erdc tr-19-4 'trends in the usace ocean disposal database
TRANSCRIPT

ERD
C TR
-19
-4
Dredging Innovations Group (DIG)
Trends in the USACE Ocean Disposal Database (1976 2015)
En
gin
eer
Res
earc
h a
nd
D
evel
opm
ent
Cen
ter
Justin L. Wilkens, Burton C. Suedel, and Kenneth N. Mitchell February 2019
Approved for public release; distribution is unlimited.

The U.S. Army Engineer Research and Development Center (ERDC) solves the nation’s toughest engineering and environmental challenges. ERDC develops innovative solutions in civil and military engineering, geospatial sciences, water resources, and environmental sciences for the Army, the Department of Defense, civilian agencies, and our nation’s public good. Find out more at www.erdc.usace.army.mil.
To search for other technical reports published by ERDC, visit the ERDC online library at http://acwc.sdp.sirsi.net/client/default.

Dredging Innovations Group (DIG) ERDC TR-19-4 February 2019
Trends in the USACE Ocean Disposal Database (1976−2015)
Justin L. Wilkens and Burton C. Suedel Environmental Laboratory U.S. Army Engineer Research and Development Center 3909 Halls Ferry Road Vicksburg, MS 39180-6199
Kenneth N. Mitchell
Coastal and Hydraulics Laboratory U.S. Army Engineer Research and Development Center 3909 Halls Ferry Road Vicksburg, MS 39180-6199
Final Report
Approved for public release; distribution is unlimited.
Prepared for Headquarters, U.S. Army Corps of Engineers Washington, DC 20314-1000
Under Project Number 455084, Dredging Innovations Group (DIG)

ERDC TR-19-4 ii
Abstract
This technical report reviews the placement of dredged sediment at ocean dredged material disposal sites (ODMDS) from 1976-2015. This report uses data obtained from the Ocean Disposal Database (ODD), a repository of ocean disposal data submitted by USACE Districts. These data are collected in order to fulfill the London Convention (LC) obligations to report annually the amount and location of dredged sediments placed in ocean waters. The LC report is published annually, but until now, a long-term compilation analysis of the ODD dataset has never been conducted. Analyzing the database for long-term trends shows that the ODD can help answer questions related to policies concerning placement of dredged sediments in ocean waters. Additionally, historical trends provide the USACE with information about ODMDS activity to assist in the short- and long-term management of dredged sediment placed at these sites. There is limited ancillary data outside of the required data fields to support LC reporting activities. Therefore, this report leaves open the possibility for further research into the reasons for the observed trends. In order to better understand ODD trends, it is recommended that data from other related databases be integrated into a broader and more comprehensive framework.
DISCLAIMER: The contents of this report are not to be used for advertising, publication, or promotional purposes. Citation of trade names does not constitute an official endorsement or approval of the use of such commercial products. All product names and trademarks cited are the property of their respective owners. The findings of this report are not to be construed as an official Department of the Army position unless so designated by other authorized documents. DESTROY THIS REPORT WHEN NO LONGER NEEDED. DO NOT RETURN IT TO THE ORIGINATOR.

ERDC TR-19-4 iii
Contents Abstract ..................................................................................................................................................... ii
Figures and Tables .................................................................................................................................. iv
Preface ...................................................................................................................................................... v
Unit Conversion Factors .......................................................................................................................... vi
Acronyms and Abbreviations ................................................................................................................. vii
1 Introduction ...................................................................................................................................... 1 1.1 Background ..................................................................................................................... 1 1.2 Objectives ........................................................................................................................ 2 1.3 Approach ......................................................................................................................... 3 1.4 Scope ............................................................................................................................... 3
2 Methods ..................................................................................................................................................... 4 2.1 Source of data ................................................................................................................. 4 2.2 Data quality ..................................................................................................................... 4 2.3 Data analysis................................................................................................................... 5
3 Results and Discussion ................................................................................................................... 9 3.1 Ocean dredged material disposal sites ......................................................................... 9 3.2 Ocean disposal data trends ......................................................................................... 14 3.2.1 Geographic ............................................................................................................................. 14 3.2.2 Federal and non-federal dredge events ................................................................................ 17 3.2.3 Dredge type ............................................................................................................................ 20 3.2.4 Dredge event duration ........................................................................................................... 21
4 Summary ........................................................................................................................................ 24
References............................................................................................................................................. 26
Appendix A: Summary Data for Ocean Dredged Material Disposal Sites .......................................... 28

ERDC TR-19-4 iv
Figures and Tables
Figures
Figure 1. Map of ocean dredged material disposal sites (ODMDS) actively used by dredging operations (credit USEPA ocean disposal map https://www.epa.gov /ocean-dumping/ocean-disposal-map). (A). Pacific Ocean. (B). Atlantic Ocean. (C). Gulf of Mexico. ............ 10 Figure 2. The total number of ocean dredged material disposal sites available for use each year from 1976–2015. ...................................................................................................................... 11 Figure 3. The total number of ocean dredged material disposal sites available for use each year from 1976–2015. ...................................................................................................................... 11 Figure 4. Number of active (grey) and inactive (white) ocean dredged material disposal sites by ocean area (top left), USACE Division (top right), and USACE District grouped by USACE Division (bottom). ............................................................................................................................ 12 Figure 5. Coquille River Entrance ocean dredged material disposal site located near Coquille Estuary and River, Oregon............................................................................................................ 13 Figure 6. Total disposal volume per year from 1976–2015 and number of dredge events for all major ocean areas combined (Pacific, Atlantic, Gulf of Mexico). ................................................ 14 Figure 7. Total disposal volume per year from 1976–2015 of dredged sediment and number of dredge events by major ocean area. (A) Pacific, (B) Atlantic, and (C) Gulf of Mexico. ........................... 16 Figure 8. Total quantity of dredged sediment placed by ocean area (top left), USACE Division (top right), and USACE District grouped by USACE Division (bottom). .................................... 17 Figure 9. The number of dredge events classified as maintenance or new work by major ocean area (ALL= ocean areas combined). .............................................................................................. 18 Figure 10. Sum of placement by year from 1976–2015 for dredge events classified as maintenance or new work. (A) All ocean areas combined (Pacific Ocean, Atlantic Ocean, Gulf of Mexico), (B) maintenance work, and (C) new work. .................................................................... 19 Figure 11. Number of dredge events using a hydraulic or mechanical dredge from 1976–2015. ................................................................................................................................................. 20 Figure 12. Total quantity of dredged sediment placed by ocean area (Pacific Ocean, Atlantic Ocean, and Gulf of Mexico) using a hydraulic (top) or mechanical dredge (bottom) from 1976-2015. .......................................................................................................................................... 21 Figure 13. The average dredge event duration (days) per year from 1976–2015 for dredging events classified as maintenance or new work. ...................................................................... 22 Figure 14. The average dredge event duration (days) from 1976-2015 for dredging events classified as maintenance or new work. ................................................................................................... 22 Figure 15. Dredge event duration (days) and disposal volume. ............................................................ 23 Figure 16. The average starting and ending month over time (top) and the starting (bottom left) and ending (bottom right) month frequency distribution of dredging events analyzed......................................................................................................................................................... 23
Tables
Table 1. Data fields available for describing an ocean dredged material disposal site, disposal and site management. ................................................................................................................... 6

ERDC TR-19-4 v
Preface
This study was initiated and funded by the Engineer Research and Development Center (ERDC) Dredging Innovations Group (DIG), managed by Kenneth N. Mitchell under Project Number 455084.
The work was performed by the Environmental Risk Assessment Branch (CEERD-EPR) of the, Environmental Processes and Engineering Division (CEERD-EP), U.S. Army Engineer Research and Development Center - Environmental Laboratory (ERDC-EL), and the Coastal Engineering Branch (CEERD-HNC) of the Navigation Division (CEERD-HN), U.S. Army Engineer Research and Development, Center Coastal and Hydraulics Laboratory (ERDC-CHL). At the time of publication, Dr. William Nelson was Branch Chief CEERD-EPR, Mr. Warren P. Lorentz was Division Chief, CEERD-EP, Ms. Tanya M. Beck was Branch Chief CEERD-HNC, Ms. Jackie S. Pettway was Division Chief, CEERD-HN, Dr. Jack E Davis was Acting Director, ERDC-EL, and Mr. Jeffrey R. Eckstein was Director, ERDC-CHL.
COL Ivan P. Beckman was Commander of ERDC, and Dr. David W. Pittman was the Director.

ERDC TR-19-4 vi
Unit Conversion Factors
Multiply By To Obtain
cubic feet 0.02831685 cubic meters
cubic inches 1.6387064 E-05 cubic meters
cubic yards 0.7645549 cubic meters
fathoms 1.8288 meters
feet 0.3048 meters
miles (nautical) 1,852 meters
square yards 0.8361274 square meters
tons (long) per cubic yard 1,328.939 kilograms per cubic meter
tons (2,000 pounds, mass) 907.1847 kilograms
tons (2,000 pounds, mass) per square foot 9,764.856 kilograms per square meter
yards 0.9144 meters

ERDC TR-19-4 vii
Acronyms and Abbreviations
CHL Coastal and Hydraulics Laboratory DIG Dredging Innovations Group DoD Department of Defense DOTS Dredging Operations Technical Support DQM Dredging Quality Management Program e-CFR Electronic Code of Federal Regulations EIS Environmental Impact Statements (EIS) EL Environmental Laboratory EP Environmental Processes and Engineering Division EPR Environmental Risk Assessment Branch ERDC Engineer Research Development Center HQUSACE Headquarters, U.S. Army Corps of Engineers IMO International Maritime Organization LC London Convention MPRSA Marine Protection, Research and Sanctuaries Act ODD Ocean Disposal Database ODMDS Ocean Dredged Material disposal Sites SMMP Site Management Monitoring Plans TR Technical Report USACE U.S. Army Corps of Engineers USEPA U.S. Environmental Protection Agency

ERDC TR-19-4 1
1 Introduction
1.1 Background
The United States is a Contracting Party to the London Convention (LC) for the Prevention of Marine Pollution by Dumping Wastes and Other Matter (London Convention 1972). This agreement controls deliberate disposal at sea of wastes or other matter, including dredged sediment, from vessels, aircraft, and platforms. The LC became effective in 1975 and requires yearly reporting from all Contracting Parties on the amount and location of materials disposed of at sea (London Convention 1972). In 1972, the United States Congress enacted the Marine Protection, Research and Sanctuaries Act (MPRSA). The MPRSA regulates the disposal at sea of all materials that would adversely affect major components including aquatic organisms, habitat, and people. The MPRSA implements the requirements of the LC, and is the legislative authority regulating the disposal of dredged sediment into ocean waters, including territorial seas.
The U.S. Army Corps of Engineers (USACE) is authorized under MPRSA section 103 to transport dredged sediment for the purpose of placement into ocean waters. In the case of non-federal dredging projects that seek to transport and place sediment in ocean water, a permit must be obtained from the USACE before dredging activity can commence. Prior to disposal at an ocean site, sediment dredged by federal or non-federal projects is subject to environmental criteria established jointly by the USACE and the U.S. Environmental Protection Agency (USEPA) following 40 CFR Parts 220-229 (USEPA/USACE 1991). Under MPRSA Section 102 and 40 CFR 228, the USEPA is authorized to designate specific geographic areas known as ocean dredged material disposal sites (ODMDS). Dredged sediment transported to the ocean for placement requires use of a USEPA designated ODMDS where feasible. When the designated ODMDS is not feasible to use, the USACE can select other sites for short-term use for placement under MPRSA section 103 upon USEPA agreement. Studies for the evaluation and selection of an ODMDS, as well as a list of current sites by USEPA region, are found in 40 CFR Part 228. USACE regulations for ocean disposal are published in 33 CFR. The USEPA and USACE jointly develop site management plans for each ODMDS.
ERDC TR-19-4 2
To meet LC reporting requirements, the Engineer Research and Development Center - Environmental Laboratory (ERDC-EL), Vicksburg, MS, has collected and compiled LC required data every year since 1976. The International Maritime Organization (IMO), the United Nations specialized agency responsible for regulating shipping and the prevention of marine pollution by ships, administers the LC and provides guidance for collecting data. Since 1976, the ERDC-EL has annually collected data from USACE districts placing dredged sediment at ocean sites. Funding for this effort is provided by the ERDC Dredging Operations Technical Support (DOTS) Program. The ERDC-EL enters and maintains the data in the Ocean Disposal Database (ODD), a relational database built in Microsoft Access. The database is organized in-to subject-based tables (e.g., ODMDSs, dredge event) each with a unique identifier. The relations defined between tables provides access and the ability to sort data in a variety of ways. The ERDC-EL collaborates with USEPA to prepare annual reports to fulfill the LC obligation. All ODD data is accessible to the public via a web application (https://odd.el.erdc.dren.mil/). Prior to the effort documented in this report, no comprehensive review of placement trends at U.S. ocean dredged material disposal sites over time has been conducted.
1.2 Objectives
The focus of this report is to review trends in the placement of dredged sediment at ODMDSs within U.S. waters, from 1976, the first year the LC report was required, through 2015, using data mined from the ODD. The documentation of such data over time provides several advantages, including a measure of all dredged sediment placed in the ocean since 1976, a benchmark for future data comparisons, and improved data collection and quality. This review provides the USACE with information about ODMDS activity to assist in the short- and long-term management of dredged sediment placed at these sites. The report also provides policymakers with insights into recent trends in open water placement of dredge sediment relative to historical norms, thereby helping to inform discussions of future investments into dredged sediment management strategies generally. The ERDC Dredging Innovations Group (DIG) funded this effort per its charge from the USACE Navigation Business line to provide advanced analytics and program-level efficiency evaluations of USACE-sponsored dredging activities.

ERDC TR-19-4 3
1.3 Approach
This report is not intended to resolve issues related to the use or status of an ODMDS. Instead, the report provides an unbiased review of dredged sediment disposal at ocean sites over time. Historically, ocean disposal has often been referred to as ocean dumping, and sites have sometimes been referred to as ocean dump sites. Ocean disposal is carefully regulated per the LC agreement and MPRSA, therefore, placement of dredged sediment is not indiscriminate, occurring only at approved sites. The word “dump” has negative connotations including for example, carelessness and in reference to depositing garbage. To overcome these negative connotations, the terms disposal, place, or placement are used for the remainder of this report because they align more closely to the action of putting something in a particular place, as is the case for disposal of dredged sediment. Because the ODD is structured by calendar year, some dredge projects straddle two calendar years and are essentially recorded as two separate projects. Contract identification numbers were not historically collected as part of the data call, therefore, positively identifying projects between years was not feasible. As a result, dredge projects are referred to instead as dredge events to better describe the use of the ODMDS.
1.4 Scope
The lack of historical information about ocean placement from other databases precludes direct comparisons with the ODD. Environmental Impact Statements (EIS) and Site Management Monitoring Plans (SMMPs) exist for most ODMDSs. The SMMP provides management and monitoring strategies for placement in the ODMDSs. In some cases the EIS and SMMP documents contain historical placement information, but this is usually limited to dates and placement quantities. Taken together, the ODD data along with EIS and SMMP data helps to describe historical use of ODMDSs.

ERDC TR-19-4 4
2 Methods
2.1 Source of data
The IMO provides guidance for the type of information required to meet the LC obligations. In addition to the required data, ERDC-EL collects other relevant data to describe the ocean site and placement activities (Table 1). The annual data call conducted by ERDC-EL is the primary source of historical ODMDS information. The LC and ERDC-EL reporting requirements rarely change, this allows for the comparison of data through time. The placement of dredged sediment excavated from federal and non-federal coastal areas is accomplished by the USACE dredge fleet and contracted dredge fleet. The annual data call is a complete census of USACE Districts who either had federal or non-federal events that placed dredge sediment at an ODMDS. All USACE Districts with active coastal dredging programs receive the yearly data call. Project managers, physical scientists, biologists, and regulatory project managers report the required ocean placement data. ODD data along with EIS and SMMP data are used collectively to describe the historical use of ODMDSs in this report. Table 1 and Appendix A contain a detailed summary of the ODMDS data set evaluated in this report.
2.2 Data quality
Upon completion of the data call forms by USACE District personnel, the submitted information was reviewed by ERDC-EL, and if necessary, returned with instructions to resubmit. ERDC-EL assumes the data submitted by each District is accurate, with the exception of obvious errors (e.g., fields left blank, incorrect placement site). The resources to cross reference reported data are mostly limited to historical records found in EIS and SMMP documents. To help determine data quality, data from these documents are compared to those reported to ERDC-EL. To date, a total of 984 records have been identified in EIS and SMMP documents, of these, 62% match ODD placement quantities and years in which they occurred, 25% have inconsistent years/dates or placement quantities or both, and 13% are unreported placement events. Potential sources of error likely include the manner in which the data were originally collected and processed as well as mistakes by either the District responder or personnel at ERDC-EL. Examples of such mistakes include reporting of incorrect information, inaccurate estimates of reported quantities, and instances

ERDC TR-19-4 5
where data call questions were misinterpreted. Some districts have not responded each year or they have mistakenly reported no placement in some years. Starting in 2012, ERDC-EL redesigned the data call form and increased documentation to reduce misinterpretation. Starting in 2004, there has been a decline in the number of inconsistent and unreported placement events with a more noticeable drop beginning in 2012. For this report, if the placement event has been confirmed in both the EIS and SMMP, the record is corrected in the database along with other data if available (e.g., dredge type).
2.3 Data analysis
This report describes data collected about the ODMDSs and placement at the ODMDS from 1976 to 2015, the latest year of data availability at the time of this report. Site management and monitoring are not included because these data are extensively documented in other reports including SMMPs (e.g., USEPA/USACE 2008) and USEPAs ODMDS monitoring assessment reports (e.g., USEPA 2013(a); USEPA/USACE 2003). A summary of data fields in the ODD is provided in Table 1. The data fields with an asterisk (*) are included in this report. Reported averages are followed by their standard deviation (mean ± SD).

ERD
C TR-19-4
6
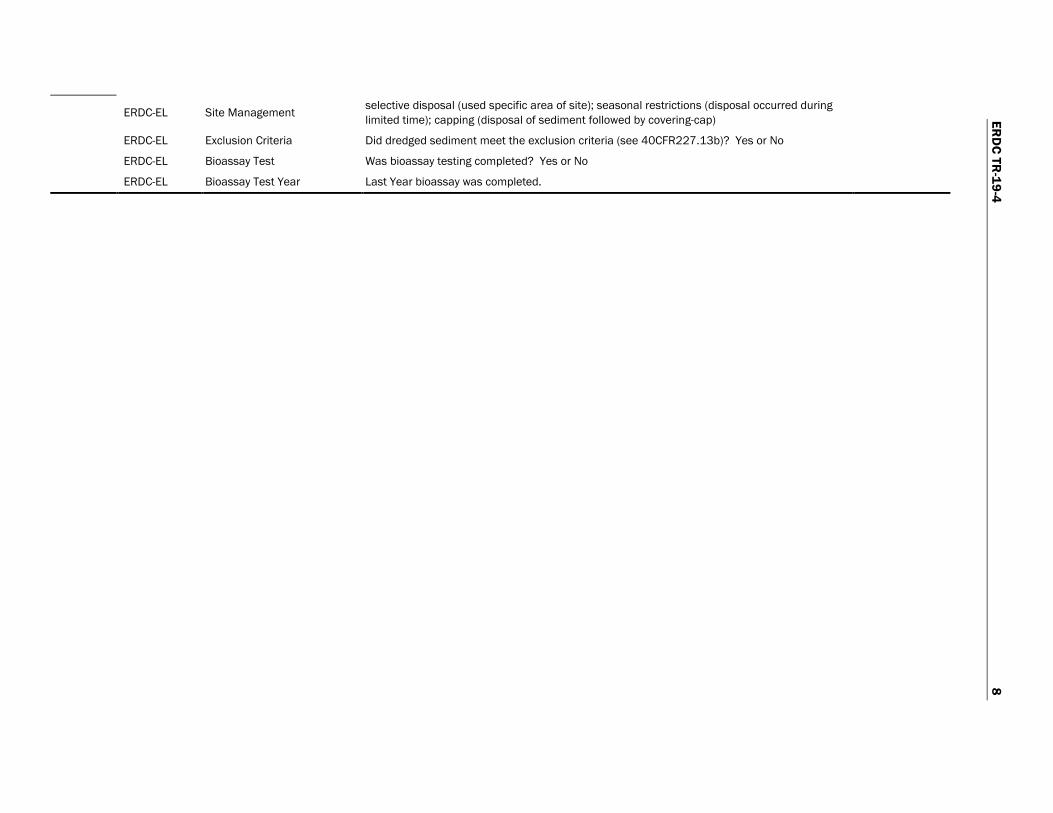
Table 1. Data fields available for describing an ocean dredged material disposal site, disposal and site management.
Category Required By Field Description
Source of Data
Disposal Site
LC LC disposal site code Two-letter prefix for country code and the disposal site code (e.g., US-161) ERDC-EL
LC* Disposal Site Name Name of disposal site 40CFR228.15
LC* Major Ocean Area Ocean area (see LC-LP.1/Circ.34, 21 January 2010 for list of ocean areas) ERDC-EL
LC Sea Area Sea area within the major ocean area (e.g., Mid-Atlantic Bight) ERDC-EL
LC Sub-sea Area Sub-sea area within the sea area where disposal site was located (e.g., Massachusetts Bay) ERDC-EL
LC Map of Disposal Site Small scale map showing disposal site ERDC-EL
LC Geodetic Datum Defines size/shape of earth and origin/orientation of coordinate systems used to map earth 40CFR228.15
LC Coordinates North/South and East/West decimal degrees. 40CFR228.15
LC* Shape of Placement Site Point, line, circle, segment of a circle, or polygon 40CFR228.15
LC Radius of Placement Site Meters 40CFR228.15
LC Internal Waters Waters on the landward side of the baseline which the territorial sea was measured BOEM/BSEE*
ERDC-EL Law MPRSA 102 or 103 site 40CFR228.15
ERDC-EL* Designated Date Date site was designated USEPA
ERDC-EL* USACE USACE Division and District using the site USACE
ERDC-EL State State associated with site 40CFR228.15
ERDC-EL* SMMP Site Management and Monitoring Plan (SMMP) start/end year USACE/USEPA
ERDC-EL Size Size of site in square nautical miles 40CFR228.15
ERDC-EL Average Depth Average depth of disposal site 40CFR228.15
ERDC-EL Minimum Depth Minimum depth of disposal site 40CFR228.15
ERDC-EL Maximum Depth Maximum depth of disposal site 40CFR228.15
ERDC-EL* Primary Use Dredged sediment disposal only 40CFR228.15
ERDC-EL Restrictions on Use Restrictions on site (e.g., where the sediment can originate from) 40CFR228.15
ERDC-EL* Period of Use The period of time the site was to remain available for use 40CFR228.15
ERDC-EL Site Notes Brief notes on any entry, (e.g., notes about shape or bearings that define the location) ERDC-EL

ERD
C TR-19-4
7
Category Required By Field Description
Source of Data
Disposal
LC Method of Disposal at Sea Placement at sea operations conducted via: ship, vessel, barge, aircraft, or other [explain]) USACE
LC* Total Quantity Total quantity of dredged sediment placed at a specific site. USACE
LC* Disposal Reporting Units Cubic meters, cubic yard and/or metric ton used for dredged sediment USACE
LC Disposal Notes Brief notes on any entry USACE
Disposal Cont’d
ERDC-EL Dredge eventt Name Name of dredge event USACE
ERDC-EL Dredge Locale Area where dredging operation occurred (e.g., Mississippi River, Vicksburg, MS) USACE
ERDC-EL* Event Type Federal or non-Federal dredging operation USACE
ERDC-EL Sediment Type Slurry or Cohesive sediment
ERDC-EL* Start Date Start date of dredging operation USACE
ERDC-EL* End Date End date of dredging operation USACE
ERDC-EL Method of Dredge Dredging method used to remove sediment: hydraulic, mechanical, clamshell, hopper USACE
ERDC-EL* Method of Transport Method used to transport sediment for disposal at sea: hopper, pipeline, scow USACE
Site Mgmt.
LC Monitoring Was Monitoring Conducted during the Reporting Period? Yes/No USACE/USEPA
LC Monitoring Time If Field Monitoring was Conducted, when was it done? (before, during, after placement at sea, other [explain]) USACE/USEPA
LC Field Monitoring Survey If Field Monitoring was Conducted, what type of survey was completed? (biological, geological, chemical, physical, other [explain]) USACE/USEPA
LC Adverse Impact If Field Monitoring was Conducted, has an adverse impact(s) been found beyond that predicted? Yes/No USACE/USEPA
LC Adverse Impact Note If an adverse impacts(s) was noted, describe briefly (e.g. physical, chemical or biological) and their spatial or temporal variation USACE/USEPA
LC Field Monitoring Reference Access to the Field Monitoring Report. Website/URL link or other reference. USACE/USEPA
LC Compliance Monitoring Was Compliance Monitoring Conducted for a Permit(s) Issued to Use the placement Site? Yes/No USACE
LC Compliance in check If Compliance Monitoring was Conducted, were the placement at sea operations found to be in compliance with the permit(s)? Yes/No USACE
LC Compliance Follow-Up If placement at sea operations were not in compliance, is follow-up action planned? Yes/No USACE
LC Compliance Reference Access to Compliance Monitoring Report. Website/URL link or other reference. USACE
LC Monitoring Notes Brief notes on any monitoring entries. USACE/USEPA
ERD
C TR-19-4
8
ERDC-EL Site Management selective disposal (used specific area of site); seasonal restrictions (disposal occurred during limited time); capping (disposal of sediment followed by covering-cap)
ERDC-EL Exclusion Criteria Did dredged sediment meet the exclusion criteria (see 40CFR227.13b)? Yes or No
ERDC-EL Bioassay Test Was bioassay testing completed? Yes or No
ERDC-EL Bioassay Test Year Last Year bioassay was completed.

ERDC TR-19-4 9
3 Results and Discussion
3.1 Ocean dredged material disposal sites
Since 1976, 140 ODMDSs have been used for placement of dredged sediment at sea. Of the 140 sites, 91 are currently active (see 40 CFR 228.15 placement sites designated on a final basis). Active sites are shown in Figure 1.
USACE Districts use on average 42 sites (37%) of the total available active sites per year (Figure 2). The availability of active ODMDSs over time has decreased from 140 to 91 sites annually (Figure 3). The decrease in sites is mostly due to the closure or de-designation of USACE 103 sites and/or interim sites. Placement information and designation dates were used to describe the number of years all sites were available for use and the percentage of time used. The percentage of time used or unused was determined by counting the number of years a placement event occurred divided by the total available years. In the total time that ocean sites have been available for placement, placement activities occurred in 50% of those years.
ODMDS information found in 40 CFR 228.15 (Section 102 sites) was used to provide a summary of geographical features and site regulations. Geographically, the Atlantic Ocean consisted of 49 sites, 32 are active (65%), the Gulf of Mexico contributed 43 sites, 30 are active (70%), and the Pacific Ocean accounted for 48 sites, 29 are active (60%; Figure 4). The USACE South Atlantic Division accounted for the most sites (39). The fewest sites (8) were found in the Pacific Ocean Division. The Portland, Jacksonville, Galveston, and New Orleans Districts had the highest numbers of ODMDSs with 26, 19, 18, and 14 sites, respectively, or 55% of the total number of sites nationally.

ERDC TR-19-4 10
FFigure 1. Map of ocean dredged material disposal sites (ODMDS) actively used by dredgingoperations (credit USEPA ocean disposal map https://www.epa.gov /ocean-dumping/ocean-
disposal-map). (A). Pacific Ocean. (B). Atlantic Ocean. (C). Gulf of Mexico.
A.
B.
C.

ERDC TR-19-4 11
FFigure 2. The total number of ocean dredged material disposal sites available for use eachyear from 1976–2015.
Figure 3. The total number of ocean dredged material disposal sites available for use each year from 1976–2015.

ERDC TR-19-4 12
FFigure 4. Number of active (grey) and inactive (white) ocean dredged material disposal sitesby ocean area (top left), USACE Division (top right), and USACE District grouped by USACE
Division (bottom).
The majority (85%) of ODMDSs are polygon shaped (e.g., square, rectangular or irregularly shaped) and the remaining (15%) are circular or oval shaped. Nearly all ODMDSs are located five nautical miles or less from the port, harbor, or navigation channel from which it receives sediment. For example, the Coquille River Entrance ODMDS is limited to dredged sediment from the Coquille Estuary and River, OR, and adjacent areas, and is located less than two nautical miles from the river entrance (Figure 5). The one exception is the San Francisco Deep Ocean Site located nearly fifty nautical miles off shore. The site is used as an alternative to placement in the San Francisco Bay, CA. This ODMDS is the deepest at 3,000 m and the farthest from the shore of all ODMDSs nationwide.
7
16
6
17
7
22
16
1
12
6
1
7
17
5
0
5
10
15
20
25
POD NWD SPD SWD MVD SAD NAD
Num
ber o
f ODM
DS
USACE Divisionactive inactive

ERDC TR-19-4 13
FFigure 5. Coquille River Entrance ocean dredged material disposal sitelocated near Coquille Estuary and River, Oregon.
Recently, USEPA Region 4 and USACE South Atlantic Division classified sites that had not been used within five years, and that were not expected to be used within the next five years, as inactive (USEPA/USACE 2013). This designation is expected to conserve agency resources that would otherwise be needed to develop SMMPs and implement monitoring plans. If monitoring as described in the SMMP is not in fact implemented at an active site, then that site can be suspended or closed. The other ODMDS marked as inactive in the ODD and not falling under the previously mentioned classification are de-designated or closed. Notes or remarks about these closed sites are limited, but some indicate the sites were no longer needed. In most such instances, no specific reason is provided (such as mounding of sediment or capacity exceedance) for the closure. It should be noted that in 1970s and 1980s, many sites were designated as interim sites, these were approved for a limited time only. In many cases it is apparent that interim sites were simply closed or a Section 103 site had been replaced by a Section 102 site, but due to limited documentation this interpretation is rarely definitively stated. The percentage of sites used per year has increased slightly over time because there are fewer sites available for use and because the current site locations are likely more appropriate than previous sites (Figure 2).
Of the 91 active sites, 86 sites are presently designated for continuous use or for an indefinite period of time. The exceptions are all on the west coast and include the Humboldt Open Ocean Disposal Site and the San

ERDC TR-19-4 14
Francisco Deep Ocean Site, these are restricted to a 50-year period of continuing use. The Mouth of Columbia River-Deep Water site can be used continuously, or until sediment mounds to a specified height. The Grays Harbor Eight Mile site is one-time use over multiple years until the site is designated. The Los Angeles/Long Beach (LA-2) site is designated for continuing use, but subject to submission of a revised Consistency Determination to the California Coastal Commission. Of the 91 active sites, 89 sites presently have no placement volume limits. The exceptions include the Mouth of the Columbia River-Deep Water site which is designated for continuing use or until the placed sediment mounds to an average height of 40 ft when the site is to be re-evaluated, and the San Francisco Deepwater Ocean Site which is limited to 4.8 million cy3 of sediment each year the site remains open.
3.2 Ocean disposal data trends
3.2.1 Geographic
An analysis conducted as part of this effort provides the geographic and temporal trends for placement of dredged sediment at ODMDs. The analysis includes placement quantities categorized by the following: ocean area (Pacific Ocean, Atlantic Ocean, and Gulf of Mexico), dredge methods (hydraulic or mechanical), class of work (maintenance or new dredging), USACE Districts and Divisions, and temporal trends (1976-2015). Since 1976, 3,206 dredge events have placed 2.36 billion cy3 of dredged sediment at 140 ODMDSs (Figure 6).
Figure 6. Total disposal volume per year from 1976–2015 and number of dredge events for all major ocean areas combined (Pacific, Atlantic, Gulf of Mexico).
0
20
40
60
80
100
120
0
20
40
60
80
100
120
1975 1985 1995 2005 2015
# dr
edge
eve
nts
cubi
c ya
rds (
mill
ions
)
Year
Disposal Dredge Events
Linear (Disposal) Linear (Dredge Events)

ERDC TR-19-4 15
Federal dredge events account for 2.1 billion cy3 of placement, the remainder of sediment (24 million cy3) is from non-federal dredge events permitted to use the ODMDS (e.g., private industry). Approximately 1.89 billion cy3 of dredged sediment have been placed in sites that are presently active, and the remainder, 0.54 billion cy3, have been placed in sites that are now inactive. It should be noted that the actual number of dredge events is lower than the figure cited above because ocean placement is reported into the ODD by calendar year. Dredging events often cross calendar years, and so in many cases, single dredging events that straddle the next year are recorded in the ODD as if there were two separate events. Thus, attempting to sum events across multiple years will result in an overestimate of the true number of dredge events utilizing ocean placement. Given this information, it is still apparent that the number of events utilizing ocean placement sites each year has trended downward through the decades while placement volume has remained relatively stable, albeit with a slight decrease overall. The Atlantic Ocean accounts for most of the decline in the number of events utilizing an ocean site, followed by the Pacific Ocean, and Gulf of Mexico (Figure 7).
On an annual basis, an average (± SD) of 80 ± 15 dredge events have placed 58.8 ± 14 million cy3 of dredged sediment. Geographically, 57% of the dredged sediment placed in the ocean sites occurred in the Gulf of Mexico (Figure 8). Districts along the Atlantic and Pacific coasts generally have more dredge events but lower placement quantities, while in the Gulf of Mexico there were fewer dredge events but placement quantities tend to be two to four times larger. The New Orleans District alone accounts for nearly 63% of the total historical placement volume since 1976. The Pacific Ocean sites account for 16% of the total sediment placed in the ocean sites, and of this amount, over 64% was placed by the Portland District. The Atlantic Ocean sites account for 27% of the total placement volume and are more evenly distributed among the Districts reporting ocean placement.

ERDC TR-19-4 16
Figure 7. Total disposal volume per year from 1976–2015 of dredged sediment and number of dredge events by major ocean area. (A) Pacific, (B) Atlantic, and (C) Gulf of Mexico.
A
B
C
010203040506070
010203040506070
1975 1985 1995 2005 2015
# dr
edge
eve
nts
cubi
c ya
rds (
mill
ions
)
YearPacific
Disposal Dredge EventsLinear (Disposal) Linear (Dredge Events)
010203040506070
010203040506070
1975 1985 1995 2005 2015
# dr
edge
eve
nts
cubi
c ya
rds (
mill
ions
)
YearAtlantic
010203040506070
010203040506070
1975 1985 1995 2005 2015
# dr
edge
eve
nts
cubi
c ya
rds m
illio
ns
YearGulf of Mexico

ERDC TR-19-4 17
Figure 8. Total quantity of dredged sediment placed by ocean area (top left), USACE Division (top right), and USACE District grouped by USACE Division (bottom).
3.2.2 Federal and non-federal dredge events
An analysis of dredge event type (federal or non-federal) and class of work (new work or maintenance) provided trends about the nature of dredging events that depend on ocean placement. Federal dredge events are those that a USACE-owned dredge or contractor is used to transport and place dredged sediment at an ODMDS (authorized under MPRSA section 103). Permitted dredge events (non-federal) are those events permitted by the USACE (under MRPSA section 103) to transport and place sediment at an ODMDS. To classify type of work, the new work designation included excavation of new navigation channels or expansion of existing channels, while maintenance dredging represented the removal of accumulated sediment from an existing navigation channel.
Of the 3,206 yearly dredging events, 2,879 are classified as maintenance, 260 represent new work, and the remaining 67 are unclassified events. Overall, the use of ODMDSs for maintenance work started to decline beginning in the 1980s (Figure 9). Geographically, the Atlantic Ocean
633
1,351
371
1,632
611
963
0
300
600
900
1,200
1,500
1,800
Atlantic Gulf ofMexico
Pacific
cy3
(mill
ions
)/#
even
ts
Ocean AreaDisposal
Events
13
252106
281
847
589
268
99
416 448
207 203
705
1,128
0
200
400
600
800
1,000
1,200
POD NWD SPD SWD MVD SAD NAD
cy3
(mill
ions
)/#
even
ts
USACE DivisionDisposalProjects
1 12
239
13 32 75
281
847
79141 198
66 10534
207
23 332 67
411
5
243 205 207 20378
216 16665
145
395
654
40 390
300
600
900
POA POH NWP NWS SPL SPN SWG MVN SAC SAJ SAM SAS SAW NAE NAN NAO NAP
POD NWD SPD SWD MVD SAD NADcy3
(mill
ions
)/#
even
ts
USACE Districts grouped by DivisionDisposal Projects

ERDC TR-19-4 18
maintenance work accounted for most of the decrease while the Gulf of Mexico and Pacific Ocean remained relatively stable. A possible explanation for the decrease in maintenance work in the Atlantic region is the increase in dredging events classified as new work during the same time period. Since 1976, maintenance work has accounted for over 2.08 billion cy3 of placement while new work has placed 222 million cy3 (Figure 10).
Figure 9. The number of dredge events classified as maintenance or new work by major ocean area (ALL= ocean areas combined).
020406080
100120
1976 1986 1996 2006 2016
# of
eve
nts
YearALL
MaintenanceNew
010203040506070
1976 1986 1996 2006 2016
# of
eve
nts
YearPacific
MaintenanceNew
010203040506070
1976 1986 1996 2006 2016
# of
eve
nts
YearAtlantic
MaintenanceNew
010203040506070
1976 1986 1996 2006 2016
# of
eve
nts
YearGulf of Mexico
MaintenanceNew

ERDC TR-19-4 19
Figure 10. Sum of placement by year from 1976–2015 for dredge events classified as maintenance or new work. (A) All ocean areas combined (Pacific Ocean, Atlantic Ocean, Gulf
of Mexico), (B) maintenance work, and (C) new work.
A.
B.
C.
0
20
40
60
80
100
1976 1979 1982 1985 1988 1991 1994 1997 2000 2003 2006 2009 2012 2015
Cubi
c Ya
rds (
mill
ions
)
Year
ALLMaintenance WorkNew Work
0
10
20
30
40
50
60
1976 1979 1982 1985 1988 1991 1994 1997 2000 2003 2006 2009 2012 2015
Cubi
c Ya
rds (
mill
ions
)
Year
Maintenance WorkPacificAtlanticGulf of Mexico
0
10
20
30
40
50
60
1976 1979 1982 1985 1988 1991 1994 1997 2000 2003 2006 2009 2012 2015
Cubi
c Ya
rds (
mill
ions
)
Year
New WorkPacificAtlanticGulf of Mexico

ERDC TR-19-4 20
3.2.3 Dredge type
For the purposes of this analysis, dredge types are divided into mechanical or hydraulic dredges. Mechanical dredges remove sediment by scooping sediment from the bottom, these include clamshell dredges and bucket dredges. During a dredging event that utilizes mechanical dredges, the sediment is usually placed on a barge and transported to an ODMDS. Hydraulic dredges suction a mixture of sediment and water from the bottom. The two main types of hydraulic dredges are trailing suction hopper dredges and cutter suction dredges. The hopper dredges use pumps to suction sediment from the bottom into the ships hopper. When the hopper reaches its capacity, dredging is stopped and the dredge vessel travels to an ODMDS where the sediment is discharged from the bottom of the ship. The cutter suction dredges remove sediment through an intake pipe and then usually pump the sediment out of a discharge pipeline, sometimes into a transport barge but more commonly directly into the ODMDS.
The most commonly used dredging method reported by USACE Districts was categorized as hydraulic (Figure 11), with more than 2,000 dredging events using a hydraulic type dredge to place over 1.9 billion cy3 of sediment. Mechanical dredges have been used by nearly 1,000 events in the ODD, placing over 300 million cy3. In recent years, the use of hydraulic dredges has decreased while the use of mechanical dredges has increased, resulting in near equal use and placement volumes. Geographically, the Gulf of Mexico dredging events account for most of the decrease in use of hydraulic dredges, the Atlantic Ocean dredging events account for most of the increase in use of mechanical dredges (Figure 12).
Figure 11. Number of dredge events using a hydraulic or mechanical dredge from 1976–2015.
0
20
40
60
80
100
1976 1979 1982 1985 1988 1991 1994 1997 2000 2003 2006 2009 2012 2015
# dr
edge
eve
nts
Year
hydraulic dredgemechanical dredge

ERDC TR-19-4 21
Figure 12. Total quantity of dredged sediment placed by ocean area (Pacific Ocean, Atlantic Ocean, and Gulf of Mexico) using a hydraulic (top) or mechanical dredge (bottom) from 1976-
2015.
3.2.4 Dredge event duration
Dredging event duration in days has been averaged for each year and summarized over time by dredge method and event type. In determining the average starting and ending month for dredging events, roughly 22% of the events were removed from consideration owing to the calendar year structure of the ODD. Events that straddle two calendar years are essentially recorded as two separate events within the ODD, the first ending on 31 December and the second beginning on 1 January, with placed volumes and other quantities prorated. To avoid the resulting bias towards the first and last day of each calendar year, such events have been excluded from the start/end analysis. Because dredging contract numbers have not always been reported, no attempt has been made to sort those events that cross years. In spite of this limitation, 78% of the events have still been included to determine duration and start/end months of dredging events in the ODD.
The average (± SD) dredge event duration is a highly variable quantity, at 65 ± 71 days (Figure 13). The mode and median of duration were 1 and 37
0
10
20
30
40
50
60
1976 1979 1982 1985 1988 1991 1994 1997 2000 2003 2006 2009 2012 2015
cubi
c ya
rds (
mill
ions
)
Year
Hydraulic DredgePacificAtlanticGulf of Mexico
0
10
20
30
40
50
60
1976 1979 1982 1985 1988 1991 1994 1997 2000 2003 2006 2009 2012 2015
cubi
c ya
rds (
mill
ions
)
Year
Mechanical DredgePacificAtlanticGulf of Mexico

ERDC TR-19-4 22
days, respectively. The average (± SD) duration of maintenance work is 62 ± 10 days while new work took longer and with much more variability at 100 ± 43 days (Figure 14). Dredge event duration does not reflect the actual number of days of dredging or the number of trips made to an ODMDS. This information has not been collected in the annual data calls and is not required to meet the LC report needs. Dredge event duration does not correlate with placement volume (R2=0.09) (Figure 15). The start and end months for dredging events are relatively evenly distributed as reflected in the frequency distribution shown in Figure 16. The average (± SD) start month is May (5.7 ± 3.2) while the average end month is July (7.2 ± 3.3) indicating that a preponderance of dredging events disposing sediment in ODMDSs are active in spring and summer months.
FFigure 13. The average dredge event duration (days) per year from 1976–2015 for dredging events classified as maintenance or new work.
Figure 14. The average dredge event duration (days) from 1976-2015 for dredging events classified as maintenance or new work.
02468
1012
0 20 40 60 80 100 120 140 160 180 200 220 240 260 280 300 320 340 360
Freq
uenc
y (%
)
Dredge Event Duration (days)

ERDC TR-19-4 23
FFigure 15. Dredge event duration (days) and disposal volume.
Figure 16. The average starting and ending month over time (top) and the starting (bottom left) and ending (bottom right) month frequency distribution of dredging events analyzed.
y = 0.0064x + 0.2356R² = 0.0906
02468
1012141618
0 50 100 150 200 250 300 350 400
cubi
c yar
ds (m
illio
ns)
Length of dredge event (days)
0
2
4
6
8
10
12
1976 1979 1982 1985 1988 1991 1994 1997 2000 2003 2006 2009 2012 2015
Mon
th (a
vera
ge)
Year
End of Dredge Event
Start of Dredge Event

ERDC TR-19-4 24
4 Summary
This Technical Report (TR) reviews the placement of dredged sediment at ODMDS from 1976–2015. The report uses data obtained from the ODD, a repository of ocean placement data submitted by USACE Districts. These data are used to fulfill the LC obligations to report annually the amount and location of dredged sediment placed in ocean waters. Other than the annual LC report, a compilation such as this one of the yearly ODD datasets had not been conducted to date.
There are limited ancillary data outside of the required data fields to support LC reporting activities. Therefore, this report leaves open the possibility for further research into the reasons for the observed trends. For instance, ERDC-EL is aware of many dredging events that have used an ODMDS for only a portion of the total dredged sediment, with the remainder used in other areas (e.g., beneficial use applications). However, for these events it is not possible to determine the fraction of dredged sediment that has been placed at an ODMDS or other areas using the ODD data. This information has not been required for the LC report, but it would help better define the role of ODMDSs going forward and document other uses of the dredged sediment. To better understand ODD data, integration of information from other databases as well as the addition of new questions to the ODD data call should be considered. Complementary data exists in other USACE databases that could be used in the future to investigate more discrete trends in the ocean placement data. For example, the National Dredging Quality Management Program (DQM) is an automated dredging monitoring system that could provide other complementary data for ocean placement events since 2012 (USACE DQM n.d.). New data requested or imported from other databases outside the scope of the LC should be carefully considered in terms of their value to the ODD and the broader USACE dredging program.
Compiling and analyzing the data in the database helps demonstrate how the ODD can help answer general questions concerning long-term trends in placement of dredged sediment in the ocean. The documentation of such data over time provides several advantages including a measure of all dredged sediment placed in the ocean since 1976, a benchmark for future data comparisons, and improved data collection and quality. At a time when the long-term fiscal outlook for federally maintained navigation events is unclear, it is imperative that policymakers and those tasked with
ERDC TR-19-4 25
management of the USACE dredging program have meaningful, quantitative, and objective sources of information upon which to base decisions.

ERDC TR-19-4 26
References Environmental Protection Agency (EPA). n.d. EPA history: Marine Protection, Research
and Sanctuaries Act (Ocean Dumping Act). Retrieved (1 January 2017). https://www.epa.gov/history/epa-history-marine-protection-research-and-sanctuaries-act-ocean-dumping-act.
Electronic Code of Federal Regulations (e-CFR). n.d. Navigation and Navigable Waters, Chapter II Corps of Engineers, Department of Army, Department of Defense. 33 C.F.R. 2017. Retrieved (1 January 2017). http://www.ecfr.gov/cgi-bin/text-idx?SID=8d076b92a380e6a8d94ea29b660deee0 &mc=true&tpl=/ecfrbrowse/Title33/33cfrv3_02.tpl#0.
Electronic Code of Federal Regulations (e-CFR). n.d. Ocean Dumping. 40 C.F.R. 220-229 2017. Retrieved (1 January 2017). http://www.ecfr.gov/cgi-bin/text-idx?SID=af685497291229f203592c91378a5eda& mc=true&tpl=/ecfrbrowse/Title40/40CIsubchapH.tpl.
London Convention (LC). n.d. International Maritime Organization. Retrieved (1 January 2018). http://www.imo.org/en/OurWork/Environment/LCLP/Pages/default.aspx.
Ocean Dredged Material Disposal Site Database. n.d. ERDC Dredging Operations Technical Support (DOTS) Program. Environmental Laboratory, U.S. Army Engineer Research and Development Center. Retrieved (1 January 2017) https://odd.el.erdc.dren.mil.
U.S. Army Corps of Engineers (USACE) Navigation Portal. n.d. U.S. Army Corps of Engineers. Retrieved (1 January 2017). http://navigation.usace.army.mil/DIF/Explore#.
U.S. Army Corps of Engineers (USACE) National Dredging Quality Management Program (DQM). nd. Retrieved (1 January 2017). https://dqm.usace.army.mil/.
U.S. Environmental Protection Agency and U.S. Army Corps of Engineers (USEPA/USACE). 1991. Evaluation of Dredged Material Proposed for Ocean Disposal. Washington, DC: Environmental Protection Agency Office of Water and Department of Army United States Army Corps of Engineers.
U.S. Environmental Protection Agency and U.S. Army Corps of Engineers (USEPA/USACE). 2008. Site Management and Monitoring Plan (SMMP) for the Galveston Ocean Dredged Material Disposal Site, TX. Environmental Protection Agency Region 6 and Army Corps of Engineers Galveston District.
U.S. Environmental Protection Agency and U.S. Army Corps of Engineers (USEPA/USACE). 2003. Regional implementation agreement for testing and reporting requirements for ocean disposal of dredged material off the Louisiana and Texas coasts under section 103 of the Marine Protection, Research and Sanctuaries Act. Environmental Protection Agency Region 6 and Army Corps of Engineers Galveston and New Orleans District.

ERDC TR-19-4 27
U.S. Environmental Protection Agency and U.S. Army Corps of Engineers (USEPA/USACE). 2013. Southeastern United States Inactive Ocean Dredged Material Disposal Sites, Site Management and Monitoring Plan, November 2013. Washington, DC: Environmental Protection Agency Office of Water and Department of Army United States Army Corps of Engineers.
U.S. Environmental Protection Agency (USEPA). 2013. 2013 National Ocean Dumping Site Monitoring Assessment Report. Washington, DC: EPA 842-R16-002. U.S. Environmental Protection Agency Office of Water.

ERDC TR-19-4 28
Appendix A: Summary Data for Ocean Dredged Material Disposal Sites
ERD
C TR-19-4
29
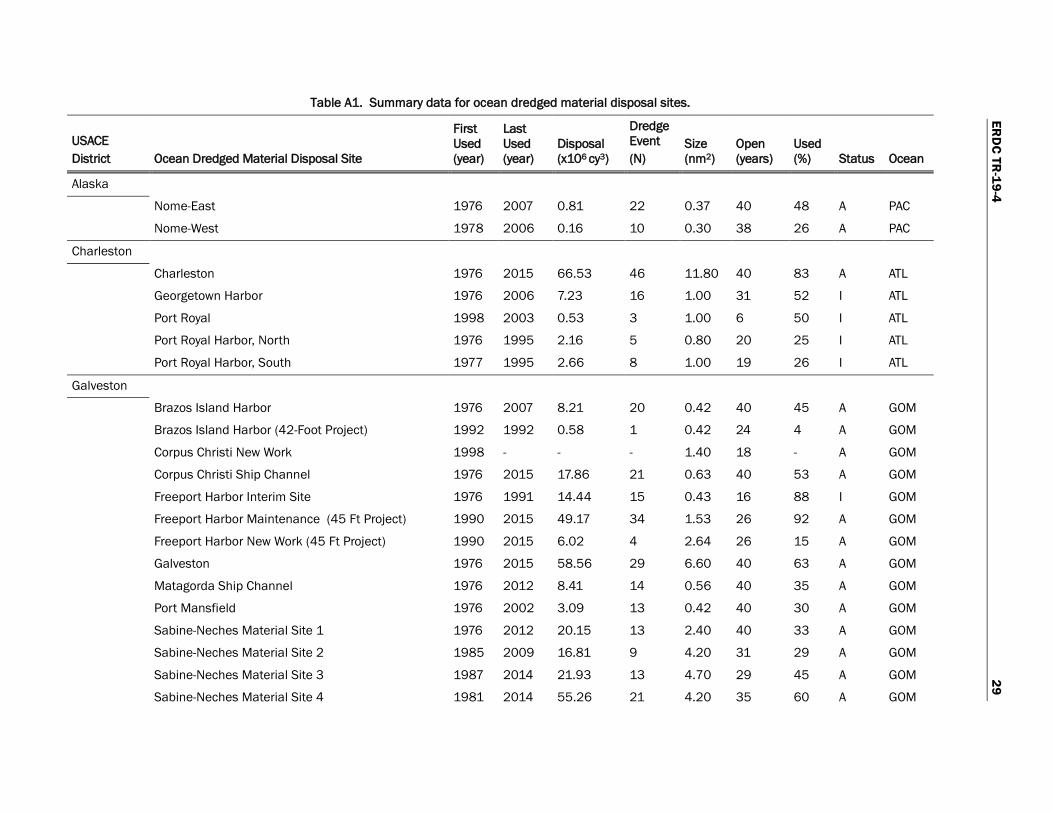
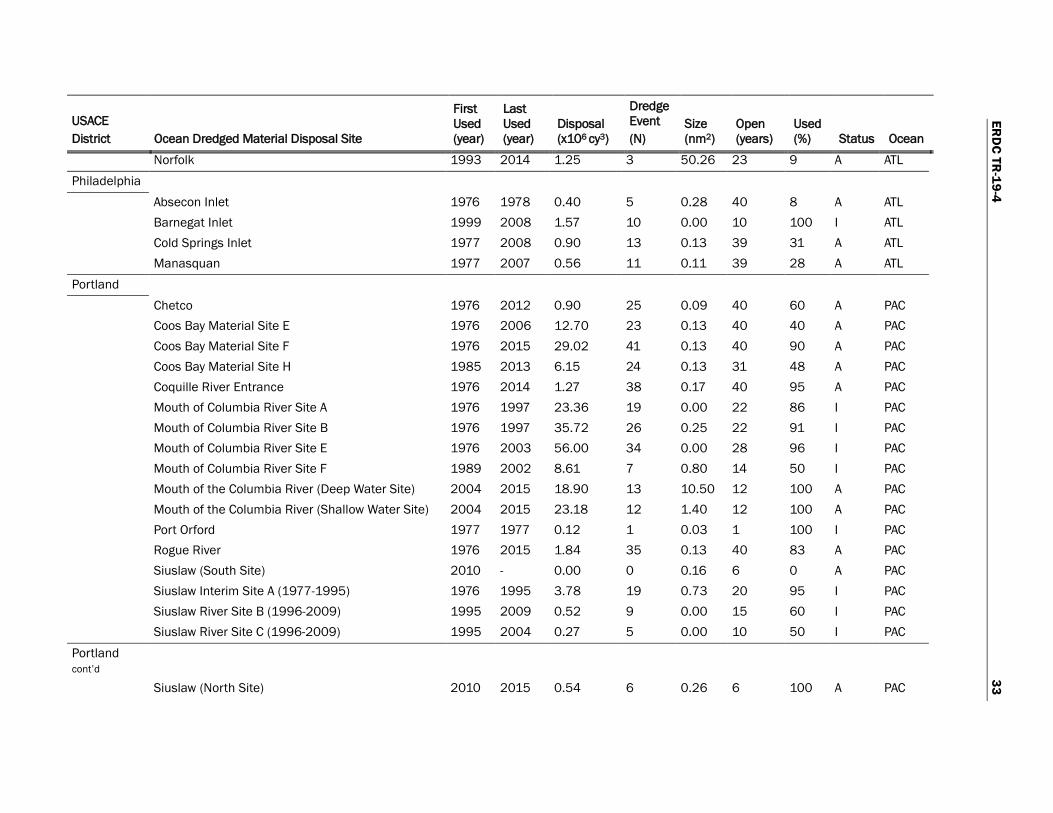
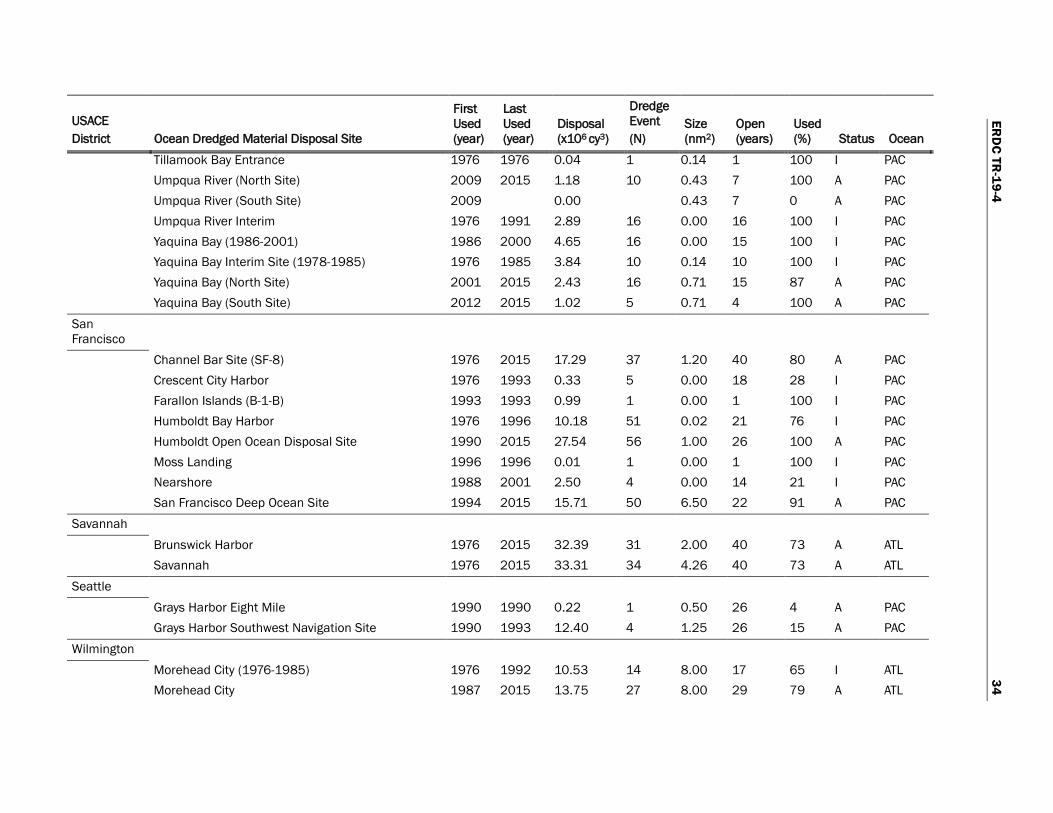
Table A1. Summary data for ocean dredged material disposal sites.
USACE District Ocean Dredged Material Disposal Site
First Used (year)
Last Used (year)
Disposal (x106 cy3)
Dredge Event (N)
Size (nm2)
Open (years)
Used (%) Status Ocean
Alaska
Nome-East 1976 2007 0.81 22 0.37 40 48 A PAC
Nome-West 1978 2006 0.16 10 0.30 38 26 A PAC
Charleston
Charleston 1976 2015 66.53 46 11.80 40 83 A ATL
Georgetown Harbor 1976 2006 7.23 16 1.00 31 52 I ATL
Port Royal 1998 2003 0.53 3 1.00 6 50 I ATL
Port Royal Harbor, North 1976 1995 2.16 5 0.80 20 25 I ATL
Port Royal Harbor, South 1977 1995 2.66 8 1.00 19 26 I ATL
Galveston
Brazos Island Harbor 1976 2007 8.21 20 0.42 40 45 A GOM
Brazos Island Harbor (42-Foot Project) 1992 1992 0.58 1 0.42 24 4 A GOM
Corpus Christi New Work 1998 - - - 1.40 18 - A GOM
Corpus Christi Ship Channel 1976 2015 17.86 21 0.63 40 53 A GOM
Freeport Harbor Interim Site 1976 1991 14.44 15 0.43 16 88 I GOM
Freeport Harbor Maintenance (45 Ft Project) 1990 2015 49.17 34 1.53 26 92 A GOM
Freeport Harbor New Work (45 Ft Project) 1990 2015 6.02 4 2.64 26 15 A GOM
Galveston 1976 2015 58.56 29 6.60 40 63 A GOM
Matagorda Ship Channel 1976 2012 8.41 14 0.56 40 35 A GOM
Port Mansfield 1976 2002 3.09 13 0.42 40 30 A GOM
Sabine-Neches Material Site 1 1976 2012 20.15 13 2.40 40 33 A GOM
Sabine-Neches Material Site 2 1985 2009 16.81 9 4.20 31 29 A GOM
Sabine-Neches Material Site 3 1987 2014 21.93 13 4.70 29 45 A GOM
Sabine-Neches Material Site 4 1981 2014 55.26 21 4.20 35 60 A GOM

ERD
C TR-19-4
30
USACE District Ocean Dredged Material Disposal Site
First Used (year)
Last Used (year)
Disposal (x106 cy3)
Dredge Event (N)
Size (nm2)
Open (years)
Used (%) Status Ocean
Sabine-Neches Material Site A 2014 - - - 4.00 2 - A GOM
Sabine-Neches Material Site B 2013 - - - 4.03 3 - A GOM
Sabine-Neches Material Site C 2013 - - - 4.03 3 - A GOM
Sabine-Neches Material Site D 2013 - - - 4.03 3 - A GOM
Honolulu
Former Honolulu/Pearl Harbor Sites 1976 1999 4.12 18 0.00 24 33 I PAC
Hilo 1977 2012 0.27 5 0.77 39 13 A PAC
Kahului 1977 1999 0.17 3 0.77 39 8 A PAC
Nawiliwili 1977 1999 1.21 5 0.77 39 13 A PAC
Port Allen 1977 1999 0.16 2 0.77 39 5 A PAC South Oahu 1981 2011 5.78 34 1.52 35 49 A PAC Jacksonville
Arecibo Harbor 1978 1982 0.24 2 1.00 38 5 A ATL
Canaveral Harbor 1976 2013 26.35 57 4.00 40 83 A ATL
Charlotte Harbor 1976 1988 2.04 7 0.86 13 46 I GOM
Fernandina Beach 1976 2015 40.76 48 4.00 40 95 A ATL
Fort Pierce Harbor 1976 2014 1.09 8 1.00 39 21 I ATL
Jacksonville 1976 2015 21.50 47 4.56 40 75 A ATL
Key West 2005 2007 0.29 2 0.00 3 67 I GOM
Mayaguez Harbor 1976 1978 0.06 2 1.00 40 5 A ATL
Miami 1985 2015 10.40 13 1.00 31 35 A ATL
Palm Beach Harbor 2005 2013 0.01 1 1.00 11 9 A ATL
Palm Beach Harbor East (<2004) 1980 1983 0.52 3 1.00 4 75 I ATL
Palm Beach Harbor West (<2004) 1979 1979 0.05 1 0.01 1 100 I ATL
Ponce Harbor 1976 2005 1.52 4 1.00 40 8 A ATL
Port Everglades Harbor 1978 2013 0.53 5 1.00 38 11 A ATL
San Juan Harbor 1976 2014 12.01 18 0.98 40 30 A ATL

ERD
C TR-19-4
31
USACE District Ocean Dredged Material Disposal Site
First Used (year)
Last Used (year)
Disposal (x106 cy3)
Dredge Event (N)
Size (nm2)
Open (years)
Used (%) Status Ocean
St. Augustine Harbor #1 1976 1977 0.30 3 0.00 2 100 I ATL
St. Lucie Inlet 1977 1979 0.22 4 0.00 3 100 I ATL
Tampa 1977 1997 23.04 26 4.00 39 26 A GOM Yabucoa Harbor 1988 - - - 1.00 28 - A ATL Los Angeles
Los Angeles/Long Beach (LA-2) 1976 2015 7.34 52 0.77 40 68 A PAC
Newport Beach (LA-3) 1976 2015 4.86 131 0.77 40 78 A PAC
San Diego (LA-5) 1976 2014 18.81 58 0.77 40 58 A PAC San Diego Point Loma 1976 1978 0.90 2 0.80 3 67 I PAC Mobile
Gulfport-Eastern Site 1977 2005 15.30 8 2.47 39 21 A GOM
Gulfport-Western Site 1982 2015 13.49 16 5.20 34 44 A GOM
Mobile 1976 2015 126.34 91 4.80 40 95 A GOM
Panama City 1977 1987 0.41 3 0.26 11 27 I GOM
Pascagoula 1992 2014 30.02 29 18.50 24 75 A GOM
Pascagoula (<1992) 1976 1990 5.85 11 1.00 15 73 I GOM
Pensacola Nearshore 1983 1987 0.27 2 2.48 5 40 I GOM Pensacola Offshore 1981 2014 6.50 6 4.53 35 17 A GOM New England
Cape Arundel 1976 2009 1.32 35 0.05 34 41 I ATL
Central Long Island Sound 2000 2015 3.82 27 2.42 16 94 A ATL
Massachusetts Bay 1976 2015 15.51 197 3.14 40 95 A ATL
Portland 1977 2015 5.58 86 1.00 39 85 A ATL
Rhode Island Sound Disposal Site 2003 2015 7.62 10 1.00 13 62 A ATL
Saint Helena Island 1977 1984 0.13 10 0.00 8 50 I ATL Western Long Island Sound 2005 2015 0.19 30 1.56 11 100 A ATL

ERD
C TR-19-4
32
USACE District Ocean Dredged Material Disposal Site
First Used (year)
Last Used (year)
Disposal (x106 cy3)
Dredge Event (N)
Size (nm2)
Open (years)
Used (%) Status Ocean
New Orleans
Atchafalaya R., Bayous Chene, Boeuf, Black (East) 1976 2002 222.01 30 9.14 40 58 A GOM
Atchafalaya River Bar 103 2002 2011 40.03 4 0.00 10 40 I GOM
Atchafalaya River Bar Channel - - - - 7.31 - - I GOM
Atchafalaya River, Bayous Chene, Boeuf, Black (West) 2002 2015 110.54 20 36.24 14 93 A GOM
Barataria Bay Waterway 1976 1988 3.56 5 1.40 40 13 A GOM
Calcasieu Material Site 1 1976 2008 71.98 14 1.76 40 35 A GOM
Calcasieu Material Site 2 1983 2015 88.83 27 3.53 33 76 A GOM
Calcasieu Material Site 3 1981 2015 14.26 9 5.88 35 26 A GOM
Freshwater Bayou, Bar Channel 1978 1994 2.01 3 1.00 17 18 I GOM
Houma Navigation Canal 1976 1997 4.06 9 2.08 22 41 I GOM
Mississippi River Gulf Outlet 1976 2005 93.86 33 6.03 30 100 I GOM
Mississippi River South Pass 1977 1978 3.98 2 0.00 2 100 I GOM
Mississippi River Southwest Pass 1976 2015 189.49 44 3.44 40 100 A GOM Mississippi River Tiger Pass Bar Channel 1978 1985 2.64 3 3.20 8 38 I GOM New York
Axel Carlson Reef 2005 2008 1.12 6 3.02 4 100 I ATL
East Rockaway Inlet, Long Island 1976 2010 0.11 3 0.81 40 8 A ATL
Fire Island Inlet, Long Island 1990 - 0.00 0 1.09 26 0 A ATL
Historic Area Remediation Site 1991 2015 76.71 154 15.70 25 80 A ATL
Jones Inlet 1990 - 0.00 0 1.19 26 0 A ATL
Mud Dump 1976 1997 124.48 484 2.20 22 100 I ATL
Rockaway Inlet 1990 - 0.00 0 0.38 26 0 A ATL Shark River 2002 2006 4.29 7 0.60 14 29 A ATL Norfolk
Dam Neck 1981 2015 22.00 37 8.00 35 74 A ATL
ERD
C TR-19-4
33
USACE District Ocean Dredged Material Disposal Site
First Used (year)
Last Used (year)
Disposal (x106 cy3)
Dredge Event (N)
Size (nm2)
Open (years)
Used (%) Status Ocean
Norfolk 1993 2014 1.25 3 50.26 23 9 A ATL Philadelphia
Absecon Inlet 1976 1978 0.40 5 0.28 40 8 A ATL
Barnegat Inlet 1999 2008 1.57 10 0.00 10 100 I ATL
Cold Springs Inlet 1977 2008 0.90 13 0.13 39 31 A ATL Manasquan 1977 2007 0.56 11 0.11 39 28 A ATL Portland
Chetco 1976 2012 0.90 25 0.09 40 60 A PAC
Coos Bay Material Site E 1976 2006 12.70 23 0.13 40 40 A PAC
Coos Bay Material Site F 1976 2015 29.02 41 0.13 40 90 A PAC
Coos Bay Material Site H 1985 2013 6.15 24 0.13 31 48 A PAC
Coquille River Entrance 1976 2014 1.27 38 0.17 40 95 A PAC
Mouth of Columbia River Site A 1976 1997 23.36 19 0.00 22 86 I PAC
Mouth of Columbia River Site B 1976 1997 35.72 26 0.25 22 91 I PAC
Mouth of Columbia River Site E 1976 2003 56.00 34 0.00 28 96 I PAC
Mouth of Columbia River Site F 1989 2002 8.61 7 0.80 14 50 I PAC
Mouth of the Columbia River (Deep Water Site) 2004 2015 18.90 13 10.50 12 100 A PAC
Mouth of the Columbia River (Shallow Water Site) 2004 2015 23.18 12 1.40 12 100 A PAC
Port Orford 1977 1977 0.12 1 0.03 1 100 I PAC
Rogue River 1976 2015 1.84 35 0.13 40 83 A PAC
Siuslaw (South Site) 2010 - 0.00 0 0.16 6 0 A PAC
Siuslaw Interim Site A (1977-1995) 1976 1995 3.78 19 0.73 20 95 I PAC
Siuslaw River Site B (1996-2009) 1995 2009 0.52 9 0.00 15 60 I PAC
Siuslaw River Site C (1996-2009) 1995 2004 0.27 5 0.00 10 50 I PAC Portland cont’d
Siuslaw (North Site) 2010 2015 0.54 6 0.26 6 100 A PAC
ERD
C TR-19-4
34
USACE District Ocean Dredged Material Disposal Site
First Used (year)
Last Used (year)
Disposal (x106 cy3)
Dredge Event (N)
Size (nm2)
Open (years)
Used (%) Status Ocean
Tillamook Bay Entrance 1976 1976 0.04 1 0.14 1 100 I PAC
Umpqua River (North Site) 2009 2015 1.18 10 0.43 7 100 A PAC
Umpqua River (South Site) 2009 0.00 0.43 7 0 A PAC
Umpqua River Interim 1976 1991 2.89 16 0.00 16 100 I PAC
Yaquina Bay (1986-2001) 1986 2000 4.65 16 0.00 15 100 I PAC
Yaquina Bay Interim Site (1978-1985) 1976 1985 3.84 10 0.14 10 100 I PAC
Yaquina Bay (North Site) 2001 2015 2.43 16 0.71 15 87 A PAC Yaquina Bay (South Site) 2012 2015 1.02 5 0.71 4 100 A PAC San Francisco
Channel Bar Site (SF-8) 1976 2015 17.29 37 1.20 40 80 A PAC
Crescent City Harbor 1976 1993 0.33 5 0.00 18 28 I PAC
Farallon Islands (B-1-B) 1993 1993 0.99 1 0.00 1 100 I PAC
Humboldt Bay Harbor 1976 1996 10.18 51 0.02 21 76 I PAC
Humboldt Open Ocean Disposal Site 1990 2015 27.54 56 1.00 26 100 A PAC
Moss Landing 1996 1996 0.01 1 0.00 1 100 I PAC
Nearshore 1988 2001 2.50 4 0.00 14 21 I PAC San Francisco Deep Ocean Site 1994 2015 15.71 50 6.50 22 91 A PAC Savannah
Brunswick Harbor 1976 2015 32.39 31 2.00 40 73 A ATL Savannah 1976 2015 33.31 34 4.26 40 73 A ATL Seattle
Grays Harbor Eight Mile 1990 1990 0.22 1 0.50 26 4 A PAC Grays Harbor Southwest Navigation Site 1990 1993 12.40 4 1.25 26 15 A PAC Wilmington
Morehead City (1976-1985) 1976 1992 10.53 14 8.00 17 65 I ATL
Morehead City 1987 2015 13.75 27 8.00 29 79 A ATL

ERD
C TR-19-4
35
USACE District Ocean Dredged Material Disposal Site
First Used (year)
Last Used (year)
Disposal (x106 cy3)
Dredge Event (N)
Size (nm2)
Open (years)
Used (%) Status Ocean
New Wilmington 2002 2015 28.33 24 9.40 14 86 A ATL
Wilmington 1987 2008 41.31 57 2.30 22 86 I ATL Wilmington Harbor (1976-1992) 1976 1992 11.14 23 2.30 17 76 I ATL
First used (year) – the first year disposal occurred or the designation date (or whichever was earlier; >1976); Last used (year) – the last year of disposal activity for an active site or the year when the site was de-designated for inactive sites; size (nm2) – the size of the ocean disposal site; active (years) – the number of years a site was open for disposal; used (%) – the percentage of years disposal occurred while the site was active; status – the current status of a site (A = Active; I= Inactive); Ocean – the ocean area where the site was located (PAC= Pacific Ocean; ATL= Atlantic Ocean; GOM= Gulf of Mexico).

REPORT DOCUMENTATION PAGE Form Approved OMB No. 0704-0188
Public reporting burden for this collection of information is estimated to average 1 hour per response, including the time for reviewing instructions, searching existing data sources, gathering and maintaining the data needed, and completing and reviewing this collection of information. Send comments regarding this burden estimate or any other aspect of this collection of information, including suggestions for reducing this burden to Department of Defense, Washington Headquarters Services, Directorate for Information Operations and Reports (0704-0188), 1215 Jefferson Davis Highway, Suite 1204, Arlington, VA 22202-4302. Respondents should be aware that notwithstanding any other provision of law, no person shall be subject to any penalty for failing to comply with a collection of information if it does not display a currently valid OMB control number. PLEASE DO NOT RETURN YOUR FORM TO THE ABOVE ADDRESS. 1. REPORT DATE (DD-MM-YYYY)
February 2019 2. REPORT TYPE
Final report 3. DATES COVERED (From - To)
4. TITLE AND SUBTITLE
Trends in the USACE Ocean Disposal Database (1976−2015)
5a. CONTRACT NUMBER
5b. GRANT NUMBER
5c. PROGRAM ELEMENT NUMBER
6. AUTHOR(S)
Justin L. Wilkens, Burton C. Suedel, and Kenneth N. Mitchell
5d. PROJECT NUMBER 455084
5e. TASK NUMBER
5f. WORK UNIT NUMBER
7. PERFORMING ORGANIZATION NAME(S) AND ADDRESS(ES) 8. PERFORMING ORGANIZATION REPORT NUMBER
U.S. Army Engineer Research and Development Center, Environmental Laboratory 3909 Halls Ferry Road, Vicksburg, MS 39180-6199 ERDC TR-19-4
9. SPONSORING / MONITORING AGENCY NAME(S) AND ADDRESS(ES) 10. SPONSOR/MONITOR’S ACRONYM(S)
Headquarters, U.S. Army Corps of Engineers Washington, DC 20314-1000
11. SPONSOR/MONITOR’S REPORT NUMBER(S)
12. DISTRIBUTION / AVAILABILITY STATEMENT Approved for public release; distribution unlimited.
13. SUPPLEMENTARY NOTES
14. ABSTRACT This technical report reviews the placement of dredged sediment at ocean dredged material disposal sites (ODMDS) from 1976-2015. This report uses data obtained from the Ocean Disposal Database (ODD), a repository of ocean disposal data submitted by USACE Districts. These data are collected in order to fulfill the London Convention (LC) obligations to report annually the amount and location of dredged sediments placed in ocean waters. The LC report is published annually, but until now, a long-term compilation analysis of the ODD dataset has never been conducted. Analyzing the database for long-term trends shows that the ODD can help answer questions related to policies concerning placement of dredged sediments in ocean waters. Additionally, historical trends provide the USACE with information about ODMDS activity to assist in the short- and long-term management of dredged sediment placed at these sites. There is limited ancillary data outside of the required data fields to support LC reporting activities. Therefore, this report leaves open the possibility for further research into the reasons for the observed trends. In order to better understand ODD trends, it is recommended that data from other related databases be integrated into a broader and more comprehensive framework.
15. SUBJECT TERMS
Dredging spoil Dredged material
Marine sediments Dredging---Management
16. SECURITY CLASSIFICATION OF: 17. LIMITATION OF ABSTRACT
18. NUMBER OF PAGES
19a. NAME OF RESPONSIBLE PERSON
a. REPORT
UNCLASSIFIED
b. ABSTRACT
UNCLASSIFIED
c. THIS PAGE
UNCLASSIFIED 45 19b. TELEPHONE NUMBER (include area code)
andard Form 298 (Rev. 8-98) escribed by ANSI Std. 239.18