erdas fws change · pdf fileerdas imagine 2015 raster based change detection tips and tricks...
TRANSCRIPT
ERDAS IMAGINE 2015
RASTER BASED CHANGE DETECTION
TIPS AND TRICKS
USFWS WORKSHOP


ChangeDetection
SectionObjective In this section, you will learn how to compare imagery, identify change, and report results.
Exercise1:BasicChangeDetectionUsingtheSwipeTool
Objective: Students will perform visual change detection by loading multiple images into a View and use the swipe tool to view the underlying image.
Task1.1:UsingSwipetoExaminetheImages
1. In a new View, open ortho_2006.img and ortho_2009.ecw. Ensure that ortho_2006.img is on top in the
Contents pane. Note the difference in file extensions. You will have to change the "files of type" option
to view ortho_2009.ecw.
2. On the Home tab, Extent group Select the Reset button .

Reset sets the display scale of the current view such that one image pixel of the uppermost image is represented by one screen pixel and grid north is oriented up on the screen.
3. Select the Inquire Cursor. Enter the coordinates 2206180.00, 1509100.00 select Apply and Close. The
view should center on a construction site.
4. Now we will use the Swipe function to see the changes. Start the Swipe Transition layer by clicking
Swipe button from the View group of the Home tab. The Transition tab is added to the ribbon
and the Transition Pane is added to the left of the viewer.

You can also right‐click in the 2D View and select Swipe from the Quick View functions. Blend and Flicker are also available options.
5. Use the slider in the Transition Extent group to swipe the top layer back and forth and examine the
change.
6. Right‐click in the View, select Open Vector Layer, and add landparcels.shp to the same View. You will now
have three files and the Layer Control group updates accordingly.
L ‐ Locked The status of the selected image is locked. During a movie the status of the image remains unchanged.
I ‐ Invisible The selected image is always invisible.
W ‐ Working The selected image is visible and is affected by the Swipe status. There must be at least one working layer. The last layer in the list cannot be the working layer since there is no layer beneath it.
S ‐ Static The selected image is visible but it is unaffected by the Swipe status.
7. In the Layer Control, move the check for ortho_2006.img to the W column to make this a Working layer.
Use the Transition Extent slider to swipe two layers.
8. Move the check for landparcels.shp to the S column to leave it displayed. Swipe only ortho_2006.img.
9. Use this time to switch between modes, start / pause / stop the movie, and become familiar with the
Swipe Multilayer functionality.
10. Zoom and pan around the imagery and analyze the difference between the datasets using Swipe.
11. Close the Transition and Clear the View.

Exercise2:IdentifyingandExtractingChanges
Objective: Students will identify and measure the changes in clear‐cuts and urban development between two periods. This will provide an indication of the rate of change within this area.
Task2.1:ChangeDetection
1. Open two 2D Views.
2. Open subset_tm_88.img (a subset portion of a TM image taken in July 1988) in the first View.
3. Open subset_tm_00.img (a subset portion of a TM image taken in July 2000) in the second View.
4. Link these two Viewers and study the differences between these two images.
The Change Detection tool can assist in identifying these features.
5. On the Raster tab, in the Change Detection group, select Zonal Change ‐> Image Difference.
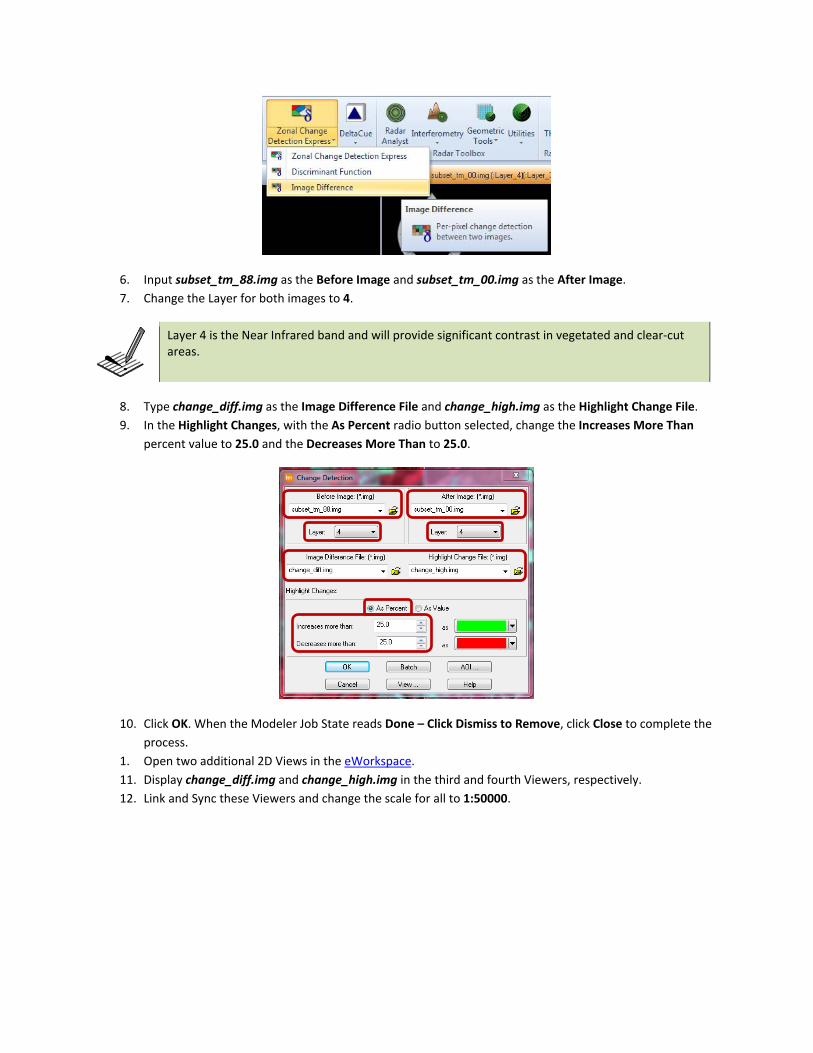
6. Input subset_tm_88.img as the Before Image and subset_tm_00.img as the After Image.
7. Change the Layer for both images to 4.
Layer 4 is the Near Infrared band and will provide significant contrast in vegetated and clear‐cut areas.
8. Type change_diff.img as the Image Difference File and change_high.img as the Highlight Change File.
9. In the Highlight Changes, with the As Percent radio button selected, change the Increases More Than
percent value to 25.0 and the Decreases More Than to 25.0.
10. Click OK. When the Modeler Job State reads Done – Click Dismiss to Remove, click Close to complete the
process.
1. Open two additional 2D Views in the eWorkspace.
11. Display change_diff.img and change_high.img in the third and fourth Viewers, respectively.
12. Link and Sync these Viewers and change the scale for all to 1:50000.
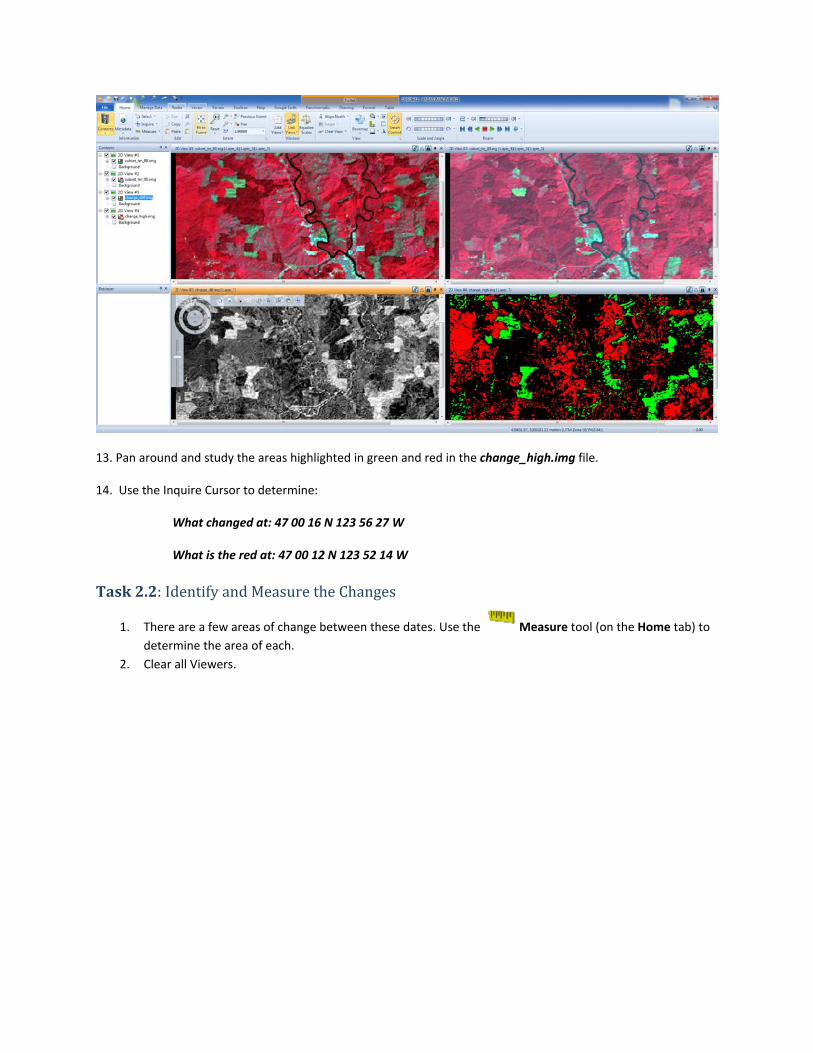
13. Pan around and study the areas highlighted in green and red in the change_high.img file. 14. Use the Inquire Cursor to determine:
What changed at: 47 00 16 N 123 56 27 W What is the red at: 47 00 12 N 123 52 14 W
Task2.2:IdentifyandMeasuretheChanges
1. There are a few areas of change between these dates. Use the Measure tool (on the Home tab) to
determine the area of each.
2. Clear all Viewers.
ZonalChangeDetection
SectionObjective Students will learn to use the Zonal Change Detection tools in ERDAS IMAGINE to perform smarter change detection through automation.
ToolsUsed
Layout Used to change in and out of the Zonal Change user interface.
Viewer Used to visualize two different dates of imagery with polygon zones.
Zonal Change Process Tab
Tools to set up a change project, set changes sensitivities, and run change likelihood process.
Zonal Change Review Tab
Tools to use change likelihood to define what has and what has not changed.
Exercise1:CreatingtheProject
Objective: Students will setup the Change Detection project.
Task1.1:LayouttheProject
Students will setup the project in the Zonal Change Detection Layout.
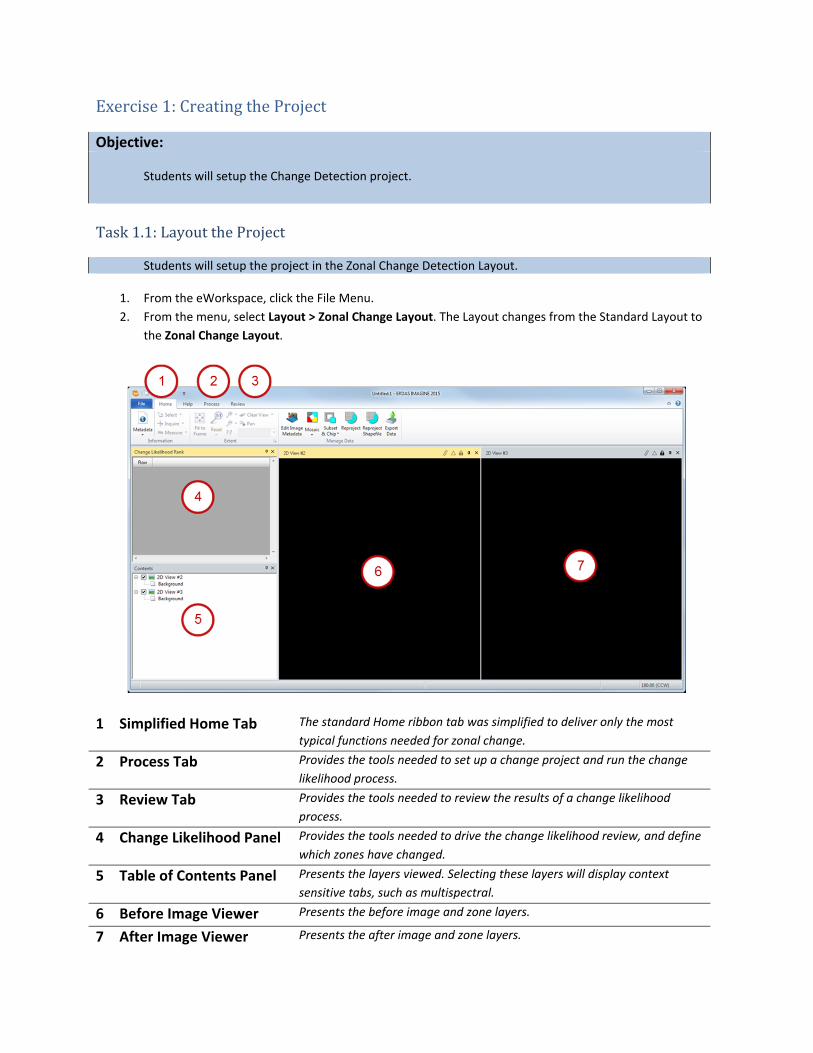
1. From the eWorkspace, click the File Menu.
2. From the menu, select Layout > Zonal Change Layout. The Layout changes from the Standard Layout to
the Zonal Change Layout.
1 Simplified Home Tab The standard Home ribbon tab was simplified to deliver only the most
typical functions needed for zonal change.
2 Process Tab Provides the tools needed to set up a change project and run the change
likelihood process.
3 Review Tab Provides the tools needed to review the results of a change likelihood
process.
4 Change Likelihood Panel Provides the tools needed to drive the change likelihood review, and define
which zones have changed.
5 Table of Contents Panel Presents the layers viewed. Selecting these layers will display context
sensitive tabs, such as multispectral.
6 Before Image Viewer Presents the before image and zone layers.
7 After Image Viewer Presents the after image and zone layers.
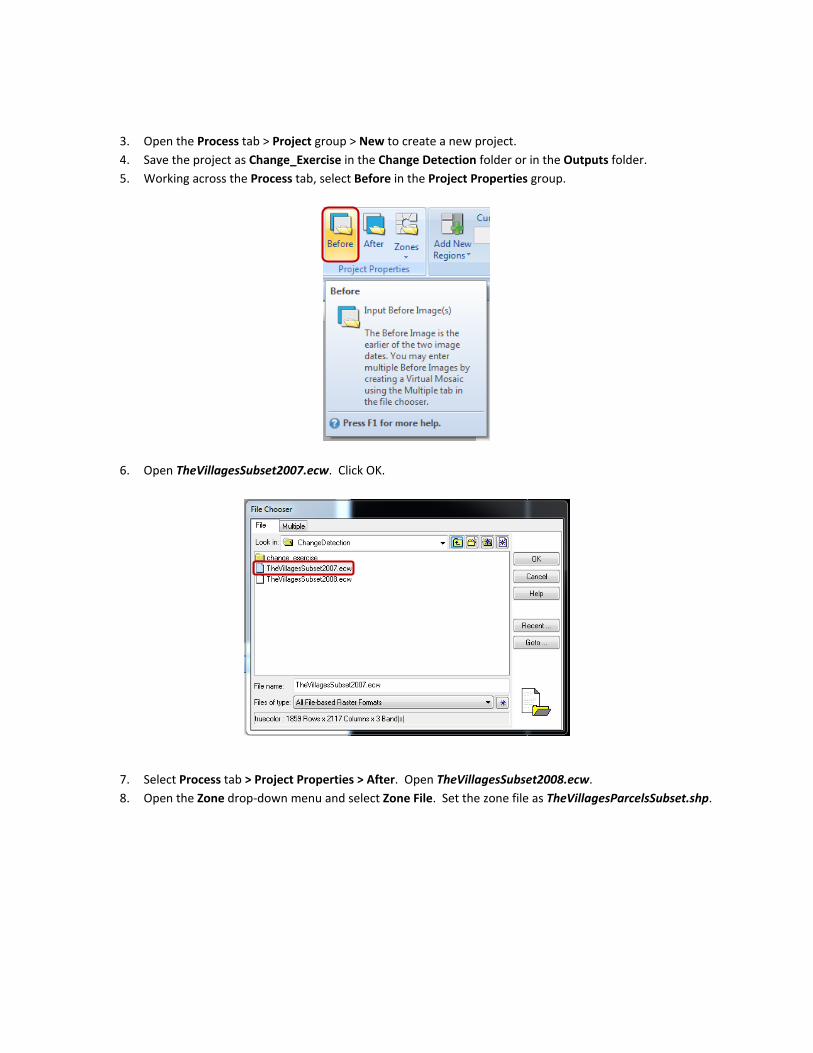
3. Open the Process tab > Project group > New to create a new project.
4. Save the project as Change_Exercise in the Change Detection folder or in the Outputs folder.
5. Working across the Process tab, select Before in the Project Properties group.
6. Open TheVillagesSubset2007.ecw. Click OK.
7. Select Process tab > Project Properties > After. Open TheVillagesSubset2008.ecw.
8. Open the Zone drop‐down menu and select Zone File. Set the zone file as TheVillagesParcelsSubset.shp.
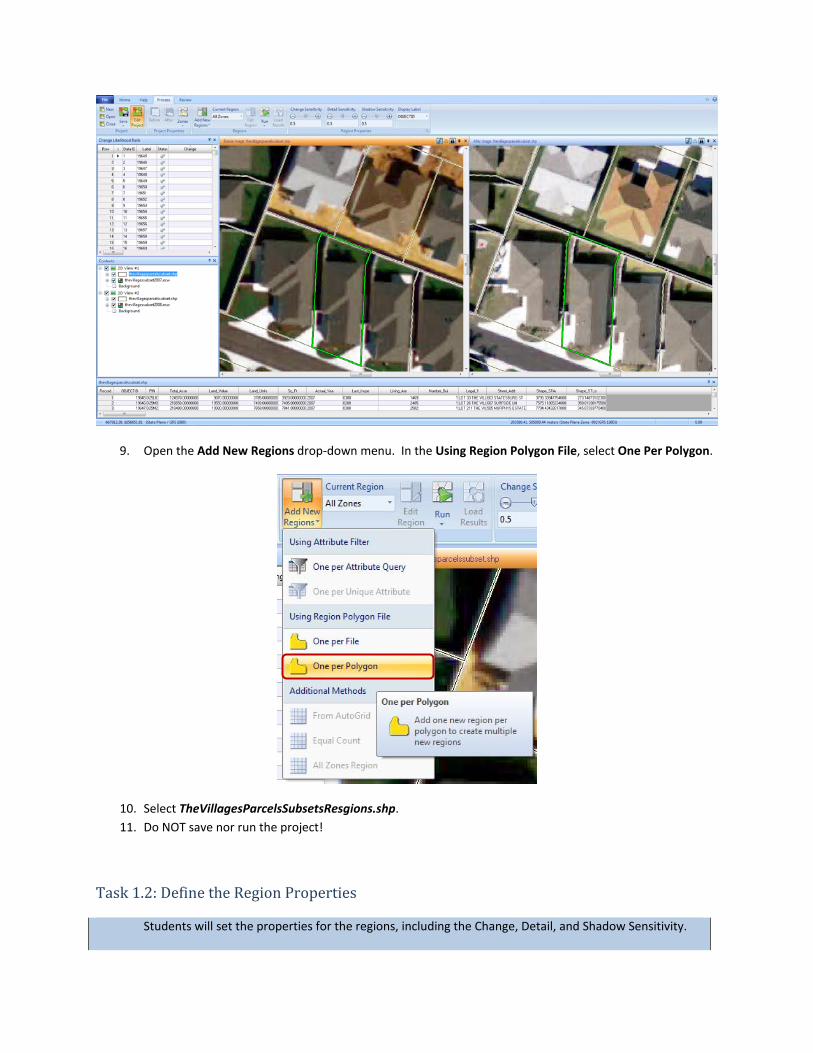
9. Open the Add New Regions drop‐down menu. In the Using Region Polygon File, select One Per Polygon.
10. Select TheVillagesParcelsSubsetsResgions.shp.
11. Do NOT save nor run the project!
Task1.2:DefinetheRegionProperties
Students will set the properties for the regions, including the Change, Detail, and Shadow Sensitivity.
In order to understand the impact of each sensitivity rating, the instructor will assign different settings for different regions.
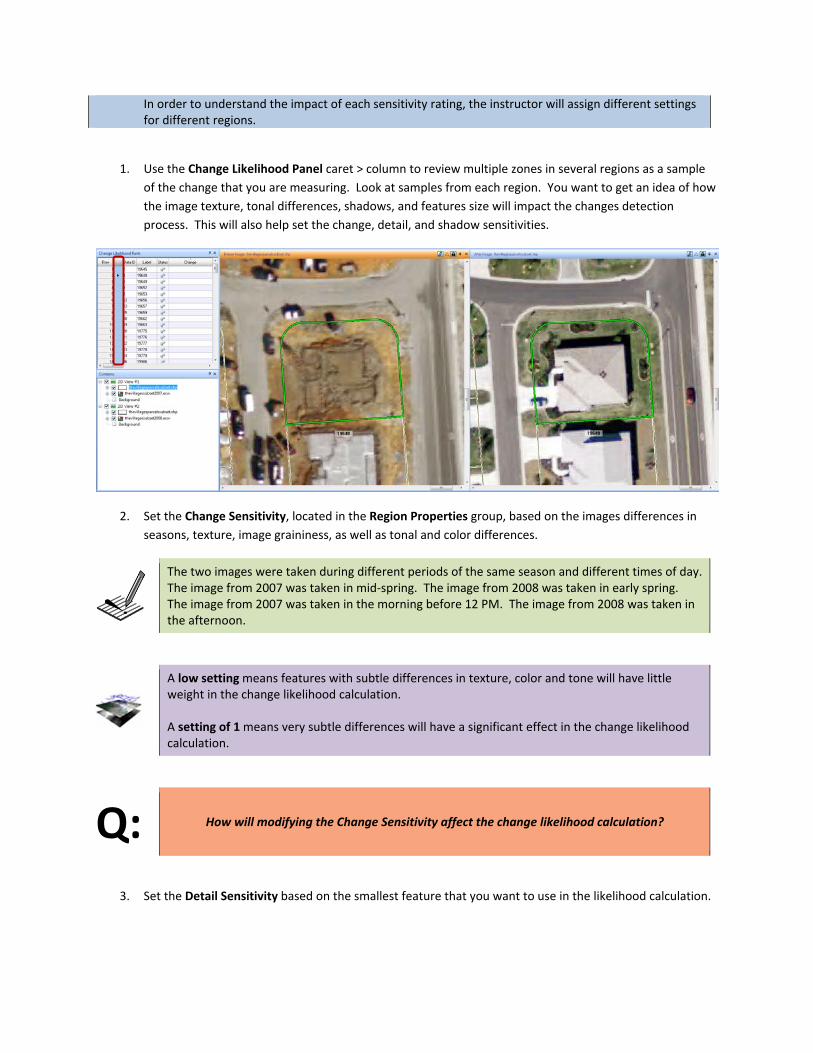
1. Use the Change Likelihood Panel caret > column to review multiple zones in several regions as a sample
of the change that you are measuring. Look at samples from each region. You want to get an idea of how
the image texture, tonal differences, shadows, and features size will impact the changes detection
process. This will also help set the change, detail, and shadow sensitivities.
2. Set the Change Sensitivity, located in the Region Properties group, based on the images differences in
seasons, texture, image graininess, as well as tonal and color differences.
The two images were taken during different periods of the same season and different times of day. The image from 2007 was taken in mid‐spring. The image from 2008 was taken in early spring. The image from 2007 was taken in the morning before 12 PM. The image from 2008 was taken in the afternoon.
A low setting means features with subtle differences in texture, color and tone will have little weight in the change likelihood calculation. A setting of 1 means very subtle differences will have a significant effect in the change likelihood calculation.
Q: How will modifying the Change Sensitivity affect the change likelihood calculation?
3. Set the Detail Sensitivity based on the smallest feature that you want to use in the likelihood calculation.
A setting of 0 means features smaller than 100 pixels will have little weight in the change likelihood calculation. A setting of 0 means features as small as 4 pixels will have a significant effect in the change likelihood calculation.
Q: How will changing the Detail Sensitivity affect the change likelihood calculation?
4. Set the Shadow Sensitivity based on the value the shadow provides to the change likelihood calculation.
Change the Shadow Sensitivity from 0.5 to 0.1.
Shadows can provide meaningful information, but they can also cause problems. Shadows from different solar elevations caused by differences in image capture times, such as different times of day or year, can have a negative effect on change detection.
A low setting means shadow will have little weight in the change likelihood calculation. A high setting means shadow will have a significant effect in the change likelihood calculation.
Q: How will changing the Detail Sensitivity affect the change likelihood calculation?
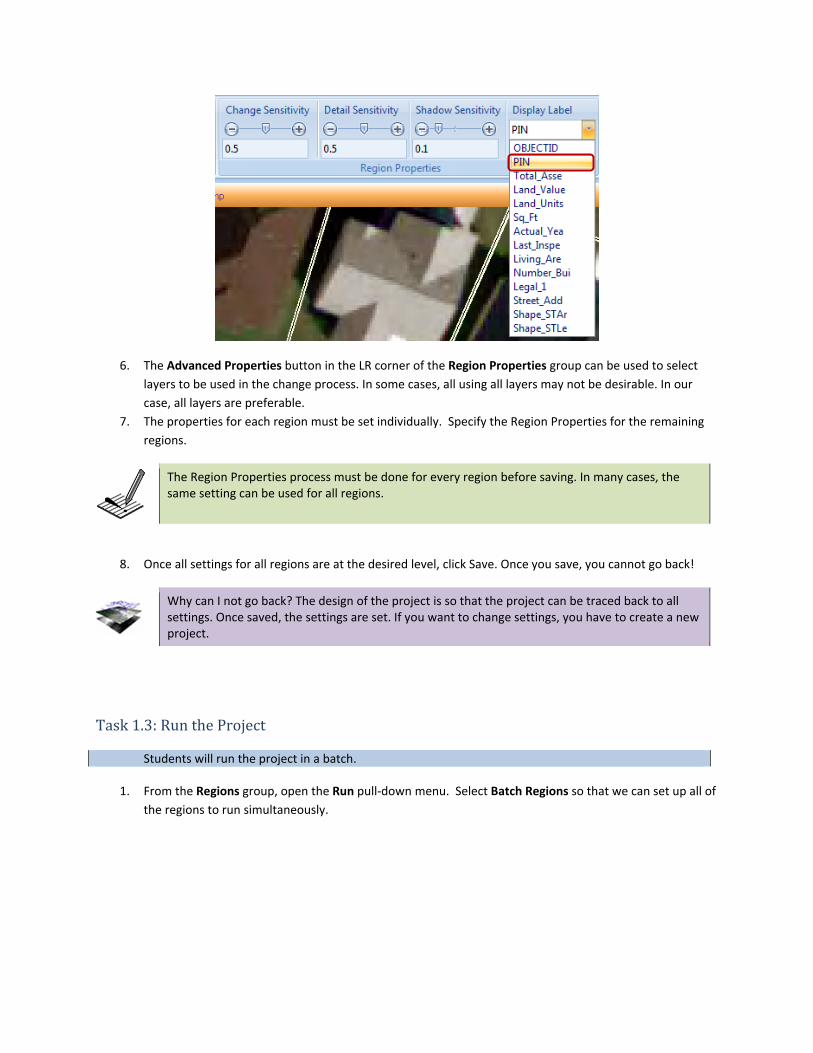
5. In the Region Properties group, set the Display Label based on the attribute in the zone file that contains
the most meaningful information. In this case, we are working with zones based on parcels so set the
Display Label to the PIN (Parcel Identification Number).
6. The Advanced Properties button in the LR corner of the Region Properties group can be used to select
layers to be used in the change process. In some cases, all using all layers may not be desirable. In our
case, all layers are preferable.
7. The properties for each region must be set individually. Specify the Region Properties for the remaining
regions.
The Region Properties process must be done for every region before saving. In many cases, the same setting can be used for all regions.
8. Once all settings for all regions are at the desired level, click Save. Once you save, you cannot go back!
Why can I not go back? The design of the project is so that the project can be traced back to all settings. Once saved, the settings are set. If you want to change settings, you have to create a new project.
Task1.3:RuntheProject
Students will run the project in a batch.
1. From the Regions group, open the Run pull‐down menu. Select Batch Regions so that we can set up all of
the regions to run simultaneously.

Selecting Run Region will run the process immediately from the workspace. Batch Regions offers several options:
Batch multiple regions as a serial process (one after another) Batch multiple regions as a parallel process (simultaneous processing) Immediate processing Time delated processing
2. In the Variable Values list, highlight All Zones by click on the 1. Right‐click and Delete Selection.
Leaving the All Zones along with all of the regions would effectively run all of the regions twice.
3. Click Submit.
4. Change the Simultaneous Processes to 4.
5. Keep the Start Processing Now radio button selected.
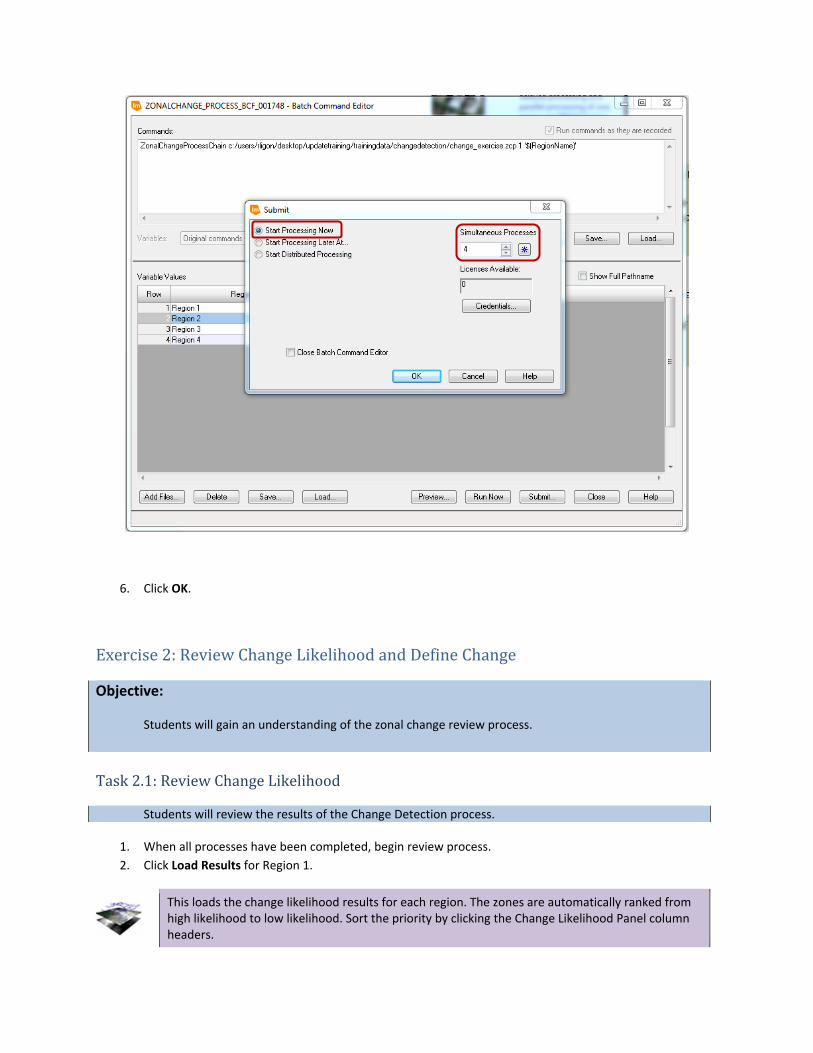
6. Click OK.
Exercise2:ReviewChangeLikelihoodandDefineChange
Objective: Students will gain an understanding of the zonal change review process.
Task2.1:ReviewChangeLikelihood
Students will review the results of the Change Detection process.
1. When all processes have been completed, begin review process.
2. Click Load Results for Region 1.
This loads the change likelihood results for each region. The zones are automatically ranked from high likelihood to low likelihood. Sort the priority by clicking the Change Likelihood Panel column headers.
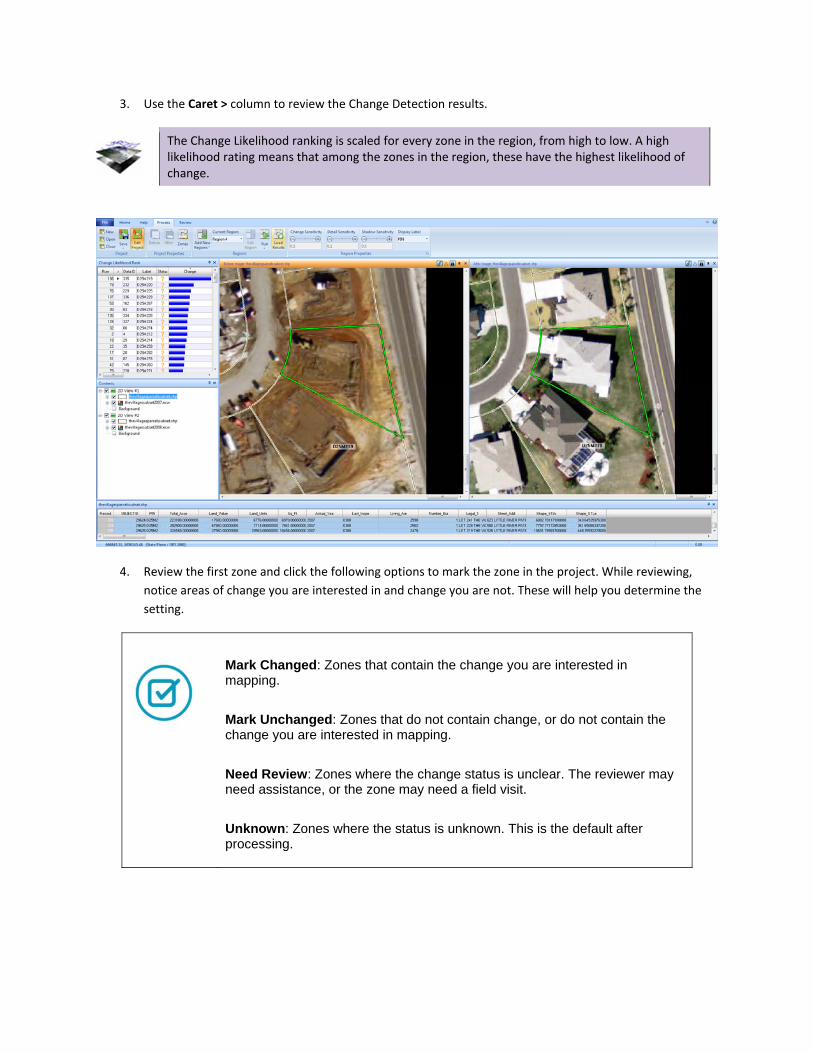
3. Use the Caret > column to review the Change Detection results.
The Change Likelihood ranking is scaled for every zone in the region, from high to low. A high likelihood rating means that among the zones in the region, these have the highest likelihood of change.
4. Review the first zone and click the following options to mark the zone in the project. While reviewing,
notice areas of change you are interested in and change you are not. These will help you determine the
setting.
Mark Changed: Zones that contain the change you are interested in mapping.
Mark Unchanged: Zones that do not contain change, or do not contain the change you are interested in mapping.
Need Review: Zones where the change status is unclear. The reviewer may need assistance, or the zone may need a field visit.
Unknown: Zones where the status is unknown. This is the default after processing.

Note: While defining the change, the viewer automatically moves to the next zone on the list.
5. Repeat for the remaining regions.
To see the complete process, check out Hexagon Geospatial’s Training videos: Smarter Change – Zonal Change Detection Part 1: Creating Your Project http://community.hexagongeospatial.com/t5/ERDAS‐IMAGINE/Smarter‐Change‐Zonal‐Change‐
Part‐1‐Creating‐Your‐Project/ta‐p/500
Smart Change – Zonal Change Part 2: Analyzing Your Results http://community.hexagongeospatial.com/t5/ERDAS‐IMAGINE/Smarter‐Change‐Zonal‐Change‐Part‐2‐Analyzing‐Your‐Results/ta‐p/579