ercot 2003 ufe analysis
DESCRIPTION
ERCOT 2003 UFE ANALYSIS. By William Boswell & Carl Raish AEIC Load Research Conference July 13, 2005. ERCOT SETTLEMENT PROCESS. CURRENT PROFILE GROUPS AND SEGMENTS. Residential Low Winter Ratio Residential High Winter Ratio. Business Non-Demand Business Low Load Factor (< 40%) - PowerPoint PPT PresentationTRANSCRIPT

ERCOT2003 UFE ANALYSIS
By William Boswell & Carl Raish
AEIC Load Research Conference July 13, 2005

TDSP Metered Entities
ERCOT Polled
Settlement Meters
Corrected CR Load
Generation Data
Calculate and
Allocate UFE
CR Load
Data Aggregation Process
Registration Data Settlement
Retail Load Data
Aggregation
Gen/Zonal Data
Aggregated CR/NOIE Load
Generation & Zonal
Meter Data Aggregation
NOIE Data
Apply T&D Losses NOIE
Load
Profiling
Data Acquisition
ERCOT MV90
System
TDSP Data
Collection Systems
ERCOT SETTLEMENT PROCESS

CURRENT PROFILE GROUPS AND SEGMENTS
•Residential Low Winter Ratio
•Residential High Winter Ratio
•Business Non-Demand
•Business Low Load Factor (< 40%)
•Business Medium Load Factor (40% - 60%)
•Business High Load Factor (> 60%)
•Business IDR Default
•Non-Metered Lighting (street lights, security lights, etc)
•Non-Metered Flat (traffic signals, communication equipment, etc)

ERCOT WEATHER ZONES

1Flat
Profile
65 Unique Profiles Daily
8 AdjustedStatic Profile
Types
8 Weather
Zones
ERCOT HAS 65 UNIQUE PROFILES

LOAD PROFILING METHODOLOGY
•Adjusted Static Models for metered Load Profiles
•Engineering estimates for non-metered loads
•Scaled profiles based on meter readings spanning the trade day or if unavailable previous meter readings
•Proxy day profiles for IDR premises if trade day data unavailable
•Un-scaled profiles for both IDR and NIDR premises when individual meter data is unavailable
•Supplemental Load Profiling
–Time-Of-Use (chunking)
–Direct Load Control (lagged dynamic)

LOAD AND UFE – ERCOT 2003 PEAK Based on True-up Settlement
This is a graph of load and UFE on the Peak Day in 2003.
ERCOT Load and UFE2003 Peak Day - August 7, 2003
-2000
0
2000
4000
6000
8000
10000
12000
14000
16000
1 9 17 25 33 41 49 57 65 73 81 89
Interval
MW
H
-2
-1
0
1
2
3
4
Perc
ent
ERCOT LOAD
Percent UFE
UFE
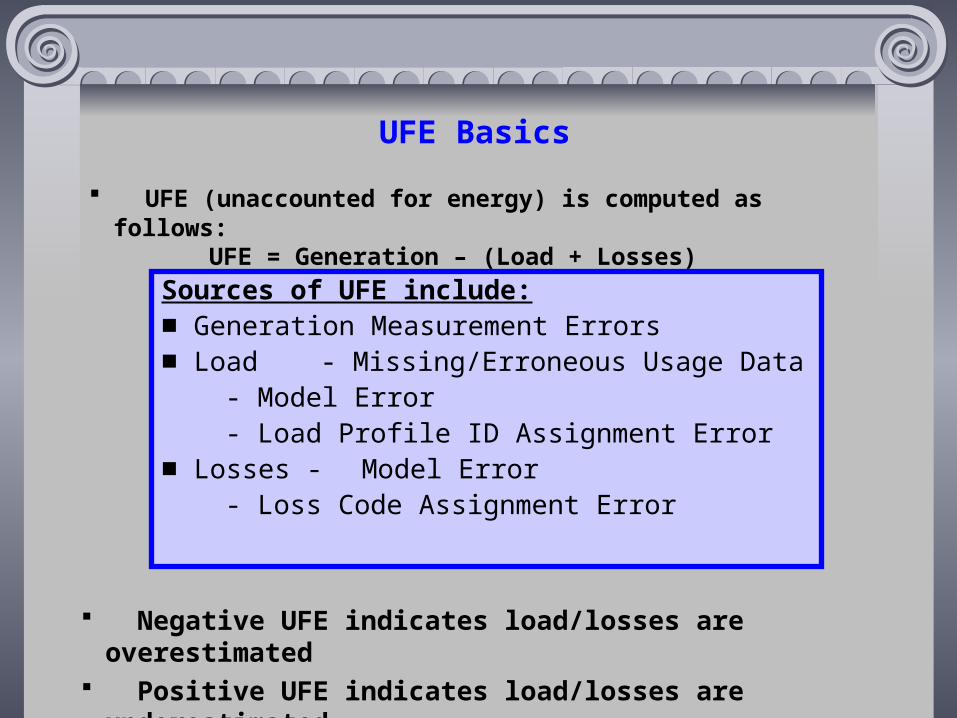
UFE Basics
Sources of UFE include:■ Generation Measurement Errors■ Load - Missing/Erroneous Usage Data
- Model Error - Load Profile ID Assignment Error
■ Losses - Model Error - Loss Code Assignment Error
Negative UFE indicates load/losses are overestimated Positive UFE indicates load/losses are underestimated
UFE (unaccounted for energy) is computed as follows:UFE = Generation – (Load + Losses)

UFE Basics
Net Generation for Settlement Interval
Interval Data Energy Usage
Profiled Energy Usage Non-Interval Data
Non-Metered Accounts
Losses:Transmission &
Distribution
UFEGAP - - - - - - >
Net GenerationCompared toLoad Buildup

DATA VERIFICATION IN THE SETTLEMENT PROCESS
UFE is computed for each 15-minute interval of a settlement run.
Initial
Final
Settlement
True-Up
Initial Settlement(17 days after the trade day)
Final Settlement(59 days after the trade day)
True-up and Resettlement (6 months to up to several years after the trade day.)
The latest resettlement in each interval is used in the analysis for Initial, Final and True-Up.

2003 UFE Mwh by Month
0
50,000
100,000
150,000
200,000
250,000
300,000
350,000
Month of 2003
Mw
h
Jan AprMarFeb May Jun Jul Aug Sep Oct Nov Dec
SR01
Annual Total = 1,673,000 MWh
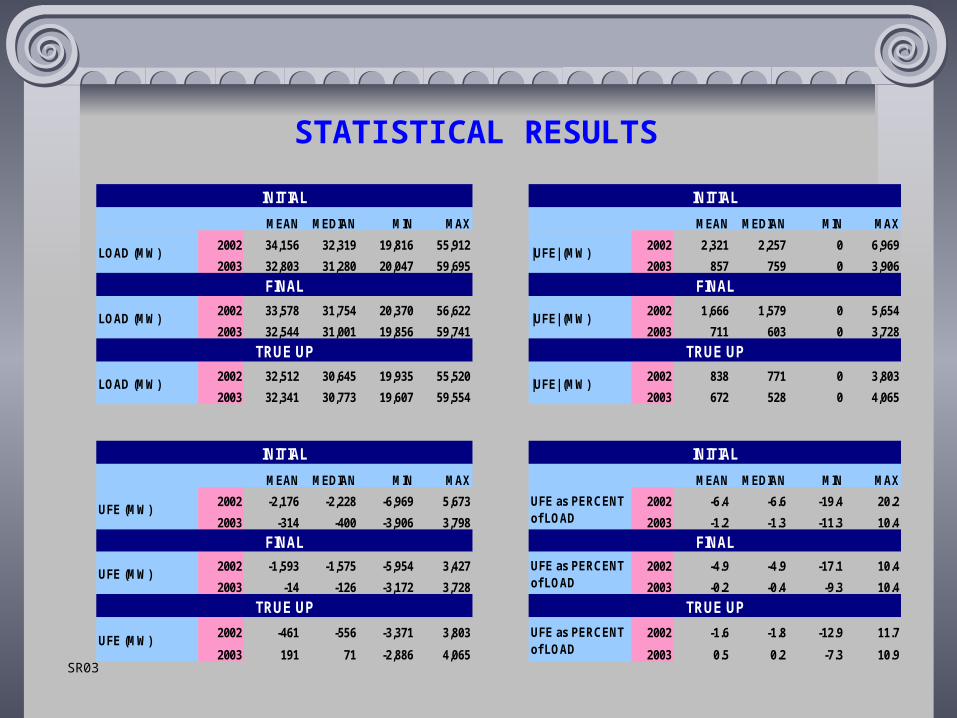
STATISTICAL RESULTS
SR03
MEAN MEDIAN MIN MAX MEAN MEDIAN MIN MAX
2002 34,156 32,319 19,816 55,912 2002 2,321 2,257 0 6,969
2003 32,803 31,280 20,047 59,695 2003 857 759 0 3,906
2002 33,578 31,754 20,370 56,622 2002 1,666 1,579 0 5,654
2003 32,544 31,001 19,856 59,741 2003 711 603 0 3,728
2002 32,512 30,645 19,935 55,520 2002 838 771 0 3,803
2003 32,341 30,773 19,607 59,554 2003 672 528 0 4,065
MEAN MEDIAN MIN MAX MEAN MEDIAN MIN MAX
2002 -2,176 -2,228 -6,969 5,673 2002 -6.4 -6.6 -19.4 20.2
2003 -314 -400 -3,906 3,798 2003 -1.2 -1.3 -11.3 10.4
2002 -1,593 -1,575 -5,954 3,427 2002 -4.9 -4.9 -17.1 10.4
2003 -14 -126 -3,172 3,728 2003 -0.2 -0.4 -9.3 10.4
2002 -461 -556 -3,371 3,803 2002 -1.6 -1.8 -12.9 11.7
2003 191 71 -2,886 4,065 2003 0.5 0.2 -7.3 10.9
INITIAL
LOAD (MW)
INITIAL
UFE as PERCENT of LOAD
UFE as PERCENT of LOAD
UFE (MW)
|UFE| (MW)
TRUE UP
UFE (MW)
|UFE| (MW)LOAD (MW)
|UFE| (MW)
UFE as PERCENT of LOAD
TRUE UP
FINAL
TRUE UP
INITIAL
FINAL
LOAD (MW)
FINAL
TRUE UP
INITIAL
FINAL
UFE (MW)

STATISTICAL RESULTS (CONTINUED)
2002 UFE has a negative bias across all settlements.
2003 UFE has a negative bias for Initial and final Settlement, positive bias for True-up.
2003 UFE for True-up has a mean of 0.5% and a median of 0.2% as compared to -1.6% and -1.8% respectively for 2002.
Mean and Median UFE values are similar indicating the UFE distributions are not skewed.
From Initial to Final thru True-Up settlements, UFE gets closer to 0 indicating more complete usage data improves UFE.
SR04
MEAN MEDIAN MIN MAX
2002 6.8 6.7 0 20.2
2003 2.7 2.3 0 11.3
2002 5.1 4.9 0 17.1
2003 2.2 1.9 0 10.4
2002 2.6 2.4 0 12.9
2003 2.1 1.7 0 10.9
|UFE as PERCENT of Load|
|UFE as PERCENT of Load|
INITIAL
FINAL
|UFE as PERCENT of Load|
TRUE UP

Generation Differences Between Initial and Final Settlements
8.4% of the intervals had Initial to Final differences greater than 100 MW
Differences greater than 300 MW occurred for 1.0 % of the intervalsGDF01

Generation Differences Between Final and True-Up Settlements
GDF02
5.5% of the intervals had Final to True-Up differences greater than 100 MW
Differences greater than 300 MW occurred for 0.1 % of the intervals

GDF04
Change in Generation between Settlements
0.0
10.0
20.0
30.0
40.0
50.0
60.0
70.0
80.0
90.0
-0.05 0.05 0.15 0.25 0.35 0.45 0.75 1.25
Percent Change in Gen Mwh
Perc
en
t o
f In
terv
als
Initial to Final
Final to True-Up

2003 Distribution of UFEas Percent of ERCOT Load
The UFE percent moves in a positive direction from Initial to Final thru True-Up.UFD03
0.0
2.0
4.0
6.0
8.0
10.0
12.0
14.0
16.0
-10.0 -9.0 -8.0 -7.0 -6.0 -5.0 -4.0 -3.0 -2.0 -1.0 0.0 1.0 2.0 3.0 4.0 5.0 6.0 7.0 8.0 9.1
UFE Percent of ERCOT Load - 2003
Dis
trib
uti
on
of
UF
E P
erc
en
t o
f E
RC
OT
Lo
ad
Initial Final True-Up
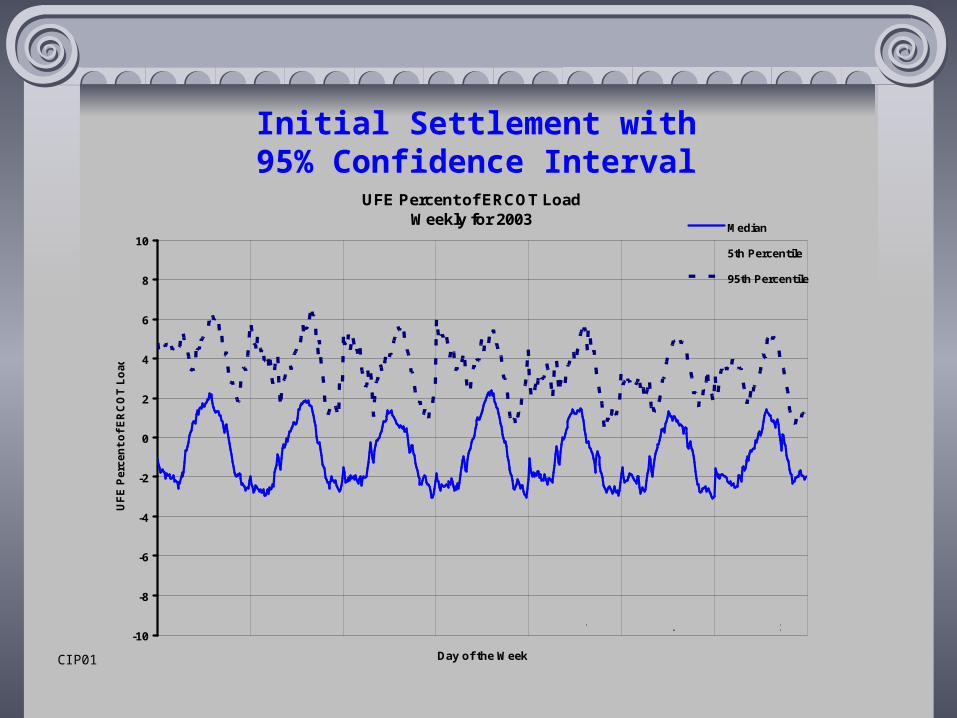
Initial Settlement with95% Confidence Interval
CIP01
UFE Percent of ERCOT LoadWeekly for 2003
-10
-8
-6
-4
-2
0
2
4
6
8
10
Day of the Week
UF
E P
erc
en
t o
f E
RC
OT
Lo
ad
Median
5th Percentile
95th Percentile
Sun TueMon Wed Thur Fri Sat

Final Settlement with95% Confidence Interval
CIP02
UFE Percent of ERCOT LoadWeekly for 2003
-10
-8
-6
-4
-2
0
2
4
6
8
10
Day of the Week
UF
E P
erc
en
t o
f E
RC
OT
Lo
ad
Median
5th Percentile
95th Percentile
Sun TueMon Wed Thur Fri Sat

True-Up Settlement with95% Confidence Interval
CIP03
UFE Percent of ERCOT LoadWeekly for 2003
-10
-8
-6
-4
-2
0
2
4
6
8
10
Day of the Week
UF
E P
erc
en
t o
f E
RC
OT
Lo
ad
Median
5th Percentile
95th Percentile
Sun TueMon Wed Thur Fri Sat

CIP04
Median ComparisonBy Settlement Type
UFE Percent of ERCOT Load
-4
-3
-2
-1
0
1
2
3
4
Day of the Week
UF
E P
erc
en
t o
f E
RC
OT
Lo
ad
Initial
Final
TrueUp
Sun Mon Tue Wed Thu Fri Sat

UFE by Weekday General Observations
The UFE Percent of ERCOT Load graphs indicate UFE as a percent of load varies over a wide range between the Median, the 5th Percentile and 95th Percentile.
The difference between the Median, the 5th Percentile and 95th Percentile decreases from Initial to Final through True-Up settlements.
For all settlements there is a well-defined cyclical component across all days of the week. UFE is negative during the off-peak hours and positive during on-peak hours.
Median values move in a positive direction from Initial to Final through True-Up settlements across all days of the week indicating settlements based on more complete usage data result in a reduction in the over-estimation of load.
CIP05

UFE Percent of ERCOT Load and ERCOT Load - Spring 2003
SEA01
-8
-6
-4
-2
0
2
4
6
Day of the Week
UF
E P
erc
en
t o
f E
RC
OT
Lo
ad
0
5000
10000
15000
20000
25000
30000
35000
ER
CO
T L
oa
d (
MW
)
Initial Final True-Up Total ERCOT Aggregated Load Adjusted for Losses
Sun Mon Tue Wed Thu Fri Sat

UFE Percent of ERCOT Load and ERCOT Load - Summer 2003
SEA02
-8
-6
-4
-2
0
2
4
6
Day of the Week
UF
E P
erc
en
t o
f E
RC
OT
Lo
ad
15000
20000
25000
30000
35000
40000
45000
50000
ER
CO
T L
oa
d (
MW
)
Initial Final True-Up Total ERCOT Aggregated Load Adjusted for Losses
Sun Mon Tue Wed Thu Fri Sat

UFE Percent of ERCOT Load and ERCOT Load - Fall 2003
SEA03
-8
-6
-4
-2
0
2
4
6
Day of the Week
UF
E P
erc
en
t o
f E
RC
OT
Lo
ad
20000
25000
30000
35000
40000
45000
50000
55000
ER
CO
T L
oa
d (
MW
)
Initial Final True-Up Total ERCOT Aggregated Load Adjusted for Losses
Sun Mon Tue Wed Thu Fri Sat

UFE Percent of ERCOT Load and ERCOT Load - Winter 2003
SEA04
-8
-6
-4
-2
0
2
4
6
Day of the Week
UF
E P
erc
en
t o
f E
RC
OT
Lo
ad
20000
25000
30000
35000
40000
45000
50000
55000
ER
CO
T L
oa
d (
MW
)
Initial Final True-Up Total ERCOT Aggregated Load Adjusted for Losses
Sun Mon Tue Wed Thu Fri Sat

SEA05
Seasonal Comparison of Medians Initial Settlement
-8
-6
-4
-2
0
2
4
6
Day of the Week
UF
E P
erce
nt
of
Lo
ad
Spring Summer Fall Winter
Sun Mon Tue Wed Thu Fri Sat

SEA06
Seasonal Comparison of MediansFinal Settlement
-8
-6
-4
-2
0
2
4
6
Day of the Week
UF
E P
erce
nt
of
Lo
ad
Spring Summer Fall Winter
Sun Mon Tue Wed Thu Fri Sat

SEA07
Seasonal Comparison of Medians True-Up Settlement
-8
-6
-4
-2
0
2
4
6
Day of the Week
UF
E P
erce
nt
of
Lo
ad
Spring Summer Fall Winter
Sun Mon Tue Wed Thu Fri Sat

Percent UFE vs ERCOT LoadInitial Settlement
MPL01
-10.0
-8.0
-6.0
-4.0
-2.0
0.0
2.0
4.0
6.0
8.0
21000 26000 31000 36000 41000 46000 51000 56000
ERCOT Load (MW)
Pe
rce
nt
UF
E
Median
5th Percentile
95th Percentile
Regression on Total Aggregated Load

Percent UFE vs ERCOT LoadFinal Settlement
MPL02
-10.0
-8.0
-6.0
-4.0
-2.0
0.0
2.0
4.0
6.0
8.0
20000 25000 30000 35000 40000 45000 50000 55000
ERCOT Load (MW)
Pe
rce
nt
UF
E
Median
5th Percentile
95th Percentile
Regression on Total Aggregated Load

Percent UFE vs ERCOT LoadTrue-Up Settlement
MPL03
-10.0
-8.0
-6.0
-4.0
-2.0
0.0
2.0
4.0
6.0
8.0
20000 25000 30000 35000 40000 45000 50000 55000
ERCOT Load (MW)
Perc
en
t U
FE
Median
5th Percentile
95th Percentile
Regression on Total Aggregated Load

Comparison of Median Percent UFEBy Settlement Type
MPL04
-10.0
-8.0
-6.0
-4.0
-2.0
0.0
2.0
4.0
6.0
8.0
20000 25000 30000 35000 40000 45000 50000 55000
ERCOT Load (MW)
Pe
rcen
t U
FE
Initial
Final
True Up

General ObservationsPercent UFE vs ERCOT Load
UFE = Generation – (Load + Losses)
There is a statistically significant relationship between load and UFE.
There is wide variability between the median, 5th and 95th percentiles of percent UFE for initial and final settlements. Variability decreases dramatically for the true up settlements.
As load increases, median UFE for all settlements moves in a positive direction indicating (Load + Losses) are over estimated at low load intervals and are progressively more under estimated as load increases.
MPL05

General ObservationsPercent UFE vs ERCOT Load
UFE shifts in a positive direction from initial to final thru true-Up settlements indicating settlements based on more complete usage data result in a reduction in the over-estimation of load.
UFE is closest to zero between 30,000 to 40,000 MW. UFE for Initial settlement becomes worse than UFE for Final settlement at approximately 38,000 MW of ERCOT load. Similarly, UFE for Final settlement becomes worse than UFE for True-Up at approximately 34,000 MW of ERCOT load.
There is a well-defined cyclical component across all days of the week however the UFE cycles are out of phase with the load cycles
MPL05
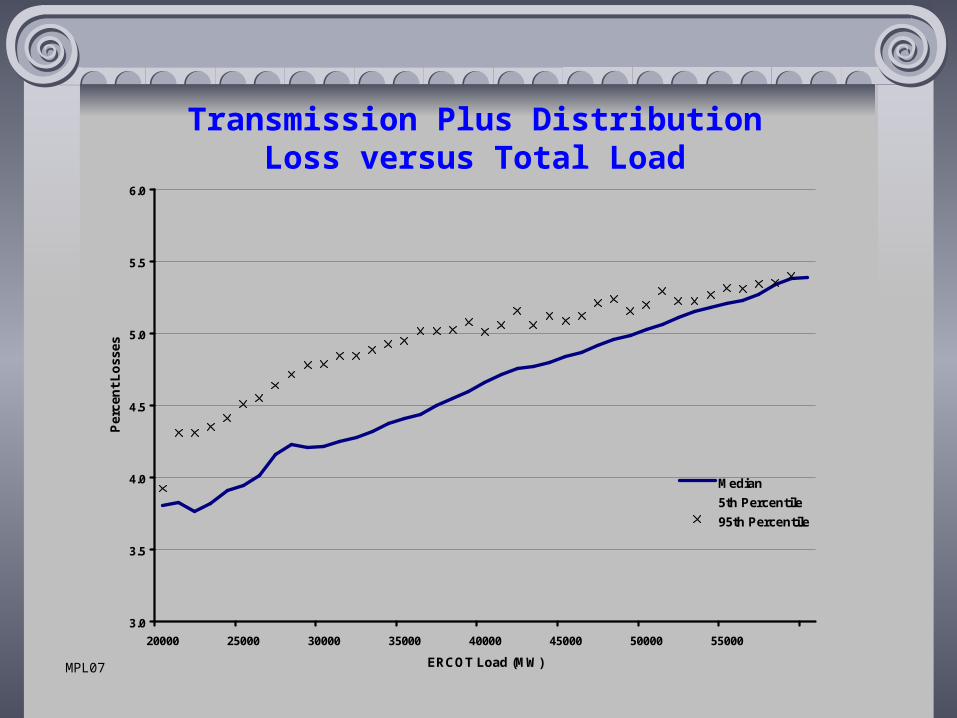
Transmission Plus Distribution Loss versus Total Load
MPL07
3.0
3.5
4.0
4.5
5.0
5.5
6.0
20000 25000 30000 35000 40000 45000 50000 55000
ERCOT Load (MW)
Per
cen
t L
oss
es
Median
5th Percentile
95th Percentile
Note: Percent losses includes distribution plus transmission losses.

MPL08
Distribution Loss versus Distribution Load
2.0
2.5
3.0
3.5
4.0
4.5
5.0
16000 20000 24000 28000 32000 36000 40000 44000
Total ERCOT Load - NOIE Load - Trans Losses (MW)
Perc
en
t D
istr
ibu
tio
n L
os
se
s
Median
5th Percentile
95th Percentile

MPL09
Transmission Loss versus Total Actual Load
1.0
1.2
1.4
1.6
1.8
2.0
2.2
2.4
2.6
20000 25000 30000 35000 40000 45000 50000 55000 60000
Total ERCOT Actual Load
Pe
rcen
t T
ran
sm
issio
n L
osse
s
Spring Median
Summer Median
Fall Median
Winter Median
Annual Median

UFE costs are calculated by multiplying the UFE (MWH) times the Market Clearing Price for Load (MCPEL)($/MWH) for each 15-minute interval in 2003.
MCPEL is a function of Congestion Zone. MCPEL is the same across all Congestion Zones if there is no congestion.
The CM Zones for 2003 are: Houston, North, South and West
UFE Cost Analysis by Congestion Management Zone
UCT01

UFE cost values per interval are calculated for:
positive and negative UFE
the absolute value of UFE
the net value of UFE.
Median UFE cost analyses include:
Seasonal as defined in the Profile Assignment Decision Tree
Spring: March 1 – April 30
Summer: May 1 – September 30
Fall: October 1 – November 30
Winter: December 1 – February 28
Monthly
Hour of the week.
UFE Cost Analysis by Congestion Management Zone
UCT01
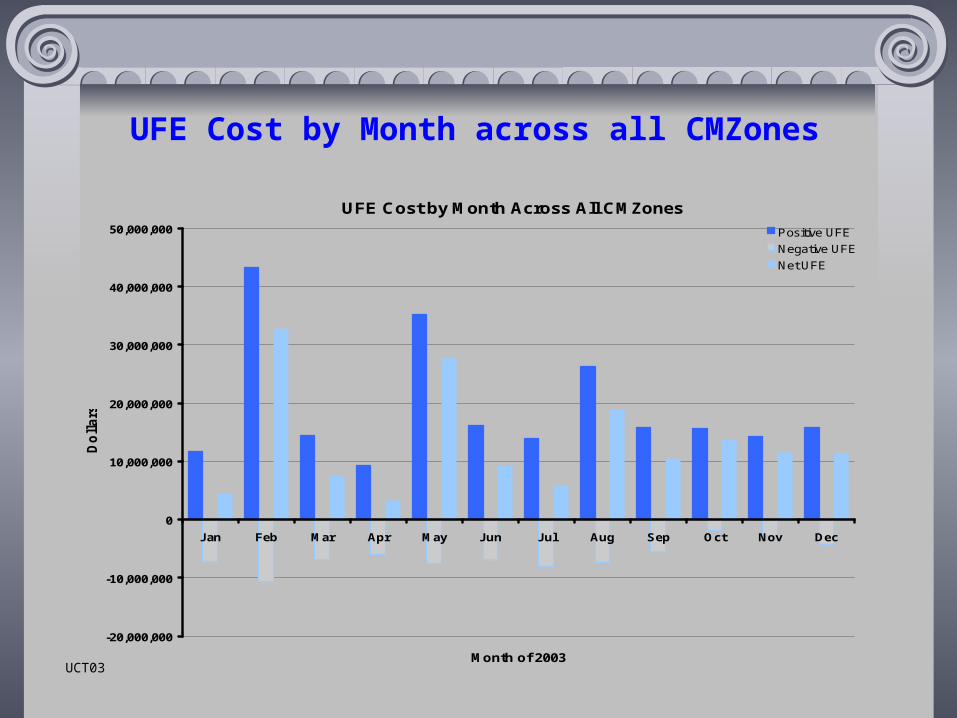
UFE Cost by Month across all CMZones
UFE Cost by Month Across All CMZones
-20,000,000
-10,000,000
0
10,000,000
20,000,000
30,000,000
40,000,000
50,000,000
Jan Feb Mar Apr May Jun Jul Aug Sep Oct Nov Dec
Month of 2003
Do
llars
Positive UFE
Negative UFE
Net UFE
UCT03

Absolute ValueUFE Cost by Month and CMZone
UCT04
0
10,000,000
20,000,000
30,000,000
40,000,000
50,000,000
60,000,000
Jan Feb Mar Apr May Jun Jul Aug Sep Oct Nov Dec
Month of 2003
Do
lla
rs
West 03
South 03
North 03
Houston 03
CMZone:

Net UFE Cost by Month and CMZone
UCT05
0
5,000,000
10,000,000
15,000,000
20,000,000
25,000,000
30,000,000
35,000,000
Jan Feb Mar Apr May Jun Jul Aug Sep Oct Nov Dec
Month of 2003
Do
lla
rs
West 03
South 03
North 03
Houston 03
CMZone:

SUM of UFE Dollars – SpringAbsolute Value and Net UFE
UCT17
Spring: March 1 - April 30
-400,000
-200,000
0
200,000
400,000
600,000
800,000
1,000,000
1,200,000
Day of the Week
Do
lla
rs
SUM[ABS(UFE)] SUM[Net(UFE)]
Sun Mon Tue Wed Thu Fri Sat
MCPE = 167.32 $/MW

UCT18
SUM of UFE Dollars – SummerAbsolute Value and Net UFE
Summer: May 1 - Sept 30
-400,000
-200,000
0
200,000
400,000
600,000
800,000
1,000,000
1,200,000
Day of the Week
Do
lla
rs
SUM[ABS(UFE)] SUM[Net(UFE)]
Sun Mon Tue Wed Thu Fri Sat

UCT19
SUM of UFE Dollars – FallAbsolute Value and Net UFE
Fall: Oct 1 - Nov 30
-400,000
-200,000
0
200,000
400,000
600,000
800,000
1,000,000
1,200,000
Day of the Week
Do
lla
rs
SUM[ABS(UFE)] SUM[Net(UFE)]
Sun Mon Tue Wed Thu Fri Sat
MCPE = $428.27
UCT20
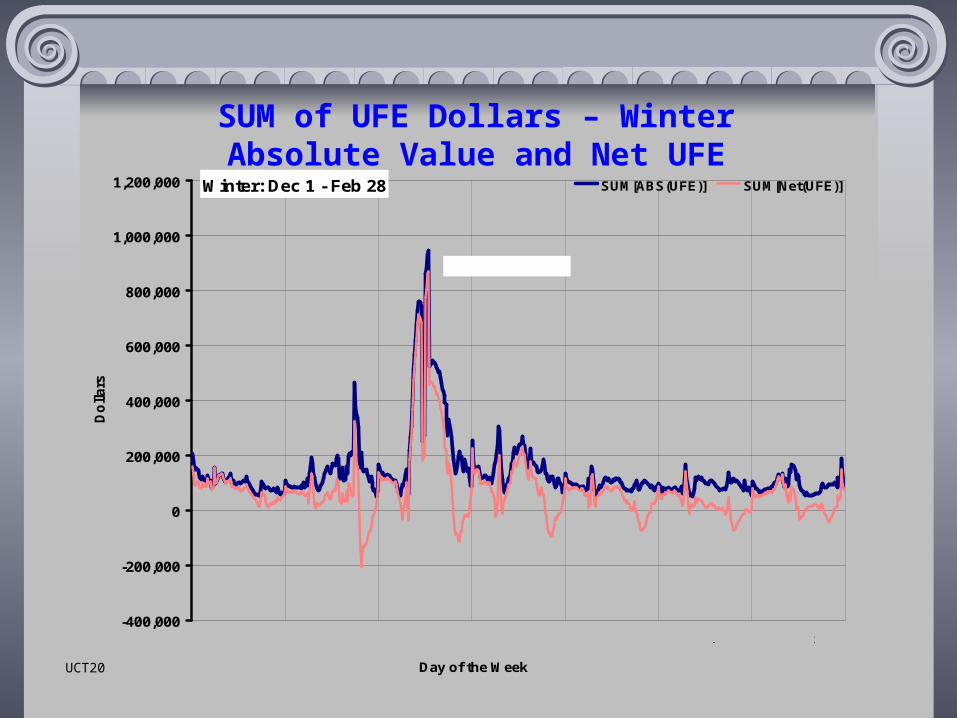
SUM of UFE Dollars – WinterAbsolute Value and Net UFE
Winter: Dec 1 - Feb 28
-400,000
-200,000
0
200,000
400,000
600,000
800,000
1,000,000
1,200,000
Day of the Week
Do
llars
SUM[ABS(UFE)] SUM[Net(UFE)]
Sun Mon Tue Wed Thu Fri Sat
MCPE = 990 $/MW

RESULTS and CONCLUSIONSThe total dollars for the absolute value of UFE in 2003 amounted to $307 million. The net UFE amounted to $157 million.
During 2003, there was a strong daily cyclical component to median UFE (related to load).
Median UFE tends to be negative during the off-peak intervals and positive during on-peak intervals. This pattern is similar for all days of the week.
Median UFE tends to be negative during low load intervals and moves in a positive direction as load increases.
Median UFE values move in a positive direction from initial to final thru true-up indicating settlements based on more complete usage data result in a reduction in the over-estimation of load.
There is less variance in UFE for true-up settlements when compared to initial and final settlements.
The pattern of median UFE is significantly different across seasons.

Continue with Load Research Project (PUCT Project 25516)
Improve Profile ID assignment processContinue to improve usage data loading accuracy and timelinessIncrease the number of IDR’s
Evaluate Lagged Dynamic sampling techniques and their application to the ERCOT System
Continue to evaluate improvements to algorithms for missing IDR and NIDR data estimation
Continue to make improvements to loss estimations
Explore alternative methods for UFE allocation
UFE Zones
By Substation Assignment
By Weather Zone
RECOMMENDATIONS