erc lep dashboard presentation manchester october 2014
TRANSCRIPT

Cluster Analysis and the LEP Growth Dashboard
ERC and GrowthAccelerator
LEP Presentation - Manchester 7th October 2014

State of Small Business Britain
http://enterpriseresearch.ac.uk/home-8/report-back-state-small-business-britain-conference-2014/

Structure
• Background – developing policy context
• LEP Cluster Analysis
• LEP Growth Dashboard
• Discussion
Background
• BIS commissioned the Enterprise Research Centre (ERC) to undertake an analysis of industrial clusters in the UK – Anyadike-Danes et al (2013) “Localisation of Industrial Activity across England’s LEPs: 2008 & 2012”
• Local Enterprise Partnerships (LEPs) the sub-national spatial frame in England.
• ERC working with the BIS Local Growth team, the What Works Centre and Grant Thornton/Growth Accelerator to provide analysis on the LEPs and Growth Hubs.

Developing Policy Agenda around Growth
• LEP SEPs and ESIFs submitted and funding allocated
• Growth Hubs – initial pathfinders; Wave 2 Cities (Lancaster University RGF Programme)
• BIS - Simplifying the Local Business Support Landscape - a guide for Cities and LEPs – 3 pilots: EM3 LEP; Northamptonshire LEP; Sheffield City Region LEP

Clusters

Table 5.4.3: Top 20 Sectors by LQ 2012 – Cheshire and Warrington 2012 Top 20 by LQ Cheshire and Warrington
SIC Sites (GB)
Jobs (GB)
Sites (LEP)
Jobs (LEP)
LQ (LEP) SIC description
20130 135 4488 10 1242 16.24 Manufacture of other inorganic basic chemicals 1629 851 3352 31 682 11.94 Support activities for animal production (other than [...]) n.e.c.
29100 770 60654 17 5793 5.61 Manufacture of motor vehicles 47520 7181 89291 136 7897 5.19 Retail sale of hardware, paints and glass in specialised stores 30300 712 84145 29 6213 4.33 Manufacture of air and spacecraft and related machinery
62011 891 7134 15 486 4.00 Ready-made interactive leisure and entertainment software development
10910 271 6796 10 435 3.76 Manufacture of prepared feeds for farm animals 74203 821 3511 13 222 3.71 Film processing 78300 1379 10056 37 616 3.60 Other human resources provision 20590 555 14308 24 870 3.57 Manufacture of other chemical products n.e.c. 32300 599 5156 20 296 3.37 Manufacture of sports goods
1420 3169 8291 192 421 2.98 Raising of other cattle and buffaloes 72190 3464 98848 64 4983 2.96 Other research and experimental development on sciences and eng’ing
1410 5334 15220 283 753 2.90 Raising of dairy cattle 46341 880 7031 10 331 2.76 Wholesale of fruit and vegetable juices, mineral waters and soft drinks 69202 4753 54214 72 2446 2.65 Bookkeeping activities 46711 650 10853 21 478 2.59 Wholesale of petroleum and petroleum products 80300 544 1538 10 65 2.48 Investigation activities 71129 39542 201539 3280 8423 2.45 Other engineering activities (not including [...]) 46310 1992 30591 23 1248 2.39 Wholesale of fruit and vegetables 717016 43900 6.1% Top 20 LEP SICs % of GB SIC jobs

Table 5.17.1: Top 20 Sectors by LQ 2008 - Lancashire 2008 Top 20 by LQ Lancashire
SIC Sites (GB)
Jobs (GB)
Sites (LEP)
Jobs (LEP)
LQ (LEP) SIC description
1190 580 4740 26 747 9.25 Growing of other non-perennial crops 71121 5751 37325 89 5411 8.51 Engineering design activities for industrial process and production 13990 421 5164 22 620 7.05 Manufacture of other textiles n.e.c. 13200 242 7320 18 805 6.46 Weaving of textiles 28940 198 2222 14 239 6.32 Manufacture of machinery for textile, apparel and leather production 10110 330 17386 12 1656 5.59 Processing and preserving of meat 13931 101 3380 13 320 5.56 Manufacture of woven or tufted carpets and rugs 13923 431 9000 20 836 5.45 Manufacture of household textiles (other than soft furnishings of 13.92/1) 27900 703 9122 12 834 5.37 Manufacture of other electrical equipment 15200 247 4280 12 358 4.91 Manufacture of footwear 14120 325 4929 11 351 4.18 Manufacture of workwear 20160 569 15289 26 1069 4.11 Manufacture of plastics in primary forms 46410 2223 14666 73 969 3.88 Wholesale of textiles 31010 1048 19899 17 1253 3.70 Manufacture of office and shop furniture 84300 1324 97878 37 6060 3.64 Compulsory social security activities 13300 592 6914 21 413 3.51 Finishing of textiles 55209 1754 7687 21 451 3.45 Other holiday and other short-stay accommodation (not incl. [...]) n.e.c. 20420 425 15998 10 931 3.42 Manufacture of perfumes and toilet preparations 29202 301 8093 15 456 3.31 Manufacture of trailers and semi-trailers 1410 3770 9302 182 466 2.94 Raising of dairy cattle 300594 24245 8.1% Top 20 LEP SICs % of GB SIC jobs

Table 5.23.1: Top 20 Sectors by LQ 2008 – Greater Manchester 2008 Top 20 by LQ Greater Manchester
SIC Sites (GB)
Jobs (GB)
Sites (LEP)
Jobs (LEP)
LQ (LEP) SIC description
51102 495 11898 17 4448 8.63 Non-scheduled passenger air transport 27200 119 2772 10 865 7.20 Manufacture of batteries and accumulators 28950 56 1151 11 346 6.94 Manufacture of machinery for paper and paperboard production
81229 211 1847 14 477 5.96 Building and industrial cleaning activities (other than window cleaning, [...]) n.e.c.
13923 431 9000 73 1658 4.25 Manufacture of household textiles (other than soft furnishings of 13.92/1) 13990 421 5164 43 908 4.06 Manufacture of other textiles n.e.c. 64992 128 2794 15 474 3.91 Factoring 46410 2223 14666 267 2454 3.86 Wholesale of textiles 81221 887 6159 40 1030 3.86 Window cleaning services 47910 4766 54967 243 9119 3.83 Retail sale via mail order houses or via Internet 85530 1858 7866 67 1189 3.49 Driving school activities 43110 391 3810 23 525 3.18 Demolition 20411 168 8105 16 1116 3.18 Manufacture of soap and detergents
87200 1931 74967 84 10112 3.11 Residential care activities for learning disabilities, mental health, substance abuse
13200 242 7320 21 964 3.04 Weaving of textiles
20301 398 15226 30 1842 2.79 Manufacture of paints, varnishes and similar coatings, mastics and sealants
46420 4632 38774 404 4669 2.78 Wholesale of clothing and footwear 26120 531 11242 27 1335 2.74 Manufacture of loaded electronic boards 20302 170 2993 15 350 2.70 Manufacture of printing ink 23990 228 6086 16 706 2.68 Manufacture of other non-metallic mineral products n.e.c. 286807 44587 15.5% Top 20 LEP SICs % of GB SIC jobs

Industrial Sectors Analysis • Witty Review sought to examine ways in which universities
can support economic growth working in conjunction with organisations such as Local Enterprise Partnerships (LEPs).
• Two main hypotheses: – strongest basis for regional economic growth is based on a
comprehensive understanding of a locality’s comparative economic advantage;
– much of the UK’s comparative economic advantage could be derived from its universities and research in fields relevant to the Industrial Strategy sectors and technologies.

Key Results – Advanced Manufacturing Aerospace
– Little change between 2008 and 2012; employment concentrated in Lancashire; Derby, Derbyshire, Nottingham and Nottinghamshire & West of England LEPs(LQ 3+)
Automotive – Concentrated mainly in the midlands (Coventry and Warwickshire,
Birmingham and Solihull), concentration in these areas increased by 2012 (LQ 4+)
Agri-tech – Concentrated in LEPs situated around the coast of England, The Marches, New
Anglia and Greater Lincolnshire – the latter giving way to the former as most concentrated by 2012 (LQ 3+)
Life Sciences – Notable change between 2008-2012; in 2008 Hertfordshire had the highest
concentration (LQ 3-4), by 2012 Humber, Oxfordshire, Swindon and Wiltshire LEPs had all joined it as the most concentrated
Key Results – Knowledge Intensive Traded Services Professional and Business Services
– Not particularly concentrated in any LEP, those in the South of England higher than average, by 2012 the Midlands also higher than average (LQs 1-2)
Information Economy – Concentrated within a few LEPS, mainly in the South (Thames Valley
Berkshire, Enterprise M3). In 2008 Cheshire and Warrington was the only Northern LEP with a higher than average concentration (LQ 1-2), by 2012 this was below average
Education – Not particularly concentrated in any LEP, no change between 2008 and
2012
Key Results – Enabling Sectors
Nuclear – Concentrated within a few mainly coastal LEPs (heaviest in Cumbria,
Derbyshire & Nottinghamshire LQ 4+). By 2012 Tees Valley had dropped below average (previously LQ 3-4), Lancashire and Gloucestershire had increased.
Offshore Wind – LQs unavailable but industry largely concentrated around North East,
North West and Eastern coasts Oil and Gas
– Concentrated within 3 LEPs: Humber (LQ 4+), Cheshire and Warrington (LQ 3-4) and Greater Lincolnshire (LQ 2-3). By 2012 same 3 but LQs all now 2-3
Construction – No particularly heavy concentrations, although central England LEPs below
average. By 2012 similar pattern although several northern LEPs also below average

UK Industrial Sectors - Summary • Overall, few changes between 2008-2012 • Increase in Life Sciences amongst Oxfordshire, Swindon and
Wiltshire and Humber LEPs • Majority of industry concentrated largely where it has been
historically: – Heavy advanced manufacturing concentrated in the
midlands area – Information and Professional Services skewed towards
Southern areas – Enabling sectors situated in Northern coastal areas

LEP Growth Dashboard
Joint venture between ERC and GrowthAccelerator

What is it?
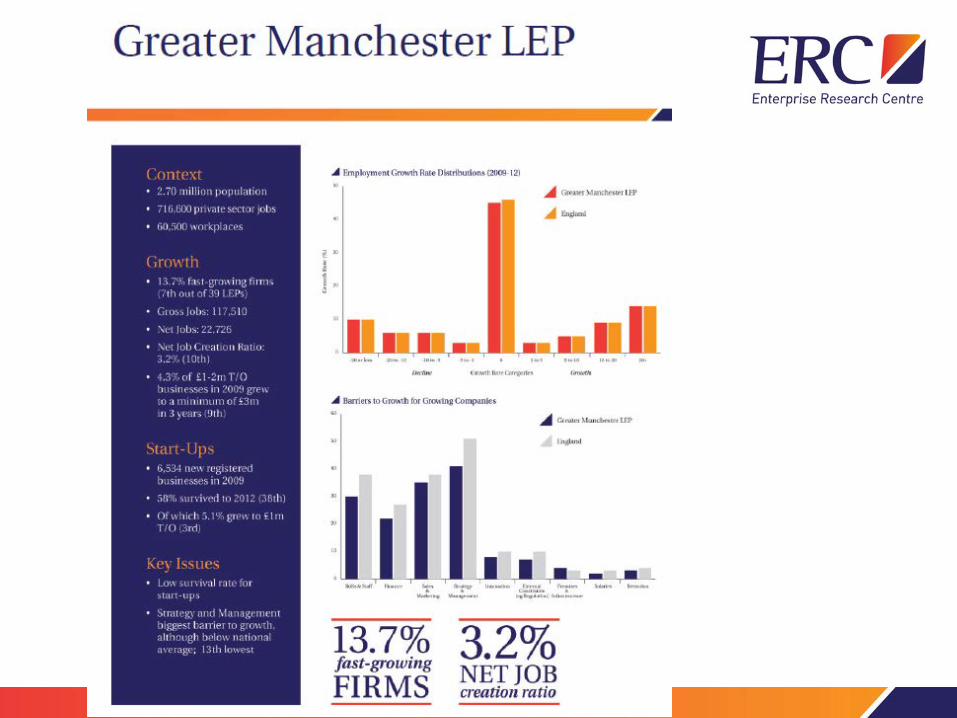
• Its purpose is to provide each LEP with a set of simple metrics on the growth of existing firms and start-ups in the LEP area.
• Set alongside the key barriers to growth flagged by businesses
who are seeking to grow and have become a participant in the GrowthAccelerator programme.
• The Dashboard, based primarily on ONS data, can be used as
a source of evidence to inform discussions on priorities in business support and includes easily understood metrics which can be readily updated on an annual basis.

Metrics
• Proportion of fast-growing firms (jobs) in the business population (2009-12)
• Net job creation ratios for 2011-12 • 3-year survival rates of start-ups (2009-12) • Proportion of surviving start-ups that reach £1m T/O
(2009-12_ • Proportion of existing £1-2m T/O businesses which
grow to £3m T/O (2009-12)


The Entrepreneurial Process and GEM Operational Definitions

Female/Male Ratio - TEA


Summary
• Clusters: connecting cluster analysis to policy – the art of the possible? - there is no simple 'read-through' from a ‘cluster’ identified by high LQs to a strategy.
• LEP Dashboard: a complex LEP geography which provides a challenge to some of the preconceptions held about the ‘hotspots’ of growth across England while confirming others.

Discussion
• Building a robust evidence base for effective policy design – how can ERC assist
• Connecting metrics to LEP strategy and policy
initiatives? • What other metrics would be useful?

Contact us:
If you would like any more information about the ERC and any of its activities please contact the Theme Lead, Mark Hart at [email protected]
More details about the activities of the ERC and our latest events can be
found at: www.enterpriseresearch.ac.uk