era-edta registryera-edta-reg.org/files/annualreports/pdf/annrep2011.pdfiii acknowledgements the...
TRANSCRIPT

ERA-EDTA RegistryAcademic Medical CenterDepartment of Medical InformaticsPO Box 227001100 DE AmsterdamThe Netherlands
ISBN 978-90-817480-3-2
June 2013
Annual Report 2011
ERA-ED
TA Registry
AnnualReport
2011
ERA-EDTA Registry
www.era-edta-reg.org

ISBN 978-90-817480-3-2
Suggested Citation ERA-EDTA Registry: ERA-EDTA Registry Annual Report 2011. Academic Medical Center, Department of Medical Informatics, Amsterdam, The Netherlands, 2013

ERA-EDTA RegistryAnnual Report 2011

ERA-EDTA Registry
Academic Medical Center
Department of Medical Informatics
PO Box 22700
1100 DE Amsterdam
The Netherlands
Telephone +31 20 566 7637
Fax +31 20 691 9840
E-mail [email protected]
Website www.era-edta-reg.org
ERA-EDTA Registry Committee
R Vanholder, Belgium (ERA-EDTA President)
C Wanner, Germany (Chairman)
FJ Caskey, United Kingdom
F Collart, Belgium
C Couchoud, France
D Fouque, France
JW Groothoff, The Netherlands
JG Heaf, Denmark
P Ravani, Italy
I Rychlik, Czech Republic
F Schaefer, Germany
S Schön, Sweden
Registry Office Staff
KJ Jager, senior epidemiologist (Managing Director)
R Cornet, senior medical informatician
FW Dekker, senior epidemiologist
A Kramer, medical informatician
MWM van de Luijtgaarden, epidemiologist
M Noordzij, epidemiologist
M Pippias, medical doctor
VS Stel, epidemiologist
KJ van Stralen, epidemiologist
AJ Weerstra, data manager

III
Acknowledgements
The ERA-EDTA Registry would like to thank the patients and staff of all the dialysis and transplant units who have contributed data via their national and regional renal registries. In addition, we would like to thank the following persons and organizations for their contribution to the work of the ERA-EDTA Registry.
For contribution to Section ARegistry Contributors
For contribution to Section BRegistry Contributors
The ERA-EDTA Registry is funded by the European Renal Association - European Dialysis and Trans-plant Association (ERA-EDTA).
Austria R Kramar
Belgium, Dutch-speaking H Augustijn, B De Moor, and J De Meester
Belgium, French-speaking JM des Grottes and F Collart
Bosnia and Herzegovina H Resić and B Prnjavorac
Denmark JG Heaf
Finland P Finne and C Grönhagen-Riska
France (23 of 26 regions) M Lassalle and C Couchoud
Greece GA Ioannidis
Iceland R Palsson
Norway T Leivestad
Romania G Mircescu, L Garneata, and E Podgoreanu
Serbia Working group of Serbian RRT Registry and all of the Serbian renal units
Spain, Andalusia P Castro de la Nuez
Spain, Aragon JI Sanchez Miret and JM Abad Diez
Spain, Asturias R Alonso de la Torre, JR Quirós, and E Sanchez
Spain, Basque country Á Magaz, J Aranzabal, M Rodrigo, and I Moina
Spain, Cantabria M Arias Rodríguez and O García Ruiz
Spain, Castile and León R González and C García-Renedo
Spain, Castile-La Mancha G Gutiérrez Ávila and I Moreno Alía
Spain, Catalonia E Arcos, J Comas, and PA Montserrat
Spain, Extremadura JM Ramos Aceitero and MA García Bazaga
Spain, Galicia E Bouzas-Caamaño and J Sánchez-Ibáñez
Spain, Valencian region O Zurriaga Llorens and M Ferrer Alamar
Sweden KG Prütz, L Bäckman, M Evans, S Schön, M Stendahl, and B Rippe
The Netherlands A Hoitsma and A Hemke
United Kingdom, England/Northern Ireland/Wales All the staff of the UK Renal Registry and of the renal units submitting data
United Kingdom, Scotland All of the Scottish renal units
Albania N Thereska, A Strakosha, and N Pasko
Croatia Croatian Registry for RRT, Croatian Regional Registries for RRT, and Croatian Society for Nephrology, Dialysis and Transplantation
Czech Republic I Rychlík, J Potucek, and F Lopot
Estonia Ü Pechter, M Rosenberg, and M Luman
France M Lassalle and C Couchoud
FYR of Macedonia O Stojceva-Taneva
Israel R Dichtiar, T Shohat, and E Golan
Latvia H Cernevskis and V Kuzema
Montenegro M Ratkovic, D Radunovic, and S Ivanovic
Poland B Rutkowski, G Korejwo, and P Jagodziński
Portugal F Macário, F Nolasco, and R Filipe
Russia NA Tomilina and BT Bikbov
Slovakia V Spustová, I Lajdova, and M Karolyova
Slovenia J Buturovic-Ponikvar, J Gubenšek, and M Arnol
Spain Spanish RRT National Registry at ONT, Spanish Regional Registries, and Spanish Society of Nephrology (SEN)
Turkey G Süleymanlar
Ukraine M Kolesnyk, G Vladzievska, and M Kulyzkyi

IV
List of abbreviations
Abbreviation Term
APD Automated peritoneal dialysis
CAKUT Congenital anomalies of the kidney and urinary tract
CAPD Continuous ambulatory peritoneal dialysis
CI Confidence interval
COD Cause of death
DM Diabetes mellitus
ERA-EDTA European Renal Association - European Dialysis and Transplant Association
ESPN European Society for Paediatric Nephrology
ESRD End-stage renal disease
EU27 The 27 Member States of the European Union as of 2007 (Austria, Belgium,
Bulgaria, Cyprus, Czech Republic, Denmark, Estonia, Finland, France, Germany,
Greece, Hungary, Ireland, Italy, Latvia, Lithuania, Luxembourg, Malta, Poland,
Portugal, Romania, Slovakia, Slovenia, Spain, Sweden, The Netherlands,
United Kingdom)
GN Glomerulonephritis / sclerosis
HD Haemodialysis
HDF Haemodiafiltration
HF Haemofiltration
HT Hypertension
HUS Haemolytic uraemic syndrome
ISO International Standards Organization
Misc Miscellaneous
N Count
ODBC Open database connectivity
Oth Other
PD Peritoneal dialysis
PGP Pretty good privacy
PKD Polycystic kidneys, adult type
Pmarp Per million age-related population
Pmp Per million population
PN Pyelonephritis
PRD Primary renal disease
RRT Renal replacement therapy
RVD Renal vascular disease
SD Standard deviation
SOPs Standard Operating Procedures
Tx Transplant
Unkn Unknown
USRDS United States Renal Data System

V
Table of Contents
I Introduction 11Chapter overview ................................................................................................................................................ 13
New to this edition .............................................................................................................................................. 13
ERA-EDTA Registry website ................................................................................................................................ 13
ESPN/ERA-EDTA Registry website ...................................................................................................................... 13
II Reference Tables - Section A 15
A1 AFFILIATED REGISTRY INFORMATION FOR 2011
Table A.1.1 .......................................................................................................................................................... 16General population of the country/region and percent coverage of general population
Table A.1.2 .......................................................................................................................................................... 17Renal centres: total number of centres and number of collaborating centres
A2 INCIDENT PATIENTS ACCEPTED FOR RRT IN 2011, AT DAY 1
Table A.2.1 .......................................................................................................................................................... 18Incident counts and percentagesat day 1, by age and gender
Table A.2.2 .......................................................................................................................................................... 19Gender, mean age, and median age of incident patientsat day 1
Table A.2.3 .......................................................................................................................................................... 20Incident rates per million (age-related) population, unadjustedat day 1, by age and gender
Table A.2.4 .......................................................................................................................................................... 21Incident rates per million population, unadjustedat day 1, by cause of renal failure
Table A.2.5 .......................................................................................................................................................... 22Incident rates per million population, adjustedat day 1, by cause of renal failure, adjusted for age and gender
A3 INCIDENT PATIENTS ACCEPTED FOR RRT IN 2011, AT DAY 91
Table A.3.1 .......................................................................................................................................................... 23Incident counts and percentagesat day 91, by age and gender
Table A.3.2 .......................................................................................................................................................... 24Gender, mean age, and median age of incident patientsat day 91
Table A.3.3 .......................................................................................................................................................... 25Incident rates per million (age-related) population, unadjustedat day 91, by age and gender
Table A.3.4 .......................................................................................................................................................... 26Incident rates per million population, unadjustedat day 91, by cause of renal failure
Table A.3.5 .......................................................................................................................................................... 27Incident rates per million population, adjustedat day 91, by cause of renal failure, adjusted for age and gender
Table A.3.6 .......................................................................................................................................................... 28Incident countsat day 91, by established therapy
Table A.3.7 .......................................................................................................................................................... 29Incident rates per million population, unadjustedat day 91, by established therapy
Table A.3.8 .......................................................................................................................................................... 30Incident rates per million population, adjustedat day 91, by established therapy, adjusted for age and gender

VI
Table A.3.9 .......................................................................................................................................................... 31Percentages of established therapy, unadjustedat day 91
Table A.3.10 ........................................................................................................................................................ 32Percentages of established therapy, unadjustedat day 91, by age, gender, and primary diagnosis
A4 PREVALENT PATIENTS ON RRT IN 2011
Table A.4.1 .......................................................................................................................................................... 33Prevalent counts and percentagesprevalent patients on December 31, by age and gender
Table A.4.2 .......................................................................................................................................................... 34Gender, mean age, and median ageprevalent patients on December 31
Table A.4.3 .......................................................................................................................................................... 35Prevalence per million (age-related) population, unadjustedprevalent patients on December 31, by age and gender
Table A.4.4 .......................................................................................................................................................... 36Prevalence per million population and percentages, unadjustedprevalent patients on December 31, by cause of renal failure
Table A.4.5 .......................................................................................................................................................... 37Prevalence per million population, adjustedprevalent patients on December 31, by cause of renal failure, adjusted for age and gender
Table A.4.6 .......................................................................................................................................................... 38Prevalent countsprevalent patients on December 31, by established therapy
Table A.4.7 .......................................................................................................................................................... 39Prevalence per million population, unadjustedprevalent patients on December 31, by established therapy
Table A.4.8 .......................................................................................................................................................... 40Prevalence per million population, adjustedprevalent patients on December 31, by established therapy, adjusted for age and gender
Table A.4.9 .......................................................................................................................................................... 41Percentages of established therapy, unadjustedprevalent patients on December 31
Table A.4.10 ........................................................................................................................................................ 42Percentages of established therapy, unadjustedprevalent patients on December 31, by age, gender, and primary diagnosis
A5 RENAL TRANSPLANTS IN 2011
Table A.5.1 .......................................................................................................................................................... 43Renal transplants performed in 2011, numbers and percentagesby donor type
Table A.5.2 .......................................................................................................................................................... 44Renal transplants performed in 2011, per million populationby donor type
A6 SURVIVAL PROBABILITY
Patient Survival on RRT
Table A.6.1 .......................................................................................................................................................... 4690-day, one-, two- and five-year survival probabilities (cohort 2002-2006): Incident RRT patients, unadjustedfrom day 1 to 90 days, one, two, and five years, by age, gender, and primary diagnosis
Table A.6.2 .......................................................................................................................................................... 4790-day, one-, two- and five-year survival probabilities (cohort 2002-2006): Incident RRT patients, adjustedfrom day 1 to 90 days, one, two, and five years, adjusted for age, gender, and primary diagnosis
Table A.6.3 .......................................................................................................................................................... 48One-, two- and five-year survival probabilities (cohort 2002-2006): Incident RRT patients, unadjustedfrom day 91 to one, two, and five years + 90 days, by age, gender, and primary diagnosis
Table A.6.4 .......................................................................................................................................................... 49One-, two- and five-year survival probabilities (cohort 2002-2006): Incident RRT patients, adjustedfrom day 91 to one, two, and five years + 90 days, adjusted for age, gender, and primary diagnosis
Table A.6.5 .......................................................................................................................................................... 5090-day, one- and two-year survival probabilities (cohort 2005-2009): Incident RRT patients, unadjustedfrom day 1 to 90 days, one, and two years, by age, gender, and primary diagnosis
Table A.6.6 .......................................................................................................................................................... 5190-day, one- and two-year survival probabilities (cohort 2005-2009): Incident RRT patients, adjustedfrom day 1 to 90 days, one, and two years, adjusted for age, gender, and primary diagnosis

VII
Table A.6.7 .......................................................................................................................................................... 52One- and two-year survival probabilities (cohort 2005-2009): Incident RRT patients, unadjustedfrom day 91 to one and two years + 90 days, by age, gender, and primary diagnosis
Table A.6.8 .......................................................................................................................................................... 53One- and two-year survival probabilities (cohort 2005-2009): Incident RRT patients, adjustedfrom day 91 to one and two years + 90 days, adjusted for age, gender, and primary diagnosis
Patient Survival on Dialysis
Table A.6.9 .......................................................................................................................................................... 5490-day, one-, two- and five-year survival probabilities (cohort 2002-2006): Incident dialysis patients, unadjustedfrom day 1 to 90 days, one, two, and five years, by age, gender, and primary diagnosis
Table A.6.10 ........................................................................................................................................................ 5590-day, one-, two- and five-year survival probabilities (cohort 2002-2006): Incident dialysis patients, adjustedfrom day 1 to 90 days, one, two, and five years, adjusted for age, gender, and primary diagnosis
Table A.6.11 ........................................................................................................................................................ 56One-, two- and five-year survival probabilities (cohort 2002-2006): Incident dialysis patients, unadjustedfrom day 91 to one, two, and five years + 90 days, by age, gender, and primary diagnosis
Table A.6.12 ........................................................................................................................................................ 57One-, two- and five-year survival probabilities (cohort 2002-2006): Incident dialysis patients, adjustedfrom day 91 to one, two, and five years + 90 days, adjusted for age, gender, and primary diagnosis
Table A.6.13 ........................................................................................................................................................ 5890-day, one- and two-year survival probabilities (cohort 2005-2009): Incident dialysis patients, unadjustedfrom day 1 to 90 days, one, and two years, by age, gender, and primary diagnosis
Table A.6.14 ........................................................................................................................................................ 5990-day, one- and two-year survival probabilities (cohort 2005-2009): Incident dialysis patients, adjustedfrom day 1 to 90 days, one, and two years, adjusted for age, gender, and primary diagnosis
Table A.6.15 ........................................................................................................................................................ 60One- and two-year survival probabilities (cohort 2005-2009): Incident dialysis patients, unadjustedfrom day 91 to one and two years + 90 days, by age, gender, and primary diagnosis
Table A.6.16 ........................................................................................................................................................ 61One- and two-year survival probabilities (cohort 2005-2009): Incident dialysis patients, adjustedfrom day 91 to one and two years + 90 days, adjusted for age, gender, and primary diagnosis
Patient Survival after First Transplant (deceased donor)
Table A.6.17 ........................................................................................................................................................ 62One-, two- and five-year survival probabilities (cohort 2002-2006): First transplant patients (deceased donor), unadjustedfrom day of transplant to one, two, and five years, by age, gender, and primary diagnosis
Table A.6.18 ........................................................................................................................................................ 63One-, two- and five-year survival probabilities (cohort 2002-2006): First transplant patients (deceased donor), adjustedfrom day of transplant to one, two, and five years, adjusted for age, gender, and primary diagnosis
Table A.6.19 ........................................................................................................................................................ 64One- and two-year survival probabilities (cohort 2005-2009): First transplant patients (deceased donor), unadjustedfrom day of transplant to one and two years, by age, gender, and primary diagnosis
Table A.6.20 ........................................................................................................................................................ 65One- and two-year survival probabilities (cohort 2005-2009): First transplant patients (deceased donor), adjustedfrom day of transplant to one and two years, adjusted for age, gender, and primary diagnosis
Patient Survival after First Transplant (living donor)
Table A.6.21 ........................................................................................................................................................ 66One-, two- and five-year survival probabilities (cohort 2002-2006): First transplant patients (living donor), unadjustedfrom day of transplant to one, two, and five years, by age, gender, and primary diagnosis
Table A.6.22 ........................................................................................................................................................ 67One-, two- and five-year survival probabilities (cohort 2002-2006): First transplant patients (living donor), adjustedfrom day of transplant to one, two, and five years, adjusted for age, gender, and primary diagnosis
Table A.6.23 ........................................................................................................................................................ 68One- and two-year survival probabilities (cohort 2005-2009): First transplant patients (living donor), unadjustedfrom day of transplant to one and two years, by age, gender, and primary diagnosis
Table A.6.24 ........................................................................................................................................................ 69One- and two-year survival probabilities (cohort 2005-2009): First transplant patients (living donor), adjustedfrom day of transplant to one and two years, adjusted for age, gender, and primary diagnosis
VIII
Graft Survival after First Transplant (deceased donor)
Table A.6.25 ........................................................................................................................................................ 70One-, two- and five-year survival probabilities (cohort 2002-2006): First graft (deceased donor), unadjustedfrom day of transplant to one, two, and five years, by age, gender, and primary diagnosis
Table A.6.26 ........................................................................................................................................................ 71One-, two- and five-year survival probabilities (cohort 2002-2006): First graft (deceased donor), adjustedfrom day of transplant to one, two, and five years, adjusted for age, gender, and primary diagnosis
Table A.6.27 ........................................................................................................................................................ 72One- and two-year survival probabilities (cohort 2005-2009): First graft (deceased donor), unadjustedfrom day of transplant to one and two years, by age, gender, and primary diagnosis
Table A.6.28 ........................................................................................................................................................ 73One- and two-year survival probabilities (cohort 2005-2009): First graft (deceased donor), adjustedfrom day of transplant to one and two years, adjusted for age, gender, and primary diagnosis
Graft Survival after First Transplant (living donor)
Table A.6.29 ........................................................................................................................................................ 74One-, two- and five-year survival probabilities (cohort 2002-2006): First graft (living donor), unadjustedfrom day of transplant to one, two, and five years, by age, gender, and primary diagnosis
Table A.6.30 ........................................................................................................................................................ 75One-, two- and five-year survival probabilities (cohort 2002-2006): First graft (living donor), adjustedfrom day of transplant to one, two, and five years, adjusted for age, gender, and primary diagnosis
Table A.6.31 ........................................................................................................................................................ 76One- and two-year survival probabilities (cohort 2005-2009): First graft (living donor), unadjustedfrom day of transplant to one and two years, by age, gender, and primary diagnosis
Table A.6.32 ........................................................................................................................................................ 77One- and two-year survival probabilities (cohort 2005-2009): First graft (living donor), adjustedfrom day of transplant to one and two years, adjusted for age, gender, and primary diagnosis
Patient Survival by Modality and Primary Diagnosis
Figure A.6.1 ........................................................................................................................................................ 78Adjusted survival (cohort 2002-2006): Incident dialysis patients and patients receiving a first transplant (between 2002 and 2006)from day 91, by modality, adjusted for age, gender, and primary diagnosis
Figure A.6.2 ........................................................................................................................................................ 78Adjusted survival (cohort 2002-2006): Incident haemodialysis patientsfrom day 91, by primary diagnosis, adjusted for age and gender
Figure A.6.3 ........................................................................................................................................................ 78Adjusted survival (cohort 2002-2006): Incident peritoneal dialysis patientsfrom day 91, by primary diagnosis, adjusted for age and gender
A7 EXPECTED REMAINING LIFETIMES
Table A.7.1 .......................................................................................................................................................... 79Expected remaining lifetimes (years) of the general population in 2005, and of prevalent dialysis and transplant patients in 2010 and 2011 (includes mortality in the first 90 days)by age and gender
III Reference Tables - Section B 81
B1 AFFILIATED REGISTRY INFORMATION FOR 2011
Table B.1.1 .......................................................................................................................................................... 82General population of the country/region and percent coverage of general population
Table B.1.2 .......................................................................................................................................................... 83Renal centres: total number of centres and number of collaborating centres
B2 INCIDENT PATIENTS ACCEPTED FOR RRT IN 2011, AT DAY 1
Table B.2.1 .......................................................................................................................................................... 84Incident counts and incident rates per million population, unadjustedat day 1
Table B.2.2 .......................................................................................................................................................... 85Gender, mean age, and median age of incident patientsat day 1
Table B.2.3 .......................................................................................................................................................... 86Incident rates per million population, adjustedat day 1, adjusted for age and gender
Table B.2.4 .......................................................................................................................................................... 87Incident rates per million population and percentages, unadjustedat day 1, by cause of renal failure

IX
B3 INCIDENT PATIENTS ACCEPTED FOR RRT IN 2011, AT DAY 91
Table B.3.1 .......................................................................................................................................................... 88Incident counts and incident rates per million population, unadjustedat day 91
Table B.3.2 .......................................................................................................................................................... 89Gender, mean age, and median age of incident patientsat day 91
Table B.3.3 .......................................................................................................................................................... 90Incident rates per million population, adjustedat day 91, adjusted for age and gender
Table B.3.4 .......................................................................................................................................................... 91Incident rates per million population and percentages, unadjustedat day 91, by cause of renal failure
Table B.3.5 .......................................................................................................................................................... 92Incident countsat day 91, by established therapy
Table B.3.6 .......................................................................................................................................................... 93Incident rates per million population, unadjustedat day 91, by established therapy
Table B.3.7 .......................................................................................................................................................... 94Percentages of established therapy, unadjustedat day 91
B4 PREVALENT PATIENTS ON RRT IN 2011
Table B.4.1 .......................................................................................................................................................... 95Prevalent counts and prevalence per million population, unadjustedprevalent patients on December 31
Table B.4.2 .......................................................................................................................................................... 96Gender, mean age, and median ageprevalent patients on December 31
Table B.4.3 .......................................................................................................................................................... 97Prevalence per million population, adjustedprevalent patients on December 31, adjusted for age and gender
Table B.4.4 .......................................................................................................................................................... 98Prevalence per million population and percentages, unadjustedprevalent patients on December 31, by cause of renal failure
Table B.4.5 .......................................................................................................................................................... 99Prevalent countsprevalent patients on December 31, by established therapy
Table B.4.6 ........................................................................................................................................................ 100Prevalence per million population, unadjustedprevalent patients on December 31, by established therapy
Table B.4.7 ........................................................................................................................................................ 101Percentages of established therapy, unadjustedprevalent patients on December 31
B5 RENAL TRANSPLANTS IN 2011
Table B.5.1 ........................................................................................................................................................ 102Renal transplants performed in 2011, numbers and percentagesby donor type
Table B.5.2 ........................................................................................................................................................ 103Renal transplants performed in 2011, per million populationby donor type
IV Summary Data 105Table S.1.1 ........................................................................................................................................................ 107
Section A - Summary data from registries providing individual patient data
Table S.1.2 ........................................................................................................................................................ 108Section B - Summary data from registries providing aggregated data
X
V Reference Tables - Section Paediatric RRT 109
P1 GENERAL CHARACTERISTICS
Table P.1.1 ........................................................................................................................................................ 111Population covered (in thousands)by age and year
Table P.1.2 ........................................................................................................................................................ 111Grouping of primary renal diseases for paediatric patientsgroups and codes included
P2 INCIDENT PATIENTS ACCEPTED FOR RRT, AT DAY 1
Table P.2.1 ........................................................................................................................................................ 112Incident countsat day 1, by age and cohort
Table P.2.2 ........................................................................................................................................................ 112Incident countsat day 1, by age, treatment modality, and cohort
Table P.2.3 ........................................................................................................................................................ 112Incident countsbetween 2002 and 2011, at day 1, by age and cause of renal failure
Table P.2.4 ........................................................................................................................................................ 113Incident rates per million age-related population (per year)at day 1, by age and cohort
Table P.2.5 ........................................................................................................................................................ 113Incident rates per million age-related population (per year)at day 1, by age, treatment modality, and cohort
Table P.2.6 ........................................................................................................................................................ 113Incident rates per million age-related populationbetween 2002 and 2011, at day 1, by age and cause of renal failure
P3 PREVALENT PATIENTS ON RRT
Table P.3.1 ........................................................................................................................................................ 114Prevalent countsprevalent patients on December 31, by age and year
Table P.3.2 ........................................................................................................................................................ 114Prevalent countsprevalent patients on December 31, by age and year
Table P.3.3 ........................................................................................................................................................ 114Prevalent countsprevalent patients on December 31, 2011, by age and cause of renal failure
Table P.3.4 ........................................................................................................................................................ 115Prevalence per million age-related population (per year)prevalent patients on December 31, by age and year
Table P.3.5 ........................................................................................................................................................ 115Prevalence per million age-related population (per year)prevalent patients on December 31, by age and year
Table P.3.6 ........................................................................................................................................................ 115Prevalence per million age-related populationprevalent patients on December 31, 2011, by age and cause of renal failure
VI Methods 117Data collection and preparation ........................................................................................................................ 119
Definitions and coding systems ......................................................................................................................... 122
Statistical analyses ........................................................................................................................................... 123
Bibliography...................................................................................................................................................... 126
VII Appendices 127Appendix 1 - Grouping of primary renal diseases ............................................................................................ 128
Appendix 2 - Grouping of causes of death ....................................................................................................... 129
Appendix 3 - Treatment modalities ................................................................................................................. 130
Appendix 4 - Renal registries contributing data for the different types of analyses ........................................131

I Introduction
12
AL Albania ME Montenegro
AT Austria MK FYR of Macedonia
BA Bosnia and Herzegovina NL The Netherlands
BE Belgium NO Norway
CZ Czech Republic PL Poland
DK Denmark PT Portugal
EE Estonia RO Romania
ES Spain RS Serbia
FI Finland RU Russia
FR France SE Sweden
GR Greece SI Slovenia
HR Croatia SK Slovakia
IL Israel TR Turkey
IS Iceland UA Ukraine
IT Italy UK United Kingdom
LV Latvia
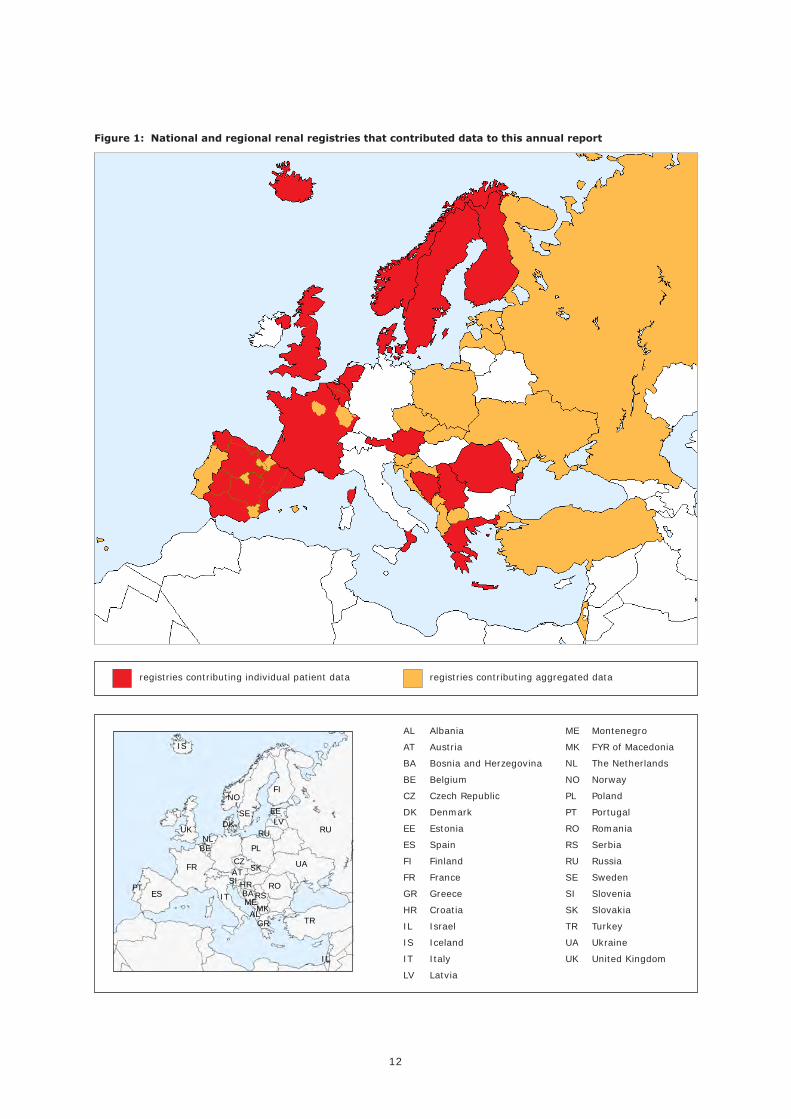
Figure 1: National and regional renal registries that contributed data to this annual report
registries contributing individual patient data registries contributing aggregated data
ES
AT
BA
BE
CZ
DK
EE
FI
FR
GR
UA
IL
IS
IT
LV
MK
NL
NO
PL
RO
RURU
SE
SK
TR
UK
MERS
PT HRSI
AL

13
I Introduction
The ERA-EDTA Registry collects data on renal replacement therapy (RRT) via the national and regional renal registries in Europe. For this Annual Report 2011 it used 44 data sets from national or regional renal registries in 30 countries. The reference tables are presented in two parts: Section A (chapter II) and Section B (chapter III). Section A relates to individual patient data from 27 national and regional registries from 15 countries (shown in red in Figure 1), whereas section B relates to 17 national registries from 17 countries providing aggregated data based on individual patient data, centre questionnaire data or information from health authorities (shown in orange in Figure 1).
Chapter overview
Chapter II (Section A) contains data on the incidence and prevalence of RRT and data on survival and expected remaining lifetimes from those registries providing individual patient data. Chapter III (Section B) contains data on the incidence and prevalence from the countries providing aggregated data. Chapter IV describes summary data from all participating registries. The incidence and prevalence of RRT in paediatric patients are described in chapter V, based on data from registries providing individual paediatric data. Chapter VI describes the methods used, including data collection and preparation, definitions, and coding systems. In addition, it describes the statistical methods to calculate incidence and prevalence, patient and graft survival, and expected remaining lifetimes.
New to this edition
This year, Albania provided data for the B-section of this annual report for the first time. In addition, Bosnia and Herzegovina and Serbia provided individual patient data for the A-section of the report for the first time.
ERA-EDTA Registry website
PDF files of the ERA-EDTA annual reports and other information on the Registry can be downloaded from the website of the ERA-EDTA Registry: www.era-edta-reg.org. This website also includes a repository of educational publications and the new 2012 version of the ERA-EDTA Coding System for PRD. To facilitate the search for one of the 273 new codes the website also comprises a PRD search tool.
ESPN/ERA-EDTA Registry website
Information on the activities of the European Society for Paediatric Nephrology (ESPN)/ERA-EDTA Registry and on paediatric registries in general is provided at the ESPN/ERA-EDTA Registry website: www.espn-reg.org. In addition, PDF files of the ESPN/ERA-EDTA Registry annual reports can be downloaded from this website.


II Reference Tables - Section A

General population % Coverage of general of whole country/region population by the registry in thousands for individual patient data
16
A1 AFFILIATED REGISTRY INFORMATION FOR 2011
Table A.1.1General population of the country/region and percent coverage of general population
Austria 8424 100
Belgium, Dutch-speaking 6329 100
Belgium, French-speaking 4665 100
Bosnia and Herzegovina 3508 100
Denmark 5627 100
Finland 5388 100
France (23 of 26 regions) 64724 77.7
Greece 11300 100
Iceland 319 100
Norway 4953 100
Romania 21385 100
Serbia 7259 100
Spain, Andalusia 8437 100
Spain, Aragon 1348 100
Spain, Asturias 1081 100
Spain, Basque country 2189 100
Spain, Cantabria 594 100
Spain, Castile and León 2552 100
Spain, Castile-La Mancha 2119 100
Spain, Catalonia 7540 100
Spain, Extremadura 1109 100
Spain, Galicia 2788 100
Spain, Valencian region 5117 100
Sweden 9449 100
The Netherlands 16693 100
United Kingdom, All countries 62752 100
United Kingdom, England 52667 100
United Kingdom, Northern Ireland 1809 100
United Kingdom, Scotland 5253 100
United Kingdom, Wales 3023 100

Total number of Number of renal centres renal centres collaborating with the registry of whole country/region for individual patient data
17
A1 AFFILIATED REGISTRY INFORMATION FOR 2011
Table A.1.2Renal centres: total number of centres and number of collaborating centres
Austria 79 79
Belgium, Dutch-speaking 27 27
Belgium, French-speaking 34 34
Bosnia and Herzegovina 27 27
Denmark 16 16
Finland 31 31
France (23 of 26 regions) 1120 942
Greece 169 169
Iceland 1 1
Norway 24 24
Romania 143 143
Serbia 57 57
Spain, Andalusia 59 59
Spain, Aragon 10 10
Spain, Asturias 10 10
Spain, Basque country 11 11
Spain, Cantabria 2 2
Spain, Castile and León 24 24
Spain, Castile-La Mancha 12 12
Spain, Catalonia 46 46
Spain, Extremadura 12 12
Spain, Galicia 24 24
Spain, Valencian region 48 48
Sweden 65 65
The Netherlands 75 75
United Kingdom, All countries 72 72
United Kingdom, England 52 52
United Kingdom, Northern Ireland 5 5
United Kingdom, Scotland 10 10
United Kingdom, Wales 5 5

All 0-19 20-44 45-64 65-74 75+
All Men Women All Men Women All Men Women All Men Women All Men Women All Men Women
N (100%) N (100%) N (100%) N % N % N % N % N % N % N % N % N % N % N % N % N % N % N %
18
A2 INCIDENT PATIENTS ACCEPTED FOR RRT IN 2011, AT DAY 1
Table A.2.1Incident counts and percentagesat day 1, by age and gender
Austria 1157 744 413 16 1 9 1 7 2 112 10 65 9 47 11 354 31 252 34 102 25 318 27 205 28 113 27 357 31 213 29 144 35
Belgium, Dutch-speaking * 1150 697 453 92 8 48 7 44 10 259 23 163 23 96 21 272 24 176 25 96 21 527 46 310 44 217 48
Belgium, French-speaking * 876 564 312 85 10 53 9 32 10 275 31 169 30 106 34 206 24 139 25 67 21 310 35 203 36 107 34
Bosnia and Herzegovina 423 245 178 7 2 5 2 2 1 52 12 39 16 13 7 171 40 109 44 62 35 126 30 60 24 66 37 67 16 32 13 35 20
Denmark 625 400 225 7 1 4 1 3 1 84 13 47 12 37 16 205 33 131 33 74 33 176 28 116 29 60 27 153 24 102 26 51 23
Finland 456 297 159 11 2 3 1 8 5 57 13 37 12 20 13 176 39 115 39 61 38 128 28 86 29 42 26 84 18 56 19 28 18
France (23 of 26 regions) 7518 4685 2833 90 1 53 1 37 1 656 9 408 9 248 9 2067 27 1302 28 765 27 1691 22 1088 23 603 21 3014 40 1834 39 1180 42
Greece 2294 1442 852 14 1 5 0 9 1 160 7 107 7 53 6 541 24 379 26 162 19 627 27 396 27 231 27 952 41 555 38 397 47
Iceland 33 22 11 2 6 2 9 0 0 7 21 3 14 4 36 8 24 6 27 2 18 8 24 6 27 2 18 8 24 5 23 3 27
Norway 503 354 149 12 2 7 2 5 3 77 15 54 15 23 15 164 33 116 33 48 32 115 23 82 23 33 22 135 27 95 27 40 27
Romania 2710 1569 1141 36 1 17 1 19 2 444 16 284 18 160 14 1134 42 691 44 443 39 703 26 377 24 326 29 393 15 200 13 193 17
Serbia 1043 637 406 9 1 4 1 5 1 139 13 81 13 58 14 461 44 303 48 158 39 270 26 143 22 127 31 164 16 106 17 58 14
Spain, Andalusia 947 595 352 10 1 5 1 5 1 121 13 73 12 48 14 297 31 202 34 95 27 275 29 176 30 99 28 244 26 139 23 105 30
Spain, Aragon 163 112 51 1 1 1 1 0 0 20 12 11 10 9 18 47 29 34 30 13 25 48 29 35 31 13 25 47 29 31 28 16 31
Spain, Asturias 155 94 61 2 1 1 1 1 2 13 8 6 6 7 11 46 30 32 34 14 23 43 28 28 30 15 25 51 33 27 29 24 39
Spain, Basque country 242 165 77 4 2 2 1 2 3 32 13 20 12 12 16 66 27 41 25 25 32 73 30 48 29 25 32 67 28 54 33 13 17
Spain, Cantabria * 65 39 26 16 25 9 23 7 27 27 42 16 41 11 42 11 17 7 18 4 15 11 17 7 18 4 15
Spain, Castile and León * 305 204 101 32 10 22 11 10 10 78 26 58 28 20 20 76 25 53 26 23 23 119 39 71 35 48 48
Spain, Castile-La Mancha * 201 127 74 27 13 16 13 11 15 61 30 43 34 18 24 64 32 43 34 21 28 49 24 25 20 24 32
Spain, Catalonia 955 603 352 11 1 3 0 8 2 122 13 68 11 54 15 290 30 189 31 101 29 241 25 165 27 76 22 291 30 178 30 113 32
Spain, Extremadura 118 76 42 2 2 1 1 1 2 15 13 12 16 3 7 37 31 27 36 10 24 26 22 15 20 11 26 38 32 21 28 17 40
Spain, Galicia 400 260 140 7 2 2 1 5 4 52 13 37 14 15 11 127 32 76 29 51 36 95 24 68 26 27 19 119 30 77 30 42 30
Spain, Valencian region 677 451 226 15 2 14 3 1 0 78 12 47 10 31 14 217 32 142 31 75 33 172 25 128 28 44 19 195 29 120 27 75 33
Sweden 1157 758 399 17 1 8 1 9 2 149 13 90 12 59 15 361 31 239 32 122 31 304 26 211 28 93 23 326 28 210 28 116 29
The Netherlands 1952 1220 732 28 1 14 1 14 2 218 11 134 11 84 11 631 32 400 33 231 32 519 27 307 25 212 29 556 28 365 30 191 26
United Kingdom, All countries * 6736 4242 2494 1124 17 681 16 443 18 2235 33 1377 32 858 34 1666 25 1056 25 610 24 1711 25 1128 27 583 23
United Kingdom, England * 5696 3625 2071 969 17 593 16 376 18 1877 33 1169 32 708 34 1404 25 895 25 509 25 1446 25 968 27 478 23
United Kingdom, Northern Ireland * 201 121 80 29 14 19 16 10 13 71 35 45 37 26 33 52 26 30 25 22 28 49 24 27 22 22 28
United Kingdom, Scotland 507 289 218 12 2 7 2 5 2 74 15 40 14 34 16 180 36 103 36 77 35 127 25 75 26 52 24 114 22 64 22 50 23
United Kingdom, Wales * ‡ 344 214 130 52 15 29 14 23 18 107 31 60 28 47 36 83 24 56 26 27 21 102 30 69 32 33 25
Categories may not add up because of missing values or rounding offPercentages are row percentages* Patients younger than 20 years of age are not reported‡ The incidence of RRT is slightly underestimated, for details see the UK Renal Registry Report 2012

All Men Women
% Mean SD Median % Mean SD Median % Mean SD Median (years) (years) (years) (years) (years) (years)
19
A2 INCIDENT PATIENTS ACCEPTED FOR RRT IN 2011, AT DAY 1
Table A.2.2Gender, mean age, and median age of incident patientsat day 1
Austria 100 65.2 15.9 68.5 64.3 65.0 15.3 67.4 35.7 65.6 16.9 70.3
Belgium, Dutch-speaking * 100 69.5 14.6 73.4 60.6 69.6 14.0 73.1 39.4 69.3 15.5 74.3
Belgium, French-speaking * 100 66.8 14.9 69.5 64.4 67.0 14.6 69.6 35.6 66.3 15.5 67.8
Bosnia and Herzegovina 100 61.1 15.5 63.7 57.9 58.5 16.3 61.0 42.1 64.7 13.7 66.9
Denmark 100 63.0 16.1 65.9 64.0 63.8 15.3 66.2 36.0 61.6 17.3 64.9
Finland 100 60.9 16.4 64.1 65.1 61.8 15.0 64.5 34.9 59.3 18.6 63.7
France (23 of 26 regions) 100 67.5 16.4 71.1 62.3 67.3 16.3 70.7 37.7 67.7 16.5 71.9
Greece 100 68.9 14.5 72.7 62.9 68.1 14.3 71.5 37.1 70.2 14.7 74.2
Iceland 100 58.2 21.7 63.6 66.7 58.7 22.0 66.3 33.3 57.2 22.1 60.4
Norway 100 61.9 18.0 64.9 70.4 62.1 17.7 65.1 29.6 61.4 18.5 64.8
Romania 100 59.6 15.1 61.7 57.9 58.7 14.8 60.6 42.1 60.8 15.4 63.0
Serbia 100 60.5 14.5 62.3 61.1 60.5 14.3 62.0 38.9 60.5 14.9 62.7
Spain, Andalusia 100 63.0 16.0 66.8 62.8 62.9 15.4 65.9 37.2 63.2 17.1 67.4
Spain, Aragon 100 64.3 15.4 68.4 68.7 64.4 14.9 68.1 31.3 64.0 16.7 69.9
Spain, Asturias 100 65.4 15.2 68.7 60.6 65.1 13.9 66.8 39.4 66.0 17.1 70.2
Spain, Basque country 100 63.6 16.3 67.1 68.2 65.3 15.5 69.0 31.8 59.9 17.2 65.0
Spain, Cantabria * 100 57.6 15.9 57.6 60.0 58.6 15.6 60.5 40.0 56.0 16.5 56.4
Spain, Castile and León * 100 67.1 14.5 70.5 66.9 66.2 14.5 69.8 33.1 68.9 14.3 74.0
Spain, Castile-La Mancha * 100 64.4 14.4 67.5 63.2 64.1 13.9 66.2 36.8 64.8 15.3 68.8
Spain, Catalonia 100 63.8 16.3 66.8 63.1 64.7 15.3 67.5 36.9 62.2 18.0 65.8
Spain, Extremadura 100 64.0 16.4 67.2 64.4 62.1 16.5 64.2 35.6 67.4 16.0 71.1
Spain, Galicia 100 63.4 16.2 66.0 65.0 63.7 15.6 66.5 35.0 62.9 17.4 64.4
Spain, Valencian region 100 63.3 16.9 66.8 66.6 62.9 17.4 67.3 33.4 64.2 15.8 66.4
Sweden 100 63.6 16.7 66.8 65.5 64.2 15.9 67.0 34.5 62.5 18.0 66.1
The Netherlands 100 64.2 15.8 66.8 62.5 64.5 15.5 67.3 37.5 63.6 16.3 66.4
United Kingdom, All countries * 100 62.3 16.2 65.1 63.0 62.8 16.3 65.6 37.0 61.5 16.2 64.1
United Kingdom, England * 100 62.2 16.3 65.0 63.6 62.6 16.4 65.6 36.4 61.4 16.2 64.0
United Kingdom, Northern Ireland * 100 62.2 15.7 65.1 60.2 62.2 15.4 64.1 39.8 62.3 16.1 67.6
United Kingdom, Scotland 100 61.2 16.9 63.9 57.0 61.5 16.8 64.7 43.0 60.8 16.9 62.6
United Kingdom, Wales * 100 64.0 16.3 66.6 62.2 65.3 16.0 69.0 37.8 62.0 16.6 64.5
Categories may not add up because of missing values or rounding offPercentages are row percentages* Patients younger than 20 years of age are not reported

All 0-19 20-44 45-64 65-74 75+
All Men Women All Men Women All Men Women All Men Women All Men Women All Men Women
Pmp Pmp Pmp Pmarp Pmarp Pmarp Pmarp Pmarp Pmarp Pmarp Pmarp Pmarp Pmarp Pmarp Pmarp Pmarp Pmarp Pmarp
20
A2 INCIDENT PATIENTS ACCEPTED FOR RRT IN 2011, AT DAY 1
Table A.2.3Incident rates per million (age-related) population, unadjustedat day 1, by age and gender
Austria 137.4 181.2 95.7 9.3 10.2 8.3 38.8 44.9 32.7 152.1 218.5 86.9 391.4 544.1 259.4 527.3 867.8 333.6
Belgium, Dutch-speaking * 181.7 223.1 141.4 45.5 47.0 44.0 147.6 184.1 110.4 464.5 627.4 314.7 907.1 1350.5 617.5
Belgium, French-speaking * 187.8 248.7 130.1 53.3 66.3 40.3 226.6 282.5 172.2 578.3 856.6 345.5 813.9 1496.9 436.3
Bosnia and Herzegovina 120.6 142.5 99.5 8.0 11.4 4.6 41.6 61.7 21.0 191.9 250.0 136.3 354.2 381.1 332.9 497.8 574.4 443.7
Denmark 111.1 143.3 79.3 5.1 5.7 4.5 46.7 51.8 41.5 135.9 173.1 98.5 314.6 428.1 208.0 386.8 649.2 213.9
Finland 84.6 112.3 58.0 9.0 4.8 13.4 34.0 43.1 24.4 114.9 150.8 79.3 245.8 353.9 151.2 191.1 352.8 99.7
France (23 of 26 regions) 149.5 191.5 109.7 7.4 8.5 6.3 41.3 51.0 31.4 153.9 198.4 111.4 403.6 553.4 271.1 648.8 1064.3 403.8
Greece 203.0 257.8 149.3 6.4 4.4 8.5 40.6 52.6 27.8 181.8 258.9 107.1 563.9 785.5 380.1 874.4 1187.6 638.9
Iceland 103.4 137.3 69.3 22.3 43.6 0 62.8 52.9 73.0 102.4 152.5 51.6 381.8 582.3 187.8 425.6 622.4 278.8
Norway 101.6 142.7 60.2 9.6 10.9 8.2 45.5 62.5 27.8 130.1 180.6 77.7 285.1 418.4 159.1 383.8 692.7 186.4
Romania 126.7 150.7 104.0 8.2 7.5 8.9 52.1 65.3 38.3 215.6 274.6 161.4 395.8 500.8 318.6 276.8 374.0 218.0
Serbia 143.7 180.4 108.9 6.0 5.2 6.8 56.7 65.4 47.8 221.7 301.4 147.1 406.9 490.4 341.5 293.3 475.8 172.4
Spain, Andalusia 112.2 142.5 82.6 5.4 5.3 5.6 37.6 44.4 30.4 142.8 196.1 90.4 415.4 570.7 279.9 387.4 564.9 273.6
Spain, Aragon 120.9 166.8 75.4 4.1 7.9 0 41.4 43.7 39.0 134.1 191.9 75.1 408.8 630.2 210.1 308.6 507.5 175.4
Spain, Asturias 143.3 181.3 108.4 13.0 12.6 13.3 35.3 32.2 38.6 144.9 207.3 85.8 409.0 583.7 262.4 373.0 530.9 279.6
Spain, Basque country 110.6 154.4 68.7 10.4 10.1 10.7 42.1 51.4 32.4 107.3 135.7 79.9 356.1 504.0 227.8 296.5 633.4 92.4
Spain, Cantabria * 109.5 134.5 85.7 75.1 83.2 66.7 163.4 195.3 132.1 221.6 303.1 150.6 176.6 298.4 103.0
Spain, Castile and León * 119.5 161.3 78.4 37.4 49.9 24.1 111.9 162.5 58.8 307.4 449.1 178.0 352.4 525.0 237.1
Spain, Castile-La Mancha * 94.9 118.9 70.4 33.7 38.1 28.7 120.9 166.0 73.3 392.5 561.2 243.0 233.7 286.8 195.9
Spain, Catalonia 126.7 161.6 92.5 7.3 3.9 10.9 42.2 45.6 38.6 154.8 204.1 106.6 396.0 580.9 234.1 443.0 709.5 278.4
Spain, Extremadura 106.4 138.0 75.2 9.1 8.8 9.3 38.3 59.9 15.7 130.5 185.6 72.4 271.6 334.4 216.2 324.0 452.3 239.9
Spain, Galicia 143.4 193.1 97.1 15.9 8.8 23.5 53.6 75.7 31.2 170.1 207.1 134.2 329.3 509.3 174.2 345.8 586.0 197.4
Spain, Valencian region 132.3 177.4 87.8 14.8 26.9 2.0 40.3 47.1 33.1 167.6 222.0 114.5 377.1 593.5 183.0 463.3 713.8 296.7
Sweden 122.4 161.0 84.2 7.8 7.1 8.5 48.2 57.0 39.0 149.4 196.4 101.8 317.1 448.6 190.5 406.3 651.1 241.8
The Netherlands 116.9 147.6 86.8 7.2 7.0 7.3 40.0 49.0 31.0 134.6 169.8 99.0 351.6 427.5 279.8 471.3 802.1 263.6
United Kingdom, All countries * 107.3 137.2 78.3 52.7 63.2 41.9 139.2 174.5 105.1 300.0 398.6 210.0 342.8 559.9 195.8
United Kingdom, England * 108.2 139.4 77.7 53.8 65.0 42.2 140.3 177.4 104.3 303.6 404.9 210.8 344.8 568.9 191.8
United Kingdom, Northern Ireland * 111.1 136.0 87.0 46.5 60.9 32.1 162.0 208.7 116.7 354.6 433.0 284.3 408.7 581.6 299.5
United Kingdom, Scotland 96.5 113.5 80.6 10.2 11.7 8.7 42.2 45.9 38.5 125.5 148.5 104.0 265.4 336.2 203.5 276.9 403.9 197.4
United Kingdom, Wales * ‡ 113.8 144.5 84.3 55.1 61.6 48.7 133.4 153.1 114.6 272.8 382.3 171.2 382.4 638.3 208.1
* Patients younger than 20 years of age are not reported‡ The incidence of RRT is slightly underestimated, for details see the UK Renal Registry Report 2012

Total GN PN PKD DM HT RVD Misc Unkn Missing
Type I Type II Both
Pmp % Pmp % Pmp % Pmp % Pmp % Pmp % Pmp % Pmp % Pmp % Pmp % Pmp % Pmp %
21
A2 INCIDENT PATIENTS ACCEPTED FOR RRT IN 2011, AT DAY 1
Table A.2.4Incident rates per million population, unadjustedat day 1, by cause of renal failure
Austria 137.4 100 13.9 10.1 5.3 3.9 4.3 3.1 4.6 3.4 35.3 25.7 39.9 29.0 15.2 11.1 17.5 12.7 24.9 18.2 16.4 11.9 0 0
Belgium, Dutch-speaking * 181.7 100 16.6 9.1 8.2 4.5 8.7 4.8 4.4 2.4 33.3 18.3 37.8 20.8 14.5 8.0 10.7 5.9 70.6 38.9 14.5 8.0 0 0
Belgium, French-speaking * 187.8 100 19.9 10.6 11.6 6.2 7.1 3.8 3.2 1.7 34.7 18.5 37.9 20.2 40.1 21.3 11.1 5.9 49.1 26.1 10.9 5.8 0 0
Bosnia and Herzegovina 120.6 100 14.3 11.8 18.0 14.9 5.4 4.5 24.2 20.1 7.1 5.9 31.4 26.0 16.2 13.5 1.7 1.4 22.2 18.4 11.4 9.5 0 0
Denmark 111.1 100 9.6 8.6 4.6 4.2 8.7 7.8 11.4 10.2 18.3 16.5 29.7 26.7 15.1 13.6 0.4 0.3 19.4 17.4 23.6 21.3 0 0
Finland 84.6 100 11.3 13.4 3.7 4.4 6.1 7.2 12.1 14.3 17.6 20.8 29.7 35.1 4.8 5.7 1.1 1.3 17.1 20.2 10.8 12.7 0 0
France (23 of 26 regions) 149.5 100 16.7 11.2 7.1 4.8 10.0 6.7 32.6 21.8 35.6 23.8 2.1 1.4 23.4 15.6 21.6 14.5 0.3 0.2
Greece 203.0 100 18.1 8.9 10.6 5.2 8.7 4.3 2.4 1.2 52.4 25.8 54.8 27.0 21.9 10.8 3.6 1.8 19.5 9.6 65.8 32.4 0 0
Iceland 103.4 100 18.8 18.2 3.1 3.0 0 0 18.8 18.2 21.9 21.2 40.8 39.4 15.7 15.2 0 0 21.9 21.2 3.1 3.0 0 0
Norway 101.6 100 17.4 17.1 5.7 5.6 6.1 6.0 4.0 4.0 10.5 10.3 14.5 14.3 32.3 31.8 3.6 3.6 19.4 19.1 2.6 2.6 0 0
Romania 126.7 100 24.8 19.6 8.7 6.9 3.8 3.0 16.6 13.1 5.6 4.4 1.0 0.8 21.9 17.3 44.3 35.0 0 0
Serbia 143.7 100 13.5 9.4 16.3 11.3 8.8 6.1 31.3 21.8 36.2 25.2 0.4 0.3 23.8 16.6 13.4 9.3 0 0
Spain, Andalusia 112.2 100 11.5 10.2 10.5 9.4 7.8 7.0 27.1 24.2 9.0 8.0 5.5 4.9 12.8 11.4 28.0 24.9 0 0
Spain, Aragon 120.9 100 17.8 14.7 6.7 5.5 4.5 3.7 5.9 4.9 17.1 14.1 23.0 19.0 14.1 11.7 3.7 3.1 18.5 15.3 32.6 27.0 0 0
Spain, Asturias 143.3 100 13.9 9.7 5.5 3.9 13.9 9.7 5.5 3.9 20.3 14.2 25.9 18.1 16.6 11.6 7.4 5.2 13.9 9.7 46.2 32.2 0 0
Spain, Basque country 110.6 100 12.3 11.2 7.8 7.0 6.4 5.8 2.7 2.5 15.5 14.0 18.3 16.5 14.6 13.2 7.3 6.6 18.3 16.5 24.7 22.3 0.9 0.8
Spain, Cantabria * 109.5 100 15.2 13.8 1.7 1.5 6.7 6.2 8.4 7.7 15.2 13.8 23.6 21.5 13.5 12.3 23.6 21.5 20.2 18.5 5.1 4.6 0 0
Spain, Castile and León * 119.5 100 16.5 13.8 3.5 2.9 5.5 4.6 9.8 8.2 22.3 18.7 32.1 26.9 25.1 21.0 1.2 1.0 14.9 12.5 20.8 17.4 0 0
Spain, Castile-La Mancha * 94.9 100 10.9 11.4 7.1 7.5 9.9 10.4 26.0 27.4 6.1 6.5 2.8 3.0 12.7 13.4 19.4 20.4 0 0
Spain, Catalonia 126.7 100 16.7 13.2 7.2 5.7 9.4 7.4 2.1 1.7 23.2 18.3 25.3 20.0 15.5 12.3 4.1 3.2 12.9 10.2 35.1 27.7 0 0
Spain, Extremadura 106.4 100 13.5 12.7 4.5 4.2 8.1 7.6 29.8 28.0 10.8 10.2 1.8 1.7 6.3 5.9 31.6 29.7 0 0
Spain, Galicia 143.4 100 14.3 10.0 4.3 3.0 12.9 9.0 4.7 3.3 32.3 22.5 36.9 25.7 17.2 12.0 5.4 3.8 20.4 14.3 31.9 22.3 0 0
Spain, Valencian region 132.3 100 15.0 11.4 10.0 7.5 7.6 5.8 21.5 16.2 21.1 16.0 9.0 6.8 14.5 10.9 33.6 25.4 0 0
Sweden 122.4 100 17.4 14.2 3.8 3.1 8.4 6.8 11.3 9.2 18.4 15.0 29.7 24.3 17.9 14.6 7.2 5.9 21.4 17.5 16.7 13.7 0 0
The Netherlands 116.9 100 8.7 7.5 4.0 3.4 4.1 3.5 3.4 2.9 15.2 13.0 18.6 15.9 14.3 12.2 15.7 13.4 18.3 15.6 10.4 8.9 22.9 19.6
United Kingdom, All countries * 107.3 100 12.4 11.5 6.5 6.1 6.7 6.2 23.4 21.8 6.6 6.1 4.4 4.1 17.5 16.3 19.4 18.1 10.5 9.8
United Kingdom, England * 108.2 100 11.5 10.7 6.3 5.8 6.6 6.1 22.9 21.2 7.0 6.4 3.6 3.3 18.0 16.7 19.9 18.4 12.4 11.5
United Kingdom, Northern Ireland * 111.1 100 14.4 12.9 11.6 10.4 8.3 7.5 26.0 23.4 5.0 4.5 7.7 7.0 22.7 20.4 15.5 13.9 0 0
United Kingdom, Scotland 96.5 100 17.1 17.8 7.2 7.5 8.6 8.9 23.0 23.9 4.8 4.9 8.0 8.3 13.5 14.0 14.1 14.6 0.2 0.2
United Kingdom, Wales * ‡ 113.8 100 18.2 16.0 6.3 5.5 4.6 4.1 31.8 27.9 3.6 3.2 9.9 8.7 14.9 13.1 22.8 20.1 1.7 1.5
Abbreviations used: GN: glomerulonephritis/sclerosis; PN: pyelonephritis; PKD: polycystic kidneys, adult type; DM: diabetes mellitus; HT: hypertension; RVD: renal vascular disease; Misc: miscellaneous; Unkn: unknownCategories may not add up because of rounding off or a limited number of cases (<10%) with diabetes mellitus type unknownPercentages are row percentagesWhen cells are left empty, (complete) data are unavailable* Patients younger than 20 years of age are not reported‡ The incidence of RRT is slightly underestimated, for details see the UK Renal Registry Report 2012

Total GN PN PKD DM HT RVD Misc Unkn Missing
Type I Type II Both
Pmp Pmp Pmp Pmp Pmp Pmp Pmp Pmp Pmp Pmp Pmp Pmp
22
A2 INCIDENT PATIENTS ACCEPTED FOR RRT IN 2011, AT DAY 1
Table A.2.5Incident rates per million population, adjustedat day 1, by cause of renal failure, adjusted for age and gender
Austria 131.3 13.4 5.2 4.1 4.5 33.7 38.2 14.4 16.3 24.1 15.6 0
Belgium, Dutch-speaking * 161.6 15.5 7.2 8.2 4.4 29.9 34.2 12.4 8.9 61.9 13.3 0
Belgium, French-speaking * 190.8 20.4 11.9 7.3 3.5 35.8 39.3 39.4 11.5 50.0 11.0 0
Bosnia and Herzegovina 135.0 15.2 20.7 5.6 25.8 7.7 33.6 18.2 1.8 25.6 14.2 0
Denmark 108.4 9.4 4.6 8.5 11.1 17.4 28.5 14.7 0.3 19.3 23.1 0
Finland 78.3 10.9 3.5 5.4 11.7 15.5 27.2 4.4 1.0 16.0 10.0 0
France (23 of 26 regions) 139.1 16.4 6.8 9.7 30.9 30.9 1.8 22.4 19.8 0.3
Greece 174.6 16.7 9.1 8.2 2.4 44.9 47.3 18.2 3.1 17.0 54.8 0
Iceland 120.0 19.9 3.7 0 19.7 29.0 48.7 17.6 0 26.3 3.7 0
Norway 105.1 17.8 5.7 6.2 4.1 10.9 15.0 33.7 3.9 20.1 2.6 0
Romania 129.1 24.9 8.9 3.8 16.6 5.8 1.1 22.5 45.4 0
Serbia 133.4 13.5 15.2 8.2 28.5 33.3 0.4 22.0 12.4 0
Spain, Andalusia 117.5 11.6 11.0 8.0 29.1 9.5 5.8 13.5 29.0 0
Spain, Aragon 110.4 16.6 5.8 4.4 5.6 15.3 21.0 12.7 2.4 17.6 29.9 0
Spain, Asturias 117.5 12.3 4.8 11.4 4.9 17.7 22.5 11.9 5.7 11.1 37.8 0
Spain, Basque country 98.5 11.4 7.3 5.8 2.5 13.7 16.2 12.6 6.1 17.4 20.9 0.9
Spain, Cantabria * 102.8 15.6 1.6 6.0 7.7 14.2 21.9 11.7 22.1 18.9 4.9 0
Spain, Castile and León * 96.0 13.9 3.2 4.6 8.7 18.2 26.9 18.4 0.8 12.4 15.9 0
Spain, Castile-La Mancha * 96.1 10.6 7.0 10.5 27.4 6.3 2.7 12.7 19.0 0
Spain, Catalonia 125.3 16.7 7.2 9.4 2.0 23.5 25.9 14.9 4.1 12.9 34.3 0
Spain, Extremadura 97.1 11.8 4.4 7.8 26.5 10.4 1.5 6.0 28.7 0
Spain, Galicia 120.5 12.6 3.8 11.6 4.3 26.3 30.6 13.6 3.9 19.1 25.4 0
Spain, Valencian region 127.1 14.5 9.8 7.5 20.8 20.2 8.6 13.7 31.9 0
Sweden 115.0 17.1 3.6 8.0 11.3 16.9 28.2 16.0 6.1 20.4 15.5 0
The Netherlands 116.1 8.5 4.0 3.9 3.4 15.0 18.4 14.5 16.1 18.1 10.4 22.2
United Kingdom, All countries * 107.0 12.5 6.5 6.8 23.7 6.6 4.2 17.6 18.8 10.4
United Kingdom, England * 108.1 11.6 6.3 6.7 23.3 7.0 3.4 18.1 19.4 12.3
United Kingdom, Northern Ireland * 121.1 15.5 12.7 8.9 28.1 5.3 8.9 25.2 16.5 0
United Kingdom, Scotland 94.4 17.0 7.1 8.2 22.6 4.6 7.8 13.1 13.8 0.2
United Kingdom, Wales * ‡ 104.8 17.4 5.9 4.6 30.3 3.2 8.2 13.9 20.0 1.4
Abbreviations used: GN: glomerulonephritis/sclerosis; PN: pyelonephritis; PKD: polycystic kidneys, adult type; DM: diabetes mellitus; HT: hypertension; RVD: renal vascular disease; Misc: miscellaneous; Unkn: unknownCategories may not add up because of rounding off or a limited number of cases (<10%) with diabetes mellitus type unknownWhen cells are left empty, (complete) data are unavailable* Patients younger than 20 years of age are not reported‡ The incidence of RRT is slightly underestimated, for details see the UK Renal Registry Report 2012

All 0-19 20-44 45-64 65-74 75+
All Men Women All Men Women All Men Women All Men Women All Men Women All Men Women
N (100%) N (100%) N (100%) N % N % N % N % N % N % N % N % N % N % N % N % N % N % N %
23
A3 INCIDENT PATIENTS ACCEPTED FOR RRT IN 2011, AT DAY 91
Table A.3.1Incident counts and percentagesat day 91, by age and gender
Austria 1061 687 374 15 1 8 1 7 2 109 10 64 9 45 12 319 30 229 33 90 24 292 28 194 28 98 26 326 31 192 28 134 36
Belgium, Dutch-speaking * 1043 633 410 90 9 47 7 43 10 238 23 148 23 90 22 245 23 155 24 90 22 470 45 283 45 187 46
Belgium, French-speaking * 776 496 280 77 10 46 9 31 11 248 32 148 30 100 36 183 24 125 25 58 21 268 35 177 36 91 33
Bosnia and Herzegovina † 378 226 152 6 2 4 2 2 1 51 13 39 17 12 8 158 42 102 45 55 36 107 28 54 24 54 36 56 15 27 12 29 19
Denmark † 590 377 213 7 1 4 1 3 1 83 14 46 12 37 17 192 33 123 33 69 33 163 28 108 29 54 26 145 25 96 25 50 23
Finland 446 289 157 11 2 3 1 8 5 56 13 36 12 20 13 172 39 112 39 60 38 126 28 85 29 41 26 81 18 53 18 28 18
France (23 of 26 regions) 6903 4288 2615 83 1 49 1 34 1 634 9 391 9 243 9 1963 28 1243 29 720 28 1568 23 1000 23 568 22 2655 38 1605 37 1050 40
Greece 2064 1315 749 14 1 5 0 9 1 153 7 101 8 52 7 512 25 361 27 151 20 559 27 355 27 204 27 826 40 493 37 333 44
Iceland 33 22 11 2 6 2 9 0 0 7 21 3 14 4 36 8 24 6 27 2 18 6 18 4 18 2 18 10 30 7 32 3 27
Norway 477 339 138 12 3 7 2 5 4 75 16 52 15 23 17 151 32 107 32 44 32 111 23 80 24 31 22 128 27 93 27 35 25
Romania 2235 1289 946 31 1 14 1 17 2 399 18 255 20 144 15 961 43 588 46 373 39 542 24 284 22 258 27 302 14 148 11 154 16
Serbia 960 592 368 8 1 3 1 5 1 137 14 81 14 56 15 435 45 286 48 149 40 236 25 127 21 109 30 144 15 95 16 49 13
Spain, Andalusia 910 571 339 10 1 5 1 5 1 114 13 71 12 43 13 289 32 194 34 95 28 263 29 167 29 96 28 234 26 134 23 100 29
Spain, Aragon 156 106 50 0 0 0 0 0 0 21 13 12 11 9 18 46 29 34 32 12 24 43 28 30 28 13 26 46 29 30 28 16 32
Spain, Asturias † 148 91 57 2 1 1 1 1 2 13 9 6 7 7 12 42 29 30 33 12 20 39 27 26 28 13 23 52 35 28 31 24 42
Spain, Basque country 238 162 76 4 2 2 1 2 3 31 13 19 12 12 16 64 27 41 25 23 30 72 30 46 28 26 34 67 28 54 33 13 17
Spain, Cantabria * 62 37 25 16 26 9 24 7 28 26 42 15 41 11 44 10 16 7 19 3 12 10 16 6 16 4 16
Spain, Castile and León * 296 198 98 31 10 21 11 10 10 73 25 55 28 18 18 75 25 52 26 23 23 117 40 70 35 47 48
Spain, Castile-La Mancha * 200 125 75 29 15 17 14 12 16 59 30 40 32 19 25 61 31 42 34 19 25 51 26 26 21 25 33
Spain, Catalonia † 922 575 347 11 1 3 1 8 2 119 13 67 12 52 15 286 31 185 32 100 29 230 25 158 27 72 21 276 30 162 28 115 33
Spain, Extremadura † 117 80 37 1 1 1 1 0 0 15 13 13 17 2 5 40 34 28 35 11 31 24 21 16 19 9 24 37 32 22 28 15 41
Spain, Galicia † 384 251 133 7 2 2 1 5 4 50 13 36 14 14 11 125 33 73 29 52 39 89 23 65 26 24 18 113 29 75 30 38 29
Spain, Valencian region 659 440 219 15 2 14 3 1 0 79 12 48 11 31 14 212 32 139 32 73 33 165 25 123 28 42 19 188 29 116 26 72 33
Sweden 1028 673 355 15 1 8 1 7 2 143 14 86 13 57 16 334 32 219 33 115 32 253 25 176 26 77 22 283 28 184 27 99 28
The Netherlands 1804 1128 676 27 1 14 1 13 2 212 12 128 11 84 12 590 33 373 33 217 32 465 26 277 25 188 28 510 28 336 30 174 26
United Kingdom, All countries * † 6313 3983 2330 1078 17 661 17 417 18 2150 34 1318 33 832 36 1538 24 970 24 568 24 1547 24 1034 26 513 22
United Kingdom, England * † 5335 3395 1940 930 17 574 17 356 18 1813 34 1126 33 687 35 1285 24 809 24 476 25 1307 25 886 26 421 22
United Kingdom, Northern Ireland * † 189 117 72 27 14 18 15 9 13 69 37 45 38 24 33 52 28 30 26 22 31 41 22 24 21 17 24
United Kingdom, Scotland 476 275 201 11 2 7 3 4 2 72 15 41 15 31 15 170 36 93 34 77 38 122 26 76 28 46 23 101 21 58 21 43 21
United Kingdom, Wales * † ‡ 329 203 126 49 15 28 14 21 17 100 30 55 27 45 36 79 24 53 26 26 21 101 31 67 33 34 27
Categories may not add up because of missing values or rounding offPercentages are row percentages* Patients younger than 20 years of age are not reported† The incident counts at day 91 are estimated (see methods)‡ The incidence of RRT is slightly underestimated, for details see the UK Renal Registry Report 2012

All Men Women
% Mean SD Median % Mean SD Median % Mean SD Median (years) (years) (years) (years) (years) (years)
24
A3 INCIDENT PATIENTS ACCEPTED FOR RRT IN 2011, AT DAY 91
Table A.3.2Gender, mean age, and median age of incident patientsat day 91
Austria 100 65.1 15.9 68.4 64.8 64.8 15.2 67.3 35.2 65.4 17.1 70.3
Belgium, Dutch-speaking * 100 69.2 14.8 73.2 60.7 69.5 14.2 73.3 39.3 68.6 15.6 73.0
Belgium, French-speaking * 100 66.4 14.9 68.7 63.9 66.9 14.5 69.7 36.1 65.6 15.7 66.6
Bosnia and Herzegovina † 100 60.6 14.5 63.1 59.9 58.6 15.0 60.2 40.1 63.7 13.1 67.1
Denmark † 100 62.6 16.3 65.8 63.9 63.4 15.6 66.5 36.1 61.2 17.4 64.4
Finland 100 61.0 16.4 64.2 64.8 61.9 15.0 64.5 35.2 59.3 18.6 63.8
France (23 of 26 regions) 100 67.0 16.5 70.3 62.1 66.8 16.4 69.9 37.9 67.3 16.6 71.1
Greece 100 68.3 14.7 71.9 63.7 67.7 14.4 71.1 36.3 69.5 15.1 73.6
Iceland 100 58.4 21.7 63.9 66.7 58.9 22.0 66.6 33.3 57.5 22.1 60.6
Norway 100 61.7 18.1 65.1 71.1 62.2 17.8 65.5 28.9 60.6 18.6 64.4
Romania 100 58.8 15.1 60.8 57.7 57.7 14.8 59.5 42.3 60.2 15.5 62.4
Serbia 100 59.9 14.5 61.7 61.7 60.0 14.3 61.6 38.3 59.8 15.0 62.1
Spain, Andalusia 100 63.1 15.9 66.8 62.7 62.8 15.4 65.6 37.3 63.5 16.8 67.5
Spain, Aragon 100 64.0 15.6 68.2 67.9 64.0 15.1 67.6 32.1 64.0 16.8 69.8
Spain, Asturias † 100 66.3 15.3 69.8 61.6 65.8 14.2 67.4 38.4 67.1 17.2 71.8
Spain, Basque country 100 63.7 16.4 67.4 68.1 65.4 15.6 69.0 31.9 60.1 17.4 65.2
Spain, Cantabria * 100 57.2 16.0 57.5 59.7 58.3 15.7 57.9 40.3 55.6 16.5 56.0
Spain, Castile and León * 100 67.1 14.6 70.7 66.9 66.1 14.6 69.8 33.1 69.2 14.4 74.3
Spain, Castile-La Mancha * 100 63.9 14.8 67.1 62.5 63.9 14.1 66.2 37.5 64.0 16.1 68.7
Spain, Catalonia † 100 63.6 16.1 66.8 62.4 64.5 15.3 67.6 37.6 62.1 17.4 65.5
Spain, Extremadura † 100 65.1 16.1 69.0 68.6 63.0 16.6 66.0 31.4 69.5 14.4 72.7
Spain, Galicia † 100 63.2 16.6 66.2 65.3 63.1 16.0 66.5 34.7 63.3 17.8 65.6
Spain, Valencian region 100 63.3 17.0 66.9 66.8 62.8 17.4 67.0 33.2 64.2 16.0 66.5
Sweden 100 62.9 16.8 65.9 65.5 63.5 16.1 66.4 34.5 61.9 18.1 64.9
The Netherlands 100 63.9 16.0 66.5 62.5 64.4 15.7 67.1 37.5 63.2 16.4 66.1
United Kingdom, All countries * † 100 61.9 16.5 64.7 63.1 62.3 16.6 65.2 36.9 61.2 16.2 63.9
United Kingdom, England * † 100 61.9 16.6 64.7 63.6 62.3 16.8 65.2 36.4 61.1 16.2 63.8
United Kingdom, Northern Ireland * † 100 62.4 16.0 66.2 61.9 63.0 15.1 65.3 38.1 61.4 17.6 67.9
United Kingdom, Scotland 100 60.7 17.0 63.4 57.8 61.2 16.9 64.5 42.2 60.1 17.0 62.0
United Kingdom, Wales * † 100 63.6 16.5 66.0 61.7 64.0 16.6 67.6 38.3 62.9 16.3 64.9
Categories may not add up because of missing values or rounding offPercentages are row percentages* Patients younger than 20 years of age are not reported† The incident counts at day 91, on which the data presented in this table are based, are estimated (see methods)
All 0-19 20-44 45-64 65-74 75+
All Men Women All Men Women All Men Women All Men Women All Men Women All Men Women
Pmp Pmp Pmp Pmarp Pmarp Pmarp Pmarp Pmarp Pmarp Pmarp Pmarp Pmarp Pmarp Pmarp Pmarp Pmarp Pmarp Pmarp
25
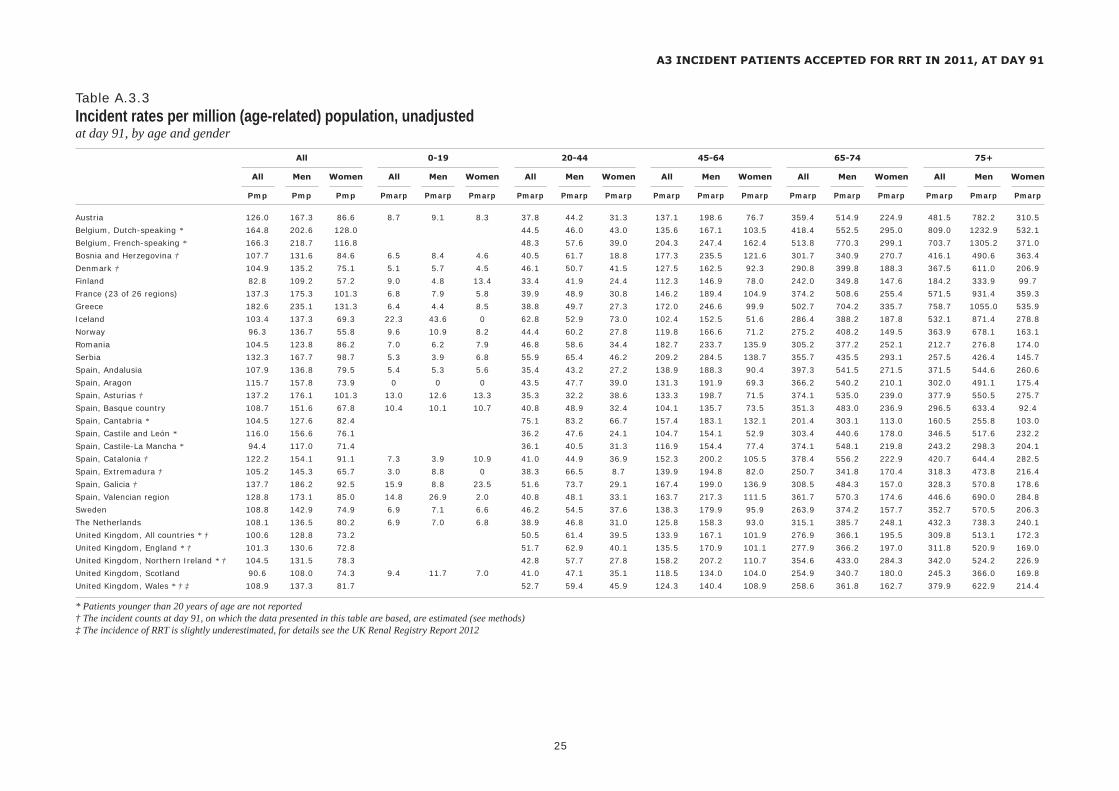
A3 INCIDENT PATIENTS ACCEPTED FOR RRT IN 2011, AT DAY 91
Table A.3.3Incident rates per million (age-related) population, unadjustedat day 91, by age and gender
Austria 126.0 167.3 86.6 8.7 9.1 8.3 37.8 44.2 31.3 137.1 198.6 76.7 359.4 514.9 224.9 481.5 782.2 310.5
Belgium, Dutch-speaking * 164.8 202.6 128.0 44.5 46.0 43.0 135.6 167.1 103.5 418.4 552.5 295.0 809.0 1232.9 532.1
Belgium, French-speaking * 166.3 218.7 116.8 48.3 57.6 39.0 204.3 247.4 162.4 513.8 770.3 299.1 703.7 1305.2 371.0
Bosnia and Herzegovina † 107.7 131.6 84.6 6.5 8.4 4.6 40.5 61.7 18.8 177.3 235.5 121.6 301.7 340.9 270.7 416.1 490.6 363.4
Denmark † 104.9 135.2 75.1 5.1 5.7 4.5 46.1 50.7 41.5 127.5 162.5 92.3 290.8 399.8 188.3 367.5 611.0 206.9
Finland 82.8 109.2 57.2 9.0 4.8 13.4 33.4 41.9 24.4 112.3 146.9 78.0 242.0 349.8 147.6 184.2 333.9 99.7
France (23 of 26 regions) 137.3 175.3 101.3 6.8 7.9 5.8 39.9 48.9 30.8 146.2 189.4 104.9 374.2 508.6 255.4 571.5 931.4 359.3
Greece 182.6 235.1 131.3 6.4 4.4 8.5 38.8 49.7 27.3 172.0 246.6 99.9 502.7 704.2 335.7 758.7 1055.0 535.9
Iceland 103.4 137.3 69.3 22.3 43.6 0 62.8 52.9 73.0 102.4 152.5 51.6 286.4 388.2 187.8 532.1 871.4 278.8
Norway 96.3 136.7 55.8 9.6 10.9 8.2 44.4 60.2 27.8 119.8 166.6 71.2 275.2 408.2 149.5 363.9 678.1 163.1
Romania 104.5 123.8 86.2 7.0 6.2 7.9 46.8 58.6 34.4 182.7 233.7 135.9 305.2 377.2 252.1 212.7 276.8 174.0
Serbia 132.3 167.7 98.7 5.3 3.9 6.8 55.9 65.4 46.2 209.2 284.5 138.7 355.7 435.5 293.1 257.5 426.4 145.7
Spain, Andalusia 107.9 136.8 79.5 5.4 5.3 5.6 35.4 43.2 27.2 138.9 188.3 90.4 397.3 541.5 271.5 371.5 544.6 260.6
Spain, Aragon 115.7 157.8 73.9 0 0 0 43.5 47.7 39.0 131.3 191.9 69.3 366.2 540.2 210.1 302.0 491.1 175.4
Spain, Asturias † 137.2 176.1 101.3 13.0 12.6 13.3 35.3 32.2 38.6 133.3 198.7 71.5 374.1 535.0 239.0 377.9 550.5 275.7
Spain, Basque country 108.7 151.6 67.8 10.4 10.1 10.7 40.8 48.9 32.4 104.1 135.7 73.5 351.3 483.0 236.9 296.5 633.4 92.4
Spain, Cantabria * 104.5 127.6 82.4 75.1 83.2 66.7 157.4 183.1 132.1 201.4 303.1 113.0 160.5 255.8 103.0
Spain, Castile and León * 116.0 156.6 76.1 36.2 47.6 24.1 104.7 154.1 52.9 303.4 440.6 178.0 346.5 517.6 232.2
Spain, Castile-La Mancha * 94.4 117.0 71.4 36.1 40.5 31.3 116.9 154.4 77.4 374.1 548.1 219.8 243.2 298.3 204.1
Spain, Catalonia † 122.2 154.1 91.1 7.3 3.9 10.9 41.0 44.9 36.9 152.3 200.2 105.5 378.4 556.2 222.9 420.7 644.4 282.5
Spain, Extremadura † 105.2 145.3 65.7 3.0 8.8 0 38.3 66.5 8.7 139.9 194.8 82.0 250.7 341.8 170.4 318.3 473.8 216.4
Spain, Galicia † 137.7 186.2 92.5 15.9 8.8 23.5 51.6 73.7 29.1 167.4 199.0 136.9 308.5 484.3 157.0 328.3 570.8 178.6
Spain, Valencian region 128.8 173.1 85.0 14.8 26.9 2.0 40.8 48.1 33.1 163.7 217.3 111.5 361.7 570.3 174.6 446.6 690.0 284.8
Sweden 108.8 142.9 74.9 6.9 7.1 6.6 46.2 54.5 37.6 138.3 179.9 95.9 263.9 374.2 157.7 352.7 570.5 206.3
The Netherlands 108.1 136.5 80.2 6.9 7.0 6.8 38.9 46.8 31.0 125.8 158.3 93.0 315.1 385.7 248.1 432.3 738.3 240.1
United Kingdom, All countries * † 100.6 128.8 73.2 50.5 61.4 39.5 133.9 167.1 101.9 276.9 366.1 195.5 309.8 513.1 172.3
United Kingdom, England * † 101.3 130.6 72.8 51.7 62.9 40.1 135.5 170.9 101.1 277.9 366.2 197.0 311.8 520.9 169.0
United Kingdom, Northern Ireland * † 104.5 131.5 78.3 42.8 57.7 27.8 158.2 207.2 110.7 354.6 433.0 284.3 342.0 524.2 226.9
United Kingdom, Scotland 90.6 108.0 74.3 9.4 11.7 7.0 41.0 47.1 35.1 118.5 134.0 104.0 254.9 340.7 180.0 245.3 366.0 169.8
United Kingdom, Wales * † ‡ 108.9 137.3 81.7 52.7 59.4 45.9 124.3 140.4 108.9 258.6 361.8 162.7 379.9 622.9 214.4
* Patients younger than 20 years of age are not reported† The incident counts at day 91, on which the data presented in this table are based, are estimated (see methods)‡ The incidence of RRT is slightly underestimated, for details see the UK Renal Registry Report 2012

Total GN PN PKD DM HT RVD Misc Unkn Missing
Type I Type II Both
Pmp % Pmp % Pmp % Pmp % Pmp % Pmp % Pmp % Pmp % Pmp % Pmp % Pmp % Pmp %
26
A3 INCIDENT PATIENTS ACCEPTED FOR RRT IN 2011, AT DAY 91
Table A.3.4Incident rates per million population, unadjustedat day 91, by cause of renal failure
Austria 126.0 100 13.9 11.0 5.0 4.0 4.0 3.2 4.3 3.4 33.4 26.5 37.6 29.9 14.4 11.4 16.0 12.7 20.8 16.5 14.2 11.3 0 0
Belgium, Dutch-speaking * 164.8 100 15.8 9.6 7.0 4.2 8.8 5.4 4.3 2.6 31.3 19.0 35.6 21.6 13.3 8.1 9.6 5.8 61.0 37.0 13.7 8.3 0 0
Belgium, French-speaking * 166.3 100 18.9 11.3 10.5 6.3 7.1 4.3 2.8 1.7 31.3 18.8 34.1 20.5 36.0 21.6 10.5 6.3 39.7 23.8 9.6 5.8 0 0
Bosnia and Herzegovina † 107.7 100 13.5 12.5 15.7 14.6 5.4 5.0 22.7 21.1 6.4 5.9 29.1 27.0 15.9 14.7 1.7 1.6 18.4 17.1 8.0 7.4 0 0
Denmark † 104.9 100 9.6 9.1 4.4 4.2 8.7 8.3 11.1 10.6 16.9 16.1 28.0 26.7 14.4 13.7 0.4 0.3 17.2 16.4 22.2 21.2 0 0
Finland 82.8 100 11.3 13.7 3.7 4.5 5.9 7.2 12.1 14.6 17.1 20.6 29.1 35.2 4.5 5.4 1.1 1.3 16.7 20.2 10.4 12.6 0 0
France (23 of 26 regions) 137.3 100 16.1 11.7 6.7 4.9 9.8 7.2 30.1 21.9 32.4 23.6 1.9 1.4 21.0 15.3 18.9 13.8 0.3 0.2
Greece 182.6 100 17.1 9.4 9.3 5.1 8.7 4.7 2.4 1.3 47.9 26.2 50.3 27.5 20.1 11.0 3.2 1.7 16.1 8.8 58.0 31.7 0 0
Iceland 103.4 100 18.8 18.2 3.1 3.0 0 0 18.8 18.2 21.9 21.2 40.8 39.4 15.7 15.2 0 0 21.9 21.2 3.1 3.0 0 0
Norway 96.3 100 17.0 17.6 5.5 5.7 6.1 6.3 4.0 4.2 9.7 10.1 13.7 14.3 31.1 32.3 3.6 3.8 17.0 17.6 2.4 2.5 0 0
Romania 104.5 100 22.2 21.3 7.1 6.8 3.5 3.4 13.9 13.3 4.9 4.7 0.8 0.8 17.4 16.7 34.6 33.1 0 0
Serbia 132.3 100 13.2 10.0 13.9 10.5 8.5 6.5 30.0 22.7 34.4 26.0 0.4 0.3 19.8 15.0 11.8 9.0 0 0
Spain, Andalusia 107.9 100 11.4 10.5 10.0 9.2 7.7 7.1 26.5 24.6 8.7 8.1 5.1 4.7 11.7 10.9 26.8 24.8 0 0
Spain, Aragon 115.7 100 16.3 14.1 6.7 5.8 4.5 3.8 5.9 5.1 16.3 14.1 22.3 19.2 13.4 11.5 3.7 3.2 17.1 14.7 31.9 27.6 0 0
Spain, Asturias † 137.2 100 13.9 10.1 5.5 4.0 13.9 10.1 4.3 3.1 19.1 13.9 23.4 17.1 16.6 12.1 4.9 3.6 13.9 10.1 45.0 32.8 0 0
Spain, Basque country 108.7 100 12.3 11.3 7.8 7.1 6.4 5.9 2.7 2.5 15.5 14.3 18.3 16.8 14.6 13.4 6.9 6.3 17.8 16.4 23.8 21.9 0.9 0.8
Spain, Cantabria * 104.5 100 15.2 14.5 1.7 1.6 6.7 6.5 8.4 8.1 13.5 12.9 21.9 21.0 11.8 11.3 23.6 22.6 18.5 17.7 5.1 4.8 0 0
Spain, Castile and León * 116.0 100 16.5 14.2 3.5 3.0 5.1 4.4 9.8 8.4 22.3 19.3 32.1 27.7 24.3 20.9 0.8 0.7 14.1 12.2 19.6 16.9 0 0
Spain, Castile-La Mancha * 94.4 100 11.8 12.5 7.6 8.0 9.4 10.0 25.5 27.0 5.7 6.0 2.4 2.5 12.7 13.5 19.4 20.5 0 0
Spain, Catalonia † 122.2 100 15.8 12.9 7.2 5.9 9.4 7.7 2.1 1.7 22.9 18.7 25.4 20.8 14.8 12.1 3.8 3.1 12.2 9.9 33.7 27.6 0 0
Spain, Extremadura † 105.2 100 13.5 12.9 4.5 4.3 10.5 10.0 32.2 30.6 9.6 9.1 1.8 1.7 6.3 6.0 26.8 25.4 0 0
Spain, Galicia † 137.7 100 14.8 10.8 4.3 3.1 12.9 9.4 4.7 3.4 30.8 22.4 35.5 25.8 16.7 12.2 5.4 3.9 18.5 13.5 29.5 21.4 0 0
Spain, Valencian region 128.8 100 15.0 11.7 9.8 7.6 7.6 5.9 21.1 16.4 20.9 16.2 8.6 6.7 13.5 10.5 32.2 25.0 0 0
Sweden 108.8 100 15.8 14.5 3.3 3.0 8.1 7.5 10.7 9.8 16.2 14.9 26.9 24.7 16.3 15.0 5.9 5.4 17.8 16.3 14.7 13.5 0 0
The Netherlands 108.1 100 8.4 7.8 3.3 3.0 4.1 3.8 3.4 3.1 14.5 13.4 17.9 16.5 13.4 12.4 14.4 13.3 15.6 14.4 9.3 8.6 21.7 20.1
United Kingdom, All countries * † 100.6 100 12.0 11.9 6.2 6.1 6.6 6.6 22.4 22.3 6.2 6.2 3.8 3.8 16.0 15.9 17.9 17.8 9.4 9.3
United Kingdom, England * † 101.3 100 11.2 11.0 6.0 5.9 6.4 6.3 21.9 21.6 6.6 6.5 3.1 3.1 16.6 16.4 18.4 18.1 11.1 11.0
United Kingdom, Northern Ireland * † 104.5 100 14.4 13.8 11.6 11.1 8.3 7.9 24.5 23.5 5.0 4.8 7.0 6.7 20.5 19.6 13.3 12.7 0 0
United Kingdom, Scotland 90.6 100 16.4 18.1 6.9 7.6 8.6 9.5 21.3 23.5 4.8 5.3 7.0 7.7 12.4 13.7 13.1 14.5 0.2 0.2
United Kingdom, Wales * † ‡ 108.9 100 18.2 16.7 5.8 5.4 4.6 4.3 30.4 27.9 3.6 3.3 9.0 8.3 13.6 12.4 22.4 20.5 1.2 1.1
Abbreviations used: GN: glomerulonephritis/sclerosis; PN: pyelonephritis; PKD: polycystic kidneys, adult type; DM: diabetes mellitus; HT: hypertension; RVD: renal vascular disease; Misc: miscellaneous; Unkn: unknownCategories may not add up because of rounding off or a limited number of cases (<10%) with diabetes mellitus type unknownPercentages are row percentagesWhen cells are left empty, (complete) data are unavailable* Patients younger than 20 years of age are not reported† The incident counts at day 91, on which the data presented in this table are based, are estimated (see methods)‡ The incidence of RRT is slightly underestimated, for details see the UK Renal Registry Report 2012

Total GN PN PKD DM HT RVD Misc Unkn Missing
Type I Type II Both
Pmp Pmp Pmp Pmp Pmp Pmp Pmp Pmp Pmp Pmp Pmp Pmp
27
A3 INCIDENT PATIENTS ACCEPTED FOR RRT IN 2011, AT DAY 91
Table A.3.5Incident rates per million population, adjustedat day 91, by cause of renal failure, adjusted for age and gender
Austria 120.4 13.4 4.9 3.9 4.2 31.9 36.1 13.5 14.9 20.1 13.7 0
Belgium, Dutch-speaking * 146.9 14.8 6.1 8.3 4.2 27.8 32.0 11.4 8.1 53.6 12.6 0
Belgium, French-speaking * 169.0 19.3 10.7 7.3 3.0 32.6 35.5 35.2 10.8 40.5 9.7 0
Bosnia and Herzegovina † 120.2 14.7 18.2 5.8 24.2 7.1 31.3 18.3 1.8 21.0 9.5 0
Denmark † 102.4 9.5 4.4 8.5 10.8 16.0 26.7 14.1 0.3 17.3 21.7 0
Finland 76.5 10.9 3.5 5.2 11.7 15.0 26.7 4.0 1.0 15.6 9.7 0
France (23 of 26 regions) 128.1 15.8 6.4 9.5 28.5 28.4 1.6 20.2 17.4 0.3
Greece 157.6 15.8 8.0 8.2 2.4 41.0 43.4 16.8 2.8 14.2 48.4 0
Iceland 118.2 19.9 3.7 0 19.7 27.8 47.5 17.6 0 25.8 3.7 0
Norway 99.5 17.4 5.5 6.2 4.1 10.2 14.2 32.3 3.9 17.5 2.4 0
Romania 106.1 22.3 7.2 3.5 13.9 5.1 0.9 17.8 35.3 0
Serbia 122.8 13.2 12.9 8.0 27.2 31.6 0.4 18.4 11.0 0
Spain, Andalusia 112.8 11.5 10.4 7.8 28.5 9.2 5.4 12.3 27.6 0
Spain, Aragon 105.2 15.2 5.7 4.4 5.7 14.8 20.5 12.1 2.4 15.7 29.2 0
Spain, Asturias † 112.0 12.3 4.9 11.4 4.1 16.3 20.1 11.7 4.4 11.1 36.5 0
Spain, Basque country 96.9 11.4 7.2 5.8 2.5 13.8 16.3 12.7 5.8 17.0 20.0 0.9
Spain, Cantabria * 97.9 15.6 1.6 6.0 7.7 12.2 20.0 10.3 21.9 17.6 4.9 0
Spain, Castile and León * 93.1 14.0 3.1 4.3 8.7 18.2 26.9 17.8 0.6 11.7 14.9 0
Spain, Castile-La Mancha * 95.1 11.5 7.4 9.9 26.7 5.7 2.2 12.7 18.9 0
Spain, Catalonia † 121.1 15.9 7.2 9.3 2.0 23.1 25.5 14.4 3.7 12.4 32.7 0
Spain, Extremadura † 95.9 11.5 4.4 9.6 28.2 9.7 1.5 6.1 24.5 0
Spain, Galicia † 115.8 13.4 3.8 11.6 4.3 25.0 29.3 13.2 3.9 17.0 23.5 0
Spain, Valencian region 123.8 14.6 9.6 7.6 20.5 19.9 8.2 12.8 30.6 0
Sweden 102.6 15.7 3.1 7.8 10.7 15.0 25.7 14.6 5.0 17.1 13.6 0
The Netherlands 107.1 8.3 3.3 3.9 3.3 14.3 17.6 13.7 14.6 15.4 9.4 20.9
United Kingdom, All countries * † 100.2 12.1 6.2 6.7 22.6 6.2 3.7 16.1 17.4 9.3
United Kingdom, England * † 101.3 11.3 6.0 6.6 22.3 6.6 3.0 16.7 17.9 11.0
United Kingdom, Northern Ireland * † 113.7 15.6 12.7 8.9 27.0 5.2 7.9 22.4 14.4 0
United Kingdom, Scotland 88.7 16.3 6.8 8.2 20.9 4.6 6.9 12.0 12.8 0.2
United Kingdom, Wales * † ‡ 100.3 17.2 5.7 4.5 29.1 3.2 7.4 12.7 19.6 1.1
Abbreviations used: GN: glomerulonephritis/sclerosis; PN: pyelonephritis; PKD: polycystic kidneys, adult type; DM: diabetes mellitus; HT: hypertension; RVD: renal vascular disease; Misc: miscellaneous; Unkn: unknownCategories may not add up because of rounding off or a limited number of cases (<10%) with diabetes mellitus type unknownWhen cells are left empty, (complete) data are unavailable* Patients younger than 20 years of age are not reported† The incident counts at day 91, on which the data presented in this table are based, are estimated (see methods)‡ The incidence of RRT is slightly underestimated, for details see the UK Renal Registry Report 2012

Total Haemodialysis Peritoneal dialysis Transplant Unkn Missing
HD HD HD HF HDF Total APD CAPD PD Total Living Deceased Tx Total hospital/ home type HD/ type PD type Tx centre Unkn HF/HDF Unkn Unkn
N N N N N N N N N N N N N N N N N
28
A3 INCIDENT PATIENTS ACCEPTED FOR RRT IN 2011, AT DAY 91
Table A.3.6Incident countsat day 91, by established therapy
Austria 1061 834 0 2 0 85 921 30 75 3 108 23 9 0 32 0 0
Belgium, Dutch-speaking * 1043 584 0 56 4 270 914 62 45 0 107 7 15 0 22 0 0
Belgium, French-speaking * 776 537 5 0 11 108 661 50 33 0 83 7 16 0 23 9 0
Bosnia and Herzegovina † 378 356 0 0 0 4 360 3 15 0 18 0 0 0 0 0 0
Denmark † 590 379 1 0 380 97 72 0 169 24 11 3 38 1 2
Finland 446 302 12 0 0 12 326 62 57 0 119 1 0 0 1 0 0
France (23 of 26 regions) 6903 5041 0 9 9 694 5753 305 484 0 789 67 263 0 330 5 26
Greece 2064 1854 0 0 3 59 1916 58 83 0 141 7 0 0 7 0 0
Iceland 33 19 0 0 19 10 10 4 0 0 4 0 0
Norway 477 308 1 0 309 92 92 33 43 0 76 0 0
Romania 2235 2015 10 0 2 0 2027 8 161 0 169 23 10 6 39 0 0
Serbia 960 778 3 1 0 65 847 4 96 0 100 11 2 0 13 0 0
Spain, Andalusia 910 761 0 0 761 115 115 34 34 0 0
Spain, Aragon 156 125 2 0 127 6 18 0 24 5 0 0 5 0 0
Spain, Asturias † 148 107 0 0 107 0 33 0 33 2 6 0 8 0 0
Spain, Basque country 238 170 0 0 170 0 62 0 62 0 6 0 6 0 0
Spain, Cantabria * 62 39 0 0 39 2 15 0 17 1 5 0 6 0 0
Spain, Castile and León * 296 230 1 0 231 24 34 0 58 0 7 0 7 0 0
Spain, Castile-La Mancha * 200 160 0 0 160 7 30 0 37 3 3 0 0
Spain, Catalonia † 922 522 2 0 172 696 28 98 1 127 61 37 0 98 0 1
Spain, Extremadura † 116 97 0 0 0 0 97 4 15 0 19 0 0 0 0 0 0
Spain, Galicia † 384 291 1 0 292 14 65 0 79 10 0 3 13 0 0
Spain, Valencian region 659 533 0 0 533 11 100 0 111 5 10 0 15 0 0
Sweden 1028 7 616 623 321 321 63 21 0 84 0 0
The Netherlands 1804 1271 0 0 1271 97 213 0 310 203 20 0 223 0 0
United Kingdom, All countries * † § 6313 4306 10 6 6 120 4448 565 783 19 1367 246 179 73 498 1 0
United Kingdom, England * † 5335 3575 5 2 6 117 3705 468 691 19 1178 215 164 73 452 1 0
United Kingdom, Northern Ireland * † 189 143 0 0 0 3 146 29 3 0 32 9 2 0 11 0 0
United Kingdom, Scotland 476 364 1 0 365 63 27 0 90 13 7 1 21 0 0
United Kingdom, Wales * † ‡ 329 234 4 4 0 0 242 10 63 0 73 9 5 0 14 0 0
Abbreviations used: HD: haemodialysis; Unkn: unknown; HF: haemofiltration; HDF: haemodiafiltration; APD: automated peritoneal dialysis; CAPD: continuous ambulatory peritoneal dialysis; PD: peritoneal dialysis; Tx: transplantCategories may not add up because of rounding offWhen cells are left empty, (complete) data are unavailable* Patients younger than 20 years of age are not reported† The incident counts at day 91 are estimated (see methods)‡ The incidence of RRT is slightly underestimated, for details see the UK Renal Registry Report 2012§ Not all UK centres record whether a patient is on HDF and this is probably an underestimate of HDF usage in the UK

Total Haemodialysis Peritoneal dialysis Transplant Unkn Missing
HD HD HD HF HDF Total APD CAPD PD Total Living Deceased Tx Total hospital/ home type HD/ type PD type Tx centre Unkn HF/HDF Unkn Unkn
Pmp Pmp Pmp Pmp Pmp Pmp Pmp Pmp Pmp Pmp Pmp Pmp Pmp Pmp Pmp Pmp Pmp
29
A3 INCIDENT PATIENTS ACCEPTED FOR RRT IN 2011, AT DAY 91
Table A.3.7Incident rates per million population, unadjustedat day 91, by established therapy
Austria 126.0 99.0 0 0.2 0 10.1 109.3 3.6 8.9 0.4 12.8 2.7 1.1 0 3.8 0 0
Belgium, Dutch-speaking * 164.8 92.3 0 8.8 0.6 42.7 144.4 9.8 7.1 0 16.9 1.1 2.4 0 3.5 0 0
Belgium, French-speaking * 166.3 115.1 1.1 0 2.4 23.2 141.7 10.7 7.1 0 17.8 1.5 3.4 0 4.9 1.9 0
Bosnia and Herzegovina † 107.7 101.5 0 0 0 1.1 102.6 0.8 4.3 0 5.0 0 0 0 0 0 0
Denmark † 104.9 67.3 0.2 0 67.5 17.3 12.9 0 30.1 4.2 2.0 0.5 6.7 0.2 0.3
Finland 82.8 56.0 2.2 0 0 2.2 60.5 11.5 10.6 0 22.1 0.2 0 0 0.2 0 0
France (23 of 26 regions) 137.3 100.3 0 0.2 0.2 13.8 114.4 6.1 9.6 0 15.7 1.3 5.2 0 6.6 0.1 0.5
Greece 182.6 164.1 0 0 0.3 5.2 169.6 5.1 7.3 0 12.5 0.6 0 0 0.6 0 0
Iceland 103.4 59.6 0 0 59.6 31.3 31.3 12.5 0 0 12.5 0 0
Norway 96.3 62.2 0.2 0 62.4 18.6 18.6 6.7 8.7 0 15.3 0 0
Romania 104.5 94.2 0.5 0 0.1 0 94.8 0.4 7.5 0 7.9 1.1 0.5 0.3 1.8 0 0
Serbia 132.3 107.2 0.4 0.1 0 9.0 116.7 0.6 13.2 0 13.8 1.5 0.3 0 1.8 0 0
Spain, Andalusia 107.9 90.2 0 0 90.2 13.6 13.6 4.0 4.0 0 0
Spain, Aragon 115.7 92.7 1.5 0 94.2 4.5 13.4 0 17.8 3.7 0 0 3.7 0 0
Spain, Asturias † 137.2 98.9 0 0 100.2 0 30.2 0 29.9 1.8 5.2 0 7.1 0 0
Spain, Basque country 108.7 77.7 0 0 77.7 0 28.3 0 28.3 0 2.7 0 2.7 0 0
Spain, Cantabria * 104.5 65.7 0 0 65.7 3.4 25.3 0 28.6 1.7 8.4 0 10.1 0 0
Spain, Castile and León * 116.0 90.5 0.4 0 90.5 9.4 13.3 0 22.7 0 2.7 0 2.7 0 0
Spain, Castile-La Mancha * 94.4 75.5 0 0 75.5 3.3 14.2 0 17.5 1.4 1.4 0 0
Spain, Catalonia † 122.2 69.2 0.3 0 22.8 92.3 3.7 13.0 0.1 16.9 8.1 4.9 0 13.0 0 0
Spain, Extremadura † 105.2 87.8 0 0 0 0 87.8 3.6 13.8 0 17.4 0 0 0 0 0 0
Spain, Galicia † 137.7 104.2 0.4 0 104.6 5.1 23.4 0 28.6 3.7 0 1.0 4.5 0 0
Spain, Valencian region 128.8 104.2 0 0 104.2 2.1 19.5 0 21.7 1.0 2.0 0 2.9 0 0
Sweden 108.8 0.7 65.2 65.9 34.0 34.0 6.7 2.2 0 8.9 0 0
The Netherlands 108.1 76.1 0 0 76.1 5.8 12.8 0 18.6 12.2 1.2 0 13.4 0 0
United Kingdom, All countries * † § 100.6 68.6 0.2 0.1 0.1 1.9 70.9 9.0 12.5 0.3 21.8 3.9 2.9 1.2 7.9 0 0
United Kingdom, England * † 101.3 67.9 0.1 0 0.1 2.2 70.3 8.9 13.1 0.4 22.4 4.1 3.1 1.4 8.6 0 0
United Kingdom, Northern Ireland * † 104.5 79.2 0 0 0 2.0 80.7 15.8 1.7 0 17.5 5.2 1.1 0 6.3 0 0
United Kingdom, Scotland 90.6 69.3 0.2 0 69.5 12.0 5.1 0 17.1 2.5 1.3 0.2 4.0 0 0
United Kingdom, Wales * † ‡ 108.9 77.6 1.3 1.3 0 0 80.2 3.3 20.8 0 24.1 2.9 1.8 0 4.6 0 0
Abbreviations used: HD: haemodialysis; Unkn: unknown; HF: haemofiltration; HDF: haemodiafiltration; APD: automated peritoneal dialysis; CAPD: continuous ambulatory peritoneal dialysis; PD: peritoneal dialysis; Tx: transplantCategories may not add up because of rounding offWhen cells are left empty, (complete) data are unavailable* Patients younger than 20 years of age are not reported† The incident counts at day 91, on which the data presented in this table are based, are estimated (see methods)‡ The incidence of RRT is slightly underestimated, for details see the UK Renal Registry Report 2012§ Not all UK centres record whether a patient is on HDF and this is probably an underestimate of HDF usage in the UK
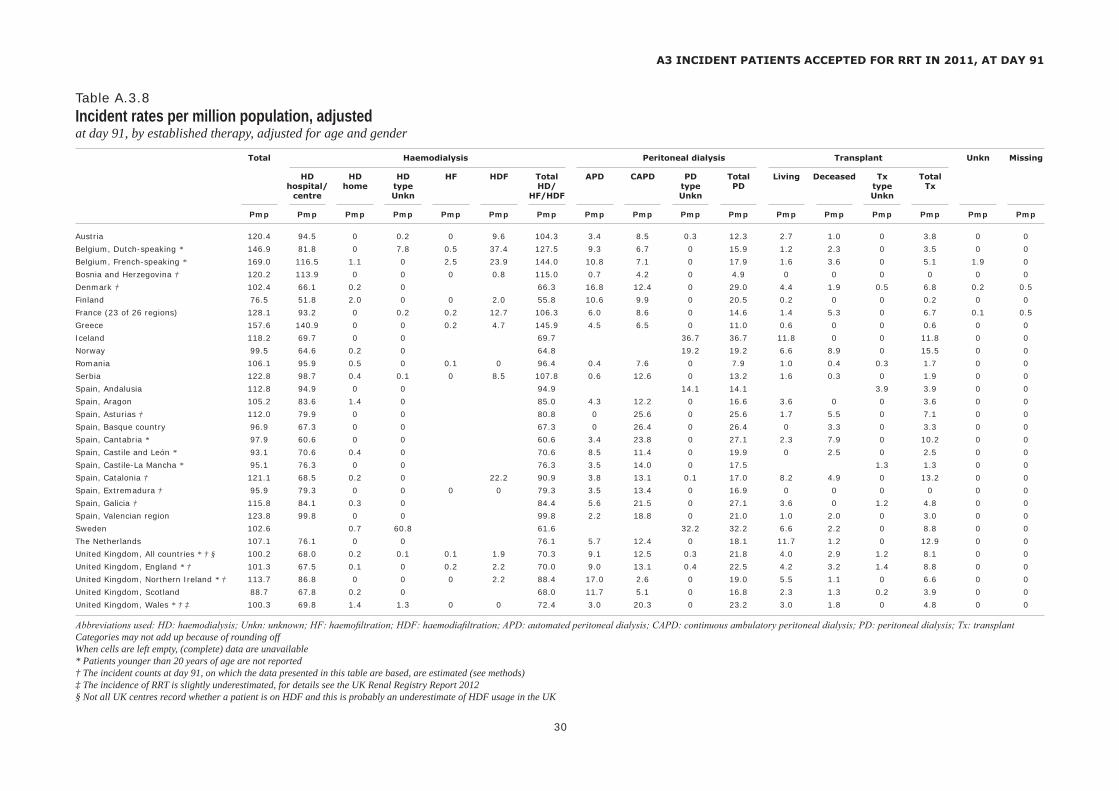
Total Haemodialysis Peritoneal dialysis Transplant Unkn Missing
HD HD HD HF HDF Total APD CAPD PD Total Living Deceased Tx Total hospital/ home type HD/ type PD type Tx centre Unkn HF/HDF Unkn Unkn
Pmp Pmp Pmp Pmp Pmp Pmp Pmp Pmp Pmp Pmp Pmp Pmp Pmp Pmp Pmp Pmp Pmp
30
A3 INCIDENT PATIENTS ACCEPTED FOR RRT IN 2011, AT DAY 91
Table A.3.8Incident rates per million population, adjustedat day 91, by established therapy, adjusted for age and gender
Austria 120.4 94.5 0 0.2 0 9.6 104.3 3.4 8.5 0.3 12.3 2.7 1.0 0 3.8 0 0
Belgium, Dutch-speaking * 146.9 81.8 0 7.8 0.5 37.4 127.5 9.3 6.7 0 15.9 1.2 2.3 0 3.5 0 0
Belgium, French-speaking * 169.0 116.5 1.1 0 2.5 23.9 144.0 10.8 7.1 0 17.9 1.6 3.6 0 5.1 1.9 0
Bosnia and Herzegovina † 120.2 113.9 0 0 0 0.8 115.0 0.7 4.2 0 4.9 0 0 0 0 0 0
Denmark † 102.4 66.1 0.2 0 66.3 16.8 12.4 0 29.0 4.4 1.9 0.5 6.8 0.2 0.5
Finland 76.5 51.8 2.0 0 0 2.0 55.8 10.6 9.9 0 20.5 0.2 0 0 0.2 0 0
France (23 of 26 regions) 128.1 93.2 0 0.2 0.2 12.7 106.3 6.0 8.6 0 14.6 1.4 5.3 0 6.7 0.1 0.5
Greece 157.6 140.9 0 0 0.2 4.7 145.9 4.5 6.5 0 11.0 0.6 0 0 0.6 0 0
Iceland 118.2 69.7 0 0 69.7 36.7 36.7 11.8 0 0 11.8 0 0
Norway 99.5 64.6 0.2 0 64.8 19.2 19.2 6.6 8.9 0 15.5 0 0
Romania 106.1 95.9 0.5 0 0.1 0 96.4 0.4 7.6 0 7.9 1.0 0.4 0.3 1.7 0 0
Serbia 122.8 98.7 0.4 0.1 0 8.5 107.8 0.6 12.6 0 13.2 1.6 0.3 0 1.9 0 0
Spain, Andalusia 112.8 94.9 0 0 94.9 14.1 14.1 3.9 3.9 0 0
Spain, Aragon 105.2 83.6 1.4 0 85.0 4.3 12.2 0 16.6 3.6 0 0 3.6 0 0
Spain, Asturias † 112.0 79.9 0 0 80.8 0 25.6 0 25.6 1.7 5.5 0 7.1 0 0
Spain, Basque country 96.9 67.3 0 0 67.3 0 26.4 0 26.4 0 3.3 0 3.3 0 0
Spain, Cantabria * 97.9 60.6 0 0 60.6 3.4 23.8 0 27.1 2.3 7.9 0 10.2 0 0
Spain, Castile and León * 93.1 70.6 0.4 0 70.6 8.5 11.4 0 19.9 0 2.5 0 2.5 0 0
Spain, Castile-La Mancha * 95.1 76.3 0 0 76.3 3.5 14.0 0 17.5 1.3 1.3 0 0
Spain, Catalonia † 121.1 68.5 0.2 0 22.2 90.9 3.8 13.1 0.1 17.0 8.2 4.9 0 13.2 0 0
Spain, Extremadura † 95.9 79.3 0 0 0 0 79.3 3.5 13.4 0 16.9 0 0 0 0 0 0
Spain, Galicia † 115.8 84.1 0.3 0 84.4 5.6 21.5 0 27.1 3.6 0 1.2 4.8 0 0
Spain, Valencian region 123.8 99.8 0 0 99.8 2.2 18.8 0 21.0 1.0 2.0 0 3.0 0 0
Sweden 102.6 0.7 60.8 61.6 32.2 32.2 6.6 2.2 0 8.8 0 0
The Netherlands 107.1 76.1 0 0 76.1 5.7 12.4 0 18.1 11.7 1.2 0 12.9 0 0
United Kingdom, All countries * † § 100.2 68.0 0.2 0.1 0.1 1.9 70.3 9.1 12.5 0.3 21.8 4.0 2.9 1.2 8.1 0 0
United Kingdom, England * † 101.3 67.5 0.1 0 0.2 2.2 70.0 9.0 13.1 0.4 22.5 4.2 3.2 1.4 8.8 0 0
United Kingdom, Northern Ireland * † 113.7 86.8 0 0 0 2.2 88.4 17.0 2.6 0 19.0 5.5 1.1 0 6.6 0 0
United Kingdom, Scotland 88.7 67.8 0.2 0 68.0 11.7 5.1 0 16.8 2.3 1.3 0.2 3.9 0 0
United Kingdom, Wales * † ‡ 100.3 69.8 1.4 1.3 0 0 72.4 3.0 20.3 0 23.2 3.0 1.8 0 4.8 0 0
Abbreviations used: HD: haemodialysis; Unkn: unknown; HF: haemofiltration; HDF: haemodiafiltration; APD: automated peritoneal dialysis; CAPD: continuous ambulatory peritoneal dialysis; PD: peritoneal dialysis; Tx: transplantCategories may not add up because of rounding offWhen cells are left empty, (complete) data are unavailable* Patients younger than 20 years of age are not reported† The incident counts at day 91, on which the data presented in this table are based, are estimated (see methods)‡ The incidence of RRT is slightly underestimated, for details see the UK Renal Registry Report 2012§ Not all UK centres record whether a patient is on HDF and this is probably an underestimate of HDF usage in the UK

Total Haemodialysis Peritoneal dialysis Transplant Unkn Missing
HD HD HD HF HDF Total APD CAPD PD Total Living Deceased Tx Total hospital/ home type HD/ type PD type Tx centre Unkn HF/HDF Unkn Unkn
% % % % % % % % % % % % % % % % %
31
A3 INCIDENT PATIENTS ACCEPTED FOR RRT IN 2011, AT DAY 91
Table A.3.9Percentages of established therapy, unadjustedat day 91
Austria 100 78.6 0 0.2 0 8.0 86.8 2.8 7.1 0.3 10.2 2.2 0.8 0 3.0 0 0
Belgium, Dutch-speaking * 100 56.0 0 5.4 0.4 25.9 87.6 5.9 4.3 0 10.3 0.7 1.4 0 2.1 0 0
Belgium, French-speaking * 100 69.2 0.6 0 1.4 13.9 85.2 6.4 4.3 0 10.7 0.9 2.1 0 3.0 1.2 0
Bosnia and Herzegovina † 100 94.3 0 0 0 1.1 95.3 0.7 4.0 0 4.7 0 0 0 0 0 0
Denmark † 100 64.2 0.2 0 64.4 16.5 12.3 0 28.7 4.0 1.9 0.5 6.4 0.2 0.3
Finland 100 67.7 2.7 0 0 2.7 73.1 13.9 12.8 0 26.7 0.2 0 0 0.2 0 0
France (23 of 26 regions) 100 73.0 0 0.1 0.1 10.1 83.3 4.4 7.0 0 11.4 1.0 3.8 0 4.8 0.1 0.4
Greece 100 89.8 0 0 0.1 2.9 92.8 2.8 4.0 0 6.8 0.3 0 0 0.3 0 0
Iceland 100 57.6 0 0 57.6 30.3 30.3 12.1 0 0 12.1 0 0
Norway 100 64.6 0.2 0 64.8 19.3 19.3 6.9 9.0 0 15.9 0 0
Romania 100 90.2 0.4 0 0.1 0 90.7 0.4 7.2 0 7.6 1.0 0.4 0.3 1.7 0 0
Serbia 100 81.0 0.3 0.1 0 6.8 88.2 0.4 10.0 0 10.4 1.1 0.2 0 1.4 0 0
Spain, Andalusia 100 83.6 0 0 83.6 12.6 12.6 3.7 3.7 0 0
Spain, Aragon 100 80.1 1.3 0 81.4 3.8 11.5 0 15.4 3.2 0 0 3.2 0 0
Spain, Asturias † 100 72.1 0 0 72.1 0 22.0 0 22.0 1.3 3.8 0 5.2 0 0.7
Spain, Basque country 100 71.4 0 0 71.4 0 26.1 0 26.1 0 2.5 0 2.5 0 0
Spain, Cantabria * 100 62.9 0 0 62.9 3.2 24.2 0 27.4 1.6 8.1 0 9.7 0 0
Spain, Castile and León * 100 78.0 0 0 78.0 8.1 11.5 0 19.6 0 2.4 0 2.4 0 0
Spain, Castile-La Mancha * 100 80.0 0 0 80.0 3.5 15.0 0 18.5 1.5 1.5 0 0
Spain, Catalonia † 100 56.6 0.2 0 18.7 75.5 3.0 10.7 0.1 13.8 6.7 4.0 0 10.7 0 0
Spain, Extremadura † 100 83.4 0 0 0 0 83.4 3.4 13.1 0 16.6 0 0 0 0 0 0
Spain, Galicia † 100 75.7 0.3 0 76.0 3.7 17.0 0 20.7 2.7 0 0.7 3.3 0 0
Spain, Valencian region 100 80.9 0 0 80.9 1.7 15.2 0 16.8 0.8 1.5 0 2.3 0 0
Sweden 100 0.7 59.9 60.6 31.2 31.2 6.1 2.0 0 8.2 0 0
The Netherlands 100 70.5 0 0 70.5 5.4 11.8 0 17.2 11.3 1.1 0 12.4 0 0
United Kingdom, All countries * † § 100 68.2 0.2 0.1 0.1 1.9 70.4 8.9 12.4 0.3 21.6 3.9 2.8 1.2 7.9 0 0
United Kingdom, England * † 100 67.0 0.1 0 0.1 2.2 69.4 8.8 12.9 0.4 22.1 4.0 3.1 1.4 8.5 0 0
United Kingdom, Northern Ireland * † 100 75.5 0 0 0 1.7 77.2 15.2 1.6 0 16.8 4.9 1.1 0 6.0 0 0
United Kingdom, Scotland 100 76.5 0.2 0 76.7 13.2 5.7 0 18.9 2.7 1.5 0.2 4.4 0 0
United Kingdom, Wales * † 100 71.3 1.2 1.2 0 0 73.6 3.0 19.1 0 22.2 2.6 1.6 0 4.3 0 0
Abbreviations used: HD: haemodialysis; Unkn: unknown; HF: haemofiltration; HDF: haemodiafiltration; APD: automated peritoneal dialysis; CAPD: continuous ambulatory peritoneal dialysis; PD: peritoneal dialysis; Tx: transplantCategories may not add up because of rounding offPercentages are row percentagesWhen cells are left empty, (complete) data are unavailable* Patients younger than 20 years of age are not reported† The incident counts at day 91, on which the data presented in this table are based, are estimated (see methods)§ Not all UK centres record whether a patient is on HDF and this is probably an underestimate of HDF usage in the UK
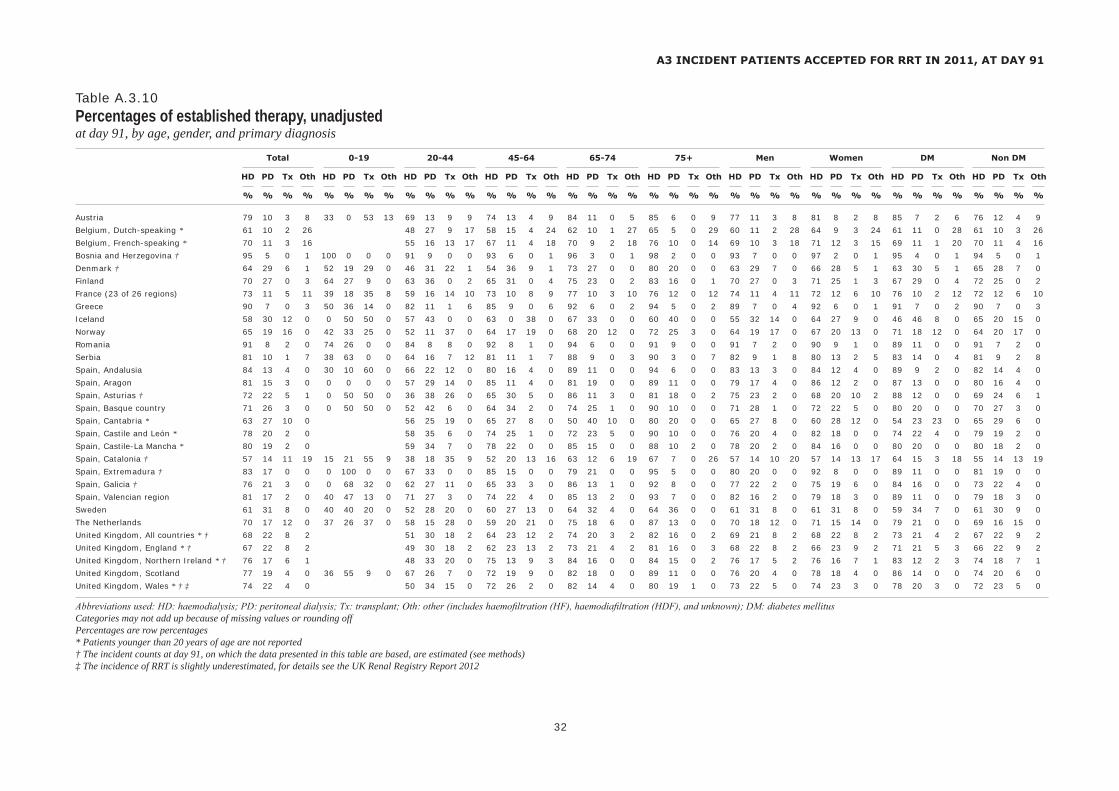
Total 0-19 20-44 45-64 65-74 75+ Men Women DM Non DM
HD PD Tx Oth HD PD Tx Oth HD PD Tx Oth HD PD Tx Oth HD PD Tx Oth HD PD Tx Oth HD PD Tx Oth HD PD Tx Oth HD PD Tx Oth HD PD Tx Oth
% % % % % % % % % % % % % % % % % % % % % % % % % % % % % % % % % % % % % % % %
32
A3 INCIDENT PATIENTS ACCEPTED FOR RRT IN 2011, AT DAY 91
Table A.3.10Percentages of established therapy, unadjustedat day 91, by age, gender, and primary diagnosis
Austria 79 10 3 8 33 0 53 13 69 13 9 9 74 13 4 9 84 11 0 5 85 6 0 9 77 11 3 8 81 8 2 8 85 7 2 6 76 12 4 9
Belgium, Dutch-speaking * 61 10 2 26 48 27 9 17 58 15 4 24 62 10 1 27 65 5 0 29 60 11 2 28 64 9 3 24 61 11 0 28 61 10 3 26
Belgium, French-speaking * 70 11 3 16 55 16 13 17 67 11 4 18 70 9 2 18 76 10 0 14 69 10 3 18 71 12 3 15 69 11 1 20 70 11 4 16
Bosnia and Herzegovina † 95 5 0 1 100 0 0 0 91 9 0 0 93 6 0 1 96 3 0 1 98 2 0 0 93 7 0 0 97 2 0 1 95 4 0 1 94 5 0 1
Denmark † 64 29 6 1 52 19 29 0 46 31 22 1 54 36 9 1 73 27 0 0 80 20 0 0 63 29 7 0 66 28 5 1 63 30 5 1 65 28 7 0
Finland 70 27 0 3 64 27 9 0 63 36 0 2 65 31 0 4 75 23 0 2 83 16 0 1 70 27 0 3 71 25 1 3 67 29 0 4 72 25 0 2
France (23 of 26 regions) 73 11 5 11 39 18 35 8 59 16 14 10 73 10 8 9 77 10 3 10 76 12 0 12 74 11 4 11 72 12 6 10 76 10 2 12 72 12 6 10
Greece 90 7 0 3 50 36 14 0 82 11 1 6 85 9 0 6 92 6 0 2 94 5 0 2 89 7 0 4 92 6 0 1 91 7 0 2 90 7 0 3
Iceland 58 30 12 0 0 50 50 0 57 43 0 0 63 0 38 0 67 33 0 0 60 40 0 0 55 32 14 0 64 27 9 0 46 46 8 0 65 20 15 0
Norway 65 19 16 0 42 33 25 0 52 11 37 0 64 17 19 0 68 20 12 0 72 25 3 0 64 19 17 0 67 20 13 0 71 18 12 0 64 20 17 0
Romania 91 8 2 0 74 26 0 0 84 8 8 0 92 8 1 0 94 6 0 0 91 9 0 0 91 7 2 0 90 9 1 0 89 11 0 0 91 7 2 0
Serbia 81 10 1 7 38 63 0 0 64 16 7 12 81 11 1 7 88 9 0 3 90 3 0 7 82 9 1 8 80 13 2 5 83 14 0 4 81 9 2 8
Spain, Andalusia 84 13 4 0 30 10 60 0 66 22 12 0 80 16 4 0 89 11 0 0 94 6 0 0 83 13 3 0 84 12 4 0 89 9 2 0 82 14 4 0
Spain, Aragon 81 15 3 0 0 0 0 0 57 29 14 0 85 11 4 0 81 19 0 0 89 11 0 0 79 17 4 0 86 12 2 0 87 13 0 0 80 16 4 0
Spain, Asturias † 72 22 5 1 0 50 50 0 36 38 26 0 65 30 5 0 86 11 3 0 81 18 0 2 75 23 2 0 68 20 10 2 88 12 0 0 69 24 6 1
Spain, Basque country 71 26 3 0 0 50 50 0 52 42 6 0 64 34 2 0 74 25 1 0 90 10 0 0 71 28 1 0 72 22 5 0 80 20 0 0 70 27 3 0
Spain, Cantabria * 63 27 10 0 56 25 19 0 65 27 8 0 50 40 10 0 80 20 0 0 65 27 8 0 60 28 12 0 54 23 23 0 65 29 6 0
Spain, Castile and León * 78 20 2 0 58 35 6 0 74 25 1 0 72 23 5 0 90 10 0 0 76 20 4 0 82 18 0 0 74 22 4 0 79 19 2 0
Spain, Castile-La Mancha * 80 19 2 0 59 34 7 0 78 22 0 0 85 15 0 0 88 10 2 0 78 20 2 0 84 16 0 0 80 20 0 0 80 18 2 0
Spain, Catalonia † 57 14 11 19 15 21 55 9 38 18 35 9 52 20 13 16 63 12 6 19 67 7 0 26 57 14 10 20 57 14 13 17 64 15 3 18 55 14 13 19
Spain, Extremadura † 83 17 0 0 0 100 0 0 67 33 0 0 85 15 0 0 79 21 0 0 95 5 0 0 80 20 0 0 92 8 0 0 89 11 0 0 81 19 0 0
Spain, Galicia † 76 21 3 0 0 68 32 0 62 27 11 0 65 33 3 0 86 13 1 0 92 8 0 0 77 22 2 0 75 19 6 0 84 16 0 0 73 22 4 0
Spain, Valencian region 81 17 2 0 40 47 13 0 71 27 3 0 74 22 4 0 85 13 2 0 93 7 0 0 82 16 2 0 79 18 3 0 89 11 0 0 79 18 3 0
Sweden 61 31 8 0 40 40 20 0 52 28 20 0 60 27 13 0 64 32 4 0 64 36 0 0 61 31 8 0 61 31 8 0 59 34 7 0 61 30 9 0
The Netherlands 70 17 12 0 37 26 37 0 58 15 28 0 59 20 21 0 75 18 6 0 87 13 0 0 70 18 12 0 71 15 14 0 79 21 0 0 69 16 15 0
United Kingdom, All countries * † 68 22 8 2 51 30 18 2 64 23 12 2 74 20 3 2 82 16 0 2 69 21 8 2 68 22 8 2 73 21 4 2 67 22 9 2
United Kingdom, England * † 67 22 8 2 49 30 18 2 62 23 13 2 73 21 4 2 81 16 0 3 68 22 8 2 66 23 9 2 71 21 5 3 66 22 9 2
United Kingdom, Northern Ireland * † 76 17 6 1 48 33 20 0 75 13 9 3 84 16 0 0 84 15 0 2 76 17 5 2 76 16 7 1 83 12 2 3 74 18 7 1
United Kingdom, Scotland 77 19 4 0 36 55 9 0 67 26 7 0 72 19 9 0 82 18 0 0 89 11 0 0 76 20 4 0 78 18 4 0 86 14 0 0 74 20 6 0
United Kingdom, Wales * † ‡ 74 22 4 0 50 34 15 0 72 26 2 0 82 14 4 0 80 19 1 0 73 22 5 0 74 23 3 0 78 20 3 0 72 23 5 0
Abbreviations used: HD: haemodialysis; PD: peritoneal dialysis; Tx: transplant; Oth: other (includes haemofiltration (HF), haemodiafiltration (HDF), and unknown); DM: diabetes mellitusCategories may not add up because of missing values or rounding offPercentages are row percentages* Patients younger than 20 years of age are not reported† The incident counts at day 91, on which the data presented in this table are based, are estimated (see methods)‡ The incidence of RRT is slightly underestimated, for details see the UK Renal Registry Report 2012

All 0-19 20-44 45-64 65-74 75+
All Men Women All Men Women All Men Women All Men Women All Men Women All Men Women
N (100%) N (100%) N (100%) N % N % N % N % N % N % N % N % N % N % N % N % N % N % N %
33
A4 PREVALENT PATIENTS ON RRT IN 2011
Table A.4.1Prevalent counts and percentagesprevalent patients on December 31, by age and gender
Austria 8436 5219 3217 103 1 62 1 41 1 1294 15 765 15 529 16 3553 42 2278 44 1275 40 2077 25 1319 25 758 24 1409 17 795 15 614 19
Belgium, Dutch-speaking * 7496 4436 3060 851 11 505 11 346 11 2561 34 1558 35 1003 33 1725 23 1047 24 678 22 2359 31 1326 30 1033 34
Belgium, French-speaking * 5929 3622 2307 818 14 511 14 307 13 2239 38 1370 38 869 38 1306 22 798 22 508 22 1566 26 943 26 623 27
Bosnia and Herzegovina 2473 1415 1058 22 1 13 1 9 1 431 17 271 19 160 15 1122 45 664 47 458 43 571 23 296 21 275 26 327 13 171 12 156 15
Denmark 4786 2940 1846 87 2 50 2 37 2 970 20 573 19 397 22 1986 41 1228 42 758 41 1036 22 643 22 393 21 707 15 446 15 261 14
Finland 4325 2722 1603 121 3 66 2 55 3 673 16 423 16 250 16 1958 45 1234 45 724 45 1013 23 649 24 364 23 560 13 350 13 210 13
France (23 of 26 regions) 54571 32865 21706 541 1 309 1 232 1 8160 15 4966 15 3194 15 20819 38 12756 39 8063 37 11214 21 6786 21 4428 20 13837 25 8048 24 5789 27
Greece 12465 7923 4542 109 1 61 1 48 1 1696 14 1109 14 587 13 4265 34 2816 36 1448 32 3064 25 1942 25 1123 25 3331 27 1995 25 1336 29
Iceland 212 123 89 7 3 4 3 3 3 55 26 29 24 26 29 79 37 48 39 31 35 42 20 23 19 19 21 29 14 19 15 10 11
Norway 4329 2853 1476 84 2 53 2 31 2 831 19 524 18 307 21 1784 41 1179 41 605 41 951 22 626 22 325 22 679 16 471 17 208 14
Romania || 13346 7475 5871 123 1 62 1 61 1 2775 21 1656 22 1119 19 5883 44 3370 45 2513 43 2871 22 1535 21 1336 23 1694 13 852 11 842 14
Serbia 5275 3134 2141 35 1 12 0 23 1 1048 20 640 20 408 19 2604 49 1553 50 1051 49 1075 20 619 20 456 21 513 10 310 10 203 9
Spain, Andalusia 8641 5194 3447 91 1 53 1 38 1 1628 19 1015 20 613 18 3470 40 2179 42 1291 37 1899 22 1126 22 773 22 1553 18 821 16 732 21
Spain, Aragon 1400 884 516 8 1 4 0 4 1 211 15 124 14 87 17 565 40 376 43 189 37 296 21 190 21 106 21 320 23 190 21 130 25
Spain, Asturias 1122 707 415 7 1 4 1 3 1 172 15 102 14 70 17 447 40 298 42 149 36 233 21 139 20 94 23 263 23 164 23 99 24
Spain, Basque country 2414 1511 903 32 1 20 1 12 1 380 16 221 15 159 18 964 40 613 41 351 39 575 24 364 24 211 23 463 19 293 19 170 19
Spain, Cantabria * 563 379 184 92 16 57 15 35 19 238 42 162 43 76 41 127 23 88 23 39 21 106 19 72 19 34 18
Spain, Castile and León * 2625 1710 915 358 14 232 14 126 14 1033 39 691 40 342 37 527 20 346 20 181 20 707 27 441 26 266 29
Spain, Castile-La Mancha * 2088 1268 820 341 16 210 17 131 16 799 38 511 40 288 35 488 23 295 23 193 24 460 22 252 20 208 25
Spain, Catalonia 9067 5647 3420 99 1 55 1 44 1 1411 16 879 16 532 16 3401 38 2176 39 1225 36 2041 23 1293 23 748 22 2115 23 1244 22 871 25
Spain, Extremadura 1136 687 449 7 1 5 1 2 0 196 17 129 19 67 15 473 42 304 44 169 38 217 19 129 19 88 20 243 21 120 17 123 27
Spain, Galicia 3286 2048 1238 19 1 9 0 10 1 521 16 321 16 200 16 1254 38 793 39 461 37 765 23 492 24 273 22 727 22 433 21 294 24
Spain, Valencian region 5885 3644 2241 71 1 51 1 20 1 880 15 543 15 337 15 2224 38 1399 38 825 37 1372 23 872 24 500 22 1338 23 779 21 559 25
Sweden 8787 5613 3174 154 2 87 2 67 2 1440 16 884 16 556 18 3641 41 2311 41 1330 42 2119 24 1389 25 730 23 1433 16 942 17 491 15
The Netherlands 16049 9642 6407 250 2 146 2 104 2 2738 17 1643 17 1095 17 6529 41 3947 41 2582 40 3686 23 2208 23 1478 23 2846 18 1698 18 1148 18
United Kingdom, All countries * 53820 32748 21072 12030 22 7158 22 4872 23 22683 42 13770 42 8913 42 10623 20 6439 20 4184 20 8484 16 5381 16 3103 15
United Kingdom, England * 45246 27556 17690 10106 22 6014 22 4092 23 19042 42 11550 42 7492 42 8962 20 5409 20 3553 20 7136 16 4583 17 2553 14
United Kingdom, Northern Ireland * 1539 937 602 340 22 207 22 133 22 603 39 375 40 228 38 326 21 199 21 127 21 270 18 156 17 114 19
United Kingdom, Scotland 4421 2596 1825 85 2 53 2 32 2 1035 23 591 23 444 24 1923 43 1158 45 765 42 783 18 462 18 321 18 595 13 332 13 263 14
United Kingdom, Wales * 2699 1712 987 549 20 346 20 203 21 1115 41 687 40 428 43 552 20 369 22 183 19 483 18 310 18 173 18
Categories may not add up because of missing values or rounding offPercentages are row percentages* Patients younger than 20 years of age are not reported|| The overall prevalence of RRT is underestimated by approximately 3% due to an estimated 30% underreporting of patients living on a functioning graft

All Men Women
% Mean SD Median % Mean SD Median % Mean SD Median (years) (years) (years) (years) (years) (years)
34
A4 PREVALENT PATIENTS ON RRT IN 2011
Table A.4.2Gender, mean age, and median ageprevalent patients on December 31
Austria 100 60.0 15.5 61.7 61.9 59.8 15.1 61.7 38.1 60.2 16.1 61.8
Belgium, Dutch-speaking * 100 65.1 15.3 66.7 59.2 64.7 15.1 66.3 40.8 65.5 15.5 67.6
Belgium, French-speaking * 100 63.3 15.7 64.4 61.1 63.1 15.5 64.4 38.9 63.6 15.9 64.6
Bosnia and Herzegovina 100 58.4 15.1 59.9 57.2 57.3 15.1 58.8 42.8 59.8 14.9 61.9
Denmark 100 57.7 16.5 59.5 61.4 58.1 16.4 59.9 38.6 57.2 16.5 58.9
Finland 100 58.0 16.0 60.4 62.9 58.3 15.8 60.8 37.1 57.5 16.4 59.4
France (23 of 26 regions) 100 62.1 16.6 63.4 60.2 61.8 16.4 63.1 39.8 62.4 16.7 63.8
Greece 100 63.1 15.9 65.6 63.6 62.6 15.7 64.9 36.4 64.0 16.2 66.6
Iceland 100 55.0 18.5 57.6 58.0 56.0 18.4 59.5 42.0 53.6 18.6 55.0
Norway 100 58.3 16.2 60.4 65.9 58.8 16.2 60.8 34.1 57.4 16.2 59.1
Romania || 100 57.8 15.1 59.4 56.0 57.1 15.0 58.7 44.0 58.7 15.2 60.4
Serbia 100 57.0 14.3 58.8 59.4 57.0 14.2 58.7 40.6 57.1 14.5 59.0
Spain, Andalusia 100 59.1 15.9 60.8 60.1 58.3 15.7 59.7 39.9 60.2 16.2 62.3
Spain, Aragon 100 61.3 15.3 62.6 63.1 61.3 14.9 62.5 36.9 61.3 16.1 62.8
Spain, Asturias 100 61.4 15.3 62.3 63.0 61.3 15.1 61.8 37.0 61.6 15.7 62.9
Spain, Basque country 100 60.3 15.7 62.3 62.6 60.6 15.4 62.7 37.4 59.7 16.2 61.8
Spain, Cantabria * 100 60.3 14.5 61.4 67.3 60.7 14.3 62.4 32.7 59.4 15.0 60.5
Spain, Castile and León * 100 62.8 15.1 63.8 65.1 62.5 15.0 63.4 34.9 63.3 15.3 64.5
Spain, Castile-La Mancha * 100 61.4 15.1 62.9 60.7 60.7 15.0 61.4 39.3 62.5 15.3 64.5
Spain, Catalonia 100 61.5 16.0 63.2 62.3 61.3 15.8 62.8 37.7 61.8 16.3 63.9
Spain, Extremadura 100 60.1 15.7 60.9 60.5 59.0 15.4 59.6 39.5 61.7 16.0 63.5
Spain, Galicia 100 61.3 15.3 63.1 62.3 61.3 14.9 63.2 37.7 61.4 15.9 62.9
Spain, Valencian region 100 61.5 16.1 63.5 61.9 61.1 16.1 63.3 38.1 62.2 16.1 63.9
Sweden 100 59.2 16.1 61.3 63.9 59.7 15.9 61.8 36.1 58.5 16.4 60.3
The Netherlands 100 59.4 16.1 61.4 60.1 59.5 16.0 61.5 39.9 59.4 16.3 61.3
United Kingdom, All countries * 100 57.8 15.8 58.3 60.8 58.1 15.8 58.6 39.2 57.3 15.7 57.8
United Kingdom, England * 100 57.8 15.8 58.3 60.9 58.1 15.9 58.6 39.1 57.3 15.6 57.9
United Kingdom, Northern Ireland * 100 58.4 16.1 59.2 60.9 58.4 15.7 59.0 39.1 58.5 16.7 59.5
United Kingdom, Scotland 100 55.9 16.3 56.5 58.7 56.0 16.2 56.9 41.3 55.8 16.5 55.4
United Kingdom, Wales * 100 59.0 15.9 60.5 63.4 59.3 15.9 60.7 36.6 58.5 15.8 59.9
Categories may not add up because of missing values or rounding offPercentages are row percentages* Patients younger than 20 years of age are not reported|| The overall prevalence of RRT is underestimated by approximately 3% due to an estimated 30% underreporting of patients living on a functioning graft

All 0-19 20-44 45-64 65-74 75+
All Men Women All Men Women All Men Women All Men Women All Men Women All Men Women
Pmp Pmp Pmp Pmarp Pmarp Pmarp Pmarp Pmarp Pmarp Pmarp Pmarp Pmarp Pmarp Pmarp Pmarp Pmarp Pmarp Pmarp
35
A4 PREVALENT PATIENTS ON RRT IN 2011
Table A.4.3Prevalence per million (age-related) population, unadjustedprevalent patients on December 31, by age and gender
Austria 1001.5 1270.9 745.2 59.8 70.2 48.9 448.5 528.3 368.1 1527.0 1975.3 1086.5 2556.4 3500.5 1739.9 2081.1 3238.8 1422.6
Belgium, Dutch-speaking * 1184.4 1419.8 955.0 421.1 494.8 345.9 1459.0 1759.4 1153.2 2945.6 3732.2 2222.2 4060.6 5776.6 2939.6
Belgium, French-speaking * 1271.0 1597.3 962.3 513.3 639.4 386.4 1844.5 2290.0 1411.6 3666.6 4917.8 2619.6 4111.6 6953.6 2540.2
Bosnia and Herzegovina 705.0 823.0 591.5 25.1 29.7 20.6 344.4 429.0 258.2 1259.4 1523.0 1006.8 1605.3 1880.2 1387.0 2429.7 3069.5 1977.8
Denmark 850.5 1053.1 651.0 63.7 71.5 55.6 539.3 631.7 445.4 1316.7 1622.3 1008.9 1851.8 2373.1 1362.2 1787.6 2838.8 1094.8
Finland 802.7 1028.9 584.4 99.3 106.1 92.3 401.1 492.4 305.4 1278.1 1618.3 940.9 1945.5 2671.1 1310.6 1273.8 2205.2 747.5
France (23 of 26 regions) 1085.5 1343.6 840.9 44.6 49.7 39.3 513.5 620.9 404.7 1550.3 1943.8 1174.2 2676.3 3451.6 1990.9 2978.5 4670.4 1980.9
Greece 1103.1 1416.2 796.0 49.9 54.2 45.3 430.4 545.2 308.0 1432.8 1923.7 957.6 2755.7 3852.0 1846.2 3059.6 4269.1 2150.0
Iceland 664.5 767.9 560.4 78.1 87.3 68.5 493.4 511.8 474.4 1011.0 1219.9 799.1 2004.6 2232.1 1784.4 1543.0 2365.2 929.2
Norway 874.0 1150.5 596.8 67.4 82.8 51.1 491.5 606.3 371.4 1415.7 1835.3 979.4 2357.5 3194.0 1567.1 1930.4 3434.1 969.3
Romania || 624.1 718.1 534.9 28.0 27.5 28.5 325.3 380.8 267.6 1118.2 1339.5 915.5 1616.5 2038.9 1305.7 1193.0 1593.3 951.2
Serbia 726.7 887.6 574.3 23.2 15.5 31.4 427.6 517.1 336.3 1252.1 1544.9 978.3 1620.2 2122.6 1226.2 917.5 1391.4 603.6
Spain, Andalusia 1024.2 1244.1 808.8 49.4 55.9 42.5 505.2 618.0 388.0 1668.0 2115.4 1229.2 2868.5 3651.4 2185.8 2465.8 3336.8 1907.4
Spain, Aragon 1038.7 1316.3 763.0 32.6 31.7 33.6 437.1 492.5 376.8 1612.6 2122.0 1091.4 2521.1 3421.3 1713.1 2101.0 3110.3 1425.0
Spain, Asturias 1037.5 1363.4 737.2 45.4 50.6 39.9 467.6 547.4 385.6 1408.0 1930.8 913.4 2216.0 2897.6 1644.1 1923.8 3224.5 1153.1
Spain, Basque country 1102.9 1413.9 806.1 83.5 101.4 64.4 500.2 568.3 428.8 1567.8 2029.1 1122.3 2805.1 3822.0 1922.7 2049.0 3437.0 1208.1
Spain, Cantabria * 948.6 1307.2 606.1 431.6 526.7 333.4 1440.6 1977.0 912.7 2558.0 3811.0 1468.5 1701.3 3069.4 875.2
Spain, Castile and León * 1028.5 1352.4 710.5 418.4 525.9 304.0 1481.8 1936.5 1005.0 2131.7 2932.0 1400.8 2093.6 3260.7 1313.9
Spain, Castile-La Mancha * 985.5 1187.1 780.6 425.0 500.7 342.1 1583.4 1972.5 1172.9 2992.9 3849.9 2233.2 2193.7 2890.7 1697.8
Spain, Catalonia 1202.6 1513.1 898.2 65.6 70.6 60.2 488.0 588.9 380.4 1815.2 2350.0 1292.6 3353.3 4551.8 2304.5 3220.1 4958.2 2145.8
Spain, Extremadura 1024.6 1247.7 804.4 31.7 44.1 18.6 501.0 643.5 351.3 1667.7 2089.8 1223.2 2266.8 2875.7 1729.9 2071.8 2584.4 1735.9
Spain, Galicia 1178.4 1521.0 858.5 43.3 39.8 47.0 537.2 657.1 415.5 1679.1 2161.3 1213.4 2651.5 3685.0 1761.3 2112.4 3295.4 1381.8
Spain, Valencian region 1150.0 1433.6 870.2 70.2 98.0 40.7 455.0 544.1 359.9 1717.8 2186.9 1259.6 3007.7 4043.2 2079.0 3178.7 4633.5 2211.2
Sweden 929.9 1192.1 669.5 70.6 77.7 63.2 465.7 560.1 367.2 1507.2 1898.9 1109.5 2210.5 2953.0 1495.2 1786.0 2920.7 1023.3
The Netherlands 961.4 1166.9 760.0 64.0 73.1 54.5 502.9 600.4 404.3 1392.5 1675.1 1107.0 2497.4 3074.4 1950.5 2412.5 3731.2 1584.3
United Kingdom, All countries * 857.7 1059.3 661.9 563.7 664.5 460.9 1412.9 1744.9 1091.9 1912.7 2430.6 1440.4 1699.6 2671.0 1042.3
United Kingdom, England * 859.1 1059.9 663.3 560.8 659.5 459.6 1423.2 1752.6 1103.5 1937.9 2447.1 1471.7 1701.7 2693.3 1024.6
United Kingdom, Northern Ireland * 850.7 1053.2 654.8 545.5 663.8 427.0 1375.5 1739.4 1023.3 2222.9 2872.4 1641.4 2252.3 3360.5 1551.9
United Kingdom, Scotland 841.6 1019.2 674.3 72.4 88.3 55.8 589.9 678.4 502.5 1340.8 1669.1 1033.2 1636.1 2071.2 1256.3 1445.1 2095.0 1038.4
United Kingdom, Wales * 892.8 1156.4 639.8 582.2 734.5 430.1 1390.3 1753.5 1043.4 1814.5 2519.1 1160.1 1810.9 2867.7 1090.7
* Patients younger than 20 years of age are not reported|| The overall prevalence of RRT is underestimated by approximately 3% due to an estimated 30% underreporting of patients living on a functioning graft

Total GN PN PKD DM HT RVD Misc Unkn Missing
Type I Type II Both
Pmp % Pmp % Pmp % Pmp % Pmp % Pmp % Pmp % Pmp % Pmp % Pmp % Pmp % Pmp %
36
A4 PREVALENT PATIENTS ON RRT IN 2011
Table A.4.4Prevalence per million population and percentages, unadjustedprevalent patients on December 31, by cause of renal failure
Austria 1001.5 100 235.1 23.5 76.8 7.7 65.2 6.5 54.7 5.5 156.3 15.6 211.1 21.1 73.2 7.3 66.5 6.6 177.6 17.7 96.0 9.6 0 0
Belgium, Dutch-speaking * 1184.4 100 210.5 17.8 90.4 7.6 113.5 9.6 53.2 4.5 163.5 13.8 216.8 18.3 80.4 6.8 89.7 7.6 276.5 23.3 106.7 9.0 0 0
Belgium, French-speaking * 1271.0 100 226.6 17.8 123.0 9.7 98.4 7.7 38.4 3.0 175.4 13.8 213.7 16.8 178.1 14.0 47.2 3.7 304.6 24.0 79.3 6.2 0 0
Bosnia and Herzegovina 705.0 100 148.8 21.1 123.4 17.5 37.6 5.3 91.2 12.9 24.2 3.4 115.5 16.4 57.6 8.2 9.7 1.4 150.2 21.3 62.1 8.8 0 0
Denmark 850.5 100 170.9 20.1 65.0 7.6 76.1 8.9 83.7 9.8 58.6 6.9 142.3 16.7 82.5 9.7 3.2 0.4 154.1 18.1 156.4 18.4 0 0
Finland 802.7 100 170.6 21.2 74.4 9.3 97.2 12.1 131.6 16.4 77.0 9.6 208.6 26.0 26.7 3.3 4.5 0.6 145.1 18.1 75.5 9.4 0 0
France (23 of 26 regions) 1085.5 100 223.9 20.6 74.1 6.8 108.2 10.0 157.4 14.5 159.9 14.7 12.0 1.1 199.4 18.4 122.8 11.3 27.8 2.6
Greece 1103.1 100 203.7 18.5 75.4 6.8 86.0 7.8 21.6 2.0 184.7 16.7 206.3 18.7 107.7 9.8 19.4 1.8 97.7 8.9 306.9 27.8 0 0
Iceland 664.5 100 166.1 25.0 65.8 9.9 43.9 6.6 47.0 7.1 34.5 5.2 81.5 12.3 100.3 15.1 15.7 2.4 150.5 22.6 40.8 6.1 0 0
Norway 874.0 100 257.4 29.5 76.9 8.8 93.7 10.7 108.8 12.4 147.4 16.9 7.5 0.9 160.7 18.4 21.6 2.5 0 0
Romania || 624.1 100 146.2 23.4 80.9 13.0 39.7 6.4 62.8 10.1 32.7 5.2 4.7 0.7 73.7 11.8 183.3 29.4 0 0
Serbia 726.7 100 153.6 21.1 85.0 11.7 51.7 7.1 95.1 13.1 170.3 23.4 7.9 1.1 120.5 16.6 42.7 5.9 0 0
Spain, Andalusia 1024.2 100 217.0 21.2 117.3 11.5 99.0 9.7 141.9 13.8 83.7 8.2 30.8 3.0 125.9 12.3 208.6 20.4 0 0
Spain, Aragon 1038.7 100 187.0 18.0 68.3 6.6 88.3 8.5 71.2 6.9 96.4 9.3 167.7 16.1 89.0 8.6 34.9 3.4 139.5 13.4 264.1 25.4 0 0
Spain, Asturias 1037.5 100 195.1 18.8 77.7 7.5 121.1 11.7 54.6 5.3 94.3 9.1 148.9 14.3 131.3 12.7 18.5 1.8 156.3 15.1 188.6 18.2 0 0
Spain, Basque country 1102.9 100 263.6 23.9 126.1 11.4 119.7 10.9 41.6 3.8 67.6 6.1 109.2 9.9 106.0 9.6 47.5 4.3 164.5 14.9 164.5 14.9 1.8 0.2
Spain, Cantabria * 948.6 100 298.2 31.4 70.8 7.5 92.7 9.8 45.5 4.8 77.5 8.2 123.0 13.0 102.8 10.8 96.0 10.1 117.9 12.4 47.2 5.0 0 0
Spain, Castile and León * 1028.5 100 176.7 17.2 61.1 5.9 79.1 7.7 70.1 6.8 95.2 9.3 165.3 16.1 115.6 11.2 14.1 1.4 116.4 11.3 300.1 29.2 0 0
Spain, Castile-La Mancha * 985.5 100 203.0 20.6 120.8 12.3 105.3 10.7 150.1 15.2 57.1 5.8 9.0 0.9 104.8 10.6 231.3 23.5 4.2 0.4
Spain, Catalonia 1202.6 100 252.3 21.0 132.4 11.0 122.3 10.2 32.6 2.7 126.3 10.5 160.2 13.3 110.0 9.1 37.4 3.1 127.2 10.6 260.9 21.7 0 0
Spain, Extremadura 1024.6 100 221.0 21.6 78.5 7.7 98.3 9.6 148.8 14.5 53.2 5.2 13.5 1.3 117.2 11.4 294.0 28.7 0 0
Spain, Galicia 1178.4 100 213.0 18.1 88.6 7.5 121.6 10.3 45.5 3.9 144.5 12.3 190.1 16.1 94.7 8.0 32.6 2.8 166.8 14.2 271.1 23.0 0 0
Spain, Valencian region 1150.0 100 230.2 20.0 121.6 10.6 100.4 8.7 134.3 11.7 150.9 13.1 43.6 3.8 130.1 11.3 239.0 20.8 0 0
Sweden 929.9 100 237.4 25.5 56.4 6.1 91.6 9.9 170.8 18.4 74.9 8.1 35.3 3.8 176.9 19.0 86.5 9.3 0 0
The Netherlands 961.4 100 161.3 16.8 77.2 8.0 77.4 8.1 36.9 3.8 69.1 7.2 106.0 11.0 98.3 10.2 60.7 6.3 164.0 17.1 102.1 10.6 114.4 11.9
United Kingdom, All countries * 857.7 100 159.7 18.6 95.2 11.1 79.3 9.3 127.6 14.9 49.1 5.7 19.2 2.2 140.1 16.3 151.1 17.6 36.3 4.2
United Kingdom, England * 859.1 100 153.9 17.9 91.1 10.6 76.7 8.9 127.7 14.9 52.1 6.1 17.9 2.1 141.5 16.5 155.4 18.1 42.8 5.0
United Kingdom, Northern Ireland * 850.7 100 164.7 19.4 126.6 14.9 103.4 12.2 130.5 15.3 26.5 3.1 21.6 2.5 171.9 20.2 104.5 12.3 1.1 0.1
United Kingdom, Scotland 841.6 100 186.5 22.2 125.4 14.9 95.6 11.4 117.1 13.9 33.7 4.0 24.2 2.9 140.1 16.6 118.2 14.0 0.8 0.1
United Kingdom, Wales * 892.8 100 212.7 23.7 99.6 11.2 81.7 9.2 143.6 16.1 38.0 4.3 31.8 3.6 115.4 12.9 164.1 18.4 6.0 0.7
Abbreviations used: GN: glomerulonephritis/sclerosis; PN: pyelonephritis; PKD: polycystic kidneys, adult type; DM: diabetes mellitus; HT: hypertension; RVD: renal vascular disease; Misc: miscellaneous; Unkn: unknownCategories may not add up because of rounding off or a limited number of cases (<10%) with diabetes mellitus type unknownPercentages are row percentagesWhen cells are left empty, (complete) data are unavailable* Patients younger than 20 years of age are not reported|| The overall prevalence of RRT is underestimated by approximately 3% due to an estimated 30% underreporting of patients living on a functioning graft

Total GN PN PKD DM HT RVD Misc Unkn Missing
Type I Type II Both
Pmp Pmp Pmp Pmp Pmp Pmp Pmp Pmp Pmp Pmp Pmp Pmp
37
A4 PREVALENT PATIENTS ON RRT IN 2011
Table A.4.5Prevalence per million population, adjustedprevalent patients on December 31, by cause of renal failure, adjusted for age and gender
Austria 955.3 224.0 74.3 61.8 51.9 148.3 200.2 69.4 62.8 171.6 91.3 0
Belgium, Dutch-speaking * 1080.1 196.0 84.5 105.1 49.9 145.3 195.2 69.4 75.8 256.6 97.6 0
Belgium, French-speaking * 1291.9 230.8 125.6 102.6 39.2 179.8 218.9 176.4 47.2 309.3 81.1 0
Bosnia and Herzegovina 770.2 155.2 135.9 38.7 97.7 25.7 123.4 64.1 10.6 175.8 66.6 0
Denmark 834.3 169.4 65.4 71.5 81.2 55.9 137.2 80.1 3.3 153.8 153.7 0
Finland 757.3 161.2 71.2 86.1 129.4 68.6 198.1 24.5 4.1 141.1 71.0 0
France (23 of 26 regions) 1046.5 222.5 74.3 104.4 150.0 141.6 10.9 198.5 116.8 27.6
Greece 988.7 190.5 69.2 79.1 20.9 159.6 180.5 92.1 16.8 91.1 269.5 0
Iceland 743.7 182.6 74.5 51.5 50.7 43.8 94.5 113.9 19.9 156.3 50.5 0
Norway 900.9 263.4 79.3 97.3 111.8 153.7 7.8 165.4 22.1 0
Romania || 633.0 146.2 81.8 39.8 63.8 34.2 4.9 75.1 187.1 0
Serbia 682.1 148.9 80.2 46.6 89.2 156.1 7.2 113.4 40.5 0
Spain, Andalusia 1060.8 220.8 120.5 105.0 150.4 88.1 32.5 128.2 215.4 0
Spain, Aragon 951.8 173.7 63.0 83.2 66.6 86.4 153.0 74.3 28.5 130.9 245.2 0
Spain, Asturias 874.9 167.5 70.2 101.6 48.9 78.9 127.7 100.4 14.2 138.7 154.4 0
Spain, Basque country 996.9 241.2 116.2 106.6 37.8 58.9 96.7 92.1 40.8 155.6 145.9 1.6
Spain, Cantabria * 874.8 274.1 65.7 87.4 42.9 73.0 115.9 90.9 85.2 112.6 43.1 0
Spain, Castile and León * 862.8 155.7 53.3 70.2 61.8 73.7 135.5 85.1 9.9 100.4 252.7 0
Spain, Castile-La Mancha * 990.8 208.5 118.2 112.9 152.4 56.3 7.9 105.1 225.4 4.2
Spain, Catalonia 1189.8 250.9 129.5 124.5 32.0 127.2 160.6 107.1 36.4 126.3 254.5 0
Spain, Extremadura 967.2 211.2 75.5 95.7 136.4 47.8 11.7 113.6 275.2 0
Spain, Galicia 1015.5 193.9 78.1 107.1 42.8 116.3 159.1 75.5 24.6 152.1 225.0 0
Spain, Valencian region 1112.5 224.8 118.1 99.8 130.0 143.0 41.2 126.7 228.9 0
Sweden 891.3 230.9 55.1 86.2 164.0 67.0 31.8 174.1 82.2 0
The Netherlands 946.7 156.7 76.7 74.3 35.7 67.9 103.6 97.1 61.0 163.3 102.2 111.8
United Kingdom, All countries * 863.2 161.8 96.5 79.7 128.7 48.9 18.4 142.1 150.8 36.4
United Kingdom, England * 866.9 156.2 92.3 77.7 129.3 52.0 17.2 143.7 155.6 43.0
United Kingdom, Northern Ireland * 919.6 177.5 136.1 111.0 140.9 29.1 24.0 187.4 112.5 1.1
United Kingdom, Scotland 830.1 185.2 125.4 91.1 115.4 32.3 23.4 140.2 116.3 0.8
United Kingdom, Wales * 863.1 208.7 102.7 77.5 137.9 35.8 26.6 113.4 154.7 5.8
Abbreviations used: GN: glomerulonephritis/sclerosis; PN: pyelonephritis; PKD: polycystic kidneys, adult type; DM: diabetes mellitus; HT: hypertension; RVD: renal vascular disease; Misc: miscellaneous; Unkn: unknownCategories may not add up because of rounding off or a limited number of cases (<10%) with diabetes mellitus type unknownWhen cells are left empty, (complete) data are unavailable* Patients younger than 20 years of age are not reported|| The overall prevalence of RRT is underestimated by approximately 3% due to an estimated 30% underreporting of patients living on a functioning graft

Total Haemodialysis Peritoneal dialysis Transplant Unkn Missing
HD HD HD HF HDF Total APD CAPD PD Total Living Deceased Tx Total hospital/ home type HD/ type PD type Tx centre Unkn HF/HDF Unkn Unkn
N N N N N N N N N N N N N N N N N
38
A4 PREVALENT PATIENTS ON RRT IN 2011
Table A.4.6Prevalent countsprevalent patients on December 31, by established therapy
Austria 8436 2949 3 1 1 912 3866 145 208 3 356 570 3643 1 4214 0 0
Belgium, Dutch-speaking * 7496 2109 5 297 7 1576 3994 258 134 2 394 141 2593 374 3108 0 0
Belgium, French-speaking * 5929 2510 56 0 25 555 3146 182 104 0 286 146 1888 443 2477 20 0
Bosnia and Herzegovina 2473 2068 0 0 7 142 2217 2 90 0 92 123 37 3 163 1 0
Denmark 4786 1899 119 0 2018 315 188 0 503 777 1445 21 2243 22 0
Finland 4325 1104 74 0 0 265 1443 190 139 0 329 181 2368 4 2553 0 0
France (23 of 26 regions) 54571 23414 194 51 57 5058 28774 926 1246 0 2172 1253 21507 476 23236 309 80
Greece 12465 7211 1 0 8 2032 9252 425 296 0 721 1067 1425 0 2492 0 0
Iceland 212 65 0 0 65 16 16 93 38 0 131 0 0
Norway 4329 1022 7 0 1029 186 186 1346 1762 6 3114 0 0
Romania || 13346 10795 10 2 5 20 10832 39 1466 0 1505 176 156 673 1005 4 0
Serbia 5275 3330 33 2 0 754 4119 14 399 1 414 501 237 0 738 4 0
Spain, Andalusia 8641 3963 6 0 3969 371 371 4300 4300 1 0
Spain, Aragon 1400 565 4 0 569 19 35 0 54 31 746 0 777 0 0
Spain, Asturias 1122 419 0 0 419 9 59 0 68 18 617 0 635 0 0
Spain, Basque country 2414 796 1 0 797 0 205 0 205 0 1412 0 1412 0 0
Spain, Cantabria * 563 191 1 0 192 10 34 0 44 13 311 0 324 3 0
Spain, Castile and León * 2625 1084 5 0 1089 82 96 0 178 0 1333 0 1333 25 0
Spain, Castile-La Mancha * 2088 853 3 0 856 23 83 0 106 1116 1116 10 0
Spain, Catalonia 9067 2697 3 0 1214 3914 143 211 1 355 637 4161 0 4798 0 0
Spain, Extremadura 1136 554 3 0 0 3 560 21 44 0 65 5 141 365 511 0 0
Spain, Galicia 3286 1473 8 0 1481 98 185 0 283 89 1395 38 1522 0 0
Spain, Valencian region 5885 3213 8 0 3221 53 240 0 293 26 1421 924 2371 0 0
Sweden 8787 115 2939 3054 823 823 2083 2827 0 4910 0 0
The Netherlands 16049 5228 175 0 5403 523 488 0 1011 3751 5876 8 9635 0 0
United Kingdom, All countries * ‡ § 53820 21697 819 138 22 877 23553 1828 2027 52 3907 5365 15921 5053 26339 21 0
United Kingdom, England * ‡ 45246 18154 700 100 21 837 19812 1519 1796 45 3360 4491 12871 4692 22054 20 0
United Kingdom, Northern Ireland * ‡ 1539 678 0 31 1 36 746 67 10 5 82 114 270 327 711 0 0
United Kingdom, Scotland 4421 1839 56 0 1895 203 61 0 264 584 1651 27 2262 0 0
United Kingdom, Wales * ‡ 2699 1036 63 7 0 4 1110 52 160 2 214 205 1161 8 1374 1 0
Abbreviations used: HD: haemodialysis; Unkn: unknown; HF: haemofiltration; HDF: haemodiafiltration; APD: automated peritoneal dialysis; CAPD: continuous ambulatory peritoneal dialysis; PD: peritoneal dialysis; Tx: transplantWhen cells are left empty, (complete) data are unavailable* Patients younger than 20 years of age are not reported|| The overall prevalence of RRT is underestimated by approximately 3% due to an estimated 30% underreporting of patients living on a functioning graft§ Not all UK centres record whether a patient is on HDF and this is probably an underestimate of HDF usage in the UK‡ Not all patients on home HD are reported as such so the total number of these patients is slightly underestimated
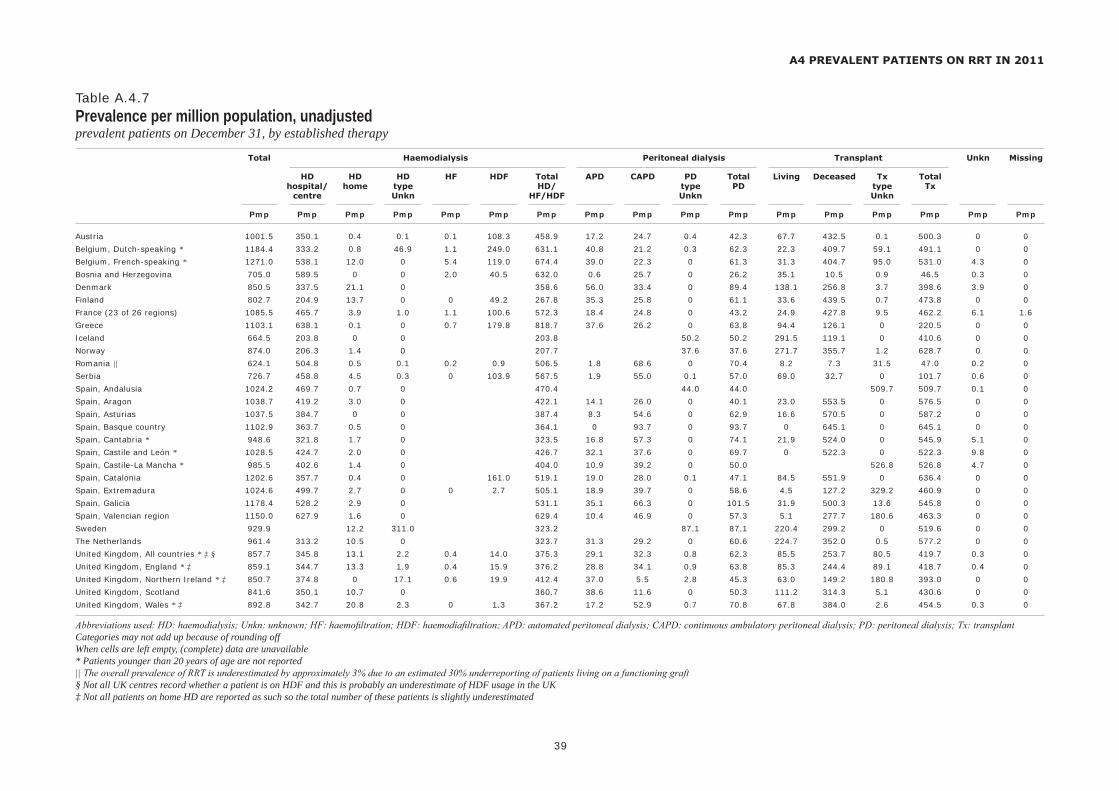
Total Haemodialysis Peritoneal dialysis Transplant Unkn Missing
HD HD HD HF HDF Total APD CAPD PD Total Living Deceased Tx Total hospital/ home type HD/ type PD type Tx centre Unkn HF/HDF Unkn Unkn
Pmp Pmp Pmp Pmp Pmp Pmp Pmp Pmp Pmp Pmp Pmp Pmp Pmp Pmp Pmp Pmp Pmp
39
A4 PREVALENT PATIENTS ON RRT IN 2011
Table A.4.7Prevalence per million population, unadjustedprevalent patients on December 31, by established therapy
Austria 1001.5 350.1 0.4 0.1 0.1 108.3 458.9 17.2 24.7 0.4 42.3 67.7 432.5 0.1 500.3 0 0
Belgium, Dutch-speaking * 1184.4 333.2 0.8 46.9 1.1 249.0 631.1 40.8 21.2 0.3 62.3 22.3 409.7 59.1 491.1 0 0
Belgium, French-speaking * 1271.0 538.1 12.0 0 5.4 119.0 674.4 39.0 22.3 0 61.3 31.3 404.7 95.0 531.0 4.3 0
Bosnia and Herzegovina 705.0 589.5 0 0 2.0 40.5 632.0 0.6 25.7 0 26.2 35.1 10.5 0.9 46.5 0.3 0
Denmark 850.5 337.5 21.1 0 358.6 56.0 33.4 0 89.4 138.1 256.8 3.7 398.6 3.9 0
Finland 802.7 204.9 13.7 0 0 49.2 267.8 35.3 25.8 0 61.1 33.6 439.5 0.7 473.8 0 0
France (23 of 26 regions) 1085.5 465.7 3.9 1.0 1.1 100.6 572.3 18.4 24.8 0 43.2 24.9 427.8 9.5 462.2 6.1 1.6
Greece 1103.1 638.1 0.1 0 0.7 179.8 818.7 37.6 26.2 0 63.8 94.4 126.1 0 220.5 0 0
Iceland 664.5 203.8 0 0 203.8 50.2 50.2 291.5 119.1 0 410.6 0 0
Norway 874.0 206.3 1.4 0 207.7 37.6 37.6 271.7 355.7 1.2 628.7 0 0
Romania || 624.1 504.8 0.5 0.1 0.2 0.9 506.5 1.8 68.6 0 70.4 8.2 7.3 31.5 47.0 0.2 0
Serbia 726.7 458.8 4.5 0.3 0 103.9 567.5 1.9 55.0 0.1 57.0 69.0 32.7 0 101.7 0.6 0
Spain, Andalusia 1024.2 469.7 0.7 0 470.4 44.0 44.0 509.7 509.7 0.1 0
Spain, Aragon 1038.7 419.2 3.0 0 422.1 14.1 26.0 0 40.1 23.0 553.5 0 576.5 0 0
Spain, Asturias 1037.5 384.7 0 0 387.4 8.3 54.6 0 62.9 16.6 570.5 0 587.2 0 0
Spain, Basque country 1102.9 363.7 0.5 0 364.1 0 93.7 0 93.7 0 645.1 0 645.1 0 0
Spain, Cantabria * 948.6 321.8 1.7 0 323.5 16.8 57.3 0 74.1 21.9 524.0 0 545.9 5.1 0
Spain, Castile and León * 1028.5 424.7 2.0 0 426.7 32.1 37.6 0 69.7 0 522.3 0 522.3 9.8 0
Spain, Castile-La Mancha * 985.5 402.6 1.4 0 404.0 10.9 39.2 0 50.0 526.8 526.8 4.7 0
Spain, Catalonia 1202.6 357.7 0.4 0 161.0 519.1 19.0 28.0 0.1 47.1 84.5 551.9 0 636.4 0 0
Spain, Extremadura 1024.6 499.7 2.7 0 0 2.7 505.1 18.9 39.7 0 58.6 4.5 127.2 329.2 460.9 0 0
Spain, Galicia 1178.4 528.2 2.9 0 531.1 35.1 66.3 0 101.5 31.9 500.3 13.6 545.8 0 0
Spain, Valencian region 1150.0 627.9 1.6 0 629.4 10.4 46.9 0 57.3 5.1 277.7 180.6 463.3 0 0
Sweden 929.9 12.2 311.0 323.2 87.1 87.1 220.4 299.2 0 519.6 0 0
The Netherlands 961.4 313.2 10.5 0 323.7 31.3 29.2 0 60.6 224.7 352.0 0.5 577.2 0 0
United Kingdom, All countries * ‡ § 857.7 345.8 13.1 2.2 0.4 14.0 375.3 29.1 32.3 0.8 62.3 85.5 253.7 80.5 419.7 0.3 0
United Kingdom, England * ‡ 859.1 344.7 13.3 1.9 0.4 15.9 376.2 28.8 34.1 0.9 63.8 85.3 244.4 89.1 418.7 0.4 0
United Kingdom, Northern Ireland * ‡ 850.7 374.8 0 17.1 0.6 19.9 412.4 37.0 5.5 2.8 45.3 63.0 149.2 180.8 393.0 0 0
United Kingdom, Scotland 841.6 350.1 10.7 0 360.7 38.6 11.6 0 50.3 111.2 314.3 5.1 430.6 0 0
United Kingdom, Wales * ‡ 892.8 342.7 20.8 2.3 0 1.3 367.2 17.2 52.9 0.7 70.8 67.8 384.0 2.6 454.5 0.3 0
Abbreviations used: HD: haemodialysis; Unkn: unknown; HF: haemofiltration; HDF: haemodiafiltration; APD: automated peritoneal dialysis; CAPD: continuous ambulatory peritoneal dialysis; PD: peritoneal dialysis; Tx: transplantCategories may not add up because of rounding offWhen cells are left empty, (complete) data are unavailable* Patients younger than 20 years of age are not reported|| The overall prevalence of RRT is underestimated by approximately 3% due to an estimated 30% underreporting of patients living on a functioning graft§ Not all UK centres record whether a patient is on HDF and this is probably an underestimate of HDF usage in the UK‡ Not all patients on home HD are reported as such so the total number of these patients is slightly underestimated
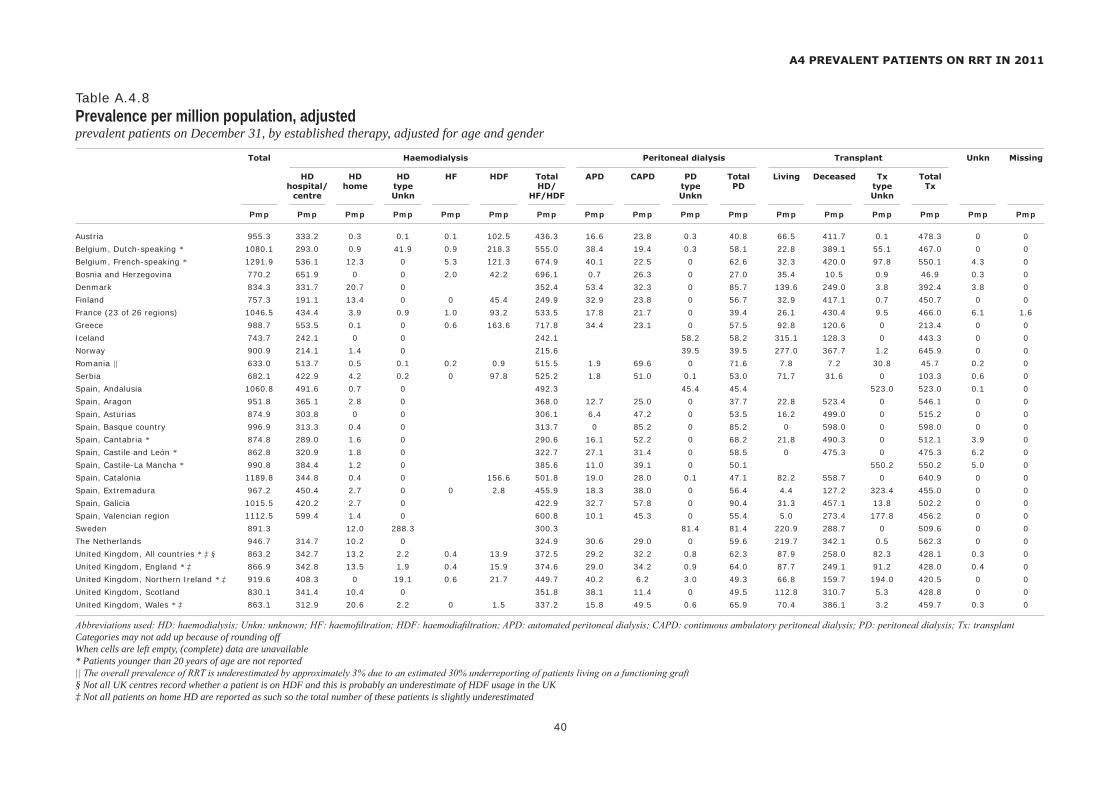
Total Haemodialysis Peritoneal dialysis Transplant Unkn Missing
HD HD HD HF HDF Total APD CAPD PD Total Living Deceased Tx Total hospital/ home type HD/ type PD type Tx centre Unkn HF/HDF Unkn Unkn
Pmp Pmp Pmp Pmp Pmp Pmp Pmp Pmp Pmp Pmp Pmp Pmp Pmp Pmp Pmp Pmp Pmp
40
A4 PREVALENT PATIENTS ON RRT IN 2011
Table A.4.8Prevalence per million population, adjustedprevalent patients on December 31, by established therapy, adjusted for age and gender
Austria 955.3 333.2 0.3 0.1 0.1 102.5 436.3 16.6 23.8 0.3 40.8 66.5 411.7 0.1 478.3 0 0
Belgium, Dutch-speaking * 1080.1 293.0 0.9 41.9 0.9 218.3 555.0 38.4 19.4 0.3 58.1 22.8 389.1 55.1 467.0 0 0
Belgium, French-speaking * 1291.9 536.1 12.3 0 5.3 121.3 674.9 40.1 22.5 0 62.6 32.3 420.0 97.8 550.1 4.3 0
Bosnia and Herzegovina 770.2 651.9 0 0 2.0 42.2 696.1 0.7 26.3 0 27.0 35.4 10.5 0.9 46.9 0.3 0
Denmark 834.3 331.7 20.7 0 352.4 53.4 32.3 0 85.7 139.6 249.0 3.8 392.4 3.8 0
Finland 757.3 191.1 13.4 0 0 45.4 249.9 32.9 23.8 0 56.7 32.9 417.1 0.7 450.7 0 0
France (23 of 26 regions) 1046.5 434.4 3.9 0.9 1.0 93.2 533.5 17.8 21.7 0 39.4 26.1 430.4 9.5 466.0 6.1 1.6
Greece 988.7 553.5 0.1 0 0.6 163.6 717.8 34.4 23.1 0 57.5 92.8 120.6 0 213.4 0 0
Iceland 743.7 242.1 0 0 242.1 58.2 58.2 315.1 128.3 0 443.3 0 0
Norway 900.9 214.1 1.4 0 215.6 39.5 39.5 277.0 367.7 1.2 645.9 0 0
Romania || 633.0 513.7 0.5 0.1 0.2 0.9 515.5 1.9 69.6 0 71.6 7.8 7.2 30.8 45.7 0.2 0
Serbia 682.1 422.9 4.2 0.2 0 97.8 525.2 1.8 51.0 0.1 53.0 71.7 31.6 0 103.3 0.6 0
Spain, Andalusia 1060.8 491.6 0.7 0 492.3 45.4 45.4 523.0 523.0 0.1 0
Spain, Aragon 951.8 365.1 2.8 0 368.0 12.7 25.0 0 37.7 22.8 523.4 0 546.1 0 0
Spain, Asturias 874.9 303.8 0 0 306.1 6.4 47.2 0 53.5 16.2 499.0 0 515.2 0 0
Spain, Basque country 996.9 313.3 0.4 0 313.7 0 85.2 0 85.2 0 598.0 0 598.0 0 0
Spain, Cantabria * 874.8 289.0 1.6 0 290.6 16.1 52.2 0 68.2 21.8 490.3 0 512.1 3.9 0
Spain, Castile and León * 862.8 320.9 1.8 0 322.7 27.1 31.4 0 58.5 0 475.3 0 475.3 6.2 0
Spain, Castile-La Mancha * 990.8 384.4 1.2 0 385.6 11.0 39.1 0 50.1 550.2 550.2 5.0 0
Spain, Catalonia 1189.8 344.8 0.4 0 156.6 501.8 19.0 28.0 0.1 47.1 82.2 558.7 0 640.9 0 0
Spain, Extremadura 967.2 450.4 2.7 0 0 2.8 455.9 18.3 38.0 0 56.4 4.4 127.2 323.4 455.0 0 0
Spain, Galicia 1015.5 420.2 2.7 0 422.9 32.7 57.8 0 90.4 31.3 457.1 13.8 502.2 0 0
Spain, Valencian region 1112.5 599.4 1.4 0 600.8 10.1 45.3 0 55.4 5.0 273.4 177.8 456.2 0 0
Sweden 891.3 12.0 288.3 300.3 81.4 81.4 220.9 288.7 0 509.6 0 0
The Netherlands 946.7 314.7 10.2 0 324.9 30.6 29.0 0 59.6 219.7 342.1 0.5 562.3 0 0
United Kingdom, All countries * ‡ § 863.2 342.7 13.2 2.2 0.4 13.9 372.5 29.2 32.2 0.8 62.3 87.9 258.0 82.3 428.1 0.3 0
United Kingdom, England * ‡ 866.9 342.8 13.5 1.9 0.4 15.9 374.6 29.0 34.2 0.9 64.0 87.7 249.1 91.2 428.0 0.4 0
United Kingdom, Northern Ireland * ‡ 919.6 408.3 0 19.1 0.6 21.7 449.7 40.2 6.2 3.0 49.3 66.8 159.7 194.0 420.5 0 0
United Kingdom, Scotland 830.1 341.4 10.4 0 351.8 38.1 11.4 0 49.5 112.8 310.7 5.3 428.8 0 0
United Kingdom, Wales * ‡ 863.1 312.9 20.6 2.2 0 1.5 337.2 15.8 49.5 0.6 65.9 70.4 386.1 3.2 459.7 0.3 0
Abbreviations used: HD: haemodialysis; Unkn: unknown; HF: haemofiltration; HDF: haemodiafiltration; APD: automated peritoneal dialysis; CAPD: continuous ambulatory peritoneal dialysis; PD: peritoneal dialysis; Tx: transplantCategories may not add up because of rounding offWhen cells are left empty, (complete) data are unavailable* Patients younger than 20 years of age are not reported|| The overall prevalence of RRT is underestimated by approximately 3% due to an estimated 30% underreporting of patients living on a functioning graft§ Not all UK centres record whether a patient is on HDF and this is probably an underestimate of HDF usage in the UK‡ Not all patients on home HD are reported as such so the total number of these patients is slightly underestimated

Total Haemodialysis Peritoneal dialysis Transplant Unkn Missing
HD HD HD HF HDF Total APD CAPD PD Total Living Deceased Tx Total hospital/ home type HD/ type PD type Tx centre Unkn HF/HDF Unkn Unkn
% % % % % % % % % % % % % % % % %
41
A4 PREVALENT PATIENTS ON RRT IN 2011
Table A.4.9Percentages of established therapy, unadjustedprevalent patients on December 31
Austria 100 35.0 0 0 0 10.8 45.8 1.7 2.5 0 4.2 6.8 43.2 0 50.0 0 0
Belgium, Dutch-speaking * 100 28.1 0.1 4.0 0.1 21.0 53.3 3.4 1.8 0 5.3 1.9 34.6 5.0 41.5 0 0
Belgium, French-speaking * 100 42.3 0.9 0 0.4 9.4 53.1 3.1 1.8 0 4.8 2.5 31.8 7.5 41.8 0.3 0
Bosnia and Herzegovina 100 83.6 0 0 0.3 5.7 89.6 0.1 3.6 0 3.7 5.0 1.5 0.1 6.6 0 0
Denmark 100 39.7 2.5 0 42.2 6.6 3.9 0 10.5 16.2 30.2 0.4 46.9 0.5 0
Finland 100 25.5 1.7 0 0 6.1 33.4 4.4 3.2 0 7.6 4.2 54.8 0.1 59.0 0 0
France (23 of 26 regions) 100 42.9 0.4 0.1 0.1 9.3 52.7 1.7 2.3 0 4.0 2.3 39.4 0.9 42.6 0.6 0.1
Greece 100 57.8 0 0 0.1 16.3 74.2 3.4 2.4 0 5.8 8.6 11.4 0 20.0 0 0
Iceland 100 30.7 0 0 30.7 7.5 7.5 43.9 17.9 0 61.8 0 0
Norway 100 23.6 0.2 0 23.8 4.3 4.3 31.1 40.7 0.1 71.9 0 0
Romania || 100 80.9 0.1 0 0 0.1 81.2 0.3 11.0 0 11.3 1.3 1.2 5.0 7.5 0 0
Serbia 100 63.1 0.6 0 0 14.3 78.1 0.3 7.6 0 7.8 9.5 4.5 0 14.0 0.1 0
Spain, Andalusia 100 45.9 0.1 0 45.9 4.3 4.3 49.8 49.8 0 0
Spain, Aragon 100 40.4 0.3 0 40.6 1.4 2.5 0 3.9 2.2 53.3 0 55.5 0 0
Spain, Asturias 100 37.3 0 0 37.3 0.8 5.3 0 6.1 1.6 55.0 0 56.6 0 0
Spain, Basque country 100 33.0 0 0 33.0 0 8.5 0 8.5 0 58.5 0 58.5 0 0
Spain, Cantabria * 100 33.9 0.2 0 34.1 1.8 6.0 0 7.8 2.3 55.2 0 57.5 0.5 0
Spain, Castile and León * 100 41.3 0.2 0 41.5 3.1 3.7 0 6.8 0 50.8 0 50.8 1.0 0
Spain, Castile-La Mancha * 100 40.9 0.1 0 41.0 1.1 4.0 0 5.1 53.4 53.4 0.5 0
Spain, Catalonia 100 29.7 0 0 13.4 43.2 1.6 2.3 0 3.9 7.0 45.9 0 52.9 0 0
Spain, Extremadura 100 48.8 0.3 0 0 0.3 49.3 1.8 3.9 0 5.7 0.4 12.4 32.1 45.0 0 0
Spain, Galicia 100 44.8 0.2 0 45.1 3.0 5.6 0 8.6 2.7 42.5 1.2 46.3 0 0
Spain, Valencian region 100 54.6 0.1 0 54.7 0.9 4.1 0 5.0 0.4 24.1 15.7 40.3 0 0
Sweden 100 1.3 33.4 34.8 9.4 9.4 23.7 32.2 0 55.9 0 0
The Netherlands 100 32.6 1.1 0 33.7 3.3 3.0 0 6.3 23.4 36.6 0 60.0 0 0
United Kingdom, All countries * ‡ § 100 40.3 1.5 0.3 0 1.6 43.8 3.4 3.8 0.1 7.3 10.0 29.6 9.4 48.9 0 0
United Kingdom, England * ‡ 100 40.1 1.5 0.2 0 1.9 43.8 3.4 4.0 0.1 7.4 9.9 28.4 10.4 48.7 0 0
United Kingdom, Northern Ireland * ‡ 100 44.1 0 2.0 0.1 2.3 48.5 4.4 0.6 0.3 5.3 7.4 17.5 21.2 46.2 0 0
United Kingdom, Scotland 100 41.6 1.3 0 42.9 4.6 1.4 0 6.0 13.2 37.3 0.6 51.2 0 0
United Kingdom, Wales * ‡ 100 38.4 2.3 0.3 0 0.1 41.1 1.9 5.9 0.1 7.9 7.6 43.0 0.3 50.9 0 0
Abbreviations used: HD: haemodialysis; Unkn: unknown; HF: haemofiltration; HDF: haemodiafiltration; APD: automated peritoneal dialysis; CAPD: continuous ambulatory peritoneal dialysis; PD: peritoneal dialysis; Tx: transplantCategories may not add up because of rounding offPercentages are row percentagesWhen cells are left empty, (complete) data are unavailable* Patients younger than 20 years of age are not reported|| The overall prevalence of RRT is underestimated by approximately 3% due to an estimated 30% underreporting of patients living on a functioning graft§ Not all UK centres record whether a patient is on HDF and this is probably an underestimate of HDF usage in the UK‡ Not all patients on home HD are reported as such so the total number of these patients is slightly underestimated
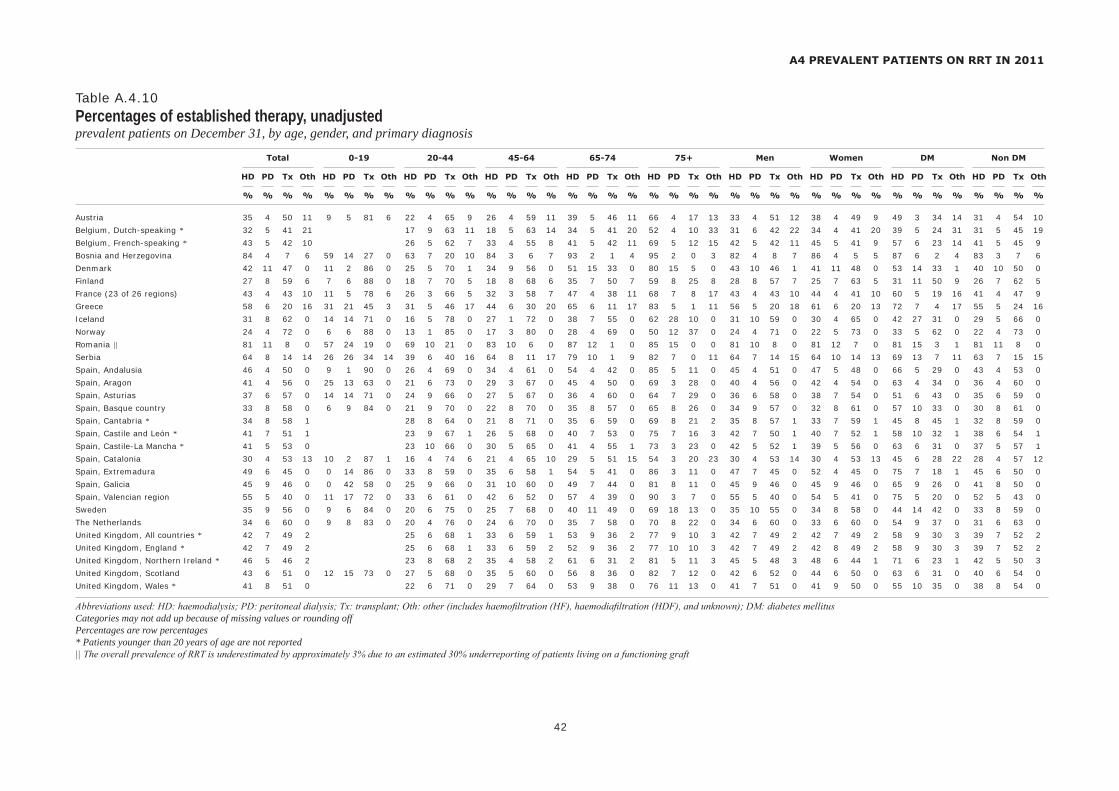
Total 0-19 20-44 45-64 65-74 75+ Men Women DM Non DM
HD PD Tx Oth HD PD Tx Oth HD PD Tx Oth HD PD Tx Oth HD PD Tx Oth HD PD Tx Oth HD PD Tx Oth HD PD Tx Oth HD PD Tx Oth HD PD Tx Oth
% % % % % % % % % % % % % % % % % % % % % % % % % % % % % % % % % % % % % % % %
42
A4 PREVALENT PATIENTS ON RRT IN 2011
Table A.4.10Percentages of established therapy, unadjustedprevalent patients on December 31, by age, gender, and primary diagnosis
Austria 35 4 50 11 9 5 81 6 22 4 65 9 26 4 59 11 39 5 46 11 66 4 17 13 33 4 51 12 38 4 49 9 49 3 34 14 31 4 54 10
Belgium, Dutch-speaking * 32 5 41 21 17 9 63 11 18 5 63 14 34 5 41 20 52 4 10 33 31 6 42 22 34 4 41 20 39 5 24 31 31 5 45 19
Belgium, French-speaking * 43 5 42 10 26 5 62 7 33 4 55 8 41 5 42 11 69 5 12 15 42 5 42 11 45 5 41 9 57 6 23 14 41 5 45 9
Bosnia and Herzegovina 84 4 7 6 59 14 27 0 63 7 20 10 84 3 6 7 93 2 1 4 95 2 0 3 82 4 8 7 86 4 5 5 87 6 2 4 83 3 7 6
Denmark 42 11 47 0 11 2 86 0 25 5 70 1 34 9 56 0 51 15 33 0 80 15 5 0 43 10 46 1 41 11 48 0 53 14 33 1 40 10 50 0
Finland 27 8 59 6 7 6 88 0 18 7 70 5 18 8 68 6 35 7 50 7 59 8 25 8 28 8 57 7 25 7 63 5 31 11 50 9 26 7 62 5
France (23 of 26 regions) 43 4 43 10 11 5 78 6 26 3 66 5 32 3 58 7 47 4 38 11 68 7 8 17 43 4 43 10 44 4 41 10 60 5 19 16 41 4 47 9
Greece 58 6 20 16 31 21 45 3 31 5 46 17 44 6 30 20 65 6 11 17 83 5 1 11 56 5 20 18 61 6 20 13 72 7 4 17 55 5 24 16
Iceland 31 8 62 0 14 14 71 0 16 5 78 0 27 1 72 0 38 7 55 0 62 28 10 0 31 10 59 0 30 4 65 0 42 27 31 0 29 5 66 0
Norway 24 4 72 0 6 6 88 0 13 1 85 0 17 3 80 0 28 4 69 0 50 12 37 0 24 4 71 0 22 5 73 0 33 5 62 0 22 4 73 0
Romania || 81 11 8 0 57 24 19 0 69 10 21 0 83 10 6 0 87 12 1 0 85 15 0 0 81 10 8 0 81 12 7 0 81 15 3 1 81 11 8 0
Serbia 64 8 14 14 26 26 34 14 39 6 40 16 64 8 11 17 79 10 1 9 82 7 0 11 64 7 14 15 64 10 14 13 69 13 7 11 63 7 15 15
Spain, Andalusia 46 4 50 0 9 1 90 0 26 4 69 0 34 4 61 0 54 4 42 0 85 5 11 0 45 4 51 0 47 5 48 0 66 5 29 0 43 4 53 0
Spain, Aragon 41 4 56 0 25 13 63 0 21 6 73 0 29 3 67 0 45 4 50 0 69 3 28 0 40 4 56 0 42 4 54 0 63 4 34 0 36 4 60 0
Spain, Asturias 37 6 57 0 14 14 71 0 24 9 66 0 27 5 67 0 36 4 60 0 64 7 29 0 36 6 58 0 38 7 54 0 51 6 43 0 35 6 59 0
Spain, Basque country 33 8 58 0 6 9 84 0 21 9 70 0 22 8 70 0 35 8 57 0 65 8 26 0 34 9 57 0 32 8 61 0 57 10 33 0 30 8 61 0
Spain, Cantabria * 34 8 58 1 28 8 64 0 21 8 71 0 35 6 59 0 69 8 21 2 35 8 57 1 33 7 59 1 45 8 45 1 32 8 59 0
Spain, Castile and León * 41 7 51 1 23 9 67 1 26 5 68 0 40 7 53 0 75 7 16 3 42 7 50 1 40 7 52 1 58 10 32 1 38 6 54 1
Spain, Castile-La Mancha * 41 5 53 0 23 10 66 0 30 5 65 0 41 4 55 1 73 3 23 0 42 5 52 1 39 5 56 0 63 6 31 0 37 5 57 1
Spain, Catalonia 30 4 53 13 10 2 87 1 16 4 74 6 21 4 65 10 29 5 51 15 54 3 20 23 30 4 53 14 30 4 53 13 45 6 28 22 28 4 57 12
Spain, Extremadura 49 6 45 0 0 14 86 0 33 8 59 0 35 6 58 1 54 5 41 0 86 3 11 0 47 7 45 0 52 4 45 0 75 7 18 1 45 6 50 0
Spain, Galicia 45 9 46 0 0 42 58 0 25 9 66 0 31 10 60 0 49 7 44 0 81 8 11 0 45 9 46 0 45 9 46 0 65 9 26 0 41 8 50 0
Spain, Valencian region 55 5 40 0 11 17 72 0 33 6 61 0 42 6 52 0 57 4 39 0 90 3 7 0 55 5 40 0 54 5 41 0 75 5 20 0 52 5 43 0
Sweden 35 9 56 0 9 6 84 0 20 6 75 0 25 7 68 0 40 11 49 0 69 18 13 0 35 10 55 0 34 8 58 0 44 14 42 0 33 8 59 0
The Netherlands 34 6 60 0 9 8 83 0 20 4 76 0 24 6 70 0 35 7 58 0 70 8 22 0 34 6 60 0 33 6 60 0 54 9 37 0 31 6 63 0
United Kingdom, All countries * 42 7 49 2 25 6 68 1 33 6 59 1 53 9 36 2 77 9 10 3 42 7 49 2 42 7 49 2 58 9 30 3 39 7 52 2
United Kingdom, England * 42 7 49 2 25 6 68 1 33 6 59 2 52 9 36 2 77 10 10 3 42 7 49 2 42 8 49 2 58 9 30 3 39 7 52 2
United Kingdom, Northern Ireland * 46 5 46 2 23 8 68 2 35 4 58 2 61 6 31 2 81 5 11 3 45 5 48 3 48 6 44 1 71 6 23 1 42 5 50 3
United Kingdom, Scotland 43 6 51 0 12 15 73 0 27 5 68 0 35 5 60 0 56 8 36 0 82 7 12 0 42 6 52 0 44 6 50 0 63 6 31 0 40 6 54 0
United Kingdom, Wales * 41 8 51 0 22 6 71 0 29 7 64 0 53 9 38 0 76 11 13 0 41 7 51 0 41 9 50 0 55 10 35 0 38 8 54 0
Abbreviations used: HD: haemodialysis; PD: peritoneal dialysis; Tx: transplant; Oth: other (includes haemofiltration (HF), haemodiafiltration (HDF), and unknown); DM: diabetes mellitusCategories may not add up because of missing values or rounding offPercentages are row percentages* Patients younger than 20 years of age are not reported|| The overall prevalence of RRT is underestimated by approximately 3% due to an estimated 30% underreporting of patients living on a functioning graft

Total Living Deceased Donor type Unkn
Related Unrelated Type Unkn All
N % N % N % N % N % N % N %
43
A5 RENAL TRANSPLANTS IN 2011
Table A.5.1Renal transplants performed in 2011, numbers and percentagesby donor type
Austria § 407 100 27 6.6 23 5.7 0 0 50 12.3 357 87.7 0 0
Belgium, Dutch-speaking * 251 100 9 3.6 10 4.0 0 0 19 7.6 231 92.0 1 0.4
Belgium, French-speaking * 208 100 10 4.8 7 3.4 0 0 17 8.2 190 91.3 1 0.5
Bosnia and Herzegovina 22 100 14 63.6 2 9.1 0 0 16 72.7 6 27.3 0 0
Denmark 233 100 53 22.7 36 15.5 0 0 89 38.2 130 55.8 14 6.0
Finland 176 100 13 7.4 0 0 0 0 13 7.4 163 92.6 0 0
France (23 of 26 regions) 2194 100 173 7.9 173 7.9 2018 92.0 3 0.1
Greece 201 100 51 25.4 1 0.5 0 0 52 25.9 149 74.1 0 0
Iceland 11 100 2 18.2 0 0 9 81.8 11 100 0 0 0 0
Norway 302 100 55 18.2 18 6.0 0 0 73 24.2 229 75.8 0 0
Romania || 173 100 54 31.2 4 2.3 6 3.5 64 37.0 79 45.7 30 17.3
Serbia 113 100 28 24.8 3 2.7 13 11.5 44 38.9 69 61.1 0 0
Spain, Andalusia 421 100 421 100
Spain, Aragon 78 100 9 11.5 9 11.5 69 88.5 0 0
Spain, Asturias 54 100 9 16.7 0 0 0 0 9 16.7 45 83.3 0 0
Spain, Basque country 121 100 0 0 0 0 0 0 0 0 121 100 0 0
Spain, Cantabria * 48 100 5 10.4 1 2.1 0 0 6 12.5 42 87.5 0 0
Spain, Castile and León * 412 100 0 0 0 0 0 0 0 0 412 100 0 0
Spain, Castile-La Mancha * 82 100 82 100
Spain, Catalonia 579 100 141 24.4 0 0 0 0 141 24.4 438 75.6 0 0
Spain, Extremadura 52 100 3 5.8 0 0 0 0 3 5.8 46 88.5 3 5.8
Spain, Galicia 148 100 0 0 0 0 24 16.2 24 16.2 124 83.8 0 0
Spain, Valencian region 192 100 6 3.1 2 1.0 0 0 8 4.2 184 95.8 0 0
Sweden 427 100 96 22.5 88 20.6 0 0 184 43.1 243 56.9 0 0
The Netherlands 861 100 446 51.8 446 51.8 415 48.2 0 0
United Kingdom, All countries ‡ 2740 100 620 22.6 404 14.7 2 0.1 1026 37.5 1714 62.6 0 0
United Kingdom, England ‡ 2310 100 532 23.0 354 15.3 2 0.1 888 38.4 1422 61.6 0 0
United Kingdom, Northern Ireland ‡ 114 100 35 30.7 12 10.5 0 0 47 41.2 67 58.8 0 0
United Kingdom, Scotland ‡ 169 100 30 17.8 23 13.6 0 0 53 31.4 116 68.6 0 0
United Kingdom, Wales ‡ 147 100 23 15.7 15 10.2 0 0 38 25.9 109 74.2 0 0
Categories may not add up because of rounding offPercentages are row percentagesWhen cells are left empty, (complete) data are unavailable§ Data based on residents and non-residents* Patients younger than 20 years of age are not reported|| The transplantation activity reflects 70% of the total transplantation activity in the country, because there is an underreporting of preemptive transplantations‡ Data from NHS Blood and Transplant

Total Living Deceased Donor type Unkn
Related Unrelated Type Unkn All
Pmp Pmp Pmp Pmp Pmp Pmp Pmp
44
A5 RENAL TRANSPLANTS IN 2011
Table A.5.2Renal transplants performed in 2011, per million populationby donor type
Austria § 44.6 3.0 2.5 0 5.5 39.2 0
Belgium, Dutch-speaking * 39.7 1.4 1.6 0 3.0 36.5 0.2
Belgium, French-speaking * 44.6 2.1 1.5 0 3.6 40.7 0.2
Bosnia and Herzegovina 6.3 4.0 0.6 0 4.6 1.7 0
Denmark 41.4 9.4 6.4 0 15.8 23.1 2.5
Finland 32.7 2.4 0 0 2.4 30.3 0
France (23 of 26 regions) 43.6 3.4 3.4 40.1 0.1
Greece 17.8 4.5 0.1 0 4.6 13.2 0
Iceland 34.5 6.3 0 28.2 34.5 0 0
Norway 61.0 11.1 3.6 0 14.7 46.2 0
Romania || 8.1 2.5 0.2 0.3 3.0 3.7 1.4
Serbia 15.6 3.9 0.4 1.8 6.1 9.5 0
Spain, Andalusia 49.9 49.9
Spain, Aragon 57.9 6.7 6.7 51.2 0
Spain, Asturias 49.9 8.3 0 0 8.3 41.6 0
Spain, Basque country 55.3 0 0 0 0 55.3 0
Spain, Cantabria * 80.9 8.4 1.7 0 10.1 70.8 0
Spain, Castile and León * 161.4 0 0 0 0 161.4 0
Spain, Castile-La Mancha * 38.7 38.7
Spain, Catalonia 76.8 18.7 0 0 18.7 58.1 0
Spain, Extremadura 46.9 2.7 0 0 2.7 41.5 2.7
Spain, Galicia 53.1 0 0 8.6 8.6 44.5 0
Spain, Valencian region 37.5 1.2 0.4 0 1.6 36.0 0
Sweden 45.2 10.2 9.3 0 19.5 25.7 0
The Netherlands 51.6 26.7 26.7 24.9 0
United Kingdom, All countries ‡ 43.7 9.9 6.4 0.0 16.4 27.3 0
United Kingdom, England ‡ 43.9 10.1 6.7 0.0 16.7 27.0 0
United Kingdom, Northern Ireland ‡ 63.0 19.4 6.6 0 26.0 37.0 0
United Kingdom, Scotland ‡ 32.2 5.7 4.4 0 10.1 22.1 0
United Kingdom, Wales ‡ 48.6 7.6 5.0 0 12.6 36.1 0
Categories may not add up because of rounding offWhen cells are left empty, (complete) data are unavailable§ The number of transplants differs from table A.5.1 since non-residents are excluded for this analysis* Patients younger than 20 years of age are not reported|| The transplantation activity reflects 70% of the total transplantation activity in the country, because there is an underreporting of preemptive transplantations‡ Data from NHS Blood and Transplant


90 day 1 year 2 year 5 year
46
Survival in % (95% CI) Survival in % (95% CI) Survival in % (95% CI) Survival in % (95% CI)
ALL COUNTRIES *
A6 SURVIVAL PROBABILITYPatient Survival on RRT
Table A.6.190-day, one-, two- and five-year survival probabilities (cohort 2002-2006): Incident RRT patients, unadjustedfrom day 1 to 90 days, one, two, and five years, by age, gender, and primary diagnosis
0-19 99.2 (98.4-99.6) 96.6 (95.2-97.5) 95.8 (94.4-96.9) 93.9 (92.3-95.2)
20-44 98.8 (98.6-99.0) 96.1 (95.7-96.4) 93.0 (92.6-93.5) 86.4 (85.8-86.9)
45-64 96.1 (95.9-96.4) 88.5 (88.1-88.8) 80.5 (80.1-80.9) 62.0 (61.6-62.3)
65-74 92.3 (92.0-92.6) 78.0 (77.6-78.4) 64.4 (64.0-64.8) 36.1 (35.9-36.3)
75+ 87.5 (87.1-87.9) 68.1 (67.7-68.5) 50.6 (50.3-50.9) 19.4 (19.3-19.5)
Men 93.3 (93.1-93.5) 81.4 (81.1-81.7) 69.9 (69.6-70.1) 46.6 (46.4-46.8)
Women 92.8 (92.5-93.0) 80.7 (80.3-81.0) 69.6 (69.3-70.0) 47.3 (47.0-47.5)
Diabetes 94.0 (93.6-94.3) 80.8 (80.3-81.2) 66.6 (66.2-67.1) 37.4 (37.1-37.6)
Hypertension / renal vascular disease 92.9 (92.5-93.3) 79.2 (78.6-79.7) 65.6 (65.1-66.1) 38.0 (37.7-38.3)
Glomerulonephritis 97.1 (96.8-97.4) 91.1 (90.6-91.6) 84.5 (83.9-85.0) 69.3 (68.7-69.9)
Other cause 92.3 (92.1-92.6) 80.1 (79.8-80.4) 69.7 (69.3-70.0) 49.1 (48.9-49.4)
All 93.1 (93.0-93.3) 81.1 (80.9-81.3) 69.8 (69.6-70.0) 46.9 (46.7-47.0)
* Based on data from Austria, Belgium (Dutch-speaking), Belgium (French-speaking), Denmark, Finland, Greece, Iceland, Italy (Calabria), Norway, Spain (Andalusia), Spain (Aragon), Spain (Asturias), Spain (Basque country), Spain (Cantabria), Spain (Castile and León), Spain (Catalonia), Spain (Valencian region), Sweden, The Netherlands, United Kingdom (England and Wales) and United Kingdom (Scotland)

90 day 1 year 2 year 5 year
47
Survival in % (95% CI) Survival in % (95% CI) Survival in % (95% CI) Survival in % (95% CI)
ALL COUNTRIES *
A6 SURVIVAL PROBABILITYPatient Survival on RRT
Table A.6.290-day, one-, two- and five-year survival probabilities (cohort 2002-2006): Incident RRT patients, adjustedfrom day 1 to 90 days, one, two, and five years, adjusted for age, gender, and primary diagnosis
0-19 99.1 (98.5-99.7) 96.2 (95.0-97.5) 95.4 (94.0-96.8) 93.3 (91.6-95.0)
20-44 98.9 (98.7-99.1) 96.1 (95.7-96.4) 93.0 (92.5-93.4) 86.1 (85.4-86.7)
45-64 96.4 (96.2-96.6) 89.1 (88.7-89.4) 81.4 (80.9-81.9) 62.9 (62.3-63.5)
65-74 93.0 (92.7-93.4) 79.6 (79.1-80.1) 66.6 (66.0-67.2) 38.3 (37.7-38.9)
75+ 88.3 (87.9-88.7) 69.6 (69.0-70.2) 52.3 (51.6-52.9) 20.6 (20.1-21.1)
Men 96.1 (96.0-96.2) 88.2 (88.0-88.5) 79.6 (79.3-80.0) 57.7 (57.3-58.2)
Women 95.9 (95.7-96.1) 88.2 (87.9-88.5) 80.3 (79.9-80.6) 59.9 (59.3-60.4)
Diabetes 95.9 (95.7-96.1) 86.4 (86.0-86.8) 75.1 (74.6-75.7) 46.9 (46.2-47.6)
Hypertension / renal vascular disease 96.5 (96.3-96.7) 89.3 (88.9-89.6) 81.0 (80.5-81.5) 59.0 (58.3-59.8)
Glomerulonephritis 97.5 (97.3-97.8) 92.3 (91.8-92.8) 85.9 (85.3-86.6) 69.6 (68.7-70.5)
Other cause 95.1 (95.0-95.3) 86.7 (86.4-87.0) 78.7 (78.3-79.0) 59.1 (58.6-59.6)
All 96.0 (95.9-96.1) 88.2 (88.0-88.4) 79.9 (79.6-80.2) 58.6 (58.2-59.0)
* Based on data from Austria, Belgium (Dutch-speaking), Belgium (French-speaking), Denmark, Finland, Greece, Iceland, Italy (Calabria), Norway, Spain (Andalusia), Spain (Aragon), Spain (Asturias), Spain (Basque country), Spain (Cantabria), Spain (Castile and León), Spain (Catalonia), Spain (Valencian region), Sweden, The Netherlands, United Kingdom (England and Wales) and United Kingdom (Scotland)
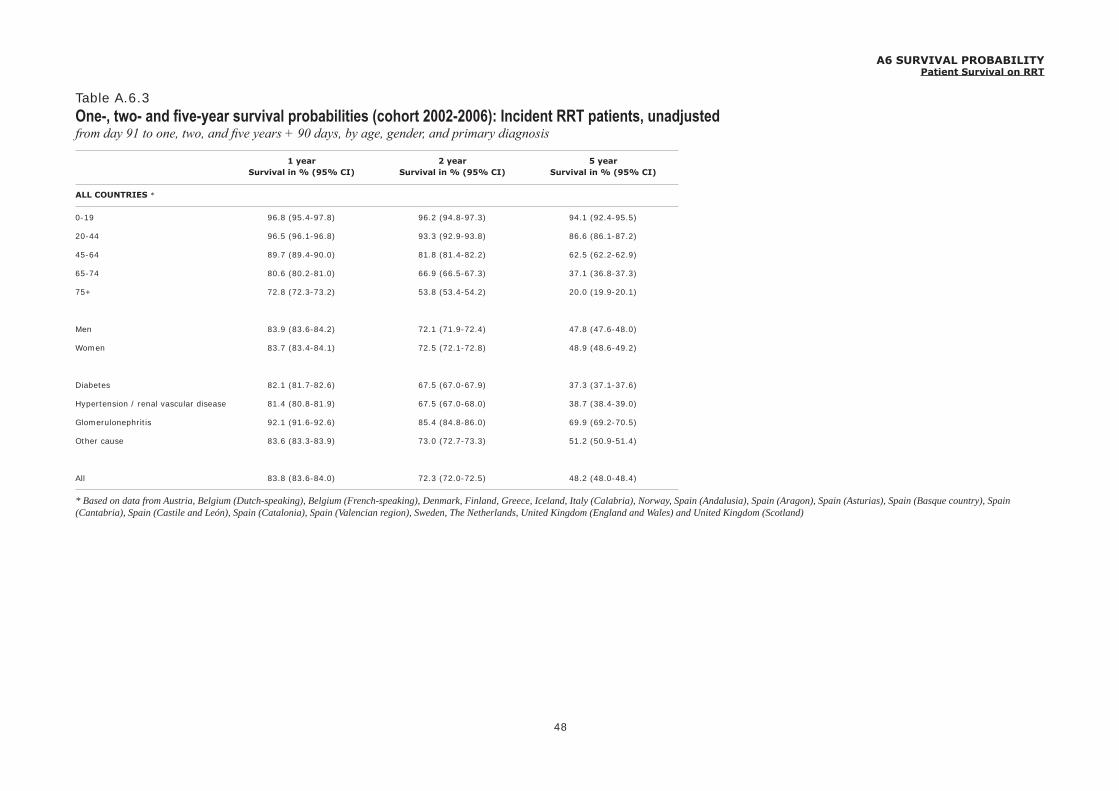
1 year 2 year 5 year
48
Survival in % (95% CI) Survival in % (95% CI) Survival in % (95% CI)
ALL COUNTRIES *
A6 SURVIVAL PROBABILITYPatient Survival on RRT
Table A.6.3One-, two- and five-year survival probabilities (cohort 2002-2006): Incident RRT patients, unadjustedfrom day 91 to one, two, and five years + 90 days, by age, gender, and primary diagnosis
0-19 96.8 (95.4-97.8) 96.2 (94.8-97.3) 94.1 (92.4-95.5)
20-44 96.5 (96.1-96.8) 93.3 (92.9-93.8) 86.6 (86.1-87.2)
45-64 89.7 (89.4-90.0) 81.8 (81.4-82.2) 62.5 (62.2-62.9)
65-74 80.6 (80.2-81.0) 66.9 (66.5-67.3) 37.1 (36.8-37.3)
75+ 72.8 (72.3-73.2) 53.8 (53.4-54.2) 20.0 (19.9-20.1)
Men 83.9 (83.6-84.2) 72.1 (71.9-72.4) 47.8 (47.6-48.0)
Women 83.7 (83.4-84.1) 72.5 (72.1-72.8) 48.9 (48.6-49.2)
Diabetes 82.1 (81.7-82.6) 67.5 (67.0-67.9) 37.3 (37.1-37.6)
Hypertension / renal vascular disease 81.4 (80.8-81.9) 67.5 (67.0-68.0) 38.7 (38.4-39.0)
Glomerulonephritis 92.1 (91.6-92.6) 85.4 (84.8-86.0) 69.9 (69.2-70.5)
Other cause 83.6 (83.3-83.9) 73.0 (72.7-73.3) 51.2 (50.9-51.4)
All 83.8 (83.6-84.0) 72.3 (72.0-72.5) 48.2 (48.0-48.4)
* Based on data from Austria, Belgium (Dutch-speaking), Belgium (French-speaking), Denmark, Finland, Greece, Iceland, Italy (Calabria), Norway, Spain (Andalusia), Spain (Aragon), Spain (Asturias), Spain (Basque country), Spain (Cantabria), Spain (Castile and León), Spain (Catalonia), Spain (Valencian region), Sweden, The Netherlands, United Kingdom (England and Wales) and United Kingdom (Scotland)

1 year 2 year 5 year
49
Survival in % (95% CI) Survival in % (95% CI) Survival in % (95% CI)
ALL COUNTRIES *
A6 SURVIVAL PROBABILITYPatient Survival on RRT
Table A.6.4One-, two- and five-year survival probabilities (cohort 2002-2006): Incident RRT patients, adjustedfrom day 91 to one, two, and five years + 90 days, adjusted for age, gender, and primary diagnosis
0-19 96.4 (95.1-97.7) 95.7 (94.3-97.2) 93.4 (91.6-95.2)
20-44 96.4 (96.1-96.8) 93.2 (92.7-93.7) 86.4 (85.7-87.0)
45-64 90.2 (89.9-90.6) 82.7 (82.2-83.1) 63.9 (63.3-64.5)
65-74 81.9 (81.4-82.4) 68.8 (68.2-69.4) 39.6 (38.9-40.2)
75+ 73.8 (73.2-74.4) 55.2 (54.5-55.9) 21.5 (20.9-22.1)
Men 89.6 (89.4-89.8) 80.9 (80.5-81.2) 58.5 (58.0-59.0)
Women 89.9 (89.6-90.2) 81.8 (81.4-82.2) 60.9 (60.3-61.5)
Diabetes 87.2 (86.8-87.6) 75.5 (75.0-76.1) 47.0 (46.2-47.7)
Hypertension / renal vascular disease 90.3 (89.9-90.7) 81.9 (81.4-82.5) 59.4 (58.6-60.2)
Glomerulonephritis 93.0 (92.5-93.5) 86.6 (86.0-87.3) 70.1 (69.2-71.0)
Other cause 88.9 (88.7-89.2) 80.8 (80.4-81.2) 60.6 (60.1-61.1)
All 89.7 (89.5-89.9) 81.3 (81.0-81.5) 59.5 (59.1-59.9)
* Based on data from Austria, Belgium (Dutch-speaking), Belgium (French-speaking), Denmark, Finland, Greece, Iceland, Italy (Calabria), Norway, Spain (Andalusia), Spain (Aragon), Spain (Asturias), Spain (Basque country), Spain (Cantabria), Spain (Castile and León), Spain (Catalonia), Spain (Valencian region), Sweden, The Netherlands, United Kingdom (England and Wales) and United Kingdom (Scotland)

90 day 1 year 2 year
50
Survival in % (95% CI) Survival in % (95% CI) Survival in % (95% CI)
ALL COUNTRIES *
A6 SURVIVAL PROBABILITYPatient Survival on RRT
Table A.6.590-day, one- and two-year survival probabilities (cohort 2005-2009): Incident RRT patients, unadjustedfrom day 1 to 90 days, one, and two years, by age, gender, and primary diagnosis
0-19 98.8 (97.9-99.3) 96.4 (95.1-97.4) 95.8 (94.4-96.8)
20-44 99.1 (98.9-99.2) 96.7 (96.4-97.0) 93.7 (93.3-94.1)
45-64 96.8 (96.6-97.0) 89.7 (89.4-90.0) 82.4 (82.1-82.8)
65-74 93.2 (92.9-93.5) 80.3 (79.9-80.7) 67.8 (67.5-68.2)
75+ 88.9 (88.6-89.2) 70.6 (70.2-71.0) 54.0 (53.7-54.4)
Men 94.1 (94.0-94.3) 82.9 (82.7-83.2) 72.1 (71.9-72.4)
Women 93.6 (93.3-93.8) 82.4 (82.0-82.7) 71.9 (71.6-72.2)
Diabetes 94.7 (94.5-95.0) 82.8 (82.4-83.2) 69.5 (69.1-69.9)
Hypertension / renal vascular disease 93.8 (93.4-94.1) 81.0 (80.5-81.4) 67.6 (67.2-68.1)
Glomerulonephritis 97.4 (97.1-97.7) 92.0 (91.5-92.4) 86.1 (85.6-86.6)
Other cause 93.2 (92.9-93.4) 81.6 (81.3-81.9) 72.0 (71.7-72.3)
All 93.9 (93.8-94.1) 82.7 (82.5-82.9) 72.0 (71.8-72.2)
* Based on data from Austria, Belgium (Dutch-speaking), Belgium (French-speaking), Denmark, Finland, Greece, Iceland, Italy (Calabria), Norway, Spain (Andalusia), Spain (Aragon), Spain (Asturias), Spain (Basque country), Spain (Cantabria), Spain (Castile and León), Spain (Castile-La Mancha), Spain (Catalonia), Spain (Extremadura), Spain (Valencian region), Sweden, The Netherlands, United Kingdom (England, Northern Ireland, and Wales) and United Kingdom (Scotland)

90 day 1 year 2 year
51
Survival in % (95% CI) Survival in % (95% CI) Survival in % (95% CI)
ALL COUNTRIES *
A6 SURVIVAL PROBABILITYPatient Survival on RRT
Table A.6.690-day, one- and two-year survival probabilities (cohort 2005-2009): Incident RRT patients, adjustedfrom day 1 to 90 days, one, and two years, adjusted for age, gender, and primary diagnosis
0-19 98.5 (97.8-99.3) 96.0 (94.8-97.3) 95.4 (94.0-96.8)
20-44 99.1 (98.9-99.2) 96.7 (96.3-97.0) 93.6 (93.2-94.0)
45-64 97.0 (96.8-97.2) 90.3 (89.9-90.6) 83.2 (82.8-83.6)
65-74 93.9 (93.6-94.1) 81.8 (81.3-82.2) 69.7 (69.2-70.3)
75+ 89.7 (89.3-90.0) 72.1 (71.6-72.6) 55.9 (55.3-56.5)
Men 96.5 (96.4-96.7) 89.3 (89.1-89.5) 81.4 (81.1-81.7)
Women 96.3 (96.2-96.5) 89.2 (89.0-89.5) 81.8 (81.4-82.2)
Diabetes 96.5 (96.3-96.7) 88.0 (87.6-88.3) 77.6 (77.2-78.1)
Hypertension / renal vascular disease 97.0 (96.8-97.1) 90.2 (89.9-90.6) 82.3 (81.9-82.8)
Glomerulonephritis 97.8 (97.5-98.0) 93.0 (92.5-93.4) 87.5 (86.9-88.0)
Other cause 95.6 (95.5-95.8) 87.7 (87.5-88.0) 80.4 (80.0-80.7)
All 96.5 (96.4-96.6) 89.3 (89.1-89.5) 81.6 (81.3-81.8)
* Based on data from Austria, Belgium (Dutch-speaking), Belgium (French-speaking), Denmark, Finland, Greece, Iceland, Italy (Calabria), Norway, Spain (Andalusia), Spain (Aragon), Spain (Asturias), Spain (Basque country), Spain (Cantabria), Spain (Castile and León), Spain (Castile-La Mancha), Spain (Catalonia), Spain (Extremadura), Spain (Valencian region), Sweden, The Netherlands, United Kingdom (England, Northern Ireland, and Wales) and United Kingdom (Scotland)

1 year 2 year
52
Survival in % (95% CI) Survival in % (95% CI)
ALL COUNTRIES *
A6 SURVIVAL PROBABILITYPatient Survival on RRT
Table A.6.7One- and two-year survival probabilities (cohort 2005-2009): Incident RRT patients, unadjustedfrom day 91 to one and two years + 90 days, by age, gender, and primary diagnosis
0-19 97.0 (95.7-98.0) 96.4 (94.9-97.4)
20-44 96.8 (96.5-97.1) 93.7 (93.3-94.1)
45-64 90.6 (90.3-90.9) 83.2 (82.8-83.6)
65-74 82.7 (82.3-83.1) 69.9 (69.5-70.3)
75+ 74.5 (74.1-74.9) 56.6 (56.2-56.9)
Men 85.0 (84.7-85.2) 73.8 (73.6-74.1)
Women 85.0 (84.7-85.3) 74.1 (73.8-74.4)
Diabetes 83.6 (83.2-84.0) 70.0 (69.6-70.5)
Hypertension / renal vascular disease 82.6 (82.1-83.1) 68.7 (68.2-69.2)
Glomerulonephritis 92.8 (92.3-93.2) 86.7 (86.1-87.2)
Other cause 84.7 (84.5-85.0) 74.7 (74.4-75.0)
All 85.0 (84.8-85.2) 73.9 (73.7-74.1)
* Based on data from Austria, Belgium (Dutch-speaking), Belgium (French-speaking), Denmark, Finland, Greece, Iceland, Italy (Calabria), Norway, Spain (Andalusia), Spain (Aragon), Spain (Asturias), Spain (Basque country), Spain (Cantabria), Spain (Castile and León), Spain (Castile-La Mancha), Spain (Catalonia), Spain (Extremadura), Spain (Valencian region), Sweden, The Netherlands, United Kingdom (England, Northern Ireland, and Wales) and United Kingdom (Scotland)

1 year 2 year
53
Survival in % (95% CI) Survival in % (95% CI)
ALL COUNTRIES *
A6 SURVIVAL PROBABILITYPatient Survival on RRT
Table A.6.8One- and two-year survival probabilities (cohort 2005-2009): Incident RRT patients, adjustedfrom day 91 to one and two years + 90 days, adjusted for age, gender, and primary diagnosis
0-19 96.6 (95.3-97.9) 95.9 (94.5-97.3)
20-44 96.7 (96.4-97.1) 93.6 (93.2-94.1)
45-64 91.1 (90.8-91.4) 84.1 (83.7-84.5)
65-74 83.8 (83.4-84.3) 71.8 (71.3-72.4)
75+ 75.7 (75.1-76.2) 58.5 (57.9-59.1)
Men 90.3 (90.1-90.6) 82.3 (82.0-82.6)
Women 90.6 (90.3-90.9) 83.0 (82.6-83.4)
Diabetes 88.4 (88.0-88.7) 77.9 (77.4-78.5)
Hypertension / renal vascular disease 90.9 (90.6-91.3) 82.7 (82.2-83.2)
Glomerulonephritis 93.6 (93.2-94.0) 88.0 (87.4-88.5)
Other cause 89.7 (89.4-89.9) 82.2 (81.8-82.5)
All 90.5 (90.3-90.6) 82.6 (82.3-82.9)
* Based on data from Austria, Belgium (Dutch-speaking), Belgium (French-speaking), Denmark, Finland, Greece, Iceland, Italy (Calabria), Norway, Spain (Andalusia), Spain (Aragon), Spain (Asturias), Spain (Basque country), Spain (Cantabria), Spain (Castile and León), Spain (Castile-La Mancha), Spain (Catalonia), Spain (Extremadura), Spain (Valencian region), Sweden, The Netherlands, United Kingdom (England, Northern Ireland, and Wales) and United Kingdom (Scotland)

90 day 1 year 2 year 5 year
54
Survival in % (95% CI) Survival in % (95% CI) Survival in % (95% CI) Survival in % (95% CI)
ALL COUNTRIES *
A6 SURVIVAL PROBABILITYPatient Survival on Dialysis
Table A.6.990-day, one-, two- and five-year survival probabilities (cohort 2002-2006): Incident dialysis patients, unadjustedfrom day 1 to 90 days, one, two, and five years, by age, gender, and primary diagnosis
0-19 99.0 (98.0-99.5) 95.8 (93.9-97.1) 94.9 (92.8-96.4) 91.7 (88.1-94.3)
20-44 98.8 (98.5-98.9) 95.6 (95.2-96.0) 91.4 (90.9-92.0) 79.2 (78.4-80.0)
45-64 96.1 (95.8-96.3) 88.0 (87.6-88.3) 78.9 (78.5-79.3) 54.5 (54.1-54.9)
65-74 92.3 (92.0-92.6) 77.8 (77.4-78.2) 64.0 (63.6-64.4) 34.3 (34.0-34.5)
75+ 87.5 (87.1-87.9) 68.1 (67.7-68.5) 50.6 (50.2-50.9) 19.3 (19.2-19.4)
Men 93.2 (93.0-93.4) 80.7 (80.4-81.0) 67.9 (67.6-68.1) 38.9 (38.7-39.1)
Women 92.6 (92.3-92.8) 79.9 (79.5-80.2) 67.6 (67.3-68.0) 39.9 (39.7-40.2)
Diabetes 93.9 (93.6-94.2) 80.4 (80.0-80.8) 65.5 (65.0-65.9) 32.2 (32.0-32.4)
Hypertension / renal vascular disease 92.9 (92.5-93.2) 78.9 (78.4-79.4) 64.6 (64.1-65.1) 33.9 (33.6-34.1)
Glomerulonephritis 97.0 (96.6-97.3) 90.5 (90.0-91.0) 82.3 (81.7-83.0) 59.2 (58.5-59.9)
Other cause 92.2 (91.9-92.4) 79.3 (79.0-79.6) 67.5 (67.2-67.8) 41.5 (41.3-41.7)
All 93.0 (92.8-93.1) 80.4 (80.2-80.6) 67.8 (67.6-68.0) 39.3 (39.2-39.4)
* Based on data from Austria, Belgium (Dutch-speaking), Belgium (French-speaking), Denmark, Finland, Greece, Iceland, Italy (Calabria), Norway, Spain (Andalusia), Spain (Aragon), Spain (Asturias), Spain (Basque country), Spain (Cantabria), Spain (Castile and León), Spain (Catalonia), Spain (Valencian region), Sweden, The Netherlands, United Kingdom (England and Wales) and United Kingdom (Scotland)

90 day 1 year 2 year 5 year
55
Survival in % (95% CI) Survival in % (95% CI) Survival in % (95% CI) Survival in % (95% CI)
ALL COUNTRIES *
A6 SURVIVAL PROBABILITYPatient Survival on Dialysis
Table A.6.1090-day, one-, two- and five-year survival probabilities (cohort 2002-2006): Incident dialysis patients, adjustedfrom day 1 to 90 days, one, two, and five years, adjusted for age, gender, and primary diagnosis
0-19 98.9 (98.2-99.7) 95.5 (93.8-97.3) 94.5 (92.5-96.6) 90.5 (86.5-94.8)
20-44 98.8 (98.6-99.0) 95.7 (95.3-96.1) 91.4 (90.8-92.0) 78.1 (77.0-79.3)
45-64 96.3 (96.1-96.5) 88.6 (88.2-89.0) 79.9 (79.4-80.4) 55.1 (54.3-55.8)
65-74 92.9 (92.6-93.2) 79.2 (78.7-79.7) 65.8 (65.3-66.4) 35.8 (35.2-36.5)
75+ 88.2 (87.8-88.6) 69.4 (68.8-70.0) 51.9 (51.3-52.6) 20.2 (19.7-20.7)
Men 95.5 (95.3-95.6) 86.5 (86.2-86.8) 76.6 (76.2-77.0) 50.6 (50.1-51.1)
Women 95.2 (95.0-95.4) 86.4 (86.0-86.7) 77.2 (76.7-77.6) 53.0 (52.4-53.7)
Diabetes 95.4 (95.2-95.7) 84.9 (84.5-85.4) 72.5 (71.9-73.1) 41.1 (40.4-41.9)
Hypertension / renal vascular disease 95.9 (95.6-96.1) 87.4 (86.9-87.8) 77.8 (77.2-78.4) 52.1 (51.3-53.0)
Glomerulonephritis 97.3 (97.0-97.6) 91.4 (90.9-92.0) 84.0 (83.3-84.8) 62.2 (61.1-63.3)
Other cause 94.4 (94.2-94.6) 84.8 (84.5-85.2) 75.5 (75.1-76.0) 52.2 (51.6-52.8)
All 95.4 (95.3-95.5) 86.5 (86.2-86.7) 76.8 (76.5-77.2) 51.6 (51.1-52.0)
* Based on data from Austria, Belgium (Dutch-speaking), Belgium (French-speaking), Denmark, Finland, Greece, Iceland, Italy (Calabria), Norway, Spain (Andalusia), Spain (Aragon), Spain (Asturias), Spain (Basque country), Spain (Cantabria), Spain (Castile and León), Spain (Catalonia), Spain (Valencian region), Sweden, The Netherlands, United Kingdom (England and Wales) and United Kingdom (Scotland)

1 year 2 year 5 year
56
Survival in % (95% CI) Survival in % (95% CI) Survival in % (95% CI)
ALL COUNTRIES *
A6 SURVIVAL PROBABILITYPatient Survival on Dialysis
Table A.6.11One-, two- and five-year survival probabilities (cohort 2002-2006): Incident dialysis patients, unadjustedfrom day 91 to one, two, and five years + 90 days, by age, gender, and primary diagnosis
0-19 96.2 (94.3-97.5) 95.5 (93.3-97.0) 92.7 (88.9-95.2)
20-44 96.0 (95.6-96.3) 91.6 (91.0-92.1) 78.8 (78.0-79.7)
45-64 89.1 (88.7-89.4) 80.0 (79.6-80.4) 54.5 (54.1-54.9)
65-74 80.4 (80.0-80.8) 66.3 (65.9-66.8) 34.9 (34.7-35.1)
75+ 72.7 (72.3-73.2) 53.8 (53.4-54.1) 19.9 (19.8-20.0)
Men 83.1 (82.8-83.4) 69.8 (69.5-70.1) 39.3 (39.2-39.5)
Women 82.9 (82.6-83.3) 70.3 (69.9-70.7) 40.9 (40.6-41.1)
Diabetes 81.7 (81.3-82.2) 66.1 (65.7-66.6) 31.8 (31.6-32.0)
Hypertension / renal vascular disease 81.0 (80.4-81.5) 66.3 (65.8-66.9) 34.0 (33.7-34.3)
Glomerulonephritis 91.3 (90.8-91.9) 83.0 (82.3-83.6) 58.9 (58.2-59.6)
Other cause 82.7 (82.4-83.0) 70.7 (70.3-71.0) 42.8 (42.6-43.1)
All 83.0 (82.8-83.2) 70.0 (69.8-70.2) 39.9 (39.8-40.1)
* Based on data from Austria, Belgium (Dutch-speaking), Belgium (French-speaking), Denmark, Finland, Greece, Iceland, Italy (Calabria), Norway, Spain (Andalusia), Spain (Aragon), Spain (Asturias), Spain (Basque country), Spain (Cantabria), Spain (Castile and León), Spain (Catalonia), Spain (Valencian region), Sweden, The Netherlands, United Kingdom (England and Wales) and United Kingdom (Scotland)

1 year 2 year 5 year
57
Survival in % (95% CI) Survival in % (95% CI) Survival in % (95% CI)
ALL COUNTRIES *
A6 SURVIVAL PROBABILITYPatient Survival on Dialysis
Table A.6.12One-, two- and five-year survival probabilities (cohort 2002-2006): Incident dialysis patients, adjustedfrom day 91 to one, two, and five years + 90 days, adjusted for age, gender, and primary diagnosis
0-19
20-44 96.0 (95.6-96.4) 91.6 (91.0-92.2) 77.9 (76.7-79.1)
45-64 89.7 (89.3-90.1) 81.0 (80.5-81.5) 55.4 (54.7-56.2)
65-74 81.5 (81.0-82.0) 68.0 (67.4-68.6) 36.8 (36.2-37.5)
75+ 73.6 (73.0-74.2) 54.9 (54.2-55.6) 21.0 (20.5-21.6)
Men 87.9 (87.6-88.2) 77.7 (77.3-78.1) 50.8 (50.3-51.4)
Women 88.2 (87.8-88.5) 78.7 (78.3-79.2) 53.6 (53.0-54.3)
Diabetes 85.7 (85.2-86.2) 72.8 (72.2-73.4) 40.8 (40.0-41.6)
Hypertension / renal vascular disease 88.4 (88.0-88.9) 78.6 (78.0-79.2) 52.0 (51.1-52.9)
Glomerulonephritis 92.1 (91.6-92.7) 84.6 (83.8-85.3) 62.2 (61.0-63.4)
Other cause 87.2 (86.9-87.5) 77.6 (77.2-78.1) 53.1 (52.5-53.8)
All 88.0 (87.8-88.3) 78.1 (77.8-78.4) 52.0 (51.5-52.4)
* Based on data from Austria, Belgium (Dutch-speaking), Belgium (French-speaking), Denmark, Finland, Greece, Iceland, Italy (Calabria), Norway, Spain (Andalusia), Spain (Aragon), Spain (Asturias), Spain (Basque country), Spain (Cantabria), Spain (Castile and León), Spain (Catalonia), Spain (Valencian region), Sweden, The Netherlands, United Kingdom (England and Wales) and United Kingdom (Scotland)

90 day 1 year 2 year
58
Survival in % (95% CI) Survival in % (95% CI) Survival in % (95% CI)
ALL COUNTRIES *
A6 SURVIVAL PROBABILITYPatient Survival on Dialysis
Table A.6.1390-day, one- and two-year survival probabilities (cohort 2005-2009): Incident dialysis patients, unadjustedfrom day 1 to 90 days, one, and two years, by age, gender, and primary diagnosis
0-19 98.4 (97.2-99.1) 94.9 (92.9-96.4) 93.4 (91.0-95.2)
20-44 99.0 (98.8-99.2) 96.1 (95.8-96.5) 91.9 (91.4-92.4)
45-64 96.7 (96.5-96.9) 89.0 (88.7-89.4) 80.6 (80.2-81.0)
65-74 93.2 (92.9-93.4) 80.1 (79.7-80.4) 67.2 (66.8-67.6)
75+ 88.9 (88.6-89.2) 70.6 (70.2-70.9) 54.0 (53.7-54.3)
Men 93.9 (93.8-94.1) 82.1 (81.8-82.3) 69.9 (69.7-70.2)
Women 93.3 (93.1-93.6) 81.4 (81.1-81.7) 69.7 (69.4-70.0)
Diabetes 94.7 (94.4-94.9) 82.4 (82.0-82.8) 68.2 (67.8-68.6)
Hypertension / renal vascular disease 93.7 (93.4-94.1) 80.7 (80.2-81.2) 66.7 (66.2-67.2)
Glomerulonephritis 97.3 (97.0-97.6) 91.2 (90.7-91.7) 84.0 (83.3-84.6)
Other cause 92.9 (92.7-93.1) 80.6 (80.3-80.9) 69.6 (69.3-69.9)
All 93.7 (93.6-93.9) 81.8 (81.6-82.0) 69.9 (69.6-70.1)
* Based on data from Austria, Belgium (Dutch-speaking), Belgium (French-speaking), Denmark, Finland, Greece, Iceland, Italy (Calabria), Norway, Spain (Andalusia), Spain (Aragon), Spain (Asturias), Spain (Basque country), Spain (Cantabria), Spain (Castile and León), Spain (Castile-La Mancha), Spain (Catalonia), Spain (Extremadura), Spain (Valencian region), Sweden, The Netherlands, United Kingdom (England, Northern Ireland, and Wales) and United Kingdom (Scotland)

90 day 1 year 2 year
59
Survival in % (95% CI) Survival in % (95% CI) Survival in % (95% CI)
ALL COUNTRIES *
A6 SURVIVAL PROBABILITYPatient Survival on Dialysis
Table A.6.1490-day, one- and two-year survival probabilities (cohort 2005-2009): Incident dialysis patients, adjustedfrom day 1 to 90 days, one, and two years, adjusted for age, gender, and primary diagnosis
0-19 98.2 (97.1-99.2) 94.7 (92.8-96.6) 93.0 (90.7-95.4)
20-44 99.0 (98.8-99.2) 96.2 (95.8-96.5) 91.9 (91.3-92.5)
45-64 96.9 (96.7-97.1) 89.7 (89.4-90.0) 81.6 (81.1-82.0)
65-74 93.8 (93.5-94.0) 81.4 (80.9-81.9) 69.0 (68.4-69.5)
75+ 89.6 (89.3-90.0) 71.9 (71.4-72.5) 55.6 (55.0-56.2)
Men 96.1 (96.0-96.3) 88.0 (87.8-88.2) 79.0 (78.7-79.4)
Women 95.8 (95.7-96.0) 87.9 (87.6-88.2) 79.5 (79.1-79.9)
Diabetes 96.2 (96.0-96.4) 86.9 (86.5-87.3) 75.7 (75.2-76.2)
Hypertension / renal vascular disease 96.5 (96.3-96.7) 89.0 (88.6-89.3) 80.0 (79.5-80.5)
Glomerulonephritis 97.6 (97.3-97.8) 92.2 (91.8-92.7) 85.8 (85.2-86.5)
Other cause 95.1 (94.9-95.3) 86.3 (86.0-86.6) 77.9 (77.5-78.3)
All 96.0 (95.9-96.1) 88.0 (87.8-88.2) 79.2 (78.9-79.5)
* Based on data from Austria, Belgium (Dutch-speaking), Belgium (French-speaking), Denmark, Finland, Greece, Iceland, Italy (Calabria), Norway, Spain (Andalusia), Spain (Aragon), Spain (Asturias), Spain (Basque country), Spain (Cantabria), Spain (Castile and León), Spain (Castile-La Mancha), Spain (Catalonia), Spain (Extremadura), Spain (Valencian region), Sweden, The Netherlands, United Kingdom (England, Northern Ireland, and Wales) and United Kingdom (Scotland)

1 year 2 year
60
Survival in % (95% CI) Survival in % (95% CI)
ALL COUNTRIES *
A6 SURVIVAL PROBABILITYPatient Survival on Dialysis
Table A.6.15One- and two-year survival probabilities (cohort 2005-2009): Incident dialysis patients, unadjustedfrom day 91 to one and two years + 90 days, by age, gender, and primary diagnosis
0-19 95.9 (93.8-97.2) 94.4 (91.9-96.1)
20-44 96.2 (95.8-96.5) 91.8 (91.2-92.3)
45-64 89.9 (89.5-90.2) 81.2 (80.8-81.6)
65-74 82.4 (82.0-82.8) 69.2 (68.8-69.6)
75+ 74.5 (74.1-74.9) 56.5 (56.1-56.8)
Men 84.1 (83.9-84.4) 71.4 (71.2-71.7)
Women 84.0 (83.7-84.4) 71.7 (71.4-72.1)
Diabetes 83.2 (82.7-83.6) 68.6 (68.2-69.1)
Hypertension / renal vascular disease 82.2 (81.7-82.7) 67.5 (67.0-68.0)
Glomerulonephritis 92.0 (91.5-92.5) 84.3 (83.7-84.9)
Other cause 83.7 (83.4-84.0) 72.2 (71.8-72.5)
All 84.1 (83.9-84.3) 71.6 (71.3-71.8)
* Based on data from Austria, Belgium (Dutch-speaking), Belgium (French-speaking), Denmark, Finland, Greece, Iceland, Italy (Calabria), Norway, Spain (Andalusia), Spain (Aragon), Spain (Asturias), Spain (Basque country), Spain (Cantabria), Spain (Castile and León), Spain (Castile-La Mancha), Spain (Catalonia), Spain (Extremadura), Spain (Valencian region), Sweden, The Netherlands, United Kingdom (England, Northern Ireland, and Wales) and United Kingdom (Scotland)

1 year 2 year
61
Survival in % (95% CI) Survival in % (95% CI)
ALL COUNTRIES *
A6 SURVIVAL PROBABILITYPatient Survival on Dialysis
Table A.6.16One- and two-year survival probabilities (cohort 2005-2009): Incident dialysis patients, adjustedfrom day 91 to one and two years + 90 days, adjusted for age, gender, and primary diagnosis
0-19
20-44 96.2 (95.8-96.6) 91.8 (91.2-92.4)
45-64 90.5 (90.1-90.8) 82.3 (81.8-82.8)
65-74 83.5 (83.0-83.9) 71.0 (70.4-71.5)
75+ 75.5 (74.9-76.0) 58.2 (57.5-58.8)
Men 89.1 (88.9-89.3) 79.9 (79.5-80.2)
Women 89.3 (89.0-89.6) 80.6 (80.2-81.1)
Diabetes 87.3 (86.9-87.7) 75.9 (75.3-76.4)
Hypertension / renal vascular disease 89.6 (89.2-90.0) 80.3 (79.7-80.8)
Glomerulonephritis 92.9 (92.4-93.4) 86.2 (85.5-86.9)
Other cause 88.3 (88.0-88.6) 79.7 (79.3-80.1)
All 89.2 (89.0-89.4) 80.2 (79.9-80.5)
* Based on data from Austria, Belgium (Dutch-speaking), Belgium (French-speaking), Denmark, Finland, Greece, Iceland, Italy (Calabria), Norway, Spain (Andalusia), Spain (Aragon), Spain (Asturias), Spain (Basque country), Spain (Cantabria), Spain (Castile and León), Spain (Castile-La Mancha), Spain (Catalonia), Spain (Extremadura), Spain (Valencian region), Sweden, The Netherlands, United Kingdom (England, Northern Ireland, and Wales) and United Kingdom (Scotland)

1 year 2 year 5 year
62
Survival in % (95% CI) Survival in % (95% CI) Survival in % (95% CI)
ALL COUNTRIES *
A6 SURVIVAL PROBABILITYPatient Survival after First Transplant (deceased donor)
Table A.6.17One-, two- and five-year survival probabilities (cohort 2002-2006): First transplant patients (deceased donor), unadjustedfrom day of transplant to one, two, and five years, by age, gender, and primary diagnosis
0-19 98.4 (96.8-99.2) 97.5 (95.7-98.6) 95.4 (93.3-96.9)
20-44 97.9 (97.5-98.3) 97.1 (96.6-97.5) 93.9 (93.3-94.5)
45-64 95.0 (94.5-95.5) 92.7 (92.1-93.2) 85.2 (84.5-85.8)
65+ 88.0 (86.4-89.4) 83.6 (81.9-85.1) 69.8 (68.1-71.4)
Men 95.2 (94.7-95.6) 93.2 (92.7-93.7) 86.3 (85.7-86.9)
Women 96.0 (95.5-96.5) 94.1 (93.4-94.6) 88.5 (87.7-89.2)
Diabetes 93.1 (92.1-94.1) 90.3 (89.2-91.4) 80.3 (78.9-81.6)
Hypertension / renal vascular disease 93.1 (91.8-94.2) 90.4 (88.9-91.6) 81.3 (79.6-82.8)
Glomerulonephritis 96.8 (96.2-97.3) 95.6 (94.9-96.2) 90.7 (89.8-91.6)
Other cause 96.1 (95.6-96.5) 94.2 (93.7-94.7) 88.6 (87.9-89.2)
All 95.5 (95.1-95.8) 93.5 (93.1-93.9) 87.1 (86.6-87.6)
* Based on data from Austria, Belgium (Dutch-speaking), Belgium (French-speaking), Denmark, Finland, Greece, Iceland, Italy (Calabria), Norway, Spain (Aragon), Spain (Asturias), Spain (Basque country), Spain (Cantabria), Spain (Castile and León), Spain (Catalonia), Spain (Valencian region), Sweden, The Netherlands, United Kingdom (England and Wales) and United Kingdom (Scotland)

1 year 2 year 5 year
63
Survival in % (95% CI) Survival in % (95% CI) Survival in % (95% CI)
ALL COUNTRIES *
A6 SURVIVAL PROBABILITYPatient Survival after First Transplant (deceased donor)
Table A.6.18One-, two- and five-year survival probabilities (cohort 2002-2006): First transplant patients (deceased donor), adjustedfrom day of transplant to one, two, and five years, adjusted for age, gender, and primary diagnosis
0-19
20-44 98.1 (97.7-98.4) 97.3 (96.8-97.7) 94.3 (93.7-95.0)
45-64 95.5 (95.0-95.9) 93.3 (92.8-93.9) 86.3 (85.5-87.1)
65+ 89.2 (87.6-90.8) 85.1 (83.4-87.0) 72.2 (69.9-74.5)
Men 97.1 (96.8-97.4) 95.8 (95.4-96.2) 91.2 (90.6-91.7)
Women 97.3 (97.0-97.7) 96.0 (95.6-96.5) 92.1 (91.5-92.8)
Diabetes 95.2 (94.5-96.0) 93.2 (92.3-94.1) 85.6 (84.3-87.0)
Hypertension / renal vascular disease 96.5 (95.8-97.2) 95.0 (94.2-95.9) 89.9 (88.7-91.2)
Glomerulonephritis 97.6 (97.2-98.1) 96.7 (96.2-97.3) 93.0 (92.3-93.8)
Other cause 97.3 (96.9-97.6) 95.9 (95.5-96.3) 91.8 (91.2-92.4)
All 97.2 (96.9-97.4) 95.9 (95.6-96.2) 91.6 (91.1-92.0)
* Based on data from Austria, Belgium (Dutch-speaking), Belgium (French-speaking), Denmark, Finland, Greece, Iceland, Italy (Calabria), Norway, Spain (Aragon), Spain (Asturias), Spain (Basque country), Spain (Cantabria), Spain (Castile and León), Spain (Catalonia), Spain (Valencian region), Sweden, The Netherlands, United Kingdom (England and Wales) and United Kingdom (Scotland)

1 year 2 year
64
Survival in % (95% CI) Survival in % (95% CI)
ALL COUNTRIES *
A6 SURVIVAL PROBABILITYPatient Survival after First Transplant (deceased donor)
Table A.6.19One- and two-year survival probabilities (cohort 2005-2009): First transplant patients (deceased donor), unadjustedfrom day of transplant to one and two years, by age, gender, and primary diagnosis
0-19 97.7 (95.9-98.7) 97.3 (95.4-98.4)
20-44 97.9 (97.6-98.3) 97.0 (96.5-97.4)
45-64 95.7 (95.3-96.1) 93.6 (93.1-94.1)
65+ 90.9 (89.6-92.0) 86.7 (85.2-88.0)
Men 95.7 (95.3-96.1) 93.7 (93.2-94.1)
Women 96.6 (96.2-97.0) 95.0 (94.4-95.5)
Diabetes 94.1 (93.2-94.9) 91.6 (90.5-92.5)
Hypertension / renal vascular disease 94.3 (93.2-95.3) 91.7 (90.4-92.9)
Glomerulonephritis 97.4 (96.8-97.9) 96.0 (95.3-96.6)
Other cause 96.4 (96.0-96.8) 94.7 (94.2-95.1)
All 96.0 (95.7-96.3) 94.2 (93.8-94.5)
* Based on data from Austria, Belgium (Dutch-speaking), Belgium (French-speaking), Denmark, Finland, Greece, Iceland, Italy (Calabria), Norway, Spain (Aragon), Spain (Asturias), Spain (Basque country), Spain (Cantabria), Spain (Castile and León), Spain (Catalonia), Spain (Extremadura), Spain (Valencian region), Sweden, The Netherlands, United Kingdom (England, Northern Ireland, and Wales) and United Kingdom (Scotland)

1 year 2 year
65
Survival in % (95% CI) Survival in % (95% CI)
ALL COUNTRIES *
A6 SURVIVAL PROBABILITYPatient Survival after First Transplant (deceased donor)
Table A.6.20One- and two-year survival probabilities (cohort 2005-2009): First transplant patients (deceased donor), adjustedfrom day of transplant to one and two years, adjusted for age, gender, and primary diagnosis
0-19
20-44 98.1 (97.8-98.5) 97.2 (96.8-97.6)
45-64 96.1 (95.7-96.5) 94.2 (93.7-94.7)
65+ 91.8 (90.5-93.1) 87.9 (86.4-89.5)
Men 97.2 (96.9-97.5) 95.9 (95.5-96.3)
Women 97.6 (97.3-98.0) 96.4 (96.0-96.9)
Diabetes 95.7 (95.0-96.3) 93.7 (92.9-94.6)
Hypertension / renal vascular disease 96.8 (96.2-97.5) 95.3 (94.5-96.1)
Glomerulonephritis 98.1 (97.7-98.5) 97.0 (96.5-97.5)
Other cause 97.3 (97.0-97.6) 96.0 (95.6-96.4)
All 97.4 (97.1-97.6) 96.1 (95.8-96.4)
* Based on data from Austria, Belgium (Dutch-speaking), Belgium (French-speaking), Denmark, Finland, Greece, Iceland, Italy (Calabria), Norway, Spain (Aragon), Spain (Asturias), Spain (Basque country), Spain (Cantabria), Spain (Castile and León), Spain (Catalonia), Spain (Extremadura), Spain (Valencian region), Sweden, The Netherlands, United Kingdom (England, Northern Ireland, and Wales) and United Kingdom (Scotland)

1 year 2 year 5 year
66
Survival in % (95% CI) Survival in % (95% CI) Survival in % (95% CI)
ALL COUNTRIES *
A6 SURVIVAL PROBABILITYPatient Survival after First Transplant (living donor)
Table A.6.21One-, two- and five-year survival probabilities (cohort 2002-2006): First transplant patients (living donor), unadjustedfrom day of transplant to one, two, and five years, by age, gender, and primary diagnosis
0-19 98.3 (96.3-99.2) 98.3 (96.3-99.2) 96.6 (94.2-98.0)
20-44 99.0 (98.4-99.3) 98.3 (97.7-98.8) 97.4 (96.7-98.0)
45-64 97.0 (96.0-97.8) 96.0 (94.9-96.9) 92.4 (91.0-93.5)
65+ 93.8 (89.7-96.3) 90.7 (86.2-93.8) 82.0 (77.0-85.9)
Men 97.8 (97.1-98.3) 97.0 (96.3-97.6) 94.7 (93.8-95.4)
Women 98.3 (97.5-98.9) 97.4 (96.5-98.1) 95.1 (93.9-96.0)
Diabetes 94.5 (91.5-96.4) 91.9 (88.6-94.3) 85.4 (81.6-88.4)
Hypertension / renal vascular disease 97.8 (95.5-98.9) 96.9 (94.4-98.3) 92.2 (89.0-94.5)
Glomerulonephritis 99.1 (98.3-99.5) 98.5 (97.6-99.1) 97.8 (96.7-98.5)
Other cause 97.9 (97.1-98.4) 97.2 (96.4-97.8) 94.9 (93.9-95.7)
All 98.0 (97.5-98.4) 97.1 (96.6-97.6) 94.8 (94.1-95.4)
* Based on data from Austria, Belgium (Dutch-speaking), Belgium (French-speaking), Denmark, Finland, Greece, Iceland, Italy (Calabria), Norway, Spain (Aragon), Spain (Asturias), Spain (Basque country), Spain (Cantabria), Spain (Castile and León), Spain (Catalonia), Spain (Valencian region), Sweden, The Netherlands, United Kingdom (England and Wales) and United Kingdom (Scotland)

1 year 2 year 5 year
67
Survival in % (95% CI) Survival in % (95% CI) Survival in % (95% CI)
ALL COUNTRIES *
A6 SURVIVAL PROBABILITYPatient Survival after First Transplant (living donor)
Table A.6.22One-, two- and five-year survival probabilities (cohort 2002-2006): First transplant patients (living donor), adjustedfrom day of transplant to one, two, and five years, adjusted for age, gender, and primary diagnosis
0-19
20-44 98.9 (98.5-99.4) 98.3 (97.7-98.8) 97.3 (96.6-98.1)
45-64 97.2 (96.4-98.1) 96.2 (95.2-97.2) 92.7 (91.2-94.1)
65+ 95.0 (91.9-98.1) 92.9 (89.4-96.6) 85.2 (80.2-90.5)
Men 98.0 (97.4-98.5) 97.2 (96.6-97.9) 95.0 (94.1-95.9)
Women 98.3 (97.6-99.0) 97.4 (96.5-98.2) 95.0 (93.9-96.2)
Diabetes 95.4 (93.2-97.6) 93.2 (90.6-95.8) 87.6 (84.2-91.1)
Hypertension / renal vascular disease 98.5 (97.3-99.6) 97.8 (96.5-99.2) 94.4 (92.2-96.6)
Glomerulonephritis 99.0 (98.4-99.6) 98.4 (97.6-99.2) 97.6 (96.7-98.6)
Other cause 97.7 (97.1-98.4) 97.0 (96.2-97.8) 94.5 (93.5-95.6)
All 98.1 (97.7-98.5) 97.3 (96.8-97.8) 95.0 (94.3-95.8)
* Based on data from Austria, Belgium (Dutch-speaking), Belgium (French-speaking), Denmark, Finland, Greece, Iceland, Italy (Calabria), Norway, Spain (Aragon), Spain (Asturias), Spain (Basque country), Spain (Cantabria), Spain (Castile and León), Spain (Catalonia), Spain (Valencian region), Sweden, The Netherlands, United Kingdom (England and Wales) and United Kingdom (Scotland)

1 year 2 year
68
Survival in % (95% CI) Survival in % (95% CI)
ALL COUNTRIES *
A6 SURVIVAL PROBABILITYPatient Survival after First Transplant (living donor)
Table A.6.23One- and two-year survival probabilities (cohort 2005-2009): First transplant patients (living donor), unadjustedfrom day of transplant to one and two years, by age, gender, and primary diagnosis
0-19 99.0 (97.4-99.6) 99.0 (97.4-99.6)
20-44 99.4 (99.0-99.6) 99.0 (98.6-99.3)
45-64 97.7 (97.0-98.2) 96.5 (95.7-97.2)
65+ 94.6 (91.9-96.4) 92.1 (89.2-94.3)
Men 98.3 (97.8-98.7) 97.5 (96.9-97.9)
Women 98.4 (97.8-98.9) 97.7 (97.0-98.3)
Diabetes 96.0 (93.9-97.4) 93.8 (91.4-95.6)
Hypertension / renal vascular disease 95.9 (93.6-97.3) 95.2 (92.8-96.8)
Glomerulonephritis 99.3 (98.7-99.6) 98.8 (98.1-99.3)
Other cause 98.5 (97.9-98.8) 97.8 (97.2-98.2)
All 98.3 (98.0-98.6) 97.6 (97.1-97.9)
* Based on data from Austria, Belgium (Dutch-speaking), Belgium (French-speaking), Denmark, Finland, Greece, Iceland, Italy (Calabria), Norway, Spain (Aragon), Spain (Asturias), Spain (Basque country), Spain (Cantabria), Spain (Castile and León), Spain (Catalonia), Spain (Extremadura), Spain (Valencian region), Sweden, The Netherlands, United Kingdom (England, Northern Ireland, and Wales) and United Kingdom (Scotland)

1 year 2 year
69
Survival in % (95% CI) Survival in % (95% CI)
ALL COUNTRIES *
A6 SURVIVAL PROBABILITYPatient Survival after First Transplant (living donor)
Table A.6.24One- and two-year survival probabilities (cohort 2005-2009): First transplant patients (living donor), adjustedfrom day of transplant to one and two years, adjusted for age, gender, and primary diagnosis
0-19
20-44 99.4 (99.0-99.7) 99.0 (98.6-99.4)
45-64 97.7 (97.1-98.3) 96.7 (95.9-97.4)
65+ 95.3 (93.2-97.5) 93.4 (90.9-96.0)
Men 98.7 (98.3-99.1) 98.1 (97.6-98.5)
Women 98.6 (98.2-99.1) 98.0 (97.5-98.6)
Diabetes 97.3 (96.0-98.6) 95.7 (94.1-97.4)
Hypertension / renal vascular disease 97.6 (96.4-98.7) 97.2 (95.9-98.4)
Glomerulonephritis 99.3 (98.9-99.8) 98.9 (98.3-99.4)
Other cause 98.6 (98.2-99.1) 98.0 (97.5-98.5)
All 98.7 (98.4-99.0) 98.1 (97.7-98.5)
* Based on data from Austria, Belgium (Dutch-speaking), Belgium (French-speaking), Denmark, Finland, Greece, Iceland, Italy (Calabria), Norway, Spain (Aragon), Spain (Asturias), Spain (Basque country), Spain (Cantabria), Spain (Castile and León), Spain (Catalonia), Spain (Extremadura), Spain (Valencian region), Sweden, The Netherlands, United Kingdom (England, Northern Ireland, and Wales) and United Kingdom (Scotland)

1 year 2 year 5 year
70
Survival in % (95% CI) Survival in % (95% CI) Survival in % (95% CI)
ALL COUNTRIES *
A6 SURVIVAL PROBABILITYGraft Survival after First Transplant (deceased donor)
Table A.6.25One-, two- and five-year survival probabilities (cohort 2002-2006): First graft (deceased donor), unadjustedfrom day of transplant to one, two, and five years, by age, gender, and primary diagnosis
0-19 91.5 (89.0-93.5) 89.7 (87.0-91.9) 77.6 (74.5-80.3)
20-44 92.3 (91.6-93.0) 89.7 (88.9-90.4) 82.6 (81.7-83.5)
45-64 89.6 (88.9-90.2) 86.7 (86.0-87.3) 77.2 (76.4-77.9)
65+ 81.1 (79.4-82.7) 76.3 (74.6-78.0) 61.9 (60.3-63.4)
Men 89.8 (89.2-90.4) 86.8 (86.2-87.4) 77.1 (76.4-77.7)
Women 89.7 (89.0-90.4) 86.9 (86.1-87.7) 78.6 (77.7-79.4)
Diabetes 88.9 (87.7-90.1) 85.4 (84.1-86.6) 73.5 (72.1-74.8)
Hypertension / renal vascular disease 87.0 (85.4-88.4) 82.9 (81.3-84.4) 71.2 (69.5-72.8)
Glomerulonephritis 90.9 (90.0-91.8) 88.5 (87.5-89.4) 80.1 (79.0-81.2)
Other cause 90.2 (89.6-90.8) 87.4 (86.7-88.0) 79.0 (78.2-79.7)
All 89.8 (89.3-90.2) 86.8 (86.4-87.3) 77.6 (77.1-78.2)
* Based on data from Austria, Belgium (Dutch-speaking), Belgium (French-speaking), Denmark, Finland, Greece, Iceland, Italy (Calabria), Norway, Spain (Aragon), Spain (Asturias), Spain (Basque country), Spain (Cantabria), Spain (Castile and León), Spain (Catalonia), Spain (Valencian region), Sweden, The Netherlands, United Kingdom (England and Wales) and United Kingdom (Scotland)

1 year 2 year 5 year
71
Survival in % (95% CI) Survival in % (95% CI) Survival in % (95% CI)
ALL COUNTRIES *
A6 SURVIVAL PROBABILITYGraft Survival after First Transplant (deceased donor)
Table A.6.26One-, two- and five-year survival probabilities (cohort 2002-2006): First graft (deceased donor), adjustedfrom day of transplant to one, two, and five years, adjusted for age, gender, and primary diagnosis
0-19 91.1 (88.6-93.8) 89.2 (86.4-92.1) 76.6 (72.8-80.5)
20-44 92.6 (91.9-93.3) 90.0 (89.2-90.9) 83.1 (82.1-84.2)
45-64 89.9 (89.2-90.6) 87.1 (86.4-87.9) 77.8 (76.9-78.8)
65+ 82.1 (80.1-84.1) 77.5 (75.3-79.7) 63.4 (60.9-65.9)
Men 91.1 (90.5-91.6) 88.4 (87.7-89.0) 79.5 (78.6-80.3)
Women 90.7 (89.9-91.4) 88.1 (87.3-89.0) 80.3 (79.3-81.4)
Diabetes 89.9 (88.7-91.2) 86.6 (85.3-88.0) 75.4 (73.7-77.2)
Hypertension / renal vascular disease 89.3 (87.9-90.8) 86.0 (84.3-87.6) 75.9 (73.8-78.0)
Glomerulonephritis 91.4 (90.5-92.4) 89.2 (88.2-90.2) 81.2 (79.9-82.5)
Other cause 90.9 (90.2-91.5) 88.3 (87.5-89.0) 80.4 (79.4-81.3)
All 90.9 (90.5-91.4) 88.3 (87.8-88.8) 79.8 (79.1-80.5)
* Based on data from Austria, Belgium (Dutch-speaking), Belgium (French-speaking), Denmark, Finland, Greece, Iceland, Italy (Calabria), Norway, Spain (Aragon), Spain (Asturias), Spain (Basque country), Spain (Cantabria), Spain (Castile and León), Spain (Catalonia), Spain (Valencian region), Sweden, The Netherlands, United Kingdom (England and Wales) and United Kingdom (Scotland)

1 year 2 year
72
Survival in % (95% CI) Survival in % (95% CI)
ALL COUNTRIES *
A6 SURVIVAL PROBABILITYGraft Survival after First Transplant (deceased donor)
Table A.6.27One- and two-year survival probabilities (cohort 2005-2009): First graft (deceased donor), unadjustedfrom day of transplant to one and two years, by age, gender, and primary diagnosis
0-19 91.4 (88.8-93.4) 88.6 (85.8-90.9)
20-44 92.8 (92.2-93.4) 90.4 (89.7-91.1)
45-64 90.2 (89.6-90.8) 87.3 (86.7-87.9)
65+ 84.6 (83.1-86.0) 80.4 (78.9-81.9)
Men 90.5 (90.0-91.0) 87.5 (86.9-88.0)
Women 90.6 (90.0-91.3) 88.0 (87.3-88.7)
Diabetes 89.3 (88.2-90.3) 85.9 (84.7-87.0)
Hypertension / renal vascular disease 88.5 (87.1-89.8) 85.4 (83.9-86.7)
Glomerulonephritis 91.5 (90.6-92.3) 88.7 (87.7-89.6)
Other cause 91.0 (90.4-91.5) 88.2 (87.6-88.8)
All 90.6 (90.1-91.0) 87.7 (87.2-88.1)
* Based on data from Austria, Belgium (Dutch-speaking), Belgium (French-speaking), Denmark, Finland, Greece, Iceland, Italy (Calabria), Norway, Spain (Aragon), Spain (Asturias), Spain (Basque country), Spain (Cantabria), Spain (Castile and León), Spain (Catalonia), Spain (Extremadura), Spain (Valencian region), Sweden, The Netherlands, United Kingdom (England, Northern Ireland, and Wales) and United Kingdom (Scotland)

1 year 2 year
73
Survival in % (95% CI) Survival in % (95% CI)
ALL COUNTRIES *
A6 SURVIVAL PROBABILITYGraft Survival after First Transplant (deceased donor)
Table A.6.28One- and two-year survival probabilities (cohort 2005-2009): First graft (deceased donor), adjustedfrom day of transplant to one and two years, adjusted for age, gender, and primary diagnosis
0-19 90.9 (88.3-93.6) 88.0 (85.0-91.0)
20-44 93.1 (92.4-93.7) 90.6 (89.9-91.4)
45-64 90.4 (89.8-91.1) 87.6 (86.9-88.3)
65+ 85.1 (83.4-86.8) 81.0 (79.1-82.8)
Men 91.5 (91.0-92.1) 88.8 (88.2-89.4)
Women 91.4 (90.7-92.1) 88.9 (88.1-89.7)
Diabetes 90.1 (88.9-91.2) 86.8 (85.6-88.1)
Hypertension / renal vascular disease 90.3 (88.9-91.6) 87.6 (86.1-89.1)
Glomerulonephritis 91.9 (91.1-92.8) 89.3 (88.3-90.3)
Other cause 91.6 (91.0-92.2) 89.0 (88.3-89.7)
All 91.5 (91.0-91.9) 88.8 (88.3-89.3)
* Based on data from Austria, Belgium (Dutch-speaking), Belgium (French-speaking), Denmark, Finland, Greece, Iceland, Italy (Calabria), Norway, Spain (Aragon), Spain (Asturias), Spain (Basque country), Spain (Cantabria), Spain (Castile and León), Spain (Catalonia), Spain (Extremadura), Spain (Valencian region), Sweden, The Netherlands, United Kingdom (England, Northern Ireland, and Wales) and United Kingdom (Scotland)

1 year 2 year 5 year
74
Survival in % (95% CI) Survival in % (95% CI) Survival in % (95% CI)
ALL COUNTRIES *
A6 SURVIVAL PROBABILITYGraft Survival after First Transplant (living donor)
Table A.6.29One-, two- and five-year survival probabilities (cohort 2002-2006): First graft (living donor), unadjustedfrom day of transplant to one, two, and five years, by age, gender, and primary diagnosis
0-19 94.1 (91.3-96.0) 93.0 (90.0-95.1) 84.0 (80.5-86.9)
20-44 94.9 (93.9-95.8) 93.3 (92.2-94.2) 88.5 (87.2-89.7)
45-64 94.9 (93.7-95.9) 93.3 (92.0-94.4) 87.6 (86.0-89.1)
65+ 90.2 (85.7-93.4) 86.1 (81.3-89.7) 78.9 (73.9-83.0)
Men 94.6 (93.7-95.4) 93.0 (92.0-93.9) 87.5 (86.3-88.6)
Women 94.7 (93.5-95.7) 92.8 (91.5-93.9) 87.1 (85.5-88.5)
Diabetes 90.9 (87.5-93.4) 88.0 (84.4-90.8) 78.2 (74.4-81.6)
Hypertension / renal vascular disease 94.4 (91.4-96.3) 91.9 (88.6-94.2) 83.1 (79.4-86.2)
Glomerulonephritis 96.0 (94.7-97.0) 93.9 (92.4-95.1) 89.3 (87.5-90.9)
Other cause 94.1 (93.0-95.0) 92.7 (91.6-93.7) 87.4 (86.0-88.6)
All 94.6 (93.9-95.3) 92.9 (92.1-93.6) 87.3 (86.4-88.2)
* Based on data from Austria, Belgium (Dutch-speaking), Belgium (French-speaking), Denmark, Finland, Greece, Iceland, Italy (Calabria), Norway, Spain (Aragon), Spain (Asturias), Spain (Basque country), Spain (Cantabria), Spain (Castile and León), Spain (Catalonia), Spain (Valencian region), Sweden, The Netherlands, United Kingdom (England and Wales) and United Kingdom (Scotland)

1 year 2 year 5 year
75
Survival in % (95% CI) Survival in % (95% CI) Survival in % (95% CI)
ALL COUNTRIES *
A6 SURVIVAL PROBABILITYGraft Survival after First Transplant (living donor)
Table A.6.30One-, two- and five-year survival probabilities (cohort 2002-2006): First graft (living donor), adjustedfrom day of transplant to one, two, and five years, adjusted for age, gender, and primary diagnosis
0-19 94.0 (91.3-96.6) 92.7 (89.8-95.6) 83.2 (79.1-87.5)
20-44 94.6 (93.6-95.7) 92.9 (91.7-94.1) 87.8 (86.4-89.3)
45-64 94.8 (93.6-96.0) 93.1 (91.7-94.5) 87.3 (85.5-89.1)
65+ 90.8 (86.8-95.1) 87.6 (82.9-92.5) 81.0 (75.4-87.0)
Men 94.4 (93.5-95.4) 92.7 (91.7-93.8) 86.9 (85.6-88.4)
Women 94.3 (93.0-95.5) 92.3 (90.8-93.7) 86.2 (84.4-88.1)
Diabetes 91.0 (87.8-94.2) 88.1 (84.5-91.8) 78.4 (73.9-83.1)
Hypertension / renal vascular disease 94.5 (92.0-97.0) 92.0 (89.1-95.0) 83.4 (79.4-87.6)
Glomerulonephritis 95.9 (94.7-97.1) 93.8 (92.3-95.3) 89.1 (87.2-91.1)
Other cause 93.9 (92.9-95.0) 92.5 (91.3-93.7) 87.1 (85.5-88.6)
All 94.4 (93.6-95.1) 92.6 (91.7-93.4) 86.7 (85.6-87.8)
* Based on data from Austria, Belgium (Dutch-speaking), Belgium (French-speaking), Denmark, Finland, Greece, Iceland, Italy (Calabria), Norway, Spain (Aragon), Spain (Asturias), Spain (Basque country), Spain (Cantabria), Spain (Castile and León), Spain (Catalonia), Spain (Valencian region), Sweden, The Netherlands, United Kingdom (England and Wales) and United Kingdom (Scotland)

1 year 2 year
76
Survival in % (95% CI) Survival in % (95% CI)
ALL COUNTRIES *
A6 SURVIVAL PROBABILITYGraft Survival after First Transplant (living donor)
Table A.6.31One- and two-year survival probabilities (cohort 2005-2009): First graft (living donor), unadjustedfrom day of transplant to one and two years, by age, gender, and primary diagnosis
0-19 95.3 (92.9-96.9) 93.5 (90.9-95.4)
20-44 95.7 (94.9-96.4) 94.3 (93.4-95.0)
45-64 95.7 (94.8-96.4) 93.8 (92.8-94.7)
65+ 92.7 (89.8-94.8) 90.0 (86.8-92.4)
Men 95.5 (94.8-96.1) 94.0 (93.2-94.7)
Women 95.4 (94.5-96.2) 93.4 (92.3-94.3)
Diabetes 94.1 (91.6-95.8) 91.4 (88.7-93.5)
Hypertension / renal vascular disease 92.2 (89.5-94.2) 90.1 (87.3-92.4)
Glomerulonephritis 96.0 (94.9-96.9) 93.8 (92.5-94.8)
Other cause 95.4 (94.6-96.1) 94.1 (93.3-94.9)
All 95.5 (94.9-96.0) 93.8 (93.1-94.3)
* Based on data from Austria, Belgium (Dutch-speaking), Belgium (French-speaking), Denmark, Finland, Greece, Iceland, Italy (Calabria), Norway, Spain (Aragon), Spain (Asturias), Spain (Basque country), Spain (Cantabria), Spain (Castile and León), Spain (Catalonia), Spain (Extremadura), Spain (Valencian region), Sweden, The Netherlands, United Kingdom (England, Northern Ireland, and Wales) and United Kingdom (Scotland)

1 year 2 year
77
Survival in % (95% CI) Survival in % (95% CI)
ALL COUNTRIES *
A6 SURVIVAL PROBABILITYGraft Survival after First Transplant (living donor)
Table A.6.32One- and two-year survival probabilities (cohort 2005-2009): First graft (living donor), adjustedfrom day of transplant to one and two years, adjusted for age, gender, and primary diagnosis
0-19 94.4 (91.9-96.9) 92.6 (89.8-95.4)
20-44 95.5 (94.7-96.4) 94.1 (93.1-95.0)
45-64 95.4 (94.5-96.3) 93.5 (92.5-94.6)
65+ 92.8 (90.1-95.6) 90.5 (87.4-93.7)
Men 95.3 (94.6-96.1) 93.9 (93.1-94.7)
Women 95.0 (94.0-96.0) 92.8 (91.6-93.9)
Diabetes 94.1 (92.0-96.3) 91.5 (89.0-94.1)
Hypertension / renal vascular disease 92.3 (89.9-94.9) 90.3 (87.6-93.1)
Glomerulonephritis 95.9 (94.9-96.9) 93.6 (92.3-94.9)
Other cause 95.4 (94.6-96.2) 94.1 (93.2-94.9)
All 95.2 (94.6-95.8) 93.5 (92.8-94.1)
* Based on data from Austria, Belgium (Dutch-speaking), Belgium (French-speaking), Denmark, Finland, Greece, Iceland, Italy (Calabria), Norway, Spain (Aragon), Spain (Asturias), Spain (Basque country), Spain (Cantabria), Spain (Castile and León), Spain (Catalonia), Spain (Extremadura), Spain (Valencian region), Sweden, The Netherlands, United Kingdom (England, Northern Ireland, and Wales) and United Kingdom (Scotland)

78
Figure A.6.1Adjusted survival (cohort 2002-2006): Incident dialysis patients and patients receiving a first transplant (between 2002 and 2006)from day 91, by modality, adjusted for age, gender, and primary diagnosis
A6 SURVIVAL PROBABILITYPatient Survival by Modality and Primary Diagnosis
Figure A.6.2Adjusted survival (cohort 2002-2006): Incident haemodialysis patientsfrom day 91, by primary diagnosis, adjusted for age and gender
Figure A.6.3Adjusted survival (cohort 2002-2006): Incident peritoneal dialysis patientsfrom day 91, by primary diagnosis, adjusted for age and gender
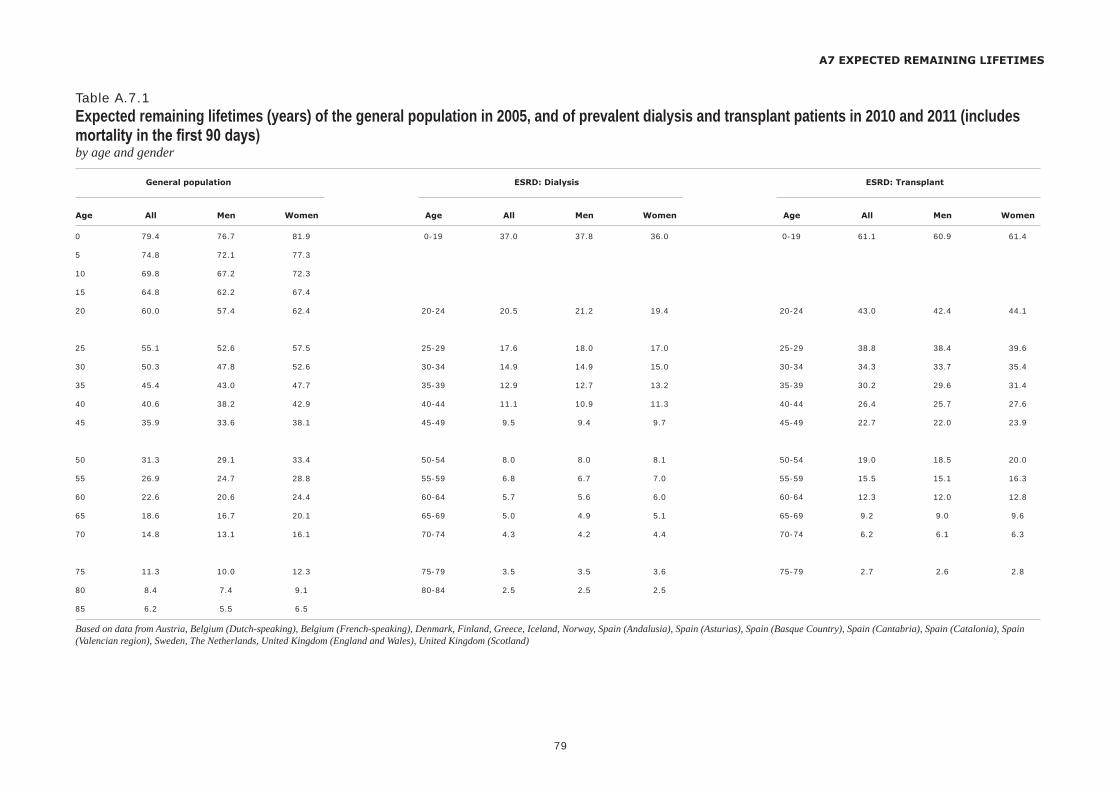
Age All Men Women Age All Men Women Age All Men Women
General population ESRD: Dialysis ESRD: Transplant
79
A7 EXPECTED REMAINING LIFETIMES
Table A.7.1Expected remaining lifetimes (years) of the general population in 2005, and of prevalent dialysis and transplant patients in 2010 and 2011 (includes mortality in the first 90 days)by age and gender
0 79.4 76.7 81.9 0-19 37.0 37.8 36.0 0-19 61.1 60.9 61.4
5 74.8 72.1 77.3
10 69.8 67.2 72.3
15 64.8 62.2 67.4
20 60.0 57.4 62.4 20-24 20.5 21.2 19.4 20-24 43.0 42.4 44.1
25 55.1 52.6 57.5 25-29 17.6 18.0 17.0 25-29 38.8 38.4 39.6
30 50.3 47.8 52.6 30-34 14.9 14.9 15.0 30-34 34.3 33.7 35.4
35 45.4 43.0 47.7 35-39 12.9 12.7 13.2 35-39 30.2 29.6 31.4
40 40.6 38.2 42.9 40-44 11.1 10.9 11.3 40-44 26.4 25.7 27.6
45 35.9 33.6 38.1 45-49 9.5 9.4 9.7 45-49 22.7 22.0 23.9
50 31.3 29.1 33.4 50-54 8.0 8.0 8.1 50-54 19.0 18.5 20.0
55 26.9 24.7 28.8 55-59 6.8 6.7 7.0 55-59 15.5 15.1 16.3
60 22.6 20.6 24.4 60-64 5.7 5.6 6.0 60-64 12.3 12.0 12.8
65 18.6 16.7 20.1 65-69 5.0 4.9 5.1 65-69 9.2 9.0 9.6
70 14.8 13.1 16.1 70-74 4.3 4.2 4.4 70-74 6.2 6.1 6.3
75 11.3 10.0 12.3 75-79 3.5 3.5 3.6 75-79 2.7 2.6 2.8
80 8.4 7.4 9.1 80-84 2.5 2.5 2.5
85 6.2 5.5 6.5
Based on data from Austria, Belgium (Dutch-speaking), Belgium (French-speaking), Denmark, Finland, Greece, Iceland, Norway, Spain (Andalusia), Spain (Asturias), Spain (Basque Country), Spain (Cantabria), Spain (Catalonia), Spain (Valencian region), Sweden, The Netherlands, United Kingdom (England and Wales), United Kingdom (Scotland)


III Reference Tables - Section B

82
General population % Coverage of general of whole country/region population by the registry in thousands
B1 AFFILIATED REGISTRY INFORMATION FOR 2011
Table B.1.1General population of the country/region and percent coverage of general population
Albania 2796 100
Croatia 4285 100
Czech Republic 10505 99.0
Estonia 1340 100
France 64882 99.0
FYR of Macedonia 2022 100
Israel 7766 100
Latvia 2042 85.5
Montenegro 620 100
Poland 38538 100
Portugal 10562 100
Russia 143056 100
Slovakia 5404 100
Slovenia 2052 100
Spain 47190 99.8
Turkey 74724 83.2
Ukraine 45534 94.3

83
Total number of Number of renal centres renal centres collaborating with the registry of whole country/region
B1 AFFILIATED REGISTRY INFORMATION FOR 2011
Table B.1.2Renal centres: total number of centres and number of collaborating centres
Albania 8 8
Croatia 54 54
Czech Republic 102 98
Estonia 3 3
France 1120 1085
FYR of Macedonia 19 19
Israel 66 66
Latvia 21 19
Montenegro 10 10
Poland 267 267
Portugal 114 114
Russia 341 330
Slovakia 69 69
Slovenia 24 24
Spain 340 339
Turkey 834 688
Ukraine 87 81

N Pmp N Pmp N Pmp
All Men Women
84
B2 INCIDENT PATIENTS ACCEPTED FOR RRT IN 2011, AT DAY 1
Table B.2.1Incident counts and incident rates per million population, unadjustedat day 1
Albania 214 76.5 133 94.9 81 58.1
Croatia 607 141.7 374 181.0 233 105.0
Czech Republic † 1860 178.8
Estonia 87 64.9 52 84.1 35 48.5
France 9584 149.2 5995 191.9 3589 108.8
FYR of Macedonia 271 134.0 170 167.5 101 100.3
Israel 1457 187.6 926 241.1 531 135.3
Latvia 173 99.1 89 111.6 84 88.6
Montenegro 16 25.8 11 35.9 5 15.9
Poland 5130 133.1
Portugal 2391 226.4
Russia 6138 42.9 3425 51.8 2713 35.3
Slovakia † 804 148.8 439 166.8 365 131.7
Slovenia 236 115.0 153 150.7 83 80.0
Spain 5686 120.7 3704 159.4 1982 83.1
Turkey † 14797 238.0 8257 264.4 6540 211.4
Ukraine # 1041 24.2 577 29.2 464 20.0
Categories may not add up to total or to 100% because of missing valuesWhen cells are left empty, the data are unavailable† Data include dialysis patients only# Data do not include Kiev city

% Mean SD Median % Mean SD Median % Mean SD Median (years) (years) (years) (years) (years) (years)
All Men Women
85
B2 INCIDENT PATIENTS ACCEPTED FOR RRT IN 2011, AT DAY 1
Table B.2.2Gender, mean age, and median age of incident patientsat day 1
Albania 100 47.9 15.8 51.0 62.1 47.9 15.8 50.0 37.9 48.0 16.1 51.0
Croatia 100 64.1 14.3 66.0 61.6 63.9 13.5 65.0 38.4 64.5 15.4 67.0
Czech Republic
Estonia 100 59.1 17.5 62.0 59.8 59.8 16.4 62.0 40.2 58.0 19.3 62.0
France 100 67.0 16.5 70.4 62.6 66.7 16.5 69.9 37.4 67.4 16.5 71.3
FYR of Macedonia 100 60.0 14.2 61.0 62.7 61.3 13.0 62.0 37.3 57.9 15.9 60.0
Israel 100 64.9 15.9 66.6 63.6 64.4 16.1 66.1 36.4 65.9 15.5 68.6
Latvia 100 62.0 16.1 66.0 51.4 61.3 16.7 65.0 48.6 62.6 15.9 67.0
Montenegro 100 55.4 18.3 59.5 68.8 55.6 17.2 57.0 31.3 55.0 22.8 62.0
Poland
Portugal
Russia 100 50.8 14.8 52.0 55.8 49.7 14.7 51.0 44.2 52.1 14.7 54.0
Slovakia † 100 63.3 13.3 64.0 54.6 61.8 12.8 62.0 45.4 65.2 13.7 67.0
Slovenia 100 66.5 14.2 68.0 64.8 63.8 14.3 64.0 35.2 71.3 12.8 74.0
Spain 100 62.1 0.9 66.9 65.1 61.9 1.1 66.5 34.9 62.4 1.5 67.8
Turkey † 100 56.5 59.4 55.8 56.2 59.0 44.2 56.9 60.0
Ukraine # 100 55.4 44.6
Categories may not add up to total or to 100% because of missing values or rounding offWhen cells are left empty, the data are unavailable† Data include dialysis patients only# Data do not include Kiev city

Pmp Pmp Pmp
All Men Women
86
B2 INCIDENT PATIENTS ACCEPTED FOR RRT IN 2011, AT DAY 1
Table B.2.3Incident rates per million population, adjustedat day 1, adjusted for age and gender
Albania 82.4 102.8 62.6
Croatia 130.4 169.6 96.0
Czech Republic
Estonia 64.6 91.5 46.4
France 144.6 181.0 107.1
FYR of Macedonia 173.5 219.6 127.4
Israel 273.9 342.9 201.7
Latvia
Montenegro 27.1 38.0 16.9
Poland
Portugal
Russia
Slovakia † 165.2 190.6 144.2
Slovenia 107.4 142.9 73.6
Spain 118.3 154.0 81.7
Turkey † 384.9 424.8 343.1
Ukraine
When cells are left empty, the data are unavailable† Data include dialysis patients only

Total GN PN PKD DM HT RVD Misc Unkn Missing
Type I Type II Both
Pmp % Pmp % Pmp % Pmp % Pmp % Pmp % Pmp % Pmp % Pmp % Pmp % Pmp % Pmp %
87
B2 INCIDENT PATIENTS ACCEPTED FOR RRT IN 2011, AT DAY 1
Table B.2.4Incident rates per million population and percentages, unadjustedat day 1, by cause of renal failure
Albania 76.5 100 21.8 28.5 19.0 24.8 2.9 3.7 1.4 1.9 8.2 10.7 9.7 12.6 1.8 2.3 1.8 2.3 7.2 9.3 12.5 16.4 0 0
Croatia 141.7 100 14.7 10.4 13.5 9.6 5.8 4.1 38.5 27.2 24.7 17.5 3.3 2.3 18.2 12.9 4.4 3.1 18.4 13.0
Czech Republic
Estonia 64.9 100 10.4 16.1 9.0 13.8 3.7 5.7 9.7 14.9 3.0 4.6 12.7 19.5 15.7 24.1 0 0 13.4 20.7 0 0 0 0
France 149.2 100 16.4 11.0 6.8 4.6 9.3 6.2 32.6 21.8 36.3 24.4 1.6 1.1 23.3 15.6 22.9 15.3 0 0
FYR of Macedonia 134.0 100 12.4 9.2 12.4 9.2 6.4 4.8 2.5 1.8 29.2 21.8 31.7 23.6 39.6 29.5 0.5 0.4 9.4 7.0 21.8 16.2 0 0
Israel 187.6 100 10.9 5.8 3.3 1.8 7.2 3.8 58.1 31.0 32.3 17.2 90.4 48.2 17.5 9.3 6.6 3.5 19.6 10.4 24.1 12.8 8.0 4.3
Latvia 99.1 100 14.9 15.0 14.9 15.0 9.2 9.2 1.7 1.7 11.5 11.6 13.2 13.3 18.3 18.5 1.1 1.2 11.5 11.6 16.0 16.2 0 0
Montenegro 25.8 100 6.5 25.0 0 0 0 0 12.9 50.0 0 0 12.9 50.0 4.8 18.8 0 0 1.6 6.3 0 0 0 0
Poland 133.1 100 23.5 17.6 4.0 3.0 5.1 3.8 31.5 23.7 21.1 15.8 0.5 0.4 8.3 6.3 24.5 18.4 14.6 11.0
Portugal & + 226.4 100 20.9 9.2 10.0 4.4 70.8 31.3 33.7 14.9 43.4 19.2 44.6 19.7 1.0 0.5
Russia 42.9 100 13.9 32.4 4.7 11.0 4.0 9.3 3.0 6.9 4.4 10.3 7.4 17.2 3.5 8.1 0.1 0.2 6.1 14.3 3.2 7.4 0 0
Slovakia † 148.8 100 15.2 10.2 15.0 10.1 4.3 2.9 54.8 36.8 10.2 6.8 7.4 5.0 39.2 26.4 2.8 1.9 0 0
Slovenia 115.0 100 15.6 13.6 7.3 6.4 7.8 6.8 0.5 0.4 30.7 26.7 31.2 27.1 16.6 14.4 4.4 3.8 12.2 10.6 20.0 17.4 0 0
Spain ¶ 120.7 100 13.5 11.2 10.3 8.5 7.9 6.5 29.3 24.3 17.3 14.3 14.8 12.2 27.7 22.9 0 0
Turkey † 238.0 100 16.1 6.8 6.0 2.5 8.0 3.4 17.4 7.3 72.7 30.6 90.1 37.9 71.4 30.0 2.7 1.1 26.1 11.0 15.8 6.7 1.7 0.7
Ukraine + # 24.2 100 8.6 35.5 3.3 13.5 2.2 8.9 3.9 16.2 1.4 5.7 2.9 12.0 2.0 8.1
Abbreviations used: GN: glomerulonephritis/sclerosis; PN: pyelonephritis; PKD: polycystic kidneys, adult type; DM: diabetes mellitus; HT: hypertension; RVD: renal vascular disease; Misc: miscellaneous; Unkn: unknownWhen cells are left empty, the data are unavailable† Data include dialysis patients only& Pyelonephritis is not reported separately, but is included into miscellaneous+ Renal vascular disease is not reported separately, but is included into miscellaneous¶ Renal vascular disease is not reported separately, but is included into hypertension# Data do not include Kiev city
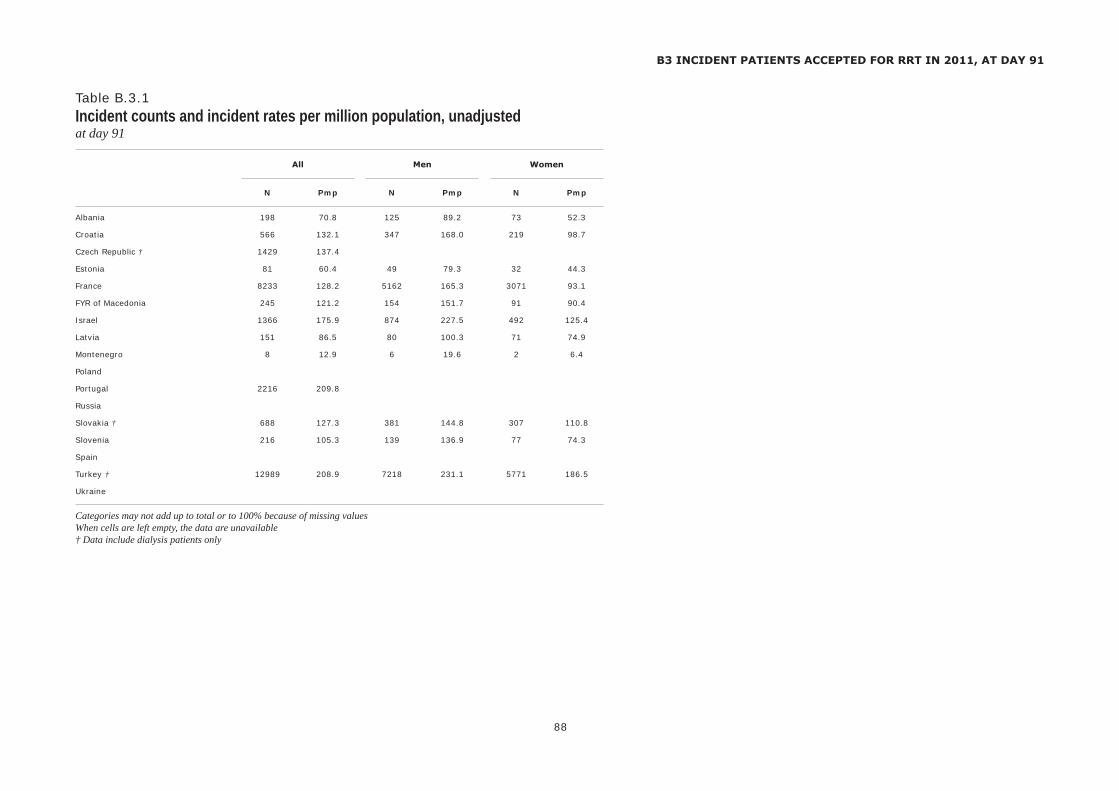
N Pmp N Pmp N Pmp
All Men Women
88
B3 INCIDENT PATIENTS ACCEPTED FOR RRT IN 2011, AT DAY 91
Table B.3.1Incident counts and incident rates per million population, unadjustedat day 91
Albania 198 70.8 125 89.2 73 52.3
Croatia 566 132.1 347 168.0 219 98.7
Czech Republic † 1429 137.4
Estonia 81 60.4 49 79.3 32 44.3
France 8233 128.2 5162 165.3 3071 93.1
FYR of Macedonia 245 121.2 154 151.7 91 90.4
Israel 1366 175.9 874 227.5 492 125.4
Latvia 151 86.5 80 100.3 71 74.9
Montenegro 8 12.9 6 19.6 2 6.4
Poland
Portugal 2216 209.8
Russia
Slovakia † 688 127.3 381 144.8 307 110.8
Slovenia 216 105.3 139 136.9 77 74.3
Spain
Turkey † 12989 208.9 7218 231.1 5771 186.5
Ukraine
Categories may not add up to total or to 100% because of missing valuesWhen cells are left empty, the data are unavailable† Data include dialysis patients only

% Mean SD Median % Mean SD Median % Mean SD Median (years) (years) (years) (years) (years) (years)
All Men Women
89
B3 INCIDENT PATIENTS ACCEPTED FOR RRT IN 2011, AT DAY 91
Table B.3.2Gender, mean age, and median age of incident patientsat day 91
Albania 100 47.6 15.7 51.0 63.1 47.6 15.7 50.0 36.9 47.7 15.7 51.0
Croatia 100 63.8 14.1 65.0 61.3 63.7 13.0 64.0 38.7 64.0 15.6 67.0
Czech Republic
Estonia 100 58.9 17.6 61.0 60.5 60.3 16.1 61.0 39.5 56.8 19.8 61.0
France 100 67.1 16.0 70.2 62.7 66.7 16.1 69.6 37.3 67.7 15.8 71.3
FYR of Macedonia 100 59.3 14.2 61.0 62.9 60.3 13.0 61.0 37.1 57.7 15.9 59.0
Israel 100 64.4 15.9 66.1 64.0 63.9 16.1 65.5 36.0 65.2 15.5 67.2
Latvia 100 61.1 16.5 66.0 53.0 60.5 16.7 64.0 47.0 61.7 16.6 67.0
Montenegro 100 67.6 9.8 69.5 75.0 67.8 9.7 69.5 25.0 67.0 14.1 67.0
Poland
Portugal
Russia
Slovakia † 100 62.1 13.4 63.0 55.4 60.5 12.7 61.0 44.6 64.1 13.9 66.0
Slovenia 100 65.9 14.3 68.0 64.4 63.5 13.7 63.0 35.6 70.2 14.5 73.0
Spain
Turkey † 100 56.1 58.8 55.6 56.0 58.6 44.4 56.2 59.1
Ukraine
Categories may not add up to total or to 100% because of missing values or rounding offWhen cells are left empty, the data are unavailable† Data include dialysis patients only

Pmp Pmp Pmp
All Men Women
90
B3 INCIDENT PATIENTS ACCEPTED FOR RRT IN 2011, AT DAY 91
Table B.3.3Incident rates per million population, adjustedat day 91, adjusted for age and gender
Albania 75.8 96.6 55.5
Croatia 121.6 157.1 90.5
Czech Republic
Estonia 60.0 86.2 42.7
France 124.6 156.5 91.9
FYR of Macedonia 154.5 195.3 114.7
Israel 256.2 323.6 186.0
Latvia
Montenegro 14.5 22.6 7.0
Poland
Portugal
Russia
Slovakia † 139.3 162.2 120.2
Slovenia 99.3 130.6 69.2
Spain
Turkey † 333.5 368.6 296.9
Ukraine
When cells are left empty, the data are unavailable† Data include dialysis patients only

Total GN PN PKD DM HT RVD Misc Unkn Missing
Type I Type II Both
Pmp % Pmp % Pmp % Pmp % Pmp % Pmp % Pmp % Pmp % Pmp % Pmp % Pmp % Pmp %
91
B3 INCIDENT PATIENTS ACCEPTED FOR RRT IN 2011, AT DAY 91
Table B.3.4Incident rates per million population and percentages, unadjustedat day 91, by cause of renal failure
Albania 70.8 100 20.7 29.3 17.5 24.7 2.9 4.0 1.1 1.5 7.9 11.1 8.9 12.6 1.4 2.0 1.8 2.5 5.7 8.1 11.8 16.7 0 0
Croatia 132.1 100 14.5 11.0 12.4 9.4 5.6 4.2 36.9 27.9 23.6 17.8 3.3 2.5 16.1 12.2 3.5 2.7 16.3 12.4
Czech Republic
Estonia 60.4 100 9.7 16.0 8.2 13.6 3.7 6.2 8.2 13.6 3.0 4.9 11.2 18.5 14.9 24.7 0 0 12.7 21.0 0 0 0 0
France 128.2 100 14.1 11.0 5.8 4.5 7.8 6.1 34.2 26.6 32.6 25.4 1.3 1.0 18.7 14.6 13.8 10.7 0 0
FYR of Macedonia 121.2 100 11.9 9.8 10.9 9.0 6.4 5.3 2.5 2.0 25.7 21.2 28.2 23.3 36.1 29.8 0.5 0.4 8.9 7.3 18.3 15.1 0 0
Israel 175.9 100 10.8 6.1 3.1 1.8 7.1 4.0 55.0 31.3 31.2 17.7 86.1 49.0 16.4 9.3 5.8 3.3 18.0 10.2 22.3 12.7 6.3 3.6
Latvia 86.5 100 14.3 16.6 12.6 14.6 8.0 9.3 1.7 2.0 9.7 11.3 11.5 13.2 17.2 19.9 1.1 1.3 10.3 11.9 11.5 13.2 0 0
Montenegro 12.9 100 6.5 50.0 0 0 0 0 3.2 25.0 0 0 3.2 25.0 1.6 12.5 0 0 1.6 12.5 0 0 0 0
Poland
Portugal
Russia
Slovakia † 127.3 100 14.4 11.3 11.1 8.7 4.1 3.2 47.4 37.2 9.4 7.4 5.4 4.2 34.0 26.7 1.5 1.2 0 0
Slovenia 105.3 100 14.6 13.9 6.8 6.5 7.8 7.4 0.5 0.5 29.2 27.8 29.7 28.2 16.1 15.3 1.0 0.9 12.7 12.0 16.6 15.7 0 0
Spain
Turkey † 208.9 100 13.4 6.4 5.3 2.5 7.3 3.5 16.2 7.8 58.8 28.2 75.0 35.9 57.4 27.5 2.4 1.1 19.6 9.4 27.7 13.2 0.9 0.4
Ukraine
Abbreviations used: GN: glomerulonephritis/sclerosis; PN: pyelonephritis; PKD: polycystic kidneys, adult type; DM: diabetes mellitus; HT: hypertension; RVD: renal vascular disease; Misc: miscellaneous; Unkn: unknownWhen cells are left empty, the data are unavailable† Data include dialysis patients only

Total Haemodialysis Peritoneal dialysis Transplant Missing
HD HD HD HF HDF Total APD CAPD PD Total Living Deceased Tx Total hospital/ home type HD/ type PD type Tx centre Unkn HF/HDF Unkn Unkn
N N N N N N N N N N N N N N N N
92
B3 INCIDENT PATIENTS ACCEPTED FOR RRT IN 2011, AT DAY 91
Table B.3.5Incident countsat day 91, by established therapy
Albania 198 186 0 0 0 0 186 0 7 0 7 5 0 0 5 0
Croatia 566 497 0 0 0 7 504 14 34 7 55 3 4 0 7 0
Czech Republic † 1429 1340 1340 89 89 0
Estonia 81 31 0 0 2 15 48 11 12 0 23 3 7 0 10 0
France 8233 6290 0 0 12 761 7063 211 555 0 766 52 320 31 403 1
FYR of Macedonia 245 244 0 0 0 0 244 0 1 0 1 0 0 0 0 0
Israel 1366 1225 0 0 0 0 1225 55 38 0 93 41 4 3 48 0
Latvia 151 137 0 0 137 14 14 0 0 0 0 0
Montenegro 8 8 0 0 0 0 8 0 0 0 0 0 0 0 0 0
Poland
Portugal # 2216 1970 1970 225 225 21 0 0 21 0
Russia
Slovakia † 688 356 0 0 0 309 665 8 15 0 23 0
Slovenia 216 128 0 0 1 76 205 0 10 0 10 0 1 0 1 0
Spain
Turkey † 12989 11795 7 0 0 275 12077 254 658 0 912 0
Ukraine
Abbreviations used: HD: haemodialysis; Unkn: unknown; HF: haemofiltration; HDF: haemodiafiltration; APD: automated peritoneal dialysis; CAPD: continuous ambulatory peritoneal dialysis; PD: peritoneal dialysis; Tx: transplantWhen cells are left empty, the data are unavailable† Data include dialysis patients only# Only pre-emptive transplantations (at day 1) are included

Total Haemodialysis Peritoneal dialysis Transplant Missing
HD HD HD HF HDF Total APD CAPD PD Total Living Deceased Tx Total hospital/ home type HD/ type PD type Tx centre Unkn HF/HDF Unkn Unkn
Pmp Pmp Pmp Pmp Pmp Pmp Pmp Pmp Pmp Pmp Pmp Pmp Pmp Pmp Pmp Pmp
93
B3 INCIDENT PATIENTS ACCEPTED FOR RRT IN 2011, AT DAY 91
Table B.3.6Incident rates per million population, unadjustedat day 91, by established therapy
Albania 70.8 66.5 0 0 0 0 66.5 0 2.5 0 2.5 1.8 0 0 1.8 0
Croatia 132.1 116.0 0 0 0 1.6 117.6 3.3 7.9 1.6 12.8 0.7 0.9 0 1.6 0
Czech Republic † 137.4 128.8 128.8 8.6 8.6 0
Estonia 60.4 23.1 0 0 1.5 11.2 35.8 8.2 9.0 0 17.2 2.2 5.2 0 7.5 0
France 128.2 97.9 0 0 0.2 11.8 110.0 3.3 8.6 0 11.9 0.8 5.0 0.5 6.3 0
FYR of Macedonia 121.2 120.7 0 0 0 0 120.7 0 0.5 0 0.5 0 0 0 0 0
Israel 175.9 157.7 0 0 0 0 157.7 7.1 4.9 0 12.0 5.3 0.5 0.4 6.2 0
Latvia 86.5 78.5 0 0 78.5 8.0 8.0 0 0 0 0 0
Montenegro 12.9 12.9 0 0 0 0 12.9 0 0 0 0 0 0 0 0 0
Poland
Portugal # 209.8 186.5 186.5 21.3 21.3 2.0 0 0 2.0 0
Russia
Slovakia † 127.3 65.9 0 0 0 57.2 123.1 1.5 2.8 0 4.3 0
Slovenia 105.3 62.4 0 0 0.5 37.0 99.9 0 4.9 0 4.9 0 0.5 0 0.5 0
Spain
Turkey † 208.9 189.7 0.1 0 0 4.4 194.3 4.1 10.6 0 14.7 0
Ukraine
Abbreviations used: HD: haemodialysis; Unkn: unknown; HF: haemofiltration; HDF: haemodiafiltration; APD: automated peritoneal dialysis; CAPD: continuous ambulatory peritoneal dialysis; PD: peritoneal dialysis; Tx: transplantWhen cells are left empty, the data are unavailable† Data include dialysis patients only# Only pre-emptive transplantations (at day 1) are included

Total Haemodialysis Peritoneal dialysis Transplant Missing
HD HD HD HF HDF Total APD CAPD PD Total Living Deceased Tx Total hospital/ home type HD/ type PD type Tx centre Unkn HF/HDF Unkn Unkn
% % % % % % % % % % % % % % % %
94
B3 INCIDENT PATIENTS ACCEPTED FOR RRT IN 2011, AT DAY 91
Table B.3.7Percentages of established therapy, unadjustedat day 91
Albania 100 93.9 0 0 0 0 93.9 0 3.5 0 3.5 2.5 0 0 2.5 0
Croatia 100 87.8 0 0 0 1.2 89.0 2.5 6.0 1.2 9.7 0.5 0.7 0 1.2 0
Czech Republic † 100 93.8 93.8 6.2 6.2 0
Estonia 100 38.3 0 0 2.5 18.5 59.3 13.6 14.8 0 28.4 3.7 8.6 0 12.3 0
France 100 76.4 0 0 0.1 9.2 85.8 2.6 6.7 0 9.3 0.6 3.9 0.4 4.9 0
FYR of Macedonia 100 99.6 0 0 0 0 99.6 0 0.4 0 0.4 0 0 0 0 0
Israel 100 89.7 0 0 0 0 89.7 4.0 2.8 0 6.8 3.0 0.3 0.2 3.5 0
Latvia 100 90.7 0 0 90.7 9.3 9.3 0 0 0 0 0
Montenegro 100 100 0 0 0 0 100 0 0 0 0 0 0 0 0 0
Poland
Portugal # 100 88.9 88.9 10.2 10.2 0.9 0 0 0.9 0
Russia
Slovakia † 100 51.7 0 0 0 44.9 96.7 1.2 2.2 0 3.3 0
Slovenia 100 59.3 0 0 0.5 35.2 94.9 0 4.6 0 4.6 0 0.5 0 0.5 0
Spain
Turkey † 100 90.8 0.1 0 0 2.1 93.0 2.0 5.1 0 7.0 0
Ukraine
Abbreviations used: HD: haemodialysis; Unkn: unknown; HF: haemofiltration; HDF: haemodiafiltration; APD: automated peritoneal dialysis; CAPD: continuous ambulatory peritoneal dialysis; PD: peritoneal dialysis; Tx: transplantWhen cells are left empty, the data are unavailable† Data include dialysis patients only# Only pre-emptive transplantations (at day 1) are included

N Pmp N Pmp N Pmp
All Men Women
95
B4 PREVALENT PATIENTS ON RRT IN 2011
Table B.4.1Prevalent counts and prevalence per million population, unadjustedprevalent patients on December 31
Albania 794 284.0 515 367.6 279 200.0
Croatia 4343 1013.5 2510 1214.9 1833 826.0
Czech Republic † 6136 590.0
Estonia 714 532.8 412 666.7 302 418.3
France 70322 1094.8 42501 1360.6 27821 843.2
FYR of Macedonia 1533 758.2 916 902.5 617 612.7
Israel † 5675 730.8 3439 895.3 2236 569.7
Latvia 904 517.8 472 591.7 432 455.6
Montenegro 170 274.2 103 336.6 67 213.4
Poland 27236 706.7
Portugal ¶ 17553 1661.9 10174 1844.8 6840 1355.3
Russia 27989 195.7 15052 227.5 12937 168.3
Slovakia † 3107 574.9 1777 675.2 1330 479.8
Slovenia 2011 980.0 1194 1176.4 817 787.8
Spain 50767 1077.9 31416 1352.0 19351 811.0
Turkey 53977 868.2 29760 953.0 24217 782.6
Ukraine # 5618 130.8 3104 157.0 2514 108.5
Categories may not add up to total or to 100% because of missing valuesWhen cells are left empty, the data are unavailable† Data include dialysis patients only¶ Gender not reported for 539 (3.1%) patients# Data do not include Kiev city
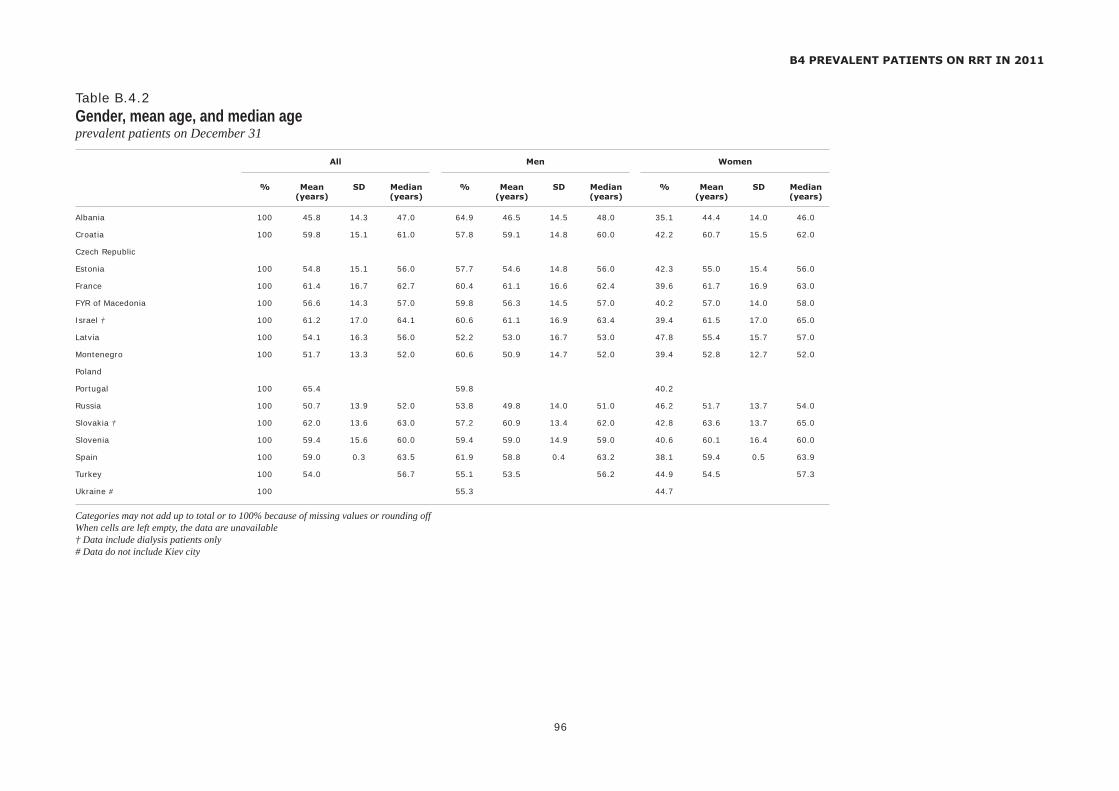
% Mean SD Median % Mean SD Median % Mean SD Median (years) (years) (years) (years) (years) (years)
All Men Women
96
B4 PREVALENT PATIENTS ON RRT IN 2011
Table B.4.2Gender, mean age, and median ageprevalent patients on December 31
Albania 100 45.8 14.3 47.0 64.9 46.5 14.5 48.0 35.1 44.4 14.0 46.0
Croatia 100 59.8 15.1 61.0 57.8 59.1 14.8 60.0 42.2 60.7 15.5 62.0
Czech Republic
Estonia 100 54.8 15.1 56.0 57.7 54.6 14.8 56.0 42.3 55.0 15.4 56.0
France 100 61.4 16.7 62.7 60.4 61.1 16.6 62.4 39.6 61.7 16.9 63.0
FYR of Macedonia 100 56.6 14.3 57.0 59.8 56.3 14.5 57.0 40.2 57.0 14.0 58.0
Israel † 100 61.2 17.0 64.1 60.6 61.1 16.9 63.4 39.4 61.5 17.0 65.0
Latvia 100 54.1 16.3 56.0 52.2 53.0 16.7 53.0 47.8 55.4 15.7 57.0
Montenegro 100 51.7 13.3 52.0 60.6 50.9 14.7 52.0 39.4 52.8 12.7 52.0
Poland
Portugal 100 65.4 59.8 40.2
Russia 100 50.7 13.9 52.0 53.8 49.8 14.0 51.0 46.2 51.7 13.7 54.0
Slovakia † 100 62.0 13.6 63.0 57.2 60.9 13.4 62.0 42.8 63.6 13.7 65.0
Slovenia 100 59.4 15.6 60.0 59.4 59.0 14.9 59.0 40.6 60.1 16.4 60.0
Spain 100 59.0 0.3 63.5 61.9 58.8 0.4 63.2 38.1 59.4 0.5 63.9
Turkey 100 54.0 56.7 55.1 53.5 56.2 44.9 54.5 57.3
Ukraine # 100 55.3 44.7
Categories may not add up to total or to 100% because of missing values or rounding offWhen cells are left empty, the data are unavailable† Data include dialysis patients only# Data do not include Kiev city

Pmp Pmp Pmp
All Men Women
97
B4 PREVALENT PATIENTS ON RRT IN 2011
Table B.4.3Prevalence per million population, adjustedprevalent patients on December 31, adjusted for age and gender
Albania 306.5 405.9 209.1
Croatia 940.0 1148.2 754.6
Czech Republic
Estonia 533.3 705.0 406.7
France 1085.5 1325.8 846.1
FYR of Macedonia 949.4 1127.2 763.5
Israel † 1043.7 1260.3 821.2
Latvia
Montenegro 283.2 234.0 330.7
Poland
Portugal
Russia
Slovakia † 628.9 767.1 514.6
Slovenia 926.2 1120.2 743.0
Spain 1040.5 1292.2 785.7
Turkey 1335.3 1459.2 1206.7
Ukraine
When cells are left empty, the data are unavailable† Data include dialysis patients only

Total GN PN PKD DM HT RVD Misc Unkn Missing
Type I Type II Both
Pmp % Pmp % Pmp % Pmp % Pmp % Pmp % Pmp % Pmp % Pmp % Pmp % Pmp % Pmp %
98
B4 PREVALENT PATIENTS ON RRT IN 2011
Table B.4.4Prevalence per million population and percentages, unadjustedprevalent patients on December 31, by cause of renal failure
Albania 284.0 100 57.9 20.4 74.0 26.1 13.9 4.9 3.6 1.3 16.8 5.9 20.4 7.2 6.4 2.3 11.1 3.9 24.0 8.4 76.2 26.8 0 0
Croatia 1013.5 100 242.5 23.9 131.2 12.9 77.2 7.6 178.8 17.6 134.9 13.3 8.2 0.8 118.3 11.7 33.6 3.3 88.9 8.8
Czech Republic
Estonia 532.8 100 145.5 27.3 92.5 17.4 44.0 8.3 79.9 15.0 25.4 4.8 105.2 19.7 87.3 16.4 0 0 58.2 10.9 0 0 0 0
France 1094.8 100 573.5 52.4 31.0 2.8 40.2 3.7 147.6 13.5 135.7 12.4 6.2 0.6 94.9 8.7 65.6 6.0 0.1 0
FYR of Macedonia 758.2 100 148.4 19.6 97.4 12.9 62.3 8.2 9.4 1.2 90.5 11.9 99.9 13.2 148.9 19.6 10.4 1.4 56.9 7.5 133.0 17.5 1.0 0.1
Israel † 730.8 100 67.7 9.3 27.6 3.8 27.8 3.8 198.8 27.2 121.7 16.7 320.5 43.9 71.6 9.8 19.3 2.6 80.4 11.0 110.6 15.1 5.3 0.7
Latvia 517.8 100 185.6 35.8 72.7 14.0 57.3 11.1 54.4 10.5 45.8 8.8 0 0 71.0 13.7 30.9 6.0 0 0
Montenegro 274.2 100 95.2 34.7 16.1 5.9 14.5 5.3 24.2 8.8 17.7 6.5 41.9 15.3 58.1 21.2 14.5 5.3 29.0 10.6 4.8 1.8 0 0
Poland ¤ 706.7 100 76.0 10.8 51.5 7.3 36.9 5.2 103.6 14.7 60.7 8.6 0.7 0.1 58.0 8.2 39.9 5.6 279.4 39.5
Portugal & + 1661.9 100 121.7 7.3 68.6 4.1 282.5 17.0 162.3 9.8 197.2 11.9 207.5 12.5 609.7 36.7
Russia 195.7 100 86.1 44.0 20.7 10.6 19.7 10.1 11.7 6.0 9.5 4.9 21.2 10.8 10.1 5.2 1.2 0.6 24.6 12.6 12.0 6.1 0 0
Slovakia † 574.9 100 80.9 14.1 71.8 12.5 23.7 4.1 182.5 31.7 37.9 6.6 20.9 3.6 149.0 25.9 8.3 1.4 0 0
Slovenia 980.0 100 218.8 22.3 100.9 10.3 89.7 9.1 40.9 4.2 99.9 10.2 140.8 14.4 86.7 8.9 11.2 1.1 198.3 20.2 133.5 13.6 0 0
Spain ¶ 1077.9 100 200.4 18.6 122.1 11.3 100.3 9.3 156.9 14.6 114.1 10.6 126.7 11.8 220.9 20.5 36.6 3.4
Turkey 868.2 100 72.6 8.4 34.4 4.0 40.0 4.6 43.4 5.0 203.7 23.5 247.1 28.5 227.8 26.2 8.9 1.0 88.4 10.2 137.7 15.9 11.3 1.3
Ukraine + # 130.8 100 65.9 50.4 17.8 13.6 13.1 10.0 16.9 12.9 4.2 3.2 12.0 9.1 0 0 0.9 0.7
Abbreviations used: GN: glomerulonephritis/sclerosis; PN: pyelonephritis; PKD: polycystic kidneys, adult type; DM: diabetes mellitus; HT: hypertension; RVD: renal vascular disease; Misc: miscellaneous; Unkn: unknownWhen cells are left empty, the data are unavailable† Data include dialysis patients only¤ Data on cause of renal failure are available for dialysis patients only (transplant patients are included into missing)& Pyelonephritis is not reported separately, but is included into miscellaneous+ Renal vascular disease is not reported separately, but is included into miscellaneous¶ Renal vascular disease is not reported separately, but is included into hypertension# Data do not include Kiev city

Total Haemodialysis Peritoneal dialysis Transplant Missing
HD HD HD HF HDF Total APD CAPD PD Total Living Deceased Tx Total hospital/ home type HD/ type PD type Tx centre Unkn HF/HDF Unkn Unkn
N N N N N N N N N N N N N N N N
99
B4 PREVALENT PATIENTS ON RRT IN 2011
Table B.4.5Prevalent countsprevalent patients on December 31, by established therapy
Albania 794 544 0 0 0 0 544 0 43 0 43 169 38 0 207 0
Croatia 4343 2593 1 0 6 37 2637 58 144 15 217 180 1172 137 1489 0
Czech Republic † 6136 3129 0 0 2497 5626 510 510
Estonia 714 240 0 0 240 22 47 0 69 40 365 0 405 0
France 70322 29875 228 0 67 6411 36581 1109 1490 0 2599 2319 28700 120 31139 3
FYR of Macedonia 1533 1363 1 0 0 0 1364 1 25 0 26 136 7 0 143 0
Israel † 5675 5340 0 0 0 0 5340 182 151 2 335 0
Latvia 904 341 0 0 341 81 81 20 462 0 482 0
Montenegro 170 81 0 0 0 4 85 0 6 0 6 46 15 18 79 0
Poland 27236 16895 0 0 16895 425 643 0 1068 9273 9273 0
Portugal 17553 5355 0 0 0 5054 10409 350 354 0 704 6440 6440 0
Russia 27989 20214 0 0 0 0 20214 67 1776 0 1843 858 5074 0 5932 0
Slovakia † 3107 1235 0 0 0 1779 3014 43 49 1 93 0
Slovenia 2011 532 0 0 16 799 1347 12 48 0 60 15 589 0 604 0
Spain 50767 22623 22623 2674 2674 25315 25315 155
Turkey & 53977 42475 31 0 0 1604 44110 1256 2677 0 3933 4274 1606 54 5934 0
Ukraine # 5618 4195 0 0 0 0 4195 686 686 737 737 0
Abbreviations used: HD: haemodialysis; Unkn: unknown; HF: haemofiltration; HDF: haemodiafiltration; APD: automated peritoneal dialysis; CAPD: continuous ambulatory peritoneal dialysis; PD: peritoneal dialysis; Tx: transplantWhen cells are left empty, the data are unavailable† Data include dialysis patients only& The number of patients living on a functioning graft is underestimated# Data do not include Kiev city

Total Haemodialysis Peritoneal dialysis Transplant Missing
HD HD HD HF HDF Total APD CAPD PD Total Living Deceased Tx Total hospital/ home type HD/ type PD type Tx centre Unkn HF/HDF Unkn Unkn
Pmp Pmp Pmp Pmp Pmp Pmp Pmp Pmp Pmp Pmp Pmp Pmp Pmp Pmp Pmp Pmp
100
B4 PREVALENT PATIENTS ON RRT IN 2011
Table B.4.6Prevalence per million population, unadjustedprevalent patients on December 31, by established therapy
Albania 284.0 194.6 0 0 0 0 194.6 0 15.4 0 15.4 60.4 13.6 0 74.0 0
Croatia 1013.5 605.1 0.2 0 1.4 8.6 615.4 13.5 33.6 3.5 50.6 42.0 273.5 32.0 347.5 0
Czech Republic † 590.0 300.9 0 0 240.1 541.0 49.0 49.0
Estonia 532.8 179.1 0 0 179.1 16.4 35.1 0 51.5 29.9 272.4 0 302.2 0
France 1094.8 465.1 3.5 0 1.0 99.8 569.5 17.3 23.2 0 40.5 36.1 446.8 1.9 484.8 0
FYR of Macedonia 758.2 674.1 0.5 0 0 0 674.6 0.5 12.4 0 12.9 67.3 3.5 0 70.7 0
Israel † 730.8 687.6 0 0 0 0 687.6 23.4 19.4 0.3 43.1 0
Latvia 517.8 195.3 0 0 195.3 46.4 46.4 11.5 264.6 0 276.1 0
Montenegro 274.2 130.6 0 0 0 6.5 137.1 0 9.7 0 9.7 74.2 24.2 29.0 127.4 0
Poland 706.7 438.4 0 0 438.4 11.0 16.7 0 27.7 240.6 240.6 0
Portugal 1661.9 507.0 0 0 0 478.5 985.5 33.1 33.5 0 66.7 609.7 609.7 0
Russia 195.7 141.3 0 0 0 0 141.3 0.5 12.4 0 12.9 6.0 35.5 0 41.5 0
Slovakia † 574.9 228.5 0 0 0 329.2 557.7 8.0 9.1 0.2 17.2 0
Slovenia 980.0 259.3 0 0 7.8 389.4 656.4 5.8 23.4 0 29.2 7.3 287.0 0 294.3 0
Spain 1077.9 480.4 480.4 56.8 56.8 537.5 537.5 3.3
Turkey & 868.2 683.2 0.5 0 0 25.8 709.5 20.2 43.1 0 63.3 68.7 25.8 0.9 95.4 0
Ukraine # 130.8 97.7 0 0 0 0 97.7 16.0 16.0 17.2 17.2 0
Abbreviations used: HD: haemodialysis; Unkn: unknown; HF: haemofiltration; HDF: haemodiafiltration; APD: automated peritoneal dialysis; CAPD: continuous ambulatory peritoneal dialysis; PD: peritoneal dialysis; Tx: transplantWhen cells are left empty, the data are unavailable† Data include dialysis patients only& The number of patients living on a functioning graft is underestimated# Data do not include Kiev city

Total Haemodialysis Peritoneal dialysis Transplant Missing
HD HD HD HF HDF Total APD CAPD PD Total Living Deceased Tx Total hospital/ home type HD/ type PD type Tx centre Unkn HF/HDF Unkn Unkn
% % % % % % % % % % % % % % % %
101
B4 PREVALENT PATIENTS ON RRT IN 2011
Table B.4.7Percentages of established therapy, unadjustedprevalent patients on December 31
Albania 100 68.5 0 0 0 0 68.5 0 5.4 0 5.4 21.3 4.8 0 26.1 0
Croatia 100 59.7 0 0 0.1 0.9 60.7 1.3 3.3 0.3 5.0 4.1 27.0 3.2 34.3 0
Czech Republic † 100 51.0 0 0 40.7 91.7 8.3 8.3
Estonia 100 33.6 0 0 33.6 3.1 6.6 0 9.7 5.6 51.1 0 56.7 0
France 100 42.5 0.3 0 0.1 9.1 52.0 1.6 2.1 0 3.7 3.3 40.8 0.2 44.3 0
FYR of Macedonia 100 88.9 0.1 0 0 0 89.0 0.1 1.6 0 1.7 8.9 0.5 0 9.3 0
Israel † 100 94.1 0 0 0 0 94.1 3.2 2.7 0 5.9 0
Latvia 100 37.7 0 0 37.7 9.0 9.0 2.2 51.1 0 53.3 0
Montenegro 100 47.6 0 0 0 2.4 50.0 0 3.5 0 3.5 27.1 8.8 10.6 46.5 0
Poland 100 62.0 0 0 62.0 1.6 2.4 0 3.9 34.0 34.0 0
Portugal 100 30.5 0 0 0 28.8 59.3 2.0 2.0 0 4.0 36.7 36.7 0
Russia 100 72.2 0 0 0 0 72.2 0.2 6.3 0 6.6 3.1 18.1 0 21.2 0
Slovakia † 100 39.7 0 0 0 57.3 97.0 1.4 1.6 0 3.0 0
Slovenia 100 26.5 0 0 0.8 39.7 67.0 0.6 2.4 0 3.0 0.7 29.3 0 30.0 0
Spain 100 44.6 44.6 5.3 5.3 49.9 49.9 0.3
Turkey & 100 78.7 0.1 0 0 3.0 81.7 2.3 5.0 0 7.3 7.9 3.0 0.1 11.0 0
Ukraine # 100 74.7 0 0 0 0 74.7 12.2 12.2 13.1 13.1 0
Abbreviations used: HD: haemodialysis; Unkn: unknown; HF: haemofiltration; HDF: haemodiafiltration; APD: automated peritoneal dialysis; CAPD: continuous ambulatory peritoneal dialysis; PD: peritoneal dialysis; Tx: transplantWhen cells are left empty, the data are unavailable† Data include dialysis patients only& The number of patients living on a functioning graft is underestimated# Data do not include Kiev city

Total Living Deceased Donor type Unkn
Related Unrelated Type Unkn All
N % N % N % N % N % N % N %
102
B5 RENAL TRANSPLANTS IN 2011
Table B.5.1Renal transplants performed in 2011, numbers and percentagesby donor type
Albania 11 100 11 100 0 0 0 0 11 100 0 0 0 0
Croatia 230 100 25 10.9 7 3.0 0 0 32 13.9 187 81.3 11 4.8
Czech Republic 332 100 40 12.0 40 12.0 292 88.0 0 0
Estonia 44 100 3 6.8 0 0 0 0 3 6.8 41 93.2 0 0
France 2976 100 302 10.1 0 0 0 0 302 10.1 2674 89.9 0 0
FYR of Macedonia 6 100 6 100 0 0 0 0 6 100 0 0 0 0
Israel 407 100 0 0 0 0 128 31.4 128 31.4 208 51.1 71 17.4
Latvia 63 100 3 4.8 0 0 0 0 3 4.8 60 95.2 0 0
Montenegro 2 100 0 0 0 0 0 0 0 0 2 100 0 0
Poland 1042 100 40 3.8 40 3.8 1002 96.2 0 0
Portugal 530 100 47 8.9 47 8.9 483 91.1 0 0
Russia 975 100 179 18.4 0 0 0 0 179 18.4 796 81.6 0 0
Slovakia + 129 100 10 7.8 3 2.3 0 0 13 10.1 116 89.9 0 0
Slovenia 46 100 0 0 0 0 0 0 0 0 46 100 0 0
Spain ¤ 2498 100 310 12.4 2 0.1 0 0 312 12.5 2186 87.5 0 0
Turkey & 2955 100 1767 59.8 631 21.4 37 1.3 2435 82.4 520 17.6 0 0
Ukraine # 62 100 29 46.8 7 11.3 0 0 36 58.1 26 41.9 0 0
Categories may not add up to total or to 100% because of missing values or rounding offWhen cells are left empty, the data are unavailable+ Data from: Slovak Centre of Organ Transplantation¤ Data from: Organización Nacional de Trasplantes (ONT), 2011 from total Spanish population& Data from: Turkish Ministry of Health# Data do not include Kiev city

Total Living Deceased Donor type Unkn
Related Unrelated Type Unkn All
Pmp Pmp Pmp Pmp Pmp Pmp Pmp
103
B5 RENAL TRANSPLANTS IN 2011
Table B.5.2Renal transplants performed in 2011, per million populationby donor type
Albania 3.9 3.9 0 0 3.9 0 0
Croatia 53.7 5.8 1.6 0 7.5 43.6 2.6
Czech Republic 31.9 3.8 3.8 28.1 0
Estonia 32.8 2.2 0 0 2.2 30.6 0
France 46.3 4.7 0 0 4.7 41.6 0
FYR of Macedonia 3.0 3.0 0 0 3.0 0 0
Israel 52.4 0 0 16.5 16.5 26.8 9.1
Latvia 36.1 1.7 0 0 1.7 34.4 0
Montenegro 3.2 0 0 0 0 3.2 0
Poland 27.0 1.0 1.0 26.0 0
Portugal 50.2 4.4 4.4 45.7 0
Russia 6.8 1.3 0 0 1.3 5.6 0
Slovakia + 23.9 1.9 0.6 0 2.4 21.5 0
Slovenia 22.4 0 0 0 0 22.4 0
Spain ¤ 52.9 6.6 0 0 6.6 46.3 0
Turkey & 47.5 28.4 10.1 0.6 39.2 8.4 0
Ukraine # 1.4 0.7 0.2 0 0.8 0.6 0
Categories may not add up to total or to 100% because of missing values or rounding offWhen cells are left empty, the data are unavailable+ Data from: Slovak Centre of Organ Transplantation¤ Data from: Organización Nacional de Trasplantes (ONT), 2011 from total Spanish population& Data from: Turkish Ministry of Health# Data do not include Kiev city


IV Summary Data

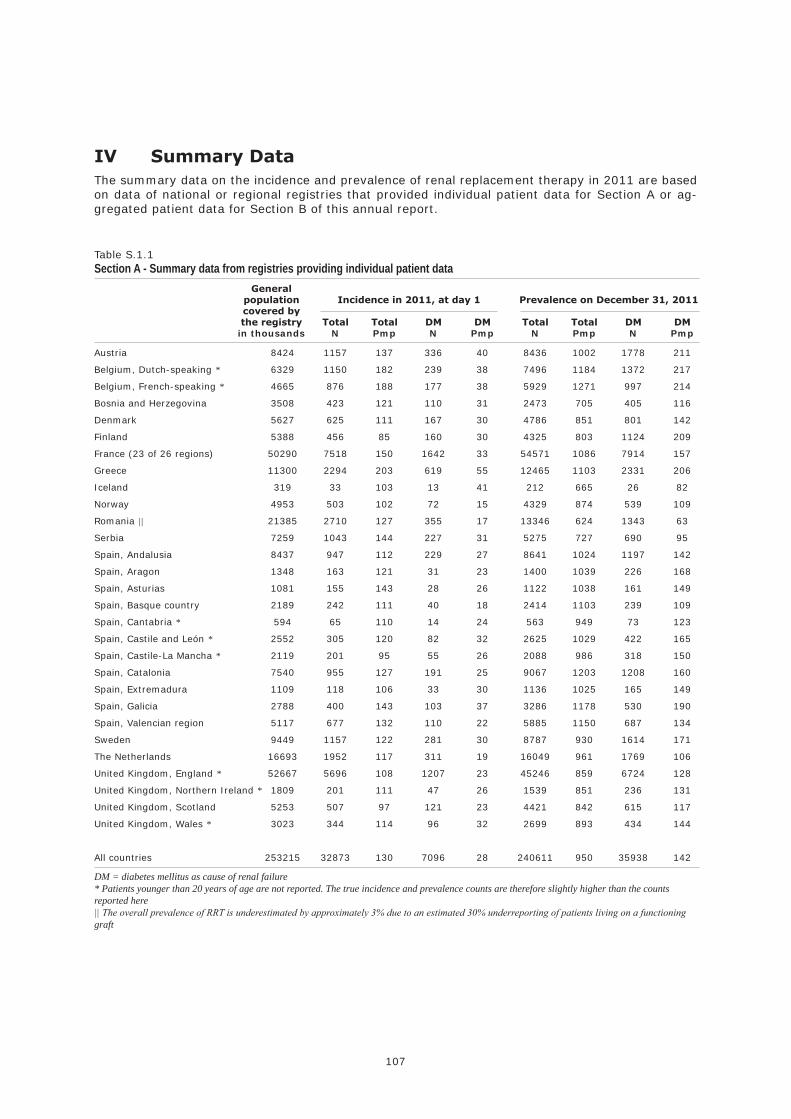
107
General population Incidence in 2011, at day 1 Prevalence on December 31, 2011 covered by the registry Total Total DM DM Total Total DM DM in thousands N Pmp N Pmp N Pmp N Pmp
IV Summary DataThe summary data on the incidence and prevalence of renal replacement therapy in 2011 are based on data of national or regional registries that provided individual patient data for Section A or ag-gregated patient data for Section B of this annual report.
Table S.1.1Section A - Summary data from registries providing individual patient data
Austria 8424 1157 137 336 40 8436 1002 1778 211
Belgium, Dutch-speaking * 6329 1150 182 239 38 7496 1184 1372 217
Belgium, French-speaking * 4665 876 188 177 38 5929 1271 997 214
Bosnia and Herzegovina 3508 423 121 110 31 2473 705 405 116
Denmark 5627 625 111 167 30 4786 851 801 142
Finland 5388 456 85 160 30 4325 803 1124 209
France (23 of 26 regions) 50290 7518 150 1642 33 54571 1086 7914 157
Greece 11300 2294 203 619 55 12465 1103 2331 206
Iceland 319 33 103 13 41 212 665 26 82
Norway 4953 503 102 72 15 4329 874 539 109
Romania || 21385 2710 127 355 17 13346 624 1343 63
Serbia 7259 1043 144 227 31 5275 727 690 95
Spain, Andalusia 8437 947 112 229 27 8641 1024 1197 142
Spain, Aragon 1348 163 121 31 23 1400 1039 226 168
Spain, Asturias 1081 155 143 28 26 1122 1038 161 149
Spain, Basque country 2189 242 111 40 18 2414 1103 239 109
Spain, Cantabria * 594 65 110 14 24 563 949 73 123
Spain, Castile and León * 2552 305 120 82 32 2625 1029 422 165
Spain, Castile-La Mancha * 2119 201 95 55 26 2088 986 318 150
Spain, Catalonia 7540 955 127 191 25 9067 1203 1208 160
Spain, Extremadura 1109 118 106 33 30 1136 1025 165 149
Spain, Galicia 2788 400 143 103 37 3286 1178 530 190
Spain, Valencian region 5117 677 132 110 22 5885 1150 687 134
Sweden 9449 1157 122 281 30 8787 930 1614 171
The Netherlands 16693 1952 117 311 19 16049 961 1769 106
United Kingdom, England * 52667 5696 108 1207 23 45246 859 6724 128
United Kingdom, Northern Ireland * 1809 201 111 47 26 1539 851 236 131
United Kingdom, Scotland 5253 507 97 121 23 4421 842 615 117
United Kingdom, Wales * 3023 344 114 96 32 2699 893 434 144
All countries 253215 32873 130 7096 28 240611 950 35938 142
DM = diabetes mellitus as cause of renal failure* Patients younger than 20 years of age are not reported. The true incidence and prevalence counts are therefore slightly higher than the counts reported here|| The overall prevalence of RRT is underestimated by approximately 3% due to an estimated 30% underreporting of patients living on a functioning graft

108
General population Incidence in 2011, at day 1 Prevalence on December 31, 2011 covered by the registry Total Total DM DM Total Total DM DM in thousands N Pmp N Pmp N Pmp N Pmp
Table S.1.2Section B - Summary data from registries providing aggregated data
Albania 2796 214 77 27 10 794 284 57 20
Croatia 4285 607 142 165 39 4343 1014 766 179
Czech Republic † * 10400 1860 179 6136 590
Estonia 1340 87 65 17 13 714 533 141 105
France (25 of 26 regions) 64233 9584 149 2091 33 70322 1095 9484 148
FYR of Macedonia 2022 271 134 64 32 1533 758 202 100
Israel * 7766 1457 188 702 90 5675 731 2489 321
Latvia 1746 173 99 23 13 904 518 95 54
Montenegro 620 16 26 8 13 170 274 26 42
Poland + 38538 5130 133 1215 32 27236 707 3991 104
Portugal 10562 2391 226 748 71 17553 1662 2984 283
Russia 143056 6138 43 1058 7 27989 196 3033 21
Slovakia † * 5404 804 149 296 55 3107 575 986 183
Slovenia 2052 236 115 64 31 2011 980 289 141
Spain 47096 5686 121 1380 29 50767 1078 7388 157
Turkey † 62170 14797 238 5603 90 53977 868 15363 247
Ukraine # 42939 1041 24 169 4 5618 131 726 17
All countries 447025 50492 113 13630 31 278849 624 48020 110
When cells are left empty, the data are unavailable and could therefore not be used for the calculations of the summary dataDM = diabetes mellitus as cause of renal failure† Data on incidence include dialysis patients only* Data on prevalence include dialysis patients only+ Data on prevalence on cause of renal failure (DM) include dialysis patients only# Data do not include Kiev city

V Reference Tables - Section Paediatric RRT


111
V Reference Tables - Section Paediatric RRT
The incidence and prevalence of RRT in paediatric patients are based on data from 21 registries from 14 countries that provided individual patient data on children via the ERA-EDTA Registry, including Austria, Bosnia and Herzegovina, Denmark, Finland, France, Greece, Iceland, Norway, Romania, Serbia, Spain (Andalusia), Spain (Aragon), Spain (Asturias), Spain (Basque country), Spain (Catalonia), Spain (Extremadura), Spain (Galicia), Spain (Valencian region), Sweden, The Netherlands, and United Kingdom (Scotland). In the analyses the data collected between 2002 and 2011 were used. As not all countries provided data over the complete period and to allow for comparison over the years, data regarding 2007 through 2011 are shown both including and excluding the data from Bosnia and Herzegovina, France, Romania, Serbia, Spain (Aragon), Spain (Extremadura) and Spain (Galicia). The methods that were applied to the data on paediatric patients were similar to those applied to the data on adult patients and are described in Chapter VI Methods.
Further details on the epidemiology of paediatric patients on RRT and on projects and initiatives collecting paediatric data are available on the website of the European Society for Paediatric Nephrology (ESPN)/ ERA-EDTA Registry, www.espn-reg.org.
Congenital anomalies of the kidney and urinary tract (CAKUT) 20, 21, 22, 23, 24, 25, 29, 60, 61, 63, and 66
Glomerulonephritis 10, 11, 12, 13, 14, 15, 16, 17, 19, and 86
Cystic kidney disease 40, 41, 42, 43, and 49
Hereditary nephropathy 50, 51, and 59
Ischaemic renal failure 90
Haemolytic uraemic syndrome (HUS) 88
Metabolic disorders 52, 53, 54, 92, and 93
Vasculitis 73, 74, 84, 85, and 87
Miscellaneous 30, 31, 32, 33, 34, 39, 70, 71, 72, 75, 76, 78, 79,
80, 81, 82, 83, 89, 91, 94, 95, 96, and 99
Missing, unknown missing and 00
Cohort Total 0-4 5-9 10-14 15-19
N N N N N
Primary renal disease group Primary renal disease code (see appendix 1)
P1 GENERAL CHARACTERISTICSTable P.1.1Population covered (in thousands)by age and year
2002 19668 4630 4828 5044 5166
2003 19695 4669 4773 5086 5168
2004 19633 4715 4734 5098 5086
2005 19659 4749 4714 5079 5117
2006 19777 4791 4746 5043 5196
2007 19843 4832 4758 4996 5256
2008 20047 4907 4851 4973 5316
2009 20008 4973 4841 4895 5300
2010 20016 5012 4877 4861 5266
2011 19986 5021 4912 4853 5199
2007 * 25579 6110 6061 6359 7050
2008 * 34247 8335 8300 8394 9218
2009 * 34628 8564 8423 8456 9184
2010 * 36849 9184 9082 9015 9567
2011 * 39951 9876 9925 9844 10306
2002-2011 * 275116 66785 66795 68711 72825
* Including data from Romania and Spain (Aragon, Extremadura) since 2006, Spain (Galicia) since 2007, France since 2008 (coverage from 53.9% in 2008 to 77.7% in 2011), and Bosnia and Herzegovina and Serbia since 2011 Table P.1.2Grouping of primary renal diseases for paediatric patientsgroups and codes included

112
Cohort Total 0-4 5-9 10-14 15-19
N N N N N
Cohort Total 0-4 5-9 10-14 15-19
N N N N N
Cohort Total 0-4 5-9 10-14 15-19
HD PD Tx HD PD Tx HD PD Tx HD PD Tx HD PD Tx
N N N N N N N N N N N N N N N
P2 INCIDENT PATIENTS ACCEPTED FOR RRT, AT DAY 1Table P.2.1Incident countsat day 1, by age and cohort
2002-2003 385 79 50 92 164
2004-2005 399 72 47 113 167
2006-2007 408 93 49 95 171
2008-2009 413 94 63 107 149
2010-2011 349 97 39 84 129
2006-2007 * 501 98 56 110 237
2008-2009 * 643 122 99 161 261
2010-2011 * 628 151 72 139 266
2002-2011 * 2556 522 324 615 1095
* Including data from Romania and Spain (Aragon, Extremadura) since 2006, Spain (Galicia) since 2007, France since 2008 (coverage from 53.9% in 2008 to 77.7% in 2011), and Bosnia and Herzegovina and Serbia since 2011
Table P.2.2Incident countsat day 1, by age, treatment modality, and cohort
2002-2003 164 144 75 8 57 14 14 23 13 36 34 22 106 30 26
2004-2005 173 127 99 13 45 14 13 19 15 43 37 33 104 26 37
2006-2007 166 139 99 17 63 13 10 15 24 43 26 24 96 35 38
2008-2009 149 143 119 18 62 14 19 19 25 31 31 44 81 31 36
2010-2011 148 114 87 24 57 16 13 11 15 31 20 33 80 26 23
2006-2007 * 230 157 110 19 66 13 13 17 26 51 31 26 147 43 45
2008-2009 * 278 192 163 28 78 16 33 27 35 65 39 56 152 48 56
2010-2011 * 322 172 133 47 82 22 31 17 23 64 29 46 180 44 42
2002-2011 * 1167 792 580 115 328 79 104 103 112 259 170 183 689 191 206
For 17 patients information on treatment modality at start was unavailable* Including data from Romania and Spain (Aragon, Extremadura) since 2006, Spain (Galicia) since 2007, France since 2008 (coverage from 53.9% in 2008 to 77.7% in 2011), and Bosnia and Herzegovina and Serbia since 2011
Table P.2.3Incident countsbetween 2002 and 2011, at day 1, by age and cause of renal failure
CAKUT 779 169 100 227 283
Glomerulonephritis 468 49 55 101 263
Cystic kidney disease 197 38 34 63 62
Hereditary Nephropathy 181 80 18 23 60
Ischaemic Renal Failure 43 17 6 11 9
HUS 83 34 9 15 25
Metabolic disorders 44 12 13 11 8
Vasculitis 67 2 2 17 46
Miscellaneous 309 80 45 59 125
Missing, unknown 385 41 42 88 214
Including data from Romania and Spain (Aragon, Extremadura) since 2006, Spain (Galicia) since 2007, France since 2008 (coverage from 53.9% in 2008 to 77.7% in 2011), and Bosnia and Herzegovina and Serbia since 2011

113
Cohort Total 0-4 5-9 10-14 15-19
HD PD Tx HD PD Tx HD PD Tx HD PD Tx HD PD Tx
Pmarp Pmarp Pmarp Pmarp Pmarp Pmarp Pmarp Pmarp Pmarp Pmarp Pmarp Pmarp Pmarp Pmarp Pmarp
Cohort Total 0-4 5-9 10-14 15-19
Pmarp Pmarp Pmarp Pmarp Pmarp
Cohort Total 0-4 5-9 10-14 15-19
Pmarp Pmarp Pmarp Pmarp Pmarp
P2 INCIDENT PATIENTS ACCEPTED FOR RRT, AT DAY 1Table P.2.4Incident rates per million age-related population (per year)at day 1, by age and cohort
2002-2003 9.8 8.5 5.2 9.1 15.9
2004-2005 10.2 7.6 5.0 11.1 16.4
2006-2007 10.3 9.7 5.2 9.5 16.4
2008-2009 10.3 9.5 6.5 10.8 14.0
2010-2011 8.7 9.7 4.0 8.6 12.3
2006-2007 * 9.9 8.1 4.7 8.7 16.9
2008-2009 * 9.3 7.2 5.9 9.6 14.2
2010-2011 * 8.2 7.9 3.8 7.4 13.4
2002-2011 * 9.3 7.8 4.9 9.0 15.0
* Including data from Romania and Spain (Aragon, Extremadura) since 2006, Spain (Galicia) since 2007, France since 2008 (coverage from 53.9% in 2008 to 77.7% in 2011), and Bosnia and Herzegovina and Serbia since 2011
Table P.2.5Incident rates per million age-related population (per year)at day 1, by age, treatment modality, and cohort
2002-2003 4.2 3.7 1.9 0.9 6.1 1.5 1.5 2.4 1.4 3.6 3.4 2.2 10.3 2.9 2.5
2004-2005 4.4 3.2 2.5 1.4 4.8 1.5 1.4 2.0 1.6 4.2 3.6 3.2 10.2 2.5 3.6
2006-2007 4.2 3.5 2.5 1.8 6.5 1.4 1.1 1.6 2.5 4.3 2.6 2.4 9.2 3.3 3.6
2008-2009 3.7 3.6 3.0 1.8 6.3 1.4 2.0 2.0 2.6 3.1 3.1 4.5 7.6 2.9 3.4
2010-2011 3.7 2.8 2.2 2.4 5.7 1.6 1.3 1.1 1.5 3.2 2.1 3.4 7.6 2.5 2.2
2006-2007 * 4.5 3.1 2.2 1.6 5.5 1.1 1.1 1.4 2.2 4.0 2.4 2.0 10.5 3.1 3.2
2008-2009 * 4.0 2.8 2.4 1.7 4.6 0.9 2.0 1.6 2.1 3.9 2.3 3.3 8.3 2.6 3.0
2010-2011 * 4.2 2.2 1.7 2.5 4.3 1.2 1.6 0.9 1.2 3.4 1.5 2.4 9.1 2.2 2.1
2002-2011 * 4.2 2.9 2.1 1.7 4.9 1.2 1.6 1.5 1.7 3.8 2.5 2.7 9.5 2.6 2.8
For 17 patients information on treatment modality at start was unavailable* Including data from Romania and Spain (Aragon, Extremadura) since 2006, Spain (Galicia) since 2007, France since 2008 (coverage from 53.9% in 2008 to 77.7% in 2011), and Bosnia and Herzegovina and Serbia since 2011
Table P.2.6Incident rates per million age-related populationbetween 2002 and 2011, at day 1, by age and cause of renal failure
CAKUT 2.8 2.5 1.5 3.3 3.9
Glomerulonephritis 1.7 0.7 0.8 1.5 3.6
Cystic kidney disease 0.7 0.6 0.5 0.9 0.9
Hereditary Nephropathy 0.7 1.2 0.3 0.3 0.8
Ischaemic Renal Failure 0.2 0.3 0.1 0.2 0.1
HUS 0.3 0.5 0.1 0.2 0.3
Metabolic disorders 0.2 0.2 0.2 0.2 0.1
Vasculitis 0.2 0.0 0.0 0.2 0.6
Miscellaneous 1.1 1.2 0.7 0.9 1.7
Missing, unknown 1.4 0.6 0.6 1.3 2.9
Including data from Romania and Spain (Aragon, Extremadura) since 2006, Spain (Galicia) since 2007, France since 2008 (coverage from 53.9% in 2008 to 77.7% in 2011), and Bosnia and Herzegovina and Serbia since 2011

114
Cohort Total 0-4 5-9 10-14 15-19
N N N N N
Cohort Total 0-4 5-9 10-14 15-19
N N N N N
Cohort Total 0-4 5-9 10-14 15-19
HD PD Tx HD PD Tx HD PD Tx HD PD Tx HD PD Tx
N N N N N N N N N N N N N N N
P3 PREVALENT PATIENTS ON RRTTable P.3.1Prevalent countsprevalent patients on December 31, by age and year
2002 1298 101 186 391 620
2003 1323 106 178 389 650
2004 1340 98 183 392 667
2005 1353 105 191 370 687
2006 1367 102 223 345 697
2007 1377 116 220 337 704
2008 1379 108 222 344 705
2009 1394 131 234 357 672
2010 1365 133 224 348 660
2011 1361 143 219 371 628
2007 * 1510 119 231 369 791
2008 * 1964 140 302 499 1023
2009 * 1999 165 318 513 1003
2010 * 2016 181 314 506 1015
2011 * 2115 207 323 566 1019
* Including data from Romania and Spain (Aragon, Extremadura) since 2006, Spain (Galicia) since 2007, France since 2008 (coverage from 53.9% in 2008 to 77.7% in 2011), and Bosnia and Herzegovina and Serbia since 2011
Table P.3.2Prevalent countsprevalent patients on December 31, by age and year
2002 143 143 999 5 46 49 9 20 156 36 32 321 93 45 473
2003 151 123 1035 12 35 58 18 18 141 29 24 333 92 46 503
2004 163 123 1043 8 33 56 16 15 152 30 32 326 109 43 509
2005 163 119 1057 7 34 64 13 26 152 30 22 313 113 37 528
2006 162 118 1075 12 34 56 13 29 180 29 19 292 108 36 547
2007 154 121 1092 14 44 58 17 16 186 28 22 286 95 39 562
2008 147 86 1134 13 33 62 14 15 192 29 17 296 91 21 584
2009 150 115 1119 17 48 66 17 22 195 28 21 306 88 24 552
2010 145 113 1099 16 53 64 16 17 191 27 15 305 86 28 539
2011 155 112 1086 21 54 68 16 20 183 27 16 327 91 22 508
2007 * 214 153 1133 15 45 59 19 21 190 44 30 294 136 57 590
2008 * 263 146 1534 20 48 72 20 24 255 61 32 401 162 42 806
2009 * 280 172 1537 21 61 83 31 29 258 61 37 413 167 45 783
2010 * 295 179 1529 23 73 84 27 29 258 56 31 418 189 46 769
2011 * 336 190 1572 39 71 96 31 33 257 63 35 467 203 51 752
* Including data from Romania and Spain (Aragon, Extremadura) since 2006, Spain (Galicia) since 2007, France since 2008 (coverage from 53.9% in 2008 to 77.7% in 2011), and Bosnia and Herzegovina and Serbia since 2011
Table P.3.3Prevalent countsprevalent patients on December 31, 2011, by age and cause of renal failure
CAKUT 701 68 109 192 332
Glomerulonephritis 359 17 46 95 201
Cystic kidney disease 176 13 26 51 86
Hereditary Nephropathy 188 32 37 56 63
Ischaemic Renal Failure 43 9 9 12 13
HUS 82 9 15 28 30
Metabolic disorders 47 10 6 11 20
Vasculitis 26 0 2 4 20
Miscellaneous 258 31 46 66 115
Missing, unknown 235 18 27 51 139
Including data from Romania and Spain (Aragon, Extremadura) since 2006, Spain (Galicia) since 2007, France since 2008 (coverage from 53.9% in 2008 to 77.7% in 2011), and Bosnia and Herzegovina and Serbia since 2011

115
Cohort Total 0-4 5-9 10-14 15-19
HD PD Tx HD PD Tx HD PD Tx HD PD Tx HD PD Tx
Pmarp Pmarp Pmarp Pmarp Pmarp Pmarp Pmarp Pmarp Pmarp Pmarp Pmarp Pmarp Pmarp Pmarp Pmarp
Cohort Total 0-4 5-9 10-14 15-19
Pmarp Pmarp Pmarp Pmarp Pmarp
Cohort Total 0-4 5-9 10-14 15-19
Pmarp Pmarp Pmarp Pmarp Pmarp
P3 PREVALENT PATIENTS ON RRTTable P.3.4Prevalence per million age-related population (per year)prevalent patients on December 31, by age and year
2002 66.0 21.8 38.5 77.5 120.0
2003 67.2 22.7 37.3 76.5 125.8
2004 68.3 20.8 38.7 76.9 131.2
2005 68.8 22.1 40.5 72.8 134.2
2006 69.1 21.3 47.0 68.4 134.1
2007 69.4 24.0 46.2 67.4 133.9
2008 68.8 22.0 45.8 69.2 132.6
2009 69.7 26.3 48.3 72.9 126.8
2010 68.2 26.5 45.9 71.6 125.3
2011 68.1 28.5 44.6 76.4 120.8
2007 * 59.0 19.5 38.1 58.0 112.2
2008 * 57.3 16.8 36.4 59.4 111.0
2009 * 57.7 19.3 37.8 60.7 109.2
2010 * 54.7 19.7 34.6 56.1 106.1
2011 * 52.9 21.0 32.5 57.5 98.9
* Including data from Romania and Spain (Aragon, Extremadura) since 2006, Spain (Galicia) since 2007, France since 2008 (coverage from 53.9% in 2008 to 77.7% in 2011), and Bosnia and Herzegovina and Serbia since 2011
Table P.3.5Prevalence per million age-related population (per year)prevalent patients on December 31, by age and year
2002 7.3 7.3 50.8 1.1 9.9 10.6 1.9 4.1 32.3 7.1 6.3 63.6 18.0 8.7 91.6
2003 7.7 6.2 52.6 2.6 7.5 12.4 3.8 3.8 29.5 5.7 4.7 65.5 17.8 8.9 97.3
2004 8.3 6.3 53.1 1.7 7.0 11.9 3.4 3.2 32.1 5.9 6.3 63.9 21.4 8.5 100.1
2005 8.3 6.1 53.8 1.5 7.2 13.5 2.8 5.5 32.2 5.9 4.3 61.6 22.1 7.2 103.2
2006 8.2 6.0 54.4 2.5 7.1 11.7 2.7 6.1 37.9 5.8 3.8 57.9 20.8 6.9 105.3
2007 7.8 6.1 55.0 2.9 9.1 12.0 3.6 3.4 39.1 5.6 4.4 57.2 18.1 7.4 106.9
2008 7.3 4.3 56.6 2.6 6.7 12.6 2.9 3.1 39.6 5.8 3.4 59.5 17.1 4.0 109.9
2009 7.5 5.7 55.9 3.4 9.7 13.3 3.5 4.5 40.3 5.7 4.3 62.5 16.6 4.5 104.1
2010 7.2 5.6 54.9 3.2 10.6 12.8 3.3 3.5 39.2 5.6 3.1 62.7 16.3 5.3 102.4
2011 7.8 5.6 54.3 4.2 10.8 13.5 3.3 4.1 37.3 5.6 3.3 67.4 17.5 4.2 97.7
2007 * 8.4 6.0 44.3 2.5 7.4 9.7 3.1 3.5 31.3 6.9 4.7 46.2 19.3 8.1 83.7
2008 * 7.7 4.3 44.8 2.4 5.8 8.6 2.4 2.9 30.7 7.3 3.8 47.8 17.6 4.6 87.4
2009 * 8.1 5.0 44.4 2.5 7.1 9.7 3.7 3.4 30.6 7.2 4.4 48.8 18.2 4.9 85.3
2010 * 8.0 4.9 41.5 2.5 7.9 9.1 3.0 3.2 28.4 6.2 3.4 46.4 19.8 4.8 80.4
2011 * 8.4 4.8 39.3 3.9 7.2 9.7 3.1 3.3 25.9 6.4 3.6 47.4 19.7 4.9 73.0
* Including data from Romania and Spain (Aragon, Extremadura) since 2006, Spain (Galicia) since 2007, France since 2008 (coverage from 53.9% in 2008 to 77.7% in 2011), and Bosnia and Herzegovina and Serbia since 2011
Table P.3.6Prevalence per million age-related populationprevalent patients on December 31, 2011, by age and cause of renal failure
CAKUT 17.5 6.9 11.0 19.5 32.2
Glomerulonephritis 9.0 1.7 4.6 9.7 19.5
Cystic kidney disease 4.4 1.3 2.6 5.2 8.3
Hereditary Nephropathy 4.7 3.2 3.7 5.7 6.1
Ischaemic Renal Failure 1.1 0.9 0.9 1.2 1.3
HUS 2.1 0.9 1.5 2.8 2.9
Metabolic disorders 1.2 1.0 0.6 1.1 1.9
Vasculitis 0.7 0.0 0.2 0.4 1.9
Miscellaneous 6.5 3.1 4.6 6.7 11.2
Missing, unknown 5.9 1.8 2.7 5.2 13.5
Including data from Romania and Spain (Aragon, Extremadura) since 2006, Spain (Galicia) since 2007, France since 2008 (coverage from 53.9% in 2008 to 77.7% in 2011), and Bosnia and Herzegovina and Serbia since 2011


VI Methods


119
VI Methods
The ERA-EDTA Registry is located at the Department of Medical Informatics of the Academic Medical Center in Amsterdam, The Netherlands. This department hosts several clinical registries which share a quality management system with Standard Operating Procedures (SOPs) for data collection, data storage, data analysis, and the production of the annual report. The quality management system has been certified according to the ISO 9001:2000 norm since 2004 and according to the ISO 9001:2008 norm since September 2010.
Data collection and preparation
Section A
Data collectionOnce a year data sets containing individual patient data are sent to the office of the ERA-EDTA Registry in Amsterdam. Data delivery takes place in one of the Open Data Base Connectivity (ODBC) compatible file formats, like Microsoft Access, Microsoft Excel, or in other formats like text, SPSS or SAS. Collaborating registries send data by e-mail and most data sets are received in PGP encrypted format.
Variables
The ERA-EDTA Registry asks national and regional registries for the data in Table 1.
Table 1: Variables collected for Section A
Patient data Transaction data
Patient identifier Patient identifierCountry of registry Date of eventDate of birth Type of event / treatmentGender Cause of deathPrimary Renal Disease Treatment centreDate of first RRT Source registry Destination registry
Collaborating registries and participating countries
Individual patient data of 27 national and regional registries from 15 countries were used to create the tables in Section A of this annual report (see Figure 1).
Registry data are subject to continuous alteration and improvement. Small differences between ERA-EDTA Registry data and the data presented in the national and regional registry’s own annual reports may result from different times of data extraction. Minor differences between the numbers reported by the UK Renal Registry and this annual report may occur because the prevalence as reported in the UK Renal Registry Report is based on quarterly data returns, whereas the prevalence as reported in this annual report is based on data derived from the modality timeline.
The data on France presented in Section A of this report, are based on one dataset containing data from 23 of 26 regions, including Alsace, Aquitaine, Auvergne, Basse Normandie, Bourgogne, Bretagne, Centre, Champagne-Ardenne, Corse, Franche-Comté, Haute Normandie, Languedoc Roussillon, Limousin, Midi-Pyrénées, Nord-Pas de Calais, Pays de la Loire, Picardie, Poitou-Charentes, Provence-Alpes-Côte d’Azur, Rhône-Alpes and the overseas departments of Guadeloupe, Guiana and Réunion.
The data on Spain presented in Section A of this report are based on separate datasets from 11 of 19 regions, including Andalusia, Aragon, Asturias, Basque country, Cantabria, Castile and León, Castile-La Mancha, Catalonia, Extremadura, Galicia, and Valencian region.

120
Differences between collaborating registries
Definitions and collection of data
In the comparison of data between registries it should be recognized that there may be small differences between registries in definitions and in the collection of their data. For example, the different registries do not collect data at the same level of detail, especially with regard to the various subtypes of the treatment modalities.
Patient population
The data from Belgium (Dutch-speaking), Belgium (French-speaking), Spain (Cantabria), Spain (Castile and León), Spain (Castile-La Mancha), and United Kingdom (England/Northern Ireland/Wales) only comprised patients older than 20 years of age. It has been estimated that inclusion of data on children would add about 2 per million population (Pmp) to the incidence rate and about 13 Pmp to the prevalence.
For the calculation of the incidence of those alive and on RRT on day 91, registries were asked to provide data with a follow-up until 31 March 2012. For the following registries data were only available until 31 December 2011: Bosnia and Herzegovina, Denmark, Spain (Asturias), Spain (Catalonia), Spain (Extremadura), Spain (Galicia), and UK (England, Wales and Northern Ireland). For these registries the incidence on day 91 was estimated as explained in the paragraph on statistical analyses.
For Romania, the kidney transplantation activity reported reflects 70% of the total kidney transplantation activity in the country because there is an underreporting of pre-emptive transplantations. As a consequence, the overall incidence and prevalence of RRT were underestimated by approximately 1% and 3%, respectively.
Data loading and cleaningThe registry data were imported using an in-house developed import utility. This program first uniforms the data and then translates any non-standard codes. Consistency checks were performed, and thereafter the data were converted to the desired format in order to make storage in the relational and event-driven database possible. The new data, annually provided by national and regional registries, replaced all existing data in the ERA-EDTA Registry database. Changes in the data sets made by the national and regional registries were in this way adopted by the ERA-EDTA Registry. The import utility performed extensive logging and the logging-results were used to provide the national and regional registries with feedback concerning inconsistencies or other problems in the data.
After data analysis, the results were compared to the annual reports published by the national and regional registries as a first check for errors. In case of discrepancies the registry was contacted and potential problems regarding (the interpretation of) their data set were solved. Thereafter, more detailed reports were produced which needed the approval from the registries before publication in the ERA-EDTA Registry Annual Report.
ERA-EDTA Registry databaseMicrosoft SQL Server (a database management system) was used to manage the ERA-EDTA Registry database. This relational and event-driven database consists of a patient and a transaction table which can be extended according to future needs.
General population dataMidyear population data of the contributing countries were provided by Eurostat, the national bureau of statistics or the national or regional registry. The sources of the population data used for the analyses in Section A are shown in Table 2.

121
Table 2: Sources of general population data for the national and regional registries participating in Section A
Registry Sources of general population data of 2011
Austria http://epp.eurostat.ec.europa.eu/Belgium, Dutch-speaking http://aps.vlaanderen.be/Belgium, French-speaking http://aps.vlaanderen.be/Bosnia and Herzegovina http://www.fzs.ba/Denmark http://epp.eurostat.ec.europa.eu/ Greenland http://www.stat.gl/Finland http://epp.eurostat.ec.europa.eu/France Registry (INSEE)Greece http://epp.eurostat.ec.europa.eu/Iceland http://epp.eurostat.ec.europa.eu/Norway http://epp.eurostat.ec.europa.eu/Romania http://epp.eurostat.ec.europa.eu/Serbia http://epp.eurostat.ec.europa.eu/Spain, Andalusia http://www.ine.es/Spain, Aragon http://www.ine.es/Spain, Asturias http://www.ine.es/Spain, Basque country http://www.ine.es/Spain, Cantabria http://www.ine.es/Spain, Castile and León http://www.ine.es/Spain, Castile-La Mancha http://www.ine.es/Spain, Catalonia http://www.ine.es/Spain, Extremadura http://www.ine.es/Spain, Galicia http://www.ine.es/Spain, Valencian region http://www.ine.es/Sweden http://epp.eurostat.ec.europa.eu/The Netherlands http://epp.eurostat.ec.europa.eu/United Kingdom, England/Northern Ireland/Wales http://www.statistics.gov.uk/United Kingdom, Scotland http://www.statistics.gov.uk/
Reference populationSince the Annual Report 2008, the age and gender distribution of the EU27 of 2005 as provided by Eurostat is used for the adjustment of incidence rates and prevalence for age and gender [1]. The age and gender distribution of EU27 in 2005 is shown in Table 3.
Table 3: The age and gender distribution of the reference population EU27 (2005)
Age groups All Men Women
N N N
0-4 25.319.377 12.987.194 12.332.1835-9 25.785.403 13.220.589 12.564.81410-14 27.909.860 14.308.595 13.601.26515-19 30.553.193 15.655.201 14.897.99220-24 32.182.224 16.362.495 15.819.72925-29 33.801.832 17.155.652 16.646.18030-34 35.618.802 18.014.943 17.603.85935-39 37.664.584 19.014.329 18.650.25540-44 37.194.942 18.664.119 18.530.82345-49 35.145.729 17.491.426 17.654.30350-54 32.862.110 16.196.648 16.665.46255-59 30.683.670 15.009.724 15.673.94660-64 25.257.188 12.132.666 13.124.52265-69 24.176.265 11.232.568 12.943.69770-74 20.772.535 9.170.809 11.601.72675-79 17.024.353 6.886.468 10.137.88580-84 12.055.615 4.197.014 7.858.60185+ 8.007.800 2.300.954 5.706.846Total 492.015.482 240.001.394 252.014.088

122
Section B
Data collectionSection B relates to national registries from countries providing the ERA-EDTA Registry with aggregated data. Data were provided via a Microsoft Excel template and imported for inclusion in this annual report.
Collaborating registries
Aggregated data from 17 national registries are used for the preparation of the tables in Section B (see Figure 1). The following countries participated in Section B of this year’s annual report: Albania, Croatia, Czech Republic, Estonia, France, FYR of Macedonia, Israel, Latvia, Montenegro, Poland, Portugal, Russia, Slovakia, Slovenia, Spain, Turkey, and Ukraine.
Data from France are based on 25 of 26 regions, including Alsace, Aquitaine, Auvergne, Brittany, Burgundy, Centre, Champagne-Ardenne, Corse, Franche-Comté, Île-de-France, Languedoc-Roussillon, Limousin, Lorraine, Lower Normandy, Midi-Pyrénées, Nord-Pas-de-Calais, Pays de la Loire, Picardy, Poitou-Charentes, Provence-Alpes-Côte d’Azur, Rhône-Alpes, Upper Normandy, and the overseas departments of Guadeloupe, Guiana and Réunion.
Data from Spain are based on all of the 19 regions, including Andalusia, Aragon, Asturias, Balearic Islands, Basque country, Canary Islands, Cantabria, Castile and León, Castile-La Mancha, Catalonia, Extremadura, Galicia, La Rioja, Community of Madrid, Region of Murcia, Navarre, Valencian region, and the overseas cities Ceuta and Melilla.
Data loading and cleaningThe Microsoft Excel templates used for data collection included automated consistency checks. Additional checks were performed manually.
General population dataThe population data needed for the calculation of incidence rates and prevalence Pmp were reported by the collaborating registries.
Reference populationAs in Section A, we used the age and gender distribution of the EU27 of 2005 (see Table 3) as provided by Eurostat for the adjustment of incidence rates and prevalence [1].
Definitions and coding systems
The definitions given below apply to both Section A and B.
Incidence and prevalenceIncidence is the number of new cases of a condition during a specific period of time which, in this annual report, is a year (2011). Prevalence is the number of people in a given population with a particular disease at a given time, in this annual report at December 31, 2011.
Primary cause of renal failureRenal diseases were defined according to the 1994 and 1995 ERA-EDTA coding systems and subsequently classified into groups (Appendix 1).
Causes of deathCauses of death were defined according to the ERA-EDTA coding systems and subsequently classified into groups (Appendix 2).
Treatment modalitiesAppendix 3 provides an overview of the coding currently used for treatment modalities in the ERA-EDTA database.

123
Statistical analyses
An overview of the renal registries contributing data for the different types of analyses is given in Appendix 4.
SAS 9.2For the data analyses SAS 9.2 [2] was used. This statistical software package is able to maintain large datasets, is syntax driven which increases reproducibility of results, and has extensive capabilities with respect to statistics and data management.
Section A
Incidence and prevalenceThe incidence and prevalence tables were based on 27 data sets from national or regional registries from 15 countries that provided individual patient data for 2011, including Austria, Belgium (Dutch-speaking), Belgium (French-speaking), Bosnia and Herzegovina, Denmark, Finland, France (23 regions), Greece, Iceland, Norway, Romania, Serbia, Spain (Andalusia), Spain (Aragon), Spain (Asturias), Spain (Basque country), Spain (Cantabria), Spain (Castile and León), Spain (Castile-La Mancha), Spain (Catalonia), Spain (Extremadura), Spain (Galicia), Spain (Valencian region), Sweden, The Netherlands, United Kingdom (England/Northern Ireland/Wales) and United Kingdom (Scotland).
Methods for calculating incidence and prevalence
Incidence and prevalence of those alive and on RRT were calculated for the total population and for subgroups based on gender, age group, treatment modality, and cause of renal failure. The incidence or prevalence Pmp is the observed incident or prevalent count divided by the general population in that year and multiplied by one million. For the incidence or prevalence per million age-related population (Pmarp) the observed incident or prevalent count per age category was divided by the general population in that age category and multiplied by one million.
For those registries that had no data available with a follow-up until March 31, 2012, the incidence of RRT on day 91 was estimated. We assumed that the relative difference between the incidence on day 1 and the incidence on day 91 was similar for patients who started RRT in the first nine months of 2011, when compared to patients who started RRT in the last three months of 2011.
For the calculation of the mean and median age for incident patients on day 91, we used the actual age on day 91.
Adjustment of incidence and prevalence
Differences in unadjusted incidence and prevalence across countries might be due to the differences in the age and gender distribution of the general population. The EU27 age and gender distribution of the European population was therefore used to adjust incidence and prevalence for age and gender [1]. Adjusted rates were derived by applying the weights of the reference population to the observed variable-specific rates (e.g. incidence rate per age group) in a country. This weighed average provides for each country a single summary rate that would be expected if that country had the age and gender distribution of the reference population. The following example shows how to calculate the age adjusted incidence. In this example the incidence rate of country A is 269 Pmp, the age-specific rates of country A and the reference population distribution with respect to age are shown in Table 4.
Table 4: Calculation of the adjusted incidence rate
Age groups Incidence rate Reference country A population
Pmp %
0-19 332 31.720-44 261 39.345-64 64 29.0Total 269 100
The adjusted incident rate of country A is: (0.317 * 332) + (0.393 * 261) + (0.29 * 64) = 226 Pmp

124
Performed renal transplants
For all participating countries and regions the number of renal transplants performed during the year was presented by donor type. In Iceland the number of transplants was somewhat lower, because several patients received transplants in other countries. Rates are expressed as numbers, percentages and Pmp.
Survival probabilityIn this annual report, patient survival on RRT, patient survival on dialysis, patient survival after the first transplant, and graft survival after the first transplant are presented in tables by age, gender and cause of renal failure. In the figures, the patient survival is presented by treatment modality and by cause of renal failure. Survival probabilities are presented as percentages from 0 to 100.
Survival was analysed from day 1 and from day 91 onwards for those patients alive and on RRT on those days [3]. For the analysis of survival data two five-year cohorts were used:
• 2002-2006 - for the presentation of 90-day, one-, two- and five-year survival probabilities.
• 2005-2009 - for the presentation of 90-day, one- and two-year survival probabilities.
These analyses were based on data from Austria, Belgium (Dutch-speaking), Belgium (French-speaking), Denmark, Finland, Greece, Iceland, Italy (Calabria), Norway, Spain (Andalusia), Spain (Asturias), Spain (Basque country), Spain (Cantabria), Spain (Catalonia), Spain (Valencian region), Sweden, The Netherlands, United Kingdom (England/Wales) and United Kingdom (Scotland). Spain (Castile-La Mancha), Spain (Extremadura) and United Kingdom (Northern Ireland) were only included in the analyses based on the second cohort (2005-2009), because for these registries complete data were available from 2003 and 2005, respectively.
December 31, 2011 was applied as censoring date for all survival analyses. For the different types of survival analysis the events and censoring were defined as shown in Table 5.
Table 5: Overview of the events and censoring as defined for the survival analyses in Section A
Survival type Event Censoring
Patients on renal replacement therapy Death of patient Recovery of renal function * Loss to follow-up
End of follow-up time
Patients on dialysis Death of patient Transplantation
Recovery of renal function * Loss to follow-up
End of follow-up time
First transplant recipients Death of patient Loss to follow-up
End of follow-up time
First graft Death of patient Loss to follow-up
Graft failure End of follow-up time
* Only when a patients’ renal function recovered for more than 30 days this was considered as a censored observation.
Unadjusted survival probabilities
Unadjusted survival probabilities were calculated using the Kaplan-Meier method, and corresponding confidence intervals were calculated according to Bie et al. [3]. In unadjusted survival analysis the cells in the tables were left blank when there were less than 30 patients in that cell.
Adjusted survival probabilities
The Cox regression model was used to compare the survival between groups while accounting for confounders [4]. Survival probabilities were adjusted for age, gender and primary renal disease. As the ERA-EDTA Registry database is still growing with respect to the coverage of European countries, it was decided to adjust for fixed values for a number of variables in the survival analyses to make results more comparable across time periods. The fixed values of variables used for the survival tables are shown in Table 6.
In the adjusted survival analyses, cells with less than 30 events were left empty. Patients for whom age, gender, or primary renal disease was missing were excluded.

125
Survival figures
In the Figures A.6.1 to A.6.3 survival was adjusted for age 60 years and gender 60% men. In addition, Figure A.6.1 was adjusted for primary renal disease distribution: 20% Diabetes; 17% Hypertension / renal vascular disease; 15% Glomerulonephritis and 48% Other cause.
Table 6: Overview of the variables used to adjust the survival probabilities in Section A
Survival type Age Gender Renal disease
Patients on renal 60 years 60% men 20% Diabetes
replacement therapy 17% Hypertension / renal vascular disease
15% Glomerulonephritis
48% Other cause
Patients on dialysis 60 years 60% men 20% Diabetes
17% Hypertension / renal vascular disease
15% Glomerulonephritis
48% Other cause
First transplant recipients 45 years 60% men 10% Diabetes
(deceased donor) 8% Hypertension / renal vascular disease
28% Glomerulonephritis
54% Other cause
First transplant recipients 45 years 60% men 10% Diabetes
(living donor) 8% Hypertension / renal vascular disease
28% Glomerulonephritis
54% Other cause
First graft 45 years 60% men 10% Diabetes
(deceased donor) 8% Hypertension / renal vascular disease
28% Glomerulonephritis
54% Other cause
First graft 45 years 60% men 10% Diabetes
(living donor) 8% Hypertension / renal vascular disease
28% Glomerulonephritis
54% Other cause
The differences between the survival probabilities of this annual report and survival probabilities published in earlier annual reports of the ERA-EDTA Registry may be partly due to differences in participating countries.
Expected remaining lifetimesExpected remaining lifetimes represent the average number of years of life remaining for persons who have reached a given age. In this annual report, expected remaining lifetimes were calculated for RRT patients and for the general population. For the calculation of expected remaining lifetimes of both groups, the methodology of the United States Renal Data System (USRDS) was adopted [5].
To be able to calculate expected remaining lifetimes we used data from registries providing data from 2000 until 2011. Consequently, the data of the following national or regional registries from 11 countries were suitable for this analysis: Austria, Belgium (Dutch-speaking), Belgium (French-speaking), Denmark, Finland, Greece, Iceland, Norway, Spain (Andalusia), Spain (Asturias), Spain (Basque country), Spain (Cantabria), Spain (Catalonia), Spain (Valencian region), Sweden, The Netherlands, United Kingdom (England/Wales) and United Kingdom (Scotland). With regard to the inclusion of the data, it should be noted that the differences between the expected remaining lifetimes of this annual report and expected remaining lifetimes published in earlier annual reports of the ERA-EDTA Registry may be partly due to differences in participating countries.
RRT population
The expected remaining lifetimes for RRT patients are presented by age, gender and treatment modality. The expected remaining lifetime for a certain patient group is the average of the remaining life expectancies for the patients in that group. Although this can not be known until all the patients in the group have died, the expected remaining lifetime can be projected by assuming that patients in the patient group will die at the same rates as those observed among older groups of recent prevalent RRT patients.

126
General population
The death rates Pmp by gender and age of the general population of the contributing countries were provided by Eurostat (based on EU27 in 2005). The size of the contribution of each country to the general population that was used to calculate expected remaining lifetimes was in proportion to the size of the general population covered by its renal registry.
Section BIncidence and prevalence counts were provided by the contributing registries themselves. To increase the consistency of the data, general explanations of how to complete the Microsoft Excel template and how to calculate adjusted incidence and prevalence counts were provided to support the participating registries.
Paediatric SectionThe incidence and prevalence tables were based on data from 21 national or regional registries from 14 countries that provided complete individual patient data in their paediatric population for 2002 to 2011, including Austria, Bosnia and Herzegovina, Denmark, Finland, France, Greece, Iceland, Norway, Romania, Serbia, Spain (Andalusia), Spain (Aragon), Spain (Asturias), Spain (Basque country), Spain (Catalonia), Spain (Extremadura), Spain (Galicia), Spain (Valencian region), Sweden, The Netherlands, and United Kingdom (Scotland). Bosnia and Herzegovina and Serbia provided data for 2011, France since 2008, Spain (Galicia) since 2007, and Romania and Spain (Aragon, Extremadura) provided data since 2006. Furthermore, as not every region in Spain had a specialised paediatric centre, paediatric patients could be treated in other regions than their resident region. This would result in an underestimation of the incidence and prevalence in these regions. To adjust for this, non-resident paediatric patients were not excluded in the paediatric section.
Incidence (on day 1) and prevalence on RRT were calculated for subgroups based on age, treatment modality, and cause of renal failure. Incidence on RRT by 2-year cohorts was presented for paediatric patients who started RRT between 2002 and 2011. The cohorts 2006-2007, 2008-2009 and 2010-2011 were presented twice, once including and once excluding the countries with a limited follow-up to allow for a comparison over time. The incidence on RRT Pmarp was the observed incident count in that particular time period divided by the age-related general population in that time period (for example the total population in 2010 + the total population in 2011) multiplied by one million. The grouping of primary renal disease codes for the paediatric population is described in Table P.1.2 as it differs from the grouping in the adult population.
The prevalence on RRT was presented at December 31 of each year from 2002 to 2011. Again, the years 2007, 2008, 2009, 2010 and 2011 were presented twice to allow for a comparison over time. The prevalence on RRT by cause of renal failure was calculated for patients prevalent on December 31, 2011.
Bibliography
1) Eurostat: http://epp.eurostat.ec.europa.eu/portal/page/portal/population/data/database. Date of extraction: July 15, 2010. Table: Average population by sex and five-year age groups.
2) SAS Institute Inc., Cary, NC, USA.
3) Bie O, Borgan O and Liestol K. Confidence intervals and confidence bands for the cumulative hazard rate function and their small sample properties. Scandinavian Journal of Statistics 1987; 14: 221-233.
4) Altman, D. Practical statistics for medical research. second ed. 1999, London: Chapman & Hall.
5) U.S. Renal Data System, USRDS 2011 Annual Data Report: Atlas of End-Stage Renal Disease in the United States, National Institutes of Health, National Institute of Diabetes and Digestive and Kidney Diseases, Bethesda, MD, 2011.

VII Appendices

128
Appendix 1 - Grouping of primary renal diseases
Primary renal disease 1994 1995 PRD code code group
Glomerulonephritis; histologically NOT examined 10 10 IFocal segmental glomerulosclerosis with nephrotic syndrome in children 11 11 IIgA nephropathy (proven by immunofluorescence, not code 76 or 85) 12 12 IDense deposit disease; membrano-proliferative GN; type II (proven by immunofluorescence 13 13 I / electron microscopy)Membranous nephropathy 14 14 IMembrano-proliferative GN; type I (proven by immunofluorescence / electron microscopy, not code 84 or 89) 15 15 ICrescentic (extracapillary) glomerulonephritis (type I, II, III) 16 16 IFocal segmental glomerulosclerosis with nephrotic syndrome in adults 17 17 IGlomerulonephritis; histologically examined, not given above 19 19 IPyelonephritis; cause not specified 20 20 IIPyelonephritis associated with neurogenic bladder 21 21 IIPyelonephritis due to congenital obstructive uropathy with/without vesico-ureteric reflux 22 22 IIPyelonephritis due to acquired obstructive uropathy 23 23 IIPyelonephritis due to vesico-ureteric reflux without obstruction 24 24 IIPyelonephritis due to urolithiasis 25 25 IIPyelonephritis due to other cause 29 29 IIInterstitial nephritis (not pyelonephritis) due to other cause, or unspecified (not mentioned above) 30 30 VIINephropathy (interstitial) due to analgesic drugs 31 31 VIINephropathy (interstitial) due to cis-platinum 32 32 VIINephropathy (interstitial) due to cyclosporin A 33 33 VIILead induced nephropathy (interstitial) 34 VIIDrug induced nephropathy (interstitial) not mentioned above 39 39 VIICystic kidney disease - type unspecified 40 40 VIIPolycystic kidneys; adult type (dominant) 41 41 IIIPolycystic kidneys; infantile (recessive) 42 42 VIIMedullary cystic disease; including nephronophthisis 43 43 VIICystic kidney disease - other specified type 49 49 VIIHereditary / Familial nephropathy - type unspecified 50 50 VIIHereditary nephritis with nerve deafness (Alport’s Syndrome) 51 51 VIICystinosis 52 52 VIIPrimary oxalosis 53 53 VIIFabry’s disease 54 54 VIIHereditary nephropathy - other specified type 59 59 VIIRenal hypoplasia (congenital) - type unspecified 60 60 VIIOligomeganephronic hypoplasia 61 61 VIICongenital renal dysplasia with or without urinary tract malformation 63 63 VIISyndrome of agenesis of abdominal muscles (Prune Belly) 66 66 VIIRenal vascular disease - type unspecified 70 70 VRenal vascular disease due to malignant hypertension 71 71 IVRenal vascular disease due to hypertension 72 72 IVRenal vascular disease due to polyarteritis 73 73 VIIWegener’s granulomatosis 74 74 VIIIschaemic renal disease/cholesterol embolism (1998 prd code) 75 VIIGlomerulonephritis related to liver cirrhosis 76 76 VIICryoglobulinaemic glomerulonephritis 78 VIIRenal vascular disease - due to other cause (not given above and not code 84-88) 79 79 VDiabetes glomerulosclerosis or diabetic nephropathy - Type I 80 80 VIDiabetes glomerulosclerosis or diabetic nephropathy - Type II 81 80 VIMyelomatosis / light chain deposit disease 82 82 VIIAmyloid 83 83 VIILupus erythematosus 84 84 VIIHenoch-Schoenlein purpura 85 85 VIIGoodpasture’s Syndrome 86 86 VIISystemic sclerosis (scleroderma) 87 87 VIIHaemolytic Uraemic Syndrome (including Moschcowitz Syndrome) 88 88 VIIMulti-system disease - other (not mentioned above) 89 89 VIITubular necrosis (irreversible) or cortical necrosis (different from 88) 90 90 VIITuberculosis 91 91 VIIGout 92 92 VIINephrocalcinosis and hypercalcaemic nephropathy 93 93 VIIBalkan nephropathy 94 94 VIIKidney tumour 95 95 VIITraumatic or surgical loss of kidney 96 96 VIIOther identified renal disorders 99 99 VIIChronic renal failure; aetiology uncertain 00 00 VIII
PRD group: I: glomerulonephritis / sclerosis; II: pyelonephritis; III: polycystic kidneys, adult type; IV: hypertension; V: renal vascular disease; VI: diabetes; VII: miscellaneous; VIII: unknown

129
Appendix 2 - Grouping of causes of death
Cause of death 1994 1995 COD code code group
Cause of death uncertain / not determined 0 0 XIMyocardial ischaemia and infarction 11 11 IHyperkalaemia 12 12 XHaemorrhagic pericarditis 13 13 XOther causes of cardiac failure 14 14 IICardiac arrest / sudden death; other cause or unknown 15 15 IIIHypertensive cardiac failure 16 16 IIHypokalaemia 17 17 XFluid overload / pulmonary oedema 18 18 IIPulmonary embolus 21 21 XCerebro-vascular accident, other cause or unspecified 22 22 IVGastro-intestinal haemorrhage 23 23 XHaemorrhage from graft site 24 24 XHaemorrhage from vascular access or dialysis circuit 25 25 XHaemorrhage from ruptured vascular aneurysm (not code 22 or 23) 26 26 XHaemorrhage from surgery (not code 23, 24 or 26) 27 27 XOther haemorrhage (not codes 23-27) 28 28 XMesenteric infarction 29 29 XPulmonary infection (bacterial - not code 73) 31 31 VPulmonary infection (viral) 32 32 VPulmonary infection (fungal or protozoal; parasitic) 33 33 VInfections elsewhere except virus hepatitis 34 VSepticaemia 35 35 VTuberculosis (lung) 36 36 VTuberculosis (elsewhere) 37 37 VGeneralized viral infection 38 38 VPeritonitis (all causes except for Peritoneal Dialysis) 39 39 VLiver disease due to hepatitis B virus 41 41 XLiver disease due to other viral hepatitis 42 42 XLiver disease due to drug toxicity 43 43 XCirrhosis - not viral 44 44 XCystic liver disease 45 45 XLiver failure - cause unknown 46 46 XPatient refused further treatment for ESRF 51 51 VISuicide 52 52 VIESRF treatment ceased for any other reason 53 53 VIIESRF treatment withdrawn for medical reasons 54 VIIUremia caused by graft failure 61 XPancreatitis 62 62 XBone marrow depression 63 63 XCachexia 64 64 VIIIMalignant disease, possibly induced by immunosuppressive therapy 66 66 IXMalignant disease: solid tumors except those of 66 67 67 IXMalignant disease: lymphoproliferative disorders except those of 66 68 IXDementia 69 69 XPeritonitis (sclerosing, with peritoneal dialysis) 70 70 VPerforation of peptic ulcer 71 71 XPerforation of colon 72 72 XChronic obstructive airways disease 73 73 XAccident related to ESRF treatment (not code 25) 81 81 XAccident unrelated to ESRF treatment 82 82 XPeritonitis (bacterial, with peritoneal dialysis) 100 VPeritonitis (fungal, with peritoneal dialysis) 101 VPeritonitis (due to other cause, with peritoneal dialysis) 102 VOther identified cause of death 99 99 X
COD group: I: myocardial ischaemia and infarction; II: heart failure; III: cardiac arrest, other cause / unknown; IV: cerebrovascular accident;V: infection; VI: suicide / refusal treatment; VII: withdrawal; VIII: cachexia; IX: malignancies; X: miscellaneous; XI: unknown / unavailable

130
Appendix 3 - Treatment modalities
Event Event code
Home haemodialysis 001Centre haemodialysis 002Haemofiltration 003Haemodiafiltration 004Haemodialysis, type unknown 009
Continuous Ambulatory Peritoneal Dialysis (CAPD) 011Intermittent Ambulatory Peritoneal Dialysis (CAPD) 012Continuous Automated Peritoneal Dialysis (APD) 013Intermittent Automated Peritoneal Dialysis (APD) 014Peritoneal Dialysis, type unknown 019
Unknown dialysis 090 Transplantation, living donor 020Transplantation, living related donor 021Transplantation, living unrelated donor 022Transplantation, deceased donor 023Transplantation, donor type unknown 029Transplantation follow-up (still functioning) 060Graft failure 061 Treatment type unknown / unavailable 031 Recovery Renal Function 051Death 052Transfer out to other registry 053Transfer in from other registry 054Lost to follow-up 055
Limited care / stopped treatment (without recovery of renal function) 071

131
Appendix 4 - Renal registries contributing data for the different types of analyses
Section A Section B Section Paediatric RRT Individual patient data Aggregated data Individual patient data
Incidence Survival Expected Incidence Incidence and remaining and and prevalence lifetimes prevalence prevalence
Albania - - - + -
Austria + + + - +
Belgium, Dutch-speaking + + + - -
Belgium, French-speaking + + + - -
Bosnia and Herzegovina + - - - +
Croatia - - - + -
Czech Republic - - - + -
Denmark + + + - +
Estonia - - - + -
Finland + + + - +
France * + - - + +
FYR of Macedonia - - - + -
Greece + + + - +
Iceland + + + - +
Israel - - - + -
Italy † - + - - -
Latvia - - - + -
Montenegro - - - + -
Norway + + + - +
Poland - - - + -
Portugal - - - + -
Romania + - - - +
Russia - - - + -
Serbia + - - - +
Slovakia - - - + -
Slovenia - - - + -
Spain, Andalusia + + + + +
Spain, Aragon + + - + +
Spain, Asturias + + + + +
Spain, Balearic Islands - - - + -
Spain, Basque country + + + + +
Spain, Canary Islands - - - + -
Spain, Cantabria + + + + -
Spain, Castile and León + + - + -
Spain, Castile-La Mancha + + - + -
Spain, Catalonia + + + + +
Spain, Ceuta - - - + -
Spain, Community of Madrid - - - + -
Spain, Extremadura + + - + +
Spain, Galicia + - - + +
Spain, La Rioja - - - + -
Spain, Melilla - - - + -
Spain, Navarre - - - + -
Spain, Region of Murcia - - - + -
Spain, Valencian region + + + + +
Sweden + + + - +
The Netherlands + + + - +
Turkey - - - + -
Ukraine - - - + -
United Kingdom, England + + + - -
United Kingdom, Northern Ireland + + - - -
United Kingdom, Scotland + + + - +
United Kingdom, Wales + + + - -
* Incidence and prevalence data based on the regions Alsace, Aquitaine, Auvergne, Brittany, Burgundy, Centre, Champagne-Ardenne, Corsica, Franche-Comté, Île-de-France (only in B), Languedoc-Roussillon, Limousin, Lorraine (only in B), Lower Normandy, Midi-Pyrénées, Nord-Pas-de-Calais, Pays de la Loire, Picardy, Poitou-Charentes, Provence-Alpes-Côte-d’Azur, Rhône-Alpes, Upper Normandy and the overseas departments of Guadeloupe, Guiana and Réunion† Survival data based on the region Calabria only


ERA-EDTA RegistryAcademic Medical CenterDepartment of Medical InformaticsPO Box 227001100 DE AmsterdamThe Netherlands
ISBN 978-90-817480-3-2
June 2013
Annual Report 2011
ERA-ED
TA Registry
AnnualReport
2011
ERA-EDTA Registry
www.era-edta-reg.org