equivalent loading asphalt layer pavement …...1 equivalent loading frequencies to simulate asphalt...
TRANSCRIPT
1
Equivalent Loading Frequencies to Simulate Asphalt Layer Pavement Responses Under
Dynamic Traffic Loading
Elie Y. Hajj, Ph.D.Alvaro Ulloa, Ph.D. Candidate
Peter E. Sebaaly, Ph.D. Raj V. Siddharthan, Ph.D.
University of Nevada Reno
Asphalt Mixture & Construction ETGPhoenix, ArizonaMarch 18, 2011
Introduction
• Dynamic response of AC pavements under moving load is a key component for accurate prediction of flexible a key component for accurate prediction of flexible pavement performance.
• Reliable determination of pavement responses to moving load is essential for a successful mechanistic design procedure.
• Time and temperature dependency of asphalt must be considered in the mechanistic analysis response model.
2
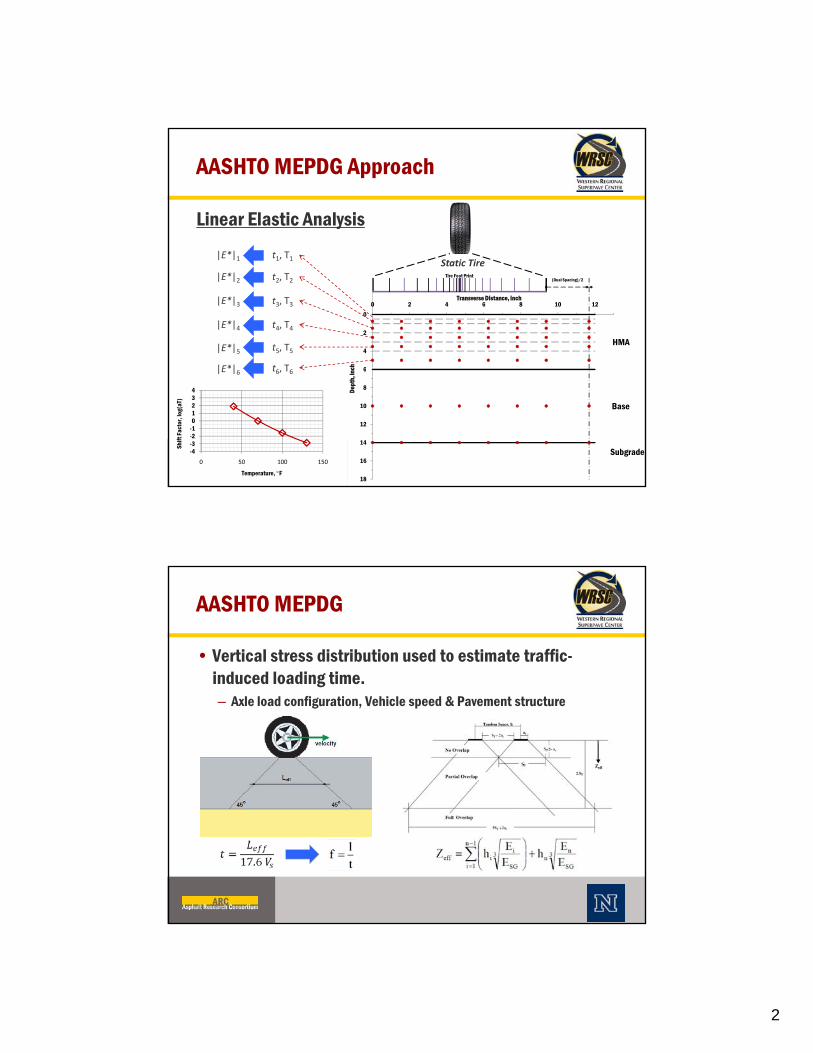
Linear Elastic Analysis
AASHTO MEPDG Approach
HMA
Tire Foot Print(Dual Spacing)/2-4
-2
0
2
4
6
0 2 4 6 8 10 12
h
Transverse Distance, inch
t2, T2
t3, T3
t4, T4
t T
|E*|2
|E*|3
|E*|4
|E*|
Static Tire
t5, T5|E*|5
t1, T1|E*|1
Base
Subgrade
6
8
10
12
14
16
18
Dep
th, i
nct6, T6|E*|6
-4-3-2-101234
0 50 100 150
Shift
Fac
tor,
log(
aT)
Temperature, F
• Vertical stress distribution used to estimate traffic-induced loading time.
AASHTO MEPDG
g– Axle load configuration, Vehicle speed & Pavement structure
3
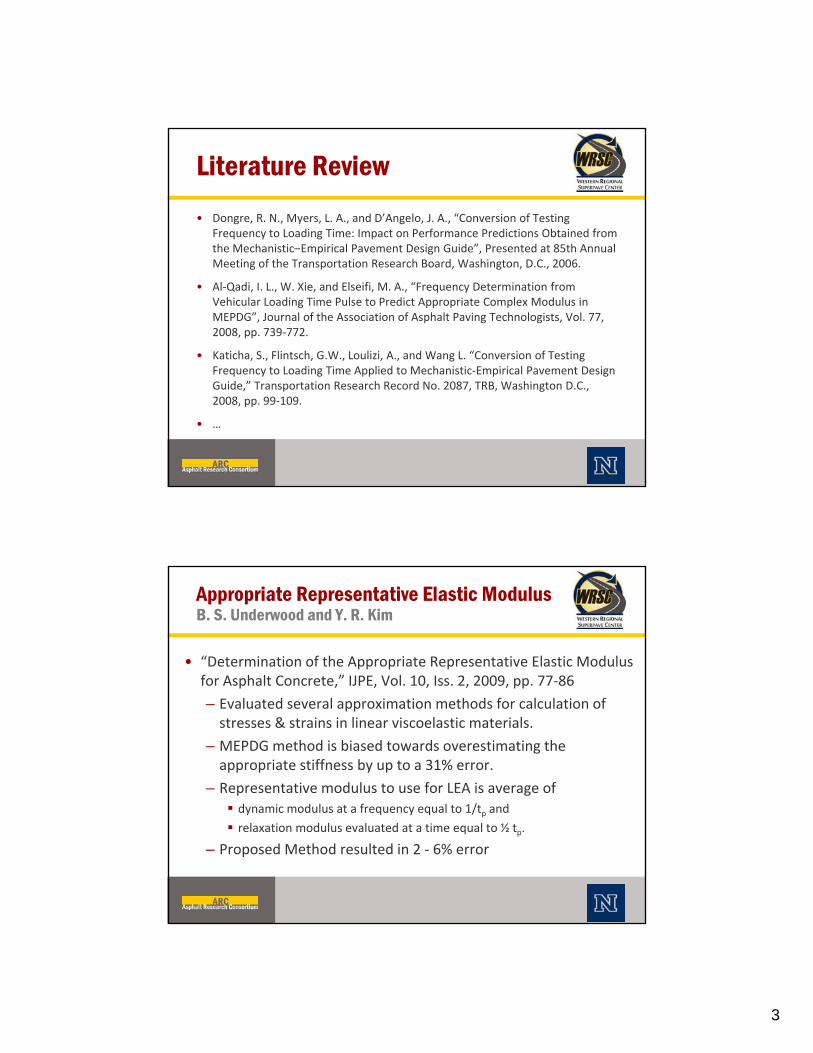
Literature Review
• Dongre, R. N., Myers, L. A., and D’Angelo, J. A., “Conversion of Testing Frequency to Loading Time: Impact on Performance Predictions Obtained from the Mechanistic Empirical Pavement Design Guide” Presented at 85th Annualthe Mechanistic–Empirical Pavement Design Guide , Presented at 85th Annual Meeting of the Transportation Research Board, Washington, D.C., 2006.
• Al‐Qadi, I. L., W. Xie, and Elseifi, M. A., “Frequency Determination from Vehicular Loading Time Pulse to Predict Appropriate Complex Modulus in MEPDG”, Journal of the Association of Asphalt Paving Technologists, Vol. 77, 2008, pp. 739‐772.
• Katicha, S., Flintsch, G.W., Loulizi, A., and Wang L. “Conversion of Testing F t L di Ti A li d t M h i ti E i i l P t D iFrequency to Loading Time Applied to Mechanistic‐Empirical Pavement Design Guide,” Transportation Research Record No. 2087, TRB, Washington D.C., 2008, pp. 99‐109.
• …
Appropriate Representative Elastic ModulusB. S. Underwood and Y. R. Kim
• “Determination of the Appropriate Representative Elastic Modulus for Asphalt Concrete,” IJPE, Vol. 10, Iss. 2, 2009, pp. 77‐86for Asphalt Concrete, IJPE, Vol. 10, Iss. 2, 2009, pp. 77 86
– Evaluated several approximation methods for calculation of stresses & strains in linear viscoelastic materials.
– MEPDG method is biased towards overestimating the appropriate stiffness by up to a 31% error.
– Representative modulus to use for LEA is average ofd i d l f l 1/ d dynamic modulus at a frequency equal to 1/tp and
relaxation modulus evaluated at a time equal to ½ tp.
– Proposed Method resulted in 2 ‐ 6% error
4
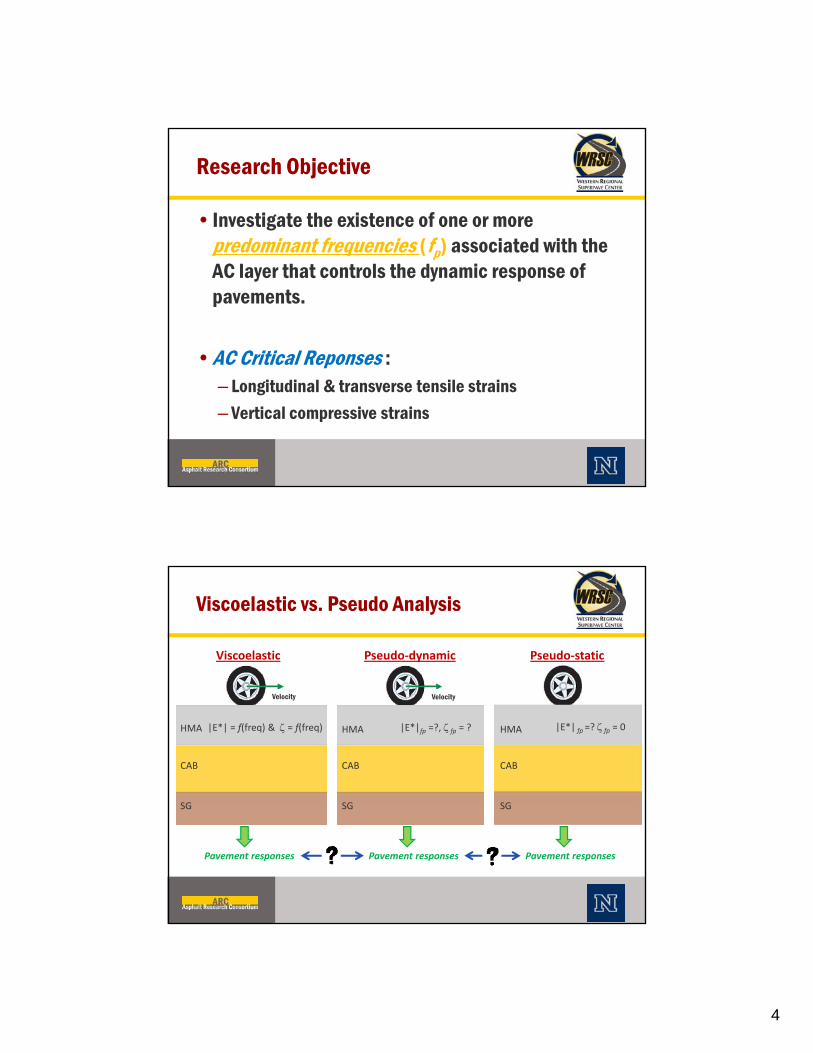
•Investigate the existence of one or more predominant frequencies (f ) associated with the
Research Objective
predominant frequencies (fp) associated with the AC layer that controls the dynamic response of pavements.
•AC Critical Reponses :p– Longitudinal & transverse tensile strains
– Vertical compressive strains
Viscoelastic vs. Pseudo Analysis
Viscoelastic Pseudo‐staticPseudo‐dynamic
HMA
CAB
SG
|E*| = f(freq) & = f(freq) HMA
CAB
SG
|E*| fp =? fp = 0HMA
CAB
SG
|E*|fp =?, fp = ?
VelocityVelocity
Pavement responses
SG
Pavement responses
SG
Pavement responses
SG
5
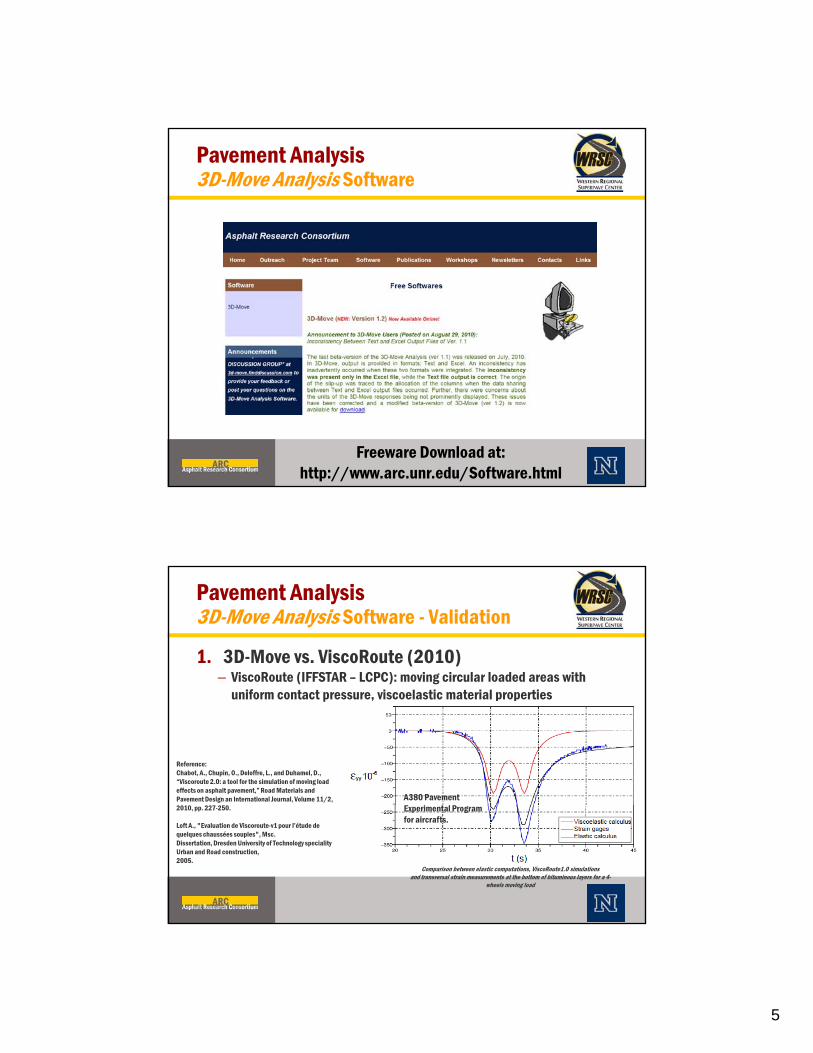
Pavement Analysis3D-Move Analysis Software
Freeware Download at:http://www.arc.unr.edu/Software.html
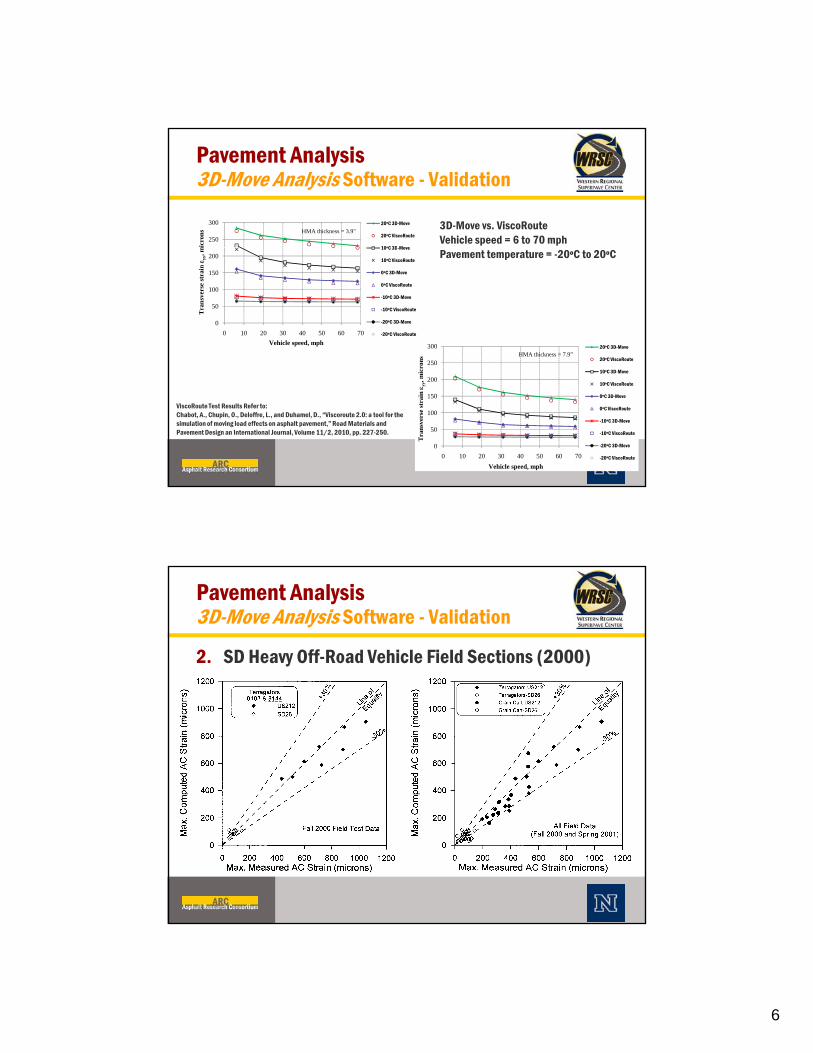
1. 3D-Move vs. ViscoRoute (2010)– ViscoRoute (IFFSTAR – LCPC): moving circular loaded areas with
Pavement Analysis3D-Move Analysis Software - Validation
uniform contact pressure, viscoelastic material properties
A380 Pavement
Reference:Chabot, A., Chupin, O., Deloffre, L., and Duhamel, D., “Viscoroute 2.0: a tool for the simulation of moving load effects on asphalt pavement,” Road Materials and Pavement Design an International Journal, Volume 11/2,
Experimental Program for aircrafts.
Comparison between elastic computations, ViscoRoute1.0 simulationsand transversal strain measurements at the bottom of bituminous layers for a 4-
wheels moving load
2010, pp. 227-250.
Loft A., "Evaluation de Viscoroute-v1 pour l’étude de quelques chaussées souples", Msc.Dissertation, Dresden University of Technology specialityUrban and Road construction,2005.
6
250
300
mic
ron
s
20ºC 3D-Move
20ºC ViscoRoute
10ºC 3D Move
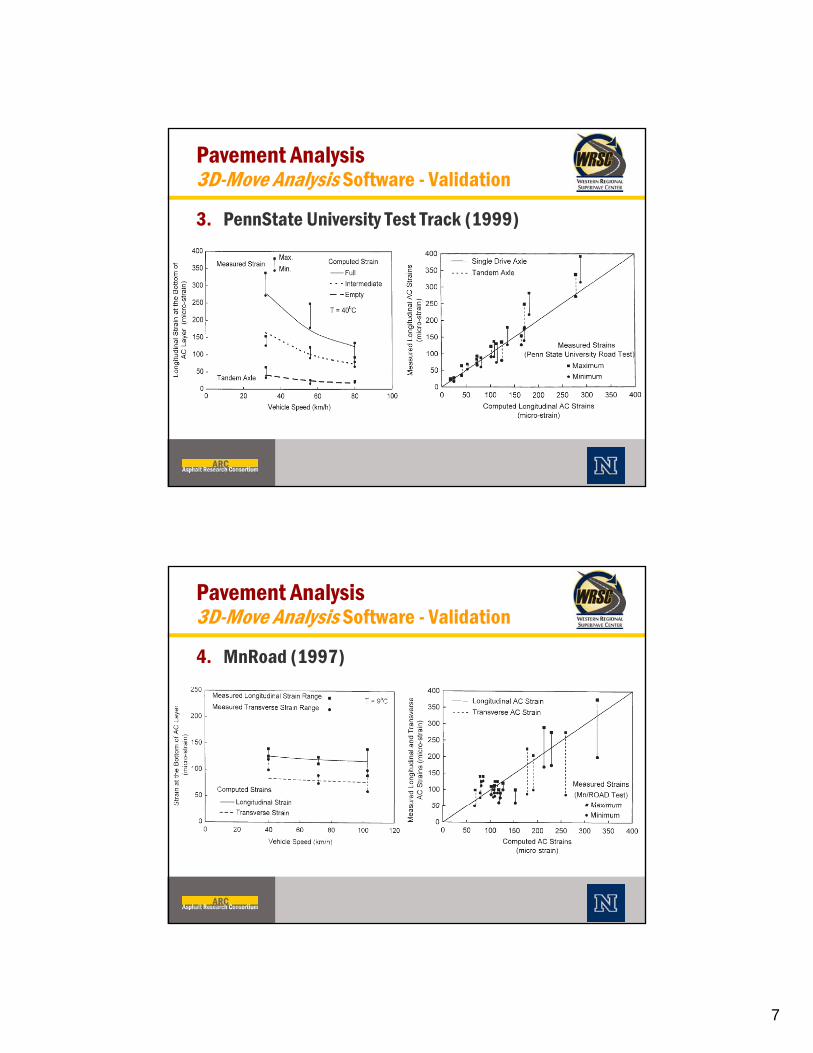
HMA thickness = 3.9"3D-Move vs. ViscoRouteVehicle speed = 6 to 70 mph
Pavement Analysis3D-Move Analysis Software - Validation
0
50
100
150
200
0 10 20 30 40 50 60 70
Tra
nsv
erse
str
ain
yy
, m
Vehicle speed, mph
10ºC 3D-Move
10ºC ViscoRoute
0ºC 3D-Move
0ºC ViscoRoute
-10ºC 3D-Move
-10ºC ViscoRoute
-20ºC 3D-Move
-20ºC ViscoRoute
250
300
ron
s
20ºC 3D-Move
20ºC ViscoRouteHMA thickness = 7.9”
Pavement temperature = -20ºC to 20ºC
0
50
100
150
200
0 10 20 30 40 50 60 70
Tra
nsv
erse
str
ain
yy
, mic
r
Vehicle speed, mph
10ºC 3D-Move
10ºC ViscoRoute
0ºC 3D-Move
0ºC ViscoRoute
-10ºC 3D-Move
-10ºC ViscoRoute
-20ºC 3D-Move
-20ºC ViscoRoute
ViscoRoute Test Results Refer to:Chabot, A., Chupin, O., Deloffre, L., and Duhamel, D., “Viscoroute 2.0: a tool for the simulation of moving load effects on asphalt pavement,” Road Materials and Pavement Design an International Journal, Volume 11/2, 2010, pp. 227-250.
2. SD Heavy Off-Road Vehicle Field Sections (2000)
Pavement Analysis3D-Move Analysis Software - Validation
7
3. PennState University Test Track (1999)
Pavement Analysis3D-Move Analysis Software - Validation
4. MnRoad (1997)
Pavement Analysis3D-Move Analysis Software - Validation
8
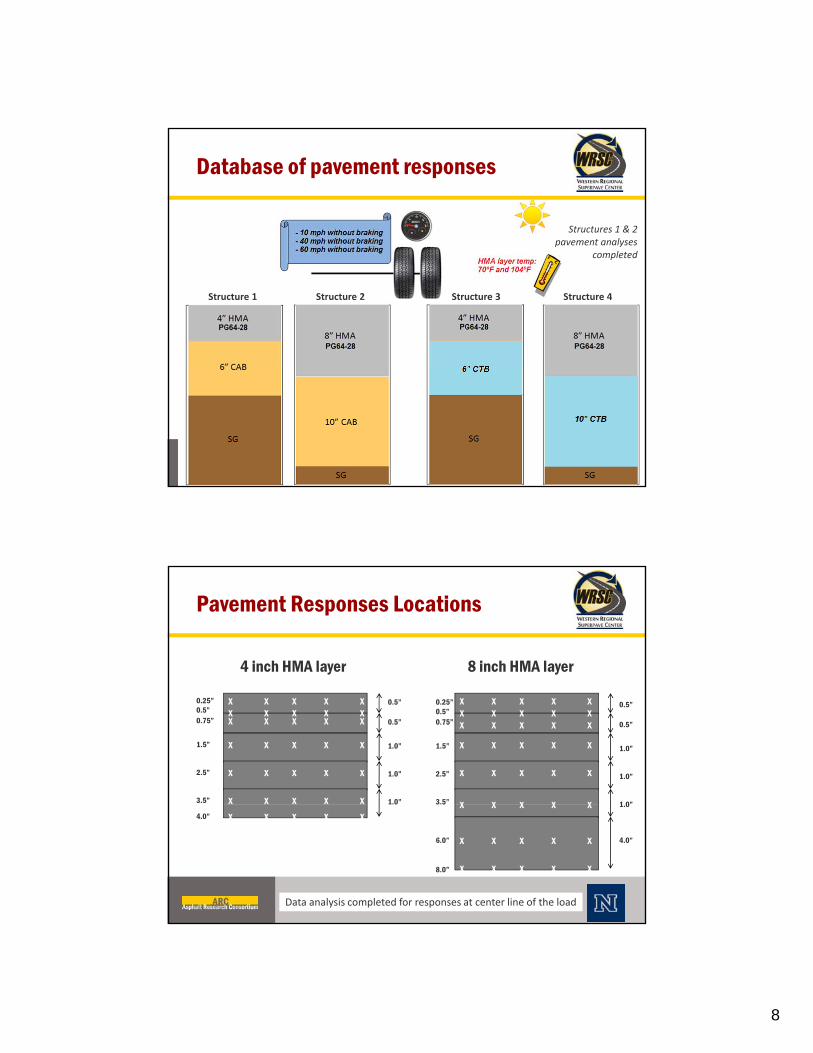
Database of pavement responses
Structures 1 & 2 pavement analyses
Structure 1 Structure 2 Structure 3 Structure 4
completed
Pavement Responses Locations
4 inch HMA layer 8 inch HMA layer
XXX
X
X
X
XX
X
X
X
X
0.5”
0.5”
1.0”
1.0”
1.0”
0.5”
0.5”
1.0”
1.0”
1 0”
0.25”0.5”0.75”
1.5”
2.5”
3.5”
0.25”0.5”0.75”
1.5”
2.5”
3.5”
XXX
X
X
X
XXX
X
X
X
XXX
X
X
X
XXX
X
X
X
XX
X
X
X
X
XX
X
X
X
X
XX
X
X
X
X
XX
X
X
X
X
AX
X
X
X
1.0
4.0”
4.0”
6.0”
8.0”
Data analysis completed for responses at center line of the load
XXX X
X
X
X
X
X
X
X
X
X
X
X
X
9
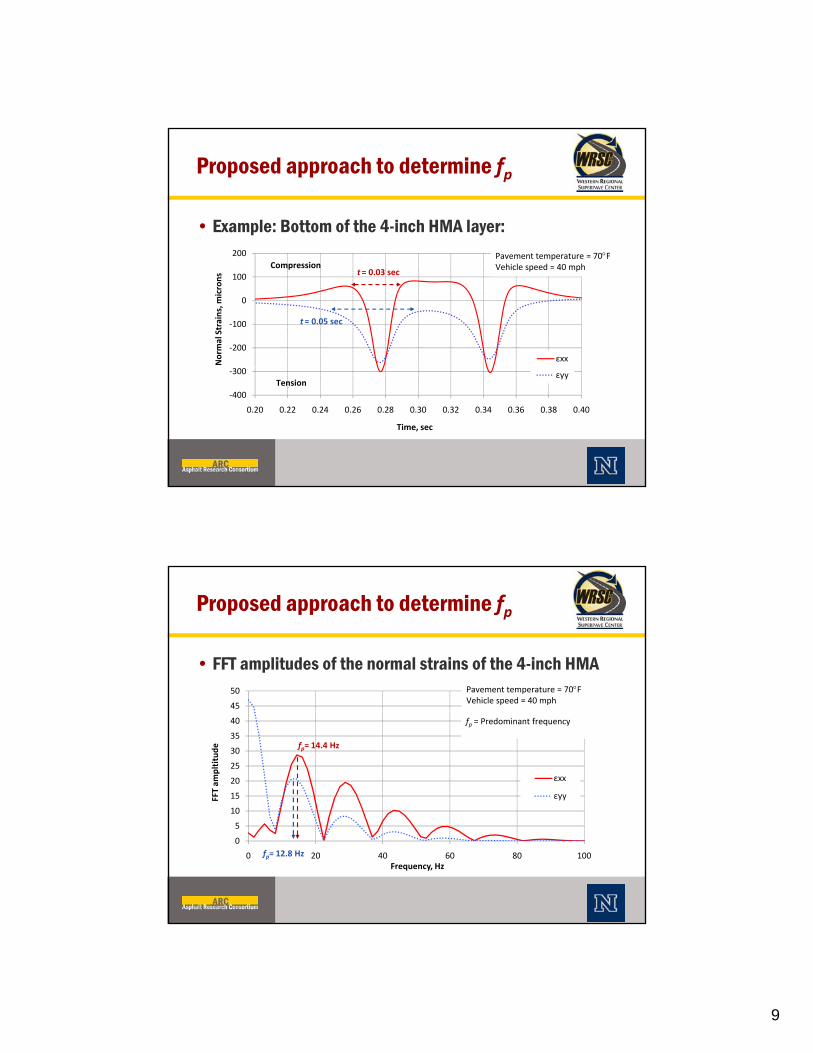
Proposed approach to determine fp
• Example: Bottom of the 4-inch HMA layer:
‐200
‐100
0
100
200
Norm
al Strains, m
icrons
εxx
t= 0.03 secCompression
Pavement temperature = 70FVehicle speed = 40 mph
t= 0.05 sec
‐400
‐300
0.20 0.22 0.24 0.26 0.28 0.30 0.32 0.34 0.36 0.38 0.40
Time, sec
εyyTension
Proposed approach to determine fp
• FFT amplitudes of the normal strains of the 4-inch HMA
15
20
25
30
35
40
45
50
FFT am
pltitude
εxx
εyy
fp = Predominant frequency
fp= 14.4 Hz
Pavement temperature = 70FVehicle speed = 40 mph
0
5
10
0 20 40 60 80 100Frequency, Hz
fp= 12.8 Hz
10
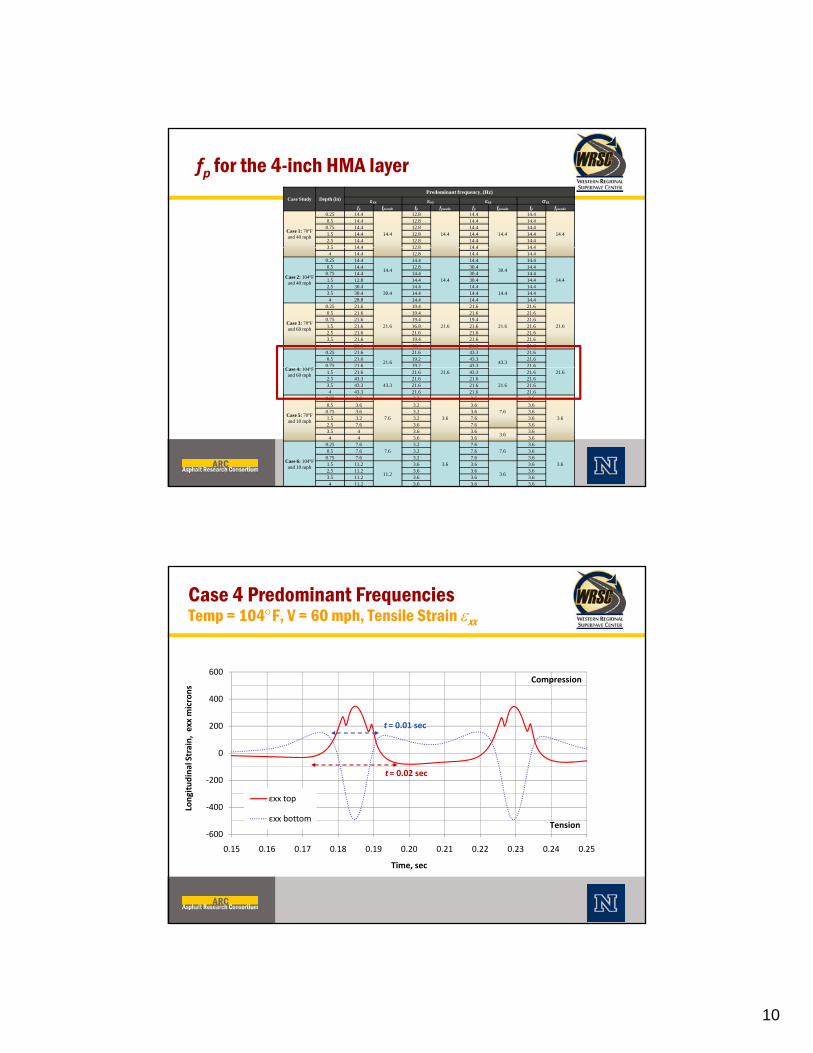
fp for the 4-inch HMA layerCase Study Depth (in)
Predominant frequency, (Hz)
xx yy zz zz
fp fpseudo fp fpseudo fp fpseudo fp fpseudo
Case 1: 70ºF and 40 mph
0.25 14.4
14.4
12.8
14.4
14.4
14.4
14.4
14.4
0.5 14.4 12.8 14.4 14.40.75 14.4 12.8 14.4 14.41.5 14.4 12.8 14.4 14.42.5 14.4 12.8 14.4 14.43 5 14 4 12 8 14 4 14 43.5 14.4 12.8 14.4 14.44 14.4 12.8 14.4 14.4
Case 2: 104ºF and 40 mph
0.25 14.4
14.4
14.4
14.4
14.4
30.4
14.4
14.4
0.5 14.4 12.8 30.4 14.40.75 14.4 14.4 30.4 14.41.5 12.8 14.4 30.4 14.42.5 30.4
30.414.4 14.4
14.414.4
3.5 30.4 14.4 14.4 14.44 28.8 14.4 14.4 14.4
Case 3: 70ºF and 60 mph
0.25 21.6
21.6
19.4
21.6
21.6
21.6
21.6
21.6
0.5 21.6 19.4 21.6 21.60.75 21.6 19.4 19.4 21.61.5 21.6 16.8 21.6 21.62.5 21.6 21.6 21.6 21.63.5 21.6 19.4 21.6 21.64 21.6 19.4 21.6 21.6
0.25 21.6
21.6
21.6 43.3
43.3
21.60.5 21.6 19.2 43.3 21.6
0.75 21.6 19.2 43.3 21.6Case 4: 104ºF
and 60 mph21.6 21.61.5 21.6 21.6 43.3 21.6
2.5 43.343.3
21.6 21.621.6
21.63.5 43.3 21.6 21.6 21.64 43.3 21.6 21.6 21.6
Case 5: 70ºF and 10 mph
0.25 3.6
7.6
3.2
3.6
3.6
7.6
3.6
3.6
0.5 3.6 3.2 3.6 3.60.75 3.6 3.2 3.6 3.61.5 3.2 3.2 7.6 3.62.5 7.6 3.6 7.6 3.63.5 4 3.6 3.6
3.63.6
4 4 3.6 3.6 3.6
Case 6: 104ºF and 10 mph
0.25 7.67.6
3.2
3.6
7.67.6
3.6
3.6
0.5 7.6 3.2 7.6 3.60.75 7.6 3.2 7.6 3.61.5 11.2
11.2
3.6 3.6
3.6
3.62.5 11.2 3.6 3.6 3.63.5 11.2 3.6 3.6 3.64 11.2 3.6 3.6 3.6
Case 4 Predominant FrequenciesTemp = 104F, V = 60 mph, Tensile Strain xx
600Compression
400
‐200
0
200
400
ongitudinal Strain, exx microns
εxx top
t= 0.02 sec
t= 0.01 sec
‐600
‐400
0.15 0.16 0.17 0.18 0.19 0.20 0.21 0.22 0.23 0.24 0.25
Lo
Time, sec
εxx bottomTension
11
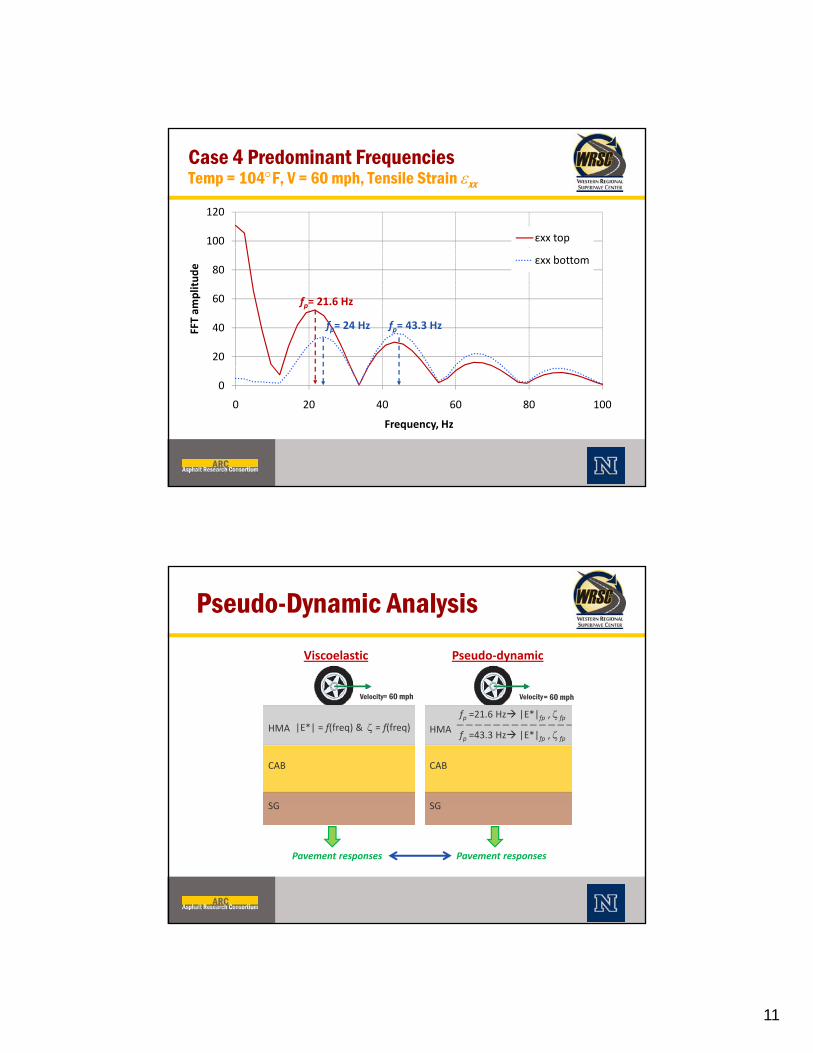
Case 4 Predominant FrequenciesTemp = 104F, V = 60 mph, Tensile Strain xx
100
120
εxx top
20
40
60
80
FFT am
plitude εxx bottom
fp= 21.6 Hz
fp= 24 Hz fp= 43.3 Hz
0
0 20 40 60 80 100
Frequency, Hz
Pseudo-Dynamic Analysis
Viscoelastic Pseudo‐dynamic
HMA
CAB
SG
|E*| = f(freq) & = f(freq) HMA
CAB
SG
fp =21.6 Hz |E*|fp , fp
VelocityVelocity
fp =43.3 Hz |E*|fp , fp
= 60 mph = 60 mph
Pavement responses
SG
Pavement responses
SG
12
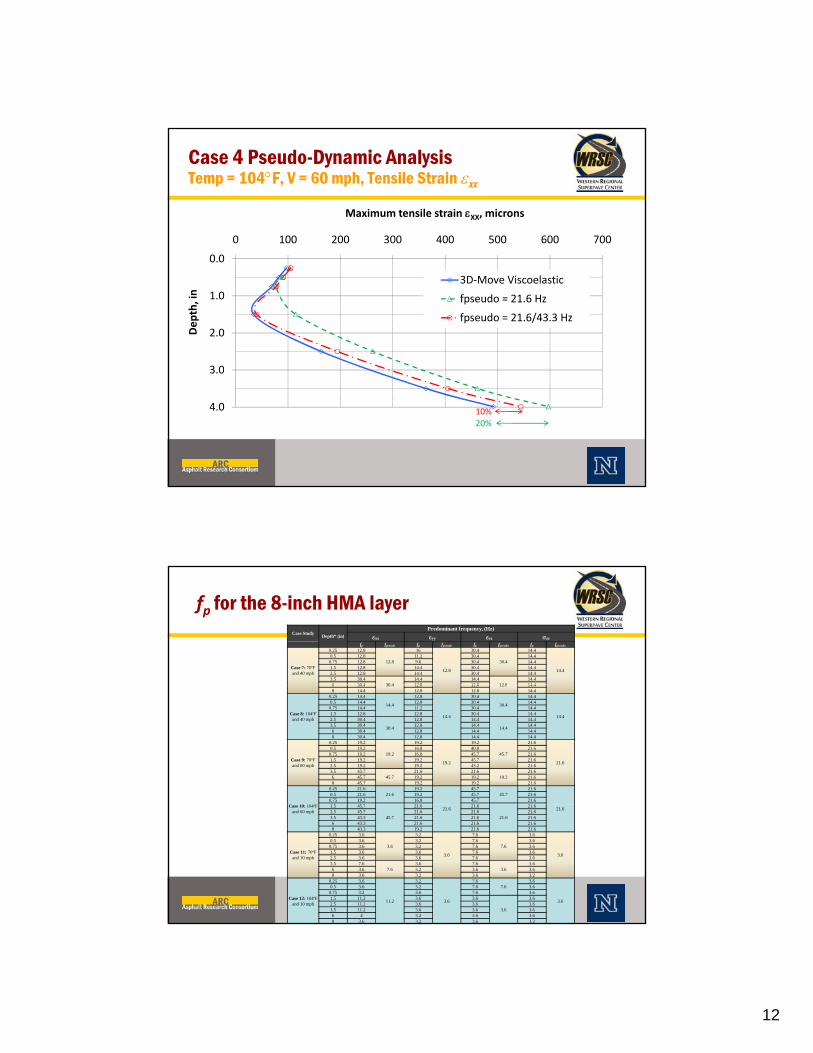
Case 4 Pseudo-Dynamic AnalysisTemp = 104F, V = 60 mph, Tensile Strain xx
0 100 200 300 400 500 600 700
Maximum tensile strain XX, microns
0.0
1.0
2.0
3 0
Depth, in
3D‐Move Viscoelastic
fpseudo = 21.6 Hz
fpseudo = 21.6/43.3 Hz
3.0
4.0 10%
20%
fp for the 8-inch HMA layerCase Study
Depth* (in)
Predominant frequency, (Hz)
xx yy zz zz
fp fpseudo fp fpseudo fp fpseudo fp fpseudo
Case 7: 70ºF and 40 mph
0.25 12.8
12.8
16
12.8
30.4
30.4
14.4
14.4
0.5 12.8 11.2 30.4 14.40.75 12.8 9.6 30.4 14.41.5 12.8 14.4 30.4 14.42.5 12.8 14.4 30.4 14.43.5 30.4
30 414.4 14.4
12 814.4
6 30 4 12 8 12 8 14 430.4 12.86 30.4 12.8 12.8 14.48 14.4 12.8 12.8 14.4
Case 8: 104ºF and 40 mph
0.25 14.4
14.4
12.8
14.4
30.4
30.4
14.4
14.4
0.5 14.4 12.8 30.4 14.40.75 14.4 11.2 30.4 14.41.5 12.8 12.8 30.4 14.42.5 30.4
30.4
12.8 14.4
14.4
14.43.5 30.4 12.8 14.4 14.46 30.4 12.8 14.4 14.48 30.4 12.8 14.4 14.4
Case 9: 70ºF and 60 mph
0.25 19.2
19.2
19.2
19.2
19.2
45.7
21.6
21.6
0.5 19.2 16.8 40.8 21.60.75 19.2 16.8 45.7 21.61.5 19.2 19.2 45.7 21.62.5 19.2 19.2 43.2 21.63.5 45.7
45.721.6 21.6
19.221.6
6 45.7 19.2 19.2 21.68 45.7 19.2 19.2 21.6
C 10 104ºF
0.25 21.621.6
19.2 45.745.7
21.60.5 21.6 19.2 45.7 21.6
0.75 19.2 16.8 45.7 21.61 5 45 7 21 6 21 6 21 6Case 10: 104ºF
and 60 mph21.6 21.6
1.5 45.7
45.7
21.6 21.6
21.6
21.62.5 45.7 21.6 21.6 21.63.5 43.3 21.6 21.6 21.66 43.3 21.6 21.6 21.68 43.3 19.2 21.6 21.6
Case 11: 70ºF and 10 mph
0.25 3.6
3.6
3.2
3.6
7.6
7.6
3.6
3.6
0.5 3.6 3.2 7.6 3.60.75 3.6 3.2 7.6 3.61.5 3.6 3.6 7.6 3.62.5 3.6 3.6 7.6 3.63.5 7.6
7.63.6 7.6
3.63.6
6 3.6 3.2 3.6 3.68 3.6 3.2 3.6 3.2
Case 12: 104ºF and 10 mph
0.25 3.6
11.2
3.2
3.6
7.67.6
3.6
3.6
0.5 3.6 3.2 7.6 3.60.75 3.2 3.6 7.6 3.61.5 11.2 3.6 3.6
3.6
3.62.5 11.2 3.6 3.6 3.63.5 11.2 3.6 3.6 3.66 4 3.2 3.6 3.68 3.6 3.2 3.6 3.2

13
Viscoelastic vs. Pseudo-Dynamic analysis
400
500, m
icro
ns 4-inch HMA layer - 70ºF - 40 mph
400
500
, mic
rons 4-inch HMA layer - 70ºF - 60 mph
400
500
mic
rons 4-inch HMA layer - 70ºF - 10 mph
4-inch HMA layer
0
100
200
300
0 100 200 300 400 500
Com
pute
d ps
eudo
str
ains
,
3D-Move viscoelastic strains, microns
εxx
εyy
εzz
+10%
-10%
400
500
rain
s, m
icro
ns 4-inch HMA layer - 104ºF - 40 mph
800
1000
1200
rain
s, m
icro
ns 4-inch HMA layer - 104ºF - 60 mph
0
100
200
300
0 100 200 300 400 500
Com
pute
d ps
eudo
str
ains
,
3D-Move viscoelastic strains, microns
εxx
εyy
εzz
+10%
-10%
0
100
200
300
400
0 100 200 300 400 500
Com
pute
d ps
eudo
str
ains
, m
3D-Move viscoelastic strains, microns
εxx
εyy
εzz
+10% -10%
800
1000
1200
rain
s, m
icro
ns 4-inch HMA layer - 104ºF - 10 mph
0
100
200
300
0 100 200 300 400 500
Com
pute
d ps
eudo
str
3D-Move viscoelastic strains, microns
εxx
εyy
εzz
+10%
-10%
0
200
400
600
0 200 400 600 800 1000 1200
Com
pute
d ps
eudo
str
3D-Move viscoelastic strains, microns
εxx
εyy
εzz
+10%
-10%
0
200
400
600
0 200 400 600 800 1000 1200
Com
pute
d ps
eudo
str
3D-Move viscoelastic strains, microns
εxx
εyy
εzz
+10%
-10%
Viscoelastic vs. Pseudo-Dynamic analysis
8-inch HMA layer200
mic
rons 8-inch HMA layer - 70ºF - 40 mph
200
mic
rons 8-inch HMA layer - 70ºF - 60 mph
200
mic
rons 8-inch HMA layer - 70ºF - 10 mph
0
50
100
150
0 50 100 150 200
Com
pute
d ps
eudo
str
ains
, m
3D-Move viscoelastic strains, microns
εxx
εyy
εzz
+10%
-10%
600
750
900
stra
ins,
mic
rons 8-inch HMA layer - 104ºF - 40 mph
0
50
100
150
0 50 100 150 200
Com
pute
d ps
eudo
str
ains
, m
3D-Move viscoelastic strains, microns
εxx
εyy
εzz
+10%
-10%
600
750
900
o st
rain
s, m
icro
ns 8-inch HMA layer - 104ºF - 60 mph
0
50
100
150
0 50 100 150 200
Com
pute
d ps
eudo
str
ains
, m
3D-Move viscoelastic strains, microns
εxx
εyy
εzz
+10%
-10%
450
600
750
900
do s
trai
ns, m
icro
ns 8-inch HMA layer - 104ºF - 10 mph
εxx
0
150
300
450
0 150 300 450 600 750 900
Com
pute
d ps
eudo
s
3D-Move viscoelastic strains, microns
εxx
εyy
εzz
+10%
-10%
0
150
300
450
0 150 300 450 600 750 900
Com
pute
d ps
eud
3D-Move viscoelastic strains, microns
εxx
εyy
εzz
+10%
-10%
0
150
300
450
0 150 300 450 600 750 900
Com
pute
d ps
eud
3D-Move viscoelastic strains, microns
εxx
εyy
εzz
+10%
-10%
14
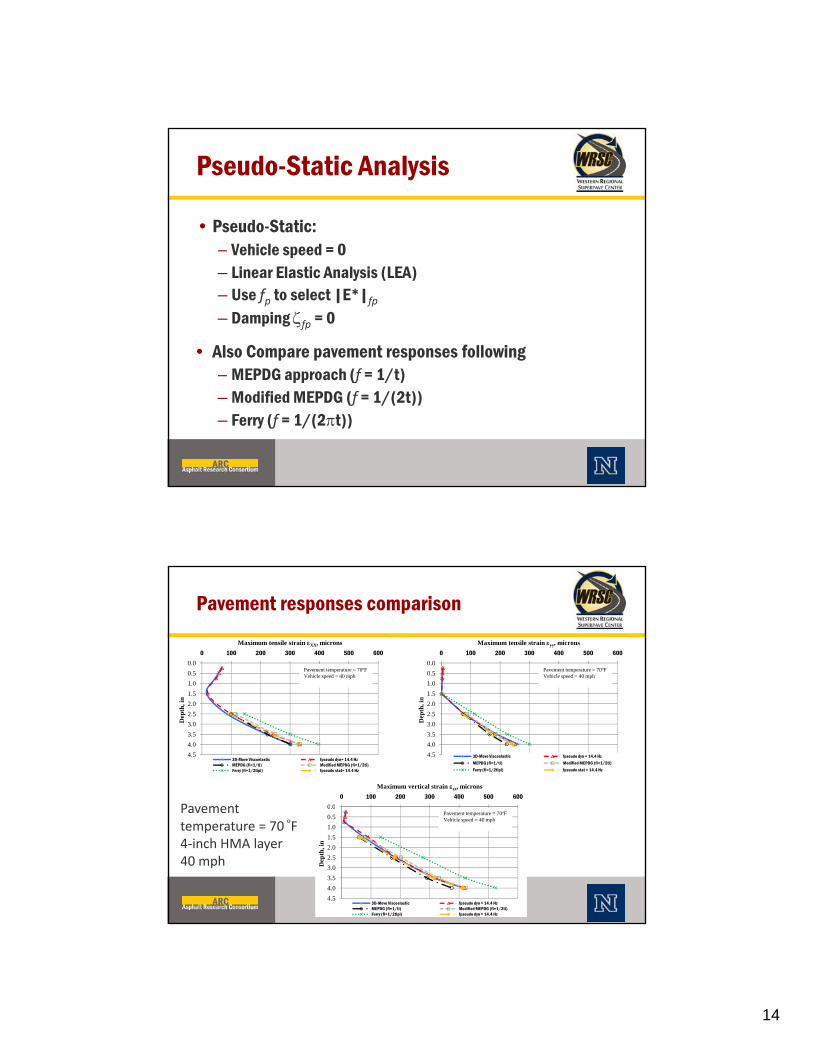
Pseudo-Static Analysis
• Pseudo-Static:Vehicle speed = 0– Vehicle speed = 0
– Linear Elastic Analysis (LEA)– Use fp to select |E*|fp
– Damping fp = 0
• Also Compare pavement responses following– MEPDG approach (f = 1/t)– Modified MEPDG (f = 1/(2t))– Ferry (f = 1/(2t))
Pavement responses comparison
0.0
0.5
1.0
0 100 200 300 400 500 600
Maximum tensile strain XX, microns
Pavement temperature = 70ºFVehicle speed = 40 mph
0.0
0.5
1.0
0 100 200 300 400 500 600
Maximum tensile strain yy, microns
Pavement temperature = 70ºFVehicle speed = 40 mph
P t
1.0
1.5
2.0
2.5
3.0
3.5
4.0
4.5
Dep
th, i
n
3D-Move Viscoelastic fpseudo dyn= 14.4 HzMEPDG (fi=1/ti) Modified MEPDG (fi=1/2ti)Ferry (fi=1/2tipi) fpseudo stat= 14.4 Hz
1.0
1.5
2.0
2.5
3.0
3.5
4.0
4.5
Dep
th, i
n
3D-Move Viscoelastic fpseudo dyn = 14.4 Hz
MEPDG (fi=1/ti) Modified MEPDG (fi=1/2ti)
Ferry (fi=1/2tipi) fpseudo stat = 14.4 Hz
0 0
0 100 200 300 400 500 600
Maximum vertical strain zz, microns
Pavement temperature = 70 F4‐inch HMA layer40 mph
0.0
0.5
1.0
1.5
2.0
2.5
3.0
3.5
4.0
4.5
Dep
th, i
n
3D-Move Viscoelastic fpseudo dyn = 14.4 HzMEPDG (fi=1/ti) Modified MEPDG (fi=1/2ti)Ferry (fi=1/2tipi) fpseudo dyn = 14.4 Hz
Pavement temperature = 70ºFVehicle speed = 40 mph
15
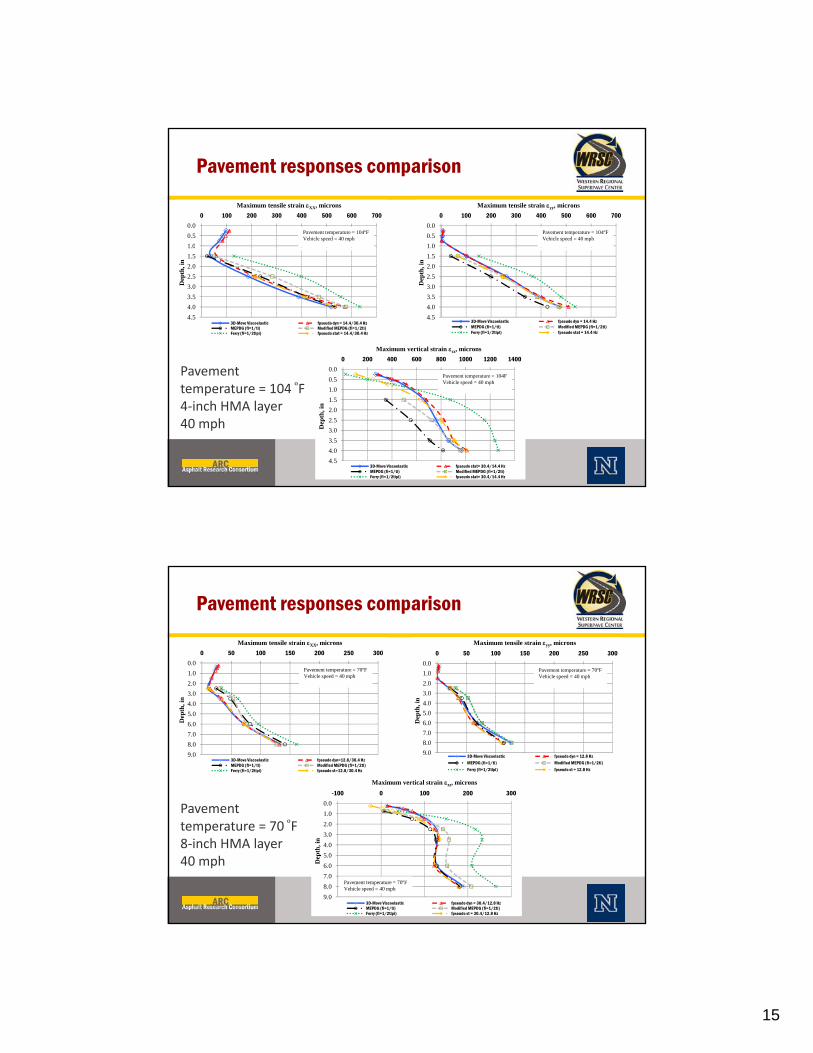
Pavement responses comparison
0.0
0.5
1.0
0 100 200 300 400 500 600 700
Maximum tensile strain XX, microns
Pavement temperature = 104ºFVehicle speed = 40 mph
0.0
0.5
1.0
0 100 200 300 400 500 600 700
Maximum tensile strain yy, microns
Pavement temperature = 104ºFVehicle speed = 40 mph
P t
1.0
1.5
2.0
2.5
3.0
3.5
4.0
4.5
Dep
th, i
n
3D-Move Viscoelastic fpseudo dyn = 14.4/30.4 HzMEPDG (fi=1/ti) Modified MEPDG (fi=1/2ti)Ferry (fi=1/2tipi) fpseudo stat = 14.4/30.4 Hz
1.0
1.5
2.0
2.5
3.0
3.5
4.0
4.5
Dep
th, i
n
3D-Move Viscoelastic fpseudo dyn = 14.4 HzMEPDG (fi=1/ti) Modified MEPDG (fi=1/2ti)Ferry (fi=1/2tipi) fpseudo stat = 14.4 Hz
0 0
0 200 400 600 800 1000 1200 1400
Maximum vertical strain zz, microns
Pavement temperature = 104 F4‐inch HMA layer40 mph
0.0
0.5
1.0
1.5
2.0
2.5
3.0
3.5
4.0
4.5
Dep
th, i
n
3D-Move Viscoelastic fpseudo stat= 30.4/14.4 HzMEPDG (fi=1/ti) Modified MEPDG (fi=1/2ti)Ferry (fi=1/2tipi) fpseudo stat= 30.4/14.4 Hz
Pavement temperature = 104FVehicle speed = 40 mph
Pavement responses comparison
0.0
1.0
2.0
0 50 100 150 200 250 300
Maximum tensile strain XX, microns
Pavement temperature = 70ºFVehicle speed = 40 mph
0.0
1.0
2.0
0 50 100 150 200 250 300
Maximum tensile strain yy, microns
Pavement temperature = 70ºFVehicle speed = 40 mph
2.0
3.0
4.0
5.0
6.0
7.0
8.0
9.0
Dep
th, i
n
3D-Move Viscoelastic fpseudo dyn=12.8/30.4 HzMEPDG (fi=1/ti) Modified MEPDG (fi=1/2ti)Ferry (fi=1/2tipi) fpseudo st=12.8/30.4 Hz
2.0
3.0
4.0
5.0
6.0
7.0
8.0
9.0
Dep
th, i
n
3D-Move Viscoelastic fpseudo dyn = 12.8 Hz
MEPDG (fi=1/ti) Modified MEPDG (fi=1/2ti)
Ferry (fi=1/2tipi) fpseudo st = 12.8 Hz
0 0
-100 0 100 200 300
Maximum vertical strain zz, microns
P t0.0
1.0
2.0
3.0
4.0
5.0
6.0
7.0
8.0
9.0
Dep
th, i
n
3D-Move Viscoelastic fpseudo dyn = 30.4/12.8 HzMEPDG (fi=1/ti) Modified MEPDG (fi=1/2ti)Ferry (fi=1/2tipi) fpseudo st = 30.4/12.8 Hz
Pavement temperature = 70ºFVehicle speed = 40 mph
Pavement temperature = 70 F8‐inch HMA layer40 mph
16
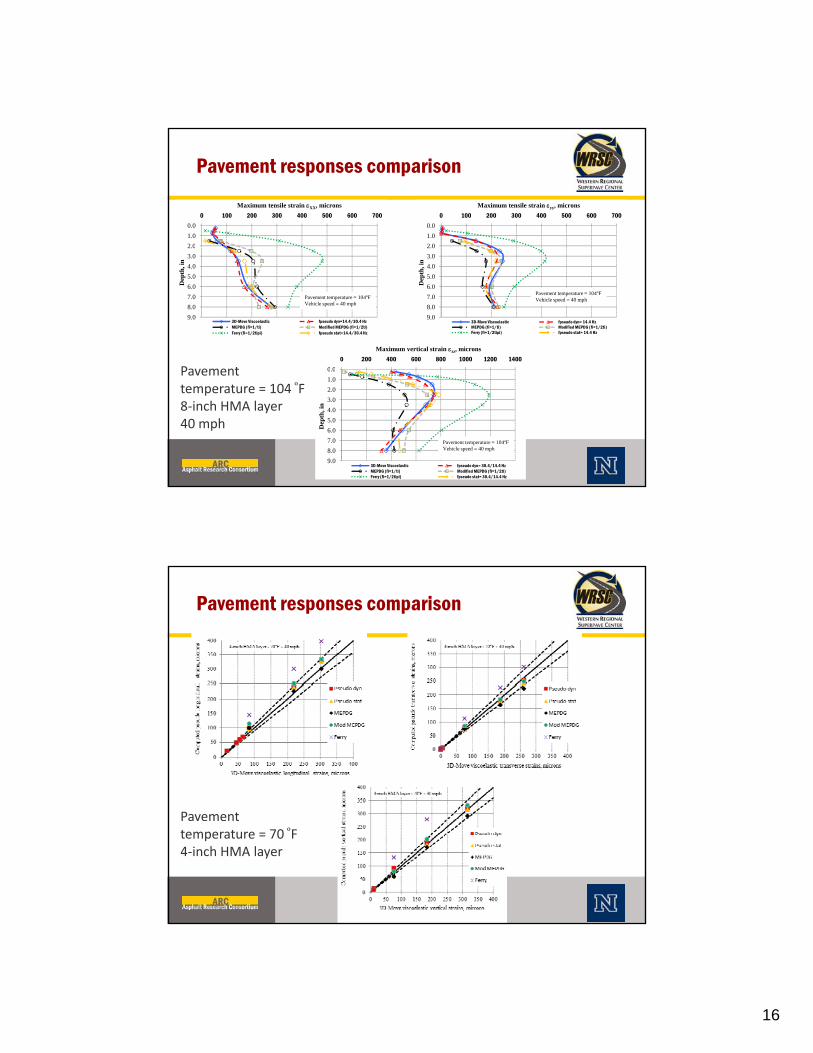
Pavement responses comparison
0.0
1.0
2.0
0 100 200 300 400 500 600 700
Maximum tensile strain XX, microns
0.0
1.0
2.0
0 100 200 300 400 500 600 700
Maximum tensile strain yy, microns
P t
2.0
3.0
4.0
5.0
6.0
7.0
8.0
9.0
Dep
th, i
n
3D-Move Viscoelastic fpseudo dyn=14.4/30.4 HzMEPDG (fi=1/ti) Modified MEPDG (fi=1/2ti)Ferry (fi=1/2tipi) fpseudo stat=14.4/30.4 Hz
Pavement temperature = 104ºFVehicle speed = 40 mph
2.0
3.0
4.0
5.0
6.0
7.0
8.0
9.0
Dep
th, i
n
3D-Move Viscoelastic fpseudo dyn= 14.4 HzMEPDG (fi=1/ti) Modified MEPDG (fi=1/2ti)Ferry (fi=1/2tipi) fpseudo stat= 14.4 Hz
Pavement temperature = 104ºFVehicle speed = 40 mph
0 0
0 200 400 600 800 1000 1200 1400
Maximum vertical strain zz, microns
Pavement temperature = 104 F8‐inch HMA layer40 mph
0.0
1.0
2.0
3.0
4.0
5.0
6.0
7.0
8.0
9.0
Dep
th, i
n
3D-Move Viscoelastic fpseudo dyn= 30.4/14.4 HzMEPDG (fi=1/ti) Modified MEPDG (fi=1/2ti)Ferry (fi=1/2tipi) fpseudo stat= 30.4/14.4 Hz
Pavement temperature = 104ºFVehicle speed = 40 mph
Pavement responses comparison
Pavement temperature = 70 F4‐inch HMA layer
17
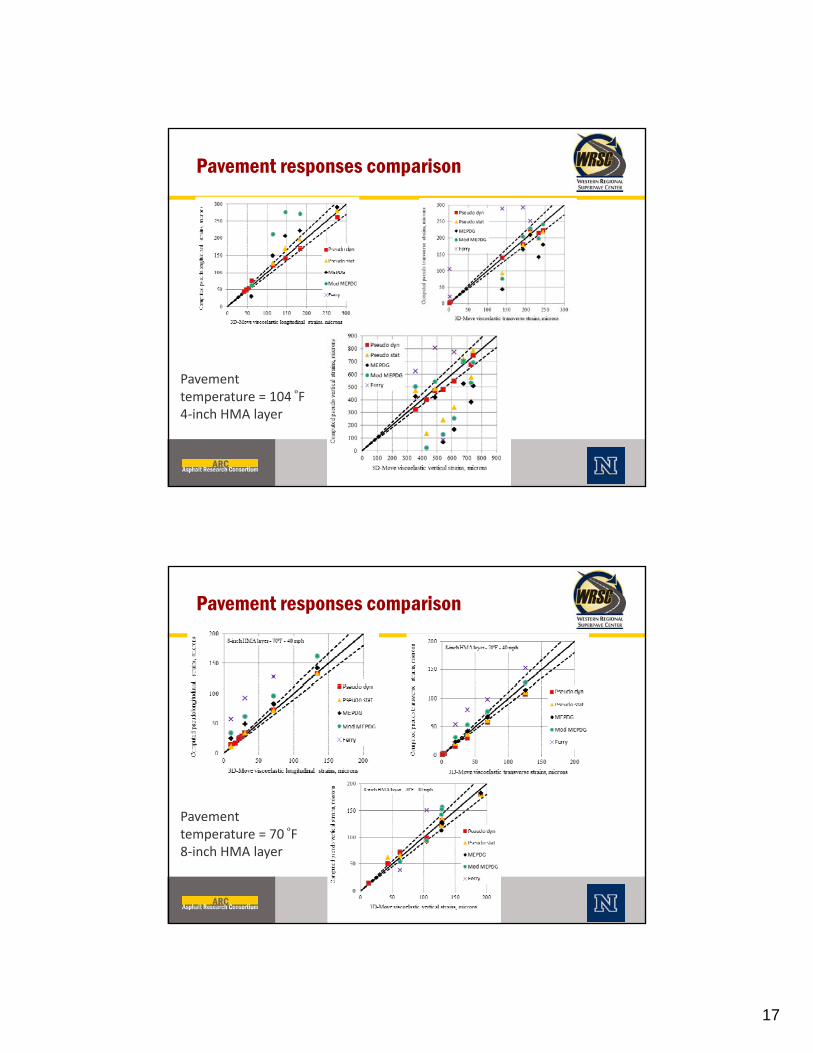
Pavement responses comparison
Pavement temperature = 104 F4‐inch HMA layer
Pavement responses comparison
Pavement temperature = 70 F8‐inch HMA layer
18
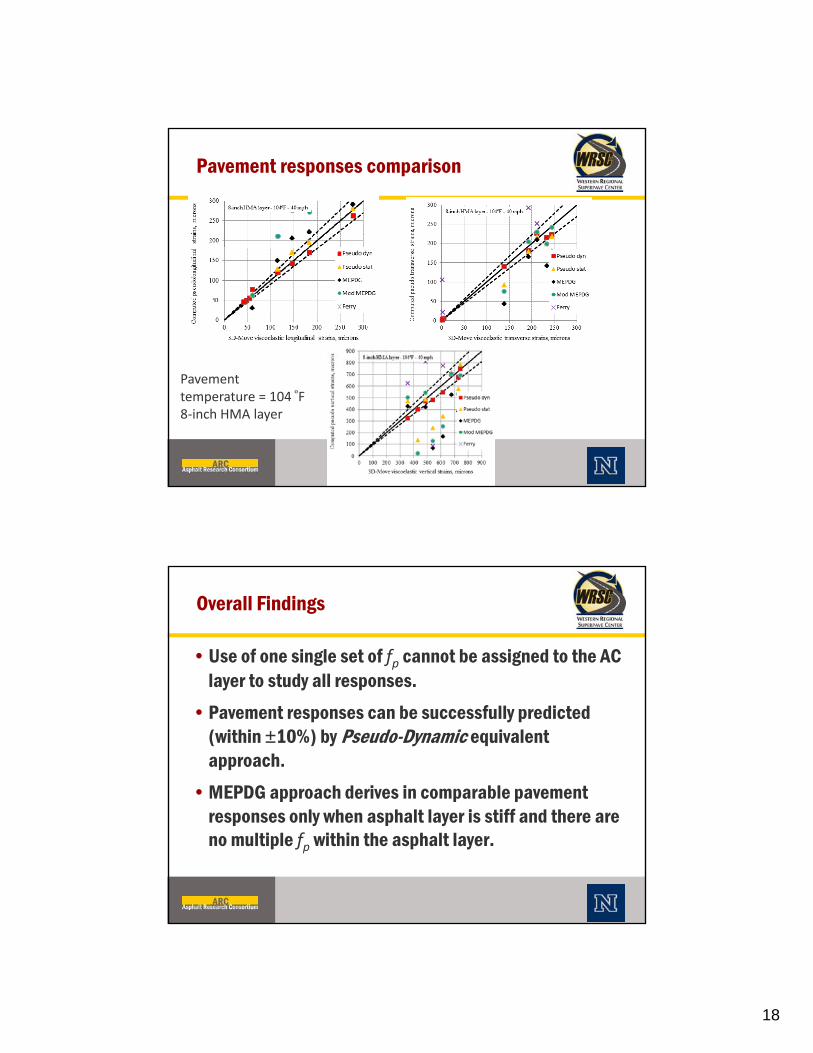
Pavement responses comparison
Pavement temperature = 104 F8‐inch HMA layer
Overall Findings
• Use of one single set of fp cannot be assigned to the AC layer to study all responses. layer to study all responses.
• Pavement responses can be successfully predicted (within ±10%) by Pseudo-Dynamic equivalent approach.
• MEPDG approach derives in comparable pavement responses only when asphalt layer is stiff and there are no multiple fp within the asphalt layer.
19
Additional needed work…
• Investigate influence of axle load, response location and axle configuration on faxle configuration on fp.
• Investigate influence of CTB on fp.
• Evaluate different time-frequency conversions.
• Other!
…Feedback…
Acknowledgment
– This work is part of the overall effort in the Asphalt Research Consortium (ARC) work element E2d Research Consortium (ARC) work element E2d. (www.arc.unr.edu)
– FHWA support gratefully acknowledged.
f f– Contents reflect the views of the authors and do not necessarily reflect the official views & policies of FHWA.