equity research€¦ · we have reviewed our valuation and we maintain our hold recommendation on...
TRANSCRIPT

EQUITY RESEARCH 9th August 2019
Calamatta Cuschieri Research | Malta International Airport plc 1
Malta International Airport p.l.c.
Stock Rating Price target (1Yr)
Hold €7.18
Executive Summary: “We have reviewed our valuation and we maintain our Hold recommendation on Malta International Airport plc, with an updated 12-month price target of €7.18 from our previous target of €6.40. Following the recent news of Ryanair’s founding of Malta Air and the subsequent anticipated investment by Ryanair to increase its Malta based aircraft fleet to 10 aircraft from its current 6 aircraft, we increased the terminal growth to 3% from the previously implemented growth rate of 2.5%. The masterplan could potentially increase MIA’s profitability however, given that a major part of this investment is anticipated to be completed in 2025, we have opted to value this investment separately. Consequently, we are of the opinion that the current price captures the foreseeable future growth. Despite the downside to our price target, we are maintaining our Hold recommendation as our model does not fully capture the potential growth that could be brought about by Ryanair’s substantial investment given that currently such growth cannot be reasonably measured. Nevertheless, we remain cautious that the UK represents the largest tourism market for Malta and the ever-increasing doubt of a hard Brexit, which if should it occur will negatively affect MIA’s passenger movements and ultimately its revenue. Therefore, we believe that investors should be opportunistic in adding positions in the stock.” Company Overview: Malta International Airport plc (“MIA” or “the Company”) principal activities are the development, operation and management of Malta International Airport. MIA has a 65-year concession to operate Malta’s airport, which commenced on July 2002. MIA has three 100% owned subsidiaries: Airport Parking Limited, Sky Parks Development Limited and Sky Parks Business Centre Limited. Airport Parking Limited operates all the car parks situated on the land leased to MIA. Moreover, the Company is involved in the management and development of real estate for commercial use on the land adjacent to the airport terminal, which is run by Sky Parks Development Limited and Sky Parks Business Centre Limited. The airport welcomed over 6.8 million passengers in 2018 and handled 17,684 tonnes of cargo. Since opening in 1992, the air terminal has received continuous investment in infrastructure, equipment, personnel, and services. Malta’s airport features two runways, can land any class of commercial aircraft, and offer more than 1,500 car parking spaces. Company Update: Last June a new airline, owned and operated by Ryanair, was officially launched. Malta Air will take over the operations of Ryanair and will base 6 of its aircrafts in Malta, coupled with 200 Malta based crew members. The airline is expected to commence operations by
Country Industry Ticker
Malta Air Transport / Real Estate MIA
Price (as at 08/08/2019) Price Target (1 Year) Upside / (downside) to PT Market Cap Shares Outstanding Free Float Net Dividend Yield Current P/E * Forward P/E ** * Based on the last twelve months (LTM) as of June 2019 ** CC estimates
€7.50 €7.18 -4.3% €1,014.8m 135.3m 29.9% 1.6% 32.4x 31.8x
1-Year Range: Price Movement & Volume Movement (20 day moving average)
Exchange MSE Lowest Price: €5.50 Highest Price: €7.95
Market Research
Simon Psaila Financial Analyst +356 25 688 141 [email protected]
Rowen Bonello Financial Analyst +356 25 688 141 [email protected]
Source: Bloomberg
4.00
5.00
6.00
7.00
8.00
9.00
-
10,000
20,000
30,000
40,000
Aug-18 Dec-18 Apr-19 Aug-19
€ S
har
e P
rice
Vo
lum
e
Volume Price

EQUITY RESEARCH 9th August 2019
Calamatta Cuschieri Research | Malta International Airport plc 2
Summer of 2020. It is anticipated that the fleet will increase to 10 aircrafts in three years’ time, with the creation of an additional 350 jobs. In the first 6-months of 2019, a new airline Qatar Airways started operating a new route between Malta and Doha, with the local airline (Air Malta) extending its latest German routes into the summer schedule. Additionally, Wizz Air and Volotea introduced new routes in addition to a second ship operating from Valletta as part of the fly-cruise program by TUI Cruises, which is a German cruise company, consequently resulting in an increase in charter traffic from Germany. Dividends – For the first 6-months ending June 2019, the Company is proposing a net dividend of €0.03 per share, which aggregated with the final net dividend paid for 2018 amounting to €0.09 per share results in a total net dividend of €0.12 per share for the LTM 2019, equal to the total net dividend distributed for financial year 2018.
SWOT Analysis
Strengths The airport segment, which accounts for 71% of
revenue, operates as a monopoly in one of the fastest growing economies in the European Union.
Management has a proven track record in terms of revenue and profitability growth.
The structural importance of the airport to Malta’s economy puts it in a unique position to have bargaining power with the government, suppliers and consumers alike.
Passenger numbers are currently in a growth phase, increasing in-line with management expectations.
Ryanair, Europe’s largest carrier, has a base in Malta and is looking to expand operations.
Management is committed to continue to develop the business and diversifying its revenue stream with an investment of circa €100 million.
Weaknesses
MIA operates in the air transport industry, which is a volatile industry.
In order to grow, MIA operates in a capital intensive industry, dampening the level of free cashflow available to shareholders.
Indirectly, MIA is impacted by the change in the price of oil, as oil prices directly affect the viability of the routes an airline operates.
Highly dependent on strategic decisions of airlines, especially Ryanair being the airline that carried the highest number of passengers in 2018.
Opportunities o The anticipated expansion in Malta Air’s aircraft
fleet by Ryanair will positively affect passenger growth.
o Passenger growth and demand for airport services remains strong and on an upward trajectory.
o The execution of the approved master plan has the potential to significantly increase and diversify the revenue streams of the Company.
o Low cost carriers introducing new routes. o The demand for top tier office space is currently
strong and is not expected to taper in the foreseeable future.
o The Maltese economy as a whole is projected to maintain its current sustainable growth in the coming years.
o Management can elect to part finance its capital expenditure through debt, thus benefitting from a lower cost of capital and be able to increase the return to its shareholders.
Threats ! Change in government policy on the expansion of
Air Malta’s operations. ! Downturn in the Real Estate industry. ! Political Changes:
Brexit – The UK is Malta’s biggest market in terms of passenger movements. Brexit could have a significant impact on passenger numbers if tariffs, charges etc. are imposed on persons travelling from/to the UK. Airlines are reportedly already more cautious in this respect.
! Reduction of the economic growth for the Euro Area by the European Union.
! The inherent limitation of land capacity in the Maltese Islands will have an implication on future passenger growth, with side effects such as overcrowded beaches, air and noise pollution, and traffic congestion already being experienced. As a result, the long-term growth is expected to be contained.

EQUITY RESEARCH 9th August 2019
Calamatta Cuschieri Research | Malta International Airport plc 3
Investment Stance
We have reviewed our valuation and we maintain our Hold recommendation on Malta International Airport plc,
with an updated 12-month price target of €7.18 from our previous target of €6.40. Following the recent news of
Ryanair’s founding of Malta Air and the subsequent anticipated investment by Ryanair to increase its Malta based
aircraft fleet to 10 aircraft from its current 6 aircraft, we increased the terminal growth to 3% from the previously
implemented growth rate of 2.5%. The masterplan could potentially increase MIA’s profitability however, given
that a major part of this investment is anticipated to be completed in 2025, we have opted to value this investment
separately. Consequently, we are of the opinion that the current price captures the foreseeable future growth.
Despite the downside to our price target, we are maintaining our Hold recommendation as our model does not
fully capture the potential growth that could be brought about by Ryanair’s substantial investment given that
currently such growth cannot be reasonably measured. Nevertheless, we remain cautious that the UK represents
the largest tourism market for Malta and the ever-increasing doubt of a hard Brexit, which if should it occur will
negatively affect MIA’s passenger movements and ultimately its revenue. Therefore, we believe that investors
should be opportunistic in adding positions in the stock.
Our assumptions and expectations in relation to the Masterplan (an investment of circa €100 million) is that (a)
the construction of the Multi-Storey Car Park (€20 million investment) will be finalised and operational by mid-
2020, (b) the Terminal Expansion (€40 million investment) and (c) Skyparks II (€40 million investment) are
estimated to be completed by year 2025, with revenues commencing from year 2026. The Masterplan is expected
to increase earnings considerably in the future given the continuous increase in passenger growth and the current
growth in demand for high quality office retail space. Despite this, given the length of time to completion of the
terminal expansion and Skyparks II, these fall outside of the forecasted period in our analysis and have been valued
separately at €18.7 million and €2.4 million, respectively.
In arriving at our price target, we took into consideration the change in business model experienced by MIA in the
last five years, where the 5-year long-term average P/E ratio currently stands at 27.4x. Currently MIA is trading at
32.4x earnings, therefore the Company is currently trading at a higher P/E ratio, which reflects the exceptional
growth in MIA’s operations and the expected future returns from the various planned projects. Based on our 2019
projections the forward P/E ratio is of 31.8x.
We are confident that MIA’s financial performance will be in-line with its earnings projections for 2019. The airport
has witnessed a double-digit growth in traffic in the last three years, in addition to an increase in the number of
operating airlines, with a constant seat load factor and a healthy growth in its other revenue streams. Albeit, we
do agree with management’s outlook for 2019 where it expects a decrease in the growth rate of passenger
movements, which was substantiated by the interim figures for 2019 that reported a 5.9% passenger growth.
Masterplan
The Masterplan is an investment program through which MIA will develop its terminal infrastructure, as well as
the surrounding airport campus. As described above, this program will see the Company investing at least €100
million and will involve the building of a Multi-Storey Car Park, construction of SkyParks II and the expansion of
the Airport’s Terminal. The Multi-Storey Car Park will cater for an additional 1,300 car parking spaces, with
construction works commenced in the last quarter of 2018.
SkyParks II, which will complement the existing SkyParks building, will house both office and commercial space,
in addition to a business hotel. The hotel is envisaged to have a footprint of 1,400 sqm and a rating of at least 4-
stars. The 100-room hotel will mainly attract business travellers and will enable them to maximise their time in
Malta. Currently the Company is evaluating designs submitted from prospective bidders for the design of SkyParks

EQUITY RESEARCH 9th August 2019
Calamatta Cuschieri Research | Malta International Airport plc 4
II. There is no clear indication of the completion of SkyParks II, but management is predicting that this will be
completed by 2025.
In earlier plans, the terminal was envisaged to have a lateral expansion followed by a vertical expansion onto the
main car park. Recently management indicated that they are currently reviewing these plans in order to arrive at
the most efficient and effective way of expanding the terminal. No indication is currently available of the
commencement of works for this expansion, however it was pointed out that this is critical for the airport to
accommodate the substantial passenger movements in the future, given the upward trajectory.
Valuation Our one-year price target is €7.18. The price target is calculated using a Free Cash Flow to Equity model with a cost of equity of 7.3% and a terminal growth rate of 3%. We have substantiated our target using the Price Earnings (P/E) Model with a P/E ratio of 30x. The cost of equity is based on the local equity risk premium and caters for the monopolistic position that MIA benefits from.
Key Assumptions - Masterplan
Multi-Storey Carpark - The carpark is earmarked for completion by mid-2020 and will offer an additional 1,300
parking spaces. Based on current car park revenue, the yearly revenue contribution of this carpark will be of
€2.2 million. In 2020, the valuation accounts for 50% of this revenue that is €1.1 million, which represents half-
year contribution. From 2021 onwards, the valuation accounts for the full year revenue of €2.2 million.
1 LTM 2019 is calculated by adding the interim results (H1) of 2019 to the audited results of financial year 2018, less the interim results of 2018. 2 Our forecasted figures do not take into account the implications brought about by the adoption of IFRS 16, where all leases will be capitalised as from 1st January 2019. Hence our projected EBITDA is not comparable to the LTM 2019. 3 In 2017, MIA incurred a one-off early repayment fee on its outstanding loans amounting to €2.78 million, in addition to a one-off charge to the lease payments reflecting the effect of a recalibration of prior years’ passenger movements amounting to €1.54 million.
FY 2017 FY 2018 LTM 20191 2019F2 2020P 2021P € € € € € €
Revenue 82,369,154 92,191,719 95,894,966 97,780,875 104,121,244 109,787,124 Staff Costs (8,045,386) (9,747,167) (10,316,511) (10,720,000) (11,288,928) (11,884,819) Other operating Expenses (25,750,264) (28,014,126) (28,113,917) (29,725,386) (31,652,858) (32,716,563)
EBITDA 48,573,504 54,430,426 57,464,538 57,335,489 61,179,457 65,185,742 Depreciation & Amortisation (7,410,628) (7,384,403) (8,102,986) (8,037,500) (8,573,523) (8,787,933)
EBIT 41,162,876 47,046,023 49,361,552 49,297,989 52,605,934 56,397,809 Deferred Income 208,765 208,765 208,765 208,765 208,765 208,765 Investment income 4,406 (7,021) 10,791 5,000 5,000 5,000 Finance Costs (3,808,536) (148,915) (1,008,122) - - -
Profit Before Tax 37,567,511 47,098,852 48,572,986 49,511,754 52,819,699 56,611,574 Income tax expense (13,417,031) (16,763,212) (17,288,446) (17,642,477) (18,821,194) (20,172,350)
Profit Available to Ordinary Equity holders
24,150,480 30,335,640 31,284,540 31,869,276 33,998,505 36,439,224
Earnings Per Share 0.178 0.224 0.231 0.236 0.251 0.269 Normalised Profit after tax 26,955,2303 30,335,640 31,284,540 31,869,276 33,998,505 36,439,224 Normalised Earnings Per Share 0.199 0.224 0.231 0.236 0.251 0.269
Ratio Analysis: FY 2017 FY 2018 LTM 2019 2019F 2020P 2021P Revenue Growth (YoY) 12.7% 11.9% 4.0% 2.0% 6.5% 5.4% EBITDA Margin 59.0% 59.0% 59.9% 58.6% 58.8% 59.4% Net Margin (Normalised Profit) 32.7% 32.9% 32.6% 32.6% 32.7% 33.2%
Source: Audited Financial Statements and CC Estimates
EQUITY RESEARCH 9th August 2019
Calamatta Cuschieri Research | Malta International Airport plc 5
Source: Audited Financial Statements and CC Estimates
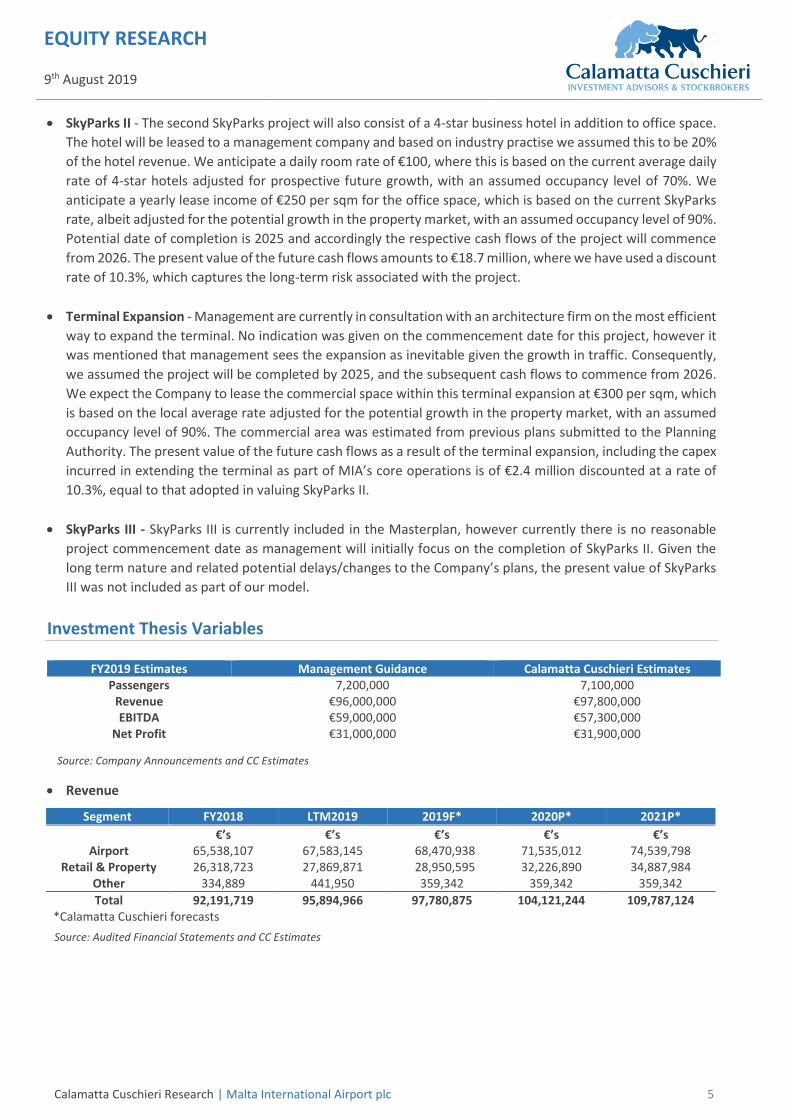
SkyParks II - The second SkyParks project will also consist of a 4-star business hotel in addition to office space.
The hotel will be leased to a management company and based on industry practise we assumed this to be 20%
of the hotel revenue. We anticipate a daily room rate of €100, where this is based on the current average daily
rate of 4-star hotels adjusted for prospective future growth, with an assumed occupancy level of 70%. We
anticipate a yearly lease income of €250 per sqm for the office space, which is based on the current SkyParks
rate, albeit adjusted for the potential growth in the property market, with an assumed occupancy level of 90%.
Potential date of completion is 2025 and accordingly the respective cash flows of the project will commence
from 2026. The present value of the future cash flows amounts to €18.7 million, where we have used a discount
rate of 10.3%, which captures the long-term risk associated with the project.
Terminal Expansion - Management are currently in consultation with an architecture firm on the most efficient
way to expand the terminal. No indication was given on the commencement date for this project, however it
was mentioned that management sees the expansion as inevitable given the growth in traffic. Consequently,
we assumed the project will be completed by 2025, and the subsequent cash flows to commence from 2026.
We expect the Company to lease the commercial space within this terminal expansion at €300 per sqm, which
is based on the local average rate adjusted for the potential growth in the property market, with an assumed
occupancy level of 90%. The commercial area was estimated from previous plans submitted to the Planning
Authority. The present value of the future cash flows as a result of the terminal expansion, including the capex
incurred in extending the terminal as part of MIA’s core operations is of €2.4 million discounted at a rate of
10.3%, equal to that adopted in valuing SkyParks II.
SkyParks III - SkyParks III is currently included in the Masterplan, however currently there is no reasonable
project commencement date as management will initially focus on the completion of SkyParks II. Given the
long term nature and related potential delays/changes to the Company’s plans, the present value of SkyParks
III was not included as part of our model.
Investment Thesis Variables
FY2019 Estimates Management Guidance Calamatta Cuschieri Estimates Passengers 7,200,000 7,100,000
Revenue €96,000,000 €97,800,000 EBITDA €59,000,000 €57,300,000
Net Profit €31,000,000 €31,900,000
Revenue
Segment FY2018 LTM2019 2019F* 2020P* 2021P*
€’s €’s €’s €’s €’s Airport 65,538,107 67,583,145 68,470,938 71,535,012 74,539,798
Retail & Property 26,318,723 27,869,871 28,950,595 32,226,890 34,887,984 Other 334,889 441,950 359,342 359,342 359,342
Total 92,191,719 95,894,966 97,780,875 104,121,244 109,787,124 *Calamatta Cuschieri forecasts
Source: Company Announcements and CC Estimates

EQUITY RESEARCH 9th August 2019
Calamatta Cuschieri Research | Malta International Airport plc 6
We expect revenue to increase to €97.8 million in 2019
from €92.2 million in 2018, representing an increase of
6.1%. This has been substantiated by the revenue
growth registered by MIA in the LTM 2019, where
revenue increased to €95.9 million, equating to an
increase of €3.7 million from the revenue of 2018. The
main revenue drivers are; the Airport segment and the
Retail & Property segment, which are expected to
increase by €0.9 million and €1.1 million, respectively
when compared to the LTM2019. For the 6-months
ending June 2019, traffic growth was of 5.9% and we
anticipate this to be marginally lower at 5.0% for the year ending 2019. Revenue per passenger as at June 2019
stood at €9.54 and we expect this to be at €9.58 for the year ending 2019, representing a decrease of 0.5%
when compared to the revenue per passenger of 2018, which stood at €9.63. This is a result of discounts on
fees given to airlines during the winter months. We are anticipating passenger growth to remain constant at
5.0% in 2020.
The Retail and Property segment grew by 13.2% in the interim financials of June 2019 and for the LTM stood
at €27.9 million. We anticipate that the contribution from this segment will increase to €29.0 million for the
year ending 2019, representing a total growth of 10% when compared to 2018, where the Retail and Property
segment stood at €26.3 million. The growth in commercial space mainly reflects the growth in MIA’s footfall
in addition to the growth currently being experienced in the property market.
EBITDA - Increased to €57.5 million (59.9% margin) in
the LTM 2019 from €54.4 million (59.0% margin) in
2018. It is pertinent to note that as a result of adopting
IFRS 16 as from 1 Jan 2019, the Company capitalised its
leases resulting in an expenses saving of €1.1 million.
Should this be adjusted for the EBITDA would have been
of €56.4 million with an EBITDA margin of 58.8%. Given
that, we are not adjusting our valuation for the
implications of IFRS 16 (since the net effect on net profit
is nil), our EBITDA for 2019 is of €57.3 million, with an
EBITDA margin of 58.6%.
For the interim results of June 2019 increase in expenses were mainly characterised by a significant increase
in staff costs, with other operating expenses experiencing a marginal increase when compared to same period
of 2018. In H1 2019, staff costs increased by 12.9% mainly as result of an increase in the workforce, with the
current average employees standing at 380 employees, an increase of 40 employees when compared to 2018.
In addition to the increase in workforce, wages are expected to increase by 3.5% annually during the period
2018 to 2020, following the signing of a collective agreement. Other operating expenses naturally increased
given the growth in the airport’s passenger movements. We anticipate that in 2019 staff costs and other
operating expenses will be €10.7 million and €29.7 million, respectively.
Source: Financial Statements / CC Estimates
Source: Financial Statements / CC Estimates
73.1 82.4
92.2 95.9
9.1%
12.7%
11.9%
4.0%
0.0%
5.0%
10.0%
15.0%
0.0
20.0
40.0
60.0
80.0
100.0
120.0
FY 2016 FY 2017 FY 2018 LTM 2019
€ 'm
illio
n
Revenue Growth
40.0
48.6 54.4 57.5
54.7%
59.0%59.0% 59.9%
52%
54%
56%
58%
60%
62%
0.0
20.0
40.0
60.0
80.0
FY 2016 FY 2017 FY 2018 LTM 2019
€ 'm
illio
n
EBITDA EBITDA Margin

EQUITY RESEARCH 9th August 2019
Calamatta Cuschieri Research | Malta International Airport plc 7
Depreciation - Increased to €8.1 million in LTM 2019, representing an increase of €0.7 million when compared
to 2018, where it stood at €7.4 million. This is mainly as a result of the implications of IFRS 16, which resulted
in an additional charge of €0.5 million. Should this be adjusted for, the depreciation charge for LTM 2019 would
have been of €7.6 million rather than €8.1 million. Given that our valuations does not take into account the
implications of the leases capitalisation, we are forecasting a depreciation charge of €8.0 million for the year
ending 2019. Thus reflecting the core increase in depreciation as a result of the additional capital expenditure
program currently being undertaken by MIA.
Finance Costs - In the first quarter of 2018, MIA repaid all its outstanding debt amounting to €33.0m and
incurred interest expense of €0.1 million. The LTM results of June 2019 shows a finance cost of €1.0 million,
which represents the interest cost that is being incurred as a result of MIA’s leases capitalisation, as required
by IFRS 16. Should this be adjusted for, MIA currently has no financial debt employed for financing its activities
and we estimate this to hold in the foreseeable future. This is in view of the Company’s plan to finance capital
expenditure through accumulated retained earnings. Albeit, management did mention that it might opt for
debt to fund the construction of SkyParks II.
Net Profit and Earnings per Share (EPS) - We are
forecasting net profit to increase to €31.9 million in
2019 compared to €31.3 million in LTM 2019. This
translates to an EPS of €0.236 compared to an EPS
€0.231 in LTM2019, that is a growth of 1.9%. Return
on Common Equity has continuously increased during
the period 2016 to 2018. Albeit, the ROE for the
LTM2019 decreased to 27.6% from 29.1% as
registered for 2018. This substantiates our view that
MIA is reaching its mature stage of its life cycle and
moving forward profits should stabilise and accordingly so will the return to the shareholders.
Dividends - After considering the capital expenditure requirements of both a recurring nature as well as the
implementation of the master plan, we estimate that MIA should be in a strong position to continue to
distribute around 54% of its net profit in the foreseeable future. This is in-line with the payout ratio of the last
two years, were in 2018 the payout ratio stood at 53.5% and in 2017 the payout ratio stood at 56.0%. For the
LTM 2019 the dividend payout ratio stood at 51.9%. MIA’s has a conservative approach towards financing its
growth. Management prefer to retain excess liquidity to be able to finance its capital projects, which
substantiates the 54% payout ratio.
Source: Financial Statements / CC Estimates
25.8%
26.7%
29.1%
27.6%
24.0%
26.0%
28.0%
30.0%
FY 2016 FY 2017 FY 2018 LTM 2019
Return on Common Equity (ROE)

EQUITY RESEARCH 9th August 2019
Calamatta Cuschieri Research | Malta International Airport plc 8
Key Financial Indicators
€'Millions unless otherwise indicated Dec-16 Dec-17 Dec-18 LTM 2019
Income Statement
Revenue 73.06 82.37 92.19 95.89
Growth in Revenue (YoY) 9.11% 12.73% 11.93% 4.02%
EBITDA 39.99 48.57 54.43 57.46
EBITDA Margin (EBITDA / Revenue) 54.73% 58.97% 59.04% 59.92%
Operating Income (EBIT) 33.15 41.16 47.05 49.36
Operating (EBIT) Margin (EBIT / Revenue) 45.36% 49.97% 51.03% 51.47%
Net Income 20.98 24.15 30.34 31.28
Net Margin (Net Income / Revenue) 28.72% 29.32% 32.90% 32.62%
Earnings per Share (EPS) 0.16 0.18 0.22 0.23
Growth in EPS (YoY) 8.88% 15.10% 25.61% 3.13%
Dividend per Share (Net Dividends / Shares Outstanding) 0.10 0.10 0.12 0.12
Growth in Dividends (YoY) -9.09% 0.00% 20.00% 0.00%
Sustainable Growth Rate in Dividends 9.16% 11.75% 13.53% 13.26%
Dividends Yield (Dividend per Share / Share Price ) Year-end 2.47% 2.13% 2.07% 1.60%
Balance Sheet
Cash and Cash Equivalents 36.55 38.40 20.25 20.84
Current Assets 52.27 54.68 41.14 48.67
Non-Current Assets 120.10 128.17 128.67 176.84
Total Assets 172.36 182.85 169.81 225.51
Current Liabilities 33.14 45.95 47.92 50.06
Non-Current Liabilities 54.12 41.15 9.28 61.05
Total Debt 46.35 33.02 - 51.99
Total Equity 85.10 95.75 112.61 114.40
Net Debt 9.80 (5.39) (20.25) 31.15
Shares Outstanding 135.30 135.30 135.30 135.30
Cash flow
Cash Flow from Operating Activities (CFO) 27.30 42.70 36.83 45.68
Capex (7.16) (14.02) (8.45) (12.11)
Free Cash Flow (FCF) 20.14 28.69 28.38 33.57
Cash Flow from Investing Activities (6.11) (13.99) (8.43) (17.08)
Cash Flow from Financing Activities (24.28) (26.86) (46.55) (16.62)
Ratios
Profitability
Return on Common Equity (Net Income / Common Equity) 25.78% 26.71% 29.12% 27.56%
Return on Assets (Net Income / Total Assets) 12.17% 13.21% 17.86% 13.87%
Solvency
Gearing Ratio Level 1 (Net Debt / Total Equity) 11.51% -5.62% -17.99% 27.23%
Gearing Ratio Level 2 (Total Liabilities / Total Assets) 50.63% 47.64% 33.68% 49.27%
Net Debt / EBITDA 0.25x (0.11)x (0.37)x 0.54x
Current Ratio (Current Assets / Current Liabilities) 1.58x 1.19x 0.86x 0.97x
Quick Ratio (Acid Test Ratio) 1.55x 1.17x 0.84x 0.96x
Interest Coverage Ratio (EBITDA) 41.35x 12.77x 365.51x 55.27x
Cash from Operations / EBIT 0.82x 1.04x 0.78x 0.93x
Source: Audited Financial Statements and Interim Results

EQUITY RESEARCH 9th August 2019
Calamatta Cuschieri Research | Malta International Airport plc 9
Historical 1-Year Price Target
Reference Date Price Price Target Analyst Recommendation
MIA 22.04.2016 €4.33 €4.11 Simon Psaila Hold
MIA 17.03.2017 €4.125 €4.49 Simon Psaila Buy
MIA 04.09.2017 €4.20 €4.50 Simon Psaila Buy
MIA 09.11.2018 €6.25 €6.05 Simon Psaila and Rowen Bonello
Hold
MIA 12.03.2019 €6.60 €6.40 Simon Psaila and Rowen Bonello
Hold
MIA 09.08.2019 €7.50 €7.18 Simon Psaila and Rowen Bonello
Hold
1.50
2.50
3.50
4.50
5.50
6.50
7.50
8.50
Jul 14 Feb 15 Sep 15 Apr 16 Nov 16 Jun 17 Jan 18 Aug 18 Mar 19
Pri
ce €
MIA Maltex Rebased
Source: Bloomberg

EQUITY RESEARCH 9th August 2019
Calamatta Cuschieri Research | Malta International Airport plc 10
Glossary and Definitions
Income Statement
Revenue Total revenue generated by the Group/Company from its principal business activities during the financial year.
EBITDA EBITDA is an abbreviation for earnings before interest, tax, depreciation and amortisation. It reflects the Group’s/Company’s earnings purely from operations.
Operating Profit (EBIT) EBIT is an abbreviation for earnings before interest and tax.
Depreciation and Amortisation
An accounting charge to compensate for the decrease in the monetary value of an asset over time and the eventual cost to replace the asset once fully depreciated.
Net Finance Costs The interest accrued on debt obligations less any interest earned on cash bank balances and from intra-group companies on any loan advances.
Net Income The profit made by the Group/Company during the financial year net of any income taxes incurred.
Profitability Ratios
Growth in Revenue (YoY) This represents the growth in revenue when compared with previous financial year.
EBITDA Margin EBITDA as a percentage of total revenue.
Operating (EBIT) Margin Operating margin is the EBIT as a percentage of total revenue.
Net Margin Net income expressed as a percentage of total revenue.
Return on Common Equity
Return on common equity (ROE) measures the rate of return on the shareholders’ equity of the owners of issued share capital, computed by dividing the net income by the average common equity (average equity of two years financial performance).
Return on Assets Return on assets (ROA) is computed by dividing net income by total assets.
Earnings per Share (EPS) Earnings per share (EPS) is the amount of earnings per outstanding share of a Group’s/Company’s share capital. It is computed by dividing net income by total shares outstanding as at statement of financial position date.
Growth in EPS (YoY) This represents the growth in Earnings per Share (EPS) when compared with previous financial year.
Dividends Ratios
Net Dividends Net dividends represent the net amount of dividends in respect of a Group’s/Company’s fiscal year.
Dividend per Share Dividend per Share is the amount of dividends per outstanding share of a Group’s/Company’s share capital. It is computed by dividing net dividends by total shares outstanding as at statement of financial position date.
Growth in Dividends (YoY)
This represents the growth in dividends when compared with previous financial year.
Sustainable Growth Rate in Dividends
This ratio indicates the sustainable growth rate of dividends given the profitability of the Group/Company and the respective level of dividends distribution.
Dividends Yield as at year-end
This ratio indicates how much a Group/Company pays out in dividends each fiscal year relative to its share price. It is computed by the dividing the Dividend per Share by the share price as at year-end.
Cash Flow Statement
Cash Flow from Operating Activities (CFO)
Cash generated from the principal revenue producing activities of the Group/Company.

EQUITY RESEARCH 9th August 2019
Calamatta Cuschieri Research | Malta International Airport plc 11
Cash Flow from Investing Activities
Cash generated from the activities dealing with the acquisition and disposal of long-term assets and other investments of the Group/Company.
Cash Flow from Financing Activities
Cash generated from the activities that result in change in share capital and borrowings of the Group/Company.
Capex Represents the capital expenditure incurred by the Group/Company in a financial year.
Free Cash Flows (FCF) The amount of cash the Group/Company has after it has met its financial obligations. It is calculated by taking Cash Flow from Operating Activities less the Capex of the same financial year.
Balance Sheet
Total Assets What the Group/Company owns which can de further classified into Non-Current Assets and Current Assets.
Non-Current Assets Assets, full value of which will not be realised within the forthcoming accounting year
Current Assets Assets which are realisable within one year from the statement of financial position date.
Inventory Inventory is the term for the goods available for sale and raw materials used to produce goods available for sale.
Cash and Cash Equivalents
Cash and cash equivalents are Group/Company assets that are either cash or can be converted into cash immediately.
Total Equity Total Equity is calculated as total assets less liabilities, representing the capital owned by the shareholders, retained earnings, and any reserves.
Total Liabilities What the Group/Company owes which can de further classified into Non-Current Liabilities and Current Liabilities.
Non-Current Liabilities Obligations which are due after more than one financial year.
Total Debt All debt obligations inclusive of long and short-term debt.
Net Debt Total debt of a Group/Company less any cash and cash equivalents.
Current Liabilities Obligations which are due within one financial year.
Shares Outstanding Outstanding shares refer to the Group/Company stock currently held by all its shareholders.
Financial Strength Ratios
Current Ratio The Current ratio (also known as the Liquidity Ratio) is a financial ratio that measures whether or not a company has enough resources to pay its debts over the next 12 months. It compares current assets to current liabilities.
Quick Ratio (Acid Test Ratio)
The quick ratio measures a Group’s/Company’s ability to meet its short-term obligations with its most liquid assets. It compares current assets (less inventory) to current liabilities.
Interest Coverage Ratio
The interest coverage ratio is calculated by dividing EBITDA of one period by cash interest paid of the same period.
Gearing Ratio Gearing Ratio Level 1 Gearing Ratio Level 2
The gearing ratio indicates the relative proportion of shareholders’ equity and debt used to finance total assets. Is calculated by dividing Net Debt by Total Equity. Is calculated by dividing Total Liabilities by Total Assets.
Net Debt / EBITDA The Net Debt / EBITDA ratio measures the ability of the Group/Company to refinance its debt by looking at the EBITDA.
Cash from Operations / EBIT
This ratio measures the ability of the Group/Company to convert its earnings into cash.

EQUITY RESEARCH 9th August 2019
Calamatta Cuschieri Research | Malta International Airport plc 12
Explanation of Equity Research Ratings
Buy: Based on a current 12- month view of total shareholder return (TSR = percentage change in share price from current price to projected target price plus projected dividend yield), we recommend that investors buy the stock. Sell: Based on a current 12-month view of total shareholder return, we recommend that investors sell the stock. Hold: We take a neutral view on the stock 12-months out and, based on this time horizon, we do not recommend either a Buy or Sell. Current shareholders should consider buying on dips and selling on peaks. Newly issued research recommendations and target prices supersede previously published research.
Disclaimer
This document is being issued by Calamatta Cuschieri Investment Services Ltd (“CC”) of Ewropa Business Centre, Triq Dun
Karm, Birkirkara, BKR9034, Malta and bearing company registration number C13729. CC is licensed to conduct Investment
Services in Malta by the Malta Financial Services Authority. This information is being provided solely for information purposes
and should not be deemed or construed as investment advice, advice concerning particular investments, advice concerning
investment decisions, tax, legal or any other ancillary regulatory advice. Similarly, any views or opinions expressed are not
intended and should not be construed as investment, tax and/or legal recommendations or advice. CC has not verified and
consequently neither warrants the accuracy nor the veracity of any information, views or opinions appearing on this
document. CC does not accept liability for actions, proceedings, costs, demands, expenses, damages and losses suffered by
persons as a result of information, views or opinions appearing on this document. No person should act upon any opinion
and/or information in this document without first obtaining professional advice.