equity pricing and stock market anomalies · · 2013-06-05"equity pricing and stock market...
TRANSCRIPT

"EQUITY PRICING AND STOCK MARKET ANOMALIES"
by Rolf BANZ*
Gabriel HAWAWINI*
N° 87 / 07
* Rolf BANZ and Gabriel HAWAWINI, INSEAD, Fontainebleau, France
Director of Publication :
Charles WYPLOSZ, Associate Dean for Research and Development
Printed at INSEAD, Fontainebleau, France

EQUITY PRICING AND STOCK MARKET ANOMALIES
Rolf BANZ*
* Gabriel HAVAVINI
INSEAD, Fontainebleau, France
February 1987
* The authors would like to thank Ms. Marie-Cécile Dalaine and
Ms. Gillian Hay for typing the manuscript.

Abstract
According to the Capital Asset Pricing Model (CAPM), an asset's
expected return in excess of the risk-free rate is proportional to that
asset's market risk. In this paper we review the concept of risk in the
context of the CAPM and show that the early evidence was generally
consistent with this model. We then re-examine the model's validity in
light of the so-called "size effect", i.e., the tendency of small-firm
portfolios to outperform large-firm portfolios. We conclude with some
practical implications of the size effect for corporate treasurers and
portfolio managers.

EQUITY PRICING AND STOCK MARKET ANOMALIES
1. Financial theory and anomalous empirical regularities
You are asked to determine which of two portfolios of securities
has the higher expected return. You do not know the composition of the
two portfolios and you are allowed to ask a single question. Which
question should you ask ?
If you believe in certain fundamental principles of modern finance,
you should ask which of the two portfolios has the higher risk since
modern finance suggests that there is a positive relation between risk
and return. If you buy the high-risk, high-expected-return portfolio
and hold it over a sufficiently long period of time (say a few years)
that portfolio should earn a higher actual return than the low-risk,
low-expected-return portfolio1 .
Unfortunately, reality is not that simple. We need to be more
specific about what we mean by "risk". What is the risk of a portfolio
and how is it measured ? What is the relation between a portfolio's
expected return and its risk ? In the following sections we review the
concept of risk in the context of the Capital Asset Pricing Model
(CAPM). This model, developed in the early sixties (Sharpe (1964),
Lintner (1965)), provides a simple theoretical relationship between the
expected return and the risk of a financial asset. But the purpose of
this article is not to review the modern theory of finance. Our
objective is to examine the validity of the CAPM in light of several
recent empirical findings which appear to be at odds with some of the
fundamental principles of finance. Indeed, since the early eighties, a
growing number of empirical studies based on U.S., European and Japanese
stock market data have reported several anomalous empirical regularities
also known as "stock market anomalies" (Hawawini (1984), Keim (1986)).
These recurrent empirical phenomena are not consistent with asset
pricing according to the CAPM.
For example, recall the question which we asked in the opening
paragraph: which of two portfolios has the higher expected return and

-2-
hence the higher probability of achieving the higher average return in
the near future ? According to modern finance, it is the portfolio with
the higher risk. But a substantial body of empiricai evidence suggests
that the portfolio containing the securities of firms with the smaller
market capitalization (number of shares outstanding multiplied by the
share price) should, on average, outperform the portfolio with the
larger market capitalization. In other words, firm size may be a
stronger indicator of expected return than risk. Of course, firm size
may be interrelated with risk and we would intuitively expect small
firms to be "riskier" than large firms. Nevertheless the evidence shows
that small firms outperform, on average, large firms even if one adjusts
returns for differences in risk. In other words, portfolios of small
firms will, on average, outperform portfolios of large firms even after
controlling for differences in risk between the two portfolios. This
so-called size effect, and other stock market anomalies, will be
examined in more detail in this article. But first, we briefly review
what risk is, how it is measured and how it is related to expected
return according to the CAPM.
2. Vat is risk ?
Securities are risky because their price fluctuations are
unpredictable. And the wider the range of a security's price
fluctuations, the higher its risk. To measure the risk of a security we
need to know the range of the possible outcomes and the likelihood of
their occurence, i.e., the probability distribution of its returns.
Consider the following simple example. A security currently priced at
100 will be worth, a month from now, either 105 or 115 with an equal
probability. In other words, its monthly return will be either 5
percent or 15 percent with each outcome equally likely. From the
knowledge of this distribution of returns we can deduce two important
characteristics of that security. Its expected return is 10 percent 2
and the standard deviation of its return is 5 percent. The latter is a
measure of the dispersion of returns around the mean value of 10
percent3. If the distribution of returns is approximately symmetrical,
the standard deviation of returns or its square, the variance, is a good
measure of the extent to which the price of a security fluctuates and
hence a good measure of the total risk of a security.

- 3 - One of the main building blocks of the CAPM is the principle of
risk decomposition. The total risk of a security can be broken down
into two independent components: a market-related component and a firm-
specific component. The former is a measure of the extent to which the
price of a security fluctuates in response to the general market
movements. The latter is a measure of the extent to which the price of
a security fluctuates in response to information unique to the firm
which issued the security. We can write:
TOTAL RISK = [MARKET RISK] + [FIRM-SPECIFIC RISK]
where the variance is the measure of the total risk of a security. In
our numerical example we have a variance of returns equal to .25
percent, the square of 5 percent.
It can be shown that the market risk of a security is proportional
to the variance of the market as a whole:
[MARKET RISK OF] (0i)
2 [VARIANCE OF] S ECURITY i THE MARKET
where the proportionality factor Bi is called the beta coefficient of
security i or its systematic risk. It is a measure of the sensitivity
of security i's return to the returns of the market. A security with a
beta coefficient equal to one has as much market risk as the market as a
whole. But a security with a beta coefficient greater than one has more
market risk than the market as a whole. And a security with a beta
coefficient smaller than one has less market risk than the market as a
whole. In other words, high-beta stocks have higher market risk than
low-beta stocks.4
To return to our example, suppose that the monthly
variance of the market is .10 percent and that security i has a beta
coefficient of .80. Its market risk is (.80)(.10 percent) . .08
percent. And since its total risk is .25 percent it follows that
security i has a firm-specific or residual risk of .17 percent. Note
that 32 percent (.08 percent divided by .25 percent) of the total risk
of security i is generated by the market movement (market risk) and the
remaining 68 percent of its total risk is generated by information
unique to firm i (firm-specific risk).5

- 4 -
3. The CAPM: A link betveen expected return and market risk
Modern financial theory builds on two basic facts. First
individuals dislike risk, i.e., they are risk-averse. Second, security
prices do not move in perfect unison, i.e., their returns are less than
perfectly correlated. As a result, increasing the number of securities
in a portfolio will generally reduce the total risk of that portfolio.
As a result, investors will tend to hold well-diversified portfolios.
What then is the relevant measure of the risk of a security when that
security is part of a well-diversified portfolio ? It can be shown that
only the market risk of a security is relevant in a portfolio context
because the firm-specific risk is diversified away. Indeed, an investor
holding a well-diversified portfolio of securities only bears the market
risk of the securities making up the portfolio. The firm-specific
component of the risk of the securities will offset one another and
approach zero as the size of the portfolio increases.
Since the firm-specific risk of a security can be eliminated by
investors by simply holding the security as part of a portfolio, the
firm-specific risk of a security is irrevelant in the pricing of that
security. In other words, since investors do not have to bear firm-
specific risk, investors should not be compensated for it. They should
only be remunerated for bearing market risk because market risk cannot
be diversified away. Thus, the expected return of a security (the
remuneration for holding that security) must be related only to the
market risk of that security. Securities with high-beta coefficients (a
measure of their market risk) must earn higher expected returns than
securities with low-beta coefficients.
The Capital Asset Pricing Model (CAPM) gives the theoretical
relationship that must exist in equilibrium between an asset's expected
returnfflo»anclitsbetacoefficient(.f31):
E(Ri) = RF + [E(Rm) - RF]•Oi
According to the CAPM, the expected return on a risky asset is
equal to the return on a risk-free asset (RF) plus a risk premium which
is proportional to the beta •coefficient of that asset. The
proportionality factor (also called the market price of one unit of

- 5 -
risk) is the difference between the expected return on the market as a
whole (indicated by the subscript m) and the risk-free rate of return.
If the monthly risk-free rate is 1 percent and the expected monthly
return on the market is 3 percent, then:
E(Ri) . .01 + .020i,
and the expected return of an asset with a beta coefficient of 1.5 is 4
percent according to the CAPM, the sum of 1 percent risk-free rate and a
risk premium of (.02)(1.5) = 3 percent.
4. Early evidence on the validity of the CAPM
How can we test the validity of the CAPM ? Note that the model is
based on expected returns which are not observable. But if the relation
between security returns remains relatively stable through time, then
historical returns can be used to estimate the unobservable expected
returns. Thus, to verify the empirical validity of the model we can
examine the historical relation between portfolio returns and their
corresponding estimated beta coefficients6. If that relation is linear
with an intercept equal to the risk-free rate and a slope equal to the
excess return on a broad market index then the CAPM is a valid model of
stock price behavior. We will have an additional test of the validity
of the CAPM if we can show that firm-specific risk is unrelated to
average returns. Recall that, according to the CAPM, firm-specific risk
can be diversified away and, hence, should not be priced in the market.
In other words, an asset's firm-specific risk should not be related to
that asset's average return.
One of the first rigorous test of the CAPM was performed by Fama
and MacBeth (1973) on portfolios of stocks traded on the New York Stock
Exchange (NYSE) from 1935 to June 1968. They estimated the relationship
between average returns (Iii) and beta (0i), beta squared (012 ), and
firm-specific risk. They found the following relationship:
.0020 + .01140i - .0026p.2 + .0516 [Firm-specific risk]
(.55) (1.85) (-.86) (1.11)

-6-
where the number in parentheses below the estimated average coefficients
are t-statistics7. They indicate whether these coefficients are
significantly different from zero. In this case, when the absolute
value of the t-statistics exceeds 1.70, we conclude that there is a 95
percent chance that the estimated coefficient is different from zero.
Otherwise, the estimated coefficient is not significantly different from
zero. Referring to the estimated relationship we can see that average
returns are positively related to beta (t-statistic > 1.70) but
unrelated to beta-squared or firm-specific risk (t-statistics < 1.70).
The conclusion is obvious. The CAPM, when tested over a long period of
time on the NYSE, cannot be rejected. Market risk is the only factor
which has a significant relationship with the average return. Firm
specific risk is irrelevant for security pricing and so is beta
squared8. Also, Fama and MacBeth found that the intercept is not
significantly different from the average risk-free rate over the test
period, a result consistent with the CAPM.
Similar, but somewhat weaker, conclusions were reached when the
CAPM vas first tested on European data. In general, the price behavior
of European common stocks was found to be consistent with the CAPM in
the United Kingdom (Guy (1976)), Germany (Guy (1977)), France (Hawawini
et al. (1983)), Spain (Palacios (1973)) and Belgium (Hawawini et al.
(1982). These and other studies are reviewed in Hawawini (1984).
Despite the empirical evidence supporting the CAPM, it has not been
universally accepted. Criticisms range from its simplicity to the
problem of how one should define "the market" (Roll (1977)). Indeed,
the CAPM is a single period model and it assumes that all market
participants have a common view of the future, to mention but two of its
more contentious properties. And defining "the market" is not an easy
task. In the U.S., it is possible to pretend that all NYSE stocks
constitute the market, but in the relatively small European markets,
clearly some kind of world market portfolio would be a better proxy
given the actual investment practices of European investors. These
criticisms not withstanding, the CAPM is a useful and important model of
asset pricing: its simplicity is its major strength. It focuses our
attention on what appears to matter most for security pricing: market
risk.

7 -
5. The size effect
According to the CAPM, the only determinant of the expected return
on a firm's common stock is its market risk. This implies that other
characteristics of firms, such as their size, should not be related to
average returns. In other words, firms with relatively small market
capitalizations should not have average returns that differ
systematically from those of firms with relatively large market
capitalization.
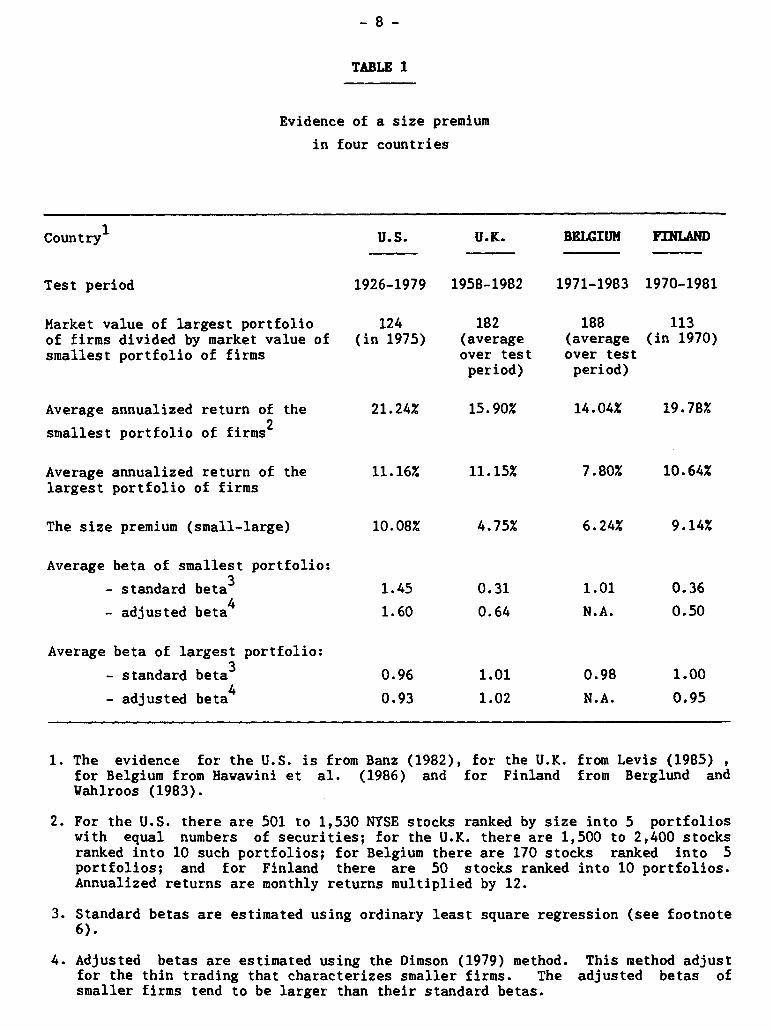
But the evidence indicates that size affects average returns and
that small firms earn, on average, higher returns than large firms. As
we pointed out earlier, this phenomenon cannot be attributed to risk
differential between small and large firms. Small firms tend to
outperform their larger counterparts on even a risk-adjusted basis.
Some of the evidence for the United States, the United Kingdom, Belgium
and Finland is summarized in Table 1. The United Kingdom has the
largest equity market in Europe and the world's third largest market
(after the U.S. and Japan). The Belgian and Finnish markets are among
the smallest in Europe.
First note the difference in size between the largest and smallest
portfolios in the samples drawn from the four countries. The largest
portfolio is 124 times larger than the smallest portfolio in the United
States, 182 times larger in the United Kingdom, 188 times larger in
Belgium and 113 times larger in Finland. The annualized size premium
(the difference between the annual returns on the smallest and the
largest portfolios) is equal to 10.08 percent in the United States (over
a 54-year test period); it is equal to 4.75 percent in the United
Kingdom (over a 25-year test period), 6.24 percent in Belgium (over a
13-year test period), and 9.14 percent in Finland (over a 12-year
period).The size effect exists in the four countries. But since the
sample periods are different, we cannot be certain whether the magnitude
of the effect is significantly different in these countries.
What about risk ? Can differences in risk between the smallest and
largest portfolios explain the size premium ? The evidence is found in
Table 1. In the three European countries, the market risk of the
smallest firms is either lover than the market risk of the largest firms
- 8 -
TABLE 1
Evidence of a size premium
in four countries
Country1 U.S. U.K. BELGIUM FINLAND
■■•■■•■■•■•■
Test period
1926-1979 1958-1982
1971-1983 1970-1981
Market value of largest portfolio
124
182
188
113 of firms divided by market value of (in 1975)
(average
(average (in 1970) smallest portfolio of firms over test
over test
period)
period)
14.04%
7.80%
6.24%
19.78%
10.64%
9.14%
Average annualized return of the
21.24% 15.90%
smallest portfolio of firms2
Average annualized return of the 11.16% largest portfolio of firms
The size premium (small-large) 10.08%
Average beta of smallest portfolio:
- standard beta3
- adjusted beta
Average beta of largest portfolio:
- standard beta3
- adjusted beta
1.45 0.31 1.01 0.36
1.60 0.64 N.A. 0.50
0.96 1.01
0.93 1.02
0.98 1.00
N.A. 0.95
1. The evidence for the U.S. is from Banz (1982), for the U.K. from Levis (1985) , for Belgium from Hawawini et al. (1986) and for Finland from Berglund and Wahlroos (1983).
2. For the U.S. there are 501 to 1,530 NYSE stocks ranked by size into 5 portfolios with equal numbers of securities; for the U.K. there are 1,500 to 2,400 stocks ranked into 10 such portfolios; for Belgium there are 170 stocks ranked into 5 portfolios; and for Finland there are 50 stocks ranked into 10 portfolios. Annualized returns are monthly returns multiplied by 12.
3. Standard betas are estimated using ordinary least square regression (see footnote 6).
4. Adjusted betas are estimated using the Dimson (1979) method. This method adjust for the thin trading that characterizes smaller firms. The adjusted betas of smaller firms tend to be larger than their standard betas.

-9-
(United Kingdom and Finland) or the same (Belgium). It is not clear why
small firms in the United Kingdom and Finland have, on average, lover
betas than large firms but the implication is clear. If we adjust for
differences in risk, the size premium would be higher than the one
reported in Table 1 in the case of the United Kingdom and Finland (since
small firms have lover betas) and about the same in Belgium (since small
and large firms have, on average, roughly the same betas in that
country). In the United States we have the opposite phenomenon: small
firms have, on average, higher market risk than large firms. This is
intuitively more appealing. Small firms are, on average, more risky
than large firms in the United States. But the higher market risk of
small firms in the United States does not account for the size premium
in that country. The risk-adjusted size premium is smaller than the
10.08 percent reported in Table 1 for the United States but still
significantly different from zero.
6. The size effect is not a stationary phenomenon
One obvious question at this point is whether the size effect is a
stationary phenomenon. The evidence suggests that there is little
stationarity. There are periods of time over which large firms, on
average, outperform small firms. Also, the magnitude of the size
premium is not constant. For example, in the case of the United States
reported in Table 1, the size premium varied between a low of -10.20
percent over the subperiod 1926-1930 and a high of 43.80 percent over
the subperiod 1931-1935. Also the magnitude and the sign of the size
premium are not the same, on average, in all months of the year. For
example, in the United Kingdom, almost 50 percent of the total average
size premium reported in Table 1 is earned during the month of May
alone. In the case of Belgium we have reported in Table 1 a total
average size premium of 6.24 percent. But the annualized average size
premium is equal to 29.76 percent in August alone.
The size effect is clearly time dependent. It depends on the
length of time over which the size premium is averaged out. It also
varies throughout the year.

- 10 -
7. Other stock market anomalies
Size is not the only characteristic of firms which could be used to
earn "abnormal" returns, that is, returns exceeding those predicted by
the CAPM. Basu (1977) postulated the existence of relation between P/E-
ratio and return. He examined the average annual returns, from April
1957 through March 1971, of over 750 NYSE stocks assigned to one of five
portfolios on the basis of the magnitude of their year-end price-
earnings ratio. He found that the lowest P/E portfolio earned, on
average, 8 percent more than the highest P/E portfolio after adjusting
returns for risk according to the CAPM. Is the P/E effect another
anomaly or is it simply another manifestation of the size effect ? Low
P/E firms are mostly small firms and the P/E effect could be just a
proxy for the size effect. This is the conclusion reached by several
authors who examined both effects (Reinganum (1981b) and Banz and Breen
(1986)). Once we control returns for differences in risk and size, and
eliminate the bias introduced by the inadequate use of historical data,
the P/E effect disappears.
Other stock market anomalies include a price-to-book value ratio
effect (Stattman (1980)), a "neglected"-firms effect (Arbel and Strebel
(1982)), a period-of-listing effect (Barry and Brown (1984)) and a
dividend-yield effect (Keim (1985)). Firms with relatively low price-
to-book value ratios seem to outperform, on average, firms with
relatively high price-to-book value ratios. Firms which are not
followed regularly by financial analysts and which are not widely held
by institutional investors tend to outperform firms which are
scrutinized by analysts and adopted by institutional investors. Firms
listed on the NYSE for the least number of months earn, on average,
abnormal returns. So do firms with either zero or high dividend
yields9. Some of these phenomena are related to the size effect (the
price-to-book value effect and the "neglected"-firms effect). Others
seem to persist even after returns are adjusted for size (the period-of-
listing effect and the dividend-yield effect). Some also exhibit
seasonality. For example, the dividend-yield effect manifest itself
mostly in the month of January. Ail these phenomena were uncovered
using U.S. stock market data. At the time of this writing there were no
similar studies based on European data but our suspicion is that
anomalies similar to those found in U.S. stock market data will soon be
uncovered in European stock market data.

8. A look at the CAPM in light of the size effect
We have reported the results of the Fama and MacBeth test of the
CAPM in a previous section and concluded that the evidence vas
consistent with equity pricing according to the CAPM. But if there
exists a size premium in the equity market, the Fama and MacBeth test
would not capture it. The relationship between average returns and
market risk must be re-examined in light of the size effect.
The first test of the CAPM with an explicit recognition of size vas
performed using U.S. stock market data (Banz (1981)). Average returns
were found to be positively related to market risk and negatively
related to firm size. But the relationship between average returns,
market risk and firm size is unstable and seasonal (Tiniç and West
(1986)). The evidence for two European markets, the United Kingdom and
Belgium is summarized in Table 2. When the entire sample is
considered, portfolio returns are, on average, unrelated to market risk
(note that the t-statistics for the risk premium are smaller than 1.70)
and inversely related to size (the t-statistics for the size premium are
greater than 1.70). The conclusion is clear: over the 27-year period
from 1957 to 1983 in the United Kingdom and over the 13-year period from
1971 to 1983 in Belgium, a strategy that consists of holding portfolios
of small firms would have outperformed a strategy that consists of
holding portfolios of high-risk firms.
But we said earlier that the relationship between return, market
risk and size is seasonal in the United States. This is also the case
in Europe. A look at Table 2 indicates that returns are significantly
positively related to market risk and significantly negatively related
to size only in April in the United Kingdom and only in January in
Belgium. The conclusion is that a strategy that consists of holding
portfolios containing firms that are both small and risky would have
outperformed the market average in April in the United Kingdom and
January in Belgium. As a matter of fact, a high-beta, small-firm
strategy implemented during January in Belgium would have earned 10.31
percent (monthly return) over the 13-year period from January 1971 to
December 1983. Over the same period, the average monthly market return
vas 0.84 percent. The January, small-firm, high-beta strategy earned a
return over 12 times greater than a market-average strategy (exclusive
of transaction costs) !

TABLE 2
Estimation of the average risk premium and the average size premium based on the relationship:
* R y +
r1•0. + y -SIZE Ri i
Estimated coefficient
Y1
Y2 average over
(risk premium)
(size premium)
. U.K. (1/57 to 12/83)
Ail months -.0032 -.0008**
(-1.44) (-1.96)
April only .0157** -.0004**
(2.10) (-2.13)
. Belgium (1/71 to 12/83)
-.0020 -.0008** Ail months
(-1.30) (-2.30)
January only .0172** -.0022**
(3.05) (-1.95)
* For the United Kingdom, size is measured by the logarithm of the market value of the firm. See Corhay et al. (1987a). For Belgium, size is measured relative to the average market value of all firms, i.e., by the ratio : (Vi - Vm)/Vm where Vi is the market value of firm i and Vm is the average market value. See Hawawini et al. (1986).
** Indicates coefficients that are significantly different from zero. The absence of the double asterisks indicates that the coefficient is not significantly different from zero.
9. Interpreting the size effect
There are basically two possible interpretations of the small firm
effect. The first is that the phenomenon does not exist; its appearance
is simply the result of poor measurement procedures. If stock returns
and market risk were measured properly, the size effect would disappear.
The second interpretation is that the size effect is the result of an
incorrect specification of the pricing model (the CAPM) we are using to
calculate the risk-adjusted size premium. If we had a "correct" model
of the risk-return relationship, which would incorporate ail aspects of
risk relevant for investors, then the risk-adjusted size-premium would
disappear.
Suppose that the market risk of small firms is systematically
underestimated and that the market risk of large firms is systematically
overestimated. In other words, the "true" market risk of small firms is
higher than their estimated market risk and the "true" market risk of
large firms is lover than their estimated market risk. If that is the
case, then the "true" risk-adjusted return on small firms will be lover
than the observed return (and that of large firms will be higher) with
the end result that the risk-adjusted size premium may disappear. This
outcome will be reinforced if the "true" return on small firms were
lover than those estimated from the data. This may be the case if we
account, for example, for the higher costs of trading small firms. In
this case the size-premium measured net of transaction costs will be
smalier if small firms have higher transaction costs than their larger
counterparts10.
But why should the estimated market risk of small firms be below
its "true" value ? The estimated beta coefficient of infrequently
traded stocks is lover than their "true" beta coefficient and since
small firms tend to trade relatively infrequently their beta
coefficients are underestimated. Adjusted betas, which correct for thin
trading smaller firms, have been developed by several authors (Dimson
(1979) and Cohen et al. (1983)). A look at Table 2 indicates that the
adjusted betas of small firms are indeed higher than their standard
betas. But even with adjusted betas, the size premium remains. Hence,
adjusted betas reduce but do not eliminate the size premium.

- 14 -
The second possible explanation of the size effect is that the CAPM
does not adequately adjust for risk and hence is not a reliable model to
calculate risk-adjusted returns11. This explanation is, of course, to
some extent a truism. The CAPM is an incomplete model as the evidence
has shown. But there are several kinds of risk which might be
responsible for the size anomaly. Suppose smaller firms are perceived
to be riskier because investors have relatively less information about
them than about larger firms. If that is the case, then the excess
return earned on small firms is simply a compensation for holding
riskier securities. This extra risk may not be captured by the beta
coefficient and size may simply act as a proxy for a missing risk factor
introduced by differential information across firms.
Note that the above interpretations of the small firm effect do not
explain its seasonal behavior12. Why is the risk-adjusted size-premium
earned during particular months of the year ? Specifically, January in
the United States and Belgium and April in the United Kingdom ? January
is the first month of the fiscal year in the United States and Belgium.
April is the first month of the fiscal year in the United Kingdom. It
is possible that the small firm effect is partly tax induced. According
to that hypothesis, investors can reduce their taxes by selling the
stocks on which they lost money during the year. In doing so they
realize capital losses that are deductible from their taxable income.
The sale of securities at the end of the fiscal year depresses their
prices which recover at the beginning of the next fiscal year as stocks
move back to their equilibrium value. Because small-firm stocks are
more volatile than large-firm stocks they are more likely to be
candidates for year-end tax-selling and hence the observed January size-
premium in the United States and Belgium and the April size-premium in
the United Kingdom. The evidence is, however, far from conclusive with
regard to this "tax-loss selling effect" (Chan (1986))13.
At this time we can only offer interpretations and hypotheses. We
do not yet have a definitive explanation of the small firm effect.
- 15 -
10. Implication for corporate treasurers and portfolio managers
We conclude with some practical implications of the small firm
effect. Assuming that the phenomenon is not just the outcome of
measurement errors then the size premium earned on small firms implies
that investors demand (and obtain) higher return in order to hold
smaller firms. This, in turn, implies that smaller firms have a higher
cost of equity than their larger counterparts. Another way to look at
this phenomenon is that firms can reduce their cost of equity capital by
increasing their market capitalization. This result offers a slim
financial justification of conglomerate mergers.
From a portfolio manager's perspective, the small firm effect (as
well as the other stock market anomalies) presents, in principle, an
opportunity to increase portfolio performance. Are these opportunities
real once we take transaction costs into account ? The rewards sug-
gested by the seasonal anomalies are substantial but academic research
generally assumes no transaction costs14. Given the limited liquidity
of small stocks and their high bid-ask spreads, most strategies which
involve active trading will not lead to the desired success. While is
may appear irresistible to invest in small Belgian firms every January,
commissions and especially the market impact of the trades would most
likely wipe out all or most of the gain. The higher costs associated
with trading in and gathering information about small firms suggest that
an approach which minimizes portfolio turnover, i.e., a buy-and hold-
strategy, is the most feasible one. But the fundamental question
remains: is the extra return earned on small-firm stocks a "free lunch"
or is it simply a fair compensation on a riskier investment ?

Footnotes
1. Note the distinction between expected returns and average
historical returns. The former is an ex ante measure and the
latter is an ex post measure. If a market is characterized by
"rational expectations" then average historical returns are
unbiased estimators of the unobservable returns.
2. The expected return is calculated as follows:
Y2(5%) + Y2(15%) = 10%
3. The standard deviation is calculated as follows:
)1V2(5% - 10%)2 + h(15% - 10%)2 . 5%
4. Note that stocks with identical betas could have very different
firm-specific risks and vice-versa.
5. Note that empirical work indicates that the total risk of a
security is mostly firm-specific. Market-related risk usually
represents less than one-third of the total risk of a security
(Hawawini (1984)).
6. The beta coefficient of a stock can be estimated using standard
regression analysis. The estimated slope of the linear regression
of stock returns on market index returns is the stock's beta
coefficient.
7. The t-statistic is the ratio of the coefficient's mean value to its
standard deviation. The higher the t-statistic the more "precise"
is the estimate.
8. Since the coefficient of beta squared is not significantly
different from zero we can conclude that the relationship is
linear.
9. Forbes (January 1987) reports the following annual returns (capital
gains only) during 1986 for a large sample of U.S. common stocks

- 17 -
(all stocks for which daily quotations are available): 23% for
large firms and 41% for small firms; 27% for low-beta firms and 57%
for high-beta firms, 16% for firms with a P/E ratio over 25 and 27%
for firms with a P/E ratio under 5; 20% for firms with a dividend
yield over 7.5% and 33% for firms with no dividend payments.
10. Transaction costs are measured by the broker's commission as well
as the dealer's bid-ask spread. Smaller firms have relatively
vider bid-ask spread and hence higher transaction costs (Amihud and
Mendelson (1986)).
11. Recent attempts to examine the size effect in the United States
using a different pricing model than the CAPM have not produced
conclusive results. The Arbitrage Pricing Theory (APT) developed
by Ross (1976) is a multifactor model of asset pricing which
generalizes the CAPM. Employing the APT, Reinganum (1981a) reports
that even a five-factor model is unable to explain the size anomaly
whereas Chen (1983) reports that firms size does not have
sufficient explanatory power to reject the APT model. Gultekin and
Gultekin (1986) show that there is a strong seasonal pattern in the
estimates of the risk premia from the APT model similar to those
found for the CAPM (Corhay, Hawawini and Michel (1987b)). They
conclude that the APT model, like the CAPM, can explain the risk-
return relationship in January only in the United States.
12. Some authors have shown that the risk of small U.S. firms (both
total risk and market risk) is higher in January than during the
rest of the year (Tiniç and Rogalski (1986)). Hence, the higher
return earned by small firms in January may simply reward investors
for holding securities that have higher risk in January. But the
question of why we observe higher return and higher risk in January
for small U.S. firms is still unanswered.
13. For example, a January effect has been observed in countries with
no taxes on capital gains such as the Netherlands (van den Bergh
and Wessels (1985)) and Japan (Korajczyk and Viallet (1987)).
14. See footnote 10.
References
AMIHUD,Y. and MENDELSON, H. (1986): "Asset Pricing and the Bid-Ask
Spread", Journal of Financial Economics, 17 (December), 223-250
ARBEL, A. and STREBEL, P. (1982): "The Neglected and Small-Firm
Effects", Financial Review, 17 (November), 201-218.
BANZ, R. (1981): "The Relationship Between Return and Market Value of
Common Stock", Journal of Financial Economics, 9 (June), 3-18.
BANZ, R. (1982): "The Small Firm Effect Revisited", Unpublished
Manuscript (Northwestern University) (April).
BANZ, R. and BREEN, W. (1986): "Sample Dependent Results Using
Accounting and Market Data: Some Evidence", Journal of Finance, 41
(September), 779-794.
BARRY, C. and BROWN, S. (1984): "Differential Information and the Small
Firm Effect", Journal of Financial Economics, 13 (JUNE), 283-294.
BASU, S. (1977): "Investment Performance of Common Stocks in Relation to
their Price-Earnings Ratios: A Test of the Efficient Market
Hypothesis", Journal of Finance, 32 (June), 663-682.
van den BERGH, W. and WESSELS, R. (1985): "Stock Market Seasonality and
Taxes: An Examination of the Tax-Loss Selling Hypothesis", Journal
of Business Finance and Accounting, 12 (Winter), 515-530
CHAN, K.C. (1986): "Can Tax-Loss Selling Explain the January Seasonal in
Stock Returns ? ", Journal of Finance, 41 (December), 1115-1128
CHAN, N.-F. (1983): "Some Empirical Tests of the Theory of Arbitrage
Pricing," Journal of Finance, 38 (December), 1393-1414
COHEN, K., HAWAWINI, G., MAIER, S., SCHARTZ, R., and WHITCOMB, D.
(1983): "Estimating and Adjusting for the Intervalling Effect Bias
in Beta", Management Science, 29 (January), 135-148.
- 19-
CORHAY, A., HAWAWINI, G. and MICHEL, P. (1987a): "The Pricing of Equity
on the London Stock Exchange: Seasonality and Size Premium", in
Stock Market Anomalies, E. DIMSON editor, Cambridge University
Press.
CORHAY, A., HAWAWINI, G. and MICHEL, P. (1987b): "Seasonality in the
Risk-Return Relationship: Some International Evidence", Journal of
Finance, 42 (March).
DIMSON, E. (1979): "Risk Measurement When Shares are Subject to
Infrequent Trading", Journal of Financial Economics, 7 (June), 197-
226.
FAMA, E. and MACBETH, J. (1973): "Risk, Return and Equilibrium:
Empirical Tests", Journal of Political Economy, 71 (May/June), 607-
636.
GULTEKIN, M. and GULTEKIN, B. (1986): "Stock Return Anomalies and The
Asset Pricing Tests: The Case of the Arbitrage Pricing Theory",
Unpublished Manuscript, University of Pennsylvania (January).
GUY, J. (1976): "The Stock Exchange, London: An Empirical Analysis of
Monthly Data from 1960-1970", in European Finance Association 1975
Proceedings, Brealey, R. and Rankine, G. editors, North-Holland:
Amsterdam.
GUY, J. (1977): "The Behavior of Equity Securities on the German Stock
Exchange", Journal of Banking and Finance, 1, 71-93.
HAWAWINI, G. (1984): "European Equity Markets: Price Behavior and
Efficiency", Monograph series in Finance and Economics, Salomon
Brothers Center for the Study of Financial Institutions, New York
University.
HAWAWINI, G., MICHEL, P. and CORHAY, A. (1986): "The Pricing of Common
Stocks on the Brussels Stock Exchange: A Re-examination of the
Evidence", Working Paper 86/39 (INSEAD).
HAWAWINI, G. and MICHEL, P. (1982): "The Pricing of Risky Assets on the
Belgian Stock Market", Journal of Banking and Finance, 6 (June),
161-178.

-20-
HAWAWINI, G., MICHEL, P. and VIALLET, C. (1983): "An Assessment of the
Risk and Return of French Common Stocks", Journal of Business
Accounting and Finance 10 (Autumn), 333-350.
KEIM, D. (1985): "Dividend Yields and Stock Returns: Implications of
Abnormal January Returns", Journal of Financial Economics, 14
(September), 473-490.
KEIM, D. (1986): "The Capital Asset Pricing Model and Market Anomalies",
Financial Analyst Journal, 42 (May/June), 19-34.
KORAJCZYK, R. and VIALLET, C. (1987): "An Empirical Investigation of
International Asset Pricing", Working Paper 87/2 (INSEAD)
LINTNER, J. (1965): "The Valuation of Risk Assets and the Selection of
Risky Investments in Stock Portfolios and Capital Budgets", Review
of Economics and Statistics, 47 (February), 13-57.
PALACIOS, J. (1973): "The Stock Market in Spain: Tests of Efficiency and
Capital Market Theory", Doctoral Thesis, Stanford University.
REINGANUM, M. (1981a): "The Arbitrage Pricing Theory: Some Empirical
Results", Journal of Finance, 36 (May), 313-321.
REINGANUM, M. (1981b): "A Misspecification of Capital Asset Pricing:
Empirical Anomalies Based on Earnings Yields and Market Values",
Journal of Financial Economics, 9 (June), 19-46.
ROLL, R. (1977): "A Critique of the Asset Pricing Theory's Tests",
Journal of Financial Economics, 4 (March), 129-176.
ROSS, S. (1976): "The Arbitrage Theory of Capital Asset Pricing",
Journal of Economic Theory, 13 (December), 341-360.
SHARPE, W. (1964): "Capital Asset Prices: A Theory of Market Equilibrium
Under Conditions of Risk", Journal of Finance, 19 (September), 425-
442.
STATTMAN,D. (1980):"Book Values and Expected Stock Returns", Unpublished
M.B.A. honors paper,(University of Chicago).

TINIÇ, S. and WEST, R. .(1986):"Risk, Return, and Equilibrium: A
Revisit", Journal of Political Economy, 94 (February), 126-147.
TINIÇ, S and ROGALSKI, R. (1986): "The January Size Effect: Anomaly or
Risk Mismeasurement", Financial Analyst Journal (November -
December), 63-70.
VAHLROOS, B. and BERGLUND, T. (1986): "Anomalies and Equilibrium Returns
in a Small Stock Market", Journal of Business Research, 14, 423-
440.

1985
85/01 Jean DERMINE
85/02 Philippe A. NAERT and Els GIJSBRECHTS
85/03 Philippe A. NAERT and Els GIJSBRECHTS
"The measurement of interest rate risk by financial intermediaries", December 1983, Revised December 1984.
"Diffusion Bodel for nev product introduction in existing markets" .
"Towards a decision support system for hierarchically allocating marketing resources across and vithin product groupe .
85/17 Manfred F.R. KETS DE "Personality, culture and organization". VRIES and Danny MILLER
85/18 Manfred F.R. KETS "The darker side of entrepreneurship". DE VRIES
85/19 Manfred P.R. KETS DE "Narcissism and leadership: an object VRIES and Dany MILLER relations perspective".
85/20 Manfred F.R. KETS DE "Interpreting organizational texts". VRIES and Dany MILLER
"A technological life-cycle to the organisational factors determining gatekeeper activities" , November 1983.
"La politique budgétaire et le taux de change réel", November 1983.
"Real exchange rate effects of fiscal policy", December 1983.
"European equity markets: a reviev of the evidence on price behavior and efficiency", February 1984.
"Capital controls and balance of payments crises", February 1984.
"An uncertainty model of the professional partnership", November 1983.
"The geometry of risk aversion", October 1983.
"Risk, Return and equilibrium of the NYSE: update, robustness of results and extensions" December 1983.
"Industry influence on firm's investment in vorking capital: theory and evidence", January 1984.
"Impact of the Belgian Financial Reporting Act of 1976 on the systematic risk of common stocks", January 1984.
"On the measurement of the market value of a bank", April 1984.
"Tax reform in Portugal: a general equilibrium analysis of the introduction of a value added tax", December 1984.
"Integration of information systems in manufacturing", December 1984.
85/04 Philippe A. NAERT and Marcel WEVERBERGH
85/05 Ahmet AYKAC, Marcel CORSTJENS, David GAUTSCHI and Ira HOROWITZ
85/06 Kasra FERDOWS
85/07 Kasra FERDOWS, Jeffrey G. MILLER, Jinchiro NAKANE and Thomas E.VOLLMANN.
85/08 Spyros MAKRIDAKIS and Robert CARBONE
85/09 Spyros MAKRIDAKIS and Robert CARBONE
85/10 Jean DERMINE
85/11 Antonio M. BORGES and Alfredo M. PEREIRA
85/12 Arnoud DE MEYER
85/13 Arnoud DE MEYER
85/14 Ahmet AYKAC, Marcel CORSTJENS, David GAUTSCHI and Douglas L. MacLACHLAN
85/15 Arnoud DE MEYER and Roland VAN DIERDONCK
85/16 Herwig M. LANGOHR and Antony M. SANTOMERO
"Market share specification, estimation and validation: tovards reconciling seemingly divergent vievs" .
"Estimation uncertainty and optimal advertising decisions", Second draft, April 1985.
"The shifting paradigms of manufacturing: inventory, quality and nov versatility", March 1985.
"Evolving manufacturing strategies in Europe, Japan and North-America"
"Forecasting vhen pattern changes occur beyond the historical data" , April 1985.
"Sampling distribution of post-sample forecasting errors" , February 1985.
"Portfolio optimization by financial intermediaries in an asset pricing model".
"Energy demand in Portuguese manufacturing: a tvo-stage model".
"Defining a manufacturing strategy - a survey of European manufacturers".
"Large European manufacturers and the management of R & D".
"The advertising-sales relationship in the U.S. cigarette industry: a comparison of correlational and causality testing approaches".
"Organizing a technology jump or overcoming the technological hurdle".
"Commercial bank refinancing and economic stability: an analysis of European features".
84/13 Arnoud DE MEYER and Kasra FERDOWS
1984
84/01 Arnoud DE MEYER
84/02 Jeffrey SACHS and Charles A. WYPLOSZ
84/03 Jeffrey SACHS and Charles A. WYPLOSZ
84/04 Gabriel A. HAWAWINI
84/05 Charles A. WYPLOSZ
84/06 Gabriel A. HAWAWINI
84/07 Gabriel A. HAWAWINI
84/08 Gabriel A. HAWAWINI, Pierre MICHEL and Claude J. VIALLET
84/09 Gabriel A. HAWAWINI, Claude J. VIALLET and Ashok VORA
84/10 Gabriel A. HAWAWINI and Pierre A. MICHEL
84/11 Jean DERMINE
84/12 Antonio M. BORGES

85/21 Herwig M. LANGOHR and Claude J. VIALLET
85/22 Herwig M. LANGOHR and B. Espen ECKBO
85/23 Manfred F.R. KETS DE VRIES and Dany MILLER
85/24 Spyros MAKRIDAKIS
85/25 Gabriel HAWAWINI
85/26 Karel O. COOL and Dan E. SCHENDEL
85/27 Arnoud DE MEYER
1986
86/01 Arnoud DE MEYER
86/02 Philippe A. NAERT Marcel WEVERBERGH and Guido VERSWIJVEL
86/03 Michael BRIMM
86/04 Spyros MAKRIDAKIS and Michèle HIBON
86/05 Charles A. WYPLOSZ
86/06 Francesco GIAVAZZI, Jeff R. SHEEN and Charles A. WYPLOSZ
86/07 Douglas L. MacLACHLAN and Spyros MAKRIDAKIS
86/08 José de la TORRE and David H. NECKAR
86/09 Philippe C. HASPESLAGH
"Nationalisation, compensation and vealth transfers: France 1981-1982" 1, Final version July 1985.
"Takeover prenions, disclosure regulations, and the market for corporate control. A comparative analysis of public tender of fers, controlling-block trades and minority buyout in France", July 1985.
"Barriers to adaptation: personal, cultural and organizational perspectives".
"The art and science of forecasting: an assessment and future directions".
"Financial innovation and recent developments in the French capital markets", October 1985.
"Patterns of competition, strategic group formation and the performance case of the US pharmaceutical industry, 1963-1982", October 1985.
"European manufacturing: a comparative study (1985)".
"The R & D/Production interface".
"Subjective estimation in integrating communication budget and allocation decisions: a case study", January 1986.
"Sponsorship and the diffusion of organizational innovation: a preliminary viev".
"Confidence intervals: an empirical investigation for the series in the N-Competition" .
"A note on the reduction of the vorkveek", July 1985.
"The real exchange rate and the fiscal aspects of a naturel resource discovery", Revised version: February 1986.
"Judgmental blases in sales forecasting", February 1986.
"Forecasting political risks for international operations", Second Draft: March 3, 1986.
"Conceptualizing the strategic process in diversified firms: the role and nature of the corporate influence process", February 1986.
86/10 R. MOENART, Arnoud DE MEYER, J. BARBE and D. DESCHOOLMEESTER.
86/11 Philippe A. NAERT and Alain BULTEZ
86/12 Roger BETANCOURT and David GAUTSCHI
86/13 S.P. ANDERSON and Damien J. NEVEN
86/14 Charles WALDMAN
86/15 Mihkel TOMBAK and Arnoud DE MEYER
86/16 B. Espen ECKBO and Herwig M. LANGOHR
86/17 David B. JEMISON
86/18 James TEBOUL and V. MALLERET
86/19 Rob R. WEITZ
86/20 Albert CORHAY, Gabriel HAWAWINI and Pierre A. MICHEL
86/21 Albert CORHAY, Gabriel A. HAWAWINI and Pierre A. MICHEL
86/22 Albert CORHAY, Gabriel A. HAWAWINI and Pierre A. MICHEL
86/23 Arnoud DE MEYER
86/24 David GAUTSCHI and Vithala R. RAO
86/25 H. Peter GRAY and Ingo WALTER
86/26 Barry EICHENGREEN and Charles WYPLOSZ
"Analysing the issues concerning technological de-maturity".
"From "Lydiametry" to "Pinkhamization": misspecifying advertising dynamics rarely affects profitability".
"The economics of retail firman, Revised April 1986.
"Spatial competition à la Cournot".
"Comparaison internationale des marges brutes du commerce", June 1985.
"Bov the managerial attitudes of firms with ENS differ from other manufacturing firms: survey results", June 1986.
"Les primes des offres publiques, la note d'information et le marché des transferts de contrôle des sociétés".
"Strategic capability transfer in acquisition integration", May 1986.
"Tovards an operational definition of services", 1986.
"Nostradamus: a knovledge-based forecasting advisor".
"The pricing of equity on the London stock exchange: seasonality and size premium", June 1986.
"Risk-premia seasonality in U.S. and European equity markets", February 1986.
"Seasonality in the risk-return relationships some international evidence", July 1986.
"An exploratory study on the integration of information systems in manufacturing", July 1986.
"A methodology for specification and aggregation in product concept testing", July 1986.
"Protection", August 1986.
"The economic consequences of the Franc Poincare", September 1986.

86/27 Karel COOL and Ingemar DIERICKX
"Negative risk-return relationships in business strategy: paradox or truism?", October 1986.
1987
87/01 Manfred KETS DE VRIES "Prisoners of leadership".
86/28 Manfred KETS DE VRIES and Danny MILLER
"Interpreting organizational texts. 87/02 Claude VIALLET "An empirical investigation of international asset pricing", November 1986.
86/29
86/30
Manfred KETS DE VRIES
Manfred KETS DE VRIES
"Why follov the leader?".
"The succession game: the real story.
87/03 David GAUTSCHI and Vithala RAO
"A methodology for specification and aggregation in product concept testing", Revised Version: January 1987.
86/31 Arnoud DE MEYER "Flexibility: the next competitive battle". 87/04 Sumantra GHOSHAL and Chrisopher BARTLETT
"Organizing for innovations: case of the multinational corporation", February 1987.
86/32 Karel COOL Performance differences among strategic group and Dan SCHENDEL members", October 1986. 87/05 Arnoud DE MEYER
and Kasra FERDOWS "Managerial focal points in manufacturing strategy", February 1987.
86/33 Ernst BALTENSPERGER "The role of public policy in insuring and Jean DERMINE financial stability: a cross-country,
comparative perspective", August 1986, Revised 87/06 Arun K. JAIN,
Christian PINSON and "Customer loyalty as a construct in the marketing of banking services", July 1986.
November 1986. Naresh K. MALHOTRA
86/34 Philippe HASPESLAGH and David JEMISON
"Acquisitions: myths and reality", July 1986.
86/35 Jean DERMINE "Measuring the market value of a bank, a primer", November 1986.
86/36 Albert CORHAY and "Seasonality in the risk-return relationship: Gabriel HAWAWINI some international evidence", July 1986.
86/37 David GAUTSCHI and Roger BETANCOURT
"The evolution of retailing: a suggested economic interpretation".
86/38 Gabriel HAWAWINI "Financial innovation and recent developments in the French capital markets", Updated: September 1986.
86/39 Gabriel HAWAWINI Pierre MICHEL and Albert CORHAY
"The pricing of common stocks on the Brussels stock exchange: a re-examination of the evidence", November 1986.
86/40 Charles WYPLOSZ "Capital fioles liberalization and the ENS, a French perspective", December 1986.
86/41 Kasra FERDOWS and Wickham SKINNER
"Manufacturing in a nev perspective", July 1986.
86/42 Kasra FERDOWS and Per LINDBERG
"FMS as indicator of manufacturing strategy", December 1986.
86/43 Damien NEVEN "On the existence of equilibrium in hotelling's model", November 1986.
86/44' Ingemar DIERICKX Carmen MATUTES and Damien NEVEN
"Value added tax and competition", December 1986.

Arlfit■
UME "in M1 FI/ 111.‘..; rte
IT'HA Hrin a~p ô
Boulevard de Constance 77309 Fontainebleau Cedex, France Telephone (1) 60 72 40 40 Telecopy (1) 60 72 40 49 Telex 690389
EAC RESEARCH PAPERS
EAC RESEARCH PAPERS
(Academic papers based on the research of EAC Faculty and research staff)
1. LASSERRE Philippe (Research Paper n° 1) A contribution to the study of entrepreneurship development in Indonesia. 1980.
2. BOISOT Max and LASSERRE Philippe (Research Paper n° 2) The transfer of technology from European to ASEAN entreprises: strategies and practices in the chemical and pharmaceutical sectors. 1980.
3. AMAKO Tetsuo (Research Paper n° 3) Possibilité d'un transfert à l'étranger des techniques japonaises de gestion du personnel: le cas français. 1982.
4. SCHUTTE Hellmut (Research Paper n° 8) Wirtschaftliche Kooperation zwischen den ASEAN - Lândern und Nordrhein-Westfalen - Hemmungsfaktoren und Chancen für die deutsche Wirtschaft. 1983.
5. ISHIYAMA Yoshihide (Research Paper n° 14) The political economy of liberalisation of the financial system in Japan. 1984.
6. LASSERRE Philippe (Research Paper n° 17) Singapour comme centre régional. L'expérience d'entreprises françaises. 1985.
7. Von KIRCHBACH Friedrich (Research Paper n° 18) Patterns of export channels to developing Asia. 1984.
8. MITTER Rajan (Research Paper n° 19) A survey of European business in India. 1984.
9. CHAPON Marie-Claude (Research Paper n° 22) Stratégies des entreprises japonaises en Afrique. 1985.