equity in long-lasting insecticidal nets and indoor
TRANSCRIPT

Hailu et al. Malar J (2016) 15:366 DOI 10.1186/s12936-016-1425-0
RESEARCH
Equity in long-lasting insecticidal nets and indoor residual spraying for malaria prevention in a rural South Central EthiopiaAlemayehu Hailu1,2*, Bernt Lindtjørn1, Wakgari Deressa3, Taye Gari4, Eskindir Loha4 and Bjarne Robberstad1,5
Abstract
Background: While recognizing the recent achievement in the global fight against malaria, the disease remains a challenge to health systems in low-income countries. Beyond widespread consensuses about prioritizing malaria pre-vention, little is known about the prevailing status of long-lasting insecticidal nets (LLINs) and indoor residual spraying (IRS) across different levels of wealth strata. The aim of this study was to evaluate the socioeconomic related dimen-sion of inequalities in malaria prevention interventions.
Methods: This study was conducted in July–August 2014 in Adami Tullu district in the South-central Ethiopia, among 6069 households. A cross-sectional data were collected on household characteristics, LLIN ownership and IRS cover-age. Principal component analysis technique was used for ranking households based on socioeconomic position. The inequality was measured using concentration indices and concentration curve. Decomposition method was employed in order to quantify the percentage contribution of each socioeconomic related variable on the overall inequality.
Results: The proportion of households with at least one LLIN was 11.6 % and IRS coverage was 72.5 %. The Erreygers normalized concentration index was 0.0627 for LLIN and 0.0383 for IRS. Inequality in LLIN ownership was mainly asso-ciated with difference in housing situation, household size and access to mass-media and telecommunication service.
Conclusion: Coverage of LLIN was low and significant more likely to be owned by the rich households, whereas houses were sprayed equitably. The current mass free distribution of LLINs should be followed by periodic refill based on continuous monitoring data.
Keywords: Ethiopia, Equity, Malaria prevention, LLIN, IRS, Inequality analysis, Concentration index
© 2016 The Author(s). This article is distributed under the terms of the Creative Commons Attribution 4.0 International License (http://creativecommons.org/licenses/by/4.0/), which permits unrestricted use, distribution, and reproduction in any medium, provided you give appropriate credit to the original author(s) and the source, provide a link to the Creative Commons license, and indicate if changes were made. The Creative Commons Public Domain Dedication waiver (http://creativecommons.org/publicdomain/zero/1.0/) applies to the data made available in this article, unless otherwise stated.
BackgroundIn the last decade, the global fight against malaria reaches on promising phase. Between 2000 and 2013, malaria mortality was reduced by 47 % worldwide and by 54 % in Africa. During the same period, deaths from malaria dropped by half in Ethiopia. However, malaria still remains to be one of the major challenges for the health system in low-income countries. The disease is
widespread around the globe, putting approximately 3.3 billion people at risk [1].
Malaria is one of the leading health problems in Ethio-pia. Records from the Ministry of Health (MoH) reveal that more than 75 % of the total land mass is endemic and about 68 % of the population is living in a malari-ous area [2]. The World Health Organization (WHO) report more than 3.7 million cases of malaria infection for the year 2012 [3], and more than 2.1 million of cases for 2013 [4], in Ethiopia. Malaria is also one of the lead-ing causes of outpatient visits, inpatient admissions and hospital deaths. In the malaria endemic districts of Oro-mia region, malaria account for up to 29 % of all outpa-tient visits [5], while in Adami Tullu district, where this
Open Access
Malaria Journal
*Correspondence: [email protected] 2 Department of Reproductive Health and Health Service Management, School of Public Health, Addis Ababa University, P.O. Box 9086, Addis Ababa, EthiopiaFull list of author information is available at the end of the article
brought to you by COREView metadata, citation and similar papers at core.ac.uk
provided by Springer - Publisher Connector

Page 2 of 11Hailu et al. Malar J (2016) 15:366
paper emanates, malaria parasitic prevalence peaks up to 10.4 % [6]. A recent study by Gari et al. similarly reported a higher incidence of malaria cases (4.6 cases per 10,000 person-weeks of observation) from the same area [7].
The incidence peaks biannually from September to December and April to May, both coinciding with har-vesting seasons [8]. This has a serious consequence for Ethiopian farmers whom constitute the vast majority of the total population. The consequences regard both the farmers, who are dependent on subsistence agriculture for livelihood, but also more broadly the economic devel-opment of the country. Studies consistently show also malaria imposes heavy sanctions on economic growth and causes household impoverishment [9, 10].
Malaria causes multifaceted problems which demand priority as well as synergistic intervention. Prevention of malaria using long-lasting insecticidal nets (LLINs) and indoor residual spraying (IRS) has been demonstrated to be cost-effective interventions in different contexts. A systematic review indicates a median incremental cost effectiveness ratio (ICER) per disability adjusted life year (DALY) averted of $27 for insecticide-treated nets (ITNs), and $143 for IRS [11]. These tools have been scaled up in the last decade aiming towards a universal access and to interrupt malaria transmission in malaria-endemic developing countries [12].
The results of the last two malaria indicator surveys (MIS) showed a remarkable stride in malaria prevention and control services in Ethiopia. For example: ITN own-ership in malaria endemic areas improved from 3.4 % in 2005 [13] to 65.6 % in 2007 [14]. Overall, 68 % of house-holds in malaria endemic areas were protected by at least one LLIN or indoor residual spraying of households with insecticide [15]. Thirty percent of IRS targeted areas were sprayed in 2007 and in 2008 the coverage increased to 50 % [16]. So far, (since 2005 till 2014), a total of 64.2 mil-lion ITNs have been distributed [17]. Currently, Ethiopia aims to achieve universal coverage by distributing one LLIN per 1.8 persons through mass and free distribution campaigns at the community level through the health extension workers and health facilities. Usually, LLINs are distributed by periodic mass campaigns that occur about every 3 years in a rotation basis [2].
Beyond mere emphasis on overall coverage, malaria prevention services in general and LLIN ownership and IRS status in particular, should be fair regardless of socioeconomic status over time. Both LLIN and IRS are mainly financed through the MoH either from donation or direct government budgeting. Therefore, unargu-ably, the benefits from these publicly financed interven-tions shall be distributed equitably. A test regarding this normative position is that the odds of malaria infection should be the same for all socioeconomic classes [18].
Worrall et al. [19], based on review of several literatures, and Filmer [20], using 29 Demographic and Heath Sur-veys (DHS) data from 22 countries, establish a very weak link between malaria incidence and wealth status at micro-level. No differences were found at the household level in the incidence of fever between the poor and less poor [20]. Similarly, a recent study by Gari et al. from the same area also found no significant association between wealth status and incidence of malaria [7].
The underlying assumption is that at individual or household level, the odds of malarial infection is quite similar if either of them are not using the preventive measures. Therefore the argument that the socioeco-nomically better-off are in a better position to access the other non-publicly financed means of malaria preven-tion including mosquito repellent or window meshes could not be justified given that the availability in rural setting is limited. For this reason, this paper emphasizes that malaria prevention interventions (LLINs and IRS) should be owned equitably at any given time. However, the Ethiopian government has committed to follow pro-poor universal health service delivery strategy, which goes beyond policy statements of creating equal access to health services for all groups of population [21].
In a nutshell, in this malaria elimination and eradica-tion era, information on the equity dimension is more important than ever for priority setting and resource allocation [22–24]. In contrast, little is currently known about who benefits from prevention efforts. Where are those freely distributed bed nets? Who owns them? Whose houses are sprayed or not? These questions reflect concerns about social justice and fairness, and have so far not systematically been investigated. In this paper, household survey data were used to evaluate the socio-economic related dimension of inequalities in malaria prevention interventions (LLIN and IRS) in a district in south-central Ethiopia. Therefore, the hypothesis is that the poor families are equally likely to own the LLINs and to live in a house treated with IRS compared with better-offs.
MethodsStudy area and participantsThis study is part of a large cluster randomized con-trolled trial, which aim to evaluate the combined use of LLINs and IRS against each intervention alone in pre-venting malarial infection [25]. This study uses data from a baseline household survey conducted in July–August 2014 in Adami Tullu district of Oromia region in south-central Ethiopia. The survey was conducted in 13 vil-lages, located within 5 km from the shore of Lake Ziway. Overall, 31,284 individuals from 6069 households were included.

Page 3 of 11Hailu et al. Malar J (2016) 15:366
The district is situated in the heart of the Great Rift Valley. Most of the villages are located in the lowland portion, while the elevation ranges from low altitude of 1500 m to higher altitude of 2300 m above sea level. The area is partly dry and arid, where malaria is largely sea-sonal, and partly swampy and marshy, where malaria is largely perennial.
Data collectionThe data were obtained from the head of the household by trained nurses who performed face-to-face interviews using a pre-tested structured questionnaire. The ques-tionnaire contains information about socioeconomic position, including questions about demographic situa-tion, ownership of different household assets, ownership and utilization of malaria prevention services, and gen-eral health service utilization.
Data analysis and model specificationsMeasuring socioeconomic statusThe two recommended ways to consider for measuring socioeconomic status is to use consumption expenditure levels of the households and to use asset based wealth index. Nonetheless, consumption expenditure measure-ment in the present situation would have been likely to be unreliable, since most people base their livelihood on subsistence farming for own consumption, so that the market value of much of the produced is never real-ized [26]. For this reason, principal components analysis (PCA) was used to construct a wealth index based on household characteristics: such as, availability of various household assets, housing conditions, water source, and type of latrine facility. An equation provided by Filmer and Pritchett [27] was used to calculate the wealth index (A), for individual i, defined as follows:
where, aik is the value of household characteristics or k for household i (i.e. 0 = if the household didn’t own that specific characteristics; 1 = if the household own that characteristics), a k is the sample mean, sk is the sample standard deviation, and fk are the weights (eigenvectors) extracted from the first principal component which are correlation matrix of the data [26, 27].
Measuring LLIN ownership and IRS statusThe primary health outcome variables are household level LLIN ownership and IRS status. LLIN ownership and IRS with insecticide were defined as “the household owns at least one functional LLIN” and “the house is sprayed within the last 12 months”, respectively. LLIN ownership
Ai =
∑
k
[
fk(aik − ak)
sk
]
was measured by direct observation by the data collec-tors while IRS status was assessed based on what the household head reported. A binary logit regression model was employed in order to predict the probability of LLIN ownership and IRS status of the households. The unit of analysis in this study is at household level.
Measuring inequalityThe main measures of inequality is the concentration curve and concentration index (CI) [28]. The concentra-tion curve plots the cumulative percentage of the health variable (LLIN and IRS ownership) on the y-axis against the cumulative percentage of the population on x-axis, ranked by wealth index beginning with the poorest, and ending with the least poor (richest). If everyone irrespec-tive of the wealth status has exactly the same value of the prevention measures, then the concentration curve will be a straight diagonal line, from the bottom left corner to the top right corner. Besides visual inspection of the concentration curve, a dominance test using the multiple comparison approach was applied to examine for statisti-cal significance of the difference between the concentra-tion curve and the line of equality (diagonal).
A concentration index is a relative measure of inequal-ity. A CI ranges from –1 to 1, with a value of 0 indicat-ing perfect equity. The index takes a negative value when the variable of interest is concentrated among the poor-est groups and a positive value when it is concentrated among the richest group [28, 29]. The conventional con-centration index (CI) is a covariance between LLIN own-ership/IRS treatment (yi) and the socioeconomic rank (Ri) of that household, multiplied by two, and then the whole expression divided by the mean of the outcome variable (μ).
However, the health outcome variables (LLIN owner-ship and IRS) were binary in which case a normalized concentration index is preferred over the conventional CI. “Erreygers normalized concentration index” was employed, which is provided by Erreygers and Van Ourti [30] as follows;
where, CI(
y)
is the generalized concentration index and μ is the mean (in this case proportion of LLIN ownership or IRS coverage).
Decomposition analysisWagstaff et al. proved that concentration index are decomposable into its contributing factors [31]. They showed that, for each factor, its contribution is the
CI(y) =2 ∗ cov
(
yi,Ri
)
µ
CCI = 4 ∗ µ ∗ CI(y)

Page 4 of 11Hailu et al. Malar J (2016) 15:366
product of the sensitivity of the outcome variable with respect to that factor and the degree of socioeconomic status inequality in that factor. They provide a linear additive regression model for outcome variable y, against to a set of k determinants, xk, as follows:
Then concentration index for y (i.e. Concentration index of LLIN) (CIy) can be written as:
where xk is the mean value of the determinant xk, μ is the mean of the outcome variables (LLIN), Ck is the concen-tration index of the determinant xk; GCε is the residual component that captures wealth-related inequality in LLIN that is not accounted for by systematic variation in determinants across wealth groups, and
(
Bkxkµ
)
is the impact of each determinant on the probability of LLIN ownership and represents the elasticity (ηk) of the out-come variable with respect to the determinant xk evalu-ated at the mean y. In this paper, this decomposition technique was used to estimate, and compare the con-tribution of socioeconomic effects to that of education, religion, ethnicity, household size, place of residence (village), housing conditions, access to infrastructure (electricity and piped water), ownership and access to mass-media and telecommunication service (radio, tel-evision, mobile telephone). All analyses were conducted using STATA version 14 [32].
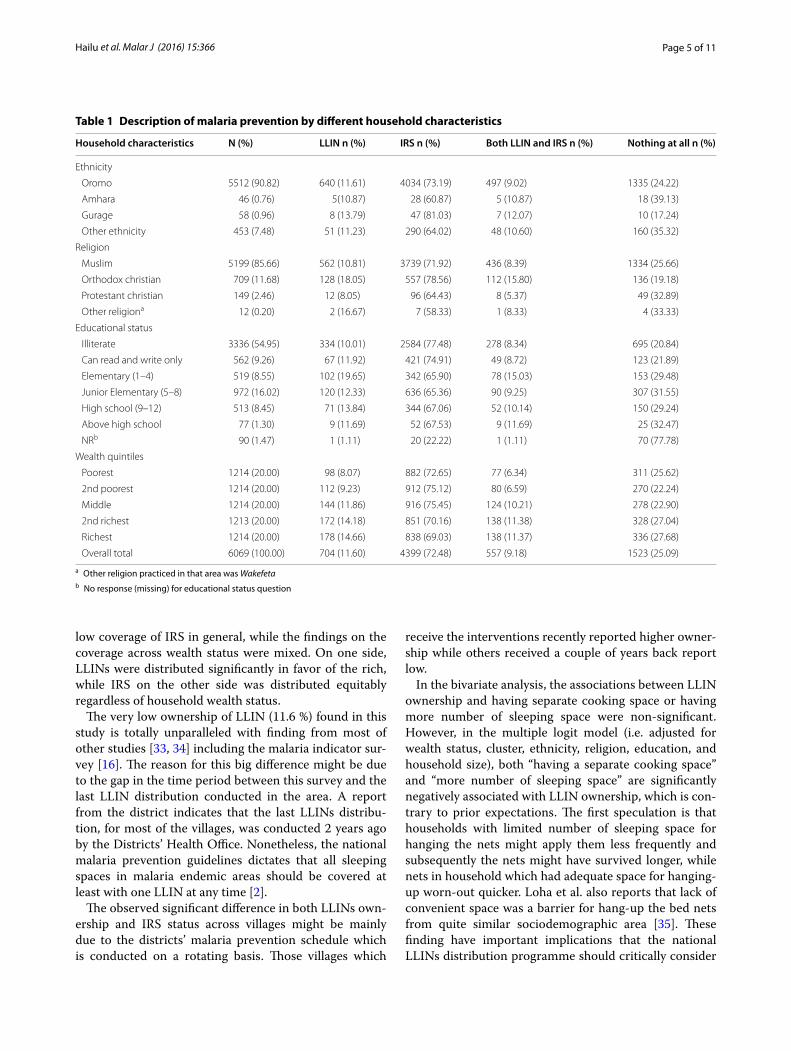
ResultsCharacteristics of the study populationTable 1 shows a summary of the study participants and distribution of LLINs and IRS among households clas-sified into different socioeconomic and demographic groups. A total of 6069 households were enrolled into the study. The mean household size was 5.1 (range from 1 to 14). The majority of the study participants were Oromo (5512, 91 %), muslim (5199, 86 %) and illiterate (3335, 55 %).
LLIN ownership and IRS coverageThe overall LLIN ownership was 704 (11.6 %), ranging from 98 (8.0 %) in the poorest quintile to 178 (14.7 %) in the richest quintile. Regarding IRS, about three quarters of the houses were sprayed in the last 12 months. A quar-ter of households had neither own any LLIN nor their house was sprayed, whereas 557 (9.2 %) of the house-holds owned LLIN meanwhile their house is sprayed in the last 12 months.
y = α +
∑
k
Bkxk + ε
CIy =∑
k
(
Bkxk
µ
)
Ck +
(
GCε
µ
)
The binary logit model for LLIN ownership show that households wealth status, larger household size, hav-ing a latrine, and having a radio were significantly posi-tively associated with LLIN ownership, where as having a separate cooking space from the main room and hav-ing a larger number of sleeping spaces, were significantly and negatively associate with household LLIN ownership (Table 2). Similarly, the logit model for the IRS shows that educational status of head of the household was sig-nificantly associated with the probability of having IRS (Table 3).
Equity in LLIN and IRS ownershipThe concentration curve for LLIN is clearly below the diagonal line (Fig. 1a), indicating a pro-rich distribution. The dominance test based on the multiple comparison approach indicates that the concentration curve is sig-nificantly below the line of equality at 19 evenly spaced points. Similarly, the Erreygers normalized concentration index of 0.06270 (SE = 0.03898) was significantly differ-ent from zero (P < 0.0001) (Table 4).
On the other hand, the concentration curve for IRS is closely aligned with the diagonal line (Fig. 1b), indicat-ing that there was no noticeable difference in houses sprayed according to different socioeconomic status. The Erreygers normalized concentration index of −0.03834 (SE = 0.01139) for the IRS was not significantly different from zero.
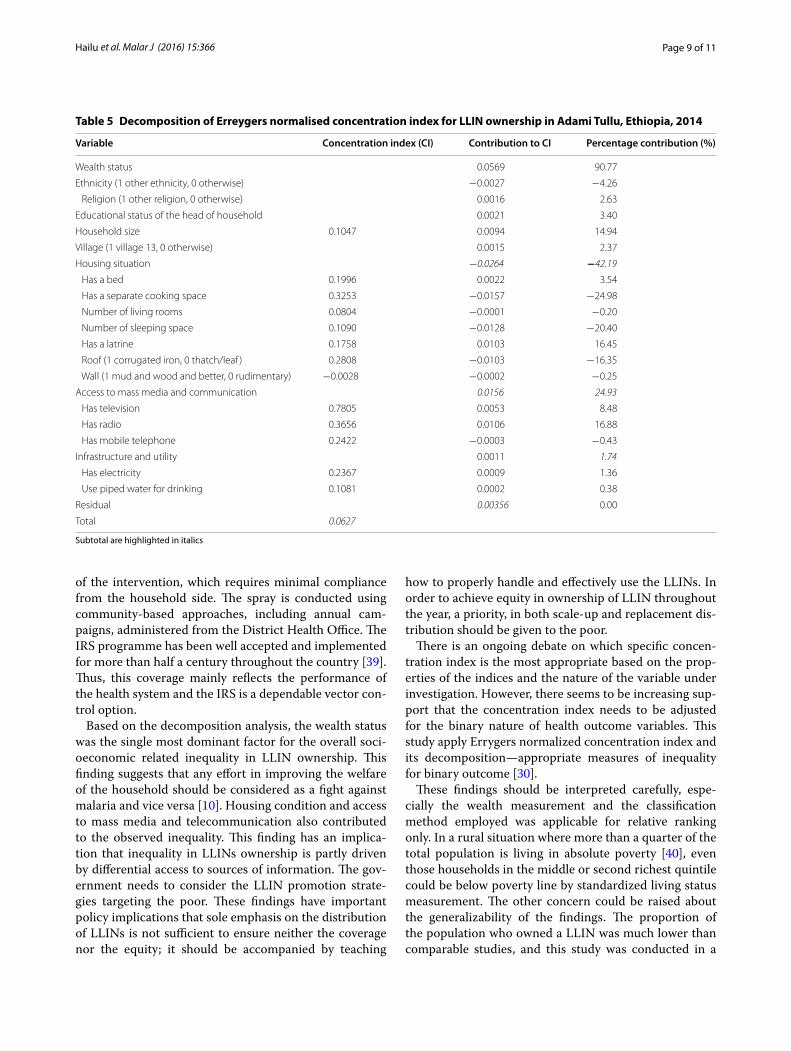
The decomposition analysis shows that inequality in ownership of LLIN is largely driven by the wealth itself (90.77 %), whereas ethnicity (4.25 %), religion (2.63 %) and educational status (3.4 %) of the head of the house-hold had little influence on inequality. Difference in housing situation, access to mass media and telecommu-nication, and household size, were also found to be pre-dominantly contributing for the inequality. The positive or negative sign of the CI or the percentage contribution in Table 5 demonstrates that the factor was concentrated among rich or poor household respectively. For example, higher educational attainment, larger household size, those who have bed and latrine, as reported in Table 5, are concentrated among the richest households. The per-centage contribution of wealth is an estimate of the pure effect of wealth on the total inequality, adjusting for other relevant factors.
DiscussionThis study is the first to provide empirical evidence about socioeconomic inequalities in malaria prevention inter-ventions from a district in Ethiopia. This study tries to evaluate the household level coverage and equity dimen-sion of LLIN ownership and IRS status. The main finding from this study indicates very low ownership of LLIN and
Page 5 of 11Hailu et al. Malar J (2016) 15:366
low coverage of IRS in general, while the findings on the coverage across wealth status were mixed. On one side, LLINs were distributed significantly in favor of the rich, while IRS on the other side was distributed equitably regardless of household wealth status.
The very low ownership of LLIN (11.6 %) found in this study is totally unparalleled with finding from most of other studies [33, 34] including the malaria indicator sur-vey [16]. The reason for this big difference might be due to the gap in the time period between this survey and the last LLIN distribution conducted in the area. A report from the district indicates that the last LLINs distribu-tion, for most of the villages, was conducted 2 years ago by the Districts’ Health Office. Nonetheless, the national malaria prevention guidelines dictates that all sleeping spaces in malaria endemic areas should be covered at least with one LLIN at any time [2].
The observed significant difference in both LLINs own-ership and IRS status across villages might be mainly due to the districts’ malaria prevention schedule which is conducted on a rotating basis. Those villages which
receive the interventions recently reported higher owner-ship while others received a couple of years back report low.
In the bivariate analysis, the associations between LLIN ownership and having separate cooking space or having more number of sleeping space were non-significant. However, in the multiple logit model (i.e. adjusted for wealth status, cluster, ethnicity, religion, education, and household size), both “having a separate cooking space” and “more number of sleeping space” are significantly negatively associated with LLIN ownership, which is con-trary to prior expectations. The first speculation is that households with limited number of sleeping space for hanging the nets might apply them less frequently and subsequently the nets might have survived longer, while nets in household which had adequate space for hanging-up worn-out quicker. Loha et al. also reports that lack of convenient space was a barrier for hang-up the bed nets from quite similar sociodemographic area [35]. These finding have important implications that the national LLINs distribution programme should critically consider
Table 1 Description of malaria prevention by different household characteristics
a Other religion practiced in that area was Wakefetab No response (missing) for educational status question
Household characteristics N (%) LLIN n (%) IRS n (%) Both LLIN and IRS n (%) Nothing at all n (%)
Ethnicity
Oromo 5512 (90.82) 640 (11.61) 4034 (73.19) 497 (9.02) 1335 (24.22)
Amhara 46 (0.76) 5(10.87) 28 (60.87) 5 (10.87) 18 (39.13)
Gurage 58 (0.96) 8 (13.79) 47 (81.03) 7 (12.07) 10 (17.24)
Other ethnicity 453 (7.48) 51 (11.23) 290 (64.02) 48 (10.60) 160 (35.32)
Religion
Muslim 5199 (85.66) 562 (10.81) 3739 (71.92) 436 (8.39) 1334 (25.66)
Orthodox christian 709 (11.68) 128 (18.05) 557 (78.56) 112 (15.80) 136 (19.18)
Protestant christian 149 (2.46) 12 (8.05) 96 (64.43) 8 (5.37) 49 (32.89)
Other religiona 12 (0.20) 2 (16.67) 7 (58.33) 1 (8.33) 4 (33.33)
Educational status
Illiterate 3336 (54.95) 334 (10.01) 2584 (77.48) 278 (8.34) 695 (20.84)
Can read and write only 562 (9.26) 67 (11.92) 421 (74.91) 49 (8.72) 123 (21.89)
Elementary (1–4) 519 (8.55) 102 (19.65) 342 (65.90) 78 (15.03) 153 (29.48)
Junior Elementary (5–8) 972 (16.02) 120 (12.33) 636 (65.36) 90 (9.25) 307 (31.55)
High school (9–12) 513 (8.45) 71 (13.84) 344 (67.06) 52 (10.14) 150 (29.24)
Above high school 77 (1.30) 9 (11.69) 52 (67.53) 9 (11.69) 25 (32.47)
NRb 90 (1.47) 1 (1.11) 20 (22.22) 1 (1.11) 70 (77.78)
Wealth quintiles
Poorest 1214 (20.00) 98 (8.07) 882 (72.65) 77 (6.34) 311 (25.62)
2nd poorest 1214 (20.00) 112 (9.23) 912 (75.12) 80 (6.59) 270 (22.24)
Middle 1214 (20.00) 144 (11.86) 916 (75.45) 124 (10.21) 278 (22.90)
2nd richest 1213 (20.00) 172 (14.18) 851 (70.16) 138 (11.38) 328 (27.04)
Richest 1214 (20.00) 178 (14.66) 838 (69.03) 138 (11.37) 336 (27.68)
Overall total 6069 (100.00) 704 (11.60) 4399 (72.48) 557 (9.18) 1523 (25.09)

Page 6 of 11Hailu et al. Malar J (2016) 15:366
Table 2 Logit model predicting the probability of LLIN ownership
Variable Coef. Robust SE P value [95 % Conf. interval]
Wealth status (ref. = reachest Q)
Poorest Q −0.8390 0.2541 0.001 −1.3370 −0.3410
Second poorest Q −0.6149 0.2152 0.004 −1.0367 −0.1931
Middle Q −0.3240 0.1748 0.064 −0.6666 0.0187
Second richest −0.1249 0.1501 0.405 −0.4190 0.1693
Ethnicity (ref. = other ethnicity)
Oromo −0.4490 0.2419 0.063 −0.9232 0.0251
Amhara −0.3835 0.5992 0.522 −1.5580 0.7909
Gurage 0.6176 0.4832 0.201 −0.3294 1.5646
Religion (ref. = other religion)
Orthodox 0.3698 0.7026 0.599 −1.0072 1.7468
Muslim 0.1984 0.7006 0.777 −1.1747 1.5715
Protestant −0.1818 0.7495 0.808 −1.6508 1.2873
Education (ref. = above high school)
Illiterate 0.3061 0.3550 0.388 −0.3896 1.0019
Can read and write only 0.4762 0.3534 0.178 −0.2163 1.1688
Elementary (1 − 4) 0.7490 0.3633 0.039 0.0369 1.4612
Junior Elementary (5 − 8) 0.3550 0.3786 0.348 −0.3871 1.0971
High School (9 − 12) 0.5916 0.3955 0.135 −0.1835 1.3667
Household size 0.0556 0.0261 0.033 0.0044 0.1068
Villages (ref. = Kebele #13)
Kebele1 2.3848 0.4098 0.000 1.5815 3.1881
Kebele2 4.7088 0.4908 0.000 3.7468 5.6707
Kebele3 1.5564 0.3727 0.000 0.8260 2.2868
Kebele4 1.9868 0.3083 0.000 1.3826 2.5910
Kebele5 0.5895 0.4206 0.161 −0.2348 1.4137
Kebele6 −0.5098 0.8708 0.558 −2.2165 1.1968
Kebele7 0.7979 0.5923 0.178 −0.3629 1.9587
Kebele8 −1.6184 1.0035 0.107 −3.5852 0.3484
Kebele9 −0.5220 0.4334 0.228 −1.3714 0.3275
Kebele10 1.6388 0.3679 0.000 0.9176 2.3600
Kebele11 0.9948 0.4361 0.023 0.1402 1.8495
Kebele12 1.7502 0.3978 0.000 0.9705 2.5299
Housing
Has a bed 0.0791 0.1433 0.581 −0.2018 0.3599
Has a separate cooking space −0.3018 0.1148 0.009 −0.5269 −0.0768
Number of living rooms 0.0579 0.1010 0.566 −0.1400 0.2558
Number of sleeping space −0.2148 0.0769 0.005 −0.3656 −0.0641
Has a latrine 0.3659 0.1145 0.001 0.1414 0.5904
Roof (1 corrugated iron, 0 thatch/leaf ) −0.2038 0.1322 0.123 −0.4629 0.0553
Wall(1 mud &wood and better, 0 rudimentary) 0.2154 0.3255 0.508 −0.4226 0.8535
Communication access
Has television 0.2903 0.1897 0.126 −0.0814 0.6620
Has radio 0.2446 0.0995 0.014 0.0495 0.4397
Has mobile telephone 0.0059 0.1294 0.964 −0.2478 0.2595
Infrastructure and utility
Has electricity 0.0295 0.1829 0.872 −0.3290 0.3880
Use piped water for drinking 0.0191 0.1695 0.910 −0.3132 0.3514
_Constant −3.6198 0.9835 0.000 −5.5475 −1.6921

Page 7 of 11Hailu et al. Malar J (2016) 15:366
Table 3 Logit model predicting the probability of IRS status of the household
Variable Coef. Robust SE P value [95 % Conf. interval]
Wealth status (ref. = reachest Q)
Poorest Q −0.7766 0.3046 0.0110 −1.3737 −0.1795
Second poorest Q −0.6166 0.2203 0.0050 −1.0483 −0.1849
Middle Q −0.4146 0.1786 0.0200 −0.7647 −0.0645
Second richest −0.4790 0.1380 0.0010 −0.7495 −0.2085
Ethnicity (ref. = other ethnicity)
Oromo −0.5795 0.1772 0.0010 −0.9269 −0.2322
Amhara −0.5909 0.3829 0.1230 −1.3414 0.1596
Gurage 0.8654 0.3414 0.0110 0.1963 1.5345
Religion (ref. = other religion)
Orthodox 0.2692 0.5776 0.6410 −0.8629 1.4013
Muslim 0.0498 0.5325 0.9250 −0.9938 1.0935
Protestant −0.0749 0.5819 0.8980 −1.2154 1.0656
Education (ref. = above high school)
Illiterate 1.2899 0.3798 0.0010 0.5454 2.0344
Can read and write only 1.1435 0.3658 0.0020 0.4265 1.8605
Elementary (1−4) 1.1823 0.4136 0.0040 0.3717 1.9929
Junior elementary (5−8) 1.1041 0.3995 0.0060 0.3210 1.8872
High school (9−12) 1.0489 0.4004 0.0090 0.2641 1.8336
Household size 0.0331 0.0195 0.0890 −0.0050 0.0712
Villages (ref. = Kebele #13)
Kebele1 −0.1902 0.4541 0.6750 −1.0802 0.6998
Kebele2 −1.8311 0.5471 0.0010 −2.9035 −0.7588
Kebele3 0.8239 0.4677 0.0780 −0.0927 1.7405
Kebele4 2.9881 0.6129 0.0000 1.7869 4.1894
Kebele5 −0.9067 0.3628 0.0120 −1.6178 −0.1956
Kebele6 −0.6001 0.8312 0.4700 −2.2291 1.0289
Kebele7 2.3747 0.4985 0.0000 1.3977 3.3516
Kebele8 −6.1193 0.8757 0.0000 −7.8357 −4.4030
Kebele9 −2.1782 0.4496 0.0000 −3.0595 −1.2970
Kebele10 −0.3213 0.4660 0.4910 −1.2347 0.5921
Kebele11 1.0652 0.4392 0.0150 0.2044 1.9260
Kebele12 −0.0950 0.4770 0.8420 −1.0300 0.8400
Housing
Has a bed 0.2100 0.1189 0.0770 −0.0231 0.4431
Has a separate cooking space −0.0274 0.1247 0.8260 −0.2718 0.2169
Number of living rooms −0.0380 0.1217 0.7550 −0.2764 0.2005
Number of sleeping space −0.0574 0.0949 0.5450 −0.2434 0.1287
Has a latrine −0.3592 0.1077 0.0010 −0.5703 −0.1481
Roof (1 corrugated iron, 0 thatch/leaf ) −0.3412 0.1275 0.0070 −0.5912 −0.0913
Wall (1 mud and wood and better, 0 rudimentary) −0.2931 0.2303 0.2030 −0.7445 0.1583
Communication access
Has television 0.0543 0.2082 0.7940 −0.3538 0.4624
Has radio 0.1525 0.1001 0.1270 −0.0436 0.3487
Has mobile telephone 0.0499 0.0990 0.6140 −0.1441 0.2440
Infrastructure and utility
Has electricity −0.5746 0.1847 0.0020 −0.9366 −0.2126
Use piped water for drinking −0.6268 0.2007 0.0020 −1.0201 −0.2335
_Constant 2.0583 0.8134 0.0110 0.4642 3.6525

Page 8 of 11Hailu et al. Malar J (2016) 15:366
number of sleeping space in addition to household size based allotment of the nets for optimizing the efficiency of available LLINs. Moreover, the relationship between LLIN ownership, number of sleeping spaces and useful life time of the LLIN is not sufficiently well understood, which warrants more research.
LLINs are significantly more likely to be owned by the rich, even when analyses are adjusted for village. In a situation where the coverage is low and the inequality in ownership is high, an empirical study [36] and a math-ematical model [37] highlight that community wide pro-tection of the LLINs could be diminished. The uses of LLINs decrease probability of bites of mosquitoes for the
ultimate users without significantly decreasing the popu-lation of mosquito. Consequently, the potential advan-tage of the ‘positive externality’ to those who could not own by themselves might be nullified.
Various studies from sub-Saharan Africa consistently report the cost as a main barrier to ownership of LLIN among the poorest households [38]. In this study area, LLINs were distributed free of charge, and the cost argu-ment is, therefore, less apparent. Several questions need consideration to better understand the causalities. From the demand side—one may ask whether the poor are reluctant to collect their share from the health posts? Are the poor unable to avail themselves on the dates and place of distribution? Did the LLINs in the poor-est households wear out faster and got lost because of improper handling? Do the poor sell the LLINs received? The current study didn’t investigate these matters. How-ever, in the field site stay, the authors frequently observed that several of LLINs were used for other purposes, such as collecting crops and vegetables in the farm, for fenc-ing or as a fishing net). As a consequence, it could be that the “useful life” of the LLINs differs between the socio-economic strata.
In contrast, the equitable distribution of the IRS between socio-economic strata is surely a notable achievement and might be partly driven by the nature
0.2
.4.6
.81
Cum
ulat
ive
shar
e of
LLI
N
0 .2 .4 .6 .8 1
Cumulative share of households ranked (poor-->rich)
0.2
.4.6
.81
Cum
ulat
ive
shar
e of
hou
ses
spra
yed
last
12
mon
ths
(IRS
)
0 .2 .4 .6 .8 1
Cumulative share of households ranked (poor-->rich)
a b
Fig. 1 Concentrations curves for LLIN ownership (a), IRS in the last 12 months (b)
Table 4 Erreygers normalised and generalized concentra-tion indices for LLIN and IRS distribution
Significant at 0.001**, 0.01* level of significance
Concentration Index (CI) Malaria prevention programs
LLIN IRS
Erreygers normalised CI 0.06270** −0.03834
Generalized CI 0.13495** −0.01323
95 % confidence interval (0.09526, 0.17465)** (−0.02232, −0.00413)*
Standard error (delta method)
0.03898 0.01139
Page 9 of 11Hailu et al. Malar J (2016) 15:366
of the intervention, which requires minimal compliance from the household side. The spray is conducted using community-based approaches, including annual cam-paigns, administered from the District Health Office. The IRS programme has been well accepted and implemented for more than half a century throughout the country [39]. Thus, this coverage mainly reflects the performance of the health system and the IRS is a dependable vector con-trol option.
Based on the decomposition analysis, the wealth status was the single most dominant factor for the overall soci-oeconomic related inequality in LLIN ownership. This finding suggests that any effort in improving the welfare of the household should be considered as a fight against malaria and vice versa [10]. Housing condition and access to mass media and telecommunication also contributed to the observed inequality. This finding has an implica-tion that inequality in LLINs ownership is partly driven by differential access to sources of information. The gov-ernment needs to consider the LLIN promotion strate-gies targeting the poor. These findings have important policy implications that sole emphasis on the distribution of LLINs is not sufficient to ensure neither the coverage nor the equity; it should be accompanied by teaching
how to properly handle and effectively use the LLINs. In order to achieve equity in ownership of LLIN throughout the year, a priority, in both scale-up and replacement dis-tribution should be given to the poor.
There is an ongoing debate on which specific concen-tration index is the most appropriate based on the prop-erties of the indices and the nature of the variable under investigation. However, there seems to be increasing sup-port that the concentration index needs to be adjusted for the binary nature of health outcome variables. This study apply Errygers normalized concentration index and its decomposition—appropriate measures of inequality for binary outcome [30].
These findings should be interpreted carefully, espe-cially the wealth measurement and the classification method employed was applicable for relative ranking only. In a rural situation where more than a quarter of the total population is living in absolute poverty [40], even those households in the middle or second richest quintile could be below poverty line by standardized living status measurement. The other concern could be raised about the generalizability of the findings. The proportion of the population who owned a LLIN was much lower than comparable studies, and this study was conducted in a
Table 5 Decomposition of Erreygers normalised concentration index for LLIN ownership in Adami Tullu, Ethiopia, 2014
Subtotal are highlighted in italics
Variable Concentration index (CI) Contribution to CI Percentage contribution (%)
Wealth status 0.0569 90.77
Ethnicity (1 other ethnicity, 0 otherwise) −0.0027 −4.26
Religion (1 other religion, 0 otherwise) 0.0016 2.63
Educational status of the head of household 0.0021 3.40
Household size 0.1047 0.0094 14.94
Village (1 village 13, 0 otherwise) 0.0015 2.37
Housing situation −0.0264 −42.19
Has a bed 0.1996 0.0022 3.54
Has a separate cooking space 0.3253 −0.0157 −24.98
Number of living rooms 0.0804 −0.0001 −0.20
Number of sleeping space 0.1090 −0.0128 −20.40
Has a latrine 0.1758 0.0103 16.45
Roof (1 corrugated iron, 0 thatch/leaf ) 0.2808 −0.0103 −16.35
Wall (1 mud and wood and better, 0 rudimentary) −0.0028 −0.0002 −0.25
Access to mass media and communication 0.0156 24.93
Has television 0.7805 0.0053 8.48
Has radio 0.3656 0.0106 16.88
Has mobile telephone 0.2422 −0.0003 −0.43
Infrastructure and utility 0.0011 1.74
Has electricity 0.2367 0.0009 1.36
Use piped water for drinking 0.1081 0.0002 0.38
Residual 0.00356 0.00
Total 0.0627

Page 10 of 11Hailu et al. Malar J (2016) 15:366
single district. This study may not be a full representative of the malaria situation of a rural Ethiopia.
A third limitation to this study is that it only focuses on horizontal equity. Socioeconomic related inequalities in health services are only considered unfair, when they do not correspond to differences in need for health care across socioeconomic groups. In other way, horizontal equity means that households in equal need for the ser-vice should receive equal service irrespective of other characteristics such as wealth status, ethnicity, religion or geographical location. On the other side, vertical equity describes the extent to which households with greater needs received more service [29]. For example:, house-holds which are located more close to the mosquito breeding site might have higher LLIN need while this study did not consider standardization based on differ-ence in need.
ConclusionThe ownership of LLIN is significantly pro-rich, while IRS status is equitable across socio-economic strata. The distribution campaign should be followed by periodic refill based on continuous monitoring data. Local data on ‘useful life’ of LLIN and tracking information should be ready for timely planning of LLIN distribution.
AbbreviationsCI: concentration index; DALY: disability adjusted life year; DHS: demographic and heath survey; ICER: incremental cost effectiveness ratio; IRB: institutional review board; IRB: institutional review board; IRS: indoor residual spraying; ITN: insecticide treated net; ITN: insecticide treated net; LLIN: long-lasting insecti-cidal net; MIS: malaria indicator survey; MoH: Ministry of Health; PCA: principal components analysis; SE: standard error; WHO: World Health Organization.
Authors’ contributionsAll authors (AH, BR, WD, TG, EL and BL) substantially participated in the con-ception of the research idea and design of data collection tools. AH, BR, WD, EL and BL have done interpretation of the result and write-up of this manuscript. AH and TG coordinated and supervised the data collection. Analysis of the data was done by AH and BR. The initial draft manuscript was prepared by AH. All authors read and approved the final manuscript.
Author details1 Center for International Health, University of Bergen, Bergen, Norway. 2 Department of Reproductive Health and Health Service Management, School of Public Health, Addis Ababa University, P.O. Box 9086, Addis Ababa, Ethiopia. 3 Department of Preventive Medicine, School of Public Health, Addis Ababa University, Addis Ababa, Ethiopia. 4 School of Public and Environmen-tal Health, Hawassa University, Hawassa, Ethiopia. 5 Center for Intervention Science in Maternal and Child Health (CISMAC), University of Bergen, Bergen, Norway.
AcknowledgementsThe authors acknowledge the Center for International Health at the University of Bergen in Norway, and Addis Ababa and Hawassa Universities in Ethiopia for all the support we received to this research. We acknowledge the contribu-tions of the Oromia Regional Health Bureau, East Shewa Zone Health Depart-ment and the Adami Tullu District Health Office for their administrative and logistic support. We are grateful for the community, field staff, and health care workers who participate in this study.
Competing interestsThe authors declare that they have no competing interests.
Availability of data and materialThis study is part of an ongoing randomized controlled cluster trial (MalTrials). The full data will be publicly availed when the trial is complete.
Consent to publicationThe data were collected after taking informed consent (including consent for publication) from the participants.
Ethical approvalThe study was approved by the Institutional Review Board (IRB) of the College of Health Sciences at Addis Ababa University, the Ministry of Science and Technology in Ethiopia (ref: 3.10/446/06) and the Regional Committee for Medical and Health Research Ethics, Western Norway (ref: 2013/986/REK Vest). Participation in the study was voluntary and informed consent was obtained from each participant.
FundingThis study has been funded by the Research Council of Norway (Project Number: 220554).
Received: 6 March 2016 Accepted: 5 July 2016
References 1. World Health Organization. World malaria report 2014. Geneva: World
Health Organization; 2014. 2. MoH. National malaria programme monitoring and evaluation plan
2014–2020. Addis Ababa: Federal Democratic Republic of Ethiopia Minis-try of Health; 2014.
3. WHO. World malaria report 2013. Geneva: World Health Organization; 2013.
4. WHO. World malaria report 2015. Geneva: World Health Organization; 2015.
5. Olana D, Chibsa S, Teshome D, Mekasha A, Graves PM, Reithinger R. Malaria, Oromia regional state, Ethiopia, 2001–2006. Emerg Infect Dis. 2011;17:1336–7.
6. Bekele D, Belyhun Y, Petros B, Deressa W. Assessment of the effect of insecticide-treated nets and indoor residual spraying for malaria control in three rural kebeles of Adami Tulu District, South Central Ethiopia. Malar J. 2012;11:127.
7. Gari T, Kenea O, Loha E, Deressa W, Hailu A, Balkew M, et al. Malaria incidence and entomological findings in an area targeted for a cluster-randomized controlled trial to prevent malaria in Ethiopia: results from a pilot study. Malar J. 2016;15:145.
8. Ghebreyesus T, Deressa W, Witten KH, Getachew A, Seboxa T. Malaria. In: Berhane Y, Haile-Mariam D, Kloos H, editors. Epidemiology and ecology of health and disease in Ethiopia. 1st ed. Addis Ababa: Shama PLC; 2006. p. 556–76.
9. Gallup JL, Sachs J. The economic burden of malaria. Centre for interna-tional development at Harvard. Am J Trop Med Hyg. 2001;64:85–96.
10. Sachs J, Malaney P. The economic and social burden of malaria. Nature. 2002;415:680–5.
11. White MT, Conteh L, Cibulskis R, Ghani AC. Costs and cost-effectiveness of malaria control interventions—a systematic review. Malar J. 2011;10:337.
12. Flaxman AD, Fullman N, Otten MW Jr, Menon M, Cibulskis RE, Ng M, et al. Rapid scaling up of insecticide-treated bed net coverage in Africa and its relationship with development assistance for health: a systematic synthesis of supply, distribution, and household survey data. PLoS Med. 2010;7:e1000328.
13. CSA & ORC Macro. Ethiopia demographic and health survey 2005. Addis Ababa and Calverton: Central Statistical Agency and ORC Macro; 2006.
14. Jima D, Getachew A, Bilak H, Steketee RW, Emerson PM, Graves PM, et al. Malaria indicator survey 2007, Ethiopia: coverage and use of major malaria prevention and control interventions. Malar J. 2010;9:58.

Page 11 of 11Hailu et al. Malar J (2016) 15:366
• We accept pre-submission inquiries
• Our selector tool helps you to find the most relevant journal
• We provide round the clock customer support
• Convenient online submission
• Thorough peer review
• Inclusion in PubMed and all major indexing services
• Maximum visibility for your research
Submit your manuscript atwww.biomedcentral.com/submit
Submit your next manuscript to BioMed Central and we will help you at every step:
15. CSA & ORC Macro. Ethiopia demographic and health survey 2011. Addis Ababa and Calverton: Central Statistical Agency and ORC Macro; 2011.
16. MoH. Ethiopia national malaria indicator survey 2011. Addis Ababa: Federal Democratic Republic of Ethiopia Ministry of Health; 2012.
17. PMI. Ethiopia malaria operational plan FY 2015. Addis Ababa: President’s Malaria Initiative USAID; 2015.
18. Heggenhougen HK, Hackethal V, Vivek P. The behavioural and social aspects of malaria and its control: an introduction and annotated bibliog-raphy. Geneva: World Health Organization; 2003. p. 147–52.
19. Worrall E, Basu S, Hanson K. Is malaria a disease of poverty? A review of the literature. Trop Med Int Health. 2005;10:1047–59.
20. Filmer D. Fever and its treatment among the more and less poor in sub-Saharan Africa. Health Policy Plan. 2005;20:337–46.
21. Ministry of Health. Health sector transformation plan 2008–2012 EFY. Addis Ababa: Federal Democratic Republic of Ethiopia Ministry of Health; 2015.
22. Cookson R, Drummond M, Weatherly H. Explicit incorporation of equity considerations into economic evaluation of public health interventions. Health Econ Policy Law. 2009;4:231–45.
23. Onwujekwe O, el Malik F, Mustafa SH, Mnzavaa A. Do malaria preventive interventions reach the poor? Socioeconomic inequities in expendi-ture on and use of mosquito control tools in Sudan. Health Policy Plan. 2006;21:10–6.
24. Barat LM, Palmer N, Basu S, Worrall E, Hanson K, Mills A. Do malaria control interventions reach the poor? A view through the equity lens. Am J Trop Med Hyg. 2004;71:174–8.
25. Deressa W, Loha E, Balkew M, Hailu A, Gari T, Kenea O, et al. Combining long-lasting insecticidal nets and indoor residual spraying for malaria prevention in Ethiopia: study protocol for a cluster randomized controlled trial. Trials. 2016;17:20.
26. Vyas S, Kumaranayake L. Constructing socio-economic status indi-ces: how to use principal components analysis. Health Policy Plan. 2006;21:459–68.
27. Filmer D, Pritchett LH. Estimating wealth effects without expenditure data—or tears: an application to educational enrollments in states of India. Demography. 2001;38:115–32.
28. Wagstaff A, Paci P, van Doorslaer E. On the measurement of inequalities in health. Soc Sci Med. 1991;33:545–57.
29. O’Donnell O. Analyzing health equity using household survey data a guide to techniques and their implementation. Washington: World Bank; 2008.
30. Erreygers G. Correcting the concentration index. J Health Econ. 2009;28:504–5.
31. Wagstaff A, Watanabe N, Doorslaer E. On decomposing the causes of health sector inequalities with an application to malnutrition inequalities in Vietnam. Washington: World Bank; 2001.
32. StataCorp. Stata statistical software: release 14. College Station: StataCorp LP; 2015.
33. Woyessa A, Deressa W, Ali A, Lindtjorn B. Ownership and use of long-last-ing insecticidal nets for malaria prevention in Butajira area, south-central Ethiopia: complex samples data analysis. BMC Public Health. 2014;14:99.
34. Teklemariam Z, Awoke A, Dessie Y, Weldegebreal F. Ownership and utiliza-tion of insecticide-treated nets (ITNs) for malaria control in Harari National Regional State Eastern Ethiopia. Pan Afr Med J. 2015;21:52.
35. Loha E, Tefera K, Lindtjorn B. Freely distributed bed-net use among Chano Mille residents, south Ethiopia: a longitudinal study. Malar J. 2013;12:23.
36. Hawley WA, Phillips-Howard PA, ter Kuile FO, Terlouw DJ, Vulule JM, Ombok M, et al. Community-wide effects of permethrin-treated bed nets on child mortality and malaria morbidity in western Kenya. Am J Trop Med Hyg. 2003;68:121–7.
37. Andrew D, Oladele A, Pieter S, Francis S. Preventive or curative treatment of malaria? Evidence from agricultural workers in Nigeria. Washington: International Food Policy Research Institute; 2012.
38. Singh M, Brown G, Rogerson SJ. Ownership and use of insecticide-treated nets during pregnancy in sub-Saharan Africa: a review. Malar J. 2013;12:268.
39. Ministry of Health. National malaria guidelines. Addis Ababa: Federal Democratic Republic of Ethiopia Ministry of Health; 2012.
40. World Bank. Ethiopia poverty assessment 2014. Washington: World Bank Group; 2015.