equity & debt strategy - kotak.com · us imposes tariff us hikes fed rate by 25 bps ... 12%...
TRANSCRIPT

Equity & Debt Strategy
Mid Apr – May’ 2018

Equity Market Update &
Equity MF Strategy

Confidential | 3
Equity markets corrected in Mar on global cues and selling pressure in Mutual Funds due to Dividend payouts
18,000
18,500
19,000
19,500
20,000
20,500
21,000
21,500
22,000
9,800
9,900
10,000
10,100
10,200
10,300
10,400
10,500
02-Mar-18 08-Mar-18 14-Mar-18 20-Mar-18 26-Mar-18 01-Apr-18
NIFTY Index Nsemcap index
US imposes tariff
US hikes Fed
rate by 25 bps
-6,663
13,254
-12,552
12,272
1,586
-7,131
1,651
-228
6,1827,540
16,257
4,973
-15,000
-10,000
-5,000
0
5,000
10,000
15,000
20,000
Dec 17 Jan 18 Feb 18 Mar 18
FII DII excl MF MF
Nifty 50 and Midcap 100 corrected by 3.6% and 4.6% in
March on global cues
FII selling was concentrated in Derivatives market, MF flow
was subdued
March net inflow was lower due to higher redemptions in
both Pure Equity and Balanced funds possibly due to
Dividend payouts
Source: Bloomberg, Kotak Institutional Equities (KIE)As of 5th Apr 2018
cr
Flows to Equity Mutual Funds fell significantly in Mar 2018
cr
22,52820,372 19,535
11,047
0
5,000
10,000
15,000
20,000
25,000
Dec 17 Jan 18 Feb 18 Mar 18
Net investment in Cash market
0
10,000
20,000
30,000
40,000
50,000
Dec 17 Jan 18 Feb 18 Mar 18
Pure Equity Inflow Balanced Inflow
Pure Equity Redemption Balanced Redemption
Confidential | 4
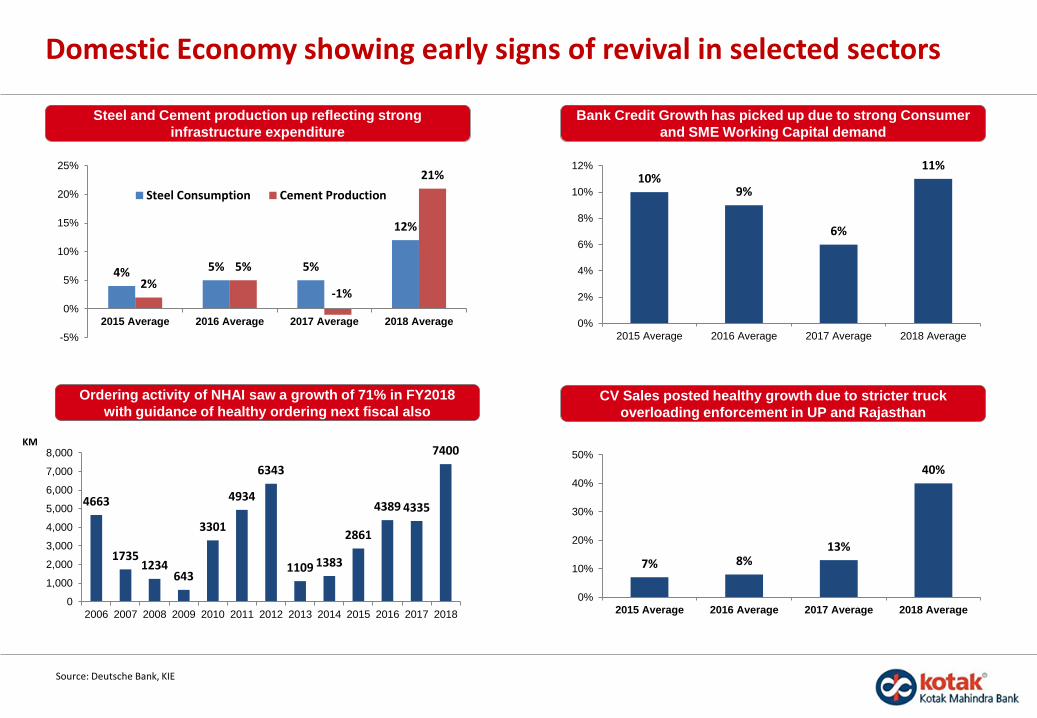
4% 5% 5%
12%
2%
5%
-1%
21%
-5%
0%
5%
10%
15%
20%
25%
2015 Average 2016 Average 2017 Average 2018 Average
Steel Consumption Cement Production
10%9%
6%
11%
0%
2%
4%
6%
8%
10%
12%
2015 Average 2016 Average 2017 Average 2018 Average
Steel and Cement production up reflecting strong
infrastructure expenditure
Bank Credit Growth has picked up due to strong Consumer
and SME Working Capital demand
Ordering activity of NHAI saw a growth of 71% in FY2018
with guidance of healthy ordering next fiscal alsoCV Sales posted healthy growth due to stricter truck
overloading enforcement in UP and Rajasthan
Source: Deutsche Bank, KIE
Domestic Economy showing early signs of revival in selected sectors
KM
7% 8%13%
40%
0%
10%
20%
30%
40%
50%
2015 Average 2016 Average 2017 Average 2018 Average
4663
17351234
643
3301
4934
6343
1109 1383
2861
4389 4335
7400
0
1,000
2,000
3,000
4,000
5,000
6,000
7,000
8,000
2006 2007 2008 2009 2010 2011 2012 2013 2014 2015 2016 2017 2018

Confidential | 5
However favorable Liquidity scenario could reverse in 2018
India has been receiving major inflows from passive GEM ETFs
which could reverse on negative sentiment over EM in trade
war environment
Libor – OIS spread, a measure of credit risk, is at highest level
in last decade due to US Tax reforms
QE Unwind program has resulted in asset drop of $74 billion
resulting in lowest level of “Fed Balance Sheet” since 2014
Source: DB,Bloomberg, CLSA
0%
10%
20%
30%
40%
50%
60%
70%
Jan14
Apr14
Jul14
Oct14
Jan15
Apr15
Jul15
Oct15
Jan16
Apr16
Jul16
Oct16
Jan17
Apr17
Jul17
Oct17
Jan18
FII will continue to play an important role as domestic liquidity
will be sucked by IPOs and disinvestments by Govt
2
9.25
4.756.5
8.5
1.52.5
2.527.5
Ne
t D
om
estic
Institu
iton
al
Flo
w
Oth
er
QIP
PS
U B
ank
QIPIP
Os
Dis
investm
ent
by G
ovt
Div
iden
ds
Paid
by M
F
Insura
nce N
et
Flo
w
EP
FO
, N
PS
an
d o
ther
ET
Fs
Do
me
stic M
FIn
flow
4,250,000
4,300,000
4,350,000
4,400,000
4,450,000
4,500,000
4,550,000
Jun
14
Au
g 1
4
Oct 14
Dec 1
4
Fe
b 1
5
Ap
r 15
Jun
15
Au
g 1
5
Oct 15
Dec 1
5
Fe
b 1
6
Ap
r 16
Jun
16
Au
g 1
6
Oct 16
Dec 1
6
Fe
b 1
7
Ap
r 17
Jun
17
Au
g 1
7
Oct 17
Dec 1
7
Fe
b 1
8
USD bn
11%
2% 2%
-1%
2%
-2%
0%
2%
4%
6%
8%
10%
12%
GEM ETFs Others GEM Non ETF India ETF India Non ETF
Inflow in last 6 Months/ AUM
$ Mn

Confidential | 6
Market still remain overvalued compared to historic valuations, EPS growth coming from Auto, Metals and Banking
Mid Cap Index premium over large cap has been maintained in the correction so far
Q4 2018 Sensex PAT (KIE) is expected to increase by 10% yoy backed by Auto, Consumer, Infra, Metals and NBFCs
Consensus Earnings expectation of FY 2019 has been relatively stable compared to previous Fiscals
Infra looks attractive in terms of valuation, >40% of incremental profit expected from Banks due to lower provisions
17.0 19.5
36.9
11.316.0
22.517.3 17.0
-
10.0
20.0
30.0
40.0
50.0
60.0
70.0
80.0
Au
to
Ban
kin
g
Co
nsu
mer
s
Ene
rgy
Infr
a
Ph
arm
a
Tech
Nif
ty 5
0
PE 2019E Average Earnings Growth FY19E
17.2
21.0
15.616.9
0.0
5.0
10.0
15.0
20.0
25.0
Large Cap Mid Cap
Current 12M Forward PE 5 Year Median
22% Premium vs 8% AverageBloomberg Estimate
400.00
450.00
500.00
550.00
600.00
650.00
700.00
Apr 15Jul 15Oct 15Jan 16Apr 16Jul 16Oct 16Jan 17Apr 17Jul 17Oct 17Jan 18
FY 2019 FY2018 FY2017
14.010.9
14.3 18.8
3.1
37.0
-22.5
-0.2 2.3
9.7
(30.0)
(20.0)
(10.0)
-
10.0
20.0
30.0
40.0
Au
to
Ban
ks
Co
nsu
me
r
Ene
rgy
Ind
ust
rial
s
Me
tals
Ph
arm
a
Tech
Uti
litie
s
Sen
sex
Source: Bloomberg, KIE

Confidential | 7
Key Triggers – Resolution of NPA & Earnings
• Global Economic data : World economy improving
• Commodity Prices: Sustained high prices is expected to lead to high earnings growth in Steel/Oil sector
• Resolution of NPA: Effective addressal by government of NPA issue in Indian Banks, initial bids for NCLT List 1 has been promising
• Weaker Rupee: Benefit IT and Pharma
• Rural recovery: Government focus on rural economy including increase of MSP could benefit rural consumption
Positive Triggers
• Outflow from EM: US tax reforms and rising global rates could trigger capital flight from Emerging markets like India
• Earnings: Consensus expected earnings growth for domestic equities is high at around 25% for FY19, any downgrade would make the valuations more expensive
• Geo-Political Risk: Further tariffs imposed by US/China
• Monetary Policy: Faster than expected monetary tightening in Europe and US
• Weaker Macro: Higher crude prices and low GST collection could lead to lower re-rating of Equity valuations
• Tight Credit and Higher NPA: Recent PNB event could lead to cascading effect in the whole banking system
• Slowdown in Retail Flows: Redemption pressure in retail possible post 10% LTCG and 10-15% correction in markets
• State Elections: Elections in Rajasthan and Karnataka are expected to be tight for NDA
Risks

Confidential | 8
India Equities: Valuations & Strategy – Maintain Neutral Stance
Indian markets lost ~4% for the month of March on account of weakness in markets worldwide. The financial year FY17-18 endedwith a gain of 10.2% as against 18.5% for the previous FY. FII flows into equity markets turned positive with a net investment ofINR 12,272 cr from negative last month.
At current levels of approx. 10,481 (13th April, 2018), Nifty is trading at a 1 year forward PE of 18.5X. In the current scenario, wecontinue to maintain a Neutral stance on the back of healthy earnings growth expectations..
Mutual Funds: As domestic liquidity continues to drive markets, we advise new investments in Mutual Funds to be deployed 25%in lumpsum and subsequent in tranches via SIPs/STPs.
Recommended allocation within equity mutual funds is as under:
• 50% Large Cap allocation (Prefer Large Caps due to relatively Favorable Valuations)
• 50% Multi Cap allocation (such funds currently have a bias toward large cap)
• For investors who want equity exposure but have low appetite for volatility, they can take equity exposure through
Balanced Funds. Balanced funds have around 25% to 30% of their portfolio into Debt instruments which provides cushion
to the portfolio return during market volatility.
Source: EPS Estimates by KIE

Debt Market Update &
Debt MF Strategy

Confidential | 10
Indicators
Policy Action
• No rate action as expected in Apr policy
• We expect repo rate to be unchanged for extended
period of time
• Tone was softer and carried focus on upward risks to
inflation
Inflation
• CPI was lower than expectation at 4.28% in March 2018
• RBI lowered expectation of 4QFY18 to 4.5% and
1HFY19 to 4.7-5.1%
• We expect CPI averaging around 4.3% for FY2019
10 Year G-Sec Benchmark Yield
• Short term triggers like favorable Gsec supply,
favorable inflation Prints and expectation of hike in FII
could sustain rally
Liquidity
• Liquidity has gone to deficit from surplus due to tax payments
• RBI has reaffirmed their objective of maintaining a neutral
level
INR
• Concerns over LOU limits and CAD put pressure
on INR
• Expect mild depreciation towards 65.5 over 1 Year
• Broad range of 63-66 to hold
Key Risks
• Global monetary tightening
• Crude Prices
• Impact of GST revenues and spending on Fiscal Deficit
• Growth Recovery
G-Sec Supply
• Government announced to borrow INR 2.88 trn of
bonds in H1FY19, lower by 50k cr compensated by
lower buybacks and higher small savings
• Issuance in medium term segment of 10-14 years was
reduced to 29% against 50% in previous years
• A hike in FII limit and/or support from RBI in form of
OMO purchase could further improve the Supply-
Demand dynamics
Debt Market: Key Variables

Confidential | 11
Yields relaxed by 30-60 bps over positive news from inflation print, Borrowing announcement and RBI policy meet
-575
-2,000
-1,000
0
1,000
1-Mar 6-Mar 11-Mar 16-Mar 21-Mar 26-Mar 31-Mar
Am
ou
nt
in R
s. B
n 113
7.13
6.00
020406080100120140160180200
5.75
6.25
6.75
7.25
7.75
Spre
ad (
bp
s)
% Y
ield
Spread 10 Year G Sec Repo Rate
G Sec Spread over Repo has fallen from peak of 170 bps
to 113 bps
-30-23
-29-33
-36-43
-55
7.13
7.68
-70
-60
-50
-40
-30
-20
-10
0
6.00
6.40
6.80
7.20
7.60
8.00
8.40
1Y 2Y 3Y 4Y 5Y 8Y 10Y
Sp
read
(b
ps
)
% Y
ield
Change Current G-Sec Yield 1M earlier G-Sec Yield
10 Year papers rallied the most due to lower gross supply
announcement
Liquidity gone to deficit level before Fiscal end
Inflation for March 2018 was lower than expected
however Core inflation of 5% warrants caution
Note: As of 5th Apr 2018, Source Bloomberg
4.28%
5.20%
May17
Jun17
Jul17
Aug17
Sep17
Oct17
Nov17
Dec17
Jan18
Feb18
Mar18
0.00%
1.00%
2.00%
3.00%
4.00%
5.00%
6.00%
CPI Core Inflation

Confidential | 12
Decision to increase FII limit could lend support to Bond market and INR
Jul 17 Aug 17 Sep 17 Oct 17 Nov 17 Dec 17 Jan 18 Feb 18 Mar 18
-1,500
-1,000
-500
0
500
1,000
1,500
2,000
2,500
3,000
3,500
US
D M
illi
on
FIIs buying slowing down due to rising global rates
and high utilization levels
64.84
May17
Jun17
Jul17
Aug17
Sep17
Oct17
Nov17
Dec17
Jan18
Feb18
Mar18
Apr18
63.00
63.50
64.00
64.50
65.00
65.50
66.00
Indian currency has depreciated on sustained dollar
demand due to demand from importers and FII
outflow from Equity
Fed expects 5 rate hikes in 2018, ~3.5% rate till 2020
Jul 17 Aug 17 Sep 17 Oct 17 Nov 17 Dec 17 Jan 18 Feb 18
740
760
780
800
820
840
860
880
900
920
940
GST collections running below target rate of 1.1
Trillion Rs/month
Note: As of 5th Apr 2018, Source Bloomberg
o
4
o
3.75
oo
3.5 o o
ooo ooooo
3.25 o o
oo o
3 ooooo
ooooo
2.75 o oooo
o o oo o
2.5 o
oooooo
2.25 o
oooooo o
2
1.75
oo O o
1.5
2018 2019 2020 Long Term
The Fed’s Dot Plot chart: Dots represents number of members voting. The chart represents where each participant thinks the Fed rate should be in the next few years.
Fed
Rat
e

Confidential | 13
Debt Market Trends
165.00
170.00
175.00
180.00
185.00
190.00
195.00
200.00
205.00
210.00
215.00
220.00
Sep 17 Oct 17 Nov 17 Dec 17 Jan 18 Feb 18 Mar 18 Apr 18
0.00
10.00
20.00
30.00
40.00
50.00
60.00
70.00
80.00
3 Year AAA 5 Year AAA SDL Credit RHS
Government Yields rallied more than Corporate papers
last monthFY19 Central Government Borrowing has been reduced by 50,000
cr, duration mix and H1 supply favorable for 10 Year paper
6.24
0.25
0.25
0.5
6.24
FY19 FiscalDeficit
Higher SmallSavings
Borrowing
Lower BondBuy Back
Lower GrossBorrowing
FY19 FiscalDeficit
6
6.25
6.5
6.75
7
1.9
2.5 2.62.8
3.12.9
2.6
FY13 FY14 FY15 FY16 FY17 FY18RE FY19BE
0
0.5
1
1.5
2
2.5
3
3.5
Due to better than expected Cess & stamp duty collection
and low expenditure growth, State FD is expected to
reduce this year
Spread over 10 Year GSec
Note: As of 3rd Apr 2018, Source Bloomberg, MFI
% of GDP
Rs lk cr
6.20
6.40
6.60
6.80
7.00
7.20
7.40
7.60
7.80
8.00
8.20
8.40
Jul 17 Aug 17 Sep 17 Oct 17 Nov 17 Dec 17 Jan 18 Feb 18 Mar 18
0.00
50.00
100.00
150.00
200.00
250.001 Year CP RHS
Spread of 1 Year CP over 1 Month CD has reduced but
still at attractive levels
Confidential | 14
India Fixed Income: Strategy
Substantial part of the portfolio should be deployed through a mix of high rated and credit accrual strategies. Exit from duration funds only for investors who have completed 3 years and can deploy with another 3 years view.
Investment Focus:
Passive Accrual-Oriented Debt funds
High quality portfolios (~100% AAA / Sovereign) Portfolio is run on a passive accrual basis i.e buying a bond and holding it till maturity thereby earning from the accruing of
interest Higher predictability of return, lower volatility & lower interest rate risk
High Yield Credit-Oriented Funds
Low volatility on account of maturity of portfolio between 3 – 5 years, attractive and stable accrual yields Experienced teams to carefully evaluate and tightly monitor high yielding debt instruments
Short Term Bond Funds
Actively managed to run a low avg. maturity of 2-3 years, attractive risk-reward Lower volatility and interest rate risk than Dynamic Bond Funds, better suited from a risk-adjusted basis in volatile markets
Continue to recommend ultra short term relative to liquid funds (up to 3 Months)For short term parking of funds for a minimum of 6 months, Arbitrage funds preferred over ultra short term funds on back of better tax adjusted returns
Source : AMCs, other Financial websites

Confidential | 15
DisclaimerThe aforesaid is for information purposes only and should not be construed to be investment advice under SEBI (Investment Advisory) Regulations.
In the preparation of the material contained in this document, Kotak Mahindra Bank has used information that is publicly available, including information developed in-house. Some of the material used in the document may have been obtained from members/persons other than the Kotak Mahindra Bank and/or its affiliates and which mayhave been made available to Kotak Mahindra Bank and/or its affiliates. Information gathered & material used in this document is believed to be from reliable sources. KotakMahindra Bank however does not warrant the accuracy, reasonableness and/or completeness of any information. For data reference to any third party in this material nosuch party will assume any liability for the same. Kotak Mahindra Bank and/or any affiliate of Kotak Mahindra Bank does not in any way through this material solicit any offerfor purchase, sale or any financial transaction/commodities/products of any financial instrument dealt in this material. All recipients of this material should before dealingand or transacting in any of the products referred to in this material make their own investigation, seek appropriate professional advice
We have included statements/opinions/recommendations in this document which contain words or phrases such as "will", "expect" "should" and similar expressions orvariations of such expressions, that are "forward looking statements". Actual results may differ materially from those suggested by the forward looking statements due torisks or uncertainties associated with our expectations with respect to, but not limited to, exposure to market risks, general economic and political conditions in India andother countries globally, which have an impact on our services and / or investments, the monetary and interest policies of India, inflation, deflation, unanticipatedturbulence in interest rates, foreign exchange rates, equity prices or other rates or prices, the performance of the financial markets in India and globally, changes indomestic and foreign laws, regulations and taxes and changes in competition in the industry. By their nature, certain market risk disclosures are only estimates and could bematerially different from what actually occurs in the future. As a result, actual future gains or losses could materially differ from those that have been estimated
Kotak Mahindra Bank (including its affiliates) and any of its officers directors, personnel and employees, shall not liable for any loss, damage of any nature, including but notlimited to direct, indirect, punitive, special, exemplary, consequential, as also any loss of profit in any way arising from the use of this material in any manner. The recipientalone shall be fully responsible/ are liable for any decision taken on the basis of this material. The investments discussed in this material may not be suitable for all investors.Any person subscribing to or investing in any product/financial instruments should do so on the basis of and after verifying the terms attached to such product/financialinstrument. Financial products and instruments are subject to market risks and yields may fluctuate depending on various factors affecting capital/debt markets. Please notethat past performance of the financial products and instruments does not necessarily indicate the future prospects and performance thereof. Such past performance mayormay not be sustained in future. Kotak Mahindra Bank (including its affiliates) or its officers, directors, personnel and employees, including persons involved in thepreparation or issuance of this material may; (a) from time to time, have long or short positions in, and buy or sell the securities mentioned herein or (b) be engaged in anyother transaction involving such securities and earn brokerage or other compensation in the financial instruments/products/commodities discussed herein or act as advisoror lender / borrower in respect of such securities/financial instruments/products/commodities or have other potential conflict of interest with respect to anyrecommendation and related information and opinions. The said persons may have acted upon and/or in a manner contradictory with the information contained here. Nopart of this material may be duplicated in whole or in part in any form and or redistributed without the prior written consent of Kotak Mahindra Bank. This material is strictlyconfidential to the recipient and should not be reproduced or disseminated to anyone else
This material is not a research report as per the SEBI (Research Analyst) Regulations, 2014.
Mutual Fund investments are subject to market risks, read all scheme related documents carefully.