equity bank group annual report 2013
DESCRIPTION
Equity Bank Group Annual Report 2013TRANSCRIPT
7/21/2019 Equity Bank Group Annual Report 2013
http://slidepdf.com/reader/full/equity-bank-group-annual-report-2013 1/124
2013ANNUAL REPORT
AND FINANCIAL
STATEMENTS

7/21/2019 Equity Bank Group Annual Report 2013
http://slidepdf.com/reader/full/equity-bank-group-annual-report-2013 2/124
Equity Bank Group Headquarters, Nairobi.
7/21/2019 Equity Bank Group Annual Report 2013
http://slidepdf.com/reader/full/equity-bank-group-annual-report-2013 3/124
EQUITY BANK LIMITED AND SUBSIDIARIES | ANNUAL REPORT AND FINANCIAL STATEMENTS
FOR THE YEAR ENDED 31 DECEMBER 2013
Pg
1
CORPORATE PHILOSOPHIES
Founded as Equity Building Society (EBS) in October
1984, Equity Bank has grown to be the largest bank in
Africa by customer base.
The Bank is a value driven institution with the customer
at the center. One of the core values of the Bank is respect
and dignity for customers. Staff are carefully selected and
appointed based on attitude as they can be trained for
‘skills’. The Bank in pursuit of its purpose of transforming
lives and livelihoods of the African people has set a clear
and well-defined corporate image and positioning that
the bank can own and stay true to through a vibrant,
energized and passionate team.
The tagline for Equity Bank is “Your Listening Caring
Partner”. The bank puts a lot of emphasis on listening
to and caring for its customers. For Equity Bank, our
services go beyond banking. We believe that by building
a strong emotional connection with our customers, we
create a better and stronger relationship which in turn
enables us to achieve one of our core philosophies, to
transform the lives and livelihoods of our people.
Just like the Equity logo that denotes a house, at Equity
we believe in providing a ‘home’ to all our customers. By
providing tailor made and relevant products and services,
we have seen our customers find a home in Equity
Bank. We continue to witness millions of our customers
nurture, pursue and realize their dreams. This is what
gives us inspiration and motivation to continue pursuing
the Equity dream.
In line with our positioning statement, every year we
rededicate ourselves to listening to the needs and
aspirations of our customers, continuously innovating
products and services that are relevant to them that meet
their needs and that help them to live dignified lives.
In 2014 and beyond, there are abundant opportunities
for all as Africa becomes the future for the 21st century.
We invite you all to share in the vision and mission as we
re-dedicate ourselves to work even harder for financial
inclusion, empowerment and wealth creation of all, as
we continue jointly pursuing the African dream.
OUR PURPOSE
We exist to transform the lives and livelihoods of our
people socially and economically by availing them
modern, inclusive financial services that maximize their
opportunities.
OUR VISION
To be the champion of the socio-economic prosperity of
the people of Africa.
OUR MISSION
We offer inclusive, customer focused financial services
that socially and economically empower our clients andother stakeholders.
POSITIONING STATEMENT
Equity provides Inclusive Financial Services that transform
livelihoods, give dignity and expand opportunities.
OUR TAGLINE
Your Listening Caring Partner.
OUR MOTTO
Growing Together In Trust.
OUR VALUES
Professionalism
Integrity
Creativity & Innovation
Teamwork
Unity of Purpose
Respect & Dignity for Customers
Effective Corporate Governance
7/21/2019 Equity Bank Group Annual Report 2013
http://slidepdf.com/reader/full/equity-bank-group-annual-report-2013 4/124
EQUITY BANK LIMITED AND SUBSIDIARIES | ANNUAL REPORT AND FINANCIAL STATEMENTS
FOR THE YEAR ENDED 31 DECEMBER 2013
Pg
2
TABLE OF CONTENTS
Corporate Philosophies 1
Notice of Tenth Annual General Meeting 3-4
Bank information 5-6
Chairman’s Statement 7-10
CEO’s Statement 11-15
Financial Highlights 16 -17
Key achievements and accolades 18-20
Statement on corporate social responsibility 21-25
Board of Directors 26-33
The Executive Management 34-38
Report of the directors 39-40
Statement of corporate governance 41- 48
Statement of directors’ responsibilities 49
Report of the independent auditors 50
Financial statements:
Consolidated income statement 51
Consolidated statement of comprehensive income 52
Consolidated statement of financial position 53
Consolidated statement of changes in equity 54
Statement of changes in equity 55
Consolidated statement of cash flows 56 Notes to the consolidated financial statements 57-116
Notes 117-118
Proxy Form 119
7/21/2019 Equity Bank Group Annual Report 2013
http://slidepdf.com/reader/full/equity-bank-group-annual-report-2013 5/124
EQUITY BANK LIMITED AND SUBSIDIARIES | ANNUAL REPORT AND FINANCIAL STATEMENTS
FOR THE YEAR ENDED 31 DECEMBER 2013
Pg
3
Notice is hereby given that the Tenth Annual General Meeting (AGM) of Equity Bank Limited will be held on Wednesday,
26th March 2014 at Kenyatta International Conference Centre (KICC) NAIROBI at 10.00 am to transact the following
business:
1. The Company Secretary to read the notice convening the meeting.
2. To receive, consider and if thought fit, adopt the Annual Report and Audited Financial Statements for the year
ended 31st December 2013 together with the Chairman’s, Directors’ and Auditors’ reports thereon.
3. To approve a first and final dividend for the year ended 31st December 2013 of KES 1.50/- per ordinary share
of KES 0.50 cents each, subject to withholding tax, where applicable.
4. Election of Directors:
a) Mr. Peter Kahara Munga, a director retires by rotation in accordance with Article 100 of the Company’s
Articles of Association, and having attained the age of seventy years on 5th May 2013 further retires in terms
of section 186 (2) of the Companies Act (Cap 486 of the Laws of Kenya) and being eligible, by virtue of a specialnotice given under section 186 (5), offers himself for re-election as a director.
b) Prof. Shem Migot-Adholla, a director retires by rotation in accordance with Article 100 of the Company’s
Articles of Association, and having attained the age of seventy years on 14th June 2012 further retires in
terms of section 186 (2) of the Companies Act (Cap 486 of the Laws of Kenya) and being eligible, by virtue of
a special notice given under section 186 (5), offers himself for re-election as a director.
c) Mr. Ernest Nzovu, a director retires by rotation in accordance with Article 100 of the Company’s Articles of
Association, and having attained the age of seventy years on 27th September 2013 further retires in terms of
section 186 (2) of the Companies Act (Cap 486 of the Laws of Kenya) and does not offer himself for re-election
as a director.
5. To approve the remuneration of the directors for the year ending 31st December 2014.
6. To note that the auditors Messrs Ernst & Young, being eligible and having expressed their willingness, will
continue in office in accordance with section 159 of the Companies Act (Cap 486) and to authorize the directors
to fix their remuneration.
7. As Special Business, to consider and if thought fit, to pass the following resolution as a Special Resolution:
“To ratify the acquisition of Francis Thuo & Partners Limited by Equity Investment Bank Limited, a wholly
owned subsidiary of Equity Investment Services Limited, which in turn is a wholly owned subsidiary of Equity
Bank Limited in fulfillment of the requirement of Regulation G.06 (a) of the Fifth Schedule to the Capital
Markets (Securities) (Public Offers, Listing and Disclosures) Regulations 2002 (“Disclosure Regulations”)”
8. Any other business of which notice will have been duly received.
By order of the Board
Mary Wangari Wamae
Company Secretary
P.O. Box 75104 -00200NAIROBI.
27th February, 2014
NOTICE OF TENTH ANNUAL GENERAL MEETING
7/21/2019 Equity Bank Group Annual Report 2013
http://slidepdf.com/reader/full/equity-bank-group-annual-report-2013 6/124
EQUITY BANK LIMITED AND SUBSIDIARIES | ANNUAL REPORT AND FINANCIAL STATEMENTS
FOR THE YEAR ENDED 31 DECEMBER 2013
Pg
4
Notes
1) A member entitled to attend and vote at the meeting and who is unable to attend is entitled to appoint a proxy
to attend and vote on his or her behalf. A proxy need not be a member of the Company. To be valid, a form of
proxy must be duly completed by the member and lodged with the Company Secretary at the Company’s Head
Office situated at EQUITY CENTRE, 9TH FLOOR, Hospital Road, Upper Hill, Nairobi, not later than 10.00 am on
Monday, 24th March 2014, failing which it will be invalid. In the case of a corporate body the proxy must be
under its common seal.
2) Subject to approval of shareholders, the Board of Directors has resolved to recommend to members at the
forthcoming Annual General Meeting a dividend for the year ended 31st December 2013 of KES 1.50/- per
share to be paid to shareholders on the register of members of the Company at the close of business on 14th
March 2014. The dividend will be paid on or about 25th April 2014.
3) The full set of audited financial statements for the year ended 31st December 2013 is available at the Company’s
registered office at Equity Centre 9th Floor or can be downloaded at the website, www.equitybankgroup.com
NOTICE OF TENTH ANNUAL GENERAL MEETING
7/21/2019 Equity Bank Group Annual Report 2013
http://slidepdf.com/reader/full/equity-bank-group-annual-report-2013 7/124
EQUITY BANK LIMITED AND SUBSIDIARIES | ANNUAL REPORT AND FINANCIAL STATEMENTS
FOR THE YEAR ENDED 31 DECEMBER 2013
Pg
5
PRINCIPAL PLACE OF BUSINESS: 9th Floor, Equity Centre
Hospital Road,Upper Hill
P.O. Box 75104-00200
NAIROBI
Tel : +254-020-2262000
Fax : +254-020-2737276,
Cell: 0711 026000 /0732 112000
www.equitybankgroup.com
@KeEquitybank KeEquitybank
REGISTERED OFFICE: 9th Floor, Equity Centre
Hospital Road,Upper Hill
P.O. Box 75104-00200
NAIROBI
LAWYERS: Coulson Harney Advocates,
1st Floor, Block A
Nairobi Business Park
Ngong Road
P.O. Box 10643 – 00100
NAIROBI
Hamilton Harrison & Mathews
ICEA Building,
Kenyatta Avenue,
P.O. Box 30333-00100
NAIROBI
Dengtiel A. Kuur
South Sudan Associated Advocates
Chamber of Commerce Complex
Summer Palace Business Hotel Close
Juba
SOUTH SUDAN
MRB Attorneys
KG 624 St, Kimihurura
P.O. Box 628
KigaliRWANDA
Mark & Associates Attorneys
NIC Life House
1st Floor, Wing C
Sokoine Drive/Ohio Street
P.O.Box 8211
Dares Salaam
TANZANIA
A.F. Mpanga Advocates
9th Floor North Wing Workers House1 Pikinton Road
P.O. Box 1520
Kampala
UGANDA
BANK INFORMATION
7/21/2019 Equity Bank Group Annual Report 2013
http://slidepdf.com/reader/full/equity-bank-group-annual-report-2013 8/124
EQUITY BANK LIMITED AND SUBSIDIARIES | ANNUAL REPORT AND FINANCIAL STATEMENTS
FOR THE YEAR ENDED 31 DECEMBER 2013
Pg
6
BANKERS: Central Bank of KenyaP.O. Box 60000 - 00200
NAIROBI
AUDITORS: Ernst & Young
Kenya-Re Towers, Upperhill
Off Ragati Road
P.O. Box 44286 - 00100
NAIROBI
COMPANY SECRETARY: Mary Wangari Wamae
9th Floor, Equity Centre
P.O. Box 75104-00200NAIROBI
BANK INFORMATION (continued)
7/21/2019 Equity Bank Group Annual Report 2013
http://slidepdf.com/reader/full/equity-bank-group-annual-report-2013 9/124
EQUITY BANK LIMITED AND SUBSIDIARIES | ANNUAL REPORT AND FINANCIAL STATEMENTS
FOR THE YEAR ENDED 31 DECEMBER 2013
Pg
7
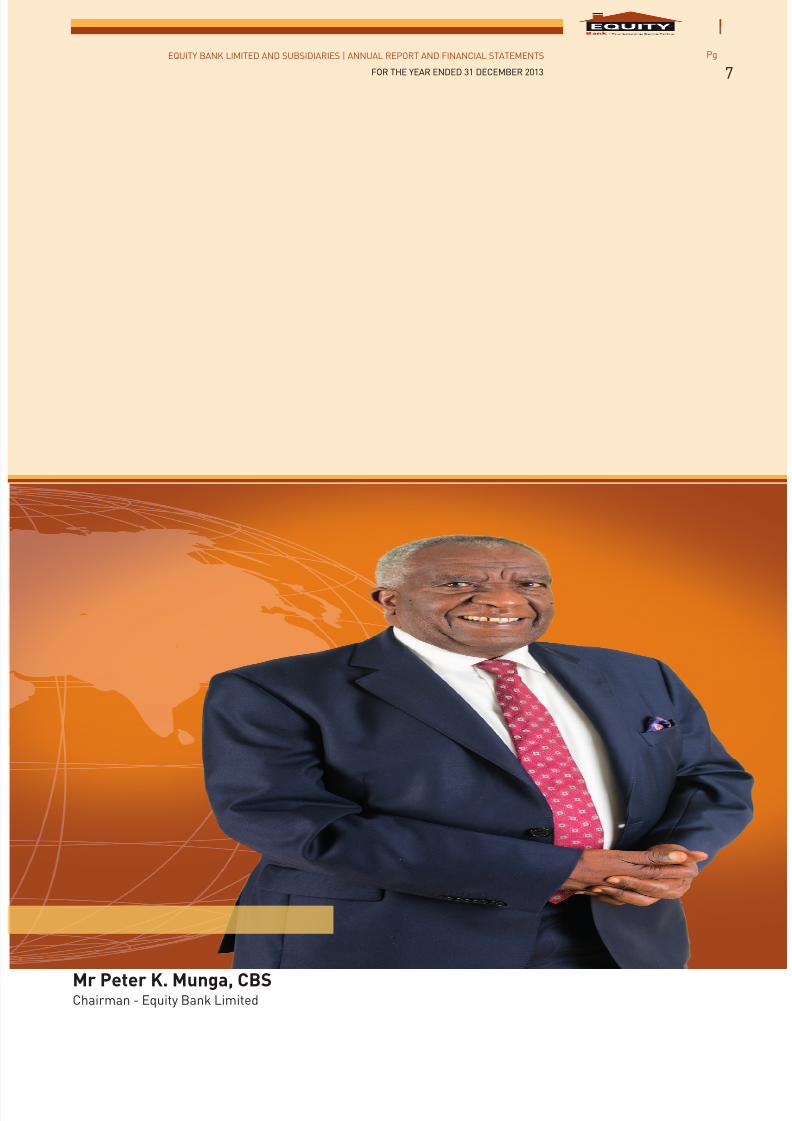
Mr Peter K. Munga, CBSChairman - Equity Bank Limited
7/21/2019 Equity Bank Group Annual Report 2013
http://slidepdf.com/reader/full/equity-bank-group-annual-report-2013 10/124
EQUITY BANK LIMITED AND SUBSIDIARIES | ANNUAL REPORT AND FINANCIAL STATEMENTS
FOR THE YEAR ENDED 31 DECEMBER 2013
Pg
8
CHAIRMAN’S STATEMENT
INTRODUCTION
It’s a great honour to present to you the Group’s report for the year ended December 31st, 2013.
Despite the challenges that characterized the environment with the country going through a general election inKenya, reorganization of resources to devolved government and the national security concerns, the Group was able to
register impressive performance. This is attributable to its continued focus on innovation and technology, new market
segments, consolidation of regional businesses and growing the networks and channels to sustain growth.
OPERATING ENVIRONMENT
Kenya maintained a stable economic environment and fiscal discipline despite the fiscal pressures from the March
2013 elections, a new devolved system of governance and public sector pay pressure.
The country saw robust economic growth expected to be slightly higher than the GDP growth rate of 4.6 percent
recorded in 2012, thanks in part to a smooth conclusion to the March presidential elections as well as an increase in
capital inflows, brought about in part by an increase in infrastructure activity together with stabilization of inflation,
interest rates and the exchange rate in the past 18 months. Inflation remained at single digit levels.
South Sudan’s economic fortunes appeared to be poised for strong growth following the gradual resumption of oil
production and export starting in April 2013. The conflict borne out of political rifts erupted in December 2013 but
efforts by the international community and regional bodies have seen this being contained and expectations are high
that peace will resume. Despite the uncertainty the country continues to export over 200,000 barrels of oil per day.
In Uganda, the average annual inflation rate for 2013 was 5.5 percent compared to 14.0 percent in 2012. However
economic growth in the first quarter of 2013/14 (July-June) slowed due to drought but full year 2014 economic growth
is still projected at 6 percent-6.5 percent.
Tanzania demonstrated its bright economic prospects as the GDP growth accelerated to 7.1 percent in 2013 from 6.9
percent in 2012 as output in communications, financial services and manufacturing rose. Meanwhile inflation fell from12.1 percent in December 2012 to 6.2 percent in November 2013. Economic growth is also expected to be boosted by
the massive oil finds and also the operationalization of the Bagamoyo port.
In Rwanda the lagged effect of the aid shock in the second half of 2012 led to deceleration of growth in 2013. The
economy grew by 5.9 percent and 5.7 percent in the first and second quarters of 2013, respectively, before inching
up to 6 per cent in the third quarter. This growth momentum is expected to be maintained given the technological
innovativeness of the country backed by very strong government policy.
BANKING SECTOR DEVELOPMENTS
The banking sector has been credited with accelerating financial inclusion and with developments that have led to
increased access to banking services to the Kenyan public.
The sector is expected to continue on this growth trajectory. Ongoing reforms and initiatives by the Commercial banks
and Central Bank of Kenya (CBK) will serve to further propel the banking sector to new frontiers of financial inclusionfor more Kenyans to access these services. To increase financial stability CBK has adopted a consolidated supervision
approach to take cognizance of the growing Pan-African nature of the Kenyan banking sector.
REGULATORY ENVIRONMENT
The Revised Prudential and Risk Management Guidelines issued in November 2012 came into effect in January 2013.
New Prudential Guidelines were issued covering various operating aspects of banking operations and management.
These include Outsourcing, Representative Offices of Foreign Institutions, Voluntary Liquidation, Consolidated
Supervision, Stress Testing, Prompt Corrective Action and Consumer Protection. In addition, the existing nine Risk
Management Guidelines were reviewed while two new guidelines on Country and Transfer Risk and Information
and Communication Technology Risk Management were introduced. The above guidelines are expected to further
strengthen the banking sector environment.
The Central Bank of Kenya through new Prudential Guidelines also allowed acquisition and control of banks by Non-Operating Holding Companies. This is pursuant to section 13(e) of the Banking Act. This means that a Group Non-
operating holding company can engage in various activities which are limited to holding investments in subsidiaries,
holding properties used by group members; raising funds to invest in, or to provide support to,subsidiaries, raising
funds to conduct its own limited activities, investing funds on behalf of the group, conducting the banking activities
required for its own limited functions, and providing administrative, risk management and financial services to support
7/21/2019 Equity Bank Group Annual Report 2013
http://slidepdf.com/reader/full/equity-bank-group-annual-report-2013 11/124
EQUITY BANK LIMITED AND SUBSIDIARIES | ANNUAL REPORT AND FINANCIAL STATEMENTS
FOR THE YEAR ENDED 31 DECEMBER 2013
Pg
9
the efficient operation of the group.
Together with this was also the approval for licensed banks to engage in provision of regulated financial services and
products. This includes diversified financial services such as bancassurance.As well, new Prudential Guidelines were introduced which raised the minimum capital adequacy ratios and also
increased the risk factors to consider in the computation of the Risk Weighted Assets. These will see banks requiring
to increase their capital in order to meet the statutory requirements.
EQUITY INVESTMENT BANK’S ACQUISITION OF FRANCIS THUO & PARTNERS
Equity Investment Bank (EIB) is a wholly owned subsidiary of Equity Investment Services Limited, which in turn is a
wholly owned subsidiary of Equity Bank Limited.
EIB is licensed by the Capital Markets Authority to operate as an investment bank. This allows it to provide the
following services:
a) Offering advisory services on:
i. Public offering of securities;
ii. Corporate financial restructuring, takeovers, mergers, acquisitions and privatizations;iii. Corporate financing options including issuance of equity, debt securities or loan syndication.
b) Engaging in the business of a stock broker;
c) Engaging in the business of a dealer;
d) Promoting or arranging underwriting or issuance of securities;
e) Promoting and acting as a fund manager of collective investment schemes;
f) Providing investment advisory services and contractual portfolio management.
The Capital Markets (Licensing Requirements) (General) Regulations, 2002 provides that: ‘No investment bank shall
be licensed to carry out the business of a stock broker unless it acquires a controlling interest in a stockbroker that is
a member of the securities exchange’.
Notwithstanding that it was licensed and that the group had an ambitious plan and dedicated resources to support
the roll out of the broad range of services that EIB was licensed to undertake, EIB had been unable to do this due
to the fact that it had not been admitted as a member of the securities exchange and was consequently not able to
trade securities directly. The fact that it could not trade securities directly and had to rely on competitors to do so had
seriously constrained EIB’s activities. As a result, the Group acquired Francis Thuo & Partners to enable EIB gain
admission to the Nairobi Securities Exchange (NSE) and hence effectively leverage the Groups significant resources,
capital, infrastructure and client base to provide financial services in the capital markets with the intention of making
high quality services available to clients in a convenient and cost effective manner much in the same way as the Group
had managed to achieve in banking and insurance.
FINANCIAL RESULTS
The Group Chief Executive and Managing Director’s statement has set out clearly the Bank’s continuing impressive
performance.
Equity Bank Group’s focus on enhancing affordability, accessibility and convenience has seen its growth momentummaintained for the period ended 31st December 2013.
The Bank’s earnings per share have increased to KShs 3.59 from KShs 3.26 per share. The Group achieved a return on
equity(ROE) of 28 percent and return on assets ( ROA)of 5.1 percent despite the massive investment in the IT platform,
core banking platform, mobile and internet banking services and the branch network to support SME growth during
the year. Profit before tax and exceptional items grew by 11 percent from Kshs 17.29 billion to Kshs 19.15 billion
demonstrating the resilience of the bank’s business model.
Against uncertain global economic recovery and despite stiff competition in many of our markets, the strong
performance by the Bank once again demonstrates our ability to deliver substantial and sustained value for
ourshareholders and other stakeholders.
On the customer’s front, the number of customers grew from 7.8 million at close of 2012 to over 8.4 million confirming
Equity bank’s position as the largest bank in Africa in customer numbers and demonstrating the social and financial
inclusivity of our business model.
CHAIRMAN’S STATEMENT
7/21/2019 Equity Bank Group Annual Report 2013
http://slidepdf.com/reader/full/equity-bank-group-annual-report-2013 12/124
EQUITY BANK LIMITED AND SUBSIDIARIES | ANNUAL REPORT AND FINANCIAL STATEMENTS
FOR THE YEAR ENDED 31 DECEMBER 2013
Pg
10
CHAIRMAN’S STATEMENT
CORPORATE GOVERNANCE
Strong management and corporate governance continue to be key pillars of Equity Bank.
The various board committees continued to play a vital role in supporting the board and management to discharge
their duties. The sub committees also continued to be guided by the regulatory framework as well as the CBK risk and
prudential guidelines. With effect from 1st July 2013 Mr. Dennis Aluanga became a substantive director with Mr. Alykhan
Nathoo as his alternate. Also Mr. Temitope Lawani became alternate to Mr. Babatunde Soyoye. In addition in 2013, in
order to tap into the wealth of local knowledge, a new director Ms. Zahra Nuru was appointed as a member of the
board for the Tanzania subsidiary. Please join me in wishing Ms Nuru great success in her role as a director.
Article 100 of the Memorandum and Articles of Association of the Bank provides for retirement of directors by rotation.
Section 186(2) of the Companies Act (Cap 486 of the Laws of Kenya) provides for retirement of directors on attaining
the age of seventy. During the year, the following directors are due to retire by rotation and having attained the age of
seventy, offer themselves for re-election by special notice pursuant to Section 186(5) of the Companies Act (Cap 486
of the Laws of Kenya):
i. Mr. Peter Kahara Munga;ii. Mr. Shem Migot- Adholla.
Relevant resolutions will be presented to members during the Annual General meeting for consideration.
After having served in the board since 2004, Mr. Ernest Nzovu retires by rotation and having attained the age of
seventy does not offer himself for re-election. Please join me in thanking Mr. Nzovu for his dedication and sacrifice
and wishing him well in his future endeavors.
DIVIDEND
The board continues to balance between maximizing shareholder value as well as the need to plough back funds into
the company for future business growth.
As a demonstration of confidence in the strength of the Bank’s balance sheet and sustainability of growth, the Board
has recommended a dividend of Ksh1.50 per share (2012: Ksh1.25 per share) a growth of 20 percent over the previous
year.
2014 OUTLOOK
2013 was another year of strong performance and the board remains confident about 2014. The economy is expected
to grow at between 5.8-6.2 percent this year, even after the temporary shock of the September 21, 2013 terrorist attack
in Nairobi, according to projections by the World Bank and the International Monetary Fund (IMF). We at Equity Bank
will endeavor to leverage on our strength, the conducive business environment to continue championing the socio
economic transformation of our people to deliver sustainable performance and contribute to the region’s economic
development through provision of inclusive customer- focused financial services.
CONCLUSION
Finally, I wish to express my sincere appreciation for the teams that have enabled us make these great strides over
the years. Many thanks to my fellow members of the Board of Directors, the management and staff of the Equity
Bank Group for their hard work, our customers for their untiring support and last but not least to all our development
partners and other stakeholders who have kept faith in us throughout this journey.
Thank You
Mr. Peter Munga, CBS
Chairman – Board of Directors
7/21/2019 Equity Bank Group Annual Report 2013
http://slidepdf.com/reader/full/equity-bank-group-annual-report-2013 13/124
EQUITY BANK LIMITED AND SUBSIDIARIES | ANNUAL REPORT AND FINANCIAL STATEMENTS
FOR THE YEAR ENDED 31 DECEMBER 2013
Pg
11
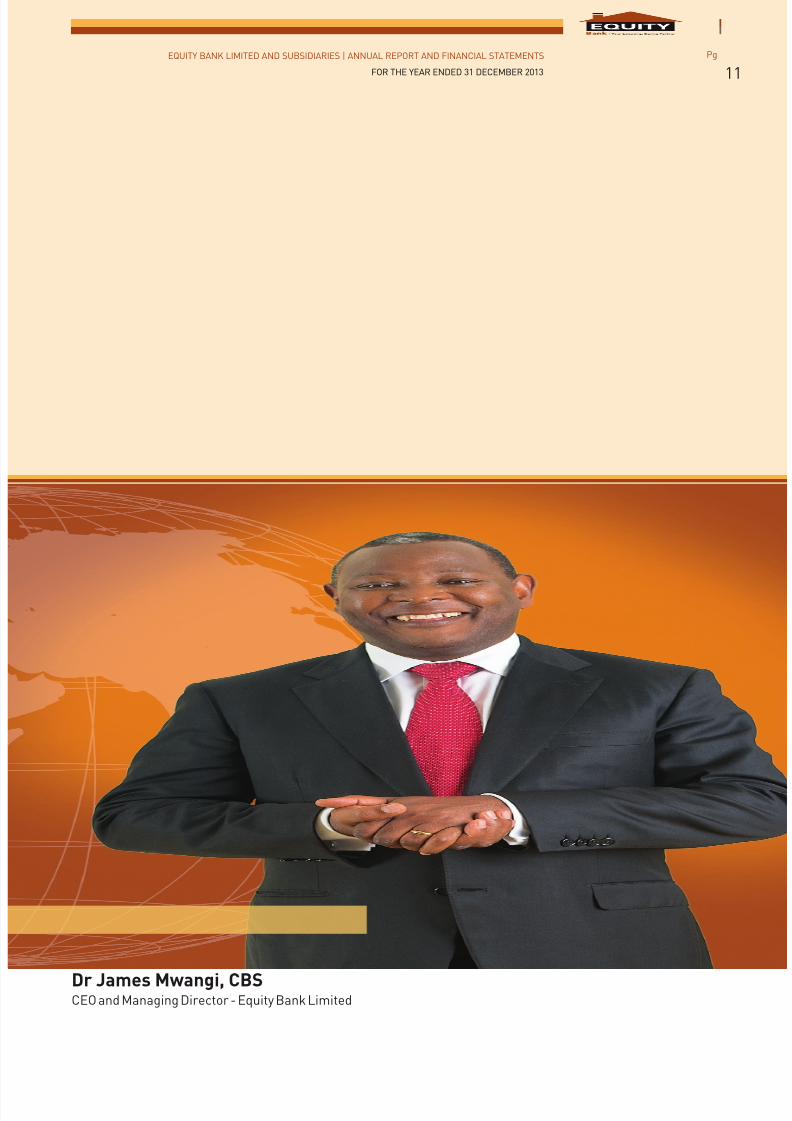
Dr James Mwangi, CBSCEO and Managing Director - Equity Bank Limited
7/21/2019 Equity Bank Group Annual Report 2013
http://slidepdf.com/reader/full/equity-bank-group-annual-report-2013 14/124
EQUITY BANK LIMITED AND SUBSIDIARIES | ANNUAL REPORT AND FINANCIAL STATEMENTS
FOR THE YEAR ENDED 31 DECEMBER 2013
Pg
12
INTRODUCTION
It is my pleasure to present to you Equity Group’s annual report and financial statements for the year 2013.
In the year under review, we are pleased with our overall business performance which aligns very well with our visionand also our proven track record of consistent delivery and sustained growth. The bank is endowed with a competitive
strategy, a unique culture and a very strong brand.
2013 PERFORMANCE REVIEW
I am happy to report that the Bank has continued to defy macro- economic turbulence to deliver strong growth, with
profit before tax and exceptional items increasing by 11 percent to Kshs. 19 billion up from Kshs.17 billion realized
the previous year.
The Group’s total assets posted a 14 percent growth during the year to close at Kshs.278 billion up from Kshs.243
billion. Net customer loans reached Kshs.171 billion up by 26 percent from Kshs.136 billion. Investment in Government
Securities grew by 9 percent to Kshs.44.5 billion up from Kshs.41.1 billion while cash and bank placements dropped by
23 percent to Kshs. 35 billion down from Kshs. 45 billion.
The growth in assets was mainly funded by a 16 percent growth in customer deposits to Kshs.195.1 billion up from
Kshs.167.9 billion and Shareholders’ funds and borrowed funds which grew by 20 percent and 1 percent respectively.
Total income grew by 14 percent to Kshs.41.9 billion up from Kshs. 36.8 billion while total operating expenses grew by
16 percent to Kshs. 23.1 billion up from Kshs.19.6 billion. The growth in income was driven by a 26 percent growth in
loans from Kshs.136 billion to Kshs.171 billion and 9 percent growth in investment in Government Securities resulting
in growth of 11 percent in net interest income from Kshs.24.0 billion to Kshs.26.5 billion.
Strategic growth of SME business resulted in rapid growth in loan book and we sustained a quality loan book despite
the challenging macro-economic environment. The group maintained a gross non performing portfolio of 5.19 percent
with a coverage ratio of 53 percent that compares positively with the regional banking industry.
The funding structure of savings deposits, shareholders funds and long-term low cost debt led the net interest margin(NIM) to stabilize at 12 percent despite the Bank revising downward the lending rates by around 800bps to stimulate
borrowing amid unstable interest regime. The Group’s strong and liquid balance sheet characterized by a high asset
quality portfolio, strong liquid asset position, loan to deposit ratio of 88 percent and a liquidity ratio of 34 percent
allowed the Group to continue its strategic growth pursuit despite the increased uncertainty in the turbulent macro-
economic environment.
COSTS
The Group’s Cost to Income ratio reduced to 48.5 percent despite the massive investment in the IT platform, core
banking platform, mobile and internet banking services and the branch network to support SME growth. Operating
costs were driven by significant costs of hiring, developing and training staff to manage SME sector and build Supreme
Banking centres. ICT costs have increased significantly as the Group upgraded its system and data centre, trained
staff in simulating the change of its core banking software from Finacle version 7 to Finacle version 10. We are
confident that going forward we shall continue to see significant improvement in the cost to income ratio as we reap
the benefits of the investments in technology already made.
CEO’S STATEMENT
7/21/2019 Equity Bank Group Annual Report 2013
http://slidepdf.com/reader/full/equity-bank-group-annual-report-2013 15/124
EQUITY BANK LIMITED AND SUBSIDIARIES | ANNUAL REPORT AND FINANCIAL STATEMENTS
FOR THE YEAR ENDED 31 DECEMBER 2013
Pg
13
2013 INITIATIVES
Business Development, Innovation and Partnerships
The Bank continued to strengthen its unique business model through innovation, partnerships and enhanced use of
technology and automation for a better customer experience. In line with this objective, the Bank in the year 2013
focused on a number of partnerships and strategic initiatives as follows:
Partnership with Mastercard Worldwide
We partnered with MasterCard to issue five-million MasterCard-branded debit and prepaid cards. The MasterCard
debit and prepaid cards with chip-enabled technology will be issued, first into the Kenyan market and then extended
into Uganda, Tanzania, Rwanda, and South Sudan, signaling the largest rollout of EMV payment cards in sub-Saharan
Africa to date. The cards also introduced MasterCard PayPass™ with the first ever installation of PayPass enabled
point of sale terminals across the region.
The suite of products that will be made available in the East African region will include Mobile Point of Sale (MPOS)
technology which allows merchants to receive payments via low cost add-ons linked to secure applications on theirmobile devices (such as a smart phone or tablet). This technology will extend the security and convenience of electronic
payments to merchants and their customers who previously depended on cash to transact.
AMEX Partnership
Equity Bank has partnered with American Express where Equity Bank will act as the exclusive issuer of American
Express Card products in Kenya, Tanzania and Uganda. As part of this agreement, Equity Bank became a merchant
acquirer on to the American Express network in Kenya, Tanzania and Uganda in 2013.
Launch of Beba Pay
Equity Bank Group teamed up with global leader in technology Google to bring Kenyans BebaPay, a payment card
which will provide a quick and convenient way to pay for bus fare without the use of cash. BebaPay is an Equity Bank
product powered by Google who bring their expertise in payments and Near Field Communication (NFC) technology.
The technology allows commuters to simply tap their BebaPay cards on a card reader to pay their bus fare making it
easier for commuters to transact with operators.
Visa Personal Payments (VPP)
We partnered with Visa and launched Visa Personal Payments (VPP).Visa Personal Payments is a convenient, cost-
effective and secure way for consumers to send funds directly to recipients with Visa cards, both domestically and
internationally. Equity Bank is the first bank in Africa to offer the Visa Personal Payments sending capability. Senders
can use Visa Personal Payments to make person-to-person payments, send funds to friends or family members, or
make account transfers.
Airtel Collaboration
In July, Equity Group entered into a partnership with Airtel Money to offer comprehensive M-Commerce solutions to
more Kenyans countrywide. The service is available to all Equity Bank customers who are subscribers of Airtel thus
enabling them to perform agency cash transactions at Equity branches and has also enabled Airtel money customers
to withdraw and deposit money at any Equity Bank branch or agency countrywide. Equity Bank and Airtel Money
entered into a partnership that will offer comprehensive M-Commerce solutions to more Kenyans countrywide. The
service which is available to all Equity Bank customers with Airtel lines enables customers from both Airtel and Equity
Bank to access Airtel mobile banking platforms, perform agency cash transactions at Equity Bank branches. It also
enables Airtel Money customers to withdraw and deposit money at any Equity Bank branch countrywide. The service
also enables customers to check account balance and receive mini statements among other services.
PayPal Partnership
Equity Bank and PayPal signed an e-commerce partnership that will enable PayPal users to enhance internationaland individuals businesses to transact with Kenya service providers via a secure and convenient payment service.
Merchants in Kenya can now sell to PayPal’s global customer base of more than 137 million active accounts in 193
markets around the world and move the proceeds to their Equity Bank accounts. This new service allows PayPal users
to withdraw funds to their qualifying Equity Bank accounts from their PayPal accounts.
CEO’S STATEMENT
7/21/2019 Equity Bank Group Annual Report 2013
http://slidepdf.com/reader/full/equity-bank-group-annual-report-2013 16/124
EQUITY BANK LIMITED AND SUBSIDIARIES | ANNUAL REPORT AND FINANCIAL STATEMENTS
FOR THE YEAR ENDED 31 DECEMBER 2013
Pg
14
CEO’S STATEMENT
INNOVATIONS AND TECHNOLOGY
Equity Bank Group successfully upgraded the Group’s integrated and robust IT platform which will enable the Bankroll out its future technology driven innovative products, provide comprehensive business functionality and enhance
customer experience. This was in partnership with Infosys Technology, IBM, Oracle and Open Way Group. The enhanced
solution allows over 8.4 million Equity Bank customers to transact seamlessly across five countries- Kenya, Uganda,
Rwanda, Tanzania and South Sudan.
SME Banking
The Bank in collaboration with our development partners set out to scale up and support SMEs in the country by
offering comprehensive business advisory and creative solutions to support their growth and development. The Bank
also launched Equity Business Club that will support businesses and entrepreneurs across East Africa.
The Bank started revamping the product offering to this segment, opened 7 Supreme Branches, recruited and is
training additional relationship managers and officers and refocusing of Equity Investment Bank to SME advisory
services. Consequently, lending to Small and Medium Sized enterprises (SMEs) increased by 28 percent to KShs 81.25billion during the year. To date, the SME sector accounts for about 46 percent of the bank’s loan book.
Agency Banking
The number of Equity Group agents stood at over 10,260 as at December 2013. Cash deposits and withdrawal
transactions by agents grew by 47 percent between 2012 and 2013. Agents’ transactions accounted for 33 percent of
total bank cash transactions.
Agency banking pioneered in Kenya by Equity Bank has proved very successful. It has been approved by regulators in
both Rwanda and Tanzania with Rwanda having 570 active agents and Tanzania 133. Having gained wide acceptance,
focus will now shift to the commercial dimension of the model to achieve full value. The Bank will continue to roll out
new products with the customers at the heart of its operation.
Mobile banking
The year 2013 saw continued success in the roll out of mobile banking services. The number of customers using mobile
banking increased to 2.8 million up from 2.1 million as at the end of 2012.The Bank will continue to innovate around
this space to enhance affordability, accessibility and convenience in line with our objective of increasing financial
inclusion in the region.
Partnership with lenders
In order to support lending to the Small and Medium Enterprises (SME’s), agriculture and women entrepreneurs in the
region, the Bank entered into a long term loan agreement with the International Finance Corporation (IFC), a member
of the World Bank Group, who extended a Kshs 8.3 billion (US$100 million) loan to Equity Bank Group to support
lending to these segments. The financing will support the growth of Equity Bank Group’s lending portfolio in Kenya,
Uganda,Tanzania, South Sudan and Rwanda.
Brand visibility through Community Partnerships
The Wings to Fly scholarship program a partnership between Equity Group Foundation and The MasterCard Foundation
and leveraging on Equity Bank infrastructure has continued to grow from strength to strength since it was launched by
former President Mwai Kibaki in 2011 with 5,000 scholarships worth USD 40.9M from The MasterCard Foundation. To
date, the program has secured additional scholarships comprising of 600 scholarships from UKAID, 2,678 scholarships
from USAID, 350 from KfW and a few more through the generous donation of individuals and corporates. This brings
the total to over 10,000 scholarships which was the target set for 2015.
7/21/2019 Equity Bank Group Annual Report 2013
http://slidepdf.com/reader/full/equity-bank-group-annual-report-2013 17/124
EQUITY BANK LIMITED AND SUBSIDIARIES | ANNUAL REPORT AND FINANCIAL STATEMENTS
FOR THE YEAR ENDED 31 DECEMBER 2013
Pg
15
The Bank through Equity Group Foundation has continued sponsoring the best boy and best girl in each district where
it has a branch for their University education. The program dubbed Equity African Leadership Program (EALP) has
benefited over 1,550 best students since 1998 with over 100 of them been admitted to top global universities includingHarvard, Yale, London Business School, Stanford among others.
In an effort to broaden financial access and deepen financial inclusion, the Bank through Equity Group Foundation in
partnership with The MasterCard Foundation rolled out a financial literacy program that has trained over one million
youth and women beneficiaries as at the end of 2013. Branded Financial Knowledge for Africa (FiKA) the programme
is supporting the growth of SMEs as drivers of economic growth by empowering entrepreneur’s with knowledge,
attitude and skills to better manage their businesses.
STAFF
Equity bank continued to invest in its staff to ensure all employees were well equipped for their roles. Equity bank has
developed career training, mentoring and coaching programs that meet the needs of every staff member. With a total
capacity of nearly 8,000 very talented staff, the bank is poised for the next level of growth in Kenya and the region.During the year, in order to strengthen our competitiveness and innovativeness, the bank made some senior staff
appointments. The bank appointed Reuben Mbindu as Human Resources Director. It also appointed Raphael Hukai as
the Chief Information Officer and Enrico Nora to lead the mobile banking unit.
2014 OUTLOOK
Despite the difficult prevailing market conditions, the Group’s commitment to its long-term strategy has enabled
the bank to capture emerging growth opportunities in Kenya and the region. We expect that the growth momentum
will be sustained through maintaining an efficient operating structure, robust agency network and mobile banking,
focus on SME to embed client graduation process, prudent lending and risk management. The Group will continue
to implement a winning strategy that focuses on delivering value to the customer, disciplined cost management and
increasing productivity of the subsidiaries.
The Group plans to enhance its market share through consolidation of the regional business; rolling out electronicdelivery channels and expanding agency banking in the recently established counties.
With the fundamentals strengthened, massive investment made and improving macro-economic environment creating
huge opportunities, the outlook for 2014 looks promising.
CONCLUSION
Let me conclude my remarks by expressing my gratitude to all who have enabled the Group achieve the success
registered in 2013. This includes all our clients in the region for remaining loyal to the Bank and continuing to trust us.
I thank the shareholders, development partners and strategic business partners for your continued support and the
Board for its guidance and continued support.
Finally, all the aforementioned achievements were made possible by a passionate and enthusiastic team at Equity
Bank Group comprising nearly 8,000 staff members. Thank you for continuing to live our brand pillars, essence and
core values. I am confident that together guided by a common purpose and vision we shall be able to steer the Groupto even greater heights of success and prosperity.
Thank you
Dr James Mwangi, CBS
Chief Executive Officer & Managing Director
CEO’S STATEMENT
7/21/2019 Equity Bank Group Annual Report 2013
http://slidepdf.com/reader/full/equity-bank-group-annual-report-2013 18/124
EQUITY BANK LIMITED AND SUBSIDIARIES | ANNUAL REPORT AND FINANCIAL STATEMENTS
FOR THE YEAR ENDED 31 DECEMBER 2013
Pg
16
FINANCIAL HIGHLIGHTS
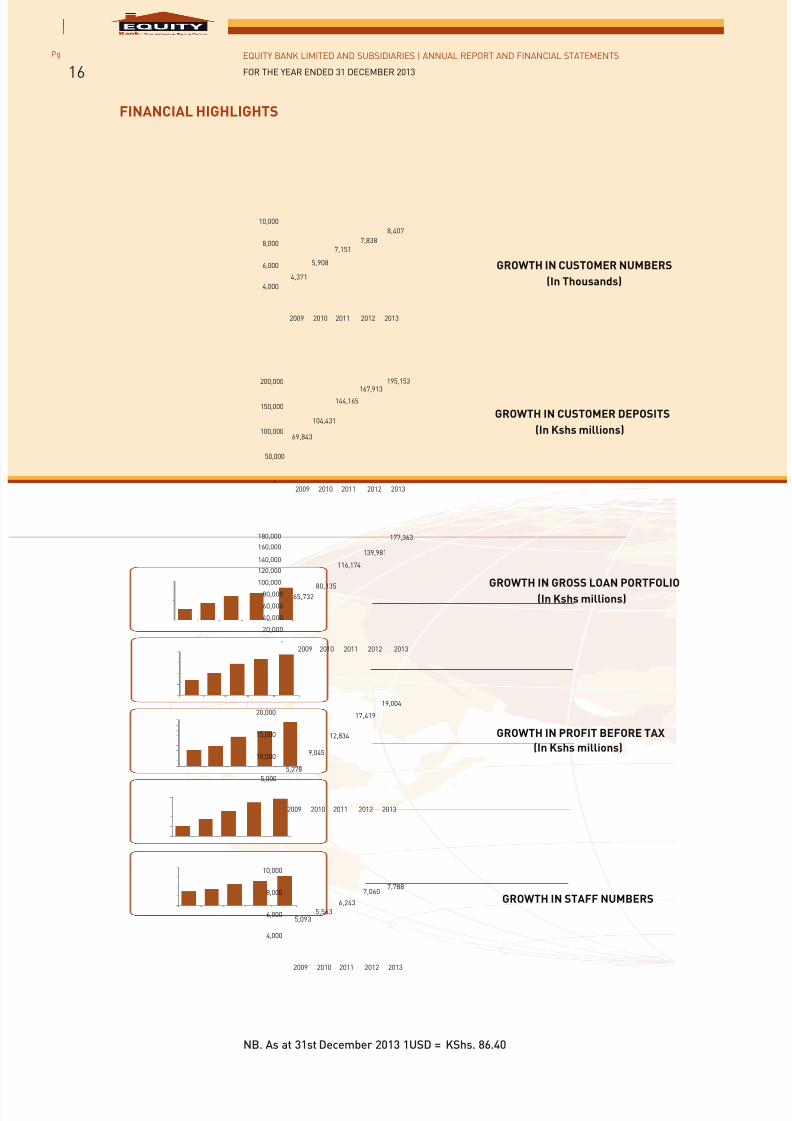
5,278
9,045
12,834
17,419
19,004
5,000
10,000
15,000
20,000
2009 2010 2011 2012 2013
GROWTH IN PROFIT BEFORE TAX
(In Kshs millions)
4,371
5,908
7,151
7,838
8,407
4,000
6,000
8,000
10,000
2009 2010 2011 2012 2013
GROWTH IN CUSTOMER NUMBERS
(In Thousands)
65,732
80,135
116,174
139,981
177,363
-
20,000
40,000
60,000
80,000
100,000
120,000
140,000
160,000
180,000
2009 2010 2011 2012 2013
GROWTH IN GROSS LOAN PORTFOLIO(In Kshs millions)
5,0935,563
6,243
7,0607,788
4,000
6,000
8,000
10,000
2009 2010 2011 2012 2013
GROWTH IN STAFF NUMBERS
69,843
104,431
144,165
195,153
-
50,000
100,000
150,000
200,000
2009 2010 2011
167,913
2012 2013
GROWTH IN CUSTOMER DEPOSITS
(In Kshs millions)
NB. As at 31st December 2013 1USD = KShs. 86.40
7/21/2019 Equity Bank Group Annual Report 2013
http://slidepdf.com/reader/full/equity-bank-group-annual-report-2013 19/124
EQUITY BANK LIMITED AND SUBSIDIARIES | ANNUAL REPORT AND FINANCIAL STATEMENTS
FOR THE YEAR ENDED 31 DECEMBER 2013
Pg
17
FINANCIAL HIGHLIGHTS
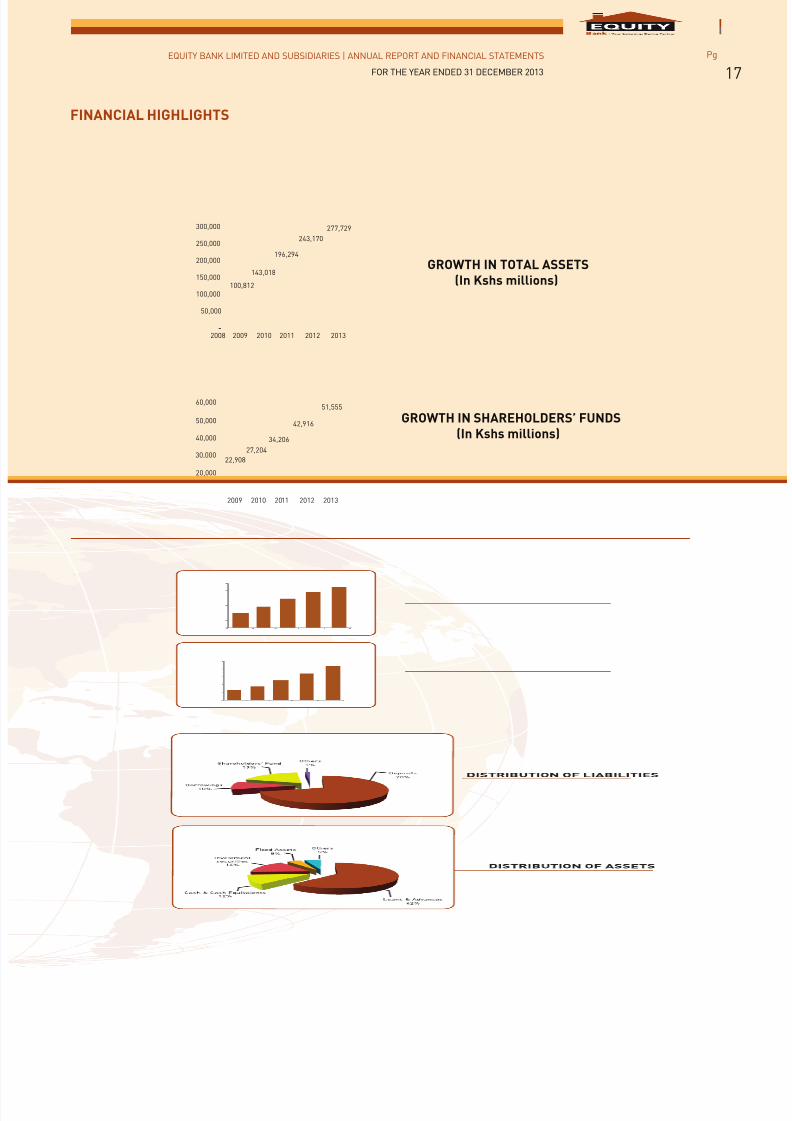
22,908
27,204
34,206
42,916
51,555
30,000
20,000
40,000
50,000
60,000
2009 2010 2011 2012 2013
GROWTH IN SHAREHOLDERS’ FUNDS
(In Kshs millions)
100,812
143,018
196,294
243,170
277,729
-
50,000
100,000
150,000
200,000
250,000
300,000
2008 2009 2010 2011 2012 2013
GROWTH IN TOTAL ASSETS
(In Kshs millions)
7/21/2019 Equity Bank Group Annual Report 2013
http://slidepdf.com/reader/full/equity-bank-group-annual-report-2013 20/124
EQUITY BANK LIMITED AND SUBSIDIARIES | ANNUAL REPORT AND FINANCIAL STATEMENTS
FOR THE YEAR ENDED 31 DECEMBER 2013
Pg
18
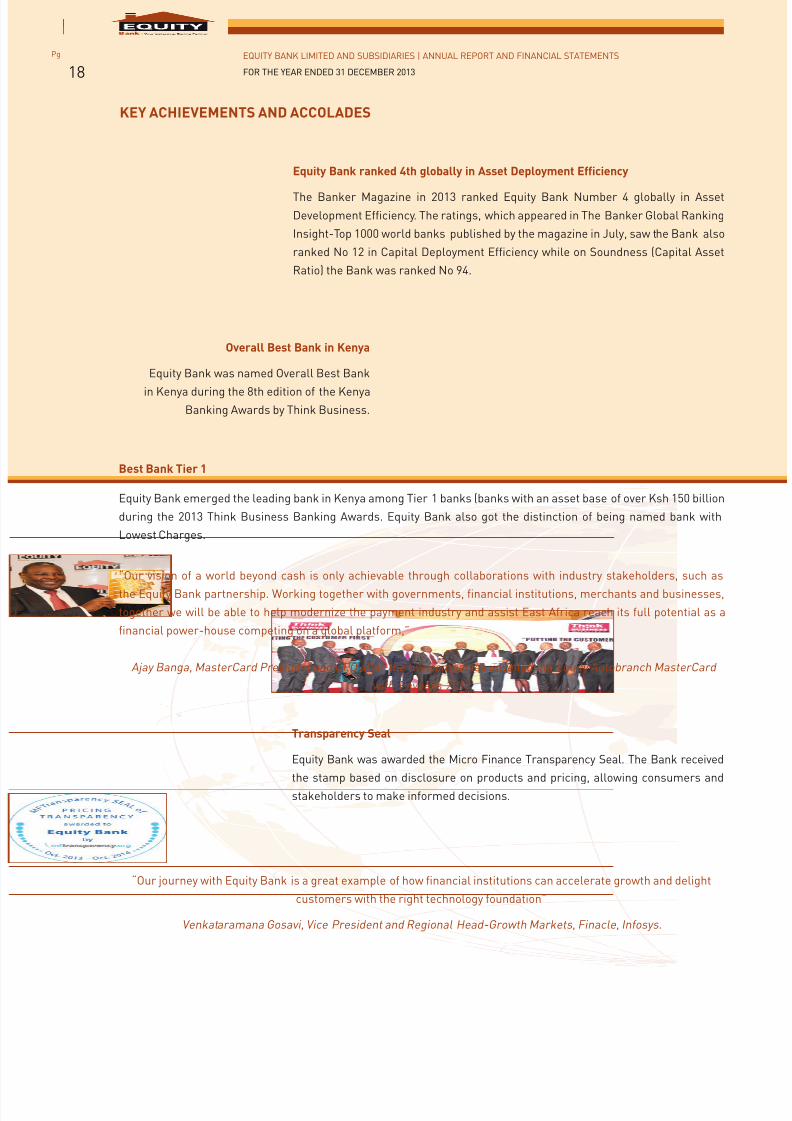
Equity Bank ranked 4th globally in Asset Deployment Efficiency
The Banker Magazine in 2013 ranked Equity Bank Number 4 globally in Asset
Development Efficiency. The ratings, which appeared in The Banker Global Ranking
Insight-Top 1000 world banks published by the magazine in July, saw the Bank also
ranked No 12 in Capital Deployment Efficiency while on Soundness (Capital Asset
Ratio) the Bank was ranked No 94.
Overall Best Bank in Kenya
Equity Bank was named Overall Best Bank
in Kenya during the 8th edition of the Kenya
Banking Awards by Think Business.
Best Bank Tier 1
Equity Bank emerged the leading bank in Kenya among Tier 1 banks (banks with an asset base of over Ksh 150 billion
during the 2013 Think Business Banking Awards. Equity Bank also got the distinction of being named bank with
Lowest Charges.
“Our vision of a world beyond cash is only achievable through collaborations with industry stakeholders, such as
the Equity Bank partnership. Working together with governments, financial institutions, merchants and businesses,
together we will be able to help modernize the payment industry and assist East Africa reach its full potential as a
financial power-house competing on a global platform,”
Ajay Banga, MasterCard President and CEO after the two companies unveiled the Equity Autobranch MasterCard
with Paypass 2013
Transparency Seal
Equity Bank was awarded the Micro Finance Transparency Seal. The Bank received
the stamp based on disclosure on products and pricing, allowing consumers andstakeholders to make informed decisions.
“Our journey with Equity Bank is a great example of how financial institutions can accelerate growth and delight
customers with the right technology foundation”
Venkataramana Gosavi, Vice President and Regional Head-Growth Markets, Finacle, Infosys.
KEY ACHIEVEMENTS AND ACCOLADES
7/21/2019 Equity Bank Group Annual Report 2013
http://slidepdf.com/reader/full/equity-bank-group-annual-report-2013 21/124
EQUITY BANK LIMITED AND SUBSIDIARIES | ANNUAL REPORT AND FINANCIAL STATEMENTS
FOR THE YEAR ENDED 31 DECEMBER 2013
Pg
19
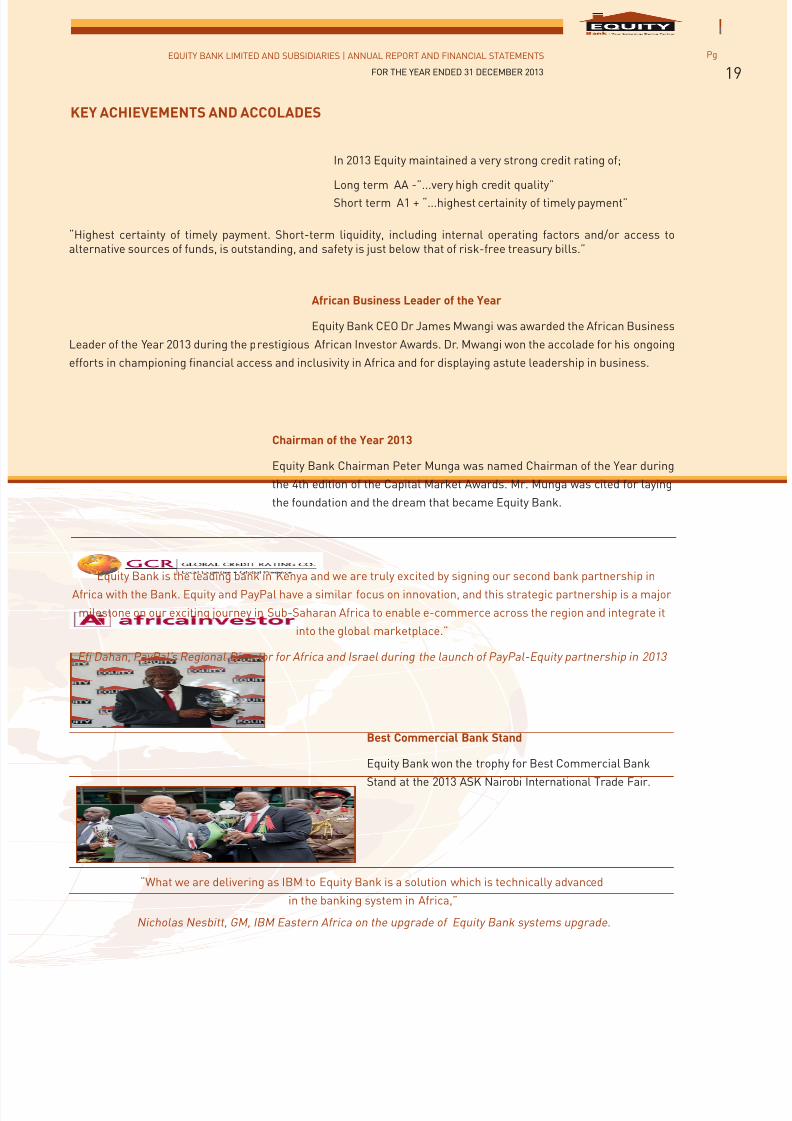
In 2013 Equity maintained a very strong credit rating of;
Long term AA -”...very high credit quality”
Short term A1 + “...highest certainity of timely payment”
“Highest certainty of timely payment. Short-term liquidity, including internal operating factors and/or access toalternative sources of funds, is outstanding, and safety is just below that of risk-free treasury bills.”
African Business Leader of the Year
Equity Bank CEO Dr James Mwangi was awarded the African Business
Leader of the Year 2013 during the prestigious African Investor Awards. Dr. Mwangi won the accolade for his ongoing
efforts in championing financial access and inclusivity in Africa and for displaying astute leadership in business.
Chairman of the Year 2013
Equity Bank Chairman Peter Munga was named Chairman of the Year during
the 4th edition of the Capital Market Awards. Mr. Munga was cited for laying
the foundation and the dream that became Equity Bank.
“Equity Bank is the leading bank in Kenya and we are truly excited by signing our second bank partnership in
Africa with the Bank. Equity and PayPal have a similar focus on innovation, and this strategic partnership is a major
milestone on our exciting journey in Sub-Saharan Africa to enable e-commerce across the region and integrate it
into the global marketplace.”
Efi Dahan, PayPal’s Regional Director for Africa and Israel during the launch of PayPal-Equity partnership in 2013
Best Commercial Bank Stand
Equity Bank won the trophy for Best Commercial Bank
Stand at the 2013 ASK Nairobi International Trade Fair.
“What we are delivering as IBM to Equity Bank is a solution which is technically advanced
in the banking system in Africa,”
Nicholas Nesbitt, GM, IBM Eastern Africa on the upgrade of Equity Bank systems upgrade.
KEY ACHIEVEMENTS AND ACCOLADES
7/21/2019 Equity Bank Group Annual Report 2013
http://slidepdf.com/reader/full/equity-bank-group-annual-report-2013 22/124
EQUITY BANK LIMITED AND SUBSIDIARIES | ANNUAL REPORT AND FINANCIAL STATEMENTS
FOR THE YEAR ENDED 31 DECEMBER 2013
Pg
20
KEY ACHIEVEMENTS AND ACCOLADES
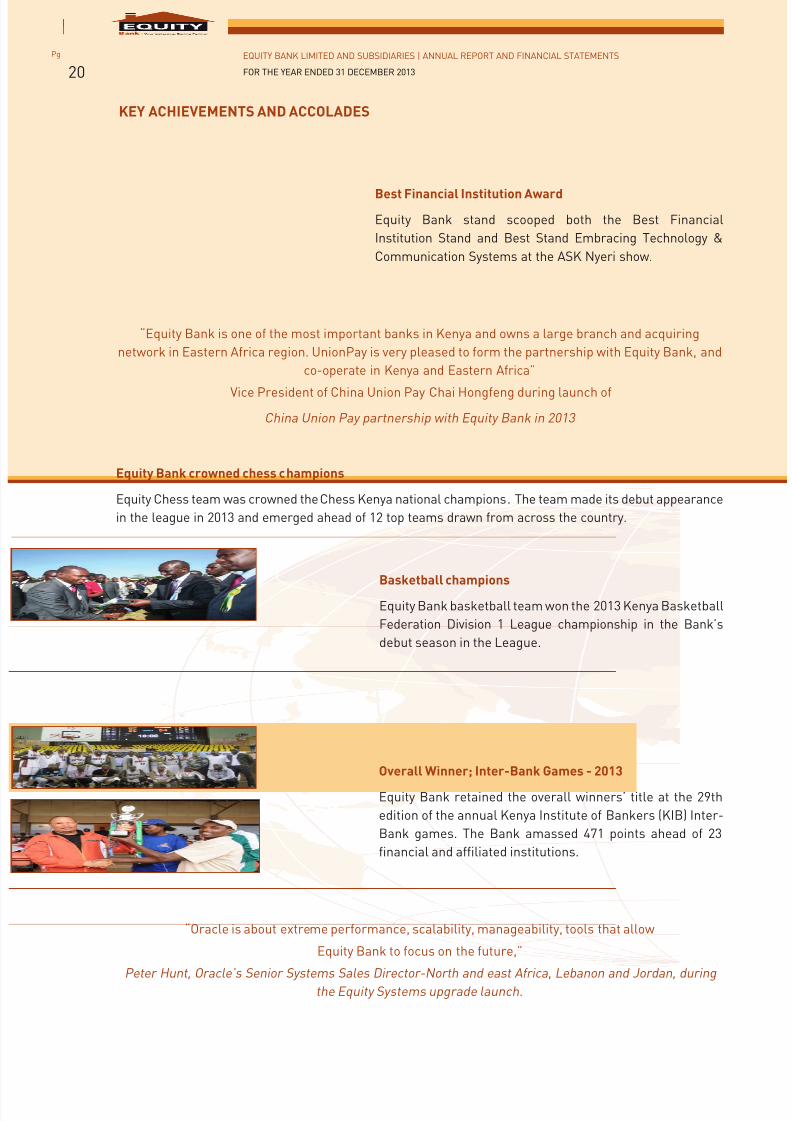
Best Financial Institution Award
Equity Bank stand scooped both the Best Financial
Institution Stand and Best Stand Embracing Technology &
Communication Systems at the ASK Nyeri show.
“Equity Bank is one of the most important banks in Kenya and owns a large branch and acquiring
network in Eastern Africa region. UnionPay is very pleased to form the partnership with Equity Bank, and
co-operate in Kenya and Eastern Africa”
Vice President of China Union Pay Chai Hongfeng during launch of
China Union Pay partnership with Equity Bank in 2013
Equity Bank crowned chess champions
Equity Chess team was crowned the Chess Kenya national champions. The team made its debut appearance
in the league in 2013 and emerged ahead of 12 top teams drawn from across the country.
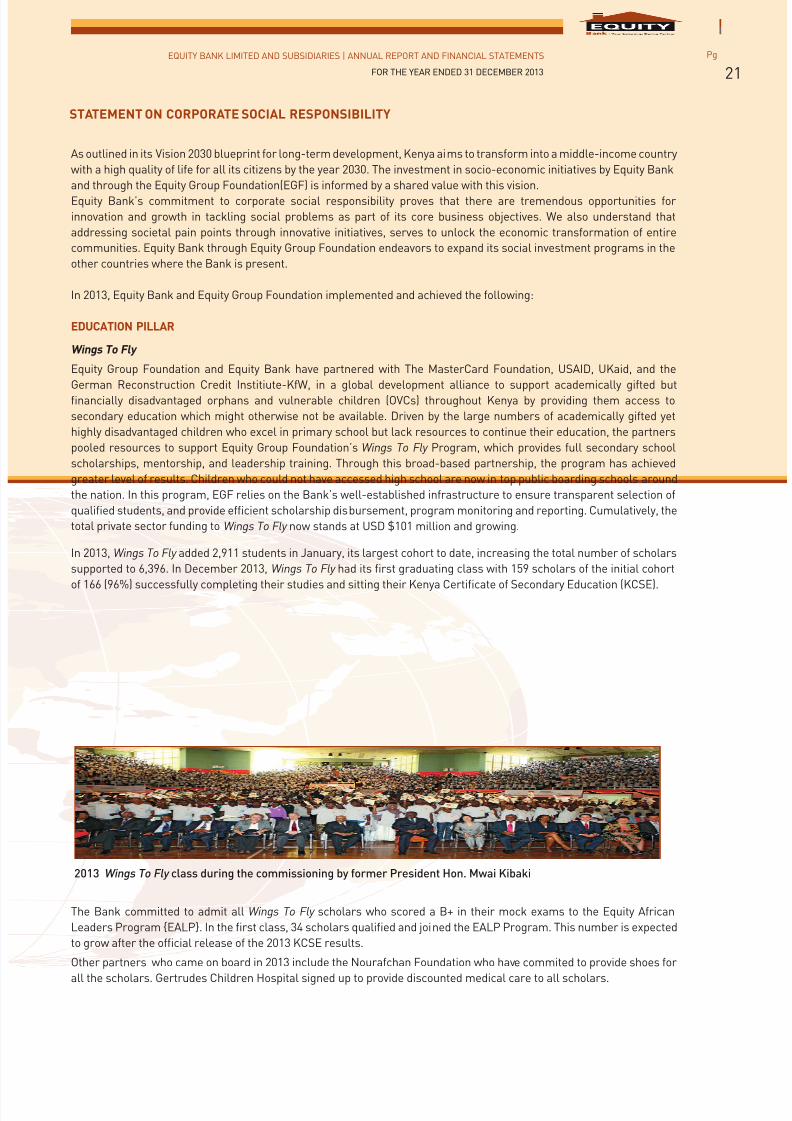
Basketball championsEquity Bank basketball team won the 2013 Kenya Basketball
Federation Division 1 League championship in the Bank’s
debut season in the League.
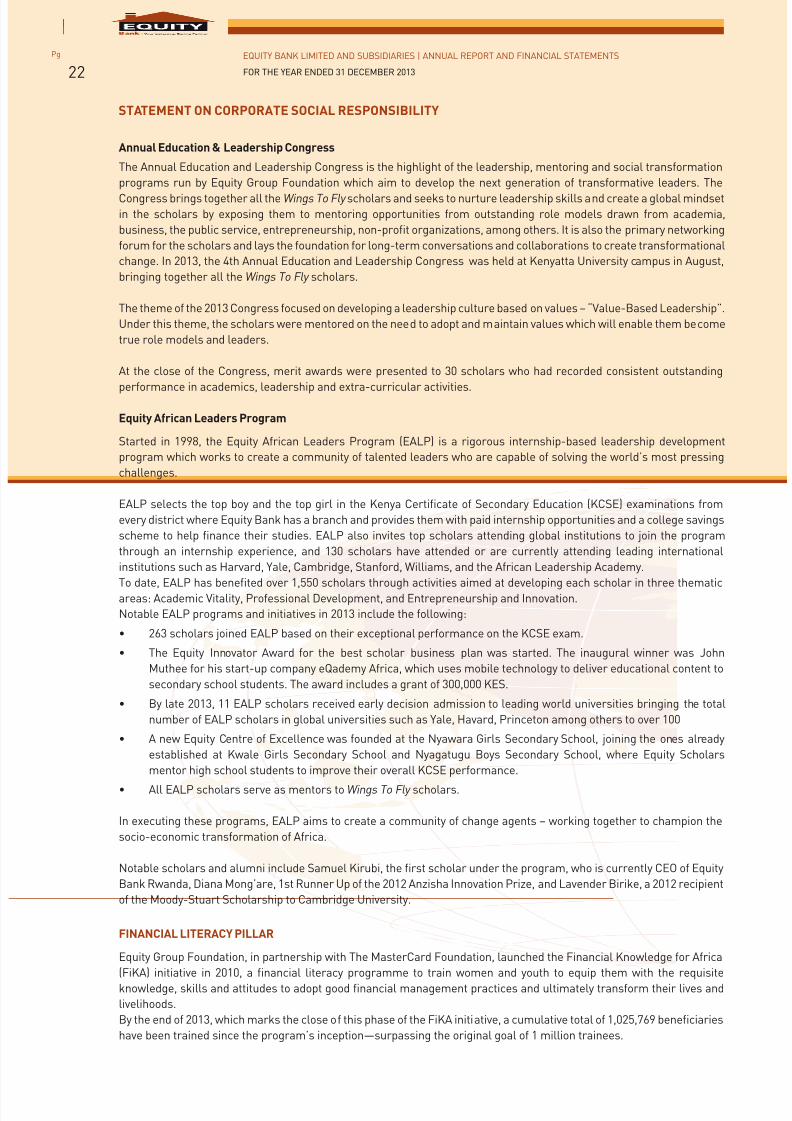
Overall Winner; Inter-Bank Games - 2013Equity Bank retained the overall winners’ title at the 29th
edition of the annual Kenya Institute of Bankers (KIB) Inter-
Bank games. The Bank amassed 471 points ahead of 23
financial and affiliated institutions.
“Oracle is about extreme performance, scalability, manageability, tools that allow
Equity Bank to focus on the future,”
Peter Hunt, Oracle’s Senior Systems Sales Director-North and east Africa, Lebanon and Jordan, duringthe Equity Systems upgrade launch.
7/21/2019 Equity Bank Group Annual Report 2013
http://slidepdf.com/reader/full/equity-bank-group-annual-report-2013 23/124
EQUITY BANK LIMITED AND SUBSIDIARIES | ANNUAL REPORT AND FINANCIAL STATEMENTS
FOR THE YEAR ENDED 31 DECEMBER 2013
Pg
21
As outlined in its Vision 2030 blueprint for long-term development, Kenya aims to transform into a middle-income country
with a high quality of life for all its citizens by the year 2030. The investment in socio-economic initiatives by Equity Bank
and through the Equity Group Foundation(EGF) is informed by a shared value with this vision.
Equity Bank’s commitment to corporate social responsibility proves that there are tremendous opportunities for
innovation and growth in tackling social problems as part of its core business objectives. We also understand that
addressing societal pain points through innovative initiatives, serves to unlock the economic transformation of entire
communities. Equity Bank through Equity Group Foundation endeavors to expand its social investment programs in the
other countries where the Bank is present.
In 2013, Equity Bank and Equity Group Foundation implemented and achieved the following:
EDUCATION PILLAR
Wings To Fly
Equity Group Foundation and Equity Bank have partnered with The MasterCard Foundation, USAID, UKaid, and the
German Reconstruction Credit Institiute-KfW, in a global development alliance to support academically gifted butfinancially disadvantaged orphans and vulnerable children (OVCs) throughout Kenya by providing them access to
secondary education which might otherwise not be available. Driven by the large numbers of academically gifted yet
highly disadvantaged children who excel in primary school but lack resources to continue their education, the partners
pooled resources to support Equity Group Foundation’s Wings To Fly Program, which provides full secondary school
scholarships, mentorship, and leadership training. Through this broad-based partnership, the program has achieved
greater level of results. Children who could not have accessed high school are now in top public boarding schools around
the nation. In this program, EGF relies on the Bank’s well-established infrastructure to ensure transparent selection of
qualified students, and provide efficient scholarship disbursement, program monitoring and reporting. Cumulatively, the
total private sector funding to Wings To Fly now stands at USD $101 million and growing.
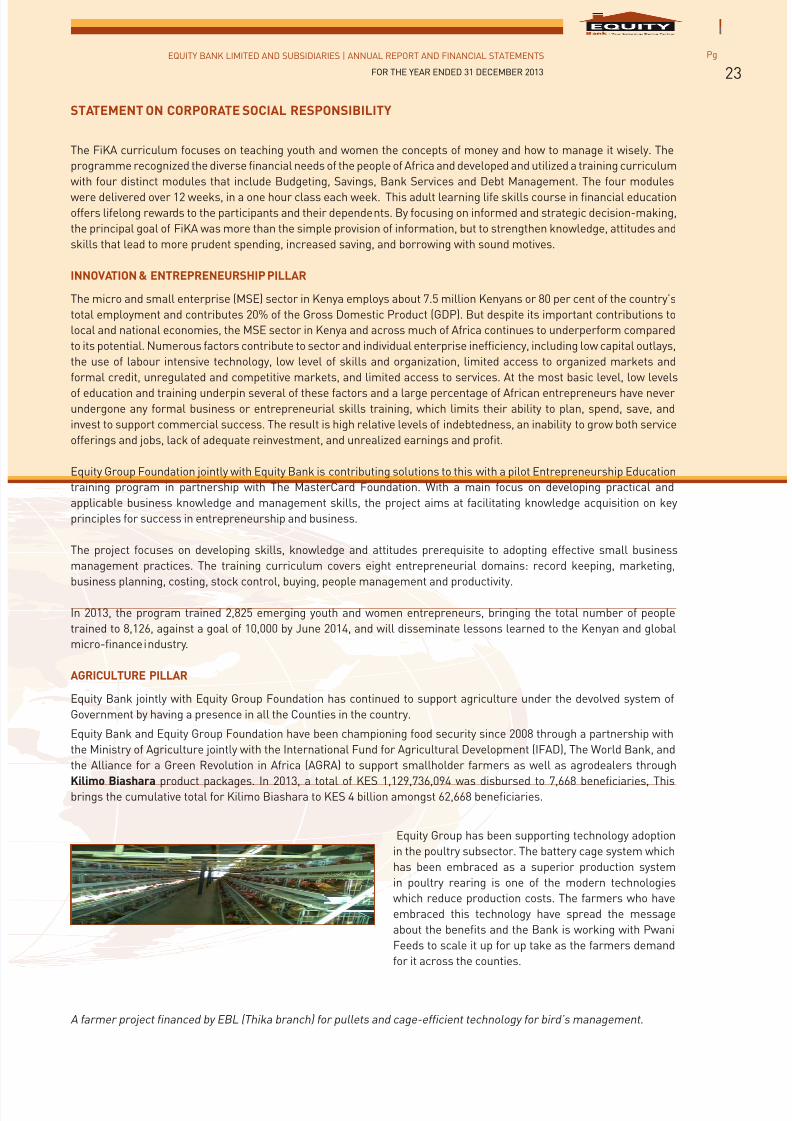
In 2013, Wings To Fly added 2,911 students in January, its largest cohort to date, increasing the total number of scholars
supported to 6,396. In December 2013, Wings To Fly had its first graduating class with 159 scholars of the initial cohort
of 166 (96%) successfully completing their studies and sitting their Kenya Certificate of Secondary Education (KCSE).
The Bank committed to admit all Wings To Fly scholars who scored a B+ in their mock exams to the Equity African
Leaders Program {EALP}. In the first class, 34 scholars qualified and joined the EALP Program. This number is expected
to grow after the official release of the 2013 KCSE results.
Other partners who came on board in 2013 include the Nourafchan Foundation who have commited to provide shoes for
all the scholars. Gertrudes Children Hospital signed up to provide discounted medical care to all scholars.
STATEMENT ON CORPORATE SOCIAL RESPONSIBILITY
2013 Wings To Fly class during the commissioning by former President Hon. Mwai Kibaki
7/21/2019 Equity Bank Group Annual Report 2013
http://slidepdf.com/reader/full/equity-bank-group-annual-report-2013 24/124
EQUITY BANK LIMITED AND SUBSIDIARIES | ANNUAL REPORT AND FINANCIAL STATEMENTS
FOR THE YEAR ENDED 31 DECEMBER 2013
Pg
22
STATEMENT ON CORPORATE SOCIAL RESPONSIBILITY
Annual Education & Leadership Congress
The Annual Education and Leadership Congress is the highlight of the leadership, mentoring and social transformation
programs run by Equity Group Foundation which aim to develop the next generation of transformative leaders. The
Congress brings together all the Wings To Fly scholars and seeks to nurture leadership skills and create a global mindsetin the scholars by exposing them to mentoring opportunities from outstanding role models drawn from academia,
business, the public service, entrepreneurship, non-profit organizations, among others. It is also the primary networking
forum for the scholars and lays the foundation for long-term conversations and collaborations to create transformational
change. In 2013, the 4th Annual Education and Leadership Congress was held at Kenyatta University campus in August,
bringing together all the Wings To Fly scholars.
The theme of the 2013 Congress focused on developing a leadership culture based on values – “Value-Based Leadership”.
Under this theme, the scholars were mentored on the need to adopt and maintain values which will enable them become
true role models and leaders.
At the close of the Congress, merit awards were presented to 30 scholars who had recorded consistent outstanding
performance in academics, leadership and extra-curricular activities.
Equity African Leaders Program
Started in 1998, the Equity African Leaders Program (EALP) is a rigorous internship-based leadership development
program which works to create a community of talented leaders who are capable of solving the world’s most pressing
challenges.
EALP selects the top boy and the top girl in the Kenya Certificate of Secondary Education (KCSE) examinations from
every district where Equity Bank has a branch and provides them with paid internship opportunities and a college savings
scheme to help finance their studies. EALP also invites top scholars attending global institutions to join the program
through an internship experience, and 130 scholars have attended or are currently attending leading international
institutions such as Harvard, Yale, Cambridge, Stanford, Williams, and the African Leadership Academy.
To date, EALP has benefited over 1,550 scholars through activities aimed at developing each scholar in three thematicareas: Academic Vitality, Professional Development, and Entrepreneurship and Innovation.
Notable EALP programs and initiatives in 2013 include the following:
• 263 scholars joined EALP based on their exceptional performance on the KCSE exam.
• The Equity Innovator Award for the best scholar business plan was started. The inaugural winner was John
Muthee for his start-up company eQademy Africa, which uses mobile technology to deliver educational content to
secondary school students. The award includes a grant of 300,000 KES.
• By late 2013, 11 EALP scholars received early decision admission to leading world universities bringing the total
number of EALP scholars in global universities such as Yale, Havard, Princeton among others to over 100
• A new Equity Centre of Excellence was founded at the Nyawara Girls Secondary School, joining the ones already
established at Kwale Girls Secondary School and Nyagatugu Boys Secondary School, where Equity Scholars
mentor high school students to improve their overall KCSE performance.
• All EALP scholars serve as mentors to Wings To Fly scholars.
In executing these programs, EALP aims to create a community of change agents – working together to champion the
socio-economic transformation of Africa.
Notable scholars and alumni include Samuel Kirubi, the first scholar under the program, who is currently CEO of Equity
Bank Rwanda, Diana Mong’are, 1st Runner Up of the 2012 Anzisha Innovation Prize, and Lavender Birike, a 2012 recipient
of the Moody-Stuart Scholarship to Cambridge University.
FINANCIAL LITERACY PILLAR
Equity Group Foundation, in partnership with The MasterCard Foundation, launched the Financial Knowledge for Africa
(FiKA) initiative in 2010, a financial literacy programme to train women and youth to equip them with the requisiteknowledge, skills and attitudes to adopt good financial management practices and ultimately transform their lives and
livelihoods.
By the end of 2013, which marks the close of this phase of the FiKA initiative, a cumulative total of 1,025,769 beneficiaries
have been trained since the program’s inception—surpassing the original goal of 1 million trainees.
7/21/2019 Equity Bank Group Annual Report 2013
http://slidepdf.com/reader/full/equity-bank-group-annual-report-2013 25/124
EQUITY BANK LIMITED AND SUBSIDIARIES | ANNUAL REPORT AND FINANCIAL STATEMENTS
FOR THE YEAR ENDED 31 DECEMBER 2013
Pg
23
The FiKA curriculum focuses on teaching youth and women the concepts of money and how to manage it wisely. The
programme recognized the diverse financial needs of the people of Africa and developed and utilized a training curriculum
with four distinct modules that include Budgeting, Savings, Bank Services and Debt Management. The four modules
were delivered over 12 weeks, in a one hour class each week. This adult learning life skills course in financial educationoffers lifelong rewards to the participants and their dependents. By focusing on informed and strategic decision-making,
the principal goal of FiKA was more than the simple provision of information, but to strengthen knowledge, attitudes and
skills that lead to more prudent spending, increased saving, and borrowing with sound motives.
INNOVATION & ENTREPRENEURSHIP PILLAR
The micro and small enterprise (MSE) sector in Kenya employs about 7.5 million Kenyans or 80 per cent of the country’s
total employment and contributes 20% of the Gross Domestic Product (GDP). But despite its important contributions to
local and national economies, the MSE sector in Kenya and across much of Africa continues to underperform compared
to its potential. Numerous factors contribute to sector and individual enterprise inefficiency, including low capital outlays,
the use of labour intensive technology, low level of skills and organization, limited access to organized markets and
formal credit, unregulated and competitive markets, and limited access to services. At the most basic level, low levels
of education and training underpin several of these factors and a large percentage of African entrepreneurs have neverundergone any formal business or entrepreneurial skills training, which limits their ability to plan, spend, save, and
invest to support commercial success. The result is high relative levels of indebtedness, an inability to grow both service
offerings and jobs, lack of adequate reinvestment, and unrealized earnings and profit.
Equity Group Foundation jointly with Equity Bank is contributing solutions to this with a pilot Entrepreneurship Education
training program in partnership with The MasterCard Foundation. With a main focus on developing practical and
applicable business knowledge and management skills, the project aims at facilitating knowledge acquisition on key
principles for success in entrepreneurship and business.
The project focuses on developing skills, knowledge and attitudes prerequisite to adopting effective small business
management practices. The training curriculum covers eight entrepreneurial domains: record keeping, marketing,
business planning, costing, stock control, buying, people management and productivity.
In 2013, the program trained 2,825 emerging youth and women entrepreneurs, bringing the total number of people
trained to 8,126, against a goal of 10,000 by June 2014, and will disseminate lessons learned to the Kenyan and global
micro-finance industry.
AGRICULTURE PILLAR
Equity Bank jointly with Equity Group Foundation has continued to support agriculture under the devolved system of
Government by having a presence in all the Counties in the country.
Equity Bank and Equity Group Foundation have been championing food security since 2008 through a partnership with
the Ministry of Agriculture jointly with the International Fund for Agricultural Development (IFAD), The World Bank, and
the Alliance for a Green Revolution in Africa (AGRA) to support smallholder farmers as well as agrodealers through
Kilimo Biashara product packages. In 2013, a total of KES 1,129,736,094 was disbursed to 7,668 beneficiaries, Thisbrings the cumulative total for Kilimo Biashara to KES 4 billion amongst 62,668 beneficiaries.
Equity Group has been supporting technology adoption
in the poultry subsector. The battery cage system which
has been embraced as a superior production system
in poultry rearing is one of the modern technologies
which reduce production costs. The farmers who have
embraced this technology have spread the message
about the benefits and the Bank is working with Pwani
Feeds to scale it up for up take as the farmers demand
for it across the counties.
A farmer project financed by EBL (Thika branch) for pullets and cage-efficient technology for bird’s management.
STATEMENT ON CORPORATE SOCIAL RESPONSIBILITY
7/21/2019 Equity Bank Group Annual Report 2013
http://slidepdf.com/reader/full/equity-bank-group-annual-report-2013 26/124
EQUITY BANK LIMITED AND SUBSIDIARIES | ANNUAL REPORT AND FINANCIAL STATEMENTS
FOR THE YEAR ENDED 31 DECEMBER 2013
Pg
24
STATEMENT ON CORPORATE SOCIAL RESPONSIBILITY
The Bank and Equity Group Foundation, has successfully championed
food security agenda through financing irrigation schemes as
mitigation toward climatic change as the country endeavor towards
paradigm shift from rain fed agriculture to more sustainable food
production mechanism where water conservation and utilization
provides pivotal role in food production.
The Smallholder Irrigation Project for Mt Kenya region has seen the
number of beneficiary households reach 4,694 covering a total of
1,799.32 acres in food production. Equity Bank financed 50 percent
of the infrastructure to the tune of KES 312,275,200 which has
been disbursed under a unique financing mechanism through the
cooperatives which manages the water catchment. Equity Group
supports farmers with loans and financial education training then
link them to market such as horticulture exporting companies. Other
irrigation schemes supported include Wei Wei, Sandai, Parkera,Bura, Hola and Bunyala.
Equity Bank continued to reach out to farmers through farmers field
days, exhibitions, ASK Shows etc. During these events Equity Group
Foundation train farmers on the importance of financial access.
The Bank in an effort to develop farmers’ capacity has introduced
a farmer to farmer learning programme. delivered by Equity Group
Foundation. During the year 2013 farmers from Ena Irrigation
Cooperative Society were supported to take a tour to Wambugu Farm,
Mariba Farmer Group in Nkubu and Sagana Farmer Group.
Prof. Judith Bahemuka (centre) receives sponsorship cheque
from Esther Muiruri GM Agribusiness (extreme left) during the
Annual Agricultural Trade Fair at University of Eldoret. Wheat rustresistant variety was launched during the forum where the theme
was transforming Agriculture through knowledge, innovation and
technology application.
BGDM Bungoma Erick Tuda receives Best Financial Instituion
certificate from FAO Representative Robert Alliport during the World
Food Day held in Bungoma County. Equity Bank dictated items for
awarding to outstanding farmers.
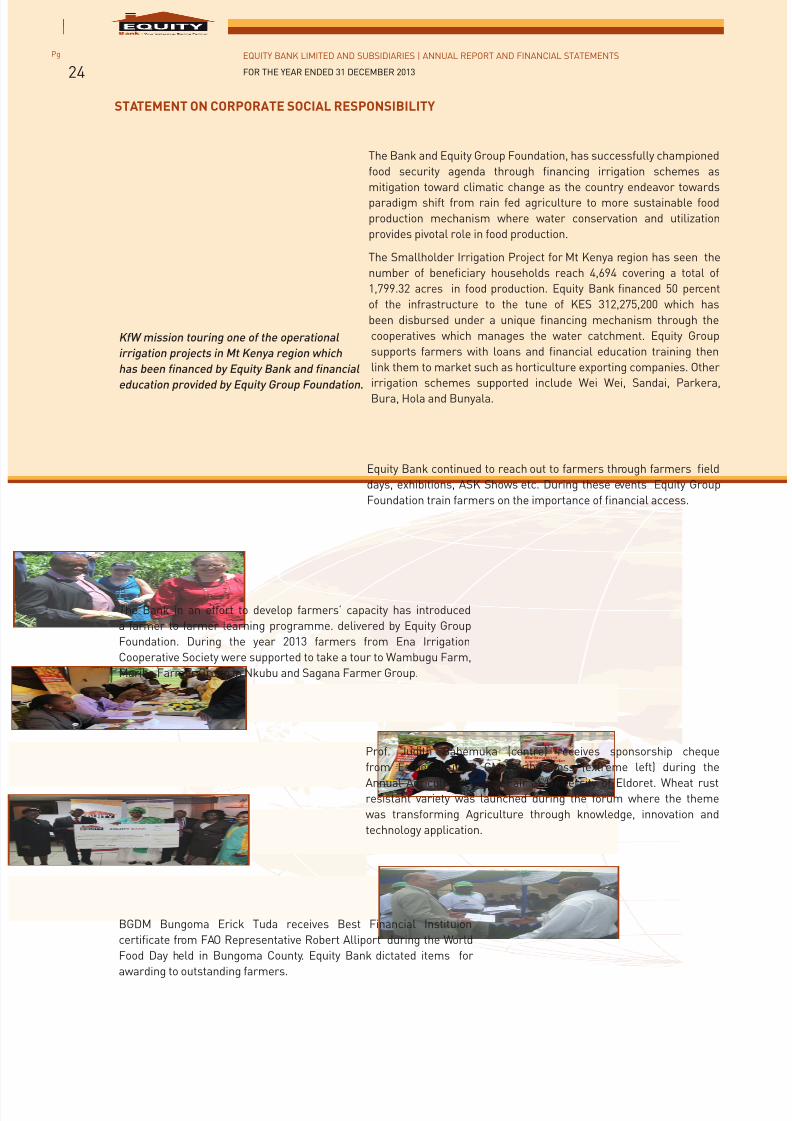
KfW mission touring one of the operational
irrigation projects in Mt Kenya region which
has been financed by Equity Bank and financial
education provided by Equity Group Foundation.
7/21/2019 Equity Bank Group Annual Report 2013
http://slidepdf.com/reader/full/equity-bank-group-annual-report-2013 27/124
EQUITY BANK LIMITED AND SUBSIDIARIES | ANNUAL REPORT AND FINANCIAL STATEMENTS
FOR THE YEAR ENDED 31 DECEMBER 2013
Pg
25
Unlocking Agriculture Potential through Medium Sized Farms
In late 2013, Equity Group Foundation launched an innovative agriculture development project called “Unlocking
Agriculture Potential through Medium Sized Farms” that seeks to strengthen approximately 2,000 medium sized farmsin Kenya. The project is funded by the Embassy of the Kingdom of the Netherlands and the Equity Bank Group and seeks
to increase agriculture production and incomes in key food crops across various regions in Kenya among farms generally
between 10 and 100 acres in size.
These medium sized farms, often refered to as the ‘missing middle’, is an orphaned category, often excluded from
traditional smallholder development projects and usually priced out of the market for corporate advisory services
and technical assistance. Yet, given their growing influence and aggregate size, this category is becoming increasingly
important in Kenya’s aspirations to achieve food security and economic prosperity.
The project combines production and enterprise development interventions with the goal of increasing agriculture
production, reducing the risk of farming, improving the efficiency of farming business, and increasing market linkages.
Social payments for food security
In 2013 Equity Bank and Equity Group Foundation jointly with various partners in the humanitarian food aid programmes
continued to support community initiatives by providing a platform for social payments. These included World Food
Programme Cash for Assets, Fresh Food Voucher payments in Dadaab and Cash Lite project in Merti Isiolo Cashless
project implemented by Equity – MasterCard and World Food Programme (WFP) where WFP beneficiaries access food
through electronic payments administered by selected merchants. In these initiatives, the beneficiaries are trained on
financial literacy by Equity Group Foundation.
ENVIRONMENT PILLAR
Sustainable Livelihood Projects for communities around Mau Complex.
This is a partnership between Kenya Forest Service (KFS) supported by the Food and Agriculture Organization (FAO)
and Equity Bank which aims at improving livelihoods of farmers around the Mau Forest catchment. The objective of the
project is to make farmers start sustainable farm projects to conserve the forest. In 2013 Kenya Forest Service (KFS)was selected as winner of the Edouard Saouma Award 2012-2013 for the successful and efficient implementation of
project TCP/KEN/3204, “Sustainable livelihood development in the Mau forest complex”, funded by the FAO Technical
Cooperation Programme (TCP) and implemented jointly with Equity Bank and Equity Group Foundation.
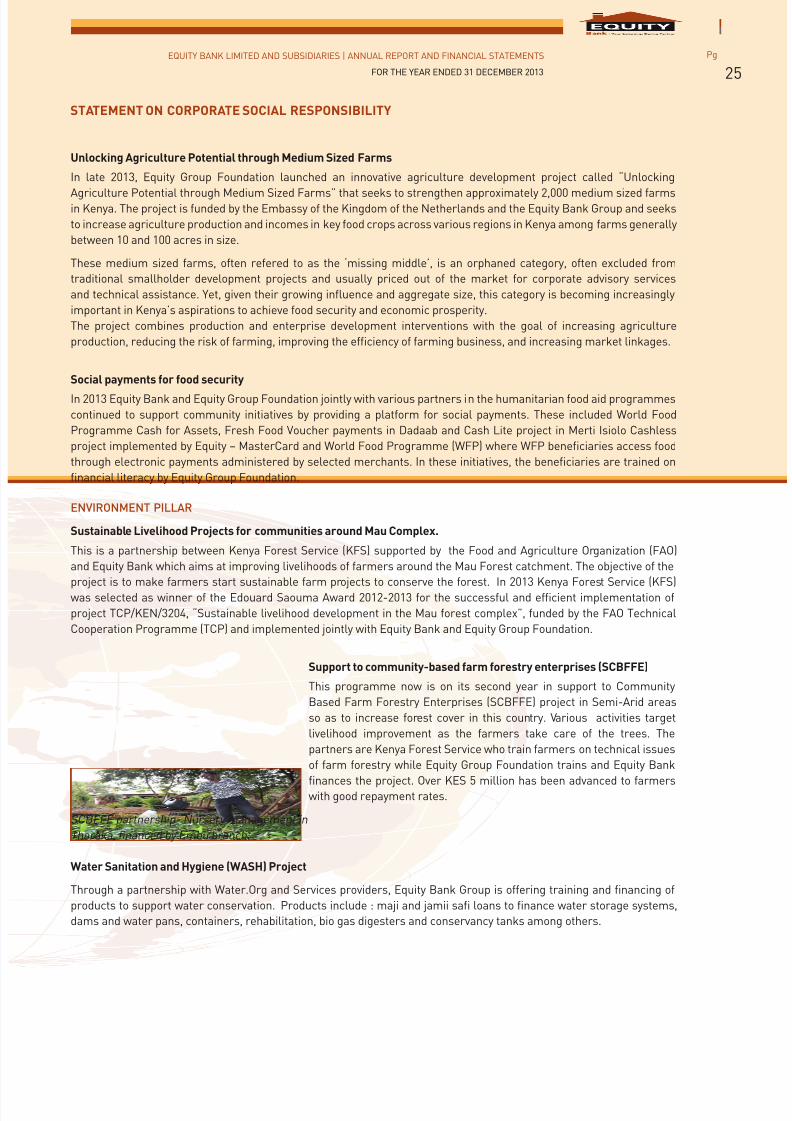
Support to community-based farm forestry enterprises (SCBFFE)
This programme now is on its second year in support to Community
Based Farm Forestry Enterprises (SCBFFE) project in Semi-Arid areas
so as to increase forest cover in this country. Various activities target
livelihood improvement as the farmers take care of the trees. The
partners are Kenya Forest Service who train farmers on technical issues
of farm forestry while Equity Group Foundation trains and Equity Bank
finances the project. Over KES 5 million has been advanced to farmerswith good repayment rates.
SCBFFE partnership- Nursery management in
Tharaka, financed by Embu branch.
Water Sanitation and Hygiene (WASH) Project
Through a partnership with Water.Org and Services providers, Equity Bank Group is offering training and financing of
products to support water conservation. Products include : maji and jamii safi loans to finance water storage systems,
dams and water pans, containers, rehabilitation, bio gas digesters and conservancy tanks among others.
STATEMENT ON CORPORATE SOCIAL RESPONSIBILITY

7/21/2019 Equity Bank Group Annual Report 2013
http://slidepdf.com/reader/full/equity-bank-group-annual-report-2013 28/124
EQUITY BANK LIMITED AND SUBSIDIARIES | ANNUAL REPORT AND FINANCIAL STATEMENTS
FOR THE YEAR ENDED 31 DECEMBER 2013
Pg
26
From Left to Right
Prof. Shem Migot-Adholla Dennis Aluanga David Ansell Mary Wamae Babatunde Soyoye Ernest Nzovu Peter Munga
BOARD OF DIRECTORS
7/21/2019 Equity Bank Group Annual Report 2013
http://slidepdf.com/reader/full/equity-bank-group-annual-report-2013 29/124
EQUITY BANK LIMITED AND SUBSIDIARIES | ANNUAL REPORT AND FINANCIAL STATEMENTS
FOR THE YEAR ENDED 31 DECEMBER 2013
Pg
27
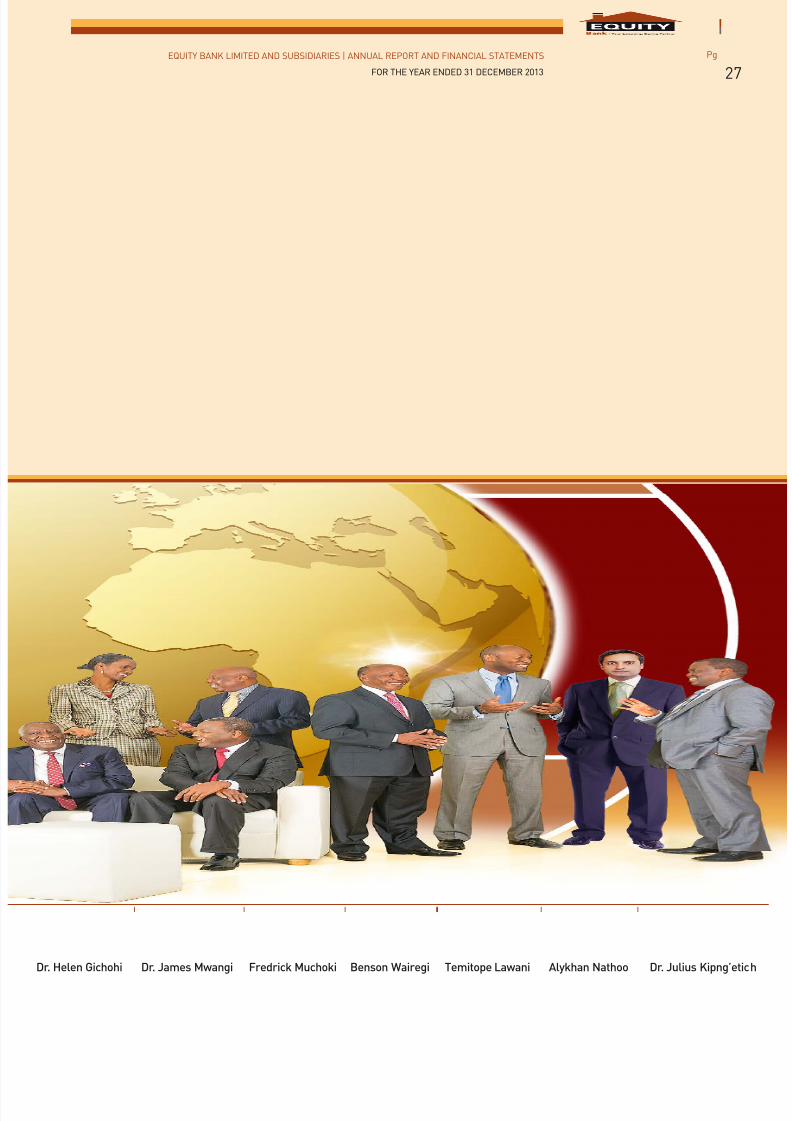
Dr. Helen Gichohi Dr. James Mwangi Fredrick Muchoki Benson Wairegi Temitope Lawani Alykhan Nathoo Dr. Julius Kipng’etich
7/21/2019 Equity Bank Group Annual Report 2013
http://slidepdf.com/reader/full/equity-bank-group-annual-report-2013 30/124
EQUITY BANK LIMITED AND SUBSIDIARIES | ANNUAL REPORT AND FINANCIAL STATEMENTS
FOR THE YEAR ENDED 31 DECEMBER 2013
Pg
28
BOARD OF DIRECTORS
PETER MUNGA, CBSNON-EXECUTIVE CHAIRMAN
Mr Munga is a Certified Public Secretary with vast experience in both public and
private sector management. He holds a diploma in Human Resources and Financial
Management. Mr Munga is a retired Deputy Secretary. He is the Chairman of
National Oil Corporation and a Director in Micro-Enterprise Support Programme
Trust (MESPT), British American Investments Company(Kenya Ltd) , Rockfeller
Foundation and Equatorial Nut Processors.
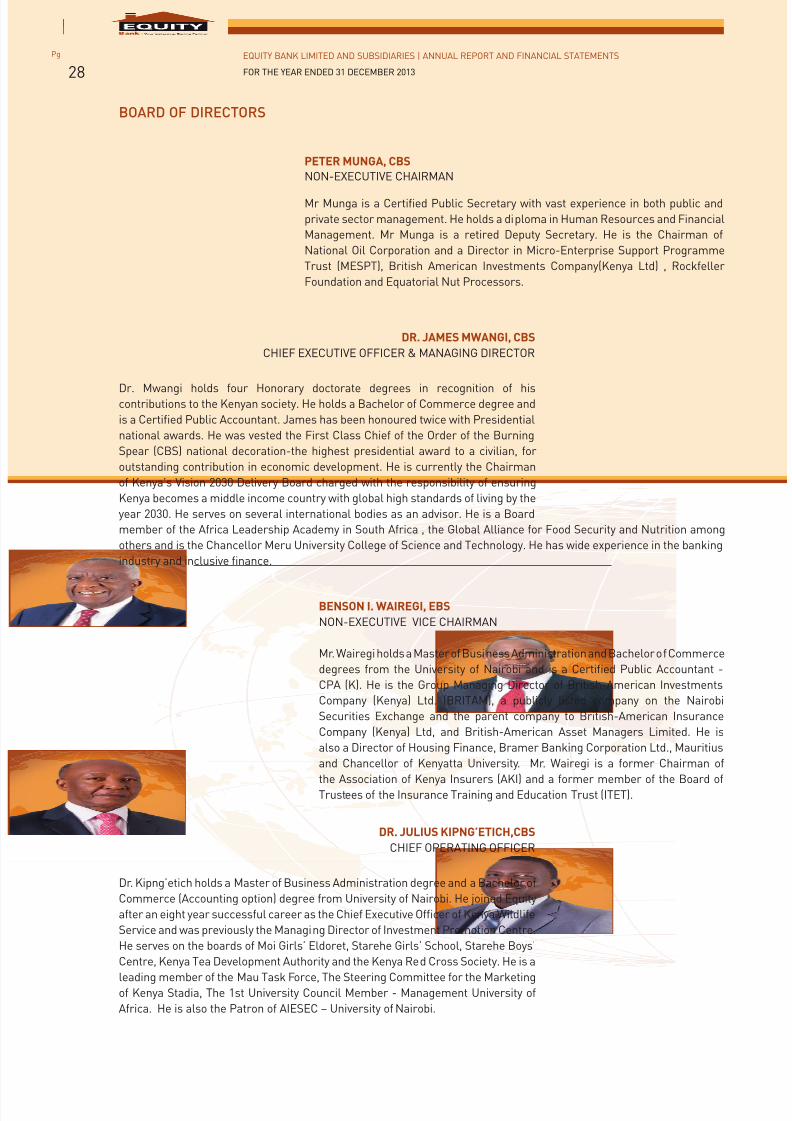
DR. JAMES MWANGI, CBS
CHIEF EXECUTIVE OFFICER & MANAGING DIRECTOR
Dr. Mwangi holds four Honorary doctorate degrees in recognition of hiscontributions to the Kenyan society. He holds a Bachelor of Commerce degree and
is a Certified Public Accountant. James has been honoured twice with Presidential
national awards. He was vested the First Class Chief of the Order of the Burning
Spear (CBS) national decoration-the highest presidential award to a civilian, for
outstanding contribution in economic development. He is currently the Chairman
of Kenya’s Vision 2030 Delivery Board charged with the responsibility of ensuring
Kenya becomes a middle income country with global high standards of living by the
year 2030. He serves on several international bodies as an advisor. He is a Board
member of the Africa Leadership Academy in South Africa , the Global Alliance for Food Security and Nutrition among
others and is the Chancellor Meru University College of Science and Technology. He has wide experience in the banking
industry and inclusive finance.
BENSON I. WAIREGI, EBS
NON-EXECUTIVE VICE CHAIRMAN
Mr. Wairegi holds a Master of Business Administration and Bachelor of Commerce
degrees from the University of Nairobi and is a Certified Public Accountant -
CPA (K). He is the Group Managing Director of British-American Investments
Company (Kenya) Ltd. (BRITAM), a publicly listed company on the Nairobi
Securities Exchange and the parent company to British-American Insurance
Company (Kenya) Ltd, and British-American Asset Managers Limited. He is
also a Director of Housing Finance, Bramer Banking Corporation Ltd., Mauritius
and Chancellor of Kenyatta University. Mr. Wairegi is a former Chairman of
the Association of Kenya Insurers (AKI) and a former member of the Board ofTrustees of the Insurance Training and Education Trust (ITET).
DR. JULIUS KIPNG’ETICH,CBS
CHIEF OPERATING OFFICER
Dr. Kipng’etich holds a Master of Business Administration degree and a Bachelor of
Commerce (Accounting option) degree from University of Nairobi. He joined Equity
after an eight year successful career as the Chief Executive Officer of Kenya Wildlife
Service and was previously the Managing Director of Investment Promotion Centre.
He serves on the boards of Moi Girls’ Eldoret, Starehe Girls’ School, Starehe Boys’
Centre, Kenya Tea Development Authority and the Kenya Red Cross Society. He is a
leading member of the Mau Task Force, The Steering Committee for the Marketingof Kenya Stadia, The 1st University Council Member - Management University of
Africa. He is also the Patron of AIESEC – University of Nairobi.
7/21/2019 Equity Bank Group Annual Report 2013
http://slidepdf.com/reader/full/equity-bank-group-annual-report-2013 31/124
EQUITY BANK LIMITED AND SUBSIDIARIES | ANNUAL REPORT AND FINANCIAL STATEMENTS
FOR THE YEAR ENDED 31 DECEMBER 2013
Pg
29
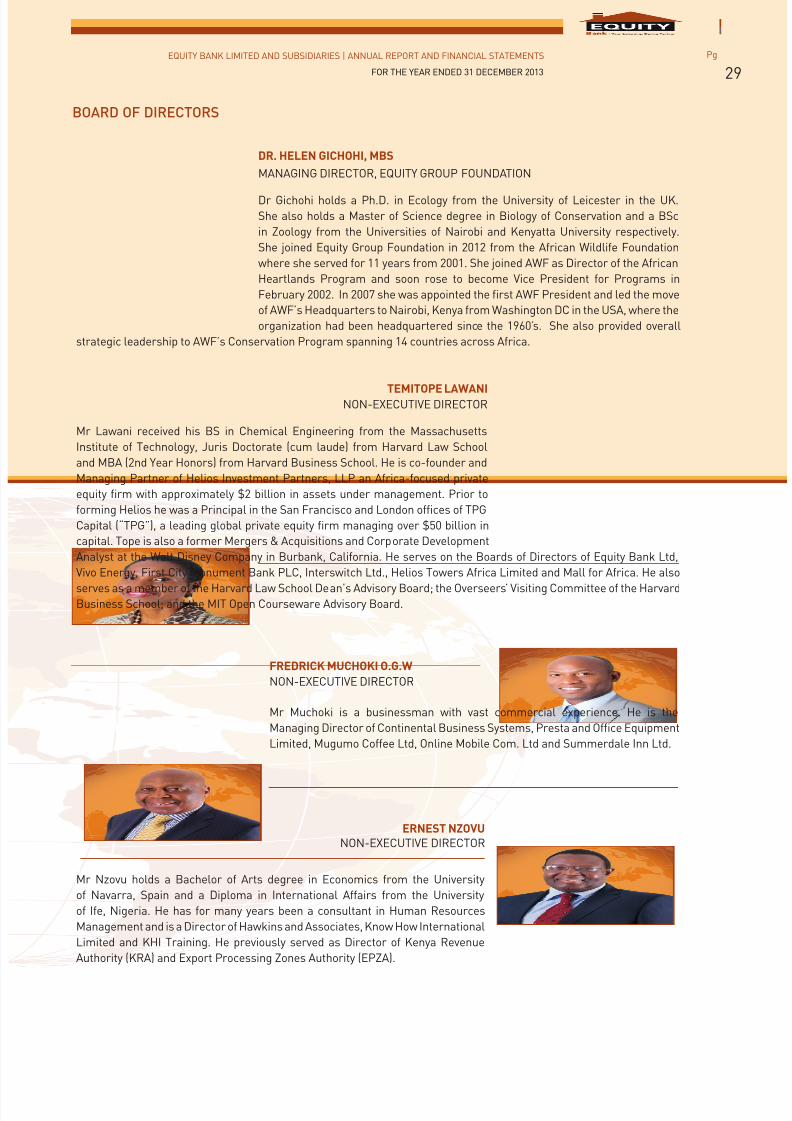
DR. HELEN GICHOHI, MBS
MANAGING DIRECTOR, EQUITY GROUP FOUNDATION
Dr Gichohi holds a Ph.D. in Ecology from the University of Leicester in the UK.
She also holds a Master of Science degree in Biology of Conservation and a BSc
in Zoology from the Universities of Nairobi and Kenyatta University respectively.
She joined Equity Group Foundation in 2012 from the African Wildlife Foundation
where she served for 11 years from 2001. She joined AWF as Director of the African
Heartlands Program and soon rose to become Vice President for Programs in
February 2002. In 2007 she was appointed the first AWF President and led the move
of AWF’s Headquarters to Nairobi, Kenya from Washington DC in the USA, where the
organization had been headquartered since the 1960’s. She also provided overall
strategic leadership to AWF’s Conservation Program spanning 14 countries across Africa.
TEMITOPE LAWANINON-EXECUTIVE DIRECTOR
Mr Lawani received his BS in Chemical Engineering from the Massachusetts
Institute of Technology, Juris Doctorate (cum laude) from Harvard Law School
and MBA (2nd Year Honors) from Harvard Business School. He is co-founder and
Managing Partner of Helios Investment Partners, LLP an Africa-focused private
equity firm with approximately $2 billion in assets under management. Prior to
forming Helios he was a Principal in the San Francisco and London offices of TPG
Capital (“TPG”), a leading global private equity firm managing over $50 billion in
capital. Tope is also a former Mergers & Acquisitions and Corporate Development
Analyst at the Walt Disney Company in Burbank, California. He serves on the Boards of Directors of Equity Bank Ltd,
Vivo Energy, First City Monument Bank PLC, Interswitch Ltd., Helios Towers Africa Limited and Mall for Africa. He also
serves as a member of the Harvard Law School Dean’s Advisory Board; the Overseers’ Visiting Committee of the HarvardBusiness School; and the MIT Open Courseware Advisory Board.
FREDRICK MUCHOKI O.G.W
NON-EXECUTIVE DIRECTOR
Mr Muchoki is a businessman with vast commercial experience. He is the
Managing Director of Continental Business Systems, Presta and Office Equipment
Limited, Mugumo Coffee Ltd, Online Mobile Com. Ltd and Summerdale Inn Ltd.
ERNEST NZOVUNON-EXECUTIVE DIRECTOR
Mr Nzovu holds a Bachelor of Arts degree in Economics from the University
of Navarra, Spain and a Diploma in International Affairs from the University
of Ife, Nigeria. He has for many years been a consultant in Human Resources
Management and is a Director of Hawkins and Associates, Know How International
Limited and KHI Training. He previously served as Director of Kenya Revenue
Authority (KRA) and Export Processing Zones Authority (EPZA).
BOARD OF DIRECTORS
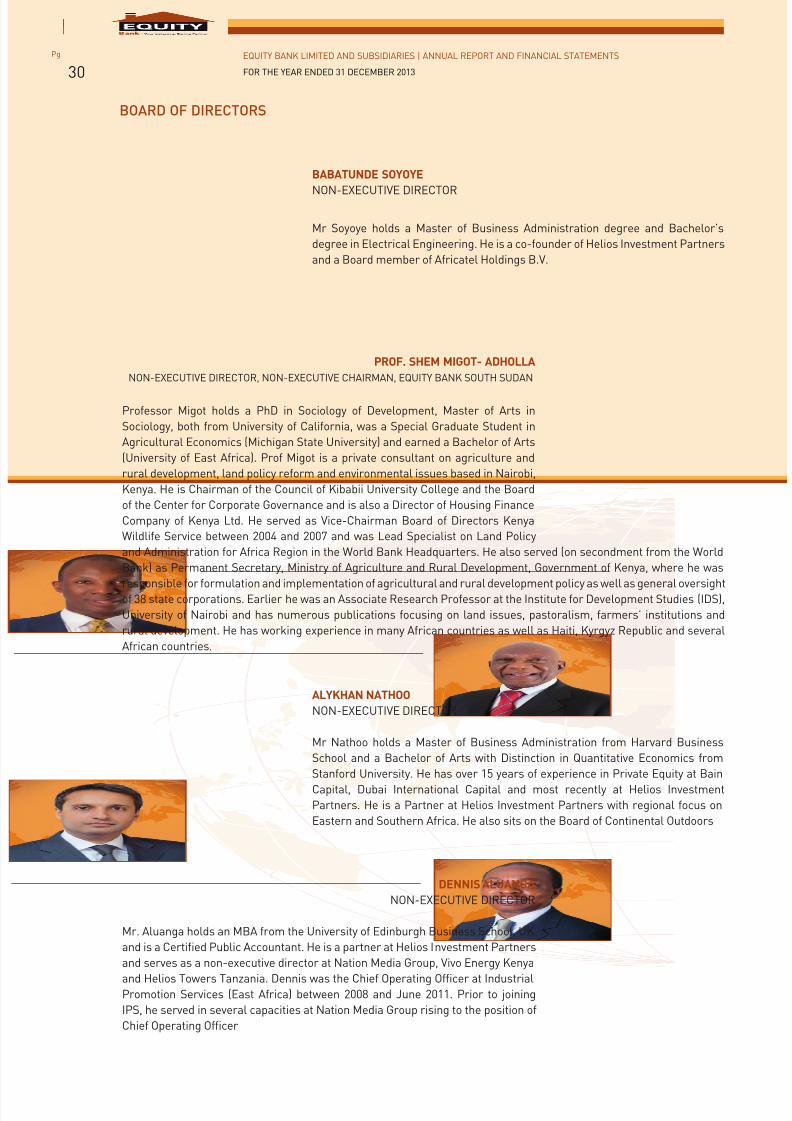
7/21/2019 Equity Bank Group Annual Report 2013
http://slidepdf.com/reader/full/equity-bank-group-annual-report-2013 32/124
EQUITY BANK LIMITED AND SUBSIDIARIES | ANNUAL REPORT AND FINANCIAL STATEMENTS
FOR THE YEAR ENDED 31 DECEMBER 2013
Pg
30
BABATUNDE SOYOYE
NON-EXECUTIVE DIRECTOR
Mr Soyoye holds a Master of Business Administration degree and Bachelor’s
degree in Electrical Engineering. He is a co-founder of Helios Investment Partners
and a Board member of Africatel Holdings B.V.
PROF. SHEM MIGOT- ADHOLLA
NON-EXECUTIVE DIRECTOR, NON-EXECUTIVE CHAIRMAN, EQUITY BANK SOUTH SUDAN
Professor Migot holds a PhD in Sociology of Development, Master of Arts in
Sociology, both from University of California, was a Special Graduate Student in
Agricultural Economics (Michigan State University) and earned a Bachelor of Arts
(University of East Africa). Prof Migot is a private consultant on agriculture and
rural development, land policy reform and environmental issues based in Nairobi,
Kenya. He is Chairman of the Council of Kibabii University College and the Board
of the Center for Corporate Governance and is also a Director of Housing Finance
Company of Kenya Ltd. He served as Vice-Chairman Board of Directors Kenya
Wildlife Service between 2004 and 2007 and was Lead Specialist on Land Policy
and Administration for Africa Region in the World Bank Headquarters. He also served (on secondment from the World
Bank) as Permanent Secretary, Ministry of Agriculture and Rural Development, Government of Kenya, where he was
responsible for formulation and implementation of agricultural and rural development policy as well as general oversightof 38 state corporations. Earlier he was an Associate Research Professor at the Institute for Development Studies (IDS),
University of Nairobi and has numerous publications focusing on land issues, pastoralism, farmers’ institutions and
rural development. He has working experience in many African countries as well as Haiti, Kyrgyz Republic and several
African countries.
ALYKHAN NATHOO
NON-EXECUTIVE DIRECTOR
Mr Nathoo holds a Master of Business Administration from Harvard Business
School and a Bachelor of Arts with Distinction in Quantitative Economics from
Stanford University. He has over 15 years of experience in Private Equity at BainCapital, Dubai International Capital and most recently at Helios Investment
Partners. He is a Partner at Helios Investment Partners with regional focus on
Eastern and Southern Africa. He also sits on the Board of Continental Outdoors
DENNIS ALUANGA
NON-EXECUTIVE DIRECTOR
Mr. Aluanga holds an MBA from the University of Edinburgh Business School, UK
and is a Certified Public Accountant. He is a partner at Helios Investment Partners
and serves as a non-executive director at Nation Media Group, Vivo Energy Kenya
and Helios Towers Tanzania. Dennis was the Chief Operating Officer at Industrial
Promotion Services (East Africa) between 2008 and June 2011. Prior to joining
IPS, he served in several capacities at Nation Media Group rising to the position of
Chief Operating Officer
BOARD OF DIRECTORS
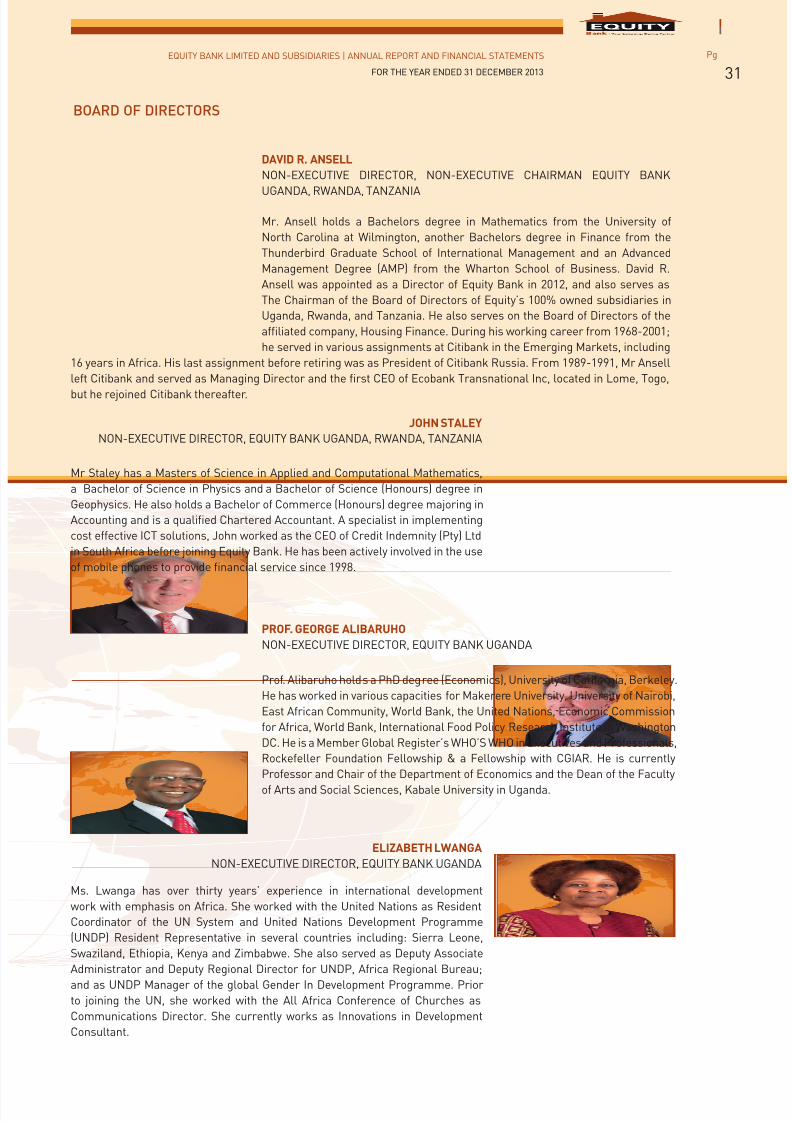
7/21/2019 Equity Bank Group Annual Report 2013
http://slidepdf.com/reader/full/equity-bank-group-annual-report-2013 33/124
EQUITY BANK LIMITED AND SUBSIDIARIES | ANNUAL REPORT AND FINANCIAL STATEMENTS
FOR THE YEAR ENDED 31 DECEMBER 2013
Pg
31
DAVID R. ANSELL
NON-EXECUTIVE DIRECTOR, NON-EXECUTIVE CHAIRMAN EQUITY BANK
UGANDA, RWANDA, TANZANIA
Mr. Ansell holds a Bachelors degree in Mathematics from the University of
North Carolina at Wilmington, another Bachelors degree in Finance from the
Thunderbird Graduate School of International Management and an Advanced
Management Degree (AMP) from the Wharton School of Business. David R.
Ansell was appointed as a Director of Equity Bank in 2012, and also serves as
The Chairman of the Board of Directors of Equity’s 100% owned subsidiaries in
Uganda, Rwanda, and Tanzania. He also serves on the Board of Directors of the
affiliated company, Housing Finance. During his working career from 1968-2001;
he served in various assignments at Citibank in the Emerging Markets, including
16 years in Africa. His last assignment before retiring was as President of Citibank Russia. From 1989-1991, Mr Ansell
left Citibank and served as Managing Director and the first CEO of Ecobank Transnational Inc, located in Lome, Togo,
but he rejoined Citibank thereafter.
JOHN STALEY
NON-EXECUTIVE DIRECTOR, EQUITY BANK UGANDA, RWANDA, TANZANIA
Mr Staley has a Masters of Science in Applied and Computational Mathematics,
a Bachelor of Science in Physics and a Bachelor of Science (Honours) degree in
Geophysics. He also holds a Bachelor of Commerce (Honours) degree majoring in
Accounting and is a qualified Chartered Accountant. A specialist in implementing
cost effective ICT solutions, John worked as the CEO of Credit Indemnity (Pty) Ltd
in South Africa before joining Equity Bank. He has been actively involved in the use
of mobile phones to provide financial service since 1998.
PROF. GEORGE ALIBARUHO
NON-EXECUTIVE DIRECTOR, EQUITY BANK UGANDA
Prof. Alibaruho holds a PhD degree (Economics), University of California, Berkeley.
He has worked in various capacities for Makerere University, University of Nairobi,
East African Community, World Bank, the United Nations, Economic Commission
for Africa, World Bank, International Food Policy Research Institute in Washington
DC. He is a Member Global Register’s WHO’S WHO in Executives and Professionals,
Rockefeller Foundation Fellowship & a Fellowship with CGIAR. He is currently
Professor and Chair of the Department of Economics and the Dean of the Facultyof Arts and Social Sciences, Kabale University in Uganda.
ELIZABETH LWANGA
NON-EXECUTIVE DIRECTOR, EQUITY BANK UGANDA
Ms. Lwanga has over thirty years’ experience in international development
work with emphasis on Africa. She worked with the United Nations as Resident
Coordinator of the UN System and United Nations Development Programme
(UNDP) Resident Representative in several countries including: Sierra Leone,
Swaziland, Ethiopia, Kenya and Zimbabwe. She also served as Deputy Associate
Administrator and Deputy Regional Director for UNDP, Africa Regional Bureau;and as UNDP Manager of the global Gender In Development Programme. Prior
to joining the UN, she worked with the All Africa Conference of Churches as
Communications Director. She currently works as Innovations in Development
Consultant.
BOARD OF DIRECTORS
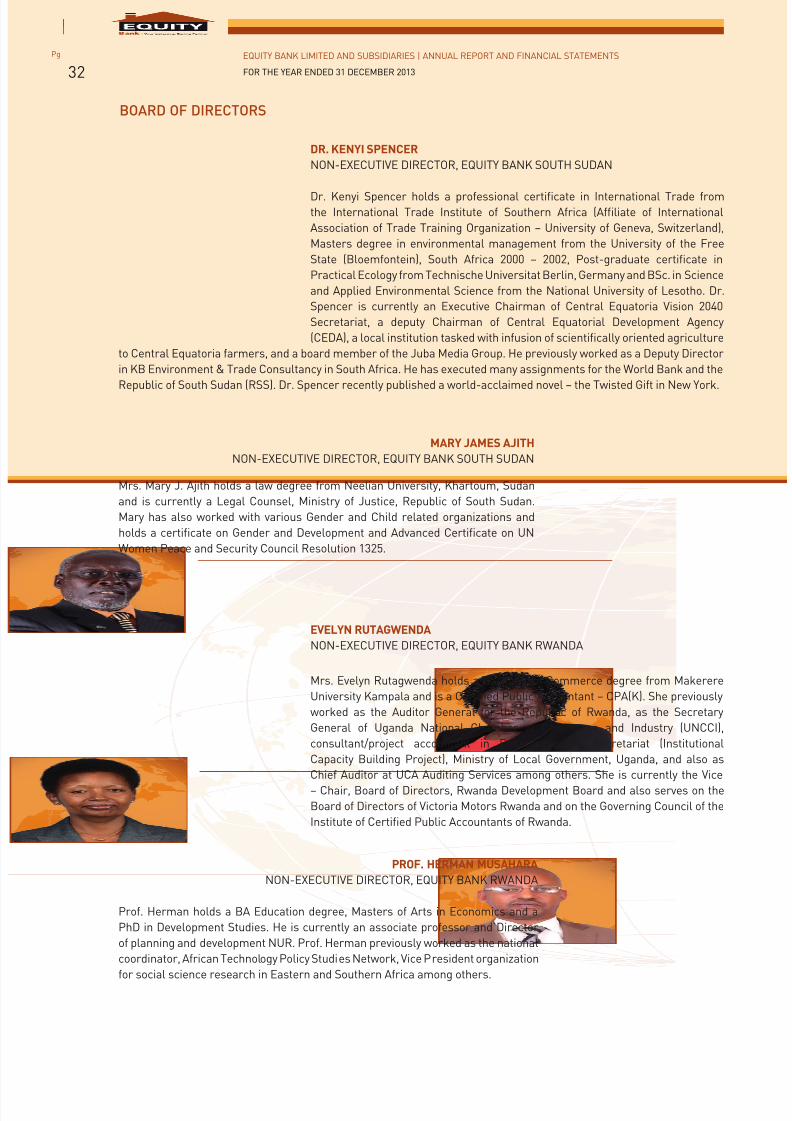
7/21/2019 Equity Bank Group Annual Report 2013
http://slidepdf.com/reader/full/equity-bank-group-annual-report-2013 34/124
EQUITY BANK LIMITED AND SUBSIDIARIES | ANNUAL REPORT AND FINANCIAL STATEMENTS
FOR THE YEAR ENDED 31 DECEMBER 2013
Pg
32
DR. KENYI SPENCER
NON-EXECUTIVE DIRECTOR, EQUITY BANK SOUTH SUDAN
Dr. Kenyi Spencer holds a professional certificate in International Trade fromthe International Trade Institute of Southern Africa (Affiliate of International
Association of Trade Training Organization – University of Geneva, Switzerland),
Masters degree in environmental management from the University of the Free
State (Bloemfontein), South Africa 2000 – 2002, Post-graduate certificate in
Practical Ecology from Technische Universitat Berlin, Germany and BSc. in Science
and Applied Environmental Science from the National University of Lesotho. Dr.
Spencer is currently an Executive Chairman of Central Equatoria Vision 2040
Secretariat, a deputy Chairman of Central Equatorial Development Agency
(CEDA), a local institution tasked with infusion of scientifically oriented agriculture
to Central Equatoria farmers, and a board member of the Juba Media Group. He previously worked as a Deputy Director
in KB Environment & Trade Consultancy in South Africa. He has executed many assignments for the World Bank and the
Republic of South Sudan (RSS). Dr. Spencer recently published a world-acclaimed novel – the Twisted Gift in New York.
MARY JAMES AJITH
NON-EXECUTIVE DIRECTOR, EQUITY BANK SOUTH SUDAN
Mrs. Mary J. Ajith holds a law degree from Neelian University, Khartoum, Sudan
and is currently a Legal Counsel, Ministry of Justice, Republic of South Sudan.
Mary has also worked with various Gender and Child related organizations and
holds a certificate on Gender and Development and Advanced Certificate on UN
Women Peace and Security Council Resolution 1325.
EVELYN RUTAGWENDA
NON-EXECUTIVE DIRECTOR, EQUITY BANK RWANDA
Mrs. Evelyn Rutagwenda holds a Bachelor of Commerce degree from Makerere
University Kampala and is a Certified Public Accountant – CPA(K). She previously
worked as the Auditor General for the Republic of Rwanda, as the Secretary
General of Uganda National Chamber of Commerce and Industry (UNCCI),
consultant/project accountant in Decentralization Secretariat (Institutional
Capacity Building Project), Ministry of Local Government, Uganda, and also as
Chief Auditor at UCA Auditing Services among others. She is currently the Vice– Chair, Board of Directors, Rwanda Development Board and also serves on the
Board of Directors of Victoria Motors Rwanda and on the Governing Council of the
Institute of Certified Public Accountants of Rwanda.
PROF. HERMAN MUSAHARA
NON-EXECUTIVE DIRECTOR, EQUITY BANK RWANDA
Prof. Herman holds a BA Education degree, Masters of Arts in Economics and a
PhD in Development Studies. He is currently an associate professor and Director
of planning and development NUR. Prof. Herman previously worked as the national
coordinator, African Technology Policy Studies Network, Vice President organization
for social science research in Eastern and Southern Africa among others.
BOARD OF DIRECTORS
7/21/2019 Equity Bank Group Annual Report 2013
http://slidepdf.com/reader/full/equity-bank-group-annual-report-2013 35/124
EQUITY BANK LIMITED AND SUBSIDIARIES | ANNUAL REPORT AND FINANCIAL STATEMENTS
FOR THE YEAR ENDED 31 DECEMBER 2013
Pg
33
PROF. DELPHIN RWEGASIRA
NON-EXECUTIVE DIRECTOR, EQUITY BANK TANZANIA
Prof. Delphin G. Rwegasira is currently holder of the Mwalimu Julius Nyerere
Professorial Chair in Development at the University of Dar es Salaam’s Economics
Department. He has many years of international and regional economic
experience. In the early 2000s, he worked for four years as Senior Advisor at
the International Monetary Fund’s African Department. Previously, he had been
Executive Director of the Nairobi–based African Economic Research Consortium
(AERC) and member of its international Board of Directors. He also served in the
African Development Bank (AfDB) as Senior Advisor to the President, and Director
of Development Research and Policy. In the early 1980s, he served as Associate
Professor of Economics at the University of Dar es Salaam, and as staff Director at
the Bank of Tanzania (BOT). Born in Tanzania, he holds a PhD in economics from Harvard University, U.S.A., and a first-
class Bachelor’s degree in Statistics and Economics from the former University of East Africa (University College Dar es
Salaam). He has published internationally on development and financial issues, contributed to the work of a number ofexpert and policy groups, and served as a member of the United Nations Committee for Development Policy
ZAHRA NURU
NON-EXECUTIVE DIRECTOR, EQUITY BANK TANZANIA
Ms. Nuru holds a Master of Science in Managerial Economics, Quantitative
Methods and Business Administration including Trade and Marketing from Hult
University. She is a Policy Advisor for IHAN (International Health Awareness
Network) and Tanzania Women Chamber of Commerce. Previously she has
worked as the Personal Assistant to the President on Diplomatic and International
Affairs United Republic of Tanzania; consultant/Advisor of the United Nations
Office - Special Advisor on Africa; among other capacities in the United Nations.She has also worked with the Government of the United Republic of Tanzania
as Permanent Secretary for Health, Community Development, Culture, Women,
Youth and sports; Deputy Permanent Secretary and Director of Management
Development and Administration and Head of Planning, Ministry of Labour and Social Welfare among other capacities.
MARY WAMAE
SECRETARY TO THE BOARD
Mrs. Wamae holds an LLB degree from the University of Nairobi, a Diploma in Law
from the Kenya School of Law and is a Certified Public Secretary (Kenya). She is
a graduate of Advanced Management Programme (Strathmore - IESE Business
School, Barcelona Spain). She is an Advocate of the High Court of Kenya and
holds a Post Graduate Diploma in Gender and Development and has over 14 years
private practice experience.
BOARD OF DIRECTORS
7/21/2019 Equity Bank Group Annual Report 2013
http://slidepdf.com/reader/full/equity-bank-group-annual-report-2013 36/124
EQUITY BANK LIMITED AND SUBSIDIARIES | ANNUAL REPORT AND FINANCIAL STATEMENTS
FOR THE YEAR ENDED 31 DECEMBER 2013
Pg
34
DR. JAMES MWANGI, CBS
CHIEF EXECUTIVE OFFICER & MANAGING DIRECTOR
James holds four Honorary doctorate degrees in recognition of his contributions to
the Kenyan society. He holds a Bachelor of Commerce degree and is a Certified Public
Accountant. James has been honoured twice with Presidential national awards. He was
vested the First Class Chief of the Order of the Burning Spear (CBS) national decoration-
the highest presidential award to a civilian, for outstanding contribution in economic
development. He is currently the Chairman of Kenya’s Vision 2030 Delivery Board
charged with the responsibility of ensuring Kenya becomes a middle income country
with global high standards of living by the year 2030. He serves on several international
bodies as an advisor. He is a Board member of the Africa Leadership Academy in South Africa , the Global Alliance for
Food Security and Nutrition among others and is the Chancellor Meru University College of Science and Technology.
James has wide experience in the banking industry and inclusive finance.
DR. JULIUS KIPNG’ETICH, CBS
CHIEF OPERATING OFFICER
Julius holds a Master of Business Administration degree and a Bachelor of Commerce
(Accounting option) degree from University of Nairobi. He joined Equity in 2012 after
an eight year successful career as the Chief Executive Officer of Kenya Wildlife Service
and was previously the Managing Director of Investment Promotion Centre. He serves
on the boards of Moi Girls’ Eldoret, Starehe Girls’ School, Starehe Boys’ Centre, Kenya
Tea Development Authority and the Kenya Red Cross Society. He is a leading member of
the Mau Task Force, The Steering Committee for the Marketing of Kenya Stadia, The 1st
University Council Member - Management University of Africa. He is also the Patron of
AIESEC – University of Nairobi. Julius joined Equity Bank in 2004 as a board member and management in 2012.
DR. HELEN GICHOHI, MBS
MANAGING DIRECTOR, EQUITY GROUP FOUNDATION
Helen holds a Ph.D. in Ecology from the University of Leicester in the UK. She also holds
a Master of Science degree in Biology of Conservation and a BSc in Zoology from the
Universities of Nairobi and Kenyatta University respectively. She joined Equity Group
Foundation in 2012 from the African Wildlife Foundation where she served for 11 years
from 2001. She joined AWF as Director of the African Heartlands Program and soon rose
to become Vice President for Programs in February 2002. In 2007 she was appointed
the first AWF President and led the move of AWF’s Headquarters to Nairobi, Kenya fromWashington DC in the USA, where the organization had been headquartered since the
1960’s. She also provided overall strategic leadership to AWF’s Conservation Program spanning 14 countries across
Africa. Helen joined Equity Bank in 2009 as a board member and management in 2012.
MARY WAMAE
COMPANY SECRETARY AND DIRECTOR OF CORPORATE STRATEGY
Mary holds an LLB degree from the University of Nairobi, a Diploma in Law from the
Kenya School of Law and is a Certified Public Secretary (Kenya). She is a graduate of
Advanced Management Programme (Strathmore - IESE Business School, Barcelona
Spain). She is an Advocate of the High Court of Kenya and holds a Post Graduate Diploma
in Gender and Development and has over 14 years private practice experience. She joined Equity Bank in 2004.
EXECUTIVE MANAGEMENT
7/21/2019 Equity Bank Group Annual Report 2013
http://slidepdf.com/reader/full/equity-bank-group-annual-report-2013 37/124
EQUITY BANK LIMITED AND SUBSIDIARIES | ANNUAL REPORT AND FINANCIAL STATEMENTS
FOR THE YEAR ENDED 31 DECEMBER 2013
Pg
35
JOHN STALEY
CHIEF OFFICER-FINANCE,INNOVATION AND TECHNOLOGY
John has a Masters of Science in Applied and Computational Mathematics, a Bachelor
of Science in Physics and a Bachelor of Science (Honours) degree in Geophysics. He
also holds a Bachelor of Commerce (Honours) degree majoring in Accounting and
is a qualified Chartered Accountant. A specialist in implementing cost effective ICT
solutions, John worked as the CEO of Credit Indemnity (Pty) Ltd in South Africa before
joining Equity Bank in 2009. He has been actively involved in the use of mobile phones
to provide financial service since 1998.
REUBEN MBINDUDIRECTOR OF HUMAN RESOURCES
Reuben holds a BSc. in Computer Science from Germany and is a full member of the
Institute of Human Resource Management in Kenya. He has expertise in various fieldsincluding technology, auditing, communication and human resources having worked at
senior management levels in various organizations. Reuben joined Equity Bank in 2013
from Standard Chartered, where he was the Director of Human Resources for East
Africa. He has also held other senior positions within Standard Chartered including
Head of Corporate Affairs - East Africa, Chairman of the Nairobi Marathon, Head of
Human Resources - Tanzania and Regional Head of Human Resources Operations for
Africa. While at Standard Chartered, he had the opportunity to work in different markets
including United Kingdom, Hong Kong, Tanzania, Zambia and South Africa. He made a major contribution in the design
and automation of global HR processes in Standard Chartered. Reuben has also worked in other sectors including
public sector (UNEP), consultancy (Deloitte) and ICT (Siemens, Germany).
RAPHAEL HUKAI
CHIEF INFORMATION OFFICER
Mr. Hukai holds a BSc. degree in Computer Science from the Institute of International Politics
of Beijing, China. He joined Equity Group in December 2013 after over 16 years of service at IBM
Corporation, where he worked at many leading banks around the world, providing executive
consulting on banking/IT technology and governance. He also has extensive experience in
insurance and e-commerce.
JUMAANE TAFAWA
DIRECTOR INVESTMENTS AND STRATEGIC INITIATIVES
Jumaane holds an MPA from Harvard University. He joined Equity Bank in 2012. At the Group
level, he overseas all SME related strategic initiatives across Equity Bank Group, including Equity
Bank SME division, Equity Investment Bank, Equity Consulting Group, Equity Insurance Agency
and Equity Group Foundation. He also leads major group-level partnerships and collaborations.
Jumaane has over a decade of business strategy and small and medium enterprise (SME)
development experience gained through his work in the private, government and nonprofit
sectors, in 60+ countries. He has spent most of his career as a management consultant improving
the effectiveness of multiple SME development programs across the world, especially across Sub-
Saharan Africa.
Executive management
7/21/2019 Equity Bank Group Annual Report 2013
http://slidepdf.com/reader/full/equity-bank-group-annual-report-2013 38/124
EQUITY BANK LIMITED AND SUBSIDIARIES | ANNUAL REPORT AND FINANCIAL STATEMENTS
FOR THE YEAR ENDED 31 DECEMBER 2013
Pg
36
GERALD WARUI
DIRECTOR CUSTOMER EXPERIENCE, RESEARCH AND DEVELOPMENT
Gerald holds an Executive Masters of Business Administration degree from Jomo
Kenyatta University of Agriculture and Technology (JKUAT). He is also a Certified Public
Accountant CPA (K) and a graduate of Advanced Management Program offered by
Strathmore- IESE Business School, Barcelona Spain. A career banker, Gerald has vast
experience in operations and customer service. Prior to his current position, he served
as the Director of Operations and Customer Service. He joined Equity Bank in 1998.
HILDAH MUGO
DIRECTOR OF OPERATIONS
Hildah holds a Masters degree in Business Administration - Strategic Management, a
Bachelor of Business Administration in Entrepreneurship and is an Associate of KenyaInstitute of Bankers. She is a graduate of Advanced Management Program offered by
Strathmore- IESE Business School, Barcelona Spain. Prior to joining Equity Bank in
2004, Hildah had acquired extensive banking experience in operations, compliance,
customer service and consumer banking for over ten years with Barclays Bank of
Kenya.
MICHAEL WACHIRA
DIRECTOR OF TREASURY AND TRADE FINANCE
Michael holds a Bachelor of Science degree in Economics and a Master of Science
in Investment Management. He is a graduate of Advanced Management Programme
(Strathmore - IESE Business School, Barcelona Spain). Prior to joining Equity Bank in2009 Michael worked in Brussels, Belgium for the Fortis Bank group. Michael has also
worked as an Emerging Markets Proprietary Trader focusing on the Middle East and
Africa for Cargill Financial Markets based in London.
ALLAN WAITITU
DIRECTOR SPECIAL PROJECTS
Allan is a Certified Systems Engineer, and a graduate of Advanced Management
Programme (Strathmore-IESE Business School, Barcelona Spain). He has over 26
years experience in information technology and banking and previously served as Equity
Bank’s General Manager of Operations. Allan joined Equity Bank in 2004.
ISAAC MWIGE
DIRECTOR OF RELATIONSHIP BANKING
Isaac holds a Masters degree in International Business Administration from the United
States International University and a Bachelor of Business Administration Degree
from University of Eastern Africa Baraton. He has over 17 years experience in Banking
covering Corporate, Business & Retail Banking and has previously worked with Standard
Chartered Bank, most recently as the Director, Transaction Banking for East Africa.
Prior to that, he was based in Ghana heading Transaction Banking for the West African
Cluster. He previously also worked with Commercial Bank of Africa for five years. Isaac
joined Equity Bank in 2011.
EXECUTIVE MANAGEMENT
7/21/2019 Equity Bank Group Annual Report 2013
http://slidepdf.com/reader/full/equity-bank-group-annual-report-2013 39/124
EQUITY BANK LIMITED AND SUBSIDIARIES | ANNUAL REPORT AND FINANCIAL STATEMENTS
FOR THE YEAR ENDED 31 DECEMBER 2013
Pg
37
ELIZABETH GATHAI
DIRECTOR OF CREDIT
Elizabeth holds a Masters degree in Business Administration from the University of Nairobi,
Bachelor of Commerce degree in finance, and a Certified Public Accountant CPA (K). She is a
graduate of Advanced Management Programme (Strathmore- IESE Business School, Barcelona
Spain) and Management Executive Programme (Maastricht School of Management (MSM)-
Netherlands). Elizabeth joined Equity Bank in 2001.
BILDARD FWAMBA
GENERAL MANAGER, INTERNAL AUDIT
Bildard holds a Bachelor of Commerce (Accounting) degree from Kenyatta University and is a
Certified Public Accountant, CPA (K). He is also writing his dissertation for an MBA at Strathmore
Business School. He has over15 years experience in Finance and Audit and previously worked with
Central Bank of Kenya and British American Insurance Company. Bildard joined Equity Bank in
2004.
AYOTUNDE ABOABA
GENERAL MANAGER, RISK
Ayo holds a Masters Degree in Mathematical Finance from the University of Oxford, England, A Msc
in Information Technology, A post Graduate Diploma in Actuarial Science, a Bsc degree in Maths and
Statistics. Prior to joining the bank, Ayo served at Moody’s Analytics; Independent FOREX Trader,LCH Clearnet as the Quantitative Analyst, UBS London as a credit Valuer, Dresdner Kleinwort as the
Quantitative Structurer, Fitch Ratings as the Quantitative Developer and Barclays Bank as the Senior
Analyst Programmer in London. Ayo joined Equity Bank in 2012.
FRANCIS C G MILLS - ROBERTSON
MANAGING DIRECTOR, EQUITY BANK UGANDA
Francis holds a BA (Hons) Social Sciences degree from the Kwame Nkrumah University of Science
and Technology, Ghana and is an Associate member of the Oxford University Society. A Business
leader with over 15 years cumulative experience in Banking and Finance, Francis last worked as theExecutive Director, Consumer Banking at Standard Chartered Bank Ghana, before joining Equity
Bank Uganda in 2010.
PAUL GITAHI
MANAGING DIRECTOR, EQUITY BANK SOUTH SUDAN
Paul is a career banker with over 24 years experience and previously worked with ABC Bank and
Cooperative Bank. He has extensive banking experience in operations, marketing and customer
service. Paul served previously as the General Manager in charge of marketing in Equity Bank Kenya
before taking up his present position. Paul joined Equity Bank in 2006.
EXECUTIVE MANAGEMENT
7/21/2019 Equity Bank Group Annual Report 2013
http://slidepdf.com/reader/full/equity-bank-group-annual-report-2013 40/124
EQUITY BANK LIMITED AND SUBSIDIARIES | ANNUAL REPORT AND FINANCIAL STATEMENTS
FOR THE YEAR ENDED 31 DECEMBER 2013
Pg
38
SAMUEL KIRUBI
MANAGING DIRECTOR, EQUITY BANK RWANDA
Samuel holds a Masters Degree in Business Administration (Finance) from Moi University and a
Bachelor of Arts degree in Economics and Statistics from Egerton University. He is a graduate of
Advanced Management Programme (Strathmore- IESE Business School, Barcelona Spain). Since
joining Equity Bank in 2001, Samuel has gained vast experience in operations, marketing and
customer service. Samuel was previously the Chief Operations Officer in Equity Bank South Sudan.
JOSEPH IHA
MANAGING DIRECTOR, EQUITY BANK TANZANIA
Joseph holds a Bachelor of Education in Accounting and Mathematics from the
University of Nairobi and has also attended various professional courses in banking. He
has over 15 years banking and leadership experience in Credit, Corporate banking and
Operations. Before to joining Equity Bank Tanzania, he worked as the General Manager,
Credit in Equity Bank Uganda and General Manager, Corporate Banking Division at
Equity Bank Kenya. Joseph joined Equity Bank in 2005. He previously worked with Co-
operative Bank of Kenya for six years in various capacities.
APOLLO NJOROGE
EXECUTIVE DIRECTOR, EQUITY BANK UGANDA
Apollo holds a Bachelor of Science (Hons) from University of Nairobi in Mathematicsand Physics, Masters Degree in International Business Administration in Finance from
United States International University and a Diploma in Banking. Prior to his current
posting he was the General Manager Corporate Banking in Equity Bank Kenya and has
wide experience of 17 years in banking. Apollo joined Equity Bank in 2008.
EXECUTIVE MANAGEMENT
7/21/2019 Equity Bank Group Annual Report 2013
http://slidepdf.com/reader/full/equity-bank-group-annual-report-2013 41/124
EQUITY BANK LIMITED AND SUBSIDIARIES | ANNUAL REPORT AND FINANCIAL STATEMENTS
FOR THE YEAR ENDED 31 DECEMBER 2013
Pg
39
REPORT OF THE DIRECTORS
The directors have pleasure in submitting their report together with, the audited financial statements for
the year ended 31st December 2013 in accordance with Section 22 of the Kenyan Banking Act and Section
157 of the Kenyan Companies Act, which discloses the state of affairs of the Bank and its subsidiarycompanies.
1. ACTIVITIES
The Bank is engaged in the business of banking and is licensed under the Banking Act. The Bank has
also invested in nine wholly owned subsidiaries whose activities are as shown under note 17b.
2. RESULTS
The Bank and Group results for the year are set out on page 51 - 116.
3. DIVIDENDS
The Board has recommended a dividend of KShs 1.50/- per share subject to the approval ofshareholders at the Annual General Meeting.
4. DIRECTORS
The directors who served during the year and to the date of this report are set out below:
Peter Kahara Munga - Chairman
Dr. James Njuguna Mwangi ** - Chief Executive Officer & Managing Director
Benson Irungu Wairegi * - Vice-chairman
Fredrick Mwangi Muchoki *
Julius Kangogo Kipng’etich ** - Chief Operating Officer
Ernest Mattho Nzovu
Babatunde Temitope Soyoye +
Temitope Olugbeminiyi Lawani #*+
Prof. Shem Migot- Adholla
Dr. Helen Gichohi**
David Ansell****
Dennis Aluanga
Alykhan Nathoo***
* Retired by rotation on 27th March 2013 and were re-elected.
** Executive Director
*** Canadian, Alternate director to Dennis Aluanga
**** American
+ British
# Alternate director to Babatunde Soyoye
7/21/2019 Equity Bank Group Annual Report 2013
http://slidepdf.com/reader/full/equity-bank-group-annual-report-2013 42/124
EQUITY BANK LIMITED AND SUBSIDIARIES | ANNUAL REPORT AND FINANCIAL STATEMENTS
FOR THE YEAR ENDED 31 DECEMBER 2013
Pg
40
Article 100 of the Memorandum and Articles of Association of the Bank provides for retirement of directors
by rotation. Section 186(2) of the Companies Act (Cap 486 of the Laws of Kenya) provides for retirement
of directors on attaining the age of seventy. During the year, the following directors are due to retire byrotation and having attained the age of seventy further retire in terms of Section 186 (2) of the Companies
Act (Cap 486 of the Laws of Kenya) and being eligible, offer themselves for re-election by special notice
pursuant to Section 186(5) of the Companies Act (Cap 486 of the Laws of Kenya):
i. Mr Peter Kahara Munga;
ii. Prof. Shem Migot- Adholla.
Mr Ernest Nzovu retires by rotation and having attained the age of seventy does not offer himself for
re-election as a director.
5. AUDITORS
The auditors, Ernst & Young, have indicated their willingness to continue in office in accordance with
Section 159(2) of the Kenyan Companies Act and subject to Section 24(1) of the Banking Act.
6. APPROVAL OF FINANCIAL STATEMENTS
The financial statements were approved by the Board of Directors on 27th February 2014.
BY ORDER OF THE BOARD
Mary Wangari Wamae - Company Secretary
4th March 2014
REPORT OF THE DIRECTORS
7/21/2019 Equity Bank Group Annual Report 2013
http://slidepdf.com/reader/full/equity-bank-group-annual-report-2013 43/124
EQUITY BANK LIMITED AND SUBSIDIARIES | ANNUAL REPORT AND FINANCIAL STATEMENTS
FOR THE YEAR ENDED 31 DECEMBER 2013
Pg
41
The Group and the Bank has built its business on very strong corporate governance principles based on
the application of high and consistent ethical standards in our relationships with all customers, employees
and other stakeholders. This is consistent with the Bank’s core value of effective corporate governancethat has led to a strong commitment to conduct business in accordance with best business practices based
on the principles of accountability and responsibility, compliance with relevant laws and regulations, risk
management, appropriate checks and balances and the delivery on commitments to all stakeholders. The
Group and the Bank has also kept abreast with international developments incorporate governance for the
promotion of enhanced transparency, integrity and the rule of law.
The Board of Directors is responsible for ensuring proper and sound corporate governance within the
Group. Good corporate governance is therefore a fundamental part of the culture and the business
practices of the Group and is also one of the core values of the Group.
OVERSIGHT ROLE OF THE BOARD OF DIRECTORS
The Board’s most significant responsibilities include guiding the Group with a view to ensuring long-term,
sustainable returns for shareholders whilst delivering exceptional services to our customers and having
regard to the interests of all other stakeholders, including staff, regulators and the communities in which
the Group operates.
The Board provides strategic direction with a focus on consistent business performance in an atmosphere
of transparency and accountability whilst also reviewing and monitoring proper corporate governance
throughout the Group.
The Board has provided strong leadership to the Bank resulting in the Bank taking banking services to thefurthest reaches of the society, the East African Region and in the generation of great shareholder wealth.
The Board of Directors has continued to supervise the delivery of strong business growth coupled with
continued delivery of very strong financial performance.
The Board has also attracted outstanding directors who have shown great commitment and enthusiasm
in discharging their duties and obligations to the Bank while also demonstrating the spirit and ethos of
the organization. The directors subscribe to the Code of Corporate Practices which is constantly reviewed
and which guides them in the fulfillment of their duties and responsibilities to shareholders, customers,
employees and respective communities. The code of corporate practices provides for the selection criteria
and processes for the board selection.
During the year, eleven directors served on the board with two alternates and five full board meetingswere held.
Mr Benson Wairegi, Mr Fredrick Muchoki and Mr Temitope Lawani retired by rotation from the Board
at the Annual General Meeting on 27th March 2013 and were re-elected. Mr Dennis Aluanga became a
substantive director with Mr. Alykhan Nathoo as his alternate. As well, Mr Temitope Lawani became an
alternate director to Mr Babatunde Soyoye.
STATEMENT OF CORPORATE GOVERNANCE
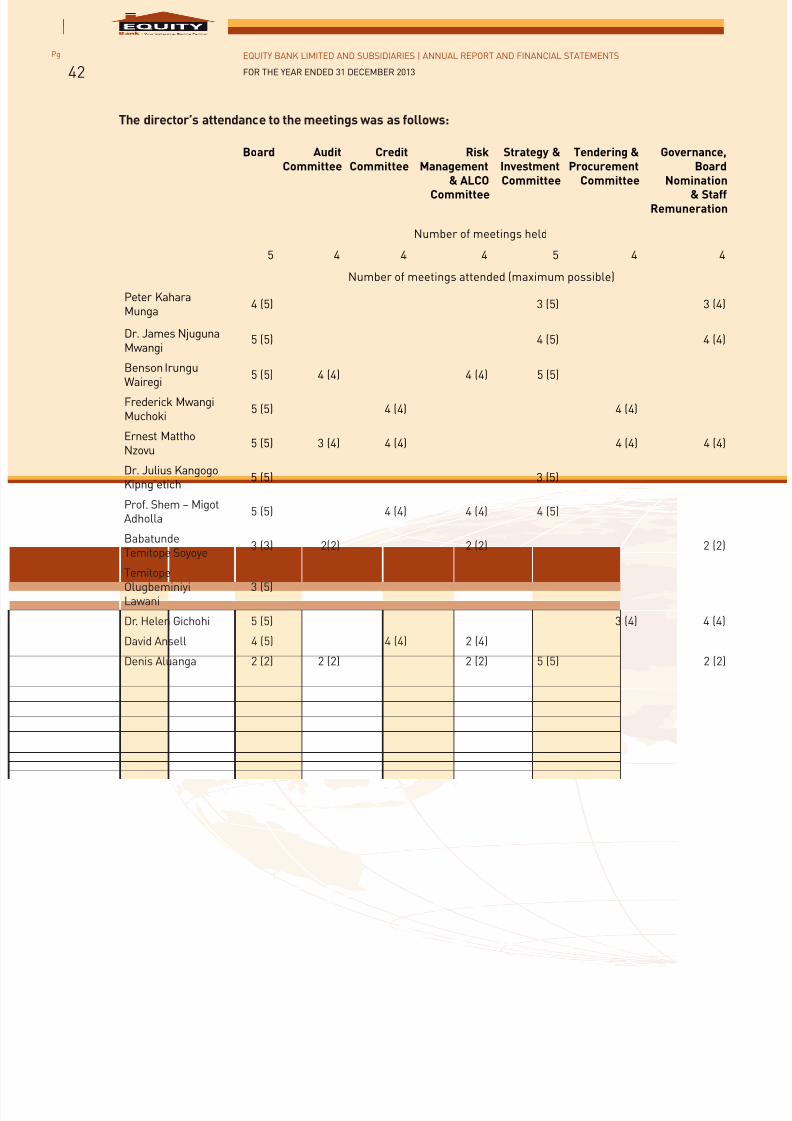
7/21/2019 Equity Bank Group Annual Report 2013
http://slidepdf.com/reader/full/equity-bank-group-annual-report-2013 44/124
EQUITY BANK LIMITED AND SUBSIDIARIES | ANNUAL REPORT AND FINANCIAL STATEMENTS
FOR THE YEAR ENDED 31 DECEMBER 2013
Pg
42
The director’s attendance to the meetings was as follows:
Board AuditCommittee
CreditCommittee
RiskManagement
& ALCO
Committee
Strategy &InvestmentCommittee
Tendering &Procurement
Committee
Governance,Board
Nomination
& StaffRemuneration
Number of meetings held
5 4 4 4 5 4 4
Number of meetings attended (maximum possible)
Peter KaharaMunga
4 (5) 3 (5) 3 (4)
Dr. James NjugunaMwangi
5 (5) 4 (5) 4 (4)
Benson IrunguWairegi
5 (5) 4 (4) 4 (4) 5 (5)
Frederick MwangiMuchoki
5 (5) 4 (4) 4 (4)
Ernest MatthoNzovu
5 (5) 3 (4) 4 (4) 4 (4) 4 (4)
Dr. Julius KangogoKipng’etich
5 (5) 3 (5)
Prof. Shem – MigotAdholla
5 (5) 4 (4) 4 (4) 4 (5)
BabatundeTemitope Soyoye
3 (3) 2(2) 2 (2) 2 (2)
Temitope
OlugbeminiyiLawani
3 (5)
Dr. Helen Gichohi 5 (5) 3 (4) 4 (4)
David Ansell 4 (5) 4 (4) 2 (4)
Denis Aluanga 2 (2) 2 (2) 2 (2) 5 (5) 2 (2)
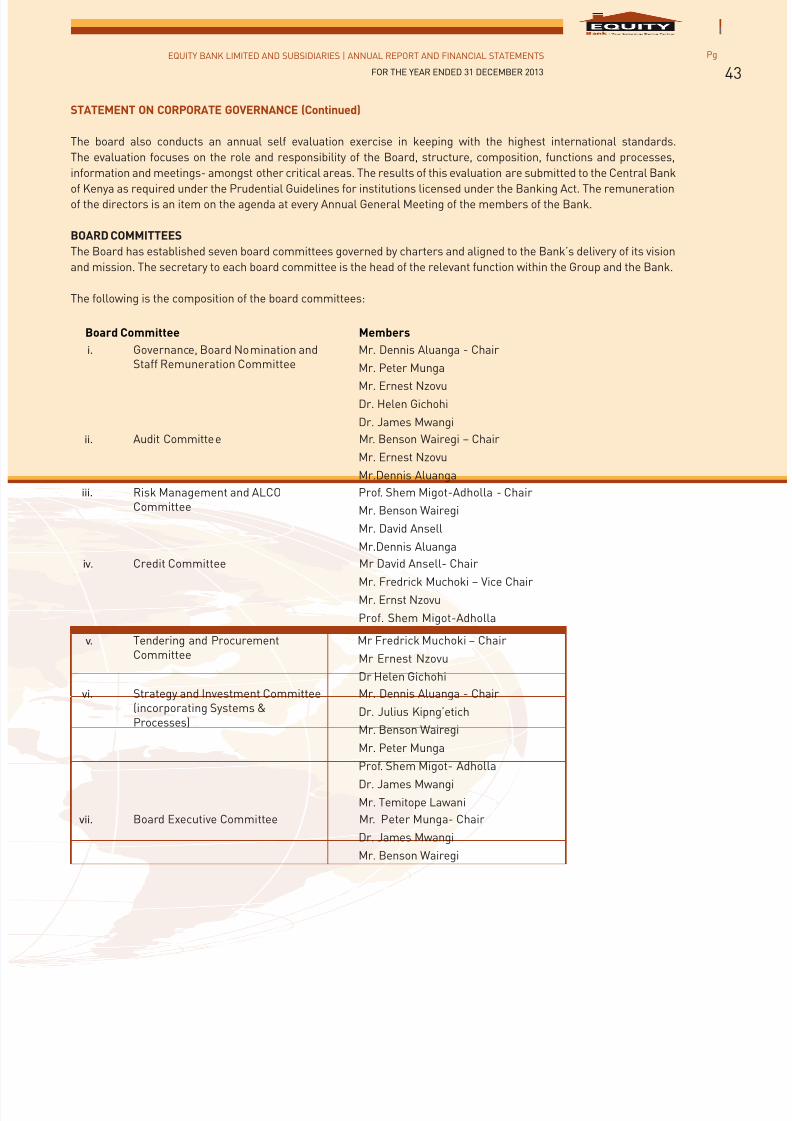
7/21/2019 Equity Bank Group Annual Report 2013
http://slidepdf.com/reader/full/equity-bank-group-annual-report-2013 45/124
EQUITY BANK LIMITED AND SUBSIDIARIES | ANNUAL REPORT AND FINANCIAL STATEMENTS
FOR THE YEAR ENDED 31 DECEMBER 2013
Pg
43
STATEMENT ON CORPORATE GOVERNANCE (Continued)
The board also conducts an annual self evaluation exercise in keeping with the highest international standards.
The evaluation focuses on the role and responsibility of the Board, structure, composition, functions and processes,
information and meetings- amongst other critical areas. The results of this evaluation are submitted to the Central Bank
of Kenya as required under the Prudential Guidelines for institutions licensed under the Banking Act. The remunerationof the directors is an item on the agenda at every Annual General Meeting of the members of the Bank.
BOARD COMMITTEES
The Board has established seven board committees governed by charters and aligned to the Bank’s delivery of its vision
and mission. The secretary to each board committee is the head of the relevant function within the Group and the Bank.
The following is the composition of the board committees:
Board Committee Members
i. Governance, Board Nomination andStaff Remuneration Committee
Mr. Dennis Aluanga - Chair
Mr. Peter Munga
Mr. Ernest NzovuDr. Helen Gichohi
Dr. James Mwangi
ii. Audit Committee Mr. Benson Wairegi – Chair
Mr. Ernest Nzovu
Mr.Dennis Aluanga
iii. Risk Management and ALCOCommittee
Prof. Shem Migot-Adholla - Chair
Mr. Benson Wairegi
Mr. David Ansell
Mr.Dennis Aluanga
iv. Credit Committee Mr David Ansell- Chair
Mr. Fredrick Muchoki – Vice ChairMr. Ernst Nzovu
Prof. Shem Migot-Adholla
v. Tendering and ProcurementCommittee
Mr Fredrick Muchoki – Chair
Mr Ernest Nzovu
Dr Helen Gichohi
vi. Strategy and Investment Committee(incorporating Systems &Processes)
Mr. Dennis Aluanga - Chair
Dr. Julius Kipng’etich
Mr. Benson Wairegi
Mr. Peter Munga
Prof. Shem Migot- Adholla
Dr. James Mwangi
Mr. Temitope Lawani
vii. Board Executive Committee Mr. Peter Munga- Chair
Dr. James Mwangi
Mr. Benson Wairegi
7/21/2019 Equity Bank Group Annual Report 2013
http://slidepdf.com/reader/full/equity-bank-group-annual-report-2013 46/124
EQUITY BANK LIMITED AND SUBSIDIARIES | ANNUAL REPORT AND FINANCIAL STATEMENTS
FOR THE YEAR ENDED 31 DECEMBER 2013
Pg
44
STATEMENT ON CORPORATE GOVERNANCE (Continued)
Governance, Board Nominations and Staff Remuneration Committee ensures implementation and compliance with
Human Resource Policies, makes recommendations to the board for policy on executive and senior management
remuneration so as to attract and retain high caliber staff and motivate them to implement the Group strategy. The
committee also ensures the Board appointments maintain a good mix of skills, experience and competence in variousfields of expertise.
Audit Committee provides independent oversight of the Group’s financial reporting and internal control system, ensures
that checks and balances are in place and the Group has and adheres to sound policies, processes and procedures that
deliver business strategic plans effectively. The committee receives and reviews findings of internal and external audits
and actions taken to address them. It is comprised of three non-executive directors.
Risk Management and ALCO Committee ensures quality, integrity and reliability of the Group risk management. The
Committee also discharges duties relating to corporate accountability and associated risks in terms of management
assurance and reporting. The Committee is responsible for ensuring that there are updated documented policies,
procedures and processes for risk management and monitors compliance with them and regularly reviews the adequacy
of the Risk Management framework in relation to the risks faced by the Group.
Credit Committee reviews and oversees the overall lending policy of the Group and its subsidiaries ensures lending
systems and procedures are adequate and adhered to and also ensures full compliance with Central Bank of Kenya
prudential guidelines, Bank of Uganda guidelines, Bank of South Sudan guidelines (Sudan), National Bank of Rwanda
(BNR), Bank of Tanzania guidelines, Banking Act and International Financial Reporting Standards to guarantee high
quality asset portfolio.
Tendering and Procurement Committee oversees and keeps the Board appraised of issues pertaining to the tendering
and procurement of goods and services including regularly reviewing the tendering and procurement procedures.
Strategy and Investment Committee supervises the development of corporate strategy and monitors implementation of
strategy. It manages the process of resource allocation to increase shareholder value in pursuit of the vision of the Bank
and Group. It also reviews and considers the proposed strategic investments and makes recommendations to the Board
and advices the management accordingly.
Executive Committee provides coaching and mentoring for the Chief Executive and provides the link between the Board
and the management. The committee provides a first line of support and response to management.
Board members have open access to management through the Chairman, Group Chief Executive Officer or Group
Company Secretary. Regular presentations are made by management to Board and Board Committee meetings and
directors may seek briefings from management on specific matters. The Board seeks additional information, where
appropriate. In accordance with the Companies Act Cap 486 the Company Secretary is a member of the Institute of
Certified Public Secretaries of Kenya(ICPSK).
THE BANK’S RISK MANAGEMENT FRAMEWORK
The Bank’s Board of Directors is the primary risk supervisor, exercising its role through various board-approved
committees. The Board has delegated the day-to-day operations of the Group and the Bank to management but remains
accountable for ensuring that operations are carried out in compliance with applicable laws and regulations that they are
consistent with safe and sound banking practices.
The Bank has instituted an end-to-end, forward-looking framework for risk management, in line with the Central Bank
regulations and with a view towards eventual, advanced Basel III compliance. Within this framework all risks associated
with the Bank’s business and operations, and those specific to the Group and the Bank, are actively owned and managed
by the respective business units supported by an integrated risk management hierarchy. With the Risk Management
function playing a monitoring and supporting role, this hierarchy utilizes, among other tools, a comprehensive risk
register that records all extraordinary events (positive or negative) occurring across all departments in all subsidiaries.
This risk register is then coupled with a risk control self-assessment platform that enables area experts across the Bank
to offer forecasts of risk; to be reconciled statistically with subsequently registered events, by risk function analysts. The
combination of an historical register and a forward-looking assessment system enables the risk function’s predictive
analytics team to offer strategic guidance to the business function heads that leverages both operations and experience:blending quantitative and qualitative elements.
7/21/2019 Equity Bank Group Annual Report 2013
http://slidepdf.com/reader/full/equity-bank-group-annual-report-2013 47/124
EQUITY BANK LIMITED AND SUBSIDIARIES | ANNUAL REPORT AND FINANCIAL STATEMENTS
FOR THE YEAR ENDED 31 DECEMBER 2013
Pg
45
STATEMENT ON CORPORATE GOVERNANCE (Continued)
Predictive risk analytics are furthermore driven by the identification of key risk drivers that are considered in the
formulation of quarterly and yearly forecasts as well as in the creation of stress tests. The Bank’s provisions and capital
(established by Board Risk & ALCO committee) are compared against plausible forecasts as well as stressed scenarios to
enable an adequate allocation of financial cushioning in any eventual market circumstance. The sensitivity of the Bank’sfinancial position then outlines for the Risk Management function the Bank’s risk profile: a key factor used in assessing
expansion, investment and operating opportunities and activities. Risk limits are also assessed to ensure the risk profile’s
alignment with business objectives and current market conditions. Moreover, the Bank has continued to strengthen the
risk management team by creating a more comprehensive structure that now comprises a Head of Risk and a Board Risk
Management Committee that works with specialized units as well as the rest of the Senior Management team.
The Risk Function’s Compliance Assurance docket reviews the compliance framework and specific compliance issues
by all business units and supports and follows up on implementation of Internal Audit, External Audit and regulators’
recommendations. In addition, the compliance enforcement team works with businesses so as to close any gaps that are
identified through audit and business reviews.
The Bank’s Internal Audit department plays a vital role within governance processes by keeping the Board and senior
management aware of risk and control issues and by assessing the effectiveness of risk management. Reporting to theAudit Committee of the Board, the department objectively and independently evaluates the existing risk and internal
control framework and analyses business processes and associated controls.
The Bank has also continued to invest in building its operational resilience by deploying a state of the art technology and
has migrated to a tier 4 data center that will ensure high system availability, security and redundancy capability.
FINANCIAL REPORTING AND DISCLOSURES
The performance of the Group and the Bank’s businesses is reported by management and the Board who have to
maintain proper books and records of the Group’s activities and to lay before the Group’s annual general meeting, an
income statement and a statement of financial position reflecting a true and fair view of the Group’s state of affairs.
Financial information on the Group’s performance is prepared using appropriate accounting policies and standards,
which are applied consistently. Financial statements are produced in accordance with International Financial ReportingStandards (IFRS) and the requirements of all the relevant statutes, rules and regulations. The Group also complies with
all relevant requirements by all other regulatory authorities such as the Retirement Benefits Authority, the Nairobi Stock
Exchange (NSE), Uganda Securities Exchange and other relevant ones in all countries in which we operate.
In accordance with the Banking Act, Capital Markets Authority Act, continuing listing obligations and the Central Bank
of Kenya prudential guidelines, the Bank ensures that shareholders and other stakeholders are provided with full and
timely information on performance at least once every quarter. Operational procedures, controls and policies have been
established to facilitate complete, accurate and timely processing of transactions and the safeguarding of assets.
DEVELOPMENT PARTNERS
The Group and the Bank has established relationships and partnerships with several organizations in its quest for the
highest standards of corporate governance, accountability and business growth.
Some of these institutions include, but are not limited to:-
1. The MasterCard Foundation
2. UK Agency for International Development (UKaid)
3. United States Agency for international Development (USAID)
4. Deutsche GesellschaftfuerInternationaleZusammenarbeit (GIZ)
5. Hong Kong Shangai Banking Corporation(HSBC)
6. Bill and Melinda Gates Foundation
7. World Food Programme (WFP)
8. German Development Bank ( KfW)
9. United Nations International Fund for Children (UNICEF) jointly with Red Cross
10. United Nations Capital Development Fund (UNCDF)
7/21/2019 Equity Bank Group Annual Report 2013
http://slidepdf.com/reader/full/equity-bank-group-annual-report-2013 48/124
EQUITY BANK LIMITED AND SUBSIDIARIES | ANNUAL REPORT AND FINANCIAL STATEMENTS
FOR THE YEAR ENDED 31 DECEMBER 2013
Pg
46
11. Swiss Foundation for Technical Co-operation ( Swisscontact)
STATEMENT ON CORPORATE GOVERNANCE (Continued)
12. Consultative Group Assisting the Poor (CGAP)
13. Financial Sector Deepening Trust (FSD)
14. International Fund for Agricultural Development (IFAD)15. Alliance for a Green Revolution in Africa (AGRA)
16. The World Bank jointly with the Kenya Forest Service
17. Food and Agriculture Organization (FAO)
18. Action Against Hunger ( ACF)
19. Food for the Hungry (FH)
20. Millennium Promise of Earth Institute
21. Kenyatta University
22. China Development Bank
23. ResponsAbility Global Microfinance Fund
24. Dexia Micro Credit Fund
25. Blue Orchard Loans for Development SA
26. Duetsche Bank Microfinace Fund27. Ontwikelinslanden N.V (FMO)
28. Micro Finance Sector Support Credit (Ministry of Finance)
29. Micro Finance Enhancement Facility (MEF)
30. International Finance Corporation (IFC)
31. European Investment Bank (EIB)
32. Technoserve
33. BizCorps Inc.
34. African Development Bank
35. Nourafchan Foundation
36. International Labour Organisation (ILO)
37. Africa Nazarene University
38. Kenya Tea Development Agency (KTDA)
39. Visa40. MasterCard Worldwide
41. Google
42. PayPal
43. American Express
The Group and the Bank are also members of the following network associations and forums
1. Association of Microfinance Institutions (AMFI)
2. Kenya Bankers Association (KBA)
3. Women’s World Banking (WWB)
4. Global Network for Banking Innovation (GNBI)
5. Small Business Banking Network (SBBN)
6. Micro Finance Network (MFN)
7. Global Agenda Council on Emerging Multinationals 2010
8. World Economic Forum
9. Clinton Global Initiative
10. African Leadership Network (ALN)
11. UN Economic and Social Council
12. G8 New Alliance for Food Security & Nutrition
13. Global Agenda Council on New Models of Economic Thinking of the World Economic Forum
PARTICULARS OF SHAREHOLDING
The Group and the Bank complies with the provisions of the Capital Markets Act and all the Rules Regulations and
guidelines made there under. Monthly reports are made to the Capital Markets Authority (CMA) and the Nairobi Securities
Exchange (NSE) on the particulars of the shareholders as required by the law.
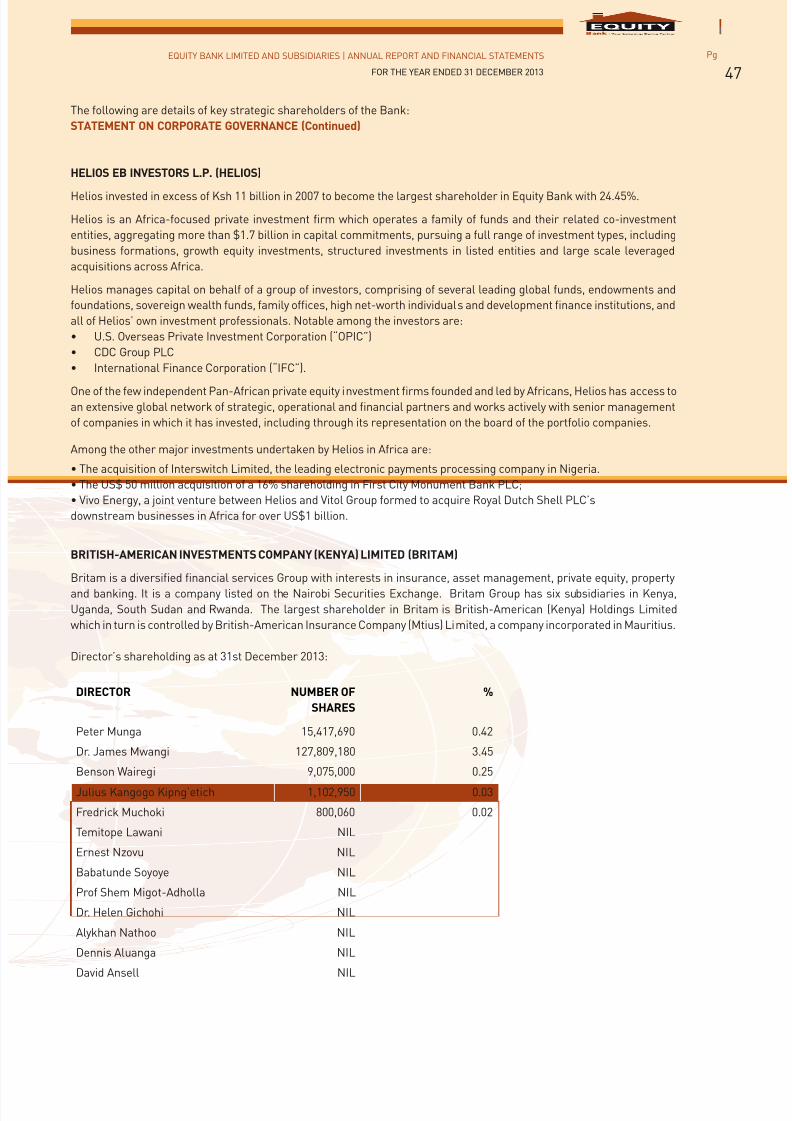
7/21/2019 Equity Bank Group Annual Report 2013
http://slidepdf.com/reader/full/equity-bank-group-annual-report-2013 49/124
EQUITY BANK LIMITED AND SUBSIDIARIES | ANNUAL REPORT AND FINANCIAL STATEMENTS
FOR THE YEAR ENDED 31 DECEMBER 2013
Pg
47
The following are details of key strategic shareholders of the Bank:
STATEMENT ON CORPORATE GOVERNANCE (Continued)
HELIOS EB INVESTORS L.P. (HELIOS)
Helios invested in excess of Ksh 11 billion in 2007 to become the largest shareholder in Equity Bank with 24.45%.
Helios is an Africa-focused private investment firm which operates a family of funds and their related co-investment
entities, aggregating more than $1.7 billion in capital commitments, pursuing a full range of investment types, including
business formations, growth equity investments, structured investments in listed entities and large scale leveraged
acquisitions across Africa.
Helios manages capital on behalf of a group of investors, comprising of several leading global funds, endowments and
foundations, sovereign wealth funds, family offices, high net-worth individuals and development finance institutions, and
all of Helios’ own investment professionals. Notable among the investors are:
• U.S. Overseas Private Investment Corporation (“OPIC”)
• CDC Group PLC
• International Finance Corporation (“IFC”).
One of the few independent Pan-African private equity investment firms founded and led by Africans, Helios has access toan extensive global network of strategic, operational and financial partners and works actively with senior management
of companies in which it has invested, including through its representation on the board of the portfolio companies.
Among the other major investments undertaken by Helios in Africa are:
• The acquisition of Interswitch Limited, the leading electronic payments processing company in Nigeria.
• The US$ 50 million acquisition of a 16% shareholding in First City Monument Bank PLC;
• Vivo Energy, a joint venture between Helios and Vitol Group formed to acquire Royal Dutch Shell PLC’s
downstream businesses in Africa for over US$1 billion.
BRITISH-AMERICAN INVESTMENTS COMPANY (KENYA) LIMITED (BRITAM)
Britam is a diversified financial services Group with interests in insurance, asset management, private equity, propertyand banking. It is a company listed on the Nairobi Securities Exchange. Britam Group has six subsidiaries in Kenya,
Uganda, South Sudan and Rwanda. The largest shareholder in Britam is British-American (Kenya) Holdings Limited
which in turn is controlled by British-American Insurance Company (Mtius) Limited, a company incorporated in Mauritius.
Director’s shareholding as at 31st December 2013:
DIRECTOR NUMBER OF
SHARES
%
Peter Munga 15,417,690 0.42
Dr. James Mwangi 127,809,180 3.45
Benson Wairegi 9,075,000 0.25Julius Kangogo Kipng’etich 1,102,950 0.03
Fredrick Muchoki 800,060 0.02
Temitope Lawani NIL
Ernest Nzovu NIL
Babatunde Soyoye NIL
Prof Shem Migot-Adholla NIL
Dr. Helen Gichohi NIL
Alykhan Nathoo NIL
Dennis Aluanga NIL
David Ansell NIL
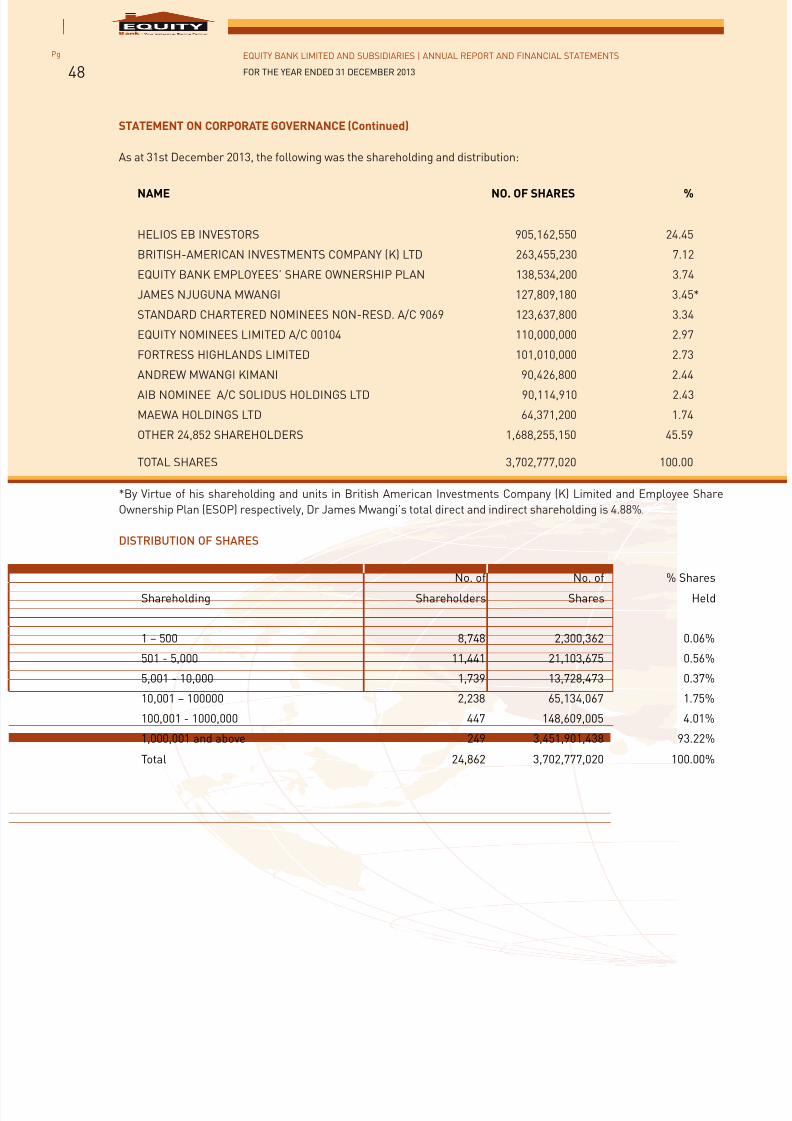
7/21/2019 Equity Bank Group Annual Report 2013
http://slidepdf.com/reader/full/equity-bank-group-annual-report-2013 50/124
EQUITY BANK LIMITED AND SUBSIDIARIES | ANNUAL REPORT AND FINANCIAL STATEMENTS
FOR THE YEAR ENDED 31 DECEMBER 2013
Pg
48
STATEMENT ON CORPORATE GOVERNANCE (Continued)
As at 31st December 2013, the following was the shareholding and distribution:
NAME NO. OF SHARES %
HELIOS EB INVESTORS 905,162,550 24.45
BRITISH-AMERICAN INVESTMENTS COMPANY (K) LTD 263,455,230 7.12
EQUITY BANK EMPLOYEES’ SHARE OWNERSHIP PLAN 138,534,200 3.74
JAMES NJUGUNA MWANGI 127,809,180 3.45*
STANDARD CHARTERED NOMINEES NON-RESD. A/C 9069 123,637,800 3.34
EQUITY NOMINEES LIMITED A/C 00104 110,000,000 2.97
FORTRESS HIGHLANDS LIMITED 101,010,000 2.73
ANDREW MWANGI KIMANI 90,426,800 2.44
AIB NOMINEE A/C SOLIDUS HOLDINGS LTD 90,114,910 2.43
MAEWA HOLDINGS LTD 64,371,200 1.74
OTHER 24,852 SHAREHOLDERS 1,688,255,150 45.59
TOTAL SHARES 3,702,777,020 100.00
*By Virtue of his shareholding and units in British American Investments Company (K) Limited and Employee Share
Ownership Plan (ESOP) respectively, Dr James Mwangi’s total direct and indirect shareholding is 4.88%.
DISTRIBUTION OF SHARES
No. of No. of % SharesShareholding Shareholders Shares Held
1 – 500 8,748 2,300,362 0.06%
501 - 5,000 11,441 21,103,675 0.56%
5,001 - 10,000 1,739 13,728,473 0.37%
10,001 – 100000 2,238 65,134,067 1.75%
100,001 - 1000,000 447 148,609,005 4.01%
1,000,001 and above 249 3,451,901,438 93.22%
Total 24,862 3,702,777,020 100.00%
7/21/2019 Equity Bank Group Annual Report 2013
http://slidepdf.com/reader/full/equity-bank-group-annual-report-2013 51/124
EQUITY BANK LIMITED AND SUBSIDIARIES | ANNUAL REPORT AND FINANCIAL STATEMENTS
FOR THE YEAR ENDED 31 DECEMBER 2013
Pg
49
STATEMENT OF DIRECTORS’ RESPONSIBILITIES
The Kenyan Companies Act requires the directors to prepare financial statements for each financial year which give a
true and fair view of the state of affairs of the Bank and its subsidiaries (the Group) as at the end of the financial year and
of the operating results of the Group and the Bank for that year. It also requires the directors to ensure the Group and
the Bank keeps proper accounting records which disclose, with reasonable accuracy, the financial position of the Groupand the Bank.
The directors accept responsibility for the annual financial statements, which have been prepared using appropriate
accounting policies supported by reasonable and prudent judgements and estimates, in conformity with International
Financial Reporting Standards and in the manner required by the Kenyan Companies Act. The directors are of the opinion
that the financial statements give a true and fair view of the state of the financial affairs of the Group and the Bank and of
the operating results of the Group and the Bank.
The directors further accept responsibility for the maintenance of accounting records which may be relied upon in the
preparation of financial statements, as well as adequate systems of internal control.
Nothing has come to the attention of the directors to indicate that the Group and the Bank will not remain a going concern
for at least the next twelve months from the date of this statement.
Director: ________________________________
Director: _________________________________
Secretary: _________________________________
27th February 2014.
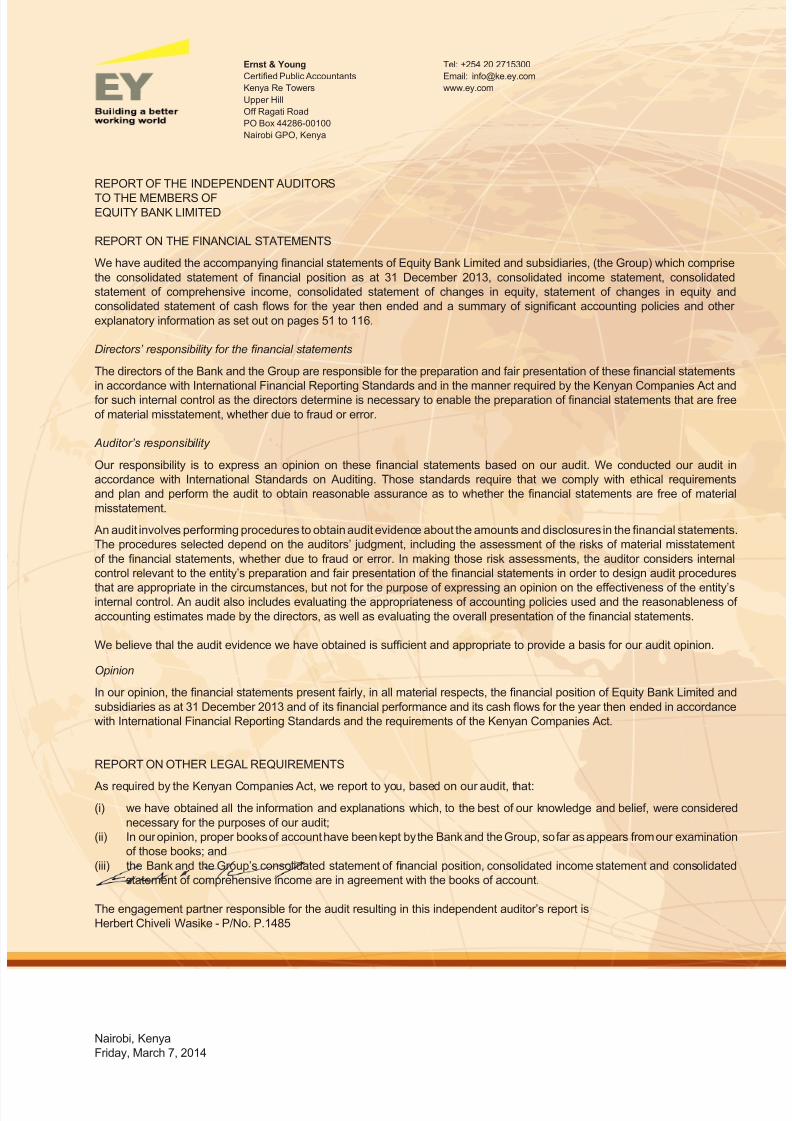
7/21/2019 Equity Bank Group Annual Report 2013
http://slidepdf.com/reader/full/equity-bank-group-annual-report-2013 52/124
REPORT OF THE INDEPENDENT AUDITORS
TO THE MEMBERS OF
EQUITY BANK LIMITED
REPORT ON THE FINANCIAL STATEMENTS
We have audited the accompanying nancial statements of Equity Bank Limited and subsidiaries, (the Group) which comprise
the consolidated statement of nancial position as at 31 December 2013, consolidated income statement, consolidated
statement of comprehensive income, consolidated statement of changes in equity, statement of changes in equity and
consolidated statement of cash ows for the year then ended and a summary of signicant accounting policies and other
explanatory information as set out on pages 51 to 116.
Directors’ responsibility for the nancial statements
The directors of the Bank and the Group are responsible for the preparation and fair presentation of these nancial statements
in accordance with International Financial Reporting Standards and in the manner required by the Kenyan Companies Act andfor such internal control as the directors determine is necessary to enable the preparation of nancial statements that are free
of material misstatement, whether due to fraud or error.
Auditor’s responsibility
Our responsibility is to express an opinion on these nancial statements based on our audit. We conducted our audit in
accordance with International Standards on Auditing. Those standards require that we comply with ethical requirements
and plan and perform the audit to obtain reasonable assurance as to whether the nancial statements are free of material
misstatement.
An audit involves performing procedures to obtain audit evidence about the amounts and disclosures in the nancial statements.
The procedures selected depend on the auditors’ judgment, including the assessment of the risks of material misstatement
of the nancial statements, whether due to fraud or error. In making those risk assessments, the auditor considers internal
control relevant to the entity’s preparation and fair presentation of the nancial statements in order to design audit procedures
that are appropriate in the circumstances, but not for the purpose of expressing an opinion on the effectiveness of the entity’sinternal control. An audit also includes evaluating the appropriateness of accounting policies used and the reasonableness of
accounting estimates made by the directors, as well as evaluating the overall presentation of the nancial statements.
We believe thal the audit evidence we have obtained is sufcient and appropriate to provide a basis for our audit opinion.
Opinion
In our opinion, the nancial statements present fairly, in all material respects, the nancial position of Equity Bank Limited and
subsidiaries as at 31 December 2013 and of its nancial performance and its cash ows for the year then ended in accordance
with International Financial Reporting Standards and the requirements of the Kenyan Companies Act.
REPORT ON OTHER LEGAL REQUIREMENTS
As required by the Kenyan Companies Act, we report to you, based on our audit, that:
(i) we have obtained all the information and explanations which, to the best of our knowledge and belief, were considered
necessary for the purposes of our audit;
(ii) In our opinion, proper books of account have been kept by the Bank and the Group, so far as appears from our examination
of those books; and
(iii) the Bank and the Group’s consolidated statement of nancial position, consolidated income statement and consolidated
statement of comprehensive income are in agreement with the books of account.
The engagement partner responsible for the audit resulting in this independent auditor’s report is
Herbert Chiveli Wasike - P/No. P.1485
Nairobi, Kenya
Friday, March 7, 2014
Tel: +254 20 2715300
Email: [email protected]
www.ey.com
Ernst & Young
Certied Public Accountants
Kenya Re Towers
Upper Hill
Off Ragati Road
PO Box 44286-00100
Nairobi GPO, Kenya
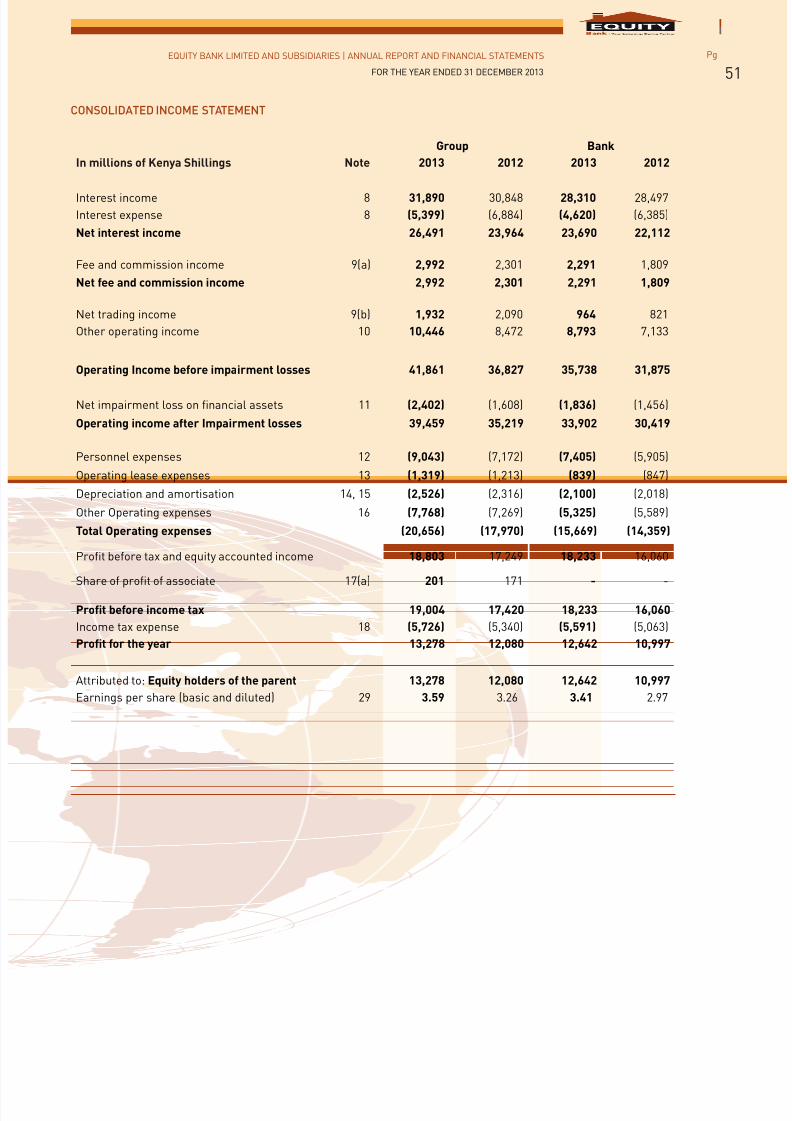
7/21/2019 Equity Bank Group Annual Report 2013
http://slidepdf.com/reader/full/equity-bank-group-annual-report-2013 53/124
EQUITY BANK LIMITED AND SUBSIDIARIES | ANNUAL REPORT AND FINANCIAL STATEMENTS
FOR THE YEAR ENDED 31 DECEMBER 2013
Pg
51
CONSOLIDATED INCOME STATEMENT
Group Bank
In millions of Kenya Shillings Note 2013 2012 2013 2012
Interest income 8 31,890 30,848 28,310 28,497Interest expense 8 (5,399) (6,884) (4,620) (6,385)
Net interest income 26,491 23,964 23,690 22,112
Fee and commission income 9(a) 2,992 2,301 2,291 1,809
Net fee and commission income 2,992 2,301 2,291 1,809
Net trading income 9(b) 1,932 2,090 964 821
Other operating income 10 10,446 8,472 8,793 7,133
Operating Income before impairment losses 41,861 36,827 35,738 31,875
Net impairment loss on financial assets 11 (2,402) (1,608) (1,836) (1,456)
Operating income after Impairment losses 39,459 35,219 33,902 30,419
Personnel expenses 12 (9,043) (7,172) (7,405) (5,905)
Operating lease expenses 13 (1,319) (1,213) (839) (847)
Depreciation and amortisation 14, 15 (2,526) (2,316) (2,100) (2,018)
Other Operating expenses 16 (7,768) (7,269) (5,325) (5,589)
Total Operating expenses (20,656) (17,970) (15,669) (14,359)
Profit before tax and equity accounted income 18,803 17,249 18,233 16,060
Share of profit of associate 17(a) 201 171 - -
Profit before income tax 19,004 17,420 18,233 16,060
Income tax expense 18 (5,726) (5,340) (5,591) (5,063)
Profit for the year 13,278 12,080 12,642 10,997
Attributed to: Equity holders of the parent 13,278 12,080 12,642 10,997
Earnings per share (basic and diluted) 29 3.59 3.26 3.41 2.97
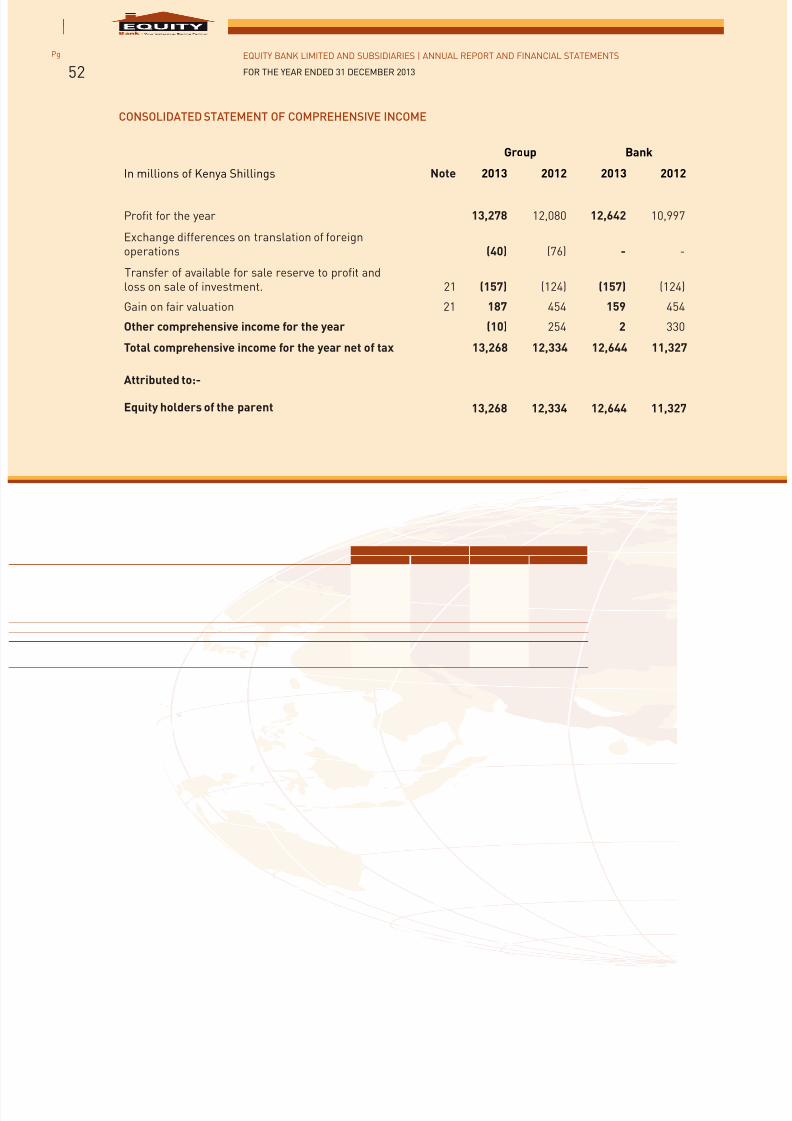
7/21/2019 Equity Bank Group Annual Report 2013
http://slidepdf.com/reader/full/equity-bank-group-annual-report-2013 54/124
EQUITY BANK LIMITED AND SUBSIDIARIES | ANNUAL REPORT AND FINANCIAL STATEMENTS
FOR THE YEAR ENDED 31 DECEMBER 2013
Pg
52
CONSOLIDATED STATEMENT OF COMPREHENSIVE INCOME
Group Bank
In millions of Kenya Shillings Note 2013 2012 2013 2012
Profit for the year 13,278 12,080 12,642 10,997
Exchange differences on translation of foreignoperations (40) (76) - -
Transfer of available for sale reserve to profit andloss on sale of investment. 21 (157) (124) (157) (124)
Gain on fair valuation 21 187 454 159 454
Other comprehensive income for the year (10) 254 2 330
Total comprehensive income for the year net of tax 13,268 12,334 12,644 11,327
Attributed to:-
Equity holders of the parent 13,268 12,334 12,644 11,327
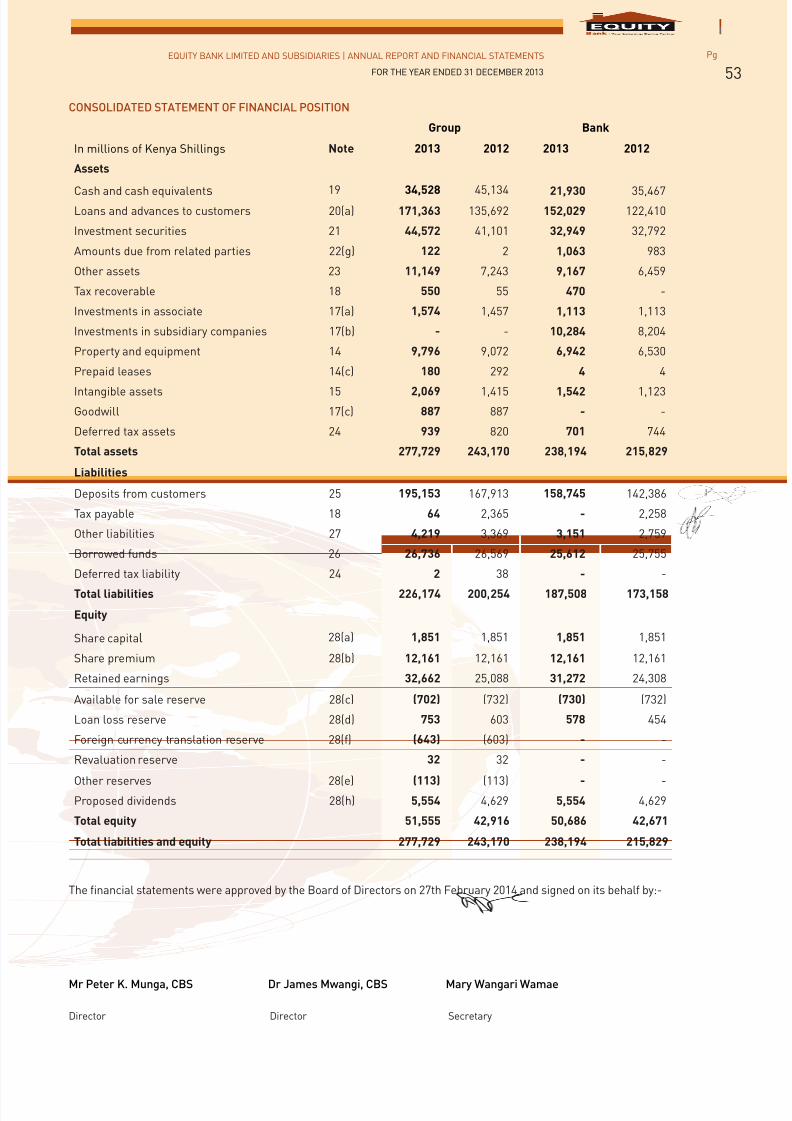
7/21/2019 Equity Bank Group Annual Report 2013
http://slidepdf.com/reader/full/equity-bank-group-annual-report-2013 55/124
EQUITY BANK LIMITED AND SUBSIDIARIES | ANNUAL REPORT AND FINANCIAL STATEMENTS
FOR THE YEAR ENDED 31 DECEMBER 2013
Pg
53
CONSOLIDATED STATEMENT OF FINANCIAL POSITION
Group Bank
In millions of Kenya Shillings Note 2013 2012 2013 2012
Assets
Cash and cash equivalents 19 34,528 45,134 21,930 35,467Loans and advances to customers 20(a) 171,363 135,692 152,029 122,410
Investment securities 21 44,572 41,101 32,949 32,792
Amounts due from related parties 22(g) 122 2 1,063 983
Other assets 23 11,149 7,243 9,167 6,459
Tax recoverable 18 550 55 470 -
Investments in associate 17(a) 1,574 1,457 1,113 1,113
Investments in subsidiary companies 17(b) - - 10,284 8,204
Property and equipment 14 9,796 9,072 6,942 6,530
Prepaid leases 14(c) 180 292 4 4
Intangible assets 15 2,069 1,415 1,542 1,123
Goodwill 17(c) 887 887 - -
Deferred tax assets 24 939 820 701 744
Total assets 277,729 243,170 238,194 215,829
Liabilities
Deposits from customers 25 195,153 167,913 158,745 142,386
Tax payable 18 64 2,365 - 2,258
Other liabilities 27 4,219 3,369 3,151 2,759
Borrowed funds 26 26,736 26,569 25,612 25,755
Deferred tax liability 24 2 38 - -
Total liabilities 226,174 200,254 187,508 173,158
Equity
Share capital 28(a) 1,851 1,851 1,851 1,851
Share premium 28(b) 12,161 12,161 12,161 12,161
Retained earnings 32,662 25,088 31,272 24,308
Available for sale reserve 28(c) (702) (732) (730) (732)
Loan loss reserve 28(d) 753 603 578 454
Foreign currency translation reserve 28(f) (643) (603) - -
Revaluation reserve 32 32 - -
Other reserves 28(e) (113) (113) - -
Proposed dividends 28(h) 5,554 4,629 5,554 4,629
Total equity 51,555 42,916 50,686 42,671
Total liabilities and equity 277,729 243,170 238,194 215,829
The financial statements were approved by the Board of Directors on 27th February 2014 and signed on its behalf by:-
Mr Peter K. Munga, CBS Dr James Mwangi, CBS Mary Wangari Wamae
Director Director Secretary
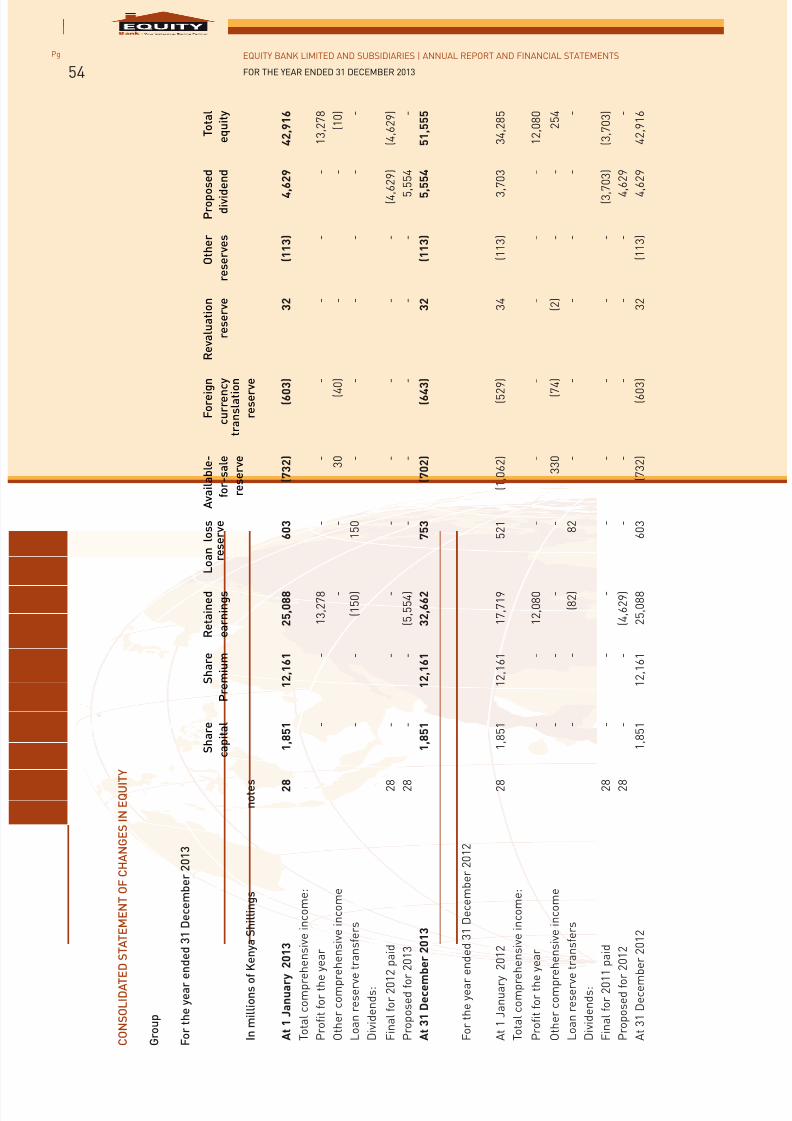
7/21/2019 Equity Bank Group Annual Report 2013
http://slidepdf.com/reader/full/equity-bank-group-annual-report-2013 56/124
EQUITY BANK LIMITED AND SUBSIDIARIES | ANNUAL REPORT AND FINANCIAL STATEMENTS
FOR THE YEAR ENDED 31 DECEMBER 2013
Pg
54
C O N S O L I D A T E D S T A T E M E N T O F C H A N G E S I N E Q U I T Y
G r o u p
F o r t h e y e a r e n
d e d 3 1 D e c e m b e r 2 0 1 3
I n m i l l i o n s o f K e n y a S h i l l i n g s
n o t e s
S h a r e
c a p i t a l
S h a r e
P r e m i u m
R e t a i n e d
e a r n i n g s
L o a n l o s s
r e s e r v e
A v a i l a b l e -
f o r - s a l e
r e s e r v e
F o r e i g
n
c u r r e n c
y
t r a n s l a t i o
n
r e s e r v
e
R e v a l u a t i o n
r e s e r v e
O t h e r
r e s e r v e s
P r o p o
s e d
d i v i d
e n d
T o t a l
e q u i t y
A t 1 J a n u a r y
2 0 1 3
2 8
1 , 8
5 1
1 2
, 1 6 1
2 5
, 0 8 8
6 0 3
( 7 3 2 )
( 6 0 3 )
3 2
( 1 1 3 )
4
, 6 2 9
4 2
, 9 1 6
T o t a l c o m p r e h
e n s i v e i n c o m e :
P r o fi t f o r t h e y e a r
-
-
1 3 , 2
7 8
-
-
-
-
-
-
1 3 , 2
7 8
O t h e r c o m p r e
h e n s i v e i n c o m e
-
-
3 0
( 4 0 )
-
-
( 1 0 )
L o a n r e s e r v e
t r a n s f e r s
-
-
( 1 5 0 )
1 5 0
-
-
-
-
-
-
D i v i d e n d s :
F i n a l f o r 2 0 1 2
p a i d
2 8
-
-
-
-
-
-
-
-
( 4 ,
6 2 9 )
( 4 , 6
2 9 )
P r o p o s e d f o r 2 0 1 3
2 8
-
-
( 5 , 5
5 4 )
-
-
-
-
-
5
, 5 5 4
-
A t 3 1 D e c e m b
e r 2 0 1 3
1 , 8
5 1
1 2
, 1 6 1
3 2
, 6 6 2
7 5 3
( 7 0 2 )
( 6 4 3 )
3 2
( 1 1 3 )
5
, 5 5 4
5 1
, 5 5 5
F o r t h e y e a r e
n d e d 3 1 D e c e m b e r 2 0 1 2
A t 1 J a n u a r y 2 0 1 2
2 8
1 , 8
5 1
1 2 , 1
6 1
1 7 , 7
1 9
5 2 1
( 1 , 0
6 2 )
( 5 2 9 )
3 4
( 1 1 3 )
3
, 7 0 3
3 4 , 2
8 5
T o t a l c o m p r e h
e n s i v e i n c o m e :
P r o fi t f o r t h e y e a r
-
-
1 2 , 0
8 0
-
-
-
-
-
-
1 2 , 0
8 0
O t h e r c o m p r e
h e n s i v e i n c o m e
-
-
-
-
3 3 0
( 7 4 )
( 2 )
-
-
2 5 4
L o a n r e s e r v e
t r a n s f e r s
-
-
( 8 2 )
8 2
-
-
-
-
-
-
D i v i d e n d s :
F i n a l f o r 2 0 1 1
p a i d
2 8
-
-
-
-
-
-
-
-
( 3 ,
7 0 3 )
( 3 , 7
0 3 )
P r o p o s e d f o r 2 0 1 2
2 8
-
-
( 4 , 6
2 9 )
-
-
-
-
-
4
, 6 2 9
-
A t 3 1 D e c e m b
e r 2 0 1 2
1 , 8
5 1
1 2 , 1
6 1
2 5 , 0
8 8
6 0 3
( 7 3 2 )
( 6 0 3 )
3 2
( 1 1 3 )
4
, 6 2 9
4 2 , 9
1 6
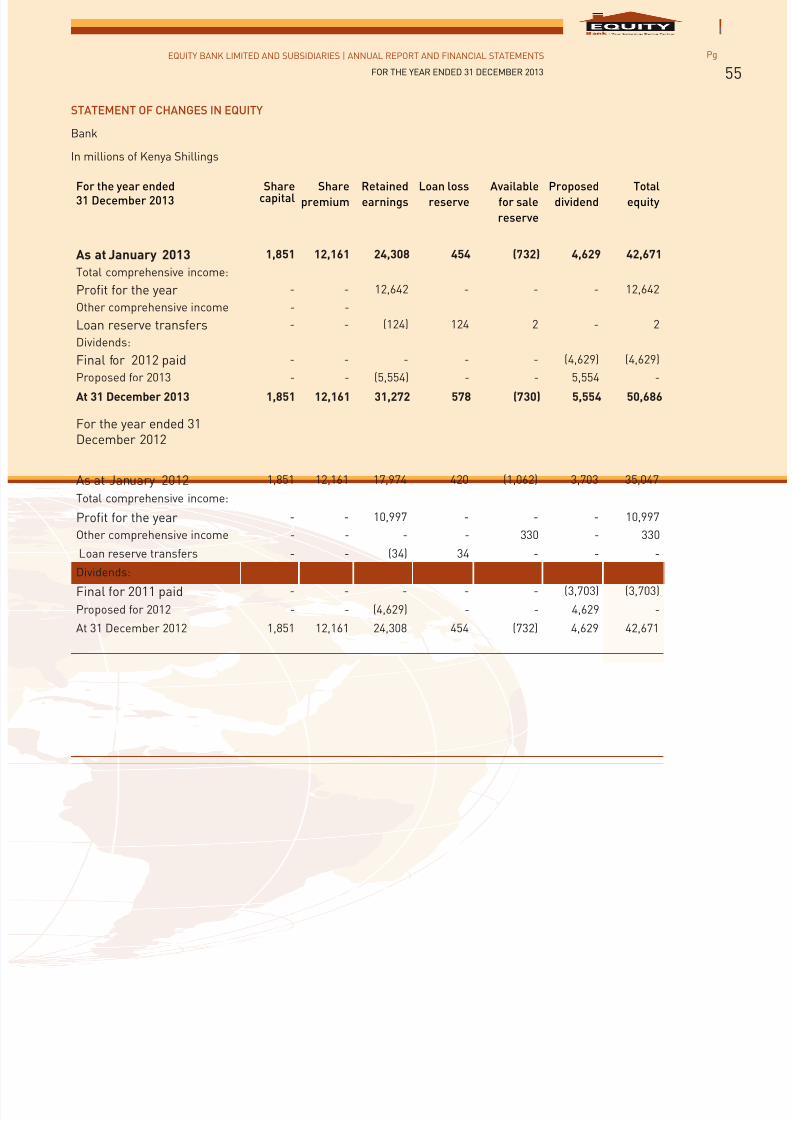
7/21/2019 Equity Bank Group Annual Report 2013
http://slidepdf.com/reader/full/equity-bank-group-annual-report-2013 57/124
EQUITY BANK LIMITED AND SUBSIDIARIES | ANNUAL REPORT AND FINANCIAL STATEMENTS
FOR THE YEAR ENDED 31 DECEMBER 2013
Pg
55
STATEMENT OF CHANGES IN EQUITY
Bank
In millions of Kenya Shillings
For the year ended31 December 2013
Sharecapital
Share
premium
Retained
earnings
Loan loss
reserve
Available
for sale
reserve
Proposed
dividend
Total
equity
As at January 2013 1,851 12,161 24,308 454 (732) 4,629 42,671
Total comprehensive income:
Profit for the year - - 12,642 - - - 12,642
Other comprehensive income - -
Loan reserve transfers - - (124) 124 2 - 2
Dividends:
Final for 2012 paid - - - - - (4,629) (4,629)
Proposed for 2013 - - (5,554) - - 5,554 -
At 31 December 2013 1,851 12,161 31,272 578 (730) 5,554 50,686
For the year ended 31December 2012
As at January 2012 1,851 12,161 17,974 420 (1,062) 3,703 35,047
Total comprehensive income:
Profit for the year - - 10,997 - - - 10,997
Other comprehensive income - - - - 330 - 330
Loan reserve transfers - - (34) 34 - - -
Dividends:
Final for 2011 paid - - - - - (3,703) (3,703)
Proposed for 2012 - - (4,629) - - 4,629 -
At 31 December 2012 1,851 12,161 24,308 454 (732) 4,629 42,671
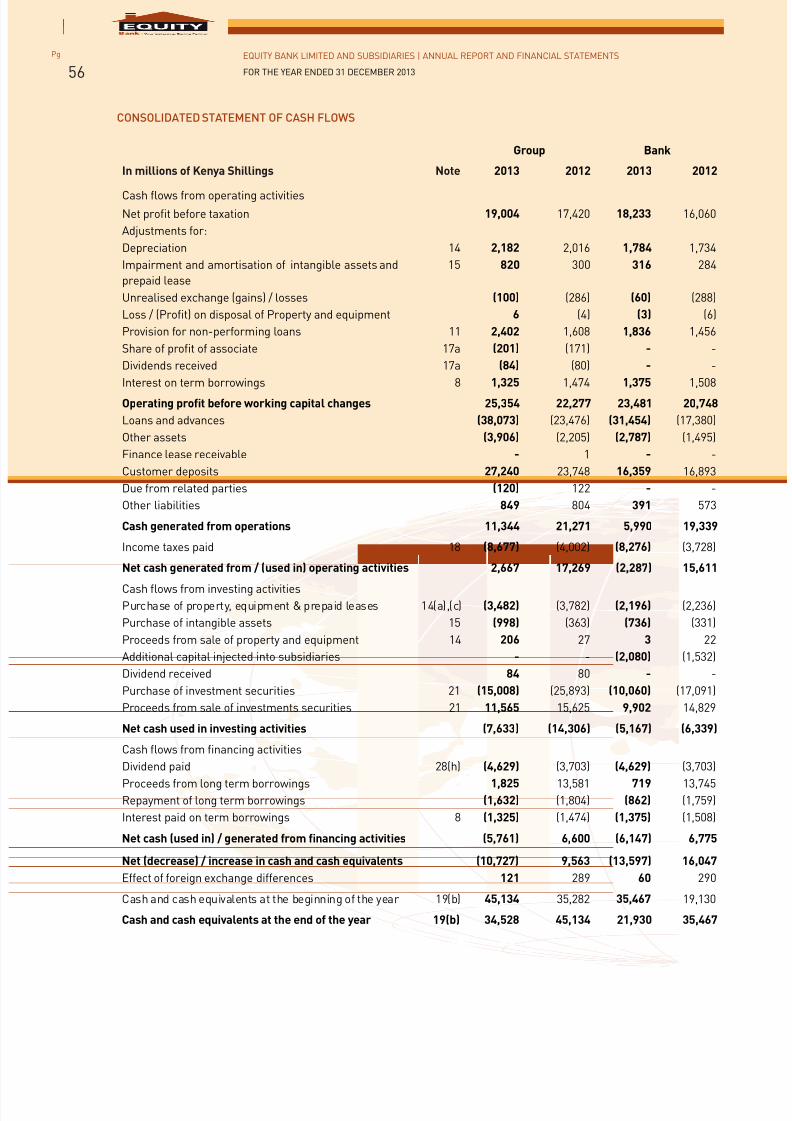
7/21/2019 Equity Bank Group Annual Report 2013
http://slidepdf.com/reader/full/equity-bank-group-annual-report-2013 58/124
7/21/2019 Equity Bank Group Annual Report 2013
http://slidepdf.com/reader/full/equity-bank-group-annual-report-2013 59/124
EQUITY BANK LIMITED AND SUBSIDIARIES | ANNUAL REPORT AND FINANCIAL STATEMENTS
FOR THE YEAR ENDED 31 DECEMBER 2013
Pg
57
NOTES TO THE CONSOLIDATED FINANCIAL STATEMENTS
1. Corporate Information
Equity Bank Limited (The “Bank”) is incorporated, registered under the Kenyan Companies Act (Cap 486 Laws of
Kenya) and domiciled in Kenya. The address of the Bank’s registered office is 9th Floor, Equity Centre, Hospital
road, Upper Hill. The Bank is licensed under the Kenya Banking Act (Chapter 488), and continues to offer retailbanking, microfinance and related services.
The Bank has subsidiaries in Kenya, Uganda, South Sudan, Rwanda and Tanzania. Its shares are listed on the
Nairobi Securities Exchange and Uganda Securities Exchange.
The consolidated financial statements for the year ended 31st December 2013 were authorised for issue according
with resolution of the directors on 27 February 2014
2. Accounting policies
The accounting policies adopted are consistent with those of the previous financial year, except for the following
new and amended IFRS and IFRIC interpretations:
2.1 Basis of preparation
The consolidated financial statements have been prepared on a historical cost basis, except for available –forsale investments and property and equipment all of which have been measured at fair value. The consolidated
financial statements are presented in Kenya Shillings and all values are rounded to the nearest million Kenya
Shillings, except when otherwise indicated.
(a) Statement of compliance
The consolidated financial statements have been prepared in accordance with International Financial
Reporting Standards (IFRSs), as issued by the IASB and the requirements of the Kenyan Companies Act.
(b) Presentation of financial statements
The Bank presents its statement of financial position in order of liquidity. Financial assets and financial
liabilities are offset and the net amount reported in the consolidated statement of financial position only
when there is a currently legally enforceable right to offset the recognised amounts and there is an intention
to settle on a net basis, or to realise the assets and settle the liability simultaneously. Income and expensesare not offset in the consolidated income statement unless required or permitted by any accounting standard
or interpretation, and as specifically disclosed in the accounting policies of the Bank.
(c) Functional and presentation currency
The consolidated financial statements are presented in Kenya Shillings, which is the Bank’s functional
currency and have been rounded off to the nearest million.
(d) Basis of consolidation
The consolidated financial statements of the Group comprise the financial statements of the Bank and its
subsidiaries as at 31 December each year.
All intra-group balances, transactions, income and expenses and profits and losses resulting from intra-
group transactions are eliminated.
Subsidiaries are consolidated from the date on which the group obtains control of the subsidiary and cease
to be consolidated from the date on which loses control of the subsidiary. Control is achieved when the
Group is exposed, or has rights, to variable returns from its involvement with the investee and has the ability
to affect those returns through its power over the investee. Specifically, the Group controls an investee if
and only if the Group has: Power over the investee (i.e. existing rights that give it the current ability to direct
the relevant activities of the investee), exposure, or rights, to variable returns from its involvement with the
investee, and the ability to use its power over the investee to affect its returns.
The Group consolidates an investee and present in its consolidated financial statements the investee’s
assets, liabilities, equity, income, expenses and cash flows, if the Group has the current ability to direct
those activities of the investee that significantly affect the investee’s returns and can benefit by using that
ability.
The accounting policies for the subsidiaries are consistent with the policies adopted by the Bank.
7/21/2019 Equity Bank Group Annual Report 2013
http://slidepdf.com/reader/full/equity-bank-group-annual-report-2013 60/124
EQUITY BANK LIMITED AND SUBSIDIARIES | ANNUAL REPORT AND FINANCIAL STATEMENTS
FOR THE YEAR ENDED 31 DECEMBER 2013
Pg
58
NOTES TO THE CONSOLIDATED FINANCIAL STATEMENTS (Continued)
2. Accounting policies (continued)
2.2 Significant accounting estimates, judgments and assumptions
The preparation of financial statements in accordance with IFRSs requires management to make judgments,
estimates and assumptions that affect the application of accounting policies and the reported amounts of
assets, liabilities at the date of the financial statements and the income and expenses during the reporting
period. Although these estimates are based on the directors’ best knowledge of current events and actions,
actual results ultimately may differ from these estimates. Estimates and underlying assumptions are reviewed
on an on-going basis. Revisions to accounting estimates are recognised in the year in which the estimates are
revised and in any future years affected.
Estimates and assumptions
The key assumptions concerning the future and other key sources of estimation uncertainty at the reporting
date, that have a significant risk of causing a material adjustment to the carrying amounts of assets and
liabilities within the next financial year, are described below. The Bank based its assumptions and estimateson parameters available when the consolidated financial statements were prepared. Existing circumstances
and assumptions about future developments, however, may change due to market changes or circumstances
beyond the control of the Bank. Such changes are reflected in the assumptions when they occur.
Judgments
In the process of applying the Bank’s accounting policies, management has made the following judgments,
which have the most significant effect on the amounts recognised in the consolidated financial statements:
Fair value of financial instruments
Where the fair values of financial assets and financial liabilities recorded on the statement of financial position
cannot be derived from active markets, they are determined using a variety of valuation techniques that include
the use of mathematical models. The inputs to these models are derived from observable market data wherepossible, but where observable market data are not available, judgment is required to establish fair values. The
judgments include considerations of liquidity and model inputs such as volatility for longer dated derivatives
and discount rates, prepayment rates, default rate assumptions for asset backed securities. The effect of
credit risk has been taken into account when determining the fair value of financial liabilities.
The valuation of financial instruments is described in more detail in Note 7.
Impairment losses on loans and advances
The Bank reviews its individually significant loans and advances at each reporting date to assess whether an
impairment loss should be recorded in profit or loss. In particular, judgment by management is required in the
estimation of the amount and timing of future cash flows when determining the impairment loss. In estimating
these cash flows, the Bank makes judgments about the borrower’s financial situation and the net realisablevalue of collateral. These estimates are based on assumptions about a number of factors and actual results
may differ, resulting in future changes to the allowance.
Loans and advances that have been assessed individually and found not to be impaired and all individually
insignificant loans and advances are then assessed collectively, in groups of assets with similar risk
characteristics, to determine whether provision should be made due to incurred loss events for which there
is objective evidence but whose effects are not yet evident. The collective assessment takes account of data
from the loan portfolio (such as credit quality, levels of arrears, credit utilisation, loan to collateral ratios
etc.), concentrations of risks and economic data (including levels of unemployment, real estate prices indices,
country risk and the performance of different individual groups). The impairment loss on loans and advances
is disclosed in more detail in Note 11 and 20(b).
7/21/2019 Equity Bank Group Annual Report 2013
http://slidepdf.com/reader/full/equity-bank-group-annual-report-2013 61/124
EQUITY BANK LIMITED AND SUBSIDIARIES | ANNUAL REPORT AND FINANCIAL STATEMENTS
FOR THE YEAR ENDED 31 DECEMBER 2013
Pg
59
NOTES TO THE CONSOLIDATED FINANCIAL STATEMENTS (Continued)
2. Accounting policies (continued)
2.2 Significant accounting estimates, judgments and assumptions (Continued)
Impairment of available-for-sale investments
The Bank reviews its debt securities classified as available-for-sale investments at each reporting date to assess
whether they are impaired. This requires similar judgment as applied to the individual assessment of loans and
advances. The Bank also records impairment charges on available-for-sale equity investments when there has
been a significant or prolonged decline in the fair value below their cost. The determination of what is ‘significant’
or ‘prolonged’ requires judgment. In making this judgment, the Bank evaluates, among other factors, historical
share price movements and duration and extent to which the fair value of an investment is less than its cost.
Vehicles, equipment and intangible assets
Critical estimates are made by the directors in determining depreciation and amortisation rates for vehicles,
equipment and intangible assets. In assessing the useful life and residual values of property, plant and
equipment, the group considers past experience, macro-economic changes, technological obsolescence and
maintenance programs
Deferred tax assets
Deferred tax assets are recognised in respect of tax losses to the extent that it is probable that taxable profit wil
be available against which the losses can be utilised. Judgment is required to determine the amount of deferred
tax assets that can be recognised, based upon the likely timing and level of future taxable profits, together with
future tax planning strategies.
3. Changes in accounting policy and disclosures
The Group and Bank applied, for the first time, certain standards and amendments that require restatement
of previous financial statements. These include IFRS 10 Consolidated Financial Statements, IFRS 11 Joint
Arrangements, IAS 19 Employee Benefits (Revised 2011), IFRS 13 Fair Value Measurement and amendments toIAS 1 Presentation of Financial Statements. In addition, the application of IFRS 12 Disclosure of Interests in Other
Entities resulted in additional disclosures in the consolidated financial statements.
Several other amendments apply for the first time in 2013. However, they do not impact the annual consolidated
financial statements of the Group and Bank.
The nature and the impact of each new standards and amendments are described below:
IFRS 10 Consolidated Financial Statements and IAS 27 Separate Financial Statements
The standard became effective for annual periods beginning on or after 1 January 2013. It replaced the requirements
of IAS 27 Consolidated and Separate Financial Statements that address the accounting for financial statements andSIC 12 Consolidation – Special Purpose Entities. IAS 27 is limited to accounting for subsidiaries, jointly controlled
entities, and associates in separate financial statements. The changes requires management to make significant
judgment to determine which entities are controlled and therefore required to be consolidated by the parent. There
are no other entities within the group that required to be consolidated in the adoption of these standards.
IFRS 11 Joint Arrangements and IAS 28 Investment in Associates and Joint Ventures
The standard became effective on 1 January 2013. It replaced IAS 31 Interests in Joint Ventures and SIC 13 Jointly
Controlled Entities – Non-monetary Contributions by venturers. Because IFRS 11 uses the principle of control in
IFRS 10 to define control, the determination of whether joint control exists may change. The adoption of IFRS 11 did
not have an impact on the accounting treatment of investments currently held by the Group and Bank.
7/21/2019 Equity Bank Group Annual Report 2013
http://slidepdf.com/reader/full/equity-bank-group-annual-report-2013 62/124
EQUITY BANK LIMITED AND SUBSIDIARIES | ANNUAL REPORT AND FINANCIAL STATEMENTS
FOR THE YEAR ENDED 31 DECEMBER 2013
Pg
60
NOTES TO THE CONSOLIDATED FINANCIAL STATEMENTS (Continued)
3. Changes in accounting policy and disclosures (continued)
IFRS 12 Disclosure of Interests in Other Entities
IFRS 12 sets out the requirements for disclosures relating to an entity’s interests in subsidiaries, joint arrangements,associates and structured entities. The requirements in IFRS 12 are more comprehensive than the previously
existing disclosure requirements for subsidiaries. While the Group has subsidiaries with material non-controlling
interests, there are no unconsolidated structured entities.( Note 17)
IFRS 13 Fair Value Measurement
IFRS 13 establishes a single source of guidance under IFRS for all fair value measurements. IFRS 13 does not
change when an entity is required to use fair value, but rather provides guidance on how to measure fair value
under IFRS. IFRS 13 defines fair value as an exit price. As a result of the guidance in IFRS 13, the Group re-assessed
its policies for measuring fair values, in particular, its valuation inputs such as non-performance risk for fair value
measurement of liabilities. IFRS 13 also requires additional disclosures. Application of IFRS 13 has not materially
impacted the fair value measurements of the Group. Additional disclosures where required, are provided in the
individual notes relating to the assets and liabilities whose fair values were determined.
IAS 1 Presentation of Items of Other Comprehensive Income – Amendments to IAS 1
The amendments to IAS 1 introduce a grouping of items presented in OCI. Items that will be reclassified (‘recycled’)
to or loss at a future point in time have to be presented separately from items that will not be reclassified.
The amendments affect presentation only and have no impact on the Group’s and Bank’s financial position or
performance.
IAS 1 Clarification of the requirement for comparative information (Amendment)
These amendments clarify the difference between voluntary additional comparative information and the
minimum required comparative information. An entity must include comparative information in the related notes
to the financial statements when it voluntarily provides comparative information beyond the minimum required
comparative period. The amendments clarify that the opening statement of financial position (as at 1 January 2012in the case of the Group), presented as a result of retrospective restatement or reclassification of items in financial
statements does not have to be accompanied by comparative information in the related notes. As a result, the
Group and Bank has not included comparative information in respect of the opening statement of financial position
as at 1 January 2012. The amendments affect presentation only and have no impact on the Group’s and Bank’s
financial position or performance.
IAS 19 Employee Benefits (Revised 2011)
The amendments to IAS 19 remove the option to defer the recognition of actuarial gains and losses, i.e., the
corridor mechanism. All changes in the value of defined benefit plans will be recognised in profit or loss and other
comprehensive income. The effective date of the standard was 1 January 2013. The amendments will not have an
impact on the group’s and bank’s defined contribution scheme.
Recoverable Amount Disclosures for Non-Financial Assets – Amendments to IAS 36 Impairment of Assets
These amendments remove the unintended consequences of IFRS 13 on the disclosures required under IAS 36.
In addition, these amendments require disclosure of the recoverable amounts for the assets or CGUs for which
impairment loss has been recognised or reversed during the period. These amendments are effective retrospectively
for annual periods beginning on or after 1 January 2014 with earlier application permitted, provided IFRS 13 is
also applied. The Group and Bank has early adopted these amendments to IAS 36 in the current period since the
amended/additional disclosures provide useful information as intended by the IASB.
Accordingly, these amendments have been considered while making disclosures for impairment of non-financial
assets. These amendments would continue to be considered for future disclosures.
7/21/2019 Equity Bank Group Annual Report 2013
http://slidepdf.com/reader/full/equity-bank-group-annual-report-2013 63/124
EQUITY BANK LIMITED AND SUBSIDIARIES | ANNUAL REPORT AND FINANCIAL STATEMENTS
FOR THE YEAR ENDED 31 DECEMBER 2013
Pg
61
NOTES TO THE CONSOLIDATED FINANCIAL STATEMENTS (Continued)
3. Changes in accounting policy and disclosures (continued)
Standards issued but not yet effective
Standards issued but not yet effective up to the date of issuance of the Group’s and Bank’s financial statements arelisted below. The Group and Bank intends to adopt applicable standards when they become effective.
IFRS 9 Financial Instruments
IFRS 9, as issued, reflects the first phase of the IASB’s work on the replacement of IAS 39 and applies to classification
and measurement of financial assets and financial liabilities as defined in IAS 39. The standard was initially effective
for annual periods beginning on or after 1 January 2013, but Amendments to IFRS 9
Mandatory Effective Date of IFRS 9 and Transition Disclosures, issued in December 2011, moved the mandatory
effective date to 1 January 2015. In subsequent phases, the IASB is addressing hedge accounting and impairment of
financial assets. The adoption of the first phase of IFRS 9 will have an effect on the classification and measurement
of the Group’s and Bank’s financial assets, but will not have an impact on classification and measurements of the
Group’s and Bank’s financial liabilities. The Group and Bank will quantify the effect in conjunction with the otherphases, when the final standard including all phases is issued.
Investment Entities (Amendments to IFRS 10, IFRS 12 and IAS 27)
These amendments are effective for annual periods beginning on or after 1 January 2014 provide an exception
to the consolidation requirement for entities that meet the definition of an investment entity under IFRS 10. The
exception to consolidation requires investment entities to account for subsidiaries at fair value through profit or
loss. It is not expected that this amendment would be relevant to the Group and Bank, since none of the entities in
the Group and Bank would qualify to be an investment entity under IFRS 10.
IAS 32 Offsetting Financial Assets and Financial Liabilities - Amendments to IAS 32
These amendments clarify the meaning of “currently has a legally enforceable right to set-off” and the criteria
for non-simultaneous settlement mechanisms of clearing houses to qualify for offsetting. These are effective forannual periods beginning on or after 1 January 2014. These amendments are not expected to be relevant to the
Group and Bank.
IFRIC Interpretation 21 Levies (IFRIC 21)
IFRIC 21 clarifies that an entity recognises a liability for a levy when the activity that triggers payment, as identified
by the relevant legislation, occurs. For a levy that is triggered upon reaching a minimum threshold, the interpretation
clarifies that no liability should be anticipated before the specified minimum threshold is reached. IFRIC 21 is
effective for annual periods beginning on or after 1 January 2014. The Group and Bank do not expect that IFRIC 21
will have material financial impact in future financial statements.
IAS 39 Novation of Derivatives and Continuation of Hedge Accounting – Amendments to IAS 39
These amendments provide relief from discontinuing hedge accounting when novation of a derivative designated asa hedging instrument meets certain criteria. These amendments are effective for annual periods beginning on or
after 1 January 2014. The Group and Bank has not novated its derivatives during the current period. However, these
amendments would be considered for future novations.
IAS 19 Employee Benefits
The narrow-scope amendments apply to contributions from employees or third parties to defined benefit plans.
The objective of the amendments is to simplify the accounting for contributions that are independent of the number
of years of employee service. The amendments are effective for annual periods beginning on or after 1 July 2014
and will have no impact on the Group and Bank as it does not have any defined benefit plans.
7/21/2019 Equity Bank Group Annual Report 2013
http://slidepdf.com/reader/full/equity-bank-group-annual-report-2013 64/124
EQUITY BANK LIMITED AND SUBSIDIARIES | ANNUAL REPORT AND FINANCIAL STATEMENTS
FOR THE YEAR ENDED 31 DECEMBER 2013
Pg
62
NOTES TO THE CONSOLIDATED FINANCIAL STATEMENTS (continued)
3. Changes in accounting policy and disclosures (continued)
IAS 36 Impairment of Assets
The IASB has issued amendments to IAS 36- Impairment of Assets which clarifies the disclosure requirementsabout the recoverable amount of impaired assets if that amount is based on fair value less costs of disposal. The
amendments clarify the IASB’s original intention that the scope of these disclosures is limited to the recoverable
amount of impaired assets that is based on fair value less costs of disposal. The amendment is effective for year
ends beginning on or after 1 January 2014 and will have no impact on the Group and Bank.
4. Significant accounting policies
The accounting policies set out below have been applied consistently to all years presented in these financial
statements (except as otherwise disclosed).
(a) Business Combinations and Goodwill
Business combinations are accounted for using the acquisition method. The cost of an acquisition is measured
as the aggregate of the consideration transferred including acquisition cost, measured at acquisition date fair
value and the amount of any non-controlling interest in the acquiree. For each business combination, the
acquirer measures the non-controlling interest in the acquiree either at fair value or at the proportionate
share of the acquiree’s identifiable net assets.
When the group acquires a business, it assesses the financial assets and liabilities assumed for appropriate
classification and designation in accordance with the contractual terms, economic circumstances and
pertinent conditions as at the acquisition date.
Goodwill is initially measured at cost being the excess of the consideration transferred over the group’s net
identifiable assets acquired and liabilities assumed. If this consideration is lower than the fair value of the net
assets of the subsidiary acquired, the difference is recognised in profit or loss.
After initial recognition, goodwill is measured at cost less any accumulated impairment losses. For thepurpose of impairment testing, goodwill acquired in a business combination is, from the acquisition date,
allocated to each of the group’s cash generating units that are expected to benefit from the combination,
irrespective of whether other assets or liabilities of the acquiree are assigned to those units.
Goodwill is tested for impairment annually and when circumstances indicate that the carrying value may
be impaired. Impairment is determined for goodwill by assessing the recoverable amount of each cash-
generating unit (or group of cash-generating units) to which the goodwill relates. Where the recoverable
amount of the cash generating unit is less than their carrying amount, an impairment loss is recognised.
Impairment losses relating to goodwill cannot be reversed in future periods.
The good will recognised by the group relates to Equity Bank Uganda subsidiary. It is the difference between
the net book value of the assets of the subsidiary at the time of acquisition and the purchase considerationpaid. After initial recognition the good will is assessed for impairment factoring in the financial performance
of subsidiary.
When subsidiaries are sold, the difference between the selling price and the net assets plus cumulative
translation differences and goodwill is recognised in profit or loss.
In the Bank accounts, investments in subsidiaries are accounted for at cost less accumulated impairments.
7/21/2019 Equity Bank Group Annual Report 2013
http://slidepdf.com/reader/full/equity-bank-group-annual-report-2013 65/124
EQUITY BANK LIMITED AND SUBSIDIARIES | ANNUAL REPORT AND FINANCIAL STATEMENTS
FOR THE YEAR ENDED 31 DECEMBER 2013
Pg
63
NOTES TO THE CONSOLIDATED FINANCIAL STATEMENTS (continued)
4. Significant accounting policies (continued)
(b) Associates
The group’s investment in its associate is accounted for using the equity method of accounting. An associateis an entity in which the group has significant influence.
Under the equity method, the investment in the associate is carried in the statement of financial position at
cost plus post acquisition changes in the group’s share of net assets of the associate. Goodwill relating to the
associate is included in the carrying amount of the investment and is not amortised or separately tested for
impairment.
The income statement reflects the share of the results of operations of the associate. This is the profit
attributable to equity holders of the associate and therefore is profit after tax and minority interests in the
subsidiaries of the associates. Where there has been a change recognised in the equity or other comprehensive
income of the associate, the group recognises its share of any changes and discloses this, when applicable,
in other comprehensive income or the statement of changes in equity. Unrealised gains and losses resulting
from transactions between the group and the associate are eliminated to the extent of the interest in the
associate.
The financial statements of the associate are prepared for the same reporting period as the parent company.
Where necessary, adjustments are made to bring the accounting policies in line with those of the group.
After application of the equity method, the group determines whether it is necessary to recognise an additional
impairment loss on the group’s investment in its associates. The group determines at each reporting date
whether there is any objective evidence that the investment in the associate is impaired. If this is the case
the group calculates the amount of impairment as the difference between the recoverable amount of the
associate and its carrying value and recognises the amount in profit or loss.
At company level, the investment in associate has been accounted for at cost.
(c) Foreign currency transactions
The Group’s consolidated financial statements are presented in Kenya Shillings, which is also the parent
company’s functional currency. Each entity in the group determines its own functional currency and items
included in the financial statements of each entity are measured using that functional currency.
(i) Transactions and balances
Transactions in foreign currencies are initially recorded by the group entities at their respective
functional currency rates prevailing at the date of the transaction. Monetary assets and liabilities
denominated in foreign currencies are retranslated at the functional currency spot rate of exchange
ruling at the reporting date. All differences arising from non-trading activities are taken to otheroperating income in the income statement. Non-monetary items that are measured in terms of
historical cost in a foreign currency are translated using the exchange rates as at the dates of the
initial transactions. Non-monetary items measured at fair value in a foreign currency are translated
using the exchange rates at the date when the fair value is determined.
(ii) Group companies
The assets and liabilities of foreign operations are translated into Kenya Shillings at the rate of
exchange prevailing at the reporting date and their income statements are translated at average
rates. The exchange differences arising on the translation are recognised in other comprehensive
income. On disposal of a foreign operation, the component of other comprehensive income relating
to that particular foreign operation is recognised in income statement.
7/21/2019 Equity Bank Group Annual Report 2013
http://slidepdf.com/reader/full/equity-bank-group-annual-report-2013 66/124
EQUITY BANK LIMITED AND SUBSIDIARIES | ANNUAL REPORT AND FINANCIAL STATEMENTS
FOR THE YEAR ENDED 31 DECEMBER 2013
Pg
64
NOTES TO THE CONSOLIDATED FINANCIAL STATEMENTS (continued)
4. Significant accounting policies (continued)
(iii) Hyperinflationary economies
The bank considers an economy to be hyperinflationary if the cumulative inflation rate over three
years is approaching, or exceeds, 100%. Balances from subsidiaries in hyperinflationary economies
are consolidated after adjusting for effects of inflation on the balances and reported at current cost
rather than historical cost. The comparative balances are also restated for the same effects. The
gain or loss from the adjustment is passed through the profit or loss. In adjusting for the effects of
inflation the bank uses the commodity price index as the basis for the adjustment.
(d) Recognition of interest income, dividend and interest expense
Revenue is recognised to the extent that it is probable that the economic benefits will flow to the group and
the revenue can be reliably measured.
Interest income and expense are recognised in the income statement on the accrual basis;
Interest income and expense presented in the income statement include:
• Interest on financial assets and liabilities on the accrual basis taking into account the effective interest
basis and interest on available-for-sale debt instruments on an effective interest basis.
• Interest on financial assets and liabilities are considered to be the group’s trading operations and
are presented together with all other changes in the fair value of trading assets and liabilities in net
trading income.
• Dividend income is recognised when the bank’s right to receive that payment is established.
(e) Fee and commission
Fee and commission income including account servicing fees, investment management fees, placement
fees and syndication fees, are recognised as the related services are performed. Other fee and commission
expense relates mainly to transaction and service fees, which are expensed as the services are received.
(f) Net trading income
Net trading income comprises gains less losses related to trading assets and liabilities, and includes all
realised and unrealised fair value changes, interest, and foreign exchange differences.
(g) Leasing
(i) Determination
The determination of whether an arrangement is a lease or it contains a lease, is based on the substance
of the arrangement and requires an assessment of whether the fulfilment of the arrangement is
dependent on the use of a specific asset or assets and the arrangement conveys a right to use the
asset.
(ii) Group as a lessee
Leases which do not transfer to the Group substantially all the risk and benefits incidental to ownership
of the leased items are operating leases. Operating lease payments are recognised as an expense in
the income statement on a straight line basis over the lease term. Contingent rental payable are
recognised as an expenses in the period in which they are incurred.
Lease incentives received are recognised as an integral part of the total lease expense, over the term
of the lease. When an operating lease is terminated before the lease period has expired, any payment
required to be made to the lessor by way of penalty is recognised as an expense in the period in which
termination takes place.
7/21/2019 Equity Bank Group Annual Report 2013
http://slidepdf.com/reader/full/equity-bank-group-annual-report-2013 67/124
EQUITY BANK LIMITED AND SUBSIDIARIES | ANNUAL REPORT AND FINANCIAL STATEMENTS
FOR THE YEAR ENDED 31 DECEMBER 2013
Pg
65
NOTES TO THE CONSOLIDATED FINANCIAL STATEMENTS (continued)
4. Significant accounting policies (continued)
(h) Taxes
(i) Current tax
Current tax assets and liabilities for the current and prior years are measured at the amount expected
to be recovered from or paid to the taxation authorities. The tax rates and tax laws used to compute the
amount are those that are enacted or substantively enacted by the reporting date.
(ii) Deferred tax
Deferred tax is provided on temporary differences at the reporting date between the tax bases of assets
and liabilities and their carrying amounts for financial reporting purposes. Deferred tax is recognised
for all taxable temporary differences, except:
• Where the deferred tax arises from the initial recognition of goodwill or of an asset or liability in a
transaction that is not a business combination and, at the time of the transaction, affects neitherthe accounting profit nor taxable income statement; and
• In respect of taxable temporary differences associated with investments in subsidiaries and
associates where the timing of the reversal of the temporary differences can be controlled and it
is probable that the temporary differences will not reverse in the foreseeable future.
Deferred tax assets are recognised for all deductible temporary differences, carry forward of unused tax
credits and unused tax losses, to the extent that it is probable that taxable profit will be available against
which the deductible temporary differences, the carry forward of unused tax credits and unused tax
losses can be utilised, except:
• Where the deferred tax asset relating to the deductible temporary difference arises from the
initial recognition of an asset or liability in a transaction that is not a business combination and,
at the time of the transaction, affects neither the accounting profit nor taxable profit or loss; and• In respect of deductible temporary differences associated with investments in subsidiaries and
associates, deferred tax assets are recognised only to the extent that it is probable that the
temporary differences will reverse in the foreseeable future and taxable profit will be available
against which the temporary differences can be utilised.
The carrying amount of deferred tax assets is reviewed at each reporting date and reduced to the extent
that it is no longer probable that sufficient taxable profit will be available to allow all or part of the
deferred tax asset to be utilised.
Deferred tax assets and liabilities are measured at the tax rates that are expected to apply in the year
when the asset is realised or the liability is settled, based on tax rates (and tax laws) that have been
enacted or substantively enacted at the reporting date.
Current tax and deferred tax relating to items recognised in other comprehensive income or equity are
also recognised in other comprehensive income or equity and not in the income statement.
Deferred tax assets and deferred tax liabilities are offset if a legally enforceable right exists to set off
current tax assets against current income tax liabilities and the deferred taxes relate to the same taxable
entity and the same taxation authority.
7/21/2019 Equity Bank Group Annual Report 2013
http://slidepdf.com/reader/full/equity-bank-group-annual-report-2013 68/124
EQUITY BANK LIMITED AND SUBSIDIARIES | ANNUAL REPORT AND FINANCIAL STATEMENTS
FOR THE YEAR ENDED 31 DECEMBER 2013
Pg
66
NOTES TO THE CONSOLIDATED FINANCIAL STATEMENTS (continued)
4. Significant accounting policies (continued)
(i) Financial assets and liabilities
(i) Recognition
The Group initially recognises loans and advances, on the date that they are originated. Financial assets and
liabilities are initially recognised on the trade date, i.e. the date at which the group becomes a party to the
contractual provisions of the instrument.
(ii) Initial measurement
The classification of financial instruments at initial recognition depends on the purpose and the
management’s intention for which the financial instruments were acquired and their characteristics. All
financial instruments are measured initially at their fair value plus transaction costs, except in the case of
financial assets and financial liabilities recorded at fair value through profit or loss.
(iii) Derecognition Financial assets
The group derecognises a financial asset (or, where applicable a part of a financial asset or part of a group of
similar financial assets) when:
• The rights to receive cash flows from the asset have expired
• The group has transferred its rights to receive cash flows from the asset or has assumed an obligation
to pay the received cash flows in full without material delay to a third party under a ‘pass-through’
arrangement; and either (a) the group has transferred substantially all the risks and rewards of the
asset, or (b) the group has neither transferred nor retained substantially all the risks and rewards of
the asset, but has transferred control of the asset.
Financial Liabilities
The group derecognises a financial liability when the obligation under the liability is discharged or cancelled
or expires. When an existing financial liability is replaced by another from the same lender on substantially
different terms, or the terms of an existing liability are substantially modified, such an exchange or
modification is treated as a derecognition of the original liability and recognition of new liability. The
difference between carrying value of the original liability and the consideration paid is recognised in income
statement.
(iv) Offsetting Financial instruments
Financial assets and liabilities are offset and the net amount presented in the statement of financial position
when, and only when, there is a currently legally enforceable right to set off the recognised amounts and there
is an intention either to settle on a net basis or to realise the asset and settle the liability simultaneously.
Income and expenses are presented on a net basis only when permitted by the accounting standards, or for
gains and losses arising from a group of similar transactions such as in the group’s trading activity.
(v) Amortised cost measurement
The amortised cost of a financial asset or liability is the amount at which the financial asset or liability is
measured at initial recognition, minus principal repayments, plus or minus the cumulative amortisation
using the effective interest method of any difference between the initial amount recognised and the maturity
amount, minus any reduction for impairment.
(vi) Fair value measurement
The determination of fair values of financial assets and financial liabilities is based on quoted market prices
or dealer price quotations for financial instruments traded in active markets at the reporting date without
any deduction for transaction costs. Gain or loss on valuation of financial assets and liabilities is recognised
in other comprehensive income.
7/21/2019 Equity Bank Group Annual Report 2013
http://slidepdf.com/reader/full/equity-bank-group-annual-report-2013 69/124
EQUITY BANK LIMITED AND SUBSIDIARIES | ANNUAL REPORT AND FINANCIAL STATEMENTS
FOR THE YEAR ENDED 31 DECEMBER 2013
Pg
67
NOTES TO THE CONSOLIDATED FINANCIAL STATEMENTS (continued)
4. Significant accounting policies (Continued)
(i) Financial assets and liabilities (Continued)
(vi) Fair value measurement (continued)
For all other financial instruments not traded in an active market, the fair value is determined by using
appropriate valuation techniques. Valuation techniques include the discounted cash flow method,
comparison to similar instruments for which market observable prices exist, options pricing models, credit
models and other relevant valuation models.
(vii) Identification and measurement of impairment
At each reporting date, the Bank and group assess whether there is objective evidence that financial assets
not carried at fair value through profit or loss are impaired. Financial assets are impaired when objective
evidence demonstrates that a loss event has occurred after the initial recognition of the asset, and that the
loss event has an impact on the future cash flows on the asset that can be estimated reliably.
The group considers evidence of impairment at both a specific asset and collective level. All individuallysignificant financial assets are assessed for specific impairment. All significant assets found not to be
specifically impaired are then collectively assessed for any impairment that has been incurred but not yet
identified. Assets that are not individually significant are also collectively assessed for impairment.
Objective evidence that financial assets (including equity securities) are impaired can include default or
delinquency by a borrower, restructuring of a loan or advance by the group on terms that the group would
not otherwise consider, indications that a borrower or issuer will enter bankruptcy, the disappearance of
an active market for a security, or other observable data relating to assets such as adverse changes in the
payment status of borrowers or issuers in the group, or economic conditions that correlate with defaults in
the group and Bank.
In assessing collective impairment the group uses statistical modelling of historical trends of the probability
of default, timing of recoveries and the amount of loss incurred, adjusted for management’s judgment as
to whether current economic and credit conditions are such that the actual losses are likely to be greateror less than suggested by historical modelling. Default rates, loss rates and the expected timing of future
recoveries are regularly benchmarked against actual outcomes to ensure that they remain appropriate.
Impairment losses on assets carried at amortised cost are measured as the difference between the
carrying amount of the financial assets and the present value of estimated cash flows discounted at the
assets’ original effective interest rate. Losses are recognised in the income statement and reflected in an
allowance account against loans and advances. Interest on the impaired asset continues to be recognised
through the unwinding of the discount.
When a subsequent event causes the amount of impairment loss to decrease, the impairment loss is
reversed through profit or loss (only applicable for loans and receivables and held-to-maturity assets).
Impairment losses on available-for-sale debt investment are recognised by transferring the difference
between the amortised acquisition cost and current fair value out of other comprehensive income to profitor loss. When a subsequent event causes the amount of impairment loss on an available-for-sale debt
security to decrease, the impairment loss is reversed through profit or loss.
In the case of equity investments classified as available-for-sale, objective evidence would also include
a ‘significant’ or ‘prolonged’ decline in the fair value of the investment below its cost. The group treats
‘significant’ generally as 20% and ‘prolonged’ as greater than 1 year. Where there is evidence of impairment,
the cumulative loss measured as the difference between the acquisition cost and the current fair value,
less any impairment loss on that investment previously recognised in profit or loss, is removed from other
comprehensive income and recognised in profit or loss. Impairment losses on equity investments are not
reversed through profit or loss. Increases in the fair value after impairment are recognised directly in other
comprehensive income and accumulated in equity.
7/21/2019 Equity Bank Group Annual Report 2013
http://slidepdf.com/reader/full/equity-bank-group-annual-report-2013 70/124
EQUITY BANK LIMITED AND SUBSIDIARIES | ANNUAL REPORT AND FINANCIAL STATEMENTS
FOR THE YEAR ENDED 31 DECEMBER 2013
Pg
68
NOTES TO THE CONSOLIDATED FINANCIAL STATEMENTS (continued)
4. Significant accounting policies (Continued)
(i) Financial assets and liabilities (Continued)
(viii) Renegotiated loans
Where possible, the bank seeks to restructure loans rather than take possession of collateral. This may
involve extending the payment arrangements and the agreement of new loan conditions. Once the terms
have been renegotiated, any impairment is measured using the original effective interest rate (EIR) as
calculated before modification of terms and the loan is no longer considered past due. Management
continually reviews renegotiated loans to ensure that all criteria are met and that future payments are
likely to occur.
(ix) Trading assets and liabilities
Trading assets and liabilities are those assets and liabilities that the group and the Bank acquires or
incurs principally for the purpose of selling or repurchasing in the near term, or holds as part of a
portfolio that is managed together for short-term profit or position taking. Trading assets and liabilities
are initially recognised and subsequently measured at fair value in the statement of financial positionwith transaction costs taken directly to profit or loss. All changes in fair value are recognised as part
of net trading income in the income statement. Trading assets and liabilities are not reclassified
subsequent to their initial recognition.
(x) Loans and advances
Loans and advances are non-derivative financial assets with fixed or determinable payments that are
not quoted in an active market and that the group does not intend to sell immediately or in the near term.
Loans and advances are initially measured at fair value plus incremental direct transaction costs, and
subsequently measured at their amortised cost using the effective interest method less allowance for
impairment, except when the group chooses to carry the loans and advances at fair value through profit
or loss. The losses arising from the impairment are recognised in profit or loss.
(xi) Financial guarantees
In the ordinary course of business, the bank gives financial guarantees, consisting of letters of credit,
guarantees and acceptances. Financial guarantees are initially recognised in the financial statement
(within ‘other liabilities’) at fair value, being the premium received. Subsequent to initial recognition,
the bank’s liability under each guarantee is measured at the higher of the amount initially recognised
less, when appropriate, cumulative amortisation recognised in profit or loss, and the best estimate of
expenditure required to settle any financial obligation arising as a result of the guarantee.
Any increase in the liability relating to financial guarantees is recorded in the income statement in credit
loss expense. The premium received is recognised in the income statement in ‘Net fees and commission
income’ on a straight line basis over the life of the guarantee.
(j) Cash and cash equivalents
Cash and cash equivalents include notes and coins on hand, unrestricted balances held with central
banks and highly liquid financial assets with original maturities of less than three months, which are
subject to insignificant risk of changes in their fair value, and are used by the group in the management
of its short-term commitments.
Cash and cash equivalents are classified as loans and receivables and carried at amortised cost in the
statement of financial position.
(k) Investment securities
(i) Fair value through profit or loss
Fair value through profit or loss investment securities are those that are classified as either held-f
or trading or those which are specifically designated as such.
7/21/2019 Equity Bank Group Annual Report 2013
http://slidepdf.com/reader/full/equity-bank-group-annual-report-2013 71/124
EQUITY BANK LIMITED AND SUBSIDIARIES | ANNUAL REPORT AND FINANCIAL STATEMENTS
FOR THE YEAR ENDED 31 DECEMBER 2013
Pg
69
NOTES TO THE CONSOLIDATED FINANCIAL STATEMENTS (continued)
4. Significant accounting policies (Continued)
(k) Investment securities (continued)
(ii) Held-to-maturity
Held-to-maturity investments are non-derivative assets with fixed or determinable payments and fixed
maturity that the group has the positive intent and ability to hold to maturity, and which are not designated
at fair value through profit or loss or available-for-sale.
After initial recognition, held-to-maturity investments are carried at amortised cost using the effective
interest method less impairment. Amortised cost is calculated by taking into account any discount
or premium on acquisition and fees that are an integral part of the effective interest rate. Any sale or
reclassification of a significant amount of held-to-maturity investments not close to their maturity would
result in the reclassification of all held-to-maturity investments as available-for-sale.
(iii) Available-for-sale
Available-for-sale investments are non-derivative investments that are neither classified as held for
trading nor designated at fair value through profit and loss. These are those securities that are intended
to be held for an indefinite period of time and which may be sold in response to needs for liquidity or in
response to changes in the market conditions. Unquoted equity securities whose fair value cannot be
reliably measured are carried at cost. All other available-for-sale investments are carried at fair value,
with unrealised gains/losses recognised as other comprehensive income in the available for sale reserve
until the investment is derecognised or impaired.
Foreign exchange gains or losses on available-for-sale debt security investments are recognised in profit
or loss.
The bank has not designated any loans or receivables as available for sale.
(iv) Borrowings
Borrowings are recognised initially at fair value. After initial measurement borrowings are subsequently
measured at amortised cost using the effective interest rate method.
(v) Borrowing costs
Borrowing costs directly attributed to the acquisition, construction or production of an asset that
necessarily takes a substantial period of time to get ready for its intended use or sale are capitalised as
part of the cost of the respective assets. All other borrowing costs are recognised as an expense when
incurred. The bank did not have any qualifying assets during the year.
(l) Property and equipment
(i) Recognition and measurement
Items of property and equipment are initially measured at cost less accumulated depreciation and
impairment losses.
After initial recognition, some classes of property and equipment held by an associate (i.e. not held by
the group) are measured at fair value less accumulated depreciation and impairment losses recognizedafter the date of the revaluation. Valuations are performed every 3 years to ensure that the fair value of
the revalued asset does not differ materially from its carrying amount.
Any revaluation surplus is recorded in other comprehensive income and hence, credited to the asset
revaluation reserve in equity, except to the extent that it reverses a revaluation decrease of the same
asset previously recognised in the income statement, in which case, the increase is recognised in the
income statement. A revaluation deficit is recognised in the income statement, except to the extent that it
offsets an existing surplus on the same asset recognised in the asset revaluation reserve Upon disposal,
any revaluation reserve relating to the particular asset being sold is transferred to retained earnings.
Cost includes expenditures that are directly attributable to the acquisition of the asset. The cost includes
any other costs directly attributable to bringing the asset to a working condition for its intended use and
the present value of the estimated costs of dismantling and removing the items and restoring the site on
which they are located.Purchased software that is integral to the functionality of the related equipment is capitalised as part of
that equipment.
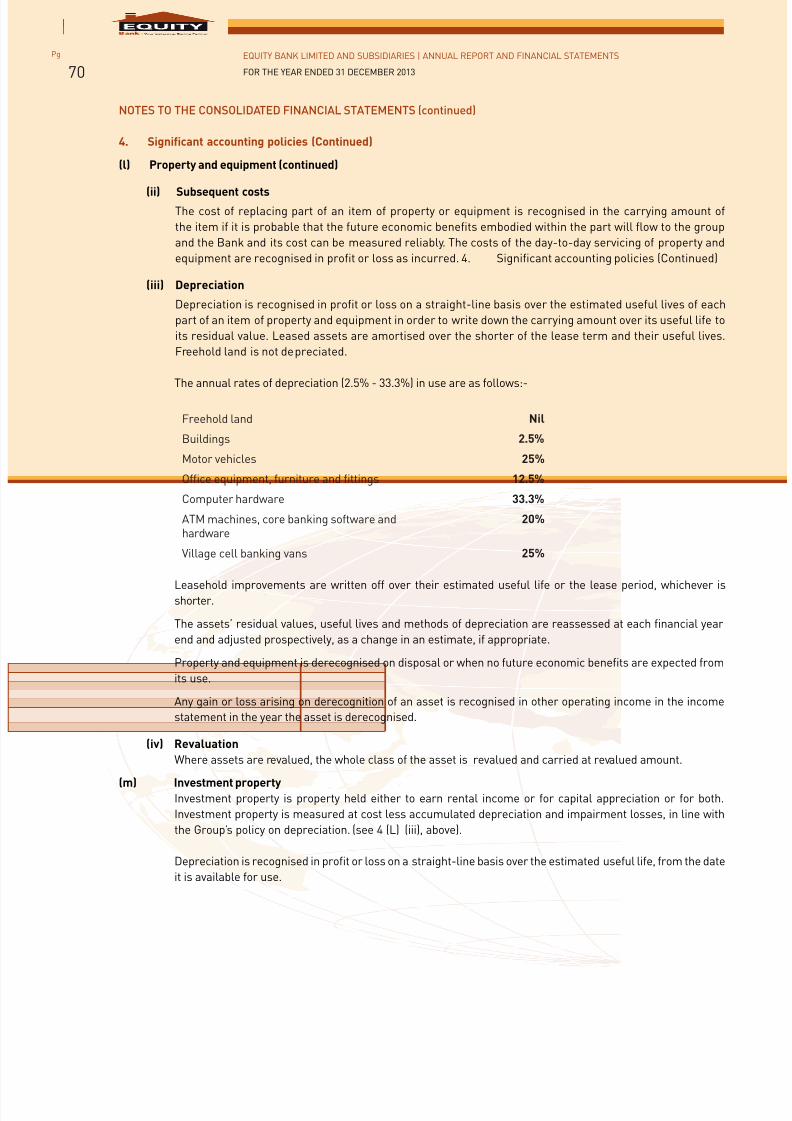
7/21/2019 Equity Bank Group Annual Report 2013
http://slidepdf.com/reader/full/equity-bank-group-annual-report-2013 72/124
EQUITY BANK LIMITED AND SUBSIDIARIES | ANNUAL REPORT AND FINANCIAL STATEMENTS
FOR THE YEAR ENDED 31 DECEMBER 2013
Pg
70
NOTES TO THE CONSOLIDATED FINANCIAL STATEMENTS (continued)
4. Significant accounting policies (Continued)
(l) Property and equipment (continued)
(ii) Subsequent costs The cost of replacing part of an item of property or equipment is recognised in the carrying amount of
the item if it is probable that the future economic benefits embodied within the part will flow to the group
and the Bank and its cost can be measured reliably. The costs of the day-to-day servicing of property and
equipment are recognised in profit or loss as incurred. 4. Significant accounting policies (Continued)
(iii) Depreciation
Depreciation is recognised in profit or loss on a straight-line basis over the estimated useful lives of each
part of an item of property and equipment in order to write down the carrying amount over its useful life to
its residual value. Leased assets are amortised over the shorter of the lease term and their useful lives.
Freehold land is not depreciated.
The annual rates of depreciation (2.5% - 33.3%) in use are as follows:-
Freehold land Nil
Buildings 2.5%
Motor vehicles 25%
Office equipment, furniture and fittings 12.5%
Computer hardware 33.3%
ATM machines, core banking software andhardware
20%
Village cell banking vans 25%
Leasehold improvements are written off over their estimated useful life or the lease period, whichever isshorter.
The assets’ residual values, useful lives and methods of depreciation are reassessed at each financial year
end and adjusted prospectively, as a change in an estimate, if appropriate.
Property and equipment is derecognised on disposal or when no future economic benefits are expected from
its use.
Any gain or loss arising on derecognition of an asset is recognised in other operating income in the income
statement in the year the asset is derecognised.
(iv) Revaluation
Where assets are revalued, the whole class of the asset is revalued and carried at revalued amount.
(m) Investment propertyInvestment property is property held either to earn rental income or for capital appreciation or for both.
Investment property is measured at cost less accumulated depreciation and impairment losses, in line with
the Group’s policy on depreciation. (see 4 (L) (iii), above).
Depreciation is recognised in profit or loss on a straight-line basis over the estimated useful life, from the date
it is available for use.
7/21/2019 Equity Bank Group Annual Report 2013
http://slidepdf.com/reader/full/equity-bank-group-annual-report-2013 73/124
EQUITY BANK LIMITED AND SUBSIDIARIES | ANNUAL REPORT AND FINANCIAL STATEMENTS
FOR THE YEAR ENDED 31 DECEMBER 2013
Pg
71
NOTES TO THE CONSOLIDATED FINANCIAL STATEMENTS (continued)
4. Significant accounting policies (Continued)
(n) Intangible Assets
The group’s intangible assets include the value of computer software. An intangible asset is recognised only
when its cost can be measured reliably and it is probable that the expected future economic benefits that areattributable to it will flow to the group. Intangible assets acquired separately are measured on initial recognition
at cost. The cost of intangible assets acquired in a business combination is their fair value as at the date of
acquisition. Following initial recognition, intangible assets are carried at cost less any accumulated amortisation
and any accumulated impairment losses.
The useful lives of intangible assets are assessed to be finite or indefinite. Intangible assets with finite lives are
amortised over the useful life. The amortisation period and the amortisation method for an intangible asset with a
finite useful life are reviewed at least at each financial year-end. Changes in the expected useful life or the expected
pattern of consumption of future economic benefits embodied in the asset are accounted for by changing the
amortisation period or method, as appropriate, and treated as changes in accounting estimates. The amortisation
expense on intangible assets with finite lives is recognised in profit or loss in the expense category consistent with
the function of the intangible asset.
Subsequent expenditure on software assets is capitalised when the recognition criteria for intangible assets are
met. All other expenditure is expensed as incurred.
The intangible assets have a maximum useful life of five years.
The Bank’s softwares are developed by external consultants and hence the Bank does not incur any research
and development costs. Softwares in test mode stage are held as work in progress until they are certified as fully
operational.
(o) Impairment of non-financial assets
The carrying amounts of the group’s non-financial assets, are reviewed at each reporting date to determine
whether there is any indication of impairment. If any such indication exists then the asset’s recoverable amount
is estimated.
The Bank assesses at each reporting date whether there is an indication that an asset may be impaired. If any
indication exists, or when annual impairment testing for an asset is required, the Bank estimates the asset’s
recoverable amount.
An asset’s recoverable amount is the higher of an asset’s or cash-generating unit’s (CGU) fair value less costs
of disposal and its value in use. The CGU is used when assessing for impairment. Where the carrying amount
of an asset or CGU exceeds its recoverable amount, the asset is considered impaired and is written down to its
recoverable amount. In assessing value in use, the estimated future cash flows are discounted to their present
value using a pre-tax discount rate that reflects current market assessments of the time value of money and
the risks specific to the asset. In determining fair value less costs of disposal, an appropriate valuation model
is used. Impairment losses are recognised in profit or loss in those expense categories consistent with the
function of the impaired asset, except for a property previously re-valued where the valuation was taken to othercomprehensive income. In this case, the impairment loss is also recognised in other comprehensive income up
to the amount of any previous revaluation.
For assets other than goodwill an assessment is made at each reporting date as to whether there is any indication
that previously recognised impairment losses may no longer exist or may have decreased. If such indication
exists, the group estimates the asset’s or CGU’s recoverable amount. A previously recognised impairment loss is
reversed only if there has been a change in the assumptions used to determine the asset’s recoverable amount
since the last impairment loss was recognised. The reversal is limited so that the carrying amount of the asset
does not exceed its recoverable amount, nor exceeds the carrying amount that would have been determined, net
of depreciation, had no impairment loss been recognised for the asset in prior years. Such reversal is recognised
in profit or loss. Impairment losses on goodwill are not reversed.
7/21/2019 Equity Bank Group Annual Report 2013
http://slidepdf.com/reader/full/equity-bank-group-annual-report-2013 74/124
EQUITY BANK LIMITED AND SUBSIDIARIES | ANNUAL REPORT AND FINANCIAL STATEMENTS
FOR THE YEAR ENDED 31 DECEMBER 2013
Pg
72
NOTES TO THE CONSOLIDATED FINANCIAL STATEMENTS (continued)
4. Significant accounting policies (Continued)
(p) Provisions
Provisions are recognised when the Group has a present obligation (legal or constructive) as a result of a pastevent, and it is probable that an outflow of resources embodying economic benefits will be required to settle
the obligation and a reliable estimate can be made of the amount of the obligation. The expense relating to any
provision is presented in profit or loss net of any reimbursement.
(q) Employee benefits
(i) Defined contribution plans
Obligations for contributions to defined contribution pension plans are recognised as an expense in profit or
loss when they are due.
(ii) Short-term benefits
Short-term employee benefit obligations are measured on an undiscounted basis and are expensed as the
related service is provided.
A provision is recognised for the amount expected to be paid under short-term cash bonus if the group has apresent obligation to pay this amount as a result of past service provided by the employee and the obligation
can be estimated reliably.
(r) Earnings per share
The group presents basic and diluted earnings per share (EPS) data for its ordinary shares. Basic EPS is calculated
by dividing the income attributable to ordinary shareholders of the group by the weighted average number of
ordinary shares outstanding during the year.
(s) Dividends
Dividends are recognised as a liability and deducted from equity in the year in which they are declared. Proposed
dividends are disclosed as a separate component of equity until declared.
(t) Sale and repurchase agreementsSecurities purchased from the Central Bank of Kenya under agreement to resell (reverse repos), are disclosed as
treasury bills as they are held to maturity after which they are repurchased and are not negotiable or discounted
during the tenure.
(u) Government grants
Government grants are recognised where there is reasonable assurance that the grant will be received and all
attached conditions will be complied with. When the grant relates to an expense item, it is recognised as income
over the period necessary to match the grant on a systematic basis to the costs that it is intended to compensate.
Where the grant relates to an asset, it is recognised as deferred income and released to income in equal amounts
over the expected useful life of the related asset.
7/21/2019 Equity Bank Group Annual Report 2013
http://slidepdf.com/reader/full/equity-bank-group-annual-report-2013 75/124
EQUITY BANK LIMITED AND SUBSIDIARIES | ANNUAL REPORT AND FINANCIAL STATEMENTS
FOR THE YEAR ENDED 31 DECEMBER 2013
Pg
73
NOTES TO THE CONSOLIDATED FINANCIAL STATEMENTS (continued)
5. Financial risk management
(a) Introduction and overview
The group and the Bank has exposure to the following risks from its use of financial instruments:• credit risk
• liquidity risk
• market risks
This note presents information about the group’s exposure to each of the above risks, the group’s objectives,
policies and processes for measuring and managing risk, and the group’s management of capital.
Risk management framework
The Board of Directors has overall responsibility for the establishment and oversight of the group’s risk
management framework. The Board has established the Board Risk Management Committee, which is
responsible for developing and monitoring group risk management policies in their specified areas. All Board
committees have both executive and non-executive members and report regularly to the Board of Directorson their activities.
The group’s risk management policies are established to identify and analyse the risks faced by the group, to set
appropriate risk limits and controls, and to monitor risks and adherence to limits. Risk management policies
and systems are reviewed regularly to reflect changes in market conditions, products and services offered.
The group, through its training and management standards and procedures, aims to develop a disciplined and
constructive control environment, in which all employees understand their roles and obligations.
The Risk Management Committee is responsible for monitoring compliance with the group’s risk management
policies and procedures, and for reviewing the adequacy of the risk management framework in relation to
the risks faced by the group. The Board Risk Management Committee is assisted in these functions by Risk
Management Department. Internal Audit undertakes both regular and ad-hoc reviews of risk management
controls and procedures, the results of which are reported to the Board Risk Management Committee.
(b) Credit risk
Credit risk is the risk of financial loss to the group if a customer or counterparty to a financial instrument fails
to meet its contractual obligations, and arises principally from the group’s loans and advances to customers
and other banks and investment securities. For risk management reporting purposes, the group considers
and consolidates all elements of credit risk exposure.
Management of credit risk
The Board of Directors has delegated responsibility for the management of credit risk to the group
management through the Chief executive officer. Management has delegated this responsibility to various
Credit committees as prescribed in the group’s Credit Charter. A separate group Credit committee, reporting
to the Chief Executive Officer, is responsible for oversight of the group’s credit risk, including:
• Formulating credit policies in consultation with business units, covering collateral requirements, credit
assessment, risk grading and reporting, documentary and legal procedures, and compliance with
regulatory and statutory requirements.
• Establishing the authorisation structure for the approval and renewal of credit facilities. Authorisation
limits are allocated to various Credit committees as stipulated in the group’s Credit Charter.
• Reviewing and assessing credit risk. The group Credit Committee assesses all credit exposures
in excess of designated limits, prior to facilities being committed to customers by the business unit
concerned. Renewals and reviews of facilities are subject to the same review process.
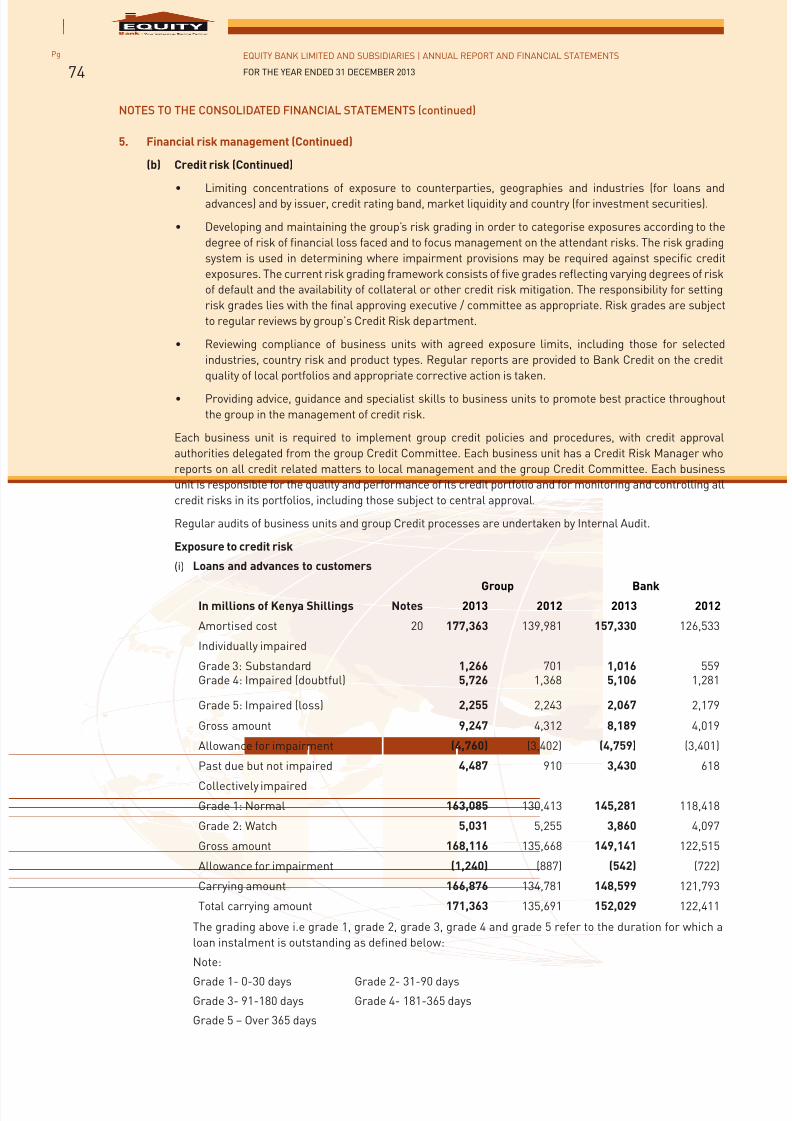
7/21/2019 Equity Bank Group Annual Report 2013
http://slidepdf.com/reader/full/equity-bank-group-annual-report-2013 76/124
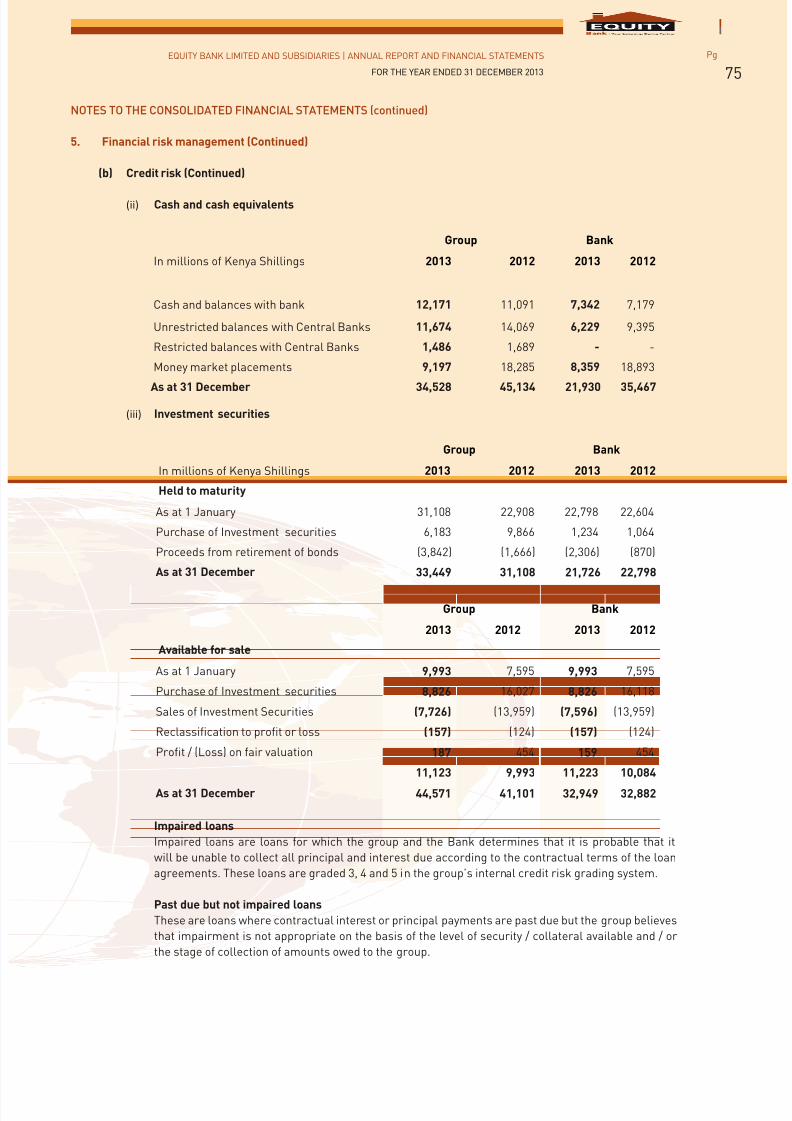
7/21/2019 Equity Bank Group Annual Report 2013
http://slidepdf.com/reader/full/equity-bank-group-annual-report-2013 77/124
EQUITY BANK LIMITED AND SUBSIDIARIES | ANNUAL REPORT AND FINANCIAL STATEMENTS
FOR THE YEAR ENDED 31 DECEMBER 2013
Pg
75
NOTES TO THE CONSOLIDATED FINANCIAL STATEMENTS (continued)
5. Financial risk management (Continued)
(b) Credit risk (Continued)
(ii) Cash and cash equivalents
Group Bank
In millions of Kenya Shillings 2013 2012 2013 2012
Cash and balances with bank 12,171 11,091 7,342 7,179
Unrestricted balances with Central Banks 11,674 14,069 6,229 9,395
Restricted balances with Central Banks 1,486 1,689 - -
Money market placements 9,197 18,285 8,359 18,893
As at 31 December 34,528 45,134 21,930 35,467
(iii) Investment securities
Group Bank
In millions of Kenya Shillings 2013 2012 2013 2012
Held to maturity
As at 1 January 31,108 22,908 22,798 22,604
Purchase of Investment securities 6,183 9,866 1,234 1,064
Proceeds from retirement of bonds (3,842) (1,666) (2,306) (870)
As at 31 December 33,449 31,108 21,726 22,798
Group Bank
2013 2012 2013 2012
Available for sale
As at 1 January 9,993 7,595 9,993 7,595
Purchase of Investment securities 8,826 16,027 8,826 16,118
Sales of Investment Securities (7,726) (13,959) (7,596) (13,959)
Reclassification to profit or loss (157) (124) (157) (124)
Profit / (Loss) on fair valuation 187 454 159 454
11,123 9,993 11,223 10,084As at 31 December 44,571 41,101 32,949 32,882
Impaired loans
Impaired loans are loans for which the group and the Bank determines that it is probable that it
will be unable to collect all principal and interest due according to the contractual terms of the loan
agreements. These loans are graded 3, 4 and 5 in the group’s internal credit risk grading system.
Past due but not impaired loans
These are loans where contractual interest or principal payments are past due but the group believes
that impairment is not appropriate on the basis of the level of security / collateral available and / or
the stage of collection of amounts owed to the group.
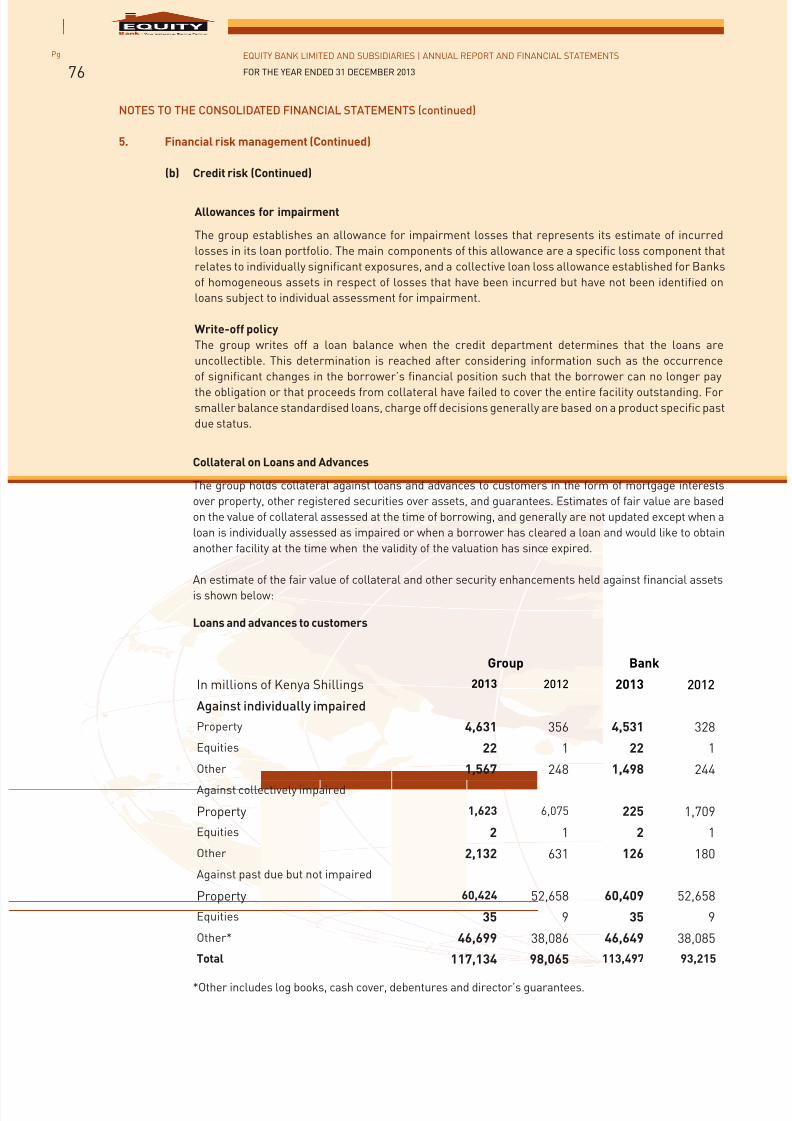
7/21/2019 Equity Bank Group Annual Report 2013
http://slidepdf.com/reader/full/equity-bank-group-annual-report-2013 78/124
EQUITY BANK LIMITED AND SUBSIDIARIES | ANNUAL REPORT AND FINANCIAL STATEMENTS
FOR THE YEAR ENDED 31 DECEMBER 2013
Pg
76
NOTES TO THE CONSOLIDATED FINANCIAL STATEMENTS (continued)
5. Financial risk management (Continued)
(b) Credit risk (Continued)
Allowances for impairment
The group establishes an allowance for impairment losses that represents its estimate of incurred
losses in its loan portfolio. The main components of this allowance are a specific loss component that
relates to individually significant exposures, and a collective loan loss allowance established for Banks
of homogeneous assets in respect of losses that have been incurred but have not been identified on
loans subject to individual assessment for impairment.
Write-off policy
The group writes off a loan balance when the credit department determines that the loans are
uncollectible. This determination is reached after considering information such as the occurrence
of significant changes in the borrower’s financial position such that the borrower can no longer pay
the obligation or that proceeds from collateral have failed to cover the entire facility outstanding. Forsmaller balance standardised loans, charge off decisions generally are based on a product specific past
due status.
Collateral on Loans and Advances
The group holds collateral against loans and advances to customers in the form of mortgage interests
over property, other registered securities over assets, and guarantees. Estimates of fair value are based
on the value of collateral assessed at the time of borrowing, and generally are not updated except when a
loan is individually assessed as impaired or when a borrower has cleared a loan and would like to obtain
another facility at the time when the validity of the valuation has since expired.
An estimate of the fair value of collateral and other security enhancements held against financial assetsis shown below:
Loans and advances to customers
Group Bank
In millions of Kenya Shillings 2013 2012 2013 2012
Against individually impaired
Property 4,631 356 4,531 328
Equities 22 1 22 1
Other 1,567 248 1,498 244
Against collectively impaired
Property 1,623 6,075 225 1,709
Equities 2 1 2 1
Other 2,132 631 126 180
Against past due but not impaired
Property 60,424 52,658 60,409 52,658
Equities 35 9 35 9
Other* 46,699 38,086 46,649 38,085
Total 117,134 98,065 113,497 93,215
*Other includes log books, cash cover, debentures and director’s guarantees.
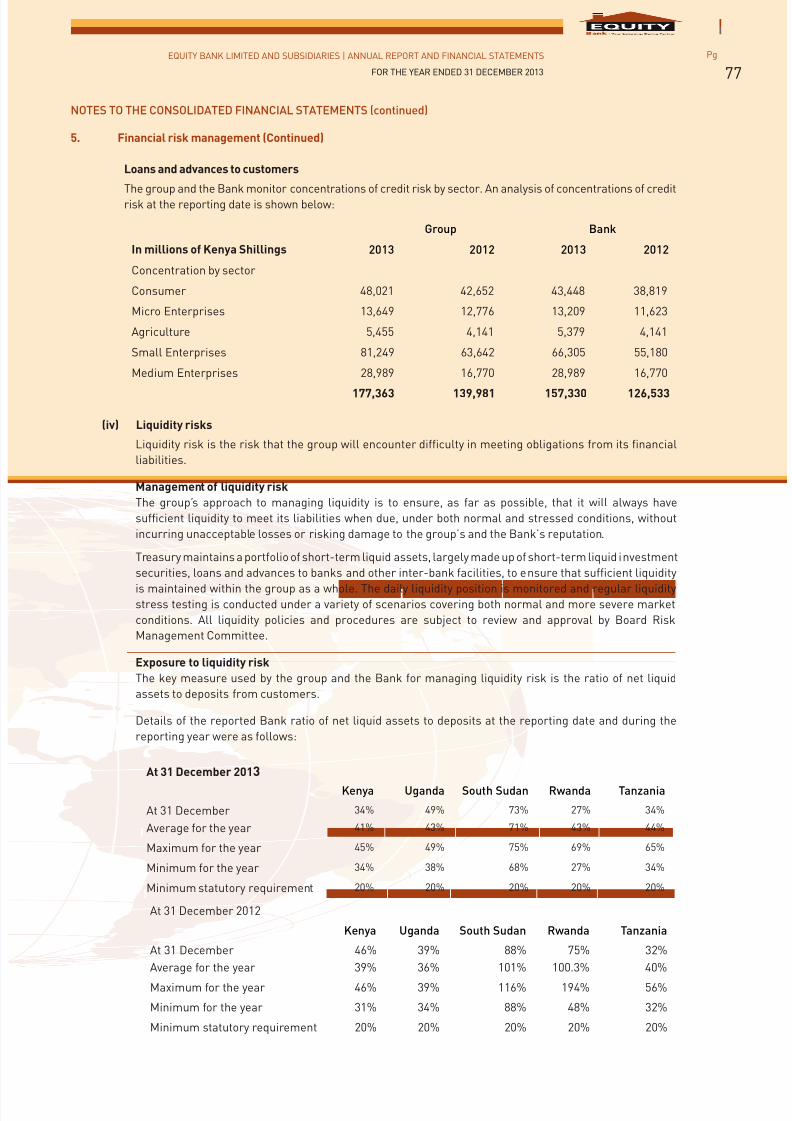
7/21/2019 Equity Bank Group Annual Report 2013
http://slidepdf.com/reader/full/equity-bank-group-annual-report-2013 79/124
EQUITY BANK LIMITED AND SUBSIDIARIES | ANNUAL REPORT AND FINANCIAL STATEMENTS
FOR THE YEAR ENDED 31 DECEMBER 2013
Pg
77
NOTES TO THE CONSOLIDATED FINANCIAL STATEMENTS (continued)
5. Financial risk management (Continued)
Loans and advances to customers
The group and the Bank monitor concentrations of credit risk by sector. An analysis of concentrations of creditrisk at the reporting date is shown below:
Group Bank
In millions of Kenya Shillings 2013 2012 2013 2012
Concentration by sector
Consumer 48,021 42,652 43,448 38,819
Micro Enterprises 13,649 12,776 13,209 11,623
Agriculture 5,455 4,141 5,379 4,141
Small Enterprises 81,249 63,642 66,305 55,180
Medium Enterprises 28,989 16,770 28,989 16,770
177,363 139,981 157,330 126,533
(iv) Liquidity risks
Liquidity risk is the risk that the group will encounter difficulty in meeting obligations from its financial
liabilities.
Management of liquidity risk
The group’s approach to managing liquidity is to ensure, as far as possible, that it will always have
sufficient liquidity to meet its liabilities when due, under both normal and stressed conditions, without
incurring unacceptable losses or risking damage to the group’s and the Bank’s reputation.
Treasury maintains a portfolio of short-term liquid assets, largely made up of short-term liquid investment
securities, loans and advances to banks and other inter-bank facilities, to ensure that sufficient liquidity
is maintained within the group as a whole. The daily liquidity position is monitored and regular liquidity
stress testing is conducted under a variety of scenarios covering both normal and more severe market
conditions. All liquidity policies and procedures are subject to review and approval by Board Risk
Management Committee.
Exposure to liquidity risk
The key measure used by the group and the Bank for managing liquidity risk is the ratio of net liquid
assets to deposits from customers.
Details of the reported Bank ratio of net liquid assets to deposits at the reporting date and during the
reporting year were as follows:
At 31 December 2013Kenya Uganda South Sudan Rwanda Tanzania
At 31 December 34% 49% 73% 27% 34%
Average for the year 41% 43% 71% 43% 44%
Maximum for the year 45% 49% 75% 69% 65%
Minimum for the year 34% 38% 68% 27% 34%
Minimum statutory requirement 20% 20% 20% 20% 20%
At 31 December 2012
Kenya Uganda South Sudan Rwanda Tanzania
At 31 December 46% 39% 88% 75% 32%
Average for the year 39% 36% 101% 100.3% 40%Maximum for the year 46% 39% 116% 194% 56%
Minimum for the year 31% 34% 88% 48% 32%
Minimum statutory requirement 20% 20% 20% 20% 20%
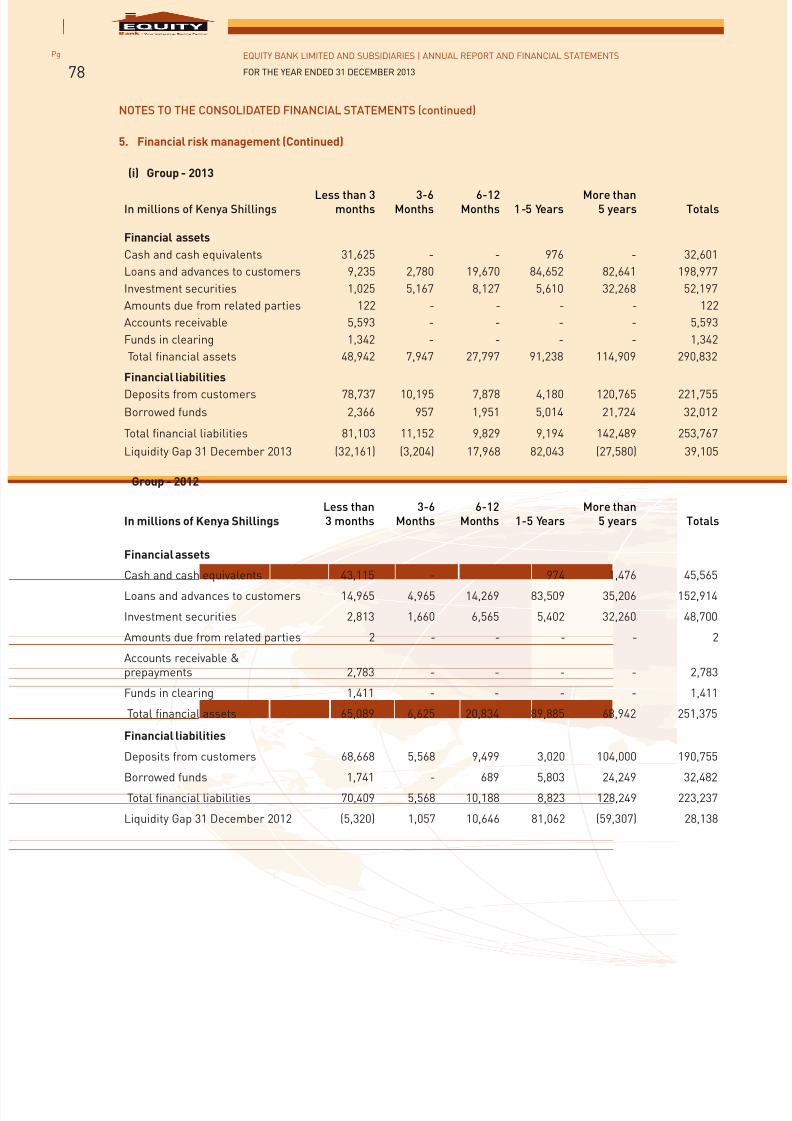
7/21/2019 Equity Bank Group Annual Report 2013
http://slidepdf.com/reader/full/equity-bank-group-annual-report-2013 80/124
EQUITY BANK LIMITED AND SUBSIDIARIES | ANNUAL REPORT AND FINANCIAL STATEMENTS
FOR THE YEAR ENDED 31 DECEMBER 2013
Pg
78
NOTES TO THE CONSOLIDATED FINANCIAL STATEMENTS (continued)
5. Financial risk management (Continued)
(i) Group - 2013
In millions of Kenya ShillingsLess than 3
months3-6
Months6-12
Months 1-5 YearsMore than
5 years Totals
Financial assets
Cash and cash equivalents 31,625 - - 976 - 32,601
Loans and advances to customers 9,235 2,780 19,670 84,652 82,641 198,977
Investment securities 1,025 5,167 8,127 5,610 32,268 52,197
Amounts due from related parties 122 - - - - 122
Accounts receivable 5,593 - - - - 5,593
Funds in clearing 1,342 - - - - 1,342
Total financial assets 48,942 7,947 27,797 91,238 114,909 290,832
Financial liabilities
Deposits from customers 78,737 10,195 7,878 4,180 120,765 221,755
Borrowed funds 2,366 957 1,951 5,014 21,724 32,012
Total financial liabilities 81,103 11,152 9,829 9,194 142,489 253,767
Liquidity Gap 31 December 2013 (32,161) (3,204) 17,968 82,043 (27,580) 39,105
Group - 2012
In millions of Kenya ShillingsLess than3 months
3-6Months
6-12Months 1-5 Years
More than5 years Totals
Financial assets
Cash and cash equivalents 43,115 - 974 1,476 45,565
Loans and advances to customers 14,965 4,965 14,269 83,509 35,206 152,914
Investment securities 2,813 1,660 6,565 5,402 32,260 48,700
Amounts due from related parties 2 - - - - 2
Accounts receivable &prepayments 2,783 - - - - 2,783
Funds in clearing 1,411 - - - - 1,411
Total financial assets 65,089 6,625 20,834 89,885 68,942 251,375
Financial liabilities
Deposits from customers 68,668 5,568 9,499 3,020 104,000 190,755
Borrowed funds 1,741 - 689 5,803 24,249 32,482 Total financial liabilities 70,409 5,568 10,188 8,823 128,249 223,237
Liquidity Gap 31 December 2012 (5,320) 1,057 10,646 81,062 (59,307) 28,138
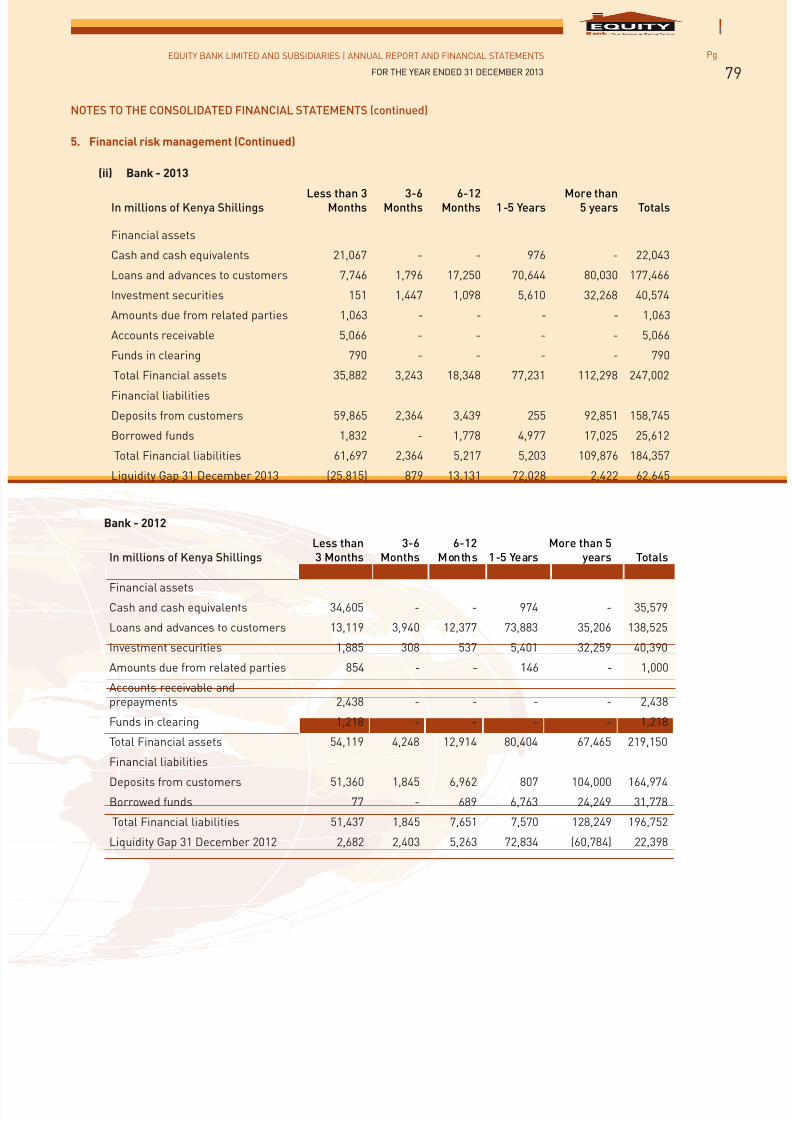
7/21/2019 Equity Bank Group Annual Report 2013
http://slidepdf.com/reader/full/equity-bank-group-annual-report-2013 81/124
EQUITY BANK LIMITED AND SUBSIDIARIES | ANNUAL REPORT AND FINANCIAL STATEMENTS
FOR THE YEAR ENDED 31 DECEMBER 2013
Pg
79
NOTES TO THE CONSOLIDATED FINANCIAL STATEMENTS (continued)
5. Financial risk management (Continued)
(ii) Bank - 2013
In millions of Kenya ShillingsLess than 3
Months3-6
Months6-12
Months 1-5 YearsMore than
5 years Totals
Financial assets
Cash and cash equivalents 21,067 - - 976 - 22,043
Loans and advances to customers 7,746 1,796 17,250 70,644 80,030 177,466
Investment securities 151 1,447 1,098 5,610 32,268 40,574
Amounts due from related parties 1,063 - - - - 1,063
Accounts receivable 5,066 - - - - 5,066
Funds in clearing 790 - - - - 790
Total Financial assets 35,882 3,243 18,348 77,231 112,298 247,002
Financial liabilities
Deposits from customers 59,865 2,364 3,439 255 92,851 158,745
Borrowed funds 1,832 - 1,778 4,977 17,025 25,612
Total Financial liabilities 61,697 2,364 5,217 5,203 109,876 184,357
Liquidity Gap 31 December 2013 (25,815) 879 13,131 72,028 2,422 62,645
Bank - 2012
In millions of Kenya ShillingsLess than3 Months
3-6Months
6-12Months 1-5 Years
More than 5years Totals
Financial assets
Cash and cash equivalents 34,605 - - 974 - 35,579
Loans and advances to customers 13,119 3,940 12,377 73,883 35,206 138,525
Investment securities 1,885 308 537 5,401 32,259 40,390
Amounts due from related parties 854 - - 146 - 1,000
Accounts receivable andprepayments 2,438 - - - - 2,438
Funds in clearing 1,218 - - - - 1,218
Total Financial assets 54,119 4,248 12,914 80,404 67,465 219,150
Financial liabilities
Deposits from customers 51,360 1,845 6,962 807 104,000 164,974
Borrowed funds 77 - 689 6,763 24,249 31,778
Total Financial liabilities 51,437 1,845 7,651 7,570 128,249 196,752
Liquidity Gap 31 December 2012 2,682 2,403 5,263 72,834 (60,784) 22,398
7/21/2019 Equity Bank Group Annual Report 2013
http://slidepdf.com/reader/full/equity-bank-group-annual-report-2013 82/124
EQUITY BANK LIMITED AND SUBSIDIARIES | ANNUAL REPORT AND FINANCIAL STATEMENTS
FOR THE YEAR ENDED 31 DECEMBER 2013
Pg
80
NOTES TO THE CONSOLIDATED FINANCIAL STATEMENTS (continued)
5. Financial risk management (Continued)
(d) Market risks
Market risk is the risk that changes in market prices, such as interest rate, equity prices, foreign exchangerates and credit spreads (not relating to changes in the obligor’s / issuer’s credit standing) will affect the
group’s income or the value of its holdings of financial instruments. The objective of market risk management
is to manage and control market risk exposures within acceptable parameters, while optimising the return
on risk.
Management of market risks
The Bank and group separates its exposure to market risk between trading and non-trading portfolios.
Trading portfolios include positions arising from market making and proprietary position taking, together
with financial assets and liabilities that are managed on a fair value basis.
All foreign exchange risk within the group is managed by the Treasury Department. Accordingly, the foreign
exchange position is treated as part of the group’s trading portfolios for risk management purposes (refer tonote 33).
Overall authority for market risk is vested in the Board Risk Management Committee. The Finance and Treasury
Departments in collaboration with the Risk Management Department are responsible for the development of
detailed risk management policies (subject to review and approval by Board Risk Management Committee)
and for the day-to-day review of their implementation.
Exposure to market risks – trading portfolios
Currently, the Bank and group does not hold a significant trading portfolio and is therefore not largely exposed
to market risks associated with such portfolios.
Exposure to interest rate risk – non-trading portfoliosThe principal risk to which non-trading portfolios are exposed is the risk of loss from fluctuations in the
future cash flows or fair values of financial instruments because of a change in market interest rates. Interest
rate risk is managed principally through monitoring interest rate gaps and by having pre-approved limits for
repricing bands. The Board Risk Management Committee is the monitoring body for compliance with these
limits and is assisted by Treasury Back Office and Finance Department in the day-to-day monitoring activities,
while Risk Management Department carries out regular reviews. A summary of the group’s interest rate gap
position on non-trading portfolios is as follows:
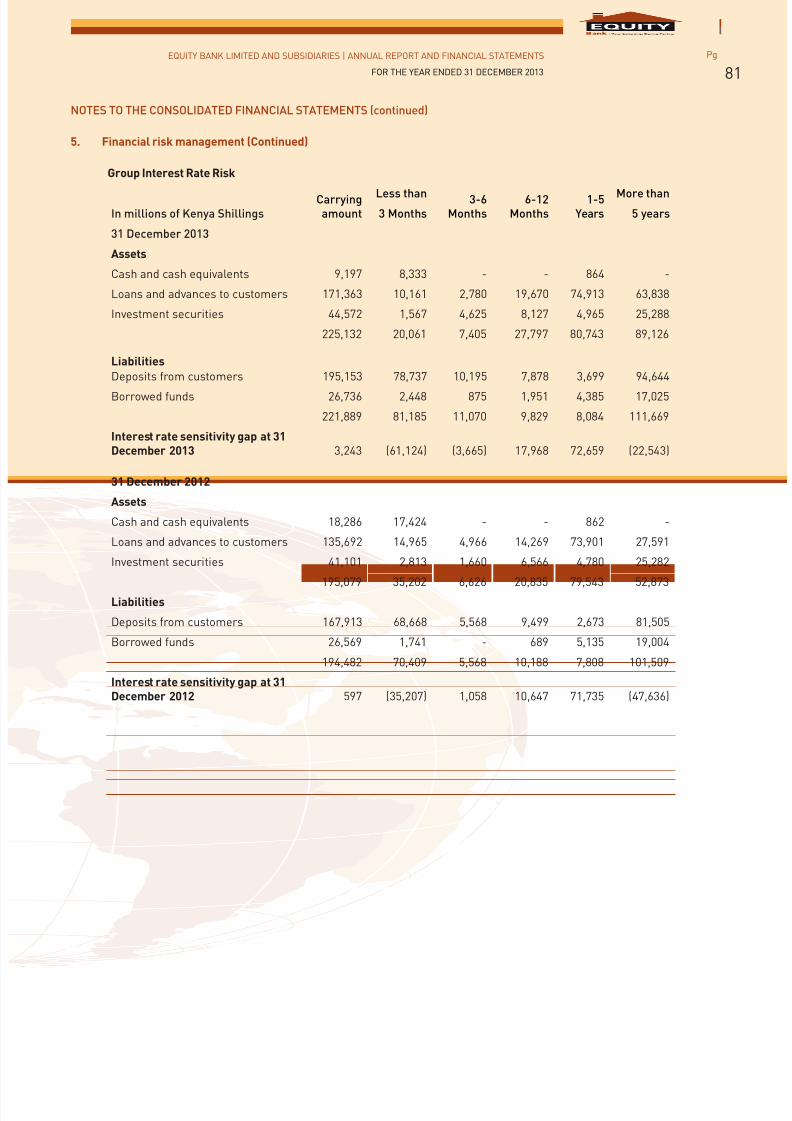
7/21/2019 Equity Bank Group Annual Report 2013
http://slidepdf.com/reader/full/equity-bank-group-annual-report-2013 83/124
EQUITY BANK LIMITED AND SUBSIDIARIES | ANNUAL REPORT AND FINANCIAL STATEMENTS
FOR THE YEAR ENDED 31 DECEMBER 2013
Pg
81
NOTES TO THE CONSOLIDATED FINANCIAL STATEMENTS (continued)
5. Financial risk management (Continued)
Group Interest Rate Risk
In millions of Kenya ShillingsCarryingamount
Less than 3-6Months
6-12Months
1-5Years
More than3 Months 5 years
31 December 2013
Assets
Cash and cash equivalents 9,197 8,333 - - 864 -
Loans and advances to customers 171,363 10,161 2,780 19,670 74,913 63,838
Investment securities 44,572 1,567 4,625 8,127 4,965 25,288
225,132 20,061 7,405 27,797 80,743 89,126
LiabilitiesDeposits from customers 195,153 78,737 10,195 7,878 3,699 94,644
Borrowed funds 26,736 2,448 875 1,951 4,385 17,025
221,889 81,185 11,070 9,829 8,084 111,669
Interest rate sensitivity gap at 31December 2013 3,243 (61,124) (3,665) 17,968 72,659 (22,543)
31 December 2012
Assets
Cash and cash equivalents 18,286 17,424 - - 862 -
Loans and advances to customers 135,692 14,965 4,966 14,269 73,901 27,591
Investment securities 41,101 2,813 1,660 6,566 4,780 25,282
195,079 35,202 6,626 20,835 79,543 52,873Liabilities
Deposits from customers 167,913 68,668 5,568 9,499 2,673 81,505
Borrowed funds 26,569 1,741 - 689 5,135 19,004
194,482 70,409 5,568 10,188 7,808 101,509
Interest rate sensitivity gap at 31December 2012 597 (35,207) 1,058 10,647 71,735 (47,636)
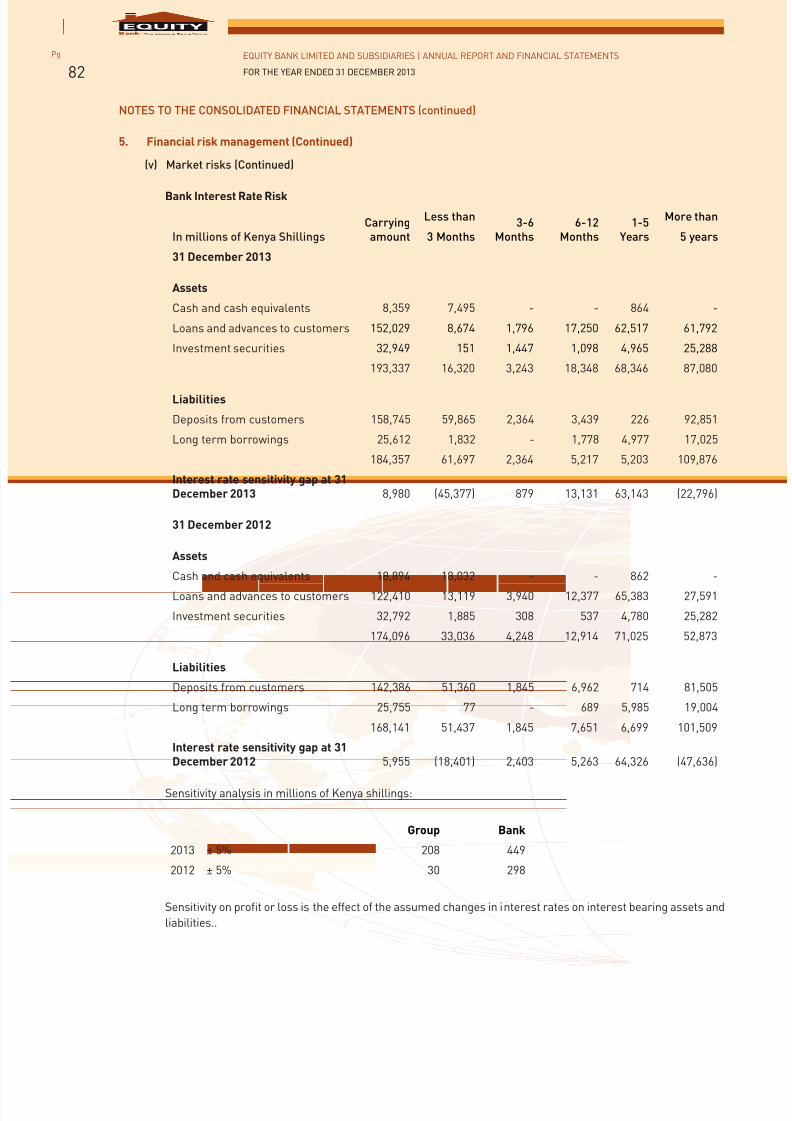
7/21/2019 Equity Bank Group Annual Report 2013
http://slidepdf.com/reader/full/equity-bank-group-annual-report-2013 84/124
EQUITY BANK LIMITED AND SUBSIDIARIES | ANNUAL REPORT AND FINANCIAL STATEMENTS
FOR THE YEAR ENDED 31 DECEMBER 2013
Pg
82
NOTES TO THE CONSOLIDATED FINANCIAL STATEMENTS (continued)
5. Financial risk management (Continued)
(v) Market risks (Continued)
Bank Interest Rate Risk
In millions of Kenya ShillingsCarryingamount
Less than3-6
Months6-12
Months1-5
Years
More than
3 Months 5 years
31 December 2013
Assets
Cash and cash equivalents 8,359 7,495 - - 864 -
Loans and advances to customers 152,029 8,674 1,796 17,250 62,517 61,792
Investment securities 32,949 151 1,447 1,098 4,965 25,288
193,337 16,320 3,243 18,348 68,346 87,080
Liabilities
Deposits from customers 158,745 59,865 2,364 3,439 226 92,851
Long term borrowings 25,612 1,832 - 1,778 4,977 17,025
184,357 61,697 2,364 5,217 5,203 109,876
Interest rate sensitivity gap at 31December 2013 8,980 (45,377) 879 13,131 63,143 (22,796)
31 December 2012
Assets
Cash and cash equivalents 18,894 18,032 - - 862 -
Loans and advances to customers 122,410 13,119 3,940 12,377 65,383 27,591
Investment securities 32,792 1,885 308 537 4,780 25,282
174,096 33,036 4,248 12,914 71,025 52,873
Liabilities
Deposits from customers 142,386 51,360 1,845 6,962 714 81,505
Long term borrowings 25,755 77 - 689 5,985 19,004
168,141 51,437 1,845 7,651 6,699 101,509
Interest rate sensitivity gap at 31December 2012 5,955 (18,401) 2,403 5,263 64,326 (47,636)
Sensitivity analysis in millions of Kenya shillings:
Group Bank
2013 ± 5% 208 449
2012 ± 5% 30 298
Sensitivity on profit or loss is the effect of the assumed changes in interest rates on interest bearing assets and
liabilities..
7/21/2019 Equity Bank Group Annual Report 2013
http://slidepdf.com/reader/full/equity-bank-group-annual-report-2013 85/124
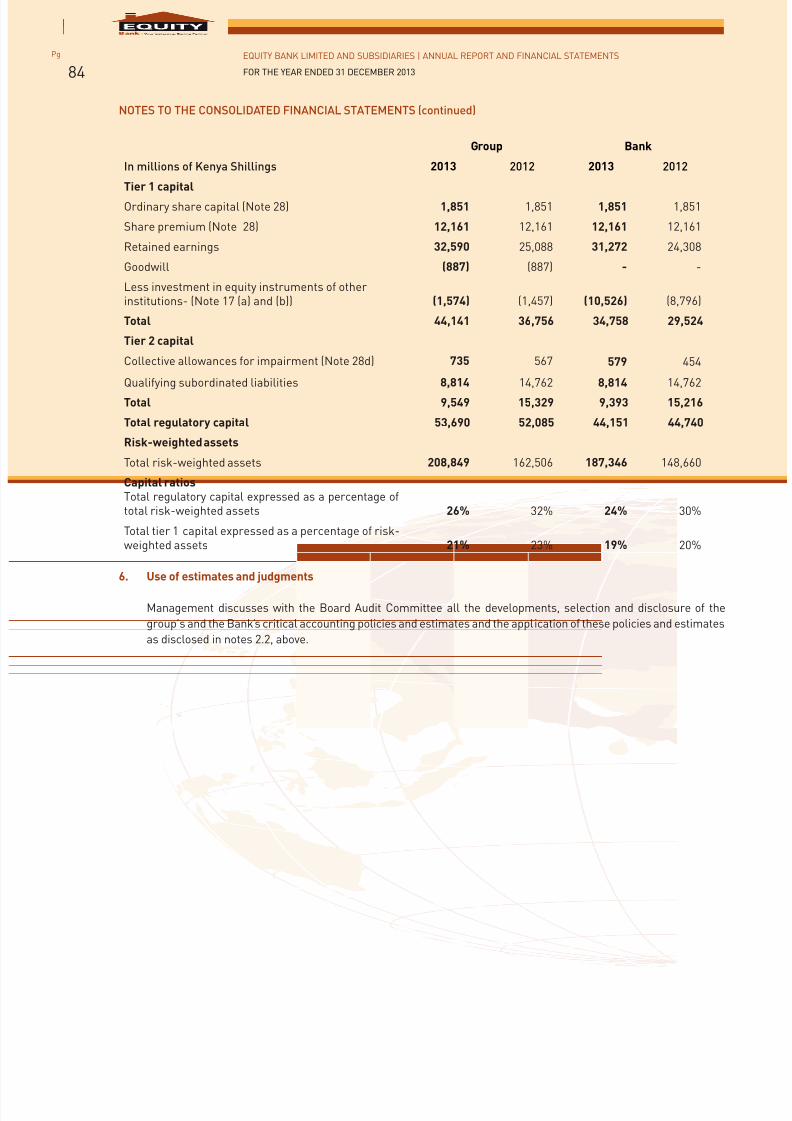
7/21/2019 Equity Bank Group Annual Report 2013
http://slidepdf.com/reader/full/equity-bank-group-annual-report-2013 86/124
EQUITY BANK LIMITED AND SUBSIDIARIES | ANNUAL REPORT AND FINANCIAL STATEMENTS
FOR THE YEAR ENDED 31 DECEMBER 2013
Pg
84
NOTES TO THE CONSOLIDATED FINANCIAL STATEMENTS (continued)
Group Bank
In millions of Kenya Shillings 2013 2012 2013 2012
Tier 1 capital
Ordinary share capital (Note 28) 1,851 1,851 1,851 1,851
Share premium (Note 28) 12,161 12,161 12,161 12,161
Retained earnings 32,590 25,088 31,272 24,308
Goodwill (887) (887) - -
Less investment in equity instruments of otherinstitutions- (Note 17 (a) and (b)) (1,574) (1,457) (10,526) (8,796)
Total 44,141 36,756 34,758 29,524
Tier 2 capital
Collective allowances for impairment (Note 28d) 735 567 579 454
Qualifying subordinated liabilities 8,814 14,762 8,814 14,762Total 9,549 15,329 9,393 15,216
Total regulatory capital 53,690 52,085 44,151 44,740
Risk-weighted assets
Total risk-weighted assets 208,849 162,506 187,346 148,660
Capital ratiosTotal regulatory capital expressed as a percentage oftotal risk-weighted assets 26% 32% 24% 30%
Total tier 1 capital expressed as a percentage of risk-weighted assets 21% 23% 19% 20%
6. Use of estimates and judgments
Management discusses with the Board Audit Committee all the developments, selection and disclosure of the
group’s and the Bank’s critical accounting policies and estimates and the application of these policies and estimates
as disclosed in notes 2.2, above.
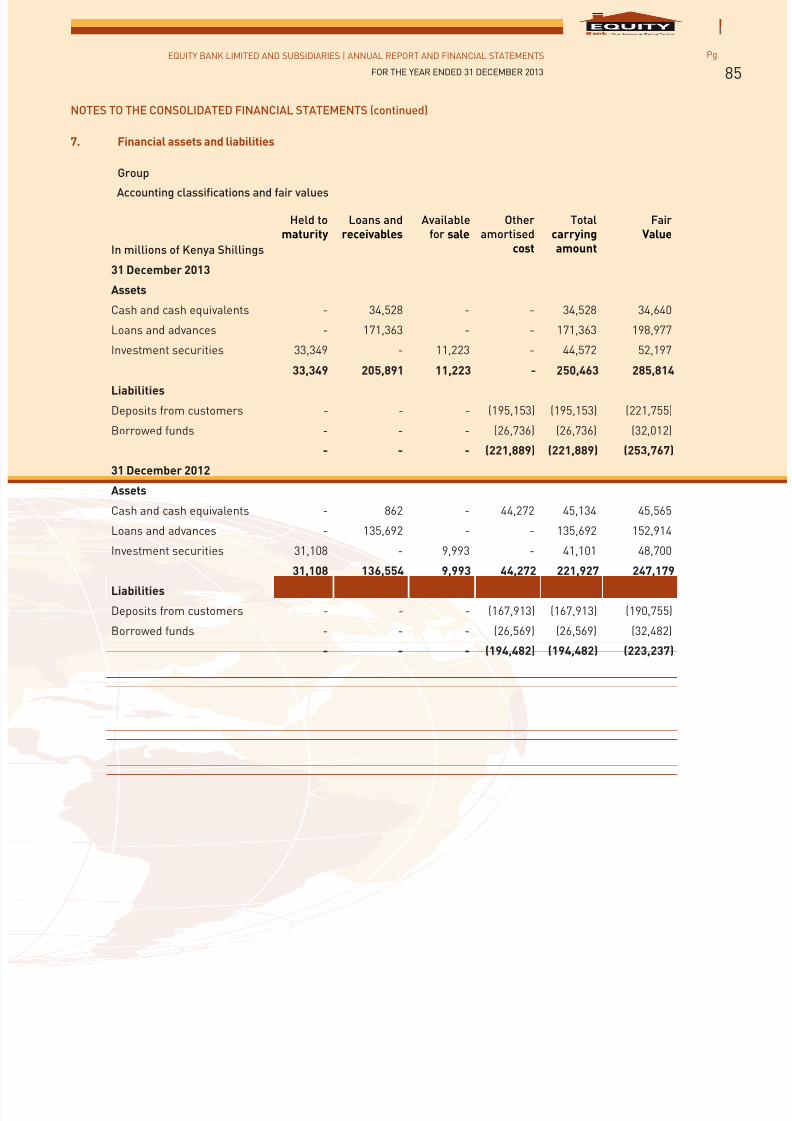
7/21/2019 Equity Bank Group Annual Report 2013
http://slidepdf.com/reader/full/equity-bank-group-annual-report-2013 87/124
EQUITY BANK LIMITED AND SUBSIDIARIES | ANNUAL REPORT AND FINANCIAL STATEMENTS
FOR THE YEAR ENDED 31 DECEMBER 2013
Pg
85
NOTES TO THE CONSOLIDATED FINANCIAL STATEMENTS (continued)
7. Financial assets and liabilities
Group
Accounting classifications and fair values
In millions of Kenya Shillings
Held tomaturity
Loans andreceivables
Availablefor sale
Otheramortised
cost
Totalcarryingamount
FairValue
31 December 2013
Assets
Cash and cash equivalents - 34,528 - - 34,528 34,640
Loans and advances - 171,363 - - 171,363 198,977
Investment securities 33,349 - 11,223 - 44,572 52,197
33,349 205,891 11,223 - 250,463 285,814
Liabilities
Deposits from customers - - - (195,153) (195,153) (221,755)
Borrowed funds - - - (26,736) (26,736) (32,012)
- - - (221,889) (221,889) (253,767)
31 December 2012
Assets
Cash and cash equivalents - 862 - 44,272 45,134 45,565
Loans and advances - 135,692 - - 135,692 152,914
Investment securities 31,108 - 9,993 - 41,101 48,700
31,108 136,554 9,993 44,272 221,927 247,179
Liabilities
Deposits from customers - - - (167,913) (167,913) (190,755)
Borrowed funds - - - (26,569) (26,569) (32,482)
- - - (194,482) (194,482) (223,237)
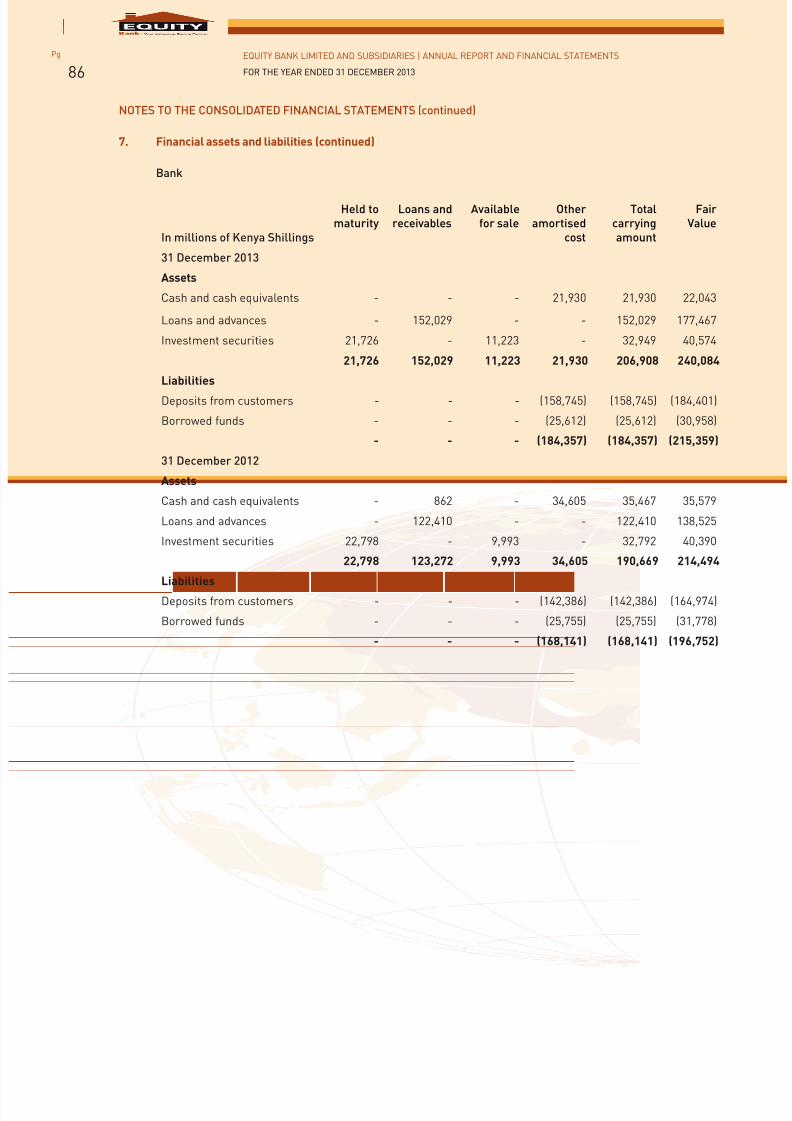
7/21/2019 Equity Bank Group Annual Report 2013
http://slidepdf.com/reader/full/equity-bank-group-annual-report-2013 88/124
EQUITY BANK LIMITED AND SUBSIDIARIES | ANNUAL REPORT AND FINANCIAL STATEMENTS
FOR THE YEAR ENDED 31 DECEMBER 2013
Pg
86
NOTES TO THE CONSOLIDATED FINANCIAL STATEMENTS (continued)
7. Financial assets and liabilities (continued)
Bank
In millions of Kenya Shillings
Held tomaturity
Loans andreceivables
Availablefor sale
Otheramortised
cost
Totalcarryingamount
FairValue
31 December 2013
Assets
Cash and cash equivalents - - - 21,930 21,930 22,043
Loans and advances - 152,029 - - 152,029 177,467
Investment securities 21,726 - 11,223 - 32,949 40,574
21,726 152,029 11,223 21,930 206,908 240,084
Liabilities
Deposits from customers - - - (158,745) (158,745) (184,401)
Borrowed funds - - - (25,612) (25,612) (30,958)
- - - (184,357) (184,357) (215,359)
31 December 2012
Assets
Cash and cash equivalents - 862 - 34,605 35,467 35,579
Loans and advances - 122,410 - - 122,410 138,525
Investment securities 22,798 - 9,993 - 32,792 40,390
22,798 123,272 9,993 34,605 190,669 214,494
LiabilitiesDeposits from customers - - - (142,386) (142,386) (164,974)
Borrowed funds - - - (25,755) (25,755) (31,778)
- - - (168,141) (168,141) (196,752)
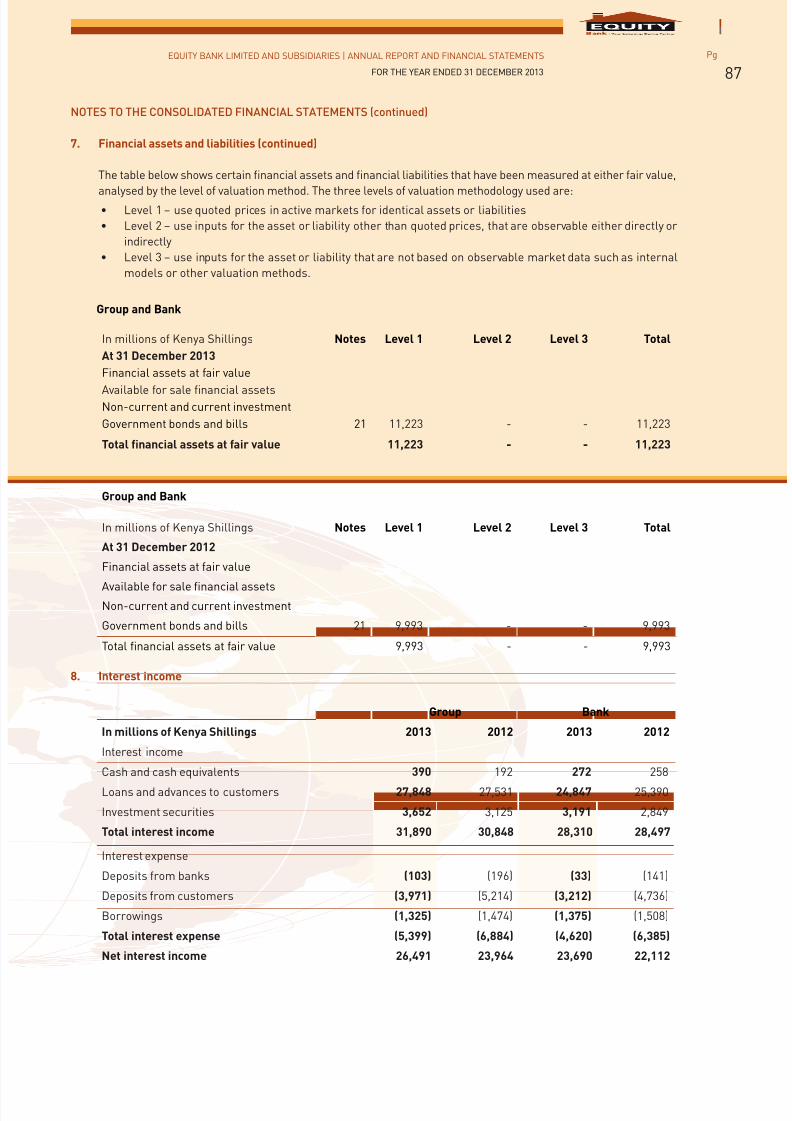
7/21/2019 Equity Bank Group Annual Report 2013
http://slidepdf.com/reader/full/equity-bank-group-annual-report-2013 89/124
EQUITY BANK LIMITED AND SUBSIDIARIES | ANNUAL REPORT AND FINANCIAL STATEMENTS
FOR THE YEAR ENDED 31 DECEMBER 2013
Pg
87
NOTES TO THE CONSOLIDATED FINANCIAL STATEMENTS (continued)
7. Financial assets and liabilities (continued)
The table below shows certain financial assets and financial liabilities that have been measured at either fair value,
analysed by the level of valuation method. The three levels of valuation methodology used are:• Level 1 – use quoted prices in active markets for identical assets or liabilities
• Level 2 – use inputs for the asset or liability other than quoted prices, that are observable either directly or
indirectly
• Level 3 – use inputs for the asset or liability that are not based on observable market data such as internal
models or other valuation methods.
Group and Bank
In millions of Kenya Shillings Notes Level 1 Level 2 Level 3 Total
At 31 December 2013
Financial assets at fair value
Available for sale financial assetsNon-current and current investment
Government bonds and bills 21 11,223 - - 11,223
Total financial assets at fair value 11,223 - - 11,223
Group and Bank
In millions of Kenya Shillings Notes Level 1 Level 2 Level 3 Total
At 31 December 2012
Financial assets at fair value
Available for sale financial assets
Non-current and current investment
Government bonds and bills 21 9,993 - - 9,993
Total financial assets at fair value 9,993 - - 9,993
8. Interest income
In millions of Kenya Shillings
Group Bank
2013 2012 2013 2012
Interest income
Cash and cash equivalents 390 192 272 258Loans and advances to customers 27,848 27,531 24,847 25,390
Investment securities 3,652 3,125 3,191 2,849
Total interest income 31,890 30,848 28,310 28,497
Interest expense
Deposits from banks (103) (196) (33) (141)
Deposits from customers (3,971) (5,214) (3,212) (4,736)
Borrowings (1,325) (1,474) (1,375) (1,508)
Total interest expense (5,399) (6,884) (4,620) (6,385)
Net interest income 26,491 23,964 23,690 22,112
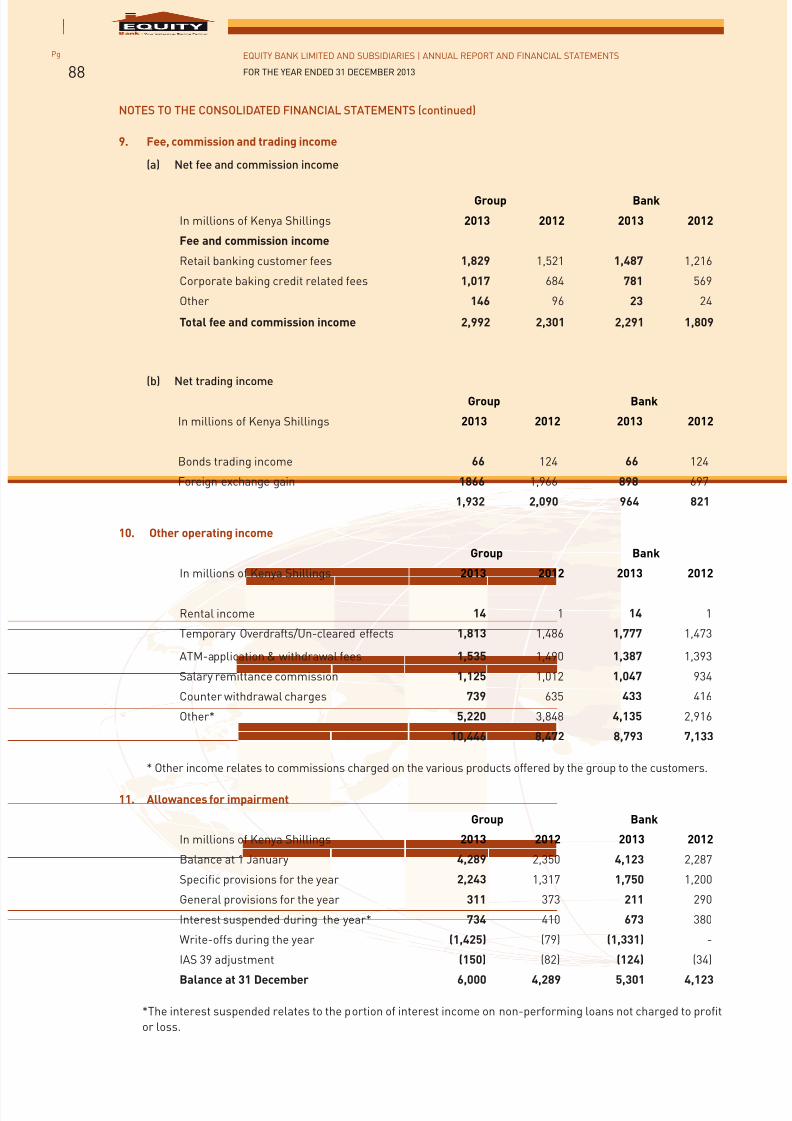
7/21/2019 Equity Bank Group Annual Report 2013
http://slidepdf.com/reader/full/equity-bank-group-annual-report-2013 90/124
EQUITY BANK LIMITED AND SUBSIDIARIES | ANNUAL REPORT AND FINANCIAL STATEMENTS
FOR THE YEAR ENDED 31 DECEMBER 2013
Pg
88
NOTES TO THE CONSOLIDATED FINANCIAL STATEMENTS (continued)
9. Fee, commission and trading income
(a) Net fee and commission income
Group Bank
In millions of Kenya Shillings 2013 2012 2013 2012
Fee and commission income
Retail banking customer fees 1,829 1,521 1,487 1,216
Corporate baking credit related fees 1,017 684 781 569
Other 146 96 23 24
Total fee and commission income 2,992 2,301 2,291 1,809
(b) Net trading income
Group Bank
In millions of Kenya Shillings 2013 2012 2013 2012
Bonds trading income 66 124 66 124
Foreign exchange gain 1866 1,966 898 697
1,932 2,090 964 821
10. Other operating income
Group Bank
In millions of Kenya Shillings 2013 2012 2013 2012
Rental income 14 1 14 1
Temporary Overdrafts/Un-cleared effects 1,813 1,486 1,777 1,473
ATM-application & withdrawal fees 1,535 1,490 1,387 1,393
Salary remittance commission 1,125 1,012 1,047 934
Counter withdrawal charges 739 635 433 416
Other* 5,220 3,848 4,135 2,916
10,446 8,472 8,793 7,133
* Other income relates to commissions charged on the various products offered by the group to the customers.
11. Allowances for impairment
Group Bank
In millions of Kenya Shillings 2013 2012 2013 2012
Balance at 1 January 4,289 2,350 4,123 2,287
Specific provisions for the year 2,243 1,317 1,750 1,200
General provisions for the year 311 373 211 290
Interest suspended during the year* 734 410 673 380
Write-offs during the year (1,425) (79) (1,331) -
IAS 39 adjustment (150) (82) (124) (34)
Balance at 31 December 6,000 4,289 5,301 4,123
*The interest suspended relates to the portion of interest income on non-performing loans not charged to profit
or loss.
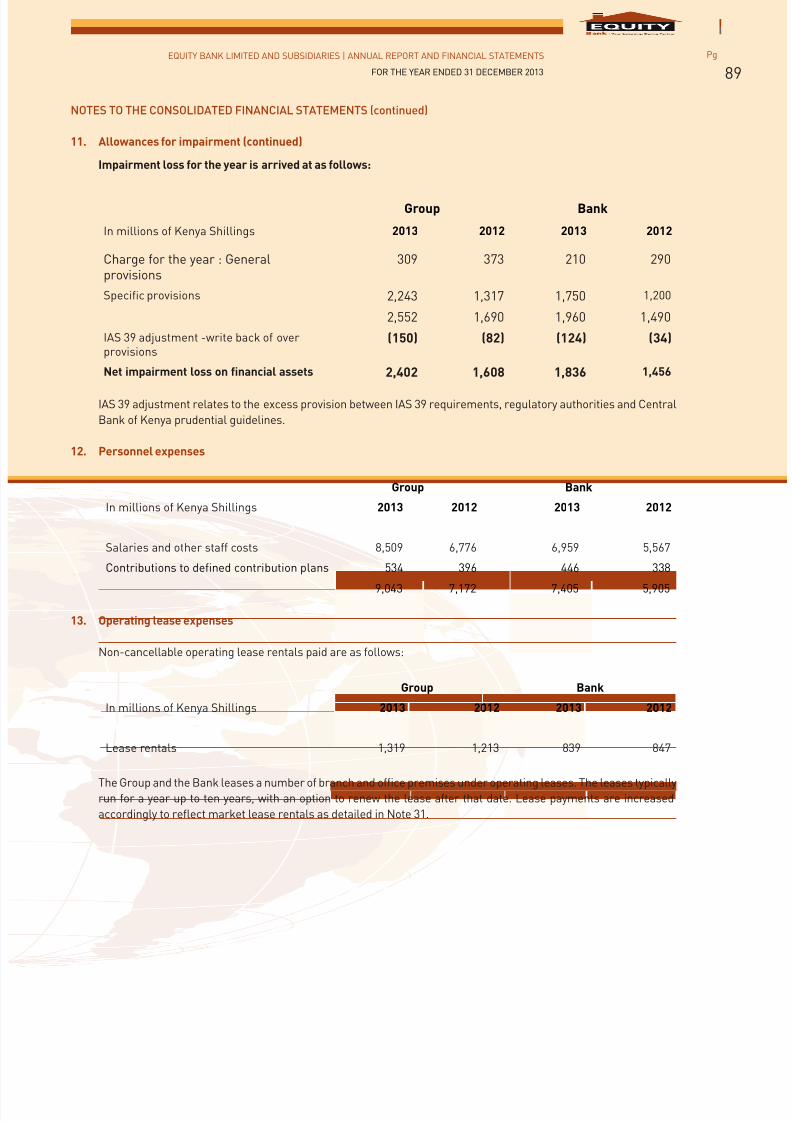
7/21/2019 Equity Bank Group Annual Report 2013
http://slidepdf.com/reader/full/equity-bank-group-annual-report-2013 91/124
EQUITY BANK LIMITED AND SUBSIDIARIES | ANNUAL REPORT AND FINANCIAL STATEMENTS
FOR THE YEAR ENDED 31 DECEMBER 2013
Pg
89
NOTES TO THE CONSOLIDATED FINANCIAL STATEMENTS (continued)
11. Allowances for impairment (continued)
Impairment loss for the year is arrived at as follows:
Group Bank
In millions of Kenya Shillings 2013 2012 2013 2012
Charge for the year : Generalprovisions
309 373 210 290
Specific provisions 2,243 1,317 1,750 1,200
2,552 1,690 1,960 1,490
IAS 39 adjustment -write back of overprovisions
(150) (82) (124) (34)
Net impairment loss on financial assets 2,402 1,608 1,836 1,456
IAS 39 adjustment relates to the excess provision between IAS 39 requirements, regulatory authorities and Central
Bank of Kenya prudential guidelines.
12. Personnel expenses
Group Bank
In millions of Kenya Shillings 2013 2012 2013 2012
Salaries and other staff costs 8,509 6,776 6,959 5,567
Contributions to defined contribution plans 534 396 446 338
9,043 7,172 7,405 5,905
13. Operating lease expenses
Non-cancellable operating lease rentals paid are as follows:
Group Bank
In millions of Kenya Shillings 2013 2012 2013 2012
Lease rentals 1,319 1,213 839 847
The Group and the Bank leases a number of branch and office premises under operating leases. The leases typicallyrun for a year up to ten years, with an option to renew the lease after that date. Lease payments are increased
accordingly to reflect market lease rentals as detailed in Note 31.
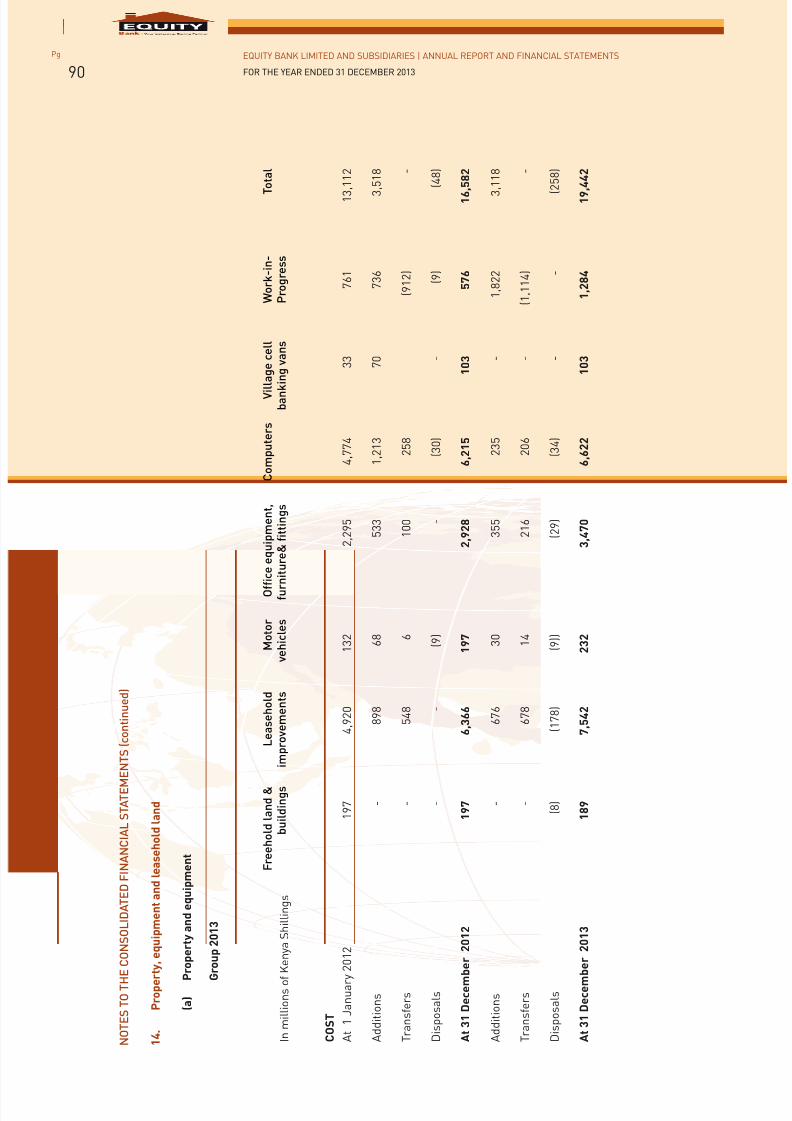
7/21/2019 Equity Bank Group Annual Report 2013
http://slidepdf.com/reader/full/equity-bank-group-annual-report-2013 92/124
EQUITY BANK LIMITED AND SUBSIDIARIES | ANNUAL REPORT AND FINANCIAL STATEMENTS
FOR THE YEAR ENDED 31 DECEMBER 2013
Pg
90
N O T E S T O T H E
C O N S O L I D A T E D F I N A N C I A L S T A T E M E
N T S ( c o n t i n u e d )
1 4
.
P r o p e r t y ,
e q u i p m e n t a n d l e a s e h o l d l a n d
( a )
P r
o p e r t y a n d e q u i p m e n t
G r
o u p 2 0 1 3
I n m i l l i o n s o f K
e n y a S h i l l i n g s
F r e e h o l d l a n d &
b u i l d i n g s
L e a s e h o l d
i m p r o v e m e n t s
M o t o r
v e h i c l e s
O f fi
c e e q u i p m e n t ,
f u r n
i t u r e & fi t t i n g s
C o m p u t e r s
V i l
l a g e c e l l
b a n k
i n g v a n s
W o r k - i n -
P r o g r e s s
T
o t a l
C O S T
A t 1 J a n u a r y 2 0 1 2
1 9 7
4 , 9
2 0
1 3 2
2 , 2
9 5
4 , 7
7 4
3 3
7 6 1
1 3
, 1 1 2
A d d i t i o n s
-
8 9 8
6 8
5 3 3
1 , 2
1 3
7 0
7 3 6
3
, 5 1 8
T r a n s f e r s
-
5 4 8
6
1 0 0
2 5 8
( 9 1 2 )
-
D i s p o s a l s
-
-
( 9 )
-
( 3 0 )
-
( 9 )
( 4 8 )
A t 3 1 D e c e m b
e r 2 0 1 2
1 9 7
6 , 3
6 6
1 9 7
2 , 9
2 8
6 , 2
1 5
1 0 3
5 7 6
1 6
, 5 8 2
A d d i t i o n s
-
6 7 6
3 0
3 5 5
2 3 5
-
1 , 8
2 2
3
, 1 1 8
T r a n s f e r s
-
6 7 8
1 4
2 1 6
2 0 6
-
( 1 , 1
1 4 )
-
D i s p o s a l s
( 8 )
( 1 7 8 )
( 9 ) )
( 2 9 )
( 3 4 )
-
-
( 2 5 8 )
A t 3 1 D e c e m b
e r 2 0 1 3
1 8 9
7 , 5
4 2
2 3 2
3 , 4
7 0
6 , 6
2 2
1 0 3
1 , 2
8 4
1 9
, 4 4 2
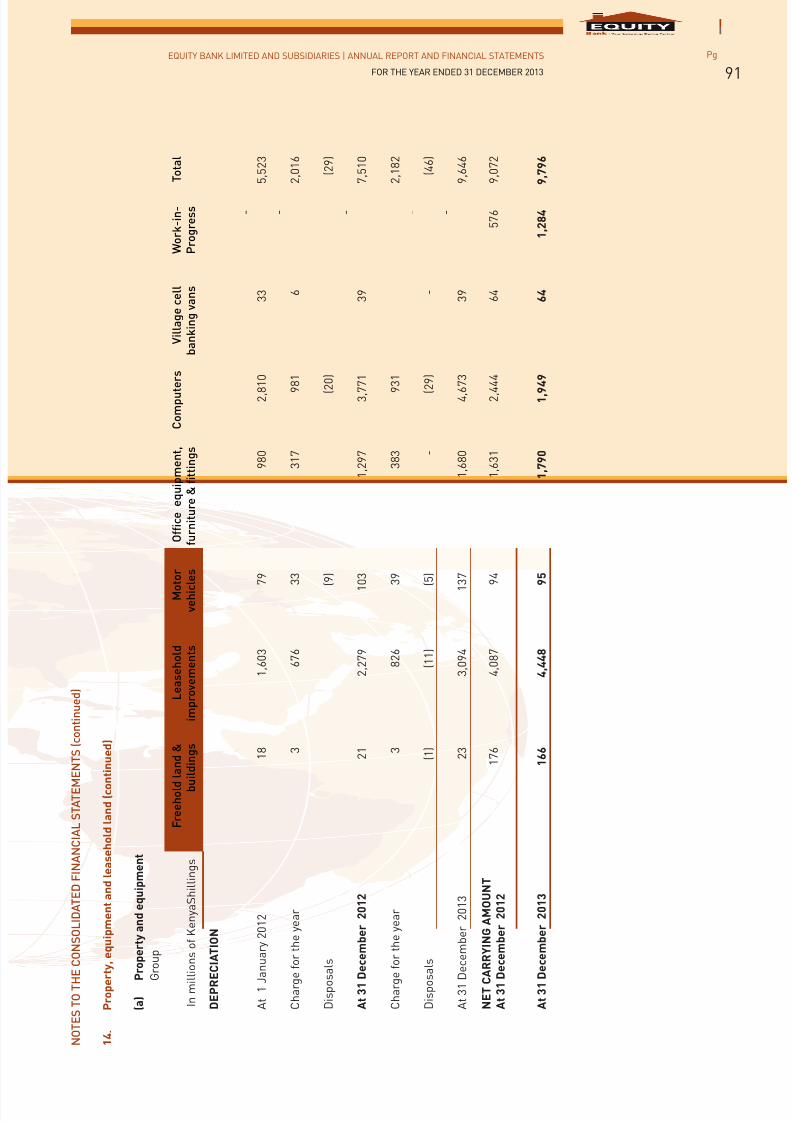
7/21/2019 Equity Bank Group Annual Report 2013
http://slidepdf.com/reader/full/equity-bank-group-annual-report-2013 93/124
EQUITY BANK LIMITED AND SUBSIDIARIES | ANNUAL REPORT AND FINANCIAL STATEMENTS
FOR THE YEAR ENDED 31 DECEMBER 2013
Pg
91
N O T E S T O T H E
C O N S O L I D A T E D F I N A N C I A L S T A T E M E
N T S ( c o n t i n u e d )
1 4
.
P r o p e r t y ,
e q u i p m e n t a n d l e a s e h o l d l a n d ( c o n t i n u e d )
( a )
P r
o p e r t y a n d e q u i p m e n t
G r
o u p
I n m i l l i o n s o f K e n y a S h i l l i n g s
F r e e h o l d l
a n d &
b u i l d i n g s
L e a s e h o l d
i m p r o v e m e n t s
M o t o r
v e h i c l e s
O f fi c e e q u i p m e n t ,
f u r n i t u r e & fi t t i n g s
C o m p u t e r s
V i l l a g e c e l l
b a n k i n g v a n s
W o r k - i n -
P r o g r e s s
T o t a l
D E P R E C
I A T I O N
A t 1 J a n u a r y 2 0 1 2
1 8
1 , 6
0 3
7
9
9 8 0
2 , 8 1 0
3 3
-
5 , 5
2 3
C h a r g e
f o r t h e y e a r
3
6 7 6
3
3
3 1 7
9 8 1
6
-
2 , 0
1 6
D i s p o s a
l s
( 9 )
( 2
0 )
( 2 9 )
A t 3 1 D e c e m b e r 2 0 1 2
2 1
2 , 2
7 9
1 0
3
1 , 2
9 7
3 , 7 7 1
3 9
-
7 , 5
1 0
C h a r g e
f o r t h e y e a r
3
8 2 6
3
9
3 8 3
9 3 1
2 , 1
8 2
D i s p o s a
l s
( 1 )
( 1 1 )
( 5 )
-
( 2
9 )
-
-
( 4 6 )
A t 3 1 D e c e m b e r 2 0 1 3
2 3
3 , 0
9 4
1 3
7
1 , 6
8 0
4 , 6 7 3
3 9
-
9 , 6
4 6
N E T C A
R R Y I N G A M O U N T
A t 3 1 D e c e m b e r 2 0 1 2
1 7 6
4 , 0
8 7
9
4
1 , 6
3 1
2 , 4 4 4
6 4
5 7 6
9 , 0
7 2
A t 3 1 D e c e m b e r 2 0 1 3
1 6 6
4 , 4
4 8
9
5
1 , 7
9 0
1 , 9
4 9
6 4
1 , 2
8 4
9 , 7
9 6
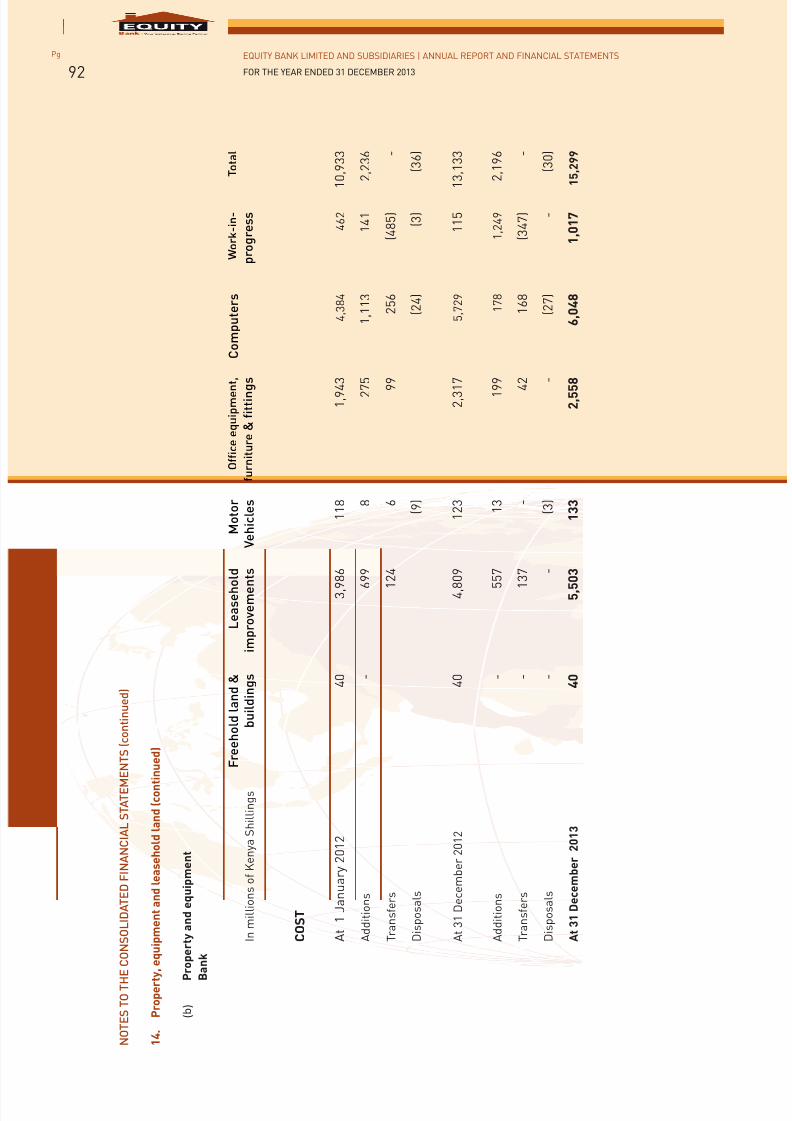
7/21/2019 Equity Bank Group Annual Report 2013
http://slidepdf.com/reader/full/equity-bank-group-annual-report-2013 94/124
EQUITY BANK LIMITED AND SUBSIDIARIES | ANNUAL REPORT AND FINANCIAL STATEMENTS
FOR THE YEAR ENDED 31 DECEMBER 2013
Pg
92
N O T E S T O T H E
C O N S O L I D A T E D F I N A N C I A L S T A T E M E
N T S ( c o n t i n u e d )
1 4
.
P r o p e r t y ,
e q u i p m e n t a n d l e a s e h o l d l a n d ( c o n t i n u e d )
( b )
P r
o p e r t y a n d e q u i p m e n t
B a
n k
I n m i l l i o n s o f K e n y a S h i l l i n g s
F r e e h o l d l a n d &
b u i l d i n g s
L e a s e h o
l d
i m p r o v e m e n
t s
M o t o r
V e h i c l e s
O f fi c e e q u i p m e n
t ,
f u r n i t u r e & fi t t i n g
s
C o m p u t e r s
W o r k - i n -
p r o g r e s s
T o t a l
C O S T
A t 1 J a n u a r y 2 0 1 2
4 0
3 , 9 8 6
1 1 8
1 , 9 4
3
4 , 3
8 4
4 6 2
1 0 , 9
3 3
A d d i t i o n s
-
6 9 9
8
2 7
5
1 , 1
1 3
1 4 1
2 , 2
3 6
T r a n s f e r s
1 2 4
6
9
9
2 5 6
( 4 8 5 )
-
D i s p o s a l s
( 9 )
( 2 4 )
( 3 )
( 3 6 )
A t 3 1 D e c e m b e r 2 0 1 2
4 0
4 , 8 0 9
1 2 3
2 , 3 1
7
5 , 7
2 9
1 1 5
1 3 , 1
3 3
A d d i t i o n s
-
5 5 7
1 3
1 9
9
1 7 8
1 , 2
4 9
2 , 1
9 6
T r a n s f e r s
-
1 3 7
-
4
2
1 6 8
( 3 4 7 )
-
D i s p o s a l s
-
-
( 3 )
-
( 2 7 )
-
( 3 0 )
A t 3 1 D e c e m b e r 2 0 1 3
4 0
5 , 5
0 3
1 3 3
2 , 5 5
8
6 , 0
4 8
1 , 0
1 7
1 5
, 2 9 9
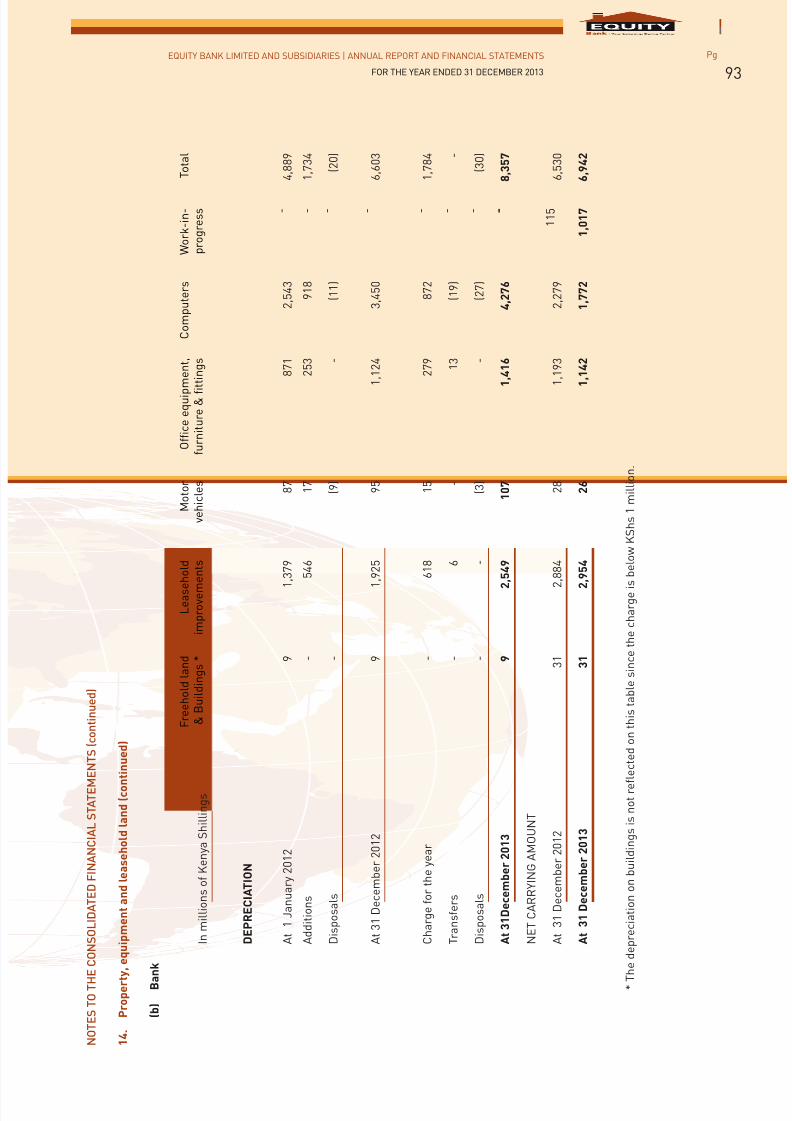
7/21/2019 Equity Bank Group Annual Report 2013
http://slidepdf.com/reader/full/equity-bank-group-annual-report-2013 95/124
EQUITY BANK LIMITED AND SUBSIDIARIES | ANNUAL REPORT AND FINANCIAL STATEMENTS
FOR THE YEAR ENDED 31 DECEMBER 2013
Pg
93
N O T E S T O T H E
C O N S O L I D A T E D F I N A N C I A L S T A T E M E
N T S ( c o n t i n u e d )
1 4
.
P r o p e r t y ,
e q u i p m e n t a n d l e a s e h o l d l a n d ( c o n t
i n u e d )
( b )
B a n
k
I n m i l l i o n s o f K e n y a S h i l l i n g s
F r e e h o l d l a n d
& B u i l d i n g s *
L e a s e h o l d
i m p r o v e m e n t s
M o t o r
v e h i c l e s
O f fi c e e q u i p m e n t ,
f u r n i t u r e & fi t t i n g s
C o m p u t e r s
W o r k - i n -
p r o g r e s s
T o t a l
D E P R E C I A T I O N
A t 1 J a n u a r y 2 0 1 2
9
1 , 3
7 9
8 7
8 7 1
2 , 5
4 3
-
4 , 8
8 9
A d d i t i o n s
-
5 4 6
1 7
2 5 3
9 1 8
-
1 , 7
3 4
D i s p o s a l s
-
( 9 )
-
( 1 1 )
-
( 2 0 )
A t 3 1 D e c e m b e r 2 0 1 2
9
1 , 9
2 5
9 5
1 , 1
2 4
3 , 4
5 0
-
6 , 6
0 3
C h a r g e f o r t h e y e a r
-
6 1 8
1 5
2 7 9
8 7 2
-
1 , 7
8 4
T r a n s f e r s
-
6
-
1 3
( 1 9 )
-
-
D i s p o s a l s
-
-
( 3 )
-
( 2 7 )
-
( 3 0 )
A t 3 1 D e c e m b e r 2 0 1 3
9
2 , 5
4 9
1 0 7
1 , 4
1 6
4 , 2
7 6
-
8 , 3
5 7
N E T C A R R Y I N G A M O U N T
A t 3 1 D e c e m b e r 2 0 1 2
3 1
2 , 8
8 4
2 8
1 , 1
9 3
2 , 2
7 9
1 1 5
6 , 5
3 0
A t 3 1 D e c e m b e r 2 0 1 3
3 1
2 , 9
5 4
2 6
1 , 1
4 2
1 , 7
7 2
1 , 0
1 7
6 , 9
4 2
* T h
e d e p r e c i a t i o n o n b u i l d i n g s i s n o t r e fl e c t e d o n t h i s t a b l e s i n c e t h e c h a r g e i s
b e l o w K S h s 1 m i l l i o n .
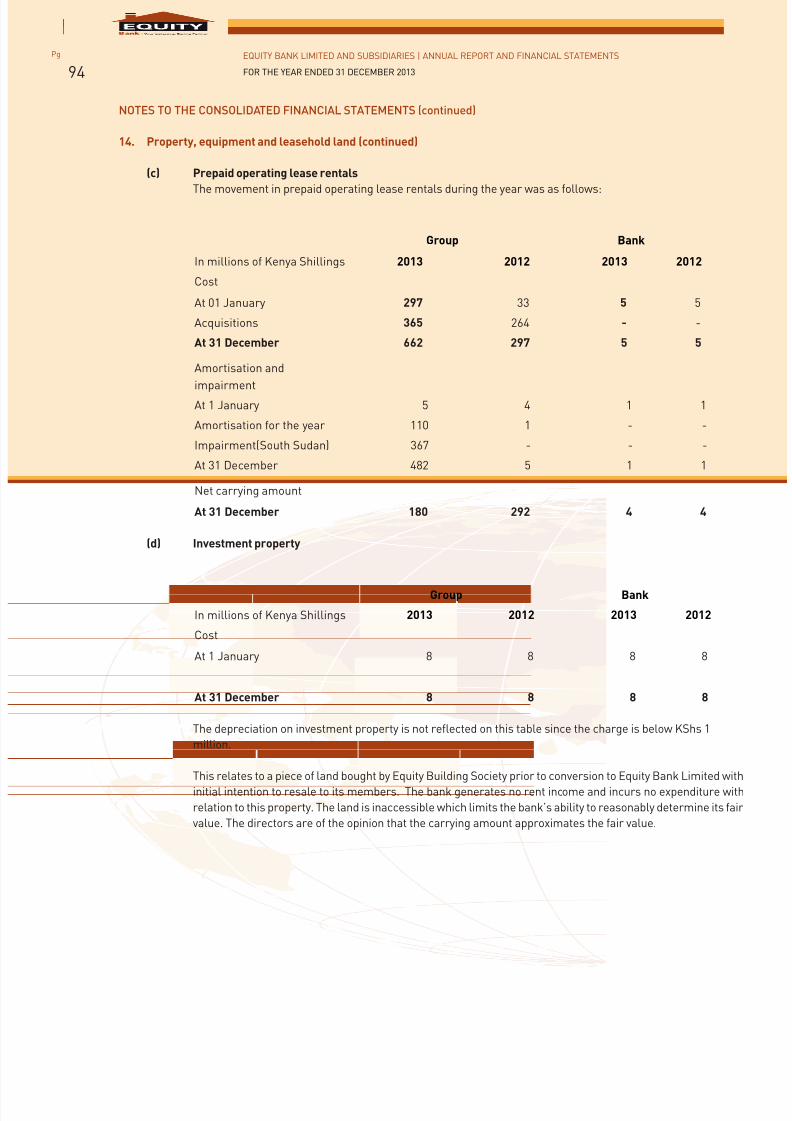
7/21/2019 Equity Bank Group Annual Report 2013
http://slidepdf.com/reader/full/equity-bank-group-annual-report-2013 96/124
EQUITY BANK LIMITED AND SUBSIDIARIES | ANNUAL REPORT AND FINANCIAL STATEMENTS
FOR THE YEAR ENDED 31 DECEMBER 2013
Pg
94
NOTES TO THE CONSOLIDATED FINANCIAL STATEMENTS (continued)
14. Property, equipment and leasehold land (continued)
(c) Prepaid operating lease rentals
The movement in prepaid operating lease rentals during the year was as follows:
Group Bank
In millions of Kenya Shillings 2013 2012 2013 2012
Cost
At 01 January 297 33 5 5
Acquisitions 365 264 - -
At 31 December 662 297 5 5
Amortisation and
impairmentAt 1 January 5 4 1 1
Amortisation for the year 110 1 - -
Impairment(South Sudan) 367 - - -
At 31 December 482 5 1 1
Net carrying amount
At 31 December 180 292 4 4
(d) Investment property
Group Bank
In millions of Kenya Shillings 2013 2012 2013 2012
Cost
At 1 January 8 8 8 8
At 31 December 8 8 8 8
The depreciation on investment property is not reflected on this table since the charge is below KShs 1
million.
This relates to a piece of land bought by Equity Building Society prior to conversion to Equity Bank Limited withinitial intention to resale to its members. The bank generates no rent income and incurs no expenditure with
relation to this property. The land is inaccessible which limits the bank’s ability to reasonably determine its fair
value. The directors are of the opinion that the carrying amount approximates the fair value.
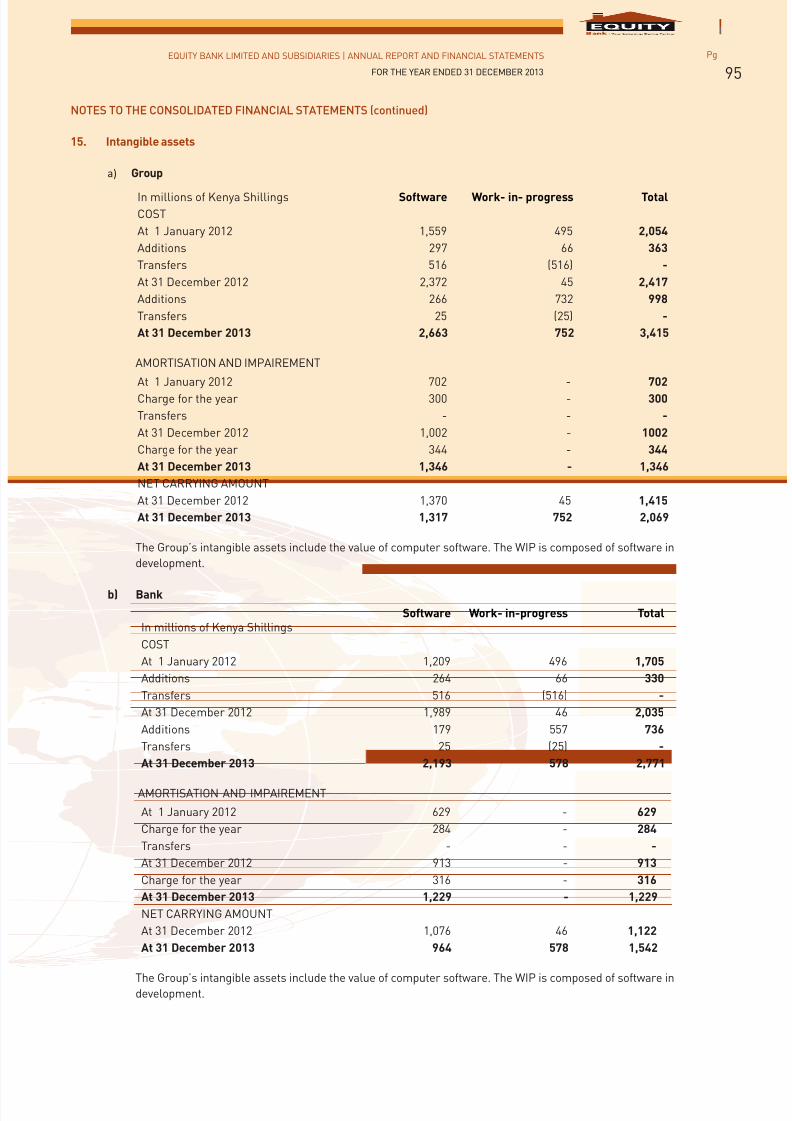
7/21/2019 Equity Bank Group Annual Report 2013
http://slidepdf.com/reader/full/equity-bank-group-annual-report-2013 97/124
EQUITY BANK LIMITED AND SUBSIDIARIES | ANNUAL REPORT AND FINANCIAL STATEMENTS
FOR THE YEAR ENDED 31 DECEMBER 2013
Pg
95
NOTES TO THE CONSOLIDATED FINANCIAL STATEMENTS (continued)
15. Intangible assets
a) Group
In millions of Kenya Shillings Software Work- in- progress TotalCOST
At 1 January 2012 1,559 495 2,054
Additions 297 66 363
Transfers 516 (516) -
At 31 December 2012 2,372 45 2,417
Additions 266 732 998
Transfers 25 (25) -
At 31 December 2013 2,663 752 3,415
AMORTISATION AND IMPAIREMENT
At 1 January 2012 702 - 702
Charge for the year 300 - 300
Transfers - - -
At 31 December 2012 1,002 - 1002
Charge for the year 344 - 344
At 31 December 2013 1,346 - 1,346
NET CARRYING AMOUNT
At 31 December 2012 1,370 45 1,415
At 31 December 2013 1,317 752 2,069
The Group’s intangible assets include the value of computer software. The WIP is composed of software in
development.
b) Bank
In millions of Kenya ShillingsSoftware Work- in-progress Total
COST
At 1 January 2012 1,209 496 1,705
Additions 264 66 330
Transfers 516 (516) -
At 31 December 2012 1,989 46 2,035
Additions 179 557 736
Transfers 25 (25) -
At 31 December 2013 2,193 578 2,771
AMORTISATION AND IMPAIREMENT
At 1 January 2012 629 - 629
Charge for the year 284 - 284
Transfers - - -
At 31 December 2012 913 - 913
Charge for the year 316 - 316
At 31 December 2013 1,229 - 1,229
NET CARRYING AMOUNT
At 31 December 2012 1,076 46 1,122
At 31 December 2013 964 578 1,542
The Group’s intangible assets include the value of computer software. The WIP is composed of software in
development.
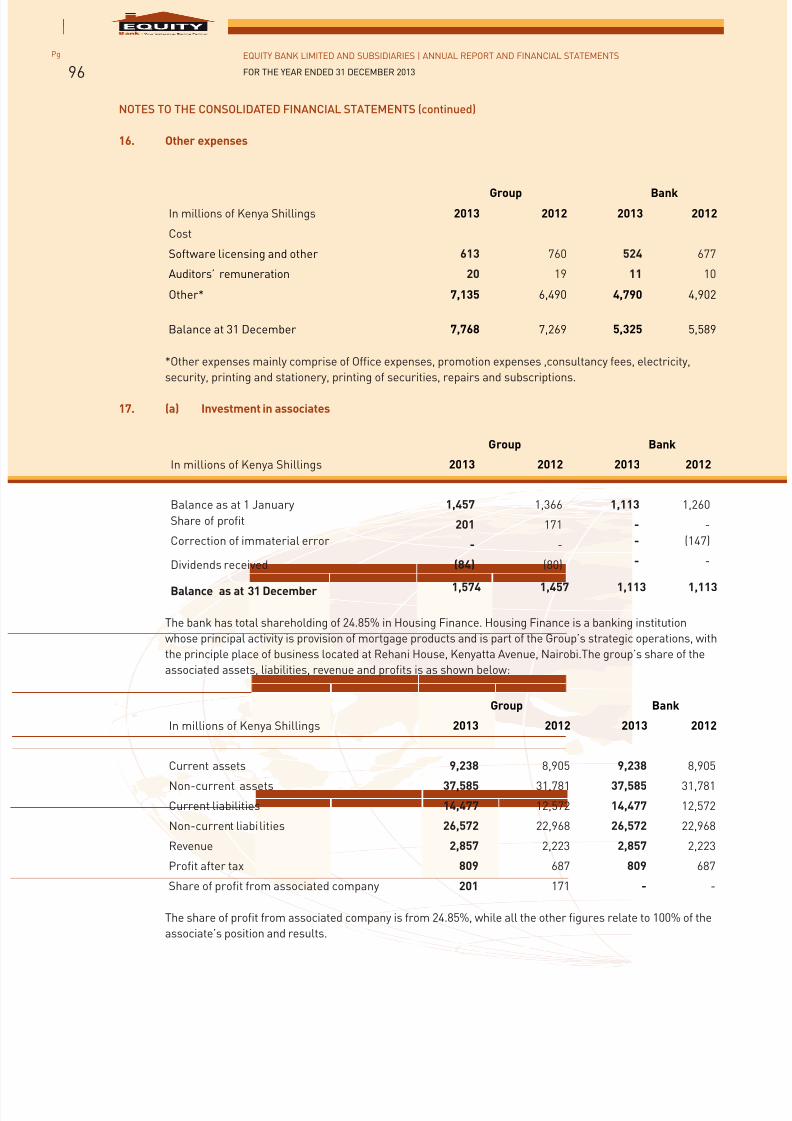
7/21/2019 Equity Bank Group Annual Report 2013
http://slidepdf.com/reader/full/equity-bank-group-annual-report-2013 98/124
EQUITY BANK LIMITED AND SUBSIDIARIES | ANNUAL REPORT AND FINANCIAL STATEMENTS
FOR THE YEAR ENDED 31 DECEMBER 2013
Pg
96
NOTES TO THE CONSOLIDATED FINANCIAL STATEMENTS (continued)
16. Other expenses
Group BankIn millions of Kenya Shillings 2013 2012 2013 2012
Cost
Software licensing and other 613 760 524 677
Auditors’ remuneration 20 19 11 10
Other* 7,135 6,490 4,790 4,902
Balance at 31 December 7,768 7,269 5,325 5,589
*Other expenses mainly comprise of Office expenses, promotion expenses ,consultancy fees, electricity,
security, printing and stationery, printing of securities, repairs and subscriptions.
17. (a) Investment in associates
Group Bank
In millions of Kenya Shillings 2013 2012 2013 2012
Balance as at 1 January 1,457 1,366 1,113 1,260
Share of profit 201 171 - -
Correction of immaterial error - - - (147)
Dividends received (84) (80) - -
Balance as at 31 December 1,574 1,457 1,113 1,113
The bank has total shareholding of 24.85% in Housing Finance. Housing Finance is a banking institution
whose principal activity is provision of mortgage products and is part of the Group’s strategic operations, with
the principle place of business located at Rehani House, Kenyatta Avenue, Nairobi.The group’s share of the
associated assets, liabilities, revenue and profits is as shown below:
Group Bank
In millions of Kenya Shillings 2013 2012 2013 2012
Current assets 9,238 8,905 9,238 8,905
Non-current assets 37,585 31,781 37,585 31,781
Current liabilities 14,477 12,572 14,477 12,572
Non-current liabilities 26,572 22,968 26,572 22,968
Revenue 2,857 2,223 2,857 2,223
Profit after tax 809 687 809 687
Share of profit from associated company 201 171 - -
The share of profit from associated company is from 24.85%, while all the other figures relate to 100% of the
associate’s position and results.
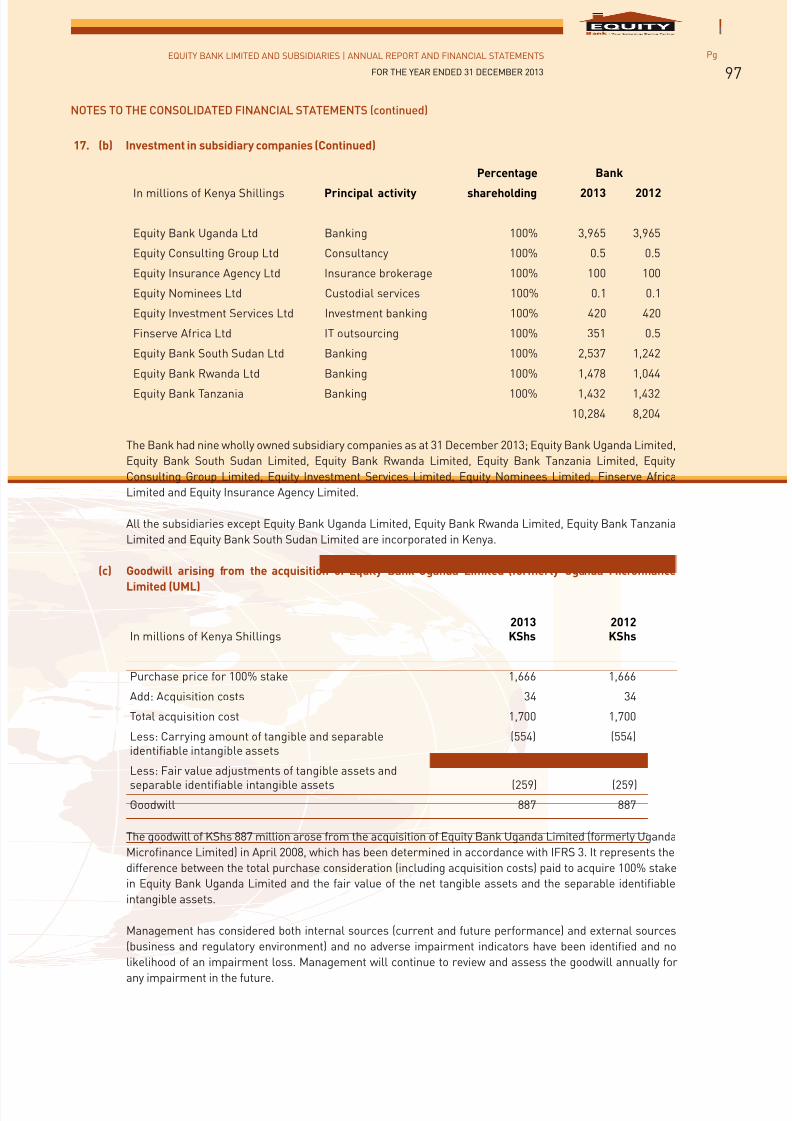
7/21/2019 Equity Bank Group Annual Report 2013
http://slidepdf.com/reader/full/equity-bank-group-annual-report-2013 99/124
EQUITY BANK LIMITED AND SUBSIDIARIES | ANNUAL REPORT AND FINANCIAL STATEMENTS
FOR THE YEAR ENDED 31 DECEMBER 2013
Pg
97
NOTES TO THE CONSOLIDATED FINANCIAL STATEMENTS (continued)
17. (b) Investment in subsidiary companies (Continued)
Principal activity
Percentage Bank
In millions of Kenya Shillings shareholding 2013 2012
Equity Bank Uganda Ltd Banking 100% 3,965 3,965
Equity Consulting Group Ltd Consultancy 100% 0.5 0.5
Equity Insurance Agency Ltd Insurance brokerage 100% 100 100
Equity Nominees Ltd Custodial services 100% 0.1 0.1
Equity Investment Services Ltd Investment banking 100% 420 420
Finserve Africa Ltd IT outsourcing 100% 351 0.5
Equity Bank South Sudan Ltd Banking 100% 2,537 1,242
Equity Bank Rwanda Ltd Banking 100% 1,478 1,044
Equity Bank Tanzania Banking 100% 1,432 1,432
10,284 8,204
The Bank had nine wholly owned subsidiary companies as at 31 December 2013; Equity Bank Uganda Limited,
Equity Bank South Sudan Limited, Equity Bank Rwanda Limited, Equity Bank Tanzania Limited, Equity
Consulting Group Limited, Equity Investment Services Limited, Equity Nominees Limited, Finserve Africa
Limited and Equity Insurance Agency Limited.
All the subsidiaries except Equity Bank Uganda Limited, Equity Bank Rwanda Limited, Equity Bank Tanzania
Limited and Equity Bank South Sudan Limited are incorporated in Kenya.
(c) Goodwill arising from the acquisition of Equity Bank Uganda Limited (formerly Uganda Microfinance
Limited (UML)
In millions of Kenya Shillings2013KShs
2012KShs
Purchase price for 100% stake 1,666 1,666
Add: Acquisition costs 34 34
Total acquisition cost 1,700 1,700
Less: Carrying amount of tangible and separableidentifiable intangible assets
(554) (554)
Less: Fair value adjustments of tangible assets andseparable identifiable intangible assets (259) (259)
Goodwill 887 887
The goodwill of KShs 887 million arose from the acquisition of Equity Bank Uganda Limited (formerly Uganda
Microfinance Limited) in April 2008, which has been determined in accordance with IFRS 3. It represents the
difference between the total purchase consideration (including acquisition costs) paid to acquire 100% stake
in Equity Bank Uganda Limited and the fair value of the net tangible assets and the separable identifiable
intangible assets.
Management has considered both internal sources (current and future performance) and external sources
(business and regulatory environment) and no adverse impairment indicators have been identified and no
likelihood of an impairment loss. Management will continue to review and assess the goodwill annually for
any impairment in the future.
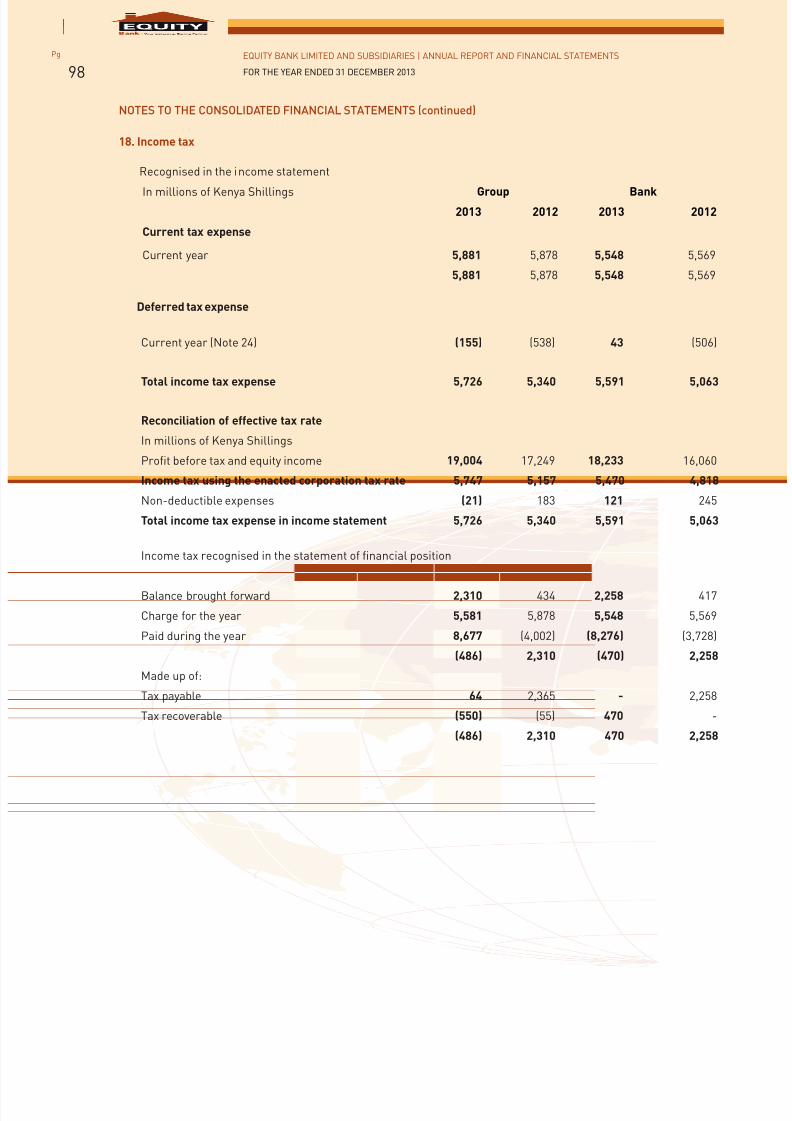
7/21/2019 Equity Bank Group Annual Report 2013
http://slidepdf.com/reader/full/equity-bank-group-annual-report-2013 100/124
EQUITY BANK LIMITED AND SUBSIDIARIES | ANNUAL REPORT AND FINANCIAL STATEMENTS
FOR THE YEAR ENDED 31 DECEMBER 2013
Pg
98
NOTES TO THE CONSOLIDATED FINANCIAL STATEMENTS (continued)
18. Income tax
Recognised in the income statement
In millions of Kenya Shillings Group Bank2013 2012 2013 2012
Current tax expense
Current year 5,881 5,878 5,548 5,569
5,881 5,878 5,548 5,569
Deferred tax expense
Current year (Note 24) (155) (538) 43 (506)
Total income tax expense 5,726 5,340 5,591 5,063
Reconciliation of effective tax rate
In millions of Kenya Shillings
Profit before tax and equity income 19,004 17,249 18,233 16,060
Income tax using the enacted corporation tax rate 5,747 5,157 5,470 4,818
Non-deductible expenses (21) 183 121 245
Total income tax expense in income statement 5,726 5,340 5,591 5,063
Income tax recognised in the statement of financial position
Balance brought forward 2,310 434 2,258 417
Charge for the year 5,581 5,878 5,548 5,569
Paid during the year 8,677 (4,002) (8,276) (3,728)
(486) 2,310 (470) 2,258
Made up of:
Tax payable 64 2,365 - 2,258
Tax recoverable (550) (55) 470 -
(486) 2,310 470 2,258
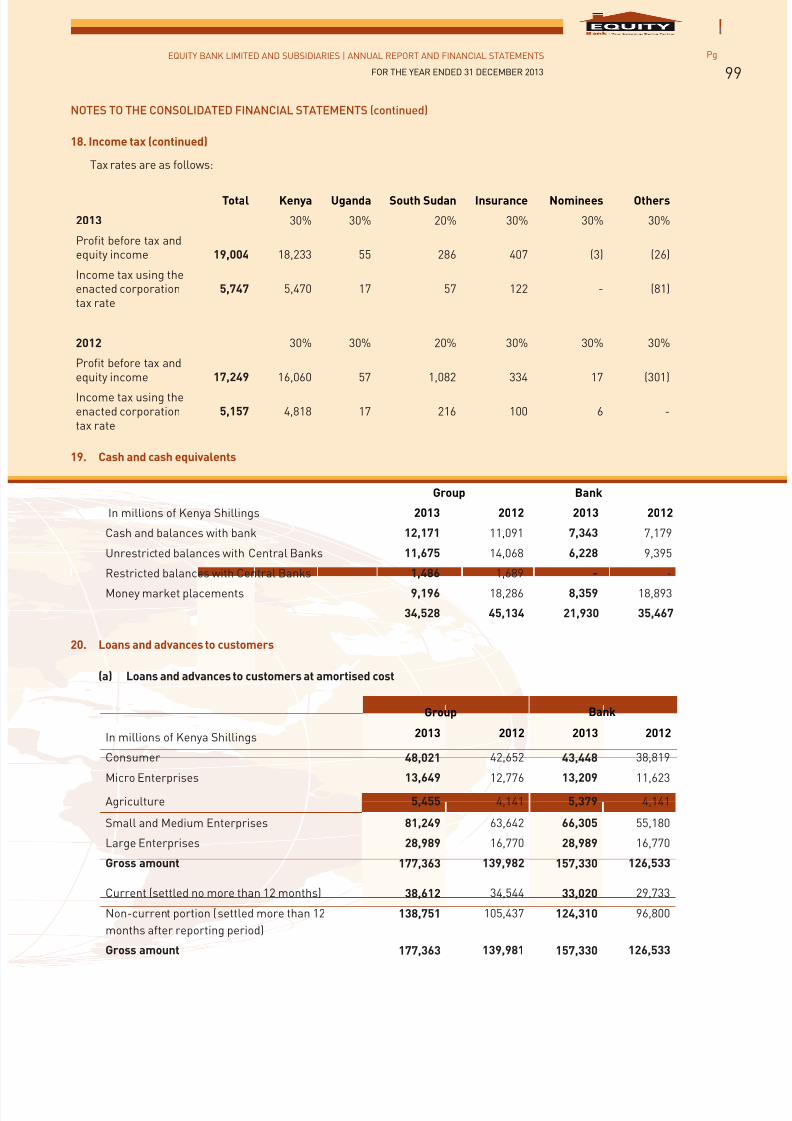
7/21/2019 Equity Bank Group Annual Report 2013
http://slidepdf.com/reader/full/equity-bank-group-annual-report-2013 101/124
EQUITY BANK LIMITED AND SUBSIDIARIES | ANNUAL REPORT AND FINANCIAL STATEMENTS
FOR THE YEAR ENDED 31 DECEMBER 2013
Pg
99
NOTES TO THE CONSOLIDATED FINANCIAL STATEMENTS (continued)
18. Income tax (continued)
Tax rates are as follows:
Total Kenya Uganda South Sudan Insurance Nominees Others
2013 30% 30% 20% 30% 30% 30%
Profit before tax andequity income 19,004 18,233 55 286 407 (3) (26)
Income tax using theenacted corporationtax rate
5,747 5,470 17 57 122 - (81)
2012 30% 30% 20% 30% 30% 30%
Profit before tax andequity income 17,249 16,060 57 1,082 334 17 (301)
Income tax using theenacted corporationtax rate
5,157 4,818 17 216 100 6 -
19. Cash and cash equivalents
Group Bank
In millions of Kenya Shillings 2013 2012 2013 2012
Cash and balances with bank 12,171 11,091 7,343 7,179
Unrestricted balances with Central Banks 11,675 14,068 6,228 9,395
Restricted balances with Central Banks 1,486 1,689 - -
Money market placements 9,196 18,286 8,359 18,893
34,528 45,134 21,930 35,467
20. Loans and advances to customers
(a) Loans and advances to customers at amortised cost
Group Bank
In millions of Kenya Shillings 2013 2012 2013 2012
Consumer 48,021 42,652 43,448 38,819
Micro Enterprises 13,649 12,776 13,209 11,623
Agriculture 5,455 4,141 5,379 4,141
Small and Medium Enterprises 81,249 63,642 66,305 55,180
Large Enterprises 28,989 16,770 28,989 16,770
Gross amount 177,363 139,982 157,330 126,533
Current (settled no more than 12 months) 38,612 34,544 33,020 29,733
Non-current portion (settled more than 12
months after reporting period)
138,751 105,437 124,310 96,800
Gross amount 177,363 139,981 157,330 126,533
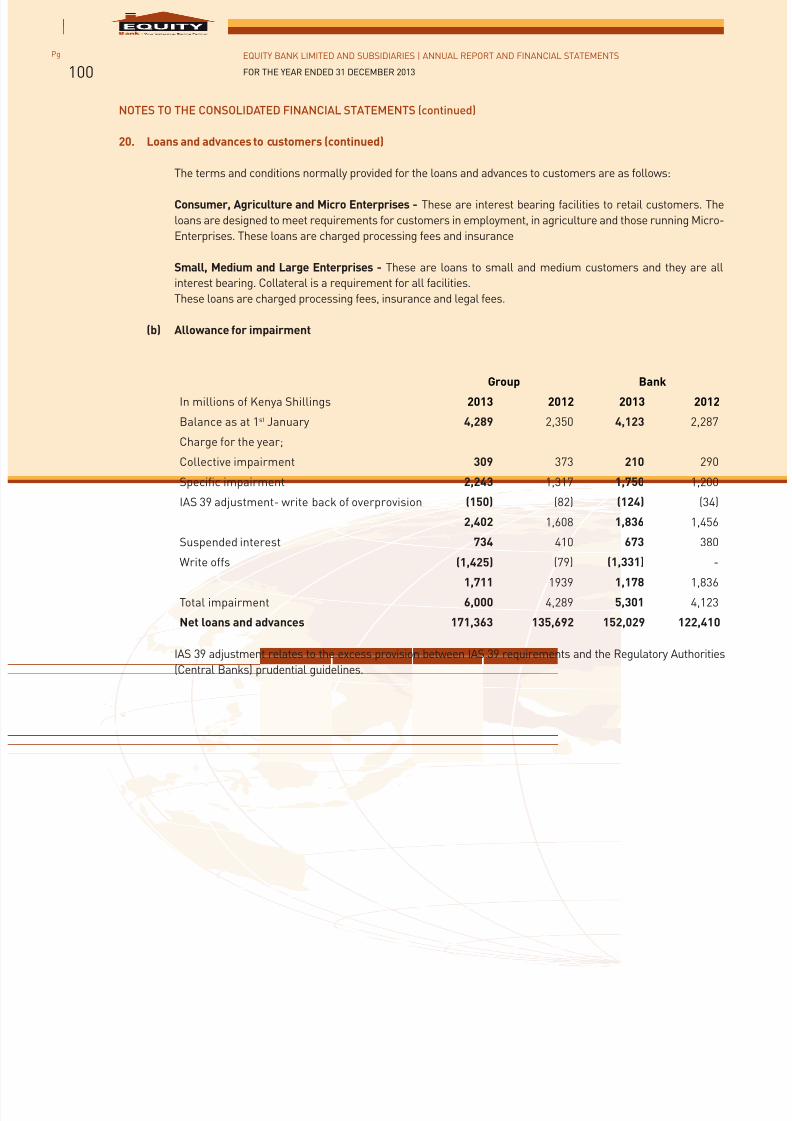
7/21/2019 Equity Bank Group Annual Report 2013
http://slidepdf.com/reader/full/equity-bank-group-annual-report-2013 102/124
EQUITY BANK LIMITED AND SUBSIDIARIES | ANNUAL REPORT AND FINANCIAL STATEMENTS
FOR THE YEAR ENDED 31 DECEMBER 2013
Pg
100
NOTES TO THE CONSOLIDATED FINANCIAL STATEMENTS (continued)
20. Loans and advances to customers (continued)
The terms and conditions normally provided for the loans and advances to customers are as follows:
Consumer, Agriculture and Micro Enterprises - These are interest bearing facilities to retail customers. The
loans are designed to meet requirements for customers in employment, in agriculture and those running Micro-
Enterprises. These loans are charged processing fees and insurance
Small, Medium and Large Enterprises - These are loans to small and medium customers and they are all
interest bearing. Collateral is a requirement for all facilities.
These loans are charged processing fees, insurance and legal fees.
(b) Allowance for impairment
Group Bank
In millions of Kenya Shillings 2013 2012 2013 2012
Balance as at 1st January 4,289 2,350 4,123 2,287
Charge for the year;
Collective impairment 309 373 210 290
Specific impairment 2,243 1,317 1,750 1,200
IAS 39 adjustment- write back of overprovision (150) (82) (124) (34)
2,402 1,608 1,836 1,456
Suspended interest 734 410 673 380
Write offs (1,425) (79) (1,331) -
1,711 1939 1,178 1,836Total impairment 6,000 4,289 5,301 4,123
Net loans and advances 171,363 135,692 152,029 122,410
IAS 39 adjustment relates to the excess provision between IAS 39 requirements and the Regulatory Authorities
(Central Banks) prudential guidelines.
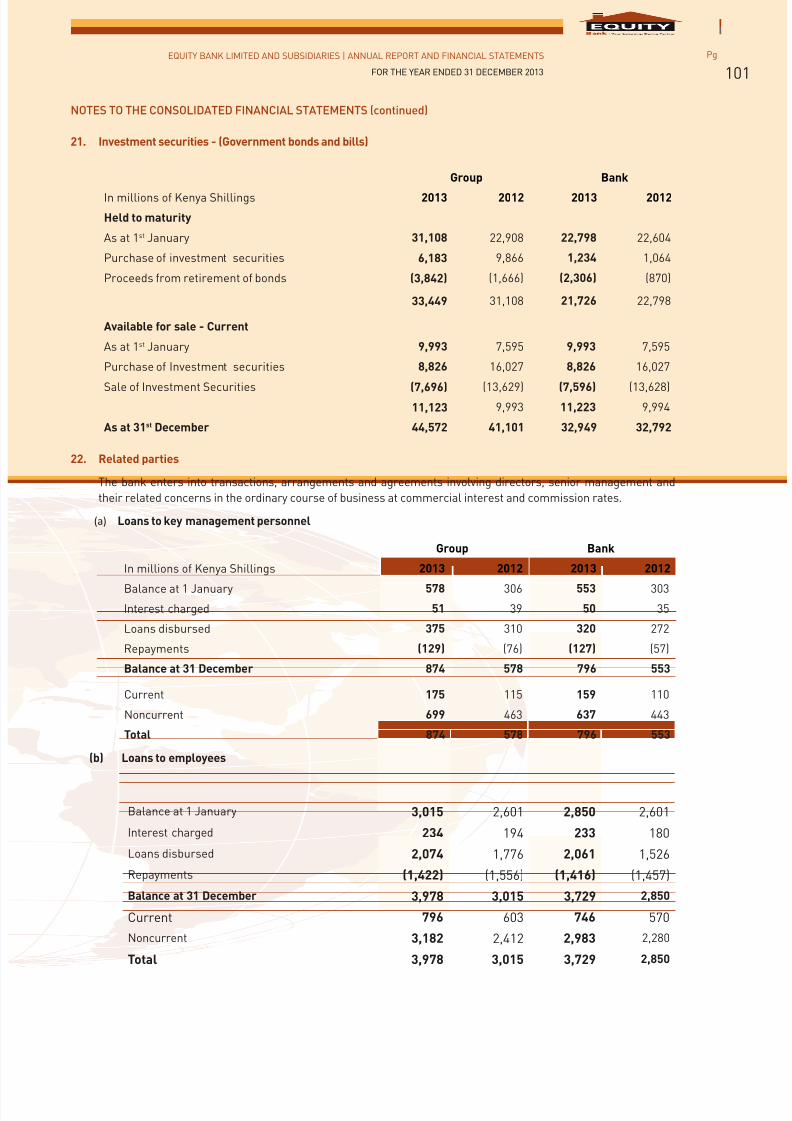
7/21/2019 Equity Bank Group Annual Report 2013
http://slidepdf.com/reader/full/equity-bank-group-annual-report-2013 103/124
EQUITY BANK LIMITED AND SUBSIDIARIES | ANNUAL REPORT AND FINANCIAL STATEMENTS
FOR THE YEAR ENDED 31 DECEMBER 2013
Pg
101
NOTES TO THE CONSOLIDATED FINANCIAL STATEMENTS (continued)
21. Investment securities - (Government bonds and bills)
Group Bank
In millions of Kenya Shillings 2013 2012 2013 2012
Held to maturity
As at 1st January 31,108 22,908 22,798 22,604
Purchase of investment securities 6,183 9,866 1,234 1,064
Proceeds from retirement of bonds (3,842) (1,666) (2,306) (870)
33,449 31,108 21,726 22,798
Available for sale - Current
As at 1st January 9,993 7,595 9,993 7,595
Purchase of Investment securities 8,826 16,027 8,826 16,027
Sale of Investment Securities (7,696) (13,629) (7,596) (13,628)11,123 9,993 11,223 9,994
As at 31st December 44,572 41,101 32,949 32,792
22. Related parties
The bank enters into transactions, arrangements and agreements involving directors, senior management and
their related concerns in the ordinary course of business at commercial interest and commission rates.
(a) Loans to key management personnel
Group Bank
In millions of Kenya Shillings 2013 2012 2013 2012
Balance at 1 January 578 306 553 303
Interest charged 51 39 50 35
Loans disbursed 375 310 320 272
Repayments (129) (76) (127) (57)
Balance at 31 December 874 578 796 553
Current 175 115 159 110
Noncurrent 699 463 637 443
Total 874 578 796 553
(b) Loans to employees
Balance at 1 January 3,015 2,601 2,850 2,601
Interest charged 234 194 233 180
Loans disbursed 2,074 1,776 2,061 1,526
Repayments (1,422) (1,556) (1,416) (1,457)
Balance at 31 December 3,978 3,015 3,729 2,850
Current 796 603 746 570
Noncurrent 3,182 2,412 2,983 2,280
Total 3,978 3,015 3,729 2,850
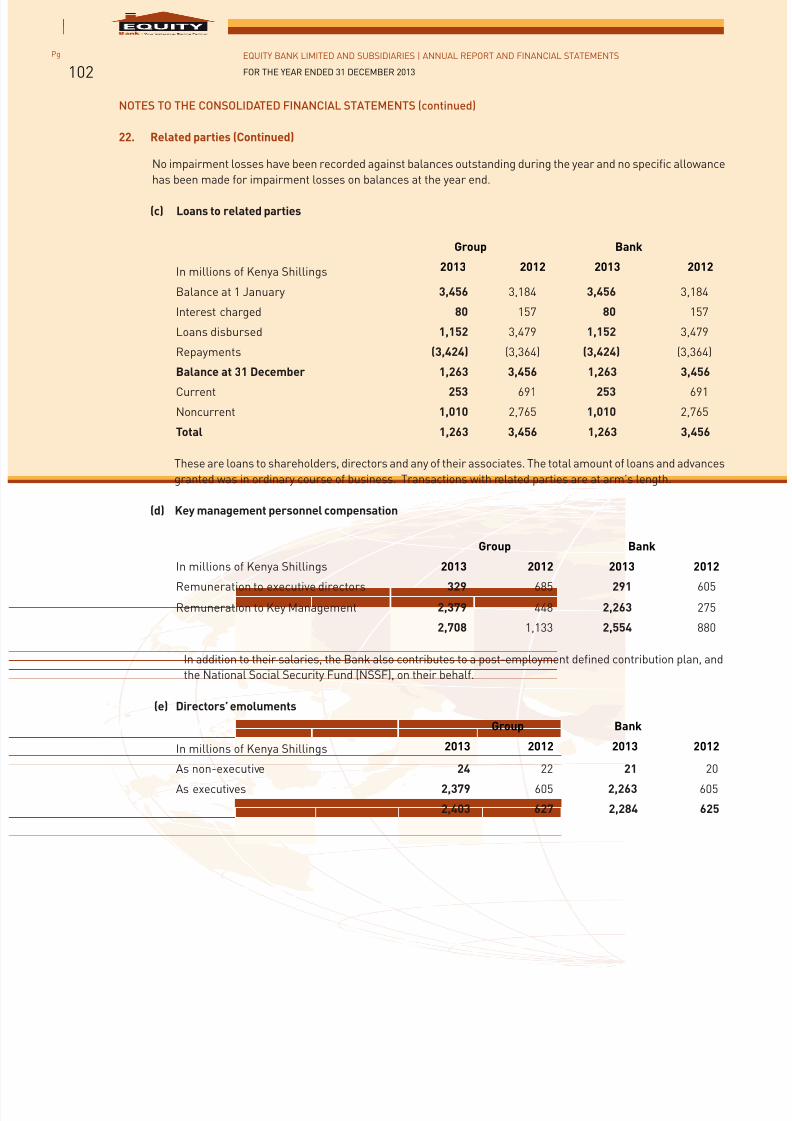
7/21/2019 Equity Bank Group Annual Report 2013
http://slidepdf.com/reader/full/equity-bank-group-annual-report-2013 104/124
EQUITY BANK LIMITED AND SUBSIDIARIES | ANNUAL REPORT AND FINANCIAL STATEMENTS
FOR THE YEAR ENDED 31 DECEMBER 2013
Pg
102
NOTES TO THE CONSOLIDATED FINANCIAL STATEMENTS (continued)
22. Related parties (Continued)
No impairment losses have been recorded against balances outstanding during the year and no specific allowance
has been made for impairment losses on balances at the year end.
(c) Loans to related parties
Group Bank
In millions of Kenya Shillings 2013 2012 2013 2012
Balance at 1 January 3,456 3,184 3,456 3,184
Interest charged 80 157 80 157
Loans disbursed 1,152 3,479 1,152 3,479
Repayments (3,424) (3,364) (3,424) (3,364)
Balance at 31 December 1,263 3,456 1,263 3,456
Current 253 691 253 691
Noncurrent 1,010 2,765 1,010 2,765
Total 1,263 3,456 1,263 3,456
These are loans to shareholders, directors and any of their associates. The total amount of loans and advances
granted was in ordinary course of business. Transactions with related parties are at arm’s length.
(d) Key management personnel compensation
Group Bank
In millions of Kenya Shillings 2013 2012 2013 2012
Remuneration to executive directors
Remuneration to Key Management
329
2,379
685
448
291
2,263
605
275
2,708 1,133 2,554 880
In addition to their salaries, the Bank also contributes to a post-employment defined contribution plan, and
the National Social Security Fund (NSSF), on their behalf.
(e) Directors’ emoluments
Group Bank
In millions of Kenya Shillings 2013 2012 2013 2012
As non-executive 24 22 21 20
As executives 2,379 605 2,263 605
2,403 627 2,284 625
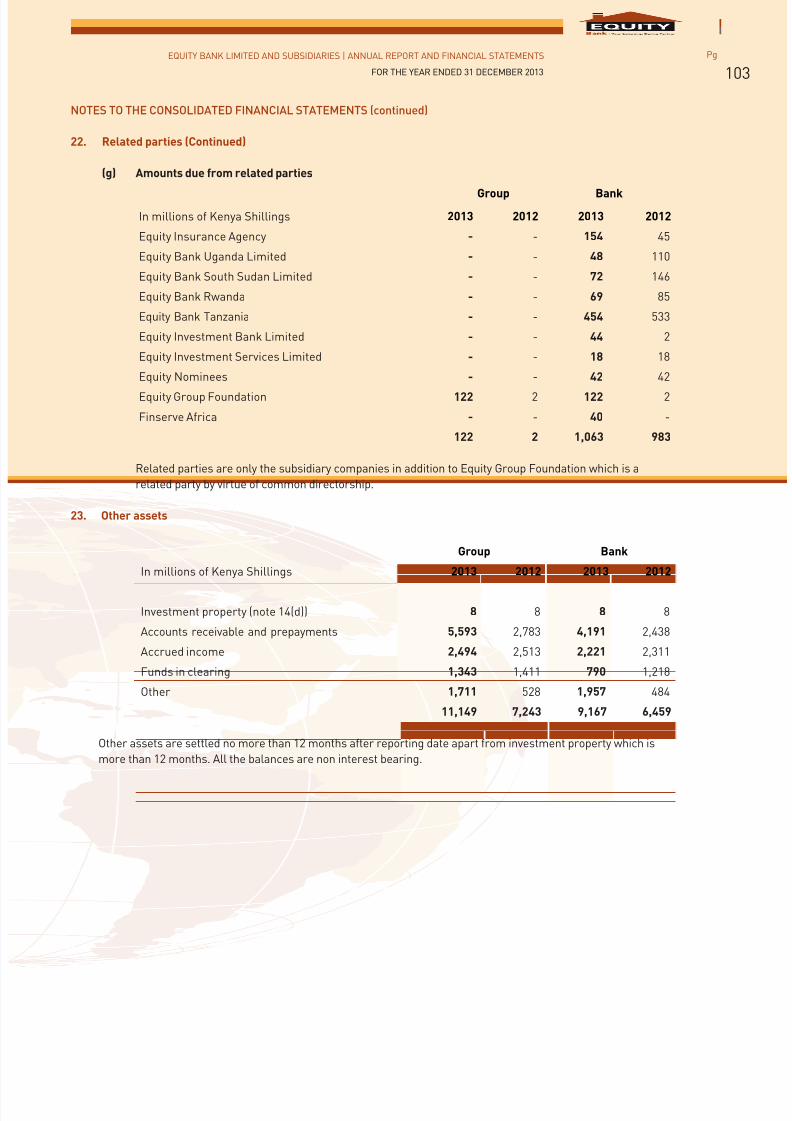
7/21/2019 Equity Bank Group Annual Report 2013
http://slidepdf.com/reader/full/equity-bank-group-annual-report-2013 105/124
EQUITY BANK LIMITED AND SUBSIDIARIES | ANNUAL REPORT AND FINANCIAL STATEMENTS
FOR THE YEAR ENDED 31 DECEMBER 2013
Pg
103
NOTES TO THE CONSOLIDATED FINANCIAL STATEMENTS (continued)
22. Related parties (Continued)
(g) Amounts due from related parties
Group Bank
In millions of Kenya Shillings 2013 2012 2013 2012
Equity Insurance Agency - - 154 45
Equity Bank Uganda Limited - - 48 110
Equity Bank South Sudan Limited - - 72 146
Equity Bank Rwanda - - 69 85
Equity Bank Tanzania - - 454 533
Equity Investment Bank Limited - - 44 2
Equity Investment Services Limited - - 18 18
Equity Nominees - - 42 42
Equity Group Foundation 122 2 122 2
Finserve Africa - - 40 -
122 2 1,063 983
Related parties are only the subsidiary companies in addition to Equity Group Foundation which is a
related party by virtue of common directorship.
23. Other assets
Group Bank
In millions of Kenya Shillings 2013 2012 2013 2012
Investment property (note 14(d)) 8 8 8 8
Accounts receivable and prepayments 5,593 2,783 4,191 2,438
Accrued income 2,494 2,513 2,221 2,311
Funds in clearing 1,343 1,411 790 1,218
Other 1,711 528 1,957 484
11,149 7,243 9,167 6,459
Other assets are settled no more than 12 months after reporting date apart from investment property which is
more than 12 months. All the balances are non interest bearing.
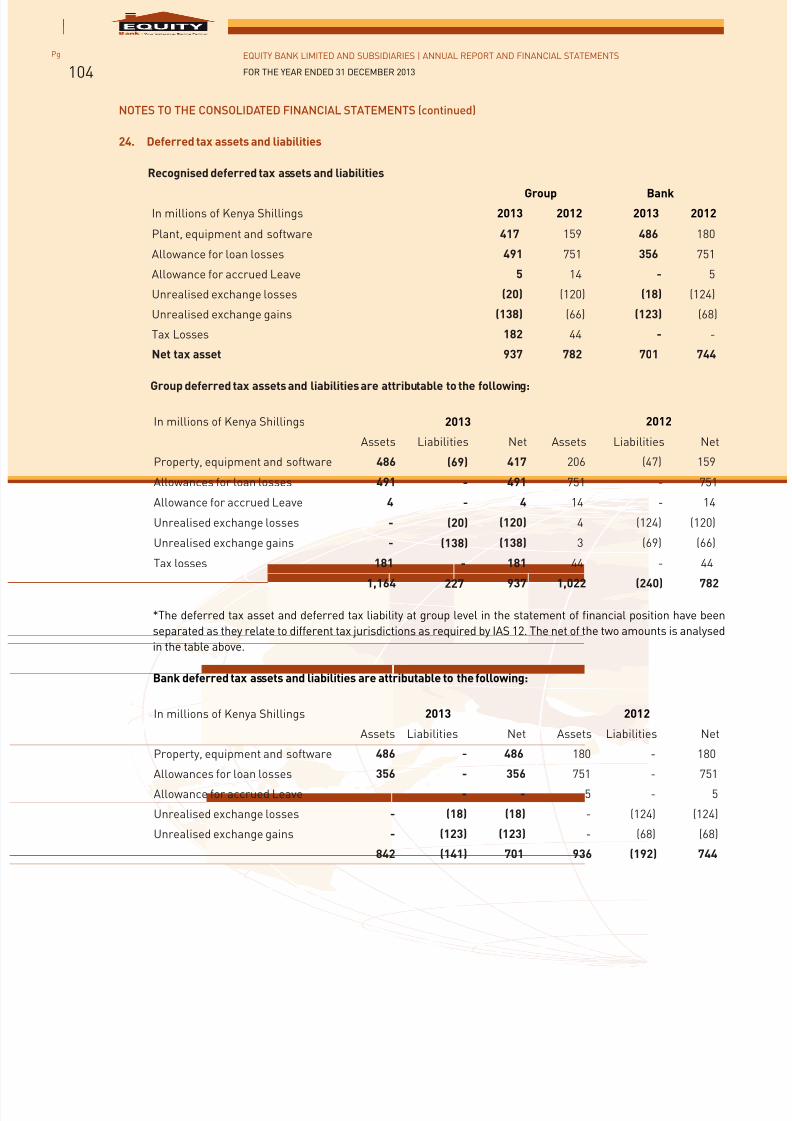
7/21/2019 Equity Bank Group Annual Report 2013
http://slidepdf.com/reader/full/equity-bank-group-annual-report-2013 106/124
EQUITY BANK LIMITED AND SUBSIDIARIES | ANNUAL REPORT AND FINANCIAL STATEMENTS
FOR THE YEAR ENDED 31 DECEMBER 2013
Pg
104
NOTES TO THE CONSOLIDATED FINANCIAL STATEMENTS (continued)
24. Deferred tax assets and liabilities
Recognised deferred tax assets and liabilities
Group BankIn millions of Kenya Shillings 2013 2012 2013 2012
Plant, equipment and software 417 159 486 180
Allowance for loan losses 491 751 356 751
Allowance for accrued Leave 5 14 - 5
Unrealised exchange losses (20) (120) (18) (124)
Unrealised exchange gains (138) (66) (123) (68)
Tax Losses 182 44 - -
Net tax asset 937 782 701 744
Group deferred tax assets and liabilities are attributable to the following:
In millions of Kenya Shillings 2013 2012
Assets Liabilities Net Assets Liabilities Net
Property, equipment and software 486 (69) 417 206 (47) 159
Allowances for loan losses 491 - 491 751 - 751
Allowance for accrued Leave 4 - 4 14 - 14
Unrealised exchange losses - (20) (120) 4 (124) (120)
Unrealised exchange gains - (138) (138) 3 (69) (66)
Tax losses 181 - 181 44 - 44
1,164 227 937 1,022 (240) 782
*The deferred tax asset and deferred tax liability at group level in the statement of financial position have been
separated as they relate to different tax jurisdictions as required by IAS 12. The net of the two amounts is analysed
in the table above.
Bank deferred tax assets and liabilities are attributable to the following:
In millions of Kenya Shillings 2013 2012
Assets Liabilities Net Assets Liabilities Net
Property, equipment and software 486 - 486 180 - 180
Allowances for loan losses 356 - 356 751 - 751Allowance for accrued Leave - - 5 - 5
Unrealised exchange losses - (18) (18) - (124) (124)
Unrealised exchange gains - (123) (123) - (68) (68)
842 (141) 701 936 (192) 744
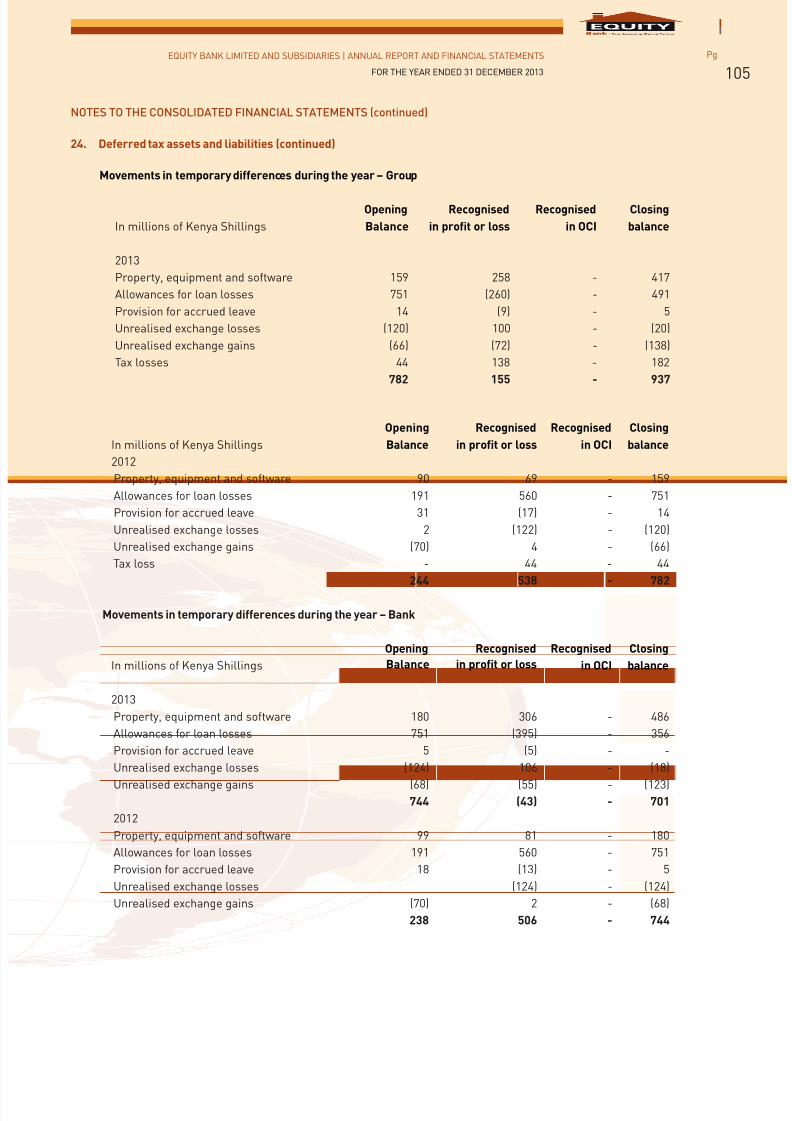
7/21/2019 Equity Bank Group Annual Report 2013
http://slidepdf.com/reader/full/equity-bank-group-annual-report-2013 107/124
EQUITY BANK LIMITED AND SUBSIDIARIES | ANNUAL REPORT AND FINANCIAL STATEMENTS
FOR THE YEAR ENDED 31 DECEMBER 2013
Pg
105
NOTES TO THE CONSOLIDATED FINANCIAL STATEMENTS (continued)
24. Deferred tax assets and liabilities (continued)
Movements in temporary differences during the year – Group
In millions of Kenya Shillings
Opening
Balance
Recognised
in profit or loss
Recognised
in OCI
Closing
balance
2013
Property, equipment and software 159 258 - 417
Allowances for loan losses 751 (260) - 491
Provision for accrued leave 14 (9) - 5
Unrealised exchange losses (120) 100 - (20)
Unrealised exchange gains (66) (72) - (138)
Tax losses 44 138 - 182
782 155 - 937
In millions of Kenya Shillings
Opening
Balance
Recognised
in profit or loss
Recognised
in OCI
Closing
balance
2012
Property, equipment and software 90 69 - 159
Allowances for loan losses 191 560 - 751
Provision for accrued leave 31 (17) - 14
Unrealised exchange losses 2 (122) - (120)
Unrealised exchange gains (70) 4 - (66)
Tax loss - 44 - 44
244 538 - 782
Movements in temporary differences during the year – Bank
In millions of Kenya Shillings
Opening
Balance
Recognised
in profit or loss
Recognised
in OCI
Closing
balance
2013
Property, equipment and software 180 306 - 486
Allowances for loan losses 751 (395) - 356
Provision for accrued leave 5 (5) - -
Unrealised exchange losses (124) 106 - (18)
Unrealised exchange gains (68) (55) - (123)
744 (43) - 701
2012
Property, equipment and software 99 81 - 180
Allowances for loan losses 191 560 - 751
Provision for accrued leave 18 (13) - 5
Unrealised exchange losses (124) - (124)
Unrealised exchange gains (70) 2 - (68)
238 506 - 744
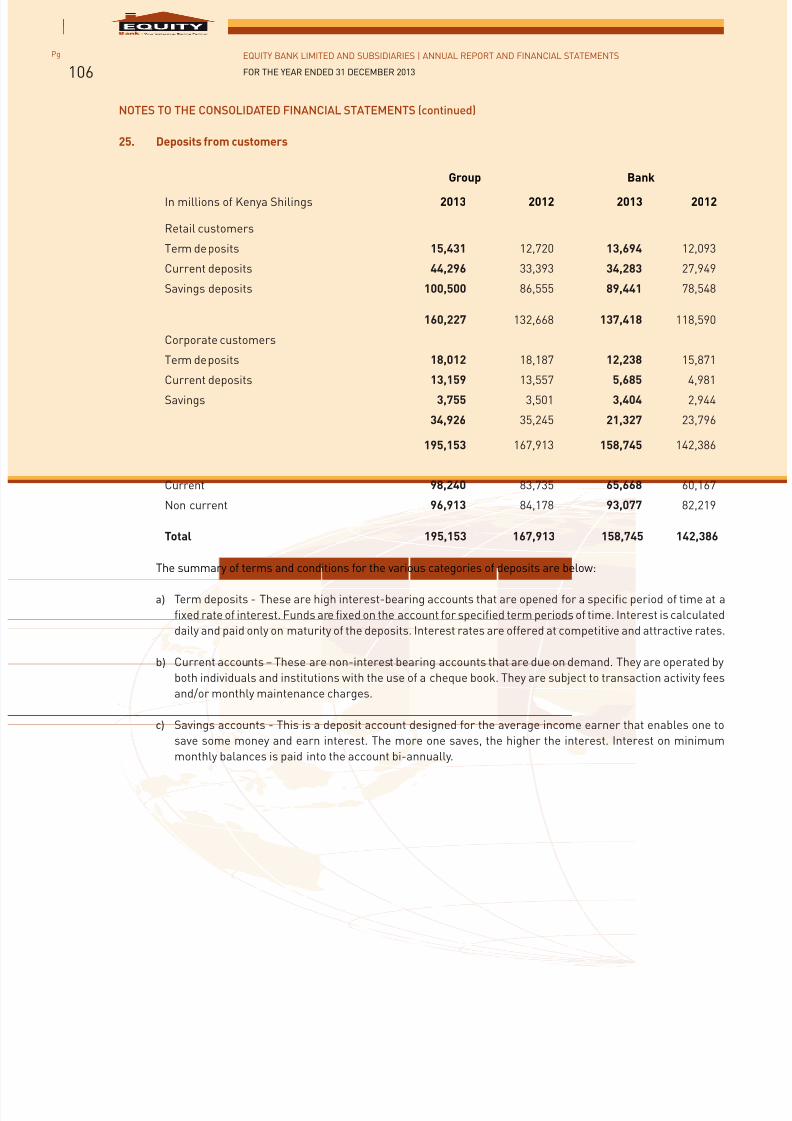
7/21/2019 Equity Bank Group Annual Report 2013
http://slidepdf.com/reader/full/equity-bank-group-annual-report-2013 108/124
EQUITY BANK LIMITED AND SUBSIDIARIES | ANNUAL REPORT AND FINANCIAL STATEMENTS
FOR THE YEAR ENDED 31 DECEMBER 2013
Pg
106
NOTES TO THE CONSOLIDATED FINANCIAL STATEMENTS (continued)
25. Deposits from customers
Group Bank
In millions of Kenya Shilings 2013 2012 2013 2012
Retail customers
Term deposits 15,431 12,720 13,694 12,093
Current deposits 44,296 33,393 34,283 27,949
Savings deposits 100,500 86,555 89,441 78,548
160,227 132,668 137,418 118,590
Corporate customers
Term deposits 18,012 18,187 12,238 15,871
Current deposits 13,159 13,557 5,685 4,981
Savings 3,755 3,501 3,404 2,944
34,926 35,245 21,327 23,796
195,153 167,913 158,745 142,386
Current 98,240 83,735 65,668 60,167
Non current 96,913 84,178 93,077 82,219
Total 195,153 167,913 158,745 142,386
The summary of terms and conditions for the various categories of deposits are below:
a) Term deposits - These are high interest-bearing accounts that are opened for a specific period of time at a
fixed rate of interest. Funds are fixed on the account for specified term periods of time. Interest is calculated
daily and paid only on maturity of the deposits. Interest rates are offered at competitive and attractive rates.
b) Current accounts – These are non-interest bearing accounts that are due on demand. They are operated by
both individuals and institutions with the use of a cheque book. They are subject to transaction activity fees
and/or monthly maintenance charges.
c) Savings accounts - This is a deposit account designed for the average income earner that enables one to
save some money and earn interest. The more one saves, the higher the interest. Interest on minimum
monthly balances is paid into the account bi-annually.
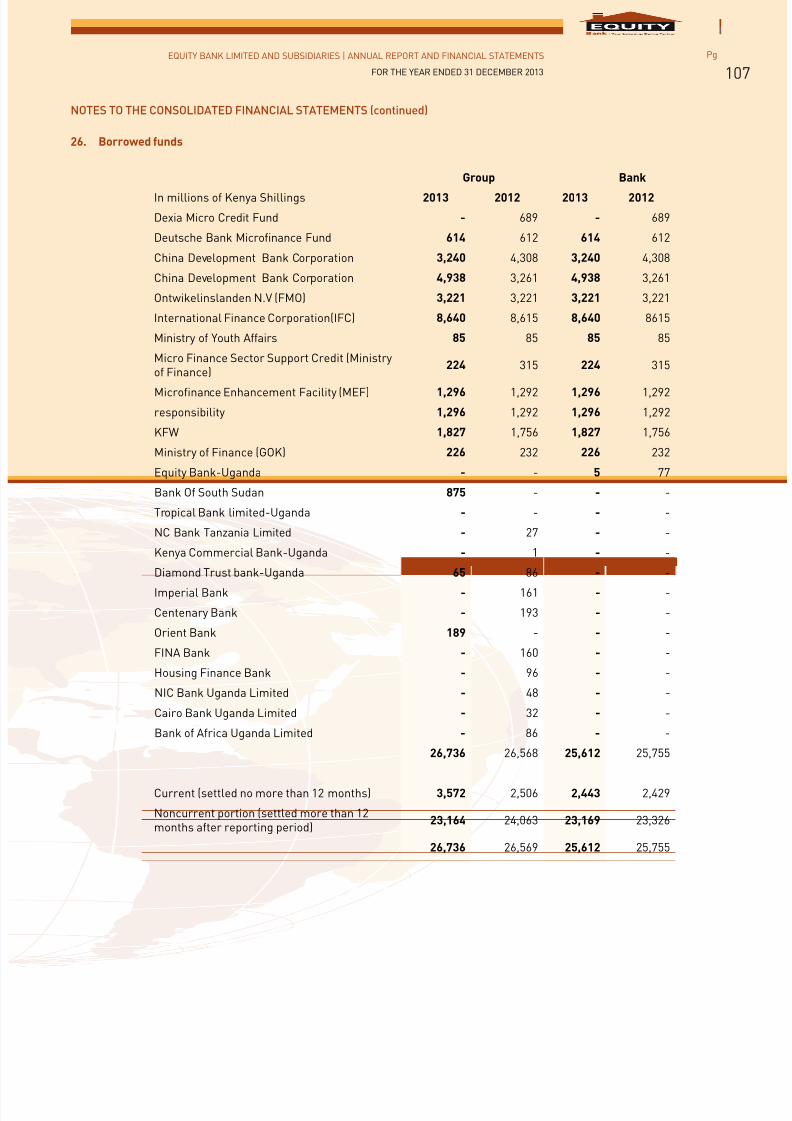
7/21/2019 Equity Bank Group Annual Report 2013
http://slidepdf.com/reader/full/equity-bank-group-annual-report-2013 109/124
EQUITY BANK LIMITED AND SUBSIDIARIES | ANNUAL REPORT AND FINANCIAL STATEMENTS
FOR THE YEAR ENDED 31 DECEMBER 2013
Pg
107
NOTES TO THE CONSOLIDATED FINANCIAL STATEMENTS (continued)
26. Borrowed funds
Group Bank
In millions of Kenya Shillings 2013 2012 2013 2012
Dexia Micro Credit Fund - 689 - 689
Deutsche Bank Microfinance Fund 614 612 614 612
China Development Bank Corporation 3,240 4,308 3,240 4,308
China Development Bank Corporation 4,938 3,261 4,938 3,261
Ontwikelinslanden N.V (FMO) 3,221 3,221 3,221 3,221
International Finance Corporation(IFC) 8,640 8,615 8,640 8615
Ministry of Youth Affairs 85 85 85 85
Micro Finance Sector Support Credit (Ministryof Finance)
224 315 224 315
Microfinance Enhancement Facility (MEF) 1,296 1,292 1,296 1,292
responsibility 1,296 1,292 1,296 1,292
KFW 1,827 1,756 1,827 1,756
Ministry of Finance (GOK) 226 232 226 232
Equity Bank-Uganda - - 5 77
Bank Of South Sudan 875 - - -
Tropical Bank limited-Uganda - - - -
NC Bank Tanzania Limited - 27 - -
Kenya Commercial Bank-Uganda - 1 - -
Diamond Trust bank-Uganda 65 86 - -
Imperial Bank - 161 - -
Centenary Bank - 193 - -
Orient Bank 189 - - -
FINA Bank - 160 - -
Housing Finance Bank - 96 - -
NIC Bank Uganda Limited - 48 - -
Cairo Bank Uganda Limited - 32 - -
Bank of Africa Uganda Limited - 86 - -
26,736 26,568 25,612 25,755
Current (settled no more than 12 months) 3,572 2,506 2,443 2,429
Noncurrent portion (settled more than 12months after reporting period)
23,164 24,063 23,169 23,326
26,736 26,569 25,612 25,755
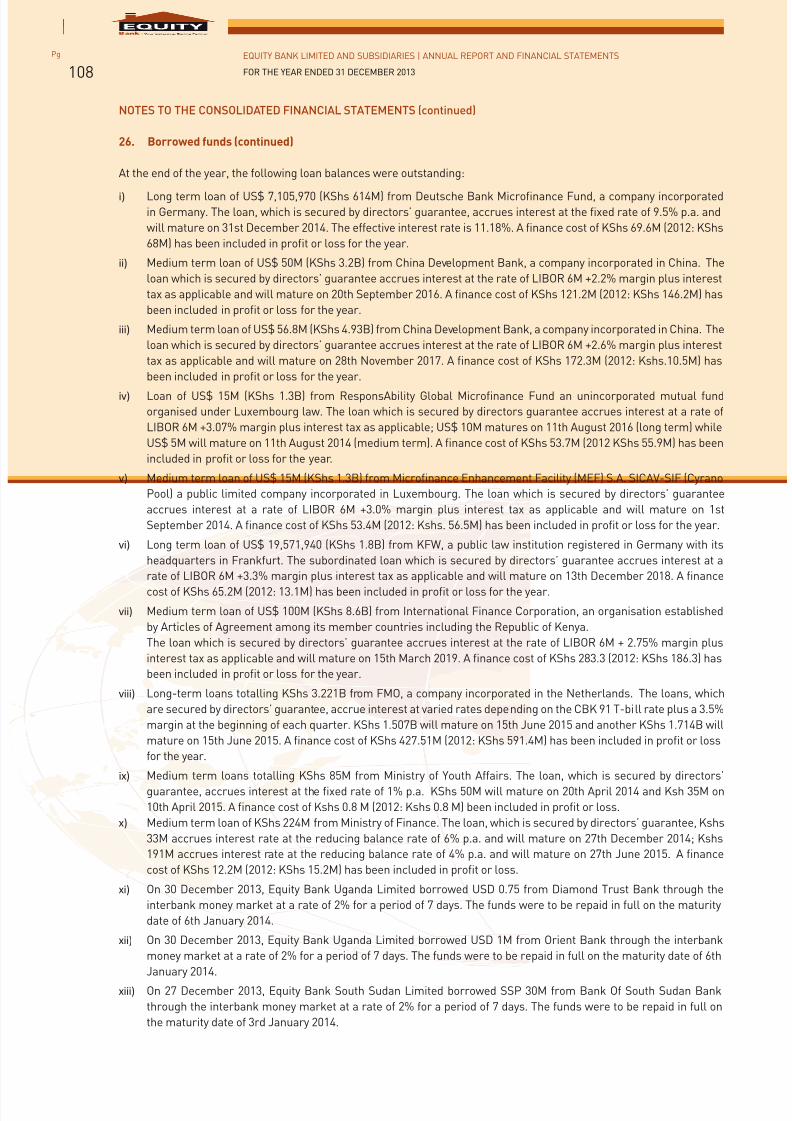
7/21/2019 Equity Bank Group Annual Report 2013
http://slidepdf.com/reader/full/equity-bank-group-annual-report-2013 110/124
EQUITY BANK LIMITED AND SUBSIDIARIES | ANNUAL REPORT AND FINANCIAL STATEMENTS
FOR THE YEAR ENDED 31 DECEMBER 2013
Pg
108
NOTES TO THE CONSOLIDATED FINANCIAL STATEMENTS (continued)
26. Borrowed funds (continued)
At the end of the year, the following loan balances were outstanding:
i) Long term loan of US$ 7,105,970 (KShs 614M) from Deutsche Bank Microfinance Fund, a company incorporatedin Germany. The loan, which is secured by directors’ guarantee, accrues interest at the fixed rate of 9.5% p.a. and
will mature on 31st December 2014. The effective interest rate is 11.18%. A finance cost of KShs 69.6M (2012: KShs
68M) has been included in profit or loss for the year.
ii) Medium term loan of US$ 50M (KShs 3.2B) from China Development Bank, a company incorporated in China. The
loan which is secured by directors’ guarantee accrues interest at the rate of LIBOR 6M +2.2% margin plus interest
tax as applicable and will mature on 20th September 2016. A finance cost of KShs 121.2M (2012: KShs 146.2M) has
been included in profit or loss for the year.
iii) Medium term loan of US$ 56.8M (KShs 4.93B) from China Development Bank, a company incorporated in China. The
loan which is secured by directors’ guarantee accrues interest at the rate of LIBOR 6M +2.6% margin plus interest
tax as applicable and will mature on 28th November 2017. A finance cost of KShs 172.3M (2012: Kshs.10.5M) has
been included in profit or loss for the year.
iv) Loan of US$ 15M (KShs 1.3B) from ResponsAbility Global Microfinance Fund an unincorporated mutual fund
organised under Luxembourg law. The loan which is secured by directors guarantee accrues interest at a rate of
LIBOR 6M +3.07% margin plus interest tax as applicable; US$ 10M matures on 11th August 2016 (long term) while
US$ 5M will mature on 11th August 2014 (medium term). A finance cost of KShs 53.7M (2012 KShs 55.9M) has been
included in profit or loss for the year.
v) Medium term loan of US$ 15M (KShs 1.3B) from Microfinance Enhancement Facility (MEF) S.A. SICAV-SIF (Cyrano
Pool) a public limited company incorporated in Luxembourg. The loan which is secured by directors’ guarantee
accrues interest at a rate of LIBOR 6M +3.0% margin plus interest tax as applicable and will mature on 1st
September 2014. A finance cost of KShs 53.4M (2012: Kshs. 56.5M) has been included in profit or loss for the year.
vi) Long term loan of US$ 19,571,940 (KShs 1.8B) from KFW, a public law institution registered in Germany with its
headquarters in Frankfurt. The subordinated loan which is secured by directors’ guarantee accrues interest at a
rate of LIBOR 6M +3.3% margin plus interest tax as applicable and will mature on 13th December 2018. A finance
cost of KShs 65.2M (2012: 13.1M) has been included in profit or loss for the year.
vii) Medium term loan of US$ 100M (KShs 8.6B) from International Finance Corporation, an organisation established
by Articles of Agreement among its member countries including the Republic of Kenya.
The loan which is secured by directors’ guarantee accrues interest at the rate of LIBOR 6M + 2.75% margin plus
interest tax as applicable and will mature on 15th March 2019. A finance cost of KShs 283.3 (2012: KShs 186.3) has
been included in profit or loss for the year.
viii) Long-term loans totalling KShs 3.221B from FMO, a company incorporated in the Netherlands. The loans, which
are secured by directors’ guarantee, accrue interest at varied rates depending on the CBK 91 T-bill rate plus a 3.5%
margin at the beginning of each quarter. KShs 1.507B will mature on 15th June 2015 and another KShs 1.714B will
mature on 15th June 2015. A finance cost of KShs 427.51M (2012: KShs 591.4M) has been included in profit or loss
for the year.
ix) Medium term loans totalling KShs 85M from Ministry of Youth Affairs. The loan, which is secured by directors’guarantee, accrues interest at the fixed rate of 1% p.a. KShs 50M will mature on 20th April 2014 and Ksh 35M on
10th April 2015. A finance cost of Kshs 0.8 M (2012: Kshs 0.8 M) been included in profit or loss.
x) Medium term loan of KShs 224M from Ministry of Finance. The loan, which is secured by directors’ guarantee, Kshs
33M accrues interest rate at the reducing balance rate of 6% p.a. and will mature on 27th December 2014; Kshs
191M accrues interest rate at the reducing balance rate of 4% p.a. and will mature on 27th June 2015. A finance
cost of KShs 12.2M (2012: KShs 15.2M) has been included in profit or loss.
xi) On 30 December 2013, Equity Bank Uganda Limited borrowed USD 0.75 from Diamond Trust Bank through the
interbank money market at a rate of 2% for a period of 7 days. The funds were to be repaid in full on the maturity
date of 6th January 2014.
xii) On 30 December 2013, Equity Bank Uganda Limited borrowed USD 1M from Orient Bank through the interbank
money market at a rate of 2% for a period of 7 days. The funds were to be repaid in full on the maturity date of 6th
January 2014.xiii) On 27 December 2013, Equity Bank South Sudan Limited borrowed SSP 30M from Bank Of South Sudan Bank
through the interbank money market at a rate of 2% for a period of 7 days. The funds were to be repaid in full on
the maturity date of 3rd January 2014.

7/21/2019 Equity Bank Group Annual Report 2013
http://slidepdf.com/reader/full/equity-bank-group-annual-report-2013 111/124
EQUITY BANK LIMITED AND SUBSIDIARIES | ANNUAL REPORT AND FINANCIAL STATEMENTS
FOR THE YEAR ENDED 31 DECEMBER 2013
Pg
109
NOTES TO THE CONSOLIDATED FINANCIAL STATEMENTS (continued)
27. Other liabilities
Group Bank
In millions of Kenya Shillings 2013 2012 2013 2012
Short term employee benefits 12 21 - -
Creditors and accruals 803 1,160 188 766
Other * 3,404 2,188 2,963 1,993
4,219 3,369 3,151 2,759
Current 4,192 3,312 3,124 2,701
Non-current 27 57 27 58
4,219 3,369 3,151 2,759
* Other liabilities relate to accruals made as at year end.
28. Share capital and reserves
Group Bank
2013 2012 2013 2012
(a) Authorised
Issued and fully paid 3,702,777,020
Ordinary shares of KShs 0.5 1,851 1,851 1,851 1,851
Movement in ordinary shares
Group Bank
In millions 2013 2012 2013 2012
On issue at 1st January 3,703 3,703 3,703 3,703
On issue at 31 December 3,703 3,703 3,703 3,703
As at 31 December 2013 the authorised share capital comprised of 3.7 billion ordinary shares (2012: 3.7
billion), with a par value of KShs 0.5. All issued shares are fully paid.
The shareholders of ordinary shares are entitled to receive dividends as declared from time to time and are
entitled to one vote per share at meetings of the Bank.
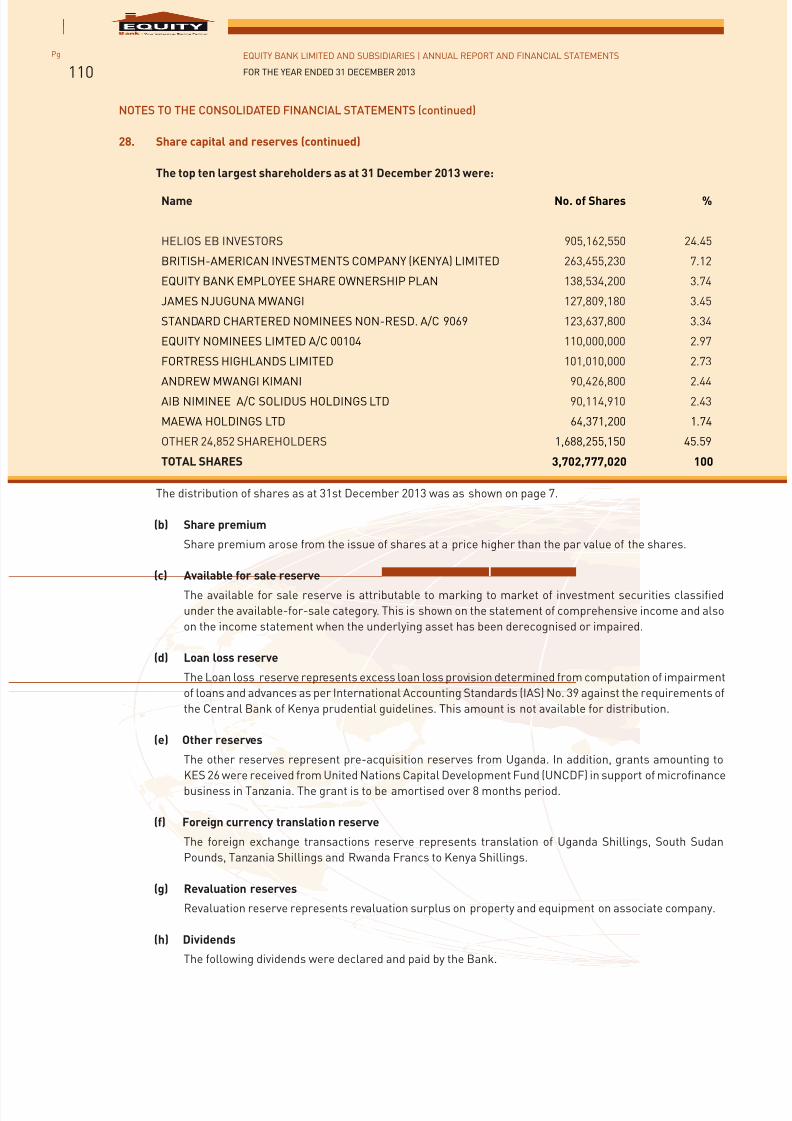
7/21/2019 Equity Bank Group Annual Report 2013
http://slidepdf.com/reader/full/equity-bank-group-annual-report-2013 112/124
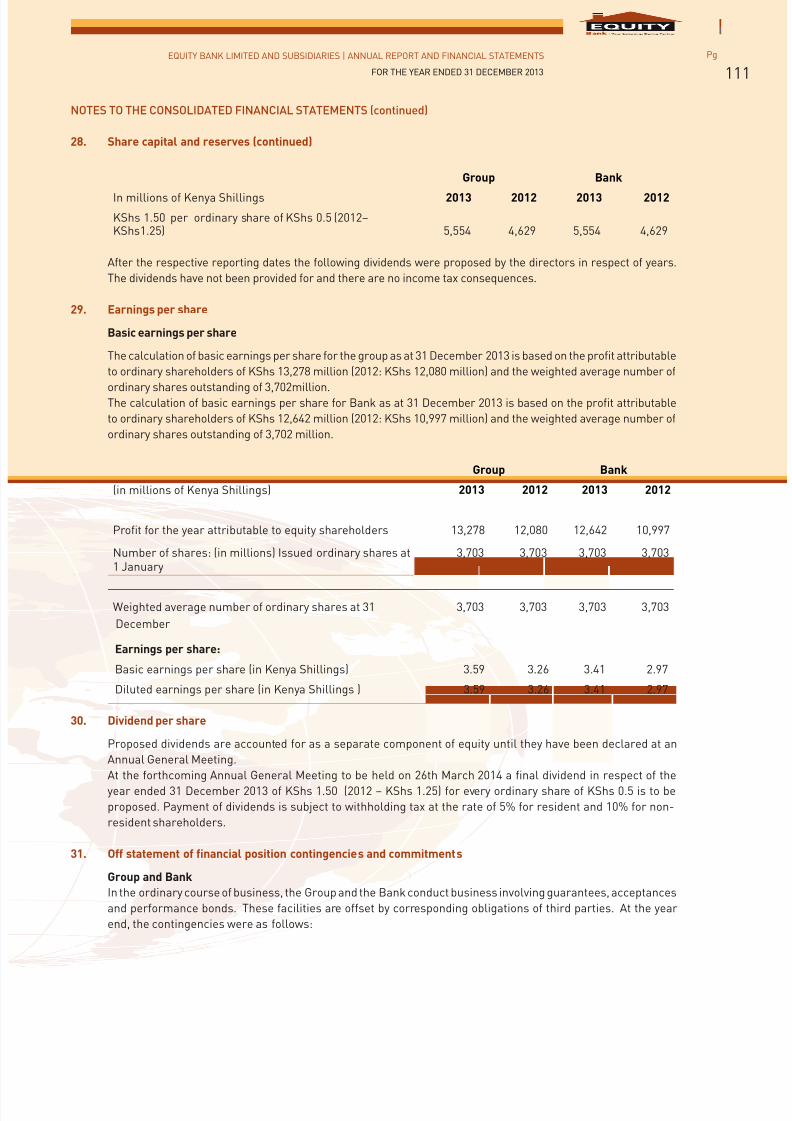
7/21/2019 Equity Bank Group Annual Report 2013
http://slidepdf.com/reader/full/equity-bank-group-annual-report-2013 113/124
EQUITY BANK LIMITED AND SUBSIDIARIES | ANNUAL REPORT AND FINANCIAL STATEMENTS
FOR THE YEAR ENDED 31 DECEMBER 2013
Pg
111
NOTES TO THE CONSOLIDATED FINANCIAL STATEMENTS (continued)
28. Share capital and reserves (continued)
Group Bank
In millions of Kenya Shillings 2013 2012 2013 2012
KShs 1.50 per ordinary share of KShs 0.5 (2012–KShs1.25) 5,554 4,629 5,554 4,629
After the respective reporting dates the following dividends were proposed by the directors in respect of years.
The dividends have not been provided for and there are no income tax consequences.
29. Earnings per share
Basic earnings per share
The calculation of basic earnings per share for the group as at 31 December 2013 is based on the profit attributable
to ordinary shareholders of KShs 13,278 million (2012: KShs 12,080 million) and the weighted average number of
ordinary shares outstanding of 3,702million.The calculation of basic earnings per share for Bank as at 31 December 2013 is based on the profit attributable
to ordinary shareholders of KShs 12,642 million (2012: KShs 10,997 million) and the weighted average number of
ordinary shares outstanding of 3,702 million.
Group Bank
(in millions of Kenya Shillings) 2013 2012 2013 2012
Profit for the year attributable to equity shareholders 13,278 12,080 12,642 10,997
Number of shares: (in millions) Issued ordinary shares at1 January
3,703 3,703 3,703 3,703
Weighted average number of ordinary shares at 31
December
3,703 3,703 3,703 3,703
Earnings per share:
Basic earnings per share (in Kenya Shillings) 3.59 3.26 3.41 2.97
Diluted earnings per share (in Kenya Shillings ) 3.59 3.26 3.41 2.97
30. Dividend per share
Proposed dividends are accounted for as a separate component of equity until they have been declared at an
Annual General Meeting.
At the forthcoming Annual General Meeting to be held on 26th March 2014 a final dividend in respect of theyear ended 31 December 2013 of KShs 1.50 (2012 – KShs 1.25) for every ordinary share of KShs 0.5 is to be
proposed. Payment of dividends is subject to withholding tax at the rate of 5% for resident and 10% for non-
resident shareholders.
31. Off statement of financial position contingencies and commitments
Group and Bank
In the ordinary course of business, the Group and the Bank conduct business involving guarantees, acceptances
and performance bonds. These facilities are offset by corresponding obligations of third parties. At the year
end, the contingencies were as follows:
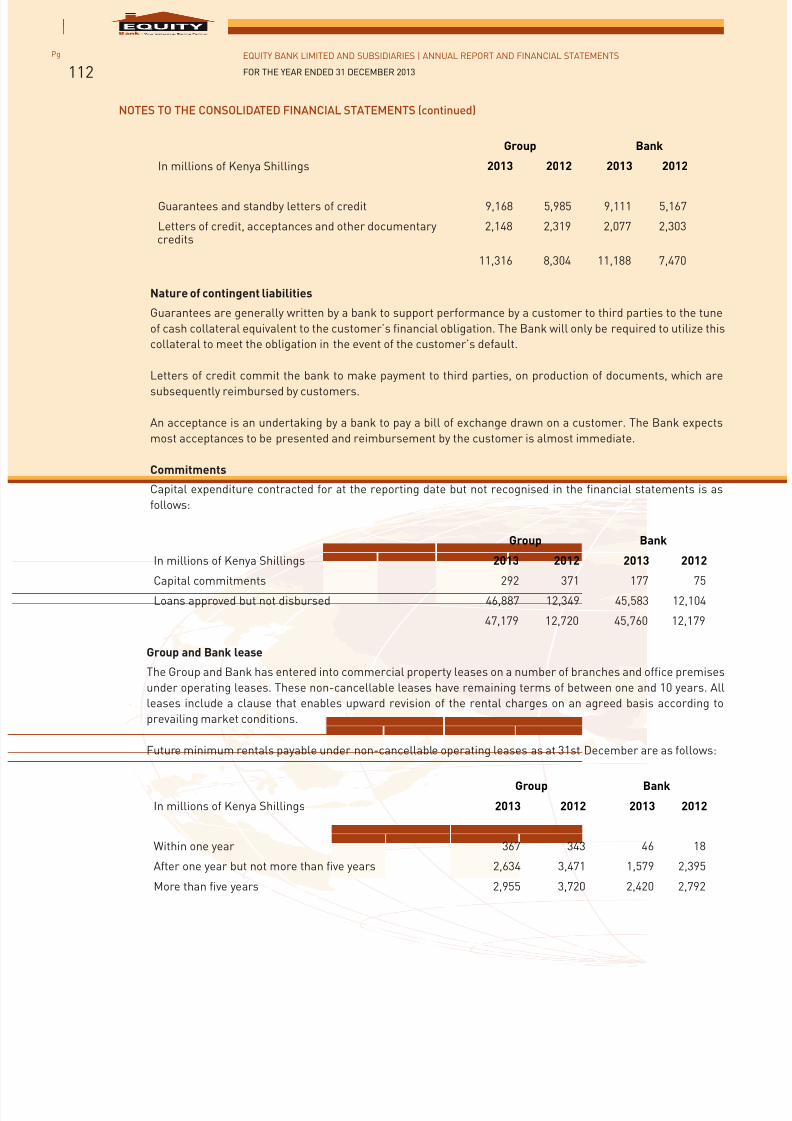
7/21/2019 Equity Bank Group Annual Report 2013
http://slidepdf.com/reader/full/equity-bank-group-annual-report-2013 114/124
EQUITY BANK LIMITED AND SUBSIDIARIES | ANNUAL REPORT AND FINANCIAL STATEMENTS
FOR THE YEAR ENDED 31 DECEMBER 2013
Pg
112
NOTES TO THE CONSOLIDATED FINANCIAL STATEMENTS (continued)
Group Bank
In millions of Kenya Shillings 2013 2012 2013 2012
Guarantees and standby letters of credit 9,168 5,985 9,111 5,167
Letters of credit, acceptances and other documentarycredits
2,148 2,319 2,077 2,303
11,316 8,304 11,188 7,470
Nature of contingent liabilities
Guarantees are generally written by a bank to support performance by a customer to third parties to the tune
of cash collateral equivalent to the customer’s financial obligation. The Bank will only be required to utilize this
collateral to meet the obligation in the event of the customer’s default.
Letters of credit commit the bank to make payment to third parties, on production of documents, which are
subsequently reimbursed by customers.
An acceptance is an undertaking by a bank to pay a bill of exchange drawn on a customer. The Bank expects
most acceptances to be presented and reimbursement by the customer is almost immediate.
Commitments
Capital expenditure contracted for at the reporting date but not recognised in the financial statements is as
follows:
Group Bank
In millions of Kenya Shillings 2013 2012 2013 2012
Capital commitments 292 371 177 75Loans approved but not disbursed 46,887 12,349 45,583 12,104
47,179 12,720 45,760 12,179
Group and Bank lease
The Group and Bank has entered into commercial property leases on a number of branches and office premises
under operating leases. These non-cancellable leases have remaining terms of between one and 10 years. All
leases include a clause that enables upward revision of the rental charges on an agreed basis according to
prevailing market conditions.
Future minimum rentals payable under non-cancellable operating leases as at 31st December are as follows:
Group Bank
In millions of Kenya Shillings 2013 2012 2013 2012
Within one year 367 343 46 18
After one year but not more than five years 2,634 3,471 1,579 2,395
More than five years 2,955 3,720 2,420 2,792
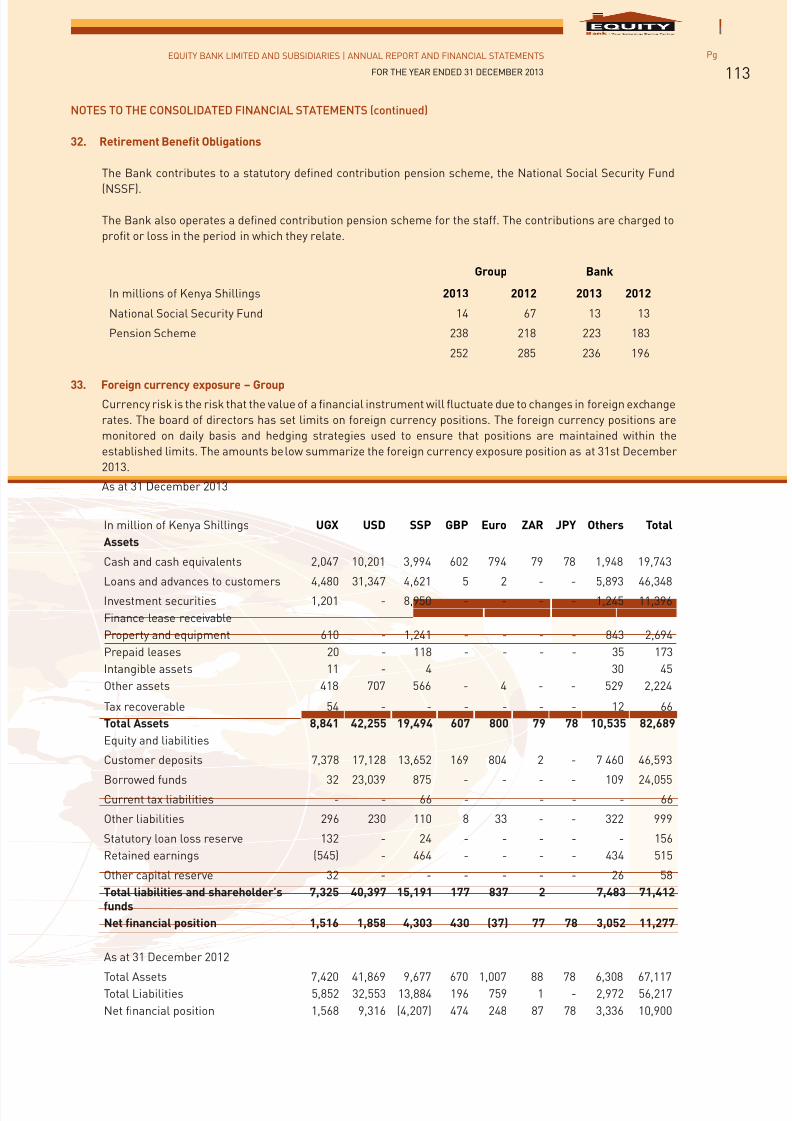
7/21/2019 Equity Bank Group Annual Report 2013
http://slidepdf.com/reader/full/equity-bank-group-annual-report-2013 115/124
EQUITY BANK LIMITED AND SUBSIDIARIES | ANNUAL REPORT AND FINANCIAL STATEMENTS
FOR THE YEAR ENDED 31 DECEMBER 2013
Pg
113
NOTES TO THE CONSOLIDATED FINANCIAL STATEMENTS (continued)
32. Retirement Benefit Obligations
The Bank contributes to a statutory defined contribution pension scheme, the National Social Security Fund
(NSSF).
The Bank also operates a defined contribution pension scheme for the staff. The contributions are charged to
profit or loss in the period in which they relate.
Group Bank
In millions of Kenya Shillings 2013 2012 2013 2012
National Social Security Fund
Pension Scheme
14
238
67
218
13
223
13
183
252 285 236 196
33. Foreign currency exposure – GroupCurrency risk is the risk that the value of a financial instrument will fluctuate due to changes in foreign exchange
rates. The board of directors has set limits on foreign currency positions. The foreign currency positions are
monitored on daily basis and hedging strategies used to ensure that positions are maintained within the
established limits. The amounts below summarize the foreign currency exposure position as at 31st December
2013.
As at 31 December 2013
In million of Kenya Shillings UGX USD SSP GBP Euro ZAR JPY Others Total
Assets
Cash and cash equivalents 2,047 10,201 3,994 602 794 79 78 1,948 19,743
Loans and advances to customers 4,480 31,347 4,621 5 2 - - 5,893 46,348Investment securities 1,201 - 8,950 - - - - 1,245 11,396
Finance lease receivable
Property and equipment 610 - 1,241 - - - - 843 2,694
Prepaid leases 20 - 118 - - - - 35 173
Intangible assets 11 - 4 30 45
Other assets 418 707 566 - 4 - - 529 2,224
Tax recoverable 54 - - - - - - 12 66
Total Assets 8,841 42,255 19,494 607 800 79 78 10,535 82,689
Equity and liabilities
Customer deposits 7,378 17,128 13,652 169 804 2 - 7 460 46,593
Borrowed funds 32 23,039 875 - - - - 109 24,055
Current tax liabilities - - 66 - - - - 66
Other liabilities 296 230 110 8 33 - - 322 999
Statutory loan loss reserve 132 - 24 - - - - - 156
Retained earnings (545) - 464 - - - - 434 515
Other capital reserve 32 - - - - - - 26 58
Total liabilities and shareholder’sfunds
7,325 40,397 15,191 177 837 2 7,483 71,412
Net financial position 1,516 1,858 4,303 430 (37) 77 78 3,052 11,277
As at 31 December 2012
Total Assets 7,420 41,869 9,677 670 1,007 88 78 6,308 67,117
Total Liabilities 5,852 32,553 13,884 196 759 1 - 2,972 56,217
Net financial position 1,568 9,316 (4,207) 474 248 87 78 3,336 10,900
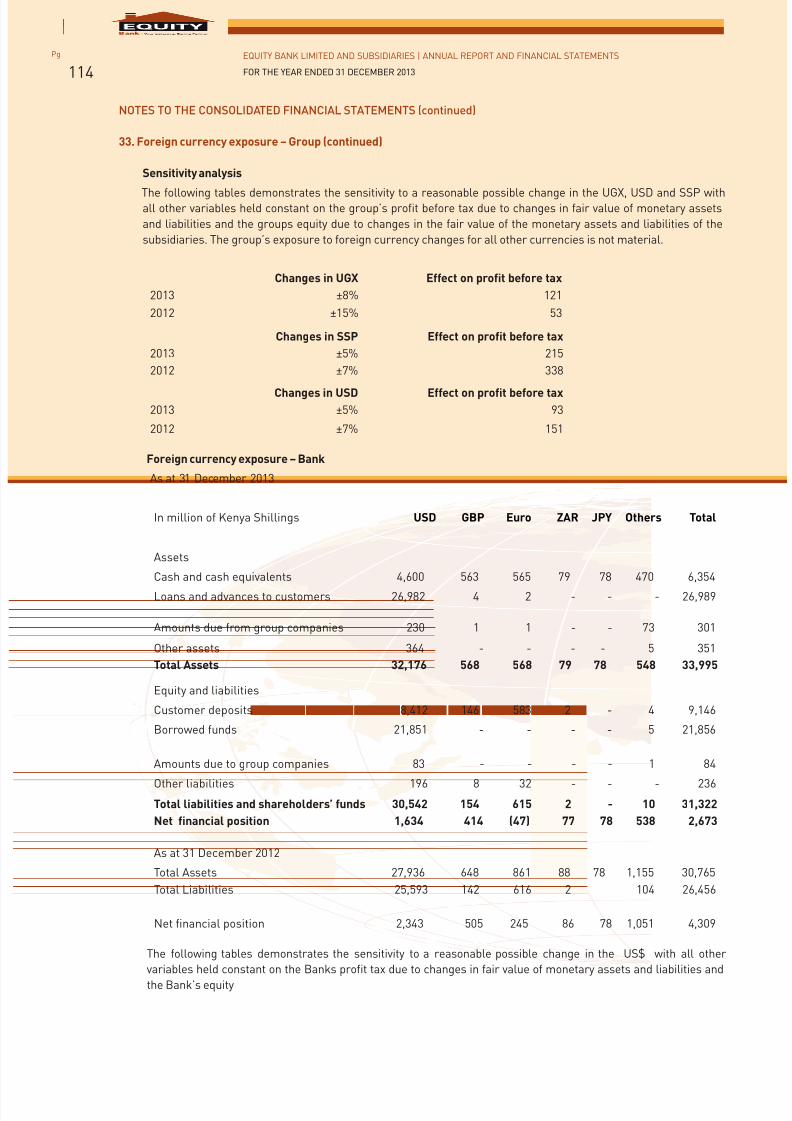
7/21/2019 Equity Bank Group Annual Report 2013
http://slidepdf.com/reader/full/equity-bank-group-annual-report-2013 116/124
EQUITY BANK LIMITED AND SUBSIDIARIES | ANNUAL REPORT AND FINANCIAL STATEMENTS
FOR THE YEAR ENDED 31 DECEMBER 2013
Pg
114
NOTES TO THE CONSOLIDATED FINANCIAL STATEMENTS (continued)
33. Foreign currency exposure – Group (continued)
Sensitivity analysis
The following tables demonstrates the sensitivity to a reasonable possible change in the UGX, USD and SSP withall other variables held constant on the group’s profit before tax due to changes in fair value of monetary assets
and liabilities and the groups equity due to changes in the fair value of the monetary assets and liabilities of the
subsidiaries. The group’s exposure to foreign currency changes for all other currencies is not material.
Changes in UGX Effect on profit before tax
2013 ±8% 121
2012 ±15% 53
Changes in SSP Effect on profit before tax
2013 ±5% 215
2012 ±7% 338
Changes in USD Effect on profit before tax
2013 ±5% 93
2012 ±7% 151
Foreign currency exposure – Bank
As at 31 December 2013
In million of Kenya Shillings USD GBP Euro ZAR JPY Others Total
Assets
Cash and cash equivalents 4,600 563 565 79 78 470 6,354Loans and advances to customers 26,982 4 2 - - - 26,989
Amounts due from group companies 230 1 1 - - 73
301
Other assets 364 - - - - 5 351
Total Assets 32,176 568 568 79 78 548 33,995
Equity and liabilities
Customer deposits 8,412 146 583 2 - 4 9,146
Borrowed funds 21,851 - - - - 5 21,856
Amounts due to group companies 83 - - - - 1
84
Other liabilities 196 8 32 - - - 236
Total liabilities and shareholders’ funds 30,542 154 615 2 - 10 31,322
Net financial position 1,634 414 (47) 77 78 538 2,673
As at 31 December 2012
Total Assets 27,936 648 861 88 78 1,155 30,765
Total Liabilities 25,593 142 616 2 104 26,456
Net financial position 2,343 505 245 86 78 1,051 4,309
The following tables demonstrates the sensitivity to a reasonable possible change in the US$ with all other
variables held constant on the Banks profit tax due to changes in fair value of monetary assets and liabilities andthe Bank’s equity

7/21/2019 Equity Bank Group Annual Report 2013
http://slidepdf.com/reader/full/equity-bank-group-annual-report-2013 117/124
EQUITY BANK LIMITED AND SUBSIDIARIES | ANNUAL REPORT AND FINANCIAL STATEMENTS
FOR THE YEAR ENDED 31 DECEMBER 2013
Pg
115
NOTES TO THE CONSOLIDATED FINANCIAL STATEMENTS (continued)
33. Foreign currency exposure – Bank (continued)
Changes in USD Effect on profit before tax
2013 ±5% 1172012 ±7% 164
34. Operating Segment
A segment is a distinguishable component of the group and the Bank that is engaged either in providing products
or services (business segment), or in providing products or services within a particular economic environment
(geographical segment), which is subject to risks and rewards that are different from those of other segments.
i) Business segments
The group provides financial services to individuals and small and medium sized enterprises in each of the
entities. For management purposes the results of each business unit (entity) is reviewed separately for thepurpose of making decisions. There are therefore no distinct significant business segments within each entity
to necessitate detailed disclosures.
ii) Operating segments
The Bank operates in five geographical markets that is Kenya, Uganda, South Sudan, Rwanda and Tanzania.
The table below shows the distribution of the group’s total assets, net interest income, total operating income,
total expenses and profit before tax.
2013 2012
In millionsof KenyaShillings
Kenya Uganda SouthSudan
Rwanda Tanzania Total Kenya Uganda SouthSudan
Rwanda Tanzania Total
Totalasset 238,194 12,833 23,321 6,204 8,091 277,729 206,023 9,978 19,656 3,392 4,122 243,170NetInterestIncome 23,690 1,004 1,026 344 380 26,490 22,123 985 488 167 201 23,964TotalOperatingIncome 35,738 1,480 2,725 717 675 42,062 32,181 1,443 2,425 423 355 36,828Totalexpenses 17,505 1,425 2,440 856 631 23,058 15,762 1,386 1,343 656 432 19,650Profitbefore tax 18,233 55 285 (139) 44 19,004 16,591 57 1,082 (233) (77) 17,420
It is not practicable to segregate revenues from external customers for each product and service as the information is notavailable and the cost to develop it would be excessive.
Interest income is reported net as management primarily relies on net interest revenue as a performance measure, not
the gross Income and expense.
No revenue from transactions with a single external customer or counter party amounted to 10% or more of the bank’s
total revenue in 2013 or 2012.
The group’s operating segments are reported based on financial information provided to the Strategy and Investment
committee as detailed on page 5 which is the key management committee and represents the decision making. The
chairmanship and composition of this committee is as detailed on page 4.
7/21/2019 Equity Bank Group Annual Report 2013
http://slidepdf.com/reader/full/equity-bank-group-annual-report-2013 118/124
EQUITY BANK LIMITED AND SUBSIDIARIES | ANNUAL REPORT AND FINANCIAL STATEMENTS
FOR THE YEAR ENDED 31 DECEMBER 2013
Pg
116
NOTES TO THE CONSOLIDATED FINANCIAL STATEMENTS (continued)
34. Operating Segment (continued)
The three customer facing lines of businesses include:
Consumer – This segment targets salaried customers or customers receiving other regular remittances like
pension. Facilities granted under this segment are for the purposes of empowering such customers to meet their
most immediate personal needs or personal development.
Small and Medium Enterprises (SME’s) – These are customers with small and medium enterprises. The
facilities granted under this segment are for purposes of meeting working capital needs, property development
or acquisition of assets.
Corporate – This segment comprises large enterprises. The facilities granted under this segment are designed
for purposes of meeting working capital needs, large scale development, property acquisition, large investments
and acquisition of assets.
The products the group offers its customers include:
Equi loan - a credit facility granted to employees of reputable organizations that the bank has an MOU with. The
facility is administered through a check off system from the employer where loan deductions are remitted to the
bank for loan instalment due.
Vijana loan - meant to cater for the youth majority of whom have business ideas but lack conventional collaterals,
the bank set aside some funds to support these clientele. The lending is done through group methodology
Fanikisha loan - loan products tailored for women clients. They have a characteristic of flexibility on collaterals
since majority of women don’t have formal collaterals yet have good business ideas.
Farm input - facilities granted to customers in the agricultural sector of the economy for inputs and workingcapital needs.
Mortgage loan - facilities granted to customers in pursuit of housing needs. The mortgages are advanced for both
residential and commercial purposes. This is available to both salaried and business clients.
Asset finance loan - granted to our customers for purchase of both movable and immovable assets. Majority of
the customers are in business.
Trade finance - products for customers in business and facilitates purchase of goods and services and subsequent
payments thereof. Various products are extended under trade finance including Bid bonds, LCs and Guarantees
among others.
Development loan - a facility granted to customers in the construction to finance the project in terms of materials
and other overheads. Majority of customers accessing this product are predominantly in SME and Corporate
sectors.
Business Loan - credit facilities granted to business customers for working capital needs.
Biashara Imara - working capital facility provided to micro Clients with no conventional collateral.

7/21/2019 Equity Bank Group Annual Report 2013
http://slidepdf.com/reader/full/equity-bank-group-annual-report-2013 119/124
EQUITY BANK LIMITED AND SUBSIDIARIES | ANNUAL REPORT AND FINANCIAL STATEMENTS
FOR THE YEAR ENDED 31 DECEMBER 2013
Pg
117
Notes
____________________________________________________________________________________
____________________________________________________________________________________
____________________________________________________________________________________
____________________________________________________________________________________
____________________________________________________________________________________
____________________________________________________________________________________
____________________________________________________________________________________
____________________________________________________________________________________
____________________________________________________________________________________
____________________________________________________________________________________
____________________________________________________________________________________
____________________________________________________________________________________
____________________________________________________________________________________
____________________________________________________________________________________
________________________________________________________________________________________________________________________________________________________________________
____________________________________________________________________________________
____________________________________________________________________________________
____________________________________________________________________________________
____________________________________________________________________________________
____________________________________________________________________________________
____________________________________________________________________________________
____________________________________________________________________________________
____________________________________________________________________________________
____________________________________________________________________________________
____________________________________________________________________________________
____________________________________________________________________________________
____________________________________________________________________________________
____________________________________________________________________________________
____________________________________________________________________________________
7/21/2019 Equity Bank Group Annual Report 2013
http://slidepdf.com/reader/full/equity-bank-group-annual-report-2013 120/124
Notes
____________________________________________________________________________________
________________________________________________________________________________________________________________________________________________________________________
____________________________________________________________________________________
____________________________________________________________________________________
____________________________________________________________________________________
____________________________________________________________________________________
____________________________________________________________________________________
____________________________________________________________________________________
____________________________________________________________________________________
____________________________________________________________________________________
____________________________________________________________________________________
____________________________________________________________________________________
____________________________________________________________________________________
____________________________________________________________________________________
____________________________________________________________________________________
____________________________________________________________________________________
____________________________________________________________________________________
____________________________________________________________________________________
____________________________________________________________________________________
____________________________________________________________________________________
____________________________________________________________________________________
____________________________________________________________________________________
____________________________________________________________________________________
____________________________________________________________________________________
____________________________________________________________________________________
____________________________________________________________________________________
____________________________________________________________________________________
____________________________________________________________________________________
____________________________________________________________________________________
118Pg EQUITY BANK LIMITED AND SUBSIDIARIES | ANNUAL REPORT AND FINANCIAL STATEMENTS
FOR THE YEAR ENDED 31 DECEMBER 2013
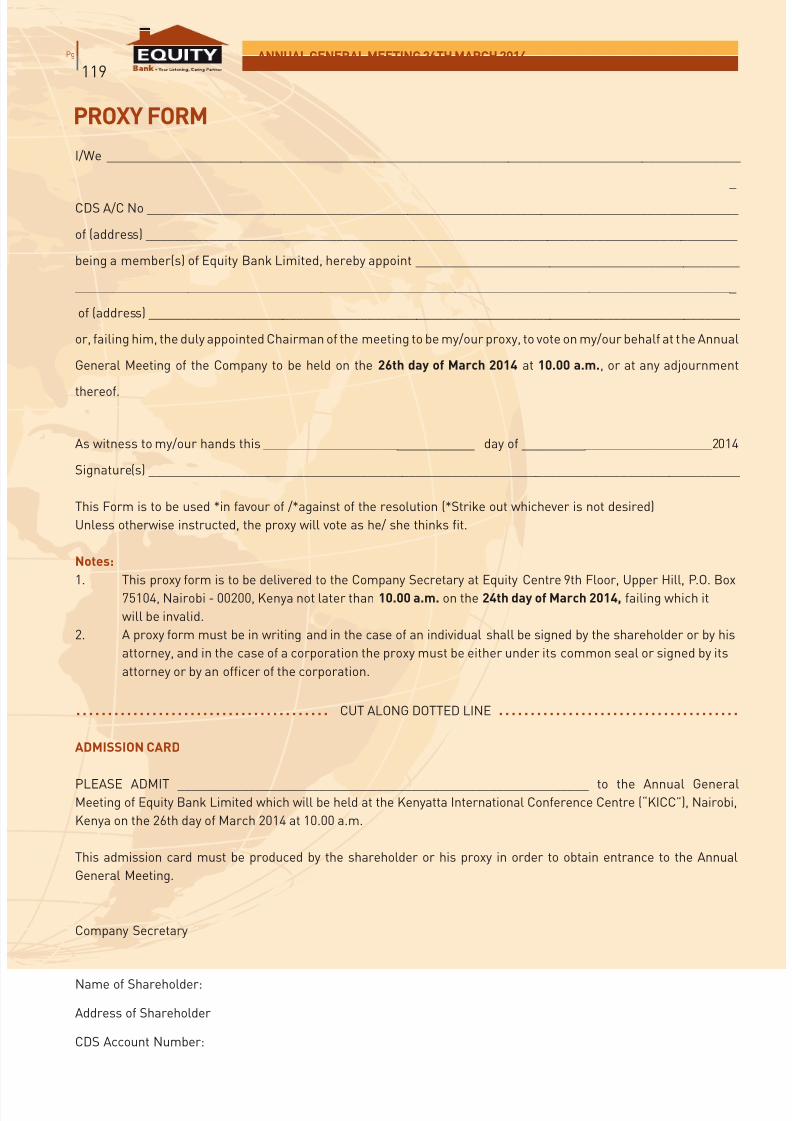
7/21/2019 Equity Bank Group Annual Report 2013
http://slidepdf.com/reader/full/equity-bank-group-annual-report-2013 121/124
7/21/2019 Equity Bank Group Annual Report 2013
http://slidepdf.com/reader/full/equity-bank-group-annual-report-2013 122/124
Pg
120MKUTANO MKUU WA MWAKA, 26TH MARCH 2014
Mimi/Sisi _____________________________________________________________________________
______________________________________________________________________________________
Nambari ya Akaunti ya hisa _______________________________________________________________
wa{anwani} ____________________________________________________________________________
Nikiwa/tukiwa wanachama wa Kampuni ya Equity Bank, ninateua/tunateua ________________________
______________________________________________________________________________________
wa{anwani} ____________________________________________________________________________
Au, akikosa kufika mwenyekiti aliyeteulliwa kihalali wa mkutano awe mwakilishi wangu/wetu kupiga kura
kwa niaba yangu/yetu katika mkutano mkuu wa mwaka wa kampuni utakaofanywa tarehe 26 March 2014
saa nne au wakati wowote uahirishaji unaweza kutokea.
Kama ilivyoshuhudiwa kwa sahihi yangu/yetu siku hii ya ____________________________________2014
Sahihi ________________________________________________________________________________
Maelezo:
1. Fomu hii ya uwakilishi inapaswa kuwasilishwa kwa katibu wa Kampuni katika Jumba la Equity
Centre Orofa ya 9, Upper Hill, s.l.p 75104, Nairobi- 00200, Kenya kabla ya saa nne asubuhi
tarehe 24 March 2014, la sivyo haitakubaliwa.
2. Fomu ya uwakilishi sharti iandikwe kwa mkono na endapo mwakilishi ni mtu binafsi inapaswakutiwa sahihi na mwenyehisa au na wakili wake na endapo ni shirika fomu ya uwakilishi sharti
iwe na muhuri au kutiwa sahihi na wakili wake au afisa wa shirika hilo.
........................KATA KATIKA SEHEMU ILIYO WEKWA ALAMA ...............................
KADI YA RUHUSA
Kadi hii ya ruhusa lazima iwasilishwe na mwenyehisa au mwakilishi wake ili kuruhusiwa kuhudhuria
Mkutano Mkuu wa Mwaka katika Jumba la Kenyatta International Conference Center (KICC) Nairobi,
Kenya tarehe 26 March 2014
saa nne asubuhi
Katibu wa kampuni:
Jina la Mwenyehisa:
Anwani ya Mwenyehisa:
Idadi ya hisa zinazoshikiliwa:
Nambari ya Akaunti ya Hisa:
FOMU YA UWAKILISHI
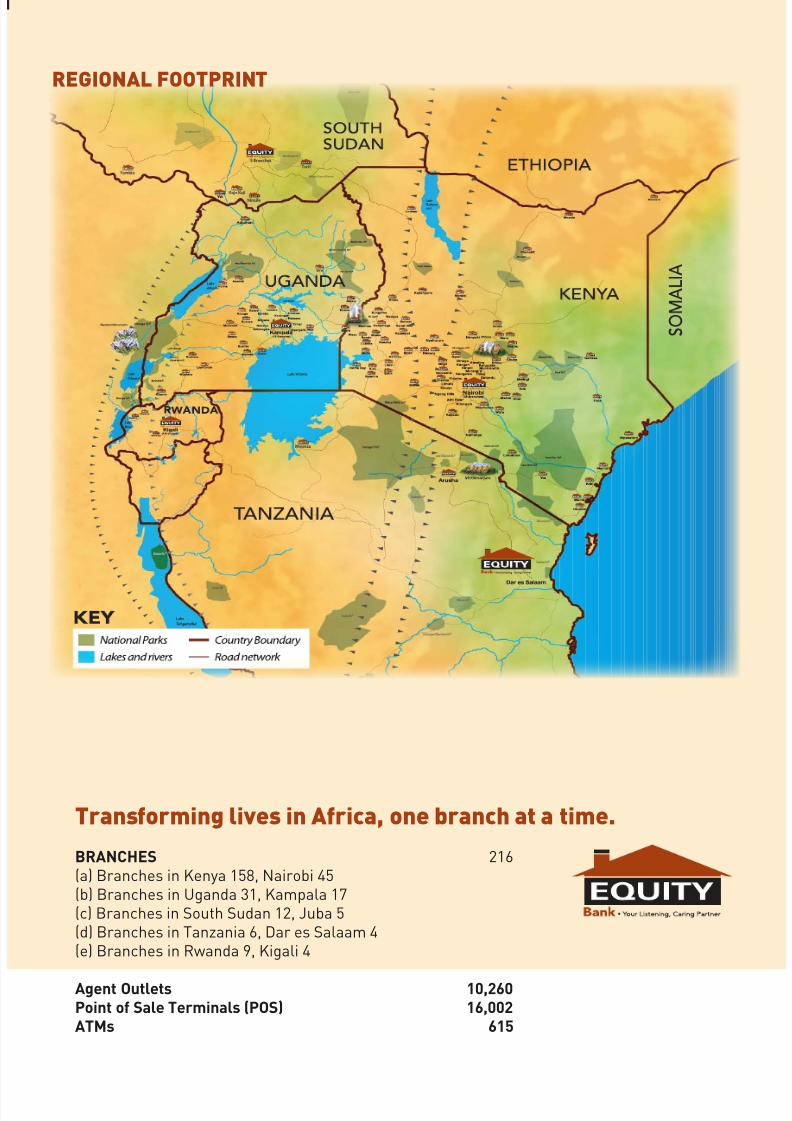
7/21/2019 Equity Bank Group Annual Report 2013
http://slidepdf.com/reader/full/equity-bank-group-annual-report-2013 123/124
REGIONAL FOOTPRINT
Transforming lives in Africa, one branch at a time.
BRANCHES 216(a) Branches in Kenya 158, Nairobi 45(b) Branches in Uganda 31, Kampala 17(c) Branches in South Sudan 12, Juba 5(d) Branches in Tanzania 6, Dar es Salaam 4(e) Branches in Rwanda 9, Kigali 4
Agent Outlets 10,260Point of Sale Terminals (POS) 16,002ATMs 615
7/21/2019 Equity Bank Group Annual Report 2013
http://slidepdf.com/reader/full/equity-bank-group-annual-report-2013 124/124
OUR INSPIRATION
That when years turn our vision dim and gray,
we shall still see beauty in the tired wrinkles of our faces and shall take comfort out of the fact and knowledge that when we were
given the opportunity we did all we could to empower our people to exploit opportunities and realise their full potential
on the road to economic prosperity.
KENYA UGANDA
SOUTH SUDAN RWANDA
OUR REGIONAL SUBSIDIARIES