equity and social justice annual report
TRANSCRIPT

Equity and Social Justice Annual Report
August 2012
Access to safe and efficient transportation
Access to affordable, healthy, local food
Healthy built and natural environments
Access to health and human services Affordable, safe, quality housing
Access to parks and natural resources
Qu
ality education
Economic development
Family wage jobs and job trainingEquity in County
practices
Equitable law and justice system
Early childhood development
Strong, vibrant neighborhoodsCommunity and public safety
August 13, 2012
I am proud to present King County’s rst Equity and Social Justice Annual Report.
Our region is a place of great opportunity—a place where quality of life, the economy and health are among the best in the country. But not everyone reaps the bene ts of these opportunities. Where you live, how much you make, and the color of your skin all have a lot to do with your life experience and your chances to live well and thrive in this county.
King County government is striving to change this. We can contribute to creating fairness and opportunity in the lives of all residents through our decisions, our policies, and our everyday work. Keeping equity and social justice at the forefront of our work helps to secure our region’s future by creating a place where everyone can contribute his or her best.
We are working in King County for equity and social justice at three levels: considering equity impacts in all decision making; promoting opportunity and fairness in county practices; and building awareness through communication and engagement with all King County communities and groups.
We don’t have all the answers. We won’t create equity working alone, nor will we get the job done overnight. But the only way we can start is by asking the important questions and digging deeper.
I remain deeply committed to working with our elected of cials, employees and residents to make King County a place where all people can reach their full potential. I hope this report spurs discussions and actions as we make strides toward the fair and just society envisioned by our county’s namesake, Dr. Martin Luther King, Jr.
Sincerely,
Dow ConstantineKing County Executive

King County Executive Of ce401 Fifth Avenue, Ste. 800
Seattle, WA 98104206-263-9600 TTY Relay: 711
www.kingcounty.gov/equity
Alternative Formats Available206-263-3703 TTY Relay: 711
12036/KCDOTcomm/jp
Equity and Social Justice Annual Report
August 2012
King County acknowledges the support and inspiration of Place Matters, an initiative of the
Joint Center for Political and Economic Studies convening 16 communities nationally
to address the social, economic and environmental conditions
and factors that lead to inequities.
ii KING COUNTY EQUITY AND SOCIAL JUSTICE ANNUAL REPORT—AUGUST 2012
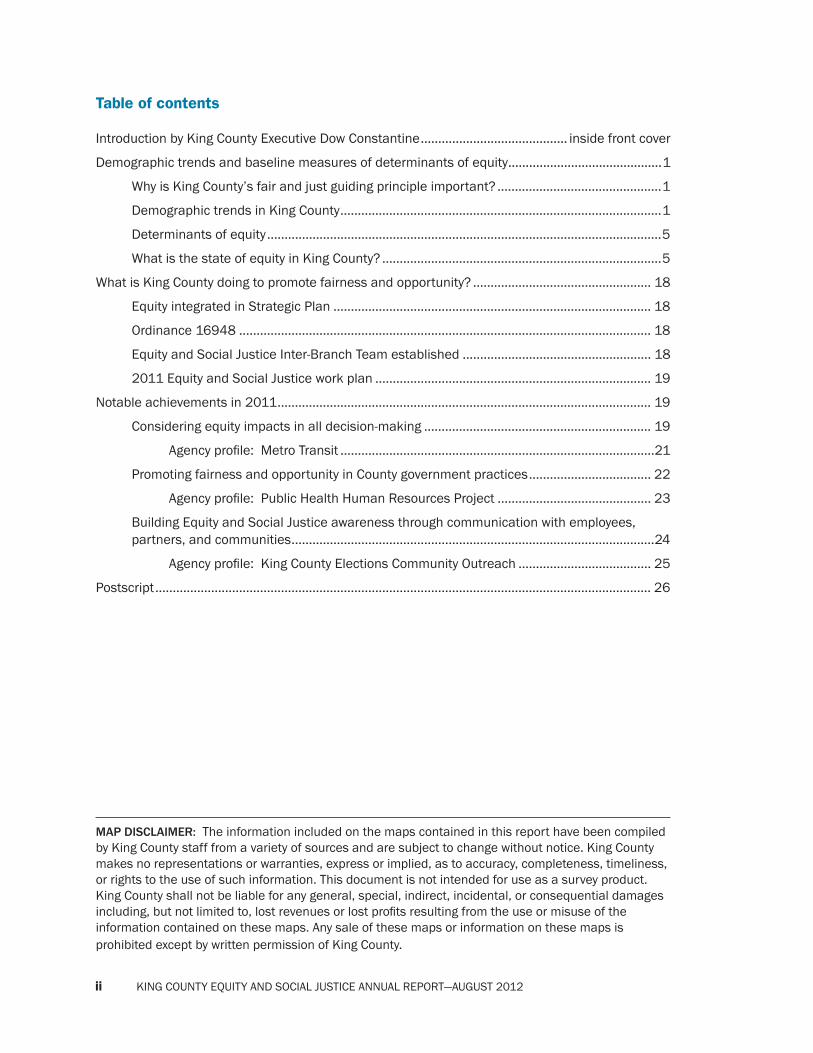
Table of contents
Introduction by King County Executive Dow Constantine .......................................... inside front cover
Demographic trends and baseline measures of determinants of equity ............................................1
Why is King County’s fair and just guiding principle important? ...............................................1
Demographic trends in King County ............................................................................................1
Determinants of equity .................................................................................................................5
What is the state of equity in King County? ................................................................................5
What is King County doing to promote fairness and opportunity? ................................................... 18
Equity integrated in Strategic Plan ........................................................................................... 18
Ordinance 16948 ...................................................................................................................... 18
Equity and Social Justice Inter-Branch Team established ...................................................... 18
2011 Equity and Social Justice work plan ............................................................................... 19
Notable achievements in 2011 ........................................................................................................... 19
Considering equity impacts in all decision-making ................................................................. 19
Agency pro le: Metro Transit ..........................................................................................21
Promoting fairness and opportunity in County government practices ................................... 22
Agency pro le: Public Health Human Resources Project ............................................ 23
Building Equity and Social Justice awareness through communication with employees, partners, and communities ........................................................................................................24
Agency pro le: King County Elections Community Outreach ...................................... 25
Postscript .............................................................................................................................................. 26
MAP DISCLAIMER: The information included on the maps contained in this report have been compiled by King County staff from a variety of sources and are subject to change without notice. King County makes no representations or warranties, express or implied, as to accuracy, completeness, timeliness, or rights to the use of such information. This document is not intended for use as a survey product. King County shall not be liable for any general, special, indirect, incidental, or consequential damages including, but not limited to, lost revenues or lost pro ts resulting from the use or misuse of the information contained on these maps. Any sale of these maps or information on these maps is prohibited except by written permission of King County.
KING COUNTY EQUITY AND SOCIAL JUSTICE ANNUAL REPORT—AUGUST 2012 1
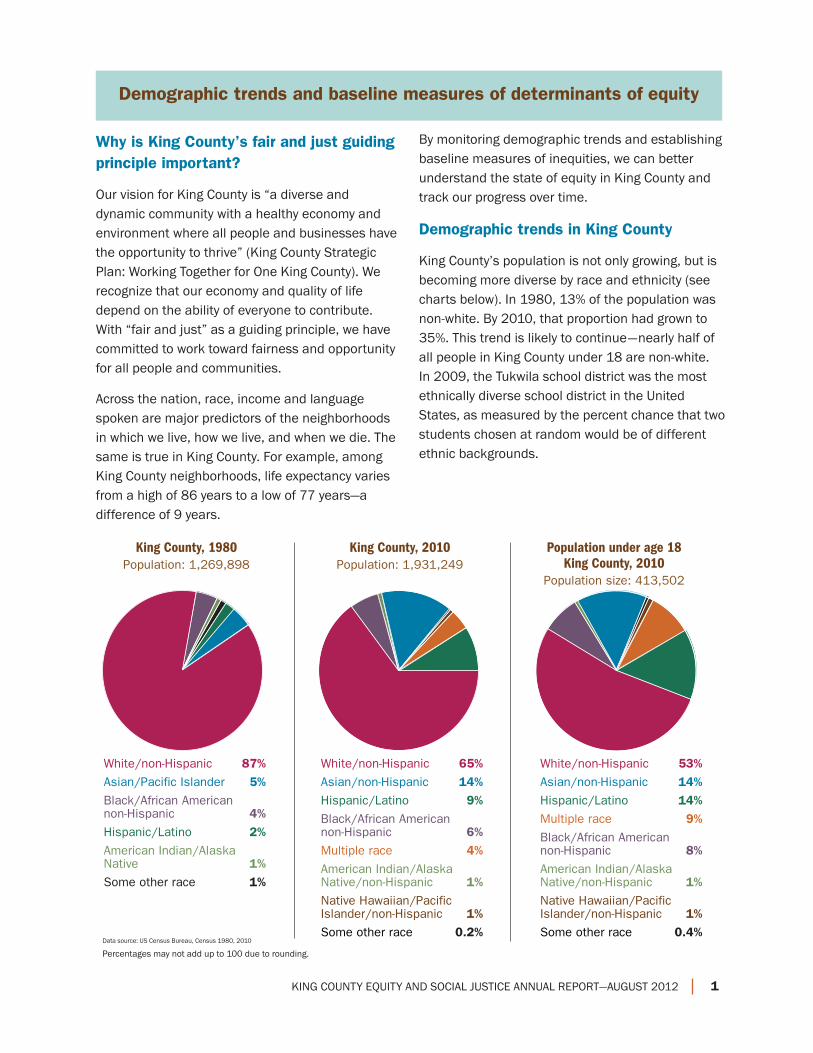
Why is King County’s fair and just guiding principle important?
Our vision for King County is “a diverse and dynamic community with a healthy economy and environment where all people and businesses have the opportunity to thrive” (King County Strategic Plan: Working Together for One King County). We recognize that our economy and quality of life depend on the ability of everyone to contribute. With “fair and just” as a guiding principle, we have committed to work toward fairness and opportunity for all people and communities.
Across the nation, race, income and language spoken are major predictors of the neighborhoods in which we live, how we live, and when we die. The same is true in King County. For example, among King County neighborhoods, life expectancy varies from a high of 86 years to a low of 77 years—a difference of 9 years.
By monitoring demographic trends and establishing baseline measures of inequities, we can better understand the state of equity in King County and track our progress over time.
Demographic trends in King County
King County’s population is not only growing, but is becoming more diverse by race and ethnicity (see charts below). In 1980, 13% of the population was non-white. By 2010, that proportion had grown to 35%. This trend is likely to continue—nearly half of all people in King County under 18 are non-white. In 2009, the Tukwila school district was the most ethnically diverse school district in the United States, as measured by the percent chance that two students chosen at random would be of different ethnic backgrounds.
Demographic trends and baseline measures of determinants of equity
White/non-Hispanic 65%Asian/non-Hispanic 14%Hispanic/Latino 9%Black/African Americannon-Hispanic 6%Multiple race 4%American Indian/Alaska Native/non-Hispanic 1%Native Hawaiian/Pacific Islander/non-Hispanic 1%Some other race 0.2%
White/non-Hispanic 53%Asian/non-Hispanic 14%Hispanic/Latino 14%Multiple race 9%Black/African Americannon-Hispanic 8%American Indian/Alaska Native/non-Hispanic 1%Native Hawaiian/Pacific Islander/non-Hispanic 1%Some other race 0.4%
King County, 1980Population: 1,269,898
King County, 2010Population: 1,931,249
Population under age 18King County, 2010
Population size: 413,502
White/non-Hispanic 87%Asian/Pacific Islander 5%Black/African Americannon-Hispanic 4%Hispanic/Latino 2%American Indian/Alaska Native 1%Some other race 1%
Data source: US Census Bureau, Census 1980, 2010
Percentages may not add up to 100 due to rounding.

2 KING COUNTY EQUITY AND SOCIAL JUSTICE ANNUAL REPORT—AUGUST 2012
The proportion of the population which is comprised of people of color varies signi cantly across
4 0 42
Miles6.3% - 19.8%
19.9% - 30.4%
30.5% - 43.7%
43.8% - 60.6%
60.7% - 91.2%
Data source: US Census Bureau, Census 2010-PL94-171
geographic areas of the county, as shown on the map below.
Percent Non-White Population by Census Tract, 2010
Non-white populations include: American Indian/Alaska Native, Asian American, Black or African American, Hispanic or Latino, Native Hawaiian/Other Paci c Islander, and multiple race individuals.
KING COUNTY
Percent Non-White

KING COUNTY EQUITY AND SOCIAL JUSTICE ANNUAL REPORT—AUGUST 2012 3
4 0 42
Miles
Ü
KING COUNTY
Data source: 2006-2010 American Community Survey (ACS), Census Bureau
Use caution in comparing ACS data with data from the decennial census or other sources. Be careful in drawing conclusions about small differences between two estimates because they may not be statistically different.
Because the American Community Survey is a small sample, margins of error are high, and these data should be used with caution as a generalized location of language communities.
Percent Population Ages 5+ Who Speak English Not Well or Not at All by Census Tract 2006-2010 Five-year Average
0% - 3.6%
3.7% - 8.3%
8.4% - 15.3%
15.4% - 43.5%
Percent Limited-English Pro ciency
In King County, over one hundred languages are spoken and 11 percent of the population over age 5 has limited-English profi ciency. The proportion
of the population with limited-English pro ciency also varies signi cantly across geographic areas of the county, as shown on the map below.

4 KING COUNTY EQUITY AND SOCIAL JUSTICE ANNUAL REPORT—AUGUST 2012
4 0 42
Miles
Ü
King County’s Equity and Social Justice work focuses on creating more equal opportunity not only for people of color and people with limited-English pro ciency, but also for low-income
Data source: 2005-2009 American Community Survey (ACS), Census Bureau
Use caution in comparing ACS data with data from the decennial census or other sources. Be careful in drawing conclusions about small differences between two estimates because they may not be statistically different.
Not Reliable = 30% or greater coef cient of variation
Two hundred percent of the Federal Poverty Level for a family of four in 2009 is $44,100
2.1% - 14.6%
14.7% - 26.5%
26.6% - 42.4%
42.5% - 79%
Not reliable
communities. Mapping income in King County also shows signi cant variation across geographic areas.
Percent of Population Below 200% Poverty Level by Census Tract2005-2009 Five-year Average
KING COUNTY
Percent Below 200% Poverty Level

KING COUNTY EQUITY AND SOCIAL JUSTICE ANNUAL REPORT—AUGUST 2012 5
Determinants of equity
King County has identi ed 14 determinants of equity that are the conditions in which people live, learn, work and play. Equal access to these determinants is necessary for all people to thrive and reach their full potential regardless of race, income, or language spoken.
• Family wage jobs and job training• Affordable, safe, quality housing• Early childhood development• Quality education• Equitable law and justice system• Access to affordable, healthy, local food• Access to health and human services• Access to parks and natural resources• Access to safe and ef cient transportation• Community and public safety• Economic development• Strong, vibrant neighborhoods• Healthy built and natural environments• Equity in county practices
In King County, as in communities across our nation, there is disproportionate access to the determinants of equity and, therefore, disproportionate access to opportunity. Access or lack of access to the determinants of equity follows some of the same geographic patterns as seen on the maps in the preceding section of this report. As a result, while the current economic environment has challenged all communities, some geographic areas and communities have experienced greater impacts than others.
In a fair and just King County, opportunity should not be de ned by race or zip code of residence. By focusing on increasing access to the determinants of equity, we hope to increase the ability of all people in King County to ful ll their potential.
Poster distributed for use in conference rooms and other highly-visible areas throughout King County.
What is the state of equity in King County?
The following are selected baseline measures of the level of access to the determinants of equity for communities in King County. These measures provide a snapshot of how opportunity is distributed in King County and are not a compre-hensive analysis of each determinant of equity.
Family-wage jobs provide a household with economic self-suf ciency and the capacity to meet basic needs without government subsidy.
In King County, reliable estimates of the income a household would need for economic self-suf ciency in 2009 varied from $66,581 for a single adult to $85,779 for two working adults with two children. We use median household income as an indicator of how households may fare relative to family-wage income because it is impossible to measure family-wage income levels directly.

6 KING COUNTY EQUITY AND SOCIAL JUSTICE ANNUAL REPORT—AUGUST 2012
In King County as a whole, median household income was $67,806 in 2009, just above family-wage income for a single adult but below that for a family of four. When measured within each census tract, median household income varies
signi cantly across King County (see map below). South King County and south Seattle have the greatest concentration of households below King County’s median household income.
4 0 42
Miles
Ü
KING COUNTY
Data source: 2005-2009 American Community Survey (ACS), Census Bureau
Use caution in comparing ACS data with data from the decennial census or other sources. Be careful in drawing conclusions about small differences between two estimates because they may not be statistically different.
Not Reliable = 30% or greater coef cient of variation
Median Household Income
$110,275 - $182,250
$77,724 - $110,274
$53,455 - $77,723
$6,563 - $53,454
Not Reliable
Median Household Income by Census Tract2005-2009 Five-year Average

KING COUNTY EQUITY AND SOCIAL JUSTICE ANNUAL REPORT—AUGUST 2012 7
Data source: US Census Bureau; 2000 Census and American Community Survey. Con dence Intervals: When comparing rates between different groups in King County with bar graphs, the 95% con dence interval or margin of error is shown to assess how much the rate is likely to vary due to chance. When comparing two rates, if the con dence intervals do not overlap, the difference in the rates is considered statistically signi cant, that is, chance or random variation is unlikely to be the reason for the difference.
$90,000
$80,000
$70,000
$60,000
$50,000
$40,000
$30,000
$20,000
$10,000
0White Black/
AfricanAmerican
AmericanIndian
/AlaskaNative
Asian NativeHawaiian/Pacific Islander
MultipleRace
Hispanic/Latino
1999 2010
Median Household Income by Race/Ethnicity, King County 1999 and 2010
Data source: 2006-2010 American Community Survey, PUMS
Percent of Households Paying Greater than 30% of Income for Housing by Race/Ethnicity, King County 2006-2010 Average
70%
60%
50%
40%
30%
20%
10%
0%
White All KingCounty
Black/African
American
AmericanIndian
/AlaskaNative
Asian NativeHawaiian/Pacific Islander
MultipleRace
Hispanic/Latino
Perc
ent
of h
ouse
hold
s
35% 38% 41% 45% 45% 47% 48% 54%
Median household income varies not only by place, but also by race (see chart below). In 2010, African American and Native American households earned just over half of white median income.
Trends in median household income show that some differences in income by race have widened since 1999.
Affordable, quality housing provides shelter that is safe and healthy for all people. Housing that costs more than 30% of household income is considered to be “unaffordable.” Black/African American, Hispanic/Latino, and multiracial house-
holds are signi cantly more likely than King County as a whole to pay more than 30 percent of their income on housing (see chart below). In King County, the median-priced home remains unaffordable to households with a median income.

8 KING COUNTY EQUITY AND SOCIAL JUSTICE ANNUAL REPORT—AUGUST 2012
The recent declines in home value have also impacted communities differentially. In comparing the top ten and bottom ten geographic areas for change in assessed home value, south King
-20% -15% -10% -5% 0% 5%
Boulevard/Riverton
Lake Forest Park/West Kenmore
Covington
Auburn
White Center
NW Renton Hill
Enumclaw Plateau
Algona/Pacific
Woodmont/Redondo
Burien
-10.3-10.4
-10.9-11.5
-12.0
-12.0-15.2-16.1
-16.7
-17.3
Wallingford
Phinney Ridge/Fremont
Queen AnneMedina/Hunts Point
East Rural King County
Green Lake
East Ballard
Central Sammamish Plateau
Eastgate/Factoria
Crossroads
2.4
0.5
0.00.00.0-.90
-1.2
-1.5
-1.8
-2.0
Least decline
Greatest decline
King County Communities with the Least and Greatest Decline in Residential Assessed Value, 2012
County communities, low income and more racially diverse communities have experienced the largest declines in home values.
Data source: King County Of ce of Economic and Financial Analysis

KING COUNTY EQUITY AND SOCIAL JUSTICE ANNUAL REPORT—AUGUST 2012 9
0% 10% 20% 30% 40% 50% 60% 70% 80% 90% 100%
26% served (10,110 eligible children unserved)
83% served (1 unserved)
King County
Skykomish
Seattle
Bellevue
Enumclaw
Snoqualmie Valley
Auburn
Lake Washington
Highline
Riverview
Federal Way
Renton
Kent
Tukwila
Shoreline
Tahoma
Northshore
Issaquah
Mercer Island
Vashon Island
46% served (1,746 unserved)
29% served (384 unserved)
27% served (99 unserved)
26% served (100 unserved)
25% served (781 unserved)
23% served (380 unserved)
21% served (1,536 unserved)
20% served (1,297 unserved)
20% served (958 unserved)
18% served (1,454 unserved)
21% served (68 unserved)
18% served (324 unserved)15% served (210 unserved)
14% served (113 unserved)
12% served (410 unserved)
9% served (195 unserved)
0% served (21 unserved)
0% served (33 unserved)
Early childhood development supports nurturing relationships and early learning opportunities that foster school readiness for all children. The early years are crucial in in uencing health and social well-being across a child’s lifetime.
Head Start and the Washington State enhanced early learning program called Early Childhood Education and Assistance Program (ECEAP) provide evidence-based programs to improve school readiness for low-income children. Due to lack of adequate State and Federal funding, these early
Estimated Percent of Children Eligible for Head Start and ECEAP Served and Number Unserved Eligible Children, King County 2011
childhood education programs are unable to serve all eligible children.
In 2011, about one in four eligible children were served by Head Start and ECEAP across King County. The number of unserved eligible children in King County exceeds 10,000 children. While 42% percent of King County children under the age of six reside in south King County school districts, more than 65% of the unserved children are in those districts.
Data source: Puget Sound Educational Service District

10 KING COUNTY EQUITY AND SOCIAL JUSTICE ANNUAL REPORT—AUGUST 2012
0% 10% 20% 30% 40% 50% 60% 70% 80% 90% 100%
70.2
70.6
75.778.1
82.0
82.3
84.0
85.7
88.3
89.8
90.090.0
90.3
90.9
93.095.6
96.5
97.0
100
All King County
Federal Way
Highline
Tukwila
Seattle
Renton
Kent
Enumclaw
Auburn
Bellevue
Snoqualmie Valley
Tahoma
Lake Washington
Northshore
Shoreline
Riverview
Issaquah
Vashon Island
Mercer Island
Skykomish
83.0
Quality education allows each student to reach his or her full learning and career potential.
Students in Federal Way, Highline, Tukwila, and Seattle school districts have the lowest on-time graduation rate. The rate across all King County school districts is 83%. (See rst chart below.)
0% 10% 20% 30% 40% 50% 60% 70% 80% 90% 100%
71.4
65.2
63.9
58.7
82.7
87.0
86.6
All King County
American Indian/Alaska Native
Hispanic/Latino
Native Hawaiian/Pacific Islander
Black/African American
White/non-Hispanic
Asian
On-time Graduation Rate by King County School District2009-2010 School Year
Again, graduation rates vary across King County not only by place, but also by race. Native-American, Native Hawaiian/Paci c Island, Latino and African American youth are less likely than Asian and white youth to graduate on-time from high school. (See second chart below.)
On-time Graduation Rate by Race/Ethnicity, King County2009-2010 School Year
Data source: Of ce of Superintendent of Public Instruction
Data source: Of ce of Superintendent of Public Instruction

KING COUNTY EQUITY AND SOCIAL JUSTICE ANNUAL REPORT—AUGUST 2012 11
An equitable law and justice system provides equitable access and fair treatment for all.
Rates of incarceration show large differences by race. In 2011, the incarceration rate of African Americans in King County was roughly 8 times the rate of incarceration for whites in King County. The incarceration rate of Asian/Paci c Islanders was half the rate of whites in King County.
Over the last several years, King County has focused on strategies that provide for alternatives to incarceration and work to break the cycle of recidivism. From 2005 to 2011, incarceration rates for all groups decreased by 21%. The incarceration rate for Black/African Americans decreased by 24%, slightly faster than for whites though the disparity remains high. The incarceration rate fell even faster for American Indian/Alaska Natives (-33.5%) and Asian/Paci c Islanders (-27.5%).
1,200
1,000
800
600
400
200
0
2005 2006 2007 2008 2009 2010 2011
Incarceration Rate per 100,000 in King County Secure Detention, by Race and Year, 2005-2011
American Indian/Alaska Native
Total
Islander
White
Black/African American
Data source: Annual Detentions and Alternatives Report, King County Department of Adult and Juvenile Detention; Public Health - Seattle & King County
12 KING COUNTY EQUITY AND SOCIAL JUSTICE ANNUAL REPORT—AUGUST 2012
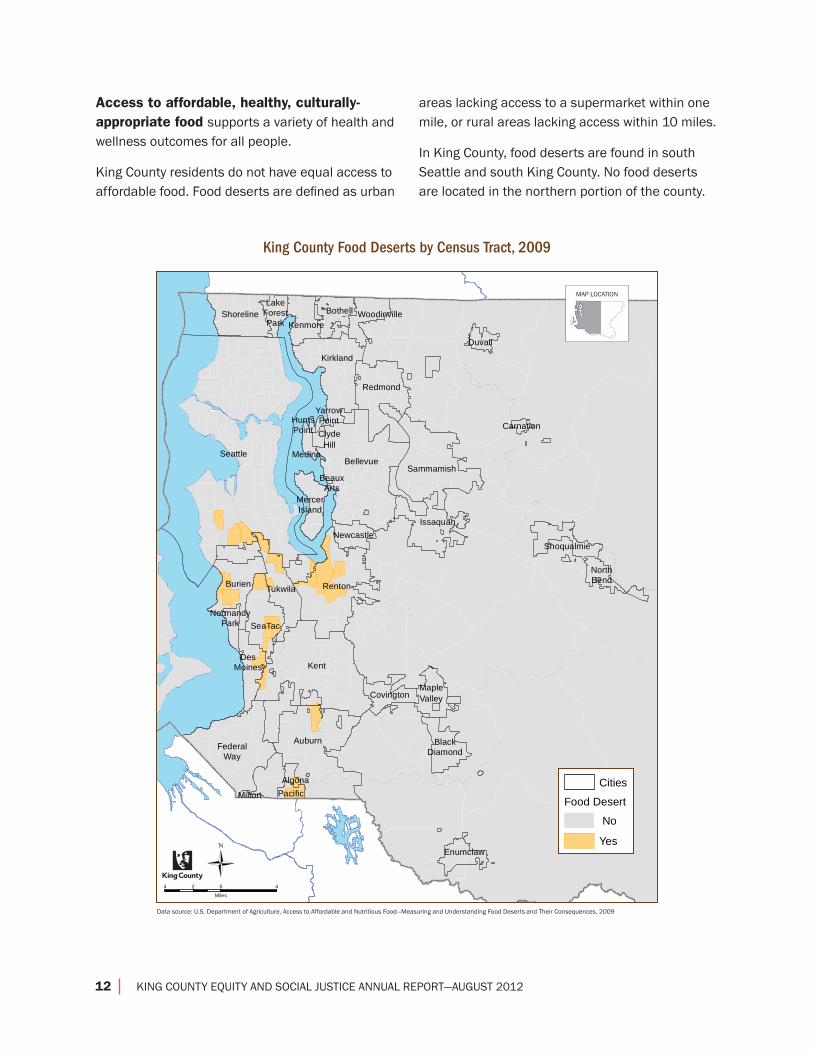
Access to affordable, healthy, culturally-appropriate food supports a variety of health and wellness outcomes for all people.
King County residents do not have equal access to affordable food. Food deserts are de ned as urban
King County Food Deserts by Census Tract, 2009
Algona
Auburn
BeauxArts
BlackDiamond
Bellevue
Bothell
Burien
CarnationClyde
Hill
Covington
DesMoines
Duvall
Enumclaw
FederalWay
HuntsPoint
Issaquah
Kent
Kirkland
Kenmore
LakeForestPark
Medina
MercerIsland
Milton
MapleValley
NorthBend
Newcastle
NormandyPark
Pacific
Redmond
Renton
Seattle
Shoreline
Sammamish
Snoqualmie
SeaTac
Tukwila
Woodinville
YarrowPoint
4 0 42
Miles
Ü
areas lacking access to a supermarket within one mile, or rural areas lacking access within 10 miles.
In King County, food deserts are found in south Seattle and south King County. No food deserts are located in the northern portion of the county.
MAP LOCATION
Data source: U.S. Department of Agriculture, Access to Affordable and Nutritious Food—Measuring and Understanding Food Deserts and Their Consequences, 2009
Cities
Food Desert
No
Yes

KING COUNTY EQUITY AND SOCIAL JUSTICE ANNUAL REPORT—AUGUST 2012 13
Food hardship is measured by the percent of households reporting running out of food sometimes or often. Food hardship has increased 50% since 2007 in King County and varies signi cantly by race. Almost four in ten Latino adults and more than one in ve African American adults report food hardship.
In south King County particularly and in King County overall, households with children were more likely to experience food hardship than those without children (data not shown).
American Indian/Alaska Native too few respondents to report
Native Hawaiian/Pacific Islander too few respondents to report
0% 10% 20% 30% 40% 50%
Percent of Adults (Age 18+)
Black/AfricanAmerican
21%
White 7%
Multiple Race 13%
Asian 6%
Hispanic/Latino 38%
Percent of Adults Who Report that Household Food Often or Sometimes Didn’t Last By Race/Ethnicity, King County 2010
Data source: Behavioral Risk Factor Surveillance System

14 KING COUNTY EQUITY AND SOCIAL JUSTICE ANNUAL REPORT—AUGUST 2012
Access to health and human services promotes wellness and support throughout one’s life. Lack of health insurance results in delays in seeking medical care, delays in receiving appropriate screenings, and delays in managing chronic disease. It contributes to increased risk of poor health, hospitalization, and premature death.
Thirteen percent of non-elderly King County adults are uninsured. The differences in the proportion of uninsured by place vary across zip codes and range from 2% in 98040 (Mercer Island) to 32% in 98188 (Tukwila/SeaTac).
3.5 0 3.51.75
Miles
ÜData source: Public Health-Seattle & King County, Behavioral Risk Factor Surveillance System
Percent of Adults Ages 18-64 Who are Uninsured in King County by Zip Code2007-2011
KING COUNTY
2% - 6%
7% - 11%
12% - 18%
19% - 32%
Not Reliable <50 Responses
Percent Uninsured

KING COUNTY EQUITY AND SOCIAL JUSTICE ANNUAL REPORT—AUGUST 2012 15
Less than $15,000
$15,000 to $24,999
$25,000 to $34,999
$35,000 to $49,999
$50,000 to $74,999
$75,000 or more
Less than High School
High School Graduate
Some College
College Graduate
Employed
Unemployed
Unable to work
Homemaker/student
Retired
0% 10% 20% 30% 40% 50% 60%PERCENT OF ADULTS
39%44%
25%18%
9%3%
10%35%
17%14%
5%
49%24%
15%6%
Percent of Adults Ages 18-64 Without Health Insurance by Income, Education, and Employment StatusKing County Three Year Average 2008-2010
Percent of Adults Ages 18-64 Without Health Insurance by Race/EthnicityKing County Three Year Average 2008-2010
People in King County who lack health insurance are much more likely to be lower income, less educated and unemployed (see top chart).
Latinos are more likely than other groups to have no health insurance (see bottom chart) and
Data source: Behavioral Risk Factor Surveillance System. Produced by Communities Count, 2011 PERCENT OF ADULTS
Multiple Race
White
Hispanic/Latino
American Indian/Alaska Native
Black/African American
Asian
Native Hawaiian/Pacific Islander
0% 10% 20% 30% 40% 50% 60%
too few respondents to report
20%
11%
46%
8%
26%
10%
Spanish speaking residents are much more likely to have no health insurance (data not shown). A higher proportion of African Americans and people of multiple races are uninsured than whites.
Data source: Behavioral Risk Factor Surveillance System. Produced by Communities Count, 2011

16 KING COUNTY EQUITY AND SOCIAL JUSTICE ANNUAL REPORT—AUGUST 2012
Access to parks and natural resources, such as play elds, open spaces and regional trails, promotes social, economic and physical well-being, particularly for those people for whom private recreation facilities are not within nancial reach.
The map below shows how neighborhoods in King County vary in their proximity to parks. The dotted
red line shows the urban growth boundary within which park proximity was measured. The dark green areas show park lands and the light green areas show those neighborhoods that are within ¼ mile of a park, open space, or regional trail. The tan areas are those neighborhoods where residents live more than ¼ mile away from a park.
Communities Within Quarter-Mile of Parks, Open Space, and Regional Trails Within the Urban Growth Area 2011
Seattle
Kent
Bellevue
Auburn
Renton
Kirkland
Federal Way
Sammamish
Redmond
Burien
SeaTac
Tukwila
Issaquah
ShorelineBothell
Covington
Newcastle
Pacific
Kenmore
Des Moines
Snoqualmie
Maple Valley
Woodinville
Black Diamond
Enumclaw
Mercer Island
North Bend
Duvall
Medina
Lake Forest
Park
Algona
Normandy Park
Clyde Hill
Carnation
Milton
Hunts Point
Yarrow Point
Beaux Arts
4 0 42
Miles
Ü
KING COUNTY
Data source: King County Spatial Data Warehouse
Parks, Open Space, & Trails
Areas Within 1/4 Mile Buffer
Areas Outside Buffer
Cities
Urban Growth Boundary

KING COUNTY EQUITY AND SOCIAL JUSTICE ANNUAL REPORT—AUGUST 2012 17
Access to safe and effi cient transportation provides all people and communities with transportation choices.
Of perhaps all the determinants of equity, King County has the most direct in uence on transit
service. King County has intentionally designed transit service to serve those communities who are transit-dependent. As a result, transit routes in King County serve low-income and minority census tracts.
Low Income and Minority Census Tracts and Transit Routes 2010
4 0 42
Miles
Ü
KING COUNTY
Current Metro Transit Routes
Low Income Census Tracts
Minority Census Tracts
Data source: US Census Bureau, Census 2010; 2006-2010 American Community Survey; King County Department of Transportation / Metro Transit

18 KING COUNTY EQUITY AND SOCIAL JUSTICE ANNUAL REPORT—AUGUST 2012
The previous sections of this report show remarkable differences in access to the determinants of equity —and therefore to opportunity—across King County by place, race and income. Together, these conditions create a complex web of barriers to opportunity for certain communities. Meaningful and widespread changes in opportunity are unlikely to result from focus on just one of these conditions, or by just one institution. Over the past few years, King County has been working intentionally on a comprehensive approach to how our government can maximize its impact on fairness and opportunity in King County.
Equity integrated in Strategic Plan
In July 2010, King County adopted its rst countywide strategic plan to guide budget and policy decisions and how we do business in King County government. The King County Strategic Plan (KCSP) 2010-2014: Working Together for One King County includes as one of its guiding principles “Fair and Just: We serve all residents of King County by promoting fairness and opportunity and eliminating inequities.” Through the implementation of the KCSP, King County is transforming its work on equity and social justice from an initiative to an integrated approach that applies the KCSP’s “fair and just” principle intentionally in all that the county does.
Ordinance 16948
In October 2010, the County adopted Ordinance 16948, establishing de nitions and directing implementation steps to achieve the fair and just principle. The Ordinance identi es the 14 determinants of equity that are highlighted in the previous section of this report. All County employees are being asked to consider how we can align efforts across County government to address these underlying social, economic, and environmental conditions. By focusing on actions that impact the determinants of equity, King County can have a larger impact on improving equity than through programs that attempt to change only individual behaviors and choices.
Equity and social justice inter-branch team established
Ordinance 16948 also required establishment of an Equity and Social Justice (ESJ) Inter-Branch Team (IBT) with representation of all agencies and branches of County government. The role of the IBT is to facilitate accountability, coordinate ESJ work across County government and develop strategies and tools to support actions to advance fairness and opportunities for all.
Members of the IBT have direct access to their agency senior leadership and work within their agencies to build ESJ into the fabric of King County government. This requires intention and effort at multiple levels: individual employees must embrace the value of fair and just, all agencies must make meaningful commitments to improve equity in their lines of business, and county leadership must focus on equity and social justice considerations in decision-making. The ESJ IBT provides tools to support work by all emlpyees across agencies on these actions.
What is King County doing to promote fairness and opportunity?

KING COUNTY EQUITY AND SOCIAL JUSTICE ANNUAL REPORT—AUGUST 2012 19
2011 Equity and Social Justice work plan
The major areas of focus for the 2011 ESJ work plan were aligned with those recognized in the ordinance:
• Consider equity impacts in all decision-making, • Promote fairness and opportunity in County
government practices, • Build ESJ awareness and capacity through
communication with employees, partners and communities.
In each of these three areas, the IBT identi ed common actions across all County government agencies. In addition, each agency made agency-speci c commitments to actions in these three areas. Some of the countywide and agency-speci c achievements in 2011 are highlighted in the next section.
The 2011 ESJ work plan and commitments on equity made by each agency within the County have contributed to the following notable achievements:
Considering equity impacts in all decision-making
The County is able to increase its impact on equity by intentionally considering the current and historic equity impacts of its policy, budget and operational decisions.
Countywide Actions
The County’s $5 billion annual budget ordinance is one of the most important articulations of county priorities, policies and, of course, resource allocation. In 2011, the Offi ce of Performance, Strategy and Budget (PSB) held all agencies accountable for considering ESJ impacts in 2012 budgets and business plans. PSB designed and conducted training, developed templates and review tools, and included an overview in the 2012 proposed budget of how ESJ considerations in uenced budget decisions.
Some examples of how information on ESJ impacts in uenced budget decisions in the County Executive’s Offi ce include:
• An enhancement to the Parks Division White Center Teen Program, a youth soccer and basketball program in a diverse and low-income urban unincorporated area of the County.
• The re-opening of the Sheriff’s Of ce Skyway and White Center storefronts in response to community concerns in these diverse and low-income unincorporated communities.
Notable achievements in 2011
In addition, in 2011 PSB and the Executive’s Of ce continued to develop implementation of the King County Strategic Plan, with an intentional focus on ESJ:
• Standardization of business plans, with requirements for each agency to address ESJ impacts across and within its lines of business
• Development of agency “product catalogs,” with a focus on ESJ considerations as part of a product’s quality
• Inclusion of ESJ metrics in the measurement framework for the Strategic Plan.
PSB and the Executive’s Of ce will continue to lead this work with a focus on ESJ in 2012.

20 KING COUNTY EQUITY AND SOCIAL JUSTICE ANNUAL REPORT—AUGUST 2012
Agency-specifi c actions
Metro Transit included social equity as a primary focus of its new Transit Strategic Plan that determines how transit services are allocated in King County (see agency pro le on page 21).
The Roads Services Division assigned a high priority to emergency storm response that was responsive to the transportation needs of lower-income residents, such as snow and ice removal along transit routes that serve those communities.
The Offi ce of Economic and Financial Analysis integrated measures by income and ethnicity into the King County economic outlook (some examples of information they developed are included in the rst section of this report).
Several agencies integrated ESJ considerations into policies related to youth in the Criminal Justice system:
• The Department of Adult and Juvenile Detention identi ed school policies as a promising approach to in uence disproportionate minority con nement. Working with the Seattle School District, the policy of dropping youth from school enrollment after only 24 hours in detention was changed to 72 hours. As a result, a large number of detained youth who were released at rst appearance no longer are required to go through an enrollment process to return to school.
• The Sheriff’s Offi ce provided youth mentoring through community-based, bilingual gang education and prevention programs for Latino, Southeast Asian, and Paci c Islander middle and high school students in south and southwest King County.
• The Prosecuting Attorney’s Offi ce developed a youth truancy prevention program to divert more cases out of the court system and reinvest a portion of those savings into services designed to get a greater number of truant youth back to school. Of 1,405 petitions led, only 258 proceeded to an initial hearing. The
remainder were dismissed with the youth returned to school. The goal is to further reduce the number of hearings by 100 in the next school year.
Multiple agencies integrated the County’s equity impact review tool into their decision-making processes:
• The Department of Judicial Administration used the tool during the policy development phase for Drug Court’s new Transitional Housing Project (THP). The THP offers 15 housing units with a more extensive level of services than the other options for housing placement by the Court. The year-end review using the tool showed that there was equitable access regardless of race to the THP among eligible homeless defendants in King County Drug Court.
• The Department of Community and Human Services used the tool in developing the plan for the renewal of the Veterans and Human Services Levy.
• District Court used an equity impact review to expand the eligibility criteria for the pilot of the Veterans’ Court track in the Regional Mental Health Court.
• Public Health used the tool to study the impact of the elimination of the rodent control program. As a result, the department was able to mitigate equity impacts to low-income and diverse communities through creative program restoration without added cost.

KING COUNTY EQUITY AND SOCIAL JUSTICE ANNUAL REPORT—AUGUST 2012 21
Metro Transit
Metro Transit is committed to providing services that contribute to equitable access to transportation for everyone in King County.
That commitment is re ected in the new Strategic Plan for Public Transportation and service guidelines that were adopted by the County in 2011. This pioneering approach places the highest priority on productivity, social equity and geographic value. The Strategic Plan and service guidelines use measurable data to support allocation of transit service to low-income and minority neighborhoods.
Metro’s Strategic Plan mirrors the King County Strategic Plan by including the goal “Human Potential: Provide equitable opportunities for people from all areas of King County to access the public transportation system.” Strategies for achieving this goal are:
• Design and offer a variety of public transportation products and services appropriate to different markets and mobility needs.
• Provide travel opportunities for historically disadvantaged populations, such as low-income people, students, youth, seniors, people of color, people with disabilities, and others with limited transportation options.
• Provide products and services that are designed to provide geographic value in all parts ofKing County.
An example of how the plan and guidelines impact decisions for where to provide transit service is the process for setting target service levels for the transit system. One of the steps in this process is to identify corridors that have many low-income or minority residents. Metro sets higher service-level targets for those areas. The guidelines also place a high priority on investments that reduce overcrowding and improving schedule reliability. This also bene ts low-income and minority communities, where transit services typically get heavy use. In addition, Metro serves people with special transportation needs by offering a range of innovative public transportation services, such as services for people with disabilities, taxi scrip, and job access and reverse commute programs.
Metro also uses concrete performance measures to track progress on its Human Potential goal and strategies:
• Percent of low-income population within ¼-mile walk access to transit
• Percent of minority population within ¼-mile walk access to transit
• Accessible bus stops
In 2012, Metro Transit will begin implementation of transit service changes according to the new Strategic Plan and service guidelines.

22 KING COUNTY EQUITY AND SOCIAL JUSTICE ANNUAL REPORT—AUGUST 2012
Promoting fairness and opportunity in County government practices
King County aims to foster an organizational culture that promotes opportunity and provides fair treatment of all employees, contractors, clients, community partners, residents, and others who interact with King County.
Countywide actions
The Finance and Business Operations Division led reform of the County’s procurement practices to promote ef ciency and equity in contracting. The Division:
• Simpli ed the King County contract boilerplate and eliminated 15 pages of redundant forms
• Reduced cycle time by more than 50% for small contracts
• Increased opportunities for small businesses to contract with the county for consulting work and established a more diverse consultant pool
• Established a regional certi cation program for small contractors and suppliers (SCS) so that a business can submit a single application and be eligible for public contracting with multiple jurisdictions including King County, the Port of Seattle and Sound Transit
• Created the county’s rst ever Job Order Contract (JOC) that provides extensive opportunities to subcontractors for a variety of small-scale repair and construction projects. Using $4 million in subcontractor public works, the county has launched approximately 50 separate projects that are under $350,000 each.
As a result, there was an 89% increase compared to the previous year in the actual number of construction contracts awarded to small contractors (102 compared to 54) and a 42% increase in the contract dollar value awarded to small businesses ($33.2 million compared to $23.3 million). The Division will continue reforms in 2012.
The Department of Executive Services developed ESJ awareness training and collaborated with departments to meet their ESJ training needs. In addition to the County’s introductory ESJ awareness training, the Department developed two new trainings that incorporate Equity & Social Justice principles: “Micro-inequities & Micro-aggressions in the Workplace” and “Apology: An Essential Leadership Tool.” The Department also offered other trainings, including anti-discrimination/anti-harassment training and cultural competency training.
The Human Resource Division embedded ESJ considerations into its enhancement of practices related to hiring process. These include:
• Implementation of customer service protocols for use with applicants during recruitment process
• Clearly stated minimum quali cations for employment with the county
• Deletion of the felony conviction question from the general employment application
• Training on ensuring diversity throughout the hiring process.
The Human Resources Division also partnered with the County Executive’s Offi ce on a new Employee Performance and Accountability System (EPAS). EPAS is designed to align with the King County Strategic Plan and holds employees accountable to the “Fair and Just” guiding principle of the Plan. In 2011, EPAS was piloted with the Executive Leadership Team and department directors, who each set ESJ-speci c goals. The pilot will be further expanded in 2012, with additional focus on ESJ.
Agency-specifi c actions
In 2011, several agencies focused on ESJ awareness and training:
• Public Health reviewed its hiring and promotion process and developed Countering Bias training for people involved in interviewing job candidates (see agency pro le on page 23).

KING COUNTY EQUITY AND SOCIAL JUSTICE ANNUAL REPORT—AUGUST 2012 23
• The Sheriff’s Offi ce applied for and was awarded a U.S. Justice Department grant for the Listen and Explain with Equity and Dignity (LEED) training model. The Sheriff’s Of ce is using the grant to design, develop, introduce, and evaluate this procedural justice training curriculum for all police of cers. The training is based on the concept and practice of Justice Based Policing.
• Superior Court sponsored a viewing of Part 3 of ‘Race: The Power or an Illusion’ through the Courts and Community Committee. More than
half of the 53 judges and 12 commissioners attended. The session resulted in a recommendation to sponsor a special judges’ retreat where equity and social justice issues of import to the court could be discussed at length.
• The Department of Executive Services conducted the Micro-inequities and Micro-aggressions in the Workplace training for all of its staff.
Public Health Human Resources Project
Public Health convened a team of supervisors, managers, and front line staff, led by a Public Health quality improvement specialist and Human Resources Analyst. The team conducted
a root cause analysis to explore reasons why we might see less diversity in our highest paid classi cations and to recommend action items to increase the diversity of Public Health staff throughout the organization. After completing a root cause analysis, the team generated a robust list of possible interventions to reduce the impact of bias and institutionalized racism on the hiring process. The recommendations for best practices in hiring generated by the team were considered by project sponsors for feasibility and used to develop an action plan.
In addition to completing the project and developing the action plan, the following implementation steps were accomplished in 2011:
• A one hour training titled “Countering Bias” was developed. The training provides statistical data on Public Health applicants and hires, information on implicit bias and the impact it can have on hiring, and measures to counter it. Many hiring managers arranged a “just-in-time” training for interview panels.
• Hiring managers were encouraged to have diverse interview panels and ensure all selection tools are developed before candidate application materials are forwarded for interview consideration.
• Presentations about the project and elements of the “Countering Bias” training were shared with other county of ces and groups including the Human Resources Division and the King County human resources professional community.
In 2012, Public Health will implement “just in time” Countering Bias training for all interview panels.

24 KING COUNTY EQUITY AND SOCIAL JUSTICE ANNUAL REPORT—AUGUST 2012
Building ESJ awareness through communication with employees, community partners, and communities
Raising awareness among employees about equity and social justice and how their work relates to it is necessary to fully integrate ESJ into the fabric of King County’s work. In addition, in order to effectively impact equity, King County must also establish partnerships and gain active support in the community for goals and actions related to ESJ. This requires an active role by the County in informing, educating and learning from County residents and communities about ESJ.
Countywide actions
In 2010, the County Executive signed an Executive Order directing translation of select County documents into languages commonly spoken in King County. In 2011, the County Executive’s Offi ce and county agencies continued implementation of the translation policies, using tools included with the Executive Order, such as language maps (see agency-speci c examples below).
The County Executive’s Offi ce also launched a revised website on the County’s ESJ work and features it on both the King County home page and the Executive’s home page. Visit www.kingcounty.gov/equity.
The Department of Executive Services designed a poster on the Determinants of Equity (see page 5) for display in conference rooms and other highly-visible areas throughout King County locations. The design is also used in county ESJ awareness training. The poster is designed to stimulate thought and conversation on how work at King County can impact equity.
The Public Health led work across county agencies to develop a Community Engagement Guide and tools to guide county employees in more effective engagement and customer service with all
communities in the county. See www.kingcounty.gov/exec/equity/toolsandresources.aspx.
Agency-specifi c actions
In 2011, several agencies focused on implementation of the Translation Executive Order and creation of culturally and linguistically appropriate websites and materials. Speci c examples include:
• The Offi ce of Emergency Management created a multi-lingual online resource for disaster preparedness.
• The Assessor’s Offi ce translated materials and web content to make it easier for non-native English speakers to understand their property valuations and taxes.
• Metro Transit translated materials for RapidRide B line into English, Spanish, Vietnamese, Russian, Somali, Korean, and Chinese.
• The County Executive’s Offi ce translated the Executive’s 2011 State of the County into Spanish and Chinese and integrated ESJ considerations into speeches and press releases.
Several King County agencies focused on creating more effective outreach to cultural and linguistic communities. Examples include:
• The Roads Services Division engaged the local community in plans for replacement of the South Park Bridge. The Division made use of ethnic media, participated in cultural events, and created outreach materials—brochures, magnets, maps, signage—that integrated English, Spanish and Vietnamese as part of the design.
• In addition to translating materials as mentioned above, Metro Transit undertook outreach for the RapidRide B Line at a variety of public outreach events and in information kiosks. Written materials included basic information in English and a phone number to call a Korean, Russian, Ukrainian, Chinese, Japanese, Somali, Spanish, or Tagalog interpreter.
• King County Elections conducted special

KING COUNTY EQUITY AND SOCIAL JUSTICE ANNUAL REPORT—AUGUST 2012 25
voter forums, workshops, and training sessions for communities and organizations interested in actively partnering in the election process through providing voting information and assistance (see agency pro le below).
In 2011, several county agencies also utilized the Community Engagement Guide to inform and improve their plans for services in particular communities. Examples include:
• The Department of Community and Human Services used the guide to strengthen community input in the development of the pilot for the Veterans’ Court track of the Regional Mental Health Court.
• The Wastewater Treatment Division applied the guide to several capital projects including Sunset and Heath eld Pumpstation upgrades, Ballard Siphon replacement, and Lakeland Hills Pumpstation repairs.
• Public Health applied the Community Engagement Guide when seeking community input during the development of a large grant proposal. The community engagement team involved in the grant proposal produced a document with lessons learned and recommendations to improve future community engagement.
King County Elections Community Outreach
Every year, King County Elections establishes an outreach program that sends staff members to large annual community events (such as Bumbershoot), as well as smaller festivals and
celebrations. The outreach teams include staff members who are able to provide Chinese language translation and—in 2011 for the rst time—translation services and translated documents for Vietnamese speaking citizens, in compliance with the National Voting Rights Act.
As a commitment to meeting its ESJ goals and continual expansion of reach in King County communities, Elections has expanded its voter registration and education outreach programs with a focus on ethnic communities and other underserved populations. New partnerships have been formed with organizations already active in serving the targeted communities.
King County Elections works with U.S. Citizenship and Immigration Services to provide voter registration to new citizens. Elections staff members attend naturalization ceremonies to talk with new citizens and to offer them voter registration services. Elections also provided training for employees of immigration agencies, so that they can inform new citizens about voter registration.
King County Elections has also established a connection with WinWin Network, a non-pro t organization dedicated to increasing cultural competency and community engagement. WinWin is af liated with a variety of ethnic and underserved communities and has welcomed King County’s interest in helping to bring voter registration and education programs to the broader community. Elections has organized voter registration classes and attended outreach events for the groups that WinWin Network serves.
On July 4, 2011, following a naturalization ceremony at U.S. Citizenship and Immigration Services, King County Elections made voter registration available for the 526 new citizens, coming from 86 countries.

26 KING COUNTY EQUITY AND SOCIAL JUSTICE ANNUAL REPORT—AUGUST 2012
Postscript
King County is committed to working toward fairness and opportunity for all people and communities. We will make progress by intentionally considering equity in everything that we do as a government. Every agency in King County is making commitments annually to advance equity.
This report describes why an intentional focus on equity is needed and some notable accomplish-ments and lessons learned in 2011. It serves as a
very simple and motivating accountability mechanism that we will continue to apply in future years to improve our efforts.
Starting, sustaining, and integrating the focus on equity creates a virtuous cycle of learning and improvement. We do not have all the answers and we have much work to do. Yet, we remain rm in our resolve to work toward creating a fair and just King County.
www.kingcounty.gov/equity