equitas small finance bank latent view analytics ltd
TRANSCRIPT

Equitas Small Finance Bank
IPO NOTE
9-Nov-2120
Equitas Small Finance Bank
IPO NOTE IPO NOTE
LATENT VIEW ANALYTICS LTD.

Incorporated in 2006 in Chennai, Latent View Analytics provides services ranging from data and analytics consulting, business analytics andinsights, advanced predictive analytics, data engineering and digital solutions. It serves clients across countries such as United States,Europe, and Asia through their subsidiaries in the United States, Netherlands, Germany, United Kingdom and Singapore and have their salesoffices in San Jose, London and Singapore. Latent View has worked with over 30 Fortune 500 companies in the last three fiscals and some ofthe key clients include Adobe, Uber Technology and 7-Eleven.
FINANCIAL HIGHLIGHTS ISSUE DETAILS
ISSUE SIZE
OVERVIEW
₹ crore
Issue Date 10th Nov’21 –12th Nov’21
Price Band ₹190-₹197
Bid Lot 76 Shares
Issue Size ₹600 cr
No. of Shares (Post Issue) 19.8 cr
Post-Issue Implied Market Cap* ₹3,894.7 cr
Price to Earnings Ratio (FY21)*
42.6x
* At upper price band
FY19 FY20 FY21 Q1 FY22
Revenue from Operations 288 310 306 88
EBITDA 78 96 113 29
Net Profit 60 73 92 22
Total₹600 cr
Fresh Issue₹474 cr
Offer For Sale₹126 cr

ABOUT THE COMPANYThe company aims to help organizations interpret data accumulated fromsources such as business operations, social interactions and sensors by usingthe power of big data through business analytics and data insights. Itsexpertise includes digital solution accelerators, big data capabilities, socialmedia predictive analytics and analytics tools. In the last three fiscals itintroduced SmartInsights, MatchView and Spotcast new solutions.
Its scope of work is classified into:
• Consulting services- It involves understanding relevant business trends,challenges and opportunities and preparing a roadmap of data andanalytics initiatives that addresses them.
• Data engineering- Undertaken to design, architect and implement thedata foundation required to undertake analytics.
• Business analytics- It delivers analysis and insights for clients to takemore accurate, timely and impactful decisions.
• Digital solutions- It develops to automate business processes, predicttrends and generate actionable insights.
284.193%
11.74% 10.1
3%
United states India Rest of the world
REVENUE BREAKUP BY GEOGRAPHY(FY21)
Total: ₹305.9 cr
Rest of the world includes United Kingdom, Netherlands and Singapore

ABOUT THE COMPANY
165.9187.1 193.5
29.725.8
29.438.2
47.953.7
54.1
49.5 29.4
2019 2020 2021
Technology CPG and Retail Industrials BFSI
REVENUE BREAKUP BY INDUSTRY
It provides services primarily to companies in Technology, CPG (consumer packaged goods) and Retail, Industrials, and BFSI (Banking,Financial Services, and Insurance) industries. It has a diversified client base of 45 active clients worldwide that it served in FY21 including21 of the fortune 500. In FY21, count of clients stood as: less than ₹5 crore- 29, Between ₹5 crore to ₹10 crore- 10, between ₹10 crore to₹50 crore-5 and above ₹50 crore- 1 client. Revenue from operations from top five clients was ₹165 crore i.e. 54% of the revenue.
₹ crore

COMPETITIVE LANDSCAPE• Its competitors include large enterprise software companies and system integrators and many of its existing competitors have
substantial competitive advantages such as greater name recognition, longer operating histories, larger client bases and resources.
• The markets for data and analytics is very competitive and such competition is expected to continue or increase in the future. Certainof its competitors include Mu Sigma, Fractal, Tiger, Palantir and Accenture.
Fractal is one of the most prominent players in the
artificial intelligence space. Its mission is to power every human
decision in the enterprise and to bring AI,
engineering and design.
Mu Sigma is a pure-play big data analytics and
decision sciences company with a unicorn status in the US. It works
with more than 140 fortune 500 companies.
Tiger Analytics is pioneering what AI and analytics can do to solve
some of the toughest problems faced by
organizations globally. It has offices in multiple
cities across the US, UK, India, Singapore.
Accenture is a global services and consulting
company. It offers strategy and consulting,
technology and operations services.

COMPETITIVE LANDSCAPE
Particulars Mu Sigma Fractal Tiger Palantir Latent View
Revenue ₹949 cr ₹790 cr ₹84 cr $742 m ₹330 cr
EBIT Margin 42.2% (5.1%) 9.8% (74.5%) 28.2%
PAT Margin 32.3% (9.7%) 7.1% (78.1%) 22.1%
Return on Equity 28.2% (27.8%) 81.4% (395.4%) 20.9%
Days of Sales Outstanding 68 73 41 25 62
Particulars Market Capital Revenue EBITDA Net Profit Price to Equity
Latent View Analytics ₹3,894.7 cr ₹306 cr ₹112.9 cr ₹91.5 cr 42.6x
Happiest Minds Technologies Limited
₹19,532.8 cr ₹773 cr ₹191 cr ₹162 cr 123.3x
COMPARISON WITH LISTED INDUSTRY PEERS
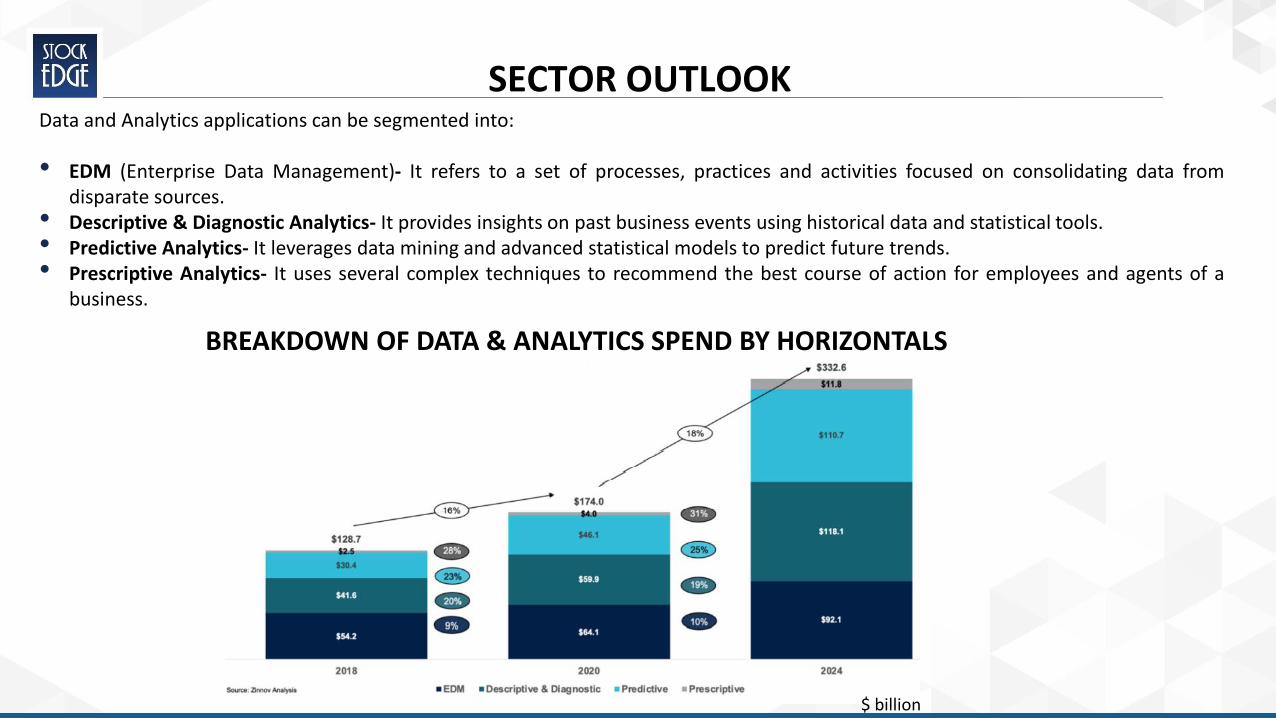
SECTOR OUTLOOK Data and Analytics applications can be segmented into:
• EDM (Enterprise Data Management)- It refers to a set of processes, practices and activities focused on consolidating data fromdisparate sources.
• Descriptive & Diagnostic Analytics- It provides insights on past business events using historical data and statistical tools.• Predictive Analytics- It leverages data mining and advanced statistical models to predict future trends.• Prescriptive Analytics- It uses several complex techniques to recommend the best course of action for employees and agents of a
business.
BREAKDOWN OF DATA & ANALYTICS SPEND BY HORIZONTALS
$ billion

KEY ENTERPRISE FUNCTIONS• Customer Analytics- It is used to map individual customer journeys by integrating customer data for segmentation and hyper-
personalization.• Marketing Analytics- Enterprises leverage it to identify the right channel strategy to optimize return in investment in advertising
costs.• Supply Chain Analytics- It enables enterprises to collect and evaluate the data generated across the different stages of a supply chain.• Finance and Risk Analytics- It combines several statistical models and algorithms to measure and predict risks with a higher degree of
certainty.• Geospatial Analytics- It harnesses the power of geo-referenced data from various sources, contextualizes the traditional data with
timing and location information, allowing enterprises to uncover trends.
BREAKDOWN BY IN-SCOPE FUNCTIONS

PROMOTER BACKGROUND AND SHAREHOLDING The promoters of the company hold a total of 79.3% and theirshareholding is as follows:
• Adugudi Viswanathan Venkatraman (69.6%)
• Pramadwathi Jandhyala (9.7%)
Adugudi Viswanathan Venkatraman is the founder andchairman of the company and is also acting as a director.
Pramadwathi Jandhyala is a co-founder of the company.
Shareholding Pre IPO Post IPO
Promoters 79.3% 59.6%
Public 20.7% 40.4%
Total 100% 100%
Allocation of offer Share in Issue (₹ crore)
% of Issue
QIB 450 75%
NIB 90 15%
Retail 60 10%
Total 600 100%
Major Selling Shareholders Share in Issue (₹ crore)
% of OFS Issue
Adugudi Venkatraman 60.1 47.7
Gopinath Koteeswaran 23.5 18.7
Ramesh Hariharan 35 27.8

OBJECTS OF THE OFFER
EXPECTED DEPLOYMENT OF NET PROCEEDS
To be determined
Particulars Amount (₹ crore)
Estimated utilization of Net Proceeds
FY22 FY23 FY24
Funding inorganic growth initiatives 148
Funding working capital requirements of Latent View analytics, its subsidiary 82 38 17 27
Investment in its subsidiaries to augment their capital base for future growth 130 40 50 40
General corporate purposes
The actual deployment of funds towards funding inorganic growth initiatives will depend on a number of factors, including thetiming, nature, size and number of acquisitions to be undertaken, as well as general factors affecting its results of operation,financial condition and access to capital.

RISK FACTORS
• It has historically derived more than 90% of its revenues from operations from clients located in the United States of America.Since, significant portion of its revenue is being derived from clients located in United States and risks are associated with anyadverse developments in market of United States, it could adversely affect its business and revenues.
• If it is unable to sufficiently differentiate its offerings from the integrated or bundled products of existing competitors, it may seea decrease in demand for its services which could adversely affect its business, financial condition and results of operations.
• Exchange rate fluctuations may adversely affect its results of operations as some portion of revenues and a significant portion ofexpenditures are denominated in foreign currencies.
• Its revenues are highly dependent on a limited number of industry verticals and any decrease in demand for outsourced servicesin these industry verticals could reduce their revenues and adversely affect business, financial condition and results of operations.
• It relies on third-party data centers and cloud computing providers and any interruption or delay in service from these facilitiescould impair the delivery of its products and adversely impact business and results of operations.
• Its business depends on the ability to remain updated with new technologies and continue to develop digital solutions to addressthe needs of its clients, failing which its business and results of operations could suffer.

STATEMENT OF PROFIT AND LOSS
ParticularsData for the period
(₹ crore)
2019* 2020 2021 Q1 FY22
Revenue From Operations 288 310 306 88
Other Income 8 20 21 4
Total Income (I) 296 330 327 92
Employee Benefit Expenses 174 198 177 50
Finance Costs 3 3 3 1
Depreciation and Amortization Expense 7 7 7 2
Other Expenses 41 32 24 11
Total Expenses (II) 225 240 211 64
Profit/(Loss) Before Tax (I-II) 71 90 116 28
Total Tax Expense (III) 11 17 25 6
Net Profit/(Loss) for the Period (I-II-III) 60 73 91 22
*Proforma

STATEMENT OF ASSETS AND LIABILITIESParticulars Data as on 31st March (₹ crore)
2019* 2020 2021 30th June, 2021
Investments 99 72 139 139
Right of Use Assets 33 30 25 24
Trade Receivables 51 53 61 64
Cash & Cash Equivalents 47 75 135 179
Other Non-current Assets 39 65 38 49
Other Current Assets 55 103 121 133
Total Assets 324 398 519 588
Total Equity 267 348 438 462
Lease Liabilities 36 33 29 28
Trade Payables 6 3 3 7
Borrowings - - 23 67
Other Non-Current Liabilities 2 3 3 3
Other Current Liabilities 13 11 23 21
Total Liabilities and Equity 324 398 519 588
*Proforma

STATEMENT OF CASH FLOW Particulars Data as on 31st March
(₹ crore)Data as on
2019 2020 2021 30th June, 2021
Net cash generated from / (used in) operating activities (A) 64 63 90 16
Net cash generated from / (used in) investing activities (B) (47) (34) (45) (17)
Net cash generated from / (used in) financing activities (C) (6) (5) 17 36
Net increase / (decrease) in cash and cash equivalents (A+B+C)
11 24 62 35

Particulars Data as on 31st March As of & For 3
Months Ended
2019 2020 202130th June,
2021
EBITDA Margin 27.1% 30.9% 36.9% 32.7%
PAT Margin 20.7% 23.5% 29.9% 25.4%
Net Worth (₹ crore) 267 348 438 462
Return on Equity 22.4% 20.9% 20.9% 4.8%
Return on Capital Employed 27.2% 23.1% 23.9% 5.9%
KEY METRICS

KEY TAKEAWAYS• As a result of the Covid, client premises were non-operational and on account of safe-distancing measures and other restrictions
imposed by regulators globally, most onsite personnel were stationed offshore, which increased the billing ratio of offshore toonsite personnel for assignments.
• Total expenses decreased by 12% from ₹239.5 crore in FY20 to ₹210.8 crore in FY21, due to a decline in employee benefit expenseand reduction in advertising and sales promotion expenses and travelling and conveyance expenses due to Covid related travelrestrictions.
• Net cash generated from financing activities turned positive and was ₹17.3 crore in FY21, on account of proceeds from long termborrowing of ₹22.9 crore primarily in the United States, share application money pending allotment of ₹1 crore and proceeds fromexercise of share options of ₹0.2 crore.
• Net cash flows used in investing activities was ₹45.4 crore in FY21, primarily on account of purchase of property, plant andequipment of ₹1.8 crore and purchase of investments of ₹138 crore. This was partially offset by proceeds from redemption ofinvestments of ₹76.9 crore, proceeds from maturity of bank deposits of ₹9.6 crore and interest received of ₹8 crore.

SWOT ANALYSIS
• Latent View has a variety of service offerings across the data andanalytics domain. Approximately 90% of its revenue is derived fromclients of the United States of America. Top 5 clients account for 54%of revenues.
• Latent View has a strong client base and has worked with over 30Fortune 500 companies in the last three fiscals. Some of the keyclients include Adobe, Uber Technology, and 7-Eleven.
• They have identified Canada as an important and margin accretivemarket going forward.
StrengthsDiversified product
offerings
OpportunitiesGrowing data and analytics demand
ThreatsIntense competition
Dynamic market of technology
Weakness
High concentration risk

Disclaimer:
This document is published for learning purposes only and nothing contained herein shall beconstrued as a recommendation on any stock or sector.
IPO NOTE
Issue Opens
Issue closes
Finalization of basis of allotment
Initiation of refunds
Credit of shares to
depository
IPO Listing Date
10 Nov
16 Nov
17 Nov
18 Nov
22Nov
12 Nov
TIMELINES
Neither Kredent Infoedge P Ltd. nor any of its associates have any financial interest in the subject company.
Neither Kredent Infoedge P Ltd. nor any of its associates have actual/beneficial ownership of one per cent or more securities of the subject company, at the
end of the month immediately preceding the date of publication of the research report or date of the public appearance.
Neither Kredent Infoedge P Ltd. nor any of its associates has, any other material conflict of interest at the time of publication of the research report or at the
time of public appearance.
Neither Kredent Infoedge P Ltd. nor any of its associates have received any compensation from the subject company in the past twelve months.
Neither Kredent Infoedge P Ltd. nor any of its associates have managed or co-managed public offering of securities for the subject company in the past twelve
months.
Neither Kredent Infoedge P Ltd. nor any of its associates have received any compensation for investment banking or merchant banking or brokerage services
from the subject company in the past twelve months.
Neither Kredent Infoedge P Ltd. nor any of its associates have received any compensation for products or services other than investment banking or merchant
banking or brokerage services from the subject company in the past twelve months.
Neither Kredent Infoedge P Ltd. nor any of its associates was a client during twelve months preceding the date of distribution of the research report.
Neither Kredent Infoedge P Ltd. nor any of its associates has served as an officer, director or employee of the subject company.
Neither Kredent Infoedge P Ltd. nor any of its associates has been engaged in Market making for the subject company.
Kredent Infoedge P Ltd shall provide all other disclosures in research report and public appearance as specified by the Board under any other regulations.
DISCLOSURES