equilibria in the system mgo-,sior-hro: a thermodynamic analysis
TRANSCRIPT

American Mineralogist, Volume 70, pages 237-248, 1985
Equilibria in the system MgO-,SiOr-HrO: a thermodynamic analysis
How.mn.W. Dlv
Department of GeologyUniuersity of Califurnia, Dauis, Califurnia 95616
J. V. CrcnNosrv
Department of Geological SciencesUniuersity of Maine, Orono, Maine 04469
.c'ND H. J. Kuunr
School of Industrial EngineeringUniuersity of Oklahoma, Norman, Oklahoma 73019
Abstract
Thermodynamic analysis of experimentally determined reactions among HrO and the nineminerals: antigorite, anthophyllite, brucite, chrysotile, enstatite, forsterite, periclase, quaftz,and talc, shows that the available calorimetrically determined enthalpies and entropies arenot compatible with the hydrothermal experiments. Major discrepancies appear to exist forthe enthalpies of formation of talc and enstatite and for the entropy of anthophyllite. Theexperimental data, molar volumes and heat capacities are internally consistent, however, andpermit only one topology of phase diagram for Mg-anthophyllite, that first proposed byGreenwood (1963). Our "best" set of thermodynamic parameters, internally consistent withthese data, includes values for the enthalpy of formation from the elements (298 K, I bar) ofantigorite and anthophyllite: -71435 kJ and -12073 kJ respectively.
Introduction
Mineral equilibria in the system MgO-SiOr-HrO repre-sent a model for metamorphism of calcium-poor ultramaficrocks and, if thoroughly understood, could form reliablestarting points for further thermodynamic or experimentalexploration of equilibria that approximate natural reac-tions. Unfortunately, no consensus has yet emerged con-cerning either the basic topology of the phase diagram orthe thermodynamic properties of phases in this system.
Greenwood (1963) and Hemley et al. (1977) determinedequilibria among the phases anthophyllite (A), enstatite (E),forsterite (F), quartz (Q), talc (T) and HrO (W) and pro-posed phase diagrams that differed largely in the calculatedor assumed location of the water-conservative reactionT + E : A (see Fig. 1). Delaney and Helgeson (1978) calcu-lated a phase diagram similar to the one proposed byGreenwood (1963) except that the invariant points were atmuch lower pressure. Day and Halbach (1979) used experi-mental data on four reactions reported by Chernosky(1976) and Chernosky and Knapp (1977) to derive thermo-dynamic parameters for eleven reactions among these sixphases. They showed that calculated phase diagrams couldhave any of the topologies previously proposed as well asseveral others that had not been considered. All such calcu-lated diagrams were consistent with the experiments and
with the known heat capacities and volumes of the partici-pating phases but major discrepancies existed between thecalculated enthalpy or entropy of talc and that determinedcalorimetrically.
Experimental and calorimetric data have appeared since1979 that warrant a new attempt to evaluate the stabilityfield of anthophyllite and to extend the thermodynamicevaluation to equilibria involving antigorite (An), brucite(B), chrysotile (C), and periclase (P).
The purpose of this paper is to analyze these newexperimental and calorimetric data in the systemMgO-SiOr-HrO. We hope to show that the experiments,heat capacities and molar volumes of the phases are inter-nally consistent and that only one thermodynamically con-sistent phase diagram topology is permitted by these data.The experimental data appear to be incompatible with ex-isting calorimetrically derived enthalpies and entropies ofsome of the individual phases. Possible sources of thesediscrepancies are the measured enthalpies of talc and en-statite and the heat capacity function or entropy of antho-phyllite.
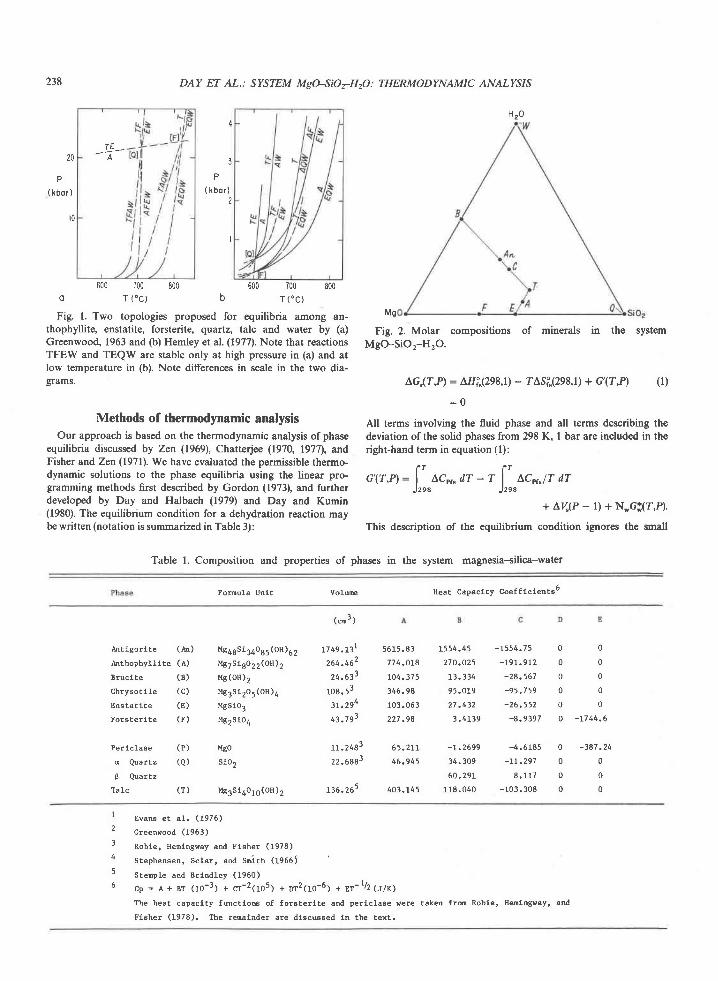
The compositions of phases are illustrated in Figure 2and some of their properties are summarized in Table 1.The equilibria with which we are concerned are listed inTable 2 together with the equations that describe the lineardependence of the reactions,
0003-o04x/8s/0304-{23 7$02.00 237
- !t-
238
20
P( kbor )
t0
DAY ET AL.: SYSTEM MgO-S\O7-H2O:THERMODYNAMIC ANALYSIS
4
3
P( kbo r )
2
I
600 700 800b r ( .c)
600 700 800o r ( "c)
Fig. 1. Two topologies proposed for equilibria among an-thophyllite, enstatite, forsterite, quartz, talc and water by (a)Greenwood, 1963 and (b) Hemley et al. (1977\. Note that reactionsTFEW and TEQW are stable only at high pressure in (a) and atlow temperature in (b). Note differences in scale in the two dia-grams.
Methods of thermodynamic analysisOur approach is based on the thermodynamic analysis of phase
equilibria discussed by Zen (1969), Chatterjee (197O, 1977), and,Fisher and Zen (1971\. We have evaluated the permissible thermo-dynamic solutions to the phase equilibria using the linear pro-gramming methods first described by Gordon (1973), and furtherdeveloped by Day and Halbach (1979) and Day and Kumin(1980). The equilibrium condition for a dehydration reaction maybe written (notation is summarized in Table 3):
Fig. 2. Molar compositions of minerals in the systemMgO-SiOr-HrO.
LG,(T,P): Alti"(2e8,1) - 7As;"(298,1) + G'(T,P) (1)
: 0
All terms involving the fluid phase and all terms describing thedeviation of the solid phases from 298 K, I bar are included in the
right-hand term in equation (1):
IT TTc'(T,P): I AC'r" dT -'r I LCpr.lT dT
J29a J29A
+ AV"(P - l) + N*Gi(r,4.
This description of the equilibrium condition ignores the small
Mg
Table 1. Composition and properties of phases in the system magnesia-silica-water
Pornula Unlt VoIu@ Heat capaclty Coeff lc lentso
Hzo
Antlgo. l te (An)
Anthophyl l l te (A)
B r u c l t e ( B )
C h r y s o t l l e ( C )
E n s t a t l t e ( E )
F o l s t e r i t e ( F )
P e r l c l a s e ( P )
a Q u a r t z ( a )
B Quartz
T a l c ( T )
Mg46Si34o65 (oH)5 2
MS7Sr8022(oH)2
Ms (oH)2
ttg3si205 (oH )4
!4CS1o3
l,tg2Slo4
ugo
s lo2
l te3s14016(oH)2
-t.2699 -4.6185
34.309 -tt.297
60.29L 8 .117
118.040 -103.308
o -387.24
0 0
0 0
0 0
( " r 3 )
1 7 4 9 . 1 3 I 5 6 1 5 . 8 3
264.462 77 4 .018
24.$3 to4 . 375
1 0 8 . 5 3 3 4 6 . 9 8
3r .2g4 103.063
4.793 227.98
r .2483 65 .211
22.6a83 46.945
136.265 403.145
t554.45 -1554.75 0 0
270.025 -191.912 0 0
13.334 -28 .567 0 0
95.019 -95 .759 0 0
27.432 -26 .552 0 0
3 .4139 -8 .9397 0 -1744.6
I
2
4
5
6
E v a n a e t a 1 . ( 1 9 7 6 )
G r e e n w o o d ( 1 9 6 3 )
Roble, Heoingeay and Ftsher (1978)
s t e p h e n s e n , S c l a r , a n d s n i t t r ( 1 9 6 6 )
S t e o p l e a n d B r t n d l e y ( 1 9 6 0 )
Cp = A+ BT (10-3) + cr-21165; + 9a2116-6; * ur- ' lZ3lr )
The heat capaclty funct lom of foreter l te and perlc lase were taken frm Roble, I tenlngway, and
Fisher (1978). The remainder are dlscussed ln the text.

DAY ET AL.: SYSTEM MsO-SiOy-H2O: THERMODYNAMIC ANALI,S|,S 239
RI. (TEQH)
R2. (TFElt)
R 3 . ( * E W )
R4. ( lEqw)
R5. (rAew)
R6. (TFAW)
R 7 . ( T E A )
R8. (CrTi l )
R9. (CDFW)
RIo. ( InrTW)
Rll . (BPr,t)
T - 3 E + q + W
T + F = 5 8 + t t
A + F = 9 E + W
A - 7 E + Q + w
7 T - 3 A + 4 Q + 4 W
9 T + 4 F = 5 A + 4 1 , I
T + 4 8 = A
5 C - 6 F + T + 9 W
c + B - 2 F + 3 W
l n = 1 8 F + 4 T + 2 7 I
B = P + W
R 5 + 3 R 4 - 7 R l = 0
R 4 + R 7 - R t = 0
R 2 - R 3 - R 7 = 0
9 R 2 - R 6 - 5 R 3 = 0
Table 2. Reactions and equations of linear dependence in thesystem magnesia-silica-water
React t ron Reference L inearDependence
mentally dcrived constraints may define a closed region contain-ing all solutions consistent with the limiting experiments, molarvolumes, heat capacities and properties of HrO (e.g., Fig. 4., Dayand Halbach (1979) or Fig. 4, this paper).
It is clear from expressions (2) and (3) that the enthalpy andentropy of the solids in a reaction may be constrained using hy-drothermal experiments provided that heat capacities and molarvolumes are available for the participating solids and that thethermodynamic properties of HrO are known. We have calculatedvalues of C*(f,P) (Table 3) using the subroutines published byHolloway et al. (1971), which are based on the properties of HrOdetermined by Burnham et al. (1969). Molar volumes are listed inTable 1 together with heat capacity functions for the mineralsconsidered.
Molar uolume data
The molar volumes we have used are taken from the literature(Table l) for both natural and synthetic phases. The unit cellvolumes of phase synthesized for this study (Chernosky et al.,1985) are within the range ofvalues reported in the literature andcomparable to those used in the thermodynamic calculations. Wechose to accept the values already in the literature because ourrefinements were very sensitive to the method of refinement usedand were made on phases synthesized during runs of several days.Thus, we cannot rule out the possibility that the molar volumeswould continue to change slightly in experiments that last up toalmost 5000 hours.
Heat capacity data
We used the heat capacities that are listed in Table 1 as ex-tended Maier-Kelley functions of temperature. We prefer to avoidusing a T2 term in the function because such terms prohibit theo-retically reasonable extrapolations outside the temp€rature rangefor which experimental data are available (cf. Day and Halbach,1979, p.814). Heat capacity functions for the elements were takendirectly from Robie et al. (1978) despite the presence of T2 termsbecause no extrapolations were required for these data.
For periclase and forsterite, we used the heat capacity functionsreported by Robie et al. (1978). Robie, Hemingway, and Takei(1982) reported a slightly revised heat capacity function for forster-ite but we retained the earlier function because it reproduces theheat content data of Orr (1953) somewhat better for temperaturesup to 725'C.
Heat capacities for anthophyllite, enstatite, and talc are based
Table 3. Thermodynamic notation
T,P,v Teoperature (K), pressure (bare), Volure (cr3)
H; Standard 6taEe enthalpy of fomation fron the elenenrs( J / g f w ) ( 2 9 8 K , I b a r )
S; Sldndard state entropy of for[et lon fron the elenenEs(J/K-sfw) (298 K, 1 bar)
S' Third Lae enrropy (J/K-gfs) (298 K, 1 baE)
Cpt Hedt cspacl ly of foroat lon frm the eleEents (J/K-gfw)
Gf clbbs enetgy of fomarton fron the elenents (J/gfs)
G * G r , u r o ( r ' r ) + c H 2 o ( r , P ) - c r r 2 g ( r , l ) ( F L s h e r
a n d Z e n , 1 9 7 1 )
cr / lggacplrdr-r IT2g6Lcolr /r dr + avs(p-r) + rqc*r{r ,r)
r dubscrlpt tndtcattng "of react lon"
s subscript lndtcat lng "du€ !o aol idg ln r€act lons..
1
I
I
1
I
I
I
2
3
4
5 , 6
lchernosky er al . (1984)2ctrernosky (1982)
3Johannes (196E)
4 B v a n s e t a l . ( 1 9 7 6 )5schrarke er al . (1982)6Earnee and Erosr (1963)
effects of isothermal compressibility and thermal expansion on themolar volumes of the solid phases but is otherwise exact. Thermalexpansion and compressibility are unknown for many phases andit is not clear whether estimating these properties improves thethermodynamic analysis or whether it introduces more uncer-tainty than it removes. Consequently, we have chosen not to ex-press the molar volumes of the solids as functions of pressure andtemperature.
Most hydrothermal experiments define limits on the location ofan equilibrium curve rather than estimates of the true equilibriumtemperature or pressure. If the products of a reaction grow at theexpense of the reactants then
ac.(T,P) < 0 (2)
or
An;"(298,1) < TAs;"(2e8,1) _ c,(T,P\
Likewise, if the reactants grow at the exp€nse of the products:
AG.(T,P) > 0
Alri"(298,1) > "Asi"(298,1)
- c'(T,p)
Linear programming analysis requires, however, that expressions(2) and (3) be written as < or 2 inequalities implying that theequilibrium curve might actually pass through a pressure-temperature coordinate at which significant reaction was ob-served. Clearly, the < or > inequalities would be a thermody-namically incorrect description of the experiments, but the dis-crepancy is of no practical consequence because the observed tem-perature brackets could be narrowed by an arbitrary fraction ofone degree Celsius so that these inequalities would be formaltycorrect. After substituting < or > inequalities, expressions suchas (2) or (3) define a straight line on a graph of A.EIri versus ASi,having a slope equal to the temperature of the experiment. Combi-nations of enthalpy and entropy violating the experiment lie onone side of the line while combinations satisfying these inequalitieslie on the other side and on the line itself. A set of such experi-
(3)

240 DAY ET AL.: SYSTEM MeHiOrHzO: THERMODYNAMIC ANALYSd
on the functions reported by Krupka et al. (1971,1979). The heatcapacity of end-member anthophyllite was estimated from theproperties of the natural mineral measured by Krupka et al. (1979)according to the scheme:
co(MBrSieozz(oH)r) : Co(MBe.rFeo..rSi8o22(oH)2)
- 0.35Co(FerSiOJ + 0.35Co(MgrSiO)
The heat capacity of fayalite was taken from Robie et al. (1978).The extended Maier-Kelley lunction obtained was used to calcu-late heat capacities at 298.15 K and at twenty degree intervals to700 K. The twenty-two calculated heat capacities were fit by least-squares regression to a three term polynomial to permit extrapola-tion above 700 K. The heat capacity function for orthorhombicenstatite differs substantially from the one used by Day and Hal-bach (1979) and was derived by least squares regression on 37values calculated from the extended Maier-Kelley function report-ed by Krupka et al. (1979) in the temperature interval 298-1000 K.The heat capacity function for talc was derived by regression ontwenty values in the temperature range 298-650 K calculated fromthe extended function reported by Krupka et al. (1977).
The heat capacity functions for alpha and beta quartz and theenthalpy of the alpha-beta transition (848 K, LH"t:290 calo-ries : 1213 J) were taken from Kelley (1960) and are compatiblewith the compilation of Robie and Waldbaum (1968). These heatcapacity functions yield high+emperature heat contents of alphaquartz that are no more than74 J greater than those preferred byRobie et al. (1978) and Stull and Prophet (r,w.u Tables, 1971).However, the heat content of beta qtartz at 900 K is 647 I greatetthan the value preferred by Robie et al. (1978) and Stull andProphet (1971), most of which (485 J) can be attributed to thehigher apparent enthalpy of the alpha-beta transition chosen byKelley. We have chosen to retain the higher heat contents andheat capacity functions of Kelley (1960) because: (1) a recent un-published measurement cited by Stull and Prophet (1971) suggeststhat the rANAF heat content at 968 K may be too low by 314 J and(2) as pointed out by Helgeson et al. (1978, p. 21), integration ofthe heat capacity functions by assuming that the alpha-beta tran-sition is first order will tend to produce an underestimate of thetrue heat content of beta quartz. Judging from Figure 3c of Hel-
Mq.S i rO . (OH) .
CH RYSOTILE
400 600 800 roooT ( K )
Fig. 3. Comparison of heat capacity functions for chrysotile.
The curve from Chernosky was derived by regression analysis of
experiments and other calorimetric data (Chernosky, 1982,
Column B. Table 4).
geson et al. (1978), the underestimate might be as large as 200-
300 J.The heat capacity function for brucite is a weighted least
squares regression on the heat content data reported by King et
al.1975. However. the functions for both antigorite and chrysotile
are estimates that require further discussion' Because no high tem-
perature heat capacities are available for chrysotile, we have fol-
lowed the lead of Robie et al. (1978) and Helgeson et al. (1978) and
have assumed that the heat capacity of Mg.SirOr(OH)n (antigor-
ite, King et al., 1967) is a good estimate for chrysotile. King et al.
(1967) measured the high temperature heat content of antigorite
(Mg.SirOr(OH)*) up to 848 K. Their 11 data were fit by weighted
least squares regression to a Maier Kelley function:
cp(J/K):346.980+95.019 x 10-37 -95.759 x 10sT-2
which fits the raw data better than the function provided by King
et al. (1967). This estimated function for chrysotile differs in a
significant way from the heat capacity function derived by
Chernosky (1982). Because no direct measurements have been re-
ported by chrysotile, Chernosky (1982) used least squares regres-
sion techniques to derive a heat capacity function that would
produce good agreement between hydrothermal experiments and
available calorimetric data. Figure 3 illustrates a comparison of
the two heat capacity functions. The major differences in these
functions may help account for some of the discrepancies dis-
cussed later in this paPer.
The heat capacity of antigorite (MgorSi.oOrr(OH)o) was esti-
mated according to the scheme proposed by Helgeson et al. (1978'
p. 64, and Table 2) using the function for Mg.SirOr(OH)n report-
ed by King et al. (1961):
Co(Me+ssiroer(oH)", : 1 6[Co(Mg.Siros(oH)J]
+ 2 Ce(r-quafiz) - Ce (structural water)'
Cp :5615 .83 +1554 .45 x 10 -3? -1554 .75x10sT -2
The heat capacity of structural water was taken from Helgeson et
al.(l978,Table 2).
Enthalpies and entopies of formation. Enthalpies and entropies
of formation can be calculated from dehydration equilibria using
only a knowledge of the molar volumes and heat capacities of the
solids and the thermodynamic properties of water, as discussed
above. It is useful, however, to compare the values permitted by
the experiments with independent measurements. calorimetric de-
terminations of entropy and enthalpy for the solid phases of in-
terest are listed in Table 4. The properties of brucite, periclase,
quartz and talc are taken from Robie et al. (1978) and the sources
for the other data are listed in the footnotes. The enthalpies of
formation from the elements for enstatite and forsterite were cal-
culated from the heats of solution reported by Charlu et al. (1975)
using the heat capacities and heats of formation for the oxides in
Robie et al. (1978). The enstatite value is based on the mean of
three measured samples and the value for forsterite, on the mean
of two samples.
Experimental data base
Pressure-temperature brackets have been determined forthe eleven mineral reactions listed in Table 2. These elevenreactions involve nine solid phases and water' Because thefirst seven reactions in Table 2 define two invariant pointslinked by reaction 7, only three ofthose reactions are iode-pendent. The sources of the experimental data and the
-9
DAY ET AL.: SYSTEM MsO-S\O7H2O: THERMODyNAMIC ANALflSN 241
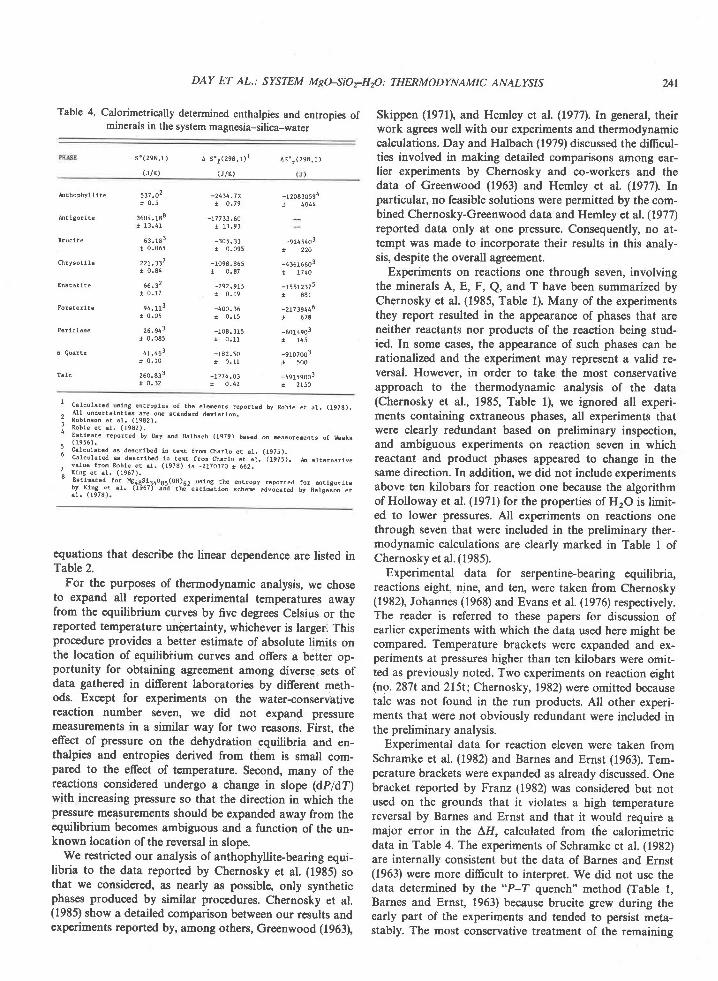
Table 4. Calorimetrically determined enthalpies and entropies ofminerals in the system magnesia-silica-water
Skippen (1971), and Hemley et al. (1977). In general, theirwork agrees well with our experiments and thermodynamiccalculations. Day and Halbach (1979) discussed the dillicul-ties involved in making detailed comparisons among ear-lier experiments by Chernosky and co-workers and thedata of Greenwood (1963) and Hemley et al. (1977). Inparticular, no feasible solutions were permitted by the com-bined Chernosky-Greenwood data and Hemley et al. (1977)reported data only at one pressure. Consequently, no at-tempt was made to incorporate their results in this analy-sis, despite the overall agreement.
Experiments on reactions one through seven, involvingthe minerals A, E, F, Q, and T have been summarized byChernosky et al. (1985, Table 1). Many of the experimentsthey report resulted in the appearance of phases that areneither reactants nor products of the reaction being stud-ied. In some cases, the appearance of such phases can berationalized and the experiment may represent a valid re-versal. However, in order to take the most conservativeapproach to the thermodynamic analysis of the data(Chernosky et al., 1985, Table l), we ignored all experi-ments containing extraneous phases, all experiments thatwere clearly redundant based on preliminary inspection,and ambiguous experiments on reaction seven in whichreactant and product phases appeared to change in thesame direction. In addition, we did not include experimentsabove ten kilobars for reaction one because the algorithmof Holloway et al. (1971) for the properties of HrO is limit-ed to lower pressures. All experiments on reactions onethrough seven that were included in the preliminary ther-modynamic calculations are clearly marked in Table I ofChernosky et al. (1985).
Experimental data for serpentine-bearing equilibria,reactions eight, nine, and ten, were taken from Chernosky(1982), Johannes (1968) and Evans et al. (1976) respectively.The reader is referred to these papers for discussion ofearlier experiments with which the data used here might becompared. Temperature brackets were expanded and ex-periments at pressures higher than ten kilobars were omit-ted as previously noted. Two experiments on reaction eight(no. 287t and 2l5t; Chernosky, 1982) were omitted becausetalc was not found in the run products. All other experi-ments that were not obviously redundant were included inthe preliminary analysis.
Experimental data for reaction eleven were taken fromSchramke et al. (1982) and Barnes and Ernst (1963). Tem-perature brackets were expanded as already discussed. Onebracket reported by Franz (1982) was considered but notused on the grounds that it violates a high temperaturereversal by Barnes and Ernst and that it would require amajor error in the AII, calculated from tlie calorimetricdata in Table 4. The experiments of Schramke et al. (1982)are internally consistent but the data of Barnes and Ernst(1963) were more diflicult to interpret. We did not use thedata determined by the "P-T quench" method (Table 1,Barnes and Ernst, 1963) because brucite grew during theearly part of the experiments and tended to persist meta-stably. The most conservative treatment of the remaining
s ' ( 2 9 8 , 1 )
(J/K)
a s ' r {zse , t ) l
(J /x )
a H " f ( 2 9 8 , r )
hthophy l l l te
h t lgor l te
Bruc l te
f r ryso !1 Ie
E n a t a t l t e
Per ic la€e
d Quar tz
sl t .o2J 0 . 5
3 6 0 4 . 1 8 8t 1 3 . 4 r
o : . t s 3t 0 , 0 6 5
22t.337J 0 . 8 4
t 6 , i 2i 0 . 1 7
9 a . t t 3r 0.05
Z t , g t 3
r 0.085
tL.t O3r 0 . 1 0
z o o . 8 3 3r o , 3 2
-2434.72t 0 . 7 9
- r 7 7 3 3 . 6 0
- 3 0 5 . 3 3r 0 , 0 9 5
- 1 0 9 8 . 8 6 5* 0 . 8 7
-292.915t 0 , 1 9
- 4 0 0 . 3 6i 0 . 1 5
- 1 0 8 . 3 1 5r 0 . 1 1
- r 8 2 , 5 0r 0 . [
-1274.O3i 0 . 4 2
-rzoeloss4T 4OLL
-gztsaolt 220
-l36to6o3
t \ 7 4 0
-t55t2375i 8 8 1
-zt1 3gtt6, 678
-6014903r I 4 5
-9toroo3r 500
-591:9003r 2150
I
23
56
78
Calcu la ted u€ lng enr ropreE o f rhe e lements repo l red by tub te e r a1 , (1978) .[ I unc€r ta ln t les a re oe s rendard dev tar ton .Rob lnaob e t a l , (1982) ,
R o b l e e t a l . ( 1 9 E 2 ) .
Es t lha te lepor ted by hy and e lbach (1979) based on Easurenents o f heks( 1 9 5 6 ) .
Ce lcu la ted a6 deecr lbed In rexr f ron f ra r tu e t a r . (1975) .Ca lcu la ted s descr lbd ln rex t f ln Ch6r1u € t a1 . (1975) . h a t te rna t lveva lue f ron kb l€ e t e l . (1978) ts -2170370 t 662.Ktns € t a l . (1967) .ts t_ lna ted fo r l rC i8s t34oO5(OH)52 us lng th en t ropy lepor ted fo r anr lgor l reby ( rng er a r . ( i967) a -n :d th ; -e6r lmt ton schem adv ;cared by He lgeson e ta r . ( 1 9 7 8 ) ,
equations that describe the linear dependence are listed inTable 2.
For the purposes of thermodynamic analysis, we choseto expand all reported experimental temperatures awayfrom the equilibrium curves by five degrees Celsius or thereported temperature unpprtainty, whichever is larger: Thisprocedure provides a better estimate of absolute limits onthe location of equilibiium curves and offers a better op-portunity for obtaining agreement among diverse sets ofdata gathered in diferent laboratories by different meth-ods. Except for experiments on the water-conservativereaction number seven, we did not expand pressuremeasuroments in a similar way for two reasonS, First, theeffect of pressure on the dehydration equilibria and en-thalpies and entropies derived from them is small com-pared to the effect of temperature. Second, many of thereactions considered undergo a change in slope (dprc7.)with increasing pressure so that the direction in which thepressure nieasurements should be expanded away from theequilibrium becomes ambiguous and a function of the un-known location of the reversal in slope.
We restricted our analysis of anthophyllite-bearing equi-libria to the data reported by Chernosky et al. (1985) sothat we considered, as nearly as possible, only syntheticphases produced by similar procedures. Chernosky et al.(1985) show a detailed comparison between our results andexperiments reported by, among others, Greenwood (1963),

242 DAY ET AL.: SYSTEM MgO-SiOrHzO: THERMODYNAMIC ANALYSIS
data in Tables I and 2 (Barnes and Ernst, 1963) is to acceptonly the high temperature experiments in which periclasewas produced at the expense of brucite. In fact, we foundthat no feasible thermodynamic solutions existed for reac-tion eleven if the other experiments were included in theanalysis. Consequently, our preliminary analysis of reac-tion eleven included the data from Schramke et al. (1982)and the high temperature experiments from Barnes andErnst (1963).
Pr eliminar y thermodynamic analy sis
Using the heat capacities and molar volumes listed inTable 1, we expressed each experiment on the eleven reac-tions considered as a constraint on the enthalpy and en-tropy of reaction similar to equations (2) and (3). Not allexperiments provide equally useful limits on the thermody-namic parameters and such redundant experiments are notconsidered in subsequent calculations. For example, elevenexperiments on reaction I were considered and only fourprovide boundary constraints on the thermodynamic pa-rameters. The relationships among the redundant andboundary constraints are illustrated in Figure 4. For thesake of clarity, only boundary constraints are listed inTable 5 and illustrated in subsequent figures.
Our preliminary treatment of the experimental datashows that the experimental data for each of the elevenreactions determined are internally consistent. That is, theexperimental pressure-temperature brackets, heat capaci-ties, molar volumes and Gibbs energy of water define feasi-ble solution spaces similar to that in Figure 4. The feasiblesolution spaces are defined by and can be constructed di-rectly from the boundary constraints listed in Table 5. Inpractice, for ease in plotting, our computer program liststhe vertices of the feasible polygon in addition to theboundary constraints.
Figures 4, 5, and 6 demonstrate that the experimentaldata are compatible, broadly speaking, with AIli" and ASi"calculated from the data in Table 4. We consider the datato be "broadly compatible" if the calorimetrically deter-mined enthalpy and entropy in question lie within theranges permitted by the experiments, although they maynot define a coordinate in the feasible solution space. Notethat the error bars illustrated in the figures are *one stan-dard deviation.
No significant inconsistencies appear for reactionsTEQW, TFEW, AnFTW, CBFW, and BPW (Figs. 4 and5). All the anthophyllite-bearing reactions (Fig. 6), however,display systematic discrepancies between calorimetric andcalculated enthalpies. The discrepancy ranges from 25-40kJ per gram-formula unit of anthophyllite and a systematicerror in the calorimetric enthalpy of about + 34 kJ(-O.3% of AI/i (A)) would eliminate most of the observeddifference. In view of the large and estimated correctionsmade for impurities in the analyzed anthophyllite (- -50
kJ, Weeks, 1956; Day and Halbach, 1979), we suggest thatthe hydrothermal experiments may provide a better esti-mate of the enthalpy of formation.
360
AHiskJ 35o
340
t90 200 zto 220
AS?s J /K
Fig. 4. Feasible solutions of AIIi" and ASi" for reaction no. 1:'TEQW. The combinations of AIli" and ASi" lying in the shadedregion satisfy all experimental brackets, the thermodynamicproperties of water and the heat capacity and molar volume datain Table 2. Filled circles are the vertices of the feasible solution
'space. Lines outside the feasible solution spaces are redundantconstraints provided by the experiments indicated in Table 1 ofChernosky et al. (1984). Error bars show the * one sigrna limitsfor the A.EIi" and ASi" calculated from the data in Table 4. Thebold (+) and (x) represent the "minimum deviation" data fromTable 6 and the "midpoint" from Table 7.
The entropies of the anthophyllite-bearing reactionsmight also be displaced (Fig. 6) in a way that suggests thecalorimetric entropy of anthophyllite is too small. How-ever, increasing the entropy of anthophyllite would in-crease the disagreement for reaction AFEW (Fig. 6a). Inaddition, the magnitude of the discrepancies (up to 30sigma in ASri) is too large, in our view, to argue that thecaf orimetric entropy of anthophyllite is the principal sovceof the error. We suggest that most of the error lies incalorimetric enthalpy of anthophyllite, but, as discussedlater, some error in the entropy may also be important.Clearly, other sources might also contribute to the discrep-ancies; for example: (l) disorder in the synthetic antho-phyllite, (2) inappropriate extrapolation of the anthophyl-lite heat capacity functidn to high temperature, (3) undetec-ted error in the experimental brackets.
Our preliminary analysis suggests that there is a majorinconsistency between the experimental and calorimetricdata for reaction 8 (CFTW). Figure 7 shows two feasiblesolution spaces and the values ofAIII and ASi. from Table4. The shaded part of the diagram is the feasible solutionspace defined by all the experiments listed in Table 5. Ifexperiment no. 55m (Table 5; Chernosky, 1982, Table 1) isremoved, the feasible solution space expands to permitvalues that are "broadly compatible" with the available
a H;s: 351489t3444
a sis= 212 ?95!o 6lo

DAY ET AL.: SYSTEM Mg0-S\O2-H2O. THERMODYNAMIC ANALYSIS 243
Table 5. Constraints on thermodynamic properties of reactionsand minerals. GE and LE mean ..greater
than or equal to" and"less than or equal to" respectively.
Exper lnenta l P ,T
non lns l expanded
Table 5. (Cont.)
T ( K )
Con6t ra lo r on en tha lpy and enr ropy
of 6o11ds ln the reac t lon
T ( K )
R 8 : 5 C - 6 F + T + 9 S
5 8
54
5 6
53o
3Zlt
289t
49m
43u
R I . T = 3 E + Q + f l
500
500
1000
4 2 7 4 3 2
409 4r4
399 392
2000 43r 424 - l aH(8) + 697.15 as(8) LE _1585386.924
5 0 0 0 4 9 6 4 9 r - l d H ( 8 ) + 7 6 4 . 1 5 A s ( 8 ) L E _ 1 4 8 0 6 8 8 . 1 3 9
5 0 0 0 s l l 5 r 7 - 1 A H ( 8 ) + 7 9 0 . 1 5 a S ( 8 ) c E _ 1 4 4 5 6 8 0 . 2 1 3
6 5 0 0 5 3 6 5 4 2 - r A H ( 8 ) + B r 5 , l 5 a S ( 8 ) c E - t 4 0 5 5 7 5 , 7 4 e
6 5 0 0 5 0 8 5 0 3 - r a B ( 8 ) + 7 7 6 , t 5 a s ( 8 ) E _ t 4 5 A 7 6 r , 7 7 a
- l A H ( 8 ) + 7 0 5 . t 5 A s ( 8 ) c E - 1 5 9 1 2 7 8 . 5 0 5
- 1 A H ( 8 ) + 6 8 7 . 1 5 6 5 ( 8 ) C E - r 6 1 2 9 t 4 . 7 0 9
- l a H ( 8 ) + 6 6 5 . 1 5 A s ( 8 ) L E - 1 5 3 4 1 5 6 . 1 0 6
5 0 0 6 1 2 6 7 7
1000 700 694
10000 790 785
10000 800 805
- r A H ( r ) + 9 5 0 . 1 5 A s ( r ) e- r A H ( l ) + 9 6 7 . l 5 A s ( 1 ) L E- r A E ( 1 ) + 1 0 5 8 . 1 5 A S ( 1 ) L E- l A H ( 1 ) + 1 0 7 8 . 1 5 ̂ S ( 1 ) C E
- r 5 0 3 9 4 . 0 6 6
- 1 4 5 0 6 0 . 6 5 5
- r 2 6 1 6 5 . 3 2 0-123295.9Js
R 2 : T + F - 5 E + WR 9 : C + B = 2 F + 3 C
1 6
35
l 0
30
500
1000
4000
6000
621
652
7 2 2
619
6 2 6 - r a H ( 2 ) + 8 9 9 . 1 5 d s ( 2 ) c E
6 4 7 - 1 a H ( 2 ) + 9 2 0 , 1 5 a s ( 2 ) L E
7 2 7 - r d f l ( 2 ) + 1 0 0 0 . 1 5 A S ( 2 ) C 8
6 7 4 - r a H ( 2 ) + 9 4 7 , 1 5 d s ( 2 ) L E
-L5745L.193
- 1 5 2 4 3 8 . 9 9 5
- t 3 9 3 2 7 . 0 6 2
-14626\.440
- 5 5 l r 8 8 , 0 5 7- 5 5 1 0 4 1 . 0 5 9
-529935.r02
-5099r2.302
8
22
2 6
370
3 7 5
4 t 0
440
r000
2000
5500
7000
3 7 5 - r A H ( 9 ) + 6 4 8 . 1 5 a s ( 9 ) c E
3 7 O - r a H ( 9 ) + 6 4 3 . 1 5 A s ( 9 ) L E
4 0 s - 1 A H ( 9 ) + 6 7 8 . 1 5 A S ( 9 ) n
4 4 5 - 1 A H ( 9 ) + 7 1 8 . 1 5 a s ( 9 ) c r
R 3 : A + F - 9 E + WR l o : h = 1 8 F + 4 T + 2 7 s
15 500 667 672
2 2 1 0 0 0 6 7 7 6 7 2
1 3000 695 700
r8 5000 684 679
8 6000 70t 707
- 1 a H ( 3 ) + 9 4 5 . 1 5 A S ( 3 ) c E- 1 a H ( 3 ) + 9 4 s . 1 5 6 5 ( 3 ) L E- l ^ 8 ( 3 ) + 9 7 1 , 1 5 A S ( 3 ) c E- r a H ( 3 ) + 9 5 2 . 1 5 A s ( 3 ) L E- 1 a H ( 3 ) + 9 8 0 , 1 5 a s ( 3 ) c E
55a 2000 480 175
47b 2000 540 545
49b 6000 560 555
48b 6000 590 59s
1 1 2 1 0 0 0 0 5 t 5 6 1 0
- r a H ( 1 0 ) + 7 4 8 . 1 5 A s ( 1 0 ) L E - 4 5 5 3 9 9 2 , 8 9 1
-1 Af l(10) + 818.15 as(10) E -4284069.125
- l A H ( r o ) + 8 2 8 . t 5 A S ( 1 0 ) L r - 4 t 5 9 7 6 a . 2 6 5
- r A f l ( r o ) + 8 6 8 . 1 5 d s ( r o ) f t - 3 9 9 6 8 4 3 . 6 1 5
- r A H ( r o ) + 8 8 3 . 1 5 A s ( r o ) L E - 3 8 9 7 5 4 5 , 0 6 6
-1 6E(10) + 908.15 As(]o) cE 47a2986.728
-151892.405
-154968.377
- 1 4 9 6 0 8 . 0 0 1
-15225t.967
-I49I45.514
6 7R 4 : A _ 7 8 + q + u
23 500 6a7
13 1500 752
3 r 1 0 0 0 0 8 r 0
6 9 2 - t a H ( 4 ) + 9 6 5 . 1 5 ̂ S ( 4 ) c E
7 5 ? - r a H ( 4 ) + 1 0 2 0 . 1 5 ̂ s ( 4 ) L E
8 l t - l A H ( 4 ) + 1 0 8 8 . 1 5 a S ( 4 ) c E
- 1 5 4 2 8 1 . 0 6 1- t 4 3 3 7 2 . 8 8 4
- r 3 1 6 4 0 . 4 8 3
B - P + W
R 5 : 7 T - 3 A + 4 Q + 4 w
s 3 8 1 3 0 8 0 6 8 l t
s4 8090 785 780
s l 3 5 1 3 0 7 2 0 7 1 5
sr7 3950 690 585
- l A H ( 1 r ) + r o 8 4 . 1 5 A s ( i l ) c E - 1 1 0 0 1 . 3 6 0
- l A H ( r l ) + 1 0 5 3 . r 5 ̂ S ( 1 1 ) L E - r r 5 8 5 r . 5 6 1
- I A n o l ) + 9 8 8 . 1 5 a s ( 1 1 ) L E - 1 2 8 6 1 2 . 8 1 4
- 1 A f l ( 1 1 ) + 9 5 8 . 1 5 A S ( 1 r ) n - L 3 4 4 7 3 . r 7 8
- 1 A H ( r r ) + 8 8 5 . I 5 A s ( 1 1 ) c E G - 1 5 0 3 3 8 . 0 8 5607l 0 l 0I O
5
9
2 1
500 641
1000 687
1500 701
3000 727
3000 742
6 4 2
692
706
7 2 2
1 4 7
- r a H ( 5 ) + 9 r 5 , 1 5 ̂ s ( 5 ) L E - 6 0 1 8 8 3 , 2 4 4
- 1 6 H ( 5 ) + 9 5 5 . 1 5 A S ( 5 ) e - 5 6 4 2 2 7 , O O A
- r a H ( 5 ) + 9 7 9 . 1 5 ̂ S ( 5 ) G E - 5 5 0 0 9 4 . 4 6 1
- 1 ^ H ( 5 ) + 9 9 5 . 1 5 A S ( 5 ) L E - 5 3 0 5 6 8 . 5 4 7
- l A H ( 5 ) + 1 0 2 0 , 1 5 a s ( 5 ) c E - 5 t 6 5 3 4 , 3 2 6
L lnea! dependence o f reac t tons R1 - R7
R 6 : 9 T + 4 F = 5 A + 4 t s
1 a H ( 5 ) + 3 A E ( 4 ) - 7 A H ( r ) = 0
l a H ( 7 ) + 1 a H ( 4 ) - I A H ( l ) . o
I A H ( 2 ) - 1 A H ( 3 ) - 1 a H ( 7 ) - 0
9 A H ( 2 ) - 1 A H ( 6 ) - 5 A H ( 3 ) = O
1 a s ( 5 ) + 3 a s ( 4 ) - 7 d s ( 1 ) - 0r As(7) + I AS(4) - la S(1) = O1 a s ( 2 ) - l a s ( 3 ) - r a s ( 7 ) = 09 ̂ s (2 ) - r ^s (6) - 5^ s (3) = 0
I I 500 597
1 2 5 0 0 6 3 2
22 1000 626
21 1000 646
15 2000 660
3 3000 666
18 4000 671
17 5000 684
5 9 0 - L ^ H ( 6 ) +
637 -r AH(6) +
6 2 1 - 1 A H ( 6 ) +
6 5 1 - r t H ( 6 ) +
6 6 5 - 1 A E ( 6 ) +
6 5 r - 1 a H ( 6 ) +
6 8 7 - r a H ( 6 ) +
689 -1 af,(5) +
8 6 3 . 1 5 A 5 ( 6 ) L E - 6 2 3 4 7 r . 5 4 4
9 1 0 . 1 5 a s ( 6 ) c E - 6 0 0 8 1 5 , 5 7 0
8 9 4 . 1 5 d S ( 6 ) L E - 5 9 1 7 t A . 6 t 2
9 2 4 . 1 5 a s ( 6 ) c E - 5 8 1 9 8 4 . 7 3 1
938.15 As(6) cE -565634.425
9 3 4 , 1 5 A S ( 5 ) L E - 5 6 3 6 1 7 . 2 7 6
9 5 5 . r 5 d s ( 6 ) c E - 5 4 8 6 9 1 . 6 5 4
9 6 2 . 1 5 A S ( 5 ) G - 5 4 2 6 0 7 . 2 6 r
Def ln i t lon o f seven tndependent reaet tons tn tems o f par r l c lpa t lng pnases
3 H ( E ) + l H ( Q ) - r B ( T ) - l l u ( r ) - o 3 s ( E ) + l S ( Q ) - r S ( T ) - r A S ( 1 ) - 05 H ( E ) - l H ( F ) - l H ( r ) - r A H ( 2 ) = 0 5 s ( E ) - l S ( F ) - r s ( r ) _ 1 a s ( 2 ) = o
9 H ( E ) - t H ( F ) - r H ( A ) - 1 a H ( 3 ) - O 9 s ( E ) - 1 S ( r ) - r s ( A ) - 1 a s ( 3 ) = o
6 H ( F ) + r H ( r ) - 5 H ( c ) - r l H ( 8 ) - o 6 s ( p ) + t s ( T ) - 5 s ( c ) - l A s ( 8 ) = o
2 H ( F ) - I H ( 8 ) - 1 H ( c ) - r d H ( 9 ) - 0 2 s ( r ) - r s ( B ) - l s ( c ) - t ^ s ( 9 ) - 0
1 8 H ( F ) + 4 H ( T ) - 1 H ( & ) - r a H ( r o ) = o 1 8 s ( F ) + 4 S ( r ) - l s ( e ) _ r A s ( r o ) = 0
R 7 : T + 4 E - A r H ( P ) - l s ( B ) - 1 d H ( U ) - 0 l s ( P ) - r s ( B ) - 1 A s ( r l ) = 0
r0300
10500
14300
730
7 5 5
790
7 2 5 - 1 A H ( 7 ) + 9 9 8 . 1 5 a s ( 7 ) L E
7 5 0 - 1 A B ( 7 ) + 1 0 2 3 . 1 5 A S ( 7 ) L E
7 8 7 - r 6 H ( 7 ) + r 0 5 8 . r 5 A s ( 7 ) L E
8 8 5 7 . 8 1 1
9202.1 23
1 0 7 5 1 . 9 3 2
calorimetric data and the heat capacity function estimatedfor antigorite (Table l, Fig. 3). Chernosky (1982) observedthat calorimetric data are "in reasonable agreement', withthe experimental results. However, that apparent agree-ment was obtained by treating the heat capacity ofchryso_tile as an adjustable parameter and finding a heat capacity
function that fits both the experiments and the calorimetricdata. That heat capacity function is very different from thefunction used here and is illustrated in Figure 3. We haveno independent reason to eliminate experiment CFTW no.55m (Table 5). However, there is also no evidence that theentropies of chrysotile, forsterite and talc could be suf-ficiently wrong to.account for the observed inconsistency.Consequently, we have omitted experiment CFTW no.55m from subsequent calculations.

244 DAY EI AL.: SYSTEM MgO-SiOrHzO: THERMODYNAMIC ANALYSN
A Hi.( k J )
J6o TFEW
a His = 333 65914 948as;s =209.8r5ro.909
200 220 240
1000 cBFW
? a{ is=g3a3t2r22 l7asis = 603 475tO85O
600 100
A H is = No Inlornotion
asis =543r oo^5^r^t3 5
As?s (J)
TAQW
I
a His = l5l9 323:19 434as is = 884.O5O!2.727900 1000 Il00
f ,H;s=1523.s81t28 l l8asis = 8e4 rl9:3 q?9
AHi .( k J )
AH?.(kJ )
AHi .( kJ )
asis (J) as?s (J)
Fig. 5. Relationship between feasible solutions of AIli" and ASi"and the calorimetric data listed in Table 4. a. TFEW b. AnFTW c.CBFW d. BPW. In Figure 5b, the arrow indicates two superim-posed vertices. IIi" (An) is unknown so no values of AIIi"(AnFTW) are shown. The bold (+) and (x) are the'minimumdeviation" data from Table 6 and the "midpoint" from Table 7,respectively. The filled rectangles represent * one standard devi-ation of the calorimetric data in Table 4.
The problem of a '6best" set of thermodynamic data
Our preliminary analysis makes it clear that the existingcalorimetric data and the experimental data are not mu-tually consistent. Only for reaction TEQW (Fig. 4) do theexisting calorimetric data define a point within the feasiblesolution space. However, all the calorimetric data illus-trated in Figures 5 and'l are within the combined twostandard deviations of ASi" and AIIi". Furthermore, if weaccept the argument that the enthalpy of anthophyllite isincorrect, no conclusions concerning agreement with theexperiments can be drawn from the data in Figure 6. Fin-ally, we note that using the alternate choice for the en-thalpy of forsterite (Table 4) does not yield consistentlyimproved agreement for forsterite-bearing reactions.
The preliminary analysis deals with each reaction byitself and neither separates the individual phase propertiesnor considers all experimental data simultaneously. In thissection, we try to identify possible sources of disagreementby examining the "best" agreement with the enthalpies andentropies of each mineral that is permitted by all reactionstaken simultaneously. We will argue that in addition to theerror in anthophyllite enthalpy discrepancies in the entropyof anthophyllite, and in the enthalpy of enstatite and talcare the most important sources of disagreement betweenthe data sets.
In order to treat all reactions simultaneously and toderive thermodynamic properties of the phases, it is neces-sary to describe the linear dependence of reactions onethrough seven (Table 2) andto define each reaction proper-
asis (J) {J51 . \u , /
Fig. 6. Relationship between feasible solutions of AIIi" and ASi"
and the calorimetric data listed in Table 4. a. AFEW b. AEQW c'
TAQW d. TFAW. The bold (+) and ( x) are the *minimum devi-
ation" data from Table 6 and the "midpoint" from Table 7, re'
spectively. The filled rectangles represent t one standard devi-
ation of the calorimetric data in Table 4.
ty in terms of the properties of the constituent phases'
Table 5 lists the set of constraints that must be solved
simultaneously in order to derive properties of the nine
solid phases of interest.
C F T W
aHis :2948 736 ' t9 .S42
ASis= l8l8 t35t4227
A H
1600 1700 1800 1900
^ S ( J / K )
Fig. 7. Two feasible solution spaces for the reaction CFTW.
Open circles and the dashed lines outline the expanded feasible
solution space that occurs when experiment 55m and its two verti-
ces are removed. The bold (+) and (x) represent the "minimumdeviation" from Table 6 and the midpoint from Table 7, respec-tively. The filled rectangles represent I one standard dcviation of
the calorimetric data in Table 4. The arrow indicates two superim'posed vertices.
aHis=313 7OO!7392
a s i s = 2 o r 8 1 5 t r 2 9 5^His =295 87O*8927
AS is =198 845 r1 6 l l
400 600 800

DAY ET AL.: SYSTEM Mg0-SiO7-H2O: THERMODyNAMIC ANALlfSiJ
The experimental data (Table 5) and the existing calori- Table 6. Enthalpies and entropies of formation from the elementsmetric data (Table 4) are mutually inconsistent and we from within the feasible solution space*would like to know how serious the disagreement is andpossible sources of the discrepancies. As a measure of dis- uinrmuo pev{arlon Kninax peviarronagfeement, we have used the function described in detail by -^Hi(J) -as;(r/K) -^Ei(r/K) -^si(J/r()Day and KUmin (1980, p. 272 and appendix): rnlrsorlt€ 77435107 17733.000 7)488a3 17685.153
245
z: , tH,_ Hi l * l { r :_ t li l uHi | | usi I
where Il, and S, are the enthalpy and entropy of phase ithat lie within the set of feasible solutions defined by theexperiments (Table 5). H't, S'',UHi and USi are the calori-metric values measured by independent means and theirassociated one sigma uncertainties (Table 4). The functionZ is a measure of the distance between calculated and mea-sured values expressed in units ofstandard deviations.
We have used linear programming methods to find theset of enthalpies and entropies that minimizes Z subject tothe constraints listed in Table 5. The choice of derivedenthalpies and entropies that is consistent with the experi-ments and that minimizes the total deviations from thecalorimetric data in Table 4 is listed in Table 6 in thecolumn headed "Minimum Deviation". Z was calculated asthe sum over all entropies and enthalpies except the en-thalpies of anthophyllite and antigorite for which no reli-able values are available.
The agreement between derived thermochemical valuesin Table 6 and the measured values in Table 4 is good,except for the enthalpy of talc and enstatite and the en-tropy of anthophyllite and, perhaps, enstatite. The derivedenthalpy of formation of talc is eight standard deviationsmore positive than the measured value reported by Robieet al. (1978). The derived enthalpy of enstatite is six stan-dard deviations more positive than the value measured byCharlu et al. (1975) but agrees with the enthalpy of clinoen-statite within the uncertainty reported by Robie et al.(1978). The derived entropy of anthophyllite is four andone-half standard deviations more positive than the valuereported by Robinson et al. (1982) based on unpublishedmeasurements by Krupka.
It is worthwhile to clarify that the perfect agreement ofthe calculations with many of the calorimetric data inTable 4 does not indicate that the result has been forced inany way to fit the calorimetric results. Not surprisingly, thetotal deviation simply reaches a minimum when many ofthe results are in perfect agreement with Table 4. Likewise,the agreement cannot be improved by ..taking into accountthe errors" in the calorimetric data. Such uncertainties al-ready appear in tbe objective function (Z) and the discrep-ancies are expressed in Table 6 as the number of standarddeviations by which the calculated and calorimetric datadifler.
The excellent agreement of most other derived parame-ters and the very large discrepancies in the enthalpy of talcand enstatite suggest that the enthalpies of formation ofthese minerals should be redetermined. The source of the
* Nunbers in paren theses represent the nmber o f s tandard dev la t long lnthe neaBured va lue by whtch the ca lcu la ted ve lue d l f fe rs f rm the ca lo_r lne t r l c va lues ln Tab le 4 ,
apparent discrepancy in the entropy ofanthophyllite is notclear. There may be entropy of disorder in the anthophyl-lite used in the hydrothermal experiments or undetectedzero point entropy in the sample used for calorimetry. Inaddition, the heat capacity function of anthophyllite usedin this study (Table 1) is an estimated function based onmeasurements up to 7fi) K of natural, impure material(Krupka et al., 1979). The results of our calculations aresensitive to the manner in which the measured heat capaci-ties are corrected for impurities and to the way in whichheat capacity is extrapolated to higher temperatures.Consequently, it is possible that the experimentally derivedand measured entropies need not disagree.
We have chosen the coordinate that minimizes the totaldeviations from measured calorimetric data as our ..best',set of thermodynamic data. One can argue that anotherchoice of feasible solutions would require less extreme dis-crepancies for the enthalpies talc and enstatite. Any suchsolution, however, must have a larger total deviation. Inorder to evaluate other such solutions. we have used an-other objective criterion that we call the "minimax." Usingthis criterion, we find the coordinate at which the largestdeviation from a calorimetric value is a minimum. Thiscriterion has the effect of lowering the deviations for talcand enstatite but raising the total deviations and the devi-ations for most other minerals. The meaning of this cri-terion is demonstrated most simply by inspecting the list ofparameters that deflnes the minimum total deviation fromcalorimetric values (Table 6). The enthalpy of talc is theparameter with the largest deviation(8.22 o) in that list andwe inquire whether it is possible to choose a solution thatdoes not require such an extreme discrepancy. The answer
Anthophyl l l te 12072854
BruciEe 924828
( r . 3 1 )
Chrysot l le 4362i79
( 0 . 4 1 )
E n s t e t i t e 1 5 4 5 6 5 4
( 6 ' 3 4 )
Forster l te 2173944
( 0 )
Perlc lase 60f490
( 0 )
Quartz 910700
( 0 )
Talc 569E217
( 8 . 2 2 )
( 3 . 4 8 )
1.2093535 2432.367
<2.98)924046 305.004
< 2 , 0 6 ) < 1 . 4 3 )4366156 1095.877
( 2 . 5 E ) ( 3 . 4 3 )
754a21t 293.419( 3 , 4 3 ) ( 2 , 6 5 )
2176273 399.845( 3 . 4 4 ) ( 3 . 4 3 )
6014E9 I08 .693( 0 . 0 0 ) ( 3 . 4 4 )
9t2417 ra2,t22( 3 . 4 3 ) ( 3 . 4 4 )
5909181 1275.411( 3 . 1 3 ) ( 3 . 4 4 )
( 0 )
243r , t63( 4 , 5 0 )
305.330
( 0 )
109E.E65( 0 )
293.342(2 .25)
400.360
(0)
108,315( 0 )
182.500
( 0 )
r27 4.030( 0 )

246 DAY ET AL.: SYSTEM Mg(lSiOrHzO: THERMODYNAMIC ANALYS$
is yes. However, because the solution already lies at thecoordinate defining the minimum total deviation, the newsolution necessarily requires that the deviation of otherparameters and the total deviation must increase. For ex-ample, less "error" might be assigned to the enthalpies oftalc and enstatite but more "error" must then be assignedto other parameters. The "minimax" criterion is designedto search for a list of parameters such that the largestdeviation in the list is as small as possible, subject to theexperimental constraints in Table 5.
For the data treated here, the largest deviation from thecalorimetric data can be no smaller than 3.44 standarddeviations. The data set having this property is listed inTable 6 under the heading, "minimax deviation," and re-quires significant error in the properties of most phases.
Consequently, we prefer the "minimum deviation" data asour "best" set of derived thermochemical parameters.
The problem of a "best" phase diagram
Day and Halbach (1979) analyznd experiments on reac-tions involving anthophyllite, enstatite, forsterite, quartz,
talc, and HrO and showed that several markedly differenttopologies of thermodynamically consistent phase dia-grams were compatible with the data available. Our newexperimental data (Chernosky et al., 1985) now permit onlyone topology for the stable equilibria among these phases(Fig.8).
A "best" set of thermochemical data such as the "mini-mum deviation" data in Table 6 does not necessarily leadto a "best" phase diagram for several reasons. First, neitherthe "minimum deviation" nor the "minimax" data sets inTable 6 necessarily lies at the maximum of the probability
function defined by the standard deviations associated withthe calorimetric measurements. Second, the definition of"best" set of thermochemical data implied by accepting the"minimum deviation" measure of goodness of fit is basedon agreement with a calorimetric data set that we nowsuggest may contain important systematic errors. Third,when calorimetric data lie outside the feasible solution de-
fined by the experiments, the "minimum deviation" cri-
terion produces an optimum solution that lies onthe bound-
ary of the feasible solution space (cf. Day and Kumin, 1980'
appendix 2). This result, thereforeo requires that at least one
calculated equilibrium curve must pass through a limiting
experiment rather than between the limiting brackets. Fin-
ally, the experiments themselves suggest that a "best" phase
diagram should contain equilibrium curves that pass be-
tween limiting experiments, implying thermochemical pa-
rameters that define a coordinate inside rather than on the
boundary ofthe feasible solution space.The phase diagram illustrated in Figure 8 was calculated
from values of the enthalpy and entropy of reaction (A.EIi"'
ASi,, see Table 7) at a "midpoint" of the feasible solution
space defined by the constraints listed in Table 5' The
"midpoint" was found by the linear programming process
outlined by Day and Halbach (1979, p. 819) and is not a
unique definition of the "center" of the hyperdimensionalfeasible solution space. It is, however, a thermodynamicallyconsistent data set that yields calculated reactions that pass
between all analyzed experimental brackets.The reaction properties listed in Table 7 can be inverted
to find the enthalpy and entropy of the participatingphases only if additional thermodynamic information is as-
sumed because there are only seven independent reactions
among the nine minerals of interest. It was possible to findproperties of the minerals in the earlier computations(Table 6) because the data H', and Si, (from Table 4) repre-
sented the additional independent information necessaryfor solving the problem. Thus, we have not presented ther-modynamic properties of minerals corresponding to thereaction data in Table 7.
In order to evaluate the range of permissible phase dia-grams, we determined ten internally consistent thermody-namic data sets from extreme points of the feasible solutionspace as outlined by Day and Halbach (1979). Phase dia-grams calculated from each of these data sets have the
same topology as Figure 8 but the temperatures and pres-
sures of the invariant points [Q] and [F] vary as shown.
The tQl invariant point lies at 7.7 !O.5 kbar at about
0 L200 500
r fc)
Fig. E. phase diagram calculated using the "midpoint" data in Table 7. Filled circles represent the range of permissible locations for
the iivariant points [q] and [F] calculated from some extreme points of the feasible solution space defined by Table 5'

Table 7. Enthalpies and entropies at the midpoint of the feasiblesolution space
^r8s (r) ^s?s (J/K)
247
be ruled out but some uncertainty remains in the locationof invariant points [Q] and [F] (see Fig. 8).
The serpentine equilibria illustrated in Figure 8 must betreated with caution. The hydrothermal experiments con-sidered here (Table 5) and the data in Table 1 are notsuflicient to constrain the serpentine equilibria in a mean-ingful way because so few of the reactions have been deter-mined experimentally. The equilibria in Figure 8 and thedata in Tables 6 and 7 arc, however, thermodynamicallyconsistent with the anthophyllite equilibria.
Our "best" set of thermodynamic parameters, internallyconsistent with the phase equilibrium data is listed in Table6. It includes new values for the enthalpy of formation fromthe elements (298 K, I bar) of antigorite and anthophyllite:-71435 kJ and -12073 kJ respectively.
The combined experimental and thermodynamic ap-proach adopted here and in our companion paper(Chernosky et al., 1984) has raised several issues that de-serve further investigation. First, our thermodynamicanalysis assumes that the molar volumes, and heat capaci-ties of the minerals are well known and that the propertiesof water are given exactly by Holloway et al. (1971) andBurnham et al. (1969). Thus, the permissible range ofphasediagrams, enthalpies and entropies that we found includesonly that variation attributable to the width of the experi-mental brackets. A second generation of studies might alsoconsider the uncertainty not only in molar volumes, butalso in heat capacities and the properties of water.
The thermodynamic analysis of mineral equilibria com-monly requires a knowledge of the heat capacity of hy-drous minerals significantly above the temperatures atwhich it is possible to gather useful data. Carefully substan-tiated models are required that will permit reliable extrapo-lations of heat capacity to high temperatures. We foundalso that our analysis of anthophyllite-bearing equilibriawas sensitive to the way in which the measured heat ca-pacity of iron-bearing anthophyllite was corrected for theefects of solid solution. Better models for the heat capacityof solid solutions would permit more reliable corrections.
Our analysis suggests possible discrepancies in thermo-dynamic parameters that might be resolved by further calo-rimetric determinations. Our "best" set of calculated en-thalpies of formation suggests major discrepancies in thevalue for talc (Table 6). Our value also differs markedlyfrom the one reported by Robinson et al. (1982, Hi:-62W218 J). The other serious discrepancy lies in the en-thalpy of formation of enstatite. The value in Table 6 ismarkedly different from the value determined by Charlu etaI. (1975) (cf. Table 4) but is curiously similar to the valuereported for clino enstatite (Robie et al., 1978, HF : -1548kJ). Clearly, the nature of the clinoenstatite-+nstatite tran-sition remains a major unsolved problem that will continueto interfere with the careful evaluation of experimental andthermodynamic data.
Finally, it appears to us that further experimental workin this system is unlikely to be rewarding unless truly su-perior starting materials are available that are fully docu-mented, both physically and calorimetrically. This need is
DAY ET AL.: SYSTEM MgO-SiOy-H2O: THERMODyNAMIC ANALII:S$
React ion
204.269
2 t 2 , 4 7 0
1 8 9 . r 5 4
E 9 0 . 4 2 1
9 t t 5 , 4 5 5
r 9 . l l 5
1 6 9 t . 3 9 3
6 2 7 . 9 7 4
5452,882
1 9 5 . 6 4 8
682"C and the [F] invariant point occurs at 10.5+3 kbarat about 794". We conclude from this exercise that Figure 8represents the best available estimate of the phase diagramgoverning the P-T stability of anthophyllite. phase dia-grams calculated from the data in Table 6 are very similarto Figure 8 and must have invariant points within therange illustrated.
No similar conclusion can be stated for the equilibriainvolving antigorite and chrysotile. Three independentreactions involving serpentine minerals have been deter-mined experimentally (Table 2) and the seven other equilib-ria considered by Evans et al. (1976) can be calculated fromthe enthalpies and entropies presented in Tables 6 and 7.Some of these are also illustrated in Figure 8. The sevenequilibria calculated from linear combinations of the threeexperimentally determined reactions are not well con-strained. The P-T placement and even direction of thesereactions vary widely within the range of permissible ther-modynamic parameters and the topology of the serpentineequilibria, therefore, is not determined uniquely by the ex-perimental data presently available.
The serpentine equilibria in Figure 8 are substantiallythe same as those deduced by Evans et al. (1976). However,the "midpoint" data (Table 7) require that the reactionC: An + F + W lies below 250'C at 1000 bars andchrysotile is therefore metastable above that temperarure.The "least deviation" data set in Table 6 requires thatchrysotile be metastable with respect to An * B above 25degrees Celsius at all pressures. It is useful to restate, how-ever, that any conclusion about the metastability ofchryso-tile is extremely sensitive to choices of enthalpy and en-tropy from within the range of permissible values.
ConclusionsOur analysis shows that the phase diagram topology
fust advocated by Greenwood (1963) (Figs. la and 8) is theonly topology consistent with the experimental data pre-sented by Chernosky et al. (1985) and the mineral proper-ties listed in Table 1. The wide range of permissible phasediagrams illustrated by Day and Halbach (1979) can now
r. (rEqw)2. (TFEP)
3. (ArEr{)
4. (AEqw)
5. (rrQw)
6. (TFAIJ)
7. (TEA)
8. (crrw)
9. (cBFw)
ro. (enPT,'r)
1 r . (BPw)
347rL8.362
34843t.622
337 7 44 ,57 4
33643r.314
).420534,592
t447 L6l,728
I0587.048
2777575.603
957046.009
87 t7t2a.275
322500.206
248 DAY ET AL.: SYSTEM Mg}-SiOrHzO: THERMODYNAMIC ANALYSIS
especially critical for talc, anthophyllite, and the serpen- antigorite-forsterite-anthophyllite-enstatite stability relations
tines. The most productive approach to further refinement and some geologic implications in the system. American Journal
of the anthophyllite-bearing iquilibria would be to reverse --o{science' 277'353-383'
the reaction T + E: A very tightly at about 675"; Hollowav' J' R'' Eggler' D H'' and Davis' N' F'(1971) Analvticalexpression for calculating the fugacity and free energy of HrO
Acknowledgments to 10,000 bars and 1,300"c. Geological society of America Bul-
This work has been supported by the National Science Founda-- ,"i"j*:i'i::',-rr':Ji Experimental investigation of the reactiontion (EAR-77-22775) (Day), EAR-74-13393 and EAR--79-04092 fo.rt".it" + H2O e serpentine * brucite. Contributions to(Chernosky), and EAR-78-24062 (Kumin). We are grateful for_the Mineralogy andpetrology, 19, 309-315.constructive reviews of R. Berman, M. Engi, J. Haas, and J. Rice Kellev. K. i. f fqOOt Contributions to the data on theoretical me-who, ofcourse, are not responsible for the views expressed here. tallurgy XIII. High temperature heat content heat capacity and
References entropy data for the elements and inorganic compounds. U. S.
Burnham, C. W., Holloway, J. R., and Davis, N. F. (loKo\ Ther- Bureauof MinesBulletin5S4'
modynamic properties of water to 1000"c ""d
10';; ;;;t. KtlF E' G" Barany' R'' weller' w' w'' and Pankratz'L' B' (1967)
Geologicalsocietyof Americaspecial Paper32. Thermodynamic properties of forsterite and serpentine' u' s'
charru, r. v., Newton, R. c., and Kreppa, o.I. (1e75) entm!]es ",i:L1"::YrT?};t#$.til:'::Tti:sbi6;ut*.
o. ,,rrr, ",*of formation at 9'7O K of compounds in the system
'- ^::--l-^,.-.
Mgo-Alro, Sio, from high temperature solution ."i.rri,",tt. ]!]fil]|t heat capacities of dolomite' talc and tremolite and
GeochimicaetcosmochimicaActa,3g,r4g!_r4g1.
r'|vr''v"ri implications to equilibrium in the siliceous dolomite system'
chatterjee, N. D. (1970) Synthesis and upper stability of paragon- Gtolo8ical Society of America Abstracts with Programs' 9'
ite. Contributions to Mineralogy and Petrology ' 2'l , 244-257. - :::"-^ - ,chatterjee, N. D. (1977) Thermodynamics of dehydrati"" ro"irru-
*ttou"-:.,l IVI'' Kerrick' D' M'' and Robie' R' A' (1979) Heat
ria. rn D. G. Fraser, Ed. rhermodynamics in c""r";;:;:"i#: ;ffiTl"j,:.i,ill1TbT:',lfiItatite and naturar anthophvrrite
"':','","#l:+3:i'fil Ti]11"0;''o "r anthophv'ite-a re- "*;*,,1-#:lil:*:gn::i:"*:';nff:"ir5ffi'33
evaluation based on new experimental data. American Mineral- ""',',
l'.rr".f, 15,52g-529.
d",.':.ll::li:-fi]?i*,rhestab'ityorcrinochrysor'e.cana- *'ll':j^j: Hemingwav' B' s'' and J' R' Fisher' J' R' (1e78)
dian Mineralogi st,20, 19-.2'1. Thermodynamic properties of minerals and related substances
chernosky, J. v., Jr. and Knapp, L. A. (1977\ The stabilitv of ?'?2!,ll ! and 1 bar (105 Pascals) Pressure and at Higher
anthophynite prus quartz. Giorogicar societv or ;;.*'^;: -j[:i1"ff;;H,j;,3'r]'il'j:'j#fi"Jtfl'[jroj,'ir*, *o""-stracts with Programs,9, 927.
chernosky, J. v., Jr., Day, H. W., and caruso, L. J. (1985) Equilib- :::i^:1d^:l""oies of Mg'sion' Mn2sioo' and co'Sioo be-
ria in the System Mgo-Sior-Hro: erp".r-.n,ui'i"'lJ.-i- -^'X::: and 380 K' American Mineralogist' 67'47H.82'
nation of the stability of Mg-Anthophyfite americall ;##: -"rl]liil+lifui?##:.;*:'';fli:'*rY;,Ti#ffi,,T;
Ji"l'i;i::.'jrlbach, H (re7e) rhe stab'ity *'o^:T:.11T li._'fff:1""',+-A 'lfu ";3;i3:;l,aT,3;
phvllite: the effect of experimental uncertainty o" o:fft:tiltt "-t,.-uTrv.".rl
*lit .p".Lt emphasis on the pro-perties ofphase diagram topologies. American Mineralogist, 64' EO9-EZJ. : : ;:-:-,-
Dav, H. w. and Kumin, H. J. (1e80) rhermodvnami.illl'r:"r BT:lff"rJ#,:;ffi1 components' U' s' Geologicar Survev
the aluminum silicate triple point. American Journal of Science' S"h."r".;l;:';. A., Kerrick, D. M., and Blencoe, J. G. (19g2) Experi-
",1ihiltr'il and Hergeson, H, c. (re78) carcuration.or the ml*mtT$',:i*"",:ilT:hffJ"A:J""I"iil-]li-
thermodynamic consequences of dehydration in subducttng ;;;;;-;;'iSS_ZlA.
oceanic crust to 100 kb and >800". American Journal of Sci- ^ "t":'"J':
ence,278,638-686. '": ':- '
:'l*"""1'j"""'-.-::: t'Hl'i;';-i;Jil,ill3i;I;""; Y;Jl::i'"til:H:':'Ji'-$'S:
Evans, B. W., Johannes, W., Oterdoom, H., and Trommsdorl-, V. J*.i-i,C-aZ.
$rJflr:rH]-":*:i#:::f"""r"1*"'ffi:#.'n"Jr'"i':l':: r,:r*:,::,," A., scrar, c. B., and smith, r. v. (re66) unit cerlgraphisch Mitteilungen, 54,'1g-g3.
volumes of synthetic orthoenstatite and low clinoenstatite' Min-
nisher, r. A. and zen, E-an (re71) rhermochemical carcurations ,,fi:'"S"i.T1tj?l;r'f;i'lr*if;rr, ,o"oo rhermochemicalfrom hydrothermal phase equilibrium data and the free energy
-'iil;. National Standard Reference Data Series, U. S. Nation-
of HrO. American Journal of Science, 27O,29'7-3L4-
Franz, G., 1e82, rhe brucite-periclase equilibrium .?tj"1:_:1 *::1,:[iTlil?ifi*::rt rmation of metamorphic mineralsHrO activities: Some information about the system H2O-NaCl.
' inlfr. .r*. CaO-MgO-SiOr-HrO and their petrological sig-
American Journal of Science, 282, 1325-1339.
Gordon, r. M. (1e73) Determination of internanv *":1'-,.11:T1; ,;'lru"iiu;i?i;iT3l?i;i^t:S"?;of pyrophyilite frommodynamic data frorn phase equilibrium experiments. Journal -
foO."if,ri*"1 data: values, discrepancies, and implications.of Geology, 81, 199-208.
Greenwood, H. J. (1963) The synthesis and stabitity of anthophyl- American Mineralogist' 54'1592-1606'
lite. Journal of Petrology, 4,3l'l-351.Hemley, J. J., Montoya, J. W, Shaw, D. R., and Luce, R. W. (1977)
Mineral equilibria in the MgO-SiO2-H2O system: II Talc-Manuscript receiueil, Nooember 8, 1983;
acceptedfor publication, Nouember 19, 1984.