equality opportunities monitoring data€¦ · web viewthe nhs ayrshire & arran workforce...
TRANSCRIPT
NHS Ayrshire & ArranEquality and Diversity –Workforce Data Report
(1/4/2012 to 31/3/2013)
1

Equality opportunities monitoring data
1.1 Data definition
The equal opportunities monitoring data are based upon staff employments* with the exception of recruitment and disciplinary/grievances data which are based on headcount. Note bank staff are excluded from all data presented. Doctors in training are excluded from leaver data and charts.
As reflected within the monitoring charts that follow there is a proportion of employees for which where there is no detail recorded for specific protected characteristics. This appears in the charts as ‘blank’ with the data being unknown / undisclosed.
1.2 Presentation of the data
The data is presented in five distinct sections: overall workforce characteristics; training; leavers; recruitment; and disciplinary and grievances.
2. Overall workforce characteristics
2.1 Gender
The NHS Ayrshire & Arran workforce is predominantly female making up 83.6% of the workforce. The gender split by job family is illustrated in the chart below:
55.5
41.5
13.7
9.2
8.4
13.8
14.1
25.2
11.6
28.2
44.5
58.5
86.3
90.8
91.6
86.2
85.9
74.8
88.4
71.8
0% 10% 20% 30% 40% 50% 60% 70% 80% 90% 100%
Medical
Dental
Medical & Dental Support
Nursing & Midwifery
Allied Health Professions
Other Therapeutic Services
Personal & Social Care
Healthcare Science
Administrative Services
Support Services
Distribution (% of workforce) of males and females across professions
Male Female
* some of our employees have more than one position and our current payroll/workforce systems count “employments” as opposed to “headcount”.
2

2.2 Religion and Belief
The NHS Ayrshire & Arran workforce is relatively diverse with Church of Scotland, No Religion and Roman Catholic being the highest recorded.
Buddhist, 0.19% Christian - Other, 5.52%
Church of Scotland, 28.66%
Declined, 2.57%
Hindu, 0.47%
Jewish, 0.03%Muslim, 0.51%
No Religion, 18.18%Other, 0.67%
Roman Catholic, 8.95%
Sikh, 0.08%
Blank, 34.17%
Staff religion and beliefs (% of workforce)
2.3 Ethnicity
Of the existing known ethnicity data, the largest proportion of NHS Ayrshire & Arran’s workforce disclosed their ethnicity as White Scottish making up 57.92% of the total workforce.
3

0.21%
0.18%
0.01%
0.03%
0.23%
0.24%
0.66%
0.18%
0.02%
0.24%
0.93%
0.34%
4.60%
1.33%
57.92%
32.89%
0.00% 10.00% 20.00% 30.00% 40.00% 50.00% 60.00%
African
Any Mixed Background
Bangladeshi
Caribbean
Chinese
Declined
Indian
Other Asian
Other Black
Other Ethnic Background
Other White
Pakistani
White British
White Irish
White Scottish
Blank
Ethnicity (% of workforce)
2.4 Disability
The current data recording system has the capability to record that people consider themselves to have a disability; however, we recognise that many people may not consider themselves as having a disability. Therefore, we will strive to increase awareness and recording in the coming years.
Declared a Disability, 0.72%
Declined, 0.46%
Blank, 98.82%
Disability (% of workforce)
2.5 Age
The NHS Ayrshire & Arran workforce ranges from 16 to 66 or older with the majority of the workforce in the 41 to 55 age range.
4

0.20%
2.49%
7.20%
9.33%
10.57%
14.94%
17.87% 17.71%
12.33%
5.96%
1.41%
0.00%
2.00%
4.00%
6.00%
8.00%
10.00%
12.00%
14.00%
16.00%
18.00%
20.00%
16 to 20 21 to 25 26 to 30 31 to 35 36 to 40 41 to 45 46 to 50 51 to 55 56 to 60 61 to 65 66 or older
Age profile (% of workforce)
2.6 Sexual Orientation
Of the existing known sexual orientation data, the majority of NHS Ayrshire & Arran’s workforce disclosed their sexual orientation as heterosexual (60%).
Bisexual, 0.28%Declined, 2.15%
Gay, 0.31%
Heterosexual, 60.02%
Lesbian, 0.27%
Other, 0.26%
Blank, 36.72%
Sexual orientation (% of workforce)
5

3. Training
In the period approximately 61,359 training opportunities (inclusive of both face to face and e-Learning packages) were undertaken by staff. The characteristics of those accessing training are shown in the charts below:
3.1 Gender
83.60%
16.40%
87.65%
12.35%
0.00% 10.00% 20.00% 30.00% 40.00% 50.00% 60.00% 70.00% 80.00% 90.00% 100.00%
Female
Male
Training by gender (% of workforce compared to % of training received)
%training %workforce
3.2 Religion and Belief
0.19%
5.52%
28.66%
2.57%
0.47%
0.03%
0.51%
18.18%
0.67%
8.95%
0.08%
34.17%
0.12%
5.77%
30.45%
2.49%
0.12%
0.01%
0.20%
19.60%
0.74%
9.36%
0.01%
31.15%
0.00% 5.00% 10.00% 15.00% 20.00% 25.00% 30.00% 35.00% 40.00%
Buddhist
Christian - Other
Church of Scotland
Declined
Hindu
Jewish
Muslim
No Religion
Other
Roman Catholic
Sikh
Blank
Training by religion and belief (% of workforce compared to % of training received)
% training %workforce
6

3.3 Ethnicity
0.21%
0.18%
0.01%
0.03%
0.23%
0.24%
0.66%
0.18%
0.02%
0.24%
0.93%
0.34%
4.60%
1.33%
57.92%
32.89%
0.15%
0.19%
0.00%
0.02%
0.08%
0.20%
0.17%
0.10%
0.01%
0.18%
0.72%
0.14%
4.69%
1.33%
61.93%
30.09%
0.00% 10.00% 20.00% 30.00% 40.00% 50.00% 60.00% 70.00%
African
Any Mixed Background
Bangladeshi
Caribbean
Chinese
Declined
Indian
Other Asian
Other Black
Other Ethnic Background
Other White
Pakistani
White British
White Irish
White Scottish
Blank
Training by ethnicity (% of workforce compared to % of training received)
% training %workforce
3.4 Disability
0.72%
0.46%
98.82%
0.91%
0.45%
98.64%
0.00% 20.00% 40.00% 60.00% 80.00% 100.00% 120.00%
Declared a Disability
Declined
Blank
Training by disability (% of workforce compared to % of training received)
%training %workforce
7

3.5 Age
0.20%
2.49%
7.20%
9.33%
10.57%
14.94%
17.87% 17.71%
12.33%
5.96%
1.41%
0.07%
2.94%
8.34%
10.61% 10.95%
16.04%
19.00%
17.18%
10.19%
4.07%
0.61%
0.00%
2.00%
4.00%
6.00%
8.00%
10.00%
12.00%
14.00%
16.00%
18.00%
20.00%
16 to 20 21 to 25 26 to 30 31 to 35 36 to 40 41 to 45 46 to 50 51 to 55 56 to 60 61 to 65 66 or older
Training by age (% of workforce compared to % of training received)
%workforce %training
3.6 Sexual Orientation
0.28%
2.15%
0.31%
60.02%
0.27%
0.26%
36.72%
0.21%
2.20%
0.47%
64.04%
0.26%
0.15%
32.67%
0.00% 10.00% 20.00% 30.00% 40.00% 50.00% 60.00% 70.00%
Bisexual
Declined
Gay
Heterosexual
Lesbian
Other
Blank
Training by sexual orientation (% of workforce compared to % of training received)
%training %workforce
8

4. Leavers
In the period there were 724 leavers from the organisation. The characteristics of this cohort are illustrated in the charts below. It should be noted that doctors in training are excluded from the leavers detail hence the variation in % of workforce as compared to previous charts as junior doctor detail has been removed in terms of workforce and leaver proportions.
4.1 Gender
84.28%
15.72%
78.87%
21.13%
0.00% 10.00% 20.00% 30.00% 40.00% 50.00% 60.00% 70.00% 80.00% 90.00%
Female
Male
Leavers by gender (% of workforce compared to % of leavers)
%leavers %workforce
4.2 Religion and Belief
0.12%
5.32%
29.07%
2.50%
0.30%
0.02%
0.35%
18.00%
0.66%
8.85%
0.03%
34.79%
0.28%
5.94%
26.93%
2.49%
0.83%
0.00%
0.55%
21.27%
1.10%
9.39%
0.28%
30.94%
0.00% 5.00% 10.00% 15.00% 20.00% 25.00% 30.00% 35.00% 40.00%
Buddhist
Christian - Other
Church of Scotland
Declined
Hindu
Jewish
Muslim
No Religion
Other
Roman Catholic
Sikh
Blank
Leavers by religion and belief (% of workforce compared to % of leavers)
%leavers %workforce
9

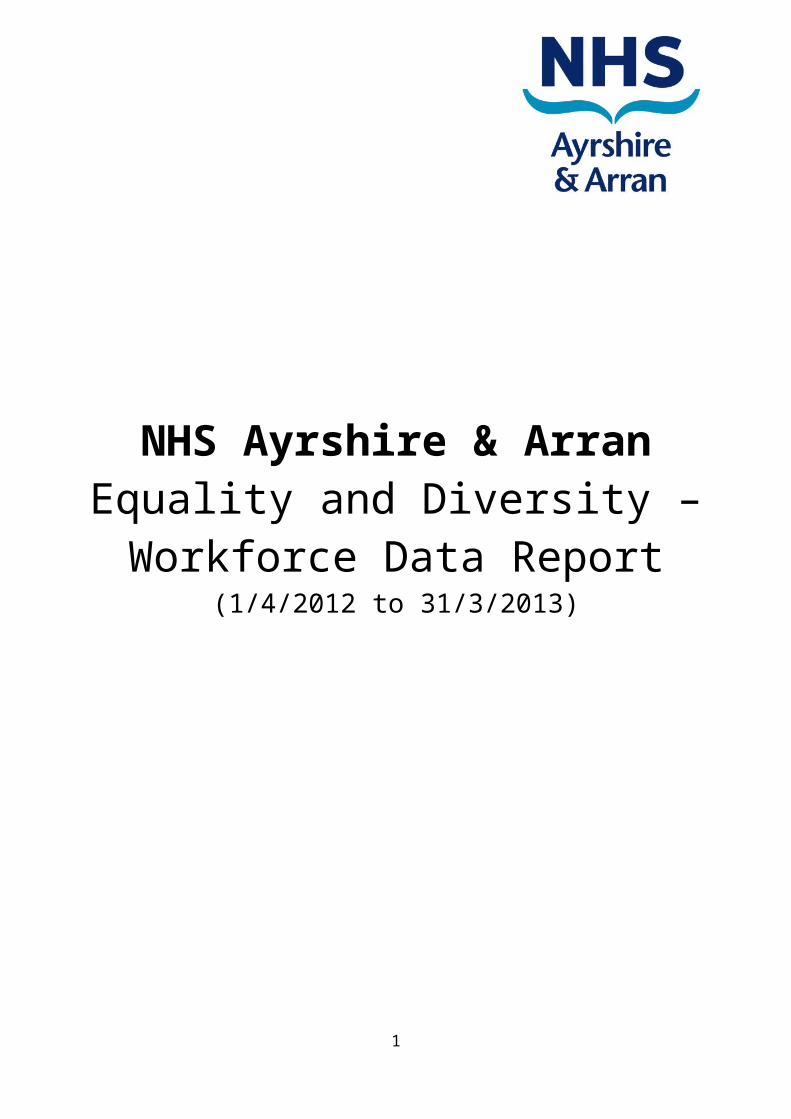
4.3 Ethnicity
0.13%
0.16%
0.00%
0.02%
0.13%
0.20%
0.42%
0.16%
0.02%
0.21%
0.84%
0.22%
4.21%
1.29%
58.45%
33.56%
0.14%
0.41%
0.00%
0.00%
0.14%
0.41%
0.97%
0.14%
0.00%
0.28%
2.35%
0.41%
4.56%
1.52%
61.33%
27.35%
0.00% 10.00% 20.00% 30.00% 40.00% 50.00% 60.00% 70.00%
African
Any Mixed Background
Bangladeshi
Caribbean
Chinese
Declined
Indian
Other Asian
Other Black
Other Ethnic Background
Other White
Pakistani
White British
White Irish
White Scottish
Blank
Leavers by ethnicity (% of workforce compared to % of leavers)
%leavers %workforce
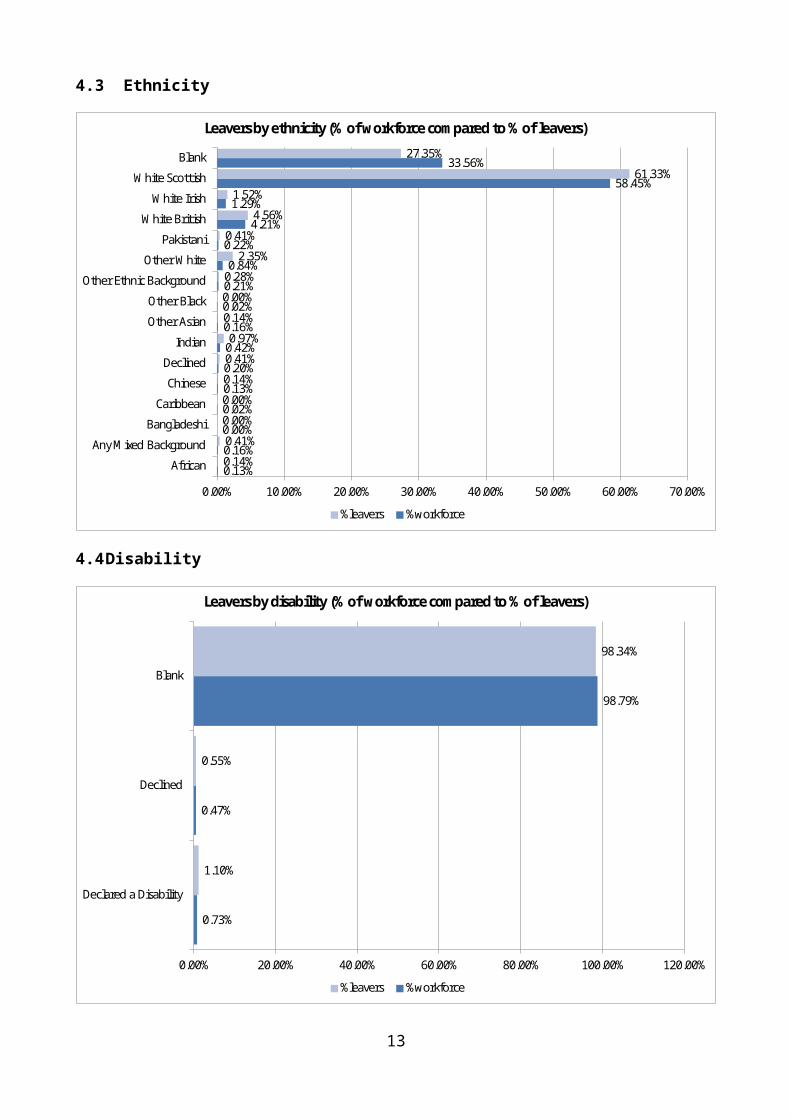
4.4 Disability
0.73%
0.47%
98.79%
1.10%
0.55%
98.34%
0.00% 20.00% 40.00% 60.00% 80.00% 100.00% 120.00%
Declared a Disability
Declined
Blank
Leavers by disability (% of workforce compared to % of leavers)
%leavers %workforce
10

4.5 Age
0.21%
2.29%
6.18%
8.88%
10.55%
15.22%
18.28% 18.14%
12.65%
6.14%
1.45%1.24%
5.52%
10.36%
9.25%8.84%
7.18%
8.29%
9.94%
13.81%
18.37%
7.18%
0.00%
2.00%
4.00%
6.00%
8.00%
10.00%
12.00%
14.00%
16.00%
18.00%
20.00%
16 to 20 21 to 25 26 to 30 31 to 35 36 to 40 41 to 45 46 to 50 51 to 55 56 to 60 61 to 65 66 or older
Leavers by age (% of workforce compared to % of leavers)
%workforce %leavers
4.6 Sexual Orientation
0.28%
2.17%
0.28%
59.48%
0.27%
0.25%
37.25%
0.28%
1.93%
0.14%
65.61%
0.14%
0.00%
31.91%
0.00% 10.00% 20.00% 30.00% 40.00% 50.00% 60.00% 70.00%
Bisexual
Declined
Gay
Heterosexual
Lesbian
Other
Blank
Leavers by sexual orientation (% of workforce compared to % of leavers)
%leavers %workforce
11

5. Recruitment
There were approximately 8,904 applicants during the year and the data reflects those vacancies with a closing date between 1/4/12 and 31/3/13.
5.1 Gender
80.66%
17.33%
2.01%
86.52%
12.85%
0.63%
85.28%
14.29%
0.44%
0.00% 10.00% 20.00% 30.00% 40.00% 50.00% 60.00% 70.00% 80.00% 90.00% 100.00%
Female
Male
Blank
Recruitment by gender
offered% interviewed% applied%
5.2 Religion and Belief
0.21%
4.73%
31.15%
2.45%
0.88%
0.47%
41.79%
1.52%
11.93%
0.07%
4.81%
0.05%
4.77%
33.67%
2.34%
0.10%
0.10%
39.95%
0.97%
14.06%
0.00%
3.99%
0.29%
3.50%
35.71%
1.90%
0.00%
0.00%
37.76%
1.02%
14.87%
0.00%
4.96%
0.00% 5.00% 10.00% 15.00% 20.00% 25.00% 30.00% 35.00% 40.00% 45.00%
Buddhist
Christian - Other
Church of Scotland
Declined
Hindu
Muslim
No Religion
Other
Roman Catholic
Sikh
Blank
Recruitment by religion and belief
offered% interviewed% applied%
12
5.3 Ethnicity
0.54%
0.54%
0.03%
0.03%
0.16%
0.26%
1.08%
0.29%
0.35%
2.98%
0.81%
1.85%
0.83%
85.44%
4.81%
0.34%
0.34%
0.00%
0.05%
0.10%
0.15%
0.24%
0.00%
0.10%
2.48%
0.15%
1.85%
0.63%
89.83%
3.75%
0.29%
0.00%
0.00%
0.29%
0.00%
0.00%
0.44%
0.00%
0.15%
1.46%
0.00%
1.46%
1.02%
90.67%
4.23%
0.00% 10.00% 20.00% 30.00% 40.00% 50.00% 60.00% 70.00% 80.00% 90.00% 100.00%
African
Any Mixed Background
Caribbean
Chinese
Declined
Indian
Other Asian
Other Black
Other Ethnic Background
Other White
Pakistani
White British
White Irish
White Scottish
Blank
Recruitment by ethnicity
offered% interviewed% applied%
5.4 Disability
2.44%
0.31%
92.53%
4.72%
2.77%
0.29%
92.55%
4.38%
2.04%
0.29%
93.44%
4.23%
0.00% 10.00% 20.00% 30.00% 40.00% 50.00% 60.00% 70.00% 80.00% 90.00% 100.00%
Declared a Disability
Declined
Not Disabled
Blank
Recruitment by disability
offered% interviewed% applied%
13

5.5 Age
7.23%
19.07%
14.20%
10.11% 10.29%
12.93%
9.75%
7.23%
3.07%
0.37%
0.02%
5.74%
2.63%
14.94%
13.63%
12.31%11.63%
18.69%
10.46%
7.35%
2.43%
0.24% 0.05%
5.64%
2.62%
15.45%
13.70%
12.39%
10.93%
16.76%
10.64%
8.60%
2.77%
0.15% 0.15%
5.83%
0.00%
5.00%
10.00%
15.00%
20.00%
25.00%
16 to 20 21 to 25 26 to 30 31 to 35 36 to 40 41 to 45 46 to 50 51 to 55 56 to 60 61 to 65 66 or older
Blank
Recruitment by age
applied% interviewed% offered%
5.6 Sexual Orientation
0.75%
2.71%
0.57%
90.09%
0.36%
0.36%
5.15%
0.68%
2.38%
1.02%
90.95%
0.54%
0.24%
4.18%
0.58%
1.75%
1.31%
91.11%
0.87%
0.15%
4.23%
0.00% 10.00% 20.00% 30.00% 40.00% 50.00% 60.00% 70.00% 80.00% 90.00% 100.00%
Bisexual
Declined
Gay
Heterosexual
Lesbian
Other
Blank
Recruitment by sexual orientation
offered% interviewed% applied%
14

6. Disciplinary and grievances
This data presented on disciplinary cases (44) reflects those that commenced and concluded during 2012/13. Due to the small numbers within this cohort there is not a further breakdown of characteristics, as numbers could get to a potentially identifiable level, and as such only gender is represented. There were two grievances commenced in the period however they did not conclude until after 31/3/13.
6.1 Disciplinary
34
66
0 10 20 30 40 50 60 70
Male
Female
Disciplinary by gender (% of cases)
15