equality information report 2019
TRANSCRIPT

Equality Information Report 2019

2
Equality, Diversity and Inclusion Team, The University of Manchester
Contents
Introduction…………………………………4
Staff Equality Information……………5
Age……………………………………………….7
Disability …………………………………..…10
Ethnicity……………………………..………..13
Gender………………………………….………20
Recruitment………………………………....25
Student Equality Information……....35
Age………………………………………………..36
Disability……………………………….……….37
Ethnicity……………………….………………..40
Domicile…………………………….…………..42
Gender…………………………….………….…43
Religion, Sexual Orientation and Gender Identity….44
Attainment…………………………..….…….46
Retention……………………………………….55
Postgraduate………………….……………..58
If you require this information in an alternative format please contact the Equality, Diversity
& Inclusion Team: [email protected]| 0161 306 5857

3
Equality, Diversity and Inclusion Team, The University of Manchester
Foreword
Equality, diversity and inclusion are central to our Social Responsibility agenda.
Diversity is a huge strength of our institution and a source of great pride.
However, we acknowledge there is still much to do to ensure we tackle all
forms of discrimination and guarantee all staff and students are given
opportunities to thrive. We have made progress - notably by every eligible
School achieving, or in the process of applying for, an Athena SWAN award
which recognises commitment to the career advancement of women; the Race
Equality Charter Mark award which aims to improve the representation,
progression and success of minority ethnic staff and students within higher
education; and recognition from Stonewall for creating an inclusive workplace
as a top 100 employer for LGBT colleagues - but we are also aware that there is
still much to do. We will continue to embed our commitment to equality,
diversity and inclusion across all our processes and this report is a great
example of our continued work in this area.
Professor James Thompson
Vice-President Social Responsibility

4
Equality, Diversity and Inclusion Team, The University of Manchester
Introduction
The University of Manchester is one of Britain’s largest single site Universities. We employ
over 12,000 staff and educate approximately 40,000 students. The University is committed
to promoting equality and providing an environment where all members of its community
are treated with respect and dignity. We are proud to strive to employ a workforce and
educate a student body that reflects the diverse community we serve.
As a Higher Education Institution we have specific equality duties, as outlined by The
Equality Act (2010). These require public authorities to tackle discrimination, victimisation
and harassment, advance equality and foster good relations. It is also our responsibility to
publish our equality information on an annual basis, and review and publish specific and
measurable equality objectives every 4 years.
Based on extensive consultation our equality objectives were developed in April 2016 and
are reviewed annually. Our objectives are to:
1) Improve the representation of women and black, Asian and minority ethnic (BAME)
staff in senior leadership, academic and professional support positions.
2) Take action to further understand and improve the experience of disabled staff as
indicated in the staff survey.
3) Take action to further understand and address any differential outcomes of
undergraduate students in relation to access, retention, attainment and progression
to a positive graduate destination in relation to disability, ethnicity, gender and
socio-economic status.
4) Take action to understand and address any inequalities for researchers.
5) To better understand the challenges, obstacles and barriers faced by different
groups at the University and to foster good relations between people who share a
relevant protected characteristic and those who do not share it.
6) Better understand the potential impact of University functions on certain groups by
improving disclosure rates and reporting mechanisms for age, disability, ethnicity,
caring responsibilities, religion or belief (including lack of belief) sexual orientation
and gender reassignment.

5
Equality, Diversity and Inclusion Team, The University of Manchester
Staff Equality Information: Key Findings Age: The age of staff at the University has increased since 2015, with the most common age
bracket shifting from ‘26 to 35’ to ‘36 to 45’. 29.5% of all staff at the University in 2018 are
aged 36 to 45, an increase of 0.5% since 2015 (see Figure 1). The data from 2018 shows that
Professional Services (PS) staff and part-time staff are older than academic staff and full
time staff with most being aged between 36 and 45 compared to 26 to 35 for academic staff
and full time staff (see Figure 2 and Figure 3).
Disability: 5.6% of staff at the University have disclosed their disability status on their staff
record (see Figure 7). The proportion of disabled staff working at the University peaked in
2014 at 6.2% and has since declined until a small rise was seen in 2017 and 2018 bringing it
to 5.6% (see Figure 11). The most prevalent disability type declared by staff, accounting for
28.2% of all disabilities, is a long standing illness or health condition such as cancer, HIV,
diabetes, chronic heart disease, or epilepsy (see Figure 8).
Ethnicity: There has been a 3.1% increase in Black, Asian and Minority Ethnic (BAME) staff
across the university since 2014, with a 4.0% increase in BAME academics and a 2.5%
increase in BAME PS staff (see Figure 17). The largest represented ethnic group is Asian
accounting for 58.8% of all BAME staff (see Figure 13). However the difference between
academic and PS staff is significant with 69.4% of BAME academic staff being Asian (see
Figure 15) compared with 45.5% of BAME PS staff (see Figure 14).
Gender: The proportion of female staff at the University has increased by 1.3% since 2014
(see Figure 28). In that period there has been a 1.4% increase in female academics and a
0.5% increase in female PS staff.
Recruitment: 39.8% of applications for core academic positions were sent by females and
36.7% by BAME Candidates in the period studied. 27.7% of applications for PS (both Faculty-
based and central) were sent by BAME candidates and only 1.8% of BAME applications were
successful in comparison to 4.0% of White candidates’ applications (see recruitment tables).
Promotions: In promotions to Reader and Senior Lecturer/Senior Research Fellow, a higher
percentage of males applied for all roles compared to females, however, females were more
likely to be promoted in the case of all roles including chairs. BAME candidates were less
likely to be successful than White candidates in promotion applications to all roles (see
promotion section for Gender and Ethnicity).
Leavers: Overall the percentage of female and BAME staff leaving the University in the past
year has increased by 1.0% (see Figure 34) and 2.9% (see Figure 23) respectively. On further
analysis it was determined that the increase is driven by fixed term contracts ending, as
turnover rates for BAME Academics increased only by 0.3% between 2016 and 2018 (see
Figure 24) and decreased by 2.6% for BAME PS staff between 2016 and 2018.

6
Equality, Diversity and Inclusion Team, The University of Manchester
Sexual Orientation, Gender Identity and Religion: 57.6% of employees of the University
responded to the question about sexual orientation and religion. Response rates to
questions about sexual orientation, gender identity and religion increased between 2017
and 2018 (see Figure 35 and Figure 37).
Internationalisation: The University of Manchester has more than 2000 members of staff
who declared a nationality other than ‘British’. This group comes from more than 100
different countries. China, Italy and Germany are the top 3 countries of origin of the
University’s international staff (see international section and the Map).
Methodology
Data of current staff in this report relates to the 2017/18 year and has come from the
Annual Performance Review dataset produced by the Human Resources Systems Team. The
data is current and up to date as of 31st July 2018 and has been analysed by the Equality,
Diversity and Inclusion team.
Throughout this report the data is split by Academic staff and Professional Services (PS)
staff. Academic staff are split by Professor, Reader, Senior Lecturer, and Lecturer. Research
staff include Researchers, Research Fellows and Senior Research Fellows. When the term
‘Academic’ is used in this report it groups together both Academic and Research Staff. PS
staff are in a range of roles such as administration and technical roles.

7
Equality, Diversity and Inclusion Team, The University of Manchester
Age
3.8%
27.6%
28.3%
23.9%
14.3%
2.2%3.9%
26.4%29.0%
23.9%
14.5%
2.3%
4.1%
25.7%
29.5%
23.7%
14.7%
2.2%0%
5%
10%
15%
20%
25%
30%
35%
25 or less 26 to 35 36 to 45 46 to 55 56 to 65 66 and above
Figure 1: All Staff by Age
2016 2017 2018
4.7%
28.8%28.3%
23.8%
13.4%
0.9%2.0%
14.6%
33.9%
23.2%
19.5%
6.8%
0%
5%
10%
15%
20%
25%
30%
35%
40%
25 or less 26 to 35 36 to 45 46 to 55 56 to 65 66 and above
Figure 2: Full-Time and Part-Time Staff by Age 2018
Full-Time Part-Time
The University has a wide range of ages of staff, with most staff at the University being aged from 36 to 45 (28% see Figure 1). Full time staff at the University tend to be aged from 26 to 35 while part time staff tend to be aged from 36 to 45 (Figure 2). Academic staff ages show most academics are aged between 26 and 35, while most PS staff are aged from 36 to 45 (Figure 3).

8
Equality, Diversity and Inclusion Team, The University of Manchester
0.9%
30.4% 29.5%
22.4%
13.8%3.0%
6.8%
21.9%
29.5%
24.8%
15.5%
1.5%0%
5%
10%
15%
20%
25%
30%
35%
25 or less 26 to 35 36 to 45 46 to 55 56 to 65 66 and above
Figure 3: Academics and PS Staff by Age 2018
Academics Professional Services
89.5%
87.5%
74.7%
78.5%
70.9%
32.8%
10.5%
12.5%
25.3%
21.5%
29.1%
67.2%
0% 10% 20% 30% 40% 50% 60% 70% 80% 90% 100%
25 or less
26 to 35
36 to 45
46 to 55
56 to 65
66 and above
Figure 4: All Staff by Age, 2018
Full-Time Part-Time
The percentage of staff working full-time at the University increases as age decreases, with the exception of the age bracket 36-45 (Figure 4). Staff of age 25 or less are most likely to be working full time (Figure 5) - this is the case for both Academic and PS staff (Figures 6 and 7).

9
Equality, Diversity and Inclusion Team, The University of Manchester
90.7%
90.3%
80.2%
81.7%
75.3%
32.0%
9.3%
9.7%
19.8%
18.3%
24.7%
68.0%
0% 10% 20% 30% 40% 50% 60% 70% 80% 90% 100%
25 or less
26 to 35
36 to 45
46 to 55
56 to 65
66 and above
Figure 5: Academic Staff by Age, 2018
Full-Time Part-Time
89.4%
84.4%
70.2%
76.0%
67.7%
34.1%
10.6%
15.6%
29.8%
24.0%
32.3%
65.9%
0% 10% 20% 30% 40% 50% 60% 70% 80% 90% 100%
25 or less
26 to 35
36 to 45
46 to 55
56 to 65
66 and above
Figure 6: Professional Services Staff by Age, 2018
Full-Time Part-Time

10
Equality, Diversity and Inclusion Team, The University of Manchester
Disability
5.6%
93.7%
0.7%0%
10%
20%
30%
40%
50%
60%
70%
80%
90%
100%
Yes - has a disability Not known to be disabled Prefer not to say
Figure 7: Disability of staff, 2018
5.6% of staff at the University have disclosed their disability status on their staff record. The percentage of all staff disclosing a disability has more than doubled since the publication of the Equality Act, with staff in PS being more likely to disclose a disability than academic staff. Holding the most complete and accurate information enables the University to effectively tackle discrimination and equalise opportunity in its community. The most frequent disability type declared by staff is a long standing illness or health condition such as cancer, HIV, diabetes, chronic heart disease, or epilepsy. This accounts for 28.2% of all disabilities declared (Figure 8).

11
Equality, Diversity and Inclusion Team, The University of Manchester
0.3%
1.0%
1.0%
1.3%
3.7%
4.8%
13.7%
13.7%
14.2%
18.0%
28.2%
0% 5% 10% 15% 20% 25% 30% 35%
General learning disability (such as Down's syndrome)
Blind or a serious visual impairment uncorrected by glasses
Two or more impairments
A social/communication impairment such as Asperger's syndrome/other autisticspectrum disorder
Deaf or serious hearing impairment
A disability, impairment or medical condition that is not listed above
A physical impairment or mobility issues, such as difficulty using arms or using awheelchair or crutches
Unknown Type of Disability
A mental health condition, such as depression, schizophrenia or anxiety disorder
A specific learning difficulty such as dyslexia, dyspraxia or AD(H)D
A long standing illness or health condition such as cancer, HIV, diabetes, chronicheart disease, or epilepsy
Figure 8: Breakdown of Disabilites 2018
37.0%
49.5%
58.1%
63.0%
50.5%
41.9%
0% 10% 20% 30% 40% 50% 60% 70% 80% 90% 100%
Prefer not to say
Not known to be Disabled
Yes - has a disability
Figure 9: Disability by Gender 2018
Female Male
80.8%
82.4%
88.3%
11.0%
15.7%
11.2%
8.2%
1.8%
0.5%
0% 10% 20% 30% 40% 50% 60% 70% 80% 90% 100%
Prefer not to say
Not known to be Disabled
Yes - has a disability
Figure 10: Disability by Ethnicity 2018
White BAME Information unknown or refused

12
Equality, Diversity and Inclusion Team, The University of Manchester
3.9%3.5%
2.7% 2.9%Academics, 3.2%
8.2%7.9%
6.8%7.1%
Professional Services, 7.6%
6.2%5.8%
4.9%5.2%
Overall, 5.6%
0%
1%
2%
3%
4%
5%
6%
7%
8%
9%
2014 2015 2016 2017 2018
Figure 11: Disabled staff in PS and Academic Roles
Academics Professional Services Overall
Among members of staff who disclosed a disability, the majority are females: 58.1% while males are a majority among staff with no known disabilities (Figure 9). For the past five years the percentage of PS staff declaring a disability is consistently higher than the percentage of academic staff (Figure 11). Between 2017 and 2018 there has been a 0.4% increase in the percentage of all staff declaring a disability.

13
Equality, Diversity and Inclusion Team, The University of Manchester
Ethnicity
1.8%
15.4%
82.8%
0% 10% 20% 30% 40% 50% 60% 70% 80% 90% 100%
Information unknown or refused
BAME
White
Figure 12: All Staff by Ethnicity 2018
‘Black, Asian and Minority Ethnic’ (BAME) is a term referring to those of non-White descent, and encompasses a wide range of different ethnicities irrespective of a person’s origin or nationality. Of all respondents, Black, Asian and Minority Ethnic staff make up 15.4% of our staff population (Figure 12).

14
Equality, Diversity and Inclusion Team, The University of Manchester
Of all BAME staff working at the university 58.8% are Asian (Figure 13). However, when analysed in terms of their functions at University, there is a significant difference in the proportion of Asian staff in academic posts when compared with PS. 45.4% of BAME PS staff (Figure 14) declared ethnicity as Asian in comparison to 69.4% of BAME academic staff are Asian (Figure 15). Out of Academics who identified their ethnicity as ‘Asian’: >37.8% declared British nationality >26.0% declared their nationality as Chinese or Hong Kong-Chinese >13.6% declared Indian nationality Black staff are the second highest represented ethnic group within all BAME staff at 15.8% (Figure 13). However only 5.7% of academic staff are black (Figure 15) compared with 28.4% of PS staff (Figure 14). Proportion of White staff is higher among females than males by 3.1% (Figure 16).

15
Equality, Diversity and Inclusion Team, The University of Manchester
84.3%
81.2%
8.3%
9.8%
2.2%
2.6%
3.9%
3.9%
1.2%
2.4%
0% 10% 20% 30% 40% 50% 60% 70% 80% 90% 100%
Female
Male
Figure 16: Ethnicity by Gender
White Asian Black Other/Mixed Unknown
15.0%
16.2%16.5%
18.6%Academics, 19.0%
10.0%10.5%
11.1%11.7%
Professional Support, 12.5%12.3%
13.2%13.6%
14.9%Overall, 15.4%
8%
10%
12%
14%
16%
18%
20%
2014 2015 2016 2017 2018
Figure 17: Proportion of BAME Staff in PS and Academic Roles
Academics Professional Support Overall
Please note: y axis does not start at 0
The percentage of BAME staff in academic roles has been consistently higher than the percentage in PS roles over the past five years (Figure 17). Since 2014 there has been a 3.1 % increase of BAME staff across the university with a 4.0% increase in BAME academics and a 2.5% increase in BAME PS staff. Between 2014 and 2018 there has been a year on year increase in the percentage of BAME staff in both academic and PS roles.

16
Equality, Diversity and Inclusion Team, The University of Manchester
42, 5.9%
34, 81.0%
12, 11.9%
8, 66.7%
0%
20%
40%
60%
80%
100%
% of applications from those eligible % of successful applications
Figure 18: Promotions to Chair by Ethnicity 2018 (Count,Percentage)
White BAME
26, 4.5%
22, 84.6%
3, 3.8%
2, 66.7%
0%
20%
40%
60%
80%
100%
% of applications from those eligible % of successful applications
Figure 19: Promotions to Reader by Ethnicity 2018 (Count,Percentage)
White BAME
102, 9.2%
88, 86.3%
25, 9.7%
21, 84.0%
0%
10%
20%
30%
40%
50%
60%
70%
80%
90%
100%
% of applications from those eligible % of successful applications
Figure 20: Promotions to Senior Lecturer/Senior Research Fellows by Ethnicity 2018 (Count, Percentage)
White BAME
17
Equality, Diversity and Inclusion Team, The University of Manchester
12.4%
13.4%14.1%
14.8%
Grade 1 - 4, 16.2%
9.2% 9.2%9.7%
10.2%Grade 5 & 6, 10.6%
4.9%
6.2%5.9%
6.8%Grade 7, 7.1%
5.8%
5.9%5.9% 4.5%
Grade 8 & 9, 3.7%
0%
2%
4%
6%
8%
10%
12%
14%
16%
18%
2014 2015 2016 2017 2018
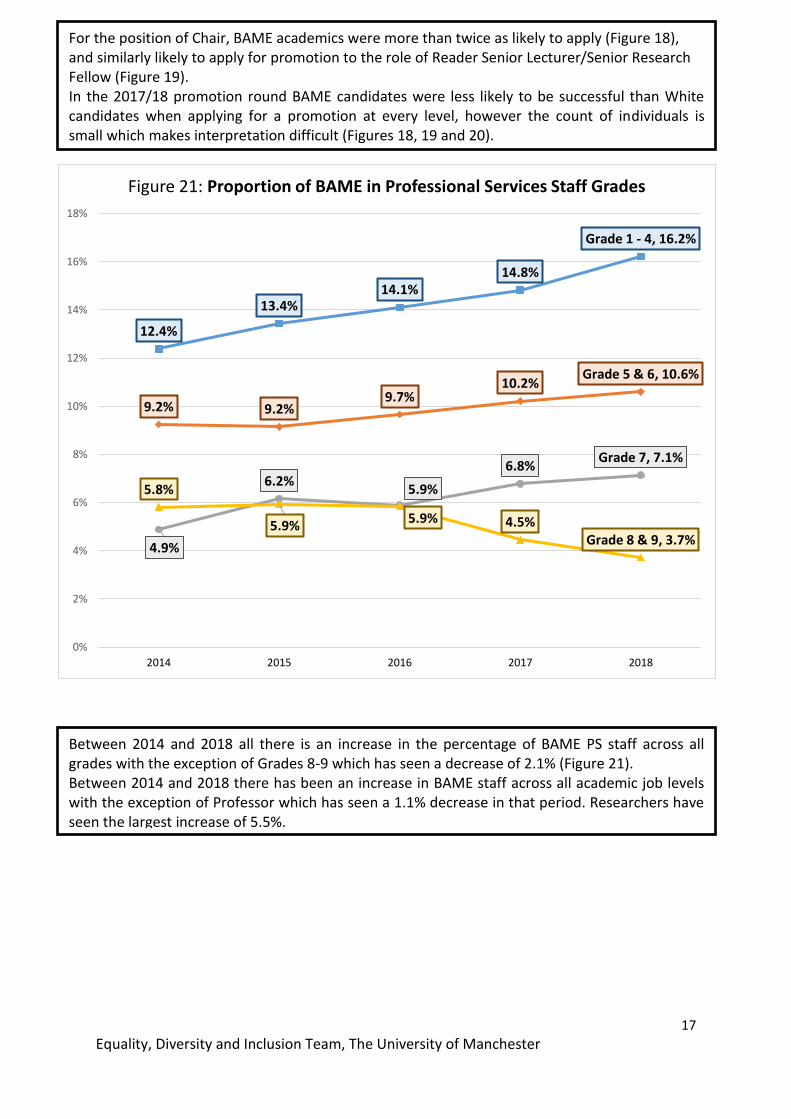
Figure 21: Proportion of BAME in Professional Services Staff Grades
For the position of Chair, BAME academics were more than twice as likely to apply (Figure 18), and similarly likely to apply for promotion to the role of Reader Senior Lecturer/Senior Research Fellow (Figure 19). In the 2017/18 promotion round BAME candidates were less likely to be successful than White candidates when applying for a promotion at every level, however the count of individuals is small which makes interpretation difficult (Figures 18, 19 and 20).
Between 2014 and 2018 all there is an increase in the percentage of BAME PS staff across all grades with the exception of Grades 8-9 which has seen a decrease of 2.1% (Figure 21). Between 2014 and 2018 there has been an increase in BAME staff across all academic job levels with the exception of Professor which has seen a 1.1% decrease in that period. Researchers have seen the largest increase of 5.5%.

18
Equality, Diversity and Inclusion Team, The University of Manchester
7.8% 8.0% 8.3% 8.8% Professor, 9.3%
11.7% 11.9% 11.9% 12.3%
Senior Lecturer/Reader,
12.5%
14.5%15.2%
16.5%17.8%
Lecturer, 19.2%18.9%
20.9% 21.2%
24.8%
Research and other academics, 25.0%
0%
5%
10%
15%
20%
25%
30%
2014 2015 2016 2017 2018
Figure 22: Proportion of BAME in Academic Staff Levels
19.7%
21.2%
22.6%
Academics, 26.4%
12.5%13.3%
11.4%Professional
Services, 10.9%
16.8%17.5% 17.7%
Overall, 19.7%
10%
12%
14%
16%
18%
20%
22%
24%
26%
28%
2015 2016 2017 2018
Figure 23: BAME Leavers
Academics Professional Services Overall
Please note: y axis does not start at 0
Between 2015 and 2018 the percentage of BAME leavers at the University has increased by 2.9%. With the percentage of BAME academics leaving the University increasing by 6.7% and the percentage of PS staff falling by 1.6%. One of the reasons why employees leave the University is that their fixed-term contract of employment came to an end. In order to account for that this report indicates turnover rates for employees on permanent contracts: they decreased for BAME academics (Figure 25) and remained stable for BAME PS staff (Figure 24).

19
Equality, Diversity and Inclusion Team, The University of Manchester
20
Equality, Diversity and Inclusion Team, The University of Manchester
Gender
42.2%
56.2%
49.8%
57.8%
43.8%
50.2%
0% 10% 20% 30% 40% 50% 60% 70% 80% 90% 100%
Academic
Professional Support
Overall
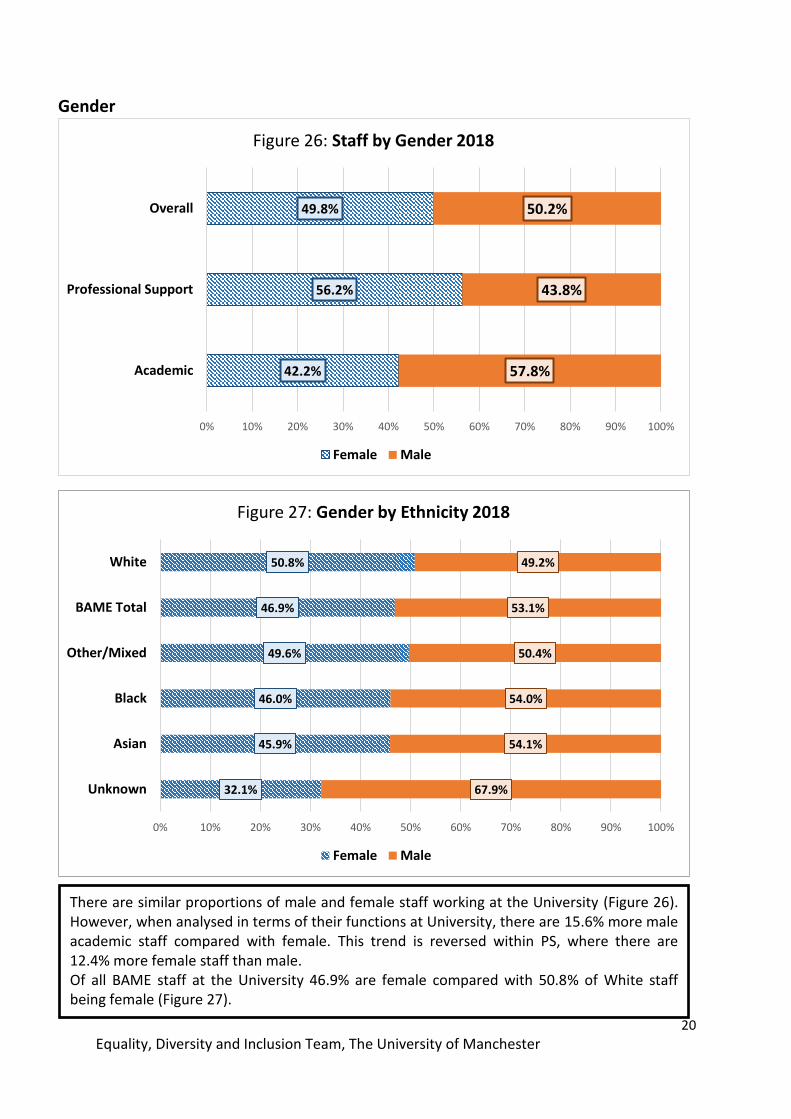
Figure 26: Staff by Gender 2018
Female Male
32.1%
45.9%
46.0%
49.6%
46.9%
50.8%
67.9%
54.1%
54.0%
50.4%
53.1%
49.2%
0% 10% 20% 30% 40% 50% 60% 70% 80% 90% 100%
Unknown
Asian
Black
Other/Mixed
BAME Total
White
Figure 27: Gender by Ethnicity 2018
Female Male
There are similar proportions of male and female staff working at the University (Figure 26). However, when analysed in terms of their functions at University, there are 15.6% more male academic staff compared with female. This trend is reversed within PS, where there are 12.4% more female staff than male. Of all BAME staff at the University 46.9% are female compared with 50.8% of White staff being female (Figure 27).

21
Equality, Diversity and Inclusion Team, The University of Manchester
Please note: y axis does not start at 0
40.6%41.4% 41.9% 42.4% Academic, 42.0%
55.5% 55.4% 56.0% 56.0%
Professional Support, 56.4%
48.6% 48.9% 49.5% 49.8% Overall, 49.9%
35%
40%
45%
50%
55%
60%
2014 2015 2016 2017 2018
Figure 28: Proportion of Females in PS and Academic Roles
Academic Professional Support Overall
Please note: y axis does not start at 0
22.3%23.3% 24.0% 24.4%
Professor, 25.6%
34.7%36.0%
37.4% 38.2%
Senior Lecturer/Reader,
37.3%
44.3% 44.6% 44.2% 44.2%Lecturer, 45.3%
47.6% 48.1% 48.9%49.9% Research and other
academics, 48.5%
20%
25%
30%
35%
40%
45%
50%
55%
2014 2015 2016 2017 2018
Figure 29: Proportion of Female in Academic Staff Levels
Professor Senior Lecturer/Reader Lecturer Research and other academics

22
Equality, Diversity and Inclusion Team, The University of Manchester
58.7%57.9% 57.7% 57.6%
Grade 1 - 4, 57.2%54.5%
55.2%56.0% 57.0%
Grade 5 & 6, 57.6%
47.7%48.3%
49.7% 49.8%
Grade 7, 50.8%51.0%
49.8%
52.7%
49.4%
Grade 8 & 9, 48.7%
45%
47%
49%
51%
53%
55%
57%
59%
61%
2014 2015 2016 2017 2018
Figure 30: Proportion of Females in Professional Services Staff Grades
Grade 1 - 4 Grade 5 & 6 Grade 7 Grade 8 & 9
Please note: y axis does not start at 0
The percentage of female staff at the University increased by 1.3% between 2014 and 2018 (Figure 28). In that period there has been a 1.4% increase in female academics and a 0.5% increase in female PS staff. In 2018 there was a decrease in proportion of females among academics by 0.4%-first time in 5 years. The percentage of females in all academic roles has increased among Lecturers and Professors but decreased in the Senior Lecturers/Readers category (Figure 29). The percentage of female PS staff at Grades 5-6 and Grade 7 has increased year on year between 2014 and 2018, with Grades 5-6 experiencing a 3.1% increase and Grade 7 experiencing a 3.1% increase in that period. Between 2014 and 2018 the percentage of female staff in Grades 1-4 has decreased by 1.5% and in Grades 8-9 by 2.3% (Figure 30).

23
Equality, Diversity and Inclusion Team, The University of Manchester
22, 6.9%
19, 86.4%
34, 6.7%
24, 70.6%
0%
20%
40%
60%
80%
100%
% of applications from thoseeligible
% of successful applications
Figure 31: Promotions to Chair by Gender 2018 (Count,Percentages)
Female Male
10, 3.6%
10, 100.0%
19, 4.8%
14, 73.7%
0%
20%
40%
60%
80%
100%
% of applications from thoseeligible
% of successful applications
Figure 32: Promotions to Reader by Gender 2018 (Count,Percentages)
Female Male
46, 7.2%
40, 87.0%
85, 10.9%
72, 84.7%
0%
20%
40%
60%
80%
100%
% of applications from thoseeligible
% of successful applications
Figure 33: Promotions to Senior Lecturers/Senior Research Fellows by Gender 2018 (Count,Percentages)
Female Male
In all promotions, a higher percentage of males that were eligible applied for promotions for Readers and Senior Lecturers/Senior Research Fellows (Figure 31 & 32). A higher percentage of females were successful in applications for promotions in all roles analysed above (Figure 31, 32 and 33).

24
Equality, Diversity and Inclusion Team, The University of Manchester
46.3%
40.8%
46.9%Academics, 45.7%
55.7%54.0%
57.9%
Professional Services, 58.2%
50.1%
47.0%
51.7% Overall, 51.1%
35%
40%
45%
50%
55%
60%
2015 2016 2017 2018
Figure 34: Female Leavers
Academics Professional Services Overall
Please note: y axis does not start at 0
Overall the percentage of females among leavers at the University has increased by 1.0% between 2015 and 2018 (Figure 34). There was a drop in female leavers in 2016, however this has risen in 2017 and decreased again in 2018.

25
Equality, Diversity and Inclusion Team, The University of Manchester
Recruitment
Table 1: Recruitment stages of core academic positions (Professorships,
Senior lectureships and lectureships) split by gender and ethnicity, 2017-2018
Table 2: Recruitment stages of Researchers and other academics (Senior
Research Fellows, Research Fellows, Researchers and others) split by gender
and ethnicity, 2017-2018
1. Core Academics (Professorships, Senior Professorships and lectureships)
Gender All Applications % Shortlisted %-All As % of Applications Successful %-All As % of Shortlisted As % of Applications
Male 3125 57.6% 407 49.9% 13.0% 72 50.0% 17.7% 2.3%
Female 2159 39.8% 388 47.5% 18.0% 68 47.2% 17.5% 3.1%
Unknown 137 2.5% 21 2.6% 15.3% 4 2.8% 19.0% 2.9%
Total 5421 100.0% 816 100.0% 15.1% 144 100.0% 17.6% 2.7%
Ethnicity All Applications % Shortlisted %-All As % of Applications Successful %-All As % of Shortlisted As % of Applications
White 3059 56.4% 557 68.3% 18.2% 97 67.4% 17.4% 3.2%
BAME 1988 36.7% 208 25.5% 10.5% 40 27.8% 19.2% 2.0%
Unknown 374 6.9% 51 6.3% 13.6% 7 4.9% 13.7% 1.9%
Total 5421 100.0% 816 100.0% 15.1% 144 100.0% 17.6% 2.7%
2. Researchers and other academics (SRF,RF and others)
Gender All Applications % Shortlisted %-All As % of Applications Successful %-All As % of Shortlisted As % of Applications
Male 7929 55.4% 856 53.0% 10.8% 250 52.4% 29.2% 3.2%
Female 5860 40.9% 683 42.3% 11.7% 201 42.1% 29.4% 3.4%
Unknown 524 3.7% 75 4.6% 14.3% 26 5.5% 34.7% 5.0%
Total 14313 100.0% 1614 100.0% 11.3% 477 100.0% 29.6% 3.3%
Ethnicity All Applications % Shortlisted %-All As % of Applications Successful %-All As % of Shortlisted As % of Applications
White 6070 42.4% 912 56.5% 15.0% 306 64.2% 33.6% 5.0%
BAME 7286 50.9% 583 36.1% 8.0% 140 29.4% 24.0% 1.9%
Unknown 957 6.7% 119 7.4% 12.4% 31 6.5% 26.1% 3.2%
Total 14313 100.0% 1614 100.0% 11.3% 477 100.0% 29.6% 3.3%
Gender: 40.9% of applications for research academic positions were sent by Females in the period studied. The proportion of Females increases among shortlisted candidates to 42.3% and is 42.1% among successful candidates. It seems that Females are doing well throughout the recruitment process, especially during the shortlisting. Ethnicity: 50.9%, of applications for research academic positions were sent by BAME candidates. The proportion of BAME candidates decreased to 36.1% among shortlisted and again to 29.4% among successful candidates. It seems that shortlisting provides particular challenge for BAME candidates- only 8.0% of BAME applications were shortlisted in comparison to 15.0% of White candidates’ applications.
Gender: 39.8% of applications for core academic positions were sent by Females in the period studied. However, Females seem to be more successful during the shortlisting and nearly as successful during the interview stages which results in nearly equal proportions of Males and Females among successful candidates-50.0% and 47.2% respectively. Ethnicity: 36.7% of applications for core academic positions were sent by BAME candidates. In addition, BAME candidates are underrepresented amongst those shortlisted. 25.5% of shortlisted candidates were BAME. 27.8% of successful candidates were BAME.

26
Equality, Diversity and Inclusion Team, The University of Manchester
Table 3: Recruitment stages of Professional Services split by gender and
ethnicity, 2017-2018
3. Professional Services
Gender All Applications % Shortlisted %-All As % of Applications Successful %-All As % of Shortlisted As % of Applications
Male 8451 39.2% 1066 33.7% 12.6% 236 31.1% 22.1% 2.8%
Female 12215 56.7% 1938 61.3% 15.9% 461 60.7% 23.8% 3.8%
Unknown 886 4.1% 158 5.0% 17.8% 63 8.3% 39.9% 7.1%
Total 21552 100.0% 3162 100.0% 14.7% 760 100.0% 24.0% 3.5%
Ethnicity All Applications % Shortlisted %-All As % of Applications Successful %-All As % of Shortlisted As % of Applications
White 14490 67.2% 2354 74.4% 16.2% 586 77.1% 24.9% 4.0%
BAME 5964 27.7% 632 20.0% 10.6% 110 14.5% 17.4% 1.8%
Unknown 1098 5.1% 176 5.6% 16.0% 64 8.4% 36.4% 5.8%
Total 21552 100.0% 3162 100.0% 14.7% 760 100.0% 24.0% 3.5%
Gender: 56.7% of applications for PS (both Faculty-based and central) positions were sent by Females in the period studied. The proportion of Females increases among shortlisted candidates to 61.3% and is 60.7% among successful candidates. It seems that Females are doing well throughout the recruitment process, especially during the shortlisting. Ethnicity: 27.7% of applications for PS (both Faculty-based and central) were sent by BAME candidates. The proportion of BAME candidates decreases to 20.0% among shortlisted and again to 14.5% among successful candidates. It seems that shortlisting provides a particular challenge for BAME candidates- only 10.6% of BAME applications were shortlisted in comparison to 16.2% of White candidates’ applications.

27
Equality, Diversity and Inclusion Team, The University of Manchester
Sexual Orientation, Gender Identity and Religion
53.1%
57.6%
0%
10%
20%
30%
40%
50%
60%
70%
2017 2018
Figure 35: Sexual Orientation: Response rates
0.4%
1.6%
1.9%
3.1%
9.0%
83.9%
0% 10% 20% 30% 40% 50% 60% 70% 80% 90% 100%
Other
Gay woman/lesbian
Bisexual
Gay man
Information refused
Heterosexual
Figure 36: Sexual Orientation of Employees, 2018 (Known Data)

28
Equality, Diversity and Inclusion Team, The University of Manchester
87.5%
80.0%
61.5%
42.0%
31.9%26.5%
Average Response
Rate, 57.6%
0%
10%
20%
30%
40%
50%
60%
70%
80%
90%
100%
25 or less 26 to 35 36 to 45 46 to 55 56 to 65 66 and above
Figure 37: Response rates of staff members to question about their sexual orientation by age
57.6% of staff at the University were willing to disclose their sexual orientation (an increase from the last year by 4.5%), of these 83.9% are heterosexual (Figure 35). Response rates are related to age: younger employees are far more likely to disclose their sexual orientation (Figure 37). Whilst there is still work to do on data disclosure for Sexual Orientation, we have seen some improvement thanks to:
Doubling the number of ALLOUT allies who have promoted the importance of data completion in MyView
Continued work with the Library to improve their data quality
Using the unknown data as a way to improve completion rates in FSE
FSE will run a bespoke LGBT event in 2019 to highlight their not known data for sexual orientation
Introducing the importance of data completion to potential employees at ‘The Works’
Focussing on data in the Diversity Calendar again in January and encouraging people to start the new year by updating their data

29
Equality, Diversity and Inclusion Team, The University of Manchester
Table 4: Gender Identity (see footnote below)1
Is your gender identity the
same as the gender you
were originally assigned at
birth?
2017 2018
Academic Professional
Support Grand Total Academic
Professional
Support Grand Total
Yes 98.6% 99.5% 99.1% 97.4% 98.1% 97.8%
No 0.0% 0.0% 0.0% 0.0% 0.0% 0.0%
Unknown 1.4% 0.5% 0.9% 2.6% 1.9% 2.2%
Grand Total 100.0% 100.0% 100.0% 100.0% 100.0% 100.0%
1 This data is pulled from our HR system and based on the information that people submit either as a new starter or through the self service system MyView. Whilst we have a very high completion of this field, the low numbers from such a high volume of staff(12,000) do give a 0% return on the gender identity field. We know however that a number of those who answered no to the question about gender identity is higher than 0% simply because the recent staff survey indicated that numbers were less than 0.1%

30
Equality, Diversity and Inclusion Team, The University of Manchester
Religion
53.2%57.6%
0%
10%
20%
30%
40%
50%
60%
70%
2017 2018
Figure 38: Religion: Response rates
0.2%
0.5%
0.6%
0.9%
1.7%
1.9%
4.3%
8.6%
33.6%
47.7%
0% 10% 20% 30% 40% 50% 60%
Sikh
Jewish
Spiritual
Buddhist
Other Religion or Belief
Hindu
Muslim
Prefer not to say/Information refused
Christian (inc CofE, Catholic etc)
No Religion or Belief
Figure 39: Religion of Employees, 2018 (Known Data)

31
Equality, Diversity and Inclusion Team, The University of Manchester
87.5%
79.5%
61.3%
42.6%
32.6%
26.5%
Average Response
Rate, 57.6%
0%
10%
20%
30%
40%
50%
60%
70%
80%
90%
100%
25 or less 26 to 35 36 to 45 46 to 55 56 to 65 66 and above
Figure 40: Response rates of staff members to question about their religion by age
57.6% of staff at the University were willing to disclose their religion (an increase from the last year by 4.4%), of these 47.7% declared themselves as non-Religious/ Believers (Figures 37 and 38). Response rates are related to age: younger employees are far more likely to disclose their religion (Figure 39).

32
Equality, Diversity and Inclusion Team, The University of Manchester
International Staff
Table 5: International staff count and percentage- Top 10 Countries 2018
Country Number of
staff members
As a % of International
Staff
China 192 8.9%
Italy 175 8.1%
Germany 159 7.3%
Spain 149 6.9%
Ireland 123 5.7%
India 107 4.9%
France 105 4.8%
Greece 100 4.6%
Poland 94 4.3%
United States of America 93 4.3%
The University of Manchester has more than 2000 members of staff who declared a nationality other than ‘British’. This group comes from more than 100 different countries. Table 5 below indicates the 10 most common nationalities of the University of Manchester International Staff.

33
Equality, Diversity and Inclusion Team, The University of Manchester
Map: University of Manchester International staff by nationality 2018
The darker red colour the more non-UK staff identified that particular country as their nationality

34
Equality, Diversity and Inclusion Team, The University of Manchester
Student Equality Information: Key Findings
Undergraduate
Age: In 2018/19 8.6% of all undergraduate students were considered ‘mature’. This is a 0.5%
decrease from the last year and a 1.5% decrease over the past five years (see Figure 2).
Disability: 9.3% of all undergraduate students have a disability– most of them report
learning difficulties and mental health conditions (see Figure 3 and 3b). 58.8% of disabled
students are female (see Figure 5) and 24.0% are BAME (see Figure 6).
Ethnicity: The percentage of UK domicile BAME students at the University has increased by
0.7% in the past year to 30.9% in 2017/18 (see Figure 8).
Domicile: In 2018/19 the percentage of UK domicile students dropped by 2.3% to 65.3%-the
lowest level in five years. There has been a 1.1% rise in overseas students and a 1.1% rise in
EU domicile students between 2017/18 and 2018/19 (see Figure 10).
Gender: In 2018/19 the percentage of female undergraduate students increased by 0.7% to
54.1% (see Figure 11). The highest proportion of females is among Black students – 61.3%
(see Figure 12).
Attainment
Ethnicity: Good degree attainment (achieved degree of a 2:1 or above) has increased to
89.7% for White students and 81.0% for BAME students in 2017/18 which has caused a
decrease in the attainment gap to 8.7% (see Figure 15). White students have consistently
achieved a higher percentage of good degrees compared with other UK ethnic groups. In
2017/18 there has been a 4.2% increase in the number of Black students obtaining good
degrees compared with the previous year (see Figure 16).
Gender: Consistently a higher percentage of female students attain good degrees compared
with males. The attainment gap remained stable between 2015/16 and 2017/18. In
2017/18, good degree attainment for male students increased by 1.6% and for females by
1.4% (see Figure 18).
Disability: Students with no known disability consistently outperform those with a disability.
The attainment gap has decreased in 2017/18 to 1.1% (see Figure 20).
Domicile: Consistently a higher proportion of both UK and EU domicile students attain good
degrees compared with the international domicile students. Good degree attainment of
International students has increased rapidly between 2014/15 and 2017/18 with an increase
of 12.4% across those four years. This has decreased the attainment gap between
International and UK students to 14.5% in 2017/18 (see Figure 22).

35
Equality, Diversity and Inclusion Team, The University of Manchester
Retention
(Definition: Proportion of students who continued their studies in Higher Education a year
after they started)
Ethnicity: In 2015/16 White student retention was 94.5% compared with 95.0% for BAME
students. White students had higher retention than BAME students between 2009/10 and
2014/15 with the exception of 2012/13 (see Figure 24).
Gender: In 2015/16 female student retention was 94.7% compared with 94.6% for male
students. This decreased the retention gap to 0.1% (see Figure 25).
Disability: Students with no known disability have consistently had better retention than
those without a disability. Disabled student retention increased to 91.4% in 2015/16
increasing the retention gap between disabled and non-disabled students to 3.7 (see Figure
26).
Postgraduate
Domicile: In 2018/19 54.6% of postgraduate students come from outside of the EU. The
proportion of postgraduate students domiciled in the UK decreased to 39.9% in 2018/19
and the proportion of EU domiciled students has decreased by 0.6% to 5.4% (see Figure 28).
Ethnicity: In 2018/19 the proportion of UK BAME students on postgraduate taught courses
increased to 25.5%. The percentage of UK BAME students on postgraduate research courses
decreased year on year between 2014/15 and 2017/18, but increased in 2018/19 to 16.6%.
(see Figure 29).
Gender: The proportion of females within postgraduate population increased in 2018/19 to
59.9%. This was driven by a 1.1% rise in female students doing postgraduate taught
programs. Proportion of female students on research programs decreased by 0.7% to 46.0%
in 2018/19 (see Figure 33).
Methodology
Data of current students in this report relates to 2018/19 year and has come from the 1st of
December dataset produced by the Directorate of Planning. The data is current and up to
date as of 1st December 2018 and has been analysed by the Equality, Diversity and Inclusion
team. Data related to Attainment and Retention comes from Higher Education Statistics
Agency Returns produced by the Directorate of Planning on an annual basis every autumn.

36
Equality, Diversity and Inclusion Team, The University of Manchester
Age
3.0%
53.9%
26.6%
7.9% 8.6%
0%
10%
20%
30%
40%
50%
60%
Under 18 18 19 20 21 and over(Mature)
Figure 1: Undergraduate Students by Age 2018/19
10.1% 9.7% 9.6% 9.1% Mature , 8.6%
89.9% 90.3% 90.4% 90.9% Young, 91.4%
0%
10%
20%
30%
40%
50%
60%
70%
80%
90%
100%
2014/15 2015/16 2016/17 2017/18 2018/19
Figure 2: Undergraduate Students by Mature and Young
The most common age to start an undergraduate course at the University is 18, with 53.9% of all undergraduates starting in 2018/19 of that age (Figure 1). Undergraduate students can be divided into two categories; young and mature. Young students are those aged under 21 on the start date of the term in which their course commences. Mature students are 21 or over by this date. Over the past five years there has been a 1.5% decrease in mature students, with a 0.5% decrease in the past year (Figure 2).

37
Equality, Diversity and Inclusion Team, The University of Manchester
Disability
9.3%
90.7%
0%
10%
20%
30%
40%
50%
60%
70%
80%
90%
100%
Known Disability No Known Disability
Figure 3: Undergraduate Students by disability 2018/19
0.9%
1.2%
1.9%
5.1%
7.0%
7.8%
15.3%
25.3%
35.4%
0% 5% 10% 15% 20% 25% 30% 35% 40%
Wheelchair/Mobility
Blind/Partially Sighted
Deaf/Partial Hearing
Autistic/Asperger Syndrome
Multiple Disabilities
Unseen Disability
Other Disabilities
Mental Health
Learning Difficulty
Figure 3b: Disabled Undegraduate Students by type of condition 2018/19
9.3% of all undergraduate students have a disability (Figure 3). This is an increase of 0.3% since 2017/18 (Figure 4). Most disabled students report Learning Difficulties and Mental Health Conditions (see figure 3b.) Of those that have a disability 58.8% are female (Figure 5) and 24.0% are BAME (Figure 6).

38
Equality, Diversity and Inclusion Team, The University of Manchester
8.2%
9.0%
8.3%
9.0%
9.3%
7.6%
7.8%
8.0%
8.2%
8.4%
8.6%
8.8%
9.0%
9.2%
9.4%
9.6%
2014/15 2015/16 2016/17 2017/18 2018/19
Figure 4: Disabled Undergraduate Students
Please note: y axis does not start at 0
Females, 58.8%
Females, 53.6%
Males, 41.2%
Males, 46.4%
0% 10% 20% 30% 40% 50% 60% 70% 80% 90% 100%
Known Disability
No Known Disability
Figure 5: Disability by Gender Undergraduate Students 2018/19

39
Equality, Diversity and Inclusion Team, The University of Manchester
White, 68.0%
White, 75.6%
BAME, 31.9%
BAME, 24.0%
Unknown, 0.1%
Unknown, 0.4%
0% 10% 20% 30% 40% 50% 60% 70% 80% 90% 100%
No Known Disability
Known Disability
Figure 6: Disability by Ethnicity for UK Undergraduate Students 2018/19

40
Equality, Diversity and Inclusion Team, The University of Manchester
Ethnicity
0.2%
4.2%
6.8%
19.9%
69.0%
0% 10% 20% 30% 40% 50% 60% 70% 80%
Unknown
Black
Other/Mixed
Asian
White
Figure 7: UK Domicile Undergraduate Students by Ethnicity 2018/19
30.9% of UK domicile undergraduate students at the University are Black, Asian and Minority Ethnic (BAME) students. This is an increase of 0.7% since 2017/18 and an increase of 5.4% in the last five years (Figure 8). The largest represented BAME group is Asian representing 19.9% of the undergraduate student population. Only 4.2% of UK domicile students are Black making it the least represented ethnic group (Figure 7).

41
Equality, Diversity and Inclusion Team, The University of Manchester
25.2%
27.2%
27.9%
30.2%
30.9%
24%
25%
26%
27%
28%
29%
30%
31%
32%
2014/15 2015/16 2016/17 2017/18 2018/19
Figure 8: Percentage of UK Domicile BAME Students
Please note: y axis does not start at 0

42
Equality, Diversity and Inclusion Team, The University of Manchester
White, 69.7%
White, 68.0%
Asian, 18.8%
Asian, 21.2%
Black, 4.5%
Black, 3.7%
Other/Mixed, 6.8%
Other/Mixed, 6.8%
Unknown, 0.1%
Unknown, 0.2%
0% 10% 20% 30% 40% 50% 60% 70% 80% 90% 100%
Females
Males
Figure 9: Ethnicity by Gender 2018/19
For both genders the proportions of each ethnicity are similar. There are 1.3% less White students among males compared with White females and 0.8% less Black students (Figure 9).

43
Equality, Diversity and Inclusion Team, The University of Manchester
Domicile
4.9% 5.5% 6.7% 7.2% 7.7% EU, 8.9%
21.2% 21.3% 22.2% 22.4%24.7% Overseas, 25.8%
73.9% 73.1%71.1% 70.4%
67.6%UK, 65.3%
0%
10%
20%
30%
40%
50%
60%
70%
80%
90%
100%
2013/14 2014/15 2015/16 2016/17 2017/18 2018/19
Figure 10: Undergraduate Students by Domicile
In 2018/19 the percentage of UK domicile students dropped by 2.3% to 65.3%, the lowest it has been within the period considered. There has been a 1.1% rise in overseas students and a 1.1% rise in EU domicile students between 2017/18 and 2018/19 (Figure 10).

44
Equality, Diversity and Inclusion Team, The University of Manchester
Gender
51.6%
52.6%
52.6%
54.5%
53.4%
54.1%
48.4%
47.4%
47.4%
45.5%
46.6%
45.9%
0% 10% 20% 30% 40% 50% 60% 70% 80% 90% 100%
2013/14
2014/15
2015/16
2016/17
2017/18
2018/19
Figure 11: Undergraduate Student Gender
Females Males
44.4%
53.3%
55.1%
56.3%
56.9%
61.3%
55.6%
46.7%
44.9%
43.7%
43.1%
38.7%
0% 10% 20% 30% 40% 50% 60% 70% 80% 90% 100%
Unknown
Asian
Overall BAME
Other/Mixed
White
Black
Figure 12: Gender by Ethnicity 2018/19
Females Males
The undergraduate student population consists of 54.1% female and 45.9% male students. There has been a decrease in the proportion of females 1.1% since 2016/17. In the last five years there have consistently been more undergraduate female students than male students. The largest proportion of females is among Black students (figure 12).

45
Equality, Diversity and Inclusion Team, The University of Manchester
Religion
0.3%
0.7%
0.8%
0.9%
1.4%
1.9%
5.1%
14.3%
24.3%
50.3%
0% 10% 20% 30% 40% 50% 60%
Buddhist
Jewish
Sikh
Any other religion or belief
Spiritual
Hindu
Information refused
Muslim
Christian
No religion
Figure 13: Religion of UK Full-Time Undergraduate Students 2018/19
50.3% of UK domicile students on full-time courses have no religion and 5.1% refused to give any religious information. Christian and Muslim are the highest represented religions with 24.3% and 14.3% respectively (Figure 13).

46
Equality, Diversity and Inclusion Team, The University of Manchester
Sexual Orientation
Table 1: Gender Identity of UK Full-time Undergraduate Students 2018/19
Is your Gender the same as assigned at birth? Grand Total
Yes 97.5%
No 0.2%
Information Refused 2.2%
1.1%
1.2%
1.8%
5.2%
6.2%
84.7%
0% 10% 20% 30% 40% 50% 60% 70% 80% 90% 100%
Gay woman/lesbian
Other
Gay man
Bisexual
Information refused
Heterosexual
Figure 14: Sexual Orientation of UK Domicle Full-TIme Undergraduate Students 2018/19
84.7% of UK domicile students on full time courses are heterosexual. 6.2% of students refused to disclose their sexual orientation (Figure 14).

47
Equality, Diversity and Inclusion Team, The University of Manchester
Attainment
79.5%
82.5% 83.0%85.9%
88.8% White, 89.7%
67.3%
71.6%
75.2% 74.3%75.9%
BAME, 81.0%
40%
50%
60%
70%
80%
90%
100%
2012/13 2013/14 2014/15 2015/16 2016/17 2017/18
Figure 15: Good Degree Attainment of UK White and BAME Students
Please note: y axis does not start at 0
Good degree attainment (achieved degree of a 2:1 or above) has increased to 89.7% for White students and 81.0% for BAME students in 2017/18 which has caused a decrease in the attainment gap to 8.7% (Figure 15).

48
Equality, Diversity and Inclusion Team, The University of Manchester
79.5%
82.5% 83.0%85.9%
88.8% White, 89.7%
65.8%
70.2%
75.9%73.8%
74.0%
Asian, 79.4%
62.5%60.4%
64.0% 64.2%
73.8%
Black, 78.0%74.2%
80.5% 79.4% 80.3%81.8%
Mixed/Other, 85.4%
40%
50%
60%
70%
80%
90%
100%
2012/13 2013/14 2014/15 2015/16 2016/17 2017/18
Figure 16: Good Degree Attainment of UK Ethnicity Groups
White Asian Black Mixed/Other
Please note: y axis does not start at 0
White students have consistently achieved a higher percentage of good degrees compared with other UK ethnic groups. In 2017/18 there has been a 4.2% increase in the number of Black students obtaining good degrees compared with the previous year. Other/Mixed students continue to obtain the highest proportion of good degrees out of BAME students with a 3.6% increase in good degree achievement between 2017/18 and 2018/19 (Figure 16).

49
Equality, Diversity and Inclusion Team, The University of Manchester
23.4%24.8%
30.2% 29.9%
34.7%
White, 39.2%
15.1% 16.0%
20.7% 20.3%20.2%
Asian, 24.5%
8.9% 9.4%
19.1%
12.8%
18.1%
Black, 22.6%19.8%21.7%
23.2%24.3%
31.3%
Mixed/Other, 36.1%
0%
5%
10%
15%
20%
25%
30%
35%
40%
45%
2012/13 2013/14 2014/15 2015/16 2016/17 2017/18
Figure 17: First Class Degree Attainment of UK Ethnicity Groups
White Asian Black Mixed/Other
In 2017/18 39.2% of White students achieved a first class degree. White students are more likely to achieve first class degrees than other ethnic groups; with Black students the least likely group to achieve first class degrees. There has been a 15.8% increase in first class degrees attained by White students between 2012/13 and 2017/18 compared with 16.3% for Other students, 9.4% for Asian students and 13.7% for Black students (Figure 17).

50
Equality, Diversity and Inclusion Team, The University of Manchester
72.6% 72.4%
74.3%75.4%
79.0%
Male, 80.6%
74.5%
78.5%77.8%
80.7%
84.0%Females, 85.4%
60%
65%
70%
75%
80%
85%
90%
2012/13 2013/14 2014/15 2015/16 2016/17 2017/18
Figure 18: Good Degree Attainment of by Gender
Please note: y axis does not start at 0
Consistently a higher percentage of female students attain good degrees compared with males. The attainment gap remained stable between 2015/16 and 2017/18. In 2017/18 good degree attainment for male students increased by 1.6% and for females by 1.4%.

51
Equality, Diversity and Inclusion Team, The University of Manchester
22.5%
22.3%
28.1%27.3%
31.9%
Male, 35.1%
20.6%
22.9%25.0%
26.3%
30.0%
Female, 34.5%
10%
15%
20%
25%
30%
35%
40%
2012/13 2013/14 2014/15 2015/16 2016/17 2017/18
Figure 19: First Class Degree Attainment by Gender
Male Female
Please note: y axis does not start at 0
In 2017/18 0.6% more male students received first class degrees compared with female students. Each year since 2014/15 a higher percentage of male students have achieved first class degrees compared with female students. The proportion of female students attaining first class degrees has increased steadily between 2013/14 and 2017/18 (Figure 19).

52
Equality, Diversity and Inclusion Team, The University of Manchester
72.0%
73.9% 73.8%
77.4%
80.6%
Disabled, 82.2%
73.9%
75.9%76.4%
78.4%
81.9%
No known Disability, 83.3%
65%
67%
69%
71%
73%
75%
77%
79%
81%
83%
85%
2012/13 2013/14 2014/15 2015/16 2016/17 2017/18
Figure 20: Good Degree Attainment of Disabled and No-Known Disability Students
Please note: y axis does not start at 0
Students with no known disability consistently outperform those with a disability. The attainment gap has decreased in 2017/18 to 1.1% (Figure 20).
53
Equality, Diversity and Inclusion Team, The University of Manchester
19.5% 19.0%
21.1%20.2%
26.8%
Disabled, 30.8%
21.7%23.1%
27.1%27.8%
31.6%
No Known Disability, 35.6%
10%
15%
20%
25%
30%
35%
40%
2012/13 2013/14 2014/15 2015/16 2016/17 2017/18
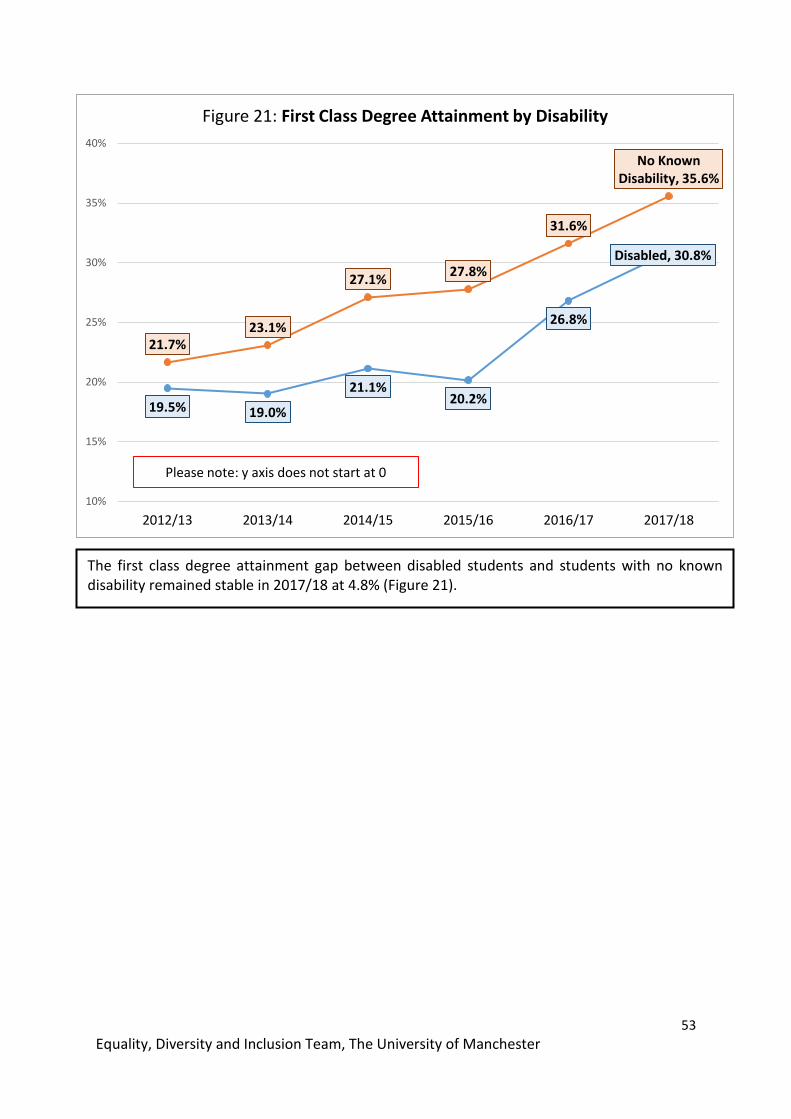
Figure 21: First Class Degree Attainment by Disability
Please note: y axis does not start at 0
The first class degree attainment gap between disabled students and students with no known disability remained stable in 2017/18 at 4.8% (Figure 21).

54
Equality, Diversity and Inclusion Team, The University of Manchester
77.1%80.4% 81.3% 82.3%
85.3%UK, 86.9%
75.4% 76.6%79.0%
81.8%80.2%
EU, 81.8%
58.5% 58.3%60.0%
64.2%
70.2%
Overseas, 72.4%
40%
50%
60%
70%
80%
90%
100%
2012/13 2013/14 2014/15 2015/16 2016/17 2017/18
Figure 22: Good Degree Attainment Categorised by Domicile Groups
UK EU Overseas
Please note: y axis does not start at 0
Consistently a higher proportion of both UK and EU domicile students attain good degrees compared with the international domicile students (Figure 22). Good degree attainment of International students has increased rapidly between 2014/15 and 2017/18 with an increase of 12.4% across those four years. This has decreased the attainment gap between International and UK students to 14.5% in 2017/18. Good degree attainment of EU students has increased by 1.6% in 2017/18 back to the level from 2015/16.

55
Equality, Diversity and Inclusion Team, The University of Manchester
64.5% 62.8%
69.5% 70.0% 75.5%
Black, 84.0%
62.9%
72.2%78.4% 74.7% 76.7%
Asian, 84.1%81.3%
84.8% 83.1% 81.5% 85.4%
Mixed/Other, 87.9%80.2%
84.1% 84.4%88.1%
90.9% White, 91.4%
0%
10%
20%
30%
40%
50%
60%
70%
80%
90%
100%
2012/13 2013/14 2014/15 2015/16 2016/17 2017/18
Figure 23: Female Good Degree Attainment categorised by Ethnicity and Academic Year
Black Asian Mixed/Other White
Good degree attainment of female students is highest for White students with Black female students receiving the lowest number of good degrees in each year (Figure 23).

56
Equality, Diversity and Inclusion Team, The University of Manchester
Retention
93.2%
94.7%
92.8%
94.6% 94.5%White, 94.5%
91.5%
92.9%
94.5%
93.8%93.7%
BAME, 95.0%
90%
91%
92%
93%
94%
95%
96%
2010/11 2011/12 2012/13 2013/14 2014/15 2015/16
Figure 24: Retention of UK White and BAME students
White BAME
Please note: y axis does not start at 0
There has been fluctuation of retention rates for ethnic groups between 2010/11 and 2015/16 (the newest available data). In 2015/16 White students had a 0.5% lower retention than BAME students.

57
Equality, Diversity and Inclusion Team, The University of Manchester
94.2%
94.7%
93.6%
94.9% 94.9%Female , 94.7%
91.4%
94.0%
92.7%
93.9%93.6%
Male, 94.6%
90%
91%
92%
93%
94%
95%
96%
2010/11 2011/12 2012/13 2013/14 2014/15 2015/16
Figure 25: Retention of UK students by Gender
Please note: y axis does not start at 0
91.7%
93.3%
87.6%
92.8% 94.1%
Known disability,
91.4%
93.0%
94.4%93.8%
94.6% 94.3%No known disability,
95.1%
86%
87%
88%
89%
90%
91%
92%
93%
94%
95%
96%
2010/11 2011/12 2012/13 2013/14 2014/15 2015/16
Figure 26: Retention of UK Disabled and those with No Known Disability
Known disability No known disability
Please note: y axis does not start at 0
In 2014/15 the retention gap between students with and without a disability increased to 3.7%.
In 2014/15 female student retention is 0.1% higher than male retention in 2015/16. The retention of female students has consistently been higher than male students from 2010/11 onwards (Figure 25).

58
Equality, Diversity and Inclusion Team, The University of Manchester
94.4%
95.0%
92.9%
94.9%
94.7%
White Females, 94.7%
93.2%
93.5%
95.6%
94.9%
95.5%
BAME Females, 94.8%
92%
93%
93%
94%
94%
95%
95%
96%
96%
2010/11 2011/12 2012/13 2013/14 2014/15 2015/16
Figure 27: Retention of Female UK White and BAME students
White Females BAME Females
Please note: y axis does not start at 0
BAME female students had better retention than white female students between 2012/13 and 2015/16. In 2015/16 there was 0.1% higher retention for BAME female students compared with White female students (Figure 27).

59
Equality, Diversity and Inclusion Team, The University of Manchester
Postgraduate
52.5% 53.0% 51.7% 52.0%Overseas, 54.6%
6.8% 5.9% 6.2% 6.0% EU, 5.4%
40.8% 41.2% 42.1% 42.1%UK, 39.9%
0%
10%
20%
30%
40%
50%
60%
70%
2014/15 2015/16 2016/17 2017/18 2018/19
Figure 28: Postgraduate Students by Domicile
Overseas EU UK
In 2018/19 54.6% of postgraduate students come from outside of the EU. The proportion of postgraduate students domiciled in the UK decreased to 39.9% in 2018/19 and the proportion of EU domiciled students has decreased by 0.6% to 5.4% (Figure 28).
Students completing postgraduate study can be divided into those on postgraduate taught courses and those on postgraduate research courses. Postgraduate research can be further broken down into doctoral training and masters degrees. Postgraduate research masters degrees include MSc by Research, Master of Enterprise (MEnt) and Master of Philosophy. Doctoral Training results in different degree types. These can include Doctor of Philosophy (PhD), Doctor of Medicine (MD), Clinical Psychology (ClinPsyD), Education (EdD), Educational Psychology (DEdPsy), Educational and Child Psychology (DEdChPsychol), Engineering (EngD), Enterprise (EntD), Counselling Psychology (DCounsPsych), Doctor of Business Administration (DBA), Doctor of Professional Studies (DProf) and Doctor of Clinical Science (DClinSci). In 2018/19 93.1% of postgraduate research students started doctoral training and 6.7% are completing research masters.
60
Equality, Diversity and Inclusion Team, The University of Manchester
16.0% 15.8%15.0% 14.6%
Postgraduate Research, 16.6%
20.2%
22.8%21.7%
22.8%
Postgraduate Taught, 25.5%
19.3%
21.5%20.7% 21.2%
All Postgraduates, 23.9%
10%
15%
20%
25%
30%
2014/15 2015/16 2016/17 2017/18 2018/19
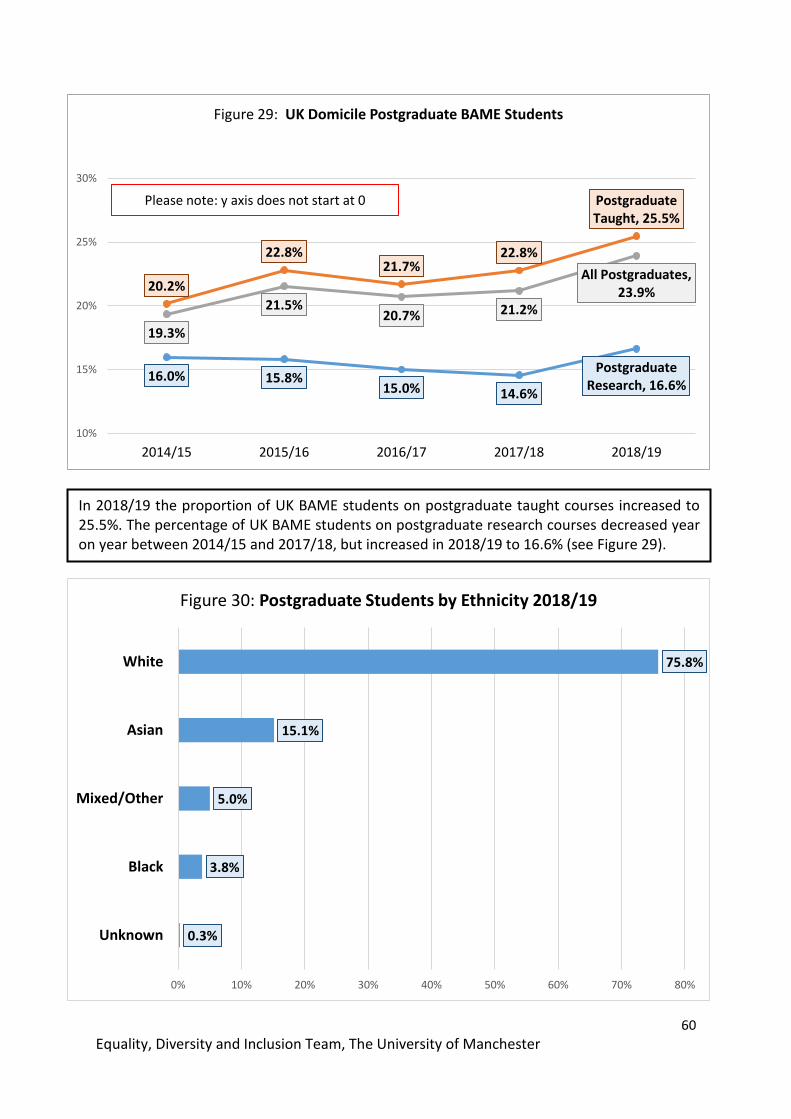
Figure 29: UK Domicile Postgraduate BAME Students
Please note: y axis does not start at 0
0.3%
3.8%
5.0%
15.1%
75.8%
0% 10% 20% 30% 40% 50% 60% 70% 80%
Unknown
Black
Mixed/Other
Asian
White
Figure 30: Postgraduate Students by Ethnicity 2018/19
In 2018/19 the proportion of UK BAME students on postgraduate taught courses increased to 25.5%. The percentage of UK BAME students on postgraduate research courses decreased year on year between 2014/15 and 2017/18, but increased in 2018/19 to 16.6% (see Figure 29).

61
Equality, Diversity and Inclusion Team, The University of Manchester
0.3%
4.1%
5.0%
16.4%
74.3%
0% 10% 20% 30% 40% 50% 60% 70% 80%
Unknown
Black
Mixed/Other
Asian
White
Figure 31: Postgraduate Taught by Ethnicity 2018/19
0.3%
2.3%
5.0%
9.4%
83.0%
0% 10% 20% 30% 40% 50% 60% 70% 80% 90%
Unknown
Black
Mixed/Other
Asian
White
Figure 32: Postgraduate Research by Ethnicity 2018/19
In 2018/19 74.3% of postgraduate taught students are White (Figure 31) compared with 83.0% of postgraduate research students (Figure 32). Asian is the next largest ethnic group for postgraduate study with 9.4% of postgraduate research students and 16.4% of postgraduate taught students being Asian.

62
Equality, Diversity and Inclusion Team, The University of Manchester
Gender
45.4% 45.1% 44.5%
46.7%POSTGRADUATE
RESEARCH, 46.0%
58.1%
60.5% 60.2%61.1%
POSTGRADUATE TAUGHT, 62.2%
56.0%
58.1% 58.1%58.8%
All POSTGRADUATE , 59.9%
40%
45%
50%
55%
60%
65%
70%
2014/15 2015/16 2016/17 2017/18 2018/19
Figure 33: Female Postgraduate Students
The proportion of females within postgraduate population increased in 2018/19 to 59.9%. This was driven by a 1.1% rise in female students doing postgraduate taught programs. Proportion of female students on research programs decreased by 0.7% to 46.0% in 2018/19 (Figure 33).

63
Equality, Diversity and Inclusion Team, The University of Manchester
40.0%
54.8%
57.5%
59.4%
57.2%
58.3%
60.0%
45.2%
42.5%
40.6%
42.8%
41.7%
0% 10% 20% 30% 40% 50% 60% 70% 80% 90% 100%
Unknown
Mixed/Other
Asian
Black
Overall BAME
White
Figure 34: Postgraduate Student Gender by Ethnicity 2017/18
Females Males
In 2018/19 58.3% of white and BAME postgraduate students were female. 59.4% of Black postgraduate students are female (Figure 34), the highest proportion out of all ethnic minority groups.