epubs.surrey.ac.ukepubs.surrey.ac.uk/849180/1/thesis_dayour.doc · web viewthe word...
TRANSCRIPT

BACKPACKERS’ PERCEPTIONS OF RISK
TOWARDS SMARTPHONE USAGE AND
RISK REDUCTION STRATEGIES, GHANAby
FREDERICK DAYOUR
Submitted for the Degree of Doctor of Philosophy
University of Surrey
Faculty of Arts and Social Sciences
School of Hospitality and Tourism Management
Supervisors:
Dr. Albert N. Kimbu Dr. Sangwon Park
© Frederick Dayour 2018

ABSTRACT
The tourism literature is replete with evidence about the indispensability of mobile technology and the Internet among backpackers – reshaping their travel ideology and enhancing experiences. The smartphone and other electronic devices in particular have become ‘travel companions’ – permitting virtual networking and innovativeness on the road. However, the users of mobile devices often become susceptible not only to security and privacy risks but also challenges with evaluating products and services online in advance of purchases. In spite of the evidence that backpackers do have risk concerns during travel, especially at the destination of visit than before, it is surprising that efforts to understand their risk concerns towards smartphone usage has up till now been neglected by tourism researchers. Backpackers’ distinctiveness to mainstream travellers in terms of their youthfulness, individuality and flexibility, suggest that the experiences with their smartphones would be different as would their risk perceptions. Besides, past studies in tourism have been overly focussed on understanding risk regarding the use of information technology – overlooking situational factors – that reflect the context (such as the destination) in which smartphones are being used. Furthermore, there is a paucity of information on personal risk reduction strategies adopted by mobile users during travel. Therefore, this study aims to explore backpackers’ risk perceptions towards smartphone usage vis-à-vis information technology risks and destination related risks and to identify the antecedents and outcomes of their perceived risk, as well as risk reduction strategies.
Employing a quantitative-dominant concurrent embedded mixed methods research design, data were collected in Ghana using a structured questionnaire and a semi-structured interview guide. A survey involving 567 backpackers and in-depth, semi-structured interviews with 15 respondents were conducted. Quantitative data was collected on risk perceptions, as well as antecedents and outcomes and analysed using SPSS 22, AMOS 22, and SmartPLS 3.0. The qualitative data, which also addressed their risk perceptions and especially risk reduction strategies was analysed thematically using both the deductive and inductive coding techniques.
This study inimitably proposed an integrative model of backpackers’ risk perceptions towards smartphone usage by combining information technology and destination related risks factors. Regarding the antecedents of their risk perceptions, while perceived innovation, trust in their smartphones, and familiarity were found as key inhibitors of backpackers’ perceived risk, observability had no association with perceived risk. Relatedly, consumers’ trust in their smartphones had a significant positive impact on the intentions to reuse a smartphone for future travel as did their satisfaction with the device and satisfaction with travel. Furthermore, perceived risk had a significant negative effect on travel satisfaction, but not the satisfaction with a smartphone and intentions to reuse it for future travel. Also, through a qualitative in-depth investigation, the study found that backpackers used a mix of cognitive and non-cognitive (overt) risk reduction strategies against the risk they perceived. These included: 1) psyching up oneself about the possibility of unpleasant occurrences; 2) using safer alternatives for Internet banking; 3) not exposing their phones in public; 4) using cheaper (for that matter expendable) smartphones during travel; and 5) non-reliance on the Internet for information. The theoretical, managerial, methodological and policy relevance and/or contributions of the thesis are discussed.
Keywords: Backpackers, destination, risk perception, mixed methods, risk reduction, Ghana
ii
ACKNOWLEDGEMENTS
Certainly, my PhD journey, which was a challenging experience, saw the support of many that need to be acknowledged at this juncture. First, I would like to show a very distinct appreciation to my supervisors: Dr. Albert N. Kimbu and Dr. Sangwon Park for the dedicated and excellent guidance they gave me. They have been very good friends and supervisors who have contributed immeasurably to my research experience by challenging and giving me the right amount of advice. I am profoundly indebted to them for the enviable responsiveness and zeal they demonstrated in supervising me. To my advisor, Prof. Allan Williams, I am most grateful for your assistance and fatherly advice.
My profound gratitude also goes to my lovely and very supportive wife, Nana Ama Dayour for her incessant prayers and encouragement throughout the time of my studies. She has been a strong ‘pillar’ worth a mention. Next, I would like to thank my parents Oxford (Dada) and Lucilla (Mmaama) for their prayers and support throughout my educational journey to date. The shine in my life today is undoubtedly a function of the belief they had in me and of the good parental guidance and unflinching spiritual support they gave me. I am also grateful to my in-laws Mr. and Mrs. Alex Kontoh for their prayers and support during this time. To my in-laws, Alex, Richard, Felix and all my brothers and sisters as well as sister in-laws who kept me going, I say a big thank you.
I would also like to say a big thank you to Dr. Jonas Akudugu and Dr. Emmanuel Deribile for their kind support. Finally, my appreciation to friends who have also supported me in diverse ways especially Dr. Jason Chen, Dr. Amenumeny, Prof. Boakye, Prof. Amuquandoh, Dr. Adam, Dr. Hiamey, Dr. Jasaw, Wey, Charles, Morgan, Asaare at Oasis Beach Resort, Danial, and Elijah. To all others who have supported me wittingly or unwittingly, thank you.
iii

DEDICATION
I dedicate this piece of work to family.
iv

DECLARATION
This thesis and the work to which it refers are the results of my own efforts. Any ideas, data, images or text resulting from the work of others (whether published or unpublished) are fully identified as such within the work and attributed to their originator in the text, bibliography or in footnotes. This thesis has not been submitted in whole or in part for any other academic degree or professional qualification. I agree that the University has the right to submit my work to the plagiarism detection service TurnitinUK for originality checks. Whether or not drafts have been so-assessed, the University reserves the right to require an electronic version of the final document (as submitted) for assessment as above.
Signature: _______ ___
Date: ________01/09/2018______________
v

TABLE OF CONTENTS
ABSTRACT...............................................................................................................................iiACKNOWLEDGEMENTS......................................................................................................iiiDEDICATION..........................................................................................................................ivDECLARATION.......................................................................................................................vTABLE OF CONTENTS..........................................................................................................viLIST OF TABLES...................................................................................................................xiiLIST OF FIGURES................................................................................................................xiiiLIST OF ACRONYMS..........................................................................................................xiv1 CHAPTER ONE – INTRODUCTION...............................................................................1
1.1 Introduction.................................................................................................................11.1.1 Background to the study.......................................................................................11.1.2 Ghana in relevant context.....................................................................................41.1.3 Challenges facing the destination: Emphasis on tourism.....................................6
1.1.3.1 Safety and security........................................................................................6
1.1.3.2 ICTs and challenges......................................................................................7
1.1.4 Problem statement................................................................................................91.1.5 The research aim and objectives........................................................................131.1.6 Rationale of the study.........................................................................................141.1.7 Structure of the thesis.........................................................................................16
2 CHAPTER TWO – LITERATURE REVIEW.................................................................18Understanding backpacking: A critical review........................................................................18
2.1 Introduction...............................................................................................................182.2 A brief historical account of backpacking.................................................................182.3 Conceptualising backpackers: The use of different operational criteria...................23
2.3.1 Socio-demographic characteristic - Age............................................................242.3.2 Motivations for travel.........................................................................................252.3.3 Length of stay and mode of travel......................................................................252.3.4 Flexibility...........................................................................................................262.3.5 Ideology..............................................................................................................262.3.6 Self-identification...............................................................................................27
2.4 Relationship between tourists’ typology and backpackers: A critical review...........282.4.1 Wonderluster versus sunluster model................................................................282.4.2 Institutionalised versus non-institutionalised tourists’ model............................28
vi

2.4.3 Psychocentrics versus allocentrics model..........................................................292.4.4 Motivational psychographics model..................................................................302.4.5 The all-inclusive typology..................................................................................302.4.6 Backpackers versus flashpackers.......................................................................312.4.7 Comparing backpackers and conventional tourists............................................34
2.5 Backpacking and community development nexus: A focus on developing destinations...........................................................................................................................362.6 Summary....................................................................................................................40
3 CHAPTER THREE – LITERATURE REVIEW.............................................................41Information and Communication Technologies (ICT) and Tourism.......................................41
3.1 Introduction...............................................................................................................413.2 Background to Information and Communication Technologies...............................41
3.2.1 The tourism industry and ICTs..........................................................................433.2.1.1 Theoretical reflections on what makes mobile technology/services different
from other ICTs.............................................................................................................46
3.2.1.2 Conceptualising ‘ubiquity’ in mobile computing – A theoretical insight. .47
3.2.1.3 Hagerstrand’s time-space theory................................................................48
3.2.1.3.1 A space-time matrix and ubiquity............................................................49
3.2.1.3.2 Portability and mobility...........................................................................52
3.2.1.3.3 Immediacy and speed...............................................................................53
3.2.1.3.4 Reachability and searchability.................................................................53
3.2.1.3.5 Untethered/wireless.................................................................................53
3.2.1.3.6 Simultaneity and continuity.....................................................................54
3.2.1.3.7 Convenience.............................................................................................54
3.2.1.3.8 Mobile devices are personal....................................................................55
3.2.1.4 Smartphone defined....................................................................................55
3.2.1.5 Tourism and mobile technology: Emphasis on smartphones.....................56
3.2.1.5.1 The role of mobile technology in tourists experience and behaviour......57
3.2.1.5.2 Backpacking and ICT: Emphasis on mobile technology experiences.....61
3.2.1.5.2.1 Mobile technology and the backpacker experience..........................62
vii

3.2.1.5.3 The impact of mobile technology (i.e. smartphones) on tourism
businesses..................................................................................................................66
3.3 Summary....................................................................................................................674 CHAPTER FOUR: LITERATURE REVIEW.................................................................68Tourism, ICTs and perceived risk............................................................................................68
4.1 Introduction...............................................................................................................684.2 Risk and risk perceptions: A theoretical insight........................................................684.3 Understanding risk.....................................................................................................68
4.3.1 The theory of perceived risk..............................................................................704.4 Tourism and perceived risk.......................................................................................73
4.4.1 Understanding backpackers and perceived risk.................................................774.4.1.1 Factors influencing backpackers perceived risk.........................................79
4.4.1.1.1 Risk perception and gender......................................................................79
4.4.1.1.2 Risk perception and nationality/culture...................................................79
4.4.1.1.3 Perceived risk and religion......................................................................80
4.4.1.1.4 Perceived risk and types of trips..............................................................80
4.4.1.1.5 Perceived risk and travel experience.......................................................80
4.5 Perceived risk and risk reduction strategies: Emphasis on ICTs...............................814.5.1 Risk reduction strategies....................................................................................82
4.6 Emerging debates on the measurement of risk perceptions in tourism.....................874.7 ICTs and perceived risk.............................................................................................90
4.7.1 Theoretical basis to combine information technology (device) risks with destination related risks in this study................................................................................94
4.8 Conceptual model and proposed hypotheses.............................................................984.8.1 Antecedents and outcomes of perceived risk: Emphasis on ICTs.....................98
4.8.1.1 Familiarity...................................................................................................99
4.8.1.2 Observability...............................................................................................99
4.8.1.3 Innovation.................................................................................................100
4.8.1.4 Trust..........................................................................................................101
4.8.1.5 Perceived risk versus satisfaction (with device and travel experience) and
intentions to reuse a smartphone for future travel related services.............................102
4.9 Summary..................................................................................................................106
viii

5 CHAPTER FIVE: RESEARCH METHODOLOGY.....................................................1075.1 Introduction.............................................................................................................1075.2 Aim and objectives of research...............................................................................1075.3 Research philosophy................................................................................................108
5.3.1 The ontological and epistemological perspectives of this research.................1095.3.2 Research approach...........................................................................................111
5.4 Previous research and methodological issues..........................................................1135.4.1 Backpacking and perceived risk – methods used in past studies.....................1145.4.2 ICTs and perceived risk – methods used in past studies..................................114
5.5 Research design.......................................................................................................1175.5.1 Quantitative versus qualitative paradigms.......................................................1176.5.2 Mixed-methods research paradigm........................................................................120
5.5.1.1 The rationale for using mixed-methods design in this study....................121
5.5.1.1.1 Quantitative-dominant concurrent embedded/nested mixed methods
design……...............................................................................................................123
5.5.2 Research methods.............................................................................................1265.5.2.1 Quantitative methods................................................................................126
5.5.2.1.1 Target population...................................................................................126
5.5.2.1.2 Data and sources....................................................................................127
5.5.2.1.3 Sample size determination.....................................................................128
5.5.2.1.3.1 Sample size......................................................................................128
5.5.2.1.4 Sampling procedure...............................................................................129
5.5.2.1.5 Measurement development – structured questionnaire.........................131
5.5.2.1.6 Piloting of data collection instrument....................................................132
5.5.2.1.7 Data processing and analysis.................................................................132
5.5.2.2 Qualitative methods..................................................................................135
5.5.2.2.1 Sample size............................................................................................135
5.5.2.2.2 Sampling procedure...............................................................................135
5.5.2.2.3 Semi-structured interview guide............................................................136
5.5.2.2.4 Piloting of data collection instrument....................................................136
5.5.2.2.5 Researcher reflexivity............................................................................136
ix

5.5.2.2.6 Data processing and analysis.................................................................138
5.5.2.3 Ethical considerations...............................................................................138
5.6 Summary..................................................................................................................1396 CHAPTER SIX: BACKPACKERS’ PROFILE AND CHARACTERISTICS..............140
6.1 Introduction.............................................................................................................1406.1.1 Socio-demographic characteristics of backpackers.........................................1406.1.2 Travel characteristics of backpackers..............................................................1426.1.3 Backpackers’ travel experiences......................................................................1436.1.4 Activities undertaken by backpackers with their smartphones in Ghana........1446.1.5 Additional electronic devices carried along with smartphones to Ghana........1456.1.6 Backpackers’ perceived risk of using smartphones.........................................1466.1.7 Determinants of backpackers perceived risk....................................................1496.1.8 Consequences of perceived risk towards smartphone usage............................150
6.2 Summary..................................................................................................................1517 CHAPTER SEVEN: EVALUATION OF MEASUREMENT MODELS.....................153
7.1 Introduction.............................................................................................................1537.1.1 Inspection for Common Methods Variance (CMV)........................................1537.1.2 Validation of conceptual model.......................................................................154
7.1.2.1 Procedure in Amos – CB-SEM.................................................................154
7.1.2.2 Procedure in SmartPLS 3.0 – PLS-SEM..................................................155
7.1.3 Evaluating perceived risk as a hierarchical latent reflective construct............1627.1.3.1 Assessing second-order reflective hierarchical model of perceived risk..163
7.1.3.2 Specifying a third-order hierarchical latent construct of perceived risk (i.e.
reflective-reflective)....................................................................................................166
7.1.3.3 Revision of perceived risk from third to second-order hierarchical latent
construct…..................................................................................................................173
7.1.3.4 Fitness comparison among different models of perceived risk................176
7.2 Summary..................................................................................................................1768 CHAPTER EIGHT: ASSESSING THE STRUCTURAL MODEL...............................178
8.1 Introduction.............................................................................................................1788.1.1 Structural model and hypotheses testing..........................................................1788.1.2 Evaluating effect size (f2) and predictive accuracy of the model.....................181
8.2 Summary..................................................................................................................1829 CHAPTER NINE: RISK CONCERNS AND REDUCTION STRATEGIES...............183
x
9.1 Introduction.............................................................................................................1839.1.1 Risk concerns in using smartphones and how they were reduced...................1849.1.2 Security risk.....................................................................................................1849.1.3 Destination-physical risk..................................................................................1859.1.4 Infrastructure risk.............................................................................................188
9.2 Summary..................................................................................................................18810 CHAPTER TEN: DISCUSSION OF RESULTS...........................................................190
10.1 Introduction.............................................................................................................19010.2 Background and travel characteristics of respondents............................................19010.3 Perceptions of risk towards the use of smartphones................................................19210.4 Antecedents and outcomes of backpackers’ risk perceptions.................................19410.5 Risk reduction strategies..........................................................................................196
11 CHAPTER ELEVEN: CONCLUSIONS AND IMPLICATIONS.................................19811.1 Introduction.............................................................................................................19811.2 Contribution to academic knowledge......................................................................19911.3 Methodological contribution...................................................................................20111.4 Managerial/practical implications...........................................................................20211.5 Policy contributions.................................................................................................20411.6 Limitations of the study and directions for further research...................................204
12 Bibliography...................................................................................................................20713 APPENDICES................................................................................................................252
13.1 Publications during the PhD study..........................................................................25213.2 Paper under review..................................................................................................25313.3 Thesis output presented at conferences...................................................................25413.4 Sample estimation using G*Power..........................................................................25513.5 Questionnaire...........................................................................................................25613.6 Semi-structured interview guide..............................................................................26313.7 Participant Information Sheet (PIS)........................................................................26513.8 Consent form...........................................................................................................26613.9 Introductory letter to tourism facilities involved in this research............................267
LIST OF TABLES
Table 1.1: Star rating and number of accommodation facilities (2010-2014)...........................5
xi

Table 2.1: Operational criteria for classifying backpackers (1990-2017)................................23
Table 2.2: A comparison between backpackers and flashpackers..........................................31
Table 2.3: A summary of the economic and non-economic potentials of backpacker tourism..................................................................................................................................................37
Table 3.1: A summary of the usefulness of smartphones for travel.........................................59
Table 4.1: Risk-relievers and operational definitions..............................................................84
Table 4.2: A summary of risk reduction strategies in services................................................86
Table 4.3: Description of traditional risk facets in consumer marketing.................................91
Table 4.4: Dimensions of perceived risk adapted to the context of smartphones....................97
Table 5.1: Main approaches to social science research..........................................................111
Table 5.2: Previous methodological issues on perceived risk in backpacker studies............115
Table 5.3: Previous methodological issues on perceived risk regarding ICTs......................116
Table 5.4: Strengths and limitations of quantitative paradigm..............................................118
Table 5.5: Strengths and limitations of qualitative paradigm................................................119
Table 5.6: Strengths and limitations of mixed-methods research..........................................121
Table 6.1: Socio-demographic characteristics of backpackers..............................................140
Table 6.2: Travel characteristics of backpackers...................................................................142
Table 6.3: Travel experience of backpackers.........................................................................144
Table 6.4: Activities undertaken/performed with smartphones.............................................145
Table 6.5: Additional electronic devices carried along with smartphones to Ghana.............146
Table 6.6: Perceived risk of using smartphones.....................................................................147
Table 6.7: Antecedents of perceived risk...............................................................................150
Table 6.8: Consequences of perceived risk............................................................................151
Table 7.1: Confirmatory factor analysis output.....................................................................156
Table 7.2: Latent correlation matrix.......................................................................................159
Table 7.3: Pattern matrix........................................................................................................160
Table 7.4: Fit indices of measurement model versus cut-off points in literature...................162
Table 7.5: CFA analysis of perceived risk as a reflective second-order latent factor............164
Table 7.6: Third-order hierarchical latent construct reliability and validity test results........169
Table 7.7: Third-order hierarchical latent construct of perceived risk...................................171
Table 7.8: Fitness comparison between the initial and alternate model of perceived risk.....176
Table 8.1: Standardised path estimates and hypotheses testing.............................................179
Table 8.2: Test for effect size (f2)...........................................................................................181
LIST OF FIGURES
xii

Figure 1: An evolutionary structure of the backpacker phenomenon......................................19
Figure 2: Allocentric-psychocentric model..............................................................................29
Figure 3: Tourists’ tripartite experiential stages and ICT usage..............................................45
Figure 4: Time-Space Matrix in the world without mobile technologies................................50
Figure 5: Time-Space Matrix in the world of mobile technologies.........................................51
Figure 6: The proposed conceptual model for the thesis.......................................................105
Figure 7: Research philosophies and methodological issues.................................................108
Figure 8: Philosophical and methodological choice for the thesis.........................................113
Figure 9: An illustration of how mixing of methods was done in the study..........................125
Figure 10: Map of Ghana showing backpacker trails............................................................127
Figure 11: Second-order CFA model of perceived risk.........................................................165
Figure 12: Third-order reflective-reflective hierarchical model of perceived risk................172
Figure 13: Second-order hierarchical latent construct of perceived risk...............................175
Figure 14: Structural path model and predictive validity of perceived risk...........................180
LIST OF ACRONYMS
AMOS Analysis of a Moment Structures
xiii
AGFI Adjusted Goodness-of-fit Index
ANOVA Analysis of variance
AVE Average Variance Extracted
BoG Bank of Ghana
CB-SEM Covariance-Based Structural Equation Modelling
CFA Confirmatory Factor Analysis
CFI Comparative fit Index
CMV Common Methods Variance
DMOs Destination Marketing Organisations
EFA Exploratory Factor Analysis
FBI Bureau of Federal Investigation
GDP Gross Domestic Product
GDSs Global Distribution Systems
GFI Goodness-of-fit Index
GIMPA Ghana Institute of Management and Professional Administration
GSS Ghana Statistical Service
GTA Ghana Tourism Authority
GTB Ghana Tourist Board
GTDC Ghana Tourism Development Corporation
HOTCATT Hotel Catering and Tourism Training Institute
HTMT Heterotrait-Monotrait
ICT Information and Communication Technology
IDC International Data Corporation
IDIs In-depth interviews
ILO International Labour Organisation
IMF International Monetary Fund
IS Information Systems
ITDP Ghana Integrated Tourism Development Plan
ITU International Telecommunication Union
IUCN International Union for Conservation of Nature
LAM Location-Aware Marketing
LBS Location-Based Services
LSN Location-Based Social Networks
MMDAs Metropolitan, Municipal and District Assemblies
xiv

MOT Ministry of Tourism
MOU Memorandum of Understanding
NDC National Democratic Congress
NDPC National Development Planning Commission
NIB National Investment Bank
NITA National Information Technology Agency
NPP New Patriotic Party
NTDP National Tourism Development Plan
PARC Xerox Palo Alto Research Centre
PDA Personal Digital Assistant
PLS Partial Least Squares
PLS-SEM Partial Least Squares Structural Equation Modelling
PNDC Provisional National Defence Council
RMSEA Root Mean Square Error of Approximation
SAP Structural Adjustment Programmes
SARS Severe Acute Respiratory Syndrome
SD Standard Deviation
SEM Structural Equation Modelling
SIC State Insurance Corporation
SMEs Small and Medium-Sized Enterprises
SMS Short Message Service
SoCoMo Social Context Mobile Marketing
SoLoMo Social Local Mobile Marketing
SPSS Statistical Product for Service Solutions
SRMR Standardised Root Mean Square Error Residual
TLI Turker-Lewis Index
TMAM Tropical Maritime Air Mass
UNDP United Nations Development Programme
UNESCO United Nations Educational Scientific and Cultural Organisation
WOM Word-of-Mouth
WTTC World Travel and Tourism Council
WWW World Wide Web
YHA Youth Hostel Association
xv

YMCA Young Men’s Christian Association
YWCA Young Women Christian Association
xvi

1 CHAPTER ONE – INTRODUCTION
1.1 Introduction
This chapter provides a background to the thesis through an overview of Information and
Communication Technologies (ICTs), especially mobile technology, and its relationship with
travel and tourism, as well as perceived risk. It then follows with the study context and
problem statement – by pointing out existing gaps in the extant literature that necessitate this
study. Most imperatively, this chapter presents the main aim and objectives of the thesis, as
well as the theoretical, practical, methodological and policy contributions. In addition, the
structure of the thesis is presented.
1.1.1 Background to the study
Research shows that the advance in ICTs has had and is having a conspicuous impact on
various sectors of the world’s economy: engineering, science, manufacturing, and travel and
tourism among others. With a contribution of nearly 10.2% to the world’s Gross Domestic
Product (GDP) in 2016, travel and tourism is but one of the world’s largest economic sectors
(World Travel and Tourism Council [WTTC], 2017). As an information-intensive industry, it
has over the years, depended and is still hugely reliant on ICTs and various digital
technologies to expand. ICTs are facilitating and unearthing innovative ways of managing
businesses in the industry, diversifying and improving consumer experience of the service
product (Neuhofer, Buhalis and Ladkin, 2012).
Buhalis and Foerste (2015, p. 159) note that “the dramatic advancement in ICTs, allows
marketers to generate information that is highly personalised and relevant to consumers in
real-time context” via mobile phones – the smartphone to be precise. The emergence of
mobile devices, such as smartphones with their unique features give destination marketing
companies more opportunities to reach out to customers in more personalised, rapid, and
spontaneous ways. Location-Aware Marketing (LAM) (in mobile marketing or m-marketing)
is one of the useful innovations that has been developed lately – facilitated by smartphones.
This makes use of the location of potential consumers by communicating and interacting with
them in real-time – predicting their needs (Xu et al., 2011). Buhalis and Foerste (2015) note
again that this property of mobile devices could be useful, especially to first-time tourists at a
destination.
1

Extant literature (see Wang, Park and Fesenmaier, 2012; Wang and Xiang, 2012) shows that
smartphones affect tourists’ behaviour through their decision-making processes and travel
experiences. Smartphones influence travel behaviour (Wang, Park and Fesenmaier, 2010;
Oulasvirta et al., 2012; Nielsen, 2014; Tussyadiah, 2015) because they are uniquely
characterised by: mobility, intelligent system, and incessant connectivity. The opportunity to
be innovative and make spontaneous decisions in real-time has immensely influenced
experiences and behaviours in the travel and tourism industry (Tussyadiah, 2015).
Smartphones (unlike personal computers) are unique for their sensitivity to context-based
information in relation to location and time, thereby, helping push context relevant
information and/or recommendations to users to support ‘on-the-spot’ decision-making in
real-time (Okazaki, 2012). Researchers have examined this trend in the field of tourism (e.g.
Wang, Park and Fesenmaier, 2010, 2012; Wang and Xiang, 2012; Wang, Xiang and
Fesenmaier, 2014a; Hwang and Park, 2015).
Besides, smartphones have also challenged the sequentially dogmatic traditional definition of
the travel experience, often categorised into: pre-trip (anticipatory), experiential
(consumption) and post-trip (reflective) stages (Tussyadiah, 2015). With smartphones,
tourists no longer need to spend many hours focusing on where to find what upon visiting a
destination. The qualities of the device give them the opportunity to make real-time decisions
and choices during the experiential stage. Tussyadiah (ibid, p. 2) concludes that “the use of
smartphones by travellers emphasises on-site experiences as the critical stage of [the] tourism
experience.” Perhaps, an exception might be that destinations that are not smart (have no ICT
enhanced infrastructure) may not fully support tourists using smartphones.
In terms of user profile, research has shown that the youth appear to have responded more
swiftly by adopting such innovations as smartphones. This has resulted in the talk about
Generation Y, boomerang generation or peter pan generation (mostly youth born between
1980 and 2000) (McGlone, Spain and McGlone, 2011) who are the digitally savvy natives.
Nielsen (2014a) refers to this cohort as the ‘Millennials’ – noting that about 85% of the
members own smartphones. Deloitte (2014) also suggests that all those who use smartphones
are 75% youngsters (between 18 and 24 years old).
Indisputably, backpackers have become part of the digitally savvy natives. Extant literature
demonstrates the plurality and indispensability of mobile phones (now smartphones) and the
2

Internet among them (Mascheroni, 2007; O’Regan, 2008; Hannam and Diekmann, 2010;
Paris, 2010a; Paris, 2012a; Iaquinto, 2012; Butler and Hannam, 2015). This new
companionship created by mobile technologies among backpackers has primarily contributed
to the coinage of the neologism ‘flashpackers’ (Paris, 2012a; Germann Molz and Paris, 2015;
Dayour, Kimbu and Park, 2017). This implies that most of them are technology savvy (i.e.
belonging to the generation Y/millennials cohort), thereby, carry smartphones on them during
travel.
Characterised by much independence and flexibility (Larsen, Øgaard and Brun, 2011), as
well as a significant growth in the last decade, the backpacker segment is presumed to be
“one of the cultural symbols of the increasingly mobile world” (Richards and Wilson, 2004,
p. 3). The reflection of backpacking as a powerful mark of contemporary ‘mobilities’ does
not suggest the obvious in terms of corporeal travel, but rather, ‘mobility’ in terms of using
mobile phones and ubiquitous Internet away from home. Mascheroni (2007, p. 541) states
that the mobile phone is a medium for the “micro-coordination of co-present interaction”
among backpackers, thus the number of backpackers who carry a mobile phone(s) while on
the ‘road’ is on the increase. Certainly, the ubiquitous nature of mobile phones (i.e.
portability, mobility, immediacy, reachability/searchability, and convenience) (Okazaki,
2012) and mobile Internet (Stienmetz, Levy and Boo, 2012) support the activities of this
‘mobile’ group of travellers.
Notwithstanding the important role of mobile devices (i.e. smartphone) in enhancing travel
experiences, especially among backpackers, the use of such ICTs predisposes users to various
degrees of risks (Luo et al., 2010; Li and Bai, 2010; Kim et al., 2013). ICTs, by nature, raise
not only security and privacy concerns among potential consumers but challenges of
evaluating services and products online before actual purchase – resulting in risk perceptions.
Therefore, research on the nexus between ICTs (e.g. online shopping/e-commerce and
electronic or mobile banking) and consumer risk perception has been increasing with the
advent of the Internet – since the 1990s (see Featherman and Pavlou, 2003; Lee et al., 2003;
Park, Lee and Ahn, 2004; Kim, Ferrin and Rao, 2008a; Chen, 2013). Typically, as a service-
based industry – inextricably linked with ICTs (Buhalis and Law, 2008), tourism researchers
have been investigating the relationship between perceived risk and technology-based service
adoption in the industry (Cunningham, Gerlach and Harper, 2004; Kim, Qu and Kim, 2009;
Kim, Chung and Lee, 2011). These efforts have been incessant in order to gain a nuanced
3

comprehension of the relationship between perceived risk and ICTs, possibly to proffer
solutions for addressing the negative impacts on businesses and travel experiences.
In relations to backpackers, studies (see Reichel, Fuchs and Uriely, 2007; Hunter-Jones, Jeffs
and Smith, 2008; Adam, 2015; Adam and Adongo, 2016) have also been focussing on
general risk concerns at travel destinations. These studies evidently show that backpackers do
have risk concerns at various destinations hence use a range of risk reduction strategies to
minimise their trepidations during travel. Therefore, this thesis conjectures that backpackers
have risk concerns regarding the use of their smartphones during travel due the challenges
associated with such mobile devices (Section 4.7). Moreover, the unique qualities of
backpackers, that is, being generally youthful, independent and flexible travellers compared
with mainstream tourists, implies that their perceptions of risk regarding smartphone usage
would also be different from that of general travellers (Pearce, 1990; Loker-Murphy and
Pearce, 1995; Larsen, Orgaard and Brun, 2011). This study was conducted in Ghana because
of its unique peculiarities relative to backpacking and the digital space. Thus, the next section
presents the context of the study in a bit to justify Ghana as the setting for this research and to
support the problematisation of this study.
1.1.2 Ghana in relevant context
The growing trend and popularity of backpacking as a viable and sustainable market segment
is, at present, not a preserve of the so-called “Banana pancakes” of Asia or the “Gringo trials”
of South America’ but African destinations (Dayour, 2013). The ‘breeze’ of backpacking is
being felt in some destinations in Africa, thus researchers and policy-makers are investigating
into the peculiarities of this segment, as well as the strategies to exert more pull.
After South Africa, Ghana is, seen as one of the destinations that appeal to backpackers
(Dayour, 2013; Adam, 2015). Travel within the Ghana may be described as relatively cheap
due to the bad performance of the Cedi (Ghanaian currency) before major currencies like the
Dollar, Euro and Pound. Still at an incipient stage of development and with various
opportunities for exploration, the destination (Ghana) endears itself to various types of
travellers, especially backpackers (Dayour, 2013; Ministry of Tourism [MOT], 2014). The
sub-destinations of Accra, Cape Coast, Tamale, and Kumasi have been found as attractive
hubs for backpacking due to the proliferation of budget accommodation facilities in those
4

areas (Dayour, 2013; Dayour, Adongo and Taale, 2016; Adam and Adongo, 2016). The
country’s allure in all-year-round sunshine, as well as a plethora of attractions: ecological,
heritage, rich cultures, pristine beaches, and proverbial hospitality, attract backpackers the
most (Dayour, 2013; Adam and Adongo, 2016).
Most remarkable is the proliferation of budget accommodation facilities (such as hostels) in
the cities and towns of the country that target low budget travellers (Table 1.1). Likewise, the
homestay phenomenon is also gaining attention as local folks have begun to cash in on the
market by providing beddings and local home experience to tourist at relatively moderate
cost. Agyeiwaah (2013) reports that backpackers and volunteers are about the main patrons of
the homestay business in Ghana. Backpacker arrivals have been increasing over the last five
years with the major markets being Europe and the USA (Dayour, Adongo and Taale, 2016).
Table 1.1: Star rating and number of accommodation facilities (2010-2014)
5 star 4 star 3 star 2 star 1 star Guest Houses
Budget hotels
Year N RMS N RMS N RMS N RMS N RMS N RMS N RMS
2010 1 104 5 756 23 1477 163 4676 225 4082 137 975 1176 15000
2011 2 299 5 765 27 1740 185 5298 278 5309 157 2972 1182 18049
2013 2 424 5 831 34 2575 200 5987 290 5762 147 1103 1550 20068
2014 2 424 7 1028 36 2379 214 6731 351 7017 156 1148 1804 22604N=Number of facilities; RMS = Rooms; Note: Data for 2012 are not available from this source at the time.
Source: Ghana Tourism Authority [GTA], (2015)
Though no specific statistics exist on backpacker arrivals other than general tourist arrivals in
Ghana, their presence has been confirmed by scholars and policy makers alike. In his study
on backpackers using a sample size of 180 respondents, Dayour (2013) explored the
dimensions of backpackers’ motivations for visiting Ghana. Taking this further, Adam (2015)
measured backpackers’ perceptions of risk in Ghana involving a sample of 603 backpackers.
Dayour, Adongo and Taale (2016) also examined the determinants of backpackers’
expenditure using 650 backpackers. Noting this trend, one main objective of the 2013-2027
National Tourism Development Plan of Ghana is to fashion out ways and means of attracting
and satisfying the backpacker segment (MOT, 2014) as they contribute to the development of
local communities in Ghana – through their expenditure (Dayour, Adongo and Taale, 2016).
5

However, the destination is not insulated from security and ICT related challenges, which is
the focus of the following section.
1.1.3 Challenges facing the destination: Emphasis on tourism
This section presents some of the encumbrances militating Ghana as a country, and the
collateral effect of that on the tourism and hospitality industry. More specifically, it touches
on safety and security issues in the country, as well as the new era of technology and its dark
side in Ghana. The challenges facing the country’s ICT infrastructure and its effects on
businesses and individuals are of focus in this section.
1.1.3.1 Safety and security
Despite the progress made in tourism development and the concomitant dividends felt by
local people through time, the destination has been saddled with some challenges – bordering
on issues of safety and security. Suffice it to mention that Ghana is, generally, considered a
peaceful country in the world (Institute for Economics and Peace, 2015) and for that matter,
one of the safest tourism destinations in Africa, yet some safety concerns have been raised by
not only tourists, but residents/natives, though the former are the most suitable target –
because of their mostly hedonistic appearance.
On the research front, a couple of studies report on tourists’ vulnerability to crime and
victimisation in the country such as phone theft, physical assaults, fraud, marauding and other
property thefts (Boakye, 2010). Whereas most of the victims were established to have been
preyed upon fortuitously by culprits, others ‘co-created’ the crimes meted to them – through
their appearances and locations: flaunting of property, being at obscure locations and
attempting to build relationships with locals. Adam (2015) reports on various perceptions of
risk expressed by backpackers in the country, including expectation risk, physical risk, health
risk, political risk, financial risk and socio-psychological risk. Though contained by security
apparatus, some regions of the country, especially the Northern Region has a long history of
protracted chieftaincy feuds hence known to be a flashpoint for potential altercations. Aside
from these, the city centres and other tourists’ hotspots are known for some of the crimes
against tourists. Other risks, including sanitation and cultural barriers were concerns
expressed by some tourists (Amuquandoh, 2011). The country is also still grappling with ICT
challenges as highlighted hereafter.
6

1.1.3.2 ICTs and challenges
As opposed to countries in the West that were early adopters/starters (of ICTs) and have
gradually evolved through and still expanding in ICTs, some African countries, though late
starters, have been rapidly expanding their ICT infrastructure (Porter et al., 2015). ICTs’
penetration in Ghana has been on the rise, especially the proliferation of mobile phones and
ubiquitous Internet access since the 1990s through various mobile networks (Esselaar, Stork
and Andjelkovic, 2014). The increase in Internet access (from the year 2000) is attributed to
the installation of a fibre optics Internet backbone transit of which most African countries
have hooked on to hence bringing about the ubiquity of Internet in most of the region.
Moreover, mobile phone ownership is surging with about 92% of Ghanaians owning a mobile
phone as at 2012 (Ministry of Communication, 2014). Hence, a survey of African nations’
(including Ghana, Nigeria, Kenya, South Africa and Uganda) mobile Internet usage, revealed
that about 40% of users browse the web via phones and of this, 51% are Ghanaians followed
by Nigeria (47%) and South Africa (40%) (Citifmonline.com, 2015). The trend in Ghana is
credited to the several mobile telecommunication networks (Vodafone, MTN, Airtel, Tigo,
glo, expresso and surfline) that are operational within the country – offering data bundles,
Pay-As-You-Go and broadband Internet services at very affordable rates (Esselaar, Stork and
Andjelkovic, 2014).
Government agencies, corporate institutions and private businesses have found ICT solutions
useful – and adopted them to support their activities. Businesses in Ghana have responded to
the ICT revolution – through the use of some ICTs to market products and services,
especially in the major cities of Accra, Kumasi, Cape Coast, and Takoradi (Yaw, Doku and
Oppong, 2014; Abanga, 2015). Most hospitality and tourism businesses have introduced
mobile payment options popularly known as mobile banking where orders are placed over the
phone and money ‘wired’ the same way. People can also gain access to free WiFi
connectivity in some hotels, restaurants, shopping malls, higher educational institutions, as
well as airports and other public areas in the cities. Moreover, most high-end hotels,
restaurants and tour operators also have websites or at worse joint ones for marketing
purposes, as well as cash and electronic payment options, though the majority remains
apprehensive of e-payment options (Abanga, 2015). Also notable is the development of
various destination mobile applications to support travel, especially tourism. These range
from cuisine, location, attractions, entertainment, transportation, accommodation apps to
transaction apps (Esselaar, Stork and Andjelkovic, 2014).
7

Undoubtedly, the technology revolution has had both positive and negative consequences on
various corporate institutions, businesses and individuals in the country. Though, the country
seems to be expanding in ICTs coverage and usage (particularly, the Internet), the country is
said to grappling with guaranteeing the security and privacy of users of the ICT
infrastructure. According to the Ministry of Communications [Ghana] (2014), Ghana’s image
is tarnished on the international front regarding its poor/weak cyberspace security making
users vulnerable to attacks by Internet criminals. One victim of such a crime has been the
government of Ghana itself. In 2015 several government websites were defaced by Internet
hackers, who hacked into the vice President’s website and the National Information
Technology Agency (NITA). The Ministry of Communications [Ghana] (2014) also noted
that the increased use of mobile phones has been accompanied by increased mobile phone
fraud and other threats. This has been made possible by the weak Internet infrastructure and
the more fluid nature of the perpetrators of cyber-crime, thus making their arrest problematic
and almost next to impossible (ibid).
Furthermore, another phenomenon of Internet crime known as ‘sakawa’ has become popular
in the country, as well as other African countries like Nigeria. It refers to a “klepto-
theological paradigm created to abet in the perpetration of Internet crime” (Warner, 2011, p.
744). Culprits simply prey on victims on the web by couching, for instance, false but
convincing business stories, leading such victims into committing huge sums of money in the
process and getting defrauded by them. However, it is claimed that this act has a spiritual
dimension, which facilitates the success of the perpetrators. Apprehending such culprits has
been challenging to the security personnel because they have moved from using Internet
cafés to broadband modems and mobile bandwidth – which make them untethered and
difficult to track. Other forms of cybercrimes cited are identity fraud, credit card fraud, and
romance fraud. Evidence also suggests that concierges and house-keepers in some hotels in
the country, steal the credit card information of clients for such criminals, in return for a
percentage of the amount realised from the act (Warner, 2011). Ghana has gained unpleasant
publicity together with her regional neighbours of Cameroon and Nigeria “as part of the top
10 cybercrimes generating regions of the world’ (cited in ibid, p. 738). The lack of know-how
in tracking criminals using computers and other devices, leave the police with infinitesimal
evidence to prosecute alleged culprits in court (Ministry of Communications [Ghana], 2014).
Therefore, the Internet and mobile-related crimes have been increasing in the country in the
last decade. According to Warner (2011), Ghana was the second most blacklisted nation by
8

US’ Web retailers – who became cynical of likely fraudulent orders from Web-based
criminals in the country.
The US Federal Bureau of Investigation [FBI], (2015) and the Government of United
Kingdom [GOV.UK] (2015) have both cautioned their citizens travelling to developing
destinations such as Ghana and other African countries to be extra-cautious of using
technological devices and the digital space as it has been claimed to be digitally unsafe and
unreliable. Having noticed its deleterious effect on the country, the Ghanaian government in
response, has developed a national cybercrime security policy and strategy to deal with this
menace (Ministry of Communications [Ghana], 2014).
Ostensibly, many a tourist before travelling to destinations, as often as not, will conduct
‘research’ on them through various sources: friends and relatives, media platforms, embassies
and other professional agencies. This is usually done to properly plan trips and have some
foreknowledge about their potential destinations. Hence, any negative information
intercepted in the course could potentially harm the decision to travel or require some
measure(s) in dealing with the situation, if the tourist so decides to proceed on the trip.
Hajibaba et al. (2015) think such tourists could be classified as ‘crises resistant tourists’ as
they would normally continue with their trips regardless of any negative occurrence, be it
murder, political unrest and the likes. Conceivably, such tourists should have ways of dealing
with such apprehensions should they occur during the trip. Against this backdrop, this
research seeks to understand how the backpacker travel genre – perceive risk towards their
smartphones usage in Ghana. Having justified the context of the study, the problem statement
is presented hereafter in detail by highlighting critical gaps in the current literature that
necessitated this research followed by the research objectives.
1.1.4 Problem statement
As alluded heretofore, extant studies have been focusing on mobile technology adoption and
its mediating power in reconstructing backpackers’ experiences and ideology – into a virtual
mobile networking ecosystem (Mascheroni, 2007; Hannam and Diekmann, 2010; Paris,
2012a; Iaquinto, 2012). The unique characteristics of backpackers (as opposed to
conventional travellers) including being hypermobile (O’ Regan, 2008), youthful, flexible,
and independent (Paris, 2010a), as well as their predilection to stay connected with like-
9

minded travellers, families, and local communities, make mobile phones indispensable during
travel. Deductively, these qualities also imply that backpackers are bound to have different
experiences and risk perceptions regarding the use of such devices during travel.
Yet, considering the risks (i.e. financial, performance, security, time, social, psychological,
and device risks) induced by mobile technology (Featherman and Pavlou, 2003; Luo et al.,
2010), it is surprising that scholars have yet to explore the risk perceptions held by
backpackers who are increasingly using smartphones during travel. The need to bridge this
lacuna in literature is buttressed by the argument that mobile technology is influencing and
reconstructing the experiences of backpackers (Mascheroni, 2007; Iaquinto, 2012; Paris,
2012a), implying that perceived risk may affect their overall travel experience at a
destination, and future travel decisions. Apparently, backpackers have risk concerns in other
areas of their travel which, in part, make the need to understand their risk concerns towards
smartphone usage important.
Recent studies (e.g. Reichel, Fuchs and Uriely, 2007; Hunter-Jones, Jeffs and Smith, 2008;
Adam, 2015) as opposed to earlier ones (see Cohen, 1973; Poon and Adams, 2000; Elsrud,
2001; O’ Reilly, 2006) have shown that backpackers are becoming more concerned about
risks (e.g. terrorism, expectation, physical, health, financial, and site-related risks) during
travel than previously. But no effort has yet been focused on exploring their risk perceptions
regarding a specific travel ICT component such as the smartphone. Against this backdrop, it
is about time, a study such as this furthered understanding of how backpackers perceive risks
towards the use of mobile technology, which is remediating their experiences and sociality.
Furthermore, consumer perceived risk towards ICTs (see Mitchell et al., 1999; Kim, Kim and
Leong, 2005; Kim, Qu and Kim, 2009; Park and Tussyadiah, 2016) and tourism (Roehl and
Fesenmaier, 1992; Fuchs and Reichel, 2006; Adam, 2015; Otoo and Kim, 2018) have been
investigated though separately. Central to this thesis, is the interest to comprehend how
destination related risks together with information technology risks concerns, influence
backpackers’ risk perceptions regarding smartphone usage. Though past studies (Kim, Kim
and Leong, 2005; Kim, Qu and Kim, 2009; Luo et al., 2010; Kim, Chung and Lee, 2011;
Park and Tussyadiah, 2016) have investigated perceived risk concerning information
technology in travel and tourism, these studies have largely focussed on perceived risk
regarding the technology. Forsythe and Shi (2003) and Kim, Kim and Leong (2005)
10
examined perceived risk in relation to purchasing airline tickets online. Similarly, a more
recent and related study by Park and Tussyadiah (2016) also concentrated on mobile-related
risk perceptions regarding mobile travel booking. Regrettably, these studies ignored
situational factors that reflect the contexts in which smartphones are used especially at the
destinations being visited.
Notably, previous studies in the field of information science (see Choi and Lee, 2003;
Pasquinucci, 2009; Khan, Abass and Al-Muhtadi, 2015) have revealed that the unreliability
of an available technology infrastructure in an area such as open wireless technology and
slow download speeds pose another kind of perceived risk to travellers. Khan, Abass and Al-
Muhtadi (2015) argue that the extreme level of comfort brought by smartphones has brought
with them an extreme number of risks, some of which are clearly location-based.
Accordingly, mobile users’ physical location has a direct impact on the level of threats and
risk they face resulting in destination related risk perceptions. Since smartphones cannot fully
function without the required technology infrastructure, such as the Internet (Stienmetz, Levy
and Boo, 2012), which is often associated with a location, this study argues that infrastructure
risk concerns (regarding mobile phone usage) would impact adversely on user experiences –
generating different types of risk perceptions. Vanola (2013) also hints that tourism
destinations can collect information about mobile users’ activities that may be highly
personal (such as their exact location) using intelligent systems, which could be considered as
a potential threat to their privacy. Hence, the evaluation of intelligent systems in tourism is
required to assess not only their capacity to help people during travel but also potential harm
to users (Vanola, ibid).
Moreover, past studies (e.g. Milligan and Hutchenson, 2007; Markeji and Bernik, 2015;
Khan, Abass and Al-Muhtadi, 2015) note that mobile users risk losing their mobile devices
(through mobile theft or snatching) due to the portable nature of the device. Regarding risks
induced by specific locations, Khan, Abass and Al-Muhtadi (2015) assert that physical
security risk is the most salient risk for mobile users. A stolen mobile device at a travel
destination may result in loss of sensitive information/data (e.g. business data, personal
information or credit card details). In effect, the risk of having one’s phone stolen or snatched
at a destination could lead to security or privacy related risk issues, if data/information is
compromised. Therefore, it can be argued that the integration of technology risks with
destination related risks is necessary to comprehensively understand backpackers’ risk
11
perceptions towards the use of their smartphones. Importantly, however, no research has
attempted to integrate these two major risk facets in order to understand perceived risk
regarding ICTs in travel and tourism.
In particular, when considering Ghana as the study context (or destination), the argument to
combine technology and destination related risks can be more pertinent in this thesis. Ghana,
as one of the emerging travel and tourism destinations in Sub-Saharan Africa (Ministry of
Tourism [MOT], 2015) is characterised by several ICT infrastructure and other physical
safety related issues that could have a bearing on risk perceptions regarding the use of mobile
technology in the country. Though Ghana can generally be regarded as a safe country
(Institute for Economics and Peace, 2015) and for that reason one of the safest tourism
destinations in Africa, some isolated safety concerns have been raised by tourists but also
residents. Several empirical studies in Ghana have reported on issues of crime against
travellers in the country. Boakye (2010) investigated tourists’ susceptibility to victimisation
and found mobile phone theft as one of the key crimes committed against tourists. Adam and
Adongo (2016) also examined issues of crime against budget travellers in Ghana and realised
that they suffered fraud, physical assault, larceny (especially mobile phones), and verbal
assault. Furthermore, there have been some challenges in terms of cyber security and access
to the Internet in some parts of the country (Esselaar, Stork and Andjelkovic, 2014). The
unreliability of the cyberspace has been reported due to the activities of cyber scammers
(locally known as ‘Sakawa’). Similarly, inaccessibility of Internet connection in some parts
of the country is yet another challenge noted (Warner, 2011; Ministry of Communication,
2014). As a result, the US Federal Bureau of Investigation (FBI) (2015) and the United
Kingdom Foreign and Commonwealth Office Travel Advisory (2015) alerted their citizens
travelling to Ghana and other affected countries in Sub-Saharan Africa to be cautious about
using mobile phones and open Wi-Fi connections in the country (see Sections 1.1.3.1 and
1.1.3.2). This thesis proposes that perceived risk towards smartphone usage includes both
generic technology risks and more specific destination related risks. It further aims to identify
factors that influence backpackers’ risk perceptions (e.g. observability, innovation, trust, and
familiarity), as well as outcomes (e.g. satisfaction and intentions to reuse the device).
Furthermore, the theoretical argument that risk perception is often accompanied by risk
mitigation strategy(ies) (Roselius, 1971; Greatorex and Mitchell, 1994) also stresses the need
to understand what risk reduction strategies may exist among backpackers who perceive risk
12

about using their mobile devices during travel. Though, there exists information on measures
used by service providers to reduce consumers perceived risk towards online bookings (Kim,
Qu and Kim, 2009), there is still a paucity of information on some of the personal risk-
relievers (if any) adopted by smartphone users in the tourism literature. Hence, this study
seeks to also explore backpackers’ risk reduction strategies regarding the use of smartphones
during travel.
This study uniquely uses the quantitative-dominant concurrent embedded mixed methods
design (Johnson & Onwuegbuzie, 2004; Creswell & Plano Clark, 2007) for investigating
backpackers’ risk perceptions about smartphone usage, as well as their risk reduction
strategies. While a quantitative methodology was used to measure their risk perceptions, as
well as antecedents and outcomes, a qualitative methodology was used to explore their risk
reduction strategies, as well as corroborate the findings on risk perceptions (see Section 5.5).
Based on the dearth of literature pointed at, the sections hereafter present the main aim and
objectives of the thesis, as well as its contributions.
1.1.5 The research aim and objectives
The main aim of this study is to explore backpackers’ perceptions of the risks of using
smartphones in Ghana and their possible risk reduction strategies to offer a holistic
understanding of consumers’ risk perceptions regarding mobile technology usage in the travel
and tourism industry.
The following specific objectives are used to address the research aim:
1. explore the functions backpackers use their smartphones to perform while in Ghana;
2. explore backpackers’ perceptions of risk regarding the use of smartphones vis-à-vis
device risks and destination related risks;
3. examine the antecedents and outcomes of backpackers’ perceived risk towards their
smartphone usage; and
4. investigate the risk reduction strategies employed by backpackers who perceive risk
towards their smartphone usage in Ghana.
13

1.1.6 Rationale of the study
Mobile technology habits among backpackers has become a new research agenda, thus the
study has some theoretical, practical, methodological, and policy relevance. Principally, this
study makes a significant theoretical contribution by integrating both information technology
and destination-specific risks in the understanding of perceived risk regarding the use of
smartphones in Sub-Saharan African tourism destinations such as Ghana.
Up till date, no research in tourism has attempted studying how destination related variables
(such as physical and infrastructure risks) in conjunction with technology related risk factors
affect perceived risk about smartphone usage, much less among backpackers. The need to
understand both technology risks and destination related risks factors in this study was
informed by the drive to provide a holistic and comprehensive understanding of perceived
risk vis-à-vis smartphone usage – since its functioning is not independent of the context in
which it is used such as the mobile infrastructure of a place or the physical safety of the
device and user. The findings offer useful implications that will make marketers and service
providers think differently about the nature of perceived risk regarding smartphone usage
than before.
Perceived risk is undeniably recognised as an integral part of consumers’ decision-making
process. It can result in the consideration of alternatives, if intolerable to a consumer
(Roselius, 1971; Mitchell and Greatorex, 1993). It is thus crucial for researchers to continue
investigating the peculiarities of unique segments, such as backpackers to appropriately
understand and deal with their concerns in order to ably leverage the potentials of this
budding segment. An understanding of backpackers’ perceived risk towards the use of
smartphones will afford an opportunity to businesses whose marketing efforts are supported
by smartphones and targeted at backpackers to develop ways and means of reposing
confidence them. Backpackers’ desire to interact with many local tourism stakeholders,
especially the local people and service providers means that the consideration of destination
related risks would be salient to the understanding of their risk perceptions related to
smartphone usage.
Furthermore, in pursuance of Buhalis and Foerste’s (2015) call for Destination Marketing
Organisations (DMOs) to appropriate the opportunities presented by Social Context Mobile
(SoCoMo) marketing in order to create value for all stakeholders, a good starting point is for
14

them to understand the risk perceived by consumers who use devices such as smartphones.
This study provides some insights for the attention of service marketers and designers of
mobile phones, especially those targeting Sub-Saharan African destinations. To service
providers (such as accommodation facilities, restaurants, entertainment, attractions, as well as
online vendors) targeting backpackers and relying on digital platforms to do so, this study
provides an opportunity to learn and understand their risk concerns and to take practicable
steps towards addressing them.
The study explores some of the antecedents of backpackers’ risk perceptions (such as trust,
innovation and familiarity), which had been silent in the backpacker literature. The
managerial implications of these drivers have been discussed in more detail (see Section
11.4). Furthermore, the study examines the extent to which backpackers’ perceived risk
predicts their satisfaction with smartphone usage, travel experience, as well as future use
intentions. Besides, it unearthed how their satisfaction with the smartphone and travel
experience affects their intentions to reuse a smartphone for future travel needs.
This study is also one of the first studies to unpack the personal risk reduction strategies
employed by users of mobile devices to reduce their risk concerns. Until now, this area had
remained an uncharted ground of research despite studies on perceived risk towards
information technology in the industry. The knowledge from this research can offer some
ideas on complementary risk relievers that can be used to reassure consumers, especially
backpackers.
Policy-wise, the study provides leads to governments of Africa, especially Ghana on areas
needing attention to enhance their digital spaces and security – to boost and inspire consumer
confidence. Such specific policies could encourage more visits by backpackers to destinations
in the region, if specific perceived digital bottlenecks are tackled (see Section 11.5).
Methodologically, this thesis contributes significantly to the tourism literature by adopting
the quantitative-dominant concurrent embedded mixed methods research design, which was
seldom used in previous backpacking studies. This design gave a more pluralistic insight
about the phenomenon in question through the generation of complementary results using
two different methodologies (i.e. quantitative and qualitative). Especially, the qualitative leg
of the thesis focussed more on backpackers’ risk reduction strategies in the use of
15

smartphones, which was a neglected research area. In addition, the study effectively used a
two-stage approach involving covariance based structural equation modelling to validate all
measurement models and the principal component-based partial least squares structural
equation modelling to assess the relatively complex structural model. This is yet another
contribution to academic knowledge worth mentioning (see Section 11.2).
It is also relevant to note that this study is a response to calls by scholars (e.g. Loker-Murphy
and Pearce, 1995; Reichel, Fuchs and Uriely, 2007; Reichel, Fuchs and Uriely, 2009) for
future studies to investigate backpackers’ risk perceptions and behaviour across various
phenomena. This will facilitate an understanding of the intricacies regarding their risk
perceptions, rather than assume they are generally risk-tolerant. This is especially crucial
because backpacking in Africa is largely under-researched with the notable exception of
South Africa – which has made considerable advances in this regard.
1.1.7 Structure of the thesis
In all, this thesis is organised into Eleven (11) chapters as follows. Chapter One sets the stage
for the research by providing the background to the study, study context, a statement of the
problem, research aim and objectives, rationale and contributions, as well as the structure of
this thesis. Chapter Two provides an understanding of backpackers – through a historical
account, and conceptualisations – based on theoretical models proposed in the existing
literature. It provides some insights on why backpacking has received and is still receiving
promotion as an economically viable and sustainable segment for especially developing
countries. Chapter Three turns its attention to ICT with focus on smartphones, and travel and
tourism. Here, emphasis is lodged on the peculiarities of smartphones that make them distinct
from other ICTs, as well as the theories behind that. The relationship between backpackers
and ICTs is highlighted as well. Chapter Four handles the issues of risk, perceived risk (in
tourism and ICTs), and risk reduction strategies. It also discusses the main theory
underpinning this study and the proposed conceptual model and conjectural statements that
are tested. Chapter Five then dwells on the research methodology by discussing the
philosophical stance of the thesis – with recourse to methodologies used in past studies, as
well as the researcher’s own understanding of what the nature of reality is and how credible
knowledge can be achieved. It further proposes and rationalises the research paradigm
followed by the approach, design, methods, and ethical considerations in this study. The
16
subsequent four chapters present the findings of the study. Chapter Six is devoted to a
description of the sample along socio-demographic factors and travel characteristics. Chapter
Seven evaluates and validates the structural and measurement models in the study. The
proposed model and associated hypotheses, as well as the effect size and predictive relevance
of the model are assessed in Chapter Eight. Chapter Nine focuses on the risk reduction
strategies used by backpackers in Ghana. Chapter Ten is a critical analysis and discussion of
the results. Finally, Chapter Eleven presents the conclusions and implications of the study.
The next chapter is an introduction to backpacking focusing on the historical undertones and
existing conceptualisations in the literature.
17

2 CHAPTER TWO – LITERATURE REVIEW
Understanding backpacking: A critical review
2.1 Introduction
The first chapter provided the background to the study, problem statement, aim and
objectives, and rationale of the study. This literature review chapter covers some major
themes on backpacking – to develop an understanding of the phenomenon, and to provide an
anchorage for this research. The chapter begins with a historical background to backpacking
(Figure 1), whereupon the conceptualisation of the phenomenon, and existing tourists’
typologies and their relationship with backpacking. Furthermore, it includes the reasons why
backpacking has and is still being promoted – as a sustainable travel segment.
2.2 A brief historical account of backpacking
This section of the literature review provides an insight into the historical undertones of
today’s backpackers, by examining the nature of ‘drifting’ or ‘tramping’, from the dawn of
the 17th Century through to the 1990s. It also considers the motivations behind such
expeditions, as well as the tourism industry that facilitated travel at the time.
The word ‘backpacker’ takes its roots from the 17th and 18th Centuries ‘Grand Tours’ of the
upper classes – the sons and daughters of the English Aristocrats who travelled Europe as
part of their career development and educational needs (Loker-Murphy and Pearce, 1995).
Hibbert (1969) and Swinglehurst (1974) observe that the Grand Tour very much increased
one’s worldliness, social awareness and sophistication as an educational trip. The character of
backpackers reflects that of the rich, educated youngsters of the Victorian epoch who
undertook adventure trips to experience and familiarise themselves with the exotic, strange,
and the hidden. Cohen (1972) noted that the spirited young adventurer mostly accepted
extreme adversity, out of his/her own volition and desire to adopt the way of life of the local
folk. He again, in 1973, regarded the young solo travellers as ‘drifters’ – and then grouped
them into sub-categories of full-timers or part-timers; inward-oriented or outward-oriented
(Cohen, 1973). While those who were inward-oriented engaged with the subculture of their
peers, those with outward-orientation, concentrated on experiencing local cultures.
18
Figure 1: An evolutionary structure of the backpacker phenomenonSource: Adapted from Loker-Murphy and Pearce (1995)
19
The Grand Tour Travel by the sons and daughter of English Aristocrats
Craftsmen GuildsTramping for workTramping for touristic reasons
Wandervogel/ Youth movement Youth Hostel Association
(YHA), Australia
Defining feature:Activity & Transport Mode
Drifters and wanderers
Defining feature:Low social/spatial organisation
Features:Use budget accommodation facilities (e.g. hostels)Flexibility/ independenceProlonged period of stay
Features:Increasing degree of independence from family
Core backpacker:Have low income, and use budget accommodation
Flashpacker:Much older, have more income, use more technology, and prefer
upscale services
Hitchhiking- Students and Middle Class Youth
Long-term budget travellers
Defining FeatureMoney/Extended time
Contemporary Youth Tourism Contemporary Backpacker
Educational /self-
development
EmploymentTraining for a trade Leisure
Health and fitness
Escape from urban
life 17th Century
18th Century
19th Century
1910
1930s
1950s
1960s
1980s
1990s
2000s
1970s

History holds that for the young men in the working class, travelling around the 18th Century
often involved following some pre-identified routes to find work (Loker-Murphy and Pearce,
1995). They typically had access to inns and lodges offered them by their guilds – who
escorted them (Adler, 1985). Up until the 19th Century, mandatory voyages for these young
learners, went on throughout Europe. However, quite dissimilar to the ‘Grand Tour’, which
was elitist in nature, travel around this period extended to include the proletariats. It was no
longer a preserve of the well-to-do in society. This period, thus witnessed the democratisation
of travel.
The earlier peregrinations served to ritually, separate young people from their homes and
family alike. These travels afforded youngsters the opportunity to engage in sightseeing,
education and adventure (Brodsky-Porges, 1981; Towner, 1985; Adler, 1985; Riley, 1988).
Moreover, Loker-Murphy and Pearce (1995) also found that youth crusade had expanded in
response to the severe situations of city life during the 19th Century in Europe. The adult
youth of the wealthier countries started taking time off to discover the splendours of the
untouched countryside. It was also during this time that the Young Men’s Christian
Association (YMCA) was founded in the UK in 1844, and the Young Women Christian
Association (YWCA) around 1855. Hence, branches of these associations were created
throughout Britain to provide an assortment of cultural experiences and activities, as well as
low-cost lodges for the youth arriving from all walks of life (Adler, 1985; Loker-Murphy and
Pearce, 1995). McCulloch (1992) noted that these associations seemed to have revived the
concept of ‘hostels’, which had not been used since the dawn of the 16th Century. Worth
noting was the fact that World War I (1914-1918) and the Great Depression (1929-1939)
later-on impeded the tramping system. Notably, these two events increased unemployment
and left a few number of jobs on the ‘road’ making life a matter of subsistence than just a
hedonistic one. The societies of crafts and guilds lost their appeal and vibrancy and became
less important (Cohen, 1973; Loker-Murphy and Pearce, 1995). But the ‘road’ continued to
play a key role in the life of many youth up to the 20th Century even though others viewed it
as a type of youth abuse, with little value placed on it as a learning expedition (Adler, 1985;
Loker-Murphy and Pearce, 1995).
Studies by Cohen (1973) and Vogt (1976) hinted about the development of an associated
tourism infrastructure, which provided services for the ‘drifter market’ (of the 60s/70s)
distinct from that which provided services to conventional mass tourists. The new unique
20

youth segment of the tourism industry consisted of affordable transport systems and youth
hostels, bounded by psychedelic shops, clubs, and coffee shops. These services persist in
catering to the needs of today’s backpackers in a form of affordable hostels, budget hotels,
public transports and nightclubs etc.
Notably, Pearce (1990) has been credited as having introduced the term ‘backpacker’ into
academic literature (Loker-Murphy and Pearce, 1995; Elsrud, 2001; Westerhausen, 2002;
Scheyvens, 2002; Moshin and Ryan, 2003; Lesile and Wilson, 2005; O’Reilly 2006; Maoz,
2007; Godfrey, 2011). The archetypal backpacker is most often seen as a replica of the drifter
of the 1970s who has the love for local cultures, is independent, and most often shuns the
tourist industry. Thus, parallel to the ‘Gringo trail’ of South America, backpackers mostly
follow and flock the ‘Banana Pancake trail’ (a modern rendition of the ‘hippie trail’ of the
60s and 70s) of Southeast Asia: Malaysia, Thailand, Vietnam, Indonesia, Nepal, Philippines
and Bangkok etc. However, in the past 10 years, Africa has also become one of the trails for
backpacking notably South Africa, Gambia, Kenya, Ghana and Ivory Coast among others
(Saayman and Saayman, 2012). This has been possible because some countries deliberately
develop policies and strategies to make them attractive to backpackers. Heretofore,
“guidebooks for the counterculture and an increasing flow of word-of-mouth information
from experienced travellers to newcomers resulted in a well-trodden network centred on
established gathering places” (Loker-Murphy and Pearce, 1995, p. 824). However, of late,
modernity and its concomitant expansion in technology has made the famous guidebook
almost non-existent in a backpacker’s life (Iaquinto, 2012).
Recently, the literature points to some changes in travel behaviour among backpackers – in
response to global transformation in the areas of economic growth and ICT, as well as
demographic trends. Hannam and Diekmann (2010) note that technological devices allow
backpackers to be, guided by electronics. This has led to a new style and approach to
backpacking termed as ‘flashpacking’ or unpopularly, ‘technopacking’ (Hannam and
Diekmann, ibid). The neologism ‘flashpacker’ is more of a modification in backpacking,
attracting a new segment where such travellers now tend to spend higher amounts on upscale
accommodation facilities and food, as well as the possession of electronic devices on the
‘road’ (Hannam and Diekmann, ibid). This term has also been extended to include some
demographics of age and income, thus flashpackers are seen as the 25-40 years’ older
travellers who are ‘cash-rich’ compared to their younger ‘cash-poor’ counterparts –
21

backpackers. Swart (2006) establishes that most of the so-called flashpackers had backpacked
much earlier in life, but are now a lot interested in privacy and comfort while travelling
(Paris, 2012a). Despite the intensive usage of digital devices among flashpackers – which
contributes to their overall experience during travel, they also remain flexible, independent,
and adventurous, as well as crave contacts with local folks and other like-minded travellers
(Hannam and Diekmann, 2010, Paris, 2012a). Hannam and Diekmann (2010, p. 23) maintain
that flashpacking “is largely unexplored and an emerging sub-segment of backpacking.”
Arguably, there exists no clear criteria for differentiating them from other backpackers given
that technology usage is equally symptomatic of other backpackers (see Paris, 2012; Iaquinto,
2012).
The preceding paragraphs have provided some understanding of the evolution of the
backpacker phenomenon dating back to the early 17th centuries. Generally, backpackers can
be associated with the patrons of the Grand Tour of the 17 th Century and drifters and hippies
of the 1960s and 70s – mostly youths who sought to explore the unknown and discover
themselves in the world they lived in. Another significant influence behind the expansion of
this low budget travel segment was infrastructure – hostels, transportation, and entertainment
events that catered to their needs – affording young people the opportunity to travel on
limited budgets. The prolonged and multi-destination nature of travels during the time
resulted in the search for temporary jobs to augment budgets whilst on the road. Studies have
alluded to demographic characteristics, motivations, and the travel ethos of today’s
backpackers being akin to their forebears – portrayed in their largely youthful nature –
craving adventure and travelling the unspoilt. Moreover, studies have also investigated the
dynamics of the backpacker market (Uriely, Yonay and Simchai, 2002; Cohen, 2004; Pursall,
2005; Maoz, 2007; Paris, 2012a; Dayour, 2013; Adam, 2015; Hindle, Martin and Nash, 2015)
noting about its heterogeneity (in relation to motivations, perceived risk, degree of novelty
sought, and technology usage) in comparison to earlier studies that tried popularising the
segment as a homogenous one (Pearce, 1990). Cohen (2015) recently called for a research
focus on contemporary backpackers who set themselves apart from core backpackers just as
they also bracket themselves out of conventional tourist segments. The next section deals
with the conceptualisation of a backpacker in the literature.
22
2.3 Conceptualising backpackers: The use of different operational criteria
Extant literature attempts in several ways to operationalise a ‘backpacker’, but this effort has
been quite challenging as researchers tend to settle on more than one criteria in defining the
concept, thus a major source of confusion to recent researchers.
Table 2.2: Operational criteria for classifying backpackers (1990-2017)
Criteria Authors
I: Socio-demographic – Age
18 to 30 years Loker (1991)
15 to 24 years Hunter-Jones, Jeffs and Smith (2008)
18 to 71 years Elsrud (2001)
II: Motivation for travel
Leisure oriented travels Adam (2015)Hunter-Jones, Jeffs and Smith (2008)
Crave meeting with other travellers Pearce (1990)
III: Travel characteristics Being on a backpacker trip for almost 6 months Cohen (2011)
Uriely, Yonay and Simchai (2002)Youth hostels and chain referrals/snowballing Zhang et al. (2017)
Carrying of backpacks & independent travellers Zhang et al. (2017)
Flexible itinerary
Patronise budget accommodation facilities
O’Reilly (2006)Hottola (2005)
Ateljevic and Doorne (2004)Pearce (1990)
Independent international traveller Ateljevic and Doorne (2004)
Travelling for 1 year of more Elsrud (2001)
IV: Virtual communities
User of backpacker web-blogs Ong and Cros (2012)
Members of Facebook backpacker groups Paris (2012a)
V: Enclaves Users of backpacker enclaves/ ‘metaworld’ Hottola (2005)
Sorensen (2003)
VI Self-identification
An admission of being a backpacker Reichel, Fuchs and Uriely (2007) Sorensen (2003)
VII: Economic criteria
Budget traveller O’Reilly (2006)
Source: Author’s construct (2018)
23

The conceptualisations usually emerge from either a combination of socio-demographics,
motivations, travel characteristics, self-identification or a combination of all the
aforementioned. This section of the literature review discusses some shared and varied
parameters used by backpacker researchers in identifying who backpackers are in their
studies. Table 2.2 gives a summary of the operational criteria used by backpacker researchers
in the past.
Studies have closely linked backpackers to Cohen’s (1972) drifters – independent young
travellers who have flexible itineraries and constraint budgets. Though a ‘backpacker’ has
been redefined by academicians over the past three decades (see Haigh, 1995; Jenkins, 2003;
Ateljevic and Doorne, 2004; Slaughter, 2004; Thyne, Davies and Nash, 2008), Pearce’s
(1990) conceptualisation is often used as a major reference point for further
conceptualisation. Pearce (1990, p. 1) operationalised backpackers as:
a group of predominantly young travellers who are more likely to stay in budget
accommodation, have an emphasis on meeting other travellers, are independent and
have a flexible travel schedule, stay for a longer rather than a brief holiday, and
focus on informal and participatory holiday activities.
Pearce’s definition, though quite broad in nature, assumes that at any point in time, an
archetypal backpacker must possess several characteristics to be regarded as such. But this
approach could be a source of confusion and challenge to researchers who may wish to use
all such criteria as a backpacker is less likely to have all such qualities (Dayour, Kimbu and
Park, 2017). Therefore, a recent study by Dayour, Kimbu and Park (ibid) calls for a
reconceptualisation of a ‘backpacker’. Similarly, Cohen (2017) calls for the need to redefine
backpacker enclaves – the spaces or meeting places of backpackers. The following sections
discuss some of the criteria used to select backpackers in past studies.
2.3.1 Socio-demographic characteristic - Age
Loker (1991) and Westerhausen (2002) expanded this definition to include a demographic
parameter positing that they must be between the age cohort of 18 and 30 years. Different
from the age criterion used by Loker (ibid) and Westerhausen (ibid), other researchers
maintain that backpackers are mostly young travellers between the ages of 15 and 24 (Mintel,
2003; Hunter-Jones, Jeffs and Smith, 2008; Adam, 2015). Additionally, Sorensen (2003) also
argues that backpackers are mostly those travellers between 18 and 30 years while Elsrud
24
(2001) suggested 18 and 71 years. For their part, Mohsin and Ryan (2003) think they can
belong to different age cohort, and may not always patronise hostels – a similar viewpoint
opined by Jenkins (2003) and Mohsin and Ryan (2003). In support, Maoz (2008) adds that
studies that tend to use only age or hostels as a criterion for identifying backpackers are
limited in that the contemporary backpacker seeks variety and for that matter, may use
different grades of accommodation facilities while motivations remain unchanged.
2.3.2 Motivations for travel
Loker (1993) and Chen and Huang (2017) observed that backpackers are usually enthusiastic
about participating in native lifestyles or cultures. Their recreational undertakings focus on
culture (village stays), nature (such as trekking/hiking), or adventure (riding camels or river
rafting) (Loker-Murphy and Pearce, 1995; Maoz, 2007). Analogously, Dayour (2013) finds
that inbound backpackers’ main motivations include the quest for historical/cultural
attractions, ecological heritage, adventure and the penchant to escape from habituated
lifestyles. Their travel style is often linked with their propensity to travel more fluidly looking
for unfamiliar experiences (Haigh, 1995). Recently, Broocks and Hannam (2016) also report
about a new form of travel motivation common among artisan backpackers in Latin America.
They realised that monetary constraints shape the travel ideology and culture of such
backpackers who often patronise different forms of accommodation and transport than other
backpackers and plan their travel around their economic activities: crafting and selling of
jewellery. This enables artisan backpackers to improve upon their business skills and English
language, as well as their touristic and geographical knowledge.
2.3.3 Length of stay and mode of travel
Furthermore, other studies have used attributes regarding length of stay and travel mode to
set backpackers apart from conventional tourists. These seem to somewhat affirm rather than
challenge Pearce’s (1990) argument as mentioned previously. Elsrud (2001) asserts that
backpackers can travel for up 1 year often leading them to multiple destinations. O’Reilly
(2006) notes that most backpackers are young people on ‘gap years’ travelling for many
months and many do extend to several years. Hannam and Ateljevic (2008) also report that
backpackers usually travel for years and are inclined to use aeroplanes for long-haul travels,
but often use public transport systems for movement within the destination. It is also evident
as per Hannam and Ateljevic’s (ibid) study that limited budgets and prolonged stays affect
25

the choice of transport used by backpackers at destinations. Wilson and Hannam (2017)
recently note that in Australia, the proliferation of campervans has become a significant part
of backpacker travel lately.
2.3.4 Flexibility
Some studies (e.g. Larsen, Ogaard and Brun, 2011) suggest that backpackers have very
flexible itineraries in comparison to other travellers but it must be acknowledged that this
argument is being debated in current literature. On flexibility, O’Reilly (2006, p. 999) also
underscores the point that “backpackers embrace serendipity with low levels of planning, no
fixed timetable, and an openness to change of plan or itinerary”. But, Hottola (2005) earlier
on observes that the plans of backpackers appear quite schematically scheduled, often
extending to a few weeks ahead, permitting temporary adjustment of some 1 to 2 days. This
has been accentuated by studies (Larsen, Ogaard and Brun, 2011; Hunter-Jones, Jeffs and
Smith, 2008; Adam, 2015) which note that backpackers are becoming much less dissimilar to
the so-called institutionalised travellers.
2.3.5 Ideology
Bradt (1995) identified some descriptors of backpacker ideology, which are referred to by
Welk (2004) as simple symbols that backpackers use to construct their identity. Welk (2004
p. 80), insists that backpackers’ ‘philosophy’ is founded on some five (5) pillars, ‟travelling
on a low budget; meeting different people; being (or feeling) free, independent and open-
minded; organising one’s journey individually and independently; and travelling for as long
as possible”. They use these symbols to identify each other in their travel spaces – in
backpacker hostels and at enclaves/ghettos (Welk, 2004; Cohen, 2017). To Westerhausen
(2002), enclaves are simply their cultural dwellings away from their permanent places of
residence that have temporary social networks while Hottola (2005), thinks of enclaves as
‘meta-worlds’ where backpackers dominate their situations, be they real or perceived. These
marks of reputation are closely associated with Pearce’s (1990) identifiers where backpackers
tend to drift off the mainstream tourism ‘bubble’. The Internet has been recognised recently
as a useful tool among backpackers – helping them to post and search for information in real-
time. This has resulted in the proliferation of various web-blogs and online backpacker
communities that enable the sharing of information before, during and after their trips (Ong
and Cros, 2012; Paris, 2012a). It has been argued that such classified communities could act
26

as symbols for their classification, which is supported by the so-called medialisation and
virtualisation of backpackers (Cohen, 2017).
2.3.6 Self-identification
Notably, academics (Hunter-Jones, Jeffs and Smith, 2008; Adam, 2015; Dayour, Adongo and
Taale, 2016; Adam and Adongo, 2016) have adopted the ‘self-identification’ method as
another way to defining the concept of backpacking, though this is not widespread in
comparison to the accommodation-based criterion. It has been argued that the classing of
anyone who stays or is found in a budget accommodation facility, at an enclave, use
backpacks, and travels solo inter alia, as backpackers, could be erroneous. Therefore, Hunter-
Jones, Jeffs and Smith (2008) and Adam (2015) have argued that in addition to other criteria
used in operationalising backpackers, researchers should consider using self-identification as
one other way to ensuring the inclusion of actual backpackers in the research. In other words,
conceptualisations based on only socially constructed identities could be limited, and may
contribute to possible measurement errors. However, Dayour, Kimbu and Park (2017) also
argue quite recently that this procedure may be potentially difficult and sensitive as some
respondents may feel uncomfortable declaring themselves as backpackers because of the
stereotypical convictions that the concept suggested in the past: ‘drugs use’, ‘poverty’,
‘aimlessness’, ‘joblessness’, and ‘penny pinching’ (Loker-Murphy and Pearce, 1995). Hindle,
Martin and Nash (2015) think that the complexity in operationalising backpacking is based
on the diversity of definitions the term has assumed over the years such as ‘drifter’ (Cohen,
1972), ‘tramping youth’ (Adler, 1985), ‘wanderer’ (Vogt, 1976), ‘budget traveller’ (Riley
1998), ‘youth segment’ (Kain and King, 2004) and ‘traveller’ (Sorensen, 2003; O’Reilly,
2005).
The review, unquestionably, shows that researchers have used and are still using various
criteria in operationalising the term ‘backpacker’ but often with recourse to Pearce’s (1990)
seminal work – thus there no single accepted operational definition for the term (Dayour,
Kimbu and Park, 2017). The use of these criteria could be challenging and misleading
resulting in invalid data gathering by backpacker researchers (ibid). Despite the
inconsistencies noted, most backpackers are agreed to be the relatively young travellers who
are mostly students and patronise budget accommodation facilities (see Reichel, Fuchs and
Uriely, 2007; Maoz, 2007; Paris, 2012a; Dayour, 2013; Hunter-Jones, Jeffs and Smith, 2008;
27

Adam, 2015; Dayour, Adongo and Taale, 2016). Also, the term ‘backpacker’ has linkages
with some concepts and theories in the extant tourism literature worth discussing in the
sections that follow.
2.4 Relationship between tourists’ typology and backpackers: A critical review
The historical issues and conceptualisations of backpackers do not exist in seclusion to some
existing theoretical classifications of tourists. This section turns attention to some of these
theories and/or models, and how they mimic backpackers. The wonderluster/sunluster model,
the institutionalised/non-institutionalised model, and psychocentric/allocentric model are
discussed.
2.4.1 Wonderluster versus sunluster model
Since the 1970s, studies have been undertaken on tourists’ psychographics, to categorise
tourists based on personality traits and characteristics. These studies suggest that tourists
differ as per the activities undertaken and motivations for travelling. Gray (1970) classifies
tourists into wanderlusters and sunlusters. To him, wanderlusters travel to more than a
destination, and are vigorously looking for cultural experience. Their motivations range from
inquisitiveness about other cultures and desire to learn about them to a proclivity to partake in
and taste a dissimilar cultural landscape to theirs. In contrast, sunlusters tend to visit
destinations, which are, chosen for their physical appeal, be it sun, beaches or water
resources. The culture of the host in whose area these resources exist is of little interest to a
sunluster, whose motivations are to recreate, relax, and entertain oneself. They are passive
recipients of cultural experiences and tend to expect acquainted cultural forms of
entertainment. Typically, backpackers, to some extent, epitomise the description of a
wanderluster who prefers new different cultural experience at different destinations.
Ethnographic studies (Sorensen 2003; Cohen 2011) suggest that backpackers prefer to get
involved in social networking with the local folks at destinations, which is also typical of
Gray’s (1970) wanderluster.
2.4.2 Institutionalised versus non-institutionalised tourists’ model
Basing it on tourists’ role, Cohen (1972) also classifies tourists into institutionalised and non-
institutionalised tourists. He splits the non-institutionalised travellers into two (2), that is,
drifters and explorers, and institutionalised ones into independent mass tourists and organised
28
mass tourists. To him, while the drifters try to avoid interaction and reliance on the
mainstream tourist environment, and rather, associate more with local communities to edify
themselves and experience their cultures and ideals, explorers retain their accustomed life
styles by using mainstream tourists’ accommodation, yet also ‘stay off the beaten track’ as
their counterparts do. The organised mass tourists depend solely on travel consultants for
their travel, have very limited flexibility and demand familiarity. Analogously, the individual
mass tourists try to keep in touch with their ‘environmental bubble’, but with some degree of
flexibility as they rather tend to travel unaccompanied. Many empirical studies (see Elsrud,
2001; Uriely, Yonay and Simchai, 2002; Cohen, 2004; Reichel, Fuchs and Uriely, 2007;
Maoz, 2007; Cohen, 2011; Paris, 2012a; Dayour, 2013; Adam, 2015; Cohen, 2015) have
shown that backpackers share some similarities with the drifters of the 1960s and 70s, thus
have also become a major reference point for most researchers.
2.4.3 Psychocentrics versus allocentrics model
Furthermore, Plog (1991) segregated tourists along personality traits using a continuum (see
Figure 2): psychocentrics/dependables to allocentrics/venturers. Allocentrics will often
actively seek out unfamiliar novel destinations for ethnic, educational or adventure pursuits.
Figure 2: Allocentric-psychocentric model
Source: Plog (1991)
29
Psychocentric
ConeyIsland
Florida Hawaii(Outer Islands) N. Euro
caCaribbeanC. EuropeGt. Britain(Honolulu & Oahu)
Allocentric
Mid-centricNearPsycho-centric
NearAllocentric
Miami USA(Gen)
S. Europe Oreint eps. Japan )
Mexico
S. Pacific

The allocentrics are primarily adventurous and passionate about travelling to unusual
destinations. They are more likely to go by air, tend to spend more during travel and interact
with many local people. Conversely, psychocentrics happen to be the direct antithesis of
allocentrics and fall on the other end of the continuum. They seek safer and more familiar
destinations and end up spending relatively less at destinations.
Unlike venturers, dependables travel less frequently, are less venturesome, less self-certain
and more worried in everyday life. Again, the backpacker leans more towards the allocentric
end of Plog’s continuum. Plog’s model recognises the fact that tourists may possibly have a
mix of traits, from both ends of the continuum hence introduced a third personality trait:
‘mid-centric’. However, Gray’s (1970) and Cohen’s (1972) classification precludes this view,
which may be a weakness of these two models.
2.4.4 Motivational psychographics model
Following the generic classification of tourists, backpacker researchers have started
examining the intricacies of the backpacker segment, including the development of
typologies. Loker-Murphy (1996) classified backpackers along their motivational
psychographics. Drawing on Pearce’s (1990) concept of travel careers, the author identified
four (4) different segments: escapers/relaxers, achievers, self-developers, and
social/excitement seekers. Although Loker-Murphy (1996) argues against the homogeneous
treatment of backpackers, her analysis remains quiet firmly tied to Pearce’s (1990) notion.
Using a leisure scale Ryan and Moshin (2001) discovered that backpackers’ activities are
simply a revelation of attitude, as well as stimulus. They recognised four (4) key types:
‘mainstreamers’, ‘explorers’, ‘passive viewers’ and ‘the not keen’.
2.4.5 The all-inclusive typology
Hottola (1999) also notes the heterogeneity in contemporary backpacking and proposed what
seems to be an all-inclusive typology. This author identifies: ‘professionals’ (such as
academics, photographers, journalists, musicians and writers on working vacation), ‘students’
(including globe trailers with an interest in seeing the world), ‘specialists’ (such as ‘eco-
packers’ natural environments, seeking pristine), ‘outcasts’ (those seeking to start a ‘second’
life), ‘root diggers’ or ‘old hippies’ (revisiting past travel experiences and places), ‘freaks’
(congregating primarily on beaches and counterculture communities) and ‘army discharges’
30

(mainly, Israelis in the void between the army and the return to civilian life) as sub-groups of
backpackers. Next, are the conceptual differences between backpackers and flashpackers.
2.4.6 Backpackers versus flashpackers
Another recent introduction, which is still being developed as a concept and in fact, the most
popular typology of backpackers is the dichotomy between a core backpacker and a
flashpacker (White and White, 2007; Hannam and Diekmann 2010; Paris, 2010a, 2012b;
Mason, 2012; Butler and Hannam, 2015; Germann Molz and Paris, 2013) (Table 2.3).
Nonetheless, this attempt has been met with some difficulty, as scholars are unable to
operationalise the concept in a univocal manner owing to the multi-facetted nature of their
definitions.
Table 2.3: A comparison between backpackers and flashpackers
Characteristics Flashpacker Backpacker
Not quite so young √ ×
More technological equipment √ ×
Show off √ ×
Upscale or upmarket accommodation services √ ×
Money plays minor role × √
Budget accommodation × √
Simple features × √
Mostly young people × √
A few electronic devices × √
Independent or free way of travel √ √
Close contacts with locals – to experience authentic cultures √ √
Looking for specific experiences √ √
Internet usage √ √
Email messaging √ √
Credit card usage √ √
Travelling off the beaten path generally √ √
Note: √ present, × absent
Source: Adapted from Paris (2012a)
31

According to Paris (2012a, p. 1094), “the recent convergence of information technology and
physical travel has been embraced by backpackers.” Communication technology also permits
most backpacker business enterprises to link directly to markets as a surrogate to word-of-
mouth communication and backpacking guide books (Paris, 2012a).
For Hannam and Diekmann (2010), the term ‘flashpacker’ or ‘technopackers’ reflects the
current dynamics in modern society resulting from the demographic, economic, social and
technological changes in the world. Being mostly older travellers with more income at their
disposal (in comparison to backpackers), and living out the character of backpackers – out of
their own volition – rather than budgetary constraints, mobile devices and other forms of
technology enhance the experience of flashpackers on the ‘road’ (Hannam and Diekmann,
2010; Paris, 2010a; Mason, 2012; Butler and Hannam, 2015; Germann Molz and Paris,
2013). Their travel style is expressive of a ‘digital nomad’ (who use technology such as
mobiles and Internet to enhance travel, thereby, more independent) plus the backpacker
culture (Makimoto and Manners, 1997). Bauman (2007) advances that flashpackers may well
be recognised as part of the elitist society globally. As accentuated by Paris (2012a, p.1095)
“these elites are hypermobile mentally, corporeally, and virtually.” The digital nomads wield
the capacity to travel more sinuously across the globe via several travel landscapes using
‘nomadic institutional structure’ of transport systems, accommodations facilities, credit cards,
online communities, travel agents, information and travel booking websites. This group of
backpackers are also able to link up instantaneously with various on-the-go networks anytime
and anywhere using an assortment of mobile devices (O’Regan, 2008, p. 111).
Research has shown that ‘flashpacking’ has become a growing important sub-segment of
backpacking (Jarvis and Peel, 2010). Backpackers are classed as ‘flashpackers’ if they are
wealthy and/or tech-savvy. Hostelbookers.com, a key online booking site for backpackers
observes that flashpackers are just normal backpackers who covet a more upscale service and
are also part of the general technology-savvy travellers (Hostelbookers.com, 2010). The
concept ‘flashpacker’ is a product of the varying demographic and economic drifts in
Western societies: improved time for leisure, child bearing, marriage, enlarged incomes and
digital revolutions (Hannam and Diekmann, 2010). It is said that flashpackers are merely
backpackers who rather tend to backpack in ‘style,’ using some kinds of ‘bucks and toys’ to
facilitate their overall experience on the ‘road’ (Paris, 2012a, p.2). Hannam and Diekmann
(2010 p. 2), therefore, conceptualised a flashpacker as:
32

the older twenty to thirty-something backpacker who travels with an expensive
backpack or trolley-type case, stays in a variety of accommodation depending on
location, has greater disposable income, visits more ‘off the beaten track’ locations,
carries a laptop, or at least a ‘flash drive’ and a mobile phone, but who engages with the
mainstream backpacker culture.
In parallel, Travelblogs.com (2009) defines flashpacking as simply backpacking with style or
flair, looking for more comfort than traditional backpackers do. However, a survey conducted
by Hostelworld.com (2009) shows that of late, both backpackers and non-backpackers carry
on themselves, several technological devices. Furthermore, a more recent study by Paris
(2012a), adopted a Cultural Consensus Analysis to compare flashpackers and backpackers –
represented by the results in parenthesis respectively: travelling with digital camera 97%
(90%), laptop 76% (14%), video camera 35% (5.1%), international cell phone 50% (41%),
WiFi enabled devices (cell phones, PDA [Personal Digital Assistant], iphones) 40%(4.1%),
email checking frequency per day 6(3), posting of pictures 2(2), and Facebook 4(4). As
noticed from the results across the various surveys, they seem to suggest that both
flashpackers and backpackers use mobile technology for their travel, but the degree of usage
among the so-called flashpackers is higher than that of their counterparts. One possible
weakness of this conceptualisation, however, is with the possibility of other types of tourists,
carrying similar digital devices being erroneously construed as flashpackers or backpackers.
However, a self-identification criterion (despite its limitations) could deal with problems such
as this, if considered by researchers.
Past studies claim that targeting the backpacker segment can be a useful and a sustainable
strategy for developing destinations (Scheyvens, 2002). Moreover, Jarvis and Peel (2010) in
their research, proposed that it was about time destinations gave attention to the growing
flashpacker segment by enhancing and supporting indigenous industries to cater for their
needs. Paris (2012a) also thinks that while the flashpacker also portray backpacker travel
style, the rising interests by tourism academics and industry practitioners in this area stress
the need for further research on the dichotomy between the two groups identified – to
properly direct marketing efforts.
On the premise that backpackers should not be considered a homogenous group of travellers,
this section revealed the diversity of the segmentation based upon motivations, socio-
33

demographics, as well as technology usage. In general, while earlier researchers as noted
above used various psychographic traits to further segment backpackers, the overall
complexity of these and the lack of a firm theoretical basis have made such typologies quite
unpopular in current literature. Perhaps, what now appears to be gaining currency and further
investigation is the backpacker-flashpacker categorisation (Hannam and Diekmann, 2010;
Paris, 2010a; Mason, 2012; Butler and Hannam, 2015; Germann Molz and Paris, 2013).
Nevertheless, there needs to be a more theoretical and nuanced understanding of this
segmentation as this seems to be fragmented in lucidity. The following section compares
backpackers with mainstreamers or conventional tourists.
2.4.7 Comparing backpackers and conventional tourists
This section compares backpackers with conventional tourists and notes the differences as
well as blurriness between these two groups in terms of their travel characteristics,
motivations, and risk-taking propensity. While there are some attributes that set backpackers
apart from mainstreamers, the literature also shows that the two groups are becoming
homogeneous in some areas.
Even though, the literature regarding this subject is a bit underdeveloped, some studies (e.g.
Uriely, Yonay and Simchai, 2002; Wilson and Richard, 2008; Larsen, Øgaard and Brun,
2011; Adam, 2015; Dayour, Adongo and Taale, 2016) have highlighted the differences
between backpackers and general travellers but also the similarities they share in common.
Unlike past studies (e.g. Uriely, Yonay and Simchai, 2002; O’Reilly, 2006; Reichel, Fuchs
and Uriely, 2009) that have reported about backpackers becoming dissimilar to
mainstreamers especially regarding motivations, a study by Larsen, Øgaard and Brun (2011)
notes some differences among the two travel segments in terms of risk-taking propensity,
worry about terror attacks, preference for luxury and relaxation, and encounter with strange
cultures at destinations. The study (ibid) demonstrated that budget travellers or backpackers
were less motivated by the penchant to engage in luxury and relaxation in comparison to
mainstream tourists, understandably because they are adventure oriented. This study supports
Maoz (2007) who found relaxation as one of the weakest motives for backpackers. Elsrud
(2001) and Larsen, Øgaard and Brun (2011) established that backpackers are significantly
less risk apprehensive regarding issues of food poisoning and terror attacks. However, both
groups are concerned about general accidents, crimes and road traffic accidents during travel,
34

thus while backpackers are less risk apprehensive, they are equally worried as tourists
(Larsen, Øgaard and Brun, 2011). In support, Adam (2015) reported that backpackers were
worried about terrorism, political, physical, socio-psychological and financial risks.
Furthermore, while backpackers see themselves as being socially individualistic (Elsrud,
2001), tourists feel otherwise – supporting the argument that tourists are more likely to be
institutionalised in nature – be they individual or organised mass tourists (Cohen, 1972). But
current studies (see Hannam and Diekmann, 2010; Adam, 2015; Adam and Adongo, 2016),
also found that backpackers are becoming institutionalised relative to their travel mode
choices, travel company and choice of accommodation. For instance, Hannam and Diekmann
(2010) and Adam and Adongo (2016) note that backpackers also use upscale accommodation
facilities and travel in groups respectively. These current studies show some indistinctness
between conventional travellers and backpackers as opposed Pearce (1990) who described
backpackers as uniquely independent travellers who use budget accommodation facilities.
Larsen, Øgaard and Brun (2011) also note that regarding psychological variables (such as
social motives, the need to escape one’s usual environment, enhance one’s ego, quest to
acquire knowledge or to learn about new cultures), there is homogeneity among the two
groups. The homogeneity found in social motives contradicts Ryan and Moshin (2001) who
maintain that building friendship with other travellers and hosts is an important motivation
for backpackers. Accordingly, this finding supports the allegation that backpackers and
conventional tourists may be more similar to each other than they are different from each
other, and that backpackers are increasingly becoming mainstreamed (O’ Reilly, 2006;
Reichel, Fuchs and Uriely, 2007, 2009). Larsen, Øgaard and Brun (2011) assert that both
backpackers and mainstreamers regard themselves as explorers but further rouse the need for
more studies on this subjective conceptualisation and differences between a “backpacker”,
“mainstream tourists”, “typical tourists”, “average tourists”, as well as other related concepts.
The above evidence indicates some similarity between backpackers and conventional
travellers in terms of their travel motivations and risk-taking propensity. Certainly, this calls
for more focussed investigations on what sets backpackers apart from conventional travellers
to streamline the selection of backpackers in research and to offer more useful marketing
implications based on their unique characteristics. This chapter ends by examining the
35

contributions of backpackers to local economies; an aspect that has activated academic
research and national discourses in recent times.
2.5 Backpacking and community development nexus: A focus on developing destinations
This part of the literature review looks at how the backpacker segment has become a
‘vehicle’ for development but also some negative perspectives on the segment – with
emphasis on developing countries. It also touches on some of the qualities of developing
countries that place them more conveniently to target backpackers, as well as what needs to
be done to encourage backpacking in such areas. Table 2.4 provides a summary of the
potential benefits of backpacker tourism.
While in the past (through media reportage), backpacking received negative connotations and
popularisation such as the dopers, gender tourists, and social misfits, quite recently this
unique segment has been promoted in the tourism literature as a panacea for local
development, especially in developing countries (Hampton, 1998; Goodwin, 1999; Wilson,
1997; Scheyvens, 2002; Dayour, 2013, Dayour, Adongo and Taale, 2016). Even though most
of the developed world has enough infrastructure to target and cater to almost all groups of
tourists, mass tourists in particular, it is very less so in Third World countries. Often, any
attempts to concentrate on mass tourism leaves very little behind for the local people in such
destinations owing to the domination of multinational companies that import almost
everything and repatriate profit to their home countries.
Cohen (1982) notes that a few local people have the wherewithal in terms of the knowledge,
networks and the skills required to provide for the needs of higher-end markets. Therefore,
backpacking is seen as a sustainable ‘strategy’ to development in such areas (Goodwin, 1999;
Wilson, 1997; Wheeler, 1999; Scheyvens, 2002). Nonetheless, Jenkins (1982) opines that
small-scale tourism businesses can exist alongside bigger ones, which mean that
backpacking, could be targeted in addition to other forms of tourism. In her work, Scheyvens
(2002) notes that the impact of backpacking on local communities is manifested in their
relatively longer length of stay at the destination, spreading of expenditure through
purchasing local produce, as well as boosting communities’ pride through interactions. This
argument was in reaction to the notion that Third World countries tend to be more interested
36

in higher end tourists, believing that their visits come with more revenue and job creation
than low budget tourists – backpackers.
Table 2.4: A summary of the economic and non-economic potentials of backpacker tourism
Economic development potentials Non-economic potentials Owing to their longer duration of stay at
the destination, they tend to expend more income than other tourists.
Enterprises catering to backpackers are commonly small scale in nature and thus are owned and controlled by local people.
Money spreads across a wider geographical area (including marginalised ones) because of their extended stays.
Providing services locally challenges foreign dominance.
They spend on local services (such as transport, food and accommodation)
The use of resources such as cold showers and fans instead of warm showers and air conditioners support energy efficiency and environmental friendliness.
Basic infrastructure is needed, therefore, reduce overhead cost.
The desire to interact with and learn local cultures lead to the renaissance of traditional knowledge and cultural attributes.
The use of local resources and skills increase multiplier effect within the destination.
Local people gain self-fulfilment from controlling and managing their own businesses instead of taking up menial job in foreign companies because they lack the capacity.
Formal qualifications and expertise are not basic requirements for working in the industry catering to backpackers – such skills are learnable on the job.
Overseeing their own businesses enable them to form local cooperatives to engender tourism growth, as well as better uphold the interest of local people during negotiations with national governments and foreign enterprises.
Source: Scheyvens (2002)
Third World governments become loath in recognising this market as a potential source of
earnings for local development. This is due to the false believe that in ensuring that funds
extend for a longer stay duration, backpackers become almost excessive ‘bargain hunters’
hence leave little in the local communities they visit (Scheyvens, 2002). To Scheyvens (ibid),
the other reason is more stereotypical, that is, likening backpackers to the ‘hippies’ and
‘drifters’ of the 60s and 70s as some drug-taking individuals, unkempt, and immoral people.
37

This has resulted in some aversion towards the backpacker market. For his part, Hampton
(1998) mentioned that the backpacker tourism market had been overlooked in the planning of
tourism. Independent travellers mostly backpackers, were being discouraged from visiting
Maldives, and were being barred totally form entering Bhutan – arguing that they were a
threat to the nation while certified tour operators were allowed (Wood and House, 1991 cited
in Scheyvens, 2002). Likewise, in the city of Goa in India, the Directorate of Tourism relied
on the higher-end tourist market claiming that budget travellers do not bring plenty of cash to
spend at the destination (Wilson, 1997 cited in Scheyvens, 2002). A similar strategy was used
in some southern African destinations to attract packaged inbound tours (Baskin, 1995) while
in elsewhere, governments in their effort to discourage backpacking, developed different
policies. For instance, a state policy in Botswana stated:
Foreign tourists who spend much of their time but little of their money in Botswana are
of little net benefit to the country. Indeed, they are almost certainly a net loss because
they crowd the available public facilities such as roads and camp sites and cause
environmental damage … It is important to shift the mix of tourists away from those
who are casual campers towards those who occupy permanent accommodation.
Encouraging the latter while discouraging the former through targeted marketing and
the imposition of higher fees for the use of public facilities, are obviously among the
objectives to be pursued (Little 1991, p.4 quoted by Scheyvens, 2002, p. 146).
In spite of some of the negative publicity backpacking has had in the past, tourism academics
have, in recent times, offered some pragmatic clues as to how this market can benefit the
majority of people in local areas. Backpackers have the fondness for nature, culture or
adventure and these often activate a higher propensity to peregrinate rather than have
ephemeral stays at destinations (Loker, 1993; Loker-Murphy and Pearce, 1995; Scheyvens,
2002; Dayour, 2013; Hindle, Martin and Nash, 2015; Dayour, Adongo and Taale, 2016).
Thus, the restrained travel budget backpackers have could be ascribed to their relatively
longer duration of stay (Gibbons and Selvarajah, 1994).
It is, noted that they can meaningfully support indigenous economic growth – due to the
inclination towards purchasing more locally made goods and services in comparison to other
tourists (Wheeler, 1999; Wilson, 1997; Scheyvens, 2002). While Goodwin (1999) feels it is
an over-generalisation to make this claim, Scheyvens’ emphasised that “backpackers are
worth more to the local economy than they commonly receive credit for” (2002 p. 152). For
38

instance, tourists lodging in a flashy beach resort would most probably think that they have a
secluded zone, cordoned-off, somewhat to protect them from local vendors (Scheyvens,
2002).
Providing some empirical evidence from the Annapurna Conservation Area Project, Nepal, a
study by Pobocik and Butalla (1998) juxtaposed the impact of free-solo tourists and
organised mass tourists. It was established from this study that while organised-group
travellers spent almost $31 per day in comparison to $6.50 by solo travellers, more impact
was created by solo travellers on the local economy. This was because whereas other
companies brought in food for groups in their hotels, individual travellers favoured local
accommodation services, food and souvenir among others. This presupposes that backpackers
can support more local economic initiatives and development than other types of tourists as
mentioned above. Scheyvens (2002) thinks that the works of skilful artisans in developing
countries are admired by backpackers, probably because of their local orientation. She notes
that backpackers’ desire for local cultures, lets them into participating in local artisanship
such as carving or leather work.
Moreover, the literature suggests that for local communities to be able to draw enough
benefits from backpacking, the necessary infrastructure to cater for them is also essential (e.g.
Hampton, 1998; Wheeler, 1999; Wilson, 1997; Scheyvens, 2002). Scheyvens (2002)
maintains that local communities can more effectively deliver services needed by
backpackers without much need for huge seed capitals and infrastructure. The very nature of
backpackers makes it less expensive to provide for their needs in comparison with higher end
tourists. Hindle, Martin and Nash (2015) mention these needs to include the quest for
adventure, local culture, interactions with other travellers and patronage of existing
accommodation facilities, and basic local food and beverages, which can be provided at a low
cost.
To fully leverage this segment, some suggestions have emerged in the literature for
prospective destinations (Scheyvens, 2002). First, there is a need for local community
empowerment by various governments and other parastatals to equip them with both the
knowledge and confidence to command total control over this kind of tourism. Second, there
is the need for proper community structures, for instance, a village development committee to
represent the local area’s interest regarding tourism. Third, social factors (such as gender and
39

class) inform power play, and eventually, the sharing of dividends emanating from tourism.
Often, it is local leaders or rulers that tend to dominate and control community development
issues, therefore, short-changing the marginalised majority (Wilkinson and Pratiwi, 1995
cited in Scheyvens, 2002). Fourth, in response to some likely unacceptable conducts that may
be exhibited by backpackers in the places visited, which could result in shocks, a
recommendation is made for developing and enforcing codes of ethics to guide visitors’
behaviour (Scheyvens, 2002; Dayour, 2013).
Briefly, the literature points to the fact that backpacker tourism can help improve local areas
and livelihoods if pursued. In particular, it has been found that backpackers’ protracted stays
at destinations and desire to consume products and services locally, not only empower local
people economically but also result in the revival of lost cultures while increasing the local
people’s pride. For its overall sustainability, it is suggested that local communities take total
control of the businesses and establish structures that would serve the interest(s) of local
people regarding tourism development (Lim, 2009).
2.6 Summary
In general, the chapter sought to facilitate an understanding of what backpacking is by
considering its origin and existing conceptualisations in the literature. It is evident from this
review that contemporary backpacking is a rendition of the ‘drifting’ of 1960s and 70s
relative to travel motives and characteristics. Meanwhile, the definition of whom a
backpacker is has been a matter of academic debate and is still unsettled (Dayour, Kimbu and
Park, 2017). But, most scholars often give credence to Pearce’s (1990) conceptualisation of
the concept. Besides, it has also been understood from the review that backpacking is a
sustainable market segment. The social and economic advantages backpackers bring to
destinations, especially to developing destinations – that can conveniently use local and
existing resources to cater to their needs have been emphasised. The chapter also drew
attention to the existence of flashpackers who are much older, earn more income, patronise
high end accommodation facilities, as well as use more technology in comparison to core
backpackers. This view is developed further in the next chapter which discusses the link
between ICTs and tourism especially tourists’ experiences.
40
3 CHAPTER THREE – LITERATURE REVIEW
Information and Communication Technologies (ICT) and Tourism
3.1 Introduction
Chapter Two, in general, provided a brief understanding of backpackers. Moving forward,
tourism and ICTs are, inextricably linked, thus this chapter critically focuses on ICTs and
how they affect travel behaviour and experiences, as well as businesses within the hospitality
and tourism industry. It also discusses some of the features of mobile technology (especially,
the smartphone) that make it unique from other ICTs and able to transform marketing
strategies and consumer behaviours. Specifically, examined in the chapter, is the relationship
between backpacking and mobile technology. Finally, the risk and concerns of using mobile
technology are examined and presented.
3.2 Background to Information and Communication Technologies
ICTs are a major driving force that influence the social, economic and political processes of
the world. Often used as an umbrella term, ICTs refer broadly to all those technology used to
collect, process, transport, and store data or information via computers or electronic network
systems, as well as a range of other supportive communication devices (Buhalis, 1998).
These include computers, mobile phones (e.g. smartphones), satellite systems and various
computing applications – used to search, convey, share and receive information, for example,
Short Message Service (SMS), audio/voice, emails, videos, pictures, as well as connect to
digital social media platforms (notably, Twitter, Facebook, Instagram, LinkedIn, YouTube
and Flickr etc.) (Perron, 2010). It could be, ventured that they are the major forces driving
change in most of the developed world while progressively reshaping and transforming the
so-called Third World countries.
For their part, Ayres and Williams (2004) note that the pace of innovation and adoption of
mobile technology has grown by leaps and bounds in the developed economies of the world,
to say the least. For the developed economies, the institutional and societal structures ably
enhance the sustainable innovation and adoption of ICTs. Smartphone users in the USA have
increased from almost 40% of the US populace in 2012 to approximately 70% in 2013
(comScore, 2012a, 2013 cited in Wang, Xiang and Fesenmaier, 2014b). Notwithstanding the
number of mobile subscribers per 100 inhabitants being globally low at 23%, the developing
41
world is also making progress and has witnessed the highest growth rate in mobile bandwidth
subscription between 2012 and 2017 (International Telecommunication Union [ITU], (2017).
Much of the globe is evidently connected through sophisticated networks that permit huge
and rapid storage, exchange of text, sound, images and videos. This has been facilitated by
ICTs especially the World Wide Web (WWW), which was invented around the 1980s – now
modern Internet – invented around the 1990s (Buhalis and Law, 2008).
Moreover, in today’s world, ICT has become important in the way people live and work. The
rapid development, uninterrupted and unlimited access to information by individuals is
having a far more positive impact on their decision-making processes (Markelj and Bernik,
2015). This has been facilitated by ICT – particularly, the advance in mobile devices and
wireless network communication. Mobile devices allow owners to have memorable
experiences using mobile network connectivity and dozens of mobile applications for the
personalisation of experiences (Markelj and Bernik, 2015). In his book titled “The Third
Screen” Martin (2015) postulates that mobile device penetration has been on the rise as
everyone already has one – the demand for smartphone is on the increase (Martin, 2015). The
International Data Corporation [IDC] (2014) report did show that smartphone sales exceeded
1 billion in the year 2013 as the sales of similar others (e.g. e-watches, pods and pads) and as
at 2015, smartphone sales were growing globally by 13.0% annually (IDC, 2015).
Also, observing trends in the development of ICTs worldwide, MacKay and Vogt (2012)
argue that they have become woven into the fabric of daily life and travel – the spill-over
effect of mobile communication technologies. The youth appear to have responded more to
the change, resulting in the talk about ‘Generation Y or Yers’ (mostly youth born between
1980 and 2000) (McGlone, Spain and McGlone, 2011) who are the digitally savvy natives
(Prensky, 2001). Nielsen (2014a) refers to the same cohort as the ‘Millennials’ – noting that
about 85% of the members own smartphones. In a similar vein, Deloitte (2014) postulates
that those who use smartphones are 75% youngsters (between 18-24 years old). Accordingly,
they are the first group to have spent their whole lives on digital technologies (Bennett,
Maton and Kervin, 2008; Miller, 2008), including sharing and searching for content, work
and play (McGlone, Spain and McGlone, 2011). More recent statistics by ITU (2017)
indicate that in the developed world, nearly 94% of all youngsters between 15 and 24 years
use the Internet in comparison to 30% for less developed countries.
42

The impacts of ICT-enabled products and services on modern economies have launched the
synonymous terms ‘digital’, ‘borderless’ or ‘new’ economy (Ayres and Williams, 2004).
Ayres and Williams (2004) also observed that the advance in ICTs is having a noticeable
impact on various sectors of the world’s economy. With a contribution of nearly 10.2% to the
world’s GDP and an expected rise of about 3.9% pa by 2027, the travel and tourism industry
is but one of the world’s largest service industries (WTTC, 2017). As an information-
intensive industry, it has, over the years depended and is still relying hugely on ICTs and
various digital technology to expand; unearthing innovative ways of managing businesses in
the industry – diversifying and improving consumers’ experience of the product (Neuhofer,
Buhalis and Ladkin, 2012). Explicated in the subsequent section, is the nexus between ICTs
in general and the travel and tourism industry.
3.2.1 The tourism industry and ICTs
Akin to many industries of the world, technological advancement and the travel and tourism
industry have been moving side-by-side for several decades (Poon, 1993; Sheldon, 1997) and
for Tribe and Mkono (2017), ICT is ubiquitous in tourism. Consistent with these positions,
Buhalis and Law (2008) report that ICTs have been transforming the tourism and hospitality
industry in a fast-moving competitive marketplace. This assertion follows Porter’s (2001)
view that the advance in ICTs has, no doubt, changed both business strategies and practices,
not leaving out the industry structures. Interpretably, the introduction of ICTs meant tourism
businesses could not solely conduct their businesses via traditional media such as radios,
television, newspapers and magazines, but rather, needed to adjust to the advance in network
computing enhanced by the Internet age to stay competitive. The development of Computer
Reservation Systems (CRSs) around the 1970s and Global Distribution Systems (GDSs)
around the 1980s coupled with the subsequent introduction of the Internet in the 1990s have
dramatically revolutionised the best strategic and operational practices in the tourism industry
(Buhalis, 2003; e-Business W@tch, 2006; Xiang and Gretzel, 2010). The GDS (e.g., Galileo,
Sabre, Amadeus and Worldspan), which are computer reservation systems provide a single
point of access for the reservation of flight seats, hotel rooms, and rental cars among others.
However, the introduction of the Internet has caused a paradigm shift in communication
technology globally (Buhalis and Law, 2008). This development has, no doubt, led to the
pluralisation of various new communication options and services that enable interactivity
among people from all occupations than ever before.
43

Studies suggest that ICTs and digital applications have greatly impacted upon tourism
businesses – manifested in tourism e-Commerce (Buhalis and Law, 2008; Beiyu et al., 2015).
Nonetheless, Buhalis and Law (2008) and Buhalis and Foerste (2015) admit that in as much
as the advance in ICTs has and is re-engineering the industry processes in an advantageous
way bringing about a paradigm shift, they also pose some challenges and threats to various
stakeholders. These could range from adoption difficulties to threats experienced by users of
ICTs.
For Law (2009), the Internet has become a virtual market, implying that more specific
distribution and communications stratagems like any other market are necessary to remain
competitive. But from another angle, Law (2010) feels that current day technologies are
affording travellers so much latitude and easier means of coming public to denigrate service
providers in the industry, especially hotels – through TripAdvisor, Yelp, as well as personal
and corporate web logs. These systems allow consumers to evaluate the services of suppliers,
as well as share travel stories and experiences with other travellers. Research has found that
blogs and consumer reviews have far more influence on consumer decision-making processes
as potential consumers tend to believe such sources than others about service quality
(Akehurst, 2009). This is often because of the idea that bloggers and online reviewers provide
more value-free evaluations based on their own personal experiences as customers, which
could be relied upon by others.
Buhalis and Foerste (2015, p. 159) postulate that “the dramatic advancement in ICTs, allows
marketers to generate information that is highly personalised and relevant to consumers in
real-time context” via mobile phones – the smartphone to be precise. The emergence of
mobile devices such as smartphones with their unique features give marketers and destination
marketing companies more opportunities to reach out to customers in very personalised,
rapid, and spontaneous ways. Location-Aware Marketing [LAM] (in mobile marketing or m-
marketing), which makes use of the location of potential consumers, to communicate and
interact with them in real-time – and predict their needs has been developed lately (Xu et al.,
2011). This property of mobile devices could be useful, especially to first-time tourists to new
destinations (Buhalis and Foerste, 2015).
Literature notes the influence of ICTs on the experience of travellers from the anticipation to
post-consumption stages of travel (Gretzel, Fesenmaier and O’Leary, 2006) (). Therefore,
44

tourists in the 21st century can now gain information about destinations or attractions far
easily through Internet access way before visiting – because it is convenient, worldwide,
inexpensive, non-time limited and interactive (Luo and Li, 2009). Supporting this assertion,
Oulasvirta et al. (2012) think that ICTs like mobile phones augment the culture of
communication and facilitate the ‘absorption’ of the Internet among people during travel.
Furthermore, the development of Web 2.0 or Travel 2.0 – a platform of websites, allowing
people to meet virtually over the Web and share information via User-Generated-Contents
(UGCs), blogs, as well as the copious social media platforms, including YouTube, Twitter,
Facebook, Flickr, and Instagram cannot be overemphasised (Buhalis and Law, 2008; Ayeh,
Au and Law, 2013a; Filieri, Alguezaui and Mcleay, 2015).
Figure 3: Tourists’ tripartite experiential stages and ICT usage
Source: Adapted from Gretzel, Fesenmaier and O’Leary (2006)
UGCs or consumer generated media not only creates a platform for interaction among users,
but for searching and disseminating a great amount of information (in the form of text,
videos, sound, and pictures) in real-time and flexible manner – via ubiquitous Internet
connectivity – using various mobile devices such as smartphones (Mascheroni, 2007;
45
PRE-TRIPPlanning Expectation-
formationDecision-making
TransactionsAnticipation
CONSUMPTION ConnectionsNavigationsShort-term
decision- making
Onsite- transaction
s
POST-TRIPSharing experiencesDocumentation External memory Re-experiencing Attachments

Stienmetz, Levy and Boo, 2012). The smartphone is observed to be facilitating interaction
among tourists, as well as the physical and virtual worlds, irrespective of location (Wang,
Xiang and Fesenmaier, 2014a). Mobile phones have now evolved into ‘smartphones’ that
function fully as computers (Wang, Xiang and Fesenmaier, 2014b). The uniqueness of a
mobile device (i.e. the smartphone) is demonstrated in its multitasking ability, which gives
users a rather far-reaching experience than other traditional ICTs like personal computers can
afford. The next section is a highlight on what makes mobile devices inimitable to other
ICTs, providing the basis for why they have become more influential in shaping travel
behaviours and commerce in the industry.
3.2.1.1 Theoretical reflections on what makes mobile technology/services different from other ICTs
Mobile technology, in the last two decades, has expanded tremendously, affecting various
spheres of life processes and businesses, particularly marketing (the so-called m-marketing or
m-commerce), as well as consumer behaviour (Bruner and Kumar, 2005). Therefore, thought
leaders (e.g. Clarke, 2001; Balasubramanian, Peterson and Jarvenpaa, 2002; Bruner and
Kumar, 2005; Ko et al., 2009; Okazaki, Hairong and Morikazu, 2009; Barnes, 2012;
Okazaki, 2012; Okazaki and Mandez, 2013) have facilitated some amount of understanding
of various developments by shedding light on the characteristics of mobile technologies that
make them rapid transformative tools (in comparison to other ICTs). Especially, their ability
to change consumer experiences, behaviours as well as marketing processes has been
established in the literature. Understandably, their transformative ‘power’ mainly emanates
from them being ubiquitous (omnipresent) in nature (Okazaki and Mandez, 2013; Lamsfus et
al., 2015). This section discusses some of the theoretical foundations of the exceptionality of
mobile technology – focusing on smartphones.
According to Okazaki and Mandez (2013), the huge explosion in and penetration of
smartphones in the world is, influenced by technological advancements in mobile computing
and connectivity, most especially, in developed economies. Generally, the literature on
mobile marketing notes a fast expansion in mobile service consumers, looking for a gamut of
mobile services, which are accessible anywhere and anytime. The qualities of location and
time sensitivity, and flexibility in mobile devices, introduced the concept of ‘ubiquity’ into
the mobile marketing literature (Okazaki and Mandez, 2013). Thus, there appears to be some
level consistency and unanimity in the understanding of what ‘ubiquity’ is, in mobile
46

marketing – “flexibility of time and location” (Okazaki, 2012, p. 65). In a much earlier
research, Barnes (2002) maintained that context (time and location) is but the most
fundamentally distinct factor amongst the qualities of smartphones that affect consumer
information processing. He noted that the ubiquitous nature of mobile technology was going
to give consumers’ control over what they may hear, see and read from marketers and
advertisers.
3.2.1.2 Conceptualising ‘ubiquity’ in mobile computing – A theoretical insight
The Oxford Leaner’s Dictionary defines ubiquity as something “seeming to be everywhere or
in several places at the same time; very common” (oxfordlearnersdictionaries.com). Okazaki
(2012), notes that the concept of ubiquity emanates from the Xerox Palo Alto Research
Centre (PARC) where there was constant interactivity between users and wirelessly
amalgamated computing. This meant that computers were accessible but seamless or invisible
to all users in the corporeal environment. And so, Weiser (1993) who termed it as ‘ubiquitous
computing’ for the next generation, prognosticated that computers (both hardware and
software) will form part of the human environment, supporting life processes, lacking
continuous direction, which would make users unaware of them. Whereas in the case of
virtual reality, humans are, mingled with computer-simulated environments, ubiquity pushes
computers out to live among people, thus are invisible, and for that matter unobtrusive.
Furthermore, Watson et al. (2002) observed ubiquity to be indistinguishable from
‘omnipresence’ implying that not only are mobile technologies everywhere, but nowhere
because they are unobtrusive to users. From m-commerce perspective, Ko et al. (2009)
separate mobile commerce from traditional Internet in terms of the convenience of access to
data and information anywhere and anytime; this permits real-time interaction between
marketers and potential consumers. Similarly, using a model of Internet indispensability,
Hoffman, Navak and Venkatesh (2004) conceptualised ubiquity to include: the context of
Internet usage and the different segments using it, and the access points. The diffusion and
impact of the Internet results from the different segments of society that use it and the context
in which it happens, be it, home, work or school etc. Also, the larger the proliferation of
Internet, the greater the patronage and impact. The availability and access influence the
behaviour and activities of Internet users. This view appears to be in harmony with the notion
about the concept of ubiquity (as stated earlier in this section) in mobile technology, often
47

applied generically to mean the use of various mobile devices to access data and information
at anytime and anywhere. This means that marketers can reach out to their potential
consumers anytime and almost anywhere with personalised services based on context and
preferences. Most importantly, the ‘time-place’ flexibility is one unique aspect of the
composite term ‘ubiquity’. Hence, it is important to highlight in this section, some of the
theoretical foundations of the concept of ubiquity (in mobile devices), as well as its facets,
which have been understood from multidimensional fields: marketing, communication and
time-geography (Okazaki, 2012).
3.2.1.3 Hagerstrand’s time-space theory
The time-space theory by Hagerstrand (1970), happens to be one of the famous models (in
time-geography) that most current theories on mobile technology draw on (Okazaki, 2012). It
is important at this juncture to expatiate on the reasoning behind this theory and its
relationship with the concept of ubiquity in mobile devices. The theory highlights the
significance of spatio-temporal factors in the interaction among individuals or groups within
a social system. Hagerstrand notes that spatially and temporally, both space, as well as social
impediments affect diffusion and innovation whereby the human environment assumes a
hierarchical structuring – to the effect that those in a higher domain with much power
continually use it in restricting the activities of subordinates or those in a lower domain. The
domain here is understood as “a time-space entity within which things and events are under
the control of a given individual or a group” (Hagerstrand, 1970, p. 16). Stated differently, in
a domain (e.g. a University) various activities are controlled by some specific individuals and
that the ability of an element of the domain, be it an individual or organisation, to traverse the
domain is subject to a time-scale triad of constraints: coupling, capability and authority
constraints (Hagerstrand, 1970). Constraints here may refer to those challenges (be it time or
distance) that inhibit people’s interaction or access to the elements of any social setting.
First, coupling constraints demand users of any domain in a social system to be present at a
particular place and time in order to participate in the activities of that domain (Kraak, 2003;
Okazaki, 2012). This means that the domain requires individuals to join others for production
and consumption to take place in bundles (e.g. being at a sporting arena or at work). Second,
capacity constraints relate to the ability of users to overcome terrestrial or spatial distance to
join others in or interact with a domain. Essentially, they are confined to the efforts required
48

by people and organisations to ably interact with others and to engage with various artefacts
in a place and at certain times (e.g. the need to attend a meeting at one location and to make a
travel booking at a different place at the same time). Third, authority constraints on the other
hand control limited space using laws, regulations, as well as economic barriers to determine
who is (not) to have access to a domain at particular places and times.
Suffice it to note that the above concepts have a bearing on the concept of ubiquity in mobile
computing. In other words, the idea of ‘being anywhere and everywhere’ at any time has a
relationship with ubiquity. Okazaki (2012, p. 68) amplifies the notion that “although
Hagerstrand’s theory is derived from a different discipline, the concepts of coupling, capacity
and authority, are relevant to our conceptualisation of the ubiquity concept.”
Telecommunication networks and systems eradicate the impediment relating to distance for
some types of activities and events. Such systems, coupled with transportation modes and
settlements patterns, over time, adjust to the needs of users, which exert an overarching
influence on the social, economic, and knowledge systems. Okazaki (ibid) argues that such a
broad-ranging interaction eventually mediates users’ location in space and time, not leaving
out other activities. For instance, no coupling constraints, in terms of time and space, affect
users of social media network like Facebook, Instagram or Myspace. In a similar vein,
capacity constraints are removed by current search engines that enable people to overcome
terrestrial or spatial distance. Finally, authority constraint is no longer an impediment to
mobile banking activities and the likes, because of the right and liberty to control personal
and specific domains at anytime and anywhere.
3.2.1.3.1 A space-time matrix and ubiquity
In the context of m-commerce, Balasubramanian, Peterson and Jarvenpaa (2002) drew on the
time-geography theory and developed a space-time matrix to explicate how spatial and
temporal factors have been affected by mobile technology. Basically, a comparison is made
between the world with and without mobile technologies. This is independent of any specific
technology platform and could be applied differently as it may fit. To the authors, any
attempts to understand the implications of m-commerce, should go beyond its applications to
exploring the foundations by employing the time-space conceptual framework. They note that
in m-commerce (i.e. transaction of business via mobile or handheld devices using a private or
public wireless network), the intertwined nature of space and time is very imperative.
49

In developing this argument, Balasubramanian et al. (ibid) put forward two main scenarios:
first, the extent to which an activity is spatially limited (or flexible) and second, the extent to
which the activity is temporally constrained (or flexible). An activity is spatially and
temporally flexible when it can occur at any place and anytime respectively. Figure 4 is
illustrative of work and leisure using a Time-Space Matrix – for a world without mobile
technology. For instance, writing and receiving emails is flexible, in terms of time, but this
must be done at a fixed location where there is Internet connectivity.
Figure 4: Time-Space Matrix in the world without mobile technologies
Source: Adopted from Balasubramanian, Peterson and Jarvenpaa (2002)
In contrast, taking a luncheon is somewhat flexible in space because it can happen anywhere,
but moderately limited along time since it must be taken within a certain period. Also,
watching a football match on television can somewhat be constrained by both time and space
dimensions. This implies that in the world without mobile technologies opportunity cost is
crucial for taking part in life’s activities. For example, watching a live game requires
individuals to be at a place at a certain time as with taking a bus. This, therefore, means that
an alternative would have to be foregone to be able to watch the match in real-time – in the
world without mobile technology.
50

In the world gone mobile as depicted by Figure 5, mobile technology has led to the
convergence of space and time, thereby, removing the constraints of engaging in some
activities. Not all activities can be mediated by mobile technology (Balasubramanian,
Peterson and Jarvenpaa, 2012). For example, taking a shower and partaking in a sporting
game somewhere require one’s physical presence; these cannot be done simultaneously. That
notwithstanding, with mobile technology, while some activities are only temporally or
spatially flexible, others are both flexible in space and time – because of ubiquity.
Figure 5: Time-Space Matrix in the world of mobile technologies
Source: Adapted from Balasubramanian, Peterson and Jarvenpaa (2002)
First, take for instance the case of watching a football match on a television. Hitherto, this
was fixed in time and location, but with mobile technology, a spatial constraint is overcome,
as it is possible to either watch the game anywhere, sitting in a bus or driving a car. However,
the viewer must tune in at the start of the game to watch it live – a temporal constraint for that
matter. A museum may develop a mobile application, which allows visitors to have
information on exhibits upon visiting the museum. This means that clients can refer to their
mobile phone at any time (for information on exhibits) without guided tours, which happens
at specific times. But to use the application, it requires a user to be present at the museum
physically. The most interesting of all is the convergence of space and time where activities
51

are limited by neither space nor time. The ubiquitous nature of mobile technology has
jettisoned spatial and temporal constraints associated with many activities. For instance, e-
buying, emailing, checking on a truck’s status (using a GPS), and holding of a meeting via
face-to-face video calls are neither limited by time nor space in the world gone mobile – the
smartphone to be specific.
Thus far, the Space-Time Matrix demonstrates how mobile technologies are reshaping the
activities of the world, which are largely circumscribed by space or time limitations. The
concept of ubiquity is theorised in the literature as a composite concept, therefore, in the
following review, the common sub-concepts of ubiquity are discussed based on the works of
some thought leaders (see Clarke, 2001; Balasubramanian, Peterson and Jarvenpaa, 2002;
Bruner and Kumar, 2005: Scharl, Dickinger and Murphy, 2005; Okazaki, Hairong and
Morikazu, 2009; Barnes, 2012; Okazaki, 2012; Martin, 2015). These sub-facets include
portability and mobility, immediacy and speed, reachability and searchability,
untethered/wireless, simultaneity and continuity, convenience, and ‘personal’.
3.2.1.3.2 Portability and mobility
Portability and mobility describes the physical feature of mobile devices that distinguish them
from other ICTs like a desktop computer. Portability has been interpreted as the quality of
mobile devices that make them light to carry everywhere (Barnes, 2002; Balasubramanian,
Peterson and Jarvenpaa, 2002; Kleijnen, de Ruyter and Wetzels, 2007). Martin (2015) refers
to them as a ‘stand-up-medium’. An essential benefit of this feature to users is the relatively
small size of mobile devices, which make them a lot easier to move around with them. For
this reason, Gao, Rau and Salvendy (2009) assert that being ubiquitous is being portable; they
can be carried everywhere, reaching out to many thereby overcoming temporal and spatial
constraints. Chatterjee et al. (2009) likened mobility to portability noting that it determines
place-time independence. Put differently, devices are usable while on the move for leisure,
business and more. It has been observed that almost 80% of smartphone owners in the US do
not leave their homes without their devices partly because they are easy to carry along
(Electronicsweekly.com, 2012 cited in Okazaki and Mandez, 2013). However, while Shankar
and Balasubramanian (2009) observe that these two composite features (mobility and
portability) enable marketers to reach out to their potential clients easily, their small screens
and battery capacity do not encourage the delivery of information-intensive push messages.
52

3.2.1.3.3 Immediacy and speed
Crano (1995) defines immediacy as an individual’s perception of the amount of time between
an action and its resultant consequences. In mobile computing, this implies the speed and
quickness with which mobile devices function (Okazaki and Mandez, 2013). A mobile device
such as the smartphone has portals and applications that respond to the immediate needs of
users, for example, checking the arrival time of a bus or departure time of a flight. For Barnes
and Huff (2003), immediacy or speed is the ability of instant connectivity in mobile devices;
this contributes to reducing temporal constraints of other ICTs like desktops computers.
Smartphones come with already well-developed Internet infrastructure, which supports
various bandwidth and WiFi connectivity, bringing about instantaneity and speed.
3.2.1.3.4 Reachability and searchability
Reachability refers to the capacity of mobile devices that enable users to connect or
communicate with others (Kim and Garrison, 2009). According to Junglas and Watson
(2006), this refers to the capability of the device to let users be in touch with other people all
the time, under the presumption that the device has enough network coverage and is running
the whole time. This characteristic introduces spatial and temporal flexibility, as people are
reachable from anywhere and at any time via mobile devices. In parallel, searchability is the
ability of a mobile device to support a thorough analysis of a situation at hand (Okazaki and
Mandez, 2013). Current mobile devices such as smartphones (unlike traditional ICT) are
designed with context-aware properties (such as GPS [Global Positioning Systems]) that
enable users, particularly marketers to study and collect information on one’s location and
preferences based on their web search history. Hence, they aid marketers to send context
relevant information to potential customers and vice versa.
3.2.1.3.5 Untethered/wireless
Unlike desktop computers, mobile devices are highly untethered. They do not require
connectivity via wires, hence not usually fixed at specific locations (Shankar and
Balasubramanian, 2009; Martin, 2015). Mobile devices mainly rely on either WiFi or mobile
service providers for broadband Internet connectivity, thus users can move and hook onto the
Web at their convenience. According to Martin (2015), customers have become untethered in
the world-gone mobile, therefore, it behoves marketers to reach out to them with information
about their products and services. The adage that “rising tides raise boats, does not hold true
53

for those that are tethered, they will sink measurably” (ibid, p. 1). This means that marketers
must rise to the occasion by taking steps that will enable them foster interactive marketing
service via mobile devices, as users have become active rather than passive consumers. But,
again Shankar and Balasubramanian (2009) realise that m-marketing could be limited by
people who may opt-out from push messages.
3.2.1.3.6 Simultaneity and continuity
Simultaneity describes the quality of mobile devices being able to perform different task
simultaneously – being multitasking (Leung and Wei, 2000; Okazaki, 2012). Using a space-
time constraint model, Janelle (2004) espoused the view that space-time limitations affect life
in relation to technological, social, and biological factors. However, technology helps to
reduce the time needed to perform a task and moving from place to place – thereby,
facilitating multitasking abilities in life. Understandably, the unique operating systems and
multifunctional screens that come with mobile devices like smartphones, allow users with
busy schedules to multitask them for efficiency and productivity (Okazaki, 2012). Hence, the
multitasking feature of mobile devices becomes a vital element of ubiquity – allowing for co-
existence (Yu, 2006; Okazaki and Mandez, 2013). Closely linked with this is continuity, that
is, the capacity to provide incessant connection via 3G and 4G networks. A combination of
the above features is perceived to be another unique feature of mobile devices, not common
with other conventional ICTs (Kleijnen, de Ruyter and Wetzels, 2007). On the other side of
this debate, Okazaki (2012) thinks that this feature could increase human stress owing to the
obsession to increase productivity.
3.2.1.3.7 Convenience
Research has shown that customers associate convenience with services and products that
save time and effort (Berry, Seiders and Grewal, 2002). In support of this view, Venkatesh
(2003), on mobile commerce opportunities, established that mobile users expect to use
interfaces that can enable them to save time, vary location and personalise their needs, which
are directly related to ubiquity. Most smartphones have been designed with user-friendly
touch screens and applications, and incessant Internet connectivity making them easier to use
for diverse tasks – often at the convenience of users. This makes users feel ubiquitous relative
to other conventional ICT like laptop and desktop computers (Okazaki, 2012). People are
inclined to either use their smartphones to search for information on the Web or use social
54

network platforms when they are on the streets, beaches, buses, and restaurants – because of
convenience.
3.2.1.3.8 Mobile devices are personal
Unlike desktop computers and television sets that can be shared among individuals and
groups, mobile devices are not shareable (Martin, 2015). The devices are always close to
their users and the communications that go on through them are highly personal such as text
messages, emails and social networking. Arguably, the feature of mobile devices produces
some emotional and psychological attachment by users, making them social actors as
espoused by Fogg, (1998). This feature also assists marketers in the co-creation
individualised or personalised services based on user ‘context’.
In brief, this section has provided some theoretical insights regarding the distinctiveness of
mobile devices in comparison to other ICTs like desktops and laptops. The single most
essential feature of mobile devices (smartphones to be specific) is ‘ubiquity’, which is often
perceived as a compound concept, describing the time-space flexibility in mobile devices.
The next section looks at the description and functions of a smartphone.
3.2.1.4 Smartphone defined
The definition of a smartphone has not been debated much in the literature on ICTs; rather,
there has been some accord as to what it is. To Wang, Xiang and Fesenmaier (2014a, p. 1), “a
smartphone is a ‘miniaturised computer’ that integrates an agglomeration of multiple digital
devices such as multiple touch screen, camera, MP3 player, GPS, digital voice, textual
messaging and an operating system that supports potentially thousands of mobile computing
software (applications).” Examples of such brands of mobile devices include but not limited
to iPhone, Samsung, Nokia, Blackberry, and Microsoft phone, which run on operating
systems such as iOS, Android, Symbian OS, Blackberry OS and Windows respectively.
Okazaki (2012, p. 2) asserts that “smartphones offer more advanced computing ability and
Internet connectivity than a contemporary basic-feature phone, which is a low-end mobile
phone that has less computing ability.” Their built-in functions and software have altered the
once ‘one-minded’ cell phone to a portable mobile computer.
55

Scholars in the field of tourism such as Wang, Park and Fesenmaier (2012) and Gretzel
(2015) report that a smartphone provides a range of possibilities that support travel, owing to
them having efficient processors, broadband Internet access, operating systems, and user-
friendly interfaces. Moreover, Wang and Xiang (2013) also did indicate that the unique
qualities of such mobile devices comprising Location-Based Services (LBS), and geo-based
services, as well as wireless interfaces allow travellers to access unlimited information
independently – to address their needs spontaneously. They also contain geo-location, mobile
payment options and cameras (Szewcyk, 2013; Wang, Xiang and Fesenmaier, 2014a;
Tussyadiah and Wang, 2016) along with some types of sensors: optical sensors,
accelerometers, audio sensors, microphones, biosensors, and compasses (Beach et al., 2010).
For O’Regan and Chang (2015) the rise in smartphones and travel-related applications (apps)
together with the Third and Fourth Generation (3G/4G) wireless connectivity and WiFi, make
it a lot easier for travellers to search for information, plan, as well as book events and transact
at their convenience – anytime and anywhere, while on the move. Arguably, except for phone
calls, smartphones cannot function as they should without Internet access – the two are
inextricably linked – for total performance.
Furthermore, studies by Osti, Turner and King (2009) and O’Regan and Chang (2015)
conclude that as travellers’ behavioural tendencies and preferences change from packaged to
individualised products and services, a new group of travellers’ plan, book and network using
smartphones. As a corollary, Neuhofer, Buhalis and Ladkin (2012) posit that the mobility
feature of a smartphone, together with useful applications, make its services mainly
imperative to tourists. The section henceforth, focuses on mobile technology and tourism
with emphasis on smartphones.
3.2.1.5 Tourism and mobile technology: Emphasis on smartphones
The special features of mobile devices (smartphones) have made an impact on the hospitality
and tourism industry. Not only is it shaping the ways of marketing and service production,
but also consumer behaviour (Tussyadiah and Sigala, 2018). Over the last decade, a large
body of literature has advanced knowledge on the impact of mobile technology on tourists’
experiences and on service product marketing. This has evidently, led to the talk about
technology-mediated travel experience, smart destinations/cities, smart attractions, m-
marketing and m-commerce (Tussyadiah, 2015). Hence, this section discusses the role of
mobile technology within the travel and tourism industry – focusing on how it mediate travel
56

experiences and how suppliers of the tourism product are retooling their businesses to meet
the demands of the current technology-savvy or contemporary travellers.
3.2.1.5.1 The role of mobile technology in tourists experience and behaviour
The world of today and life are characterised by the extensive usage of ICT, wherein
individuals depend on them to find, store, and transmit information privately and faster.
Tussyadiah (2015) notes that personal mobile technologies permeate life and have expanded
to become a major vessel through which people network. Whereas these largely comprise
personal computers (or microcomputers) and mobile phones, the latter, particularly, the
smartphone is said to have dethroned the so-called PCs, resulting from its capacity to perform
various tasks, ranging from reading of news items and entrainments through to editing of
spreadsheets using mobile software applications (Mossberg, 2014). Beyond these functions,
Tussyadiah (ibid, p. 1) expresses the uniqueness of smartphones in comparison to other
mobile devices noting that “smart-mobile devices are characterised by constant connectivity
(that is, ubiquitous access to information and social connections; always-on and always-
accessible Internet) supported by intelligent systems and robust, rapid networks”. Recently,
the invention of eyewear or wearable devices, like the Google Glass, will permit travellers to
connect concurrently with their families and friend through ‘Google+ Hangout’ applications
(in real-time) while experiencing a destination’s attractions (Hannam, Butler and Paris,
2014). Therefore, Stienmetz, Levy and Boo (2012) and Buhalis and Foerste (2015) assert that
smartphones are fast becoming a major source of the Internet for tourists in search of travel-
related information and the remote control of life respectively.
Broadly, extant literature shows that smartphones affect tourists’ behaviour through their
decision-making processes, and experiences. Current in a large body of literature is how a
smartphone influences travel behaviour (Oulasvirta et al., 2012; Nielsen, 2014a), which has
been attributed to some key characteristics it possesses: mobility, intelligent system and
incessant connectivity (Tussyadiah, 2015). More uniquely and importantly, smartphones
(unlike PCs) are preeminent for their sensitivity to context-based information in relation to
location and time, thereby, pushing context relevant information/recommendations to users to
support on the spot decision-making in real-time (Okazaki, 2012; Tussyadiah, 2015).
Indubitably, smartphones are influencing travel behaviours as travellers are markedly
employing them for various travel-related decisions. The mobile nature of tourists means that
57

smartphones, as more portable and multitasking devices (in comparison to desktops and
laptops), provide solutions to their immediate needs, often at their convenience, anywhere
and anytime. A wide stream of research has examined this trend (see Mondschein, 2011;
Wang, Park and Fesenmaier, 2012; Oulasvirta et al., 2012; Wang and Xiang, 2012; Lowy,
2013; Wang, Xiang and Fesenmaier, 2014a, Dickinson et al., 2014; O’Regan and Chang,
2015; Tussyadiah, 2015; Minazzi and Mauri, 2015; Hwang and Park, 2015; Tussyadiah and
Sigala, 2018).
Studies prove that the role of ICTs in travelling relates to its enhancement of tourist
experiences (see Tussyadiah and Fesenmaier, 2009; Wang, Park and Fesenmaier, 2012;
Dickinson et al., 2014; O’Regan and Chang, 2015, Minazzi and Mauri, 2015; Tussyadiah and
Sigala, 2018). ICTs have the capacity to transform the experiences tourists would get without
them, often in a positive way. Wang, Park and Fesenmaier (2012) realised in their research on
“smartphone use in everyday life” that the psychological and behavioural aspects of tourist
experience are mediated by smartphones – through the facilitation of search, processing and
sharing of information – helping travellers to learn more about the destination’s offerings.
Besides, Tussyadiah (2015) found that the use of smartphones during ‘post-trips’ may consist
of posting of pictures on social media and evaluating trips among others. In consequence, it
could be argued that the feature of ‘reachability’ and ‘searchability’ along with ‘simultaneity’
in smartphones (Section 3.2.1.2) make users emotionally attached to them, and want to use
them for their travel needs at every opportunity.
Furthermore, smartphones have also challenged the sequentially dogmatic traditional
definition of travel experience, often categorised into: pre-trip (anticipatory), experiential
(consumption) and post-trip (reflective) stages (Tussyadiah, 2015). With smartphones, tourist
no longer need to spend several hours planning to visit a destination since the qualities of the
devices afford them the opportunity to make real-time decisions and choices – during the
experiential stage. Therefore, Tussyadiah (2015, p. 2) concludes, “the use of smartphones by
travellers emphasises on-site experiences as the critical stage of tourism experience.”
Perhaps, an exception might be that destinations that are not smart (that is, have no ICTs
enhanced physical infrastructure) may not support tourists using smartphones.
Also, while Kramer et al. (2007) observed that travellers’ activities can be changed easily by
smartphones, Wang and Xiang (2012) found the following as their roles: accessing
58

information and interpretations, finding directions, connecting with social networks, and a
source of entertainment. Therefore, the usefulness of the device and associated attachment to
it by users, relate well with Guthrie’s (1993) concept of ‘anthropomorphism’ in technology
design, which is the ascription of human-like attributes to non-human objects such as the
mobile phone. This concept contributes to the ‘Functional Traid’ theory posited by Fogg
(1998, p. 225). Per this theory, a mobile technology performs different functions for users: as
a persuasive tool, media and a social actor. Essentially, not only are mobile technologies seen
as tools and media but as social agents with which people can interact and find solutions to or
ease their psychological and emotional burdens. Table 3.5 summarises some uses of
smartphones for travellers in the literature.
Table 3.5: A summary of the usefulness of smartphones for travel
Travel perspective Authors Mobile tour guides Bellotti et al. (2008)
Grun et al. (2008)
Information searching, information sharing, information processing
Tussyadiah and Fesenmaier (2009)Wang, Park and Fesenmaier (2012)
Functional, innovative, hedonistic, social and aesthetic roles
Wang, Park and Fesenmaier (2012)
Connectedness, safety, information, confidence, flexibility, more fun, en-route planning and sharing, less pre-planning, facilitation, recording of travel experience, social networking
Wang, Xiang and Fesenmaier (2014a)
Trip management, navigation, recommendation, online reviews, searching for deals and social networks, information search, making reservations, taking pictures, and receiving recommendations
Tussyadiah (2015)
Picture uploads on food and beverage, detailing of restaurant atmosphere, sharing experiences, leaving negative comments on blogs and social media, recommendations and information sharing
Hwan and Park (2015)
Source: Author’s construct, 2018
59

Besides, to facilitate understanding of how mobile technologies can influence tourists’
experiences and behaviours, Lamsfus et al. (2015) used the concept of ‘context’ or ‘situation’
to explicate this phenomenon. To them, travel style and behaviour take place with a context,
which is a composite of situational, personal, environmental, as well as technological
information that can be processed to create a story about a traveller’s experience (Gretzel and
Fesenmaier, 2002; Tussyadiah and Wang, 2016).
Context-awareness capabilities in mobile devices enable an understanding of tourists’
personal characteristics, the external environment within which they find themselves, as well
as their movements (Xia, Zeephongsekul and Packer, 2011; Tussyadiah and Wang, 2016).
Lamsfus et al. (2015) think that the need to understand this is based on the consciousness that
cutting-edge technological devices (smartphones) of today are supporting the activities of
travellers on-the-go. Understandably, the notion of context is based on the place and time
theory.
It is understood that ‘context’ is a twofold domain comprising personal and travel attributes,
and environmental factors (Lamsfus et al., 2015). While the former entails the individual’s
travel traits such as socio-demographics, values, personality, attitude, decision-making style,
travel length, purpose of travel, distance to destination, time availability and group
composition, the latter relates to factors such as weather, location, temperature and social
contacts – resulting in feelings, and ultimately, the sense of place. They (ibid) maintain that
the capabilities of mobile technologies, especially smartphones with context-aware sensors
that can study both the personal and external environment of travellers, allow for on-the-go
decision-making often in a flexible and spontaneous way. This brings into focus the quality
of ‘agency’ in mobile intelligence, which allows devices to push more context relevant
information to users in times of need (Tussyadiah and Wang, 2016). Kramer et al. (2007)
observed that the use of smartphones brings about spontaneous changes in plans, routes,
locations and preferences for travellers based on their time-ware, location-ware and
personalised features. Though the impact of mobile devices on travellers’ decision-making
process may be minor when deciding which destinations to choose (macro level), they could
greatly affect decision-making at the destination (micro level), especially for independent
travellers. Travellers make more micro decisions on-the-go because of Location-Based
Service (LBS) and geo-based systems that make places a lot more captivating and immersive
(Hannam, Butler and Paris, 2014). The use of mobile devices and such alike has been found
60

predominant among the backpacker niche market in the travel industry lately. The next
section discusses the degree to which mobile technology plays a role in the experiences of
backpackers.
3.2.1.5.2 Backpacking and ICT: Emphasis on mobile technology experiences
The production and dissemination of tourist information, lately, has been democratised by
ICT, especially the Internet and mobile devices. This subsection critically discusses the extent
to which mobile technology mediates or shapes the travel experiences of contemporary
backpackers. Not least important in the section is how the industry that caters to their needs
appropriates the opportunities presented by mobile technology to market niche products in
order to stay globally competitive as the only constant in the hospitality and tourism industry
is ‘change’.
Tourism research on backpacking goes as far back as the 1970s and still ongoing (e.g. Cohen
1972; Pearce, 1990; Elsrud, 2001; Scheyvens, 2002; Uriely, Yonay and Simchai, 2002;
Cohen, 2004; Ateljevic and Doorne, 2004; Slaughter, 2004; Pursall, 2005; Lesile and Wilson,
2005; O’Reilly, 2006; Reichel, Fuchs and Uriely, 2007; Hannam and Diekmann, 2010; Butler
and Hannam, 2015; Adam, 2015; Hindle, Martin and Nash, 2015; Dayour, Adongo and
Taale, 2016; Dayour, Kimbu and Park, 2017). More specifically, the economic and social
benefits brought to developing destinations by backpackers – through their expenditure and
interactions with local cultures have been emphasised in the extant literature (as broached
previously in Section 2.5). It is, reasoned that behind the popularity and rise in backpacking,
rest substantial cultural influences, as well as changes in various socio-economic factors on
late modernism, which made this type of travel a lot more accessible to the youth of the West
(O’Reilly, 2006). Appadurai (1996) indicates that alongside these cultural changes that affect
contemporary mediascapes, ethnoscapes and ideoscapes, one most essential incitement to
travel and a distinct feature of backpacking is the incessant reliance on new media while on-
the-go. Murphy (2001) and Sorensen (2003) insist that information communication networks
are vital attributes of backpacking – expressive of a functional and central aspect of their
travel style.
61

3.2.1.5.2.1 Mobile technology and the backpacker experience
A mounting body of literature demonstrates how mobile technologies are shaping the
contours of travel and tourism within the last decade (White and White, 2007) through the
convergence of physical movement and mobile technologies (Hannam, Butler and Paris,
2014). Notably, germane to backpacking is the penchant to interact with like-minded
travellers, friends, hosts and different others (Sorensen, 2003). Mascheroni (2007) spotted
this practice as symptomatic of the backpacker segment – by alluding that interactions are but
central to both the social construction and cultural transmission of backpackers’ identity
hence forming a core part of their motive for travelling and sub-culture. Before the coming
into being of various communication technology such as the Internet and mobile phones,
interactions were mainly fact-to-face and future meetings were accidental or better still,
required advanced planning (Urry, 2002; Mascheroni, 2007). However, the practice of social
networking among backpackers has been undergoing changes and this is to some extent
remediated by ICT. Physical interactions are transformed, and new communication habits
have surfaced among such independent travellers (Mascheroni, 2007; Paris, 2010a).
Mascheroni (2007) further argues that this new communication strategy is clearly a network
sociality – contingent on individuals and finds some ‘material support’ in the Internet and
mobile media. This view finds support in the work of Urry (2002) who maintains that
backpacking is increasingly a mobile sociality, in that it is based on a composite of
intersections between closeness and distance, presence and absence, co-presence via virtual
travel and times of sporadic co-presence, facilitated by corporeal movement. Likewise, by
using mobile phones and Internet, travellers engage in creative kinds of ‘virtual’ and
‘imaginative’ travel – the mediated experience of places, people and distant events facilitated
by mobile technologies (Richards, 2011). Nonetheless, this does not vitiate the need for
corporeal movements; rather, it stimulates it (Mascheroni, 2007). This assertion corroborates
Larsen, Urry and Axhausen (2007, p. 259) prognosis that “places are going to be physically
travelled to for a long while yet.”
Iaquinto (2012, p. 152) also states that “the increasing use of the Internet while backpacking
and the portability of devices with Internet access, alters the tourist experience itself.” Also,
to Cooper et al. (2001, p. 24), in every respect, the Internet is a mobile medium and an
“indiscrete technology” hence mobile devices play a major role in accessing it. Ostensibly,
the period of Internet cafés was ousted by mobile devices (now smartphones) that already
have inbuilt Internet infrastructure, which provides users with connectivity via data bundles
62

and WiFi. Wang, Park and Fesenmaier (2012) underscored the material role smartphones
play in mediating tourists’ travel experience as earlier discussed earlier (Section 3.2.1.5.1).
Likewise, social networking hubs blur the physical boundaries of home and away among
backpackers by reshaping and reconstructing their social networking ecosystem – allowing
for a co-presence at home and away – due to the pluralisation of networks at a single time
(White and White, 2004; White and White, 2007; Mascheroni, 2007). On the other hand,
Urry (2002) contends that despite the capacity of being present remotely, virtual nearness
does not, in any way, oust the desire for corporeal travel, the compulsion to meet and interact
with other people physically. This is explainable because backpackers try to create meaning
from travelling by meeting with other people unknown to them (often corporeally) to ‘barter’
cultures and real-life experiences.
Iaquinto (2012) asserts that the swing from in-person to on-line socialising among
backpackers is an emergent quality of growing global Internet use and the dominance of
portable devices with Internet support. The WWW has facilitated the transmission of
information wherein views about destinations, tickets, deals, routes, and more are obtainable
on copious home pages, and blogs on views on backpacker trails. Therefore, the impact of
pre-trip Internet use on backpacker tourism could be probability modest, but on the road,
intense (Sorensen, 2003). The increase in Internet cafés along common backpacker routes and
the obvious importance of Internet connectivity within backpacker communities, made it a
widely embraced and cherished source of information (Sorensen, 2003). Currently, Internet
Cafés have lost their appeal and taste because of the opportunity provided by portable devices
(such as smartphones) with incessant Internet on-the-go. Moshin and Ryan (2003) opined that
the two (2) major sources of information used by backpackers are word-of-mouth (WOM)
and the Internet, however, WOM has now altered into what has become electronic-WOM. Of
late, the proliferation of smartphones with in-built Internet infrastructure and personalised
applications afford backpackers the opportunity to search for and disseminate information
more conveniently over the Web than before (Paris, 2012a).
Moreover, owing to its features (of youthfulness, independence, and flexibility) and massive
growth in recent times, backpacking is, presumed to be “one of the cultural symbols of the
increasingly mobile world” (Richards and Wilson 2004, p. 3). The reflection of backpacking
as a powerful mark of contemporary mobilities is not to mean the obvious in any way – them
63

being mobile in terms of corporal travel, but rather, mobility in the sense of them using new
media away from homes such as the mobile phones and ubiquitous Internet access.
Mascheroni (2007, p. 541) avers that the mobile phone is importantly a medium for the
activity of “micro-coordination of co-present interaction” among backpackers, thus the
number of backpackers who carry a mobile phone(s) while on the ‘road’ is on the increase
(Mascheroni, 2007, p. 537). Obviously, the ubiquitous nature (that is, the portability,
mobility, immediacy, reachability/searchability and convenience) of mobile and mobile
Internet (Stienmetz, Levy and Boo, 2012) support the activities of this, undoubtedly, mobile
group of travellers.
Furthermore, research (Richards and Wilson, 2004; O’Reilly, 2006) has also confirmed that
backpackers rely on online travel communities (such as Independent Traveller, Lonely
Planet’s Thorn-Tree Forum, MySpace, TripAdvisor, Igo-Ugo, Couch Surfing, Fare
Compare), friends and other technology-based supports to enhance travel experience
(Mascheroni, 2007; Paris, 2012ab). Irrefutably, access to these systems is made possible
through computers and mobile technology, smartphones to be specific – which have almost
supplanted traditional cell phones – because of their portability, spontaneity and immediacy
(Wang, Xiang and Fesenmaier, 2014b). The adoption and use of smartphones among
travellers have greatly increased since the emergence of “iPhone (and the apps available
through iTunes) and an army of mobile phones based on the Android” and RIM systems
(Wang, Xiang and Fesenmaier, 2014b, p. 11).
Consistent with the aforementioned views, Mascheroni (2007), O’Regan (2008) and Paris
(2010, 2012a, 2012b) realised that the advance in mobile technological innovations supports
the development and adaptations in the social systems of most travellers, especially the
contemporary backpacker. Paris (2010a, p. 1) describes this current trend among this group as
the ‘virtualisation of backpacker culture’, epitomised in the emergence of ‘flashpackers’ – the
digitally savvy backpackers (Paris, 2010b; Paris, 2012a, b; Germann Molz and Paris, 2013).
The digital economy is giving a new shape to backpacking as exemplified by ‘flashpacking’
or ‘digital nomad’ (Hannam and Diekmann, 2010; Paris, 2010a; Mason, 2012; Germann
Molz and Paris, 2013; Butler and Hannam, 2015). This is evident in the growing array of
Internet users and usage of computers and mobile phones with video and still cameras, GPS,
MP3s to access and transfer information a lot quicker than before (O’Regan, 2008). However,
it can be argued that the use of personal computers among such travellers may be, nowadays
64

rare, if not non-existent because of the proliferation smartphones that have similar
computational functions and more unique features tailored to meet the needs of travellers. In
his study on ‘hypermobility in backpacker lifestyle’, O’Regan (2008), envisioned that there
will be no need to check emails on aging PCs when smartphones can be used to tap into high-
speed WiFi connectivity while on the move.
The innovations in ICT such as smartphones enable backpackers to be co-present in their
social life, home and work places, as well as make quicker decisions during the experiential
stage of travel without having to plan in advance (Paris, 2012a). Recently, Hannam, Butler
and Paris (2014) noted about a new class of tourists’ who chiefly depend on mobile devices
and technologies – thereby reconfiguring their performativities and sociabilities – the so-
called flashpackers. This has reshaped their identity and ideology. Sorensen (2003) draws
attention to the fact that the Internet has an infinitesimal impact on most backpackers, before
travel, but a substantial influence during travel because it boosts spontaneity and flexibility.
Putting that into perspective, Sorensen (ibid) notes further that while others use the Internet to
search for information back home and from friends, others use it to file tax returns, check
bank accounts, emails and similar everyday matters during travel. Moreover, from an
ideological standpoint, Paris (2010) posits that backpackers’ ideals of flexibility, freedom,
independence and corporeal travel are being reinforced and facilitated by the virtual
backpacker identity and culture, which have simultaneously blurred the boundaries between
away and home. O’Regan (2008) thinks that backpackers have become the ‘mobile elite’ who
are hypermobile globally and are distinct by their relationship with technology and
information. Wang and Fesenmaier (2013, p. 67) indicate that “mobile devices and
smartphones ‘unlock’ the three-stage model of the travel experience by eliminating or
shortening the pre-consumption and post-consumption stage and extending the consumption
stage.” Deductively, the unique features of the smartphone discussed earlier make it an ideal
‘partner/companion’ for contemporary backpackers – reinforcing their ideological stance and
rhythm of freedom, flexibility and independence.
Notwithstanding their usefulness, some researchers (e.g. Reichel, Fuchs and Uriely, 2007)
think of the flipside, noting that the expansion of such technologies could negatively affect
the experiences of tourists. The opportunity to stay connected with friends and family at
home could decrease the socially orientated nature of backpackers. Worth noting is one
defining feature of backpackers (Reichel, Fuchs and Uriely, 2007; Maoz, 2007; Paris, 2010a),
65

which is maintaining social contacts with locals and other travellers. This quest may
gradually deaden as independent travellers interact with peers and families back home
throughout the journey using media networks. Mobile phones and Internet may intensify the
already idiosyncratic inclinations ubiquitous among backpackers, which to some academics,
make escaping the pressures of home, even more, problematic (O'Regan, 2008). The next
section also highlights the impact of mobile technology on the operations of tourism
businesses.
3.2.1.5.3 The impact of mobile technology (i.e. smartphones) on tourism businesses
Considering the role of mobile technology in mediating travel experiences, researchers (see
Tussyadiah, 2012; Lamsfus et al., 2014; Lamsfus et al., 2015; Martin, 2015) have echoed the
need for tourism businesses and Destination Management Organisations (DMOs) to
compatibly leverage the same technology to improve efficiency by providing visitors with
context-relevant push notifications or recommendations about destination options and deals.
Hence, the invention of geo-social services, that is, applications that conflate GPS, mobile
sensors, and social network systems on smartphones are an attestation that marketing
strategies make do with context-based information and social media networks (Frith, 2012;
Tussyadiah, 2015; Stienmetz, Chang and Fesenmaier, 2015). Martin (2015) observes that
modern consumers wield a lot of power as they have become ‘untethered’ because of the
ubiquity in devices like smartphones, allowing them access to information on-the-go,
anytime, anywhere. This means that marketers should adjust to the character of the new
consumer by satisfying their real-time demands using mobile technology. This current trend
has brought into the research domain, the concepts of smart cities, smart destinations, and
smart attractions (Boes, Buhalis and Inversini, 2015).
Turning to the business environment, the use of Location-Based Social Networks (LSN) such
as the Social Local Mobile Marketing (SoLoMo) and Social Context Mobile Marketing
(SoCoMo), which employ travel and social media experts, coupled with intelligent systems
have been documented by scholars (see Tussyadiah, 2012; Okakaki, 2012; Buhalis and
Foerste, 2015). These systems allow marketers to use user’s context (time and location), as
well as social media to market services to them at destinations, allowing room for feedbacks.
Therefore, this makes travellers more innovative (Richards, 2011) and spontaneous (Wang,
Park and Fesenmaier, 2012) as they can discover new product offerings on the go through
66

mobile recommendations and destination mobile apps, if any. The cities of Barcelona,
Amsterdam and Brisbane are typical examples (Gretzel et al., 2015). Tussyadiah and Sigala
(2018) recently note how the sharing economy – using innovative technology – is
transforming consumer behaviour, especially around accommodation. Lamsfus et al. (2015)
also allude that the properties of smartphones, including mobile contents editors, context-
aware and mobile analytics platforms, allow DMOs and service providers to study the
environment of travellers to produce contextually rich information that could be more useful.
However, they note that programming skills are required for people to use most of such
software, except content editors, which may require no programming knowledge to use.
3.3 Summary
In brief, the chapter critically examined the influence of ICTs on tourism, especially mobile
technology. It is unequivocal from the review that ICTs play a pivotal role in the travel
industry, much as in peoples’ daily lives – making people not only travel on the Internet – but
with the Internet. In effect, being corporeally detached from friends, family, and work is no
longer tantamount to being absent from them in the age of advanced mobile technology
(Hannam, Butler and Paris, 2014). The emergence of the smartphone apps and social media
networks are reshaping the experiences of travellers and the business community of tourism,
bringing about far more remarkable experiences through co-presencing. Most especially,
backpackers are using mobile devices to mediate their experience and reconstruct their
ideology of travel resulting in a new ‘mobile sociality’ and the virtualisation of backpacker
culture (Paris, 2010; Hannam, Butler and Paris, 2014). Mobile devices enable them to
maintain a co-presence – staying in touch with work, family and friends, and host community
– while on-the-road (White and White, 2007). However, the risks and threats of ICTs are
shared in the literature - requiring users to be more conscious and take necessary steps to
prevent them. The next chapter focuses on the relationship between tourism, ICTs and
perceived risk.
67

4 CHAPTER FOUR: LITERATURE REVIEW
Tourism, ICTs and perceived risk
4.1 Introduction
Broadly, Chapter Three discussed the nexus between ICTs (especially smartphones) and the
tourism industry – focusing on how they affect travel experiences and business processes.
Chapter Four now navigates some concepts and the theory of perceived risk – the main
theoretical framework underpinning this thesis. Chiefly, the chapter sheds light on the link
between risk perceptions and tourism, as well as ICTs. Furthermore, the connection between
perceived risk and risk reduction strategies are discussed. It highlights some of the
antecedents and consequences of users’ perceived risk related to ICTs – such as the
smartphone. Finally presented in the chapter are the proposed research model and testable
hypotheses for the study.
4.2 Risk and risk perceptions: A theoretical insight
Unquestionably, the subjects of risk and perceived risk have received a broad range of
academic attention and debates for several decades. That being so, the two concepts are not
free of deferring conceptualisations, comprehensibly so, by scholars from varied academic
disciplines, ranging from economics (such as Knight, 1921), sociology (Douglas and
Wildavsky, 1982), psychology (Coombs, 1964; Tversky, 1967; Kahn and Sarin, 1988), hard
sciences (Cox, 1967), marketing (Bauer, 1960) to tourism (Rhoel and Fesenmaier, 1992;
Blake and Sinchair, 2003; Lepp and Gibson, 2003; Dolnicar, 2007; Williams and Baláž,
2013, 2015). For the social sciences, the two concepts are somewhat related and often
conflated to facilitate understanding on a social phenomenon – which is, essentially, the
wider purview of this current study. The following sections offer insights into some of the
theoretical issues on risk and perceived risk to set the stage for further discussions on
especially perceived risk – the mainstay of this research.
4.3 Understanding risk
Risk, as per Cambridge Dictionaries Online is “the possibility of something bad happening”
(http://dictionary.cambridge.org/). In a similar and more technical sense, Kogan and Wallach,
(1964) and Cunningham (1967) understand risk to be concerned with the probability of
something happening and the consequences of that occurrence. Understandably,
68

consequences here connote something negative or bad. More commonly, theoreticians
(Knight, 1921; Cunningham, 1967; Cox, 1967; Mitchell, 1992; Williams and Baláž, 2015)
have made a distinction between risk and uncertainty, but in the past, the two terms have been
used almost interchangeably in the literature. Knight (1921), in his seminal work,
demonstrated the dichotomy between risk and uncertainty so did Bauer (1960) who is
credited as having pioneered the discussions around risk perceptions in the marketing
literature. For Knight (ibid), while the probability of risk is, often known, that of uncertainty
is unknown. That is, for there to be risk, the propensity of occurrence should be known in
advance of the occurrence (known probabilities) to a victim – who can possibly take
countermeasure(s) against the risk. On the other hand, uncertainties come as a surprise to
victims – who may not be prepared for them. So, in the words of Hofstede (2001, p. 148) “an
uncertainty has no probability attached to it. It is a situation in which anything can happen,
and one has no idea.” Consistent with Knight (1921), Williams and Baláž (2015, p. 273), in
their study: “tourism risk and uncertainty”, demystified the two concepts noting that risks are
“known uncertainties” while uncertainties are “unknown risks”. Knight (1921) puts it simply
that risk is a “known risk” and uncertainty, “unknown risk”. To illustrate both views, a tourist
visiting Africa may be aware of the chances of getting sick of malaria (either based on
tacit/personal, encultured, embodied or codified knowledge, for example, websites)
(Williams and Baláž, 2008, 2015) hence can take measures against the risk by taking a
shot/vaccine or using a mosquito net. However, the same tourist maybe confronted with a
noisy next-door neighbour in a hotel or an act of terrorism, which s/he may not have
anticipated, thus becomes an uncertainty. Therefore, it could be argued that risk commences
where knowledge ends hence the two are closely related (Williams and Baláž, 2015). The
question of knowledge as an important variable in understanding risk is subject to various
debates, often founded on the philosophies of positivism/objectivism and constructivism.
Williams and Baláž, (2013) explain that the modernist/positivist believes that risk is
real/objective and has known probabilities of occurrence (Zinn, 2004), therefore, a risky
choice comes with a range of likely consequences, whose probabilities are known. But, the
constructivists/post-modernists contend that a reductionist approach to risk construction is
limited, rather, ‘meaning’ should be socially constructed based on one’s idiosyncrasies,
needs, knowledge, and cognition – for a better understanding of risk (Williams and Baláž,
2013). Boholm (1996) also postulates that an individual’s own estimate of risk could be
entirely different from an objective/real risk estimate – based on differing cultures. Therefore,
risk has been viewed as a cultural phenomenon, where people’s perceptions and attitudes
69

towards the risk are informed by their cultural backgrounds (Douglas, 1978) hence the
concept of ‘perceived risk’. The next section discusses the theory of perceived risk, which
serves as the foundation for this thesis.
4.3.1 The theory of perceived risk
Perceived risk is a consumer’s personal/subjective assessment of the negativity of a course of
action, contingent upon negative outcomes, and the propensity that those outcomes will take
place (Cunningham, 1967; Murray and Schlacter, 1990; Dowling and Staelin, 1994; Mowen
and Minor, 1998; Mitchell, 1999). Put differently, it is the subjective feeling of the
likelihoods of loss from an action or a decision taken. Most importantly, within the concept
of perceived risk are two (2) main components: uncertainty (the subjective probability of an
unknown occurrence) and negative outcomes (Dowling and Staelin, 1994; Hoffman and
Turley, 2002). Thinking about uncertainty, Becker and Knudsen (2005) maintain that
uncertainty comes from a personal or subjectively perceived anticipation of vagueness about
a probable loss or harm wherein no amount of probability can be associated with each
prospective outcome. In other words, with uncertainties, people have no foreknowledge about
the probability of occurrence. This resonates with Bauer’s (1960, p. 30) postulation that “if
risk exists in the ‘real world’ and the individual does not perceive it or is unaware of it,
he/she cannot be influenced by it”, therefore, should it occur, it becomes an uncertainty.
Furthermore, scholars (see Sjöberg, 1998; Reisinger and Mavondo, 2005; Korstanje, 2009;
Larsen, Brun and Øgaard, 2009; Quintal, Lee and Soutar, 2010) have argued that one area of
confusion in the definition of perceived risk is the use of anxiety, fear, uncertainty, and worry
interchangeably, which result in some conceptual inconsistency. In trying to demystify the
relationship between the four concepts, Yang and Nair (2014) note that two paths of
relationships chains are triggered by fear and perceived risk, which are also induced by direct
stimuli. While risk perceptions are usually induced by an event often with a known
probability, fear, is however, induced by a direct stimulus from an object with an unknown
probability (Hofstede, 2001). Also, it is argued that whereas uncertainty relates to risk
perceptions, but with an unknown probability of occurrence (Quintal, Lee and Soutar, 2010),
similarly, anxiety relates to fear but with no direct stimulus from an object. In other words,
anxiety may develop from an individual’s own fantasy or imagination (Koranje, 2009). On
the other hand, Larsen, Brun and Øgaard (2009) maintain that worry becomes a cognitive
70

product and response to uncertainty and anxiety. Expressed simply, worry is an accumulation
of negative cognitive response about an uncertain future or outcome of an event. However,
from a different observation, Peters et al. (2006) note that worry as cognitive response could
be positive, in a sense that people become conscious of the likely undesirable outcome(s) and
might fashion out mechanisms to manage fear and risk. In their study, Larsen, Brun and
Øgaard (2009) observed a moderating relationship between worry and perceived risk,
suggesting that travellers might perceive a destination as a risky one, yet still, not worry
about travelling there. Peters et al. (2006) proposed that a more holistic approach to
understand the interrelationship among all concepts is required.
Past studies (e.g. Cunningham, 1967; Dowling, 1986; Cunningham, Gerlach and Harper,
2004; Kim, Qu and Kim, 2009) have shown that rational consumers as much expect to have
positive outcomes from their purchase decisions, which will either meet or outstrip their
expectations. Nonetheless, consumers’ expectation levels cannot be achieved if they
encounter negative outcomes – resulting in dissatisfaction (Cox and Rich, 1964; Stone and
Grønhaug, 1993). Therefore, Kim, Qu and Kim, (2009) postulate that since the consequences
of buying behaviours are not recognisable, consumers have a challenge in evaluating the
propensity of negative outcomes. On this account, Cunningham (1967) thought that
consumers react in a subjective way – to the amount of risk that they truly perceive.
Conceivably, this could possibly result in a risk perceptions gap, where an individual may
perceive more risk or less risk than it ought to be.
Certainly, the ‘perceived risk theory’ has gained much attention in academic research to
comprehend consumer purchasing behaviour in product and service purchasing. Generally,
Bauer (1960) is, credited as having pioneered and introduced the concept of perceived risk to
general consumer marketing literature. This theorisation was motivated by his realisation that
consumers’ behaviour (towards buying) involves some amount of risk – which they cannot,
with certainty, predict – which could be unpleasant to them (Cunningham, 1967; Taylor,
1974). So, to communicate this, perceived risk and uncertainty were used together in
explaining the consumer purchasing behaviour. To Bauer (ibid), consumers’ purchase
decisions involve risks in that consumers are confronted with unpredictable and uncertain
consequences of which some are displeasing. Following his classical theorisation, a rich
stream of research (see Cunningham, 1967; Rosilius, 1971; Jacoby and Kaplan, 1972; Taylor,
1974; Dowling, 1986; Roehl and Fesenmaier, 1992; Mitchell and Greatorex, 1993;
71

Featherman and Pavlou, 2003; Cunningham et al., 2005; Kim et al., 2013) has proposed
some common constructs of perceived risk in various consumer behaviour research such as
performance risk, financial/economic risk, social risk, psychological risk, time risk, physical
risk, privacy risk, and device risk/equipment risk etc. These facets are explained in detail in a
more relevant section of this chapter (Section 4.7).
It has been argued that common at the early stages of consumer purchasing process (such as
need recognition, search for alternatives, and actual purchase) are issues of consumers’ risk
perceptions (Bouwman et al., 2007; Kim, Qu and Kim, 2009). Observing this, Dowling
(1986) alluded that consumers concomitantly perceive risk as they realise the need to
purchase a product or service. A consumer will go ahead to acquire any product or service if
the risk perceived exceeds his/her risk acceptance threshold, but the individual has some
ways to reduce it (Roselius, 1971). Sjöberg (1980) note that risk reduction is related to the
anticipated severity of the outcome, should it occur.
Moreover, in line with theoretical models suggested in cognitive and emotional psychology
(see Forgas, 2003; Taylor-Gooby and Zinn, 2006), perceived risk could be adequately
conceptualised as an intricate process, which includes both cognitive and affective elements
(Miceli, Sotgiu and Settanni, 2008). To Slovic et al. (2004), the affective and emotional
elements may serve as prompts for probability judgements. This implies that when an
individual assesses the possibility of occurrence of a risky event or outcome, they either
depend on prior affective experience, current feelings or images that can be associated with
the event in question. Loewenstein et al. (2001) assert that ‘‘people react to the prospect of
risk at two levels: they evaluate the risk cognitively, and they react to it emotionally’’ (p.
280).
Mitchell and Greatorex (1993) also theorised that consumers may abort intended purchase
behaviour should their perceptions of risk fall below acceptable limits. An argument persists
that the subjective nature of risk perceptions means that under the same risk situation,
different individuals may perceive it differently, dictated by various factors (Bubeck et al.,
2012), supporting the notion that the concept of perceived risk should be measured from a
context-specific angle (Roehl and Fesenmaier, 1992; Kim, Qu and Kim, 2009). The following
sections examine how perceived risk relates to tourism and ICTs.
72

4.4 Tourism and perceived risk
Risk perceptions are axiomatic in tourism because tourism is largely a service – often
characterised by uncertainties – resulting in perceived risk. According to Liu and Gao (2008),
perceived risk refers to a tourist subjective assessment on the uncertainty of the results of
tourism activities. Likewise, Chen and Zhang (2012) think it is the intuitive and subjective
judgments of potential risks factors by tourists during the consumption process of a tourism
product.
Following Parasuraman, Zeithaml and Berry (1985), services are intangible, sold without
warranties, non-standardised, and usually purchased in advance of the experience –
whereupon evaluation. The very nature of services, inseparably, link tourism with risk. A
large body of knowledge has been published on the nexus between tourism and perceived risk
(Roehl and Fesenmaier, 1992; Sönmez and Graefe, 1998a; Pizam, 1999; Dickson and
Dolnicar, 2004; Reisinger and Mavondo, 2005; Reichel, Fuchs and Uriely, 2009; Pennington-
Gay and Schroeder, 2013; Williams and Baláž, 2013, 2015; Adam, 2015; Otoo and Kim,
2018).
It is, also argued that the subject of risk and perceived risk has witnessed an unprecedented
attention/research in the tourism discipline following the surge in terrorism and natural
disasters (McCartney, 2008). The 9/11 attack on the US in 2001, and the current terrorism
onslaughts across the globe, raise security concerns among potential travellers. Other major
plagues (e.g. the Severe Acute Respiratory Syndrome (SARS) and Ebola outbreaks) have
negatively affected the tourism trade. These incidences can result in a slump in arrivals and
revenue generation globally (Sönmez and Graefe, 1998b; Shin, 2005). This, arguably, falls in
line the assertion that tourists tend to shun places with higher likelihoods of risk while less
risky ones, rather, endear to them (see Sönmez and Graefe, 1998a; Sönmez, Apostolopoulos
and Tarlow, 1999; Lepp and Gibson, 2003; Law, 2006; Boakye, 2010). This also extends to
affirm Maslow’s (1943) classical theoretical point that safety is a basic need for all human
beings. For these reasons, Yüksel and Yüksel (2007) contend that it is crucial to investigate
tourists’ perceived risk because of its likely impact on their present and future holiday
decision-making. That being so, marketers, first need to identify the risk perceived by their
customers and then, evolve an amalgam of risk resolution strategies, suited for such specific
risks (Roselius, 1971). But, there exists the argument also that this can be dynamic as with
73

time perceptions of risk may change hence willingness to take risk may decline after an
event, but eventually return to pre-event level (Williams and Baláž, 2013).
That notwithstanding, the consequential effect of perceived risk on service products has
turned the spot light of academic scholarship on it than real or actual risk in travel – as it is
virtually next to impossible to find an actual risk scale or range of risk (Bentley et al., 2001).
Hence, past studies (e.g. Reisinger and Mavondo, 2005) show that tourists are more
concerned about risk regarding themselves or those they can capably perceive (Quintal, Lee
and Soutar, 2010). Therefore, the plethora of studies on the connexion between tourism and
perceived risk is but an amplification of the importance of perceived risk in the industry.
However, perceived risk has often received negative connotations, and hence conceptualised
as such in the tourism literature. Yet, it is also seen by some authors as a positive ‘resource’
that serves to motivate tourists to engage in an activity (Cohen, 1972; Plog, 1974; Mura,
2010; Mura and Cohen, 2011; Williams and Baláž, 2013). Hence, the subject of perceived
risk is conclusively subjective and could be constructed in different ways – positive or
negative.
Furthermore, it is affirmed unequivocally in previous research (see Rosilius, 1971; Dowling,
1986; Roehl and Fesenmaier, 1992; Mitchell and Greatorex, 1993) that service purchasing
comes with risk – as consumers cannot test them before purchasing unlike traditional
products. Therefore, previous research has alluded that the qualities of the hospitality and
tourism product, comprising intangibility, heterogeneity, inseparability, and perishability
(Mitchell and Greatorex, 1993), as well as the overall importance of holiday expenditure in
the total household budget, heightens risk concern (Roehl and Fesenmaier, 1992).
First, intangibility has, received unquestionably, copious attention related to purchasing the
tourism product (see McDougall and Snetsinger, 1990; Zeithaml and Bitner, 1996; Williams
and Baláž, 2014). The intangible quality of the tourism product precludes consumers from
assessing the service product before actual purchase and/or experience. This attribute
introduces uncertainty into the decision to purchase a tourism product or service (Yavas,
1987; Mitchell and Greatorex, 1993; Roehl and Fesenmaier, 1992). Therefore, post-purchase
evaluation of service becomes more imperative to customers – because of intangibility – as
experience is regarded as a consequential element in service evaluation (Murray and
Schlacter, 1990). Second, the possibility of receiving heterogeneous/varied services
74

engenders risk perceptions in the purchasing process (Mitchell and Greatorex, 1993).
Conceivably, standardised performance is key to achieving consistency in service delivery,
which cannot always be guaranteed in the service delivery process. While consumers might
be content with the service provided them at one point in time by a provider, they may be
dissatisfied in future when the same service is purchased from the same provider or elsewhere
(Kim, Qu and Kim, 2009). This is because of the human factor in the service delivery process
– whereby mood swings could affect the quality of the service offered. Third, for a successful
service production and delivery, travellers must take part in the service production process,
and personal interactions are crucial for satisfactory service delivery (Kim, Qu and Kim,
2009). The inseparability of production and consumption is one source of risk. The nature of
the service product requires a concurrent production and consumption of it, and the consumer
must pay for the service before experiencing it. This also intensifies concerns about risk
among consumers (Zeithaml, Parasuraman and Berry, 1985) because the success or otherwise
of the service encounter is a function of both the producer and consumer. Fourth, the tourism
product is perishable and cannot be inventoried for future use. The industry is mainly
characterised by fluctuation and/or seasonality in demand (Zeithaml, Parasuraman and Berry,
1985), which tends to make businesses uncertain about future occurrences and their
magnitude. Demand may take a nosedive at any time, which means loss for service providers.
According to Williams and Baláž (2015), though service businesses may give out such
uncertainties for certainty by way of hedging through insurance, risk is still a major concern
for operators in the industry. For the tourist, prices are often dictated by demand, and service
performance may drop below his/her expectation if overly demanded (Mitchell and
Greatorex, 1993). The perishable nature of the tourism product, not only increases perceived
risk among tourists, but also among the producers of the service. Therefore, the
aforementioned characteristics of the tourism product are said to form the basis for various
perceived risk dimensions in the tourism literature (Roehl and Fesenmaier, 1992; Williams
and Baláž, 2013).
It is evident in the literature that overall perception of risk is an aggregate of several
dimensions of risk perceptions in the travel decision-making process (Murrey, 1991),
informed by the theory of perceived risk. A study by Roehl and Fesenmaier (1992) was one
of the first conceptual extensions of the perceived risk theory to tourism. The study suggested
three (3) broad dimensions of risk (such as vacation risk, physical-equipment risk and
destination risk) that plague the travel decision-making process. These are further
75

decomposed into the following risk facets: satisfaction risk, financial risk, physical risk,
psychological risk, time risk, social risk, and equipment risk.
Roehl and Fesenmaier (ibid) reveal that tourists get worried about whether services (such as
accommodation, food and beverage, transportation, attractions, and events) will provide
satisfaction. Several factors may account for the discontentment with the service product.
Kim, Qu and Kim (2009) note that a hotel’s facilities may be undesirable to consumers or
employees could be hostile towards clientele, which could negatively affect satisfaction –
satisfaction risk. Mitchell et al. (1999) echoed that tourism services/products are expensive as
they can take a greater percentage of household spending. Yet tourists have no opportunity to
‘test-drive’ services before purchase – which makes it next to impossible to evaluate the
‘value-for-money’ bit of the service. The difficulty in doing this instigates concerns as to
whether the service purchased will not cause any financial loss. To Holloway (2004), the
absence of pre-trials before actual purchase of service products, as much, intensify financial
risk among consumers. It is not also rare for travellers to experience different pricing for
similar services or products – predicated on the time of the purchase, place or market
dynamics (Mitchell et al., 1999). That way, consumers find it difficult to evaluate the product
or service relative to its price – hence the apprehension about financial loss.
Physical hazards or injuries may result from personal travel decisions at destinations such as
illnesses or assaults (Fuchs and Reichel, 2006; Pennington-Gray and Schroeder, 2013).
Boakye (2010, p. 737) in his study on “tourists’ suitability as crime targets” observed that
tourists were victims of physical assault, as well as other crimes such as phone theft, fraud,
and verbal assaults. In parallel, other hazards such as vehicular accidents and the likes,
natural disasters, plagues, not to mention terrorism attacks (Tsaur, Tzeng and Wang, 1997;
Sönmez and Graefe, 1998ab) can prevent tourist from visiting affected destinations.
Psychological risk relates to the likelihood that the vacations will not mirror one’s personal-
image (Roehl and Fesenmaier, 1992). The likelihoods of the travel not meeting one’s
expectation(s) may instigate psychological concern(s). Time risk concerns the chance that the
travel to a destination will consume too much time or lead to some time loss (Roehl and
Fesenmaier, 1992). Time used may become a source concern for service consumers,
especially when they are dissatisfied with the service/product(s).
76

Social risk relates to the “possibility that the trip to the destination will affect other people’s
opinions about the traveller” (Roehl and Fesenmaier, 1992, p. 18). It has been observed that
related to travel product purchasing, is identity and social status, therefore, consumers would
like their decisions to fall in line with those of their peers or reference group (Mitchell et al.,
1999; Fuchs and Reichel, 2006). Therefore, the possibility of being ashamed for a wrong
choice or purchasing a poor service engenders social risk among travellers (Moutinho, 1987).
Equipment risk, which relates to the probability of equipment failure while on vacation or
organisational problems (Roehl and Fesenmaier, 1992; Pennington-Gray and Schroeder,
2013). Consumers may face equipment failure when making bookings over the web or using
machines such as cars, which could potentially breakdown – causing anxiety among
travellers. Roehl and Fesenmaier (1992) found that equipment risk featured as the highest
perceived risk dimension in comparison to other risk facets in the consumer decision-making
process.
In addition to this common typology of risks in the tourism literature, other risk concerns
have been spotted by tourism scholars. For instance, health/diseases (Sönmez and Graefe,
1998b; Pennington-Gray and Schroeder, 2013), terrorism (Sönmez and Graefe, 1998a; Pizam
and Mansfeld, 1996; Richter, 2003; Dolnicar, 2005), political crises (Dolnicar, 2005;
Pennington-Gray and Schroeder, 2013), natural disasters, food safety and service quality
(Fuchs and Reichel, 2006), socio-cultural barriers such as language (Reisinger and Mavondo,
2005), anxiety (Reisinger and Mavondo, 2005), stealth and catastrophic risk (Moreira, 2007)
and property theft, and fraud (Boakye, 2010) have been mentioned as travel-related risk.
In brief, tourism, is evidently affected by various risk factors, both endogenous (that is, the
service characteristics) and exogenous (natural disasters, wars and economic crises etc.) that
cause cognitive dissonance among consumers, thereby, leading to uncertainties and risk
perceptions. Lately, some academics have also turned attention to the subject perceived risk
among backpackers – a niche travel segment in the industry. The next section specifically
focuses on backpackers and perceived risk.
4.4.1 Understanding backpackers and perceived risk
The development of the literature on backpacking as a niche tourism segment, since the
1990s has evolved from issues of demographic profiling, motivations, ideology, lifestyle,
77

culture (Cohen, 2011) and so on, to debates around technology usage (Hannam and
Diekmann, 2010; Paris, 2012a) and perceived risk (Adam, 2015). This section considers the
relationship between backpacking and risk-taking tendencies by bringing under the spotlight,
the role of risk in such a travel style and how that is taking a new shape in the current
literature. It also examines the antecedents of their risk perceptions.
The literature on backpackers’ role and risk-taking propensity could be traced back to
Cohen’s (1972) typology, which consists of the dichotomy between institutionalised and non-
institutionalised tourist roles. Using Cohen’s categorisation of tourists’ roles regarding search
for familiarity or novelty, Lepp and Gibson (2003) relate higher perceived risk levels to
organised and individual mass tourists. They maintain that what could be a source of
concern/worry to a mainstreamer may be a source of pleasure/excitement to an explorer and
drifter – akin to a backpacker. This assertion gives credence to the works of Cohen (1972)
and Vogt (1976) that non-institutionalised tourists are adventure seekers. Likewise, a study
by Elsrud (2001) reveals that risk and adventure are fundamental to the creation of a
backpacker identity and experience. It could be inferred from the extant literature that
backpackers in their narratives, tend to use their purportedly adventurous outlook and
experiences to differentiate themselves from conventional tourists (Elsrud, 2001, Cohen,
2015). However, these arguments have been challenged by recent studies. Reichel, Fuchs and
Uriely (2009), Hunter-Jones, Jeffs and Smith (2008), and Adam (2015) have created the
attention that the distinction between backpacker tourism and institutionalised tourism has
become blurred in relation to not only travel characteristics but risk perceptions.
Reichel, Fuchs and Uriely (2007) in their research on perceived risk among Israeli ex-
backpackers concluded that perceived risk is a multidimensional concept, including site-
related physical, socio-psychological, expectation, socio-political and time risks. Similarly,
concerns about terrorism, political, health, environmental and financial risks have been
documented by Hunter-Jones, Jeffs and Smith (2008) and Adam (2015) among backpackers.
Studies have also emphasised that destination specific or context specific factors influence
tourists’ perceptions of risk. Pizam and Mansfeld (1996), Sönmez and Graefe (1998a) and
Fuchs and Reichel (2004, 2006) echoed that perceived risk is strongly associated with travel
destination choice. Reichel, Fuchs and Uriely (2009) further affirm this observation by noting
that different destinations impact backpackers perceived risk differently. The next section
examines the factors that influence backpackers risk perceptions.
78

4.4.1.1 Factors influencing backpackers perceived risk
Research has demonstrated that risk is not perceived in the same way by all travellers, this
may be informed by various factors, including socio-demographic factors (such as sex,
nationality and religion) and travel characteristics (such as group versus free independent
travellers and first-timers versus repeat visitors) (McIntosh et al., 1998; Reichel, Fuchs and
Uriely, 2007; Adam, 2015). Thus, the sections that follow discuss factors that influence
backpackers’ risk perceptions in the tourism literature.
4.4.1.1.1 Risk perception and gender
Perceived risk has been reported as having a strong relationship with backpackers’ gender.
Gibson and Jordan (1998a) reported that distinct from institutionalised tourists, female
drifters perceived the risk of terror as less frightening than male drifters. Likewise, Adam
(2015) also found that backpackers’ sex had an influence on their perceived risk as did
Reichel, Fuchs and Uriely (2007). Contrary to Gibson and Jordan (1998a), Adam (ibid) found
that female backpackers were far more likely to associate risk with Ghana than their male
counterparts while Reichel, Fuchs and Uriely (2007) discovered that whereas men were
concerned about socio-political, socio-psychological, behavioural and mass tourism risks,
female backpackers, however, were associated with site-related physical expectations,
physical harm and financial risk.
4.4.1.1.2 Risk perception and nationality/culture
Current studies on backpacker-risk relationship, show that culture plays a role in
backpackers’ risk perception of a destination. Adam (2015) in line with Seddighi, Nuttall and
Theocharous (2001), affirms that perception of risk differs in relation to the nationality of
backpackers. Stated differently, tourists of different nationalities (a proxy for culture)
perceive the same risk differently. For example, Verhage, Yava and Green (1990)
investigated the connection between perceived risk and brand loyalty using Dutch, Thai,
Saudi, and Turkish consumers as a case. The results of this study showed that risk perception
can be used to understand consumer behaviours in different cultures or nationalities. Equally,
the work of Reisinger and Mavondo (2006) reported material differences in perceived risk,
anxiety and safety across travel intentions amongst tourists from different nations.
Accordingly, tourists from Hong Kong, United States and Australia were found to be more
79

concerned about risk, felt more unsafe, and were loath to travel than tourists from UK,
Canada and Greece. Similarly, in terms of backpackers, Adam (2015) also discovered in his
study that North American and European backpackers were (0.6 and 0.5 times respectively)
more likely to perceive more risk than those of other origins.
4.4.1.1.3 Perceived risk and religion
Even though it requires more empirical exploration into, religion acts as a function of
perceived risk within tourists’ segments. Fuchs and Reichel (2004) established that tourists of
different religious sects have varying degrees of risk perceptions. This is affirmed in the
study by Adam (2015) who observed that apart from destination related crimes, such as theft,
robbery, larceny, verbal and physical assaults, other geopolitical crimes, such as terrorism,
have religious undertones, which could affect backpackers’ perceived risk.
4.4.1.1.4 Perceived risk and types of trips
The types of trips, whether group or individual, also have a connection with perceived risk.
According to Reichel, Fuchs and Uriely (2007), the type of trip engaged in has some effect on
perceived risk. The authors uncovered from their study that backpackers who travelled with
other people were associated with different risk dimensions in comparison to those who
travelled alone. While group travellers were linked with perceived risk of physical harm,
mass tourism, and expectations, individual travellers rather perceived site-related physical,
financial and socio-political risks and are comparatively risk-averse. Presumably, travelling
in the company of other travellers serves as a source of guardianship hence the low risk
perceived as opposed to travelling solo. Contrastingly, Adam (2015) in his study, finds no
relationship between perceived risk and types of trips.
4.4.1.1.5 Perceived risk and travel experience
On the effect of travel experience on perceived risk, studies demonstrate the impact of travel
experience on risk perceptions. To Gibson and Jordan (1998a), well-travelled tourists who
conform to the features of both organised mass tourists and the drifter roles perceived higher
risk in cultural barriers than their less experienced colleagues. However, for Lepp and Gibson
(2003), risk perceptions of inexperienced tourists were rather found to be higher than those of
their experienced counterparts. This finds support in the study by Reichel, Fuchs and Uriely
80

(2007) and Adam (2015) which note that travel experience has a material influence on
backpackers’ perceptions of risk. For example, it is established that first-time backpackers are
noted to perceive higher risk than those with travel experience because of lack of experience
(Adam, 2015).
In short, even though risk could serve as a motivator for travel (Elsrud, 2001), this section
shows clearly that backpackers do perceive risk, should it go above their risk tolerance level,
and that their perceptions are affected by various factors – from their background to travel
characteristics. Past researchers (Hunter-Jones, Jeffs and Smith, 2008; Adam, 2015) have
alluded that the effort to measure and distinguish perceived risk along tourist roles should be
understood in light of major developments that have surfaced in backpacker literature – the
increasing number of studies that have indicated that backpacking is becoming less dissimilar
to conventional tourism (Loker-Murphy and Pearce, 1995; Scheyvens, 2002; Uriely, Yonay
and Simchai, 2002). In response to calls (by Loker-Murphy and Pearce, 1995; Adam, 2015)
for further investigations into the risk-taking dynamics of this niche group, this study takes a
step into exploring how they perceive risk towards such technologies as mobile devices (that
is, smartphones) and their risk reduction strategies thereof. Empirically, the literature on
consumer risk states that consumers who perceive or experience risk (beyond containable
limits) either delay the consumption or develop strategies geared at reducing it to a tolerable
limit (Roselius, 1971; Mitchell and Greatorex, 1993; Mowen and Minor, 1998). The next
section hereafter discusses this assertion based on theory and empirical research.
4.5 Perceived risk and risk reduction strategies: Emphasis on ICTs
Inference from the Micro-Economic Theory suggests that an important concept in consumer
behaviour, is transparency – which assumes that consumers are usually knowledgeable about
the products they want to purchase and for that matter, can make rational choices to maximise
the utility therein contained (Derbaix, 1983; Jehle and Reny, 2011). However, in the real
world, this appears cosmetic as consumers are often at the mercy of insufficient information,
if not contradictory ones, particularly in services thereby making their choice processes
inescapably risky. This is even far more aggravated as consumers’ find it difficult to assess
the real or objective risk of the product or service. Instead, they interpret the information
privy to them in a subjective manner – creating risk perceptions that can potentially thwart
purchasing behaviour (Boholm, 1996). To neutralise this for the purchase to proceed,
81

consumers try to reduce risk (Mitchell and Greatorex, 1993) using various risk-relievers.
Marketers who are aware of such strategies are better placed in offering compatible supports
to reduce perceived risk (Roselius, 1971). This section presents and discusses some of the
risk reduction strategies used by service marketers as well as consumers in the literature.
4.5.1 Risk reduction strategies
Merely perceiving risk may not necessarily prevent a purchase decision or instigate the
search for alternatives to reduce risk, but rather, when risk exceeds the individual’s risk
tolerance threshold (Mitchell et al., 1999; Williams and Baláž, 2013). Thus, uncontainable
risk perceptions result in the adoption of risk reduction strategies by consumers to manage
their risk concerns. Research into risk reduction strategies, particularly in services is nearly, if
not as old as research into risk itself. This evidence is exemplified in the body of literature on
risk reduction strategies in the consumer behaviour literature (e.g. Cox, 1967; Roselius, 1971;
Derbaix, 1983; Dowling, 1986; Mitchell and Greatorex, 1993; Mitchell and Boustani, 1994;
Cases, 2002; Mitchell, Moutinho and Lewis, 2003). Risk reduction/handling strategies are
simply those measures that consumers seek in order to decrease their level of uncertainty or
potential dissatisfaction in a decision-making process (Mitchell et al., 1999). Also, known as
risk-reliever, Roselius (1971) explains a risk reduction strategy to mean any specific strategy
or action by a consumer to reduce the impact of an uncertainty in a decision-making process.
The subject of risk reduction strategies was commenced following studies that sought to
propagate the concept of perceived risk and its importance in the marketing circles thereby
identifying various facets of perceived risk as shown in Table 4.6 and Table 4.7. Evidently,
this has led to the introduction of a plethora of risk reduction strategies in the general
purchase situations but to a very limited extent in the information technology literature.
Following the consumer behaviour literature, research on risk reduction was initiated by Cox
(1967) who found two main ways by which consumers seek to reduce perceived risk: 1)
through searching for information about the products and 2) reliance on the experience of
other people – family and friends. According to Cox (ibid), either of these strategies is used
to increase the level of certainty in a purchase situation. If neither of them is present, people
tend to purchase the priciest product, delegate the purchase or search for an alternative
product with similar utility. The study also reported several risk-relievers, including: 1)
82

searching for more information on the product, 2) soliciting advice from acquaintance and
experts, 3) comparing prices from shop to shop or 4) reliance on word-of-mouth.
Roselius (1971), one of the unneglectable scholars in the field of consumer behaviour
research, reported on various kinds of risk-relievers. According to him, consumers often
encounter the dilemma of wanting to buy a product, and yet, cynical because the resolve to
doing so, may involve suffering some losses. Therefore, when a consumer perceives risk in a
purchase circumstance, different countermeasures may be employed to reduce the effect.
First, risk may be managed by reducing the probability of it manifesting or the severity of
loss. Second, the potential buyer may search for an alternative for which there is more
tolerance regarding the risks involved. Third, there may be the postponement of the purchase.
Fourth, the buyer may decide to carry out the purchase and wholly absorb the risk therein.
Another fascinating revelation from the study was that consumers use a set of risk-relieving
actions ranging from the most favoured to the least favoured ones. Thus, the specific
perceptions of risk are crucial in determining which risk-reliever to use at a given point in
time. In other words, different losses or risks evoke different ways of dealing with them. He
also notes that from a business perspective, sellers face a trade-off or zero-sum-game by
reposing confidence in their customers through warranty offers and achieving high sales
volume as a result (ibid). In this case, the supplier’s challenge lies in deciding which risk-
reliever will be effective in each perceived risk situation. This is because consumers may be
excited about some risk-relievers and yet unimpressed about others based on the specific
situation (Roselius, 1971). Any dearth of knowledge about this might, generally, result in
wasted efforts in offering ineffective risk-relievers, which either becomes a cost in the form
of time or energy (Roselius, 1971). Marketers need to first and foremost identify the range
risks perceived by customers and then evolve a mix of effectual strategies based those risks
and buyer type. Roselius (ibid) reports on 11 different types of risk-relievers based on 4
specific perceived risk dimensions: time loss, hazard loss, ego loss and money loss (see Table
4.6). Despite investigating these among a representative sample of 472 consumers – through
mailing, Roselius’ research was not based on a particular product or purchase medium hence
difficult to extrapolate or apply. Second, a distinction was not made between measures used
by consumers in the event of perceived risk and those used by suppliers to reassure their
clientele.
83

Table 4.6: Risk-relievers and operational definitions
No Reliever Definition
1 Endorsement Purchasing a product whose advert is supported by a high-
profile person - expert or celebrity.
2 Brand loyalty Purchasing a product that one has tried before and is content
with the experience.
3 Brand image Relying on the reputation of a brand by purchasing the very
well-known and acknowledged ones.
4 Store image Relying on the reputation or dependability of store when
buying a brand.
5 Free trials Making trials of free available samples before purchasing.
6 Money-back guarantee Purchasing products from stores that offer money-back
guarantees with the products sold.
7 Government testing Purchasing brands that have been tried and tested by an expert
government institution.
8 Shopping Comparing products to make informed choices by shopping
around.
9 Expansive model Patronising the priciest brands.
10 Private testing Purchasing brand whose quality has been authenticated by a
private firm.
11 Word-of-mouth Taking recommendations and/or advice from people you
know such as friends and family.
Source: Roselius (1971)
Therefore, Derbaix (1983) in dealing with the weaknesses of Roselius’ study, came out with
clusters of products (such as search goods, durable and non-durable experience products) and
analysed customers’ perceived risk and risk reduction strategies related to them. The author
showed that while some types of perceived risk ranked high in some product clusters, they
were low in others. Moreover, dwelling on the traditional risk-relievers (see Table 4.6), the
author realised that some risk-relievers were more useful in some situations than others. For
instance, it was noticed that relievers such as money-back guarantees and brand loyalty were
more useful in reducing financial and physical risk in durable and non-durable experience
goods respectively. Also, following Roselius (1971), Greatorex and Mitchell (1994)
introduced other risk-relievers, including: 1) reading around the product, 2) purchasing cheap
products, 3) taking advantage of special offers, and 4) seeking advice from sales persons.
84

Unfortunately, there has not been much research on risk reduction strategies in electronic
commerce, except for a few studies (e.g. Tan, 1999; Van den Poel and Leunis, 1999; Cases
2002) that have merely replicated the existing classical risk-relievers. Tan (1999), one of the
forerunners in this area realised that Internet shoppers use risk-relievers to boost their
confidence such as taking suggestions from peers, expert endorsement, buying products with
warranty and reliance on personal testimonials. Van den Poel and Leunis (1999), on the
WWW, reported a mix of risk-relievers, which were conspicuously no different from that of
previous studies (Roselius, 1971) such as money-back guarantee, well-known brands and
price reduction (cheap products). The authors assert that risk reduction strategies appear to be
unchanging irrespective of the consumers involved. Cases (2002), focussed on a single
product (a Jacket) online, found some other risk-relievers comprising the viewing of the
products, comparing products, making queries via chatrooms, and advertising. Cheng, Liu
and Wu (2013) attempted to establish the correlation between various facets of perceived risk
in online purchasing and risk reduction strategies. Interestingly, they found out that financial
risk was more associated with store image and money-back guarantee; performance risk –
brand loyalty, word-of-mouth, money-back guarantee, store image, and free samples; time
risk – shopping around and website reputation; and privacy risk - shopping around. However,
perceived social risk showed no relationship with all risk reduction strategies tested in the
study.
In the field of travel and tourism, some risk reduction strategies have been reported
(Miyazaki and Krishnamurthy, 2002; Hunter-Jones, Jeffs and Smith, 2007; Reichel, Uriely
and Fuchs, 2009; Kim, Qu and Kim, 2009; Fuchs and Reichel, 2011; Otoo and Kim, 2018).
Kim, Qu and Kim (2009) found a ‘symbol of security approval’ and others as shown in Table
4.7 as important risk-relievers in the context of online air ticket purchasing. However, the
authors failed to include ‘money-back guarantee’ as a risk reliever arguing that services are
often sold out without guarantees. In order of importance, the study also indicated that web
vendor reputation, brand reputation, symbol of security, word-of-mouth, and shopping around
the Internet were reported as risk-relievers. While shopping around the Internet was found to
be useful to purchasers than non-purchasers, recommendations from family and friends was
rather useful to non-purchasers than purchasers. This study was however, limited by its
inability to juxtapose risk reduction strategies with the specific risk factors identified.
85
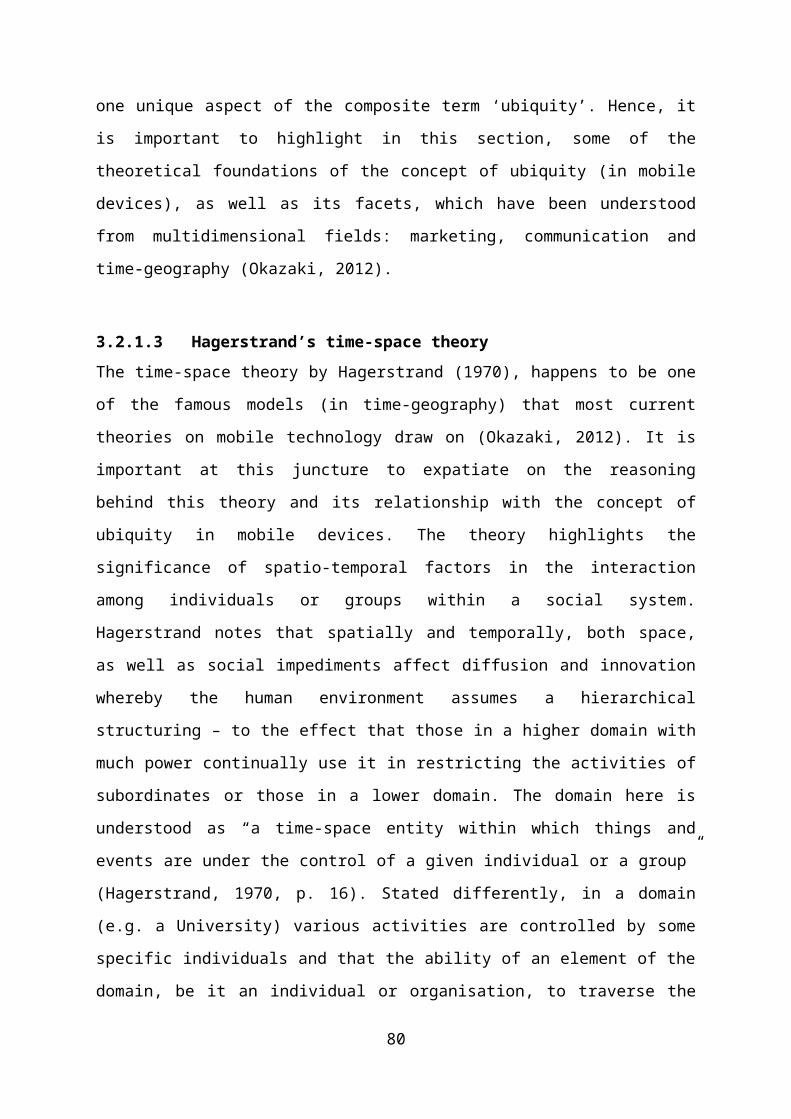
Table 4.7: A summary of risk reduction strategies in services
NoRisk reduction strategies
Greatorex & Mitchell
(1994)
Cases (2002)
Kim, Qu & Kim (2009)
Fuchs & Reichel (2011)
Adam (2015)
1 Symbol of security approval √2 Reading product information √ √ √ √
3 Experience with product √ √4 Well-known brands √ √5 Money-back guarantee √ √6 Word-of-mouth √ √ √7 Website reputation √ √8 Special offers √9 Cheapest brands √10 Using antivirus 11 Using complex passwords12 Using safe browsers 13 Travelling
in the company of friends√
14 Avoiding crowded areas √ √15 Using local tour guides √ √16 Planning an inexpensive trip √17 Planning a short trip √18 Searching for information over the
Internet √
19 Searching for information from friends and relatives
√
20 Recommendations from family and friends
√
Source: Author’s construct (2018)
There is also evidence that backpackers do employ some risk reduction strategies if the level
of risk perceived exceeds their risk tolerance threshold (Hunter-Jones Jeffs and Smith, 2008;
Reichel, Fuchs and Uriely, 2009; Adam, 2015). From a destination context, Reichel, Fuchs
and Uriely (2009) reported as risk-relievers: 1) the search for information in stores, 2) on the
Internet, and 3) from travel agents. Adam (2015) gleaned that travelling in the company of
friends, avoiding crowded areas, and using local tour guides are important risk relievers for
backpackers abroad. Perhaps, these relievers could also be useful in handling the destination-
physical risk of using mobile phones particularly, phone theft, if any. In fact, no study in
tourism, as yet, has focussed on personal risk reduction strategies in the use of mobile
technology – probably, explained by the very limited research on perceived risk around
mobile technology in this field. Therefore, based on the foregoing theoretical argument that
86

perceived risk instigates risk reduction strategy(ies), this research posits that backpackers
who perceive risk about using mobile technology during travel will use various risk-relievers
in the process.
Proposition: Backpackers’ who perceive risk towards their smartphone usage generate
personal risk reduction strategies against such risks (if uncontainable).
However, the accurateness in the measurement of perceive risk in tourism and by extension
backpacking, is yet another area of emerging of debate. The next subsection focuses on this
discourse.
4.6 Emerging debates on the measurement of risk perceptions in tourism
Suffice it to mention that the exponential increase in risk perceptions studies in tourism has
made academics (such as Reisinger and Mavondo, 2005; Korstanje, 2009; Quintal, Lee and
Soutar, 2010; Williams and Baláž, 2013; Yang and Nair, 2014) to question whether perceived
risk researchers really measure what they seek to measure, thus raising validity and/or
credibility concerns in such studies. While Korstanje (2009) and Williams and Baláž (2013)
see it as emanating from the cleavage in risk theories in the tourism discipline, often resulting
in a quite patchy comprehension of it, Korstanje (2011, p. 225) rather thinks that “risk was a
term coined in a quantitative-related paradigm, there is no room for qualitative studies in risk
perception theory”. For this reason, Reisinger and Mavondo’s (2005) definition of perceived
risk is one such example that has been critiqued. According to Reisinger and Mavondo
(2005), perceived risk is the cognitive probability of being susceptible to danger of any kind.
Hence, ‘cognitive probability’ here suggests that under the same outcome situation, people
may assess risk differently, often accompanied by different reactions to it. However, Yang
and Nair (2014) contend that there is a difference between ‘probability’ and ‘possibility’
albeit their interrelatedness. While the former concerns measurable chances of occurrence,
the latter relates to fantasy. The probability of a tourist becoming susceptible to crime in a
rural setting may be low, however, there exists the possibility. Yang and Nair’s (2014),
concern with Reisinger and Mavondo’s (2005) definition is that travellers may not realise risk
probabilities at a given point, but they may have a general view of risk possibility. For Yang
and Nair (2014), this raises a concern as to whether all tourists in a survey situation will know
the probability (available in a quantitative form) of becoming susceptible to risks hence
querying whether past research (e.g. Roehl and Fesenmaier, 1992; Lepp and Gibson, 2003;
87

Reisinger and Mavondo, 2006) in tourism really measured risk perceptions, perceived
uncertainty or both, and yet, christened it as perceived risk.
There is also a controversy as to what might be the best research approach for examining
perceived risk in tourism. Scholars (e.g. Roehl and Fesenmaier, 1992; Reisinger and
Mavondo, 2005; Reichel, Fuchs and Uriely, 2009; Pennington-Gray and Schroeder, 2013;
Adam, 2015) have looked at the objective side of perceived risk among tourists – which
involved the categorisation of perceived risk. Perhaps, this is because the concept of
perceived risk is indubitably rooted in a positivistic behavioural economics (Knight, 1921). In
the opinion of Yang and Nair (2014), though the categorisation of perceived risk by tourism
researchers has facilitated a significant understanding of it, elusive to them, is the intricate
and sophisticated nature of perceived risk as a social phenomenon. Therefore, parallel to the
thoughts of Douglas and Wildavsky (1982), Yang and Nair (2014) believe that the
complexity of tourism and perceived risk as a social phenomenon calls for a more subjective
understanding of perceived risk. To them, perceptions are more socially constructed and
shaped by individuals, and that risk perceptions persist even after threats are removed
(Williams and Baláž, 2015). Therefore, there has been the argument that a post-modernists
qualitative approach may significantly bring into the horizon the very factors that construct
and reconstruct perceived risk among tourists (Yang and Nair, 2014). Some scholars (see
Elsrud, 2001; Hunter-Jones, Jeffs and Smith, 2008; Seabra, et al., 2013) also explored
perceived risk from the constructionist point of view.
Besides, there has been a mounting confusion as to what point in time perceived risk should
be measured. Coming from a social psychology view point, Korstanji (2009) and Quintal,
Lee and Soutar (2010) got concerned about the operationalisation of perceived risk by
tourism scholars. To them, any attempt to study perceived risk prior to the actual vacation
experience, is merely an examination of anxiety as this would be bereft of direct stimuli.
Thus, the use of the term ‘anxiety’ may be a lot more appropriate since in such cases
respondents’ perceptions are based on personal imagination/fantasy about future holidays. To
Korstanji (2009), risk perception and fear are formed through the availability of direct
stimuli, thereby, advocating for the in-situ and ex post facto perceived risk investigations.
However, in assessing both pre-trip and ex post facto risk perceptions, Roehl and Fesenmaier
(1992) acknowledged the limitation of investigating perceived risk before and after vacation
experience – noting that while the former may result in respondents use of their general
88

vacation experience as templates to report their perceived risk (Folkes, 1988) – the latter may
lead to distortions in respondents’ responses with the passage of time. While some
researchers understand perceived risk as a pre-purchase uncertainty (Murrey, 1991), others
(e.g. Cox, 1967; Zeithaml and Bitner, 2003; Kim, Qu and Kim, 2009) also think that
measuring perceived risk during the post-purchasing stage may be meaningless hence
emphasise its measurement at the early stages of the consumer buying or decision-making
process. But, in the thoughts of Mitchell (1992, p. 30), “perceived risk influences every stage
of the consumer decision-making process and the challenge is for marketers to use this
knowledge to gain a competitive advantage.”
Considering the debates on perceived risk, both within the general risk literature and tourism,
as well as the juxtaposition of strengths and weaknesses, first, this study simply defines
perceived risk as the cognitive probability of loss from the use of mobile devices (i.e.
smartphone). Second, this thesis measures perceived risk instead of uncertainties – under the
presumption that backpackers are aware or knowledgeable about the risk (both consequences
and probability of outcomes) of using mobile technology, more so, within unfamiliar
locations. Third, the study also takes a cue from the problems/limitations of adopting a pre-
travel and/or ex post facto perceived risk evaluation, and adopts an ‘in-situ’ measurement of
it, that is, at the destination (Fuchs and Reichel, 2006). This approach permits an encounter
with some direct stimuli (Korstanji, 2009), and likely to avoid the so-called ex post facto
distortions or what would be rather post-experience evaluations, instead of perceived risk. In
a study of its impact on services, Cunningham, Gerlach and Harper (2005) contend that
perceived risk premium plays a pivotal role during the actual purchase of the service.
Stimulated by this argument, it is argued in this study that backpackers’ perceptions of risk
towards mobile technology usage is most likely to be induced during the experiential stage of
their travel. Finally, recognising the weaknesses of the two main traditions of social sciences
research (positivist and interpretivist paradigms), this study assumes a ‘middle-of-the-road’
position – the pragmatic approach, but with a more positivistic leaning. In the words of
Mitchell (1999, p. 165), “unlike many subjects, which divide researchers along the lines of
how they view the world, perceived risk encourages a convergence of these divergent views.”
This is broached further under the methodology chapter of this thesis. Having navigated the
concept of perceived risk in the broader tourism literature and specifically, among
backpackers, the next section is on ICTs and perceived risk.
89

4.7 ICTs and perceived risk
This section draws a link between ICTs and perceived risk – by relying more on general e-
services and mobile technology literature in terms of developing the conceptual model and
research constructs. Even though, a body of literature exists on the nexus between perceived
risk and ICTs in the tourism literature, the key theoretical bases have often been grounded in
the e-service literature. And for studies that look at perceived risk in relation to general travel
activities at the destination level as discussed heretofore (Sections 4.4 and 4.4.1), the risk
constructs in such studies will not be completely useful within the framing of the proposed
conceptual model in this study – which is about mobile technology risk perception. This is
because perceived risk must be situation specific (Pope et al., 1999; Park and Tussyadiah,
2016), for example, relative to the smartphone. Moreover, not only does the tourism and
backpacker specific literature generally appear to lack evidence about the nexus between
mobile technology and risk perceptions and its possible antecedents and outcomes but also,
some of the existing perceived risk constructs (e.g. health risk, political risk, satisfaction risk,
expectation risk and equipment risk, economic risk, environmental risk and personal risk etc)
therein cannot easily be operationalised within the context of mobile technology risk yet.
Therefore, following Lee et al. (2003) and Park and Tussyadiah (2016) who recommended
the relevance of Jacoby and Kaplan’s (1972) risk dimensions (e.g. financial, performance,
physical, psychological and social risk) in mobile service risk evaluation, this thesis frames
the proposed conceptual model (Figure 6) by adapting major theoretical constructs from the
e-service and mobile technology literature and making synthesis between that and the tourists
and backpacker literatures where applicable/possible. Therefore, the ensuing conjectural
statements in this thesis have been developed based on theoretical arguments in the e-service
and mobile technology literatures as the tourism literature appears generally limited when it
comes to the theoretical foundations.
As with the general consumer behaviour context, perceived risk is considered one of the
inhibitors that make consumers loath about carrying out purchasing decisions, especially on
electronic service platforms (Cunningham, Gerlach and Harper, 2005). For instance, within
the travel and tourism literature, perceived risk has been found as an important element in the
tourist decision-making process which could cause the avoidance of a destination or tourism
product or the consideration of safer alternatives (Sönmez and Graefe, 1998ab; Roehl and
Fesenmaier, 1992; Lepp and Gibson, 2003; Reisinger and Mavondo, 2006). Featherman and
Pavlou (2003) are regarded as the forerunners who extended the theory of perceived risk to
90
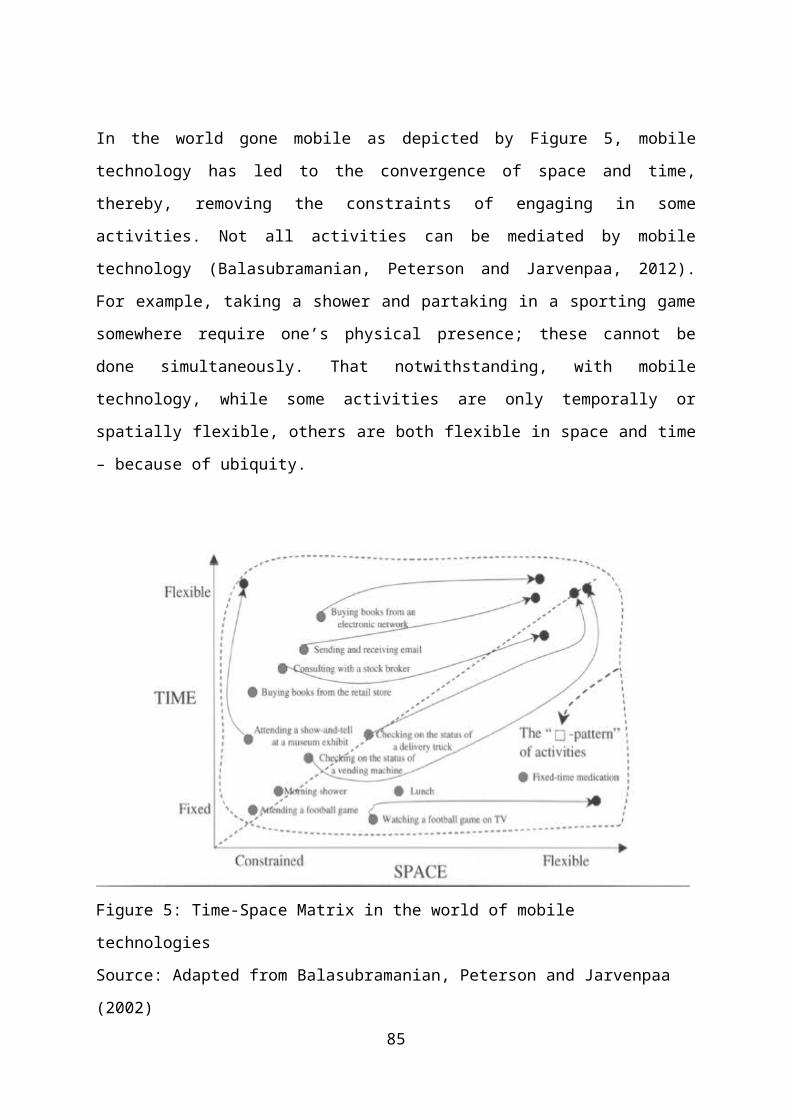
the ICT domain as did Roehl and Fesenmaier (1992) relative to travel and tourism. To
Featherman and Pavlou (2003), perceived risk reflects in Information Systems (IS) through
diffusion and adoption when the decision to adopt or use an IS either generates a feeling of
uncertainty (Dowling and Staelin, 1994), anxiety and/or discomfort (Taylor, 1974) or
cognitive dissonance (Germunden, 1985). Therefore, in the context of e-services, Featherman
and Pavlou (2003) note that electronic commerce diffusion and adoption decision is quite
convoluted, as there is an initiation of a long-term relationship between service providers and
clientele.
Table 4.8: Description of traditional risk facets in consumer marketing
Risk Definition Authorship
Financial risk The possible expenditure related to the original purchase price and the consequent maintenance cost of the product or service and the likely financial loss from fraud.
Cunningham (1967); Grewal, Gotlieb and Marmorstein (1994)
Performance risk
The likelihoods of the product malfunctioning or not performing as its design suggests or as advertised, thus failing to offer the required benefits. In other words, the risk that a purchased product will not satisfy consumers’ expectations.
Cunningham (1967); Jacoby and Kaplan (1972)
Psychological risk
The risk that product performance will adversely affect one’s peace of mind and/or self-image.
Cunningham (1967); Roselius (1971); Jacoby and Kaplan (1972)
Social risk The possibility of losing one’s social status or being viewed as unfortunate (by a peer group), the purchase decision made by an individual.
Cunningham (1967); Jacoby and Kaplan (1972)
Time risk The risk of time loss due to searching for information on the product, learning to use the product or making a bad purchase decision or having to replace a poor product/service purchased.
Cunningham (1967); Roselius (1971)
Privacy risk The possible loss of personal information from it being used without one’s consent or it being used to perpetuate fraud against an unsuspecting consumer.
Featherman and Pavlou (2003)
Overall risk “A general measure of perceived risk when all criteria are evaluated together”
Featherman and Pavlou (2003, p. 455)
Source: Author’s construct (2018)
91

This evokes risk concerns among clients as they ponder going into a remote business
relationship with faceless electronic service providers. Therefore, the authors, drawing on the
theory of perceived risk by Bauer (1960) proposed seven (7) facets of risk that affect the
adoption of e-services (including performance, financial, time, psychological, social, privacy,
as well as overall risk). See summary as shown in Table 4.8.
Interestingly, Featherman and Pavlou (2003) found that all perceived risk facets except social
risk had strong positive correlations with risk in e-services adoption. However, a study by
Crespo, del Bosque and de los Salmones (2009) indicates that all the above risks facets
(except overall risk, which was not included in the model) accounted for a significant amount
of the variance in perceived risk regarding Internet shopping. In another study, Cunningham,
Gerlach and Harper (2005) realised that financial and performance risks were about the two
most crucial factors that influenced overall risk perception in e-services. Noteworthy is the
extension of this original model to include other risk facets such as security risk, physical risk
and device/equipment risk to explain perceived risk in the same domain.
For instance, security risk, the risk of losing money in cash or via credit card, has a
significant influence on perceived risk in Internet services (Gerrard and Cunningham, 2003;
Lee, 2009; Aldás-Manzano et al., 2009). Contrarily, Kim, Kim and Leong (2005) also found
Internet security risk as not having any significant influence on the risk of purchasing airline
tickets online. Notably, Featherman and Pavlou (ibid) argued against the introduction of
physical risk (health risk regarding the use of an e-service) by asserting that e-services do not
have any negative consequences on human health or life. Yet, a more recent study (Park and
Tussyadiah, 2016) indicates otherwise in mobile travel bookings. Also included in the model
is device risk – the possible loss caused by unreliable mobile technology (Kim et al., 2013).
The tourism literature has identified similar risk facets as discussed above including financial,
time, social, physical, psychological and performance risks. However, the operationalisations
of these risk facets here are a bit distinct from those rooted in e-service. Reichel, Fuchs and
Uriely (2007) in their research on perceived risk among Israeli ex-backpackers concluded that
backpackers’ risk perceptions include site-related physical, socio-psychological, expectation,
socio-political and time risks. Similarly, concerns about terrorism, political, health,
environmental and financial risks have been documented by Hunter-Jones, Jeffs and Smith
(2008) and Adam (2015) among backpackers. Furthermore, within the general tourism
92

literature, Roehl and Fesenmaier (1992) suggested three (3) broad dimensions of risk (such as
vacation risk, physical-equipment risk and destination risk) that affect travel decision-making
process. These are further decomposed into the following risk facets: satisfaction risk,
financial risk, physical risk, psychological risk, time risk, social risk, and equipment risk.
Financial risk in the travel context is the possibility that a vacation will not provide value for
money spent (Roehl and Fesenmaier, 1992). In other words, it is the likelihood that the
purchase of a travel product or service costs more than the expected price (Zhang, 2012).
Time is the possibility that a vacation will not be a waste of time or the likelihood of
excessively consuming time when tourists consume tourism products (Roehl and Fesenmaier,
1992; Hu, 2011). Social risk is the possibility that the choice of a tourism product is not
recognised by others (Liu and Gao, 2008) or that a vacation will affect others’ opinion about
another (Roehl and Fesenmaier, 1992). Physical risk is the possibility of physical danger,
injury or sickness while on a vacation (Tsaur, Tzeng and Wang, 1997; Sonmez and Graefe,
1998; Sonmez, Apostolopoulos and Tarlow, 1999). Psychological risk is the possibility that a
travel to a destination will not reflect one’s personality or self-image (Roehl and Fesenmaier,
1992; Hu, 2011). Performance risk is the risk caused by a poor quality of a tourism product or
service not meeting a tourist expectation (Hu, 2011; Zhang, 2012). Even though, these
operational definitions cannot be applied straightaway to this study, constructs and items will
be synthesised with that of the e-service literature (See Table 4.8) within the framing of this
thesis, where applicable (see Table 4.9).
Thus far, it is evident that perceived risk may vary from one product group to the other (Pope
et al., 1999). In other words, perceived risk is context specific suggesting that different types
of risk perceptions would be formed based on a specific situational encounter of a person
(Conchar et al., 2004). While physical risk may be associated more with food purchasing,
financial risk may relate more to the purchasing of a hotel room (Mitchell and Greatorex,
1993). Research has shown that despite the exponential growth in mobile devices (such as
smartphones) as major ICTs, and their perceived usefulness, many are still unenthusiastic
about fully utilising or adopting some of the functions of such emerging devices (Crespo, del
Bosque and de los Salmones, 2009; Luo et al., 2010) especially for travel (Park and
Tussyadiah, 2016) for many reasons. Kim et al. (2013) reason that consumers could face
possible difficulties with the failure of a technology such as low batteries, unpermitted access
to a device, and other interruptions. Yang and Zhang (2009) think that there is a vast
dichotomy between purchasing travel products via mobile phones and from traditional
93

‘bricks-and-mortar’ outlets, and web-based shopping – owing to the features of mobile
phones: location and time aware systems, hidden and unconscious processing, smaller
screens and immediacy. Furthermore, a large body of literature shows that mobile phone
users unlike PCs are more vulnerable to various kinds of threats/attacks: malware, spyware,
botnets, sniffing, drive-by-downloads, automatic data transmission and device theft (see
Milligan and Hutchenson, 2007; Markeji and Bernik, 2015).
Consumers using their smartphones as a medium of transaction or for searching for
information or networking, in the process, release sensitive private information over the
Internet (wittingly or unwittingly) wherein they cannot guarantee the protection of their data
and privacy (Crespo, del Bosque and de los Salmones, 2009). These may raise concerns of
some sort to users – leading to perceived risk about using the technology. Thus far, it is
unequivocal that past researchers have been exclusively interested in understanding perceived
risk concerning just information technology in tourism overlooking the context within which
the technology is used and its impact on risk perceptions. A body of literature (see
Pasquinucci, 2009; Khan, Abass and Al-Muhtadi, 2015) also exists on how one’s location on
the globe could predispose him/her to certain risk factors regarding the use of mobile phones.
The following subsection, thus offers a detail justification for proposing to integrate
technology and destination related risks to understand perceived risk related to the use of
smartphone in this thesis.
4.7.1 Theoretical basis to combine information technology (device) risks with destination related risks in this study
Research on perceived risk in tourism has been polarised along technology and destination
related risk issues – without any effort to understand the interdependencies between these
two. Crucial to this study, therefore, is the quest to understand how destination related risks in
conjunction with information technology risks influence backpackers’ risk perceptions
regarding smartphone usage. A plethora of studies (e.g. Roehl and Fesenmaier, 1992; Tsaur,
Tzeng and Wang, 1997; Sönmez and Graefe, 1998a; Dickson and Dolnicar, 2004; Dolnicar,
2005; Reisinger and Mavando, 2006; Reichel, Fuchs and Uriely, 2007; Fuchs and Reichel,
2011; Adam, 2015) in travel and tourism have shown the need to understand consumers’ risk
concerns. Most of these studies have been focussing on risk concerns such as
equipment/functional, financial, health, terrorism, physical, political, psychological, social,
time, satisfaction, expectation, environmental and property risks (see Section 4.4). Several
94

suggestions and implications have been suggested in the extant literature on how various
stakeholders at the destination could manage such risk concerns (Section 4.5.1).
Regarding ICTs, past studies (see Forsythe and Shi, 2003; Kim, Kim and Leong, 2005;
Cunningham, Gerlach and Harper, 2005; Crespo, del Bosque and de los Salmones, 2009;
Kim, Qu and Kim, 2009; Luo et al., 2010; Kim, Chung and Lee, 2011; Park and Tussyadiah,
2016) have been solely examining perceived risk related to information technology in travel
and tourism – disregarding destination related risks. Forsythe and Shi (2003) and Kim, Kim
and Leong (2005) considered perceived risk in relation to purchasing airline tickets online. In
parallel, a more recent study by Park and Tussyadiah (2016) also concentrated on mobile-
related risk perceptions concerning mobile travel booking. However, factors reflecting the
contexts (such as the destination) within which smartphones are used also instigate different
kinds of perceived risk among travelers – that also need to be understood.
Studies in the field of computer science (see Choi and Lee, 2003; Pasquinucci, 2009; Luo et
al., 2010; Khan, Abass and Al-Muhtadi, 2015) demonstrate that the unreliability (or
unavailability) of the technology infrastructure such as open wireless technology and slow
download speeds, pose different kinds of perceived risk to users. Besides, as tourism
consumption happens within a destination (corporeally or virtually), the performance of the
Internet infrastructure could have an impact on the experiences of mobile device users, which
needs to be explored. This argument finds support in the work of Khan, Abass and Al-
Muhtadi (2015) on mobile user’s data privacy threats. They (ibid) argue that at any location,
be it travelling in different countries, hotels, museums, road, or any place in the world, users
of mobile phones can achieve their daily needs. Yet, “this extreme level of comfort has
brought with it an extreme number of risks” some of which are clearly location-based ( ibid,
p. 377). Vanola (2013) also notes that facilitated by information systems, tourism destinations
can tap into mobile users’ activities that may be highly personal, including their exact
location which could threaten their privacy. Hence, the evaluation of Intelligent Systems in
tourism is required to assess not only their capacity to help people during travel but also
potential harm to users (Vanola, 2013). Since smartphones cannot fully function without the
supporting technology infrastructure at the destination such as the Internet (Choi and Lee,
2003; Stienmetz, Levy and Boo, 2012) which is often associated with a location, this study
argues that infrastructure risk concerns (regarding mobile phone usage) could impact
adversely on user experiences thence risk perceptions.
95

Furthermore, past studies (e.g. Milligan and Hutchenson, 2007; Markeji and Bernik, 2015;
Khan, Abass and Al-Muhtadi, 2015) report that mobile users face the risk of losing their
mobile devices (through mobile theft) due to their portable nature. On risk associated with
various locations, Khan, Abass and Al-Muhtadi (2015, p. 377) assert that “physically
securing a mobile device is difficult, but when a mobile user is constantly using their mobile
device (24×7×365) and it is lost, then the task becomes seemingly impossible”. They further
maintain that physical risk is but one of the most salient risks for mobile users. A lost device
can lead to loss of sensitive or classified information/data (e.g. business data, unsecured
documents, personal information and credit card details), which may be used in ways that
will put the owner at risk, for example, losing money. Arguably, the risk of having one’s
phone stolen or snatched could result in security or privacy related risk issues, if data is
compromised. This also generates another form of perceived risk that needs to be
comprehended together with those discussed earlier in this Chapter. Thus, it is as important to
consider destination related physical risk in a bit to comprehend perceived risk related to
smartphone usage among backpackers, especially in Ghana (see Section 1.1.2). Yet, no
research has considered the connection between destination-physical risk and perceived risk
regarding the use of mobile devices.
The discussions above offer a strong theoretical basis to try and understand risk perceptions
regarding smartphone usage by not only concentrating on information technology risks of
using the device as have been done by previous researchers (e.g. Cunningham, Gerlach and
Harper, 2005; Kim, Qu and Kim, 2009; Luo et al., 2010; Kim, Chung and Lee, 2011) but also
those risks instigated by a specific location (or destination) such as infrastructure related and
physical risks. This thesis conjectures that situational factors, including: 1) mobile
infrastructure risk and 2) destination-physical risk also affect mobile users’ perceived risk.
Following previous scholarly works that suggest the importance of Jacoby and Kaplan’s
(1972) risk dimensions in mobile services research (Lee et al., 2003; Park and Tussyadiah,
2016), the study proposes that perceived risk towards smartphone usage is a third-order
hierarchical latent construct comprising destination related risks (indicated by infrastructure
risk and destination-physical risk) and information technology risks (indicated by financial,
performance, social, time, psychological, and security) as shown in Table 4.9. This is
discussed subsequently in further detail in Section 7.1.3.2.
96

Table 4.9: Dimensions of perceived risk adapted to the context of smartphones
Facts of perceived risk
Definition/Description
1 Financial risk The probability of unexpected financial loss resulting from the use of a smartphone such as a mobile Internet fee during travel (Roehl and Fesenmaier, 1992; Featherman and Pavlou, 2003; Kim, Kim and Leong, 2005; Kim et al., 2013).
2 Performance risk The probability of disappointment emanating from poor smartphone services/application quality during travel (Jacoby and Kaplan, 1974; Cunningham, Gerlach and Harper, 2005; Zhang, 2012).
3 Time risk The possibility of a smartphone user losing, or wasting, time due navigation challenges during travel (Featherman and Pavlou, 2003; Cunningham, Gerlach and Harper, 2005; Hu, 2011).
4 Psychological risk
The probability that using a smartphone can negatively affect user’s peace of mind and self-image – resulting in frustration and stress during travel (Roehl and Fesenmaier, 1992; Mitchell, 1992; Featherman and Pavlou, 2003; Cunningham, Gerlach and Harper, 2005).
5 Social risk The probability that using a smartphone service will make one look untrendy or foolish before peers or reference groups during travel (Roehl and Fesenmaier, 1992; Featherman and Pavlou, 2003; Cunningham, Gerlach and Harper, 2005; Yang and Zhang, 2009).
6 Security risk The probability of a smartphone user getting their credit card information compromised due to the use of a smartphone resulting in money loss or fraud through travel (Kim, Kim and Leong, 2005; Hanafizadeh and Khedmatgozar, 2012).
7 Destination-physical risk
The likelihoods of losing one’s phone or of one being attacked for possessing it during travel (Tsaur, Tzeng and Wang, 1997; Sonmez and Graefe, 1998; Lee, 2009; Markelj and Bernik, 2015; Khan, Abass and Al-Muhtadi, 2015).
8 Destination-infrastructure risk
The risk associated with the malfunctioning of Internet infrastructure or exposure to fraud/cybercrime through travel (Pasquinucci, 2009; Roehl and Fesenmaier, 1992; Markelj and Bernik, 2015; Khan, Abass and Al-Muhtadi, 2015).
Source: Author’s construct (2018)
Understanding how users of mobile devices perceive risk about the technology infrastructure
of a given destination could be relevant to destination marketers and service managers and by
extension, governments, especially in Sub-Saharan Africa. For instance, being aware of the
extent to which destination related factors contribute to risk perceptions regarding the use of a
97

smartphone can result in appropriate measures to curb the situation, if indeed, it becomes a
matter of concern to users. The conceptual model and associated hypotheses for the thesis are
presented in the next section.
4.8 Conceptual model and proposed hypotheses
Motivated by Featherman and Pavlou (2003) who developed a comprehensive perceived risk
model based on Jacoby and Kaplan’s (1972), as well as Milligan and Hutchenson (2007) and
Khan, Abass and Al-Muhtadi (2015) who considered destination related risk issues in the use
of information technology, this study extends the original model on perceived risk to capture
both information technology risks and destination related risk concerns. These risk facets are
adapted to the context of smartphones as shown in Table 4.9. The current study proposes that
backpackers’ perceived risk vis-à-vis smartphone usage is multidimensional.
H1: Perceived risk towards smartphone usage comprises information technology risks and
destination related risks – indicated by financial, performance, social, time, psychological,
security, destination-physical, and destination-infrastructure risks.
4.8.1 Antecedents and outcomes of perceived risk: Emphasis on ICTs
Past studies (see Dowling and Staelin, 1994; Conchar et al., 2004; Kuhlmeier and Knight,
2005) have pointed the academe and industry in the direction of various factors that influence
perceived risk within the general literature on product consumption and ICT (Dowling, 1986;
Mitchell, 1999; Lim, 2003; Crespo, del Bosque and de los Salmones, 2009; Luo et al., 2010;
Chen, 2013). Perceived risk is an intricate and a dynamic subject, which may either stem
from the consumer, a product, purchasing context (Dowling, 1986; Mitchell, 1999; Conchar
et al., 2004), the underlying technology (Park and Tussyadiah, 2016) or culture (Douglas,
1978; Sjöberg, 1997). For this research, the influence of innovation, observability, trust in
their smartphones and familiarity on perceived risk are investigated. Suffice it to
acknowledge that there are several other antecedents in the literature other than the ones
outlined, however, this study focussed on the said ones because: 1) they are being tested
within a niche tourist segment – with quite distinct characteristics from mainstreamers and
may produce some interesting off-piste findings and 2) with smartphones in context, it is
hoped that the results on these variables will offer more useful insights, not only to service
98

marketers who are in the business of providing services to backpackers, but mobile marketers
and suppliers in general.
4.8.1.1 Familiarity
Familiarly with a smartphone relates to the extent to which a user is conversant with the
functions and uses of the device, which may include either 1) searching for information or, 2)
transacting business with it (Kim, Ferrin and Reo, 2008). Some researchers have reported that
familiarity does have an impact on perceived risk regarding ICTs such as mobile technology.
It has been found that familiarity reduces not only customers’ risk perceptions, or uncertainty
but the interface complexity of a technology (Luhmann, 1979; Gefen, 2000). For instance,
familiarity with a smartphone will reduce the complexity and uncertainty through
understanding how to search for information and carry out a range of activities with it (Gefen,
2000). Therefore, the study conjectures that one’s familiarity with a smartphone reduces the
risk they would perceive about it.
H2: Familiarity has a negative influence on backpackers’ perceived risk related to using
smartphones.
4.8.1.2 Observability
Rogers (1995) theorised five factors inherent in innovation that can influence the attitudes of
potential users, including relative advantage, compatibility, complexity, trialability and
observability. Relative advantage defines the extent to which the innovation is better than
others; compatibility relates to the extent to which the innovation reflects personal values and
experiences of would-be-users; complexity is the degree to which the innovation is
cumbersome to use or comprehend; trialability is the extent to which the innovation can be
tried on a limited basis, while observability or visibility is “the degree to which the results of
the innovation are visible to others” (Rogers, 1995 p. 16). In the context of this research, it
refers to the extent to which smartphone travel services are visible to others during travel
(Park and Tussyadiah, 2016). Vishwanath and Goldhaber (2003) think that the exposure of an
innovation is enhanced by its visibility that engenders discussion on it by a social group –
which ultimately leads to the speedy diffusion of the innovation – through communication.
Previous studies (e.g. Moore and Benbasat, 1991; Vishwanath and Goldhaber, 2003; Aloudat
et al., 2014; Park and Tussyadiah, 2016) in the domain of information communication has
99
shown the impact of visibility on perceived risk of using ICT services. Moreover, Moore and
Benbasat (1991) produced a construct: ‘result demonstrability’, which refers to
communicability and observability of innovation, therefore, the more visible and
communicable the innovation, the more likely it is to reduce uncertainties among non-
adopters. Park and Tussyadiah (2016) supported that perceived risk reduces as the visibility
of technology increases. Therefore, it is suggested in this study that smartphone visibility (i.e.
the observability of applications and consequences) reduces perceived risk related to the
device among backpackers.
H3: Smartphone observability has a negative relationship with perceived risk towards using
the device.
4.8.1.3 Innovation
Innovativeness is a concept that has attracted a lot of attention among scholars as an
important variable in new products adoption (Midgley and Dowling, 1978; Hirschman,
1980). Midgley and Dowling (1978) term innate innovativeness as an individual’s degree of
receptiveness of novel ideas and willingness to take personal initiatives independent of the
experience of other people. Expressed simply, it is the extent to which people are ready to
accept/adopt or experience new products (Aldás-Manzano et al., 2009). Hence, it could be
argued that the concept relates to one’s risk-taking tendencies. In the literature, a distinction
has been made between general and specific innovation. While general innovation refers to
the openness and readiness of an individual to explore new experiences and products, and has
been found to be a strong predictor of purchasing intentions (Joseph and Vyas, 1984),
specific domain innovativeness relates to the inclination of an individual to try out a new
product or service that is of particular interest to him/her; this has similarly been found to be
a good predictor of the consumption of new products and services on the market (Goldsmith
et al., 1995).
Furthermore, extant literature provides various approaches for differentiating between
adopters of innovation. Rogers (1962) provided five categories of people in the diffusion of
innovation: innovators, early adopters, early majority, late majority, and laggards.
Significantly, innovators, the first to adopt the innovation have been found to be distinct from
late adopters based on factors such as education, social status, knowledge of innovation,
100
social involvement, exposure to media and such strong personality traits as empathy, and
attitudes that afford them a much greater risk-tolerance ability (Conchar et al., 2004; Aldás-
Manzano et al., 2009). In general, many studies have evidenced a negative relationship
between risk-taking and innovation, indicating innovation as a strong predictor of consumer
perceived risk (Cox and Rich, 1967; Cunningham, 1964; Ostlund, 1974). In the context of
technology related services, several studies support the relationship between innovation and
risk taking-propensity (Gerrard and Cunningham, 2003; Beldona, Kline and Morrison, 2004;
Aldás-Manzano et al., 2009; Park and Tussyadiah, 2016). In the domain of online banking,
Aldás-Manzano et al. (2009) note that innovation is a personality trait that reduces
consumers’ perceived risks on the Internet, thus a predictor of risk-taking behaviour among
online consumers. In parallel, Beldona, Kline and Morrison (2004) show that innovative
online travel purchasers have lower risk aversion in travel products and are more willing to
‘blaze the trail’ by buying the products much earlier than their less innovative counterparts.
Likewise, Park and Tussyadiah (2016) discovered an inverse relationship between innovation
and perceived risk in mobile travel booking, therefore, as innovation increases, perceived risk
decreases. Therefore, it is proposed in this thesis that the more innovative backpackers are,
the less likely they are to perceive risk in using smartphones.
H4: Backpackers’ innovativeness has a negative relationship with perceived risk towards their
smartphone usage.
4.8.1.4 Trust
Extant literature affirms the relationship between trust and risk (see Mayer, Davis and
Schoorman, 1995; Luo et al., 2010). Trust is an individual’s attitude based on personal beliefs
about the features of another (Mayer, Davis and Schoorman, 1995) hence consumers may
behave in a certain way while assuming others will react in accordance with their
expectations. Hence, it has become arguably, a strong precondition for effective marketing
because without trust potential consumers become reluctant about buying (Jarvenpaa and
Tractinsky, 1999; Chang and Chen, 2008; Luo et al., 2010). With information
communication systems where users are confronted with the uncertainty of privacy and
security, as well as unsolicited computing, and unreliable Internet infrastructure, trust
becomes a crucial element in ameliorating these uncertainties. In evidence, Cheng and Lee
(2000) and Chang and Chen (2008) recorded a negative relationship between trust about
101

online merchants and perceived risk of using such services. Likewise, Luo et al. (2010) report
that more trust in online banking systems reduces the risk perceptions of using such services.
Other studies also prove that trust positively affects the intentions to use such an information
system (Jarvenpaa and Tractinsky, 1999). Along with these theoretical arguments, this
research argues that backpackers’ trust concerning smartphone services, influences their
perceived risk related to the devices and that trust also influences their intentions to use it to
perform future travel related functions. Thus, it is hypothesised that:
H5: Backpackers’ trust in smartphone services is negatively related to their perceived risk
about the device.
H6: Backpackers’ trust in smartphone services influences the intentions to reuse their device
for future travel needs.
4.8.1.5 Perceived risk versus satisfaction (with device and travel experience) and intentions to reuse a smartphone for future travel related services
Consumer satisfaction is viewed as an important concept in consumer behaviour (Jamal,
2004; Sohn, Lee and Yoon, 2016) and is proved to be affected by perceived risk. In the field
of tourism, the term satisfaction refers to a tourist’s emotional state or the degree of pleasure
following the experience of a trip or the consumption of a service (Sanchez, Luis and Rosa,
2006). It is regarded as a post-consumption measure of each and overall attributes of a travel
destination. According to Johnson, Sivadas and Garbarino (2008), consumers’ risk
perceptions and satisfaction share a mutual influence from consumption experience and risk
perception has seldom been used as a driver of consumer satisfaction (Hasan, Ismail and
Islam, 2017) albeit other forms of satisfaction such as expectations of the product have been
utilised as drivers in the tourism context (Johnson, Gabarino and Sivadas, 2006). Researchers
understand that the providers of services might have control over the quality of services up to
consumers’ expectation levels (Hossain, Quaddus and Shanka, 2015), however, because of
the existence of different risk types, overall satisfaction with services is outside the purview
of the provider (Lee, Petrick and Crompton, 2007). As such, the direct effect of risk
perception on satisfaction with services is still under investigation (Johnson, Gabarino and
Sivadas, 2006). Customers’ perceived risk emanating from their experience with the product
and service may influence their satisfaction negatively or positively by means of general
antecedents (Johnson, Sivadas and Garbarino, 2008). In their study, Johnson, Sivadas and
102

Garbarino (2008) reported of a negative relationship between consumer perceived risk and
satisfaction. That is, the amount of risk concerns held by consumers penalises their
satisfaction levels. However, Sohn, Lee and Yoon (2016) in a more recent study found no
significant negative effect of perceived risk on satisfaction with service and future intentions
noting that perceived risk does not always lead to low satisfaction or negative intentions in a
consumption situation. According to Sweeney, Soutar and Johnson (1999), risk factors such
as performance, time and financial are related to post-consumption behavioural intention. A
high level of risk perception reduces a traveller’s satisfaction with services and also
negatively influences a customer repurchase intention (Wirtz and Mattila, 2001). For
instance, Johnson, Gabarino and Sivadas (2006) realised that there is an inverse relationship
between risk perception and consumers’ satisfaction with the performance of a cultural
organisation. Satisfaction comes from the experience with a service and its intensity
ultimately alleviates perceived risk (Jin, Line and Merkebu, 2016). Accordingly, customers
who are less likely to be concerned about risk in services have a more satisfying experience
(Johnson, Sivadas and Garbarino, 2008).
Furthermore, the relationship between satisfaction and post-consumption behaviour, such as
the intention to repurchase or reuse a service is still moot in the tourism literature – due to
differing findings on this subject – hence, the need for generalisability in this regard. While
some studies (Kozak, 2003; Chen and Tsai, 2007) found satisfaction to have had a positive
influence on post-purchase behaviour, Prayag (2009) established that satisfaction had no
impact on the behavioural intentions of tourists. Similarly, other studies have shown that
satisfaction has either comparatively more or less influence (Kozak, 2001) or no influence at
all (Petrick, Morais and Norman, 2001) on revisit intention. On the contrary, Baker and
Crompton (2000) and Chi and Qu (2008) have noted satisfaction as a significant predictor of
consumer behavioural intentions suggesting that the more positively consumers evaluate a
service or product, the higher their satisfaction – which further attracts positive
recommendations and intentions. In this thesis, satisfaction is, measured along two main
perspectives: 1) satisfaction with the smartphone and 2) with travel experience in general in
Ghana.
In addition to how perceived risk affects satisfaction, studies have also explored the effect of
perceived risk on behavioural intentions among consumers (Mitchell, 1999; Baker and
Crompton, 2000; Featherman and Pavlou, 2003; Luo et al., 2010; Chen, 2013; Sohn, Lee and
103

Yoon, 2016). Evidence from literature suggests that perceived risk directly affects intentions
(Mitchell, 1999). For instance, within the tourism literature, studies (e.g. Cetinsoz and Ege,
2013; Artuğer, 2015) have confirmed the existence a negative relationship between perceived
risk and revisit intentions in different consumption contexts. Similarly, many studies on
online shopping, gives credence to the negative effect of perceived risk on the intentions to
adopt such systems in future (Chang and Chen, 2008; Kim, Ferrin and Rao, 2008; Luo et al.,
2010). Therefore, the more consumers perceive risk in using an information technology
system, such as the smartphone, the less likely they are to utilise it for an intended task or in
the future.
H7: There is an inverse relationship between perceived risk and satisfaction with smartphone
travel services.
H8: There is an inverse relationship between perceived risk and satisfaction with travel
experiences.
H9: Perceived risk towards smartphone usage has an inverse relationship with the intentions
to reuse the device for future travel needs.
H10: Satisfaction with travel experiences positively influences the intentions to reuse a
smartphone.
H11: Satisfaction with smartphone services positively influences the intentions of future use.
The proposed model for study is as shown in Figure 6. Perceived risk is modelled as a third-
order hierarchical latent construct (based on existing risk facets) and antecedents and
consequences examined.
104
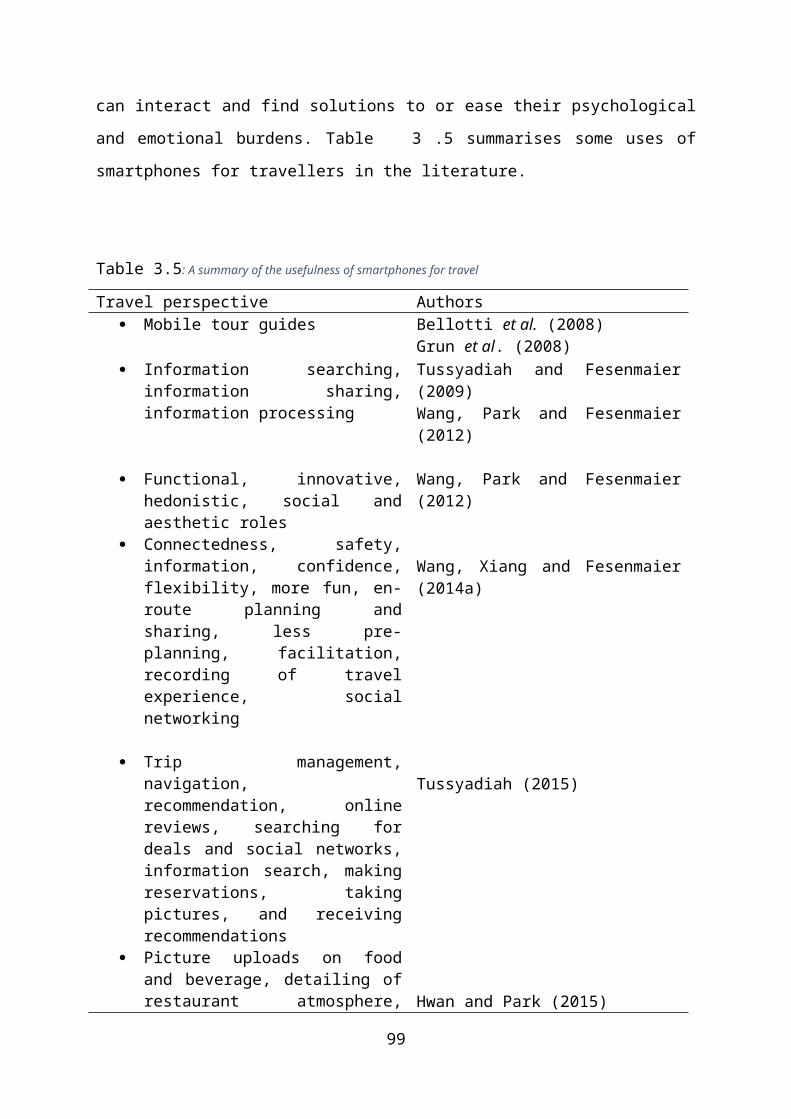
Figure 6: The proposed conceptual model for the thesis
105

4.9 Summary
This chapter critically discussed the concepts and theory of perceived risk – which is the
major theoretical lens through which this thesis is framed. The review suggests that perceived
risk (known uncertainties) is a cognitive probability of negative outcomes in a purchase
situation. Conceivably, as a service-based industry, tourism activates risk concerns among
consumers due to their inability to try or evaluate services before actual purchase. Besides,
the lack of warranty associated with the service product further heightens uncertainties and
risk concerns among consumers. The nature of the product or service produces endogenous
and exogenous risk factors that affect consumers, thus they try to reduce such risks by using
various risk-relievers to douse their impact on decision-making. Such risk reduction strategies
may broadly include the search for information on the product or service, alternatives to it or
entirely avoiding the decision to use it. Interestingly, researchers in tourism have empirically
shown that backpackers, unlike in the past, now have risk concerns during travel and for that
matter use some general risk reduction strategies to reduce their risk concerns at the
destination. However, the literature on ICT in tourism is generally bereft of information
regarding personal risk-relievers in terms of information technology usage. The next section
focusses on the methodology employed in this thesis.
106

5 CHAPTER FIVE: RESEARCH METHODOLOGY
5.1 Introduction
Research methodology is, arguably, one of the most vital and critical parts of scientific
research, especially in the social sciences – because a poorly crafted methodology could lead
to spurious results (Burke and Onwuegbuzie, 2004). Therefore, social scientists are
encouraged (if not enjoined) to document explicitly, and with the utmost integrity, the
methodologies and methods used in their research so that future researchers can learn from
them and possibly use such methods as a guide to inform their studies or verify or critique
them. This chapter proceeds by critically presenting the philosophical thoughts that informed
the chosen methodology and methods – influenced by the researcher’s own worldview of
knowledge research. It also provides a review of previous methodologies and methods used
by researchers in related studies; this guided the research design, methods, and data analyses
in the study. Furthermore, matters concerning sample size determination, sampling
procedures, research instruments, piloting, and ethical considerations are presented in this
chapter.
5.2 Aim and objectives of research
The main aim of this study was to explore backpackers’ perceptions of risk towards the use of
smartphones in Ghana and their risk reduction strategies – with the goal of broadening
understanding of perceived risk among users of mobile technologies in the travel and tourism
industry.
Four (4) specific objectives were used in achieving this aim:
1. explore what functions backpackers use their smartphones to perform while in Ghana;
2. explore backpackers’ perceptions of risk towards the use of smartphones vis-à-vis
device risks and destination related risks;
3. examine the antecedents and outcomes of backpackers’ perceived risk towards their
smartphone usage; and
4. investigate the risk reduction strategies employed by backpackers who perceive risk
towards their smartphone usage in Ghana.
107

5.3 Research philosophy
Research philosophies or theories of research are vital in the conduct of research activities –
informing the researched – in terms of how the research question can be argued, investigated,
understood, and communicated to others (Saunders, Lewis and Thornhill, 2009, 2015). Crotty
(1998), therefore, maintains that our assumptions regarding knowledge, generally, affect how
we possibly can comprehend our research questions, the methods, and interpretation of
findings. Cognisant of the importance of research philosophies in knowledge research, this
section highlights some of the major philosophical positions in social science research and
how that has shaped and still is shaping the social science atmosphere – regarding paradigms
and related assumptions. A review of these theories and methodologies applied in previous
studies informed the researcher’s ontological and epistemological positions in writing this
thesis.
Figure 7: Research philosophies and methodological issues
Source: Author’s construct (2018)
108
Ontology
Methods
Approach
Epistemology
Objectivism
Subjectivism
Positivism Interpretivism Pragmatism
Deductive
Inductive
Abductive QuestionnaireInterviews VisualsObservations Documents
What is the nature of
knowledge?
What is knowledge and how do we know
what we know?
How do we arrive at that
knowledge?
What specific strategies and procedures are necessary?
Outcome Basic questions about
knowledgeResearch
Philosophies

The researcher makes clear his philosophical and paradigmatic stance (and the associated
methodology and methods), and how that facilitated the answering and comprehension of the
overall research aim (Figure 7 depicts the major philosophical issues, related methodologies
and methods). The ontological and epistemological posturing of researchers dictate their
methodological choices (Ponterotto, 2005; Saunders, Lewis and Thornhill, 2012). The
philosophical discussions in this chapter focus on ontology and epistemology, as well as the
underlying methodology and methods that guided the study. Therefore, the next section
presents the ontological and epistemological issues in this thesis.
5.3.1 The ontological and epistemological perspectives of this research
Johnson and Clark (2006) note that researchers should not only focus on trying to make their
research more philosophically informed, but rather, how well they can reflect on their choice
of philosophy and justify it against other options known to them. Saunders, Lewis and
Thornhill (2012, 2015) acknowledge that it is imperative for researchers to know that
different philosophies are suited for different purposes – and for that matter thinking one
philosophy is better than the other is ‘missing the point’, rather, this should be informed by
the research question or objective at play.
Therefore, having considered the aim and objectives of this study and with recourse to
previous empirical studies (Table 5.11 & Table 5.12), ontologically, it is the belief of the
researcher that there could be multiple realities – objective or subjective. This study argues
that while some realities or truths may be external to social actors, others may be socially
constructed – engendered by personal connections and cultural orientations. Moreover, while
some events can be measured universally, others are not, and any attempts to understand
them that way, could be erroneous and ineffectual. Epistemologically, the researcher believes
that while it may be useful (in the effort to uncover truth) to detach oneself from what is
being researched to ensure objectivity – it may be essential to be part of that event to get a
deeper understanding of it, under some circumstances. For instance, in the case of this study,
it can be argued that while the issue of perceived risk could be measured objectively, by
staying aloof, this could mask some useful information, which otherwise, would have been
revealed by getting involved in the process. Therefore, the effort to understand the
phenomenon of perceived risk regarding smartphone usage dwelled on both objective and
subjective viewpoints. This could reveal complementary data that would produce more rich
109
and elaborated results from the thesis. Even though perceived risk has been vastly measured
using quantitative methodologies (i.e. objectively) (Table 5.11 and Table 5.12), Punch (1998)
notes that matters of perceptions and opinions could be better studied using qualitative means
to offer deeper naturalistic insights into a phenomenon.
Based on the foregoing, the main epistemological support for this thesis was pragmatism.
Apart from the two-main positivistic and interpretivistic epistemologies, a third paradigm of
research that has been widely popularised and used in the social sciences is pragmatism
(Onwuegbuzie, 2002; Onwuegbuzie and Leech, 2004a). This paradigm is meant to bridge the
schism between the aforesaid epistemological perspectives – arguing that researchers need to
consider the use of the best multiple views that can answer a research question(s) instead of a
mono-method (Newman and Benz, 1998; Saunders, Lewis and Thornhill, 2012, 2015).
Therefore, pragmatists hold the belief that instead of a purist stance, a non-purist or pluralistic
perspective to research can uncover acceptable knowledge through both objective
(observable) or subjective insights – dependent on the research question(s) involved. Besides,
taking a pluralistic view on a social phenomenon – to advance communication among
researchers from different backgrounds, and with different paradigmatic commitments – is a
key tenet of pragmatism (Watson, 1990). This logic goes with the argument that the world of
research today, is progressively becoming multidisciplinary and dynamic (e.g. tourism)
which, thus implies that current scholars need to understand multiple research methods that
would promote effective communication and production of quality research, and
collaboration; cocooning oneself to either extreme positivism or interpretivism is not helpful
(Burke and Onwuegbuzie, 2004; Saunders, Lewis and Thornhill, 2012, 2015).
Most importantly, it is maintained by some advocates of pragmatism (e.g. Reichardt and
Rallis, 1994; Tashakkori and Teddlie, 1998; Creswell, 2003; Johnson and Christensen, 2004;
Onwuegbuzie and Leech, 2004a) that research methods should be integrated in a way that
would offer the best possible answer to the researcher’s research question(s) (Hoshmand,
2003). Therefore, the resolve to apply this paradigm was clearly informed by the research
objectives of this study (see Section 5.5.1.1).
In short, the current research went with the conviction that a combination of both objective
and subjective methodologies would lead to a better understanding of backpackers’ perceived
risk towards smartphone usage and their risk reduction strategies (Punch, 1998). Thus,
110

axiologically, the question of values and beliefs in this research was informed by these two
main perspectives as above, in which case, the rhetorical positions were two: flexible and
conditioned – for both qualitative and quantitative aspects respectively. The next section
addresses the approach used in this thesis by explaining in detail, the specific methods that
were used based on the chosen paradigmatic stance – pragmatism.
5.3.2 Research approach
According to Saunders, Lewis and Thornhill (2012), the degree to which researchers become
aware of a research philosophy that would guide their research also prompts questions
regarding the design of the study. To them, the main approaches for such a reasoning are the
deductive or inductive reasoning (Table 5.10).
Table 5.10: Main approaches to social science research
Deductive approach Inductive approach Focus is on theory confirmation
or falsification
Focuses on generating testable
conclusions using a data-driven
approach to research
Sequence of research is from
theory to data – theory driven
Relies on qualitative data
Relies on quantitative data for
analysis
Focuses on understanding a
phenomenon from its context
Takes a more structured
approach to research
Non-generalisable results
Controls measurement to ensure
data validity and reliability
Enables transferability of results
to a similar context
Aims to establish causality
between variables or make
predictions
Commands more flexibility, not
governed by strict laws and
procedures
Hypothesis-bound
Focuses on the use of large
samples to enable
generalisability
Source: Adopted from Saunders, Lewis and Thornhill (2012, 2015)
111

Though, a third approach – known as abductive reasoning has also been proposed (Saunders,
Lewis and Thornhill, 2012) and thus acknowledged in this research, the discussion in this
thesis focuses on the two (2) main approaches mentioned before.
According to Babbie (2010, p. 52), “deduction begins with an expected pattern that is tested
against observations.” The reasoning here is usually from a more general assessment to a
specific one (Pelissier, 2008). In simple terms, when a deductive approach is chosen by
researchers – in answer to a research question(s), they develop testable hypotheses based on
existing theory(ies) and with the appropriate research design, the research is either conducted
to confirm or falsify the hypotheses. It is sometimes, informally referred to as a ‘top-down’
approach or more formally as the hypothetico-deductive method of inquiry. It is often laden
with numerical estimations, and is more outcome-oriented. Generally, this approach relies on
quantitative research methods, such as questionnaires, randomised data, and inferential
statistics in the process of the research.
On the other hand, an inductive reasoning (also known as a bottom-up approach) focuses on
making tentative conclusions or theoretical points for onward verification. An inductive
approach, unlike the deductive approach does not start with a theory. To Neuman (2003), an
inductive researcher commences with a thorough observation of a social phenomenon – and
advances towards patterns – leading to some tentative conclusions, which can be labelled as
theories (Goddard and Melville, 2004).
This thesis uses a more deductive than inductive lens to study perceived risk in relation to
smartphone usage in Ghana (see Figure 8). Put differently, the thesis has more inclination
towards the hypothetico-deductive method than inductive inquiry owing to the existence of
literature and theories, which facilitated the development of a research model – to establish
causality (Punch, 2005; Saunders, Lewis and Thornhill, 2012, 2015). Nonetheless, the
researcher recognised the context specificity of this study – regarding the measurement of
perceived risk related to smartphone usage from a destination context – Ghana. Hence, it was
presumed that the use of qualitative data (not involving theory development per se) would
offer deeper insights about the subject matter. Moreover, the fact that perceptions can be
triggered by stimuli (Section 4.6) may imply the revelation of different factors at the
destination that would better inform this study. Lastly, the issue of risk reduction strategies by
112

users of smartphones is very scant in the literature – much more at the destination level, and
among backpackers. Therefore, a qualitative insight to it was deemed useful and important.
Note: Uppercase indicates where emphasis lies
Figure 8: Philosophical and methodological choice for the thesis
Source: Author’s construct (2018)
Having discussed the ontological and epistemological perspectives in research, as well as the
approach used, the researcher also reviewed research methods used by previous scholars to
inform the current research. Punch (2005) stresses that previous studies should not be ignored
in making theoretical and methodological choices in a research. Considering this argument,
the next section highlights some research methods in previous studies that informed the
current research design and methods.
5.4 Previous research and methodological issues
For most researchers within the social science domain of knowledge research, choosing a
well-thought out and suited research methodology, approach and method(s) is one critical and
difficult decision that must be made at the beginning of a research, especially in the wake of
opposing views among differing methodological purists. But, Punch (2005) asserts that the
best bet for such researchers (especially those unclear about their methodology) is to have a
‘fall’ on previous related studies to serve as a guide to their decisions. In accordance with this
position, this current study ‘dived’ into previous research to examine methods, which served
as a guide to the methodological choices made. It is worth indicating that the studies
presented for this purpose, might not be representative of the totality of methodologies and
methods around the current subject, but were found to be comprehensive enough to help
inform the current research methodology. Essentially, research methods used in studies that
investigated the relationships between backpacking and perceived risk, as well as ICTs and
perceived risk were examined.
113
Ontology MethodsMethodologyEpistemology
Objective + subjective Pragmatism DEDUCTIVE
+inductiveQUESTIONNAIRE
+ interviews

5.4.1 Backpacking and perceived risk – methods used in past studies
The backpacker segment, which hitherto, was viewed as a predominantly risk tolerant group
of travellers, now has risk concerns during travel (see Section 4.4.1). Past researchers studied
backpackers’ perceived risk, largely, from a destination perspective – using different
methods. Adam (2015) quantitatively conducted a survey on a sample of 603 backpackers in
Ghana to examine their risk perceptions in general. Data analysis was done using Exploratory
Factor Analysis (EFA), and inferential statistics such as binary logistic regression, analysis of
variance (ANOVA), and T-test. Following Hunter-Jones, Jeffs and Smith (2008), Adam
(ibid) identified backpackers by using parameters like self-identification, patronage of budget
accommodation, aged between 15-24 years, and travelling mainly for leisure. Furthermore,
other studies such as Reichel, Fuches and Uriely (2007, 2008), used a mixed-methods design
(i.e. qualitative and quantitative) to study backpackers’ perceived risk – using self-
identification as a major criterion. On the other hand, Hunter-Jones, Jeffs and Smith (2008)
adopted a qualitative method in studying backpackers’ perceived risk. Some sample sizes and
techniques used in previous qualitative and quantitative studies are presented in Table 5.11.
5.4.2 ICTs and perceived risk – methods used in past studies
Moreover, past studies (see Section 4.7) have reported on the linkage between perceived risk
and ICTs – with ICTs having an impact on users’ perceived risk in various ways. Such
studies have used quantitative methodologies mostly to assess this subject in tourism and
other fields. A recent study by Park and Tussyadiah (2016) on perceived risk regarding
mobile travel booking, employed an online survey technique to assess consumers’ (N=411)
perceptions of the risks regarding mobile travel booking.
Data analysis techniques involved were Structural Equation Modelling (SEM), Confirmatory
Factor Analysis (CFA), and Partial Least Squares (PLS). Other studies (e.g. Chen, Liu and
Wu, 2013 [N=198]; Chen, 2013 [N=610]; Kim, Qu and Kim, 2005 [N=213]; Cunningham,
Gerlach and Harper, 2005, [N=59]; Featherman and Pavlou, 2003, [N=214, N=181]) have
examined perceived risk about online buying and E-banking using various methods of data
collection and analysis (Table 5.12).
114

Table 5.11: Previous methodological issues on perceived risk in backpacker studies
Author(s) Year Setting Approach/Sample size (N)
Identifying backpackers/target points
Methods Data analysis
Zhang et al. 2017 China Quan/350 Independent travellers, carry backpacks, use hostel
accommodation
Questionnaire (survey), Convenience sampling
EFA, t-test, Binary logistic and multiple linear
regression
Zhang et al. 2017 China Quan/317Qual/20
Hostel accommodation, restaurants, bus stations,
and while trekking
In-depth semi-structured interviews, Questionnaire (with plenty open-ended questions), Convenience
sampling and Snowballing
Grounded theory – inductive coding
Adam 2015 Ghana Quan/603 Self-identification,Budget hotel,15-24 years,
Leisure oriented travel
Questionnaire (survey),Random sampling
EFA, Logistic regression, chi-square
Reichel, Fuchs and Uriely
2009 Israel Quan/579Qual/12
Self-identification Questionnaire (survey),Face-to-face semi-structured
in-depth interviews (IDI), Snowballing
EFA, Discriminant analysis
Hunter-Jones, Jeffs and Smith
2008 United Kingdom Qual/20 15-24 years,Leisure-oriented travel
Face-to-face semi-structured in-depth interviews, Quota
sampling
Thematic analysis
Reichel, Fuchs and Uriely
2007 Israel Quan/579Qual/12
Self-identification Questionnaire (survey),Face-to-face semi-structured
IDI, Snowballing
EFA, Discriminant analysis
Source: Author’s construct (2018)
115

Table 5.12: Previous methodological issues on perceived risk regarding ICTs
Authors(s) Year Setting Approach/Sample size (N)
Focus Methods Data analysis
Park and Tussyadiah 2016 Online Quan/411 Mobile travel booking
Questionnaire (survey) CFA, PLS
Cheng, Liu and Wu 2013 - Quan/198 Online group buying
Questionnaire (survey) Correlation analysis
Chen 2013 Physical bank customers, Taiwan
Quan/610 Mobile banking Questionnaire (survey) EFA, SEM, CFA
Kim, Qu and Kim 2009 Across universities, USA Quan/334 Online airline ticket purchase
Questionnaire (survey) EFA, ANOVA, t-test and multiple regression
Yang and Zhang 2009 China Qual/20 Mobile services Focus Group Discussion
Thematic AnalysisKim, Kim, and Leong 2005 Across universities, USA Quan/213 Online air-line
ticket purchaseQuestionnaire (survey) CFA, Correlation,
RegressionCunningham, Gerlach and Harper
2005 University students, USA Quan/159 Internet airline reservation
Questionnaire (survey) Two-way ANOVA
Featherman and Pavlou 2003 Student sample, USA Quan/214 and 181 E-service adoption Questionnaire (survey) EFA, CFA, SEM
Cases 2002 France Quan/471 Internet shopping Questionnaire (survey) Cluster analysis
Source: Author’s construct (2018)
116

However, Cases (2002), with a similar focus, attempted a mixed-methods research, though
the use of qualitative data in this study appears fuzzy regarding the sample involved, data
collection, and analysis. Nonetheless, these studies (including those on backpacking and
ICTs), point evidently to the fact that past studies have been quantitatively inclined – with a
very limited insight from qualitative researchers. Taking lessons from these approaches and
methods used in previous related subject areas, the research design and methods for this
thesis are presented in the ensuing sections of this Chapter.
5.5 Research design
Designing a research is a crucial exercise that must be fulfilled and done well to achieve
desired results. A research design is the plan of how a researcher intends to go about
answering a research question(s) (Sarantakos, 1998, 2005; Creswell, 2005). Saunders, Lewis
and Thornhill (2012, 2015) also assert that with clear objectives set, scholars should
demonstrate how they intend to collect, analyse and interpret their data – devoid of
suspicions. So, this aspect of the research methodology discusses the main paradigms
(quantitative and qualitative) that were combined in this research, why and how they were
combined, and the methods therein. In other words, the study justifies the whole idea of
combining methods in this study. Therefore, the next section examines the main issues
embedded in the so-called ‘paradigm of wars’ (Johnson and Onwuegbuzie, 2004), as well as
the strengths and weaknesses of these opposing stances, and then proceeds to substantiate the
use of mixed-methods design in this thesis.
5.5.1 Quantitative versus qualitative paradigms
Research in social sciences is, largely divided along the quantitative and qualitative
paradigms – influenced by the positivist and interpretivist philosophies respectively. The
quantitative purists assume an extreme position, believing in the power of statistics and
numbers in researching social events (Creswell, 1994; Tashakkori and Teddlie, 1998). A
typical quantitative purist tries as much, to practice the laws, ideas, and assumptions of
positivism, and striving for objectivity. The main aim here is to examine relationships
between variables by reducing social phenomena into simple measurable entities, and using a
range of statistical techniques, as well as being able to generalise the findings to a much
larger population (i.e. context-free). Thus, standard questions (presumably understood in the
same way) and probabilistic sampling procedures are often used (Creswell, 2005).
117

The philosophical dictates of the quantitative paradigm of social science research enjoin
researchers to empirically test hypothesised statements by being uninvolved to eschew biases,
using a passive (i.e. rhetorical neutrality), rather than an active writing lens or voice
(Tashakkori and Teddlie, 1998). Some good examples of quantitative research strategies
include surveys and experimental research. However, this paradigm has its embedded
strengths and limitations (see Table 5.13).
Table 5.13: Strengths and limitations of quantitative paradigm
Strengths Limitations Allows for generalising (using
probabilistic sampling) research
findings to a wider population.
Prescribed questions and constructs
may not reflect the views and opinions
of respondents.
Expedient for studying large samples in
a study.
Theories used may not be
representative of constituents’
comprehension of the subject.
Allows for quantitative prediction of
the occurrence of an event.
May result in confirmation biases –
losing out on important trends in a
phenomenon as researchers’
concentration tend to be on narrow
hypotheses testing than theory
generation.
The research process and conclusions
are independent of the researcher’s
biases – value free.
Conclusions may be too abstract.
Data collection and analysis can be less
time consuming.
Source: Sarantakos (1998) and Johnson and Onwuegbuzie (2004)
On the other hand, the qualitative paradigm and its purists reject the philosophy of positivism
and profess the tenets of interpretivism (Sarantakos, 1998). Qualitative purists or
constructionists, unlike quantitative purists, study social events by getting involved, making
sense of how others make sense of their own personal worlds, thus place no focus on
achieving objectivity. Rather, a more thorough and deeper understanding of the subject
matter is key to a qualitative purist (Guba, 1990).
118

Table 5.14: Strengths and limitations of qualitative paradigm
Strengths Limitations
The findings are largely based on
respondents’ personal understanding and
interpretations.
Results are under the influence of the
knowledge researcher’s idiosyncrasies.
Useful for conducting research among
relatively smaller samples.
Maybe laden with credibility issues.
Allows for flexibility and responsiveness
to changes as they might occur in a
given study.
Results can hardly be generalised to
other settings.
Can provide very rich details on a
phenomenon based on its local context.
More time consuming to conduct and
analyse data.
Favours the investigation of more
intricate phenomena.
Predictions are difficult to make here.
Appropriate for theory building.
It permits the answering of how and why
questions on a phenomenon.
This paradigm is more responsive to
local conditions and stakeholder needs.
Source: Sarantakos (1998) and Johnson and Onwuegbuzie (2004)
The paradigm typically uses non-standardised data collection techniques so that there can be
the emergence and altering of procedures during the research – from a more interactive and
naturalistic environment (Saunders, Lewis and Thornhill, 2012, 2015). Here, instead of
generalising to a wider population in the end, generalisation is based on context, and on
insider perspective hence can only be transferred to a similar context (i.e. transferability)
(Bryman, Stephens and Campo, 1996).
Furthermore, qualitative researchers unlike quantitative ones, provide inductive accounts, and
in so doing, adopt an empathetically active writing style by informally presenting findings –
laden with direct quotes and personal interpretations (Miles and Huberman, 1994; Schwandt,
2000; Kelle, 2006). Most often, researchers belonging to this paradigm, use words, videos,
and pictures to gain ‘emic’ rather than ‘etic’ insights (Miles and Huberman, 1994). Some
119

good examples of qualitative research include case studies, phenomenology, ethnography,
action research, and narrative research. However, this paradigm also has its embedded
strengths and limitations (Table 5.14). Having provided insights on these opposing views, the
following section deals with the mixed-methods design, which was adopted for this research.
6.5.2 Mixed-methods research paradigm
Mixed-methods has been acknowledged as the third research paradigm or movement that is
shaping research, most especially in the social sciences and influenced by the philosophy of
pragmatism as discussed earlier in this Chapter (Johnson and Onwuegbuzie, 2004). The
Philosophy of pragmatism aims to bridge the void between qualitative and quantitative
purists thinking (Johnson and Onwuegbuzie, 2004). Hence, the increasing popularity of this
paradigm has led to various synonyms of it in the extant literature such as mixed
methodologies, mixed research, multi-research, multi-methods or others that connote
‘mixing’ such as integration, blending, combination or triangulation (Johnson, Onwuegbuzie
and Turner, 2007).
Though the nature of mixed-methods is still being debated as a research paradigm, a common
ground to it lies in the argument that the combination of both quantitative and qualitative
methods offers a better comprehension of a research problem than a mono-method or purist
stance as the strengths of one method complement the weakness(es) of another (Creswell,
2003; Creswell and Plano Clark, 2011; Creswell, 2012). This paradigm advocates the
compatibilists view to research and believes in eclecticism and pluralism through combining
nomothetic (i.e. for generalisations) and ideographic approaches (for in-depth understanding)
in a single research (Johnson and Onwuegbuzie, 2004).
Patton (1990) defines mixed-methods as the use of varied sources of data and designs in a
study to bring different perspectives to bear on a research question. To Patton ( ibid), if
different sources of data are used to answer different research questions, it cannot be termed
mixed-methods. Furthermore, Rossman and Wilson (1985) observe that the purpose of doing
mixed-methods research is to facilitate corroboration, expansion and initiation, while
Tashakkori and Teddlie (2008, p. 101) think this design helps researchers to produce meta-
inferences – “an overall conclusion, explanation or understanding developed through
integration of inferences obtained from qualitative and quantitative strands of a mixed
120
method study”. Nonetheless, the paradigm, as other traditional paradigms, is not fool proof
hence has its own weaknesses and strengths (Table 5.15).
Table 5.15: Strengths and limitations of mixed-methods research
Strengths Limitations The strengths of one method can be
used to overcome the limitations of
another.
Mixing methods can be vague unless
legitimised by the researcher.
Qualitative data expatiate and
provide reasons for quantitative
results.
It could be time consuming.
Mixing methods unearth useful data
that would otherwise be
unobtainable via a mono-method.
Could be challenging in discussing
mixed results.
Produces more overarching insights
on a phenomenon.
Generates more rich, concrete and
believable conclusions to inform
theory and practice.
More expanded and comprehensive
views on a subject recorded from
mixing methods.
Offers an opportunity for researchers
to gain nuanced insights about a
phenomenon.
Gives more credibility to generalised
findings through clarifications and
elaborations.
Source: Johnson and Onwuegbuzie (2004) and Johnson, Onwuegbuzie and Turner (2007)
5.5.1.1 The rationale for using mixed-methods design in this study
The mixed-methods design was considered a suitable research design for conducting this
study. The decision to use such a design was informed by the research objectives, as well as
121

what there is on the current subject matter – using previous related studies as a reference
point. It is clear from previous empirical studies (see Table 5.11 & Table 5.12) as discussed
earlier that the subject of perceived risk related to backpacking and ICTs has been copiously
studied using quantitative approaches, with very scant qualitative insights. Also, the
suitability of a mixed-methods design in tourism studies is observed by Pansiri (2006) who
contends that the eclectic nature of the discipline (tapping into geography, economics,
psychology, anthropology, sociology, and law etc.) makes pragmatism, a better paradigmatic
option for researchers. Though the quantitative methodology characterised previous
perceived risk research, this study went off the ‘beaten track’ to combine both quantitative
and qualitative methodologies – for many reasons enumerated hereafter.
1. The first objective of the study was concerned with exploring the functions backpackers
used their smartphones to perform while in Ghana. Though there are a priori insights on this
objective, the contexts (i.e. backpackers and Ghana) within which this study was situated is
unique to those of previous studies. Hence, a mixture of both quantitative and qualitative
methods yielded complementary results based on this study’s contexts.
2. The second objective was to explore backpackers’ perceptions of risk towards smartphone
usage relative to technology and destination related risks. Therefore, though there exist a
priori psychometric scales for measuring these variables as discussed earlier, the contexts:
backpackers and destination called for a balanced understanding – by drawing on both
quantitative and qualitative data to enable meta-inferences and corroboration of results.
3. The third objective aimed to examine the causal relationships between variables specified
in the research model (i.e. antecedents and outcomes). This required the use of appropriate
statistical techniques to establish such causalities, which qualitative techniques could not
perform. However, the semi-structured interviews yielded data for expanding and providing
deeper insights and meaning to the relationships that were revealed.
4. The fourth objective aimed to unpack the risk reduction strategies used by backpackers
amidst perceived risk related to smartphone usage. The review of literature indicates no
evidence of personal risk reduction strategies used by smartphones users to reduce their risk
perceptions, not to mention backpackers. Therefore, this was clearly a variable that needed
qualitative exploration into, especially among the study group – backpackers. In-depth semi-
122

structured interviews were deemed useful for investigating this subject in more depth and
breadth.
In view of previous methods used by researchers, the overall philosophical lens of this study
– which is pragmatism and the current research objectives, this study found the mixed-
methods design as a more suitable option for methodically and scrupulously investigating the
subject of perceived risk concerning smartphone usage and risk reduction strategies in Ghana.
This study adopted one (1) of six (6) designs proposed by Creswell and Plano Clark (2007)
and Creswell et al. (2008). These authors suggested 6 different ways by which a mixed-
methods design can be carried out: sequential exploratory, sequential explanatory, sequential
transformative, concurrent triangulation, concurrent embedded, and concurrent
transformative. Of these, this study adopted the concurrent embedded/nested design because
of its peculiarities, and the nature of the current research objectives. This has been justified
hereafter.
5.5.1.1.1 Quantitative-dominant concurrent embedded/nested mixed methods design
While quantitative results are often generalisable, literature suggests that subjective
assessments and opinions may be limited by such studies (Mays and Pope, 2000;
Rittichainuwat and Rattanaphinanchai, 2015). Punch (1998) asserts that matters of
perceptions and opinions could be better studied using various qualitative research strategies.
However, qualitative approaches have also been critiqued for their subjective nature and
limited facts even though a detailed data collection, sampling and analysis can increase
validity and reliability (Mays and Pope, 2000). Ryan, Page and Roche (2007) questioned the
validity and reliability of single cross-sectional studies and their management implications for
tourism businesses.
This thesis adopted a quantitative-dominant concurrent nested mixed methods research
design to deal with the weaknesses of a mono-method (i.e. either quantitative or qualitative)
and of making extrapolations based on a single cross-sectional study. While a single cross-
sectional survey in Ghana may not have allowed enough latitude for generalising the research
findings, the (dual) mixed methods approach gave support to the extrapolation of results and
managerial implications of the study. This design enabled the collection of quantitative and
qualitative data simultaneously in a single-phase with one playing a supportive role to the
123

other (Tashakkori and Creswell, 2007; Creswell and Plano Clark, 2007). Unlike concurrent
triangulation, which gives equal weighting to both quantitative and qualitative data (denoted
by QUAL + QUAN), concurrent nested mixed methods design uses a dominant design
approach where one methodology plays a leading role and the other, a supporting role in a
study (denoted by QUAN + qual or QUAL+quan) (Creswell and Plano Clark, 2011;
Saunders, Lewis and Thornhill, 2012, 2015). Moreover, methodologists (Johnson and
Onwuegbuzie, 2004; Creswell et al., 2008) assert that the effort to mix methods in a study
should consider three key issues such as status, timing, and integration.
In terms of status, this study used a quantitative-dominant (i.e. QUAN + qual) concurrent
nested/embedded research design – because it involved largely the testing of a conceptual
model – due to the availability of theoretical constructs for examining causal relationships in
the proposed model. However, a light touch qualitative insight was deemed useful for
deepening the statistical results since the study is uniquely placed within a destination context
implying that a full-fledged quantitative methodology may preclude novel and naturalistic
insights. Essentially, the use of the concurrent nested design allowed for the collection of
both quantitative and qualitative data synchronously after a pilot study. The reason why a
sequential mixed methods design was not tenable in this study was the fact that the study did
not have to go through a process of developing a new survey instrument as there were
existing constructs and items for ready use. Rather, this study piloted existing constructs
necessary for the model and then, proceeded to conduct the main research using quantitative
and qualitative methods contemporaneously. In terms of timing (Johnson and Onwuegbuzie,
2004; Creswell and Plano Clark, 2007), both methods in this study were employed at the
same time. Notably, while the quantitative dimension of the study investigated backpackers’
risk perceptions, as well as drivers and outcomes, the qualitative part of the study examined
their perceptions (i.e. to corroborate the quantitative results) and especially risk reduction
strategies. This is illustrated in Figure 9.
Furthermore, it is advised that researchers using mixed methods must consider the issue of
integration (Creswell, and Plano Clark 2007; Saunders, Lewis and Thornhill, 2012, 2015,
Creswell, 2012). That is, one needs to be clear about the stage(s) at which methods would be
combined and why. As per Saunders, Lewis and Thornhill (2012), integration in mixed
methods can be done from the problem formation and choice of philosophy, through to the
data collection, analysis, and interpretation. In this thesis, the mixing or integration of ideas
124

was reflected in the problem statement, research methods, discussion, conclusions and
implications.
Note: Uppercase shows where emphasis lies; “+” stands for concurrent
Figure 9: An illustration of how mixing of methods was done in the study
Source: Adapted from Creswell and Plano Clark (2007) and Creswell et al. (2008)
Finally, there are several justifications for using mixed methods in a study such as for
initiation, facilitation, complementarity, interpretation, diversity, and generalisability
(Creswell and Plano Clark, 2007; Saunders, Lewis and Thornhill, 2012). One of the bases for
adopting mixed methods design in this thesis was complementarity; this is when the
researcher wants to use the findings of one method to support the other through elaboration,
illustration or clarification. Also, the study sought a strong basis for generalising the results
and implications to a wider population. Moreover, Abeza et al. (2015) argue that the
concurrent mixed methods design, unlike the other mixed methods designs, requires less time
and resources to execute. From the foregoing, the study found enough grounds for adopting a
125

cross-sectional (one-off) concurrent embedded mixed methods design. The next sections
highlight the specific quantitative and qualitative methods that were used in this study.
5.5.2 Research methods
This section discusses both the quantitative and qualitative research methods used in this
study based on the research paradigm and research design discussed earlier. It starts by
indicating how the subjects of the study were identified and the methods and procedures that
were used in collecting the data through to the analyses stage.
5.5.2.1 Quantitative methods
The discussion of quantitative methods in this thesis focusses on issues relating to the
identification of a valid sample for investigation, as well as data and sources. It also discusses
the sample size and sample size determination, sampling technique, measurement instrument,
pilot testing, and data processing and analysis.
5.5.2.1.1 Target population
The target population for this study were international backpackers who visited Ghana
between November 2016 and February 2017. As noted in Chapter 2 (Section 2.3), previous
studies (Pearce, 1990; Ateljevic and Doorne, 2004; Reichel, Fuchs and Uriely, 2007; Maoz,
2007; Paris, 2012a; Hunter-Jones, Jeffs and Smith, 2008; Adam, 2015; Dayour, Adongo and
Taale, 2016) have conceptualised backpackers using a combination of different criteria hence
there is no clear-cut inclusion criteria(ion) for the study of backpackers (Dayour, Kimbu and
Park, 2017). This study proposed a simple and less complicated criterion for identifying
backpackers to generate a valid sample for the study. In this study, a ‘backpacker’ is simply
one who identifies himself or herself as such (see Hunter-Jones, Jeffs and Smith, 2008) in a
budget accommodation or at attraction. This approach was found appropriate especially
considering current studies that have drawn attention to a growing segment of backpackers
christened ‘flashpackers’; they are often older, tech-savvy, earn more income, and have a
high tendency to use upscale accommodation facilities at a given destination (Paris, 2012a).
Therefore, concentrating on budget accommodation facilities alone as the traditional measure
for identifying backpackers could be misleading as others may be left out due increasing
economic and demographic changes among such travellers. However, it is, acknowledged
that a possible downside to the ‘self-identification’ approach is the fact that not all
126

backpackers may yield to it as others perceive the term ‘backpacker’ to be derogatory in
nature often linked with using psychedelic enclaves (Cohen, 2011).
5.5.2.1.2 Data and sources
Data for the study were obtained from both primary and secondary sources. Primary data
were sourced from backpackers – through a structured questionnaire and in-depth interviews
(IDIs).
Figure 10: Map of Ghana showing backpacker trails
Source: University of Cape Coast Geographical and Cartographical Unit, Ghana (2016)
127

These formed the pool of ‘raw materials’ for the study. Secondary data constituted data on
budget accommodation facilities and attractions – obtained from the Ghana Tourism
Authority. These facilities were used as the main locations for collecting data from
backpackers in four regions of Ghana: Greater Accra, Central, Ashanti and Northern regions
(see Figure 10).
5.5.2.1.3 Sample size determination
Sample size determination is an important aspect of every research project – especially those
involving the collection of primary data (Miles and Huberman, 1994). However, whether for
quantitative or qualitative research or both, it may be next to impossible (due to resource
constraints) to study every case in each population – requiring sampling (Saunders, Lewis
and Thornhill, 2012, 2015). But, the inability to select the required sample for a research
project can potentially affect the quality of the results, most especially, in quantitative
research (Punch, 1998). Sampling requires the researcher to carefully select a subsect of the
target population for investigation – which should depend on the aim of the study – either to
statistically generalise to an entire population or produce results that are solely context
focussed. As such, Becker (1998) reasons that the selection of a sample should be carried out
in a way that is representative of all cases and in a manner, that is meaningful and tenable.
Admittedly, there are still controversies surrounding what might be an appropriate sample
size for a study using either quantitative or qualitative design. For most quantitative research,
the existence of sample size calculators and rules-of-thumbs have been useful in the selection
of samples. However, for some research, not all conditions (such as a sampling frame) may
exist for one to statistically estimate a required sample, especially among tourists.
5.5.2.1.3.1 Sample size
In this research, the focus was to make statistical inferences and generalisations, particularly
in Sub-Saharan Africa – using a dominantly deductive approach. Hence, the more statistically
representative the sample of the study is, the stronger the extrapolation of results. To
statistically select the sample size, this study uses the G*Power sample estimation technique
(Erdfelder, Faul and Buchner, 1996; Faul et al., 2007), which is an a priori technique applied
to estimate the number of cases/participants necessary for a study. The power analysis
prevents the researcher from committing type 1 and type 2 errors hence with sample
estimations using this approach, researchers can correctly reject a null-hypothesis without
128

being biased (Cohen, 1988). Relying on Cohen’s (1988) parameters for sample size
calculation (i.e. power [1-β] = 0.95; alpha level (α) = 0.05, Number of predictors = 7, medium
effect size [f²] = 0.15), the sample size for this study – based on linear multiple regression is
74 (Appendix 14.4). Moreover, using the 10 cases per predictor ‘rule-of-thumb’ as suggested
by Barclay, Higgins and Thompson (1995) and Bartlett, Kotrlik and Higgins (2010) puts the
sample at 70 backpackers. But also bearing in mind, the types of analytical techniques
involved in this study, Hair et al. (2017) recommend a sample of 250 and above for both
Partial Least Squares Structural Equation Modelling (PLS-SEM) and Covariance-based
Structural Equation Modelling (CB-SEM) techniques. Moreover, Wong (2013) hints that
high value path coefficients may be needed for PLS-SEM modelling if sample becomes too
small. Past studies on perceived risk concerning ICTs have employed samples between 200
and 800 (cf. Featherman and Pavlou, 2003; Kim, Kim and Leong, 2005; Chen, 2013; Park
and Tussyadiah, 2016) for CB-SEM and PLS-SEM modelling. Considering all the processes
and rule-of-thumb in the literature, the sample size for this study was 800. This was not
farfetched because past studies on backpacking in Ghana such as Dayour, Adongo and Taale
(2016) had studied 650 backpackers; Adam and Adongo (2016), 603 backpackers; and Adam
(2015), 603 backpackers within averagely two months.
5.5.2.1.4 Sampling procedure
Following the theoretical argument that perceived risk is better measured ‘in-situ’, that is,
while consumption is taking place (Section 4.6), this study investigated the subject matter
using participants recruited from budget accommodation facilities and at main attractions in
the country. Unlike past studies (e.g. Fuchs and Reichel, 2006; Adam, 2015), participants
were recruited from some main attractions (especially, those associated with adventure) in
recognition of the fact that such areas endear themselves to backpackers in the country
(Dayour, 2013).
As a procedure, first, following Adam (2015) and Dayour, Adongo and Taale (2016),
purposive sampling procedure was used to select budget accommodation facilities from a list
obtained from the Ghana Tourism Authority – for each study area in 2016. In all, a total of 23
budget accommodation facilities (i.e. 9 from the Greater Accra region, 6 from Central region,
4 from Ashanti region and 4 from Northern region) were included in this study (Section
5.5.2.1.2) because they were well-known backpacker facilities (Dayour, 2013, Dayour,
129

Adongo and Taale, 2016). A convenience sampling technique (see Dayour, 2013; Adam,
2015), which allows for the drawing of cases without a sampling frame was used to select
cases at every 3rd interval at reception areas during check-outs.
Also, four main attractions notable for backpacking were purposively selected from across
the four main study zones: 1) Shai Hills in Greater Accra; 2) Kakum National Park in the
Central Region; 3) Owabi Wildlife Sanctuary in the Ashanti region, and 4) Mole National
Park in the Northern Region. Similarly, a convenience sampling procedure was employed in
selecting cases at every 3rd interval at reception areas during check-out. This was to ensure
that potential respondents had ample time to attend to all questions. However, respondents
who were unable to complete their questionnaire because they were in a hurry to leave the
premises requested the researcher to pick up such questionnaires later at some designated
hotels and popular restaurants. Thus, the sampling technique by ‘check-out’ at the attractions
was a bit limited as some respondents did not leave questionnaires at the designated areas as
promised. It is hereby advised that subsequent studies should focus more on the traditional
budget accommodation facilities because of the challenges of sampling at attractions.
Furthermore, data collection points were spread across the four regions of Ghana to try and
get a general impression of backpackers’ risk perceptions towards smartphone usage in the
country. Thus, the study did no examine risk perceptions based on the specific facilities
involved but Ghana in general. Therefore, the researcher did not assign quotas to attractions
nor accommodation facilities from which backpackers were contacted but was focussed on
achieving the targeted sample size as mentioned earlier (see Section 5.5.2.1.3.1) thus a
limitation of this study that needs to be acknowledged at this juncture.
For both accommodation facilities and attractions, potential respondents should have 1)
identified themselves as backpackers (Hunter-Jones, Jeffs and Smith, 2008; Adam, 2015) and
2) used a smartphone for travel – to qualify for inclusion. Potential respondents who failed to
meet the two criteria were replaced before the next count. Most importantly, the study was
cognisant of the possibility of double counting in tourist surveys at destinations often because
of their fluid nature of movement (Boakye, 2010). A way to prevent this was by asking
potential respondents to know whether they had already participated in the study – before
handing out a questionnaire.
130

5.5.2.1.5 Measurement development – structured questionnaire
The instrument used for collecting quantitative data in this study was a self-administered
structured questionnaire involving open and closed ended questions. The reason for using this
kind of instrument is two-fold: 1) it is suitable for collecting statistically quantifiable data
(Creswell, 2003) and 2) past studies (e.g. Dayour, 2013; Boakye, 2013; Adam, 2015; Dayour,
Adongo and Taale, 2016) reported that most tourists in Ghana read and write in the English
language. This means that designing the instrument in English was rational for this study.
Furthermore, the design of the instrument was based on existing literature (refer to Table
4.9). Items on perceived risk regarding ICT, and proposed determinants and outcomes were
drawn from related literature (see Appendix 13.5) and adapted to the current research using a
5-point Likert scale: 1-strongly disagree, 2-disagree, 3-neither agree nor disagree, 4-agree,
and 5-strongly agree. The questionnaire was divided into five (5) part. The first part
contained measures on perceived risk related to the use of smartphones: financial (3 items),
performance (4 items), time (3 items), psychological (3 items), social (3 items), security (3
items), destination-physical (3 items), and destination-infrastructure risks (3 items). The
second part examined factors affecting perceived risk: familiarity (4 items), observability (2
items), innovation (5 items), and trust (3 items). The third part focussed on the consequences
of perceived risk: satisfaction with smartphone (4 items), satisfaction with travel (3 items),
and intentions (4 items). The fourth part looked at the travel characteristics of backpackers
(such as, travel party size, repeat visit status, travel arrangement, experiences with
backpacking and smartphones, and travel budget) measured on categorical, dummy and
continues scales. The last part of the survey contained the socio-demographic characteristics
of backpackers (such as gender, age, marital status, educational qualification, income, and
nationality) also measured on categorical, dummy and continues scales. Most importantly,
two (2) filtering/screening questions for identifying a valid sample were included in the
survey. That is, whether or not a potential respondent was 1) a backpacker and 2) used a
smartphone during travel in Ghana. Questionnaires were completed within 10 to 15 minutes.
Of the 800 questionnaires that were administered, 567 were found valid for analysis after
culling incomplete and damaged questionnaires – resulting in a response rate of 70%.
131

5.5.2.1.6 Piloting of data collection instrument
Piloting of the data instrument was an important exercise that needed to be undertaken before
the actual research (Sarantakos, 1998). The purpose of this trial-run was manifold: 1) to
ensure that respondents encounter no difficulties in answering questions, 2) ensure
questionnaire validity and reliability, 3) obtain face validity, 4) estimate response levels and
dropouts, and 5) familiarise oneself with the research milieu (Sarantakos, 1998; Creswell,
2003; Wong and Yeh, 2009).
In this research, the questionnaire and semi-structured interview guide were simultaneously
pre-tested in Cape Coast – one of the study areas – ahead of the actual fieldwork. But before
that the questionnaire had been checked for aptness and structure using academic experts and
doctoral students in the field of tourism. This facilitated the improvement of the instrument
towards validity and reliability (Bell, 2010; Saunders, Lewis and Thornhill, 2012). Following
this, piloting was undertaken (between 15th September and 15th October 2016) to ensure the
relevance of questions, wording, and instructions. It also helped to check the clarity,
timeliness of responses, and brevity of the instrument. In terms of number of questionnaires
used, this study acknowledged the suggestion by Creswell (2003) that a minimum of 30 pre-
tested instruments are enough for checking face validity and reliability. However, 85
questionnaires were administered to backpackers to gain more depth regarding validity and to
offer a clearer picture about the actual study.
5.5.2.1.7 Data processing and analysis
The quantitative data was processed and analysed using various software. Data was coded
and entered in the Statistical Product for Service Solutions (SPSS) version 22. Data cleaning
was undertaken using this software to check for outliers and missing values. The series mean
option in SPSS was used to replace missing data. The normality of the data (i.e. kurtosis and
skewness) was examined before exporting them into Analysis of a Moment Structures
(AMOS) 22 and SmartPLS 3.0 for further analysis.
In this thesis, the CB-SEM technique was used mainly to validate measurement models
because of its goodness-of-fit capacity while the component-based PLS-SEM was used in
testing the proposed hypothesised paths. The PLS-SEM was used in evaluating the structural
model for various reasons. First, unlike CB-SEM and multiple regression analysis, the PLS-
132

SEM has a few restraints on the sample size required, measurement scales, and residual
distributions (Chin, Marcolin and Newsted, 2003). The algorithm in PLS permits the use of a
small sample size for hypothesis testing (Wong, 2010, 2013; Hair, Ringle and Sarstedt,
2011). Second, unlike the CB-SEM, which is sensitive to sample size and sample
distributions (i.e. dataset must assume normality), PLS-SEM is suitable for relatively small
sample sizes (and less sensitive to data normality) to generate reliable results (Wong, 2013).
For example, in Table 6.21, Table 6.22 and Table 6.23, it was clear that the dataset in this
study was not symmetrically distributed based on the < -1 and > +1 threshold (see Bulmer,
1979) hence not suitable for CB-SEM but rather PLS-SEM in examining the structural
model. Third, PLS-SEM is suitable for testing conceptual models with complex hypothesised
relationships – with a large number indicators or manifest variables (of more than 25) (Chin,
1998). Fourth, PLS-SEM, unlike CB-SEM (which is best for confirming and rejecting
existing theories) is recommended for application when one wants to explore relationships
between variables or extend an existing structural theory (Hwang et al., 2010; Wong, 2013).
The PLS-SEM technique was deemed suitable for assessing the structural model for the
thesis as it sought to explore relationships regarding backpackers’ risk perceptions towards
smartphone usage for the very first time. However, multicollinearity could arise if modelling
was not handled carefully. Thus far, the many advantages of PLS-SEM relative to CB-SEM
as outlined above, made it the most appropriate analytical technique for testing the proposed
hypotheses while the CB-SEM was used in validating the measurement models. Furthermore,
descriptive statistics were produced to describe the sample characteristics.
In presenting the sample characteristics for the thesis, frequencies, percentages and mean
scores were generated for the socio-demographic and travel characteristics of respondents,
travel experiences, activities undertaken with smartphones, and types of electronic devices
carried along to Ghana. Similarly, mean scores, overall component scores and standard
deviations (SD) were produced for all constructs and their related measurement
items/indicators to give a more direct impression of respondents’ reactions towards each item
and construct. This was done for all the indicators and components of perceived risk,
antecedents and outcomes.
Furthermore, various procedures and thresholds in the extant literature were considered in the
process of analysing the data at more advanced levels. For instance, common methods bias is
likely to occur in data collected on both exogeneous and endogenous variables (from the
133

same sample) using a single research instrument (Podsakoff et al., 2003). Therefore, two
main approaches were used in verifying its presence or otherwise in this thesis. First,
following Park and Tussyadiah (2016), the correlation among latent variables was checked
vis-a-vis the cut-off point (r > 0.90). Second, using Podsakoff et al. (2003) upper limit (50%),
the variance accounted for by a single factor in the factor analysis was assessed for common
method variance.
In validating how well the proposed model fitted the dataset, the CFA was conducted by
assessing the various indices guided by literature. Fundamentally, the factor loadings, model
fit indices, convergent and discriminant validity, Cronbach’s alpha, composite/construct
reliability and probability values were assessed in this process. For factor loadings, the ≥ 0.5
criterion was used as a guide to include items into the proposed model (Pallant, 2005; Filieri,
Alguezaui and Mcleay, 2015) at p < 0.001 alpha level. For the internal consistency of
measurements, the Cronbach’s alpha and composite reliability values were assessed against
the lower bound of 0.7 (see Bagozzi and Yi, 1988; Kline, 2005; Hair, Ringle and Sarstedt,
2014). In terms of convergent validity, the Average Variance Extracted (AVE) was checked
against the 0.5 cut-off point as proposed by Fornell and Larcker (1981). Regarding
discriminant validity, the Fornell and Larcker criterion, factor loadings, as well as the
Heterotrait-Monotrait (HTMT) ratio were considered and checked. As per the Fornell and
Larcker criterion, the square root of the AVE of a construct should be greater than the
intercorrelation between that construct and others (Fornell and Larcker, 1981). Chin (2010)
also maintains that items should have loaded highly on their respective constructs than others.
Moreover, the HTMT criterion was also assessed based on Henseler, Ringle and Sarstedt’s
(2015) suggestion that the confidence interval of the HTMT should not include the value 1.
Hair et al. (2017) claims the HTMT criterion is more reliable in detecting discriminant
validity issues in a dataset. Concerning model fit indices, thresholds in the extant literature
(as presented in Table 7.27) were used as yardsticks for evaluating the measurement models
by the CFA approach. Also, the third-order hierarchical latent construct of perceived risk was
assessed using the ‘repeated indictor approach’ in PLS-SEM (Becker, Klein and Wetzels,
2012). Similarly, the same thresholds as indicated before, were used to check loadings and
tests for validity and reliability.
In evaluating the structural model for this thesis by PLS-SEM, the two-tailed t-statistic (1.96)
and probability values (p < 0.05 and p < 0.001) were used as the parameters for assessing
134

significant relationships between variables (Hair et al., 2017). The bootstrapping routine as
proposed Hair et al. (2017) was performed using a sample of 5000 to calculate t-statistics.
The contribution of each predictor to an endogenous variable (f2) was examined using the
guidelines (0.02 = small, 0.15 = medium and 0.35 = large) suggested by Cohen (1988).
Finally, the out-of-sample predictive relevance of the proposed model was also evaluated
using the Stone-Geisser’s Q2 method (Hair et al., 2017). Values greater than zero (0) indicate
the model’s predictive accuracy for a dependent variable (Hair et al., 2017). The next part
presents the qualitative methods used in conducting the study.
5.5.2.2 Qualitative methods
Having highlighted the selection of backpackers and data sources earlier (see Sections
5.5.2.1.1 & 5.5.2.1.2), the presentation of qualitative methods in this section focuses mainly
on the sample size, sampling procedure, semi-structured interview guide, pilot testing,
researcher reflexivity and data processing and analysis.
5.5.2.2.1 Sample size
For the qualitative part of this study, no specific rules exist on the selection of an appropriate
sample size, as this remains ambiguous among qualitative researchers. Patton (2002) thinks
that the choice of a sample for qualitative research should be based on the research question
and resources available but also the need to gain a deeper insight based on context. Also, he
recommends interviewing until theoretical saturation point is reached. This study interviewed
15 backpackers based on the saturation of responses (Onwuegbuzie and Leech, 2006). Since
the thesis focussed on Ghana and backpackers, the results that emerged from the qualitative
dimension, were generally more applicable to this context.
5.5.2.2.2 Sampling procedure
Using the same inclusion criteria as mentioned before (Section 5.5.2.1.1), the purposive or
judgemental sampling technique – which deals with the selection of cases that best elicit the
right amount of information about a subject matter was used to reach backpackers for in-
depth interviews. Specifically, the heterogeneous purposive sampling or maximum variation
sampling – which involves the deliberate selection of different subgroups (such as males and
females) to garner varied opinions on a phenomenon was employed in selecting backpackers
for interviews (Saunders, Lewis and Thornhill, 2012).
135

5.5.2.2.3 Semi-structured interview guide
Johnson and Turner (2003) note that interviewing has the strength of providing rich and in-
depth information (using probes) for exploratory insights. In parallel, Miles and Huberman
(1994) maintain that qualitative data gathering through interviews offers supplementary
information to validate quantitative data. In this study, a semi-structured in-depth interview
guide was developed to guide the elicitation of textual data from respondents. The broad
themes (based on the research aim and objectives) under which interviews were conducted
included the following: 1) the role of smartphones in backpacking 2) risk perceptions and 3)
risk reduction strategies. See interview guide in Appendix 13.6.
During interview sessions, the researcher led interviews by directing questions based on the
themes identified while allowing for flexibility in terms of structure, direction and depth.
Interviews were captured through audio recordings and note taking. Respondents were all
provided with a participant information sheet and a consent form to sign before the
commencement of interviews. Interviews were guided by Berg’s (2004) suggestion on
interviewing: order of questions, content, questioning style, appearance, and location of
interviews. All interviews lasted between 20-30 minutes.
5.5.2.2.4 Piloting of data collection instrument
As with the survey instrument, the interview guide was pretested on a single case in Cape
Coast to check for relevance, comprehension, coherence, timeliness, and potential results.
This exercise also helped in reviewing the themes, as well as the structure of the interview
guide before the main study. The next section discusses the researcher reflexivity in this
thesis.
5.5.2.2.5 Researcher reflexivity
The role of a researcher in qualitative research is very crucial and needs to be documented
with clarity to enable readers to understand how the researcher’s own ideals, values, beliefs,
emotions, disappointments, omissions and commissions affect the data collection and
understanding of the researched (Guba and Lincoln, 1994). Thus, reflexivity is the capacity to
reflect on one’s own experiences, values and behaviours during the process of data collection
and report writing (Feighery, 2006). Likewise, Ruby (1982) argues that the lived experiences
and worldview of a researcher impacts greatly on what they research and need to be
136

discussed as an important part of the study. Essentially, reflexivity is about unpacking the
‘research self’ and ‘human self’ and how that fit within the study. The ‘research self’ applies
to the ideology of science that supports objectivity in a study while the ‘human self’ refers to
how the personal idiosyncrasies of the researcher affect the data collection process.
Accordingly, Goodson and Phillimore (2004) think that to be able to get a better
comprehension of the researcher and their role in the fieldwork, they are required to
acknowledge and question their culture and identity in the research process.
It is important to note in this thesis that not only is the researcher a Ghanaian citizen but he
also has got some research experience regarding Ghana – through his own previous related
research. His experience with backpackers and the research milieu in the past raised his
expectations about the process of conducting the interviews in particular – thinking that
respondents would be ever willing to participate in the study. However, there were challenges
with getting some respondents to participate in the in-depth interviews because of
experiences they had with so called ‘needy people’ (one respondent noted) who came around
couching falsified stories to get financial help from tourists. There was a feeling of
disappointment by the researcher when some potential respondents refused to take part in the
study for fear of been deceived.
In addition, the researcher’s experience of backpacking also made him to pre-empt some
responses in the interview process which should not have been the case as this may have
affected the types of questions posed. This was quite at odds with the epistemological
conditioning of the quantitative dimension of the study which encourages researchers to
detach themselves from the research to bring about objectivity and make the research value-
free as much as possible. More importantly, even though the researcher believes in the ideals
of pragmatism – which supports the combination of different methods and approaches to
discover knowledge, the quantitative methods in this study appear to have overshadowed the
qualitative dimension – obviously because the researcher has more predilection for
quantitative methods. In fact, the analysis demonstrated more detail on the quantitative part
of the thesis than the qualitative bit. The next section discusses how the analysis was
conducted for the qualitative data.
137
5.5.2.2.6 Data processing and analysis
Following Miles and Huberman (1994) and Braun and Clarke (2006), this study employed
thematic analysis to analyse the qualitative data before conjointly interpreting them with the
quantitative results. Braun and Clarke (2006, p. 79) postulate that “thematic analysis is a
method for identifying, analysing, and reporting patterns (or themes) within the data. It
minimally organises and describes your data in (rich) detail.” It is believed that thematic
analysis is the most basic and suitable technique for analysing most qualitative research
(Daly, Kellehear and Gliksman, 1997). Therefore, one advantage of it is that it produces
results that are accessible to general educated audiences. It is also deemed suitable for both
small and large sample sizes (Frith and Gleeson, 2004). A disadvantage of this technique,
however, is that the focus on codes and themes could mask important information, which
may lead to superficial results and conclusions (Braun and Clarke, 2006).
Recorded interviews were transcribed and thematically analysed manually using both
deductive and inductive (grounded analysis) coding techniques. To Boyatzis (1998), the data-
driven inductive coding approach to thematic analysis is performed without an a priori
template serving as a guide for building themes from the data. In other words, themes emerge
from the data using this method. On the other hand, the deductive coding uses a priori themes
in the literature as a guide for the analysis (Crabtree and Miller, 1999). In this research, while
issues on perceived risk were themed based on an a priori template, those of risk reduction
strategies were data-driven – inductively coded. The ‘member checking’ or respondent
feedback/validation approach suggested by Lincoln and Guba (1985) was used to validate the
interview results and conclusions by contacting three (3) of the interviewees to approve them.
Generally, the feedback received from these three respondents showed the results from the
interviews conducted were reflective of respondents’ responses. Finally, ethical
considerations are germane to every research, thus the next section highlights potential
ethical issues and how they were addressed in the study.
5.5.2.3 Ethical considerations
Ethical considerations are important issues all researchers are enjoined to think about,
especially following several historical antecedents regarding human abuses – under the guise
of doing research (Creswell, 2012). Within the social science discipline, there are several
ethical issues for consideration in studies involving humans (such as the worthiness of the
138

research, researcher competence, benefits and costs for participants, risk, and honesty) (Miles
and Huberman, 1994). The most common ones are issues of informed consent, anonymity,
confidentiality and researcher honesty, which this thesis focussed on (Creswell, 2012).
Informed consent relates to seeking permission from a target respondent(s) or institution(s)
before starting an investigation. In this study, the purpose of the study and researcher’s
identity were disclosed vividly to backpackers, as well as the establishments from which they
were contacted. Following this discloser, those who declined participation were not coaxed or
incentivised to partake in the study. Moreover, for in-depth interviews, those who agreed to
partake in them were made to complete and sign a consent form due to the breadth of
information needed and the relatively longer time required in conducting them. Second, the
information elicited from participants was anonymised in that names and other identifiers
were not associated with them. Especially, for the qualitative research, pseudonyms (i.e. BP1,
BP2, BP3, BP4 etc.) were used in place of respondents’ real identities. Third, to ensure
confidentiality, the information elicited from respondents was not to be divulged to any third
party, but purposely used for what it is intended – a purely academic exercise. Additionally,
the researcher guaranteed the integrity of the research by guarding against plagiarism and
misrepresentation facts that arose from the research among others. Finally, data were secured
by making multiple copies on personal external memories and a computer to prevent
potential loss. Questionnaires were secured in a locker for security reasons until such a time
they may be safely culled.
5.6 Summary
The chapter discussed the methodology of the study by using a philosophical lens to justify
the research design and methods that were applied in this study. With the problem statement,
purpose of the study and objectives in focus, the researcher used pragmatism as the
epistemological lens – which necessitated the use of a mixed methods research design. The
adoption of this design then dictated the quantitative and qualitative methods proposed in this
research. The chapter that follows presents yet another important aspect of the thesis, which
is the data analysis. It commences with the profiling of backpackers in terms of socio-
demographic and travel related characteristics, as well as the activities performed with their
smartphones and additional electronic devices carried by backpackers in addition to their
smartphones.
139

6 CHAPTER SIX: BACKPACKERS’ PROFILE AND CHARACTERISTICS
6.1 Introduction
The previous chapter dealt with the methodological issues, as well as the specific methods for
this thesis. This first chapter on quantitative data analyses is concerned with descriptively
profiling backpackers in relation to their socio-demographic and travel characteristics, travel
experiences, and activities undertaken with smartphones in Ghana. It also presents data on
other electronic devices carried along by backpackers. Most importantly, as the crux of this
thesis, the chapter describes respondents’ perceived risk, drivers of their perceived risk and
outcomes thereof.
6.1.1 Socio-demographic characteristics of backpackers
This subsection focuses on the socio-demographic data of respondents. It presents issues on
gender, age, marital status, highest level of education, occupation, continent of origin, and
annual income before tax. Overall, 800 questionnaires were collected out of which 567 were
found usable for analysis. Table 6.16 indicates that there were more females (68.8%) than
males (31.2%) in the survey. Moreover, with an average age of about 25 years, most
respondents were within 20-29 years (59.8%), followed by those less than 20 years (20.5%).
Table 6.16: Socio-demographic characteristics of backpackers
Variables Frequency Percentage (%)Gender Male 177 31.2 Female 390 68.8 Total 567 100.0Age < 20 116 20.5 20-29 339 59.8 30-39 91 16.0 40-49 11 1.9 50+ 10 1.8 Total 567 100.0Marital status Married 71 12.5 Unmarried 496 87.5 Total 567 100.0Highest level of education High school 152 26.8 University/College 312 55.0 Postgraduate 103 18.2 Total 567 100.0
140

Table 6.1(continued): socio-demographic characteristics of backpackers
Variables Frequency Percentage (%)Profession/occupation Student 336 59.3 High level manager 30 5.2 Intermediate level manager 35 6.2 Supervisor 19 3.4 Skilled manual labour 30 5.2 Managerial/professional occupation 115 20.3 Unemployed 2 0.4 Total 567 100.0Continent of origin Europe 405 71.4 America 114 20.1 Asia 22 3.9 Australia 10 1.8 Africa 16 2.8 Total 567 100.0Income before Tax in year (US$) 0-10000 73 35.8 10,000-19,000 35 17.2 20,000-39,000 57 27.9 40,000-59,000 20 9.8 60,000-79,000 11 5.4 80,000+ 8 3.9 Total 204 100.0
A few of them were found to be 40 years and above (3.7%). Regarding marital status, the
study realised that most of the respondents were single (87.5%) while a few were married
(12.5%). The results also showed that slightly more than half (55.0%) were college or
university educated while a little more than a quarter (26.8%) had attained high school
education. In terms of occupation, more than half (59.3%) were still schooling (presumably
for another degree) while another 20.3% were professionals or into some type of managerial
jobs. A few were intermediate level managers (6.2%), high-level managers (5.2%), skilled
manual workers (5.2%) and supervisors (3.4%). Furthermore, most respondents originated
from Europe (71.4%) with Germans (20.6%) and Dutch (8.3%) constituting the bulk of
Europeans. Those from the American continent constituted the second highest number
(20.1%) followed by Asia (3.9%), and then Africa (2.8%). Finally, regarding annual income
before tax in a year, slightly more than a third (35.8%) earned incomes between US$ 0-
10,000 followed by those earning between US$ 20,000.00-39,000.00. On the average,
backpackers earned about US$ 23,189.40 per year. The next section describes the travel
characteristics of backpackers.
141

6.1.2 Travel characteristics of backpackers
This section describes the travel characteristics of backpackers based on accommodation
choices, major mode of transportation in Ghana, travel party and size, as well as travel
budget. In line with past studies (e.g. Pearce, 1990; Sorensen, 2002), it is illustrative from
Table 6.17 that many backpackers (75.7%) patronised budget accommodation facilities in
Ghana. Worth noting however is the fact that 17.4% also used upscale accommodation
facilities such as 2 star (6.0%), 3 star (4.9%), 1 star (4.6%) and 4 star (1.9%) hotels. It was
also found that a couple of backpackers used the services of homestay accommodation
facilities in the country (6.9%).
Table 6.17: Travel characteristics of backpackers
Variables Frequency Percentage (%)Choice of accommodation Budget (hostel, guesthouse) 429 75.7 1 star 26 4.6 2 star 34 6.0 3 star 28 4.9 4 star 11 1.9 Homestay 39 6.9 Total 567 100.0
Major mode of transport Trotro (local public transport) 354 62.4 Taxi (cab) 155 27.3 Rental car 30 5.3 Tour bus 26 4.6 Bicycle 2 0.4 Total 567 100.0
Travel Party to Ghana Alone 122 21.5 With someone 445 78.5 Total 567 100.0
Travel party size 2-4 268 82.7 5-6 48 14.8 7-8 8 2.5 Total 324 100.0
Travel budget (US$) <1000.00 178 55.6 1,000.00-2,000.00 80 25.0 2,100.00-3,000.00 28 8.8 3,100.00-4,000.00 11 3.4 4,100.00-5,000.00 11 3.4 >5,100.00 12 3.8 Total 320 100.0
142

In terms of mode of transportation, ‘trotro’, (a local public transport system in Ghana) was
mostly used by backpackers (62.4%). Other modes of transport used included taxicabs
(27.3%), rental cars (5.3%), tour buses (4.6%), and a few bicycles (0.4%). Interestingly,
divergent from past findings (e.g. Ateljevic and Doorne, 2004; O’Reilly, 2006), an important
observation in this study was the fact that most backpackers rather travelled with companions
(78.5%) while the minority (21.5%) did so solo. For those who travelled in groups, the
average group size was 3.0 with many found within groups of 2-4 (82.7%). Regarding their
travel budget, more than half of them (55.6%) had budgets below US$ 1,000.00 and a quarter
(25.0%) between US$ 1,000.00-2,000.00 for the period of their stays in Ghana. The average
travel budget stood at US$ 1,609.64 for this sample. Furthermore, past travel experience is an
important variable in backpacker studies. The next section addresses this in the sample in
relation to their general travel experiences and smartphone usage.
6.1.3 Backpackers’ travel experiences
This section describes backpackers’ experiences in relation to their familiarity with Ghana,
number of repeat visits made, experience of doing backpacking in general and of using their
smartphones. Table 6.18 suggests that a greater proportion of them were first-timers (88.2%)
while a few (11.8%) reported being repeat visitors to Ghana. Further to those who visited as
repeat visitors, more than half (58.3%) were doing that for the second time while slightly
more than a quarter (27.8%) the third time with the average number of visits being 3 times.
Concerning their general backpacking experiences, about two-thirds (68.1%) reported
repeating the practice as backpackers while almost a third (31.9%) were doing it for the first
time in their lives. The study also established that most respondents had done backpacking
for less 5 years (63.9%) whereas another 27.7% had backpacked between 5-10 years. On
average, respondents spent about 5 years and half in doing backpacking altogether.
Regarding their experiences of using smartphones, most (88.9%) answered in the affirmative
that they were repeating the use of their smartphones for travel while 11.1% of them used the
device during travel for the first time ever. Nearly three-quarters (72.9%) had used the device
for less than 5 years. Another 26.1% had been using it for 5 to 10 years while a few of them
for more than 11 years (1.0%). The study found that respondents had been using their
smartphones for averagely 5 years. In the next section, the activities backpackers used their
devices to perform and/or undertake while in Ghana are presented.
143

Table 6.18: Travel experience of backpackers
Variables Frequency Percentage (%)Familiarity with Ghana First-timer 500 88.2 Repeat visitor 67 11.8 Total 567 100.0Number of repeat visits 2.00 21 58.3 3.00 10 27.8 4.00 4 11.1 5.00 1 2.8 Total 36 100.0Backpacking experience First-timer 181 31.9 Repeater 386 68.1
Total 567 100.0Length of backpacking (in years) <5 76 63.9 5-10 33 27.7 11-15 6 5.0 16-20 3 2.5 21+ 1 0.8 Total 119 100.0Smartphone usage during travel First-timer 63 11.1 Repeater 504 88.9 Total 567 100.0Length of using smartphone (in years) <5 218 72.9 5-10 78 26.1 11+ 3 1.0 Total 299 100.0
6.1.4 Activities undertaken by backpackers with their smartphones in Ghana
This part of the chapter presents activities that backpackers used their devices to perform
while in the country. As per Table 6.19, respondents used their phones for a gamut of
activities some of which were quite conventional in nature whereas others were of
significance to their travel. The topmost activity undertaken by backpackers was social media
networking (19.9) such as Facebook, WhatsApp, Instagram, and snapchat. Other notable
activities also included emailing (16.4%), taking of photos (8.4%), phone calls (7.7%),
google maps for navigation (6.9%), booking of hotels, restaurants, and transport (6.8%),
entertainment (5.2%), and Internet surfing (5.2%). Quite a significant number also used their
smartphones for activities such as texting, planning of travel, searching for tourist
information, language translation, Internet banking, and airport check-ins etc. The section
hereafter presents additional electronic devices carried along to Ghana by backpackers beside
their smartphones.
144
Table 6.19: Activities undertaken/performed with smartphones
Activities Frequency Percentage (%)
Booking hotels, restaurants, transport etc. 163 6.8
Planning trip 68 2.8
Google maps (i.e. navigating/finding direction) 165 6.9
Social media networking (Facebook, WhatsApp,
Instagram, snapchat etc.)
475 19.9
Emailing 390 16.4
Entertainment (Music, Games etc.) 125 5.2
Translation 38 1.6
Taking pictures/photos 198 8.4
Making of video calls 16 0.7
Internet surfing 122 5.2
Research 44 1.8
Calendar 5 0.2
Skype 12 0.5
Phone calls 184 7.7
Texting/SMS 132 5.5
Checking time 15 0.6
Tourist information search 41 1.7
Reading news 37 1.6
Using alarm 7 0.3
Uber services 8 0.3
Internet banking 32 1.4
Global Positioning System (GPS) 13 0.5
Weather information search 18 0.8
Blogging 8 0.3
Taking notes 3 0.1
Shopping 15 0.6
Finding hotels/restaurants 17 0.7
Checking in at airport 28 1.2
Pay bills 7 0.3
Total 2386* 100.0
Note: *Frequency exceeds 567 because of multiple responses
6.1.5 Additional electronic devices carried along with smartphones to Ghana
From Table 6.20, it is evident that backpackers incrementally have become part of the
‘mobile elite’ – hypermobile in nature hence the neologism ‘flashpackers’ (Paris, 2012). The
145

study found that backpackers carried along not only their smartphones but other multiple
range of electronic devices to Ghana such as cameras (34.3%), laptops (26.1%), iPods
(8.9%), e-readers (e.g. kindle) (6.4%), portable chargers (power banks) (5.4%), tablets/iPads
(5.2%), and extra phones (cell phone) to mention a few.
Table 6.20: Additional electronic devices carried along with smartphones to Ghana
Activities Frequency Percentage (%)
Camera 321 34.3
Laptop 244 26.1
MP3 31 3.3
e-reader (Kindle) 60 6.4
iPod 83 8.9
Tablet/iPad 49 5.2
Portable charger (Power bank) 50 5.4
Walkman 9 1.0
Touch light 13 1.4
Electronic toothbrush 3 0.3
Extra phone (cell phone) 20 2.1
GPS tracker 6 0.6
Headphone 7 0.7
Wi-Fi router 9 1.0
Video Camera 4 0.4
Smartwatch 12 1.4
Hard drive 14 1.5
Total 935* 100.0
Note: *Frequency exceeds 567 because of multiple responses
One of the main foci of this study concerns backpackers perceived risk related to the use of
smartphones, thus the next section offers another descriptive account of their perceived risk
of using the device based on mean estimates and standard deviations.
146

6.1.6 Backpackers’ perceived risk of using smartphones
In this section, the study presents backpackers’ reactions towards individual items/statements
regarding different risk facets around mobile technology – as a lead up to modelling the
conjectural relationships in the structural model – using PLS-SEM.
Table 6.21: Perceived risk of using smartphones
Statement N Mean SD Skewness Kurtosis
Financial risk1. I feel that using a smartphone for travel in Ghana may cause
me to incur unnecessary costs. 567 2.4 1.2 0.5 -0.7
2. I am concerned that excessive mobile Internet fees may be charged during using a smartphone in Ghana.
567 2.7 1.3 0.3 -1.1
3. I feel using an Internet-bill service on my smartphone during travel in Ghana can expose me to potential fraud.
567 2.5 1.1 0.3 -0.7
Component score 567 2.5 1.2
Performance risk
1. I am not confident about my smartphone’s ability to perform as expected during travel in Ghana.
567 2.5 1.3 0.4 -0.9
2. The systems built into smartphones are not effective/secure enough to provide secure access to my mobile banking service in Ghana.
567 2.6 1.2 0.3 -0.8
3. Considering the challenges with mobile Internet performance, a lot of risk will be involved in making transactions with my smartphone in Ghana.
567 2.8 1.2 0.0 -0.8
4. I am not confident about the ability of online vendors in Ghana to deliver products and services via mobile phones.
567 3.0 1.1 -0.2 -0.6
Component score 567 2.7 1.2
Time risk
1. I am worried that using my smartphone during travel in Ghana will lead to inefficient use of my time.
567 2.4 1.3 0.4 -0.9
2. I am concerned about the time it takes to learn how to use a smartphone in Ghana.
567 1.8 1.1 1.3 1.0
3. I worry that using my smartphone during travel in Ghana will waste my time.
567 2.3 1.3 0.6 -0.8
Component score 567 2.2 1.2
Psychological risk 1. Using my smartphone while travelling in Ghana makes me feel
unconformable. 567 2.1 1.2 0.8 -0.5
2. Using my smartphone while travelling in Ghana gives me a feeling of unwanted anxiety.
567 2.1 1.2 0.8 -0.4
3. Using my smartphone while travelling in Ghana makes me feel nervous.
567 2.1 1.2 0.9 -0.3
Component score 567 2.1 1.2
Social risk 1. Using my smartphone in Ghana for travelling makes me think that
friends will see me as being showy or extravagant. 567 2.1 1.1 0.7 -0.5
147

2. Using my smartphone in Ghana for travelling makes me think of it as foolish/unwise by people whose opinion I value.
567 1.9 1.1 0.8 -0.0
3. Using my smartphone in Ghana for travelling will adversely affect others’ opinion about me.
567 2.1 1.1 0.8 -0.4
Component score 567 2.0 1.1
Scale: 1 = strongly disagree; 2 = disagree; 3 = neither agree nor disagree; 4 = agree; 5 = strongly agree
Table 6.6 (continued): Perceived risk of using smartphones
Statement N Mean SD Skewness Kurtosis
Security risk1. I feel insecure providing my private information over my smartphone
in Ghana.567 2.8 1.3 0.1 -1.1
2. I feel insecure sending sensitive information over the web with my smartphone in Ghana.
567 2.8 1.3 0.1 -1.2
3. I am worried to use my smartphone in Ghana because other people may be able access my account information.
567 2.7 1.3 0.1 -1.2
Component score 567 2.8 1.3
Destination-physical risk 1. I am concerned that my smartphone may be stolen or snatched from
me during travel in Ghana. 567 3.5 1.1 -0.5 -0.5
2. I worry that I may be physically attacked for possessing a smartphone during travel in Ghana.
567 2.9 1.2 0.1 -0.9
3. I think about the danger of holding my smartphone while travelling in Ghana.
567 3.2 1.2 -0.3 -0.9
Component score 567 3.2 1.2
Destination-Infrastructure risk 1. I worry that mobile Internet in Ghana may malfunction because of
slow download speeds or network concerns. 567 3.3 1.2 -0.3 -0.9
2. I worry that mobile Internet in Ghana is not secure enough to protect my private information.
567 3.0 1.2 -0.2 -0.8
3. I feel that I may be exposed to fraud by using mobile Internet in Ghana.
567 2.8 1.2 0.1 -0.9
Component score 567 3.0 1.2
Scale: 1 = strongly disagree; 2 = disagree; 3 = neither agree nor disagree; 4 = agree; 5 = strongly agree
The risk components reported herein involved financial, performance, time, psychological,
social, security, destination-physical, and destination-infrastructure risks. Notably, for the
descriptive data analysis, the sample size, mean scores and Standard Deviation (SD) are
presented – based on a 5-point Likert scale as follows: 1 = strongly disagree; 2 = disagree; 3
= neither agree nor disagree; 4 = agree; 5 = strongly agree. Table 6.21 gives a clear depiction
of respondents’ reactions towards each risk item in the use of smartphones. Overall, it could
be inferred from the mean scores of each item that backpackers were somewhat ambivalent or
148

better still less concerned about the risk of using smartphones in Ghana, especially
information technology risks. However, while the overall mean score for destination-physical
risk (mean = 3.2; SD = 1.2) shows that backpackers were indifferent about this risk in Ghana,
the risk of getting one’s phone stolen was expressed as a concern among backpackers (mean
= 3.5; SD = 1.1).
In relation to destination-infrastructure risk in general, backpackers had quite a neutral view
about the risk of using their smartphones in Ghana (mean = 3.0; SD = 1.2). Similarly, for
technology or device related risk, except for security risk (mean = 2.8; SD = 1.3), financial
risk (mean = 2.5; SD = 1.2), and performance risk (mean = 2.7; SD = 1.2) that backpackers
were impartial about, they did not show much concern about time (mean = 2.2; SD = 1.2),
psychological (mean = 2.1; SD =1.2), and social risks (mean = 2.0; SD =1.1). Yet another
important area of concentration in this thesis were the antecedents of backpackers perceived
risk hence the next section focuses on the factors that influenced their perceptions of risk.
6.1.7 Determinants of backpackers perceived risk
Understanding the drivers that might influence perceived risk regarding the use of
smartphones among backpackers is a consequential issue in this study providing an
opportunity to offer some practical implications to industry practitioners and mobile
marketers (Park and Tussyadiah, 2016). The study focussed on antecedents such as
familiarity, observability, innovation, and trust in their smartphone services. Akin to the
previous section on perceived risk (Section 6.1.6), the mean scores and SD for each item are
reported based on a 5-point Likert scale. As per Table 6.22, excluding the general uncertainty
with innovativeness in the use of smartphones (mean = 2.8; SD =1.2) and observability of its
utility and features (mean = 3.1; SD =1.0), backpackers acknowledged that they were familiar
with using their smartphones (mean = 4.3; SD = 1.0) and trusted them as well (mean = 3.6;
SD =1.0). The next part of this chapter now pays attention to the outcomes of their perceived
risk regarding smartphone usage.
149

Table 6.22: Antecedents of perceived risk
Statement N Mean SD Skewness Kurtosis
Familiarity1. Overall, I am familiar with a smartphone. 567 4.4 0.9 -2.1 4.1
2. I am familiar with searching for items on my smartphone. 567 4.4 0.9 -2.0 3.83. I am familiar with the process of purchasing on my
smartphone. 567 4.1 1.2 -1.3 0.8
4. I am familiar with the process of networking with my smartphone.
567 4.4 1.0 -1.8 2.6
Component score 567 4.3 1.0
Observability1. It is easy for me to observe others using the smartphone
during travel.567 3.1 1.0 -0.7 0.1
2. I have had a lot of opportunity to see the smartphone being used for travel purposes.
567 3.1 1.0 -0.9 0.3
Component score 567 3.1 1.0
Innovation 1. In general, I was among the first in my peers of friends to
use a smartphone for my travel needs. 567 2.5 1.2 0.3 -0.9
2. If I heard there was a new travel service on a smartphone, I would be interested enough to try it.
567 3.2 1.2 -0.3 -0.8
3. In comparison to my friends, I use many mobile travel services on a smartphone.
567 2.7 1.2 0.2 0.8
4. I would use a new mobile travel service(s) on smartphone even if none of my peers has tried.
567 3.2 1.2 -0.3 0.9
5. I knew about new mobile travel services on my smartphone before most of my peers.
567 2.5 1.2 0.3 0.8
Component score 567 2.8 1.2
Trust1. My smartphones have integrity. 567 3.5 0.9 -0.4 -0.1
2. My smartphones are reliable. 567 3.7 0.9 -0.5 0.03. Smartphones are trustworthy. 567 3.6 1.0 -0.4 -0.2
Component score 567 3.6 1.0
Scale: 1 = strongly disagree; 2 = disagree; 3 = neither agree nor disagree; 4 = agree; 5 = strongly agree
6.1.8 Consequences of perceived risk towards smartphone usage
Extant literature argues that perceived risk regarding a product or service often leads to a
multiplicity of consequences or outcomes (Jacoby and Kaplan, 1972; Jarvenpaa et al., 1999;
150

Park and Tussyadiah, 2016). Especially, outcomes such as satisfaction with smartphones and
with travel, as well as the intentions to reuse a smartphone for future travel were proposed in
this thesis. Hence, this section offers a description of these outcomes in relation to
backpackers’ perceived risk towards their smartphone usage. Analogous to the previous
section on perceived risk (Section 6.1.6), the mean scores and SD for indicators are presented
based on a 5-point Likert scale.
Table 6.23: Consequences of perceived risk
Statement N Mean SD Skewness Kurtosis
Satisfaction with smartphone 1. I am satisfied with my smartphone in comparison to other devices
during travel.567 3.4 1.2 -0.4 -0.8
2. My smartphone has helped me to meet my travel needs. 567 3.4 1.2 -0.4 -0.93. My smartphone meets my expectations during travel. 567 3.3 1.2 -0.3 -0.94. Overall, I am satisfied with my smartphone service(s). 567 3.4 1.2 -0.4 -0.9
Component score 567 3.4 1.2
Satisfaction with travel1. Overall, I am satisfied with my travel to Ghana. 567 4.3 1.0 -1.5 2.32. I am satisfied with my trip to Ghana when I compare it to other
trips. 567 4.0 1.0 -1.0 0.7
3. I am satisfied with my travel when considering the money and time spent.
567 4.0 1.0 -1.1 0.9
Component score 567 4.1 1.0
Intentions 1. I will use a smartphone for my travel needs in the future. 567 4.3 0.9 -1.5 2.32. I will keep using a smartphone for my travel needs. 567 4.3 0.9 -1.5 2.33. I will use mobile Internet for my future travel. 567 4.2 1.0 -1.4 1.64. I will use a smartphone for my travel arrangements in the future. 567 4.2 1.0 -1.3 1.4
Component score 567 4.3 1.0
Scale: 1 = strongly disagree; 2 = disagree; 3 = neither agree nor disagree; 4 = agree; 5 = strongly agree
From Table 6.23, it is evident that though backpackers were satisfied with their overall travel
experience (mean = 4.1; SD = 1.0), they were somewhat unresolved when it came to
satisfaction with using their smartphones (mean = 3.4; SD = 1.2). Nonetheless, most did
express their intentions to reuse their smartphones for future travel related purposes (mean =
4.3; SD = 1.0).
6.2 Summary
The descriptive statistics showed that most of the respondents were below 30 years with the
average age being 25 years. The majority originated from Europe and patronised the services
151

of budget accommodation facilities, used public transportation (locally known as ‘trotro’) and
largely travelled in groups of three (3). Among other activities, most backpackers used their
smartphones for social media interactions and taking of photos during travel. It was also
evident from the results that several of them travelled along with their cameras and laptops
among others. In terms of their risk perceptions, based on the mean scores, they appeared to
be ambivalent. However, most of them answered in the affirmative when it came to their
satisfaction with travel and intentions to reuse a smartphone for future travel purposes. Next,
confirming how well indicators measure a latent construct is an important practice among
theory-driven researchers. To set the basis for further analysis of the data, the chapter that
follows confirmed how suitably the proposed model fitted the dataset based on indices and
cut-off points in the literature as mentioned previously (Section 5.5.2.1.7).
152

7 CHAPTER SEVEN: EVALUATION OF MEASUREMENT MODELS
7.1 Introduction
Chapter Six presented the descriptive statistics necessary for this thesis to set the basis for
more detailed analysis of the data. Chapter Seven which is the second part of the quantitative
analysis is focused on examining the measurement models in this study prior to estimating
the structural paths using a component-based partial least squares technique. Estimating the
measurement models in this research is to help determine how well the proposed models fits
the dataset collected from the field. First, the fitness of the proposed conceptual model for the
study was assessed followed by an assessment of a second and third-order hierarchical
perceived risk constructs. The justification for the procedures employed is provided at each
stage. Furthermore, the internal consistency and validity of the measurements involved were
examined. As a recommended procedure for studies involving the use of a survey
questionnaire, the following subsection, examines if common methods variance/bias existed
in the data before evaluating the measurement models.
7.1.1 Inspection for Common Methods Variance (CMV)
Quantitative researchers (see Podsakoff et al., 2003; Luo et al., 2010; Agag and El-Masry,
2016) caution that CMV is most likely to occur when data on both exogenous and
endogenous variables are collected from the same sampling units using the same research
instrument. Not only would this issue potentially lead to an inflation in the true correlation
estimates among latent constructs, thereby, threatening the validity of one’s conclusions, but
also does become a key source of measurement error (Luo et al., 2010). This study checked
for the extent of CMV in the data in three (3) ways: First, as shown in Table 7.25, an
inspection of the correlation matrix specifies values less than 0.72, which meant that
correlations among latent variables were not very high (r > 0.90) (Park and Tussyadiah,
2016). Second, the Harman’s single-factor test was also used as an assessment criterion for
CMV (Podsakoff et al., 2003). CMV exists in the study if the factor analysis output shows
153

that the variance accounted for by a single factor is more than 50%. In this study, all
indicators in the measurement model were first used in an exploratory factor analysis –
yielding 15 latent factors with their corresponding eigenvalues being above 1. The absence of
CMV was evident from this analysis as all factors accounted for 76% of the total variance
explained but with the first (largest) factor accounting for 18% – below the cut-off point of
50%. Third, following the method proposed by Luo et al. (2010), the varimax rotation
technique in principal component analysis was used to rotate the initial solution. After this
procedure, each factor explained less than 8% of the overall variance. Thus, the criteria above
vividly confirmed the absence of common methods bias in this study. Next is an assessment
of the proposed measurement model for the study.
7.1.2 Validation of conceptual model
In this section, a Confirmatory Factor Analysis (CFA) technique was used to evaluate the
global fitness of the proposed conceptual model. In other words, it was used to determine
how well the model fitted the dataset. The maximum likelihood estimation method in Amos
22 was used to perform this analysis. Even though fit measures exist within PLS-SEM (which
is the proposed technique for estimating structural paths in this study), it is a principal
component-based approach often focusing on the inconsistency between the manifest
(observed) variables or the latent constructs’ parameters of exogenous variables and values
predicted by the model in question (Hair et al., 2017). As a result, there are no goodness-of-
fit indices in PLS-SEM because of its nonparametric nature but also, that of CB-SEM are not
fully transferrable to PLS-SEM (ibid). This made the CFA the best approach for validating
the measurement model because it wields global goodness-of-fit indices. However, the PLS-
SEM was used in estimating the proposed third-order latent construct of perceived risk and
the structural model due to the advantages it has over CB-SEM as mentioned earlier (see
Section 5.5.2.1.7).
Generally, the following subsection presents sequential procedures for validating all
measurement models composing not only single but also higher order factors for this study in
Amos 22 and SmartPLS 3.0.
154

7.1.2.1 Procedure in Amos – CB-SEM
1. As a first step, a validity or fitness test for the overall model involving all fifteen
(15) construct was performed by linking observed variables with their respective
latent variables and co-varying all constructs. The factor correlations, loadings,
model fit indices, as well as factoral validity and reliability were examined.
2. Second, the factor structure of perceived risk as a second-order construct was also
evaluated using eight (8) latent variables. With all manifest variables linked to their
respective constructs of perceived risk, a higher order abstraction was created and all
latent constructs reflectively linked to it. The factor loadings, squared multiple
correlations, probability values (p-value) and model fit indices were then inspected.
7.1.2.2 Procedure in SmartPLS 3.0 – PLS-SEM
This study followed Wetzels, Odekerken-Schroder and Oppen’s (2009) guidelines (in MIS
quarterly) for estimating the proposed third-order hierarchical latent construct of perceived
risk.
1. First, eight (8) first-order latent variables were created (FR, PR, TR, PSYR, SOR,
SECR, DPHR and DINFR) and reflectively linked to their respective clusters of
indicators – Mode A (FR_1-2, PR_1-3, TR_1-3, PSYR _1-3, SOR_1-3, SECR_1-3,
DPHR_1-3 and DINFR_1-3). This created factor loadings for the first-order model.
2. Second, two (2) abstractions were reflectively constructed to form the second-order
model: information technology risks and destination related risks. The constructs (and
indictors) generated from the first-order model served as the underlying latent
variables (measures) for information technology risk (FR_1-2, PR_1-3, TR_1-3,
PSYR_1-3, SOR_1-3, SECR_1-3) and destination risk (DPHR_1-3 and DINFR_1-3).
In effect, seventeen (17) manifest variables were repeated/reused for information
technology risks and six (6) for destination related risks.
3. Lastly, the third-order hierarchical latent construct of perceived risk was constructed
with information technology risks and destination risks serving as its underlying latent
constructs. This was constructed by repeating all 23 manifest variables for the two (2)
underlying latent variables as measures of the third-order latent factor.
155

In Amos 22, factor loadings were inspected for all 50 indicators in the model and loadings
below 0.5 were removed (Pallant, 2005; Filieri, Alguezaui and Mcleay, 2015; Hair et al.,
2017). One (1) item for financial risk (FR3), performance risk (PR1) and innovation (INO2)
were removed for falling below the cut-off point of 0.5.
Table 7.24: Confirmatory factor analysis output
Constructs Indicators Factor Loadings S.E. t-statistic p-value Cronbach’s
AlphaFinancial Risk (FR) FR1 0.77 0.09 10.73 *** 0.75
FR2 0.78 - -Performance Risk (PR) PR1 0.75 0.05 17.44 *** 0.78
PR2 0.89 - -PR3 0.58 0.05 13.39 *** 0.76
Time Risk (TR) TR1 0.83 0.05 17.29 ***
TR2 0.50 0.04 11.45 ***
TR3 0.88Psychological Risk (PSYR) PSYR1 0.86 0.04 25.86 *** 0.90
PSYR2 0.89 0.04 27.29 ***
PSYR3 0.86 - -Social Risk (SOR) SOR1 0.76 0.05 18.98 *** 0.86
SOR2 0.90 0.05 22.03 ***
SOR3 0.79 - -Security Risk (SECR) SECR1 0.87 0.04 25.55 *** 0.89
SECR2 0.87 0.04 25.24 ***
SECR3 0.85 - -Destination-physical Risk (DPHR) DPHR1 0.77 0.05 19.033 *** 0.85
DPHR2 0.80 0.05 19.74 ***
DPHR3 0.84 - -Destination-infrastructure Risk (DINFR)
DINFR1 0.55 0.05 13.67 ***0.81
DINFR2 0.93 0.04 25.94 ***
DINFR3 0.86 - -Familiarity (FAM) FAM1 0.95 0.03 39.78 ***
FAM2 0.97 0.02 41.72 *** 0.95FAM3 0.79 0.03 30.71 ***
FAM4 0.91 - -Observation (OBS) OBS1 0.78 0.06 14.33 *** 0.80
OBS2 0.86 - -Innovation (INO) INO1 0.66 0.06 15.09 *** 0.80
INO2 0.82 0.06 18.08 ***
156

INO3 0.59 0.06 13.48 ***
INO4 0.80TRUST (TRU) TRU1 0.86 0.04 25.97 *** 0.90
TRU2 0.87 0.04 26.75 ***
TRU3 0.88 - -S.E. = Standard error; SD = Standard Deviation p < 0.001***
Table 7.1 (continued) Confirmatory factor analysis output
Constructs Indicators Factor Loadings S.E. t-statistic p-value Cronbach’s
AlphaSatisfaction with smartphone (SATSP) SATSP1 0.78 0.03 25.25 *** 0.94
SATSP2 0.89 0.03 33.25 ***
SATSP3 0.95 0.02 38.69 ***
SATSP4 0.91Satisfaction with travel (SATRA) SATRA1 0.91 0.06 18.64 *** 0.85
SATRA2 0.80 0.06 17.68 ***
SATRA3 0.71 - -Intentions (INTEN) INTEN1 0.97 0.032 32.59 ***
INTEN2 0.95 0.033 31.61 *** 0.94INTEN3 0.78 0.038 25.19 ***
INTEN4 0.84 - -S.E. = Standard error; SD = Standard Deviation p < 0.001***
As per Table 7.24, all factors loaded significantly (p < 0.001) between 0.50 and 0.97, which
was indicative of the fact that the interrelationships between items and associated constructs
were high hence unidimensionality was achieved among all measurement constructs. For the
purposes of ensuring internal consistency of the measurements used in this study, the
Cronbach’s alpha (Table 7.24) and construct reliability values (Table 7.25) were checked
against the lower limit of 0.7 (Bagozzi and Yi, 1988; Kline, 2005; Hair, Ringle and Sarstedt,
2014). The values for both composite reliability (between 0.75 and 0.95) and Cronbach’s α
(between 0.75 and 0.95) for all constructs averaged above 0.7 suggesting that latent variables
exhibited adequate internal consistency.
Moreover, convergent and discriminant validity were assessed in the study. Convergent
validity is the extent to which the measures/indicators (of a construct) that are supposed to be
theoretically related are in fact related to each other (Hair et al., 2014). In other words,
indicators for a latent variable must share a higher proportion of the variance. In this study,
157

the convergent validity or communality test was assessed by using the AVE scores (Fornell
and Larcker, 1981). Table 7.25 indicates that the measures for various constructs correlated
well among themselves as shown by the AVE scores averaging above 0.5 (between 0.53 and
0.82) (Fornell and Larcker, 1981; Begozzi et al., 1991; Hair et al., 2011). This means that all
latent factors as per the test, explained more than half the variances in their respective
indicators suggesting minimal errors in the measurement scales utilised.
Discriminant validity measures how constructs are truly different from each other empirically
(Hair et al., 2017). This study confirmed this by three (3) different ways. First, following the
Fornell-Larcker criterion, for there to be discriminant validity in a correlation matrix, the
correlation within a construct should be higher than the intercorrelation between that
construct and another. Put differently, the square root of the AVE of a construct should be
higher than the intercorrelation among other constructs. From Table 7.25, the square root of
AVE for constructs as shown diagonally in boldface are higher than the intercorrelation
between those constructs and others. Second, items loaded better on their respective latent
constructs than on other factors thus there were no cross-loading issues with the measurement
items (Table 7.26) (Chin, 2010). As illustrated in Table 7.24 and Table 7.25, the latent
constructs in the proposed model satisfied discriminant validity as per the criteria specified
above. Third, was the HTMT ratio assessment (Henseler, Ringle and Sarstedt, 2015), which
further confirmed that the confidence interval of the HTMT did not include one (1)
suggesting there was no discriminant validity issues with this data. Hair et al. (2017) claim
that the HTMT procedure reliably detects discriminant validity issues in a dataset than the
other techniques. All constructs were indeed valid measurements of unique concepts or
diametrically different from each other.
Finally, the study examined the goodness-of-fit of the proposed model by using the chi-
square (χ2/df) test. Especially, the adequacy regarding its ability to mirror variance and
covariance of the dataset was validated using the goodness-of-fit test (Lee, 2009; Kline,
2011). However, due to the sensitivity of χ2/df to a sample size (Lee, 2009), other surrogates
such as goodness-of-fit index (GFI), adjusted goodness-of-fit index (AGFI), comparative fit
index (CFI), Turker-Lewis index (TLI), standardised root mean square error residual
(SRMR), and root mean square error of approximation (RMSEA) are recommended for
assessing the goodness-of-fit in a model (Lee, 2009; Kline, 2011; Hair et al., 2011).
158

Table 7.25: Latent correlation matrix
Construct CR AVE 1 2 3 4 3 6 7 8 9 10 11 12 13 14 15
1. Satisfaction with Travel 0.852 0.660 0.812
2. Financial 0.750 0.600 -0.107 0.775
3. Performance Risk 0.790 0.564 -0.157 0.404 0.751
4. Time Risk 0.791 0.570 -0.108 0.354 0.255 0.755
5. Psychological Risk 0.904 0.758 -0.184 0.330 0.269 0.394 0.871
6. Social Risk 0.860 0.674 -0.209 0.274 0.251 0.418 0.643 0.821
7. Security Risk 0.897 0.743 -0.088 0.387 0.547 0.219 0.417 0.360 0.862
8.Destination -physical Risk 0.845 0.646 0.007 0.146 0.273 0.186 0.470 0.332 0.425 0.804
9.Destination -infrastructure Risk 0.829 0.629 -0.056 0.336 0.543 0.207 0.385 0.353 0.723 0.517 0.793
10. Familiarity 0.948 0.821 0.463 -0.058 -0.132 -0.171 -0.203 -0.201 -0.020 0.108 -0.001 0.906
11. Observability 0.802 0.670 0.381 -0.034 -0.147 -0.114 -0.118 -0.132 -0.022 0.118 0.005 0.502 0.819
12. Innovation 0.813 0.525 -0.056 0.072 -0.047 0.033 0.146 0.175 0.062 0.068 0.087 0.054 0.138 0.725
13. Trust 0.903 0.757 0.220 -0.075 -0.240 -0.100 -0.086 -0.073 -0.053 -0.001 -0.060 0.351 0.424 0.329 0.870
14. Satisfaction with phone 0.936 0.786 0.227 -0.015 -0.068 -0.072 -0.041 -0.056 -0.035 -0.005 -0.017 0.187 0.120 0.115 0.182 0.887
15. Intentions 0.936 0.787 0.528 -0.141 -0.145 -0.150 -0.188 -0.150 -0.017 0.097 -0.008 0.522 0.476 0.161 0.352 0.285 0.887Note: Average Variance Extracted (AVE) scores show diagonally (in boldface).
Composite/Construct reliability (CR) >0.7; AVE= >0.5
159

Table 7.26: Pattern matrix
1 2 3 4 5 6 7 8 9 10 11 12 13 14 151 FAM2 0.990
FAM1 0.940 FAM4 0.922 FAM3 0.796
2 Inten1 0.991 Inten2 0.942 Inten4 0.828 Inten3 0.789
3 SafSP3 0.947 SafSP4 0.909 SafSP2 0.901 SafSP1 0.806
4 PR3 0.831 PR2 0.824 PR4 0.622 PR1 0.483
5 FR1 0.721 FR2 0.716
6 INO3 0.844 INO5 0.803 INO4 0.634 INO1 0.626 INO2 0.581
7 SOR2 0.932 SOR3 0.777 SOR1 0.752
8 TRU3 0.871 TRU2 0.864 TRU1 0.839
9 PHY2 0.922 PHY3 0.867 PHY1 0.850
160
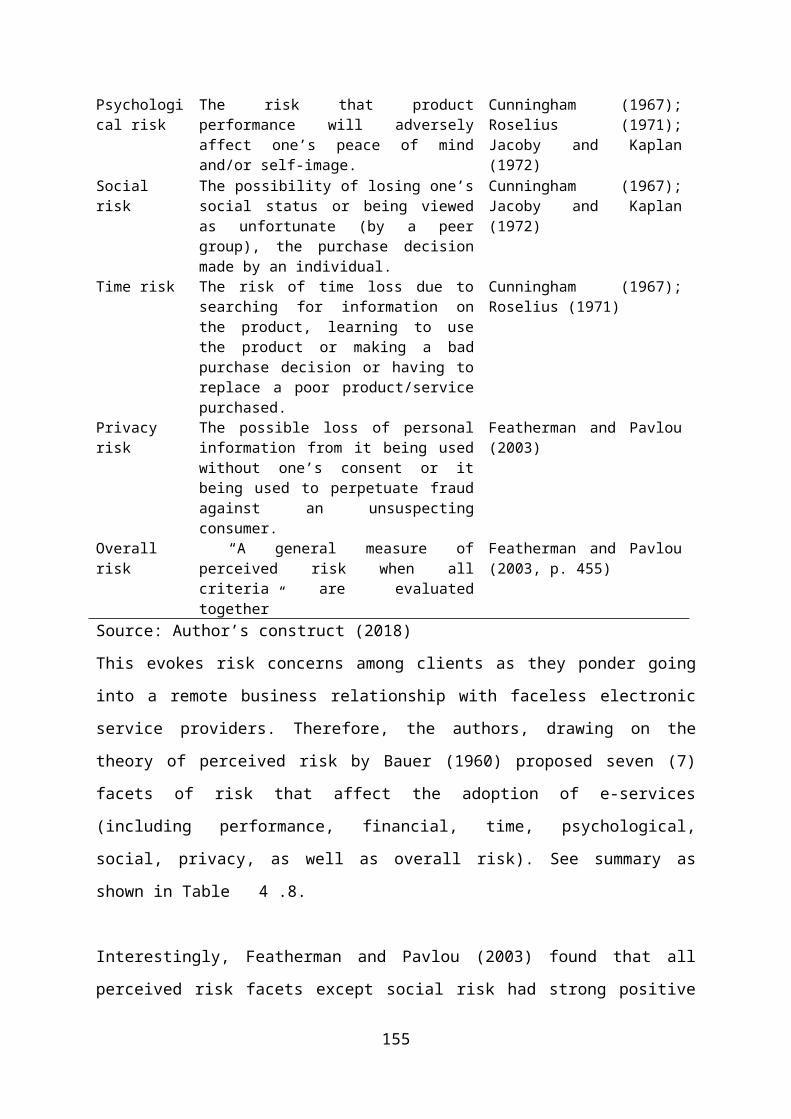
10 DPHYR3 0.790 DPHYR2 0.770 DPHYR1 0.765
11 SEC2 0.976 SEC1 0.877 SEC3 0.685
12 SafTRA2 0.918 SafTRA1 0.803 SafTRA3 0.671
13 TR3 0.924 TR1 0.860 TR2 0.822
14 INFR2 0.921INFR3 0.764INFR1 0.580
15 OBS1 0.862OBS2 0.775
Maximum likelihood estimation
161

In this thesis, fit indices were examined for the measurement model as follow. In column A1
of Table 7.27 is the χ2/df value for the measurement model, which serves as a traditional
measure for the overall model fit. This “assesses the magnitude of discrepancy between the
sample and fitted covariance matrices” (Hu and Bentler, 1999, p. 2) and should be non-
significant at a 0.05 threshold (Barrett, 2007). In this study, the χ2/df was below 3 (Kline,
2011) but significant (p < 0.001), thus there was no ‘badness-of-fit’ for the proposed model.
However, cognisant of the sensitivity of χ2/df to sample sizes, other indices as shown in Table
7.27 were assessed. Guided by recommended thresholds in B1, the GFI, AGFI, CFI, TLI,
SRMR, and RMSEA in A1 showed that the proposed conceptual model had a good fit or at
least tolerable global fitness. Next was an evaluation of the second-order model on perceived
risk.
Table 7.27: Fit indices of measurement model versus cut-off points in literature
Index Indices in this study
(A1)
Recommended
Cut-off (B1) Support for (B1)
χ2/df 1.81*** < 3 Kline (2011)
GFI 0.90 ≥ 0.90 Bagozzi, Yi and Phillips (1991)
AGFI 0.90 > 0.90 Mile and Shevlin (1998)
CFI 0.96 ≥ 0.90 Bagozzi, Yi and Phillips (1991)
TLI 0.95 > 0.95 Hu and Bentler (1999)
SRMR 0.06 < 0.08 Hu and Bentler (1999)
RMSEA 0.03 < 0.08 MacCallum, Browne and Sugawara
(1996)
p < 0.001***
7.1.3 Evaluating perceived risk as a hierarchical latent reflective construct
One of the main aims of this study was to model perceived risk as third-order hierarchical
latent construct before including it into the proposed structural model. The proposed third-
order latent variable involved two main underlying latent constructs: information technology
(IT) or device risk and destination related risks explained by six (6) and two (2) underlying
facets respectively. However, it was deemed important to first understand the factor structure
of perceived risk as a second-order hierarchical latent construct to ascertain its underlying
facets before proceeding to validate it as third-order hierarchical latent construct using PLS-
SEM. The CFA, which is more robust in terms of goodness-of-fit (Hu and Bentler, 1998) was
used initially to assess this measurement model to confirm the suitability of modelling
162
perceived risk as a second-order latent construct involving eight (8) dimensions before
considering it as third-order construct (see Figure 11).
7.1.3.1 Assessing second-order reflective hierarchical model of perceived risk
Hierarchical component models otherwise known as hierarchical latent variable models
represent multidimensional latent variables that are at an advanced level of abstraction and
are associated with latent variables at a parallel level of abstraction facilitating the effect from
and to their underlying latent factors (Chin, 1998). Therefore, hierarchical constructs are
different from unidimensional latent constructs, which are characterised by single underlying
factors (Netemeyer, Bearden and Sharma, 2003). Therefore, for Law, Wong and Mobley
(1998, p. 741), a construct becomes multidimensional or hierarchical
…when it consists of a number of interrelated attributes or dimensions and exists in
multidimensional domains. In contrast to a set of interrelated unidimensional
constructs, the dimensions of a multidimensional construct can be conceptualised under
an overall abstraction, and it is theoretically meaningful and parsimonious to use this
overall abstraction as a representation of the dimensions.
In assessing the second-order model of perceived risk, the study paid special attention to the
goodness-of-fit indexes for CFA. As shown in Table 7.28, this study did confirm the
suitability of modelling backpackers’ perceived risk towards smartphone usage as second-
order latent construct as indicated by eight (8) first-order latent constructs as follows:
financial, performance, time, psychological, social, security, destination-physical, and
destination-infrastructure risks. Thus, the study established that indeed, perceived risk can
include factors reflecting destination-physical risk and destination-infrastructure risks.
The CFA results showed that the proposed second-order construct had a tolerable goodness-
of-fit based on the cut-off points in Table 7.27. The χ2/df was lower than 3, GFI = 0.90,
AGFI = 0.90, CFI = 0.94, TLI = 0.93, SRMR = 0.09, and RMSEA = 0.05. Apart from the
TLI (0.93) and SRMR (0.09), which varied slightly from the cut-off points in Table 7.27, all
others suggested the second-order construct of perceived risk fitted the dataset. All lower-
order underlying constructs also loaded significantly (at p<0.001) between 0.55 and 0.83 on
the perceived risk latent construct.
163

Table 7.28: CFA analysis of perceived risk as a reflective second-order latent factor
Paths Factor
Loadings
(β)
Squared
multiple
Correlation
t-statistic p-value
Financial risk <--- perceived risk 0.66 0.44 7.25 ***
Performance risk <--- perceived risk 0.64 0.40 7.96 ***
Time risk<--- perceived risk 0.37 0.13 5.56 ***
Psychological <--- perceived risk 0.61 0.37 7.85 ***
Social risk <--- perceived risk 0.55 0.30 7.38 ***
Security risk <--- perceived risk 0.83 0.69 8.70 ***
Destination-physical risk <--- perceived risk 0.59 0.35 7.27 ***
Destination-infrastructure risk <--- perceived risk 0.81 0.65
8.53 ***
P < 0.001***; x2/df = 2.94***; GFI = 0.90, AGFI = 0.90, CFI = 0.94, TLI = 0.93, SRMR = 0.09, RMSEA =
0.05
The amount of variance explained in the underlying latent factors by the second-order model
ranged between 13% and 69% (Figure 11). The results indicated that backpackers were less
concerned about time risk (β = 0.37; r = 13%) but showed trepidation regarding all other risk
factors mentioned before. Especially, perceived security risk (β = 0.83; r = 69%) and
destination-infrastructure risk (β = 0.81; r = 65%) appeared to have hindered backpackers use
of smartphones. The less concern showed about time risk in this study is at odds with the
findings of Luo et al. (2010) and Park and Tussyadiah (2016) who found time risk as a
concern in m-service/commerce context. But, in a bid for more theoretical parsimony, the
following section focused on modelling perceived risk as a third-order hierarchical latent
construct (Wetzels, Odekerken-Schroder and Oppen, 2009).
164

Figure 11: Second-order CFA model of perceived risk
165

7.1.3.2 Specifying a third-order hierarchical latent construct of perceived risk (i.e. reflective-reflective)
Having achieved the goal of validating ‘perceived risk’ as a second-order hierarchical latent
construct, the study moved on to specify and estimate a third-order hierarchical latent
construct – using the repeated indictor approach in PLS-SEM (Becker, Klein and Wetzels,
2012). Studies support the applicability of both CB-SEM (e.g. Edwards, 2001; MacKenzie,
Podsakoff, and Jarvis, 2005) and PLS-SEM (e.g. Chin and Gopal, 1995; Tenenhaus et al.,
2005; Hair et al., 2017) in estimating hierarchical construct models though the former is often
constraint in several ways by data normality, factor indeterminacy, model complexity, and
identification (Fornell and Bookstein, 1982; Chin, 1998). In this study, the attempt to model a
third-order construct of perceived risk via CB-SEM was impeded by model identification and
complexity issues hence the decision to use PLS-SEM for this estimation. The justifications
for modelling perceived risk as a third-order construct using PLS-SEM are presented
hereafter.
Generally, the complex nature of the proposed model for the study mandated a reference to
the literature on higher-order hierarchical construct models (see Jarvis, MacKenzie, and
Podsakoff, 2003; Edwards, 2011; Polites, Roberts and Thatcher, 2012; Johnson et al., 2012).
Such models help to achieve more theoretical parsimony and reduce model complexity. To
Hair et al. (2017), hierarchical component models prove handy when first-order components
are highly correlated, which could potentially bias structural model estimations of
relationships due to collinearity and discriminant validity issues. When collinearity exists
among constructs, specifying higher-order components could decrease this problem and
possibly resolve issues of discriminant validity as well. Moreover, Edwards (2001) argues
that hierarchical latent variable models allow for matching the level of abstraction for a
predictor variable and criterion latent variables. Fischer (1980) assesses this as a measure of
specificity where a predictor and criterion latent constructs should be related at the same level
of abstraction. Most importantly, however, MacKenzie, Podsakoff and Podsakoff (2011) and
Johnson et al. (2012) note that to define and operationalise multidimensional latent
constructs, an important condition that needs to be satisfied is that it must be theoretically or
conceptually supported. In other words, theory should indicate the number of lower-order
dimensions and their association with higher-order constructs.
166

In this thesis, the need for a third-order model of perceived risk was informed by several
considerations. Perceived risk towards services in e-commerce has, no doubt, received ample
attention by researchers (e.g. Jacoby and Kaplan, 1972; Lee et al., 2003; Featherman and
Pavlou, 2003; Cunningham, Gerlach and Harper, 2005; Yang and Zhang, 2009; Kim et al.,
2013). However, most studies have examined perceived risk often as first-order latent
constructs and a few (e.g. Park and Tussyadiah, 2016) attempting to model it a second-order
latent variable before including it into a nomological network. This has introduced some
theoretical parsimony in the modelling of perceived risk through creating a higher-order
abstraction informed by lower-order underlying constructs. Constructs often used in the first
(lower) and second-order modelling of perceived risk include financial, performance, time,
psychological, social, physical, security, and privacy risks. These constructs can be clearly
classed as technology or device related risk factors (Crespo, del Bosque and de los Salmones,
2009; Luo et al., 2010). Moreover, a body of literature (see Section 4.7.1) exists on
destination related risks in the use of information technology but unfortunately, studies in
tourism have yet to comprehensively offer an understanding of how that can combine with
information technology risk to explain perceived risk of using smartphones. Ergo, this study
sought to examine backpackers risk perceptions by focusing on both information technology
risks and destination related risks. The study conjectured that backpackers’ perceived risk
about smartphone usage had two main dimensions: information technology risk and
destination related risk – informed by six (6) and two (2) underlying constructs respectively.
This specification required modelling perceived risk as a third-order hierarchical latent
construct.
Generally, Jarvis, MacKenzie and Podsakoff (2003) and Ringle, Sarstedt and Straub (2012)
provided a distinction between four (4) types of hierarchical component models in the
literature comprising reflective-reflective, reflective-formative, formative-reflective, and
formative-formative. In a reflective hierarchical construct (or molecular/factor/Mode A)
model, indicators are affected by the latent construct(s) while the reverse is true of a
formative measurement (or molar/Mode B/aggregate construct) model (Wetzels, Odekerken-
Schroder and Oppen, 2009). Even though Lee and Cadogan (2005) claim that there are no
such things as reflective-reflective (Type I) hierarchical latent variable models and that such
models are at best misleading and meaningless, this study adopted the reflective-reflective
approach for modelling perceived risk as higher-order latent variable. To Becker, Klein and
Wetzels (2012, p. 363), “…this type of hierarchical latent variable model is most appropriate
167

if the objective of the study is to find the common factor of several related, yet distinct
reflective constructs.” Lohmoller (1989), calls this type of hierarchical model “hierarchical
common factor” where the higher order abstraction represents the common factor of several
specific factors. For instance, Park and Tussyadiah (2016) used the Type I approach in
modelling perceived risk as a second-order construct within mobile booking context.
Similarly, within e-service context, Featherman and Pavlou (2003) modelled perceived risk
as a second-order construct using the Type 1 approach. Thus, these studies confirm the
suitability of modelling perceived risk as a reflective higher order latent construct despite the
controversy.
In addition, reflective measurements are more suitable when the items measuring the
construct are interchangeable in which case high correlation between the indicators are
expected to be high (Jarvis, Mackenzie and Podsakoff, 2003; Coltmana et al, 2008). This
means that the removal of an item does not change essentially the nature of the latent
construct. Also, with reflective measurement, a theory must inform the relationship between
constructs and this should shape how data will be collected (Wetzels, Odekerken-Schroder
and Oppen, 2009). On the contrary, formative measurement are suitable when items are not
interchangeable which means that items do not have to be highly correlated (Jarvis,
Mackenzie and Podsakoff, 2003). Here, the aim is to minimise the overlap between
complementary indicators because they cause the changes in the construct. Manifest variables
in formative measurement models are distinct from each other and the deletion of an item
will cause changes in the latent construct (Jarvis, Mackenzie, and Podsakoff, ibid).
Following Featherman and Pavlou (2003) and Park and Tussyadiah (2016) who modelled a
second-order construct of perceived risk (Type I) related to e-services and mobile travel
bookings respectfully, this study attempted to model a third-order hierarchical latent variable
of perceived risk with related but distinct reflective latent variables. All lower-level
constructs (of the 1st and 2nd order) were reflectively measured using guidelines by Wetzels,
Odekerken-Schroder and Oppen (2009) in MIS quarterly.
Furthermore, in PLS-SEM, due to the absence manifest variables for estimating construct
scores for higher-order hierarchical latent constructs, three (3) approaches to modelling
higher-order component analysis have been proposed: 1) the repeated indicator approach
(Wold, 1982), 2) the two-stage approach (see Wetzels, Odekerken-Schroder and Oppen,
168

2009; Ringle, Sarstedt and Straub, 2012) and 3) the hybrid approach (Wilson and Henseler,
2007). In the repeated indicator approach, which was the chosen approach for this study,
higher-order latent variables were created by specifying the latent factors that characterised
all observed variables of the underlying lower-order latent variables (Wold, 1982; Ringle,
Sarstedt and Straub, 2012). On the other hand, as latent variables scores are determinate in
PLS-SEM, scores for lower-order constructs are obtainable through the two-stage approach
(Chin, 1998) but this could lead to interpretational confounding since it fails to take the whole
nomological network into account (Wilson and Henseler, 2007).
Table 7.29: Third-order hierarchical latent construct reliability and validity test results
Constructs Cronbach's αComposite
reliabilityAVE
Destination infrastructure risk (DINFR) 0.81 0.89 0.729
Destination physical risk (DPHR) 0.85 0.91 0.764
Destination risk (DR) 0.83 0.88 0.546
Financial risk (FR) 0.75 0.89 0.800
Information technology risk (ITR) 0.88 0.89 0.347
Performance risk (PR) 0.78 0.87 0.692
Perceived risk (PerRisk) 0.92 0.91 0.326
Psychological risk (PSYR) 0.90 0.94 0.838
Security risk (SECR) 0.89 0.95 0.828
Social risk (SOR) 0.86 0.91 0.779
Time risk (TR) 0.76 0.86 0.678
Hence, the repeated indicator approach was used in the estimation of the third-order
hierarchical construct of perceived risk. This is often suitable when constructs have similar
number of indicators (Lohmoller, 1989; Wetzels, Odekerken-Schroder and Oppen, 2009).
However, one possible weakness of this approach is that the repeated use of the same
indicators can result in artificially correlated residuals (Becker, Klein and Wetzels, 2012).
The following presents the results of the proposed third-order hierarchical latent constructs.
In evaluating the psychometric properties of measurements for the third-order model Wetzels,
Odekerken-Schroder and Oppen (2009) suggest an initial assessment of the null model in
169

which no structural relationships are established. Thus, to evaluate the adequacy of this
model, the reliability (i.e. Cronbach’s alpha and composite reliability) and validity (i.e.
convergent and discriminant validity) of the measurements were inspected, as well as their
cross-loading (Fornell and Larcker, 1981; Chin, 1998). Table 7.29 shows there was adequate
internal consistency in the measurements as evidenced by the Cronbach’s alpha (between
0.75 and 0.92) and composite reliability (between 0.86 and 0.95) estimates. Values for these
indexes exceeded the cut-off point of 0.7. Convergent validity of constructs was determined
using a cut-off point of 0.5 for the AVE (Fornell and Larcker, 1981). All constructs except
the abstractions of information technology risks (ITR) and perceived risk met the criterion for
convergent validity. As well, following the Fornell-Larcker criterion, discriminant validity
was assessed. The square root of the AVEs for all constructs except ITR and perceived risk
exceeded the intercorrelations between those constructs and other different constructs, thus
confirmed the presence of discriminant validity. An inspection of the cross-loadings, which is
another measure of discriminant validity (Chin, 1998), indicated that items loaded adequately
on their respective constructs than on other constructs.
Furthermore, Table 7.30 shows that all path coefficients or factor loadings averaged
significantly (p < 0.001) above the 0.5 cut-off point (between 0.52 and 0.94) for all constructs
(Pallant, 2005; Hair et al., 2017). In terms of the variance explained by the model, Figure 12
demonstrates that perceived risk accounted for 89% of the variance in information technology
risks and 66% in destination risk. Similarly, while information technology risk explained
between 27% and 59% of the variance in its six (6) underlying latent constructs (indicators),
destination risk explained 73% for both destination-infrastructure and destination-physical
risks.
Unfortunately, based on the estimations above, the original proposal to model perceived risk
towards the use of smartphones as a third-order theoretical construct consisting of two (2)
main underlying latent factors: information technology risk and destination related risk as
indicated by six (6) and two (2) first-order latent variables respectively was dismissed on
grounds of lack of discriminant validity and low AVEs/convergent validity.
Thus, the study rather considered evaluating perceived risk as a second-order hierarchical
latent construct before incorporating it into the nomological network in the structural model
170

for testing. Therefore, the next section assesses the second-order measurement model using
PLS-SEM.
Table 7.30: Third-order hierarchical latent construct of perceived risk
PathsPath coefficients
(β)SD t-statistic p value
Destination risk -> Destination-infrastructure risk 0.85 0.01 76.88 ***
Destination risk -> Destination-physical risk 0.85 0.01 69.74 ***
Information technology risk -> Financial risk 0.52 0.03 13.44 ***
Information technology risk -> Performance risk 0.58 0.03 15.56 ***
Information technology risk -> Psychological risk 0.77 0.01 41.06 ***
Information technology risk -> Security risk 0.71 0.02 29.85 ***
Information technology risk -> Social risk 0.72 0.02 25.03 ***
Information technology risk -> Time risk 0.62 0.03 18.01 ***
Perceived risk -> Destination risk 0.81 0.01 49.22 ***
Perceived risk -> Information technology risk 0.94 0.00 174.26 ***
SD = Standard Deviation
p < 0.001***
171

Figure 12: Third-order reflective-reflective hierarchical model of perceived risk
172

7.1.3.3 Revision of perceived risk from third to second-order hierarchical latent construct
Due to the failure to achieve the initial objective of statistically confirming the factor
structure of perceived risk as a third-order hierarchical latent construct, this study resorted to
modelling it as second-order latent variable using PLS-SEM. Hence, the measurement quality
of this approach was examined by following the guidelines as suggested by Wetzels,
Odekerken-Schroder and Oppen’s (2009).
1. First, eight (8) first-order latent variables were created (FR, PR, TR, PSYR, SOR,
SECR, DPHR and DINFR) and reflectively linked to their respective clusters of
indicators – Mode A (FR_1-2, PR_1-3, TR_1-3, PSYR _1-3, SOR_1-3, SECR_1-3,
DPHR_1-3 and DINFR_1-3). This created factor loadings for the first-order
multidimensional model.
2. Second, a higher-order abstraction christened ‘perceived risk’ was constructed by
using all 23 manifest variables from the first-order. The constructs (and indictors)
generated from the first-order model reflectively served as the underlying latent
variables (or measures) (i.e. FR_1-2, PR_1-3, TR_1-3, PSYR_1-3, SOR_1-3,
SECR_1-3, DPHR_1-3 and DINFR_1-3) for the higher-order abstraction.
The results of the psychometric properties were as follows. Following initial cut-off points
earlier mentioned (Table 7.27), there was adequate internal consistency as proved by the
Cronbach's α (between 0.75 and 0.90) and composite reliability (between 0.86 and 0.94)
measures. In terms of convergent validity, all underlying constructs of perceived risk met this
criterion – with values averaging above 0.5. Discriminant validity was also confirmed using
three (3) methods. First, guided by the Fornell-Larcker criterion, the square roots of the
AVEs of the same risk constructs were greater than the intercorrelations with other
constructs. Second, the HTMT ratio assessment (see Henseler, Ringle and Sarstedt, 2015)
confirmed that the confidence interval did not include one (1). Third, an inspection of the
cross-loadings, which is another measure of discriminant validity (Chin, 1998), indicated that
items loaded adequately on their related constructs than on other constructs. It was concluded
that all the underlying latent constructs of perceived risk were diametrically and theoretically
different from each other. Path coefficients average significantly (p < 0.001) between 0.47
and 0.76 for all constructs. This indicated a moderate to strong relationships between
173

perceived risk and it underlying constructs. In terms of the variance explained by the model,
Figure 13 shows that perceived risk accounted for 56% of the variance in DINFR, 38% in
DPHR, 23% in FR, 34% in PR, 53% in PSYR, 59% in SECR, 44% in SOR, and 29% in TR.
Considering both the CFA and PLS-SEM results, the estimation of perceived risk as second-
order hierarchical latent construct was statistically fitting for the data than the proposed initial
third-order latent construct. Hence, as with the CFA, it is argued that perceived risk towards
smartphone usage can effectively be modelled as a second-order hierarchical latent construct
consisting of eight (8) underlying latent constructs: destination-infrastructure, destination-
physical, financial, performance, psychological, social, and time risks. Especially, the
inclusion of destination-infrastructure and destination-physical risk factors in the current
study was pertinent in understanding perceived risk towards the use of smartphones. The next
section compared different models of perceived risk before estimating the structural model
for the thesis.
174
Figure 13: Second-order hierarchical latent construct of perceived risk
175
7.1.3.4 Fitness comparison among different models of perceived risk
One of the major postulations in this thesis was that perceived risk concerning the use of
smartphones involved both information technology risks and destination related risks that
needed to be understood. Using CFA in Amos, which has a goodness-of-fit test ability, the
study compared the original model of perceived risk (comprising six (6) latent constructs)
(Featherman and Pavlou, 2003; Cunningham, Gerlach and Harper, 2005; Park and
Tussyadiah, 2016) with the alternative model involving eight (8) latent constructs. While the
former (which involved factors such as FR, PR, TR, PSYR, SOR and SECR) can generally
be described as IT risks as mentioned earlier (Section 7.1.2), the latter (including DPHR and
DINFR) can be labelled destination risks (DR). Therefore, it is maintained in this thesis that a
combination of both IT risks and DRs offers a holistic and comprehensive understanding of
perceived risk towards smartphone usage as supported by the CFA results in Table 7.31.
Table 7.31: Fitness comparison between the initial and alternate model of perceived risk
x2/df SRMR CFI TLI RMSEA AIC
Original modela of perceived risk with six
(6) latent constructs.
3.55 0.10 0.94 0.93 0.07 419.27
Alternate modelb of perceived risk with
eight (8) latent constructs.
2.94 0.09 0.94 0.93 0.05 826.51
Note: a Original model has six (6) underlying constructs b Alternate model has (8) underlying constructs
Table 7.31 shows evidence of improvement in the fit indices of the current or alternate model
of perceived risk in terms of x2/df, SRMR, RMSEA and AIC while CFI and TLI remained
unchanged. Notably, the x2/df of the revised model (2.94) appeared much better than the
original model (3.55), which considered only IT risk facets. Therefore, this study empirically
demonstrated that perceived risk towards the use of smartphones is better understood using
eight (8) constructs (i.e. FR, PR, TR, PSYR, SOR, SECR, DPHR and DINFR) than the
original theorisation involving just IT related risk facets (i.e. FR, PR, TR, PSYR, SOR and
SECR).
7.2 Summary
The evaluation of the measurement model involving all fifteen (15) constructs confirmed that
there was adequate internal consistency and validity of the measurements used in the data
176

collection. This provided the foundation for further analysis in terms of estimating the
structural model and other related analysis in the study. Also, this study proposed a third-
order hierarchical latent construct of perceived risk which was unsupported by the analysis
resulting in the revision of the third-order model to a second-order hierarchical latent
construct. Both CB-SEM and PLS-SEM evaluations confirmed that the data supported a
second-order hierarchical latent construct for perceived risk than a third-order construct.
Furthermore, a comparison of the proposed model (including eight latent constructs) with the
previous model (comprising six latent constructs) showed that perceived risk is better
formulated as a second-order hierarchical latent construct with eight (8) factors: FR, PR, TR,
PSYR, SOR, SECR, DPHR and DINFR. The section that follows estimated the structural
model for the thesis.
177

8 CHAPTER EIGHT: ASSESSING THE STRUCTURAL MODEL
8.1 Introduction
Having achieved the objective of modelling perceived risk as second-order latent construct,
the study assessed the proposed structural path model. This was done by embedding the
theorised second-order latent construct into a nomological network of relationships to test the
hypothesised paths and predictive relevance of the model. The PLS-SEM was considered as
an appropriate technique for this test than CB-SEM due to the complex nature of the
proposed model involving many hypothesised relationships (Ringle, Sarstedt and Straub,
2012; Hair et al., 2017). Second, the goal of this study was to extend the theory of perceived
risk of which PLS-SEM suited the analysis most (Hair et al., 2017).
8.1.1 Structural model and hypotheses testing
In Table 8.32 are the test results of the proposed conjectural statements. Non-significant paths
are illustrated in dotted lines. In Figure 14 are also the squared multiple correlations or
coefficients of determinations (R2) for the model, which reflect the amount of variance
explained in the endogenous variables by all exogenous variables linked together or simply,
the predictive power of the model. In all, the proposed model accounted for 6% of the
variance in perceived risk, 31% in intentions to reuse a smartphone for future travel, 2% in
satisfaction with travel, and nothing in satisfaction with smartphone.
The bootstrapping routine as suggested by Hair et al. (2017) was performed using a sample of
5000 to calculate the t-statistic and strength of relationships between predictors and
endogenous variables. In short, this aided in determining the impact of each covariate on an
endogenous variable. The results indicate that perceived risk regarding the use of
smartphones was jointly predicted by familiarity (β = -0.09, p < 0.05), innovation (β = -0.19,
p < 0.001), and trust in their smartphone services (β = -0.13, p < 0.001) except observability
(β = 0.00, p < 0.93). Hypotheses H2, H4, and H5 were supported. Furthermore, the intentions
to reuse a smartphone for travel related purposes was significantly influenced by trust in the
device (β = 0.22, p < 0.001), travel satisfaction (β = 0.40, p < 0.001), and satisfaction with
smartphone (β = 0.15, p < 0.001), except perceived risk (β = -0.02, p < 0.56).
178

Table 8.32: Standardised path estimates and hypotheses testing
Hypothe-
sis (H)
Paths
Path
coefficientsSD
t-
statistic
p
valueResult
H2: Familiarity -> Perceived risk -0.086 0.040 2.12 * supported
H3 Observability -> Perceived risk -0.004 0.047 0.09 n.s Not supported
H4: Innovation -> Perceived risk 0.191 0.065 2.93 *** supported
H5 Trust -> Perceived risk -0.132 0.043 3.07 *** supported
H6 Trust -> Intentions to reuse
smartphone 0.221 0.038 5.82 *** supported
H7Perceived risk -> Satisfaction with
smartphone -0.065 0.047 1.39 n.s Not supported
H8 Perceived risk -> Satisfaction with
travel -0.154 0.045 3.46 *** supported
H9 Perceived risk -> Intentions to reuse
smartphone -0.021 0.035 0.60 n.s
Not supported
H10 Satisfaction with travel -> Intentions
to reuse smartphone 0.400 0.048 8.33 *** supported
H11 Satisfaction with smartphone ->
Intentions to reuse smartphone 0.155 0.034 4.53 *** supported
SD = Standard Deviation n.s = not significant
p < .05*; p < 0.001***
Finally, perceived risk significantly influenced travel satisfaction (β = -0.15, p < 0.001) but
not satisfaction with smartphone (β = -0.07, p < 0.17) and the intentions to reuse it for future
travel needs (β = -0.02, p < 0.55). Therefore, the model also supported H6, H10, H11, and
H8. Next was an estimation of the predictors’ individual contributions to the R2 values, as
well as their predictive relevance as far as endogenous variables were concerned in this study.
179

Figure 14: Structural path model and predictive validity of perceived risk
180

8.1.2 Evaluating effect size (f2) and predictive accuracy of the model
Assessing the contribution of a predictor(s) to the variance explained in an endogenous latent
variable is often recommended in PLS path modelling analysis (Hair et al., 2017) through the
computation of effect size (f2) test (Cohen, 1988). Table 8.33 shows the contribution (f2 value)
of each exogenous variable to the R2 estimates in the model. Using guidelines (0.02 = small,
0.15 = medium and 0.35 = large) suggested by Cohen (1988) for assessing f2 of a given
structural model, the results revealed no (0.00) to medium (0.21) effect size on the variance
explained by the model. For instance, while trust in their smartphone services and innovation
had a relatively small effect of 0.02 and 0.04 respectively on the prediction of perceived risk,
familiarity and observability had no contribution to the R2. Perceived risk had a small (0.03)
contribution to the predictive power of the model when it comes to satisfaction with travel
but pulled no effect on satisfaction with smartphone and intentions to reuse smartphone.
Furthermore, satisfaction with travel and with smartphone had medium (0.21) and small
(0.03) effects respectively on the intentions to reuse a smartphone for future travel purposes.
In parallel, trust had a small (0.07) contribution to the variance explained in intentions.
Table 8.33: Test for effect size (f2)
Paths f2 Results
Familiarity -> Perceived risk 0.01 No effect
Innovation -> Perceived risk 0.04 Small
Observability -> Perceived risk 0.00 No effect
Trust-> Perceived risk 0.02 Small
Perceived risk -> Intentions to reuse smartphone 0.00 No effect
Perceived risk -> Satisfaction with travel 0.03 Small
Perceived risk -> Satisfaction with smartphone 0.00 No effect
Satisfaction with travel -> Intentions to reuse smartphone 0.21 Medium
Satisfaction with smartphone -> Intentions to reuse smartphone 0.03 Small
Trust-> Intentions to reuse smartphone 0.07 Small
In addition to evaluating the predictive power of the model using the R2 values, Hair et al.
(2017) recommend the estimation of the Stone-Geisser’s Q2 value, which is an out-of-sample
predictive power technique used to assess the predictive relevance of a PLS path models. In
other words, it determines the predictive precision of data not used in the model estimation.
Q2 values greater than zero (0) indicate the model’s predictive relevance/accuracy for a
181

dependent latent variable. In this research, using the blindfolding routine as suggested by
Hair et al. (2017), estimates were used to replace actual data points recursively at an omission
interval of 5 and the results were as follows. The analysis unequivocally confirmed the
predictive relevance of the model for perceived risk (0.02), satisfaction with travel (0.02), and
intentions to reuse smartphone (0.23) as Q2 values were above zero (0). On the contrary, the
model had no predictive relevance regarding the satisfaction with smartphone (0.00).
Whereas the model was valid in predicting most of the endogenous latent variables specified
in the model, it was not valid as a predictor for others (i.e. satisfaction with smartphone).
8.2 Summary
This chapter tested the proposed hypotheses for the study. The results showed that H2, H4,
H5, H6, H8, H10, and H11 were supported by the data while H3, H7, and H9 were rejected.
In terms of the contribution of each predictor to the variance explained in an endogenous
variable, the effect size (f2) ranged from no effect to medium effect. Especially, familiarity
and observability had no effect on perceived risk and so did perceived risk not have a
significant effect on the intentions to reuse a smartphone and satisfaction about it. Literature
suggests that risk perceptions are often accompanied by risk reduction strategies – the focus
of the following chapter.
182

9 CHAPTER NINE: RISK CONCERNS AND REDUCTION STRATEGIES
9.1 Introduction
Chapter Eight estimated the conceptual model for the thesis and tested the proposed
hypotheses associated with it. This chapter on risk reduction strategies is a qualitative account
of some of the risk concerns expressed by backpackers regarding the use of their smartphones
in Ghana and especially the risk reduction strategies they adopted. Based on the theoretical
saturation of responses, 15 backpackers were interviewed (See Table 9.1) and data was
analysed thematically using both inductive and deductive coding techniques.
Table 9. 10: Sample description for qualitative interviews
Backpackers (BP) Gender Age Nationality
BP1 Male 35 German
BP2 Male 28 American
BP3 Female 24 Finnish
BP4 Female 24 Dutch
BP5 Female 18 German
BP6 Female 23 Dutch
BP7 Male 23 Dutch
BP8 Female 28 German
BP9 Male 31 Israeli
BP10 Female 29 American
BP11 Female 23 Swiss
BP12 Female 23 Swiss
BP13 Male 27 Chinese
BP14 Male 18 American
BP15 Male 26 American
As noted heretofore, Dowling (1986) opines that a consumer will acquire a product or service
if the risk perceived surpasses his/her risk tolerance threshold, but there is a way(s) to reduce
or counteract it (Roselius, 1971). Sjöberg (1980) alludes that risk reduction is related to the
anticipated severity of the outcome, should it occur. Essentially, the analysis of the semi-
structured interviews revealed that backpackers did have destination-infrastructure, security,
183

and destination-physical risk concerns regarding the use of their smartphones (corroborating
findings from quantitative research). This, therefore, resulted in both cognitive and non-
cognitive (overt) responses to reduce their risk concerns as presented below.
9.1.1 Risk concerns in using smartphones and how they were reduced
Semi-structured interviews with backpackers regarding their risk concerns of using
smartphones in Ghana revealed mixed reactions. While some expressed similar concerns
regarding Internet security, physical risk, performance risk and infrastructural risk issues (as
evidenced by the quantitative results), others thought the risk of using a smartphone and the
Internet were not only a preserve of Ghana but everywhere in the world. The findings from
the qualitative research corroborated some findings from the quantitative study but also
seemed to suggest mixed views regarding perceived risk. However, for those risk concerns
uttered by the respondents, a range of risk reduction measures were reported. The sections
that follow present the specific issues around which the interviews were conducted.
9.1.2 Security risk
Security risk relates to the likelihoods of a smartphone user having his or her private
information compromised resulting in fraud or money loss. Internet related security risk
concerns came up as one of the topical subjects through the interviews but also the survey
(see Section 7.1.3.1). On the one hand, it was interesting to note that the perception that the
‘world-of-Internet’ is without bounds, shaped how some participants perceived security risk
related to their smartphones while travelling in Ghana. It was apparent from the interaction
with some respondents that though they thought that their money and vital information could
be preyed upon through using the Internet on their smartphones, they also believed this was
not exclusive to just Ghana, thus they were reluctant to associate poor cyber-security with the
country. For example, BP1 articulated:
…for me, the Internet world is totally without any boundaries at all, you know! So, I
really have the feeling when I am on the Internet that this is the WWW that I am on and
not the Ghanaian web [laughter]. So, anything that happens to me is from the globe and
not Ghana, for me this is very important.
With a similar disposition, the following quote reflects BP3’s view:
184

…I am not using my phone for anything that will connect to my credit card because I
am scared in general…not because I am in Ghana. I do not do that for fear of getting
my private information leaked…I do not use my phone for banking here and
everywhere else…
On the other hand, the results also seemed to highlight a certain sense of distrust among the
respondents with regard to using a smartphone for online banking. This corroborates
Whinston and Zhang’s (2003) argument that electronic commerce is characteristically risky
in nature as consumers deal with facelessness in the process, therefore, trust can assure
confidence in such consumers. The study revealed that not only did respondents show
trepidation about online banking but also the perception about a smartphone being a mere
mobile phone might have intensified it. Yang and Zhang (2009) espouse the view that the
features of smartphones such as smaller screen, unconscious and hidden processing, make
users unwilling to fully utilise them for Internet related transactions. Thus, some respondents
would rather do such transactions as online payments using their personal computers than use
smartphones. Interaction with respondents on this subject matter revealed the opinion of BP9:
…I rather use my personal computer for various important activities such as electronic
payments because I have Internet in my apartment. But generally, I will trust the
Internet because I have apps of my credit cards that I use to transfer money from one
bank account to another but always to myself… not to other people. I try to avoid my
smartphone because it seems like just a mobile phone for me…so not something you
want to trust so much.
9.1.3 Destination-physical risk
Apart from the security concerns of using devices, backpackers also expressed worries about
the use of smartphones in the physical environment. Generally, the physical risk associated
with a smartphone relates to the risk of losing the device through snatching, theft or even
robbery, which could possibly result in the loss of confidential personal information or data.
Similar to Section 9.1.2, though backpackers voiced some physical risk concerns regarding
the use of their smartphones, they also noted this was not only unique to Ghana but
everywhere. Hence, the strategies they employed in Ghana were no different from the ones
they would use back home or in other locations. Inferably, these strategies could broadly be
regarded in this study as cognitive and non-cognitive measures.
185
Through the semi-structured interviews, it was observed that some respondents gave a
cognitive response to the risk of losing their phones by accepting or coming to terms with
themselves that it was a likely incident that could happen to them. This consciousness
suppressed the fears of bringing their smartphones to Ghana. In the words of BP3:
Before I came to Ghana, I thought about it a lot and in the beginning, I always said it
was something that can happen…I knew it was a risk that is why at first, I didn’t want
to take it along with me. I had an iPad because I like to listen to music, it got stolen two
weeks ago, I think it’s not nice but I think if you know things like that can happen when
you are going to a country you can prepare yourself for it...you just say it is possible, it
can happen and then you prepare yourself…that was how I stayed strong when my iPad
got missing…you just say to yourself it can always happen, it can happen in my
country but people say sometimes it more likely to happen here if you are walking
around with it…there is nothing you really can do about it except being careful…I have
always tried to be more careful, it is a risk that you take when you travel, but I think
travelling is still worth it.
The findings also showed an attempt by the respondents to guard against one key element of
the Routine Activities Theory (i.e. a suitable target/victim) as proposed by Felson and Cohen
(1979). According to this theory, three elements are necessary for any criminal act to occur: a
suitable target/victim, a motivated offender and the absence of a capable guardian to stop the
interaction between an offender and a victim. Boakye (2010) refers to suitable targetship as
the degree to which a tourist becomes an easy prey or prone to victimisation. This may
include the reckless exposure of their belongings (such as mobile phones, cameras and
wallets among others) to motivated offenders. The interaction with respondents showed they
employed strategies that prevented them from being suitable for victimisation as follows:
…the only thing I am more aware of is that I don’t usually use my phone in public, if I
am in a trotro (a local public transport) or something because I do not want someone to
take it. But it’s the same way in Europe, if you are not careful about your phone in the
subway or public, someone can just take it from you. I try just to keep it…hide it under
my bag because I can’t afford to replace it (BP10).
“...I mean in a big market, I usually have my hands on it …sometimes I put it in this
bag, I have a pocket for it there.” (BP1)
186

Economic considerations also shaped the preventative measures used by backpackers. It was
also interesting to find out that another way of dealing with the physical risk of losing a
smartphone in Ghana was to use a cheaper surrogate of a phone. Some respondents revealed
that it would be more disturbing to lose an expensive mobile phone in comparison to a
cheaper one. They also noted that holding an expensive smartphone was more likely to
predispose them to criminal attacks hence some backpackers carried other models of
smartphones they considered inexpensive as evident in the following remarks by the
interviewees:
…eerm I had some concerns when I was coming to Ghana and just for travelling, I
bought a cheaper phone so that if I lose it, I wouldn’t be bothered [chuckle]…I wanted
something that is cheap and not worthy so if I lose it would not be that bad (BP14).
Another respondent alluded similarly:
“…I am using iPhone 5s since I came here but at home, I use 6s. I took my old phone
because you don’t know what will happen so I don’t want to take my newest phone.”
(BP11).
Interestingly, some respondents did not get concerned about the physical risk of losing their
phones after arriving in Ghana. They maintained that Ghana was a relatively safe place to
travel and that the risk of losing a smartphone was not an issue to contemplate. This may
have been so because some respondents had their worries allayed after experiencing the
country by themselves – contrary to the beliefs and speculations they might have held before
their visit. For instance, a backpacker (BP15) remarked:
I was thinking may be someone will rob me but till now, it is fine. Everybody in my
area says you have an iPhone, I want an iPhone as well. Can you send me an iPhone
when you are back in Holland?...everybody wants an iPhone but I don’t feel like they
want to steal it [laughter].
Likewise, BP11 had this to say:
“…everything is fine, good Internet. I am happy with it…sometimes when I am alone
in the dark I get worried about my property but this is the same for me in Europe. It is
generally ok in Ghana, I am fine.”
187
9.1.4 Infrastructure risk
The interviews further validated the fact that backpackers were concerned about destination-
infrastructure risks in Ghana (Section 7.1.3.3). This type of risk relates to the risk of getting
disappointed as a result of the poor performance and malfunctioning of the Internet and other
related systems and services (Table 4.9). This issue quite attracted varied views to the effect
that some of the respondents thought their smartphones and Internet worked quite well while
others thought otherwise. In particular, it was observed that some respondents had dispelled
the views they originally held before visiting Ghana as epitomised by following quotes:
…I expected things to be more difficult and it turned out to be easier … I thought it
would be a little bit difficult to get mobile data but it was also easy to get a SIM card so
I was happy with that…it really worked quite well for me and I don’t regret bringing
my smartphone along with me (BP3).
“…the only thing I really need when using my smartphone is mobile data and that
works well so far. I think that for the things I use my smartphone to do, I am totally
satisfied.” (BP14).
However, it was also evident from the interviews that the destination’s infrastructure
regarding Internet availability and reliability also posed some risk concerns to some other
respondents. Issues to do with the inability of the Internet to support searches on Google, as
well as the unavailability of helpful destination apps were underscored as concerns. Hence, a
strategy they used was to remain a bit passive about relying on their smartphones and the
Internet for everything in the country. In the words of BP10:
…I don’t have Internet in a lot of places…it works but in some occasions, I just can’t
get service and I can’t connect to WhatsApp or something…when I am connected it’s
always fast but in some places, I just do not have Internet. I don’t think it has a large
influence on me though...but if you just think for a while, if I hear about something and
I want to google it, read more about it or I want to open an article, sometimes, I can’t.
But I think that is okay…I can be less reliant on my phone for information [chuckle].
9.2 Summary
In support of the quantitative results, the qualitative account in this study does suggest that
backpackers had some risk concerns regarding the use of their smartphones in Ghana (such as
cyber security, infrastructure, performance and physical risks) although others were a bit
188

indifferent or perhaps, less concerned about risk. They used an array of risk reduction
strategies to reduce the impacts of these risk concerns on their travel experiences. While
some of the risk reduction strategies were cognitive in nature (such as psyching up one’s
mind about the possibility of unpleasant occurrences in Ghana), others were pragmatic
measures, including: 1) not exposing smartphones in public; 2) using cheaper alternatives of
smartphones during travel; 3) using more reliable alternatives for online transactions; 4) using
banking apps; and 5) non-reliance on the Internet for every information. The next chapter
discusses the findings that emerged from both the quantitative and qualitative analysis
hereafter.
189

10 CHAPTER TEN: DISCUSSION OF RESULTS
10.1 Introduction
The previous chapter principally focussed on the risk reduction strategies that were used by
backpackers who had some risk concerns with using their smartphones in Ghana. Moving on,
this chapter critically discusses the main findings that emerged from the study by tying them
up with the relevant literature. It also attempts proffering some plausible explanations for
why certain key findings arose in the study based on the quantitative and qualitative
approaches. Essentially, the discussion is done in relation to the objectives of this study.
10.2 Background and travel characteristics of respondents
Generally, the results on the background and travel characteristics of backpackers in this
current study, appeared to have supported most of what is in the literature but a few. In line
with previous studies (Adam, 2015; Zhang et al., 2017; Nok et al., 2017), this study observed
that most backpackers in the sample were young (i.e. between 20-29 years). Also noteworthy
was the fact that almost 20.0% were 30 years or more. This outcome relates to Hannam and
Diekmann’s (2010, p. 2) study which hints about a flashpacker being “…the older twenty to
thirty-something backpacker…” Moreover, the majority being single/unmarried gives further
credence to the largely youthful nature of backpackers (Dayour, 2013). It was also realised
from the study that while more than half of the respondents were still schooling – possibly for
another qualification – about 40.3% altogether were employed. This suggested that some of
them had greater disposable incomes than the average ‘gap-years’ who are mostly without
permanent jobs (Paris, 2012). Closely linked with the above argument was the finding that
about 19.1% had their annual incomes before tax as being US$ 40,000.00 and above. The
high incomes earned before tax by this proportion of the sample is indicative that some
respondents were flashpackers – substantiating one of Paris’ (2012) assumptions that
flashpackers are often part of the working class who may be earning more income than
average backpackers.
Parallel to previous studies (e.g. Dayour, 2013, Adam, 2015; Dayour, Adongo and Taale,
2016), more Europeans followed by Americans appeared to be backpacking in Ghana than
the inhabitants of other continents. This current trend could be linked with the popularity of
backpacking among European ‘gap-years’ since the 1990s (Dayour, Kimbu and Park, 2017).
190
Furthermore, the findings revealing that about three-quarters of backpackers used budget
accommodation facilities while the remainder used upscale ones not only support the view
that most backpackers use budget accommodation facilities (Pearce, 1990; Sorensen, 2002;
Adam, 2015) but also the fact that others prefer upscale accommodation because of more
income at their disposal (Paris, 2012). Especially, regarding the use homestay
accommodation facilities in the country by some backpackers, Agyeiwaah (2014) notes that
backpackers are about the main patrons of homestay accommodation facilities in Ghana. In
consideration of this finding, it is worth noting that homestay accommodation facilities are
currently classed as an unregulated accommodation subsector, which is gradually gaining
prominence in Ghana. The results also support past research findings that backpackers
oftentimes depend largely on local public transportation networks at various destinations
often due to budgetary constraints (Pearce, 1990; Ateljevic and Doorne, 2004). The majority
found travelling in groups in the country must have been due to security concerns. Boakye
(2012) alludes that this form of travel is a protection strategy for most tourists in Ghana,
particularly first-timers. This current finding however contravenes a recent study by Nok et
al. (2017) in Hong Kong which realised that most backpackers rather travelled alone.
Regarding experiences, it was found that the majority of backpackers were visiting Ghana for
the first time. This is supportive of existing findings that backpackers search for novelty
hence travel to unfamiliar places (Uriely, Yonay and Simchai, 2002; Cohen, 2004; Dayour,
2013). Ghana’s historical, cultural and ecological attractions endears it to most backpackers,
most of which are located far from city areas (Dayour, 2013).
The study also supports previous researchers (e.g. Elsrud, 2001; Zhang, 2017) who maintain
that backpackers in their ‘gap-year’ often peregrinate through different countries to garner
various experiences and expand their horizon. Likewise, it was not surprising to note from the
results that backpackers had been using their smartphones to travel for almost 5 years. This is
probably because most of them are young (i.e. 25 years on average) belonging to the tech-
savvy millennials or Generation ‘Yers’ cohort – as noted by McGlone, Spain and McGlone
(2011).
With regard to the functions they used their smartphones to perform, this study found
evidence of backpackers using their smartphones to engage in virtual networking via social
191

media platforms, as well as emailing, taking photos, navigations and bookings at the
destination. This relates to the argument by Mascheroni (2007) and Iaquinto (2011) that
virtual mobile networking has become almost indispensable in the travel culture of
backpackers nowadays – mediating their experiences and sociality. It also does affirm Chen
and Weiler (2014) study noting that the cyberspace is a suitable community for interaction
among Chinese backpackers. The study further buttresses the work of Paris (2012), which
revealed that backpackers use a multiple range of electronic devices for their travel though
this practice appears more common with their flashpacker counterparts. The next section
looks at their risk perceptions towards smartphone usage.
10.3 Perceptions of risk towards the use of smartphones
The factor structure of perceived risk as a second-order latent construct was validated using
both CFA and PLS-SEM. The relationship between perceived risk and its underlying
constructs was from moderate to strong relationships. The results suggested that backpackers’
risk perception towards smartphone usage is function of various risk facets: security,
destination-infrastructure, psychological, social, destination-physical, performance, time, and
financial risks. This supports past studies (e.g. Luo et al., 2010; Chen, 2013; Park and
Tussyadiah, 2016) that modelled perceived risk regarding information systems such as the
smartphone and online services – as a multidimensional latent facet. The results of this study
offer some unique insights as far as the subjects of this study are concerned. An assessment
of the variances explained in individual risk facets showed that security (57%), destination-
infrastructure (55%), psychological (54%), social (45%), and destination-physical (37%)
risks were of the most concern for backpackers.
First, security risk, the potential loss resulting from fraud, identify theft or hacker attacks
(Section 4.7), appears to be one of the greatest inhibitors and concerns for customers
engaging in mobile booking or transactions over information systems such as the smartphone.
The failure of the technology resulting in unauthorised access, as well as facelessness in
buying and interruptions, intensify concerns about security among users. The fact that most
backpackers visited Ghana for the first-time (88.2%) possibly resulted in security risk
emerging as one of the major risk concerns either due to lack of familiarity with the
destination (Williams and Baláž, 2015) or they being dubious about Internet security in the
country.
192

Second, destination-infrastructure risk was the second most important risk factor that
contributed to backpackers’ perceptions of the risk of using their smartphones in Ghana. This
risk relates to the malfunctioning of the Internet infrastructure or cyberspace at the
destination – leading to cybercrime or difficulty in accessing or using the Internet (Table 4.9).
This finding is in line with Khan, Abass and Al-Muhtadi (2015) who note that unreliable
technology infrastructure at a given place could pose risk concerns among mobile users.
Third, psychological risk, which refers to the probability of frustrations and/or
disappointment resulting from unmet needs or malfunctioning of systems (Section 4.7) also
emerged as concern for backpackers. This was not surprising as it may have been the result of
the security and destination-infrastructure risks concerns as discussed before in this section.
The feeling of frustration and anxiety due to security risk and infrastructure risk could result
in psychological risk concerns about smartphone usage (Adam, 2015). However, the current
finding is at odds with Featherman and Pavlou (2003) who established that psychological risk
is not as important a concern to consumers in e-service adoption.
Fourth, distinct from Park and Tussyadiah (2016) who reported about social risk being
inconsequential vis-à-vis mobile travel booking, in this study, social risk mattered to
backpackers. It supports the finding of Aldás-Manzano et al. (2009) who found perceived
social risk as a salient issue in online banking. As this relates to the chances that using a
smartphone for travel will attract the disapproval of friends and/or peers whose opinions are
respected, it was not strange that it became a concern among backpackers. Past studies (e.g.
Pearce, 1990) reveal that the culture of backpackers dictates a certain amount of adventure,
risk and renouncement of habitual lifestyles by partakers. Thus, social risk may have come
about as a concern to some backpackers because they felt they risked being seen by friends
and peers as unadventurous or showy – possessing a smartphone on the ‘road’.
Fifth, it was also evident from both quantitative and qualitative studies that backpackers did
care about destination-physical risk, which is the risk of having a phone stolen or potentially
victimised for holding it (Section 7.1.3.2). It was clear from the in-depth interviews
conducted that the risk of losing an expensive smartphone was of a great concern and for
which backpackers used some risk reduction strategies in Ghana (Section 9.1.3). Globally,
most touristic areas are often a breeding ground for petty theft and robbery incidents (Roehl
193

and Fesenmaier, 1992), and tourist hotspots in Ghana are no exception (Boakye, 2010). This
finding supports Boakye’s (2012) argument that tourists in Ghana are likely to become
victims of various crimes (such as phone theft) if care is not taken but also Adam (2015) who
realised that backpackers have physical risk concerns when travelling around the country.
On the other hand, the results also show three (3) other risk factors namely time, financial and
performance risks (Table 4.9) that were not as important to backpackers – relative to those
discussed above. These findings diverge from that of Lee (2009) and Luo et al. (2010) but
also Park and Tussyadiah (2016) who found these risk facets as being pivotal to consumers’
risk perceptions regarding information systems. A possible interpretation as to why time risk
was not as much a concern for backpackers is because most of them (i.e. flashpackers) are
technologically savvy and can make efficient use of their time when using their smartphones
(Paris, 2012a). Similarly, it is likely that most backpackers did not perceive as much financial
risk because they did not engage in activities that could potentially result in the loss of
money. In particular, their trepidations about security risk discussed earlier deterred most of
them from performing financial transactions on their smartphones (see Section 6.1.4), thus a
reason to be less concerned about financial risk.
Lastly, performance risk is the probability of a disappointment(s) emanating from a poor
product quality (i.e. the smartphone and/or its applications) (Table 4.9). Dissimilar to
previous research (e.g. Cunningham, Garlach and Harper, 2005; Park and Tussyadiah, 2016),
performance risk was also not as much a risk concern for backpackers in this current study.
This was probably because backpackers did not sense the likelihoods of their smartphones
and/or applications malfunctioning. Put differently, the possible malfunctioning of their
devices during travel in Ghana was not a source of worry in comparison to other risk factors.
The next section discusses the antecedents and consequences of backpackers’ risk
perceptions.
10.4 Antecedents and outcomes of backpackers’ risk perceptions
The thesis identified factors that impacted on backpackers’ perceived risk related to their
smartphone usage. Analogous to past studies (e.g. Cheung and Lee, 2000; Kim, Ferrin and
Rao, 2008; Aldás-Manzano et al., 2009; Luo et al., 2010; Park and Tussyadiah, 2016), the
results do confirm the negative effects of backpackers’ innovativeness, trust in their
194

smartphones and familiarity on risk perceptions. The study further revealed that among all the
predictors, innovation had the strongest influence (β = -0.19; p < 0.001) followed by trust (β
= -0.13; p < 0.001). Innovation, which reflects a consumer’s risk-taking inclination when it
comes to new mobile technology services, suppressed backpackers’ risk perceptions as did
their trust for the device. The youthful nature of most backpackers in this study suggests that
they were quite innovative in terms of using new smartphone services, both in everyday life
and travel hence its negative influence on perceived risk (McGlone, Spain and McGlone,
2011). Consistent with past studies (e.g. Cheng and Lee, 2000; Chang and Chen, 2008),
backpackers’ trust in their smartphones had a significant negative influence on their
perceived risk and a positive effect on the intentions to reuse it for future travel (Kim, Ferrin
and Rao, 2008). It was demonstrable in this study that the extent to which backpackers
became conversant with the functions and services on their phones, and overcame
complexities, reduced their perceived risk (Section 4.8.1.1). This finding corroborates that of
Gefen (2000) on the negative relationship between familiarity and perceived risk in the e-
commerce literature. Especially, the tech-savvy nature of most young backpackers suggests
that many could overcome the complications in using their phones – which suppressed their
risk perceptions. However, observability did not feature as an antecedent of their perceived
risk possibly because backpackers were quite uncertain about the visibility of the outcomes
and benefits of smartphones travel services.
Additionally, supported by the Stone-Geisser’s Q2 test of predictive accuracy, the study
established the predictive relevance of the model for only general travel satisfaction (0.02)
but not the satisfaction with the device and intention to reuse it (Section 8.1.2). This finding
is consistent with a previous argument that risk concerns held by consumers can penalise
their satisfaction with specific travel experiences (see Johnson, Sivadas and Garbarino, 2008;
Sohn, Lee and Yoon, 2016) (Section 4.8.1.5). This suggests that as backpackers’ risk
perceptions regarding their smartphone usage rises, their satisfaction with travel experience
reduces. Yet, this did not affect the intentions to reuse the device for future travel purposes
nor the satisfaction with their device itself. This may have been so because of the risk
reduction strategies used by backpackers or due to the risk resistant tendencies in them
(Hajibaba et al., 2015). Chapter 9 of this thesis offers further support to this assertion. The
finding uniquely contravenes past studies that suggest that perceived risk towards the use of
information systems diminishes the intentions to reuse them (Mitchell, 1999; Park and
Tussyadiah, 2016). The results also showed that satisfaction both with a smartphone and with
195

travel significantly predicted the intentions to reuse the device. That is, the more backpackers
become satisfied with their smartphones and with general travel experiences, the more likely
they are to reuse the device for future travel needs. This outcome is also in line with prior
evidence that the more positively consumers evaluate a product or service, the better the
chances of future use (Chi and Qu, 2008). Discussed hereafter were the risk reduction
strategies used by backpackers.
10.5 Risk reduction strategies
Risk reduction strategies often go side-by-side with perceived risk especially when risk
concerns exceed one’s risk tolerance level (Roselius, 1971; Dowling, 1986). In this study, it
was found that backpackers had some personal risk reduction strategies against their risk
perceptions of using smartphones in Ghana. These measures could broadly be grouped in to
cognitive and non-cognitive measures in this thesis. This study agrees with Miceli, Sotgiu
and Settanni’s (2008) view that perceived risk could be adequately conceptualised as a
complex process, which includes both cognitive and affective elements. People cognitively
react to the chances of risk related to an event (Loewenstein et al., 2000; Slovic et al., 2004).
The mental preparedness regarding a possible loss of an item, disappointment or frustration
during travel was a risk reduction strategy for some backpackers. This consciousness
suppressed the fears of bringing their smartphones to Ghana.
On the other hand, studies also show that risk reduction strategies can be classified into two:
1) consumption behaviour modification and 2) information search (Hales and Shams, 1991).
Overtly (or non-cognitively), measures including: 1) non-exposure of their phones in public;
2) the use of cheap (and therefore more expendable) smartphones; 3) the use of more reliable
alternatives (such as a personal computer) and apps for Internet banking; and 4) less
dependence on the Internet for information were distilled from the interviews as their risk
reduction strategies. These could be considered as modifications to behaviours to circumvent
possible risk or reduce the impact of perceived risk. These findings support the view that
backpackers use risk reduction strategies when their perceived risk appears intolerable (e.g.
Hunter-Jones, Jeffs and Smith, 2008; Adam, 2015). Therefore, the proposition that
backpackers’ who perceive risk towards smartphone usage (beyond their endurable threshold)
use personal risk reduction strategies, was supported. The final chapter hereafter makes
196

conclusive remarks based on the results presented – by highlighting how this thesis
contributed to academic knowledge, methodology, practice and policy.
197
11 CHAPTER ELEVEN: CONCLUSIONS AND IMPLICATIONS
11.1 Introduction
This chapter concludes the study and mainly points out its implications for theory and
practice in the travel and tourism industry. It critically sheds light on how the study
contributes to academic knowledge on ICTs in tourism, as well as in backpacking.
Essentially, the literature along the two main areas noted above has been extended. The
chapter also highlights the methodological contributions of the study, as well as the
limitations and areas of further research.
From the outset, the purpose of this thesis was to examine the factors that underlie
backpackers’ perceptions of risk towards the use of their smartphones in Ghana and their risk
reduction strategies.
This was achieved through the followings specific objectives:
1. explore the functions backpackers use their smartphones to perform while in Ghana;
2. explore backpackers’ perceptions of risk towards the use of smartphones vis-à-vis
device risks and destination related risks;
3. examine the antecedents and outcomes of backpackers’ perceived risk regarding
smartphone usage; and
4. investigate the risk reduction strategies employed by backpackers who perceive risk
towards their smartphone usage in Ghana.
Using a quantitative-dominant concurrent embedded mixed methods research design, 567
backpackers were investigated using a survey questionnaire and 15 others (based on the
saturation of responses) using interviews. The mixing of methods in this study was to allow
for corroboration and expansion of the research findings, as well as give adequate basis for
the generalisability of the results (Section 5.5.1.1). Data collection was conducted through the
self-identification approach – mostly in budget accommodation facilities and attractions in
Ghana. The locations selected were generally popular for backpacking but also other tourism
related activities in the country. The findings of this study offer several academic
contributions, as well as managerial/practical and policy implications – discussed hereafter.
198

11.2 Contribution to academic knowledge
Theoretically, to the best of the author’s knowledge, this study is the first attempt made, in a
tourism context, to propose an amalgamation of both information technology and destination
related risk factors to define perceived risk towards smartphone usage. Moreover, the model
proposed herein (involving destination-physical and destination-infrastructure risk, as well as
financial, performance, time, psychological, social, and security) demonstrated a better fit in
comparison to models that include only information technology related risk factors.
Previous studies (e.g. Forsythe and Shi, 2003; Cunningham, Gerlach and Harper, 2005; Kim,
Kim and Leong, 2005; Kim, Qu and Kim, 2009; Luo et al., 2010; Kim, Chung and Lee,
2011; Park and Tussyadiah, 2016) have investigated perceived risk regarding information
technology in the travel and tourism domain but unfortunately, these studies have mainly
focussed on risks related to only the technology. Therefore, these past studies offered quite a
limited understanding of the actual nature of perceived risk vis-à-vis ICTs (especially mobile
technology) in the travel industry. Forsythe and Shi (2003) and Kim, Kim and Leong (2005)
examined perceived risk in relation to purchasing airline tickets online. A more recent study
by Park and Tussyadiah (2016) also concentrated on mobile-related risk perceptions
regarding mobile travel booking. The said studies utterly failed to recognize the importance
destination related risks or situational factors – though tourism consumption occurs within a
destination, be it corporeal or virtual (Section 4.7). In filling this crucial knowledge gap in the
extant literature, the current study identified more comprehensive sub-factors of perceived
risk towards smartphone usage by integrating technology risks with destination related risks.
The study, unequivocally, showed the relevance of destination related risk facets in the
understanding of perceived risk towards smartphone usage (Table 7.28), which had been
overlooked by earlier studies. Inimitable to this study was the finding that time risk and
financial risk appeared not to be as much a concern for backpackers in comparison to earlier
studies on general travellers (see Luo et al., 2010; Kim, Chung and Lee, 2011). The
contribution of this study also supports previous argument that perceived risk should be
situation specific or based on a specific consumption situation such as smartphone usage
(Dowling and Staelin, 1994).
The study also contributes to theory by confirming the positive relationship between: 1)
consumers’ travel satisfaction and the intentions to reuse a smartphone, and 2) satisfaction
with the smartphone and the intentions to reuse it. In particular, though satisfaction has been
199

established as an outcome of perceived risk in consumer behaviour literature, it is often in
relation to a single situation or experience. This study assessed satisfaction at two levels of
experience (see Section 4.8.1.5) among backpackers. The study showed that the intentions to
reuse a smartphone is influenced both by: 1) the satisfaction with the device and 2)
satisfaction with travel. Moreover, in consonance with previous studies (e.g. Park and
Tussyadiah, 2016), one’s innovativeness, trust in and familiarity with a smartphone were
established as inhibitors of backpackers’ perceived risk. The study also found perceived risk
as an important inhibitor of travel satisfaction relative to the use of smartphone for travel.
Furthermore, though previous studies in tourism have been interested in how businesses
manage consumers’ risk perceptions around ICTs – through several risks relievers (Section
4.5.1) regrettably, consumers’ personal risk reduction strategies have been disregarded. This
study is about the first to shed light on personal risk reduction strategies employed by
backpackers to reduce their risk concerns towards smartphone usage. These strategies include
the cognitive (i.e. mental preparedness) and non-cognitive (i.e. pragmatic strategies)
responses to risk.
Contextually, this study contributes to several overlooked areas within the backpacking
literature. The study assessed backpackers’ risk perceptions in relation to a specific
information technology – the smartphone. This study thus provides specific recommendations
based on the risk perceptions expressed about the use of their devices (see Section 11.4). The
study was also a response to the call to examine backpackers’ risk perceptions and behaviours
across various phenomena (e.g. Loker-Murphy and Pearce, 1995; Reichel, Fuchs and Uriely,
2009; Dayour, Kimbu and Park, 2017). Especially, in extending the literature on
backpacking, the study clearly showed that backpackers’ perceptions of risk do not only
revolve around information technology but also the destination of visit. Evidently, security
and destination-infrastructure risks appeared to be the topmost risk concerns for backpackers
during travel.
The study also demonstrated that backpackers’ perceptions of the risk concerning the use of
their smartphones do not occur in a vacuum but are affected by determinant factors such as
innovation, trust in and familiarity with the device. This addresses an important gap in the
literature on backpacking as past studies on risk perceptions paid no attention to antecedents
(Section 1.1.4). Besides, the study also revealed that backpackers’ risk perceptions result in
200

certain consequences, which unfortunately, have also been overlooked in the past. While
perceived risk had no significant effect on the intentions to reuse a smartphone nor
satisfaction with the device, it did have an influence on the satisfaction with travel
experience.
For the first time in tourism, this study explored the personal risk reduction strategies that
were used by backpackers to manage their risk aversion towards smartphone usage. Through
a qualitative insight, the study established that backpackers gave both cognitive and non-
cognitive responses to their risk perceptions towards smartphone usage. These included the
mental preparedness about the risk, using inexpensive smartphones, using a computer or an
app for Internet banking, and not being overly dependent on the Internet for every
information.
The study also concluded that backpackers use their smartphones during travel for a multiple
range of activities such as social media networking, emailing, taking of photos, phone calls,
navigations, and online bookings, to mention a few. This supports previous claims that
backpackers have become part of the mobile elites in the travel economy (Mascheroni, 2007;
Iaquinto, 2012). The study also showed that backpackers use smartphones together with other
electronic devices during travel (including cameras, laptops, tablets/iPad, iPods, portable
chargers, and e-readers among others). The findings thus suppose that some respondents were
indeed ‘flashpackers’ – going by Paris’ (2012) definitional criteria.
11.3 Methodological contribution
Methodologically, this study is one of the first studies in the travel and tourism domain to
apply the quantitative-dominant concurrent nested mixed methods design (Section 5.5.1.1.1).
This design offered a pluralistic and a comprehensive understanding of perceived risk as
opposed to monolithic (i.e. mainly quantitative) approaches used in earlier studies (see Luo et
al., 2010; Kim, Chung and Lee, 2011; Park and Tussyadiah, 2016). This approach allowed
the quantitative dimension of the study to play a principal role – backed by qualitative
insights – to offer more support to the conclusions and implications of the study. Especially,
the qualitative methods enabled an understanding of how backpackers managed the risk they
perceived towards the use of their smartphones during travel.
201

This study made another inimitable methodological contribution through its data analysis
process. It used the CB-SEM technique to validate the conceptual model because of its
‘goodness-of-fit’ ability (Section 5.5.2.1.7). It then used the same approach in assessing and
validating the second-order hierarchical latent construct of perceived risk before including it
into the nomological network of the proposed structural model (Figure 11). The structural
model was then assessed using PLS-SEM due to its advantages over CB-SEM (Section
5.5.2.1.7). The CB-SEM was effective in validating all measurement models as was the PLS-
SEM in assessing the relatively complex structural model, which otherwise, would have been
challenging with the former. This study does offer another unique way of using different but
related statistical techniques to validate and assesses a model at different stages hence an
important methodological contribution to the tourism literature. This study also has several
implications for service managers and technology designers as presented in the next section.
11.4 Managerial/practical implications
This study argues that an awareness about perceived risk towards smartphone usage, its
antecedents and consequences, as well as the influence of satisfaction on the intentions to
reuse the device will be useful to service managers and marketers in the industry. Lessons
here will be useful in developing specific strategies and programmes aimed at reducing risk
perceptions – by enhancing the antecedents, and consequently, increasing satisfaction and the
intentions to reuse the device for future travel.
To deal with specific risk perceptions such as security risk towards smartphone usage,
services providers could provide encryptions, authentication systems and firewalls to prevent
users from potential fraud or identify theft (see Vos et al., 2014; Agag and El-Masry, 2016).
Likewise, the presence of third-party assurance seals has been found useful in reducing
consumers’ perceived risk of using information systems (see Kim, Ferrin and Rao, 2008).
Providing detailed technical and non-technical information about the aforementioned
measures, could enlighten and reassure smartphone users, especially backpackers for whom
the smartphone has become indispensable. Again, there is the need for service providers to
ensure the availability and reliability of the Internet connectivity in their facilities while
applying the above mechanisms to deal with potential destination-infrastructure risk.
202

Perceived psychological risk could be handled through free samples and trials of mobile
travel services, technical support for new travel services, as well as money-back guarantees to
reassure users. Perceived social risk may also be overcome by creating awareness on the very
benefits of using smartphones during travel, especially among backpackers. Service
marketers could use advertisement campaigns that clearly demonstrate how having a
smartphone would lead to a more enhanced experience during a visit to a destination. This
could reduce perceived social risk as travellers and their reference groups get to know more
about the usefulness of their smartphones for travel.
To decrease destination-physical risk perceptions, service managers and DMOs could think
of ensuring proper security measures to reassure visitors of their safety at service facilities
and the destination in general. For instance, more police visibility on major streets and
attractions, as well as the installation of CCTV cameras in touristic facilities such as hotels,
restaurants, and nightclubs among others, could well give confidence to consumers.
However, it will be vital for devices such as CCTV cameras to be installed in open spaces at
these touristic facilities in order not to encroach on the privacy of guests. It is also important
to offer security tips to visitors upon arrival at the major ports and service facilities in the
country to assuage risk concerns. Moreover, as a risk reduction strategy, backpackers did not
fully depend on the Internet in Ghana for information because of its unreliable nature. This
means that important information about travel and services in the country could be limited by
such a barrier. Therefore, the DMO and the government need to enhance the quality of
Internet services throughout the country since that has become a major platform for
marketing the destination and providing information to travellers, especially using location-
based push recommendations.
Innovativeness is a personal coping characteristic regarding the risk-taking propensity of a
consumer, which can serve as the basis for targeting specific markets that will easily adopt a
new service. Service providers and marketers could take advantage of the innovative traits in
backpackers (regarding new travel services) through mobile marketing. Besides, technology
designers and service providers can enhance trust in smartphones services by: 1) ensuring
reliability; 2) creating awareness on customers’ rights; 3) providing user support for new
mobile travel services; and 4) using online security approval symbols (see Kim, Kim and
Leong, 2005; Kim, Qu and Kim, 2009). Offering user support and guidelines could reduce
the complexities and complications of mobile travel services, which in turn, will increase
203

familiarity and decrease perceived risk. Service marketers and mobile designers can enhance
‘observability’ by ensuring the outcomes and benefits of smartphone travel services are more
visible through advertisements and free trials. This is likely to also improve trust and
satisfaction, and by extension, reduce the perceived risk of using the device. What is more, as
backpackers’ risk perceptions did not have a significant negative effect on satisfaction with
the device and the intentions to reuse it, services providers and marketers could take
advantage of the resilient nature of this segment by pushing targeted marketing campaigns to
it. Finally, satisfaction regarding the use of a smartphone could be increased by: 1) decreasing
the complexities of its applications; 2) providing user support services; and 3) improving
visibility and trust in smartphones services, which in turn, will trigger the desire to reuse it for
travel related services. Next are the policy implications of the study.
11.5 Policy contributions
The study also offers some policy implications for the destination in question (i.e. Ghana) and
other similar destinations in Sub-Saharan Africa. Thinking about perceived security and
destination-infrastructure risks, the government could enact a policy that will require service
facilities to institute measures on consumer protection over the digital space. To improve the
availability and reliability of the Internet in the country, the government could also introduce
a law that requires all service providers, especially those in the tourism industry to give
adequate Internet access to clients while it assumes the responsibility of providing affordable
and secure infrastructure. Admittedly, inadequate financial capital could make it challenging
for businesses that must implement these strategies, especially SMEs. Government, therefore,
needs to provide the enabling environment for this to be effective.
Having found that some backpackers used homestay accommodation facilities in the country,
it is about time the government puts in place, regulatory measures to register, license and
monitor the currently unregulated subsector. Aside guaranteeing better services, this could
also be a way of ensuring that proper security and safety measures are maintained in such
facilities. The following were the limitations of this thesis and thoughts for further research.
11.6 Limitations of the study and directions for further research
Akin to many studies, this study has some limitations, which will potentially provide helpful
grounds for further research. First, the study used a non-probabilistic sampling procedure (i.e.
convenience sampling) for the collection of quantitative data. As this may be
204

unrepresentative, it is advisable that some caution be exercised in generalising findings from
this study. To further validate the results, future research may consider expanding the study to
include different geographical milieus and using more probabilistic procedures for the data
collection.
Second, the study earlier proposed a third-order hierarchical latent construct of perceived risk
involving destination risk and IT risk as indicated by eight (8) underlying latent constructs.
Since this study was unable to successfully validate this, future researchers may consider
validating perceived risk as third-order hierarchical latent factor – using a different set of data
– to introduce more parsimony into the theory of perceived risk in the ICT literature.
Third, the study focussed on backpackers’ perceived risk towards the use of smartphones in
Ghana without considering specific risks generated by different locations, service facilities or
activities undertaken. In other words, it assumed that Ghana is an undifferentiated space in
terms of perceived risk. Therefore, assessing perceived risk based on different locations and
service facilities such as hotels, restaurants, airports, streets and activities undertaken could
offer a more informed and focussed implications for managers. This suggestion originates
from the argument that perceived risk should be context specific (Pope et al., 1999) hence the
need to consider it at different levels of the industry.
Fourth, there exists an opportunity to consider other important antecedents and outcome
variables of backpackers’ perceived risk apart from the ones examined in this study. This
would help broaden the knowledge on the range of factors that affect risk perceptions relative
to the use of mobile technology such as the smartphone. For example, culture and the
experience of using the device could be introduced into the model by future researchers.
Fifth, following Paris’ (2012) conceptualisation of backpackers and flashpackers, future
studies could test for heterogeneity among flashpackers and backpackers regarding risk
perceptions. Understanding the differences between the two sub-groups could offer vital
implications for the industry in terms of marketing segmentation.
Sixth, this study, no doubt, has also provided the basis for future studies to delve deeper into
the risk reduction strategies adopted by backpackers vis-à-vis using smartphones for travel.
As the generalisability of findings here was limited by the sample and method in question
205

(Section 5.5.2.2.1), future studies could consider a survey method regarding this phenomenon
to support the extrapolation of the results.
206

12 Bibliography
Abanga, J. (2015) ‘Internet use among tour operators in Ghana: An exploratory study’,
Oguaa Journal of Social Sciences, 7(2), pp. 42–52.
Abeza, G., O’Reilly, N., Dottori, M., Séguin, B. and Nzindukiyimana, O. (2015) ‘Mixed
methods research in sport marketing’, International Journal of Multiple Research
Approaches, 0806(September), pp. 1–17.
Adam, I. (2015) ‘Backpackers’ risk perceptions and risk reduction strategies in Ghana’,
Tourism Management, 49, pp. 99–108.
Adam, I. and Adongo, C. A. (2016) ‘Do backpackers suffer crime? Empirical investigation of
crime perpetrated against backpackers in Ghana’, Journal of Hospitality and Tourism
Management, 27, pp. 60–67.
Adams, J. (1995) Risk. London: UCL Press
Adkins, B. and Grant, E. (2007) ‘Backpackers as a community of strangers: The interaction
order of an online backpacker notice board’, Qualitative Sociology Review, 3(2), pp
188–201.
Adrian, A. (2013) ‘How much privacy do clouds provide? An Australian perspective’,
Computer Law and Security Review, 29(1), pp. 48–57.
Agag, G. M. and El-Masry, A. A. (2016) ‘Why do customers trust online travel websites?
Drivers and outcomes of customer trust towards online travel websites’, Journal of
Travel Research, 56(3), pp. 347-369.
Agyeiwaah, E. (2013) ‘International tourists’ motivations for choosing homestay in the
Kumasi Metropolis of Ghana’, Anatolia, 24(3), pp. 405–409.
Akehurst, G. (2009) ‘User generated content: The use of blogs for tourism organisations and
tourism consumers’, Service Business, 3(1), pp. 51–61.
Akyeampong, O. (2007) Tourism in Ghana: The accommodation sub-sector. Accra: Janel
Publications.
Akyeampong, O. and Asiedu, A. B. (eds.). (2008) Tourism in Ghana: A modern synthesis.
Accra: Assemblies of God Literature Centre.
Aldás-Manzano, J., Lassala-Navarre, C., Ruiz-Mafe, C. and Sanz-Blas, S. (2009) ‘The role of
consumer innovativeness and perceived risk in online banking usage’, International
Journal of Bank Marketing, 27(1), pp. 53–75.
Alder, J. (1985) ‘Youth on the Road: Reflections on the history of tramping’, Annals of
Tourism Research, 12, pp. 335-354.
207

Aloudat, A., Michael, K., Chen, X. and Al-Debei, M. M. (2014) ‘Social acceptance of
location-based mobile government services for emergency management’, Telematics
and Informatics, 31(1), pp. 153–171.
Amin, M, Rezaei, S. and Abolghasemi, M. (2014) ‘User satisfaction with mobile websites:
The impact of perceived usefulness (PU), perceived ease of use (PEOU) and trust’
Nankai Business Review International, 5(3), pp. 258 – 274.
Amuquandoh, F. E. (2011) ‘International tourists’ concerns about traditional foods in Ghana’,
Journal of Hospitality and Tourism Management, 18, pp. 1-9.
Anuar, F. I. and Gretzel, U. (2013) ‘Privacy concerns in the context of location-based
services for tourism, e-Review of Tourism Research, 2013.
Artuğer, S. (2015) ‘The effect of risk perceptions on tourists’ revisit intentions’, European
Journal of Business and Management, 7(2), pp. 36–43.
Ateljevic, I. and Doorne, S. (2004) Theoretical encounters: Panacea of backpacker
literature. London: Channel View.
Ayeh, J. K., Au, N. and Law, R. (2013a). ‘Predicting the intention to use consumer-generated
media for travel planning’, Tourism Management, 35, pp. 132-143
Ayres, R. U. and Williams, E. (2004) ‘The digital economy: Where do we stand?,
Technological Forecasting and Social Change, 71(4), pp. 315–339.
Ba, S., Whinston, A. B. and Zhang, H. (2013) ‘Building trust in online auction markets
through an economic incentive mechanism’, Decision Support Systems, 35(3), pp. 273–
286.
Babu. S. S, Mishra, S. and Parida, B. B. (2008) ‘Tourism development revised: Concepts,
issues and paradigms”, London, UK: Sage publications Inc.
Bagozzi, R. and Yi, Y. (1988) ‘On the evaluation of structural equation models’, Journal of
the Academy of Marketing Science, 16(1), pp. 74–94.
Bagozzi, R. P, Yi. and Phillips L. W. (1991) ‘Assessing construct validity in organisational
research’, Admin Sci Quarts, 36(3), pp. 421–30.
Bagozzi, R. P. and Yi, Y. (2012) ‘Specification, evaluation, and interpretation of structural
equation models. Journal of the Academy of Marketing Science, 40(1), pp. 8–34.
Bagozzi, R. P., Yi, Y. and Philipps, L. W. (1991) ‘Assessing construct validity in
organisational research’, Administrative Science Quarterly, 36, pp. 421-458.
Baker, D. A. and Crompton, J. L. (2000) ‘Quality, satisfaction and behavioural intentions’,
Annals of Tourism Research, 27(3), pp. 785–804.
208
Balamurugan, V. (2012) ‘Mining user mobile behaviour in location based services’,
International Journal of Scientific and Research Publications, 2(9), pp. 1–3.
Balasubraman, S., Peterson, R. and Jarvenpaa, S. L. (2002) ‘Exploring the implications of m-
commerce for markets and marketing’, Journal of the Academy of Marketing Science,
30(4), pp. 348–361.
Baloglu, S. and Uysal, M. (1996) ‘Market segments of push and pull motivations: A
canonical correlation approach’, International Journal of Contemporary Hospitality
Management, 8(3), pp. 32-38.
Barclay, D. W., Higgins, C. and Thompson, R. (1995) ‘The partial least squares approach to
casual modelling: Personal computer adoption and use as illustration’, Technology
Studies, 2(2), pp. 285–309.
Barnes, S. J. (2002) ‘Wireless digital advertising: Nature and implications’, International
Journal of Advertising, 21(3), pp. 399–420.
Barrett, P. (2007) ‘Structural equation modelling: Adjudging model fit’, Personality and
Individual Differences, 42, pp. 815-824.
Bartlett, J., Kotrlik, J. and Higgins, C. (2010) ‘Organizational research: Determining
appropriate sample size in survey research’, Information Technology, Learning, and
Performance Journal, 19(1), pp. 43–50.
Baskin, J. (1995) Local Economic Development: Tourism—Good or Bad?, in Tourism
Workshop Proceedings: Small, Medium, Micro Enterprises. Johannesburg: Land and
Agriculture Policy Center, pp. 103–116
Bauer, R. A. (1960) ‘Consumer behaviour and risk taking’, in Hancock, R. S. (ed.) Dynamic
marketing for a changing World. Chicago: American Marketing Association, pp. 389-
398.
Bauman, Z. (1998) Globalization: The human consequences. New York: Columbia
University Press.
Bauman, Z. (2007) Liquid times: living in an age of uncertainty. Cambridge: Polity.
Bazeley, P. (2004) ‘Issues in misxing qualitative and quantitative approaches to research’, in
Buber, R. Gadner, J. and Richards (eds.) Applying qualitative methods to marketing
management research. UK: Palgrave Macmillan, pp. 141-156.
Beach, A., Gartrell, M., Xing, X., Han, R., L., Q., Mishra, S. and Seada, K. (2010) ‘Fusing
mobile, sensor, and social data to fully enable context-aware computing’ in HotMobile
10 Proceedings of the Eleventh Workshop on Mobile Computing Systems and
Applications Annapolis USA, pp. 60–65.
209

Becker, H. S. (1998) Tricks of the trade: How to think about your research while you are
doing it. Chicago: Chicago University Press.
Becker, J.-M., Klein, K. and Wetzels, M. (2012) ‘Hierarchical latent variable models in PLS-
SEM: guidelines for using reflective-formative type models’, Long Range Planning, 45,
pp. 359-394.
Becker, M. and Knudsen, T. (2005) ‘The role of routines in reducing pervasive uncertainty’.
Journal of Business Research, 58(6), pp. 746–757.
Beiske, B. (2007) Research methods: Uses and limitations of questionnaires, interviews and
case studies. GRIN Verlag.
Beiyu, Z., Hariza, A., Hashim, B., Osman, S. B., Binti, E. and Bakar, A. (2015) ‘Factors
influencing consumer online information search in Yinchuan, China’, IOSR Journal of
Humanities and Social Science Ver. II, 20(6), pp. 65–70.
Beldona, S., Kline, S. and Morrison, A. (2004) ‘Utilitarian value in the Internet: Differences
between broadband and narrowband users’, Journal of Travel and Tourism Marketing,
17 (2/3), pp. 63-77.
Bell, J. (2010) Doing your research. 5th edn. Maidenhead: Open University Press.
Bellotti, V., Begole, J., Chi, E. H., Ducheneaut, N., Fang, J., Isaacs, E. (2008) ‘Activity-based
serendipitous recommendations with the Magitti mobile leisure guide, in Proceedings
of Human Factors in Computing: CHI 2008, April 2008, Italy: Florence, pp. 1157–
1166.
Bennett, S., Maton, K. and Kervin, L. (2008) ‘The ‘digital natives’ debate: A critical review
of the evidence’, British Journal of Educational Technology, 39(5), pp. 775-786.
Bentley, T., Page, S., Meyer, D., Chalmers, D. and Laird, I. (2001) ‘How safe is adventure
tourism in New Zealand? An exploratory analysis’, Applied Ergonomics, 32(4), pp 327-
338.
Berg, B. L. (2004) Qualitative research methods for the social sciences. 5th edn. Boston,
London: Pearson.
Bergeron, B. P. (2011) ‘Wireless local area network security’, The Journal of Medical
Practice Management, 20(3), pp. 138–42.
Berry, L. L., Seiders, K. and Grewal, D. (2002) ‘Understanding service convenience’,
Journal of Marketing, 66, pp. 1-17.
Bhatnagar, A. and Ghose, S. (2004) ‘Segmenting consumers based on the benefits and risks
of Internet shopping’, Journal of Business Research, 57(12), pp 1352–1360.
210

Biel, A. and Dahlstrand, U. (1995) ‘Risk perception and the location of a repository for spent
nuclear fuel’, Scandinavian Journal of Psychology, 36, pp 25-36.
Blake, A. and Sinclair, M. T. (2003) ‘Tourism crisis management: US Response to
September 11’, Annals of Tourism Research, 30(4), pp. 813-832.
Boakye, K. A. (2010) ‘Studying tourists' suitability as crime targets’, Annals of Tourism
Research, 37(3), pp. 727-743.
Boakye, K. A. (2012) ‘Tourists’ views on safety and vulnerability: A study of some selected
towns in Ghana’, Tourism Management, 33(2), pp. 327–333.
Boakye, K. A., Otibo, F. and Frempong, F. (2013) ‘Assessing Ghana’s contemporary tourism
development experience’, Journal of Global Initiatives, 8 (1/2), pp.133-154.
Boes, K, Buhalis, D and Inversini, A. (2015) ‘Conceptualizing smart tourism destination
dimensions’, in Tussyadiah I, P. and Inversini, A. (eds.) Information Communication
Technologies in Tourism 2015. New York: Springer International Publishing, pp. 667-
679.
Boholm, A. (1996) ‘The cultural theory of risk: An anthropological critique, Ethnos, 61, pp.
64-84.
Bonoma, J. R. and Johnston, W. J. (1979) ‘Decision-making under uncertainty: A direct
measurement approach, Journal of Consumer Research, 6, pp. 177-91
Botha, R. A. Furnell, S. M. and Clarke, N. L. (2009) ‘From desktop to mobile: Examining
the security experience’, Computers and Security, 28, pp. 130–137
Bouwman, H., Carlsson, C., Molina-Castillo, F. J and Walden, P. (2007) ‘Barriers and drivers
in the adoption of current and future mobile services in Finland’, Telematics and
Informatics, 24(2), pp. 145–160.
Boyatzis, R. (1998) Transforming qualitative information: Thematic analysis and code
development. Thousand Oaks, CA: Sage.
Bradley, N. (1999) ‘Sampling for Internet survey: An examination of respondents’ selection
for Internet research’, Journal of the Market Research, 44(10), pp. 141-53.
Braun, V. and Clarke, V. (2006) ‘Using thematic analysis in psychology’, Qualitative
Research in Psychology, 3, pp. 77-101.
Brewer, J. and Hunter, A. (2006) Foundations of multimethod research: Synthesizing styles.
2nd edn. Thousand Oaks, CA: Sage.
Brodsky-Porges, E. (1981) ‘The grand tour: Travel as an educational device 1600-180’,
Annals of Tourism Research, 8(2), pp. 171-186.
211

Broocks, A-K. and Hannam, K. (2016) ‘The artisan backpacker: A development in Latin
American backpacker tourism’, Int. J. Tourism Anthropology, 5, (1/2), pp. 152–164.
Brown, B. and Chalmers, M. (2003) ‘Tourism and Mobile Technology’, in Kuutti, K.,
Karsten, E.H., Fitzpatrick, G., Dourish, P. and Schmidt, K. (eds.) Proceedings of
ECSCW. Helsinki, Finland: Klewer Academic Press, pp. 335-355.
Bruner, G. C. and Kumar, A. (2005) ‘Explaining consumer acceptance of handheld Internet
devices’, Journal of Business Research, 58(5), pp. 553–558.
Bryman, A. (1988) Quantity and quality in social research. London & NY: Routledge.
Bryman, A., Stephens, M. and Campo, C.A. (1996) The importance of context: Qualitative
research and the study of leadership. The Leadership Quarterly, 7(3), pp. 353–370.
Bubeck, P., Botzen, W. J. W., Suu, L. T. T. and Aerts, J. C. J. H. (2012) ‘Do flood risk
perceptions provide useful insights for flood risk management? Findings from central
Vietnam’, Journal of flood risk management, 5(4), pp. 295-302.
Buhalis, D. (1998) ‘Strategic use of information technologies in the tourism industry’,
Tourism Management, 19(5), pp. 409–421.
Buhalis, D. (2003) eTourism: Information technology for strategic tourism management.
London: Pearson.
Buhalis, D. and Foerste, M. (2015) ‘SoCoMo marketing for travel and tourism: Empowering
co-creation of value’, Journal of Destination Marketing & Management, 4(3), pp. 151–
161.
Buhalis, D. and Law, R. (2008) ‘Progress in information technology and tourism
management: 20 years on and 10 years after the Internet – the state of eTourism
research’, Tourism Management, 29, pp. 609–623.
Buhalis, D. and O’Connor, P. (2005) ‘Information Communication Technology
Revolutionizing Tourism’, Tourism Recreation Research, 30(3), pp. 7–16.
Bulmer, M. G. (1979) Principles of Statistics. New York: Dover.
Bunnet, R. B. and Okunrotifa, P. O. (2008) General geography in diagrams for West Africa.
UK: Longman.
Burke, J. R. and Onwuegbuzie, A. J. (2004) ‘Mixed methods research: A research paradigm
whose time has come’, Educational Researcher, 33(7), pp. 14–26.
Burns, P. and O’Regan, M. (2008) ‘Everyday techno-social devices in everyday travel life:
Digital audio devices in solo travelling lifestyles’ in Burns, P. and Novelli, M. (eds.)
Tourism and mobilities: Local-global connections. Waling- ford: CABI, pp. 146–186.
212

Butler, G. and Hannam, K. (2015) ‘Flashpacking and auto-mobility’, Current Issues in
Tourism, 17(8), pp. 739 –752.
Butler, R. W. (1980) ‘The concept of a tourist area cycle of evolution: Implications for
Management of Resources’, Canadian Geographer, 24, pp. 5–12.
Campbell, D. T. (1955) ‘The informant in quantitative research’, American Journal of
Sociology, 60, pp. 339-342.
Campbell, D. T. and Fiske, D. W. (1959) ‘Convergent and discriminant validation by the
multitrait-multimethod matrix’, Psychological Bulletin, 56, pp. 81-105.
Campbell, D. T. and Stanley, J. C. (1963) Experimental and quasi-experimental designs for
research. Chicago, IL: Rand McNally.
Caracelli, V. J. and Greene, J. C. (1997) ‘Crafting mixed-method evaluation designs’, in
Greene, J. C. and Caracelli, V. J. (eds.) Advances in mixed-method evaluation: The
challenges and benefits of integrating diverse paradigms. San Francisco: Jossey-Bass,
pp. 19-32.
Carr, N. (2001) ‘An exploratory study of gendered differences in young tourists' perceptions
of danger within London’, Tourism Management, 22(5) pp. 565-570
Carter, S. M. and Little, M. (2007) ‘Justifying knowledge, justifying method, taking action:
Epistemologies, methodologies, and methods in qualitative research’, Qualitative
Health Research, 17(10), pp. 1316–1328.
Cases, A.-S. (2002) ‘Perceived risk and risk-reduction strategies in Internet shopping’, The
International Review of Retail, Distribution and Consumer Research, 12(4), pp, 375–
394.
Castells, M. (2001) Internet Galaxy, Oxford: Oxford University Press.
Cetinsoz, B. and Ege, Z. (2013) ‘Impacts of perceived risks on tourists’ revisit intentions’,
Anatolia—An International Journal of Tourism and Hospitality Research, 24(2), pp.
173–187.
Chandrasekhar, C. P. and Ghosh, J. (2001) ‘Information and communication technologies and
health in low income countries: the potential and the constraints’, Bulletin of the World
Health Organization, 79(9), Geneva. Available at:
http://www.scielosp.org/pdf/bwho/v79n9/v79n9a10.pdf
Chang, H. H. and Chen, S. W. (2008) ‘The impact of online store environment cues on
purchase intention: Trust and perceived risk as a mediator’, Online Information Review,
32(6), pp. 818–841.
213
Chatterjee, S., Chakraborty, S., Sarker, S., Sarker, S. and Lau, F. Y. (2009) ‘Examining the
success factors for mobile work in healthcare: A deductive study’, Decision Support
Systems, 46(3), pp. 620–33.
Chen, C. (2013) ‘Perceived risk, usage frequency of mobile banking services’, Managing
Service Quality, 23(5), pp 410–436.
Chen, C. and Tsai, D. (2007) ‘How destination image and evaluative factors affect
behavioural intentions’, Tourism Management, 28(4), pp. 1115-1122.
Chen, G. and Huang, S. (2017) ‘Towards a theory of personal development: Cross-cultural
validation of the BPD scale’, Tourism Management, 59, 630-639.
Chen, H., and Weiler, B. (2014) ‘Chinese Donkey Friends in Tibet – Evidence from the
Cyberspace Community’, Journal of China Tourism Research, 10(4), pp. 475–492.
Chen, Y. Q. and Zhang, H. (2012) ‘Investigation of sports tourism visitors risk perception
and coping behaviour’, Journal of Hebei Institute of Physical Education, 26(3), pp. 38–
43.
Cheng, F., Liu, T.-Y. and Wu, C.-S. (2013) ‘Perceived risks and risk reduction strategies in
online group-buying. International Conference on Technology Innovation and
Industrial Management, pp. 18–24.
Cheung, C. and Lee, M.K.O. (2000) ‘Trust in Internet shopping: A proposed model and
measurement instrument. In Proceedings of the 6th Americas Conference on
Information Systems, pp. 681-689.
Chi, C. G. Q. and Qu, H. (2008) ‘Examining the structural relationships of destination image,
tourist satisfaction and destination loyalty: An integrated approach’, Tourism
Management, 29(4), pp. 624–636.
Chin, W. W. (1998) ‘The partial least squares approach for structural equation modelling’, in
G. A. Marcoulides (ed.) Modern methods for business research. London: Lawrence
Erbaum Associates, pp. 295–336.
Chin, W. W. (2010) ‘How to write up and report PLS Analyses’, in Vinzi, V.E, Chin, W. W.
Henseler, J. and Wang, H. (eds.) Handbook of Partial Least Squares: Concepts,
Methods and Applications in Marketing and Related Fields. Berlin: Springer, pp. 655–
690.
Chin, W. W., Marcolin, B. K. and Newsted, P. R. (2003) ‘A partial least squares latent
variable approach for measuring interaction effects: results from a Monte Carlo
simulation study and an electronic mail emotion/adoption Study’, Information Systems
Research, 14(2), pp. 189–217.
214

Chin, W.W. and Gopal, A. (1995) ‘Adoption intention in GSS: Relative importance of
beliefs’, DATA BASE for Advances in Information Systems 26 (2&3), pp. 42-64.
Cho, M., Bonn, M. A. and Kang, S. (2014) ‘Wine attributes, perceived risk and online wine
repurchase intention: The cross-level interaction effects of website quality’,
International Journal of Hospitality Management, 43, pp. 108–120.
Choi, J. and Lee, K. (2003) ‘Risk perception and e‐shopping: A cross‐cultural study’, Journal
of Fashion Marketing and Management: An International Journal, 7(1), pp. 49–64.
Choi, M., Robles, R. J., Hong, C. and Kim, T. (2008) ‘Wireless network security:
Vulnerabilities, threats and countermeasures’, International Journal of Multimedia and
Ubiquitous Engineering, 3(3), pp. 77–86.
Clarke, I. (2001) ‘Emerging value propositions for m-commerce’, Journal of Business
Strategies, 18, pp. 133–148.
Cohen, E. (1972) ‘Toward a sociology of international tourist’, Social Research, 39(1), pp.
164–189.
Cohen, E. (1973) ‘Nomads from affluence: Notes on the phenomenon of drifter-tourism’,
International Journal of Comparative Sociology, 14(1–2) pp. 89–103.
Cohen, E. (1982) ‘Marginal paradises: Bungalow tourism on the islands of southern
Thailand. Annals of Tourism Research, 9(2), pp. 189–228.
Cohen, E. (2003) ‘Backpacking: Diversity and change’, Journal of Tourism and Cultural
Change, 1(2), pp. 95–110.
Cohen, E. (2015) ‘Drifter tourist’ in Jafari, J. and Xiao, H. (eds.) Encyclopaedia of Tourism,
Springer.
Cohen, E. (2017) ‘Backpackers enclaves research: Achievements, critique and alternative
approaches’, Tourism Recreation Research.
http://dx.doi.org/10.1080/02508281.2017.1388572
Cohen, J. (1988) Statistical power analysis for the behavioural sciences. 2nd edn. Hillsdale,
NJ: Lawrence Earlbaum Associates.
Cohen, S. (2011) ‘Lifestyle travellers’, Annals of Tourism Research, 38(4), pp. 1535–1555.
Collett, S. (2014) ‘Relentless cyber criminals are always looking for the next big hack, and
mobile devices are the new frontier’, http://www.csoonline.com/article/2157785/data-
protection/five-new-threats-to-your-mobile-device-security.html.
Coltmana, T., Devinneyb, T. M., Midgleyc, D. F. and Venaikd, S. (2008) ‘Formative versus
reflective measurement models: Two applications of erroneous measurement. Journal
of Business Research, 61(12), pp. 1250–1262.
215

Commonwealth Office Travel Advisory (2015) Safety and security.
https://www.gov.uk/foreign-travel-advice/ghana/safety-and-security
Conchar, M. P., Zinkhan, G. M., Peters, C. and Olavarrieta, S. (2004) ‘An integrated
framework for the conceptualization of consumers’ perceived-risk processing’,
Academy of Marketing Science, 32(4), pp. 418–436.
Coombs, C. H. (1964) A theory of data. New York: Wiley.
Cooper, G. (2001) ‘The mutable mobile: Social theory in the wireless world’, in Brown, B.,
Green, N. and Harper, R. (eds.) Wireless World: Social, cultural and interactional
issues in mobile communications and computing. London: Springer Verlag, pp. 19–31.
Corbett, S. (2013) ‘The retention of personal information online: A call for international
regulation of privacy law’, Computer Law and Security Review, 29(3), pp. 246–254.
Cox, D. F. (Ed.) (1967) Risk taking and information handling in consumer behaviour.
Boston: Harvard University Press.
Cox, D. F. and Rich, S. U. (1964) ‘Perceived risk and consumer decision-making – The case
of telephone shopping’, Journal of Marketing Research 4(3), pp. 32 - 39.
Crabtree, B. and Miller, W. (1999) ‘A template approach to text analysis: Developing and
using codebooks’, in Crabtree, B and Miller, W. (eds.) doing qualitative research.
Newbury Park, CA: Sage, pp. 163-177
Crano, W. D. (1995) ‘Attitude strength and vested interest’, in Petty, R. E. and Krosnick, J.
A. (eds.), Attitude strength: Antecedents and consequences. Mahwah, NJ: Erlbaum, pp.
131–58.
Crespo, A. H., del Bosque, I. R. and de los Salmones Sánchez, M. M. G. (2009) ‘The
influence of perceived risk on Internet shopping behaviour: A multidimensional
perspective’, Journal of Risk Research, 12(2), pp 259–277.
Creswell, J. W. (1994) Research design: Qualitative and quantitative approaches. London:
SAGE Publications.
Creswell, J. W. (2003) Research design: Qualitative, quantitative, and mixed approaches.
Thousand Oaks, CA: Sage.
Creswell, J. W. (2012) Educational research: Planning, conducting, and evaluating
quantitative and qualitative research. 4th edn. Bosten, USA. Pearson Education Inc.
Creswell, J. W. and Plano Clark, V. L. (2007) Designing and conducting mixed methods
research. Thousand Oaks, CA: Sage.
216

Creswell, J. W. and Plano Clark, V. L. (2011) Designing and conducting mixed methods
research. Thousand Oaks, CA: Sage.
Creswell, J. W., Plano Clark, V. L., Gutmann, M. L. and Hanson, W. E. (2008) ‘An expanded
typology for classifying mixed methods research into design. The mixed methods
reader’, in Clark, V. L. P and Creswell, J. W. (eds.) The mixed methods reader.
Thousand Oaks, CA: Sage, pp. 159–197.
Creswell, T. (2005) 'Moral geographies”, in Atkinson, D., Jackson, P. Sibley, D. and
Washbourne, N. (eds.), cultural geography: A dictionary of key concepts. New York: I.
B. Tauris & Co, pp. 128–134.
Crotty, M. (1998) The foundations of social research. London: Sage.
Cunningham, L. F., Gerlach, J. and Harper, M. D. (2004) ‘Assessing Perceived Risk of
Consumers in Internet Airline Reservation Services’, Journal of Air Transportation,
9(1) pp. 21–35.
Cunningham, L. F., Gerlach, J. and Harper, M. D. (2005) ‘Perceived risk and e-banking
services: An analysis from the perspective of the consumer’, Journal of Financial
Services Marketing, 10(2), pp. 165–178.
Cunningham, L. F., Gerlach, J. H., Harper, M. D. and Young, C. E. (2005) ‘Perceived risk
and the consumer buying process: Internet airline reservations’, International Journal
of Service Industry Management, 16(4), pp. 357-372.
Cunningham, S. (1967) ‘The major dimensions of perceived risk’, in Cox, D. (ed.) Risk
taking and information handling in consumer behaviour. Boston, MA: Harvard
University Press, pp. 82–108.
Cunningham, S. M. (1964) ‘Perceived risk as a factor in product oriented word-of-mouth
behaviour: a first step’, Proceedings of the Educator’s Conference, American
Marketing Association, pp. 229-38.
Cunningham, S. M. (1966) ‘Perceived risk as a factor in the diffusion of new product
information’, in Haas, R. M. (ed.), Science, technology and marketing. Chicago:
American Marketing Association, pp. 698-721.
Dai, B., Forsythe, S. and Kwon, W. S. (2014) ‘The impact of online shopping experience on
risk perceptions and online purchase intentions: Does product category matter?’,
Journal of Electronic Commerce Research, 15(1), pp. 13–24.
Dayour, F. (2013) ‘Motivations of backpackers in the Cape Coast-Elmina Conurbation,
Ghana’, African Journal of Hospitality, Tourism and Leisure, 2(3), pp. 1-13.
217

Dayour, F. Adongo, A. C. and Taale, F. (2016) ‘Determinants of backpackers’ expenditure’,
Tourism Management Perspectives, 17, pp. 36-43.
Dayour, F., Bacho, F. and Bonye, S. (2013) ‘Characteristics of budget travellers: The case of
backpackers in the cape coast- Elmina area, Ghana’, African Journal of Hospitality
Tourism and Leisure, 2(4) pp. 1-13.
Dayour, F., Kimbu, N. A. and Park, S. (2017) ‘Backpacking: The need reconceptualisation’,
Annals of Tourism Research, 66, pp. 191-198.
https://doi.org/10.1016/j.annals.2017.06.004.
Deloitte. (2014) “The smartphone generation gap: Over 55? There’s no app for that”.
Available at: https:// www2.deloitte.com/content/dam/Deloitte/global/
Documents/Technology-Media-Telecommunications/ gx-tmt-2014prediction-
smartphone.pdf.
Denzin, N. K. (1978) The research act: A theoretical introduction to sociological methods.
New York: Praeger.
Derbaix, C. (1983) ‘Perceived risk and risk relievers: An empirical investigation’, Journal of
Economic. Psychology, 3(1), pp. 19-38.
Dickinson, J. E., Ghali, K., Cherrett, T., Speed, C., Davies, N. and Norgate, S. (2014)
‘Tourism and the smartphone app: Capabilities, emerging practice and scope in the
travel domain’, Current Issues in Tourism, 17(1), pp. 84– 101.
Dickson, T. and Dolnicar, S. (2004) “No risk, no fun: The role of perceived risk in adventure
tourism”, Paper presented at the 13th International Research Conference of the Council
of Australian University Tourism and Hospitality Education (CAUTHE), Brisbane.
Dijkstra, T. K. and Henseler, J. (2011) ‘Linear indices in nonlinear structural equation
models: best fitting proper indices and other composites’, Quality and Quantity, 45(6),
pp. 1505-1518.
Dolnicar, S (2007) ‘Crises' that scare tourists: Investigating tourists' travel-related concerns’,
in Laws, E., Prideaux, B. Chon, K.S. (eds.) Crisis Management in Tourism. CABI
Publishing.
Dolnicar, S. (2005) ‘Understanding barriers to leisure travel: Tourist fears as a marketing
basis’, Journal of Vacation Marketing, 11(3), pp. 197–208.
Douglas, M. (1978) ‘Cultural Bias’, Occasional Paper no. 35, Royal Anthropological Institute
of Great Britain and Ireland.
Douglas, M. and Wildavsky, A. (1982) Risk and culture. Berkeley, Los Angeles, London:
University of California Press.
218

Dowling, G. R. (1986) ‘Perceived risk: The concept and its measurement’, Psychology and
Marketing, 3(3), pp. 193–210.
Dowling, G. R. and Staelin, R. (1994) ‘A model of perceived risk and intended risk-handling
activity’, Journal of Consumer Research, 21(1), pp. 119-134.
Duncan, T. (2010) Gap year experiences and New Zealanders: A fresh perspective? Paper
presented at the Mobilities Symposium. Dunedin, New Zealand.
Edwards, J. R. (2001) ‘Multidimensional Constructs in Organizational Behaviour Research:
An Integrative Analytical Frame work’, Organizational Research Methods, (4:2), pp.
144-192.
Edwards, J. R. (2011) ‘The fallacy of formative measurement’, Organizational Research
Methods, 14(2), pp. 370–388.
Elsrud, T. (2001) ‘Risk creation in traveling: Backpacker adventure narration’, Annals of
Tourism Research, 28, pp 597–617.
Erdfelder, E., Faul, F. and Buchner, A. (1996) ‘GPower: A general power analysis program’,
Behaviour Research Methods, Instruments and Computers, 28, pp 1-11.
Esselaar, S., Stork, C. and Andjelkovic, M. (2014) Mobile at the base of the pyramid: Ghana,
pp. 1–46. Available at: http://www.infodev.org/infodev-files/
Faul, F., Erdfelder, E., Lang, A.-G. and Buchner, A. (2007) ‘G*Power 3: A flexible statistical
power analysis for the social, behavioural, and biomedical sciences’, Behaviour
Research Methods, 39, pp. 175-191.
Featherman, M.S. and Pavlou, P.A. (2003) ‘Predicting e-services adoption: A perceived risk
facets perspective’, International Journal of Human-Computer Studies, 59(4), pp. 451-
474.
Feighery, W. (2006) 'Reflexivity and tourism research: Telling an (other) story', Current
Issues in Tourism, 9(3), pp. 269-282.
Felson, M. and Cohen, L. (1979) Social change and crime rate trends: A routine activities
approach. American Sociological Review, 44, pp. 588–608.
Filieri, R., Alguezaui, S. and Mcleay, F. (2015) ‘Why do travellers trust TripAdvisor ?
Antecedents of trust towards consumer-generated media and its influence on
recommendation adoption and word of mouth’, Tourism Management, 5, pp. 174–185.
Fischer, C. D. (1980) ‘On the dubious wisdom of expecting job satisfaction to correlate with
performance’, Academy of Management Review, (5/4), pp. 607-612.
Flynn, J., Slovic, P. and Mertz, C. K. (1994) ‘Gender, race and environmental health risks’,
Risk Analysis, 14, pp. 1101-1108.
219

Fogg, B. J. (1998) Persuasive computers: Perspectives and research directions. Proceedings
of the SIGCHI conference on Human Factors in Computing Systems. New York: ACM
Press.
Folkes, V. S. (1988) ‘The availability heuristic and perceived risk’, Journal of Consumer
Research, 15, pp. 13-23.
Forgas, J. (2003) ‘Affective influences on attitudes and judgments’, in R. Davidson, K.
Scherer, & H. Goldsmith (eds.), Handbook of affective sciences. Oxford: Oxford
University Press.
Fornell, C, and Larcker, D. F. (1981) ‘Evaluating structural equation models with
unobservable variables and measurement error. Journal of Marketing Research, 18(1),
pp. 39–50.
Fornell, C. G. and Bookstein, F. L. (1982) ‘Two structural equation models: LISREL and
PLS applied to consumer exit-voice theory. Journal of Marketing Research, 19, pp.
440-452.
Forsythe, S. M., and Shi, B. (2003) ‘Consumer patronage and risk perceptions in Internet
shopping’, Journal of Business Research, 56(11), pp. 867–875.
Fountoukali, P., Leue M. C, and Jung, T. (2015) ‘Distribution of channels for travel and
tourism: The case of Crete’, in I, P Tussyadiah and A. Inversini (eds.), Information
Communication Technologies in Tourism 2015, New York: Springer International
Publishing, pp. 667-679.
Fram, E. H. and Grady, D. B. (1995) ‘Internet buyers: Will the surfers become buyers?’,
Direct Marketing, 58(6), pp. 63-65
Frith, H. and Gleeson, K. (2004) ‘Clothing and embodiment: Men managing body image and
Appearance’, Psychology of Men & Masculinity, 5(1), pp. 40-48.
Frith, J. (2012) ‘Splintered space: Hybrid spaces and differential mobility’, Mobilities, 7(1),
pp. 131–149.
Fuchs, G. and Reichel, A. (2004) ‘Cultural differences in tourist destination risk perception:
An exploratory study’, Tourism, 52(1), pp. 21–37.
Fuchs, G. and Reichel, A. (2006) ‘Tourist destination risk: The case of Israel’, Journal of
Hospitality and Leisure Marketing, 14(2), pp. 83-105
Fuchs, G. and Reichel, A. (2011) ‘An exploratory inquiry into destination risk perceptions
and risk reduction strategies of first time versus repeat visitors to a highly volatile
destination’, Tourism Management, 32, 266-276.
220

Gao, Q, Rau, P-L. P. and Salvendy, G. (2009) ‘Perception of interactivity: Effects of four key
variables in mobile advertising’, International Journal of Human Computer Interaction,
25(6), pp. 479–505.
Gefen, D. (2000) ‘E-commerce: The role of familiarity and trust’, Omega: The International
Journal of Management Science, 28(6), pp. 725-737.
Germann Molz, J. (2006) ‘Watch us wander': Mobile surveillance and the surveillance of
mobility’, Environment and Planning, 38(2), pp. 377-39.
Germann Molz, J. and Paris, C. M. (2013) ‘The social affordances of flashpacking: Exploring
the mobility nexus of travel and communication’, Mobilities, 10(2), pp. 173-192.
Germunden, H. G. (1985) ‘Perceived risk and information search: A systematic meta-analysis
of empirical evidence’, International Journal of Research in Marketing, 2, pp. 79–100.
Gerrard, P. and Cunningham, J.B. (2003) ‘The diffusion of Internet banking among
Singapore consumers’, International Journal of Bank Marketing, 21, pp. 16-28
Ghana Statistical Service [GSS]. (2014) Statistics for development and progress: gross
gomestic Product 2014, (April), 3. Available at:
http://www.statsghana.gov.gh/docfiles/GDP/GDP_2014.pdf.
Ghana Statistical Service [GSS]. (2016) Projected population by sex (2010-2016). Data
Production United. http://www.statsghana.gov.gh/socio_demo.html.
Ghana Tourism Authority (2015) Tourism Facts Sheet on Ghana. Accra: Ghana Tourism
Authority.
Ghana Wild Life Division (1994) Management Plan for Mole National Park. Accra: Ghana
Wild Life Division.
Gibbons, S. M. and Selvarajah, C. T. (1994) A study of the international backpacker visitor to
New Zealand: Building a profile to assess value and impact, Unpublished report.
Albany: Department of Management Systems, Massey University
Goddard, W. and Melville, S. (2004) Research methodology: An introduction. 2nd edn.
Blackwell Publishing.
Godfrey, J. (2011) The grass is greener on the other side: What motivates backpackers to
leave home and why they choose New Zealand as a destination, (Thesis, Master of
Tourism), University of Otago Available at:
https://ourarchive.otago.ac.nz/handle/10523/1736 (Accessed: 20th November 2015).
Goldsmith, R.E., Freiden, J.B. and Eastman, J.K. (1995) ‘The generality/specificity issue in
consumer innovativeness research’, Technovation, 15(10), pp. 601-12.
221

Goodson, L. and Phillimore, J. (2004) 'The inquiry paradigm in qualitative tourism research',
in Phillimore, J. & Goodson, L. (eds.) Qualitative research in tourism: Ontologies,
epistemologies and methodologies. London: Routledge, pp. 30-45.
Goodwin, H. (1999) ‘Backpackers good, package tourists bad?’, in Focus, 31, pp. 12-13.
Grahame, R., Dowling, G. R. and Staelin, R. (1994) ‘A model of perceived risk and intended
risk handling activity’, Journal of Consumer Research, 21, pp. 119–134.
Gray, H. P. (1970) International travel – international trade. Lexington: Heath Lexington
Books.
Greatorex, M. and Mitchell, V. W. (1994) ‘Modelling consumer risk reduction preferences
from perceived loss data’, Journal of Economic Psychology, 15(4), pp. 669–685.
Greene, J. C. (2007) Mixed methods in social inquiry. San Francisco: Jossey-Bass.
Gretzel, U. and D. R. Fesenmaier. (2002) ‘Building narrative logic into tourism information
systems’, IEE Intelligent Systems, 17(6), pp. 59-6.
Gretzel, U., Fesenmaier, D. R. and O’Leary, J. T. (2006) ‘The transformation of consumer
behaviour’, in Buhalis, D. and Costa, C. (eds.), Tourism business frontiers’. Burlington:
MA: Elsevier/Butterworth-Heinemann, pp. 9–18.
Gretzel, U., Sigala, M., Xiang, Z. and Koo, C. (2015) ‘Smart tourism: Foundations and
developments’, Electronic Markets, 25(3), pp. 179–188.
Grewal D, Gotlieb J. and Marmorstein H (1994) ‘The moderating effects of message framing
and source credibility on the price-perceived risk relationship. Journal of Consumer
Research, 21(1), pp. 145–153.
Gu, J. C., Lee, S. C. and Suh, Y. H. (2009) ‘Determinants of behavioural intention to mobile
banking’, Expert Systems with Applications, 36(9), pp. 11605–11616
Guba, E. G. (1990) ‘The alternative paradigm dialog’, in Guba, E. G. (ed.) The paradigm
dialog. Newbury Park, CA: Sage, pp. 17–27.
Guba, E. G. and Lincoln, Y. S. (1994) ‘Competing paradigms in qualitative research’, in
Denzin, N. K. and Lincoln, Y. S. (eds.) Handbook of qualitative research. Thousand
Oaks, CA: Sage, pp. 105-117.
Gunn, C. A. (1972) Vactionscape: Designing tourists’ regions. Austin: Beau of Business
Research, University of Texas.
Guthrie, S. E. (1993) Faces in the clouds: A new theory of religion, New York: Oxford
University Press.
Hagerstrand, T. (1970) ‘What about people in regional science?’ Papers of the Regional
Science Association, 24 pp. 7-21
222

Haigh, R. (1995) Backpackers in Australia. Occasional Paper No. 20, Canberra: Bureau of
Tourism Research.
Hair, J. F., Hult, G. T. M., Ringle, C. M. and Sarstedt, M. (2014) A Primer on Partial Least
Squares Structural Equation Modelling (PLS-SEM) . Thousand Oaks, CA: Sage .
Hair, J. F., Hult, G. T. M., Ringle, C. M. and Sarstedt, M. (2017 ) A Primer on Partial Least
Squares Structural Equation Modelling (PLS-SEM) . Thousand Oaks, CA: Sage .
Hair, J. F., Ringle, C. M. and Sarstedt, M. (2011) ‘PLS-SEM: Indeed, a silver bullet’, Journal
of Marketing Theory and Practice, 19(2), pp. 139-151.
Hajibaba, H. Gretzel, U., Leisch F. and Dolnicar, S. (2015) ‘Crisis-resistant tourists’ Annals
of Tourism Research, 53, pp. 46–60.
Hales, C. and Shams, H. (1991) ‘Cautious incremental consumption: A neglected consumer
risk reduction strategy’, European Journal of Marketing, 25(7), pp. 7-22.
Hall, C. M., Timothy, D. J. and Duval, D. T. (2004) ‘Security and tourism: Towards a new
understanding? Journal of Travel and Tourism Marketing, 15(2-3), pp. 1-18.
Hampton, M. P. (1998) ‘Backpacker tourism and economic development’, Annals of Tourism
Research, 25, pp. 639–660.
Hanafizadeh, P. and Khedmatgozar, H. R. (2012) ‘The mediating role of the dimensions of
the perceived risk in the effect of customers’ awareness on the adoption of Internet
banking in Iran’, Electronic Commerce Research, 12(2), pp. 151–175.
Hannam, K. and Ateljevic, I. (2008) ‘Introduction: Conceptualising and profiling backpacker
Tourism’, in Hannam, K. and Ateljevic, I. (eds.) Backpacker tourism: Concepts and
profiles. Clevedon: Channel View Publications, pp. 1-6.
Hannam, K. and Diekmann, A. (2010) ‘From backpacking to flashpacking: Developments in
backpacker tourism research’, in Hannam, K. and Diekmann, A. (eds.) Beyond
backpacker tourism: Mobilities and experiences. Bristol: Channel View Publications,
pp. 1–7.
Hannam, K., Butler, G. and Paris, C. M. (2014) ‘Developments and key issues in tourism
mobilities’, Annals of Tourism Research, 44(1), pp. 171–185.
Hannonen, P. (2003) ‘Tourists and travellers are very different: How mainstream tourists and
budget travellers are seen by backpackers. Acta Ethnographica Hungarica, 48(1-2), pp.
161-172.
Hasan, M. K., Ismail, A. R. and Islam, M. F. (2017) ‘Tourist risk perceptions and revisit
intention: A critical review of literature’, Cogent Business and Management, 4(1).
223

Henseler, J., Ringle C. M. and Sarstedt, M. (2016) ‘Testing measurement invariance of
composites using partial least squares’, International Marketing Review, 33(3), pp. 405-
431.
Henseler, J., Ringle, C. M. and Sarstedt, M. (2015) ‘A new criterion for assessing
discriminant validity in variance-based structural modelling’, Journal of the Academy
of Marketing Science, 43, pp. 115-135.
Hibbert, C. (1969) The Grand Tour. London: Weidenfeld and Nicholson.
Hindle, N., Martin, A. and Nash, R. (2015) ‘Tourism development and the backpacker market
in Highland Scotland’, Journal of Tourism Research, 0(0), pp. 1-15.
Hirschman, E. C. (1980) ‘Innovativeness, novelty seeking and consumer creativity’, Journal
of Consumer Research, 7(3), pp 283-95.
Hoepken, W., Fuchs, M., Zanker, M. and Beer, T. (2010) ‘Context-based adaption of mobile
applications in tourism’, Information Technology and Tourism, 12, pp. 175–195
Hoffman, D. L., Novak, T. P and Venkatesh, A. (2004) ‘Has the Internet become
indispensable?’, Communications of the ACM” 47(7), pp. 37-42.
Hoffman, D., Novak, T. and Peralta, M. (1999) ‘Building consumer trust online’,
Communications of the ACM, 42(4), pp. 80–85.
Hoffman, K. D. and Turley, L. W. (2002) ‘Atmospherics, service encounters and consumer
decision-making: An integrative perspective’, Journal of Marketing Theory and
Practice, 10(3), pp. 33-47
Hofstede, G. (2001) Culture’s consequences: Comparing values, behaviours, institutions and
organizations across nations. Beverly Hills, CA: Sage Publications.
Holloway, J. C. (2004). Marketing for tourism. 4th edn. Harlow, England: Prentice Hall.
Hood, A. B. and Johnson, R. W. (1997). Assessment in counselling: A guide to psychological
assessment procedures (2nd edn.). Alexandria, VA: American Counselling Association.
Hoshmand, L.T. (2003) ‘Can lessons of history and logical analysis ensure progress in
psychological science?’ Theory and Psychology, 13, pp. 39–44.
Hossain, M., Quaddus, M. and Shanka, T. (2015) ‘Effects of intrinsic and extrinsic quality
cues and perceived risk on visitors’ satisfaction and loyalty’, Journal of Quality
Assurance in Hospitality & Tourism, 16(2), pp. 119–140.
Hostelbookers.com. (2010). Travel articles: Flashpacking. Available at
http://www.hostelboo-kers.com
Hottola, P. (2005) ‘The metaspatialities of control management in tourism: Backpacking in
India’, Tourism Geographies, 7, pp. 1-22.
224

Hu, L. and Bentler, P. M. (1998) ‘Fit indices in covariance structure modelling: Sensitivity to
under parameterised model misspecification’, Psychological Methods, 3(4), pp. 424-53.
Hu, L. and Bentler, P. M. (1999) ‘Cut-off criteria for fit indexes in covariance structure
analysis: Conventional criteria versus new alternatives’, Structural Equation Modelling,
6, pp. 1–55.
Hu, Q. Z. (2011) ‘Guest review of risk perception’, Bus Cult, 8, pp. 331–332
Hunter-Jones, P., Jeffs, A. and Smith, D. (2008) ‘Backpacking your way into crisis: An
exploratory study into perceived risk and tourist behaviour amongst young people’,
Journal of Travel and Tourism Marketing, 23(2/4), pp. 237-248.
Hwang, H., Malhotra, N. K., Kim, Y., Tomiuk, M. A. and Hong, S. (2010) ‘A comparative
study on parameter recovery of three approaches to structural equation modelling’,
Journal of Marketing Research, 47, pp. 699-712.
Hwang, J. and Park, S. (2015) ‘Social media and smartphone for restaurant decision-making
process’, in Tussyadiah, I. P. and Inversini, A. (eds) (2015) Information
Communication Technologies in Tourism 2015. New York: Springer International
Publishing, pp. 269-281.
Iaquinto, B. L. (2011) ‘Fear of a Lonely Planet: Author anxieties and the mainstreaming of a
Guidebook’, Current Issues in Tourism, 14(8), pp. 705-723.
Iaquinto, B. L. (2012) ‘Backpacking in the Internet age: Contextualising the use of Lonely
Planet Guidebooks’, Tourism Recreation Research, 37(2), pp. 145–155.
Igbaria, M. (1993) ‘User acceptance of microcomputer technology: An empirical test’,
Omega International Journal of Management Science, 21(1), pp. 73–90.
Im I, Kim Y. and Han H. J. (2008) ‘The effects of perceived risk and technology type on
users’ acceptance of technologies’, Information Management, 45(1), pp. 1–9.
Institute for Economics and Peace. (2015) Global Peace Index 2015: Quantifying Peace and
its Benefits. Institute for Economics and Peace, 120. Available at:
www.economicsandpeace.org
International Data Corporation [IDC] (2015) ‘Smartphone OS market share, 2015, Q2’,
http://www.idc.com/prodserv/smartphone-market-share.jsp
International Telecommunication Union [ITU]. (2017) ‘ICT facts and figures: The world in
2015’, http://www.itu.int/en/ITU-D/Statistics/Pages/facts/default.aspx.
Jacoby, J. and Kaplan, L. B. (1972). ‘The components of perceived risk’, in Venkatesan V.
(Ed.), Proceedings of the 3rd Annual Conference of the Association for Consumer
Research College Park, MD: Association for Consumer Research, pp. 382–393.
225

Janelle, D. G (1973) ‘Measuring human extensibility in a shrinking world’ Journal of
Geography, 72(5), pp. 5-10.
Janelle, D. G. (2004), ‘Impact of information technologies’, in Hanson, S. and Giuliano, G.
(eds.) The Geography of urban transportation, 3rd edn. New York: Guilford, pp. 86–
112.
Jang-Jaccard, J. and Nepal, S. (2014) ‘A survey of emerging threats in cybersecurity’,
Journal of Computer and System Sciences, 80(5), pp. 973–993.
Jansson, A. (2007) ‘A Sense of Tourism: New media and the dialectic of
encapsulation/decapsulation’, Tourist Studies, 7(1), pp. 5-24.
Jarvenpaa, S. and Tractinsky, N. (1999) ‘Consumer trust in an Internet store: A cross-cultural
validation’ Journal of Computer Mediated Communication, 5(2), pp. 1–35.
Jarvenpaa, S. L. and Todd, P. A. (1996) ‘Consumer reactions to electronic shopping on the
World Wide Web’, International Journal of Electronic Commerce, 1(2), pp. 59-88.
Jarvis, C. B., Mackenzie, S. B. and Podsakoff, P. M. (2003) ‘A critical review of construct
indicators and measurement model misspecification in marketing and consumer
research’, Journal of Consumer Research, 30(3), pp. 199-218.
Jarvis, D., MacKenzie, S. and Podsakoff, P. (2003) ‘A critical review of construct indicators
and measurement model misspecification in marketing and consumer research’,
Journal of Consumer Research, 30 (3), pp. 199-218.
Jarvis, J. and Peel, V. (2010) ‘Flashpacking in Fiji: Reframing the global nomad in a
developing destination’, in Hannam, K. and Diekmann, A (eds.) Beyond backpacker
tourism: Mobilities and experiences. Toronto: Channel View Publications, pp. 21-39.
Jehle, G. A. and Reny P. J. (2011) ‘Advanced microeconomics theory’. Essex, England:
Pearson Education.
Jenkins, C. (1982) ‘The effects of scale in tourism projects in developing countries’, Annals
of Tourism Research, 9, pp. 229–249.
Jenkins, O. H. (2003) ‘Photography and travel brochures: The circle of representation’,
Tourism Geographies, 5(3), pp. 305-328.
Jin, E., Line, N. and Merkebu, J. (2016) ‘The impact of brand prestige on trust, perceived
risk, satisfaction, and loyalty in upscale restaurants’, Journal of Hospitality Marketing
& Management, 25(5), pp. 523–546.
Johnson, B. and Christensen, L. (2004) Educational research: Quantitative, qualitative, and
mixed approaches. 2nd edn. Needham Heights, MA: Allyn & Bacon.
226

Johnson, B. and Turner L. A. (2003) ‘Data collection strategies in mixed methods research’,
in Tashakkori, A. and Teddlie C. (eds.) Handbook of mixed methods in social and
behavioural research, pp. 297-320.
Johnson, M. S., Sivadas, E. and Garbarino, E. (2008) ‘Customer satisfaction, perceived risk
and affective commitment: an investigation of directions of influence’, Journal of
Services Marketing, 22(5), pp. 353–362.
Johnson, M., Gabarino, E. and Sivadas, E. (2006) ‘Influences of customer differences of
loyalty, perceived risk and category experience on customer satisfaction ratings’,
International Journal of Market Research, 48(5), pp. 601–622.
Johnson, P. and Clark, M. (2006) ‘Editors’ introduction: Mapping the terrain: An overview of
business and management research methodologies’, in John, P and Clark, M (eds.)
Business and management research methodologies. London: Sage, pp. pp. xxv-iv
Johnson, R. and Onwuegbuzie, A. (2004) ‘Mixed methods research: A research paradigm
whose time has come’, Educational researcher, 33(7), pp. 14–26.
Johnson, R. B. and Turner, L. A. (2003) ‘Data collection strategies in mixed methods
research’, in Tashakkori, A and Teddlie, C. (eds.) Handbook of mixed methods in social
and behavioural research. Thousand Oaks, CA: Sage, pp. 297–319.
Johnson, R. B., Meeker, K. M., Loomis, E. J. and Onwuegbuzie, A. J. (2004) ‘Development
of the philosophical and methodological beliefs inventory’, Paper presented at the
annual meeting of the American Educational Research Association, San Diego, CA.
Johnson, R. B., Onwuegbuzie, A. J. and Turner, L. A. (2007) ‘Toward a definition of mixed
methods research’, Educational Researcher, 1(2), pp. 112 – 133.
Johnson, R. E., Rosen, C. C., Chang, C.-H., Djurdjevic, E. and Taing, M.U. (2012)
‘Recommendations for improving the construct clarity of higher-order
multidimensional constructs’, Human Resource Management Review, 22(2), pp. 62-72.
Junglas, I and Watson, R. T. (2006) ‘The U-constructs: four information drives’,
Communications of the Association for Information Systems, 17. Available at:
http://aisel.aisnet.org/cais/vol17/iss1/26)
Kahn, B and Sarin, R. (1988) ‘Modelling ambiguity in decisions under uncertainty’, Journal
of Consumer Research, 15(2), pp. 265–271.
Kain, D. and King, B. (2004) ‘Destination-based product selections by international
backpackers in Australia’, in Richards, G. and Wilson, J. (eds.) The global nomad:
Backpacker travel in theory and practice. Sydney: Channel View Publications, pp. 196-
216.
227

Kaplan, L. B., Szybillo, G. J. and Jacoby, J. (1974) ‘Components of perceived risk in product
purchase: a cross-validation’, Journal of Applied Psychology, 59(3), pp. 287–291.
Karanasios, S. and Burgess, S. (2008) ‘Tourism and Internet adoption: A developing world
perspective’, International Journal of Tourism Research ,10(2), pp. 169-182.
Kelemen, M. and Rumens, N. (2008) An introduction to critical management research.
London: Sage.
Kelle, U. (2006) ‘Combining qualitative and quantitative methods in research practice:
Purposes and advantages’ Qualitative Research in Psychology, 3(4), pp. 293–311.
Khan, J., Abbas, H. and Al-Muhtadi, J. (2015) ‘Survey on mobile user’s data privacy threats
and defence mechanisms’, Procedia Computer Science, 56(1), pp. 376–383.
Kim, D. J., Ferrin, D. L. and Rao, H. R. (2008) ‘A trust-based consumer decision-making
model in electronic commerce: The role of trust, perceived risk, and their antecedents’,
Decision Support Systems, 44(2), pp. 544–564.
Kim, D. Y. Park, J. and Morrison, A. M. (2008) ‘A model of traveller acceptance of mobile
technology’, International Journal of Tourism Research, 10(5), pp. 393-407.
Kim, K. and Prabhakar, B. (2000) ‘Initial trust, perceived risk, and the adoption of Internet
banking’, Proceedings of ICIS, Brisbane, Australia, pp. 10–13.
Kim, L. H, Kim, J., D. and Leong K. J. (2005) ‘The effect of perceived risk and purchase
intention in purchasing airline tickets online’, Journal of Hospitality and Leisure
Marketing, 13, 2, pp. 33-53.
Kim, L. H., Qu, H. and Kim, D. J. (2009) ‘A study of perceived risk and risk reduction of
purchasing air‐tickets online’, Journal of Travel & Tourism Marketing, 26(3), pp. 203–
224.
Kim, M. and Lennon, S. J. (2000) ‘Television shopping for apparel in the United States:
Effects of perceived amount of information on perceived risk and purchase intentions’,
Journal of Family and Consumer Sciences Research, 28(3), pp. 301-330.
Kim, M.-J., Chung, N. and Lee, C.-K. (2011) ‘The effect of perceived trust on electronic
commerce: Shopping online for tourism products and services in South Korea’,
Tourism Management, 32(2), pp. 256–265.
Kim, M.-K., Chang, Y., Wong, S. F. and Park, M.-C. (2013) ‘The effect of perceived risks
and switching barriers on the intention to use smartphones among non-adopters in
Korea’, Information Development, 31(3), pp. 1–12.
228

Kim, S. and Garrison, G. (2009) ‘Investigating mobile wireless technology adoption: An
extension of the technology adoption model’, Information Systems Frontiers, 11(3), pp.
323–33.
Kleijnen, M., de Ruyter, K. and Wetzels, M. (2007) ‘An assessment of value creation in
mobile service delivery and the moderating role of time consciousness’, Journal of
Retailing, 83(1), pp. 33–46.
Kline, R. B. (2005). Principles and practice of Structural Equation Modelling, 2nd edn. New
York: Guilford Press.
Kline, R. B. (2011) Principles and practice of Structural Equation Modelling. New York:
Guilford Press.
Knight, F. (1921) Risk, uncertainty and profit. Boston: Houghton Mifflin.
Ko, E, Kim, E, Y. and Lee, E. K. (2009) ‘Modelling consumer adoption of mobile shopping
for fashion products in Korea’, Psychology and Marketing, 26(7), pp. 669–687.
Kogan, N. and Wallach, M.A. (1964) Risk taking: A study in cognition and personality. New
York: Holt, Rinehart and Winston.
Korstanje, M. E. (2009) ‘Re-visiting risk perception theory in the context of travel’, e-Review
of Tourism Research, 7(4), pp. 68-81.
Korstanje, M. E. (2011) ‘The fear of traveling: A new perspective for tourism and
hospitality’, Anatolia, 22(2), 222-233.
Kozak, M. (2001) ‘Repeaters’ behaviour at two distinct destinations’, Annals of Tourism
Research, 28(3), pp. 784-807.
Kozak, M. (2003) ‘Measuring tourist satisfaction with multiple destination attributes’,
Tourism Analysis, 7, pp. 229-240.
Kraak, M. (2003) ‘The space-time cube revisited from a geo-visualization perspective’, 21st
International Cartographic Conference ICC, (August), 10–16. http://doi.org/0-958-
46093-0
Kramer, R., Modsching, M., Hagen, K. and Gretzel, U. (2007) ‘Behavioural impacts of
mobile tour guides’, in Sigala, M., Mich, L. and Murphy, J (eds.) Information and
communication technologies in tourism. Vienna: Springer-Verlag, pp. 109–118.
Kuhlmeier, D. and G. Knight, (2005) ‘Antecedents to Internet-based purchasing: A
multinational study’, International Marketing Review, 22 (4), pp. 460-473.
Lamsfus, C. Martin, D., Alzua-Sorzabal, C. and Torres-Manzanera, E. (2015) ‘Smart tourism
destinations: an extended conception of smart cities focusing on human mobility’, in
229

Tussyadiah, I. P and Inversini, A. (eds.) Information Communication Technologies in
Tourism 2015. New York; Springer International Publishing, pp. 377-389.
Lamsfus, C., Wang, D., Alzua-Sorzabal, A. and Xiang, Z. (2014) “Going mobile: Defining
context for on-the-go travellers”, Journal of Travel Research.
Larsen, J., Urry, J. and Axhausen, K. (2007) ‘Networks and tourism: Mobile social life’,
Annals of Tourism Research, 34(1), pp. 244–262.
Larsen, S., Brun, W. and Øgaard, T. (2009) ‘What tourists worry about – construction of a
scale measuring tourist worries’, Tourism Management, 30(2), pp. 260-265.
Larsen, S., Øgaard, T. and Brun, W. (2011) ‘Backpackers and mainstreamers: Realities and
myths’, Annals of Tourism Research, 38(2), pp. 690–707.
Law, K. S., Wong, C. and Mobley, W. H. (1998) ‘Toward a taxonomy of multidimensional
constructs’, Academy of Management Review, 23 (4), pp. 741-755.
Law, R. (2006) ‘The perceived impact of risks on travel decisions’, International Journal of
Tourism Research, 8(4), pp. 289-300.
Law, R. (2009) ‘Disintermediation of hotel reservations: The perception of different groups
of online buyers in Hong Kong’, International Journal of Contemporary Hospitality
Management, 21(6), pp. 766-772.
Leavitt, N. (2011) Mobile security: Finally, a serious problem. Technology news
http://www.leavcom.com/pdf/Mobilesecurity.pdf
Lee, C. K., Yoon, Y. S. and Lee, S. K. (2007) ‘Investigating the relationships among
perceived value, satisfaction, and recommendations: The case of the Korean DMZ’,
Tourism Management, 28(1), pp. 204–214.
Lee, M. C. (2009) ‘Factors influencing the adoption of Internet banking: An integration of
TAM and TPB with perceived risk and perceived benefit’, Electronic Commerce
Research and Applications, 8(3), pp. 130–141.
Lee, M. S. Y., McGoldrick, P. J., Keeling, K. A. and Doherty, J. (2003) ‘Using ZMET to
explore barriers to the adoption of 3G mobile banking services’ International Journal
of Retail and Distribution Management, 31, pp. 340–348.
Lee, M-C. (2009) ‘Factors influencing the adoption of Internet banking: An integration of
TAM and TPB with perceived risk and perceived benefits’, Electronic Commerce
Research and Application, 8, pp. 130-141.
Lee, S. Y., Petrick, J. F. and Crompton, J. (2007) ‘The roles of quality and intermediary
constructs in determining festival attendees’ behavioural intention’, Journal of Travel
Research, 45, pp. 402–412.
230

Lepp, A. and Gibson, H. (2003) ‘Tourist roles, perceived risk and international tourism’,
Annals of Tourism Research, 30(3), pp. 606-624
Lepp, A. and Gibson, H. (2008) ‘Sensation seeking and tourism: Tourist role, perception of
risk and destination choice’, Tourism Management, 29(4), pp. 740–750.
Lesile, D. and Wilson, J. (2005) ‘Backpacker and Scotland: A market analysis’, International
Multidisciplinary Journal of Tourism, 1(2), pp. 11-28.
Leung, L. and Wei, R. (2000) ‘More than just talk on the move: Uses and gratifications of the
cellular phone. Journalism and Mass Communication Quarterly, 77(2) pp. 308-320.
Li, Z. and Bai, X. (2010) ‘Influences of perceived risk and system usability on the adoption
of mobile banking service’, International Symposium on Computer Science and
Computational Technology, pp. 51–54.
Lim, F. K. G. (2009) ‘Donkey Friends’ in China: The Internet, civil society and the
emergence of the Chinese backpacking community’, in Winter, T. Teo, P. and Chang,
T. C. (eds.) Asia on tour: Exploring the rise of Asian tourism London, UK and New.
York: Routledge, pp. 291–302
Lim, N. (2003) ‘Consumers’ perceived risk: Sources versus consequences’, Electronic
Commerce Research and Applications, 2(3), pp. 216–228.
Lincoln, Y. S. and Guba, E. G. (1985) Naturalistic enquiry. Beverly Hills, CA: Sage.
Little, A. M. (1991) The impact of tourism on the environment and the culture of the local
population’, Paper prepared for the Strategic Workshop for Transkei Tourism, January,
Port St Johns. Occasional Paper 69. Pietermaritzburg: Institute of Natural Resources.
Liu, J. and Gao, J. (2008) ‘Based tourism risk perception conceptual model—A case study of
Shanghai residents’, Tourism Science, 22(5), pp. 37–43.
Lo, A. S., Cheung, C. and Law, R. (2011) ‘Hong Kong residents’ adoption of risk reduction
strategies in leisure travel”, Journal of Travel & Tourism Marketing, 28(3), pp. 240–
260.
Loewenstein, G. F., Weber, E. U., Hsee, C. K. and Welch, N. (2001) ‘Risk as feelings’,
Psychological Bulletin, 127, pp. 267–286.
Lohmoller, J.-B. (1989) Latent Variable Path Modelling with Partial Least Squares.
Physical-Verlag, Heidelberg, Germany.
Loker, L. (1991) The backpacker phenomenon II: More answers to further questions.
Townsville: Department of Tourism, James Cook University.
Loker-Murphy, L. (1996) ‘Backpackers in Australia: A motivation-based segment study’,
Journal of Travel and Tourism Marketing, 54(4), pp. 23–45.
231

Loker-Murphy, L. and Pearce, P. (1995) ‘Young budget travellers: Backpackers in Australia’,
Annals of Tourism Research, 22, pp 819–843.
Lopez-Nicolas, C. and Molina-Castillo, F. J. (2008) ‘Customer knowledge management and
e-commerce: The role of customer perceived risk’, International of Information
Management, 28, pp. 102–113.
Lowy, S. (2013) ‘Digital technology: Tourism and SoLoMo in 2013 (and beyond!)’, The
Journal for the Tourism Industry, pp. 154-10–11.
Luhmann, N. (1979) Trust and Power. Wiley, Chichester, UK.
Luo, F. L. F. and Li, J. L. J. (2009) Backpacker Internet information search behaviour: A case
study of university students in China. 2009 International Conference on Information
Management, Innovation Management and Industrial Engineering, 3, pp. 547–550.
Luo, W, Liu, J, Liu, J. and Fan, C (2009) ‘An analysis of security in social networks: Eighth
IEEE International Conference on Dependable, Autonomic and Secure Computing,
2009’, pp. 648–651.
Luo, X., Li, H., Zhang, J. and Shim, J. P. (2010) ‘Examining multi-dimensional trust and
multi-faceted risk in initial acceptance of emerging technologies: An empirical study of
mobile banking services’, Decision Support Systems, 49(2), pp. 222–234.
Lyon, J. (1997) Maldives. Hawthorn: Lonely Planet
MacCallum, R. C., Browne, M. W. and Sugawara, H. M. (1996) ‘Power analysis and
determination of sample size for covariance structure modelling’, Psychological
Methods, 1(2), pp. 130-49.
MacKay, K. and Vogt, C. (2012) ‘Information technology in everyday and vacation
contexts’, Annals of Tourism Research, 39(3), pp. 1380–140.
MacKenzie, S. B., Podsakoff, P. M. and Jarvis, C. B. (2005) ‘The problem of measurement
model misspecification in behavioural and organizational research and some
recommended solutions’, Journal of Applied Psychology, 90 (4), pp. 710-730.
MacKenzie, S. B., Podsakoff, P.M., Podsakoff, N.P. (2011) ‘Construct measurement and
validation procedures in MIS and behavioural research: Integrating new and existing
techniques. MIS Quarterly 35(2), pp. 293-334.
Makimoto, T. and Manners, D. (1997) Digital nomad. New York: Wiley
Mansfeld, Y. and Pizam, A. (2006) ‘Tourism and safety issues’, in Mansfeld, Y and Pizam, A
(Eds.) Tourism, security and safety: from theory to practice. Burlington, MA:
Butterworth-Heinemann, pp. 139-141.
Maoz, D. (2006) ‘The mutual gaze’, Annals of Tourism Research, 33(1), pp. 221–239
232

Maoz, D. (2007) ‘Backpackers’ motivations: The role of culture and nationality’, Annals of
Tourism Research, 34(1), pp. 122–140.
Markelj, B. and Bernik, I. (2015) ‘Safe use of mobile devices arises from knowing the
threats’, Journal of Information Security and Applications, 20, pp 84–89.
Martin, C. (2015) The third screen: The ultimate guide to mobile marketing. USA: Nicholas
Brealey Publishing
Mascheroni, G. (2007) ‘Global nomads' network and mobile sociality: Exploring new media
uses on the move’, Information Communication and Society, 10(4), pp. 527-546
Maslow, A. H. (1943) ‘A theory of human motivation’, Psychological Review, 50(4), pp.
370-396.
Mason, S. (2012) ‘Travel connections: Tourism, technology and togetherness in a mobile
world’, Leisure/Loisir, 36(3-4), pp. 374-376.
Mayer, R. J., Davis, J. H. and Schoorman, F. D. (1995) ‘An integrative model of
organizational trust’, Academy of Management Review, 20, pp. 709–734.
Mays, N. and Pope, C. (2000) Quality in qualitative health research, in Pope, C. P. & Mays,
N. (eds.), Qualitative research in health care (pp. 89 - 101). London: BMJ Books.
McCartney, G. (2008) ‘Does one culture all think the same? An investigation of destination
image perceptions from several origins’, Tourism Review, 63(4), pp. 13-26.
McCulloch, J. (1992) ‘The Youth Hostels Association: Precursors and contemporary
achievements’, Journal of Tourism Studies, 3(28), pp 40-45
McDougall, G. H. G. and Snetsinger, D. W. (1990) ‘The intangibility of services:
Measurement and competitive perspectives’, The Journal of Services Marketing, 4(4),
pp. 27-40
McGlone, T., Spain, J. W. and McGlone, V. (2011) ‘Corporate Social Responsibility and the
Millennials’, Journal of Education for Business, 86(4), pp. 195-200
McIntosh, I., Swanson, V., Power, K., Raeside, F. and Dempster, C. (1998) ‘Anxiety and
health problems related to air travel,’ Journal of Travel Medicine, 5(4), pp. 198-204.
Miceli, R., Sotgiu, I. and Settanni, M. (2008) ‘Disaster preparedness and perception of flood
risk: A study in an Alpine Valley in Ital’, Journal of Environmental Psychology, 28, pp.
164-173.
Michalko, G. (2004) ‘Tourism eclipsed by crime: The vulnerability of foreign tourists in
Hungary’, Journal of Travel and Tourism Marketing, 15(2/3), pp. 159-172.
Midgley, D. F. and Dowling, G. R. (1978) ‘Innovativeness: The concept and its
measurement’, Journal of Consumer Research, 4, pp. 229-42.
233

Miles M, B. and Huberman, A. M. (1994) Qualitative date analysis: An expanded
sourcebook. 2nd edn. London: Sage
Miles, J. and Shevlin, M. (2007) ‘A time and a place for incremental fit indices’, Personality
and Individual Differences, 42(5) pp. 869-74.
Milligan P. M. and Hutcheson, D. (2007) Business risks and security assessment for mobile
devices, in MCBE’07: Proceedings of the 8th Conference on 8th WSEAS Int.
Conference on Mathematics and Computers in Business and Economics. Stevens Point,
Wisconsin, USA: World Scientific and Engineering Academy and Society (WSEAS),
pp. 189–193.
Minazzi, R. and Mauri, A. G. (2015) ‘Mobile technologies effect on travel behaviour and
experiences: a preliminary analysis’, in Tussyadiah, I P. and Inversini, A. (eds.),
Information Communication Technologies in Tourism 2015, New York; Springer
International Publishing, pp. 507-521.
Ministry of Communications. (2014) Ghana National Cyber Security Policy and Strategy.
(March), Ministry of Communications: Ghana.
Ministry of Tourism. (2015) National Tourism Development Plan. Accra: Ministry of
tourism.
Mintel. (2003) Youth Travel and Backpacking–International. Retrieved September 20, 2004
from: http:// reports.mintel.com
Mitchell, V. W. (1992) ‘Understanding consumers’ behaviour: can perceived risk theory
help?’, Management Decision, 30, pp. 326-31.
Mitchell, V. W. (1999) ‘Consumer perceived risk: Conceptualisations and models’, European
Journal of Marketing, 33(1/2), pp. 163–195.
Mitchell, V. W. and Vassos, V. (1997) ‘Perceived risk and risk reduction in holiday
purchases: a cross-cultural and gender analysis’, Journal of Euromarketing, 6(3), pp.
47-97.
Mitchell, V. W., Moutinho, L. and Lewis, B. R. (2003) ‘Risk reduction in purchasing
organizational professional services’, The Service Industries Journal, 23(5), pp. 1-19.
Mitchell, V.-W. and Boustani, P. (1994) ‘A preliminary investigation into pre-and post-
purchase risk perception and reduction. European Journal of Marketing, 28(1) pp. 56-
71.
Mitchell, V.-W. and Greatorex, M. (1993) ‘Risk perception and reduction in the purchase of
Consumer Services’, The Service Industries Journal, 13(4), pp. 179–200.
234

Mitchell, V.-W. and Prince, G. S. (1993) ‘Retailing to experienced and inexperienced
consumers’, International Journal of Retail & Distribution Management, 21(5), pp. 10-
21.
Mitchell, V.-W., Davies, F., Moutinho, L. and Vassos, V. (1999) ‘Using neural networks to
understand service risk in the holiday product’, Journal of Business Research, 46(2),
pp. 167-180.
Miyazaki, A. D. and Krishnamurthy, S. (2002) ‘Internet seals of approval: Effects on online
privacy policies and consumer perceptions’, The Journal of Consumer Affairs, 36(1),
pp. 28-49.
Modi, C., Patel, D., Borisaniya, B., Patel, H., Patel, A. and Rajarajan, M. (2013) ‘A survey of
intrusion detection techniques in Cloud’, Journal of Network and Computer
Applications, 36(1), pp. 42–57.
Mohsin, A. and Ryan, C. (2003) ‘Backpackers in the Northern territory of Australia—
motives, behaviours and satisfactions’, International Journal of Tourism Research, 5,
pp. 113–131.
Mondschein, A. (2011) ‘Passeggiata Nuova: social travel in the era of the smartphone
(Working Paper). Rudin centre for transportation policy & management, New York
University. Retrieved from http://wagner.nyu.edu/files/
rudincenter/mondschein_passeggiata_it_social_travel.pd
Moore, G. C. and Benbasat, I. (1991) ‘Development of an instrument to measure the
perceptions of adopting an information technology innovation’, Information Systems
Research, 2(3), pp. 192-222.
Moreira, P. (2007) ‘Stealth risks and catastrophic risks: On risk perception and crisis
recovery strategies’, Journal of Travel and Tourism Marketing, 23(2/3/4), pp. 15–27.
Morse, J. M. (2003) ‘Principles of mixed methods and multimethod research design’, in
Tashakkori, A. & Teddlie, C (eds.) Handbook of mixed methods in social and
behavioural research. Thousand Oaks, CA: Sage, pp. 189-208.
Mossberg, W. (2014) 25 years of personal technology re-code. Retrieved
http://recode.net/2014/04/29/25-years-of-personal-technology/
Moutinho, L. (1987) ‘Consumer behaviour in tourist’, European Journal of Marketing,
21(10), pp. 5-44.
Mowen, J. and Minor, M. (1998) Consumer behaviour. Englewood Cliffs, NJ: Prentice-Hall.
Mura, P. (2010) ‘Scary…but I like it!’ Young tourists' perceptions of fear on holiday’,
Journal of Tourism and Cultural Change, 8(1/2) pp. 30-49.
235

Mura, P. and Cohen, A. S. (2011) ‘Introduction to special issue on ‘leisure, tourism and risk’,
Recreation and Society in Africa, Asia and Latin America, 1(2), pp. 1-6.
Murray, K. B. (1991) ‘A test of services marketing theory: Consumer information acquisition
activities’, Journal of Marketing, 55(1), pp. 10-25.
Murray, K. B. and Schlacter, J. L. (1990) ‘The impact of services versus goods on
consumers’ assessment of perceived risk and variability’, Journal of the Academy of
Marketing Science, 18(1), pp. 51-65.
Nakata, C. and Sivakumar, K. (1996) ‘National culture and new product development: An
integrative review’, Journal of Marketing, 60(1), pp. 61-72
Netemeyer, R. G., Bearden, W. O., Sharma, S. (2003) Scaling Procedures: Issues and
applications. Sage Publications, Thousand Oaks.
Neuhofer, B., Buhalis, D. and Ladkin, A. (2012) ‘Conceptualising technology enhanced
destination experiences’, Journal of Destination Marketing & Management, 1(1), pp.
36–46.
Neuhofer, B., Buhalis, D. and Ladkin, A. (2014) ‘A typology of technology-enhanced
tourism experiences’, International Journal of Tourism Research, 16, pp. 340-350
Newman, I. and Benz, C. R. (1998) Qualitative-quantitative research methodology:
Exploring the interactive continuum. Carbondale, IL: Southern Illinois University
Press.
Nicolaou, A. and McKnight, D. H. (2006) ‘Perceived information quality in data exchanges:
Effects on risk, trust, and intention to use’, Information Systems Research, 7(4), pp.
332–351.
Nielsen (2014a) ‘Mobile Millenials: over 85% of Generation Y Owns Smartphones’,
Available at: http://www.nielsen.com/us/en/insights/news/2014/mobile-millennials-
over-85- percent-of-generation-y-owns-smartphones.html
Nok, L. C., Suntikul, W., Agyeiwaah, E. and Tolkach, D. (2017). Backpackers in Hong Kong
– motivations, preferences and contribution to sustainable tourism. Journal of Travel
and Tourism Marketing, 34(8), 1–13.
Nunkoo, R., and Ramkissoon, H. (2013) ‘Travelers’ e-purchase intent of tourism products
and services’, Journal of Hospitality Marketing and Management, 22 (5), pp. 505–29.
O' Regan, M. (2008) ‘Hypermobility in backpacker lifestyles: the emergence of the Internet
café’, in Burns, P.M. and Novelli, M. (eds.) Tourism and Mobilities: Local-global
connections. Wallingford: CABI, pp. 109-132.
236

O’ Regan, M. (2014) ‘Fragmenting tourism: Niche tourists’, in McCabe, S. (ed.), The
Routledge handbook of tourism marketing. London: Routledge, pp. 268–280.
O’Regan, M. (2008) ‘Hypermobility in backpacker lifestyles: The emergence of the Internet
café’, in Burns, P. M. and Novelli, M. (eds.), Tourism and Mobilities: Local-Global
Connections, UK, Trowbridge, Cromwell Press, pp. 109–132.
O’Regan, M. and Chang, H. (2015) ‘Smartphone adoption amongst Chinese youth during
leisure-based tourism: Challenges and opportunities’, Journal of China Tourism
Research, 11(3), pp. 238–254.
O’Reilly, C. C. (2006) ‘From drifter to gap year tourist – mainstreaming back- packer travel’,
Annals of Tourism Research, 33 pp. 998–1017.
O’Reilly, T. (2005) What is Web 2.0?: Design patterns and business models for the next
generation of software. O’Reilly Network. Available at:
http://www.oreilly.com/pub/a/web2/archive/what-is-web-20.html
Okazaki, S, Hairong, L. and Morikazu, H. (2009) ‘Consumer privacy concerns and
preference for degree of regulatory control: A study of mobile advertising in Japan’,
Journal of Advertising, 38(4), pp. 65–79.
Okazaki, S. (2012) Mobile marketing: Theories and practices. New York: Peter Lang
Publishing.
Okazaki, S. and Mendez, F. (2013) ‘Perceived ubiquity in mobile service’, Journal of
Interactive Marketing, 27(2), pp. 98–111.
Ong, C.-E. and du Cros, H. (2012) ‘The Post-Mao gazes’, Annals of Tourism Research, 39(2)
pp. 735–754.
Onwuegbuzie, A. and Leech, N. (2006) ‘Linking research questions to mixed methods data
analysis procedures’, The Qualitative Report, 11(3), pp. 474–498.
Onwuegbuzie, A. J. (2002) ‘Positivists, post-positivists, post-structuralists, and post-
modernists: Why can’t we all get along? Towards a framework for unifying research
paradigms’, Education, 122(3), pp. 518–530.
Onwuegbuzie, A. J. and Teddlie, C. (2003) ‘A framework for analysing data in mixed
methods research’, in Tashakkori, A and Teddlie, C. (eds.) Handbook of mixed methods
in social and behavioural research. Thousand Oaks, CA: Sage, pp. 351-383.
Osti, L., Turner, L.W. and King, B. (2009) ‘Cultural differences in travel guidebooks
information search’, Journal of Vacation Marketing, 15(1), pp. 63–78.
237

Otoo, F. E. and Kim, S. (Sam). (2018). ‘Is there stability underneath health risk resilience in
Hong Kong inbound tourism?’, Asia Pacific Journal of Tourism Research, 0(0), pp. 1–
15. http://doi.org/10.1080/10941665.2018.1433700
Oulasvirta, A., Rattenbury, T., Ma, L. and Raita, E. (2012) ‘Habits make smartphone use
more pervasive’, Personal and Ubiquitous Computing, 16(1), pp. 105–114.
Pallant, J. (2005) SPSS survival manual. 2nd edn. Berkshire: Open University Press.
Palmer, C. G. S. (1996) ‘Risk perception: An empirical study of the relationship between
worldview and Risk construct’, Risk Analysis, 16, pp. 717-723
Pansiri, J. (2006) ‘Doing tourism research using the pragmatism paradigm: An empirical
example’, Tourism and Hospitality Planning and Development, 3(3), pp. 223-240.
Parasuraman, A., Zeithaml, V. A. and Berry, L. L. (1985) ‘A conceptual model of service
quality and its implications for future research’, Journal of Marketing, 49(4), pp. 41-50.
doi: 10.2307/1251430
Paris, C. M. (2010a) Understanding the virtualisation of the backpacker culture and the
emergence of the flashpacker: A mixed-method, (Ph. D. thesis), Arizona State
University.
Paris, C. M. (2010b) ‘The virtualisation of backpacker culture: Virtual mooring, sustained
interactions and enhanced Mobilities”, in Hannam, K and Diekmann, K. (eds.) Beyond
backpacker tourism: Mobilities and experiences. Bristol: Channel View Publications,
pp. 40–63.
Paris, C. M. (2012a) ‘Flashpackers: An emerging sub-culture?’ Annals of Tourism Research,
39(2), pp. 1094–1115.
Paris, C. M. (2012b) ‘Flashpacking: A discussion of independent travel in a digital world’, in
Law, R, Fuchs, M and Ricci, F. (eds.) Information and communication technologies in
tourism. Wien: Springer.
Park, J., Lee, D. and Ahn J (2004) ‘Risk focussed E-commerce adoption: A cross country
study’, Journal of Global Information Technology Management, 7(2), pp. 6–30.
Park, S. and Nicolau, J. L. (2015) ‘Asymmetric effects of online consumer reviews’, Annals
of Tourism Research, 50, pp. 67–83.
Park, S. and Tussyadiah, I. P. (2016) ‘Multidimensional facets of perceived risk in mobile
travel booking’, Journal of Travel Research, 56(7), pp. 854-867.
Park, Y. and Chen, J. V. (2007) ‘Acceptance and adoption of the innovative use of
smartphone’, Industrial Management & Data Systems, 107(9), pp. 1349–1365.
238

Pasquinucci, A. (2009) ‘The security challenges of mobile devices’, Computer Fraud and
Security, 3, pp. 16–18.
Patton, M. Q. (1990) Qualitative evaluation and research methods. 2nd edn. Newbury Park,
CA: Sage.
Patton, M. Q. (2002) Qualitative research and evaluation methods. 3rd edn. Thousand Oaks,
CA: Sage.
Pavlou, P. (2001) Integrating trust in electronic commerce with the technology acceptance
model: model development and validation. AMCIS Proceedings, Boston, MA.
Pearce, P. L. (1990) The backpacker phenomenon: Preliminary answers to basic questions.
Townsville: James Cook University of North Queensland.
Pelissier, R. (2008) Business Research Made Easy. Juta & Co
Pennington-Gray, L. and Schroeder, A. (2013) ‘International tourist's perceptions of safety
and security: The role of social media’, Matkailututkimus, 9(1), pp. 7-20.
Perron, B. E., Taylor, H. O., Glass, J. E. and Margerum-Leys, J. (2010) ‘Information and
communication technologies in social work’, Advances in Social Work, 11(1), pp. 67–
81.
Peters, E., Slovic, P., Hibbard, J. H. and Tusler, M. (2006) ‘Why worry? Worry, risk
perceptions, and willingness to act to reduce medical errors’, Health Psychology, 25,
pp. 144–152.
Petrick, J. F., Morais, D. D. and Norman, W. C. (2001) ‘An examination of the determinants
of entertainment vacationers’ intentions to revisit’, Journal of Travel Research, 40(1),
pp. 41-48.
Petter, S., Straub, D. and Rai, A. (2007) ‘Specifying formative constructs in information
systems research’ MIS Quarterly, 31(4), pp. 623-656.
Pizam, A. (1999) ‘A comprehensive approach to classifying acts of crime and violence at
tourism destinations’, Journal of Travel Research, 38(1), pp. 5-12.
Pizam, A. and Mansfeld, Y. (eds.) (1996) Tourism, crime and international security issues.
Chichester: John Wiley and Sons.
Plog, S. (1974) ‘Why destination areas rise and fall in popularity’, The Cornell Hotel and
Restaurant Administration Quarterly, 14(3), pp. 55–58.
Plog, S. C. (1991) ‘A carpenter’s tools re-visited: Measuring allocentrism and
psychocentrism properly the first time’, Journal of Travel Research, 29(4), pp. 51.
239

Pobocik, M. and Butalla, C (1998) ‘Development in Nepal: The Annapurna Conservation
Area Project’, in Hall, C. M. and Lew, A. A. (eds.) Sustainable tourism: A
geographical perspective. Harlow: Longman, pp. 159–172.
Podsakoff, P. M., MacKenzie, S. B., Lee, J. Y. and Podsakoff, N. P. (2003) ‘Common
method biases in behavioural research: A critical review of the literature and
recommended remedies’, Journal of Applied Psychology, 88(5), pp. 879–903.
Polites, G. L., Roberts, N. and Thatcher, J. (2012) ‘Conceptualising models using
multidimensional constructs: A review and guidelines for their use’, European Journal
of Information Systems, 21(1), pp. 22-48.
Ponterotto, J. G. (2005a) ‘Qualitative research training in counselling psychology: A survey
of directors of training’, Teaching of Psychology, 32, pp. 60–62.
Ponterotto, J.G. (2005b) ‘Qualitative research in counselling psychology: A primer on
research paradigms and philosophy of science’, Journal of Counselling Psychology,
52(2), pp. 126–136.
Poon, A. (1993) Tourism, technology and competitive strategies. Oxford: CAB International.
Poon, A., and E. Adams. (2000) How the British will travel, 2005. Bielefeld: Tourism
Intelligence International.
Pope, N., Brown, M. and Forrest, E. (1999) ‘Risk, innovations, gender, and involvement
factors affecting the intention to purchase sport product online’, Sport Marketing
Quarterly, 8(2), pp. 25-34.
Porter, G., Hampshire, K., Abane, A., Munthali, A., Robson, E., Bango, A., … Milner, J.
(2015) ‘intergenerational relations and the power of the cell phone: Perspectives on
young people’s phone usage in Sub-Saharan Africa’, Geoforum, 64 pp. 37–46.
Porter, M. (2001) ‘Strategy and the Internet’, Harvard Business Review, 79(3), pp. 63–78.
Prayag, G. (2009) ‘Tourists’ evaluations of destination image, satisfaction, and future
behavioral intentions-the case of Mauritius’, Journal of Travel and Tourism Marketing,
26(8), pp. 836–853.
Prensky, M. (2001) ‘Digital natives, digital immigrants’, On the Horizon, 9 pp. 5.
Punch, K. F. (1998) Introduction to social research; Quantitative and qualitative
approaches. London, Thousand Oaks, New Delhi: Sage.
Punch, K. F. (2005) Introduction to social research: Quantitative and qualitative
approaches. London, Thousand Oaks, New Delhi: Sage.
Pursall, R. (2005). From backpacker to flashpacker. Paper presented at Atlas SIG Meeting –
Backpacker Research Group conference, the Global Nomad – an expert meeting on
240

backpacker tourism 2: Advancing research agendas in backpacker travel. Bangkok,
Thailand.
Quintal, V. A., Lee, J. A. and Soutar, G. N. (2010) ‘Risk, uncertainty and the theory of
planned behaviour: A tourism example’ Tourism Management, 31(6), pp. 797–805.
Quintana, T. A., Park, S. and Cabrera, Y. A. (2014) ‘Assessing the effects of leadership
Styles on employees’ outcomes in International luxury hotels’, Journal of Business
Ethics, 129(2), pp. 469–489.
Rasinger, J., Fuchs, M. and Höpken, W. (2007) ‘Information search with mobile tourist
guides: A survey of usage intention”, Information Technology & Tourism, 9(3), pp.
177–194 doi:10.3727/ 109830507782166962.
Reichardt, S. S. and Rallis, S. F. (1994) ‘Qualitative and quantitative inquiries are not
incompatible: A call for a new partnership’, in Reichardt, C. S. and Rallis, S. F. (eds.)
The qualitative-quantitative debate: New perspectives. San Francisco, CA: Jossey-Bass.
pp. 85–91.
Reichel, A., Fuchs, G. and Uriely, N. (2007) ‘Perceived risk and the non-institutionalized
tourist role: The case of Israeli student ex-backpackers’, Journal of Travel Research,
46(2), pp. 217–226.
Reichel, A., Fuchs, G. and Uriely, N. (2009) ‘Israeli backpackers: The role of destination
choice’, Annals of Tourism Research, 36(2), pp. 222–246.
Reinartz, W. J., Haenlein, M. and Henseler, J. (2009) ‘An empirical comparison of the
efficacy of covariance-based and variance-based SEM’, International Journal of
Market Research, 26, (4), pp. 332–344.
Reisinger, Y. and Mavondo, F. (2005) ‘Travel anxiety and intentions to travel internationally:
Implications of travel risk perception’, Journal of Travel Research, 43(3), pp. 212-225.
Reisinger, Y. and Mavondo, F. (2006) ‘Cultural differences in travel risk perception’, Journal
of Travel and Tourism Marketing, 20(1), pp. 13–31.
Richards, G. (2011) ‘Creativity and tourism: The state of the art’, Annals of Tourism
Research, 38(4), pp. 1225–1253.
Richards, G. and Wilson, J. (2004) ‘The Global Nomad: Motivations and behaviours of
Independent Travellers Worldwide’, in Richards, G and Wilson, J (eds.) The Global
Nomad: Backpacker travel in theory and practice. Oevedon. Channel View, pp. 14-42.
Richter, L. K. (2003) ‘International tourism and its global public health consequences’,
Journal of Travel Research, 41(4), pp. 340-347.
241

Riley, P. J. (1988) ‘Road culture of international long-term budget travellers’, Annals of
Tourism Research 15(3), pp. 313–328.
Ringle, C. M., Sarstedt, M. and Straub, D. W. (2012) ‘Editor’s comments: A critical look at
the use of PLS-SEM in MIS quarterly’, MIS Quarterly, 36(1), pp. iii-xiv.
Rittichainuwat, B. and Rattanaphinanchai, S. (2015) ‘Applying a mixed method of
quantitative and qualitative design in explaining the travel motivation of film tourists in
visiting a film-shooting destination’, Tourism Management, 46, pp. 136–147.
http://doi.org/10.1016/j.tourman.2014.06.005
Roehl, W. and Fesenmaier, D. (1992) ‘Risk perceptions and pleasure travel: An exploratory
analysis’, Journal of Travel Research, 30(4), pp. 17-26.
Rogers, E. (1962) Diffusion of Innovations. New York: McMillan.
Rogers, E. M. (1995) Diffusion of innovations. 4th edn. New York: Free Press.
Roselius, T. (1971) ‘Consumer rankings of risk reduction methods’, Journal of Marketing,
35(1), pp. 56–61.
Rossman, G. B. and Wilson, B. L. (1985) ‘Numbers and words: Combining quantitative and
qualitative methods in a single large-scale evaluation study’, Evaluation Review, 9, pp.
627- 643.
Ruby, J. (1982) A crack in the mirror: Reflexive perspectives in anthropology. University of
Pennsylvania Press Philadelphia.
Ryan, C. and Mohsin, A. (2001) ‘Backpackers attitudes to the 'outback'’ Journal of Travel
and Tourism Marketing, 10(1), pp. 69-92.
Ryan, C., Page, S. and Roche, T. (2007) ‘New development for the journal’, Tourism Management, 28, pp. 1167.
Saayman, M. and Saayman, A. (2012) ‘Determinants of spending: An evaluation of three
major sporting events’, International Journal of Tourism Research, 14(2), pp 124–138.
Sanchez, J., Luis, C., Rosa, M. R. and Miguel, A. M. (2006) ‘Perceived value of the purchase
of a tourism product’, Tourism Management, 27(3), pp. 394–409.
Sarantakos, S. (1998) Social Research. 2nd edn., Macmillan, London.
Sarantakos, S. (2005) Social Research. 3rd edn. Melbourne: Macmillan Education.
Sarstedt, M. Henseler, J. and Ringle C. M. (2011) ‘Multi-group analysis in partial least
squares (PLS) path modelling: Alternative methods and empirical results’,
Measurement and Research Methods in International Marketing, 22, pp. 195-218.
Saunders, M., Lewis, P. and Thornhill, A (2012) Research methods for business students. 6th
edn, England: Pearson Education Limited.
242

Saunders, M., Lewis, P. and Thornhill, A. (2009) Research methods for business students. 5th
edn, England: Pearson Education Limited.
Saunders, M., Lewis, P. and Thornhill, A. (2015) Research methods for business students. 7th
edn, England: Pearson Education Limited.
Scharl, A, Dickinger, A and Murphy, J (2005), ‘Diffusion and success factors of mobile
marketing’, Electronic Commerce Research and Applications, 4(2) pp. 159–73.
Scheyvens, R. (2002) ‘Backpacker tourism and Third World development’, Annals of
Tourism Research, 29(1), pp. 144–164.
Schwandt, T. A. (2000) ‘Three epistemological stances for qualitative inquiry: Interpretivism,
hermeneutics, and social constructionism’, in Denzin, N. K. and Lincoln, Y. S. (eds.)
Handbook of qualitative research. Thousand Oaks, CA: Sage, pp. 189–213.
Schweer, J. M. (1986) ‘Perceived leisure risk: Implications and interventions for therapeutic
recreation in clinical settings’, Journal of Expanding Horizons in Therapeutic
Recreation, 1, pp 64-66.
Seabra, C., Dolnicar, S., Abrantes, J. L. and Kastenholz, E. (2013) ‘Heterogeneity in risk and
safety perceptions of international tourists’, Tourism Management, 36(0), pp 502-510.
Seddighi, H. R., Nuttall, M. W. and Theocharous, A. L. (2001) ‘Does cultural background of
tourists influence the destination choice? An empirical study with special references to
political instability’, Tourism Management, 22(2), pp. 181-19.
Shankar, V and Balasubramanian, S. (2009) ‘Mobile marketing: A synthesis and prognosis’,
Journal of Interactive Marketing, 23(2), pp. 118–29.
Sheldon, P. (1997) Tourism information technologies. Oxford: CAB.
Shen, C. C. and Chiou, J. S. (2010) ‘The impact of perceived ease of use on Internet service
adoption: The moderating effects of temporal distance and perceived risk’, Computers
in Human Behaviour, 26, pp. 42–50.
Shin, Y.-S. (2005) ‘Safety, security and peace tourism: The case of the DMZ area’, Asia
Pacific Journal of Tourism Research, 10(4), pp. 411-426.
Sieber, S. D. (1973) ‘The integration of fieldwork and survey methods’ American Journal of
Sociology, 73, pp. 1335–1359.
Singh, Y. K. and Bajpai, A. B. (2008) Research methodology: Techniques and trends. 4th
edn. APH Publishing Corporation Students, Prentice Hall
Sitkin, S. B and Pablo, A. L. (1992) ‘Reconceptualising the determinants of risk behaviour.
Academy of Management Review, 17(1), pp. 9-38
Sjoberg, L. (1980) ‘The risks of risk analysis’, Acta Psychologica, 45(1/3), pp. 301–321.
243
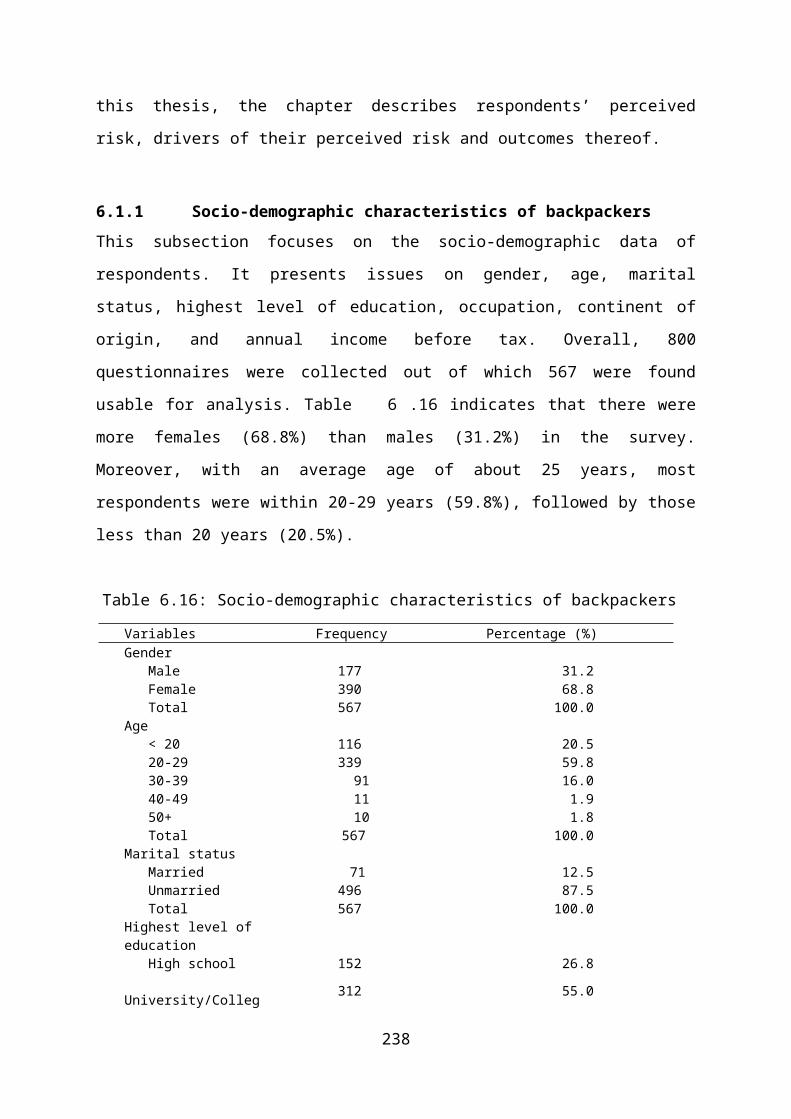
Sjöberg, L. (1997) ‘Explaining risk perception: An empirical evaluation of cultural theory’,
Risk Decision and Policy, 2(2), pp. 113-130.
Sjöberg, L. (1998) ‘Worry and risk perception’, Risk Analysis, 18(1), pp. 85-93.
Sjöberg, L. (1999) ‘Consequences of perceived risk: Demand for mitigation’, Journal of Risk
Research, 2, pp. 129-149
Slaughter, L. (2004) “Profiling the international backpacker market in Australia” in Richards,
G and Wilson, J. (eds.) The global nomad: backpacker travel in theory and practice,
Sydney: Channel View Publications, pp. 168-79.
Slovic, P., Finucane, M. L., Peters, E. and MacGregor, D. G. (2004) ‘Risk as analysis and
risk as feelings: Some thoughts about affect, reason, risk, and rationality’, Risk Analysis,
24, pp. 311–322.
Sohn, H.-K., Lee, T.J. and Yoon, Y.-S. (2016) ‘Relationship between perceived risk,
evaluation, satisfaction, and behavioural intention: A case of local-festival visitors’,
Journal of Travel and Tourism Marketing, 33(1), pp. 28–45.
Sönmez, S. F. and Graefe, A. R. (1998) ‘Influence of terrorism risk on foreign tourism
decisions’, Annals of Tourism Research, 25(1), pp. 113–144
Sönmez, S. F. and Graefe, A. R. (1998a) ‘Determining future travel behaviour from past
travel experience and perceptions of risk and safety’, Journal of Travel Research,
37(2), pp. 172-177.
Sönmez, S. F., Apostolopoulos, Y. and Tarlow, P. (1999) ‘Tourism in crisis: Managing the
effects of terrorism’, Journal of Travel Research, 38(1), pp. 13-18.
Sorensen, A. (2003) ‘Backpacker ethnography’, Annals of Tourism Research, 30, pp 847–
867.
Sotgiu, Ã, R. M. and Settanni, M. (2008) Disaster preparedness and perception of flood risk:
A study in an alpine valley in Italy, 28, 164–173.
Stienmetz, J. L., Chang, C. Y and Fesenmaier, D. R. (2015) Evaluating travellers’ response to
Social Media Using Facets-based ROI Metrics. 46th Annual International Conference
of Tourism Travel and Research Association: Advancing Tourism Research Globally,
4.
Stienmetz, J. L., Levy, S. E. and Boo, S. (2012) ‘Factors influencing the usability of mobile
destination management organization websites’, Journal of Travel Research, 52(4), pp.
453–464.
Stone, R. N. and Grønhaug, K. (1993) ‘Perceived risk: Further considerations for the
marketing discipline’, European Journal of Marketing, 27(3), pp. 39-50.
244

Swart, G. (2006) Flashpackers do it in style. Australia. Syney Morning Herland (22,
February)
Sweeney, J. C., Soutar, G. N. and Johnson, L. W. (1999) ‘The role of perceived risk in the
quality-value relationship: A study in a retail environment’, Journal of Retailing, 75(1),
pp. 77–105.
Swinglehurst, E. (1974) The Romantic Journey. London: Pica Editions
Szewcyk, M. (2013) ‘The year of SoloMo?’ Wired. Available at:
http://www.wired.com/insights/2013/01/2013-the-year-of-solomo/
Tan, S. J. (1999) ‘Strategies for reducing consumers’ risk aversion in Internet shopping’,
Journal of Consumer Marketing, 16(2), pp. 163–180.
Tashakkori, A. and Creswell, J. W. (2007) ‘Editorial: The new era of mixed methods’,
Journal of Mixed Methods Research, 1(1), pp. 3-7.
Tashakkori, A. and Teddlie, C. (1998) Mixed methodology: Combining qualitative and
quantitative approaches. Thousand Oaks, CA: Sage.
Taylor, J. W. (1974) ‘The role of risk in consumer behaviour’, Journal of Marketing, 38(2),
pp. 54-60.
Taylor-Gooby, P. and Zinn, J. O. (2006) ‘Current directions in risk research: New
developments in psychology and sociology’, Risk Analysis, 26, pp. 397–411.
Teddlie, C., Tashakkori, A. and Johnson, R. B. (2008) ‘Emergent techniques in the gathering
and analysis of mixed methods data’, in Hesse-Biber, S. N. and Leavy, P. (eds.)
Handbook of emergent methods. New York, NY: The Guilford Press, pp. 389-414.
Tenenhaus, M., Vinzi, V. E., Chatelin, Y.-M. and Lauro, C. (2005) ‘PLS path modelling’,
Computational Statistics & Data Analysis, 48 (1), pp. 159-205.
Thompson, J. P. (1995) Media and modernity: A social theory of the media. Cambridge:
Polity Press.
Thompson, M., Ellis, R. and Wildavsky, A. (1990) Cultural Theory. Boulder: Westview
Press.
Thyne M, Davies S. and Nash R (2008) ‘A lifestyle segmentation analysis of the backpacker
market in Scotland’, Journal of Quality Assurance in Hospitality & Tourism, 5(2/4), pp.
95–119.
Thyne, M., Davies, S. and Nash, R. (2005) ‘A lifestyle segmentation analysis of the
backpacker market in Scotland’, Journal of Quality Assurance in Hospitality and
Tourism, 5(2), pp. 95-119.
245

Towner, J. (1985) ‘The grand tour: A key phase in the history of tourism’, Annals of Tourism
Research, 12(3), pp 297-333.
Tribe, J. and Mkono, M. (2017) ‘Not such smart tourism? The concept of e-lienation’, Annals
of Tourism Research, 66, pp. 105-115.
Tsaur, S. H., Tzeng, G. H. and Wang, K. C. (1997) ‘Evaluating tourist risks from fuzzy
perspectives’, Annals of Tourism Research, 24(4), pp. 796-812.
Tussyadiah, I. P. (2012) ‘A concept of location-based social network marketing’, Journal of
Travel & Tourism Marketing, 29(3), pp. 205–220.
Tussyadiah, I. P. (2015) ‘The influence of innovativeness on on-site smartphone use among
American Travelers: Implications for context-based push marketing’, Journal of Travel
& Tourism Marketing, 33(6), pp. 1–18.
Tussyadiah, I. P. and F. Zach. (2012) ‘The role of geo-based technology in place
experiences’, Annals of Tourism Research, 39(2), pp. 780-800.
Tussyadiah, I. P. and Sigala, M. (2018) ‘Shareable tourism: Tourism marketing in the sharing
economy’, Journal of Travel & Tourism Marketing, 35(1), pp. 1–4.
Tussyadiah, I. P. and Wang, D. (2014) ‘Tourists’ attitudes toward proactive smartphone
Systems’, Journal of Travel Research, pp. 1–16.
Tussyadiah, I. P. and Wang, D. (2016) ‘Tourists’ attitudes toward proactive smartphone
systems’, Journal of Travel Research, 55(4), pp. 493-508.
Tversky, A. (1967b) ‘A general theory of polynomial probability’, Journal of Mathematical
Psychology, 4, pp. 1-20.
United Kingdom Foreign and Commonwealth Office Travel Advisory. (2015) ‘Foreign travel
advice’, Available at: www.gov.uk/foreign-travel-advice/ghana/safety-and-security.
Uriely, N., Yonay, Y., and Simchai, D. (2002) ‘Backpacking experiences: A type and form
analysis’, Annals of Tourism Research, 29(2), pp. 520-538.
Urry, J. (2002) ‘Mobility and proximity’, Sociology, 36(2) pp. 255–274.
US Federal Bureau of Investigation (FBI) (2015) ‘Safety and Security for US Students
travelling Abroad’, Available at: www.state.gov/travel.
van den Poel, D. and J. Leunis (1999) ‘Consumer acceptance of the Internet as a channel of
distribution’, Journal of Business Research, 45(3), pp. 249–56.
Van den Poel, D. and Leunis, J. (1996) ‘Perceived risk and risk reduction strategies in mail-
order versus retail store buying’, International Review of Retail, Distribution &
Consumer Research, 6(4), pp. 351.
246

Van den Poel, D. and Leunis, J. (1999) ‘Consumer acceptance of the Internet as a channel of
distribution’, Journal of Business Research, 45(3), pp. 249–56
Vanola, A (2013) ‘Smartmentality: The smart city as a disciplinary strategy’, Urban strategy,
pp. 1-16. doi: 10.1177/00420981034944427.
Venkatesh, V. (2003) ‘Mobile commerce opportunity and challenges: Understanding
usability in mobile commerce’, Communication of the ACM ,46, pp. 122.
Verhage, B. J., Yava, U. and Green, R. T. (1990) ‘Perceived risk: A cross-cultural
phenomenon?’ International Journal of Research in Marketing, 7(4), pp. 297-304
Vishwanath, A. and Goldhaber, G. M. (2003) ‘An Examination of the Factors Contributing to
Adoption Decisions among Late-Diffused Technology Products. New Media Society,
5(4), pp. 547–572.
Vogt, J. W. (1976) ‘Wandering: Youth and travel behaviour’, Annals of Tourism Research,
4(1) pp. 373-392.
Vos, A., Marinagi, C., Trivellas, P., Eberhagen, N., Skourlas, C. and Giannakopoulos, G.
(2014) ‘Risk reduction strategies in online shopping: E-trust perspective. Procedia -
Social and Behavioural Sciences, 147, pp. 418–423.
Wang, D. and Fesenmaier, D. R. (2013) “Transforming the travel experience: the use of
smartphones for travel” in Fuchs, M. Ricci, F and Cantoni, L. (eds.) Information and
communication technologies in tourism. Vienna: Springer, pp. 58–67.
Wang, D. and Xiang, Z. (2012) ‘The new landscape of travel: A comprehensive analysis of
smartphone apps’, in Fuchs, M, Ricci, F. and Cantoni, L (eds.), Information and
communication technologies in tourism 2012. Vienna: Springer, pp. 308–319.
Wang, D., Park, S. and Fesenmaier, D. R. (2012) ‘The role of smartphones in mediating the
touristic experience’, Journal of Travel Research, 51(4), pp. 371-387.
Wang, D., Xiang, Z. and Fesenmaier, D. R. (2014a) ‘Smartphone use in everyday life and
travel’, Journal of Travel Research, pp. 1-12.
Wang, D., Xiang, Z. and Fesenmaier, D. R. (2014b) ‘Adapting to the mobile world: A model
of smartphone use’, Annals of Tourism Research, 48, pp. 11–26.
Warner, J. (2011) ‘Understanding cyber-crime in Ghana: A view from below’, International
Journal of Cyber Criminology, 5, pp. 736–749.
Watson, R. T., Pitt, F. L, Berthon, P. and Zinkhan, G. M. (2002) ‘U-commerce: Expanding
the universe of marketing’, Journal of the Academy of Marketing Science, 30(4), pp.
333–47.
Watson, W. (1990) ‘Types of pluralism’, The Monist, 73(3), pp. 350–367.
247

Webb, E. J., Campbell, D. T., Schwartz, R. D. and Sechrest, L. (1966). Unobtrusive
measures. Chicago: Rand McNally.
Weiser, M. (1993) ‘Some computer science issues in ubiquitous computing’, Communication
of the ACM, 361(7), pp. 75-84.
Welk, P. (2004) ‘The beaten track: Anti-tourism as an element of backpacker identity
construction’, in Richards, G. and Wilson, J. (eds.) The global nomad: Backpacker
travel in theory and practice. Sydney: Channel View Publications, pp. 77-91.
Wesner, M. S. and Miller, T. (2008) ‘Boomers and millennials have much in common’,
Organizational Development, 26(3), pp. 89-96.
Westerhausen, K. (2002) Beyond the beach: An ethnography of modern travellers in Asia.
Bangkok: White Lotus Press.
Wetzels, M., Odekerken-Schroder, G. and van Oppen, C. (2009) ‘Using PLS path modelling
for assessing hierarchical construct models: Guidelines and empirical illustration’, MIS
Quarterly, 33(1), pp. 177-195.
Wheeler, T. (1999) ‘In defence of backpackers’, in Focus (Spring), pp. 15–16.
White, N. R. and White, P. B. (2004) ‘Travel as transition: identity and place’, Annals of
Tourism Research, 31(1), pp. 200–218.
White, N. R. and White, P. B. (2007) ‘Home and away: Tourists in a connected world’,
Annals of Tourism Research, 34(1), pp. 88–104.
Wilkinson, P. F. and Pratiwi, W. (1995) ‘Gender and tourism in an Indonesian Village’,
Annals of Tourism Research, 22, pp. 283–299.
Williams, A. M. and Baláž, V. (2008) International migration and knowledge. USA:
Routledge
Williams, A. M. and Baláž, V. (2013) ‘Tourism, risk tolerance and competences: Travel
organization and tourism hazards’, Tourism Management, 35. pp 209–221.
Williams, A. M. and Baláž, V. (2014) ‘Mobility, risk tolerance and competence to manage
risks’, Journal of Risk Research, 9877, pp. 1–28.
Williams, A. M. and Baláž, V. (2015) ‘Tourism risk and uncertainty: Theoretical reflections’,
Journal of Travel Research, 54(3), pp. 271–287.
Wilson, B. and Henseler, J. (2007) Modelling reflective higher-order constructs using three
approaches with PLS Path modelling: A Monte Carlo comparison. Australian and New
Zealand Marketing Academy Conference, Otago, Australia, pp. 791-800.
Wilson, D. (1997) ‘Paradoxes of Tourism in Goa’, Annals of Tourism Research, 24, pp. 52–
75.
248

Wilson, S. and Hannam, K. (2017) ‘The frictions of slow tourism mobilities: Conceptualising
campervan travel’, Annals of Tourism Research, 67, pp. 25–36.
http://doi.org/10.1016/j.annals.2017.07.021.
Wirtz, J. and Mattila, A. (2001) ‘Exploring the role of alternative perceived performance
measures and needs congruency in the consumer satisfaction process’, Journal of
Consumer Psychology, 11(3), pp. 81–192.
Wold, H. (1982) ‘Soft modelling: The basic design and some extensions’, in Joreskog, K.G.,
Wold, H. (eds.) Systems under Indirect Observation: Causality, Structure, Prediction.
North Holland, Amsterdam, pp. 1-54.
Wong, J. Y. and Yeh, C. (2009) ‘Tourist hesitation in destination decision-making’, Annals of
Tourism Research, 36(1), pp. 6–23.
Wong, K. K. (2010) Handling small survey sample size and skewed dataset with partial least
square path modelling. Vue: The Magazine of the Marketing Research and Intelligence
Association, November 20-23.
Wong, K. K. (2013) ‘Partial least squares structural equation modelling (PLS-SEM)
Techniques Using SmartPLS2’, Marketing Bulletin, 24(1), pp. 1–32.
Wood, K. and House, S. (1999) The good tourist. London: Mandarin.
World Travel and Tourism Council (WTTC) (2014) ‘Travel and tourism economic impact
2015 world’, Available at: https://www.wttc.org/-/media/files/reports.
World Travel and Tourism Council (WTTC) (2015) ‘Travel and tourism economic impact
2015 world’, https://www.wttc.org/-/media/files/reports.
World Travel and Tourism Council (WTTC) (2017) Travel and Tourism Global Economic
Impact and Issues 2017https://www.google.co.uk/search
Xia, J., P. Zeephongsekul, and D. Packer. (2011) ‘Spatial and temporal modelling of tourist
movements using Semi-Markov Processes’, Tourism Management, 32, pp. 844-51.
Xiang, Z. and Gretzel, U. (2010) ‘Role of social media in online travel information search’,
Tourism Management, 31, pp. 179-188.
Xu, H, Luo, X. R., Carrol, M. J. and Rosson, B. M. (2011) ‘The personalisation privacy
paradox: An exploratory study of decision-making process for location-aware
marketing’, Decision Support Systems, 51(1), pp. 42–52.
Yang, C. L. and Nair, V. (2014) ‘Risk perception study in tourism: Are we really measuring
perceived risk?’, Procedia - Social and Behavioural Sciences, 144, pp. 322–327.
249

Yang, E. C. L., Sharif, S. P. and Khoo-Lattimore, C. (2015) ‘Tourists’ risk perception of
risky destinations: The case of Sabah's eastern coast’, Tourism and Hospitality
Research, 15(3) pp. 206–221.
Yang, Q., Pang, C., Liu, L., Yen, D. C. and Michael Tarn, J. (2015) ‘Exploring consumer
perceived risk and trust for online payments: An empirical study in China’s younger
generation’, Computers in Human Behaviour, 50, pp. 9–24.
Yang, Y. and Zhang, J. (2009) Discussion on the dimensions of consumers’ perceived risk in
mobile service, The Proceeding of 2009 Eighth International Conference on Mobile
Business. Washington, DC: IEEE Computer Society, pp. 261–266.
Yavas, U. (1987) ‘Foreign travel behaviour in a growing vacation market: implications for
tourism marketers’, European Journal of Marketing, 21(5), pp. 57-6
Yaw, N., Doku, V. and Oppong, D. (2014) ‘Adopting electronic business in Ghana: story of
the hospitality industry’, International Journal of Computer Applications, 85(4), pp. 1–
9.
Yin, R. K. (2006) ‘Mixed methods research: Are the methods genuinely integrated or merely
parallel?’, Research in the Schools, 13(1), pp. 41-47.
Yu, H. (2006) ‘Spatio-temporal GIS design for exploring interactions of human activities’,
Cartography and Geographic Information Science, 33(1), pp. 3-19.
Yüksel, A. and Yüksel, F. (2007) ‘Shopping risk perceptions: Effects on tourists’ emotion
satisfaction and expressed loyalty intentions’, Tourism Management, 28(3), pp. 703-
713.
Zeithaml, V. A. and Bitner, M. J. (1996) Services marketing. New York: McGraw Hill.
Zeithaml, V. A., Parasuraman, A. and Berry, L. L. (1985) ‘Problems and strategies in
services marketing’, Journal of Marketing, 49(2), pp. 33-46.
Zeithaml, V.A. and Bitner, M. J. (2003) Services marketing: Integrating customer focus
across the Firm. 3rd ed., McGraw-Hill, New York, NY.
Zhang, J., Morrison, A. M., Tucker, H. and Wu, B. (2017) ‘Am I a backpacker? Factors
indicating the social identity of Chinese backpackers’, Journal of Travel Research, pp.
1–15.
Zhang, J., Tucker, H., Morrison, A. M. and Wu, B. (2017) ‘Becoming a backpacker in China:
A grounded theory approach to identity construction of backpackers’, Annals of
Tourism Research, 64, pp. 114–125.
250

Zhao, A. L., Hanmer-Lloyd, S., Ward, P. and Goode, M. M. H. (2008) ‘Perceived risk and
Chinese consumers’ Internet banking services adoption’, International Journal of Bank
Marketing, 26, pp. 505–525.
Zinn, J. (2004) ‘Literature Review: Economics and Risk’, Canterbury: University of Kent,
SCARR Working Paper 2004/2.
251

13 APPENDICES
13.1 Publications during the PhD study
1. Dayour, F., Kimbu, N., A. and Park, S. (2017) ‘Backpacking: The need
reconceptualisation’, Annals of Tourism Research, 66, pp. 183-215.
https://doi.org/10.1016/j.annals.2017.06.004.
2. Dayour, F., Adongo, A. C. and Taale, (2016) ‘Determinants of backpackers’ ex-
penditure’, Tourism Management Perspectives, 17, 36-43. doi.org/10.1016/
j.tmp.2015.11.003.
3. Otoo, F. E, Agyeiwaa, E., Dayour, F. and Wireko-Gyebi, S. (2016) ‘Volunteer tour-
ists’ length of stay in Ghana: The influence of socio-demographic and trip attributes’,
Tourism Planning and Development, 13(4), pp. 409-426. http://dx.doi.org/
10.1080/21568316.2015.1136834.
252

13.2 Paper under review
1. Backpackers’ perceived risk towards smartphone usage and risk reduction strategies: a
mixed methods study, Tourism Management.
253
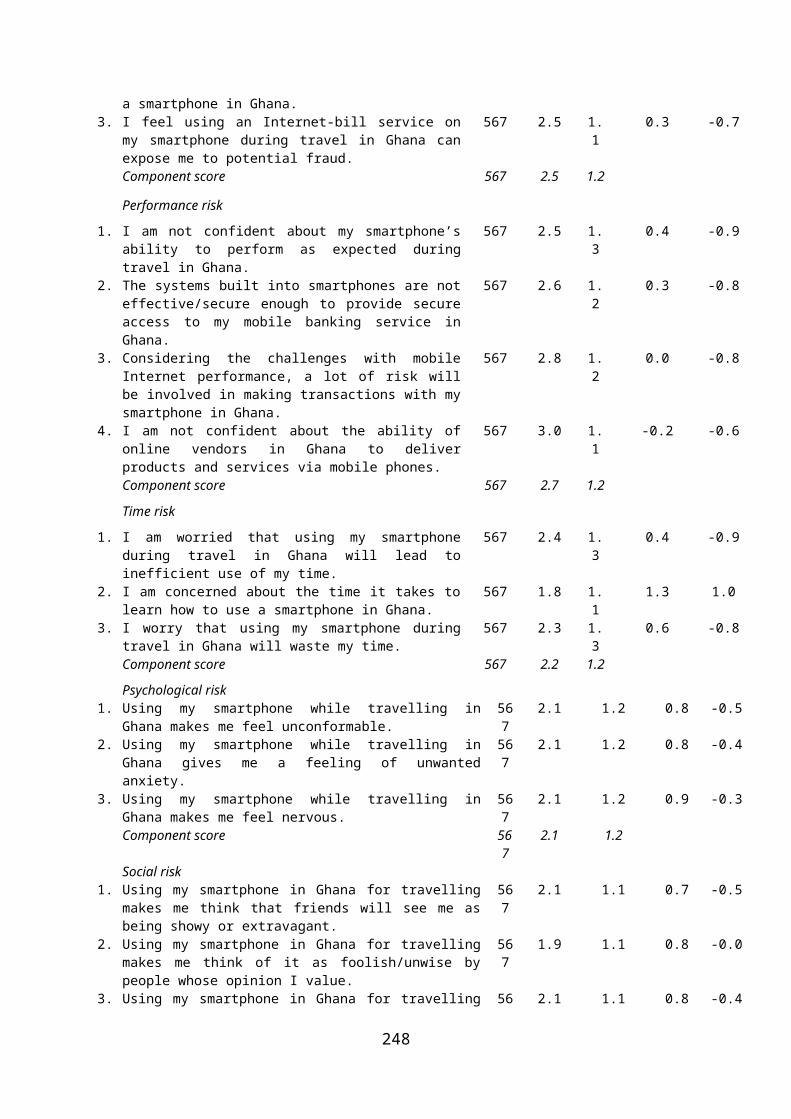
13.3 Thesis output presented at conferences
2018 Backpackers’ perceptions of risk towards smartphone usage and risk reduction
strategies, Ghana. ENTER conference, Sweden. (Winner of International Federation
for Information Technology and Travel and Tourism Scholarship. See
http://www.ifitt.org/ifitt-awards-2018).
2017 Backpackers’ perceptions of risk towards smartphone usage. Visitor Economy
Conference, Bournemouth University, UK.
2017 Backpackers’ perceptions of risk towards smartphone usage. Doctoral College
Conference, University of Surrey, UK.
254
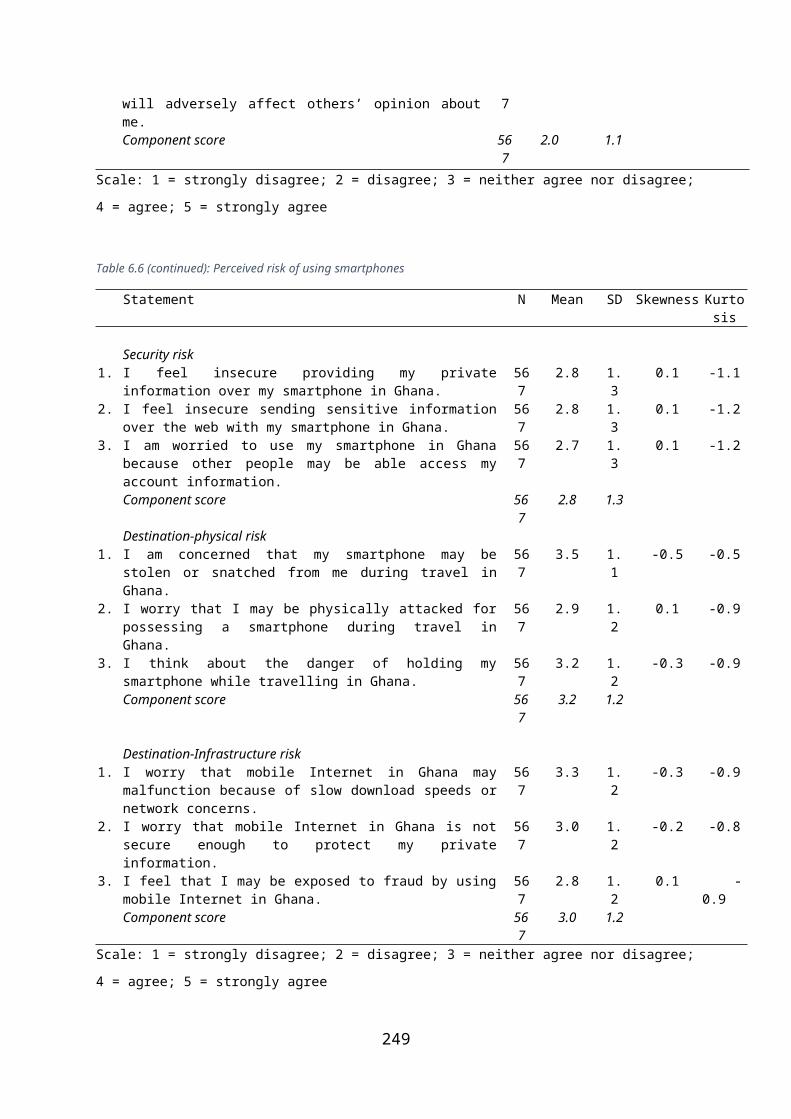
13.4 Sample estimation using G*Power
t tests - Linear multiple regression: Fixed model, single regression coefficient
Analysis: A priori: Compute required sample size
Input: Tail(s) = One
Effect size f² = 0.15
α err prob = 0.05
Power (1-β err prob) = 0.95
Number of predictors = 7
Output: Noncentrality parameter δ = 3.3316662
Critical t = 1.6682705
Df = 66
Total sample size = 74
Actual power = 0.9507699
255

13.5 Questionnaire
Hello, my name is Frederick Dayour, a postgraduate researcher carrying out research on your
stay and mobile phone usage in Ghana. This research is a major requirement for the award of
a Doctor of Philosophy (PhD) degree at the University of Surrey, UK. Please answer all the
questions as follows to the very best of your ability. I can guarantee in no uncertain terms that
the information you will provide will be anonymised, handled in confidence – and used
unreservedly, for its intended purpose. Filling the questionnaire will take just about 10
minutes of your time. If you have any difficulty in the process of responding to the
questionnaire, please do not hesitate to ask. Thank you. Cell: 0543836299
1. Do you use a smartphone while travelling in Ghana? 1. Yes 2. No
2. If YES, please list 5 activities you have used your smartphone to perform so far in Ghana
(e.g. bookings, emailing, networking etc.) 1.……………………….2………………………..
3………………………………..4………………………………..5………………………..
3. Apart from your smartphone, what other electronic devices (e.g. camera, laptop etc.) are
you in possession of in Ghana? 1………………..….2……………………………………
3…………………………4…………………………...5……………………………………
4. Section A: This section examines your perceptions of risk towards smartphone usage
in Ghana
Please indicate how much you agree with the following statements concerning your
perception of risk towards smartphone usage – using a scale of 1 to 5, where 1 = strongly
disagree; 2 = disagree; 3 = neither agree nor disagree; 4 = agree; 5 = strongly agree.
Please choose your preferred response by ticking [√] once for each statement.
Financial risk 1 2 3 4 5
1 I feel that using a smartphone for travel in Ghana may
cause me to incur unnecessary costs.
Featherman and Pavlou,
2003; Kim et al, 2013
2 I am concerned that excessive mobile Internet fees
may be charged in the course of using a smartphone
in Ghana.
3 I feel using an internet-bill service on my smartphone
during travel in Ghana can expose me to potential
256

fraud.
Performance risk
Featherman and Pavlou,
2003; Cunningham,
Gerlach and Harper, 2005;
Kim et al, 2013
1 I am not confident about my smartphone’s ability to
perform as expected during travel in Ghana.
2 The systems built into smartphones are not
effective/secure enough to provide secure access to
my mobile banking service in Ghana.
3 Considering the challenges with mobile Internet
performance, a lot of risk will be involved in making
transactions with my smartphone in Ghana.
4 I am not confident about the ability of online vendors
in Ghana to deliver products and services via mobile
phones.
Time risk
Featherman and Pavlou,
2003; Kim, Kim, and
Leong, 2005
1 I am worried that using my smartphone during travel
in Ghana will lead to inefficient use of my time.
2 I am concerned about the time it takes to learn how to
use a smartphone in Ghana.
3 I worry that using my smartphone during travel in
Ghana will waste my time.
Psychological risk
Kim, Kim, and Leong,
2005; Chen, 2013; Crespo
et al, 2009
1 Using my smartphone while travelling in Ghana
makes me feel unconformable.
2 Using my smartphone while travelling in Ghana gives
me a feeling of unwanted anxiety.
3 Using my smartphone while travelling in Ghana
makes me feel nervous.
Social risk
Featherman and Pavlou,
2003; Kim, Kim, and
Leong, 2005
1 Using my smartphone in Ghana for travelling makes
me think that friends will see me as being showy or
extravagant.
2 Using my smartphone in Ghana for travelling makes
me think of it as foolish/unwise by people whose
257

opinion I value.
3 Using my smartphone in Ghana for travelling will
adversely affect others’ opinion about me.
Security risk
Kim, Kim, and Leong,
2005
1 I feel insecure providing my private information over
my smartphone in Ghana.
2 I feel insecure sending sensitive information over the
web with my smartphone in Ghana.
3 I am worried to use my smartphone in Ghana because
other people may be able access my account
information.
The statements that follow relate to your safety in Ghana and Internet infrastructure concerns
Destination-physical risk
Roehl and Fesenmaier,
1992; Reichel, Fuchs and
Uriely, 2009; Markelj and
Bernik, 2015
1 I am concerned that my smartphone may be stolen or
snatched from me during travel in Ghana.
2 I worry that I may be physically attacked for
possessing a smartphone during travel in Ghana.
3 I think about the danger of holding my smartphone
while travelling in Ghana.
Infrastructure risk
Lee, 2009; Markelj and
Bernik, 2015
1 I worry that mobile Internet in Ghana may
malfunction because of slow download speeds or
network concerns.
2 I worry that mobile Internet in Ghana is not secure
enough to protect my private information.
3 I feel that I may be exposed to fraud by using mobile
Internet in Ghana.
Overall risk
Featherman and Pavlou,
2003
1 Overall, I feel that there is a risk associated with
smartphone use while travelling in Ghana.
5.Section B: This section examines some of the factors affecting your risk perception
Familiarity 1 2 3 4 5
258

Kim, Ferrin and Reo,
2008
1 Overall, I am familiar with a smartphone.
2 I am familiar with searching for travel services on
my smartphone.
3 I am familiar with the process of purchasing travel
services on my smartphone.
Using a scale of 1 to 5, where 1 = strongly disagree and 5 = strongly agree.
Observability 1 2 3 4 5
Park and Chen, 2007;
Aloudat et al 2014
1 It is easy for me to observe others using the
smartphone during travel.
2 I have had a lot of opportunity to see the smartphone
being used for travel purposes.
Innovation
Aldás-Manzano et al,
2009; Amin, Rezaei,
and Abolghasemi,
2014
1 In general, I was among the first in my peers of
friends to use a smartphone for my travel needs.
2 If I heard there was a new travel service on a
smartphone, I would be interested enough to try it.
3 Compared to my friends, I use a lot of mobile travel
services on a smartphone.
4 I would use a new mobile travel service(s) on
smartphone even if none of my peers has tried.
5 I knew about new mobile travel services on my
smartphone before most of my peers.
Trust
Kim, Chung, Lee, 2011
1 My smartphones have integrity.
2 My smartphones are reliable.
3 Smartphones are trustworthy.
6. Section C: This section examines your satisfaction of and intention about smartphone
usage.
Please indicate how much you agree with the following statements using a scale of 1 to 5,
where 1 = strongly disagree and 5 = strongly agree.
Please choose your preferred response by ticking [√] once for each statement
259

1 2 3 4 5
Satisfaction with smartphone in
Ghana
Kim, Chung, Lee, 2011; Amin, Rezaei, and Abolghasemi 2014
1 I am satisfied with my smartphone
compared to other devices during
travel.
2 My smartphone has helped me to
meet my travel needs.
3 My smartphone meets my
expectations during travel.
4 Overall, I am satisfied with my
smartphone service(s).
Travel satisfaction
Baker and Crompton, 2000; Lee,
Yoon and Lee, 2007
1 Overall, I am satisfied with my
travel to Ghana.
2 I am satisfied with my trip to
Ghana when I compare it to other
trips.
3 I am satisfied with my travel when
considering the money and time
spent.
Intention
Crespo et al. 2009Chen 2013; Sohn, Lee and Yoon,
2016
1 I will use a smartphone for my
travel needs in the future.
2 I will keep using a smartphone for
my travel needs.
3 I will use mobile Internet for my
future travel.
4 I will use a smartphone for my
travel arrangements in the future.
7. Section D: This section examines your travel characteristics
A. Is this your first time in Ghana? 1. Yes 2. No
B. If no, how many times have you
260

travelled to Ghana including your
current trip?
……………………………………………….
C. How would you describe yourself? 1. A backpacker 2. A tourist
3. A traveller 5. Others………….......
D. Which type of accommodation are
you currently staying in?
1. Budget (e.g. hostel or guesthouse)
2. 1*Star 3. 2*Star 4. 3*Star5. 4*Star
6. 5*Star7. Others………………………..
E. What is your major mode of
transport in Ghana?
1. Trotro (local public transport)
2. Taxi (cab) 3. Rental car
4. Tour bus 5. Others………………......
F. Is this your first time of doing
backpacking? 1. Yes 2. No
G. If no, for how long have you done
backpacking? Months………………Years………………….
H. Is this your first time of using a
smartphone abroad? 1. Yes 2. No
I. If no, how long have you been using
a smartphone for travelling (in
complete years such as 1, 5, etc)? Months………………Years…………………
J. Are you travelling alone? 1. Yes 2. No
K. If no, how many are you in your
group? ……………………………………………………..
L. Approximately, how much is your
travel budget in US$? ……………………………………………………..
8. Section E: This section finds out about your socio-demographic characteristics
Please choose your preferred answer by ticking [√] as apply
A. What is your age (in
complete years)? ………………………………………………………..
B. What is your gender? 1. Male 2. Female
C. What is your marital status? 1. Married 2. Unmarried
D. What is your highest level
of education?
1. High school 2. University/College
3. Postgraduate 4. Others (specify)………………….
261

E. What is your profession? 1. Student 2. High level manager
3. Intermediate level manager 4. Supervisor
5. Skilled manual labour
6. Managerial/professional 7.
Others…………………
F. What is your religion? 1. Christianity 2. Islam 3. Buddhism
4. Hinduism 5. Atheism Others……………
G. What is your nationality? …………………………………………………...
H. What is your continent of
origin?
1. Europe 2. America 3. Asia
4. Australia 5. Africa
I. About how much do you
earn before tax in a year (in
US$)? ………………………………………………………..
THANK YOU FOR YOUR TIME
13.6 Semi-structured interview guide
1. Welcome and self-introduction
Start by welcoming participant and introducing myself.
262

Who I am and what I am trying to do.
What I will do with the information.
Why I asked you to participate.
Participant may also introduce himself or herself.
Find out from participant if there are any questions before the interview and
address them accordingly.
2. Provide PIS which introduces the researcher and need for the study, and a
consent form to seek the approval of potential interviewee to partake in the
study.
3. Turn on voice recorder after consent is granted.
4. Asking filter questions
Please do you possess a smartphone?
If yes, what brand of smartphone do you possess (e.g. Apple, Samsung, Nokia,
LG, HTC, ZTE e.t.c)
how long have been using it?
How would you describe yourself in terms of your travel style (e.g. a backpacker,
traveller, tourist, volunteer e.t.c)?
What kind of accommodation are you currently lodging in while in Ghana (e.g.
budget hotel/guesthouse, 1 star, 2 star, 3 star, 4 star e.t.c) and why do you choose to
lodge there?
5. Travel experience and purpose of visit
How long have you been doing backpacking?
Is this your first time in Ghana?
If no, how many time have you been to Ghana including this current visit?
Tell me why you chose to visit Ghana?
Which places do you intend to visit or have you visited in Ghana?
6. Smartphone usage
Can you tell me why you came along with a smartphone to Ghana?
What functions have you used your smartphone to perform in Ghana?
Why did you use it to perform those functions (if any)?
263

Did you have any problems when executing these functions and, if so, what were
they?
7. Risk concerns
What can you say about the technology infrastructure of Ghana in terms of Internet
availability, download speeds, and security e.t.c?
Do you have any concerns of using a smartphone here?
If yes, can you state some of these concerns?
If no, have you not thought about the likelihoods of your smartphone getting
stolen or hacked e.t.c.
8. Risk reduction strategies
What measures have you taken against each of those concerns (if any) and why?
9. Satisfaction
Tell me about your satisfaction or otherwise of using a smartphone in Ghana?
What can you say about your overall experience of using a smartphone in Ghana?
Would you use a smartphone for your future travel needs? Why?
10. Background Data
What is your nationality?
What is your highest level of education?
Could you tell me your age?
That ends our interview. Thank you so much for volunteering your responses during this
interview. If you have any additional comment(s) or question(s), please fill free to do so.
11. Materials and supplies for interview
Interview guide
Consent form
Personal Information Sheet (PIS)
Jotters
Pens
2 voice recorders
Refreshment
13.7 Participant Information Sheet (PIS)
Hello, my name is Frederick Dayour and I am a postgraduate researcher at the University of
Surrey, UK. I am carrying out research on backpackers’ perceived risk towards the use of
264

smartphones in Ghana and their risk mitigation strategies. This research involves
investigating your concerns regarding the use of smartphones in Ghana and what measures
you have in place to reduce them.
You will therefore be asked to answer some questions relating to your stay and use of mobile
phones in Ghana which directly relates to this study – in this one-to-one interview. This will
last for about 45 to 60 minutes and not more.
The results or whatever you say in this interview will be confidential and anonymous. In fact,
the information I will be taking from you is purely for an academic exercise. Your
participation in this exercise is entirely voluntary and you have the right to stop at any time
and for any reason, and I will be most pleased to know the reason (if any).
If you have any queries regarding any question from me, please do not hesitate to ask for
clarity. If you have any questions regarding the nature of the research, please feel free to ask
them before or at the end of the exercise.
Thank you.
13.8 Consent form
Backpackers’ perceptions of risk towards smartphone usage and risk reduction strategies, Ghana
Please tick each box
265

I have been given a full explanation by the researcher of the nature, purpose, and likely duration of the interview, and of what I will be expected to do.
I agree to comply with the requirements of the study as outlined to me to the best of my abilities.
I agree for my data to be used for this study that will have received the relevant ethical approval.
I give consent for the interview to be audio recorded. I give consent to verbatim quotation being used in reports. I agree for the researchers to contact me to provide me with a study
results summary. I agree for the researchers to contact me about future studies. I understand that I am free to withdraw from the study at any time
without needing to justify my decision, without prejudice and without my legal rights being affected.
I understand that I can request for my data to be withdrawn until publication of the data and that following my request all personal data will be destroyed but I allow the researchers to use anonymous data already collected.
I confirm that I have read and understood the above and freely consent to participating in this study. I have been given adequate time to consider my participation.
Name of participant (BLOCK CAPITALS) ................................................
Signed ......................................................Date ..................................................... Name of researcher
……..............................................(BLOCK CAPITALS) Signed...............................................Date…………………………………
13.9 Introductory letter to tourism facilities involved in this research
266

267