eps ped muse - cdn.ymaws.com · eps ped muse 3 . shadows . 1. shadow produced by the light from...
TRANSCRIPT

EPS PED MUSE
1
Shadows: stories of light
Gorazd Planinšič
Laurence Viennot
July 2010
All members of the MUSE project take responsibility for the content of this paper. The intellectual property remains with
the authors.

EPS PED MUSE
2
Contents Shadows: stories of light ....................................................................................................................... 1 Shadows ................................................................................................................................................ 3
1. Shadow produced by the light from extended source ................................................................... 3 Why this experiment? .................................................................................................................... 3 Students‘ difficulties with shadows produced by the Sun ............................................................. 5 Experiments with extended light source ....................................................................................... 6 Added value: observing and interpreting a transition zone of shadows ........................................ 8 Short theoretical background ...................................................................................................... 11
2. Shadows produced by the light from point source ...................................................................... 12 3. Shadows produced by a beam of light that undergoes refraction on the spherical surface ......... 16
Goal of the experiment ................................................................................................................ 16 Setting .......................................................................................................................................... 16 Staging sequence ......................................................................................................................... 17
4. Coloured shadows ....................................................................................................................... 18 Goal of this experiment ............................................................................................................... 18
Setting .......................................................................................................................................... 18
A way to analyse the situation ..................................................................................................... 19 Staging suggestions ..................................................................................................................... 20 Common ideas and specific features of this experiment ............................................................. 22
Variant: LED colour mixer ......................................................................................................... 22 5.Appendix ...................................................................................................................................... 24
Leybold Apparatus for additive colour mixing ........................................................................... 24 Liesgang data projector (LCD type) ............................................................................................ 26
6. References ................................................................................................................................... 27

EPS PED MUSE
3
Shadows
1. Shadow produced by the light from extended source
Why this experiment?
Seemingly simple question
What is the size of the shadow of an object formed by the Sun? What affects the sharpness of the
shadow and how?
represents a significant problem to most high-school and undergraduate students. If you browse
introductory physics textbooks you will find that the word ―shadow‖ rarely appears in the index. In
cases when it does, you will find a short chapter or paragraph explaining solar eclipse with typical
illustrations such as one shown in figure 1 and mentioning the difference in shadows produced by a
small and large light source (see for example, Hewitt 1998, Tauger 2006, Haber-Schain et al. 1991).
The problem with figure 1 is that the transitions from bright region to less bright (penumbra) and to
dark region are not sharp but continuous. This might seem as minor designer‘s mistake but it is more
than this. It is connected with the way the formation of shadows are explained and understood in
everyday situations. Shadow is often seen as a travelling object, ―cast‖ on screen instead of a zone of
―less light‖ coming from the source to the screen due to the fact that some of this light is blocked by
the object. The continuous transition between bright and dark region in case of eclipse is direct
consequence of this.
Problems with understanding shadows become evident in explanations of what do we see and how
do we interpret images obtained with camera obscura. The construction of image by drawing light
beams from points on the object to the points on the screen may look quite reasonable to most of the
students. But when they are asked to predict how the shape and size of the aperture affect the image
on the screen they get lost. It is not easy to realize that each point on the "image" in camera obscura
is in fact a shadow of the mask with aperture (see figure 2).
Figure 1: Typical sketch showing the shadow formation during the Sun
eclipse.

EPS PED MUSE
4
Figure 2: ‗‘Image‘‘ obtained by camera obscura: light beams from points on the object are producing shadows of the
mask with aperture.
The fact that ―image‖ obtained by camera obscura is in colours represents additional obstacle in
accepting the idea of shadows. The problem of interpreting shadows produced by light sources of
different colours is interesting on its own and will be discussed at the end of this paper.
Before going on, let us stop for a while at the terminology concerning shadows and images.
In the Italian Dictionary 'Sabatini Coletti' one finds the following description of the term
―shadow‖1:
“Area of darkness or decreased luminosity produced by interposition of an opaque body between it
and the light source. The shape or figure projected on a surface by an opaque body illuminated.”
The description (area...of decreased luminosity) is surprisingly close to the one given on the previous
page.
This example shows that some misinterpretations are quite resistant and periodically reappear in
literature (certify figure 1).
This is the right moment to mention two caveats about terminology:
Though the term ―ray‖ is regularly used in several situations, one should be aware that it is
used as a model for a path of light and should not be interpreted as a physical object.
Optical image means point to point correspondence between an object and its image
produced by some kind of optical system. Optical image is ―formed‖ and not ―received‖ as a
result of some travelling images. What we call here ―shadow-image‖ is a shadow that
approximately reproduces the shape of the object that is blocking the light.
1 Etimology of ombra (shadow) goes back to XIII century.

EPS PED MUSE
5
Students’ difficulties with shadows produced by the Sun
The following question has been given to first year physics majors (Faculty for Mathematics and
Physics, University of Ljubljana):
On a sunny day, when the Sun is right above, you are holding a ball on a stick above the ground as
shown by the drawing. Draw the beams of light (rays) and show how the shadow of the ball is
formed on the ground. Explain your reasoning also in words. (The drawing of a hand holding a ball
on a stick that was part of the question is also evident from figure 3).
Different types of student responses are presented in figure 3.
Figure 3: Student responses to the question on shadow formation: a) compatible with correct answer and b) to f)
different types of student responses.
Taking into account the responses obtained from questionnaires and some follow-up interviews two
common difficulties have been identified in students‘ reasoning.
Many students don‘t understand how the shadow produced by the extended light source is
formed when the light source is close to the object and screen. But even those who
understand this seem to have difficulties to explain shadows produced by the light source
such as Sun, which is very far from the object and screen. The main difficulty comes from
generalizing the correct statement ―rays coming from very far point light source are parallel‖
to incorrect conclusion ―rays coming from Sun are parallel‖ (see figure 3 and figure 4).
In addition, some students attributed the observed transition between dark and light parts on
the screen to diffraction (figure 3b and c), without being able to recognize that diffraction is

EPS PED MUSE
6
negligible in this case. The same reasoning has been noticed also among some best
performing high school students.
Figure 4: Rays emerging from a particular spot on the Sun are parallel at the Earth. For clarity only part of rays
emerging from three spots are shown. Colours are used only to differentiate between the rays.
Two important features of shadow-images are their size and the size of the transition region in which
illumination of the screen decreases from maximum to minimum value (from now on called simply
the transition region). The third feature, which becomes important when different light sources are
used, is colour. In the first three Sections we shall focus on the first two features and in Section 4 we
shall add the colour dimension to them.
Size of the shadow-image and of the transition region depends on the following parameters: object-
to-screen distance, light source-to-screen distance, size of the light source and size of the object.
Dependence on so many variables may quickly become confusing for students, so we focus on the
crucial question, which is most closely connected to the student difficulties presented above: “How
does the size of the shadow-image and its transition region depend on the size of the light source?”
The following sequence of experiments can help students build a coherent picture about how
shadows are formed and subsequently to find answer to the question above. Some experiments offer
possibility to compare measured values with calculated values obtained from relatively simple
theoretical model.
Experiments with extended light source
Materials
Light source: A suitable light source for this
experiment is ―ultra bright 19 LED headlight‖ (see
figure 5) with LEDs that can be switched on in
groups (in our case we can switch on 1, 7 or all 19
LEDs). The price of such headlights is 5 EUR or
less. An almost zero-cost alternative is to use three
(or more) candles (see the text below).
Figure 5: Two types of light sources: a) multi LED
headlight and b) candles
EPS PED MUSE
7
Object: Any opaque object is suitable. If candles are used as a light source then the object should be
elongated in vertical direction, such as vertical rod (see text below). We used metal rod from
laboratory stand.
Screen: Normally we use white board or projection screen, but white painted wall, white sheet of
paper or cloth works equally well.
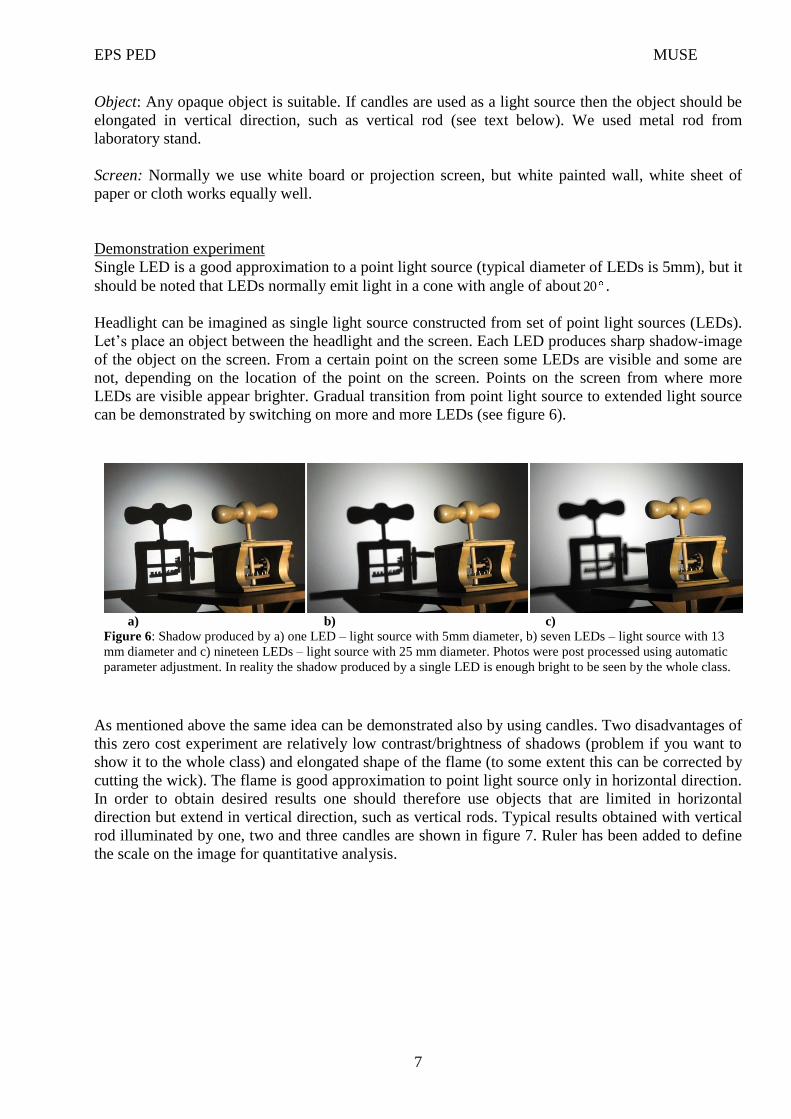
Demonstration experiment
Single LED is a good approximation to a point light source (typical diameter of LEDs is 5mm), but it
should be noted that LEDs normally emit light in a cone with angle of about 20 .
Headlight can be imagined as single light source constructed from set of point light sources (LEDs).
Let‘s place an object between the headlight and the screen. Each LED produces sharp shadow-image
of the object on the screen. From a certain point on the screen some LEDs are visible and some are
not, depending on the location of the point on the screen. Points on the screen from where more
LEDs are visible appear brighter. Gradual transition from point light source to extended light source
can be demonstrated by switching on more and more LEDs (see figure 6).
As mentioned above the same idea can be demonstrated also by using candles. Two disadvantages of
this zero cost experiment are relatively low contrast/brightness of shadows (problem if you want to
show it to the whole class) and elongated shape of the flame (to some extent this can be corrected by
cutting the wick). The flame is good approximation to point light source only in horizontal direction.
In order to obtain desired results one should therefore use objects that are limited in horizontal
direction but extend in vertical direction, such as vertical rods. Typical results obtained with vertical
rod illuminated by one, two and three candles are shown in figure 7. Ruler has been added to define
the scale on the image for quantitative analysis.
a) b) c)
Figure 6: Shadow produced by a) one LED – light source with 5mm diameter, b) seven LEDs – light source with 13
mm diameter and c) nineteen LEDs – light source with 25 mm diameter. Photos were post processed using automatic
parameter adjustment. In reality the shadow produced by a single LED is enough bright to be seen by the whole class.

EPS PED MUSE
8
Added value: observing and interpreting a transition zone of shadows
As emphasized earlier, it is important to realize that shadow means ―more or less light received‖.
The formation of penumbra (transition region in shadows formed by extended light source) can be
better understood by observing what can be seen from behind a screen or at the screen. A simple
experimental setup that allows such observation is the following (Hirn & Viennot 2000, 361). Some
holes are punched in more or less brightly illuminated areas of the screen as shown in figure 8.
A first step is to ask for predictions about what will be seen of the source (the whole source, a part of
it, which one?) through each hole. Indeed, if the lighting of an area on the screen is maximal, for
instance, this consistently goes with the fact that, through a hole punched there, one sees a large part
a) b) c)
Figure 7: Shadows of a rod (visible on the right side of each photo) formed by a) one, b) two and c) three candles. Photos
were post processed using automatic parameter adjustment. In reality the shadows are hard to be seen by the whole class
unless students are invited to come close to the screen.
Figure 8: An experimental set-up for the question: what will you see through each hole ? (Hirn
& Viennot 2000, 361). This set-up should be placed in a dark room.

EPS PED MUSE
9
of the source. Such reasoning is important, because it links rectilinear propagation, illumination of
the pupil of the eye and the geometrical condition for vision, while fostering a clear distinction
between these points.
In addition students can be asked to try to imagine what can be seen of the source of light at different
points on the screen by an ant that walks along the screen. This thought experiment in combination
with the experiment described above can help students to build a correct representation of the
situation and give answers to the questions posed above.
The view seen by a walking ant can be demonstrated by using a mobile phone camera and sliding it
across the shadow on the screen while recording a movie (see figure 9).
Figure 9: Examining a shadow by mobile phone camera: a) light source, object and the screen, b) moving mobile phone
across the shadow region, c) view ‖seen― by the mobile phone camera as it passes across the penumbra.
The use of mobile phone camera simplifies the experiment and gives additional attraction to the
study, since it includes a familiar device that is closely related to students‘ everyday life. This
experiment should follow direct observation described in the punched screen experiment above.
Student project or laboratory experiment
Dependence of light intensity in the transition region when shadow is produced by an extended light
source can be roughly measured from photos obtained with digital camera. Intensity profiles can be
easily obtained from the photos using software for image analysis, such as freeware Image J2. More
accurate measurements can be done with school light sensors, but these types of measurements
require more time and/or more sophisticated equipment. Typical results obtained with metal rod and
LED head-light are shown in figure 10. In this particular case the geometrical parameters were as
follows:
Distance between the light source and the rod a = 720 mm
Distance between the rod and the screen b = 970 mm
Light source diameter D: 5, 13 and 25 mm
Rod width: d = 12 mm
2 http://rsbweb.nih.gov/ij/download.html

EPS PED MUSE
10
Photos in figure 10 show three distinct cases. Roughly speaking we can say: if the diameter of the
light source is very small (a), than the shadow has sharp edges and ―flat‖ central dark region; if it is
large (c) than the shadow does not reach complete darkness even in the centre and the transition from
bright to dark is not sharp. In an intermediate region (b) only the narrow central part of the shadow is
completely dark. More precise definition of the three regions is given in the next chapter.
0
20
40
60
80
100
120
140
160
180
0 1 2 3 4 5 6 7 8 9 10
a) Xm=17 mm, Xc=18 mm; Ym=10 mm, Yc=11 mm
0
20
40
60
80
100
120
140
160
180
0 2 4 6 8 10
b) Xm=24 mm, Xc=23 mm; Ym= 4mm, Yc=5 mm
0
20
40
60
80
100
120
140
160
180
0 2 4 6 8 10
c) Xm=33 mm, Xc=31 mm ;Ym=3 mm, Yc=3 mm
Figure 10 : Shadows of the rod (diameter 12 mm) produced by LED head-light when the diameter of the light
source was a) 5 mm, b) 13 mm and c) 25 mm. Graphs on the right show intensity profiles across the transition
regions (horizontal axis is in cm). In all cases the rod, light source and the screen have been kept at the same
position. Photos were post processed using automatic parameter adjustment. See next chapter for explanation of X
and Y values (m indicates values measured from the photos and c calculated values).

EPS PED MUSE
11
Short theoretical background
With a good sketch and using simple geometry one can derive the expressions for width of the
shadow regions in three different cases mentioned in the previous chapter. Three cases can be
distinguished, depending on relation between the viewing angles at which object and the light source
are seen from the location of the screen (figures 10 and 11):
A) )/(/ baDbd : light source is subtending smaller viewing angle than the object
a
Db
a
bdY
a
Db
a
bdX
2)1(
2;
2)1(
2 (1)
B) )/(/ baDbd : light source and the object are subtending equal viewing angles
0; YdD
DdX (2)
C) )/(/ baDbd : light source is subtending larger viewing angle than the object
)1(22
;2
)1(2 a
bd
a
DbY
a
Db
a
bdX (3)
Figure 11 : Schematic representation of shadow regions formed by a stripe of width d which is
lit by the homogeneous light source of width D. Inserted graphs on the right represent the
qualitative dependence of intensity profiles at different distances behind the object (see also
figure 9). Note that in reality intensity of shadows in gray regions varies continuously.

EPS PED MUSE
12
Let‘s see the following two limiting cases.
Very distant extended light source (shadow-images produced by Sun)
If Sun is used as a light source then the expressions above will give the correct limiting values if we
take into account that the Sun is very far away ( a , also dD ) and that its viewing angle is
equal to 3103.9a
Drad. Under these circumstances the expressions obtain the following
simple forms:
A) 22
;22
bd
Ybd
X (for example, Sun shadow of a basketball) (4)
B) )(0; dbYdX (5)
C)22
;22
dbYb
dX (for example, shadow of a needle held about 0.5 m from
the screen) (6)
In case when the viewing angle of the object is smaller than the viewing angle of the Sun in all
directions, then the shadow is like inverted ―image‖ of the Sun obtained with camera obscura).
In case A) the width of transition region (the width of the blur where shadow goes from dark to
bright) is equal to
bbYX 01.0 . (7)
Point light source
Point light source is a light source with zero size. In practice this is the light source that observing
from the screen subtends a negligible viewing angle compared with the viewing angle of the object.
Thus the theoretical expression for the size of the shadow-image produced by a point light source
can be obtained from the expression (1) by setting D=0. In this case
)1(2 a
bdYX , (8)
which means that the shadow-image is always perfectly sharp (since X=Y the size of the transition
region is 0) and its size is always larger than the size of the object.
2. Shadows produced by the light from point source
Shadows produced by point sources can be seen as a special case of shadows produced by the
extended sources. Since point sources produce no transition regions in shadows, student problems
mentioned in the previous chapter remain hidden in this case. Common questions that are posed
when trying to stimulate students‘ reasoning in this case are related to how the size and shape of the
shadow-image change if light source, object or screen is moved along the line connecting light
source and the screen (McDermott & Shaffer 1998).

EPS PED MUSE
13
Figure 12: Magnification by point light source.
Shadows produced by point sources are delimited by magnified contours of the object. Such
magnification of different objects (especially hands) can be a great fun for young children (see figure
12). The closer the object to the light source, the larger is shadow on the screen. Different cultures
developed shadow theatres that utilize point-like light sources such as lanterns. For example Wayang
is an Indonesian name for shadow puppet theatre and literally means "shadow".
Shadows produced by point light sources offer several possibilities for simple experiments that can
be analysed by simple theoretical models. Two activities described below refer to the simple setup
that is shown in figure 13. Flat object, such as square cut from black paper, is placed between the
point light source and the screen.
Activity A
1. Make qualitative prediction on how the size (linear
dimension) of the shadow s depends on the distance
between the object and the light source a, assuming the
distance between the object and the screen b and object
size p are constant.
2. Measure s at several a values and record your
measurements.
3. Derive theoretical expression for s(a) and compare
measured and calculated values. Resolve any
inconsistency between initial prediction and final
result.
It was confirmed in informal observation that majority of the high school students and in service
teachers correctly predicted that decreasing a will result in increase of the size (linear dimension) of
the shadow. They were also able to derive the correct theoretical expression (a
baps ) using similar
triangles.

EPS PED MUSE
14
When asked the next activities, the majority of the students and in-service teachers incorrectly
predicted that the size of the shadow will be larger if object is moved either to the left or to the right
from the central position.
Activity B
1. Make qualitative prediction on how the size (linear
dimension) of the shadow s depends on the position of
the object in horizontal direction x assuming a, b, and p
are constant.
2. Measure s for several x values and record your
measurements.
3. Derive theoretical expression for s(x) and compare
measured and calculated values. Resolve any
inconsistency between initial prediction and final result.
Figure 13: Geometrical sketch of the experiment suggested in Activity B.
To large surprise of the students experiment shows that size of the shadow does not depend on x.
The probable explanation for the wrong prediction is the experience that shadows produced by the
Sun get longer and longer as Sun is setting down.
Independence of shadow size on x can be qualitatively explained in the following way. As object is
moved away from the central position, the viewing angle of the object (as seen from the position of
light source) decreases but the size of projection of the object on the screen increases for a given
angle (see sketch in figure 13). The two effects cancel and as a result of this the size of the shadow
does not depend on x. Derivation, using similar triangles, shows that the size of the shadow-image s
does not depend on x and is given by the same expression as in the previous case:
a
baps
ba
ba
a
a
ba
s
a
p '''
''' (9)

EPS PED MUSE
15
Shadow box
Shadow box is shown in figure 14. It consists of (from top to bottom) point light source made from
green LED3 and fixed in the centre of the cardboard shelf, Plexiglas for placing objects (in our case
black square papers) and white screen on the bottom.
Figure 14: Experimental setup made from cardboard box for observing shadows (left) and shadow of a black square
paper as seen in the light emitted from point light source made from green LED (right).
Making a point light source from LED
Most commercially available LEDs have an epoxy drop lens above the PN junction — the light-
emitting element. Unlike point light source LEDs emit light in a limited cone. In addition
imperfections in lens design cause the angular distribution of light intensity to be non-uniform. With
a simple modification the LED can be converted into a light source that is a good approximation of a
point light source. Start with LEDs that are encased in clear plastic. Using a hacksaw carefully saw
off the part of the LED body that makes the lens (figure 15).
Make sure that you do not cut too close to the PN junction (1 mm away is OK). Remove scratches in
sawed surface by brushing and polishing. Use fine sandpaper starting from lower grades (such as
3 For example, green LED (L-53VGC-E, Kingbright) emits light with dominant wavelength 525 nm and spectral line half
width of 36 nm.
Figure 15: Transforming LED into a point
light source: (1-2) saw off part of the LED
that makes the lens, (3) brush the sawed
surface with the fine sandpaper and (4)
finally with a white toothpaste.

EPS PED MUSE
16
grade 600) and finishing with higher grades (grade 1200). After this you have to polish the surface
with an abrasive polishing paste (a white toothpaste also works well) until the surface looks clearly
transparent.
3. Shadows produced by a beam of light that undergoes refraction on the spherical surface
Goal of the experiment
An interesting situation which combines refraction and shadow formation occurs if parallel beam of
light is incident on a transparent sphere, which contains opaque objects in its interior (see figure 16)4.
Light beam undergoes two refractions and emerges from the sphere as divergent beam of light,
resembling the light emitted by the point light source. Any object that is blocking the light beam will
produce a shadow on the screen. If the object is located inside the sphere the shadow-image will be
inverted and its size will depend on the location of the object along the optical axis. Note that though
there is refraction involved in the process, there is no ‗focusing‘ of the image on the screen, just like
in the case of camera obscura. The farther the screen, the larger will be the shadow-image.
Figure 16: Refraction of a parallel beam of light incident on a transparent sphere of radius r. Object of the size 2x forms
a shadow of size 2y on the screen, which is placed at distance d from the point T where parallel incident beams cross. In
case radius of the sphere is much smaller than distance to the screen, d is practically equal to distance between the sphere
and the screen.
Setting
The effect can be demonstrated using simple setup (see figure 17a). Fill a spherical flask with water
and add into it several square pieces of aluminium foil (approximate size 1cm x 1cm). If narrow
beam of light is aimed to the flask, magnified shadow-images of aluminium pieces are observed on a
screen (see figure 17b). Note that the shadow-image is inverted with respect to the object (you can
tell this by noting that the shadows of square leafs on the screen are moving up while leafs in the
flask are falling down.)
4 Interesting situation that combines reflection and shadow formation is described in (Čepič 2006).

EPS PED MUSE
17
a) b)
Figure 17: Spherical flask full of water with square pieces of aluminium foil; b) shadow-image of a
square piece of aluminium foil. Flask was illuminated with light beam from slide projector. Note that
the shadow of the square piece of foil on the screen is about 50 cm in size.
Water droplet which is hanging below the syringe also represents transparent spherical object. If
pond water is used then different microorganisms such as Cyclops or Water fleas can be found in it.
Fascinating magnified shadow-images of these microorganisms can be obtained on the screen if laser
beam is aimed into the water droplet (figure 18). Magnification factor of one thousand can be easily
obtained (see calculations below).
a) b) c) Figure 18 a) Water droplet that is hanging under the syringe works as a transparent spherical object. If light beam
produced by a green laser pointer is aimed into the droplet shadow-image of objects that are floating inside the droplet
can be seen on a distant screen: b) shadow-image of a Cyclops strenuous, c) shadow-image of Daphnia ambigua. Note
that the typical size of shadow-images of microorganisms is from 0.5 m to 1m. (Planinšič 2001).
Staging sequence
First show the experiment with dancing aluminium leafs in water flask and discusses how shadow-
images are formed.
During or after the demonstration you may ask students the following questions:
What approximately is the ratio between the size of the shadow-image and the size of the
object?

EPS PED MUSE
18
Are the shadow-images upright or inverted compared to the objects? Hint: you can tell this by
observing the movement of the shadow-images. (Leafs fall down. How are moving the
shadow-images?).
How will the size of the shadow-image change if the object placed inside the sphere moves
closer to the screen (see figure 16 to find the answer)?
How does the magnification depend on the index of refraction of the sphere filled with water?
How does the magnification depend on the size of the sphere? The water drop experiment
gives the answer to this question. (Several students think that the larger the lens (sphere in
this case), the larger the image).
Then show magnified shadow-images of microorganisms using the water droplet experiment. The
water droplet experiment offers an excellent opportunity for joint class of biology and physics.
After discussing these questions the expression for magnification in paraxial approximation can be
derived. Using some basic geometry the following expression can be found for magnification of the
object placed inside the sphere as shown in figure 16)
nr
dM
11
2,
where n is index of refraction of the sphere, d is distance between the sphere and the screen and r is
sphere radius. Since n for most of the liquids is between 1,3 and 1,6, the magnification factor M is
roughly given by the ratio between distance to the screen and sphere radius.
4. Coloured shadows
Goal of this experiment
A setting commonly referred to as ―coloured shadows‖ may help students at the same time work
about colours (additive and subtractive mixing) and better to understand what a shadow is.
Concerning additive and subtractive mixing this setting offers a simple and direct access to the effect
of simultaneous contributions of several coloured lights illuminating a given zone of a white screen
or any white object5. Concerning shadows, it leads students to reasoning exclusively about the beams
of light that actually reach a given zone.
Setting
In each of the three boxes shown in Figure 20 a point source of white light – a small halogen bulb
(Osram, 4V, 0.85A in our case)- is connected to a 4,5V battery, and a filter is placed (with a slide
frame) on an aperture punched into the side near the screen. The filters are, for instance, red (R), blue
5 Given that colour is a perceptive reaction of the visual system to a light entering the eye, we mean
by ―coloured light‖, for example ―a yellow light‖, a light that generates the visual impression called,
for instance, ―yellow‖.

EPS PED MUSE
19
(B) and green (G), each with a bandwidth of approximately a third of that of the spectrum of white
light (figure 19).
―Red‖ filter ―Green‖ filter ―Blue‖ filter
Figure 19. Transmissivity of the Red, Green and Blue filters (Jeulin-Kodak) used in this experiment, between 300nm and
700nm. Horizontal lines from top to bottom: 0,1%, 1%, 10%, 100%.
The white tetrahedron, (made for instance from a bristol sheet) geometrically blocks some lights in
some directions, so that different zones on the screen or on the tetrahedron are illuminated by one,
two, or three beams of coloured light, or none of them.
Figure 20. Sketch of setting used to perform the experiment of ―coloured shadows‖ (Chauvet 1996, Chauvet 1999,
slightly modified version: the tetrahedron has one edge parallel to the screen)
Not only should the room be in the dark but in order to avoid reflection, the stand of the experiment
has to be covered with black paper.
A way to analyse the situation
Of course, as for ordinary shadows, some holes can be drilled in different zones of the screen to
check which light sources are visible from particular hole. In order to predict which light will reach
which zone, the only rule to take into account here is rectilinear propagation of light.

EPS PED MUSE
20
The screen and the tetrahedron diffusely reflect all the impacting lights, in particular towards the
observer‘s eye. The visual impression corresponding to various combinations of coloured lights are
recalled in Box 1. The observed colours are shown in Figure 21.
It might be thought that only the first part of Box 1 is useful here, as we are in a case of added lights
that is of an additive mixing. Thus, a zone of the screen or of the tetrahedron that appears yellow
receives red and green lights, a magenta zone (to put it briefly) receives red and blue lights, a cyan
zone receives blue and green lights, whereas a red zone receives only red light, etc. Noticeably, a
zone receiving the three coloured lights appears – approximately - white (somewhat grey on the
picture), which is also the case for the side of the tetrahedron near the screen, due to backward
diffuse reflection.
But the case when two thirds of spectrum (to put it briefly) reach a zone – say red and blue – can also
be seen as showing the impact of three ―thirds‖ minus one, say white minus green. In such a case, the
―minus‖ is operated by geometrical blockage. This mimics the role of a magenta filter, i.e. absorbing
the ―green‖ part of the spectrum. When two ―thirds of the spectrum‖ of white light are blocked off,
that is in the smaller triangles that appear respectively red and green, the situation is analogous to
that of superimposed filters, respectively ―yellow + magenta‖ and ―cyan + yellow‖. The black zone –
i.e. the smallest triangle on the screen - shows the effects of three superimposed filters: magenta,
cyan and yellow.
Thus, this experiment geometrically operates the combinatory of coloured lights which give access
to the basics of additive and subtractive mixing.
a) View from the side b) View from above Figure 21: Colours of the different zones of the setting shown in Figure 19, once the lamps are switched on (photos: P.
Sauvage).
Staging suggestions
According to a widely recommended strategy (Chauvet 1996, 1999; see also, on this web site, the
paper about ―Educational Added Value‖), students could be asked: ―Can you predict what you will
see on the white screen if you switch on the three lamps? Explain your predictions‖
A dialogue with the students after the lamps are switched on would benefit from a preliminary
reflection, on behalf of the teacher, about the expectable students‘ ideas.

EPS PED MUSE
21
Additive colour mixing
Separating the various radiations that constitute "white" light gives a "spectrum".
The spectrum of visible white light ranges from =400 nm to =700 nm.
( wavelength; measured in a vacuum; 1 nm = 10-9
m).
The spectrum is here schematically divided
into three thirds.
Coloured lights with a spectrum corresponding
to a third of the spectrum of white light
in long wavelengths appears red
in intermediate wavelengths appears green
in short wavelengths appears blue
Combining these three lights, in various proportions, results in a large range of colours and can
also give white light.
Combining two of these lights in the correct proportion respectively gives a light that is
- yellow, if green light and red light are added
- cyan, if green light and blue light are added
- magenta, if red light and blue light are added
Subtractive colour mixing
A filter (or a pigment) absorbs a part of the spectrum of white light:
- a yellow filter absorbs blue light (a third) and
diffusely reflects green and red lights.
- a cyan filter absorbs red light (a third) and
diffusely reflects green and blue lights.
- a magenta filter absorbs green light (a third)
and diffusely reflects red and blue lights.
When illuminated in white light, two superimposed filters or two blended paints send back
(transmit or diffusely reflect) to the eye only the part of the spectrum that they have in common:
yellow + magenta filters or pigments
=> red light
cyan + yellow filters
or pigments
=> green light
magenta + cyan filters or pigments
=> blue light
Box 1. Additive and subtractive mixing: colours associated with "thirds of the spectrum".

EPS PED MUSE
22
Common ideas and specific features of this experiment
Concerning shadows, several authors (for instance Olivieri et al. 1988) have pointed out that the
students are often very surprised not to see any ―black shadow‖ on the screen. Being very small, the
only dark zone on the screen does not look like a simple shadow of the tetrahedron. Thus, the
common idea of a shadow seen as an emanation of the object ―cast‖ on the screen is challenged.
It is less common to critically analyse the following - ritual - comment: ―Such and such zone is at
the intersection of (such and such) shadows‖ (Viennot 2006, 401). This comment would be
misleading if it suggested that each of the intersecting ―shadows‖ can exist on its own: clearly, you
cannot have, for instance, a magenta ―shadow‖ only with the source of light that is in line with the
tetrahedron and this – so called - shadow, given that this source emits green light.
As observed by Chauvet (1996, 1999), absorption of light is not a simple concept, which constitutes
a severe handicap to understand subtractive mixing. One of the merits of this experiment is to offer a
geometrical analogous to absorption, a kind of radical illustration of the phenomenon. Later, it will
be necessary to refine this model, given that in real life absorption is - most of the times - partial.
Note: The materials described here and whole sequence about colour phenomena by Chauvet (1996,
see also Viennot 2003) can be found at the URL provided with the reference Chauvet 1999.
Variant: LED colour mixer
A very interesting variant of this experiment has been described in a paper by G. Planinsic (2004).
The three point light sources are made from coloured LEDs as explained at the end of Section 2. If
such light sources are mounted in a ping pong ball and various obstacles (wire or paper strip) are
inserted into the ball, different coloured patterns can be observed on the surface of that ball.
This simple device offers opportunities for different questions suitable for the students after they
have learned about additive colour mixing.
First, make sure that students understand how the LED colour mixer is made. Give them a sketch
that clearly shows how the three LEDs are located in the ball. Insert a wire through the slit on the top
of the light ball (an extended paper clip works well) all the way down into the ball. The coloured
shadows should appear on the ball wall, opposite to the LEDs (see figure 22, on the left). Ask
students to explain the location and colour of individual coloured stripe. Repeat the same as above
with a paper strip (about 4 mm wide) and you will observe a different colour pattern (figure 22, in
the middle). Pull the paper strip half way out of the ball and notice a different colour pattern. Ask
students to explain the formation of the colours in all cases.
In order to give the right explanation, the students should understand how the light emitted by the
point-light source propagates, how the shadow is produced, and how the rules of additive colour
mixing operate. They should also take into account the arrangement of the LEDs in the ball. The
corresponding justifications for the observed coloured patterns are given schematically in figure 22.

EPS PED MUSE
23
Colour mixing and spectra
The described experiments and related concepts become even clearer if students can observe the
emission spectra of the LED colour light mixer. Spectra of white, red-green yellow and ―proper‖
yellow light from the experiments are shown in figure 23. Note that the yellow wavelengths fall right
in the gap between red and green wavelengths. Also note that the three wavelength regions in this
white light spectrum differ in intensities (see Appendix for more on composition of white light
spectra.)
Note: as for any perceived colour, a visual impression of “white” can be generated by a variety
of spectra, all sharing the property of exciting the three types of cones of the human eye with
appropriate intensities.
Figure 22: The coloured shadows produced when a wire (on the left) or a paper strip (in the middle) is inserted
all the way through the ball and when a paper strip is inserted about half the way through the ball (on the right).
The sketches below show pictorial justification for the observed colour patterns. The colours on the sketches are
indicated with the usual letters (K means black).
Figure 23: Spectra obtained by prism spectrometer (from left to right): white light
produced by the three LEDs, yellow light produced by green and red LED and yellow
light produced by the yellow LED. The spectra have been obtained with a pocket
prism spectrometer.

EPS PED MUSE
24
5.Appendix
It is well known that describing and interpreting colours and colour sensation is often discipline
dependent. So we decided to take a look at two pieces of equipment that are designed for educational
purposes (Liesgang Data projector and Leybold Apparatus for additive colour mixing ) and analyse
their spectra – again using available school equipment (Vernier interface and Red Tide Ocean optics
VIS-NIR spectrometer).
Leybold Apparatus for additive colour mixing
The setup is using three colour filters and three movable mirrors to adjust the directions of colour
beams (see figure A1). The important feature of this setup is that it uses an overhead projector as a
common white light source for all three colours which means that one has no possibility to adjust
intensities of colour components separately. This means that the transmission properties of the colour
filters have been chosen so that they already take into account a proper ratio of intensities to see
white colour when all three lights are combined on a white surface.
Figure A1: (left) overhead projector with colour filters and three mirrors mounted on a stand; (right) photo of a setup of
the three overlapping colour beams impacting on a white screen.
Figure A2 shows the reflected spectra of individual colour beams on the screen and the sum of all
three (shown with black line). Regions that correspond to the widths at half peek values for each
band (RGB) are shown in transparent gray. The direct incident spectra are practically identical to the
reflected spectra.

EPS PED MUSE
25
Figure A2: Reflected spectra of individual colour beams on the screen and the sum of all three (shown with black line)
for Leybold colour mixer. Wavelength window has been limited to the visible region (400nm – 700nm).
Note that all three filters transmit near infrared light. This is the case with most acetate filters used in
schools.
When interpreting the spectra obtained with school equipment one should have in mind that such
equipment usually have significant selective spectral sensitivity. Figure A3 shows the comparison
between the spectrum of the direct sunlight obtained with school spectrometer mentioned above and
standard spectrum obtained with professional equipment (Reference Solar Spectral Irradiance). Note
the reduced spectral sensitivity of school equipment (spectrometer and optical fibre) in near infrared
and ultraviolet region.
Figure A3. Solar spectral irradiance obtained with school spectrometer (blue line) and with professional equipment
(Reference Solar Spectral Irradiance).

EPS PED MUSE
26
Liesgang data projector (LCD type)
The main difference between the data projector and colour mixer above (concerning light filtering) is
that data projector uses dichroic filters that are much better approximation of band-pass filters than
acetate filters (Reid 2008). We have dismounted a data projector and measured the properties of
filtering system alone. Figure A5 shows the ‗heart‘ of the light separation/mixing system. Figure A6a
shows the spectra of individual colours and figure A6b the spectrum of white light from classical
slide projector, which we used as source of white light in this case.
Figure A5: Part of the data projector where colour light separation and mixing takes place (for clarity the trichroic prism,
which mixes the three colour components has been replaced with white folded paper visible in the middle of the photo.)
a) b) Figure A6: a) spectrum of three colour components after passing through dichroic filters and b) spectrum of light from
classical slide projector, which uses a source of white colour in this case.
Based on our observations and measurements the following conclusion can be made:
Speaking of wavelength we can say that the components cover three distinctive regions of the
visible spectrum; each of the three regions has a bandwidth of approximately a third of that of
the spectrum of white light but there is some overlapping, especially between green and blue.
With regard to intensities the three components can be quite different in magnitude.

EPS PED MUSE
27
6. References
Čepič, M. 2006. Does virtual image cast a shadow?, Phys. Educ. 41, 295.
Chauvet, F. 1996. Teaching colour: designing and evaluation of a sequence, European Journal of
Teacher Education, vol 19, n°2, pp 119-134.
Chauvet, F.1999. STTIS Project, Colour sequence University " Denis Diderot ", LDAR (Laboratoire
de didactique André Revuz); and STTIS (Science Teacher Training in an Information Society)
web sites: (retrieved 1.7.2010)
http://www.lar.univ-paris-diderot.fr/sttis_p7/color_sequence/page_mere.htm or
http://crecim.uab.cat/websttis/index.html
Haber-Schain, Dodge, Gardner, Shone 1991. PSSC Physics (7th
ed), Kendall/Hunt publ.
Hewitt P 1997, Conceptual Physics (8th
ed), Addison-Wesley.
Hirn C. & Viennot L. 2000. Transformation of didactic intentions by teachers: the case of
geometrical optics in grade 8 in France, International Journal of Science Education, 22, 4, pp.
357-384.
McDermott, L. C. & Shaffer, P. S. 1998. Tutorials in introductory physics (with homework book),
Prentice Hall, New Jersey.
Olivieri, G., Torosantucci, G., Vicentini, M. 1988. Coloured shadows, International Journal of
Science of Education, vol. 10, n° 5, p. 561-569.
Planinsic, G. 2001.Water drop projector, The Phys. Teach. Vol. 39.
Planinsic, G. 2004. Color Light mixer for every student, The Physics Teacher, 42,138-142
Reference Solar Spectral Irradiance http://rredc.nrel.gov/solar/spectra/am1.5/ (retrieved 23.6.2010)
Reid, A. 2008.The physics of the data projector, Phys.Ed. 43, 599-603.
Tauger J 2006, Introductory Physics – building understanding, John Wiley.
Viennot L 2003. Teaching Physics, Kluwer Academic Publishers (chap.6).
Viennot L 2006. Teaching rituals and students‘ intellectual satisfaction, Phys. Educ. 41, 400.