epri igcc design and ram analysis for zero emissions
DESCRIPTION
EPRI method for estimating emission from IGCC PlantTRANSCRIPT

IGCC Design and RAM Analysis for Near Zero Emissions
1008400


IGCC Design and RAM Analysis for Near Zero Emissions
1008400
Technical Update, December 2004
EPRI Project Managers
N. Holt G. Booras
EPRI • 3412 Hillview Avenue, Palo Alto, California 94304 • PO Box 10412, Palo Alto, California 94303 • USA 800.313.3774 • 650.855.2121 • [email protected] • www.epri.com

DISCLAIMER OF WARRANTIES AND LIMITATION OF LIABILITIES
THIS DOCUMENT WAS PREPARED BY THE ORGANIZATION(S) NAMED BELOW AS AN ACCOUNT OF WORK SPONSORED OR COSPONSORED BY THE ELECTRIC POWER RESEARCH INSTITUTE, INC. (EPRI). NEITHER EPRI, ANY MEMBER OF EPRI, ANY COSPONSOR, THE ORGANIZATION(S) BELOW, NOR ANY PERSON ACTING ON BEHALF OF ANY OF THEM:
(A) MAKES ANY WARRANTY OR REPRESENTATION WHATSOEVER, EXPRESS OR IMPLIED, (I) WITH RESPECT TO THE USE OF ANY INFORMATION, APPARATUS, METHOD, PROCESS, OR SIMILAR ITEM DISCLOSED IN THIS DOCUMENT, INCLUDING MERCHANTABILITY AND FITNESS FOR A PARTICULAR PURPOSE, OR (II) THAT SUCH USE DOES NOT INFRINGE ON OR INTERFERE WITH PRIVATELY OWNED RIGHTS, INCLUDING ANY PARTY'S INTELLECTUAL PROPERTY, OR (III) THAT THIS DOCUMENT IS SUITABLE TO ANY PARTICULAR USER'S CIRCUMSTANCE; OR
(B) ASSUMES RESPONSIBILITY FOR ANY DAMAGES OR OTHER LIABILITY WHATSOEVER (INCLUDING ANY CONSEQUENTIAL DAMAGES, EVEN IF EPRI OR ANY EPRI REPRESENTATIVE HAS BEEN ADVISED OF THE POSSIBILITY OF SUCH DAMAGES) RESULTING FROM YOUR SELECTION OR USE OF THIS DOCUMENT OR ANY INFORMATION, APPARATUS, METHOD, PROCESS, OR SIMILAR ITEM DISCLOSED IN THIS DOCUMENT.
ORGANIZATION(S) THAT PREPARED THIS DOCUMENT
EPRI
This is an EPRI Technical Update report. A Technical Update report is intended as an informal report of continuing research, a meeting, or a topical study. It is not a final EPRI technical report.
ORDERING INFORMATION
Requests for copies of this report should be directed to EPRI Orders and Conferences, 1355 Willow Way, Suite 278, Concord, CA 94520. Toll-free number: 800.313.3774, press 2, or internally x5379; voice: 925.609.9169; fax: 925.609.1310.
Electric Power Research Institute and EPRI are registered service marks of the Electric Power Research Institute, Inc. EPRI. ELECTRIFY THE WORLD is a service mark of the Electric Power Research Institute, Inc.
Copyright © 2004 Electric Power Research Institute, Inc. All rights reserved.

iii
CITATIONS This document was prepared by
EPRI 3412 Hillview Avenue Palo Alto, California 94304
Principal Investigators N. Holt G. Booras
This document describes research sponsored by EPRI.
The publication is a corporate document that should be cited in the literature in the following manner: IGCC Design and RAM Analysis for Near zero Emissions, EPRI, Palo Alto, CA: 2004. 1008400.

iv
v
REPORT SUMMARY Concern over the continued availability of natural gas at competitive prices has led many power companies to initiate studies and projects on clean coal technologies as a strategic hedge against over reliance on natural gas alone to provide future power needs. Integrated Gasification Combined Cycle (IGCC) plants can meet very stringent emissions targets including those for Mercury and CO2. Several years of commercial operation have been accumulated on coal based IGCC plants in the US and Europe and IGCC plants based on petroleum residuals are in service worldwide. Prediction of IGCC plant availability is a fundamental necessity during the conceptual design and feasibility study phase of any project. Annual availability not only impacts the revenue stream in the financial proforma, it also influences the total installed cost through the required equipment redundancy and sparing philosophy.
Background The common measures of financial performance, such as return on investment (ROI), net present value (NPV), and payback period, all are dependent on the project cash flow. The net cash flow is the sum of all project revenues and expenses. For most projects, the net cash flow is negative in the early years during construction and only turns positive when the project starts generating revenues by producing saleable products. Therefore, the annual production rate is a key parameter in determining the financial performance of a project. Thus, a comparative availability analysis is required to predict the relative production rates and corresponding cash flows that are required to develop a meaningful financial analysis for a prospective project.
Objectives • To review the operating experience and availability parameters from existing gasification
facilities, including identification of sources of data.
• To describe the methodology for evaluating and reporting IGCC availability, including definition of key availability parameters.
• To discuss options for improving IGCC availability.
• To summarize results of EPRI case studies using the UNIRAM computer model.
• To discuss the key features and recommended configurations for new IGCC plants
Approach Rigorous calculation of plant availability requires the development of an Availability Block Flow Diagram (ABFD) depicting relationships between process blocks, systems, subsystems, equipment, or components. Probabilistic algorithms and methodology can then be applied to for overall plant availability parameters. EPRI’s UNIRAM computer model can be used for this calculation. Availability data for individual plant elements such as process blocks, systems, subsystems, equipment, or components is required as an input to these algorithms. For IGCC plants, typical analyses are limited to the system level based primarily on the practicality of utilizing historical reliability and availability data from the various operating gasification plants. From a practical standpoint, availability analysis at the system level reflects the overall average result of the interaction of the associated plant equipment and components.

vi
Results A brief summary of operating experience and availability parameters from the commercial gasification plants was prepared based on statistics reported at the Annual Gasification Technologies Council (GTC) Gasification Conference, as well as information obtained through various EPRI utility-specific IGCC studies. Availability reporting guidelines and analysis methodology were described. Two key parameters are forced outage rates and scheduled outage rates. Forced outage rates from the operating gasification plants were analyzed to determine the major causes of downtime. Projections of forced outage rates for new IGCC plants were developed based on incorporating lessons learned.
Methodology for development of detailed, multi-year planned maintenance schedules was described. Careful coordination of gasification and power block maintenance outages is required to minimize overall scheduled outage rates. Incorporation of a spare gasifier leads to a significant reduction in scheduled outage rates, but can increase plant capital costs by 5 to 10 percent depending on the gasification technology selected. Other availability improvement options include use of natural gas or distillate as a backup fuel, and incorporation of liquid oxygen and liquid nitrogen storage.
The coal-to power equivalent availability for new IGCC plants is expected to be in the range of 81 to 83 percent for GE Energy and E-Gas (somewhat higher for Shell) without a spare gasifier. This can be improved to around 91 to 93 percent with a spare gasifier.
EPRI Perspective The database of operating gasification plants is still relatively small and using this limited database to forecast reliability of future IGCC plants can be risky. Many operating gasification plants only have a single gasifier and have experienced typical first-of-a-kind reliability issues. Incorporating the lessons learned from these operating gasification plants is critical to the long term success of IGCC power plants. EPRI plans to work with members of the Gasification Users Association (GUA) to expand the gasification availability database. EPRI will update the results in this report as improved component availability estimates are obtained.
Interest Categories State-of-the-Art Power Plants, IGCC Power Plants, Technology Assessment, CO2 Capture and Sequestration, RAM Analysis
Keywords GCC Power Plants, Gasification, Availability, Reliability, Maintenance,
vii
CONTENTS
1 INTRODUCTION....................................................................................1-1
2 GTC AVAILABILITY REPORTING GUIDELINES ................................2-1
GTC Definitions – Measured Statistics ................................................................... 2-1 GTC Definitions – Calculated Statistics .................................................................. 2-2 GTC Availability Example ....................................................................................... 2-3
3 GASIFICATION OPERATING EXPERIENCE & AVAILABILITY..........3-1
Commercial Plants Utilizing Coal and Petcoke ....................................................... 3-1 Measures of Reliability and Availability ................................................................... 3-1 Operating Experience and Availability Summary .................................................. 3-11
4 IGCC AVAILABILITY METHODOLOGY...............................................4-1
Forced Outage Rates.............................................................................................. 4-1 Scheduled Outage Planning ................................................................................... 4-3
5 IGCC AVAILABILITY OPTIONS & CASE STUDIES ............................5-1
Peak Season Availability Analysis .......................................................................... 5-1 Spare Gasifier versus Backup Fuel......................................................................... 5-5 Storage of Liquid Oxygen and Liquid Nitrogen ....................................................... 5-7 EPRI Availability Analysis Cases Studies ............................................................... 5-7
6 COMMERCIAL DESIGN OF NEW IGCC PLANTS...............................6-1
Gasifier Sparing and High Availability Design......................................................... 6-1 Additional Features for New IGCC Plant Designs................................................... 6-1 IGCC Design for CO2 Capture ................................................................................ 6-3
7 BIBLIOGRAPHY....................................................................................7-1
8 APPENDIX.............................................................................................8-1
UNIRAM CASE STUDY OUTPUT REPORTS........................................................ 8-1 IGCC - E-Gas-Low FOR - 2 TRAIN (w/o SPARE GASIFIER) ........................... 8-2 IGCC - E-Gas-High FOR - 2 TRAIN (w/o SPARE GASIFIER)........................... 8-5 IGCC - E-Gas-Low FOR - 2 TRAIN (w/SPARE GASIFIER) .............................. 8-8 IGCC - E-Gas-High FOR - 2 TRAIN (w/SPARE GASIFIER)............................ 8-11

viii

ix
LIST OF FIGURES
Figure 2-1 GTC Unit Operating Statistics – Measured...............................................................2-1 Figure 2-2 GTC Unit Operating Statistics – Calculated..............................................................2-2 Figure 3-1 How Important is Reliability? (Source: Eastman) .....................................................3-4 Figure 3-2 Historical Forced Outage Rates at Eastman ...........................................................3-4 Figure 3.3 Polk IGCC Power Station Annual Availability Statistics............................................3-7 Figure 3.4 Texaco-Based IGCC Availability Adjustment............................................................3-8 Figure 3.5 Wabash Syngas Availability....................................................................................3-10 Figure 4-1 Simplified Availability Block Flow Diagram ...............................................................4-1 Figure 4.2 Maintenance Schedule Example (3x50% Train IGCC Plant)....................................4-4 Figure 5.1 Availability Analysis for Single Train IGCC Plant .....................................................5-2 Figure 5.2 Availability Analysis for a 2x50% Train IGCC Plant .................................................5-3 Figure 5.3 Availability Analysis for a 3x50% Train IGCC Plant .................................................5-4 Figure 5.4 Availability Improvement with a Spare Gasifier ........................................................5-7

x
xi
LIST OF TABLES
Table 3-1 SFA Pacific Gasification Database Commercial Gasification Plants .........................3-2 Table 3-2 Top Ten Eastman Shutdown Causes – 1983-2000...................................................3-3 Table 3-3 Polk Power Station Unit 1 – Capacity Factor.............................................................3-5 Table 3-4 Polk Power Station IGCC Availability Statistics .........................................................3-5 Table 3-5 Polk Power Station IGCC Unavailability Statistics.....................................................3-6 Table 3-6 Wabash Gasification Island Availability Statistics......................................................3-9 Table 3-7 Wabash Gasification Island Unavailability Statistics..................................................3-9 Table 3-8 2001 Wabash Gasification Island Downtime Cause..................................................3-9 Table 3-9 Summary of Availability and Unavailability Data......................................................3-11 Table 4-1 Single Train Reliability Data.......................................................................................4-2 Table 4-2 Scheduled Outages for Single Train E-Gas Gasification Unit ...................................4-4 Table 5-1 Peak Season Availability Analysis Summary............................................................5-5 Table 5-2 Sensitivity to Gasifier Forced Outage Rates..............................................................5-7 Table 5-3 Availability Comparison Example ..............................................................................5-8 Table 5-4 Overall IGCC Availability Analysis Results ................................................................5-8

xii

1-1
1 INTRODUCTION
The common measures of financial performance, such as return on investment (ROI), net present value (NPV), and payback period, all are dependent on the project cash flow. The net cash flow is the sum of all project revenues and expenses. Depending upon the detail of the financial analysis, the cash flow streams usually are computed on annual or quarterly bases. For most projects, the net cash flow is negative in the early years during construction and only turns positive when the project starts generating revenues by producing saleable products. Therefore, the annual production rate is a key parameter in determining the financial performance of a project. Thus, a comparative availability analysis is required to predict the relative production rates and corresponding cash flows that are required to develop a meaningful financial analysis for a prospective project.
Prediction of plant availability is a fundamental necessity during the front-end engineering and economic evaluation phase of any project. Annual availability not only influences the financial proforma via the annual revenue stream, it also manifests itself as part of the total installed cost. No valid feasibility study or preliminary engineering effort is undertaken without giving due consideration to the impact on plant availability, specifically as it relates to:
• Process scheme development/selection
• Equipment redundancy
• Process area (or system) redundancy – multiple operating trains or spare trains
• Equipment and component selection
Clearly the resultant decisions impart a direct effect on both the plant’s availability and the project’s total installed cost, the ramifications of which have impacts of comparable magnitude (although of opposite signs) on the overall economic proforma.
Rigorous calculation of plant availability requires four basic elements:
• Availability Block Flow Diagram correctly depicting relationships between process blocks, systems, subsystems, equipment, or components, as applicable
• Definition of plant states to cover the appropriate range of operating modes and scenarios
• Probabilistic algorithms and methodology for calculating overall plant availability parameters. EPRI’s UNIRAM computer model can be used for this calculation.
• Availability data for individual plant elements such as process blocks, systems, subsystems, equipment, or components.

1-2
It should be noted that the level of analysis desired; process block, system, subsystem, equipment, or component must first be established, such that the four analytical elements are treated as consistently as possible. For IGCC plants, typical analyses are limited to the system level based primarily on the practicality of utilizing historical reliability and availability data from the various operating gasification plants. The value associated with using actual historical gasification availability data at the system level is considered greater than the application of more generic information (e.g. from the literature) at a more detailed level. Additionally, from a practical standpoint, availability analysis at the system level reflects the overall average result of the interaction of the associated plant equipment and components.

2-1
2 GTC AVAILABILITY REPORTING GUIDELINES The objective of the Gasification Technology Council’s (GTC) guidelines is to present a standardized way for reporting the operating statistics of gasification facilities. The statistics are primarily time-based, however, a single flow-based indicator is also included. An example is included.
The gasification facility is divided into two units so that the operating statistics can be reported for each of these critical areas of the facility. The units are defined as follows:
• Gasification (including ASU and Acid Gas Removal Unit )
• Product Units
− Power production block, and / or
− Chemical production block
Specific configurations of the units with regard to back-up and multiple trains should be indicated.
GTC Definitions – Measured Statistics
Figure 2-1 shows the measured statistics, both time based and flow based.
On-Stream
Unplanned Outages
Planned Outages
0%
100%Product Not
Required
• % of Yr by Cause
• # of Unplanned Outages
• % of Yr.
• % of Yr.
• % of Yr.
• % of Yr.
YearlyProduction
• Total Quantity of Product Delivered in Year
TimeBased
FlowBased
On-Stream
Unplanned Outages
Planned Outages
0%
100%Product Not
Required
• % of Yr by Cause
• # of Unplanned Outages
• % of Yr.
• % of Yr.
• % of Yr.
• % of Yr.
YearlyProduction
• Total Quantity of Product Delivered in Year
TimeBased
FlowBased
Figure 2-1 GTC Unit Operating Statistics – Measured

2-2
Product Not Required represents the percentage of the year that the product from the unit was not required, and therefore, the unit was not operated. The unit was generally available to run and not in a planned outage or forced outage.
Planned Outages represent the percentage of the year that the unit is not operated due to outages which were scheduled at least one month in advance. This includes yearly planned outages as well as maintenance outages with more than one month notice.
Unplanned Outages represent the percentage of the year the unit was not operated due to forced outages which had less than one month notice. This includes immediate outages as well as maintenance outages with less than one month notice.
On-Stream represents the percentage of the year the unit was operating and supplying product in a quantity useful to the downstream unit or customer.
Yearly Production is defined as the total quantity of product actually delivered from the unit in a calendar year. For the gasification unit the production is reported on the basis of total clean synthesis gas.
GTC Definitions – Calculated Statistics
Figure 2-2 shows the statistics that are calculated from the measured statistics.
TimeBased
FlowBased
Forced Outage Rate = Unplanned /
[On-Stream + Unplanned]
Availability = On-Stream +
Product Not Required * [ 1 – (Forced Outage Rate / 100%)]
Annual Loading Factor = Yearly Production /
Rated Capacity
TimeBased
FlowBased
Forced Outage Rate = Unplanned /
[On-Stream + Unplanned]
Availability = On-Stream +
Product Not Required * [ 1 – (Forced Outage Rate / 100%)]
Annual Loading Factor = Yearly Production /
Rated Capacity
Figure 2-2 GTC Unit Operating Statistics – Calculated
Forced Outage Rate is defined as the time during which the down-stream unit or customer did not receive product due to unplanned problems divided by the time during which they expected product, expressed as a percentage.

2-3
Availability is defined as the sum of the time during which the unit was on-stream plus an estimate of the time the unit could have run when product was not required, expressed as a percentage of the year. Assumption is that unit could have operated at the same Forced Outage Rate when product was not required.
Annual Loading Factor is defined as the yearly production of the unit divided by the rated capacity, expressed as a percentage.
Rated Capacity is defined as the design quantity that the unit would produce at the design rate over the calendar year when operated in an integrated manner. It is calculated by multiplying 365 times the average annual daily design rate. Note that the design production rate can change over time as the plant is de-bottlenecked or re-rated.
GTC Availability Example
The following example illustrates the application of the GTC availability reporting guidelines for an operating unit that is a gasification train which is designed to make 200 mmscfd of syngas
The measured unit operating statistics for this example are:
• Product Not Required = 10% of year
• Planned Outages = 8 % of year
• Unplanned Outages = 4% of year
− Breakdown of the 4% by Cause
− Report # of interruptions
• On-stream = 78% of year
• Yearly production = 55,000 mmscf of syngas
The resulting calculated unit operating statistics are:
• Forced Outage Rate = 4% / [ 78% + 4% ] = 4.9%
• Availability = 78% + 10% * [1 – (4.9% /100% )] = 78% + 9. 5% = 87.5%
• Rated Capacity = 365 d * 200 mmscfd = 73,000 mmscf
• Annual Loading Factor = 55,000 mmscf / 73,000 mmscf = 75.3%

3-1
3 GASIFICATION OPERATING EXPERIENCE & AVAILABILITY
Commercial Plants Utilizing Coal and Petcoke
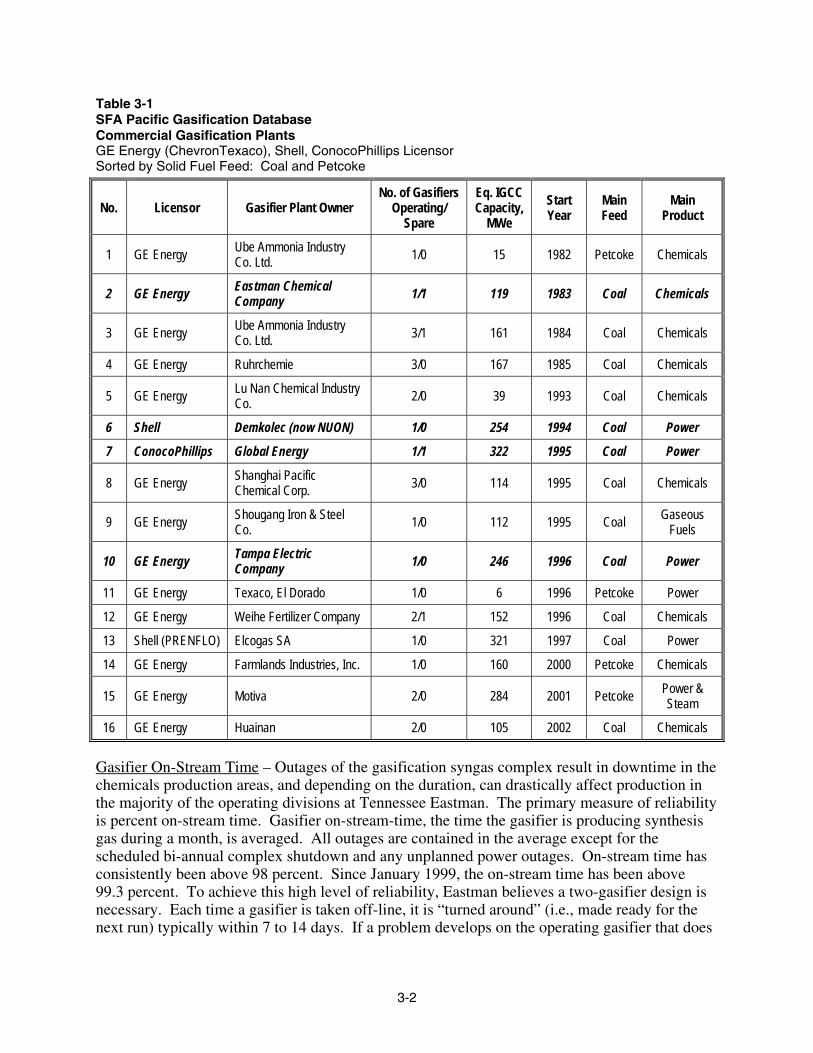
Table 3-1 lists the commercial gasification plants licensed by GE Energy (formerly ChevronTexaco), Shell, or ConocoPhillips that utilize a solid fuel of either coke or petcoke. The initial plant started up in 1982. The initial five plants were all used to produce chemicals. The first plant designed to produce power started up in 1994; a total of five plants have been built that primarily produce power.
References that included data on availability and unavailability were found for the four plants in bold italic. By far the most comprehensive data have been reported on the Eastman Chemical Company plant. The two plants that were part of the DOE Clean Coal Technology program, the Tampa Electric and Wabash plants, have also reported operating statistics since their plant startup. Only one reference giving a single number for the reliability and capacity factor was found for the Demkolec plant.
Measures of Reliability and Availability
Eastman Chemical Company1,2 – The Eastman Chemical Company’s chemicals from coal facility began operations in 1983 and was the first use of a Texaco quench gasifier to provide feed gas for the production of acetyl chemicals.
The syngas production area contains the coal handling/slurry preparation plant, the gasification plants, the Rectisol gas cleanup plant, the CO/H2 separation plant, and the sulfur recovery plant. Air Products and Chemicals, Inc. supply oxygen from an air separation plant adjacent to the Eastman plant. Oxygen and coal are supplied to either of two 450-cubic-foot Texaco quench gasifiers. Raw gases produced are split into two process streams. About one-third of the raw gas is routed to the shift reactor. Each stream is then sent to a Rectisol sulfur recovery unit.
Syngas Production – Through a 1991 plant expansion and many improvement projects, the annual plant capacity has been increased from 18 billion scf in 1991 to 26 billion scf in 2000. This is a capacity factor of 120 percent (annual production/design production).
1 “Eastman Chemical Company Kingsport Plant Fine Tuning to Improve Availability and Reliability of Coal Based Gasification 1983-2001,” presented at the Gasification Technologies 2001, San Francisco, CA, Oct. 7-10, 2001. 2“Eastman Chemical Company Kingsport Plant Chemicals from Coal operation 1983-2000,” presented at the Gasification Technologies 2000, San Francisco, CA, Oct. 8-11, 2000,”
3-2
Table 3-1 SFA Pacific Gasification Database Commercial Gasification Plants GE Energy (ChevronTexaco), Shell, ConocoPhillips Licensor Sorted by Solid Fuel Feed: Coal and Petcoke
No. Licensor Gasifier Plant Owner No. of Gasifiers
Operating/ Spare
Eq. IGCC Capacity,
MWe Start Year
Main Feed
Main Product
1 GE Energy Ube Ammonia Industry Co. Ltd. 1/0 15 1982 Petcoke Chemicals
2 GE Energy Eastman Chemical Company 1/1 119 1983 Coal Chemicals
3 GE Energy Ube Ammonia Industry Co. Ltd. 3/1 161 1984 Coal Chemicals
4 GE Energy Ruhrchemie 3/0 167 1985 Coal Chemicals
5 GE Energy Lu Nan Chemical Industry Co. 2/0 39 1993 Coal Chemicals
6 Shell Demkolec (now NUON) 1/0 254 1994 Coal Power
7 ConocoPhillips Global Energy 1/1 322 1995 Coal Power
8 GE Energy Shanghai Pacific Chemical Corp. 3/0 114 1995 Coal Chemicals
9 GE Energy Shougang Iron & Steel Co. 1/0 112 1995 Coal Gaseous
Fuels
10 GE Energy Tampa Electric Company 1/0 246 1996 Coal Power
11 GE Energy Texaco, El Dorado 1/0 6 1996 Petcoke Power
12 GE Energy Weihe Fertilizer Company 2/1 152 1996 Coal Chemicals
13 Shell (PRENFLO) Elcogas SA 1/0 321 1997 Coal Power
14 GE Energy Farmlands Industries, Inc. 1/0 160 2000 Petcoke Chemicals
15 GE Energy Motiva 2/0 284 2001 Petcoke Power & Steam
16 GE Energy Huainan 2/0 105 2002 Coal Chemicals Gasifier On-Stream Time – Outages of the gasification syngas complex result in downtime in the chemicals production areas, and depending on the duration, can drastically affect production in the majority of the operating divisions at Tennessee Eastman. The primary measure of reliability is percent on-stream time. Gasifier on-stream-time, the time the gasifier is producing synthesis gas during a month, is averaged. All outages are contained in the average except for the scheduled bi-annual complex shutdown and any unplanned power outages. On-stream time has consistently been above 98 percent. Since January 1999, the on-stream time has been above 99.3 percent. To achieve this high level of reliability, Eastman believes a two-gasifier design is necessary. Each time a gasifier is taken off-line, it is “turned around” (i.e., made ready for the next run) typically within 7 to 14 days. If a problem develops on the operating gasifier that does

3-3
not cause immediate shutdown, the spare gasifier is started and put online without interruption of the gas supply to the downstream plants.
During their last two-year maintenance cycle (8/99–9/01) Eastman reported an on-stream factor of 97.8 percent. The 2.2 percent downtime included 1.2 percent of planned outages, 1.0 percent of unplanned outages, and 0.0 percent of product not required.
Gasifier Run Length – Another important measure of reliability, is how long a gasifier is run between switching gasifiers or gas flow interruptions. For the complex startup year, 1983, gasifier run length was 4.7 days. During the late 80s to the late 90s, the average gasifier run length was between 20 and 25 days. With new reliability efforts, the gasifier run length was about 33 days in 1999 and in 2000. Through October 2001 the gasifier run length was 43.5 days. The longest single gasifier run in 2001 was 91 days.
Gasifier Turn-Arounds – One of the largest controllable maintenance costs is gasifier turn-around costs: the fewer turn-arounds a year, the lower the year’s maintenance cost. Therefore, the time between gasifier turn-arounds is measured and called “gasifier life.” Gasifier life has increased from 7.13 days in 1983 to a high of 59 days in 2000.
Top Ten Shutdown Causes – Table 3-2 lists the top ten shutdown causes over the years. In past years the feed injector or burner has been the primary cause for shutdown. However, Eastman believes it has made a breakthrough in burner design that will extend the life of the burner beyond that of other system components.
Table 3-2 Top Ten Eastman Shutdown Causes – 1983-2000
1 Feed Injector Failure 18.5% 2 Slurry Feed Pump 15.2% 3 Planned Switch 10.7% 4 Low Quench H2O Flow 6.7% 5 Low Slurry Flow 5.7% 6 Low Level in Gasifier 4.7% 7 O2 Leak 4.0% 8 PSV Failure 2.5% 9 Dip/Draft Tube 2.0% 10 DCS – PLC Failure 2.0%
Eastman, with the best operating record of all Gasification systems has provided us with the relationships shown in Figure 3-1 for various parameters. Note that a 10 % change in reliability is equivalent to 20% change in other parameters (except for electricity price).
Also, recall that forced outages are the inverse of reliability, and availability is the inverse of forced plus planned outages. On this chart Eastman means Availability
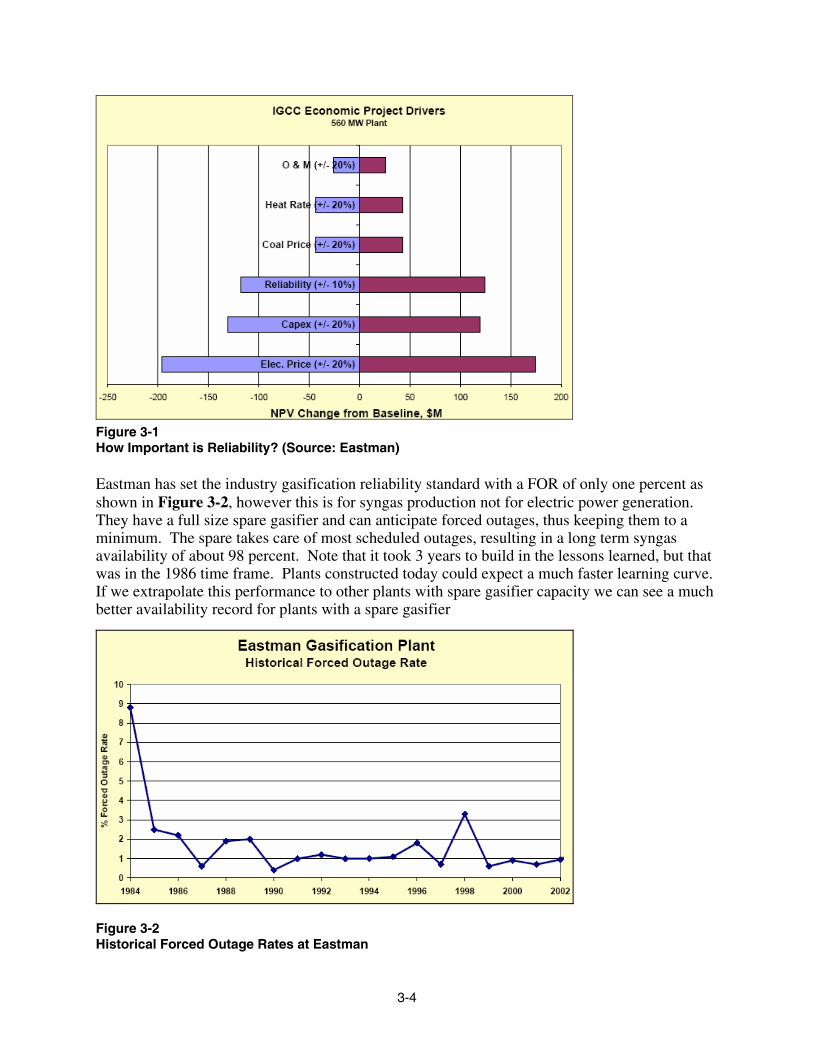
3-4
Figure 3-1 How Important is Reliability? (Source: Eastman) Eastman has set the industry gasification reliability standard with a FOR of only one percent as shown in Figure 3-2, however this is for syngas production not for electric power generation. They have a full size spare gasifier and can anticipate forced outages, thus keeping them to a minimum. The spare takes care of most scheduled outages, resulting in a long term syngas availability of about 98 percent. Note that it took 3 years to build in the lessons learned, but that was in the 1986 time frame. Plants constructed today could expect a much faster learning curve. If we extrapolate this performance to other plants with spare gasifier capacity we can see a much better availability record for plants with a spare gasifier
Figure 3-2 Historical Forced Outage Rates at Eastman

3-5
Tampa Electric Company3 – The Polk Power Station Unit 1 utilizes commercially available oxygen-blown entrained-flow coal gasification technology licensed by GE Energy (formerly ChevronTexaco). Part of TECO’s cooperative agreement with DOE is a 5-year demonstration phase.
In the Texaco arrangement, coal is ground with water to the desired concentration in rod mills. The single gasification train is designed to utilize about 2,200 tons per day of coal (dry basis). An air separation unit (ASU) separates ambient air into 95 percent pure oxygen for use in the gasification system and sulfuric acid plant, and nitrogen, which is sent to the advanced combustion turbine (CT). Air Products provided the ASU.
The acid gas removal system is a conventional MDEA system, which removes over 98 percent of the sulfur from the syngas. This sulfur is recovered as sulfuric acid. Monsanto provided the sulfuric acid plant. Sulfuric acid has a ready market in the phosphate industry in the central Florida area.
The key components of the combined cycle are the advanced CT, HRSG, steam turbine (ST), and electric generators. General Electric provided the combined cycle power block. The CT is an advanced GE 7F machine adapted for syngas and distillate fuel firing. The initial startup of the power plant is carried out on low-sulfur No. 2 fuel oil. Transfer to syngas occurs upon establishment of fuel production from the gasification plant. The exhaust gas from the CT passes through the HRSG for heat recovery, and leaves the system via the HRSG stack.
Power Production – Table 3-3 is an overview of the power production in the five years of commercial operation. Year 4 was the best year to date, with a 75 percent capacity factor on syngas.
Table 3-3 Polk Power Station Unit 1 – Capacity Factor
Year 1 2 3 4 5 Capacity Factor Syngas 32.3 63.8 56.8 75.2 66.2 Oil 7.0 6.4 7.9 1.9 5.7 Total 39.3 70.2 64.7 77.1 71.9
Availability – Table 3-4 gives the availability statistics for the major subsystems of the unit. The term “Reserve Shutdown” is equivalent to the category “Product Not Required” for Eastman and Wabash. For the gasification plant, this reflects the percentage of time when the gasifier was intentionally not operated for economic reasons, or when either the power block or the oxygen plant was unavailable.
Table 3-4 3 “POLK POWER STATION IGCC 5th Year of Commercial Operation October 2000-September 2001,” presented at Gasification Technologies 2001, San Francisco, CA, Oct. 7-10, 2001.

3-6
Polk Power Station IGCC Availability Statistics % of Period Hours, Year 4/Year 5
On-Stream Reserve Shutdown
Total Available
ASU 80.5/73.3 13.4/17.2 93.9/90.5 Gasifier 77.8/71.0 10.9/13.2 88.7/84.2 Power Syngas Oil
81.0/81.4 75.8/69.8 5.2/11.6
5.6/12.5 86.6/93.9
Unavailability – Table 3-5 shows the unavailability broken down into planned and forced outages. The gasifier’s longer planned outage in year 5 compared to year 4 reflects the gasifer liner replacement in year 5. The power block’s longer planned outage in year 4 compared to year 5 reflects the hot gas path inspection in year 4.
Table 3-5 Polk Power Station IGCC Unavailability Statistics % of Period Hours, Year 4/Year 5
Planned Outage
Forced Outage
Total Unavailable
ASU 1.1/1.1 5.0/8.5 6.1/9.6 Gasifier 5.8/7.7 5.6/8.2 11.4/15.9 Power 4.8/3.1 8.7/3.0 13.5/6.1
• Gasifier Run Length – The longest single gasifier run in year 5 was 37 days.
• Shutdown Causes – Leading causes of lost gasifier production included:
− Planned outage for refractory replacement and CT combustion inspection
− Derime ASU
− Radiant cooler outlet line plug
− Main Air Compressor 4th stage impeller
− Scrubber failures
− Gas/water leaks
− Formate salts in MDEA
The Polk IGCC was the first large USA plant built and operated by a utility. It produces approximately 250 MW (net) using a GE Energy (ChevronTexaco) gasifier and a GE 7FA gas turbine. Figure 3-3 again shows the early plant issue of low availability during the first few years. The gasifier availability grew to about 75 percent, while the power block moved up to 90

3-7
percent using the backup fuel. The ability of the power block to operate independently has been very important for these early plants
44.4
85.9
91.386.8
93.5
33.2
62.559.9
76.0 75.3
1 2 3 4 5
Operating Year
0
10
20
30
40
50
60
70
80
90
100
Fact
or
Gasifier On-StreamCombined Cycle Available
Polk Power Station IGCCAnnual Statistics (July through June)
Figure 3.3 Polk IGCC Power Station Annual Availability Statistics
Figure 3-4 shows how the historical Polk IGCC availability data could be extrapolated to estimate the availability of future commercial-scale IGCC plants. The first adjustment is for a single train. The second adjustment is for a nominal 500 MW plant consisting of 2 operating trains, with a spare gasifier. The final adjustment also incorporates lessons learned from the Polk IGCC plant and results in an overall IGCC availability of just over 90 percent.

3-8
70
75
80
85
90
95
100
Polk HistoricalData 1999-2001
Current PlantExpected 1+0
Current PlantExpected 2+1
New 2+1w/Lessons
Learned
IGC
C P
erce
nt A
vaila
bilit
Figure 3.4 Texaco-Based IGCC Availability Adjustment Wabash River Energy Ltd.4 – The E-Gas Gasification Process, as applied at Wabash, features an oxygen-blown, continuous-slagging, two-stage, entrained-flow gasifier that uses natural gas for startup. Coal or coke is milled with water in a rodmill to form a slurry. The slurry is combined with oxygen in mixer nozzles and injected into the first stage of the gasifier, which operates at 2600°F and 400 psig. A turnkey 2,060 ton/day low-pressure cryogenic distillation facility owned and operated by Global Energy supplies 95 percent pure oxygen.
In the first stage, slurry undergoes a partial oxidation reaction at temperatures high enough to bring the coal’s ash above its melting point. The fluid ash falls through a taphole at the bottom of the first stage into a water quench, forming an inert vitreous slag. The syngas then flows to the second stage, where additional coal slurry is injected. This coal is pyrolyzed in an endothermic reaction with the hot syngas to enhance syngas heating value and to improve overall efficiency.
The syngas then flows to the high-temperature heat-recovery unit (HTHRU), essentially a fire-tube steam generator, to produce high-pressure saturated steam. After the syngas is cooled in the HTHRU, particulates in the syngas are removed in a hot/dry filter and recycled to the gasifier where the carbon in the char is converted into syngas. The syngas is further cooled in a series of heat exchangers, is water scrubbed to remove chloride, and is passed through a catalyst that hydrolyzes carbonyl sulfide to hydrogen sulfide. Hydrogen sulfide is removed using MDEA-
4 “Wabash River Energy Ltd., 2001 Project Update, Operating Experience at the Wabash River Repowering Project,” presented at the Gasification Technologies 2001, San Francisco, CA, Oct. 7-10, 2001.

3-9
based absorber/stripper columns. The “sweet” syngas is then moisturized, preheated, and piped over to the power block.
Availability – Table 3-6 gives the availability statistics for the major subsystems of the unit. The term “Reserve Shutdown” is equivalent to the category “Product Not Required” for Eastman and Wabash. For the gasification plant, this reflects the percentage of time when the gasifier was intentionally not operated for economic reasons, or when either the power block or the oxygen plant was unavailable.
Table 3-6 Wabash Gasification Island Availability Statistics % of Period Hours, Year 2001
On-Stream Product
Not Required
Total Available
Gasifier Island 37.0 46.0 83.0
Unavailability – Table 3-7 shows the unavailability broken down into planned and forced outages.
Table 3-7 Wabash Gasification Island Unavailability Statistics % of Period Hours, Year 2001
Planned Outage
Forced Outage
Total Unavailable
Gasifier Island 6.5 10.5 17.0 Shutdown Causes – Leading causes of lost gasifier production are shown in Table 3-8.
Table 3-8 2001 Wabash Gasification Island Downtime Causes
Downtime Cause % of Year Syngas Cooler Tube Leaks 5.82 AG Cooler Tube Leaks 3.40 Slurry Mixer Replacement 0.40 Slurry Flow Interruption 0.72 False Filter Pressure Indication 0.12 Miscellaneous 0.11
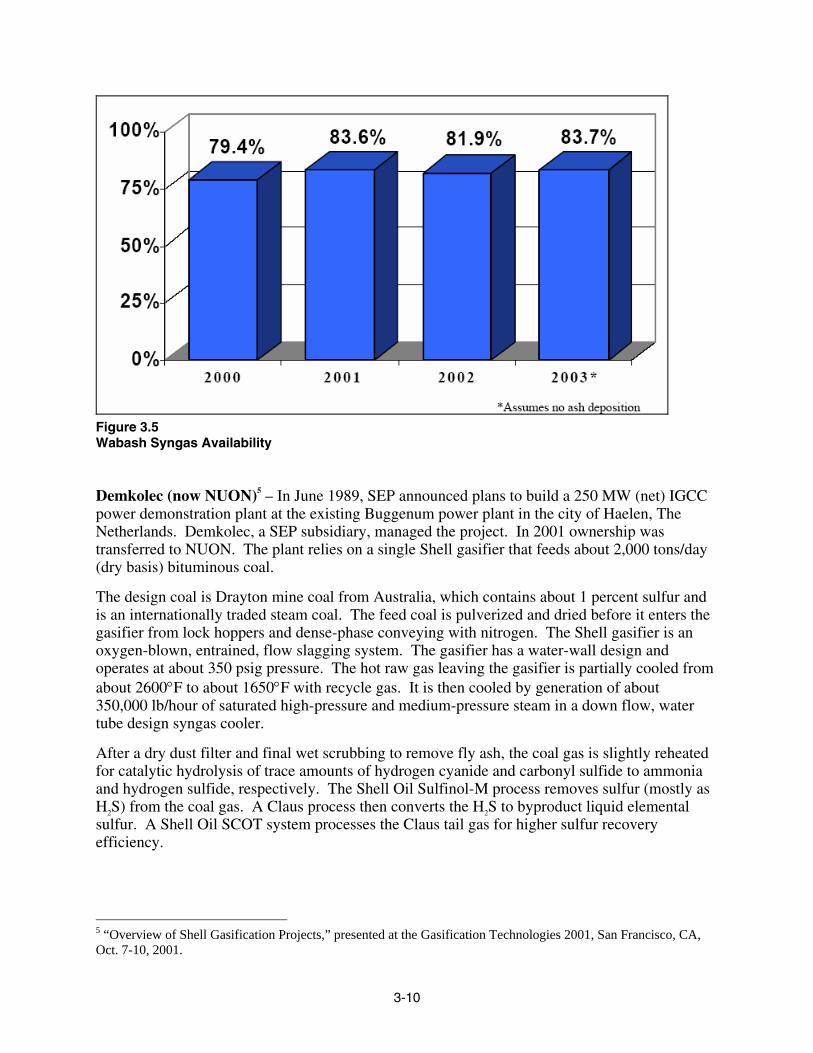
Wabash uses a single train E-Gas gasifier and one GE 7FA gas turbine to repower an existing steam turbine generator. Figure 3-5 shows the availability record for the last four years with the correction for lessons learned on ash deposition. Note this is syngas availability, not power availability and it is for a single train plant but it is one of the better records
3-10
Figure 3.5 Wabash Syngas Availability Demkolec (now NUON)5 – In June 1989, SEP announced plans to build a 250 MW (net) IGCC power demonstration plant at the existing Buggenum power plant in the city of Haelen, The Netherlands. Demkolec, a SEP subsidiary, managed the project. In 2001 ownership was transferred to NUON. The plant relies on a single Shell gasifier that feeds about 2,000 tons/day (dry basis) bituminous coal.
The design coal is Drayton mine coal from Australia, which contains about 1 percent sulfur and is an internationally traded steam coal. The feed coal is pulverized and dried before it enters the gasifier from lock hoppers and dense-phase conveying with nitrogen. The Shell gasifier is an oxygen-blown, entrained, flow slagging system. The gasifier has a water-wall design and operates at about 350 psig pressure. The hot raw gas leaving the gasifier is partially cooled from about 2600°F to about 1650°F with recycle gas. It is then cooled by generation of about 350,000 lb/hour of saturated high-pressure and medium-pressure steam in a down flow, water tube design syngas cooler.
After a dry dust filter and final wet scrubbing to remove fly ash, the coal gas is slightly reheated for catalytic hydrolysis of trace amounts of hydrogen cyanide and carbonyl sulfide to ammonia and hydrogen sulfide, respectively. The Shell Oil Sulfinol-M process removes sulfur (mostly as H2S) from the coal gas. A Claus process then converts the H2S to byproduct liquid elemental sulfur. A Shell Oil SCOT system processes the Claus tail gas for higher sulfur recovery efficiency.
5 “Overview of Shell Gasification Projects,” presented at the Gasification Technologies 2001, San Francisco, CA, Oct. 7-10, 2001.

3-11
The plant reheats the coal gas and saturates it with water vapor before burning it in a Siemens/KWU V94.2 turbine. This turbine has a power output of 155 MW. The HRSG generates superheated and reheated steam. It also adds the required superheat and reheat to the steam generated by the gasifier water wall and the syngas cooler. The steam turbine power output is 128 MW for a gross combined cycle total of 283 MW. The internal power requirements of 30 MW reduce the net power generation to 253 MW.
Capacity and Unavailability – At the 2001 Gasification Technology Conference, P.L. Zuideveld gave an overview of Shell gasification projects. For the Demkolec plant he reported the following capacity and reliability statistics for the previous year:
• Capacity: about 60 percent.
• Planned outages: 8 percent.
• Unplanned outages: 7 percent.
Operating Experience and Availability Summary
Table 3-9 summarizes the data on availability and unavailability for the four plants that reported data. Only the Eastman plant with a spare gasifier maintained in standby condition for a rapid turnaround was able to achieve a syngas availability well in excess of 90 percent. The syngas availability for the other three plants ranged from 82 to 85 percent. In order to reach syngas availability goals in excess of 90 percent, a spare gasification train will be required.
Table 3-9 Summary of Availability and Unavailability Data
Plant Eastman Tampa Wabash Demkolec Number of Gasifiers Operating/spare
1/1 (Fast turnaround) 1/0 1/1
(Slow turnaround) 1/0
Period Maintenance cycle (8/99-9/01)
Year 2001 (Year 5) Year 2001 Year 2001
Capacity Factor, % Syngas Oil
117.4 66.2 5.7 36.4 About 60%
Gasifier On-Stream Time, % 97.8 71.0 37.0 Product Not Required, % 0.0 13.2 46.0 Total Gasifier Availability, % 97.8 84.2 83.0 85.0 Gasifier Planned Outage, % 1.2 7.7 6.5 8.0 Gasifier Forced Outage, % 1.0 8.2 10.5 7.0 Longest Gasifier Run, days 91 37 Average Gasifier Run, days 44
4-1
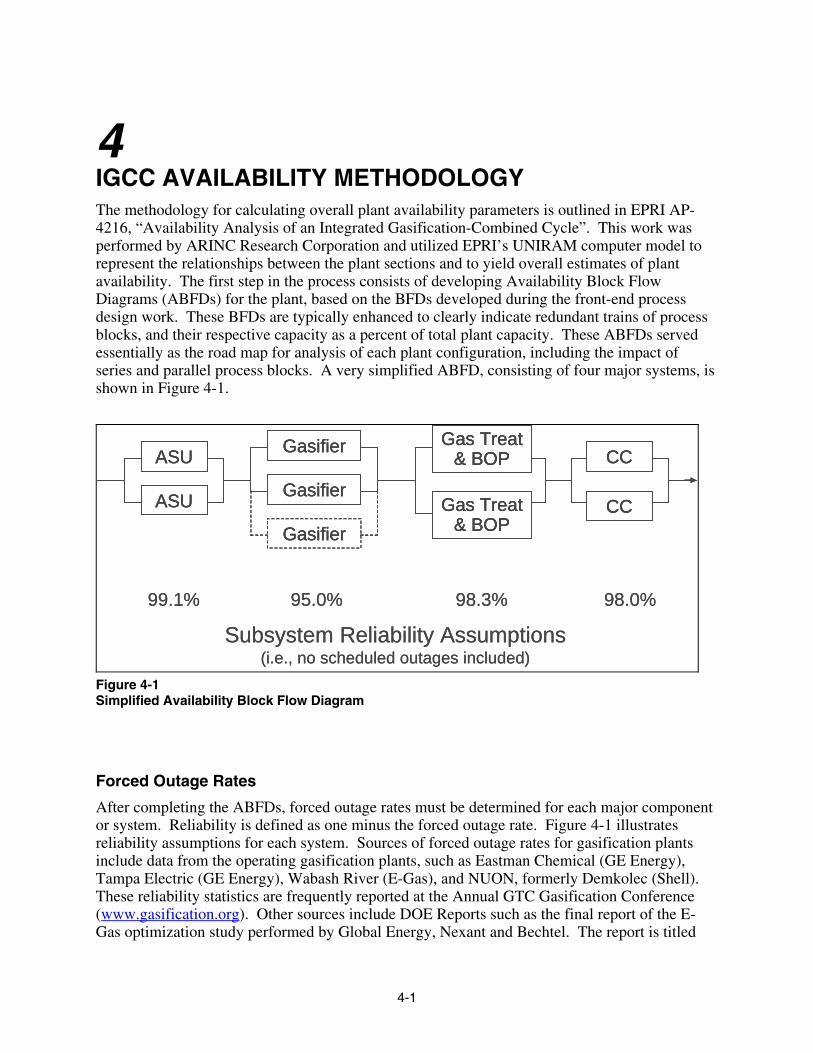
4 IGCC AVAILABILITY METHODOLOGY The methodology for calculating overall plant availability parameters is outlined in EPRI AP-4216, “Availability Analysis of an Integrated Gasification-Combined Cycle”. This work was performed by ARINC Research Corporation and utilized EPRI’s UNIRAM computer model to represent the relationships between the plant sections and to yield overall estimates of plant availability. The first step in the process consists of developing Availability Block Flow Diagrams (ABFDs) for the plant, based on the BFDs developed during the front-end process design work. These BFDs are typically enhanced to clearly indicate redundant trains of process blocks, and their respective capacity as a percent of total plant capacity. These ABFDs served essentially as the road map for analysis of each plant configuration, including the impact of series and parallel process blocks. A very simplified ABFD, consisting of four major systems, is shown in Figure 4-1.
ASU
ASU
Gasifier
Gasifier
GasifierGas Treat
& BOP
Gas Treat& BOP CC
CC
99.1% 95.0% 98.3% 98.0%
Subsystem Reliability Assumptions(i.e., no scheduled outages included)
ASU
ASU
Gasifier
Gasifier
GasifierGas Treat
& BOP
Gas Treat& BOP CC
CC
ASU
ASU
Gasifier
Gasifier
GasifierGas Treat
& BOP
Gas Treat& BOP CC
CC
99.1% 95.0% 98.3% 98.0%
Subsystem Reliability Assumptions(i.e., no scheduled outages included)
Figure 4-1 Simplified Availability Block Flow Diagram
Forced Outage Rates
After completing the ABFDs, forced outage rates must be determined for each major component or system. Reliability is defined as one minus the forced outage rate. Figure 4-1 illustrates reliability assumptions for each system. Sources of forced outage rates for gasification plants include data from the operating gasification plants, such as Eastman Chemical (GE Energy), Tampa Electric (GE Energy), Wabash River (E-Gas), and NUON, formerly Demkolec (Shell). These reliability statistics are frequently reported at the Annual GTC Gasification Conference (www.gasification.org). Other sources include DOE Reports such as the final report of the E-Gas optimization study performed by Global Energy, Nexant and Bechtel. The report is titled

4-2
“Gasification Plant Performance and Cost Optimization”, May 2002. It includes availability analysis and projected improvements and can be downloaded at:
http://www.netl.doe.gov/coalpower/gasification/projects/systems/docs/40342R01.PDF
For most IGCC analyses, the basic element is typically a plant system. Wabash system availability data has been reported publicly (in annual DOE reports and/or at GTC meetings) since completing the first year of plant operation in 1996 and is used as an example in this methodology section. The Wabash data, reported in terms of forced outage hours (by system), has been re-formatted by calculating the mean time between failures (MTBF) and mean down time (MDT), in accordance with EPRI UNIRAM methodology. This re-formatting allows calculation of annual availability in terms that could be directly applied to this analysis. The associated formulae are shown below:
Raw Data Manipulation
Availability = MTBF/(MTBF + MDT)
MTBF = (1/Lambda )*8760, hr
Lambda = # events/yr
MDT = (F.O.H.)/# events, hr
Wabash actual system availability for the period 3/1/98 – 2/28/99, after recalculation per the above, is shown in Table 4-1. By combining the data for the various systems into their associated process blocks, a series of single train reliabilities was established for each. These train reliability values are the fundamental basis for performing the overall plant availability calculation using the UNIRAM computer model. Table 4-1 lists these single train Reliabilities.
For the calculation of availability for future E-Gas based IGCC projects, the representative reliability data from the Wabash process units can be used except for two areas: the air separation unit and the gasifier. The Wabash ASU has not operated with the reliability of most industry units (this is discussed in detail in the Wabash Final Report) and an industry standard reliability of 99% is used in the projection for future plants.
The E-Gas gasifier reliability is projected to be 95% in future applications, slightly above the 93.5% of year 2000 operation. This reflects the continuing progress being made in gasifier control and in extending slurry mixer longevity. The 95% value is the reliability of an operating train.
Table 4-1

4-3
Single Train Reliability Data
New Plant Wabash Final Report Calendar Year Per Train 3/1/98 - 2/28/99 2000 Per Process Unit Calculation method Plant (EPRI) Plant EPRI Process Area Air Separation Unit 95.92 ( 96.48 ) 93.30 99.01 Slurry Preparation 99.54 ( 99.59 ) 100.00 99.59 Gasification Train 81.79 ( 85.55 ) 93.46 95.00 Slag Handling 99.15 ( 99.25 ) 97.40 99.25 AGR / Low Temp HR 99.77 ( 99.56 ) 98.10 99.56 Sulfur Recovery Unit 99.94 ( 99.94 ) 99.90 99.94 Cooling Tower 100.0 ( 100.0 ) 100.00 100.00
Scheduled Outage Planning
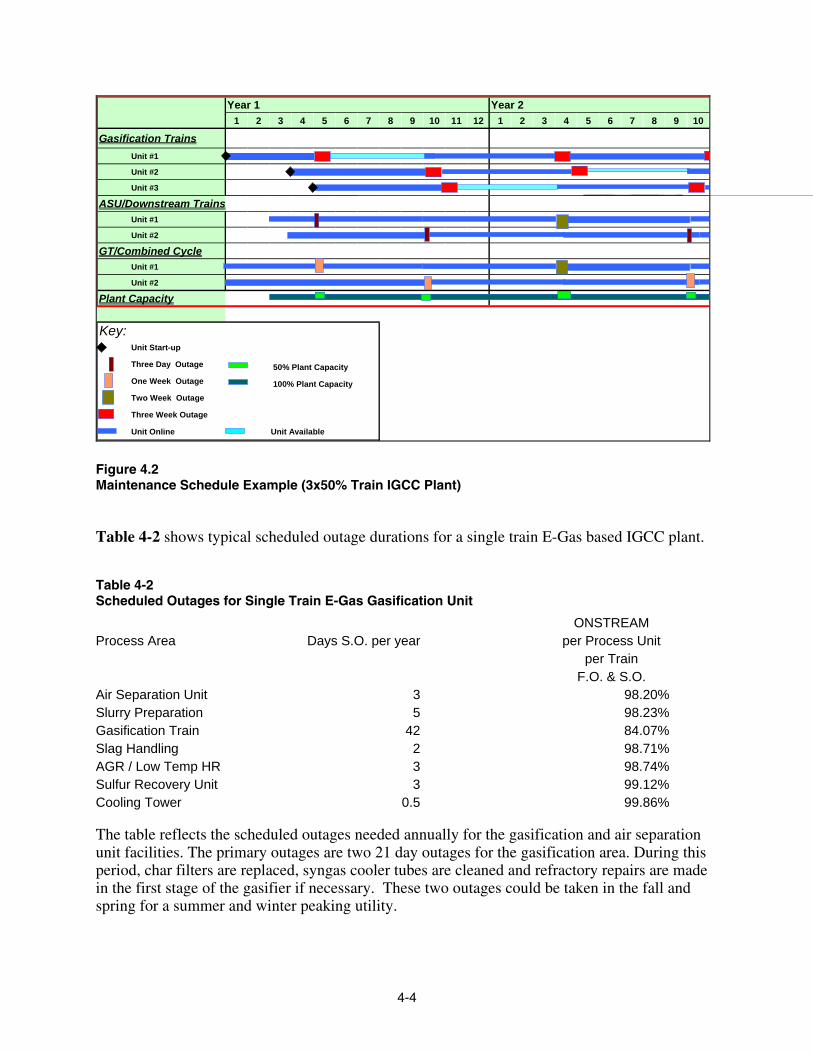
Development of a planned maintenance schedule is an essential part of the overall IGCC availability analysis. This requires establishing the planned outage duration and frequency for each major system. Typically, a five or ten year maintenance program must be defined in order to account for the longer maintenance items that may only occur every 3rd or 5th year, such as combustion turbine hot gas path inspections or major overhauls. Areas of overlapping maintenance (i.e., masking) need to be identified. For example, the combined cycle maintenance can be performed during the gasifier scheduled outages. The operating philosophy for spare trains needs to be identified in order to optimize the rotating maintenance outages. Availability of backup fuels such as natural gas or distillate may eliminate the need for a spare gasifier. Figure 4-2 shows a simplified, 2-year example of a maintenance schedule for a nominal 500 MW IGCC plant with a spare gasifier.
4-4
Year 1 Year 21 2 3 4 5 6 7 8 9 10 11 12 1 2 3 4 5 6 7 8 9 10
Gasification TrainsUnit #1
Unit #2
Unit #3
ASU/Downstream TrainsUnit #1
Unit #2
GT/Combined CycleUnit #1
Unit #2
Plant Capacity
Key:Unit Start-up
Three Day Outage
One Week Outage
Two Week Outage
Three Week Outage
Unit Online Unit Available
100% Plant Capacity
50% Plant Capacity
Figure 4.2 Maintenance Schedule Example (3x50% Train IGCC Plant)
Table 4-2 shows typical scheduled outage durations for a single train E-Gas based IGCC plant.
Table 4-2 Scheduled Outages for Single Train E-Gas Gasification Unit
ONSTREAM Process Area Days S.O. per year per Process Unit per Train F.O. & S.O. Air Separation Unit 3 98.20%Slurry Preparation 5 98.23%Gasification Train 42 84.07%Slag Handling 2 98.71%AGR / Low Temp HR 3 98.74%Sulfur Recovery Unit 3 99.12%Cooling Tower 0.5 99.86% The table reflects the scheduled outages needed annually for the gasification and air separation unit facilities. The primary outages are two 21 day outages for the gasification area. During this period, char filters are replaced, syngas cooler tubes are cleaned and refractory repairs are made in the first stage of the gasifier if necessary. These two outages could be taken in the fall and spring for a summer and winter peaking utility.

4-5
At the Wabash facility, which has two parallel gasifiers, one gasifier is used until its refractory is expended (about every third year) and a swap is made to the other gasifier. In future E-Gas units, a staged replacement of gasifier refractory is planned and portions of the first stage refractory will be replaced at each of the spring and fall outages. This extends the outage time to 21 days each (compared to a target of 16 days at Wabash), but avoids a lengthy shutdown or the need for a spare reactor vessel in each train.
The primary value of having a spare gasifier is to allow for planned outages (refractory change-outs) without interrupting syngas availability to the power block. Having a spare gasifier is expected to have a limited beneficial impact on reducing forced outages since many of these are typically caused by problems with auxiliary systems (ASU, slurry feed pumps, controls) that are outside the scope of a spare gasifier.
At the Polk IGCC plant, planned outages for refractory replacement are typically 30 days in duration, which includes cool-down and preheat. In planning these gasifier outages, the owner also needs to consider the maintenance requirements of the power block. While the power block can run without the gasifier in service if a back-up fuel is available, the gasifier is of no value without an operating gas turbine to consume the syngas. The gas turbine requires a 10 day combustion inspection (CI) outage for every 8,000 operating hours. After 24,000 hours of operation, a 14 day hot gas path (HGP) inspection is required and after 48,000 hours, a 30 day major inspection (MI) is needed. The Polk IGCC operators always schedule gasifier maintenance to coincide with maintenance on the power block.
With this outage management process, there is essentially a minimum of 10 days of "free" outage time available to perform gasifier maintenance every year (8,000 hours). To say it another way, planned annual gasifier maintenance has to exceed 10 days duration (during a CI year) to cause an incremental impact on syngas availability. In the year of a major inspection, there is a 30 day outage window, which also happens to be the time needed to replace the gasifier refractory.
By properly planning gasifier maintenance periods to coincide with power block maintenance, the owner can dramatically reduce the impact of the gasifier downtime. This careful maintenance planning also reduces the economic benefit of having a spare gasifier.

4-6

5-1
5 IGCC AVAILABILITY OPTIONS & CASE STUDIES
Peak Season Availability Analysis
ConocoPhillips is promoting the concept of “Peak Season Syngas Availability” as a strategic alternative to installing a spare gasifier. Peak Season Syngas Availability is defined as the gasification facility availability when the scheduled outages are not considered. Routine maintenance outages are typically scheduled during the fall and spring. No routine maintenance outages are planned during the winter and summer peak demand seasons. Availability is then calculated for two separate periods. The average annual availability can then be calculated based on the weighted average availability of the two periods.
For a single train unit, availability is thus calculated for two periods: 6 weeks per year (42 days for the two 21 day outages) when the unit does not operate, and 46 weeks of operation with no scheduled outages, only forced outages. The EPRI availability calculations indicate the following:
Availability – Single Train Gasification Facility
Phase State 1 ( no scheduled outage – 46 weeks) 92.97%
Phase State 2 ( scheduled outage- 2 X 3 weeks) 0 %
Overall Annual Syngas Availability 82.84%
This is syngas availability to the combustion turbine and does not include the availability of the combined cycle plant itself. Assuming a 98% combined cycle availability (where the combined cycle schedule outages are masked by those of the gasification plant), this would produce an overall Power Availability of 81.1% as shown in Figure 5-1.

5-2
Figure 5.1 Availability Analysis for Single Train IGCC Plant
Similarly, for a two train plant (two gasifier trains lined up with two combustion turbines, but cross connected), the availability can be calculated for two separate periods: 40 weeks when neither unit is in scheduled outage and 12 weeks (6 in the spring and 6 in the fall) when one gasifier or the other is having its three week planned outage. During a portion of each of these outages (3 days each for outages on the two trains, nominally one week total) there will also be an annual outage on the Acid Gas Removal and Sulfur Recovery Process Units. This yields the following result:
Availability – 2 x 50% Gasification Trains for 2 x 7FA GT’s
Phase State 1 ( no scheduled outage – 40 weeks) 93.08%
Phase State 2 ( scheduled gasifier outage – 4 x 3 weeks less 2 x 1/2 week ) 46.95%
Phase State 3 ( scheduled AGR/SRU outage- 2 x ½ week) 46.48 %
Overall Annual Syngas Availability 82.43 %
The resulting overall annual power availability is 80.8%, assuming at 98% combined cycle availability, as shown in Figure 5-2.
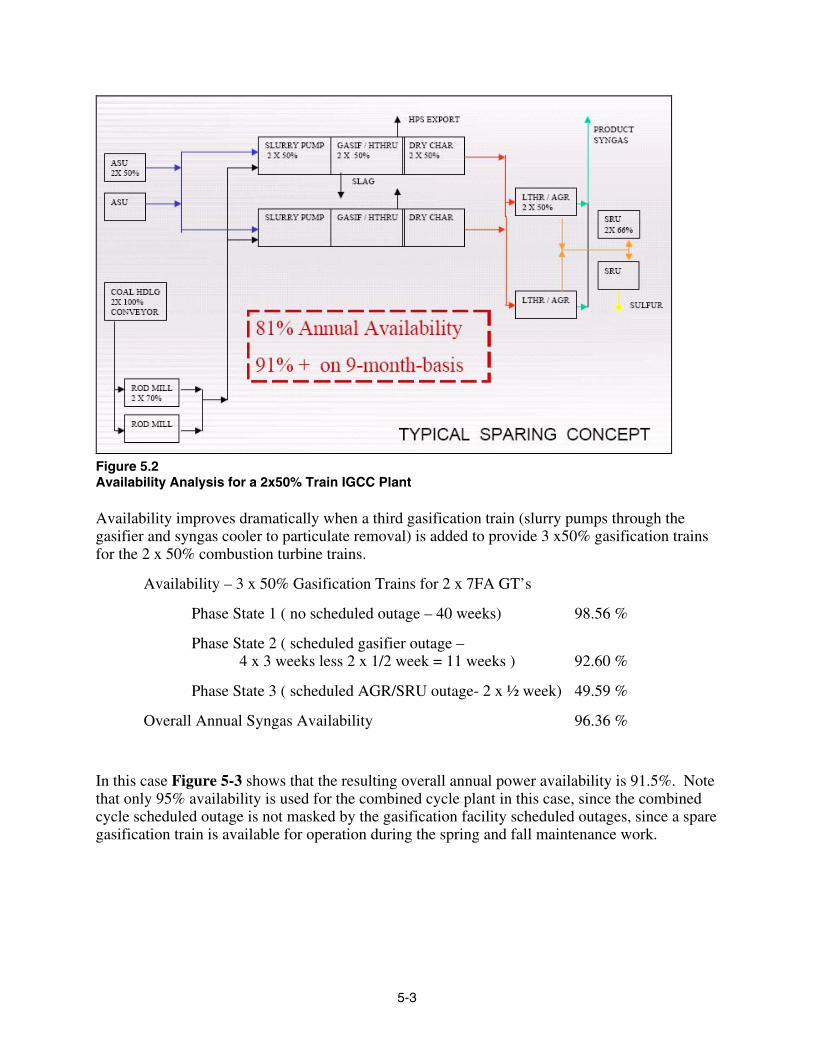
5-3
Figure 5.2 Availability Analysis for a 2x50% Train IGCC Plant Availability improves dramatically when a third gasification train (slurry pumps through the gasifier and syngas cooler to particulate removal) is added to provide 3 x50% gasification trains for the 2 x 50% combustion turbine trains.
Availability – 3 x 50% Gasification Trains for 2 x 7FA GT’s
Phase State 1 ( no scheduled outage – 40 weeks) 98.56 %
Phase State 2 ( scheduled gasifier outage – 4 x 3 weeks less 2 x 1/2 week = 11 weeks ) 92.60 %
Phase State 3 ( scheduled AGR/SRU outage- 2 x ½ week) 49.59 %
Overall Annual Syngas Availability 96.36 %
In this case Figure 5-3 shows that the resulting overall annual power availability is 91.5%. Note that only 95% availability is used for the combined cycle plant in this case, since the combined cycle scheduled outage is not masked by the gasification facility scheduled outages, since a spare gasification train is available for operation during the spring and fall maintenance work.

5-4
Figure 5.3 Availability Analysis for a 3x50% Train IGCC Plant The same methodology can be utilized to calculate availability for larger plants, as in the analysis below of two plants with three gas turbine trains. For the gasification trains aligned with the combustion turbines, 3 x 33 % and 4 x33% are compared.
Availability – 3 x 33% Gasification Trains for 3 x 7FA GT’s
Phase State 1 ( no scheduled outage – 34 weeks) 93.05 %
Phase State 2 ( scheduled gasifier outage – 2 x 3 x 3 weeks less 2 x 1/2 week = 17 weeks ) 62.99 %
Phase State 3 ( scheduled AGR/SRU outage- 2 x ½ week) 32.75 %
Overall Annual Syngas Availability 82.06 %
In this case the overall annual power availability is estimated to be 80.5%, based on 98% availability for the combined cycle.
Availability – 4 x 33% Gasification Trains for 3 x 7FA GT’s
Phase State 1 ( no scheduled outage – 34 weeks) 97.19 %
Phase State 2 ( scheduled gasifier outage – 2 x 3 x 3 weeks less 2 x 1/2 week = 17 weeks ) 92.38 %
Phase State 3 ( scheduled AGR/SRU outage- 2 x ½ week) 32.83 %
Overall Annual Syngas Availability 94.38 %
5-5
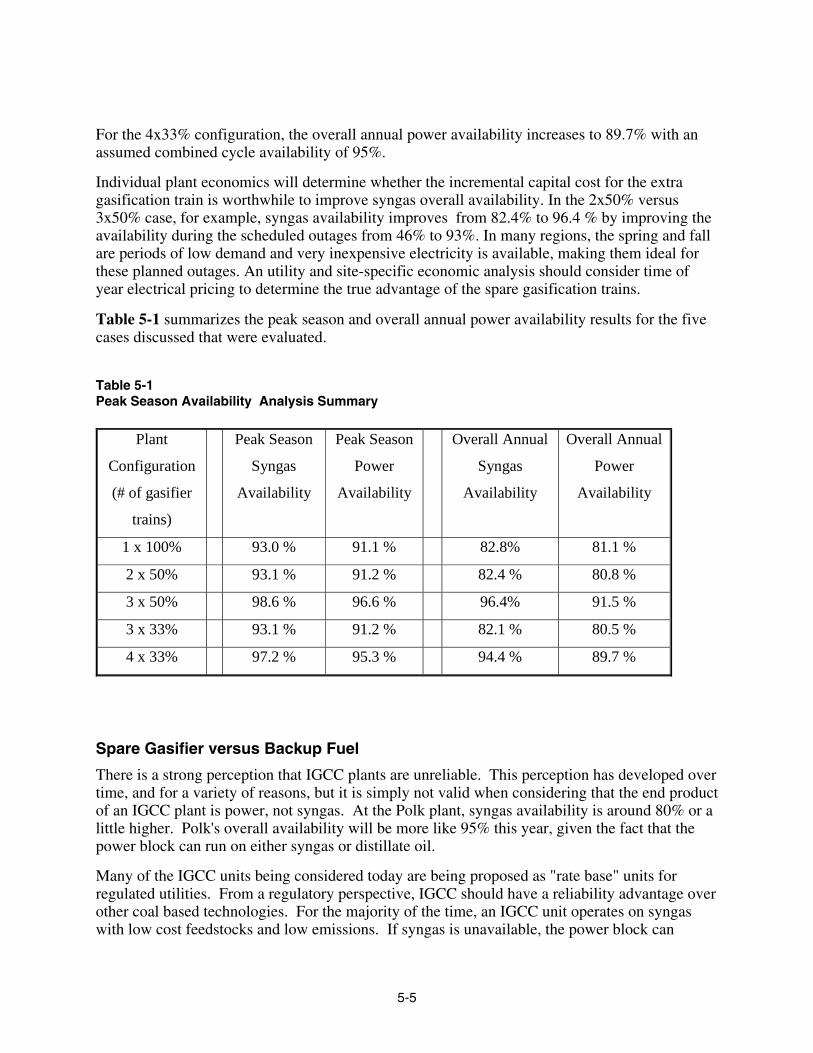
For the 4x33% configuration, the overall annual power availability increases to 89.7% with an assumed combined cycle availability of 95%.
Individual plant economics will determine whether the incremental capital cost for the extra gasification train is worthwhile to improve syngas overall availability. In the 2x50% versus 3x50% case, for example, syngas availability improves from 82.4% to 96.4 % by improving the availability during the scheduled outages from 46% to 93%. In many regions, the spring and fall are periods of low demand and very inexpensive electricity is available, making them ideal for these planned outages. An utility and site-specific economic analysis should consider time of year electrical pricing to determine the true advantage of the spare gasification trains.
Table 5-1 summarizes the peak season and overall annual power availability results for the five cases discussed that were evaluated.
Table 5-1 Peak Season Availability Analysis Summary
Plant
Configuration
(# of gasifier
trains)
Peak Season
Syngas
Availability
Peak Season
Power
Availability
Overall Annual
Syngas
Availability
Overall Annual
Power
Availability
1 x 100% 93.0 % 91.1 % 82.8% 81.1 %
2 x 50% 93.1 % 91.2 % 82.4 % 80.8 %
3 x 50% 98.6 % 96.6 % 96.4% 91.5 %
3 x 33% 93.1 % 91.2 % 82.1 % 80.5 %
4 x 33% 97.2 % 95.3 % 94.4 % 89.7 %
Spare Gasifier versus Backup Fuel
There is a strong perception that IGCC plants are unreliable. This perception has developed over time, and for a variety of reasons, but it is simply not valid when considering that the end product of an IGCC plant is power, not syngas. At the Polk plant, syngas availability is around 80% or a little higher. Polk's overall availability will be more like 95% this year, given the fact that the power block can run on either syngas or distillate oil.
Many of the IGCC units being considered today are being proposed as "rate base" units for regulated utilities. From a regulatory perspective, IGCC should have a reliability advantage over other coal based technologies. For the majority of the time, an IGCC unit operates on syngas with low cost feedstocks and low emissions. If syngas is unavailable, the power block can

5-6
continue to operate on backup fuel, and supply power to customers in an extremely reliable manner.
There are advantages to increasing syngas availability to the power block, but the advantages are based on differential fuel cost between syngas and the backup fuel, not on the basis that the reliability of power generation will be increased.
Eastman’s experience with sparing their gasifier shows that scheduled outages are significantly reduced. In addition, many forced outages can be reduced or eliminated by anticipating problems and switching to the spare gasifier. Costs for a spare gasifier can vary from $35 million to $80 million out of a total plant cost of nearly $800 million for a 500 MW plant. With a spare gasifier, coal to electric power availability can move from 80+% to 92 %. A backup fuel can increase overall electric power availability to around 94%. However, the higher cost of natural gas or distillate may result in lower dispatch rates. Natural gas pipeline costs and demand charges may be prohibitive since a very large volume of gas is required, but only for short, intermittent time periods.
EPRI’s UNIRAM computer model was used to assess the availability improvement that could be realized by adding a spare gasifier. The UNIRAM model was based the four basic subsystems on the simplified availability block flow diagram for a two-train (~500 MW) IGCC plant shown earlier in Figure 4-1. In this example, the scheduled outage time was reduced from about 34 days to only 11 days by incorporating a spare gasifier. As a result the equivalent availability of the IGCC power plant increased from 83.4 to 92.3%, as shown in Figure 5-4.
Ultimately, the choice of installing a spare gasifier or utilizing a backup fuel is a utility-specific and site-specific decision.
92.3
83.4
75.0
80.0
85.0
90.0
95.0
100.0
0 5 10 15 20 25 30 35 40 45 50
Scheduled Outage, Days/Year
Equi
vale
nt A
vaila
bilit
y, %
With Spare Gasifier
No Spare Gasifier

5-7
Figure 5.4 Availability Improvement with a Spare Gasifier
Storage of Liquid Oxygen and Liquid Nitrogen
Forced outage rates for air separation plants are typically around 1.0%. The forced outage rate at the Wabash IGCC air separation plant has been running slightly higher at about 1.7%. Over half of the air separation unit trips are usually corrected in less than 8 hours. Incorporating liquid oxygen (LOX) and liquid nitrogen (LIN) storage can reduce the forced outage rate by about 0.5%. The additional capital cost for the LOX and LIN storage, and the required vaporizing facilities, is about $2 million.
EPRI Availability Analysis Cases Studies
EPRI’s UNIRAM computer model was used to assess the sensitivity of overall IGCC equivalent availability to changes in gasifier forced outage rates. The availability block diagram for these sensitivity cases was shown earlier in Figure 4-1. The IGCC plant is a two-train configuration, and was evaluated with and without a spare gasifier. The subsystem reliability assumptions are based on the use of the E-Gas gasifier with forced outage rates of 5 and 10 percent. For the cases with a spare gasifier, the minimum scheduled outage time was assumed to be 263 hours, or a 3 percent scheduled outage rate. The results are summarized in Table 5-2. Decreasing the gasifier FOR from 10 to 5 percent results in a 4.1 percentage point improvement in IGCC equivalent availability for the case without a spare gasifier. However, if a spare gasifier is included, the improvement is only about 1.0 percentage point. This again illustrates that the major benefit of adding a spare gasifier is the reduction in scheduled outage time. The UNIRAM output reports for the cases included in Table 5-2 are included in the Appendix to this report.
Table 5-2 Sensitivity to Gasifier Forced Outage Rates
Inputs Low Gasifier FOR High Gasifier FOR
Case Description EGAS2+0 EGAS2+1 EGAS2+0 EGAS2+1
Planned Outage Hours 1008 263 1008 263
Subsystem Reliability Assumptions
ASU 99.1% 99.1% 99.1% 99.1%
Gasifier 95.0% 95.0% 90.0% 90.0%
Gas Treating & BOP 98.3% 98.3% 98.3% 98.3%
Combined Cycle 98.0% 98.0% 98.0% 98.0%
UNIRAM Equivalent Availability 80.50% 92.34% 76.43% 91.38%

5-8
Table 5-3 Availability Comparison Example
An example comparing the availability for the three major gasification processes, with and without a spare gasifier, is included in Table 5-3. This data was taken from an earlier EPRI utility-specific study and is included here as an example of the availability methodology. The specific data and assumptions used in the table may not be valid today. The methodology assumes that the spare gasifier saves all of the gasifier scheduled outage time and half of the gasifier forced outage time.
Table 5-4 summarizes the availability analysis results from another EPRI utility-specific study. The IGCC plants with refractory-lined gasifiers, CVX and E-Gas, include a spare gasifier due to their higher scheduled outage rates. The base case shown in the table for the Shell gasification process does not include a spare gasifier. The cost of a spare Shell gasifier is significantly higher than the cost of a spare gasifier for the other processes. However, the Shell process requires less scheduled outage time since it has no refractory lining. If the Shell case had included a spare gasifier the availability for the new plant would increase to 91.5%, while the availability for the current plant would increase to 87.3%.
Table 5-4 Overall IGCC Availability Analysis Results
CVX E-Gas ShellW/O Spare 2 x 50%
Gasifier SO Hours / Yr 1008 1008 570Gasifier SO Refractory Hours / yr 336 included includedDownstream SO Hours /yr masked masked maskedTotal SO Hours 1344 1008 570
Gasifier FO Hours/Yr 550 532 570SO + FO Hours 1894 1540 1140
Syngas Availability % 78.4 82.4 87
Coal to Power Availability % 76.0 79.9 84.4With Spare 3 x 50%
Gasifier SO Hours / yr 232 0 0Gasifier SO Refractory Hours / yr included included includedDownstream SO Hours / yr included 84 84Total SO Hours 232 84 84
Gasifier FO Hours/year 275 266 285SO + FO Hours 507 350 369
Syngas Availability % 94.2 96 95.8
Coal to Power Availability % 90.4 91.2 91

5-9

5-10

6-1
6 COMMERCIAL DESIGN OF NEW IGCC PLANTS
Gasifier Sparing and High Availability Design
The next generation of coal IGCC plants will almost certainly be multi-train plants that should provide the economies of scale to compete with 500-1000 MW PC plants. These plants will most likely also have a spare gasifier to ensure a plant availability on syngas > 85%. IGCC Plants based on petroleum residuals adjacent to refineries are also likely to be multi-train with spare gasifier capacity to ensure that the steam and hydrogen supply availability is > 95%. The availability and cost of auxiliary fuels such as natural gas or distillate can also affect the approach taken with regard to sparing of gasification capability.
The current IGCC plant designs are mostly for plants in the 500-800 MW size range. For refractory lined gasifiers such as Texaco and E-Gas the replacement of refractory is needed every 2-3 years. For IGCC plants based on these technologies a spare gasifier is recommended to achieve a target availability >90%. The Shell gasifier does not have this same refractory replacement period and generally has a higher availability. With the high cost of the Shell gasification island (GI) a spare gasifier would be difficult to justifiable however this does result in a slightly lower calculated availability for the Shell IGCC design versus Texaco and E-Gas with a spare gasification train.
The scheduled outages for the Texaco and E-Gas gasifiers are 34-42 days/year (5-6 weeks) without a spare gasifier but only 11-12 days/year (1.5 – 2 weeks) with a spare. Figure 5-4 showed the effect of scheduled outages duration in days/year on equivalent availability. The equivalent availability is typically 81-83% for Texaco and E-Gas (somewhat higher for Shell) without a spare gasifier based on data from the operating IGCC plants when adjusted for lessons learned and which is improved to ~91-93% with a spare gasifier.
Additional Features for New IGCC Plant Designs
Some other probable features for new IGCC plant designs are:
• The ASU will probably be designed to take no more than 50% of its air supply as extraction from the gas turbine compressor. Full integration would adversely affect availability due to the extended star-up time, but obtaining some of the air by extraction from the gas turbine compressor reduces the auxiliary power demand.
• The ASU’s will probably be of higher pressure (HP) design (14 barg or 200 psig) since nitrogen is usually the favored diluent for gas turbine NOx control. The availability of nitrogen at ~5 barg from the HP plant reduces the auxiliary power requirement for the nitrogen compressor.
• Most of the IGCC plants currently being designed are with the use of “F” type gas turbines with firing temperatures of ~1260°C (2300°F). The “G” and “H” gas turbines will offer additional improvements in plant efficiency and reduced capital cost. However, these

6-2
turbines are only now entering the market place in natural gas service and it will probably be a few more years before they will be considered for the IGCC application.
• The GE 7 FA turbines used for most of the recent studies have a gas turbine power output of 197 MW. This power output may be increased in the next few years through introduction of a rotor with increased torque capability. To date the 7 FB has only been sold for the natural gas application however GE may chose to adapt it and offer it for the IGCC syngas application. If successful this would increase the output and efficiency.
• The current designs generally reflect conservative estimates from GE of gas turbine performance on syngas or hydrogen. With the increased mass flow in the IGCC application due to the use of diluents (nitrogen and moisture) for NOx control and because of (in some cases) higher moisture content flue gases GE believes that heat transfer to the turbine blades will be greater. In order to maintain blade temperatures similar to those in NGCC service (where GE offers Long Term Service Agreements (LTSAs)) they have reduced the firing temperature. This adversely affects both gas turbine and steam turbine performance so that the heat rates are typically ~400 Btu/kWh higher than those reported in prior year reports. Many of the previously reported heat rate estimates were based on models that allowed firing temperatures with syngas about the same as for natural gas (i.e. 1288°C or 2350°F)
• IGCC heat rate estimates for the three gasification technologies with syngas heat recovery are in the range of 8300-8700 Btu/kWh with Shell being slightly better, but this heat rate edge does not usually translate to a bottom line COE advantage. However, the current draft of the proposed US Energy Bill contains tax incentives for IGCC plants that can meet certain heat rates. These would obviously favor the higher efficiency IGCC designs and may well change the preferred technology selection. In response to this potential tax incentive Texaco is now reconsidering its IGCC designs with radiant and convective syngas coolers.
• Inclusion of a carbon bed (or other sorbent) for removal of Mercury and other trace elements from the syngas. This would most likely be at the lower temperature of 40°C or less just before to the AGR system. A paper presented by Parsons at the 2002 Gasification Technologies Conference estimated that the additional costs of mercury removal were capital costs of 3-4 $/kW and an additional COE of 0.25$/MWh.
• There is considerable uncertainty about future environmental regulation and the standards that will have to be met. It is assumed that for all coal plants Mercury will have to be >90% removed.
However, there is also some continued uncertainty as to what future NOx standards will be for IGCC. Emissions of <25 ppmv at 15% oxygen in IGCC gas turbine stacks has been amply demonstrated however in several US locations natural gas combined cycle (NGCC) plants are required to have <2 ppmv. Additional work on gas turbine combustors for the syngas application will probably reduce the emissions further and GE plans to achieve 9 ppmv at Motiva. TEC has also achieved <15 ppmv by adding a saturator that adds ~7% moisture to the syngas in addition to the nitrogen dilution already practiced. Selective Catalytic Reduction (SCR) is used in NGCC plants however there is concern that unless the flue gas is completely sulfur free that ammonium sulfate and bisulfate formed from ammonia slip and trace SOx will foul and corrode the HRSG finned exchanger surfaces and cause significant outages. GE has suggested that, if SCR is used, the SOx should be <2pppmv in the flue gas (which is typically equivalent to < 15 ppmv in the clean syngas). This level of sulfur removal can be achieved with high-pressure gasifiers that can use the physical AGR solvents (e.g. Selexol) or with dry coal fed gasifiers (e.g. Shell) that produce a syngas with low CO2 content so that bulk acid gas removal can be used. It also appears

6-3
that for some gasification technologies (e.g. E-Gas if limited to31 barg (450 psig) pressure) considerable increase in capital cost and reduction in net efficiency would occur if <2ppmv of NOx was to become a mandatory requirement and deep sulfur removal was therefore required. One alternative to deep sulfur removal might be to run the SCR sub-stoichiometrically so that there is little or no ammonia slip or chance for ammonium bisulfate formation. GE is strongly making the case that such a stringent NOx emission requirement of <2ppmv is not cost effective in the larger scheme of things.
IGCC Design for CO2 Capture
The possibility of future CO2 removal requirement is also a major unknown. If this is evaluated as a major concern it will affect many aspects of technology selection and IGCC design. The removal of CO2 in an IGCC plant is accomplished by conducting (adding) the shift reaction (CO + H2O = CO2 + H2) on the syngas followed by CO2 removal from the syngas and its compression for use or disposal via pipeline. Design issues relevant to a possible additional phase when CO2 removal for use or disposal and/or hydrogen production is contemplated include the following:
• Combustion Turbine selection
• Combustion Turbine combustor design
• Degree of Integration of Air Separation Unit with Combustion Turbine
• NOx emissions control
• HRSG design and adaptability for integration with gasification
• Gasifier type, pressure and sparing
• Gasifier heat recovery (e.g.Quench versus full heat recovery)
• Gas treating for sulfur and CO2 removal
• Plant plot size and layout provisions for future equipment additions for the Shift and CO2
removal and compression units
• Coal delivery and handling, logistics and infrastructure
• Effect of pre-investment on performance
Since the shift reaction does incur some irreversible thermodynamic losses and reduction in fuel gas heating value additional gasification and ASU capacity is needed to produce enough fuel gas (now essentially mainly hydrogen) to fully load the gas turbine. One of the issues is therefore how and when should this extra capacity be built? Initially or later? It also appears that higher-pressure gasification results in lower additional costs for CO2 removal. However, such designs may not be economically optimal if CO2 removal is not required. There are many such subtleties and potential policy changes that need to be examined as the designs of the next generation of IGCC plants are undertaken.
The phased construction of IGCC with later addition for CO2 capture has been studied under contracts with Parsons and Jacobs Consultancy. Each of the studies evaluates the effect on a standard IGCC design of later adding capture but also evaluates different approaches to degrees of pre-investment on the ultimate cost, performance and COE. These results will be finalized later this year and will enable various scenarios of projected incentive or regulatory timing for

6-4
capture to be evaluated e.g. a net present value of different pre-investment options can be calculated under different scenario assumptions.
The IGCC studies with CO2 capture show a distinct advantage for the Texaco Quench system with much lower added costs than for E-Gas and Shell. At current US coal costs the lower capital Texaco Quench design often has the lowest COE with E-Gas very close. If CO2 capture was required then Texaco quench would be preferred. However Texaco quench has a high heat rate of 9200-9300 Btu/kWh (unless Jacobs claims are substantiated) and if the Energy Bill were passed with the currently drafted heat rate hurdles then it would not qualify for the substantial tax credits. Accordingly, Texaco is now putting forward designs with SGC heat recovery (R and R+C) that should be able to meet some of the heat rate hurdles.
It is ironical that with better heat rates E-Gas and Shell stand a good chance of qualifying for the proposed credits but are technologies that would have to incur much greater added costs for CO2 removal. It will be interesting to see what pressure Texaco proposes for the plants with SGC heat recovery (R and R+C). The thrust of the proposed credits in the Energy Bill ignores the possible issue of CO2 capture yet elsewhere the DOE (e.g. in its briefing for the second CCPI solicitation) asked that any proposed IGCC projects be “CO2 Capture ready” designs. These are challenging times for gasification technology selection in the face of so many uncertainties.

7-1
7 BIBLIOGRAPHY The following sources have provided background material for this report;
Papers from the following EPRI and Gasification Technologies Council (GTC) sponsored annual Conferences on Gasification Technology that are held each October in San Francisco, CA. The papers from the 2002 through 2004 Conferences can be downloaded from the GTC website www.gasification.org. A CD of papers from earlier Conferences can also be ordered from the same website.
• 1998 Gasification Technologies Conference. October 4-7, 1998
• 1999 Gasification Technologies Conference. October 18-21, 1999
• 2000 Gasification Technologies Conference. October 8-11, 2000
• 2001 Gasification Technologies Conference. October 7-10, 2001
• 2002 Gasification Technologies conference. October 27-30, 2002
• 2003 Gasification Technologies Conference October 12-15, 2003
• 2004 Gasification Technologies Conference October 3-6, 2004 (Washington, DC)
Papers from the 2002 5th European Gasification Conference in Noordwijk, The Netherlands and the 6th European Gasification Conference in Brighton, UK can be obtained from the Icheme website www.icheme.org/literature/conferences/gasi/index.htm
The US DOE website www.fetc.doe.gov/coalpower/gasification contains a variety of information on their programs
US DOE Clean Coal Technology Topical Reports
• Number 6 “ The Tampa Electric Integrated Gasification Combined Cycle Project” October 1996
• Number 19 “ The Tampa Electric Integrated Gasification Combined Cycle Project – An Update” July 2000
• Number 7 "The Wabash River Coal Gasification Repowering Project” November 1996
• Number20 "The Wabash River Coal Gasification Repowering Project – An Update” September 2000.
• Number 8 "The Piñon Pine Power Project” December 1996

7-2
Other references included:
1. “Gasification Plant Performance and Cost Optimization”, May 2002, (23 MB). The final report of Task 1 of this comprehensive ($2.4 million) study performed by Global Energy, Nexant and Bechtel under subcontract to the DOE to identify cost savings in the next generation of integrated gasification and coproduction facilities utilizing the E-Gas Technology. Detailed cost estimating by Bechtel.
http://www.netl.doe.gov/coalpower/gasification/projects/systems/docs/40342R01.PDF
2. “Availability Analysis of an Integrated Gasification Combined Cycle”, EPRI, Palo Alto, CA: June 1997, AP-5276.
3. “Gasification Technology Status – September 2004”, EPRI, Palo Alto, CA: 2004. 1009769.

8-1
8 APPENDIX
UNIRAM CASE STUDY OUTPUT REPORTS
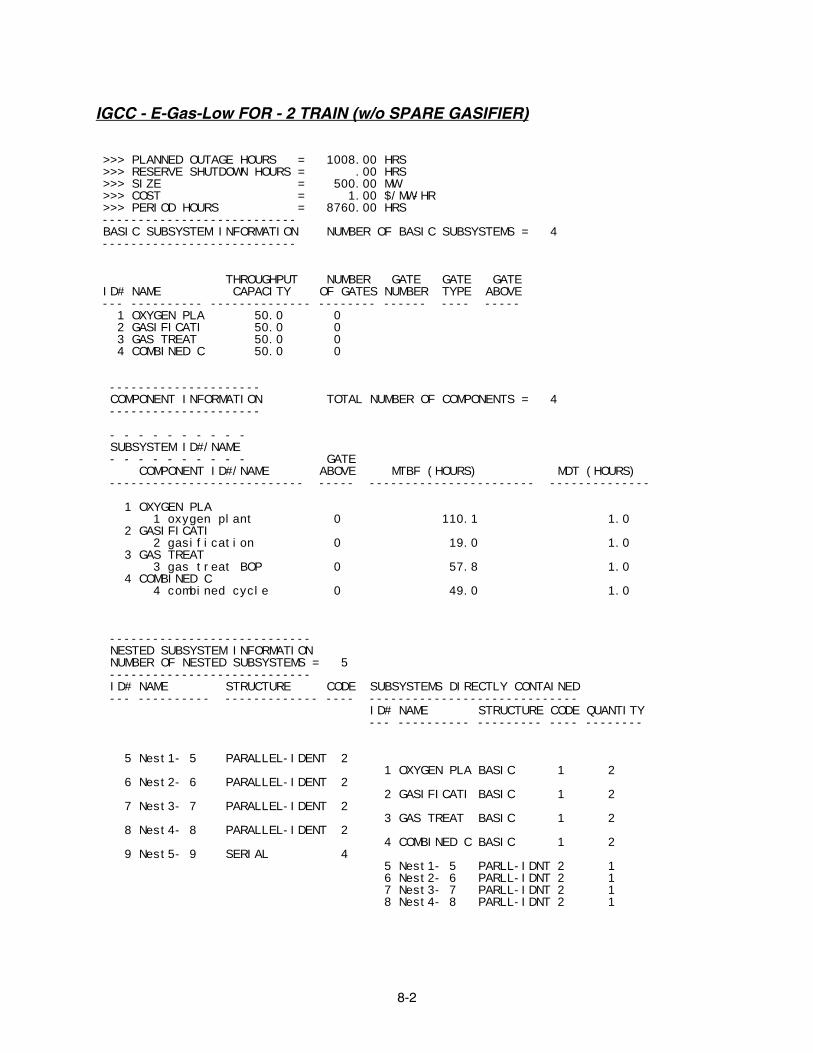
8-2
IGCC - E-Gas-Low FOR - 2 TRAIN (w/o SPARE GASIFIER) >>> PLANNED OUTAGE HOURS = 1008.00 HRS >>> RESERVE SHUTDOWN HOURS = .00 HRS >>> SIZE = 500.00 MW >>> COST = 1.00 $/MW-HR >>> PERIOD HOURS = 8760.00 HRS --------------------------- BASIC SUBSYSTEM INFORMATION NUMBER OF BASIC SUBSYSTEMS = 4 --------------------------- THROUGHPUT NUMBER GATE GATE GATE ID# NAME CAPACITY OF GATES NUMBER TYPE ABOVE --- ---------- -------------- -------- ------ ---- ----- 1 OXYGEN PLA 50.0 0 2 GASIFICATI 50.0 0 3 GAS TREAT 50.0 0 4 COMBINED C 50.0 0 --------------------- COMPONENT INFORMATION TOTAL NUMBER OF COMPONENTS = 4 --------------------- - - - - - - - - - - SUBSYSTEM ID#/NAME - - - - - - - - - - GATE COMPONENT ID#/NAME ABOVE MTBF (HOURS) MDT (HOURS) --------------------------- ----- ----------------------- -------------- 1 OXYGEN PLA 1 oxygen plant 0 110.1 1.0 2 GASIFICATI 2 gasification 0 19.0 1.0 3 GAS TREAT 3 gas treat BOP 0 57.8 1.0 4 COMBINED C 4 combined cycle 0 49.0 1.0 ---------------------------- NESTED SUBSYSTEM INFORMATION NUMBER OF NESTED SUBSYSTEMS = 5 ---------------------------- ID# NAME STRUCTURE CODE SUBSYSTEMS DIRECTLY CONTAINED --- ---------- ------------- ---- ----------------------------- ID# NAME STRUCTURE CODE QUANTITY --- ---------- --------- ---- -------- 5 Nest1- 5 PARALLEL-IDENT 2 1 OXYGEN PLA BASIC 1 2 6 Nest2- 6 PARALLEL-IDENT 2 2 GASIFICATI BASIC 1 2 7 Nest3- 7 PARALLEL-IDENT 2 3 GAS TREAT BASIC 1 2 8 Nest4- 8 PARALLEL-IDENT 2 4 COMBINED C BASIC 1 2 9 Nest5- 9 SERIAL 4 5 Nest1- 5 PARLL-IDNT 2 1 6 Nest2- 6 PARLL-IDNT 2 1 7 Nest3- 7 PARLL-IDNT 2 1 8 Nest4- 8 PARLL-IDNT 2 1

8-3
******************************************** ****************** RUN 1 ****************** ******************************************** BASELINE RUN -------------------------------------------------------- FAULT TREE EVALUATION MEAN TIME MEAN BETWEEN SUBSYSTEM DOWNTIME FAILURES AVAILABILITY (HOURS) (HOURS) -------------------------------------------------------- 1 OXYGEN PLA 1.00 110.11 .9910 2 GASIFICATI 1.00 19.00 .9500 3 GAS TREAT 1.00 57.82 .9830 4 COMBINED C 1.00 49.00 .9800 --------------------------------------- STATE DEFINITIONS WITH CORRESPONDING OUTPUT CAPABILITIES --------------------------------------- CURTAIL- STATE MENT STATE OUTPUT SUBSYSTEM LEVEL AVAILABILITY CAPACITY (PERCENTAGE) (PERCENTAGE) -------------- 5 Nest1- 5 -------------- 0 98.208080 100.00 1 1.783824 50.00 2 .008100 .00 -------------- 6 Nest2- 6 -------------- 0 90.250000 100.00 1 9.500002 50.00 2 .250000 .00 -------------- 7 Nest3- 7 -------------- 0 96.628710 100.00 1 3.342388 50.00 2 .028903 .00 -------------- 8 Nest4- 8 -------------- 0 96.040000 100.00 1 3.919996 50.00 2 .040000 .00 -------------- 9 Nest5- 9 -------------- 0 82.253190 100.00 1 17.420020 50.00 2 .326794 .00

8-4
-------------------------------------------------------------- PLANT OUTPUT STATE OUTPUT DAYS/ POWER (MW) COSTS STATE PROBABILITY CAPABILITY YEAR OUTPUT ($M) -------------------------------------------------------------- 1 82.25% 100.00% 265.68 500.00 3.188 2 17.42% 50.00% 56.27 250.00 .338 3 .33% .00% 1.06 .00 .000 --------------------------------------------------- I PLANT RAM MEASURES I I I I EQUIVALENT I I FORCED FORCED EQUIVALENT I I OUTAGE OUTAGE AVAILABILITY AVAILABILITY I I RATE RATE FACTOR FACTOR I --------------------------------------------------- I .33% 9.04% 80.50% 88.20% I I $ .350M $ 3.526M I --------------------------------------------------- ------------------------------------------- I UNIT-LEVEL R&M VALUES I ------------------------------------------- I UNIT MEAN TIME I MEAN UNIT FULL I I BETWEEN FULL I FORCED OUTAGE I I FORCED OUTAGES I DURATION I I (HOURS) I (HOURS) I ------------------------------------------- I 152.6 I .5 I -------------------------------------------

8-5
IGCC - E-Gas-High FOR - 2 TRAIN (w/o SPARE GASIFIER) >>> PLANNED OUTAGE HOURS = 1008.00 HRS >>> RESERVE SHUTDOWN HOURS = .00 HRS >>> SIZE = 500.00 MW >>> COST = 1.00 $/MW-HR >>> PERIOD HOURS = 8760.00 HRS --------------------------- BASIC SUBSYSTEM INFORMATION NUMBER OF BASIC SUBSYSTEMS = 4 --------------------------- THROUGHPUT NUMBER GATE GATE GATE ID# NAME CAPACITY OF GATES NUMBER TYPE ABOVE --- ---------- -------------- -------- ------ ---- ----- 1 OXYGEN PLA 50.0 0 2 GASIFICATI 50.0 0 3 GAS TREAT 50.0 0 4 COMBINED C 50.0 0 --------------------- COMPONENT INFORMATION TOTAL NUMBER OF COMPONENTS = 4 --------------------- - - - - - - - - - - SUBSYSTEM ID#/NAME - - - - - - - - - - GATE COMPONENT ID#/NAME ABOVE MTBF (HOURS) MDT (HOURS) --------------------------- ----- ----------------------- -------------- 1 OXYGEN PLA 1 oxygen plant 0 110.1 1.0 2 GASIFICATI 2 gasification 0 9.0 1.0 3 GAS TREAT 3 gas treat BOP 0 57.8 1.0 4 COMBINED C 4 combined cycle 0 49.0 1.0 ---------------------------- NESTED SUBSYSTEM INFORMATION NUMBER OF NESTED SUBSYSTEMS = 5 ---------------------------- ID# NAME STRUCTURE CODE SUBSYSTEMS DIRECTLY CONTAINED --- ---------- ------------- ---- ----------------------------- ID# NAME STRUCTURE CODE QUANTITY --- ---------- --------- ---- -------- 5 Nest1- 5 PARALLEL-IDENT 2 1 OXYGEN PLA BASIC 1 2 6 Nest2- 6 PARALLEL-IDENT 2 2 GASIFICATI BASIC 1 2 7 Nest3- 7 PARALLEL-IDENT 2 3 GAS TREAT BASIC 1 2 8 Nest4- 8 PARALLEL-IDENT 2 4 COMBINED C BASIC 1 2 9 Nest5- 9 SERIAL 4 5 Nest1- 5 PARLL-IDNT 2 1 6 Nest2- 6 PARLL-IDNT 2 1 7 Nest3- 7 PARLL-IDNT 2 1 8 Nest4- 8 PARLL-IDNT 2 1

8-6
******************************************** ****************** RUN 1 ****************** ******************************************** BASELINE RUN -------------------------------------------------------- FAULT TREE EVALUATION MEAN TIME MEAN BETWEEN SUBSYSTEM DOWNTIME FAILURES AVAILABILITY (HOURS) (HOURS) -------------------------------------------------------- 1 OXYGEN PLA 1.00 110.11 .9910 2 GASIFICATI 1.00 9.00 .9000 3 GAS TREAT 1.00 57.82 .9830 4 COMBINED C 1.00 49.00 .9800 --------------------------------------- STATE DEFINITIONS WITH CORRESPONDING OUTPUT CAPABILITIES --------------------------------------- CURTAIL- STATE MENT STATE OUTPUT SUBSYSTEM LEVEL AVAILABILITY CAPACITY (PERCENTAGE) (PERCENTAGE) -------------- 5 Nest1- 5 -------------- 0 98.208080 100.00 1 1.783824 50.00 2 .008100 .00 -------------- 6 Nest2- 6 -------------- 0 80.999990 100.00 1 18.000000 50.00 2 1.000000 .00 -------------- 7 Nest3- 7 -------------- 0 96.628710 100.00 1 3.342388 50.00 2 .028903 .00 -------------- 8 Nest4- 8 -------------- 0 96.040000 100.00 1 3.919996 50.00 2 .040000 .00 -------------- 9 Nest5- 9 -------------- 0 73.822800 100.00 1 25.100980 50.00 2 1.076217 .00
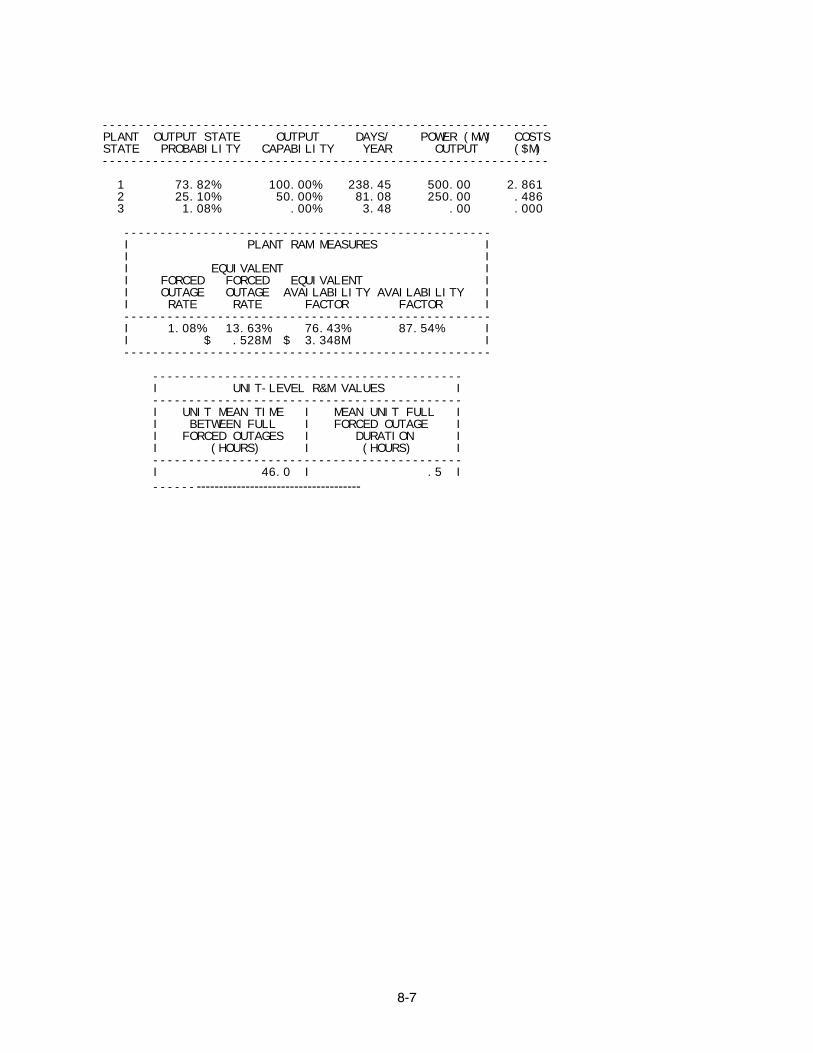
8-7
-------------------------------------------------------------- PLANT OUTPUT STATE OUTPUT DAYS/ POWER (MW) COSTS STATE PROBABILITY CAPABILITY YEAR OUTPUT ($M) -------------------------------------------------------------- 1 73.82% 100.00% 238.45 500.00 2.861 2 25.10% 50.00% 81.08 250.00 .486 3 1.08% .00% 3.48 .00 .000 --------------------------------------------------- I PLANT RAM MEASURES I I I I EQUIVALENT I I FORCED FORCED EQUIVALENT I I OUTAGE OUTAGE AVAILABILITY AVAILABILITY I I RATE RATE FACTOR FACTOR I --------------------------------------------------- I 1.08% 13.63% 76.43% 87.54% I I $ .528M $ 3.348M I --------------------------------------------------- ------------------------------------------- I UNIT-LEVEL R&M VALUES I ------------------------------------------- I UNIT MEAN TIME I MEAN UNIT FULL I I BETWEEN FULL I FORCED OUTAGE I I FORCED OUTAGES I DURATION I I (HOURS) I (HOURS) I ------------------------------------------- I 46.0 I .5 I -------------------------------------------

8-8
IGCC - E-Gas-Low FOR - 2 TRAIN (w/SPARE GASIFIER) >>> PLANNED OUTAGE HOURS = 263.00 HRS >>> RESERVE SHUTDOWN HOURS = .00 HRS >>> SIZE = 500.00 MW >>> COST = 1.00 $/MW-HR >>> PERIOD HOURS = 8760.00 HRS --------------------------- BASIC SUBSYSTEM INFORMATION NUMBER OF BASIC SUBSYSTEMS = 4 --------------------------- THROUGHPUT NUMBER GATE GATE GATE ID# NAME CAPACITY OF GATES NUMBER TYPE ABOVE --- ---------- -------------- -------- ------ ---- ----- 1 OXYGEN PLA 50.0 0 2 GASIFICATI 50.0 0 3 GAS TREAT 50.0 0 4 COMBINED C 50.0 0 --------------------- COMPONENT INFORMATION TOTAL NUMBER OF COMPONENTS = 4 --------------------- - - - - - - - - - - SUBSYSTEM ID#/NAME - - - - - - - - - - GATE COMPONENT ID#/NAME ABOVE MTBF (HOURS) MDT (HOURS) --------------------------- ----- ----------------------- -------------- 1 OXYGEN PLA 1 oxygen plant 0 110.1 1.0 2 GASIFICATI 2 gasification 0 19.0 1.0 3 GAS TREAT 3 gas treat BOP 0 57.8 1.0 4 COMBINED C 4 combined cycle 0 49.0 1.0 ---------------------------- NESTED SUBSYSTEM INFORMATION NUMBER OF NESTED SUBSYSTEMS = 5 ---------------------------- ID# NAME STRUCTURE CODE SUBSYSTEMS DIRECTLY CONTAINED --- ---------- ------------- ---- ----------------------------- ID# NAME STRUCTURE CODE QUANTITY --- ---------- --------- ---- -------- 5 Nest1- 5 PARALLEL-IDENT 2 1 OXYGEN PLA BASIC 1 2 6 Nest2- 6 PARALLEL-IDENT 2 2 GASIFICATI BASIC 1 3 7 Nest3- 7 PARALLEL-IDENT 2 3 GAS TREAT BASIC 1 2 8 Nest4- 8 PARALLEL-IDENT 2 4 COMBINED C BASIC 1 2 9 Nest5- 9 SERIAL 4 5 Nest1- 5 PARLL-IDNT 2 1 6 Nest2- 6 PARLL-IDNT 2 1 7 Nest3- 7 PARLL-IDNT 2 1 8 Nest4- 8 PARLL-IDNT 2 1
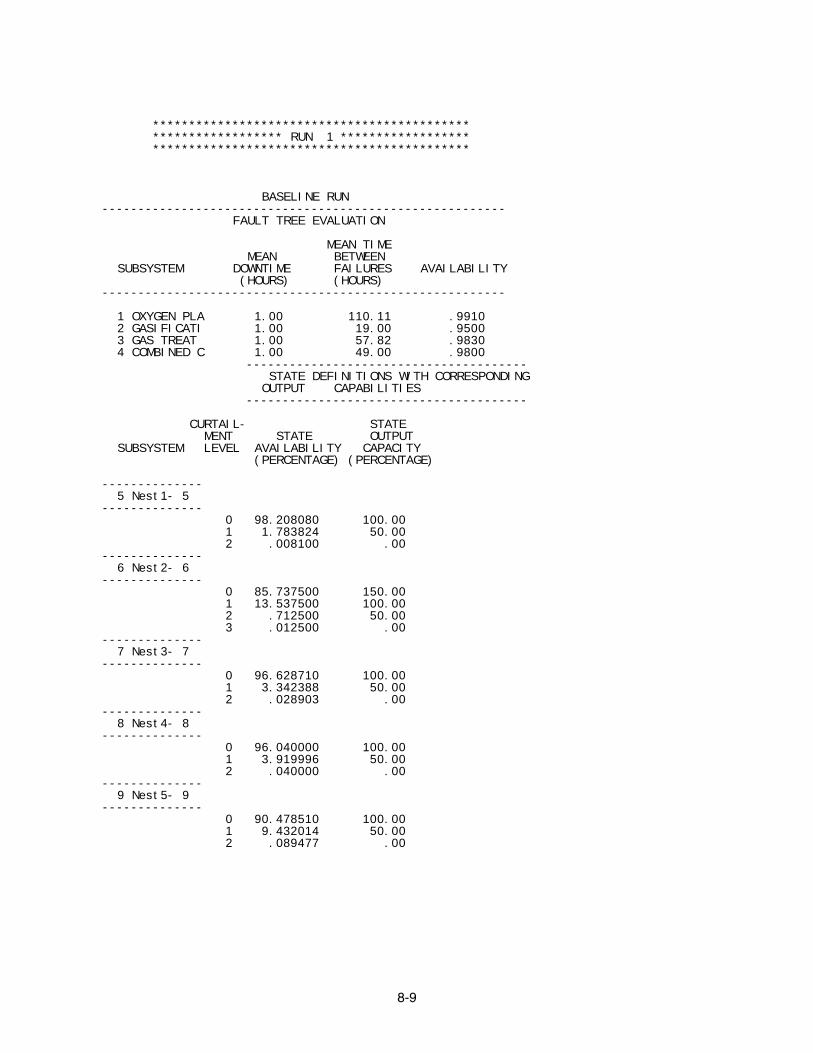
8-9
******************************************** ****************** RUN 1 ****************** ******************************************** BASELINE RUN -------------------------------------------------------- FAULT TREE EVALUATION MEAN TIME MEAN BETWEEN SUBSYSTEM DOWNTIME FAILURES AVAILABILITY (HOURS) (HOURS) -------------------------------------------------------- 1 OXYGEN PLA 1.00 110.11 .9910 2 GASIFICATI 1.00 19.00 .9500 3 GAS TREAT 1.00 57.82 .9830 4 COMBINED C 1.00 49.00 .9800 --------------------------------------- STATE DEFINITIONS WITH CORRESPONDING OUTPUT CAPABILITIES --------------------------------------- CURTAIL- STATE MENT STATE OUTPUT SUBSYSTEM LEVEL AVAILABILITY CAPACITY (PERCENTAGE) (PERCENTAGE) -------------- 5 Nest1- 5 -------------- 0 98.208080 100.00 1 1.783824 50.00 2 .008100 .00 -------------- 6 Nest2- 6 -------------- 0 85.737500 150.00 1 13.537500 100.00 2 .712500 50.00 3 .012500 .00 -------------- 7 Nest3- 7 -------------- 0 96.628710 100.00 1 3.342388 50.00 2 .028903 .00 -------------- 8 Nest4- 8 -------------- 0 96.040000 100.00 1 3.919996 50.00 2 .040000 .00 -------------- 9 Nest5- 9 -------------- 0 90.478510 100.00 1 9.432014 50.00 2 .089477 .00

8-10
-------------------------------------------------------------- PLANT OUTPUT STATE OUTPUT DAYS/ POWER (MW) COSTS STATE PROBABILITY CAPABILITY YEAR OUTPUT ($M) -------------------------------------------------------------- 1 90.48% 100.00% 320.33 500.00 3.844 2 9.43% 50.00% 33.39 250.00 .200 3 .09% .00% .32 .00 .000 --------------------------------------------------- I PLANT RAM MEASURES I I I I EQUIVALENT I I FORCED FORCED EQUIVALENT I I OUTAGE OUTAGE AVAILABILITY AVAILABILITY I I RATE RATE FACTOR FACTOR I --------------------------------------------------- I .09% 4.81% 92.34% 96.91% I I $ .204M $ 4.044M I --------------------------------------------------- ------------------------------------------- I UNIT-LEVEL R&M VALUES I ------------------------------------------- I UNIT MEAN TIME I MEAN UNIT FULL I I BETWEEN FULL I FORCED OUTAGE I I FORCED OUTAGES I DURATION I I (HOURS) I (HOURS) I ------------------------------------------- I 522.0 I .5 I -------------------------------------------

8-11
IGCC - E-Gas-High FOR - 2 TRAIN (w/SPARE GASIFIER) >>> PLANNED OUTAGE HOURS = 263.00 HRS >>> RESERVE SHUTDOWN HOURS = .00 HRS >>> SIZE = 500.00 MW >>> COST = 1.00 $/MW-HR >>> PERIOD HOURS = 8760.00 HRS --------------------------- BASIC SUBSYSTEM INFORMATION NUMBER OF BASIC SUBSYSTEMS = 4 --------------------------- THROUGHPUT NUMBER GATE GATE GATE ID# NAME CAPACITY OF GATES NUMBER TYPE ABOVE --- ---------- -------------- -------- ------ ---- ----- 1 OXYGEN PLA 50.0 0 2 GASIFICATI 50.0 0 3 GAS TREAT 50.0 0 4 COMBINED C 50.0 0 --------------------- COMPONENT INFORMATION TOTAL NUMBER OF COMPONENTS = 4 --------------------- - - - - - - - - - - SUBSYSTEM ID#/NAME - - - - - - - - - - GATE COMPONENT ID#/NAME ABOVE MTBF (HOURS) MDT (HOURS) --------------------------- ----- ----------------------- -------------- 1 OXYGEN PLA 1 oxygen plant 0 110.1 1.0 2 GASIFICATI 2 gasification 0 9.0 1.0 3 GAS TREAT 3 gas treat BOP 0 57.8 1.0 4 COMBINED C 4 combined cycle 0 49.0 1.0 ---------------------------- NESTED SUBSYSTEM INFORMATION NUMBER OF NESTED SUBSYSTEMS = 5 ---------------------------- ID# NAME STRUCTURE CODE SUBSYSTEMS DIRECTLY CONTAINED --- ---------- ------------- ---- ----------------------------- ID# NAME STRUCTURE CODE QUANTITY --- ---------- --------- ---- -------- 5 Nest1- 5 PARALLEL-IDENT 2 1 OXYGEN PLA BASIC 1 2 6 Nest2- 6 PARALLEL-IDENT 2 2 GASIFICATI BASIC 1 3 7 Nest3- 7 PARALLEL-IDENT 2 3 GAS TREAT BASIC 1 2 8 Nest4- 8 PARALLEL-IDENT 2 4 COMBINED C BASIC 1 2 9 Nest5- 9 SERIAL 4 5 Nest1- 5 PARLL-IDNT 2 1 6 Nest2- 6 PARLL-IDNT 2 1 7 Nest3- 7 PARLL-IDNT 2 1 8 Nest4- 8 PARLL-IDNT 2 1

8-12
******************************************** ****************** RUN 1 ****************** ******************************************** BASELINE RUN -------------------------------------------------------- FAULT TREE EVALUATION MEAN TIME MEAN BETWEEN SUBSYSTEM DOWNTIME FAILURES AVAILABILITY (HOURS) (HOURS) -------------------------------------------------------- 1 OXYGEN PLA 1.00 110.11 .9910 2 GASIFICATI 1.00 9.00 .9000 3 GAS TREAT 1.00 57.82 .9830 4 COMBINED C 1.00 49.00 .9800 --------------------------------------- STATE DEFINITIONS WITH CORRESPONDING OUTPUT CAPABILITIES --------------------------------------- CURTAIL- STATE MENT STATE OUTPUT SUBSYSTEM LEVEL AVAILABILITY CAPACITY (PERCENTAGE) (PERCENTAGE) -------------- 5 Nest1- 5 -------------- 0 98.208080 100.00 1 1.783824 50.00 2 .008100 .00 -------------- 6 Nest2- 6 -------------- 0 72.899990 150.00 1 24.300000 100.00 2 2.700001 50.00 3 .100000 .00 -------------- 7 Nest3- 7 -------------- 0 96.628710 100.00 1 3.342388 50.00 2 .028903 .00 -------------- 8 Nest4- 8 -------------- 0 96.040000 100.00 1 3.919996 50.00 2 .040000 .00 -------------- 9 Nest5- 9 -------------- 0 88.587360 100.00 1 11.235720 50.00 2 .176909 .00
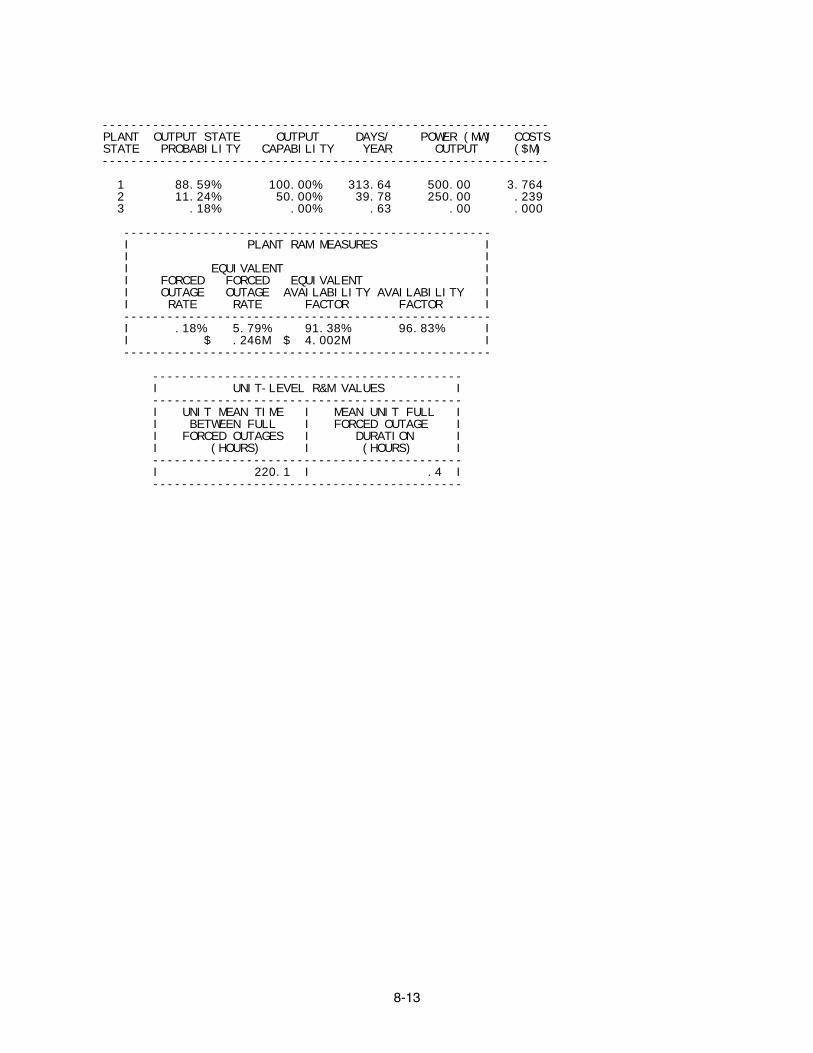
8-13
-------------------------------------------------------------- PLANT OUTPUT STATE OUTPUT DAYS/ POWER (MW) COSTS STATE PROBABILITY CAPABILITY YEAR OUTPUT ($M) -------------------------------------------------------------- 1 88.59% 100.00% 313.64 500.00 3.764 2 11.24% 50.00% 39.78 250.00 .239 3 .18% .00% .63 .00 .000 --------------------------------------------------- I PLANT RAM MEASURES I I I I EQUIVALENT I I FORCED FORCED EQUIVALENT I I OUTAGE OUTAGE AVAILABILITY AVAILABILITY I I RATE RATE FACTOR FACTOR I --------------------------------------------------- I .18% 5.79% 91.38% 96.83% I I $ .246M $ 4.002M I --------------------------------------------------- ------------------------------------------- I UNIT-LEVEL R&M VALUES I ------------------------------------------- I UNIT MEAN TIME I MEAN UNIT FULL I I BETWEEN FULL I FORCED OUTAGE I I FORCED OUTAGES I DURATION I I (HOURS) I (HOURS) I ------------------------------------------- I 220.1 I .4 I -------------------------------------------


EPRI • 3412 Hillview Avenue, Palo Alto, California 94304 • PO Box 10412, Palo Alto, California 94303 • USA 800.313.3774 • 650.855.2121 • [email protected] • www.epri.com
About EPRI
EPRI creates science and technology solutions for the
global energy and energy services industry. U.S.
electric utilities established the Electric Power
Research Institute in 1973 as a nonprofit research
consortium for the benefit of utility members, their
customers, and society. Now known simply as EPRI,
the company provides a wide range of innovative
products and services to more than 1000 energy-
related organizations in 40 countries. EPRI’s
multidisciplinary team of scientists and engineers
draws on a worldwide network of technical and
business expertise to help solve today’s toughest
energy and environmental problems.
EPRI. Electrify the World
Export Control Restrictions Access to and use of EPRI Intellectual Property is granted with the specific understanding and requirement that responsibility for ensuring full compliance with all applicable U.S. and foreign export laws and regulations is being undertaken by you and your company. This includes an obligation to ensure that any individual receiving access hereunder who is not a U.S. citizen or permanent U.S. resident is permitted access under applicable U.S. and foreign export laws and regulations. In the event you are uncertain whether you or your company may lawfully obtain access to this EPRI Intellectual Property, you acknowledge that it is your obligation to consult with your company’s legal counsel to determine whether this access is lawful. Although EPRI may make available on a case by case basis an informal assessment of the applicable U.S. export classification for specific EPRI Intellectual Property, you and your company acknowledge that this assessment is solely for informational purposes and not for reliance purposes. You and your company acknowledge that it is still the obligation of you and your company to make your own assessment of the applicable U.S. export classification and ensure compliance accordingly. You and your company understand and acknowledge your obligations to make a prompt report to EPRI and the appropriate authorities regarding any access to or use of EPRI Intellectual Property hereunder that may be in violation of applicable U.S. or foreign export laws or regulations.
© 2004 Electric Power Research Institute (EPRI), Inc. All rights reserved. Electric Power Research Institute and EPRI are registered service marks of the Electric Power Research Institute, Inc. EPRI. ELECTRIFY THE WORLD is a service mark of the Electric Power Research Institute, Inc.
1008400