epping forest dc air quality annual status report 2016 forest_dc_air_quality_annual... · 2016 air...
TRANSCRIPT
Epping Forest District Council
LAQM Annual Status Report 2016
2016 Air Quality Annual Status Report (ASR) In fulfilment of Part IV of the Environment Act 1995 Local Air Quality Management June 2016

Epping Forest District Council
LAQM Annual Status Report 2016
Local Authority Officer
None
Department Public Health
Address Epping Forest District Council Civic Offices High Street Epping Essex CM16 4BZ
Telephone 01992 564496
E-mail [email protected]
Report Reference number
WK/201621405
Date July 2016

Epping Forest District Council
LAQM Annual Status Report 2016 i
Executive Summary: Air Quality in Our Area Breathing clean air is a crucial part of our health and well-being.
Our atmosphere has always been polluted by natural sources like volcanoes, desert
dust and forest fires, but what concerns us today is man-made pollution and the
impact it has on us, and on our surroundings. Urban air pollution is certainly not a
new problem: the effects of the London smog’s are well documented, and
remembered by many, but today, and in Essex, the biggest source of air pollution is
road traffic.
Air Quality in Epping Forest District Air pollution is associated with a number of adverse health impacts. It is recognised
as a contributing factor in the onset of heart disease and cancer. Additionally, air
pollution particularly affects the most vulnerable in society: children and older people,
and those with heart and lung conditions. There is also often a strong correlation with
equalities issues, because areas with poor air quality are also often the less affluent
areas1,2.
The annual health cost to society of the impacts of particulate matter alone in the UK
is estimated to be around £16 billion3.
The Council continues to monitor air quality across the district, using nitrogen dioxide
as the key air quality indicator. The air quality in the district is reasonably good with
only small pockets of increased concentrations of vehicle emissions related
polutants, limited to congested high street areas and busy junctions. The results for
2015 indicate an overall improvement in terms of a reduction in nitrogen dioxide
concentrations measured. It is not known if this reduction is attributable to actual
improvements in air quality, or the change of Laboratory and diffusion tube
preparation method. The Council retains one small AQMA for the Bell Common
junction, which remains above the 40µg/m3, but now not at risk of exceeding the
hourly average. For details of the AQMA, see:
http://www.essexair.org.uk/AQInEssex/LA/EppingForest.aspx?View=aqma
1 Environmental equity, air quality, socioeconomic status and respiratory health, 2010 2 Air quality and social deprivation in the UK: an environmental inequalities analysis, 2006 3 Defra. Abatement cost guidance for valuing changes in air quality, May 2013

Epping Forest District Council
LAQM Annual Status Report 2016 ii
No new sources of emissions needed to be considered, nor were any new AQMAs
declared. The Council continues to work with out partners including County Council
and the Environment Agency on environmental protection and air quality matters,
and we are about to embark on project with the Corporation of London, Middlesex
University, Essex CC and the Health authority on a research project on the impart of
air pollution on the Forest.
Actions to Improve Air Quality Because the single largest influence on air quality in the District is the motor car, the
Council is generally reliant on national strategies and vehicle emissions regulations
for the improvement of air quality.
Local Priorities and Challenges Particular challenges in the area include the ageing service bus fleet providing
essentially a rural transport service where London transport network ends. This also
means that the motor car remains the first transport choice.
Local priorities remain as the overall improvement of air quality via a variety of
means, including non-specific but health-related activities, raising awareness at the
local level and changing habits.
How to Get Involved Get involved – it’s easy! Ride your bike, walk or scoot to work (have you noticed how
my ‘gown-ups’ have scooters now?), walk your children to school. Make it fun! The
Essex Air Web site can also help you get out and about and involved, see:
http://www.essexair.org.uk/

Epping Forest District Council
LAQM Annual Status Report 2016 iii
Table of Contents Executive Summary: Air Quality in Our Area .......................................................... i
Air Quality in <Local Authority Name> ................................................................................ i
Actions to Improve Air Quality ............................................................................................ ii
Local Priorities and Challenges ......................................................................................... ii
How to Get Involved .......................................................................................................... ii
1 Local Air Quality Management ........................................................................ 1
2 Actions to Improve Air Quality ........................................................................ 2
2.1 Air Quality Management Areas............................................................................... 2
2.2 Progress and Impact of Measures to address Air Quality in Epping Forest
District ............................................................................................................................... 2
2.3 PM2.5 – Local Authority Approach to Reducing Emissions and or
Concentrations .................................................................................................................. 4
3 Air Quality Monitoring Data and Comparison with Air Quality Objectives and National Compliance ...................................................................... 5
3.1 Summary of Monitoring Undertaken ....................................................................... 5
3.1.1 Automatic Monitoring Sites ............................................................................................. 5 3.1.2 Non-Automatic Monitoring Sites ..................................................................................... 5
3.2 Individual Pollutants ............................................................................................... 5
3.2.1 Nitrogen Dioxide (NO2) ................................................................................................... 5 3.2.2 Particulate Matter (PM10) ................................................................................................ 8 3.2.3 Particulate Matter (PM2.5) ............................................................................................... 8 3.2.4 Sulphur Dioxide (SO2) .................................................................................................... 8
Appendix A: Monitoring Results ............................................................................. 9
Appendix B: Full Monthly Diffusion Tube Results for 2015 ................................ 17
Appendix C: Supporting Technical Information / Air Quality Monitoring Data QA/QC ............................................................................................................. 21
Appendix D: Map(s) of Monitoring Locations ....................................................... 23
Appendix E: Summary of Air Quality Objectives in England .............................. 24
Glossary of Terms .................................................................................................. 25
References............................................................................................................... 26
List of Tables Table 2.1 – Declared Air Quality Management Areas ................................................. 2 Table 2.2 – Progress on Measures to Improve Air Quality .......................................... 3

Epping Forest District Council
LAQM Annual Status Report 2016 1
1 Local Air Quality Management This report provides an overview of air quality in the Epping Forest District during
2015. It fulfils the requirements of Local Air Quality Management (LAQM) as set out
in Part IV of the Environment Act (1995) and the relevant Policy and Technical
Guidance documents.
The LAQM process places an obligation on all local authorities to regularly review
and assess air quality in their areas, and to determine whether or not the air quality
objectives are likely to be achieved. Where an exceedance is considered likely the
local authority must declare an Air Quality Management Area (AQMA) and prepare
an Air Quality Action Plan (AQAP) setting out the measures it intends to put in place
in pursuit of the objectives. This Annual Status Report (ASR) is an annual
requirement showing the strategies employed by Epping Forest District Council to
improve air quality and any progress that has been made.
The statutory air quality objectives applicable to LAQM in England can be found in
Table E.1 in Appendix E.

Epping Forest District Council
LAQM Annual Status Report 2016 2
2 Actions to Improve Air Quality 2.1 Air Quality Management Areas Air Quality Management Areas (AQMAs) are declared when there is an exceedance
or likely exceedance of an air quality objective. After declaration, the authority must
prepare an Air Quality Action Plan (AQAP) within 12-18 months setting out measures
it intends to put in place in pursuit of the objectives.
A summary of AQMAs declared by Epping Forest District Council can be found in
Table 2.1. Further information related to the AQMA, including maps of AQMA
boundaries are available online at:
http://www.essexair.org.uk/AQInEssex/LA/EppingForest.aspx?View=aqma
Table 2.1 – Declared Air Quality Management Areas
AQMA Name
Pollutants and Air Quality
Objectives
City / Town One Line Description Action Plan
AQMA Epping Forest District Council No.2
NO2 annual mean Epping
An area encompassing 2 of properties at the junction of Theydon Road and Epping High Road.
District-wide actions. Previous action plan completed. New plan to be finalised.
2.2 Progress and Impact of Measures to address Air Quality in Epping Forest District
Epping Forest District Council has taken forward a number of measures during 2015
in pursuit of improving local air quality. Details of all measures completed, in progress
or planned are set out in Table 2.2.

Epping Forest District Council
LAQM Annual Status Report 2016 3
Table 2.2 – Progress on Measures to Improve Air Quality
Measure No. Measure EU Category EU
Classification Lead Authority Planning Phase
Implementation Phase
Key Performance
Indicator
Target Pollution Reduction in the
AQMA Progress to Date
Estimated Completion
Date Comments
1 Environmental
Permitting inspections
Environmental Permits
Environment charges
through permit systems and
economic instruments
EFDC N/A N/A 100% inspection of inspection due
Applicable to the whole district not just the AQMA
100% to date Ongoing
2
Enhanced particulate controls on
biomass boiler
Environmental Permits
Measures to reduce
pollution through IPPC Permits going beyond BAT
EFDC N/A N/A Permit issued Applicable to the whole district not just the AQMA
Completed May 2016
Energy generation
system also installed
3 Updates to
Essex Air web site
Public information Via the internet Essex Air N/A N/A None
Applicable to the whole district not just the AQMA
Ongoing Ongoing
4 Fleet vehicle standards for
CO2
Promoting Low Emission Transport
Company Vehicle
Procurement -Prioritising
uptake of low emission vehicles
EFDC TBC TBC TBC Applicable to the whole district not just the AQMA
Email exchanges
5
Natural Capital Asset Check
with a focus on Air Quality
Policy Guidance and
Development Control
Regional Groups Co-ordinating programmes to develop Area wide Strategies to reduce emissions and improve air quality
Essex County Council TBC TBC TBC
Applicable to the whole district not just the AQMA
Scoping project

Epping Forest District Council
LAQM Annual Status Report 2016
2.3 PM2.5 – Local Authority Approach to Reducing Emissions and or Concentrations
As detailed in Policy Guidance LAQM.PG16 (Chapter 7), local authorities are
expected to work towards reducing emissions and/or concentrations of PM2.5
(particulate matter with an aerodynamic diameter of 2.5µm or less). There is clear
evidence that PM2.5 has a significant impact on human health, including premature
mortality, allergic reactions, and cardiovascular diseases.
Epping Forest District Council is taking the following measures to address PM2.5:
Ø Effective regulation of Part B and Part A2 regulated activities, including regular
reviews for unregulated activities.
Ø Effective regulation of solvent emission activities.
Ø Middlesex University research project likely to include PM2.5 element.
Ø Natural Capital Asset Check with a focus on Air Quality.

Epping Forest District Council
LAQM Annual Status Report 2016
3 Air Quality Monitoring Data and Comparison with Air Quality Objectives and National Compliance 3.1 Summary of Monitoring Undertaken This section sets out what monitoring has taken place and how it compares with
objectives.
3.1.1 Automatic Monitoring Sites
Epping Forest District Council did not undertake automatic (continuous) monitoring at
any location in the district during 2015. National monitoring results are available at
http://laqm.defra.gov.uk/review-and-assessment/tools/background-maps.html
3.1.2 Non-Automatic Monitoring Sites
Epping Forest District Council undertook non- automatic (passive) monitoring of NO2
at 25 sites during 2015. Table A.1 – Details of Non-Automatic Monitoring Sites in
Appendix A shows the details of the sites.
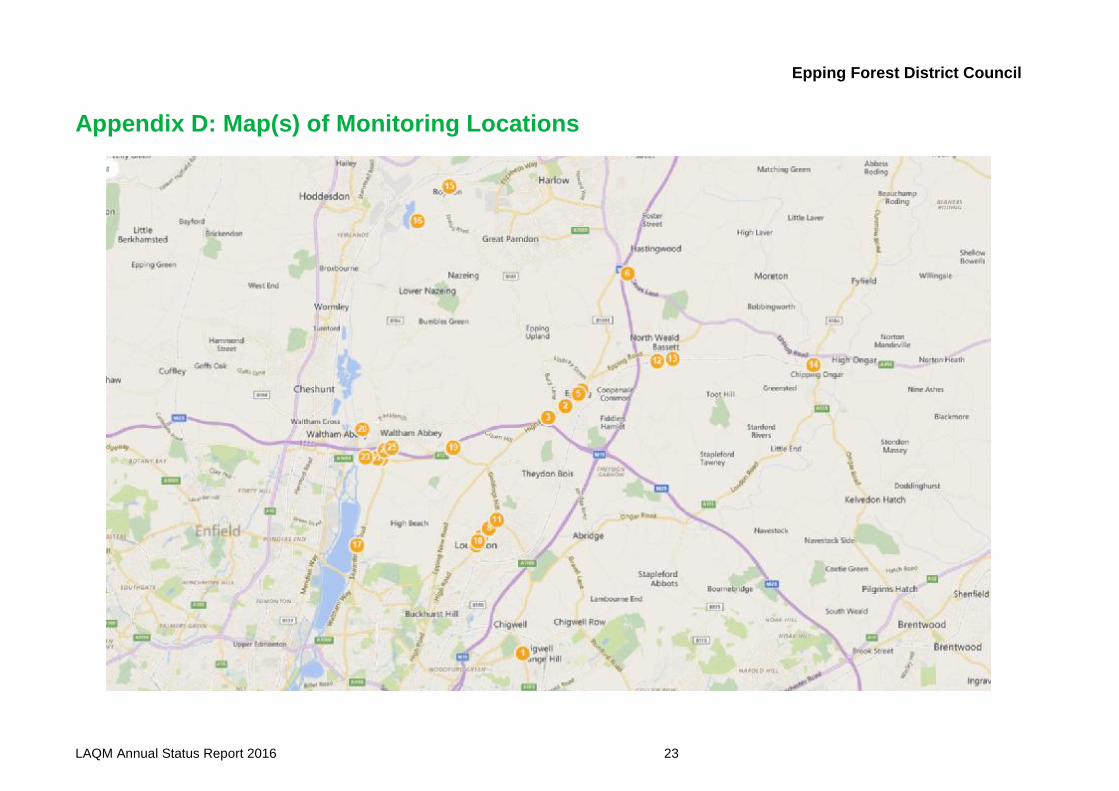
Maps showing the location of the monitoring sites can be seen on the EssexAir web
site: http://www.essexair.org.uk/AQInEssex/LA/EppingForest.aspx?View=diffusion
Further details on Quality Assurance/Quality Control (QA/QC) and bias adjustment
for the diffusion tubes are included in Appendix C.
3.2 Individual Pollutants The air quality monitoring results presented in this section are, where relevant,
adjusted for “annualisation” and bias. Further details on adjustments are provided in
Appendix C.
3.2.1 Nitrogen Dioxide (NO2)

Epping Forest District Council
LAQM Annual Status Report 2016
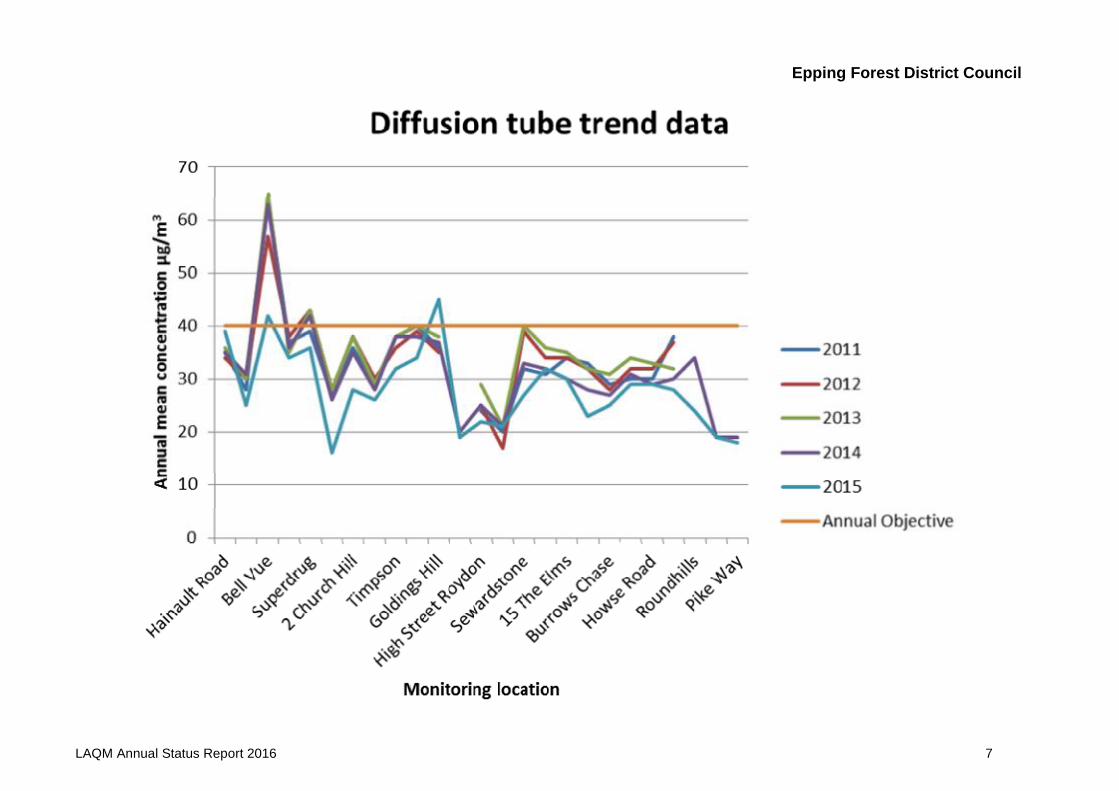
Table A.2 in Appendix A compares the bias adjusted monitored NO2 annual mean
concentrations for the past 5 years with the air quality objective of 40µg/m3.
For diffusion tubes, the full 2015 dataset of monthly mean values is provided in
Appendix B. Contractual arrangements with diffusion tube suppler meant that data for
2015 was April to December inclusive. ESG provided all diffusion tubes in this period,
using the 50% TEA in acetone method. There was however sufficient data capture,
meaning that results did not need to be annualised.
All bias adjusted annual averages were below the 40µg/m3 annual average
objective, save for the following exceptions:
Ø Site 3: Epping, Bell Vue (42µg/m3)
Ø Site 11: Goldings Hill (45µg/m3)
Bell Vue is the exisiting AQMA. Receptors at Goldings Hill are set back from the
diffusion tube location. When adjusted for distnace, the annual average becomes
37.4µg/m3, which is below the annual average objective. The distance adjustment
can be found in Appendix C.
No location returned an annual mean greater than 60µg/m3, which indicates that an
exceedance of the 1-hour mean objective is unlikely at any sensitive receptor.
Epping Forest District Council
LAQM Annual Status Report 2016 7
Epping Forest District Council
LAQM Annual Status Report 2016
3.2.2 Particulate Matter (PM10)
PM10 monitoring is not undertaken in the district.
3.2.3 Particulate Matter (PM2.5)
PM2.5 monitoring is not undertaken in the district, and because PM10 monitoring is not
undertaken either, it is not possible to estimate PM2.5 from PM10 measurements.
3.2.4 Sulphur Dioxide (SO2)
Sulphur dioxide monitoring is not undertaken in the district.
Epping Forest District Council
LAQM Annual Status Report 2016 9
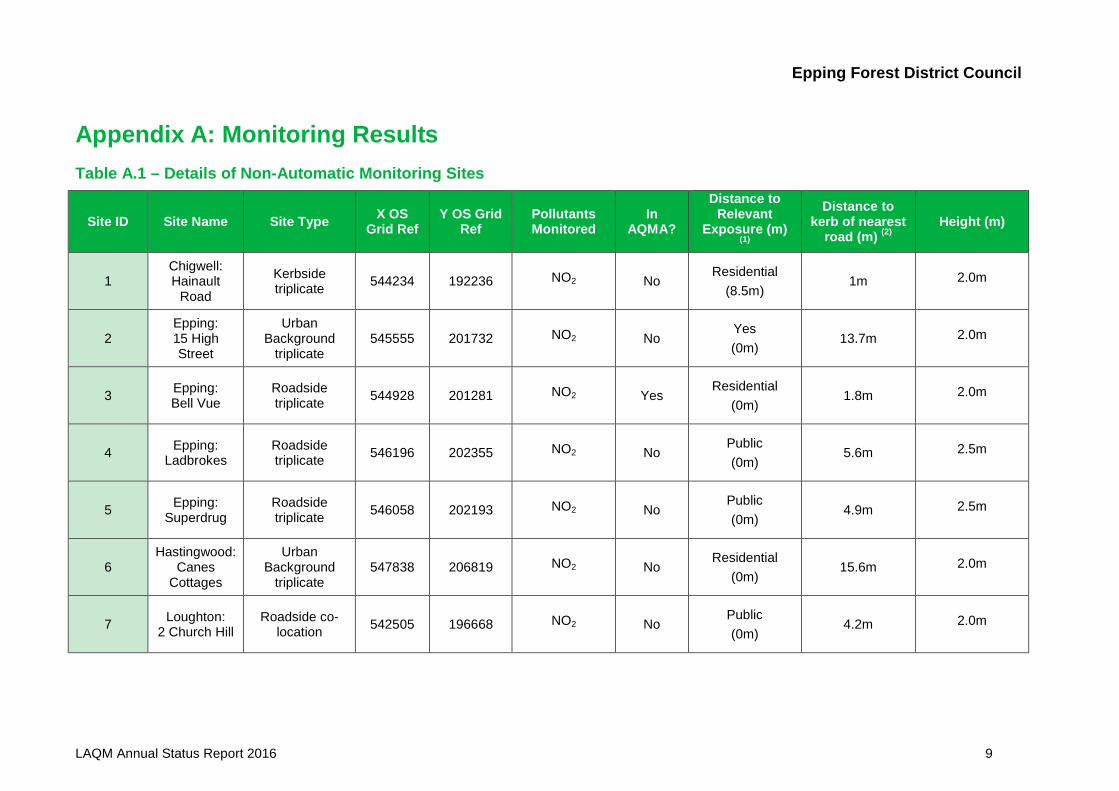
Appendix A: Monitoring Results Table A.1 – Details of Non-Automatic Monitoring Sites
Site ID Site Name Site Type X OS Grid Ref
Y OS Grid Ref
Pollutants Monitored
In AQMA?
Distance to Relevant
Exposure (m) (1)
Distance to kerb of nearest
road (m) (2) Height (m)
1 Chigwell: Hainault
Road
Kerbside triplicate 544234 192236 NO2 No
Residential (8.5m)
1m 2.0m
2 Epping: 15 High Street
Urban Background
triplicate 545555 201732 NO2 No
Yes (0m)
13.7m 2.0m
3 Epping: Bell Vue
Roadside triplicate 544928 201281 NO2 Yes
Residential (0m)
1.8m 2.0m
4 Epping: Ladbrokes
Roadside triplicate 546196 202355 NO2 No
Public (0m)
5.6m 2.5m
5 Epping: Superdrug
Roadside triplicate 546058 202193 NO2 No
Public (0m)
4.9m 2.5m
6 Hastingwood:
Canes Cottages
Urban Background
triplicate 547838 206819 NO2 No
Residential (0m)
15.6m 2.0m
7 Loughton: 2 Church Hill
Roadside co-location 542505 196668 NO2 No
Public (0m)
4.2m 2.0m

Epping Forest District Council
LAQM Annual Status Report 2016 10
Site ID Site Name Site Type X OS Grid Ref
Y OS Grid Ref
Pollutants Monitored
In AQMA?
Distance to Relevant
Exposure (m) (1)
Distance to kerb of nearest
road (m) (2) Height (m)
8 Loughton: 72 Church
Hill
Urban Background co-
location 542664 196868 NO2 No
Residential (0m)
12.7m 2.0m
9
Loughton: 249 High
Road (Timpson)
Roadside triplicate 542339 196360 NO2 No
Public (0m)
6.4m 2.0m
10 Loughton: 252 High
Road (P!nk)
Roadside duplicate 542373 196478 NO2 No
Public (0m)
5.7m 2.0m
11 Loughton: Goldings Hill
Roadside co-location 543091 197316 NO2 No
Residential (4.8m)
1m 2.0m
12 North Weald:
Tempest Mead
Urban Background
triplicate 549648 203671 NO2 No
Residential (4.2m)
1.0m 2.0m
13 Roydon: High Street
Roadside triplicate 540919 209956 NO2 No
Residential (0.75m)
2.5m 2.0m
14 Roydon:
Netherhall Lane
Urban Background
triplicate 539711 208662 NO2 No
Background (16m)
1.7m 2.0m
15 Sewardstone:
Albion Terrace
Roadside co-location 537727 196187 NO2 No
Residential (3.1m)
4.6m 2.0m
16 Waltham Abbey:
13 The Elms
Urban Background
triplicate 541308 200037 NO2 No
Residential (0m)
36.6m 2.0m

Epping Forest District Council
LAQM Annual Status Report 2016 11
Site ID Site Name Site Type X OS Grid Ref
Y OS Grid Ref
Pollutants Monitored
In AQMA?
Distance to Relevant
Exposure (m) (1)
Distance to kerb of nearest
road (m) (2) Height (m)
17 Waltham Abbey:
15 The Elms
Urban Background
triplicate 541320 200020 NO2 No
Residential (0m)
55.8m 2.0m
18 Waltham Abbey:
Abbeyview
Urban Background co-
location 537808 200644 NO2 No
Residential (6.1m)
24m 2.0m
19
Waltham Abbey: Burrows Chase
Urban Background co-
location 538570 199509 NO2 No
Residential (0m)
14.6m 2.0m
20
Waltham Abbey: Hayden Road
Urban Background co-
location 538386 199557 NO2 No Residential
(0m) 12m 2.0m
21 Waltham Abbey:
Howse Road
Urban Background co-
location 537956 199565 NO2 No Residential
(0m) 19m 2.0m
22 Waltham Abbey:
Lodge Lane
Roadside triplicate 538710 199860 NO2 No
Residential (7.3m)
0.5m 2.0m
23 Waltham Abbey:
Roundhills
Urban Background co-
location 538954 199973 NO2 No
Residential (6.7m)
1.0m 2.0m
24 Ongar: Marks
Avenue
Urban Background
triplicate 555074 203600 NO2 No
Residential (0m)
0.5m 2.0m
Epping Forest District Council
LAQM Annual Status Report 2016 12
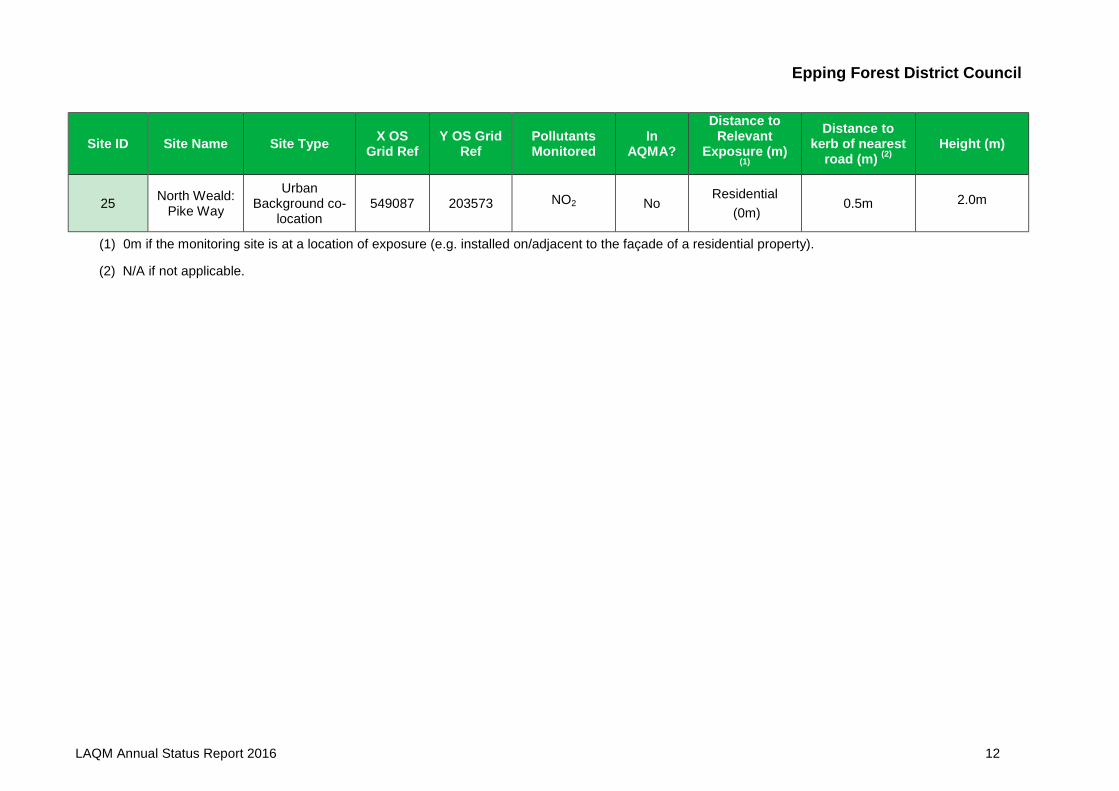
Site ID Site Name Site Type X OS Grid Ref
Y OS Grid Ref
Pollutants Monitored
In AQMA?
Distance to Relevant
Exposure (m) (1)
Distance to kerb of nearest
road (m) (2) Height (m)
25 North Weald: Pike Way
Urban Background co-
location 549087 203573 NO2 No
Residential (0m)
0.5m 2.0m
(1) 0m if the monitoring site is at a location of exposure (e.g. installed on/adjacent to the façade of a residential property).
(2) N/A if not applicable.
Epping Forest District Council
LAQM Annual Status Report 2016 13
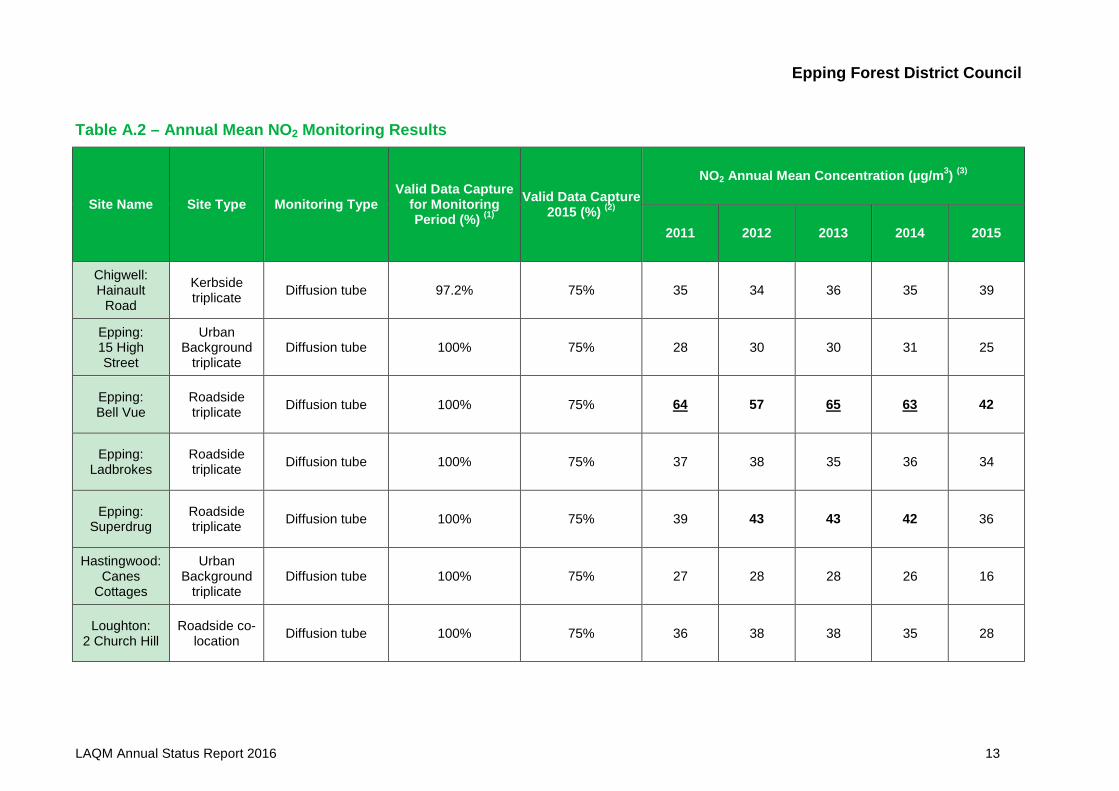
Table A.2 – Annual Mean NO2 Monitoring Results
Site Name Site Type Monitoring Type Valid Data Capture
for Monitoring Period (%) (1)
Valid Data Capture 2015 (%) (2)
NO2 Annual Mean Concentration (µg/m3) (3)
2011 2012 2013 2014 2015
Chigwell: Hainault
Road
Kerbside triplicate Diffusion tube 97.2% 75% 35 34 36 35 39
Epping: 15 High Street
Urban Background
triplicate Diffusion tube 100% 75% 28 30 30 31 25
Epping: Bell Vue
Roadside triplicate Diffusion tube 100% 75% 64 57 65 63 42
Epping: Ladbrokes
Roadside triplicate Diffusion tube 100% 75% 37 38 35 36 34
Epping: Superdrug
Roadside triplicate Diffusion tube 100% 75% 39 43 43 42 36
Hastingwood: Canes
Cottages
Urban Background
triplicate Diffusion tube 100% 75% 27 28 28 26 16
Loughton: 2 Church Hill
Roadside co-location Diffusion tube 100% 75% 36 38 38 35 28

Epping Forest District Council
LAQM Annual Status Report 2016 14
Site Name Site Type Monitoring Type Valid Data Capture
for Monitoring Period (%) (1)
Valid Data Capture 2015 (%) (2)
NO2 Annual Mean Concentration (µg/m3) (3)
2011 2012 2013 2014 2015
Loughton: 72 Church
Hill
Urban Background co-location
Diffusion tube 95.8% 75% 29 30 29 28 26
Loughton: 249 High
Road (Timpson)
Roadside triplicate Diffusion tube 100% 75% 38 36 38 38 32
Loughton: 252 High
Road (P!nk)
Roadside duplicate Diffusion tube 100% 75% 40 39 40 38 34
Loughton: Goldings Hill
Roadside co-location Diffusion tube 100% 75% 36 35 38 37 45
North Weald: Tempest
Mead
Urban Background
triplicate Diffusion tube 100% 75% - - - 20 19
Roydon: High Street
Roadside triplicate Diffusion tube 100% 75% 24 25 29 25 22
Roydon: Netherhall
Lane
Urban Background
triplicate Diffusion tube 100% 75% 20 17 21 21 21
Sewardstone: Albion
Terrace
Roadside co-location Diffusion tube 100% 75% 32 39 40 33 27

Epping Forest District Council
LAQM Annual Status Report 2016 15
Site Name Site Type Monitoring Type Valid Data Capture
for Monitoring Period (%) (1)
Valid Data Capture 2015 (%) (2)
NO2 Annual Mean Concentration (µg/m3) (3)
2011 2012 2013 2014 2015
Waltham Abbey:
13 The Elms
Urban Background
triplicate Diffusion tube 100% 75% 31 34 36 32 32
Waltham Abbey:
15 The Elms
Urban Background
triplicate Diffusion tube 100% 75% 34 34 35 30 30
Waltham Abbey:
Abbeyview
Urban Background co-location
Diffusion tube 100% 75% 33 32 32 28 23
Waltham Abbey: Burrows Chase
Urban Background co-location
Diffusion tube 100% 75% 29 28 31 27 25
Waltham Abbey:
Hayden Road
Urban Background co-location
Diffusion tube 100% 75% 30 32 34 31 29
Waltham Abbey:
Howse Road
Urban Background co-location
Diffusion tube 100% 75% 30 32 33 29 29
Waltham Abbey:
Lodge Lane
Roadside triplicate Diffusion tube 100% 75% 38 37 32 30 28
Waltham Abbey:
Roundhills
Urban Background co-location
Diffusion tube 100% 75% - - - 34 24
Epping Forest District Council
LAQM Annual Status Report 2016 16
Site Name Site Type Monitoring Type Valid Data Capture
for Monitoring Period (%) (1)
Valid Data Capture 2015 (%) (2)
NO2 Annual Mean Concentration (µg/m3) (3)
2011 2012 2013 2014 2015
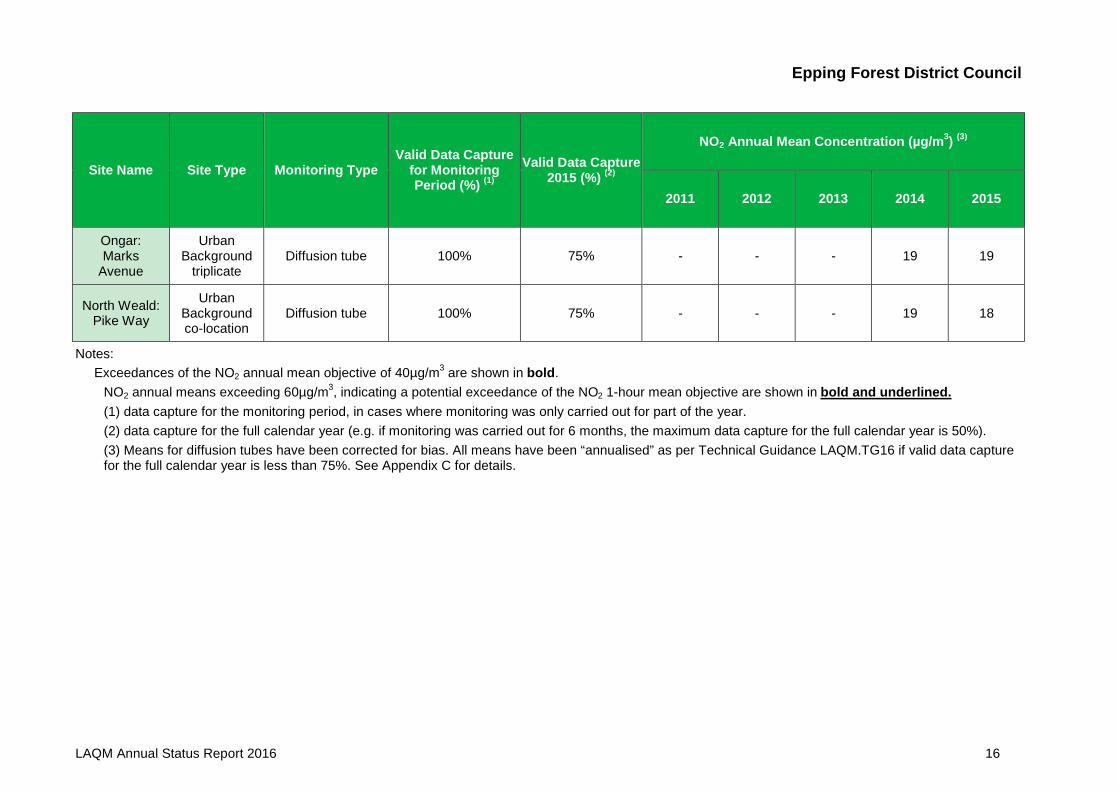
Ongar: Marks
Avenue
Urban Background
triplicate Diffusion tube 100% 75% - - - 19 19
North Weald: Pike Way
Urban Background co-location
Diffusion tube 100% 75% - - - 19 18
Notes: Exceedances of the NO2 annual mean objective of 40µg/m3 are shown in bold. NO2 annual means exceeding 60µg/m3, indicating a potential exceedance of the NO2 1-hour mean objective are shown in bold and underlined.
(1) data capture for the monitoring period, in cases where monitoring was only carried out for part of the year. (2) data capture for the full calendar year (e.g. if monitoring was carried out for 6 months, the maximum data capture for the full calendar year is 50%). (3) Means for diffusion tubes have been corrected for bias. All means have been “annualised” as per Technical Guidance LAQM.TG16 if valid data capture for the full calendar year is less than 75%. See Appendix C for details.
Epping Forest District Council
LAQM Annual Status Report 2016 17
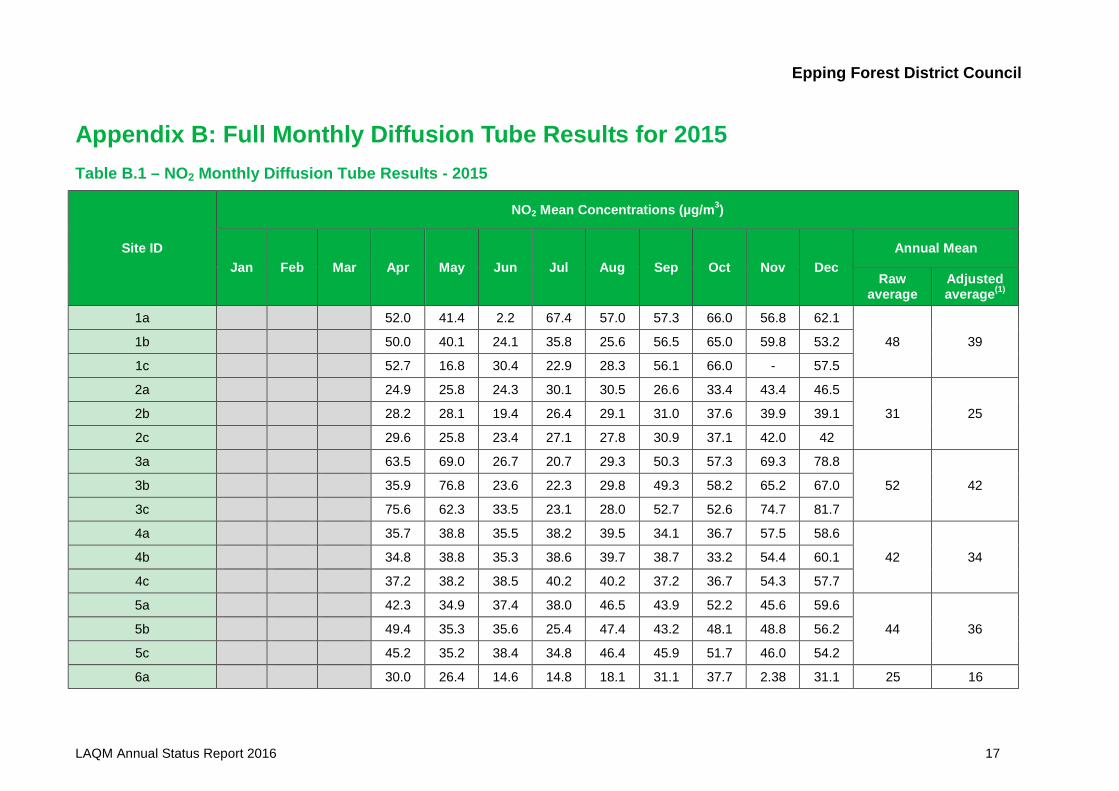
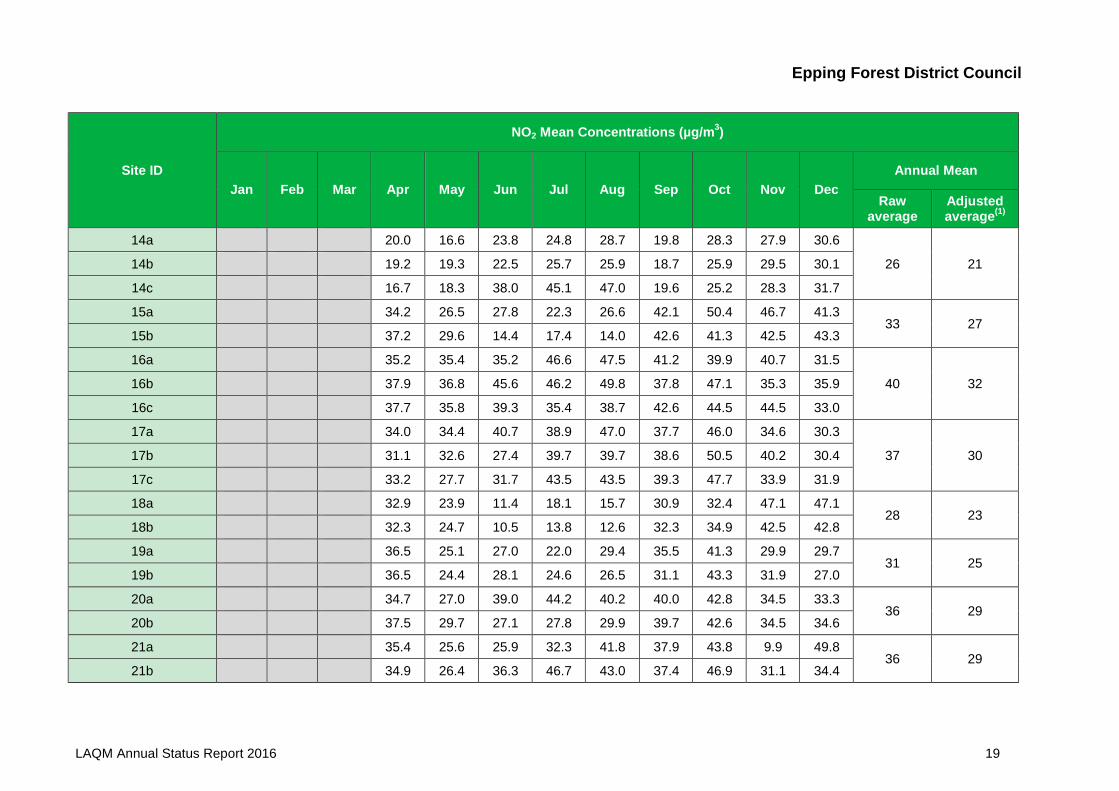
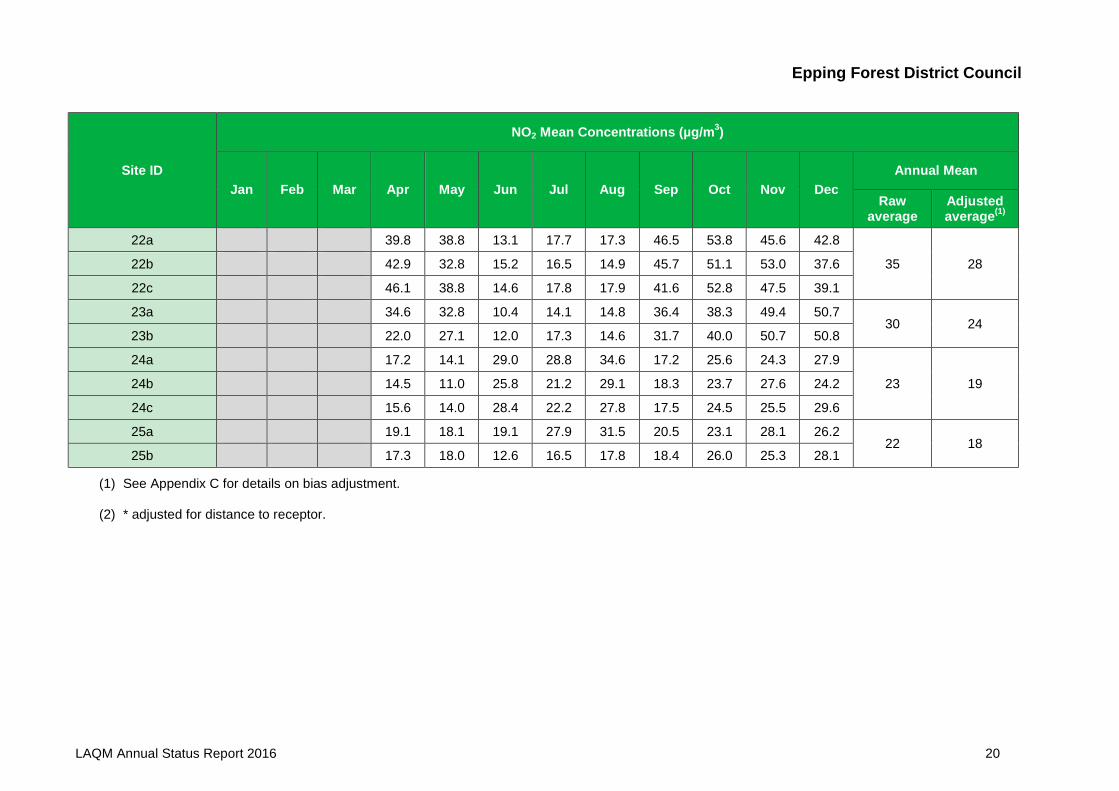
Appendix B: Full Monthly Diffusion Tube Results for 2015 Table B.1 – NO2 Monthly Diffusion Tube Results - 2015
Site ID
NO2 Mean Concentrations (µg/m3)
Jan Feb Mar Apr May Jun Jul Aug Sep Oct Nov Dec Annual Mean
Raw average
Adjusted average(1)
1a 52.0 41.4 2.2 67.4 57.0 57.3 66.0 56.8 62.1
48 39 1b 50.0 40.1 24.1 35.8 25.6 56.5 65.0 59.8 53.2
1c 52.7 16.8 30.4 22.9 28.3 56.1 66.0 - 57.5
2a 24.9 25.8 24.3 30.1 30.5 26.6 33.4 43.4 46.5
31 25 2b 28.2 28.1 19.4 26.4 29.1 31.0 37.6 39.9 39.1
2c 29.6 25.8 23.4 27.1 27.8 30.9 37.1 42.0 42
3a 63.5 69.0 26.7 20.7 29.3 50.3 57.3 69.3 78.8
52 42 3b 35.9 76.8 23.6 22.3 29.8 49.3 58.2 65.2 67.0
3c 75.6 62.3 33.5 23.1 28.0 52.7 52.6 74.7 81.7
4a 35.7 38.8 35.5 38.2 39.5 34.1 36.7 57.5 58.6
42 34 4b 34.8 38.8 35.3 38.6 39.7 38.7 33.2 54.4 60.1
4c 37.2 38.2 38.5 40.2 40.2 37.2 36.7 54.3 57.7
5a 42.3 34.9 37.4 38.0 46.5 43.9 52.2 45.6 59.6
44 36 5b 49.4 35.3 35.6 25.4 47.4 43.2 48.1 48.8 56.2
5c 45.2 35.2 38.4 34.8 46.4 45.9 51.7 46.0 54.2
6a 30.0 26.4 14.6 14.8 18.1 31.1 37.7 2.38 31.1 25 16

Epping Forest District Council
LAQM Annual Status Report 2016 18
Site ID
NO2 Mean Concentrations (µg/m3)
Jan Feb Mar Apr May Jun Jul Aug Sep Oct Nov Dec Annual Mean
Raw average
Adjusted average(1)
6b 25.6 29.9 14.2 16.3 118.0 30.5 37.4 18.3 31.7
6c 30.8 22.5 15.6 19.3 23.6 30.6 38.4 27.0 33.2
7a 32.9 26.9 31.4 39.6 33.9 33.9 40.9 36.6 37.0 35 28
7b 30.3 26.5 37.3 32.6 33.0 30.4 43.0 38.6 37.4
8a 34.2 27.5 24.4 22.0 34.2 30.2 35.8 36.7 33.3 32 26
8b 31.2 24.5 23.1 - 33.1 26.9 37.5 37.1 35.6
9a 42.2 37.4 33.0 36.8 36.2 41.5 46.3 37.1 55.1
40 32 9b 47.3 36.2 20.7 35.7 34.7 40.7 52.9 44.6 47.4
9c 46.7 38.4 26.7 32.2 38.4 41.6 42.8 45.0 52.6
10a 46.1 44.8 31.6 29.2 31.9 49.6 48.6 51.5 51.8 42 34
10b 38.9 36.4 37.6 35.3 33.3 45.8 42.1 47.8 50.0
11a 50.2 41.3 52.7 61.1 60.1 58.1 54.4 55.3 55.8 55 45 (37.4)*
11b 54.6 42.9 55.3 79.1 58.2 56.1 66.4 45.4 41.9
12a 18.2 15.8 18.8 23.4 31.9 20.4 27.4 26.1 29.7
24 19 12b 15.1 15.0 24.6 30.1 30.2 18.6 23.7 26.2 28.1
12c 18.0 15.5 28.0 32.8 36.3 17.8 23.9 26.8 26.9
13a 25.8 17.8 19.5 18.4 19.9 27.0 36.3 34.9 33.7
27 22 13b 26.5 21.9 21.9 19.8 24.6 29.5 34.8 33.4 35.6
13c 22.4 22.3 25.0 25.0 27.3 30.5 38.1 31.2 31.8
Epping Forest District Council
LAQM Annual Status Report 2016 19
Site ID
NO2 Mean Concentrations (µg/m3)
Jan Feb Mar Apr May Jun Jul Aug Sep Oct Nov Dec Annual Mean
Raw average
Adjusted average(1)
14a 20.0 16.6 23.8 24.8 28.7 19.8 28.3 27.9 30.6
26 21 14b 19.2 19.3 22.5 25.7 25.9 18.7 25.9 29.5 30.1
14c 16.7 18.3 38.0 45.1 47.0 19.6 25.2 28.3 31.7
15a 34.2 26.5 27.8 22.3 26.6 42.1 50.4 46.7 41.3 33 27
15b 37.2 29.6 14.4 17.4 14.0 42.6 41.3 42.5 43.3
16a 35.2 35.4 35.2 46.6 47.5 41.2 39.9 40.7 31.5
40 32 16b 37.9 36.8 45.6 46.2 49.8 37.8 47.1 35.3 35.9
16c 37.7 35.8 39.3 35.4 38.7 42.6 44.5 44.5 33.0
17a 34.0 34.4 40.7 38.9 47.0 37.7 46.0 34.6 30.3
37 30 17b 31.1 32.6 27.4 39.7 39.7 38.6 50.5 40.2 30.4
17c 33.2 27.7 31.7 43.5 43.5 39.3 47.7 33.9 31.9
18a 32.9 23.9 11.4 18.1 15.7 30.9 32.4 47.1 47.1 28 23
18b 32.3 24.7 10.5 13.8 12.6 32.3 34.9 42.5 42.8
19a 36.5 25.1 27.0 22.0 29.4 35.5 41.3 29.9 29.7 31 25
19b 36.5 24.4 28.1 24.6 26.5 31.1 43.3 31.9 27.0
20a 34.7 27.0 39.0 44.2 40.2 40.0 42.8 34.5 33.3 36 29
20b 37.5 29.7 27.1 27.8 29.9 39.7 42.6 34.5 34.6
21a 35.4 25.6 25.9 32.3 41.8 37.9 43.8 9.9 49.8 36 29
21b 34.9 26.4 36.3 46.7 43.0 37.4 46.9 31.1 34.4
Epping Forest District Council
LAQM Annual Status Report 2016 20
Site ID
NO2 Mean Concentrations (µg/m3)
Jan Feb Mar Apr May Jun Jul Aug Sep Oct Nov Dec Annual Mean
Raw average
Adjusted average(1)
22a 39.8 38.8 13.1 17.7 17.3 46.5 53.8 45.6 42.8
35 28 22b 42.9 32.8 15.2 16.5 14.9 45.7 51.1 53.0 37.6
22c 46.1 38.8 14.6 17.8 17.9 41.6 52.8 47.5 39.1
23a 34.6 32.8 10.4 14.1 14.8 36.4 38.3 49.4 50.7 30 24
23b 22.0 27.1 12.0 17.3 14.6 31.7 40.0 50.7 50.8
24a 17.2 14.1 29.0 28.8 34.6 17.2 25.6 24.3 27.9
23 19 24b 14.5 11.0 25.8 21.2 29.1 18.3 23.7 27.6 24.2
24c 15.6 14.0 28.4 22.2 27.8 17.5 24.5 25.5 29.6
25a 19.1 18.1 19.1 27.9 31.5 20.5 23.1 28.1 26.2 22 18
25b 17.3 18.0 12.6 16.5 17.8 18.4 26.0 25.3 28.1
(1) See Appendix C for details on bias adjustment.
(2) * adjusted for distance to receptor.

Epping Forest District Council
LAQM Annual Status Report 2016 21
Appendix C: Supporting Technical Information / Air Quality Monitoring Data QA/QC
Laboratory QA/QC
ESG participates in the AIR NO2 PT laboratory performance scheme. Rounds
AR0007 to AR011 of the testing scheme cover the monitoring periods contained in
this air quality status report. 100% of results were considered to be ‘satisfactory’. Full
details can be found here:
http://laqm.defra.gov.uk/documents/LAQM-AIR-PT-Rounds-1-12-(April-2014-
February-2016)-NO2-report.pdf
Bias adjustment
Bias adjustment factor of 0.81 based on 21 co-location studies nationally for ESG
Didcot diffusion tubes prepared as 50% TEA in Acetone.

Epping Forest District Council
LAQM Annual Status Report 2016 22
Adjustment for distance
The following monitoring locations are closer to the source than the receptor: Goldings Hill, Loughton Albion Terrace, Sewardstone Lodge Lane, Waltham Abbey Hainault Road, Chigwell The annual average result for all locations except Goldings hill were below the annual average objective. The result for Goldings hill has been distance adjusted as follows:
Epping Forest District Council
LAQM Annual Status Report 2016 23
Appendix D: Map(s) of Monitoring Locations
Epping Forest District Council
LAQM Annual Status Report 2016 24
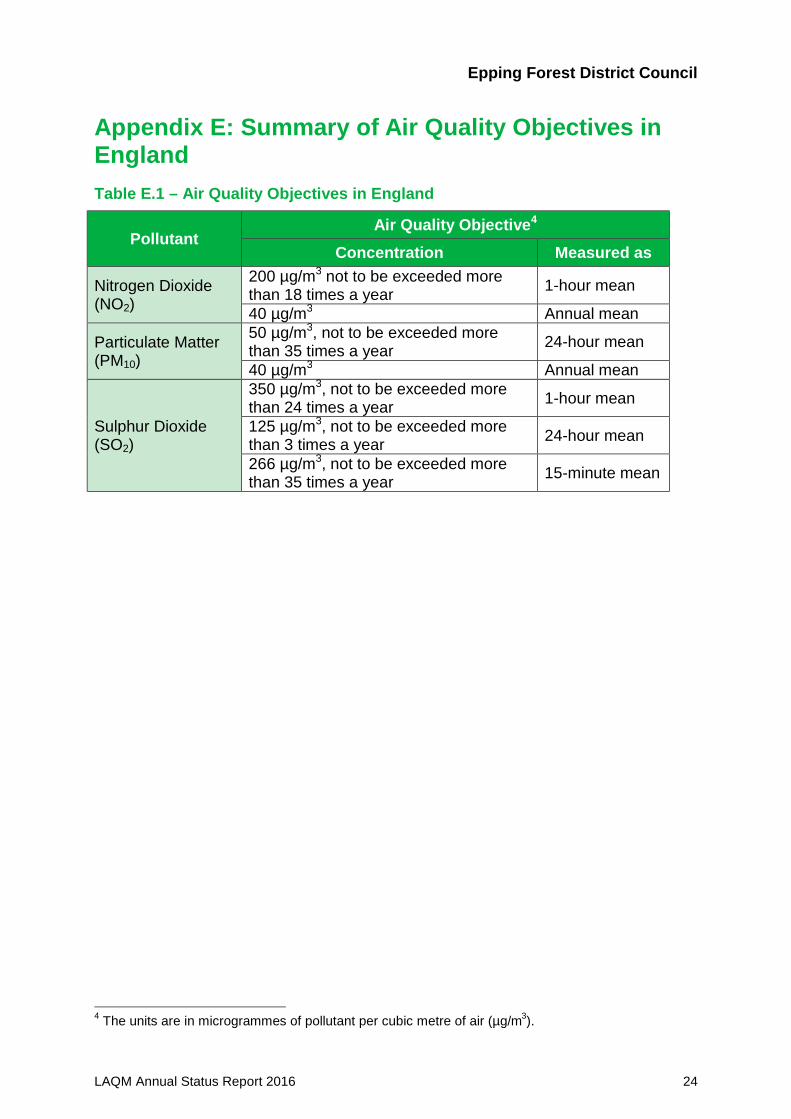
Appendix E: Summary of Air Quality Objectives in England Table E.1 – Air Quality Objectives in England
Pollutant Air Quality Objective4
Concentration Measured as
Nitrogen Dioxide (NO2)
200 µg/m3 not to be exceeded more than 18 times a year 1-hour mean
40 µg/m3 Annual mean
Particulate Matter (PM10)
50 µg/m3, not to be exceeded more than 35 times a year 24-hour mean
40 µg/m3 Annual mean
Sulphur Dioxide (SO2)
350 µg/m3, not to be exceeded more than 24 times a year 1-hour mean
125 µg/m3, not to be exceeded more than 3 times a year 24-hour mean
266 µg/m3, not to be exceeded more than 35 times a year 15-minute mean
4 The units are in microgrammes of pollutant per cubic metre of air (µg/m3).

Epping Forest District Council
LAQM Annual Status Report 2016 25
Glossary of Terms
Abbreviation Description
AQAP Air Quality Action Plan - A detailed description of measures, outcomes, achievement dates and implementation methods, showing how the local authority intends to achieve air quality limit values’
AQMA Air Quality Management Area – An area where air pollutant concentrations exceed / are likely to exceed the relevant air quality objectives. AQMAs are declared for specific pollutants and objectives
ASR Air quality Annual Status Report
Defra Department for Environment, Food and Rural Affairs
DMRB Design Manual for Roads and Bridges – Air quality screening tool produced by Highways England
EU European Union
FDMS Filter Dynamics Measurement System
LAQM Local Air Quality Management
NO2 Nitrogen Dioxide
NOx Nitrogen Oxides
PM10 Airborne particulate matter with an aerodynamic diameter of 10µm (micrometres or microns) or less
PM2.5 Airborne particulate matter with an aerodynamic diameter of 2.5µm or less
QA/QC Quality Assurance and Quality Control
SO2 Sulphur Dioxide
… …

Epping Forest District Council
LAQM Annual Status Report 2016 26
References
Nitrogen Dioxide Bias Adjustment Factor Spreadsheet
http://laqm.defra.gov.uk/bias-adjustment-factors/national-bias.html
Local Air Quality Management Technical Guidance LAQM:TG(16)
http://laqm.defra.gov.uk/documents/LAQM-TG16-April-16-v1.pdf
Summary of Laboratory Performance in Workplace Analysis Scheme for Proficiency
(WASP/AIR PT)
http://laqm.defra.gov.uk/diffusion-tubes/qa-qc-framework.html