epop: quantifying violent risk for every point on the planet
TRANSCRIPT

Welcome #EUC11

EPOP:Quantifying Violent Risk forEvery Point on the Planet
A global, intelligence-driven political violence risk model
Cathy Wilford, GIS Developer
A global, intelligence-driven political violence risk model

WHO ARE WE?
• Specialist intelligence company
• Forecasting political and violent risks worldwide
• London-based, but with global intelligence
network of 1000+ regional analysts
and local sources
• Respected for rigorous methodology,
objectivity, and precision

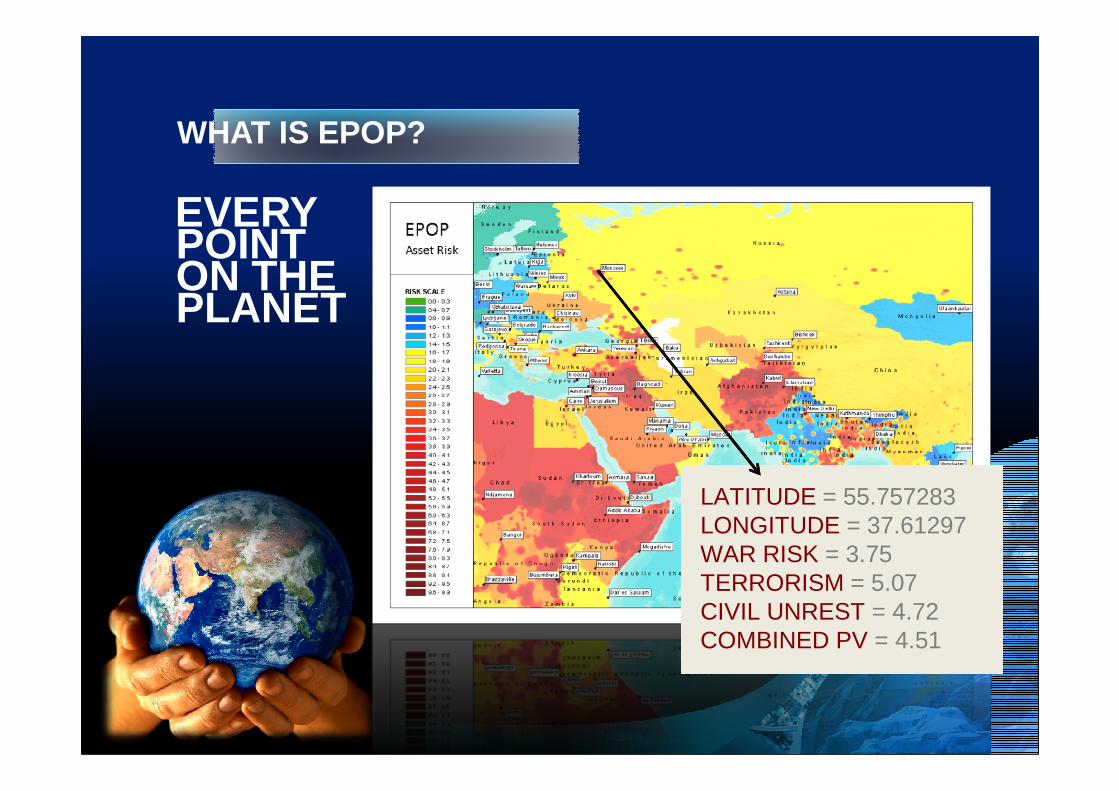
WHAT IS EPOP?
• EPOP is a risk evaluation tool
that delivers precise risk assessment
for Every Point on the Planet
EVERY POINTON THEPLANET
• EPOP is a risk evaluation tool
that delivers precise risk assessment
for Every Point on the Planet
WHAT IS EPOP?
EVERY POINTON THEPLANET
LATITUDE = 55.757283LONGITUDE = 37.61297WAR RISK = 3.75TERRORISM = 5.07CIVIL UNREST = 4.72COMBINED PV = 4.51

OUR OUTPUTS
• Online web-based products
• Tailored bespoke reports
• Ad-hoc projects for specific problems
• Standalone location intelligence products

Traditional static maps for bespoke reports …
HOW GIS SUPPORTS OUR WORK

Ad-hoc analysis projects

Regional and urban risk assessment

…in various formats

TerrorRisk in MapInfo

TerrorRisk in Google Earth

TerrorRisk in ArcGIS

Country Risk
• Click to add text
• Clearly this is going to be a lot of text

Indicator Events

So we have all this information….

… how to pull it all together?
• Create one neat super-model
THE CHALLENGE:
• from a range of different sources, products and methodologiesproducts and methodologies
• in order to deliver very precise ‘risk scores’ on a 0-10 scale
• for each of four perils (war, terrorism, civil unrest, combined political violence)
• FOR EVERY SINGLE POINT ON THE PLANET


THE SOLUTION
Map Algebra!

Converting to raster and combining:Converting to raster and combining:
THE INPUTS
Scalable for future inputsScalable for future inputs
TerrorRisk Target DataTerrorRisk Target Data
CountryCountry Scores from CREAMScores from CREAM
Relative Regional Risk AnalysisRelative Regional Risk Analysis
Historic Event Density MapsHistoric Event Density Maps

Every Point? What is a ‘point’ anyway?
• With a raster resolution of 0.005 degrees:cell size = very approx. 500 metres squared
• About 2 billion cells in totalto cover the earth’s surfaceto cover the earth’s surface
• Each ‘EPOP’ raster file = 10 MB
• x 4 peril scores
• = 8 BILLION separate calculations

Unexpected Errors
… boom

MISSION ACCOMPLISHED
…. Eventually !
PHASE TWO
• FULL AUTOMATION- how to deal with ongoing data updates?
• TESTING TESTING TESTING• TESTING TESTING TESTING- fine-tuning the all-important
magic mapAlgebra formula

Automation: Designing the workflow
From model building….

… to Model Builder

… to Python scripts
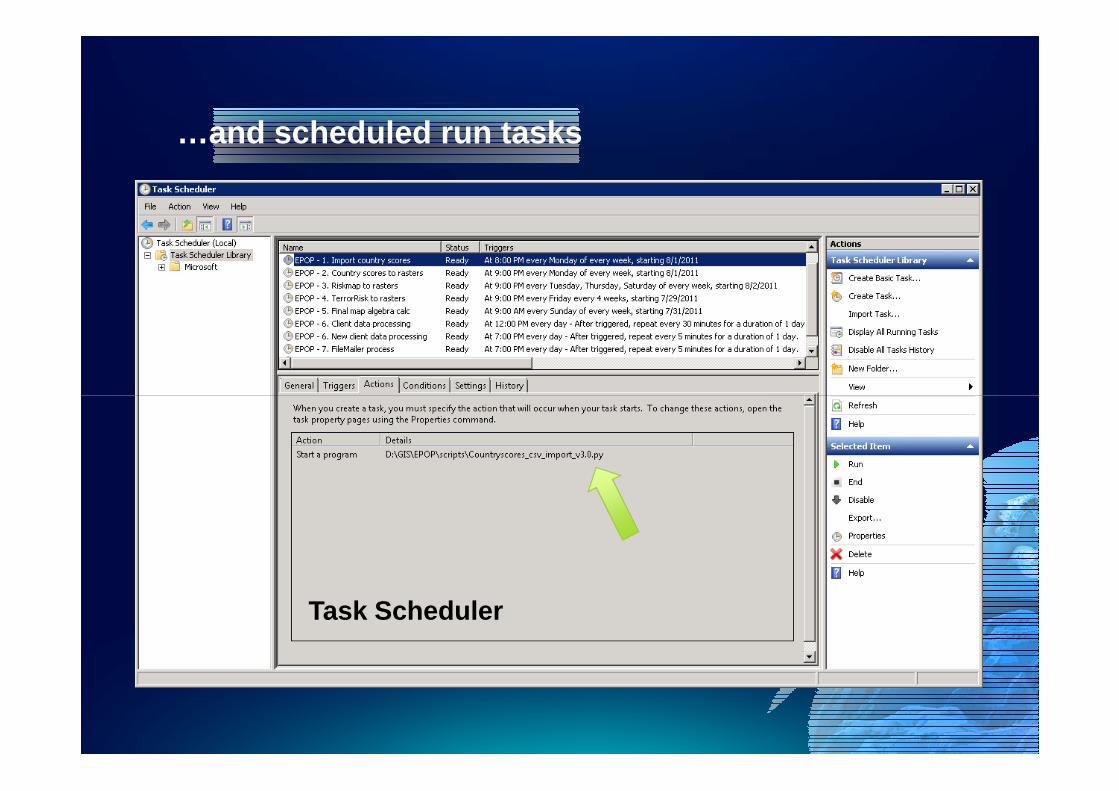
…and scheduled run tasks
• Migration to a server + more space and time = less frustration
Task Scheduler
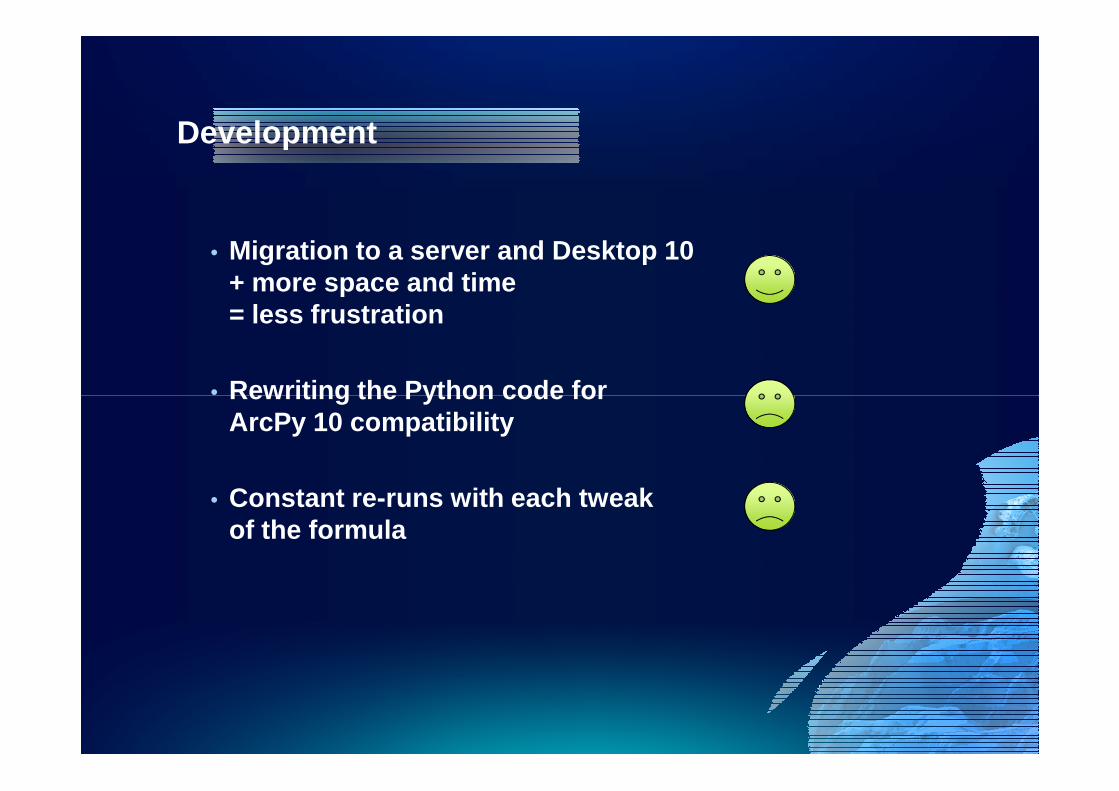
Development
• Migration to a server and Desktop 10+ more space and time = less frustration
• Rewriting the Python code for • Rewriting the Python code for ArcPy 10 compatibility
• Constant re-runs with each tweak of the formula

Development
• Version 3.2 of the formula
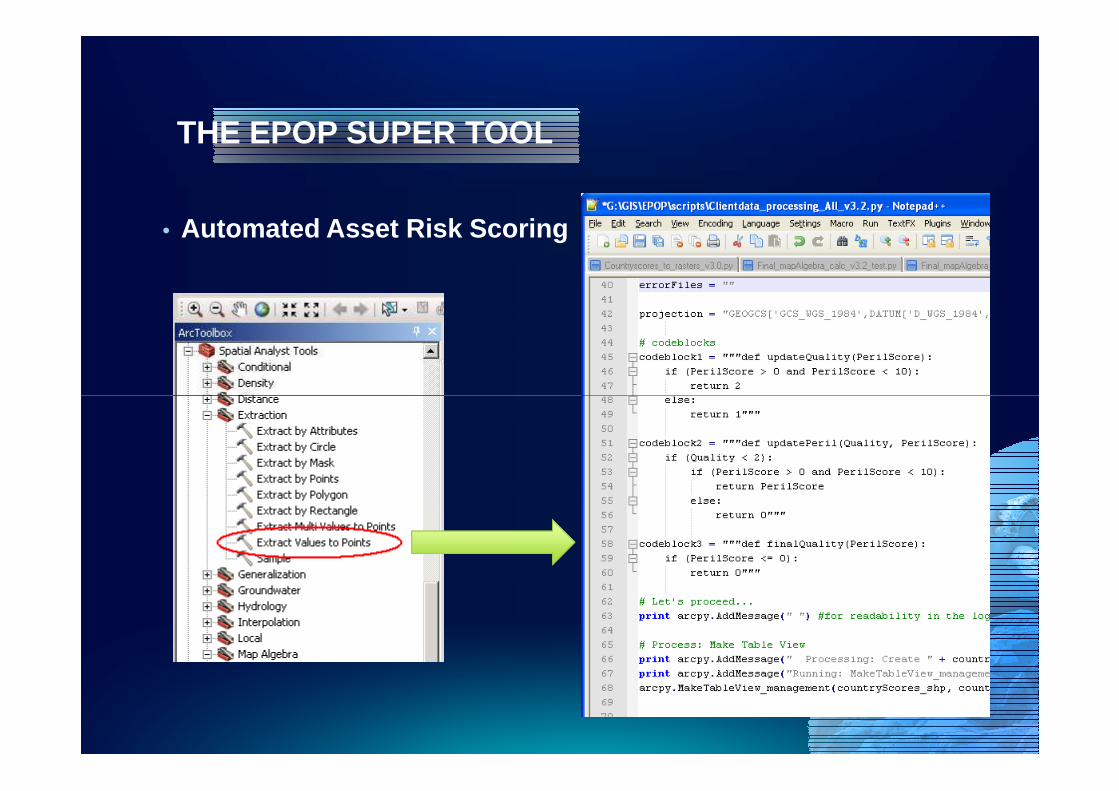
THE EPOP SUPER TOOL
• Automated Asset Risk Scoring

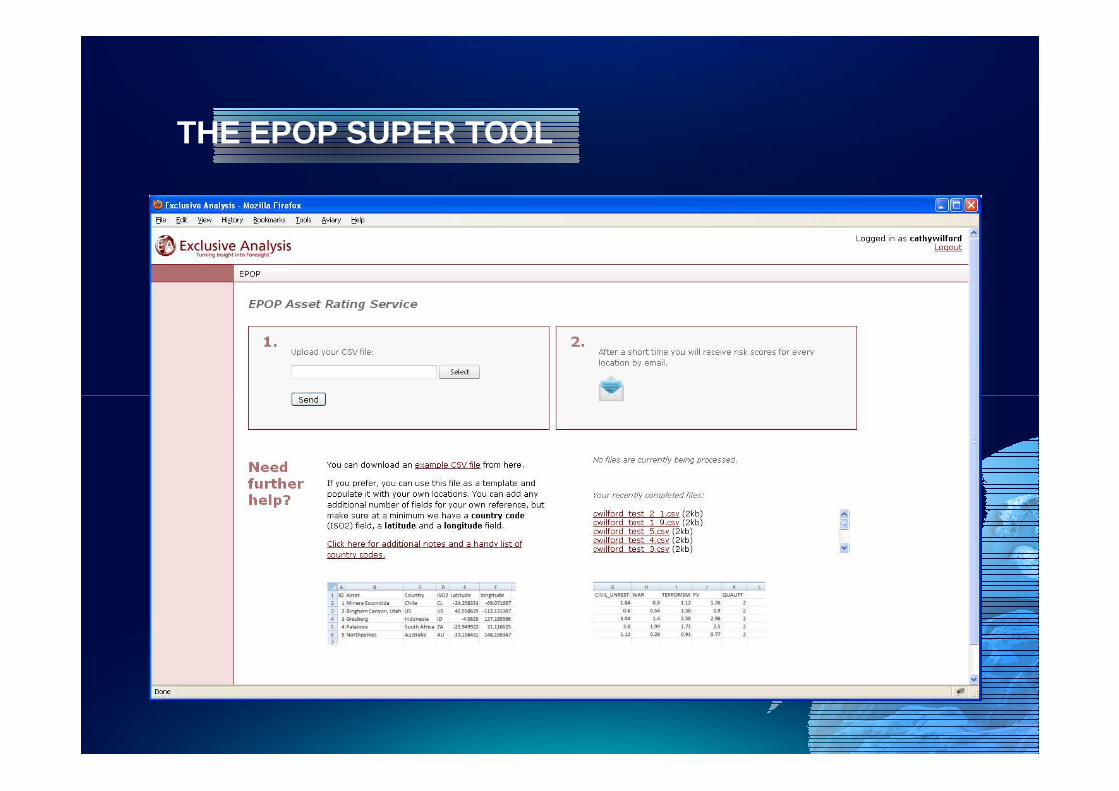
THE EPOP SUPER TOOL
• Automated Asset Risk Scoring
THE EPOP SUPER TOOL
• Automated Asset Risk Scoring

Published to the web with ArcGIS Server
Served up as a WMS,overlaid onto Google Maps


Corporate security, risk, and business development

Insurance and reinsurance

IS IT USEFUL?
• “Congratulations on what is a fantastic undertaking .
It’s really well done, this is en-route to becoming , without wanting to
exaggerate, game-changing in a lot of ways because it would so very
much relieve the burden of what the security and in telligence departments
of a lot of big companies have to do right now, cha sing around to find
information and ending with a very subjective analy sis of different information and ending with a very subjective analy sis of different
locations. This would streamline that immensely”.
• “The question I am asked is what do we know about the “The question I am asked is what do we know about the “The question I am asked is what do we know about the “The question I am asked is what do we know about the security security security security situationsituationsituationsituation both immediately around the well sites and on the route both immediately around the well sites and on the route both immediately around the well sites and on the route both immediately around the well sites and on the route itself between the sites and the base, and whether there are nearby itself between the sites and the base, and whether there are nearby itself between the sites and the base, and whether there are nearby itself between the sites and the base, and whether there are nearby risk hotspots nearby which could potentially spill over and affect risk hotspots nearby which could potentially spill over and affect risk hotspots nearby which could potentially spill over and affect risk hotspots nearby which could potentially spill over and affect our operation. our operation. our operation. our operation. Being able to view the results on a map Being able to view the results on a map Being able to view the results on a map Being able to view the results on a map I could answer those questions almost instantly.”I could answer those questions almost instantly.”I could answer those questions almost instantly.”I could answer those questions almost instantly.”

IS IT USEFUL?
“All models are wrong.
But some models are useful.”
Simon Sole, CEO, Exclusive Analysis LtdSimon Sole, CEO, Exclusive Analysis Ltd
