epidemiology of traumatic and ischemic brain injuries g. citerio rianimazione – h san gerardo –...
TRANSCRIPT

Epidemiology of traumatic Epidemiology of traumatic and ischemic brain injuriesand ischemic brain injuriesEpidemiology of traumatic Epidemiology of traumatic and ischemic brain injuriesand ischemic brain injuries
G. Citerio Rianimazione – H San Gerardo – Monza (Mi)
G. Citerio Rianimazione – H San Gerardo – Monza (Mi)

G. Citerio, MD
EpidemiologyEpidemiology
• Epidemiology is the “study of the distribution and determinants of disease frequency”
• Two elements:– DistributionDistribution (mortality, prevalence, trends)– DeterminantsDeterminants (predisposing conditions and
risk factors)
• Epidemiology is the “study of the distribution and determinants of disease frequency”
• Two elements:– DistributionDistribution (mortality, prevalence, trends)– DeterminantsDeterminants (predisposing conditions and
risk factors)
G. Citerio, MD
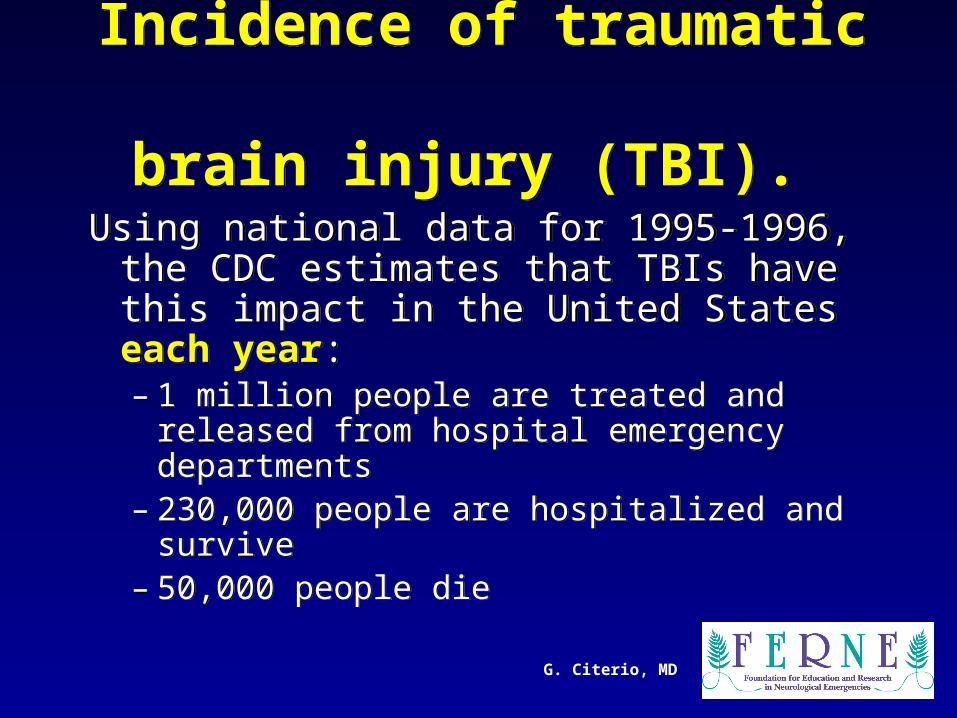
Incidence of traumatic brain injury (TBI).
Incidence of traumatic brain injury (TBI).
Using national data for 1995-1996, the CDC estimates that TBIs have this impact in the United States each year: – 1 million people are treated and released
from hospital emergency departments– 230,000 people are hospitalized and
survive– 50,000 people die
Using national data for 1995-1996, the CDC estimates that TBIs have this impact in the United States each year: – 1 million people are treated and released
from hospital emergency departments– 230,000 people are hospitalized and
survive– 50,000 people die
G. Citerio, MD
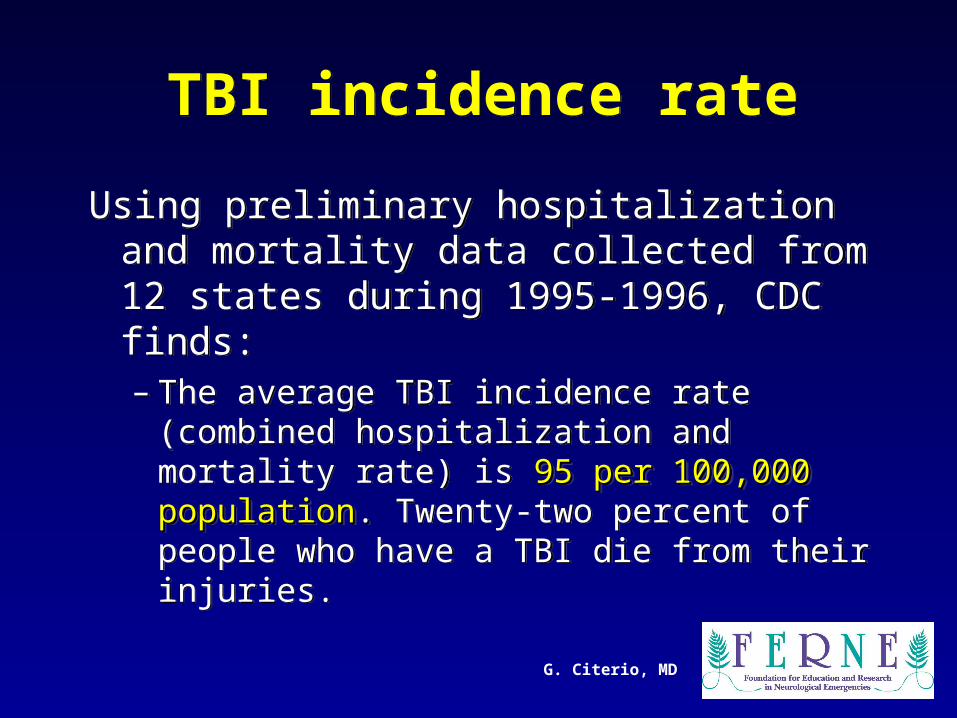
TBI incidence rateTBI incidence rate
Using preliminary hospitalization and mortality data collected from 12 states during 1995-1996, CDC finds:– The average TBI incidence rate (combined
hospitalization and mortality rate) is 95 per 95 per 100,000 population100,000 population.. Twenty-two percent of people who have a TBI die from their injuries.
G. Citerio, MD
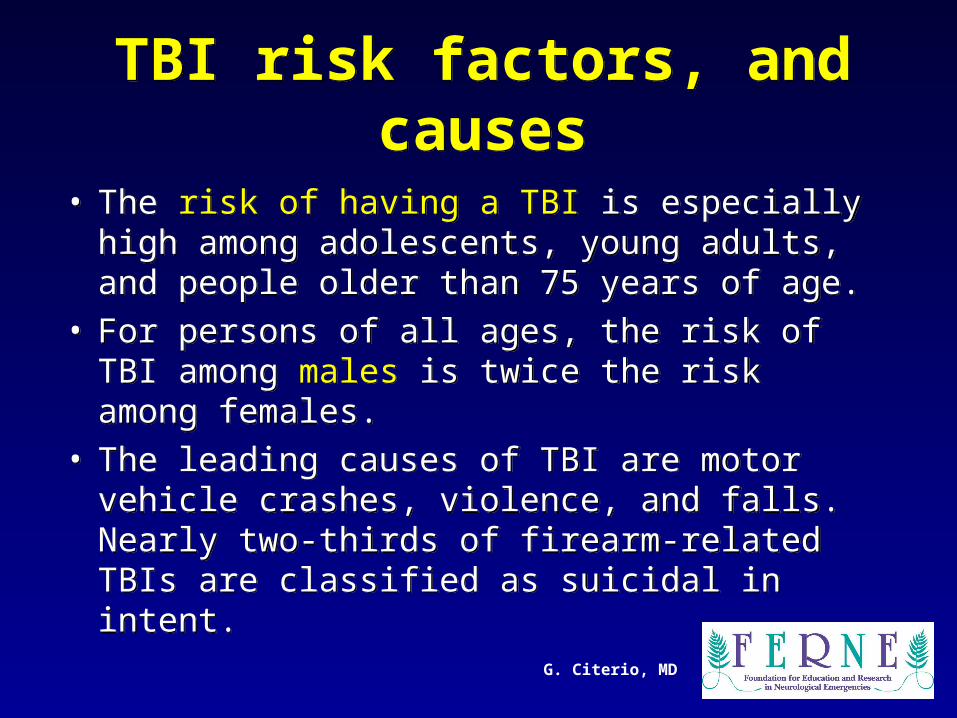
TBI risk factors, and causesTBI risk factors, and causes
• The risk of having a TBI is especially high among adolescents, young adults, and people older than 75 years of age.
• For persons of all ages, the risk of TBI among males is twice the risk among females.
• The leading causes of TBI are motor vehicle crashes, violence, and falls. Nearly two-thirds of firearm-related TBIs are classified as suicidal in intent.
G. Citerio, MD
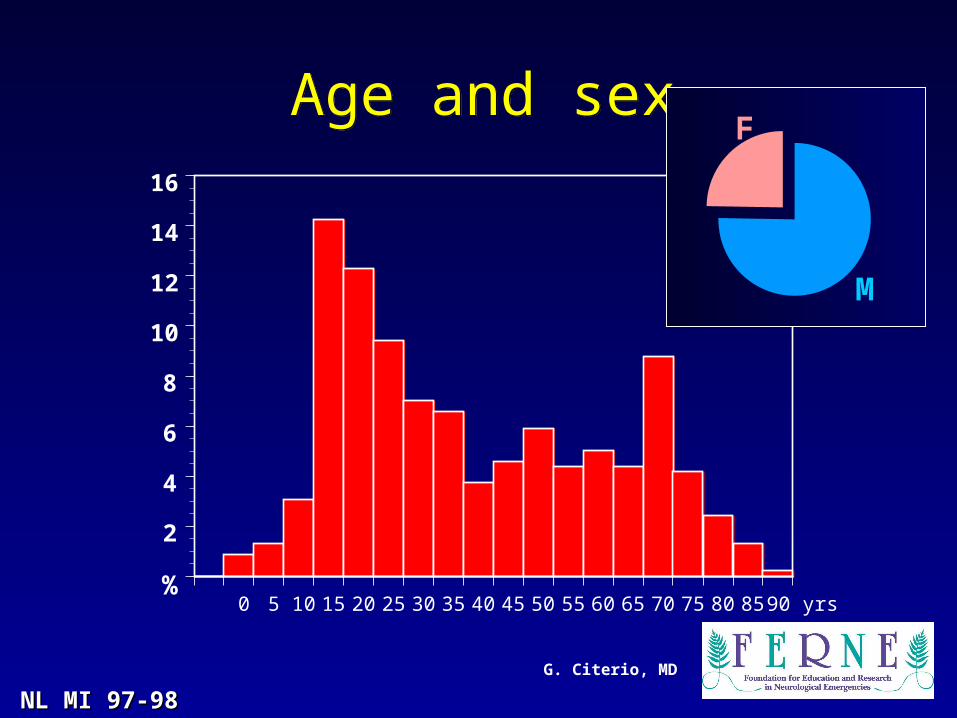
0 5 10 15 20 25 30 35 40 45 50 55 60 65 70 75 80 85 90 yrs%
2
4
6
8
10
12
14
16
Age and sexAge and sex
M
F
NL MI 97-98NL MI 97-98
G. Citerio, MD
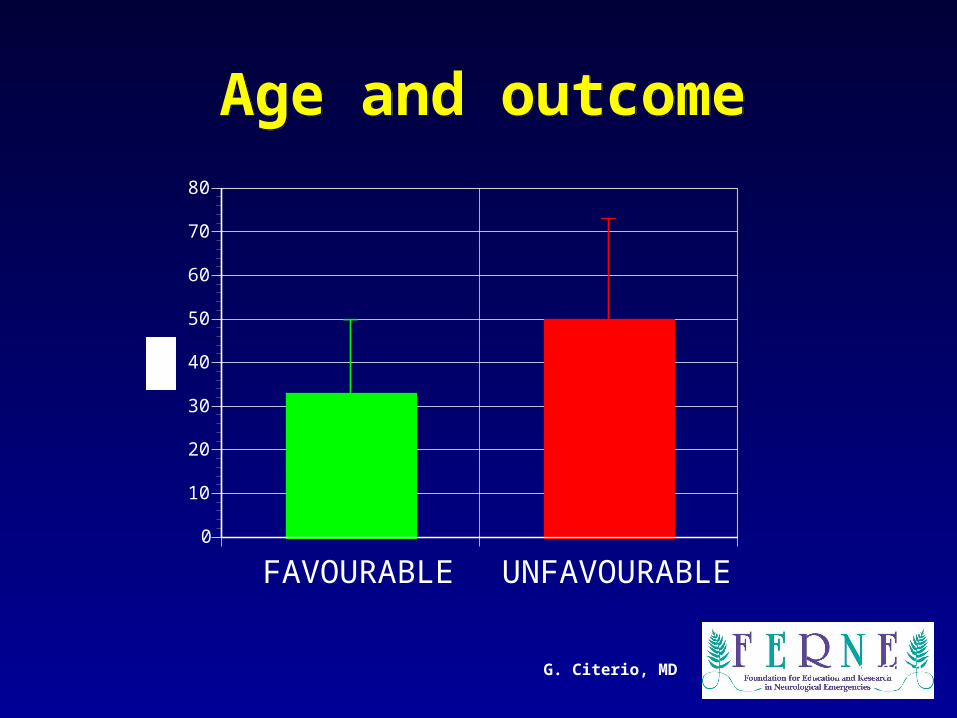
Age and outcomeAge and outcome
FAVOURABLE UNFAVOURABLE0
10
20
30
40
50
60
70
80
p 0.0001
G. Citerio, MD
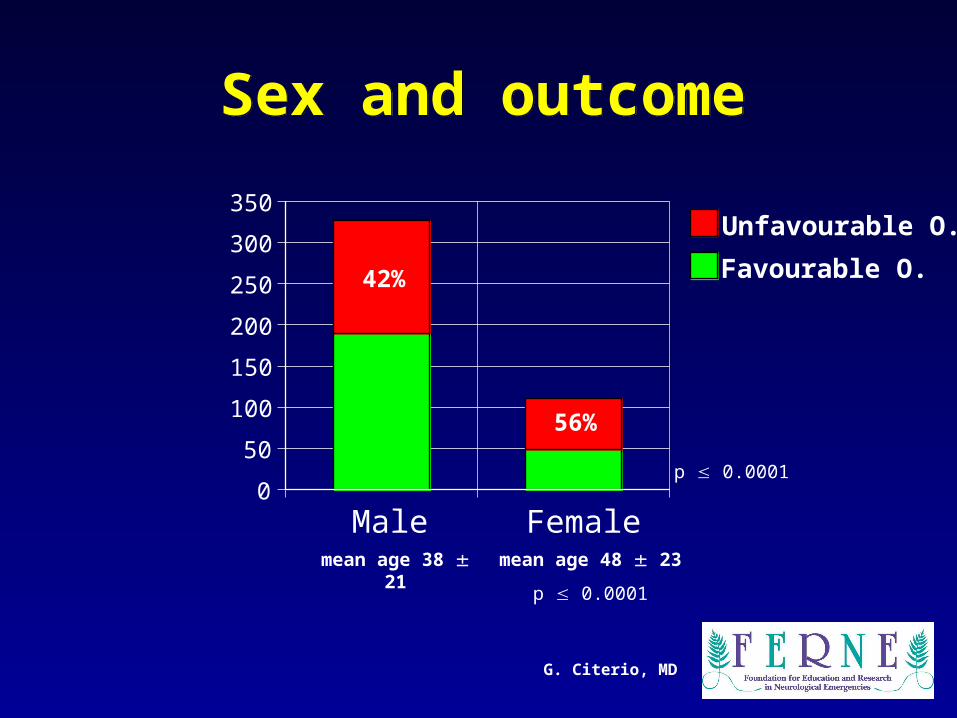
Sex and outcomeSex and outcome
mean age 38 21
mean age 48 23
p 0.0001
Male Female0
50
100
150
200
250
300
350
42%
56%
Favourable O.
Unfavourable O.
p 0.0001
G. Citerio, MD
TBI risk factors, and causesTBI risk factors, and causes
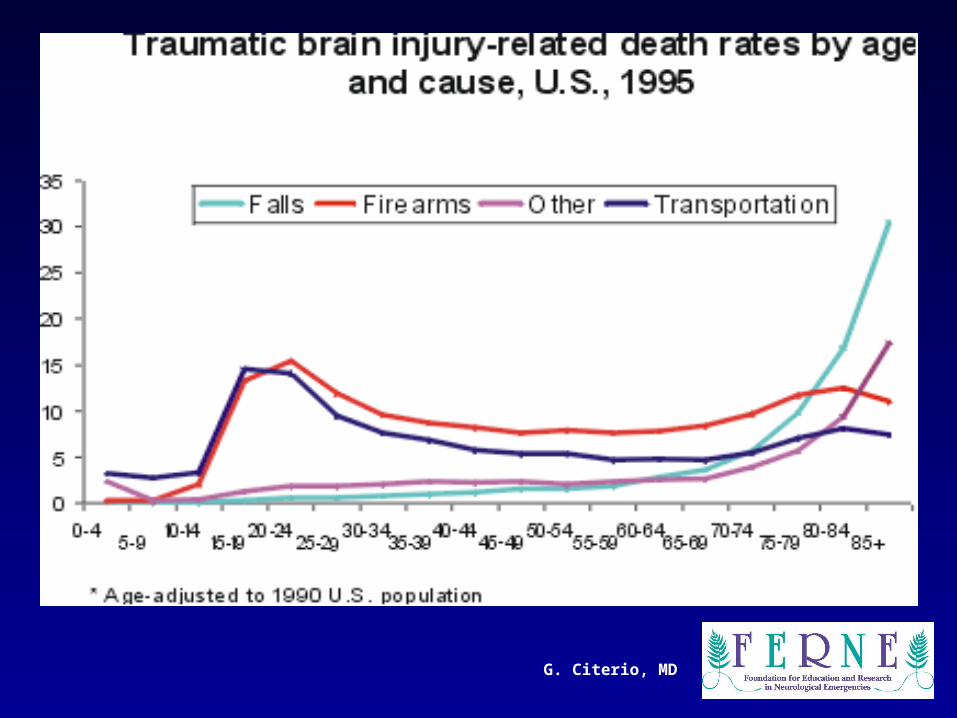
• The leading causes of TBI vary by age: falls are the leading cause of TBI among persons aged 65 years and older, whereas transportation leads among persons aged 5 to 64 years.
• The outcome of these injuries varies greatly depending on the cause: 91% of firearm-related TBIs resulted in death, but only 11% of fall-related TBIs are fatal.
G. Citerio, MD
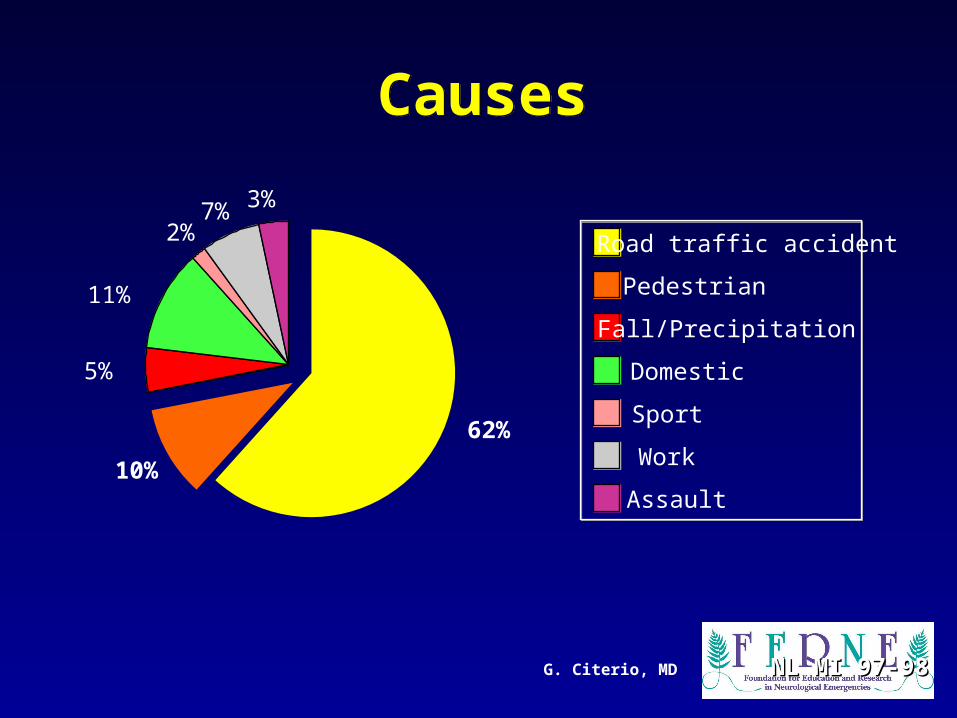
CausesCauses
NL MI 97-98NL MI 97-98
62%
10%
5%
11%
2%7% 3%
Road traffic accident
Pedestrian
Fall/Precipitation
Domestic
Sport
Work
Assault
G. Citerio, MD
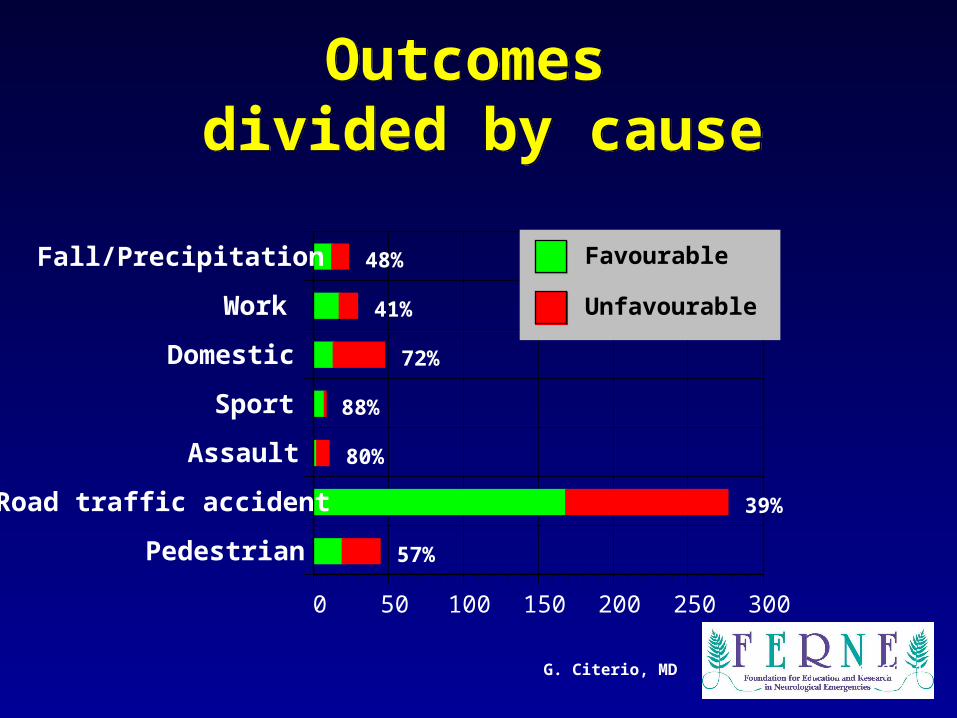
Outcomes divided by cause
Outcomes divided by cause
Pedestrian
Road traffic accident
Assault
Sport
Domestic
Work
Fall/Precipitation
0 50 100 150 200 250 300
57%
39%
80%
88%
72%
41%
48% Favourable
Unfavourable
p 0.0001
G. Citerio, MD
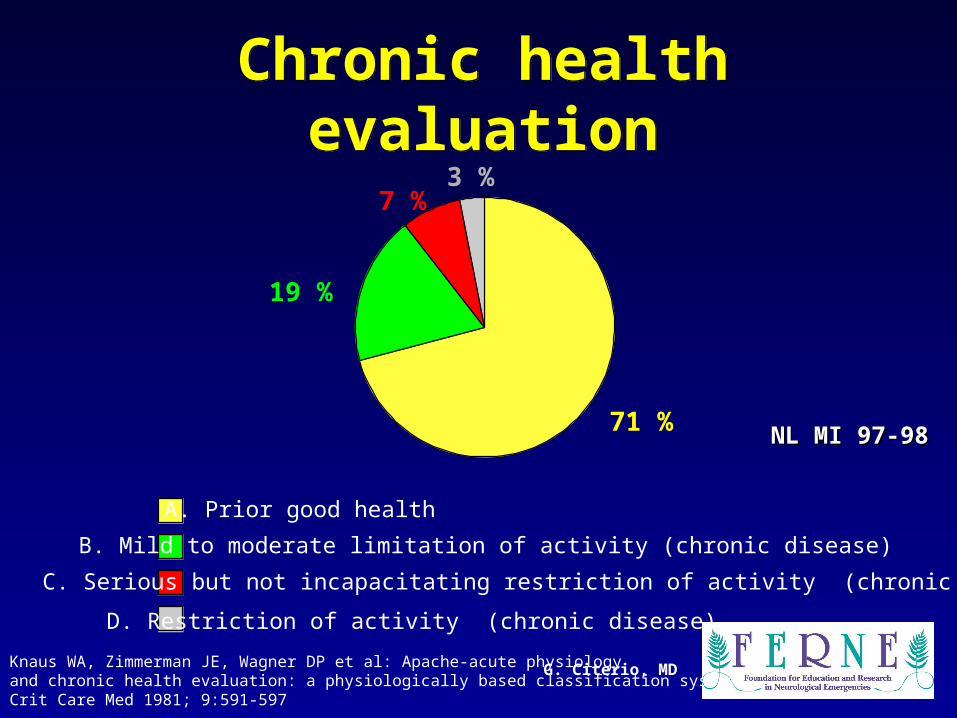
Chronic health evaluationChronic health evaluation
A. Prior good health
B. Mild to moderate limitation of activity (chronic disease)
C. Serious but not incapacitating restriction of activity (chronic disease)
D. Restriction of activity (chronic disease)
Knaus WA, Zimmerman JE, Wagner DP et al: Apache-acute physiology and chronic health evaluation: a physiologically based classification system. Crit Care Med 1981; 9:591-597
71 %
19 %
7 %3 %
NL MI 97-98NL MI 97-98
G. Citerio, MD
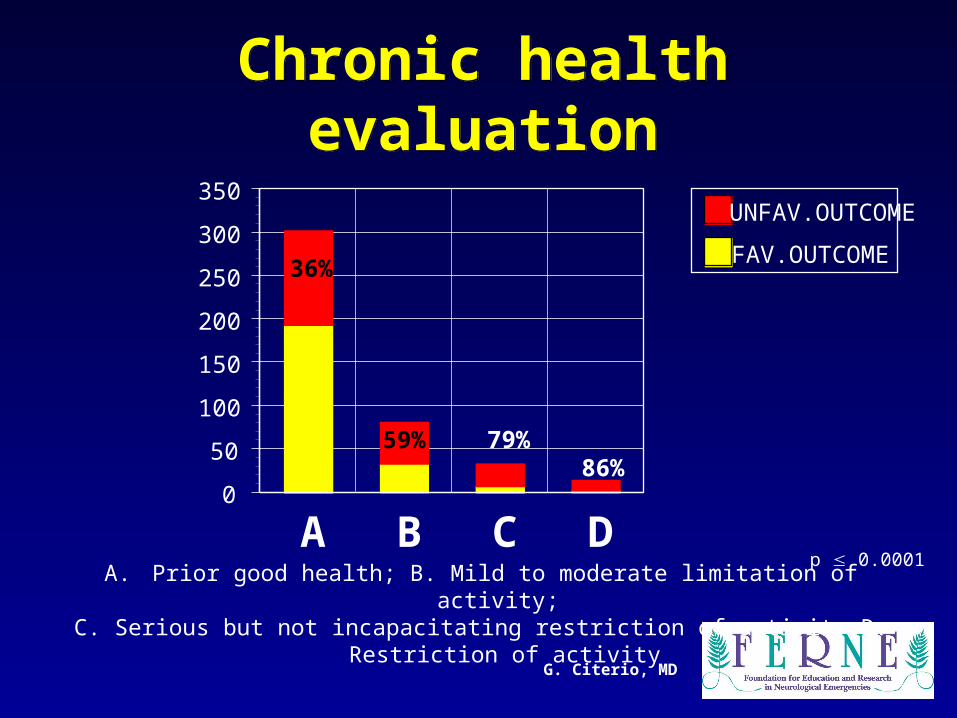
Chronic health evaluationChronic health evaluation
A B C D0
50
100
150
200
250
300
350
36%
79%86%
FAV.OUTCOME
UNFAV.OUTCOME
59%
A. Prior good health; B. Mild to moderate limitation of activity; C. Serious but not incapacitating restriction of activity D. Restriction of activity
p 0.0001
G. Citerio, MD
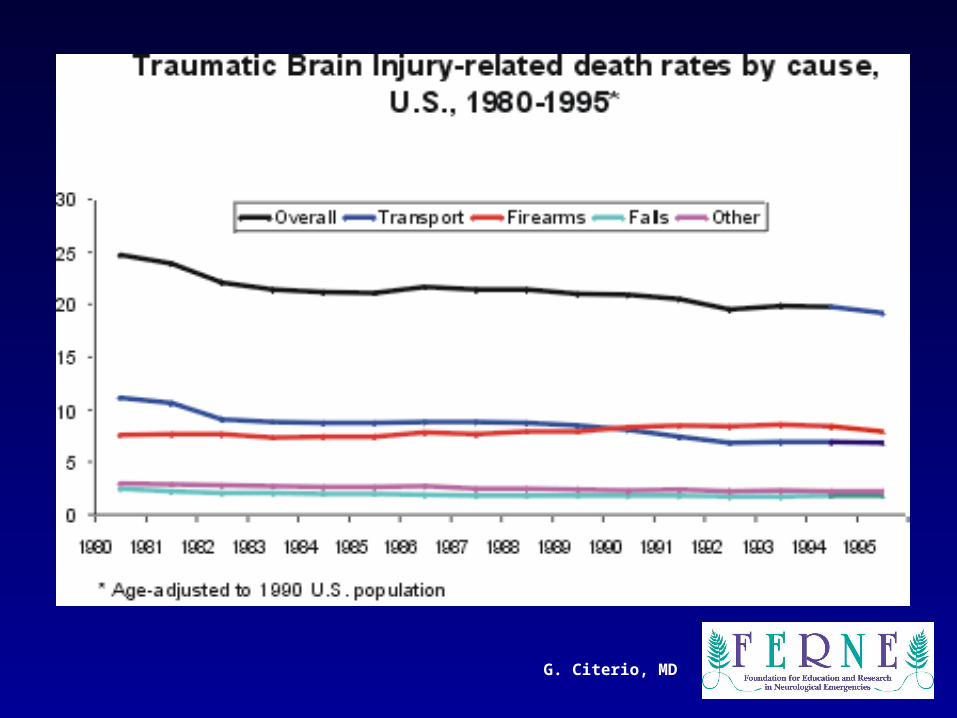
There was a 22% decline in the TBI-related death rate from 24.6/100,000 U.S. residents in 1979 to 19.3/100,000 in 1992.
Firearm-related rates increased 13% from 1984 through 1992, undermining a 25% decline in motor vehicle-related rates for the same period.
Firearms surpassed motor vehicles as the largest single cause of death associated with traumatic brain injury in the United States in 1990.
G. Citerio, MD
G. Citerio, MD
G. Citerio, MD
Incidence and prevalence of TBI-related disability.
Incidence and prevalence of TBI-related disability.
Based on national TBI incidence data and preliminary data from the Colorado TBI Registry that describe TBI-related disability in 1996-1997, CDC estimates the following:– Each year more than 80,000 Americans
survive a hospitalization for traumatic brain injury but are discharged with TBI-related disabilities.
– 5.3 million Americans are living today with a TBI-related disability.
G. Citerio, MD
There are many kinds of impairments that may occur as a result of TBI. These injuries may impair: – cognition -- concentration, memory, judgment,
and mood – movement abilities -- strength, coordination, and
balance – sensation -- tactile sensation and special senses
such as vision
• TBI sometimes results in seizure disorders (epilepsy). About 1 percent of persons with severe TBI survive in a state of persisting unconsciousness.
G. Citerio, MD
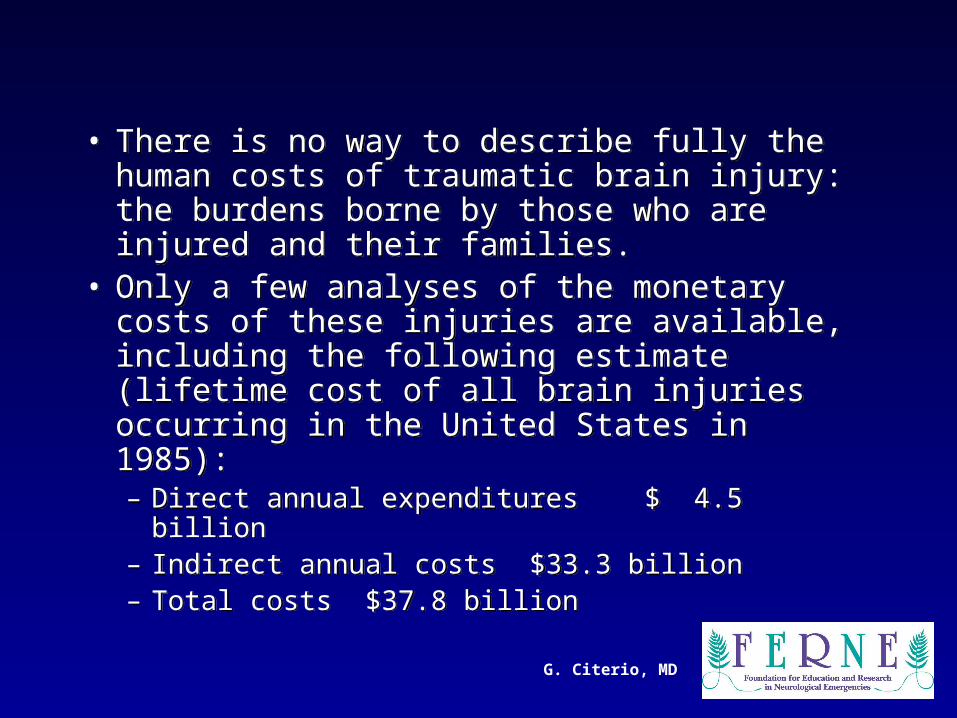
• There is no way to describe fully the human costs of traumatic brain injury: the burdens borne by those who are injured and their families.
• Only a few analyses of the monetary costs of these injuries are available, including the following estimate (lifetime cost of all brain injuries occurring in the United States in 1985):– Direct annual expenditures $ 4.5 billion – Indirect annual costs $33.3 billion – Total costs $37.8 billion
G. Citerio, MD
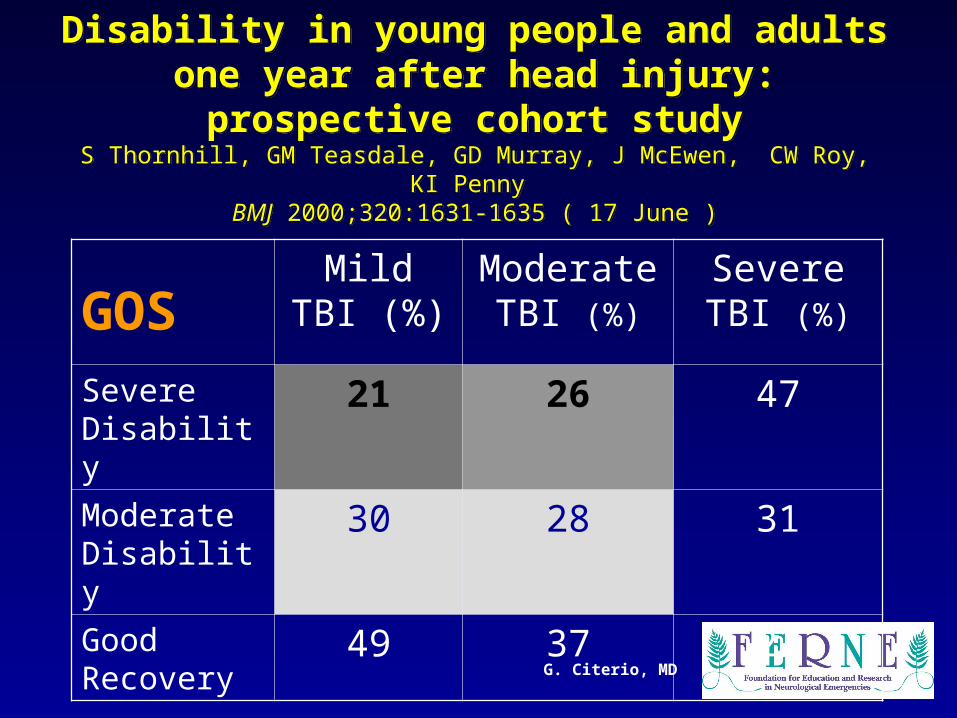
Disability in young people and adults one year after head injury: prospective cohort studyS Thornhill, GM Teasdale, GD Murray, J McEwen, CW Roy, KI Penny
BMJ 2000;320:1631-1635 ( 17 June )
Disability in young people and adults one year after head injury: prospective cohort studyS Thornhill, GM Teasdale, GD Murray, J McEwen, CW Roy, KI Penny
BMJ 2000;320:1631-1635 ( 17 June )
GOSMild TBI
(%)Moderate TBI (%)
Severe TBI (%)
Severe Disability
21 26 47
Moderate Disability
30 28 31
Good Recovery
49 37 22
G. Citerio, MD
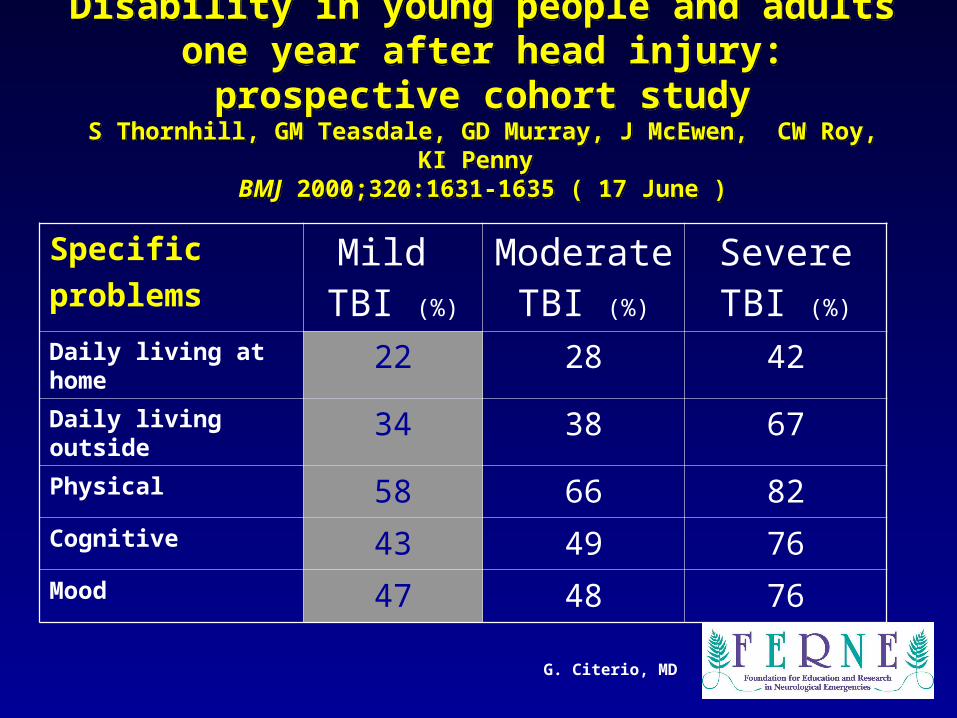
Disability in young people and adults one year after head injury: prospective cohort study
S Thornhill, GM Teasdale, GD Murray, J McEwen, CW Roy, KI Penny BMJ 2000;320:1631-1635 ( 17 June )
Disability in young people and adults one year after head injury: prospective cohort study
S Thornhill, GM Teasdale, GD Murray, J McEwen, CW Roy, KI Penny BMJ 2000;320:1631-1635 ( 17 June )
Specific
problemsMild
TBI (%)
ModerateTBI (%)
SevereTBI (%)
Daily living at home 22 28 42Daily living outside 34 38 67Physical 58 66 82Cognitive 43 49 76Mood 47 48 76
G. Citerio, MD
Primary preventionPrimary prevention
Primary prevention of TBI is an important goal of public health efforts. Accomplishing this goal requires attention to each of the major external causes of these injuries:
1. transportation,
2. violence,
3. and falls.
Primary prevention of TBI is an important goal of public health efforts. Accomplishing this goal requires attention to each of the major external causes of these injuries:
1. transportation,
2. violence,
3. and falls.
G. Citerio, MD
1. Transportation1. Transportation
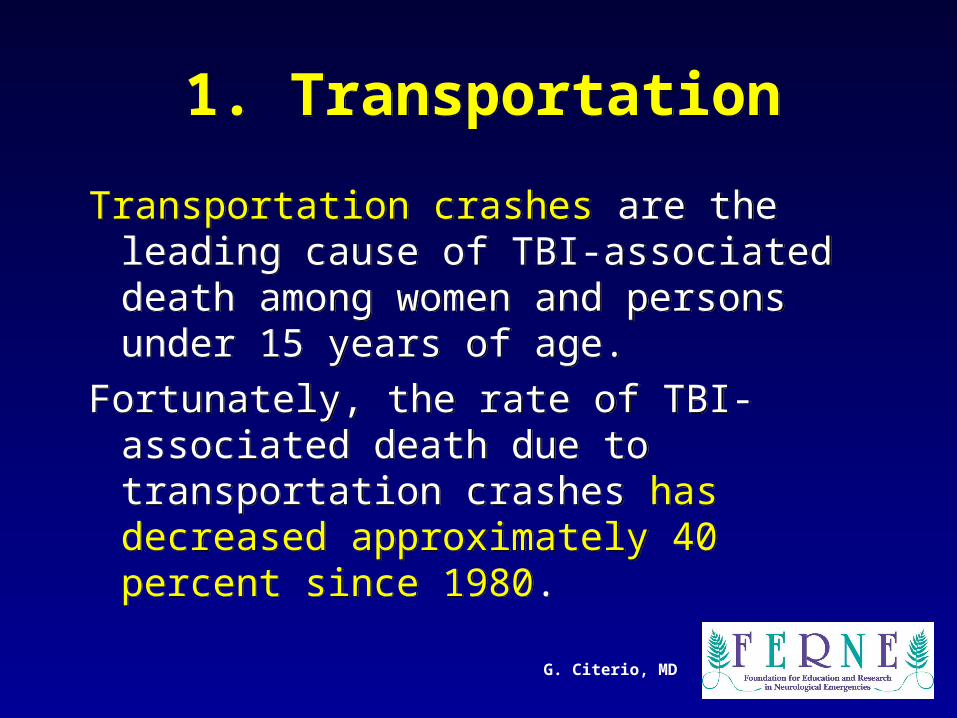
Transportation crashes are the leading cause of TBI-associated death among women and persons under 15 years of age.
Fortunately, the rate of TBI-associated death due to transportation crashes has decreased approximately 40 percent since 1980.
Transportation crashes are the leading cause of TBI-associated death among women and persons under 15 years of age.
Fortunately, the rate of TBI-associated death due to transportation crashes has decreased approximately 40 percent since 1980.
G. Citerio, MD
1. Transportation1. Transportation
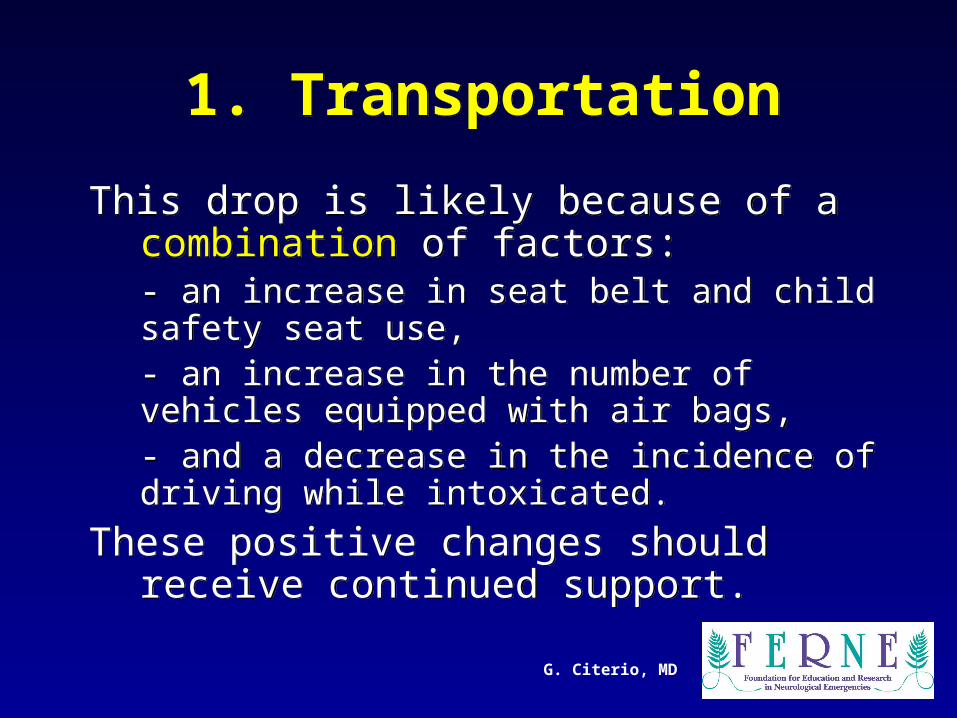
This drop is likely because of a combination of factors: - an increase in seat belt and child safety seat use, - an increase in the number of vehicles equipped with air bags, - and a decrease in the incidence of driving while intoxicated.
These positive changes should receive continued support.
This drop is likely because of a combination of factors: - an increase in seat belt and child safety seat use, - an increase in the number of vehicles equipped with air bags, - and a decrease in the incidence of driving while intoxicated.
These positive changes should receive continued support.
G. Citerio, MD
Preventing traumatic brain injury: an innovative approach
to outcomes
Preventing traumatic brain injury: an innovative approach
to outcomes
1-day educational injury prevention programme for young people with speeding offences
Farmer J, et al: Brain Injury 14:109-15, 2000
1-day educational injury prevention programme for young people with speeding offences
Farmer J, et al: Brain Injury 14:109-15, 2000

G. Citerio, MD
Rate of convictions after the target programme date
Rate of convictions after the target programme date
• 92 programme participants and
87 non-treated individuals
• no significant between-group difference
• 92 programme participants and
87 non-treated individuals
• no significant between-group difference
Farmer J, et al: Brain Injury 14:109-15, 2000
G. Citerio, MD
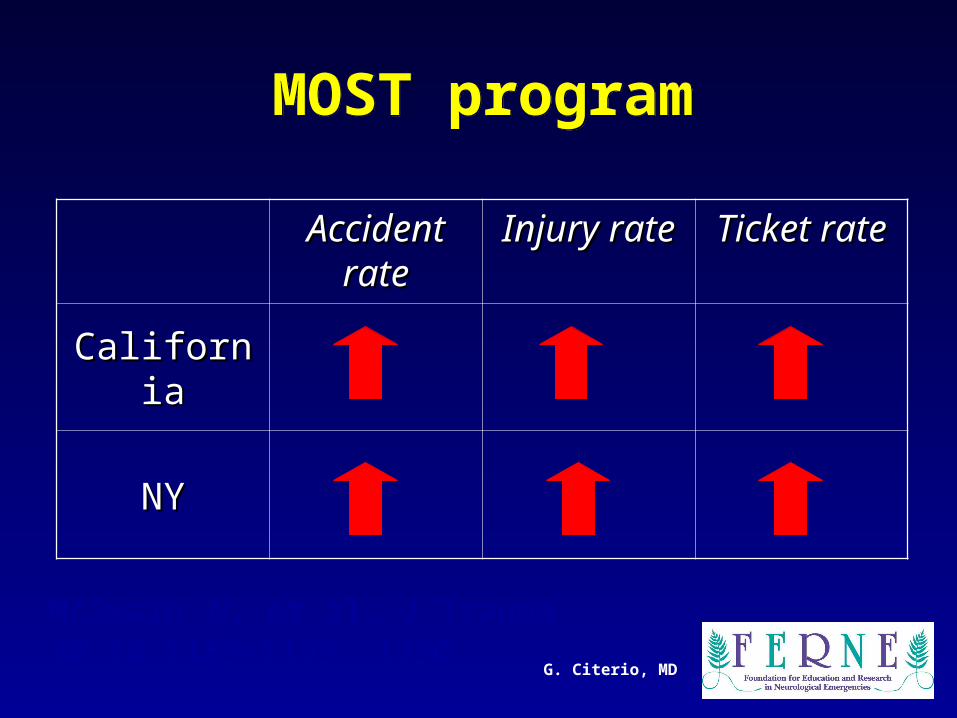
MOST programMOST program
Accident Accident raterate
Injury rateInjury rate Ticket rateTicket rate
CaliforniaCalifornia
NYNY
McSwain N, et al: J Trauma 30,10:1189-1199, 1990
G. Citerio, MD
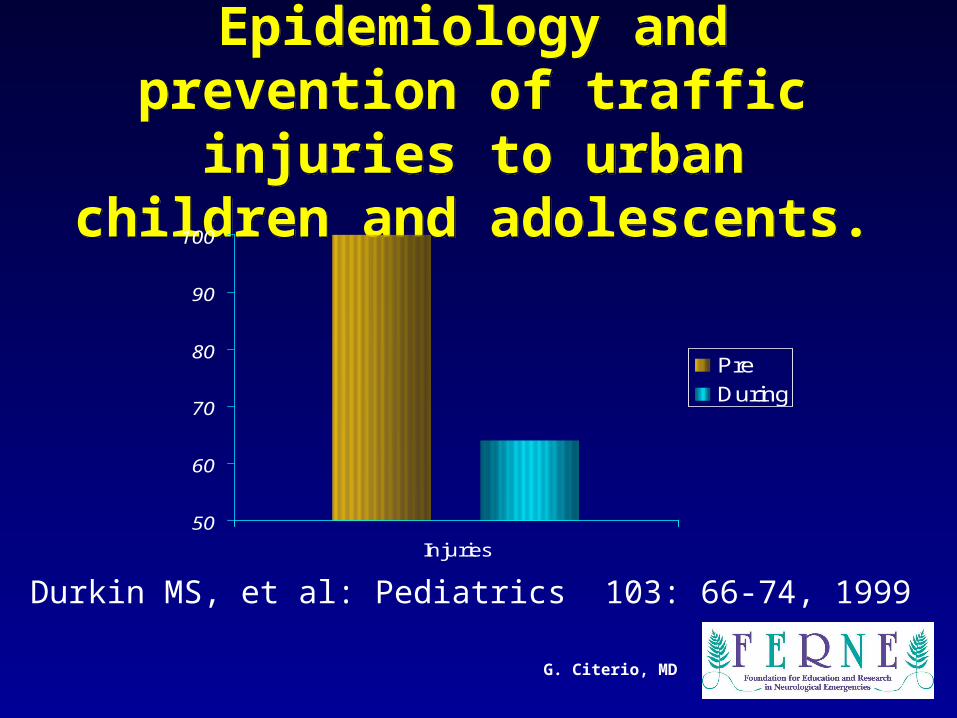
Epidemiology and prevention of traffic injuries to urban children
and adolescents.
Epidemiology and prevention of traffic injuries to urban children
and adolescents.
50
60
70
80
90
100
Injuries
Pre
During
Durkin MS, et al: Pediatrics 103: 66-74, 1999

G. Citerio, MD
Costly achievementsCostly achievements
• Education in a simulated traffic environment, and via theatrical performances
• Construction of new playgrounds to provide expanded off-street play areas for children
• Bicycle safety clinics and helmet distribution • Supervised recreational and artistic activities
• Education in a simulated traffic environment, and via theatrical performances
• Construction of new playgrounds to provide expanded off-street play areas for children
• Bicycle safety clinics and helmet distribution • Supervised recreational and artistic activities
Durkin MS, et al: Pediatrics 103: 66-74, 1999
G. Citerio, MD
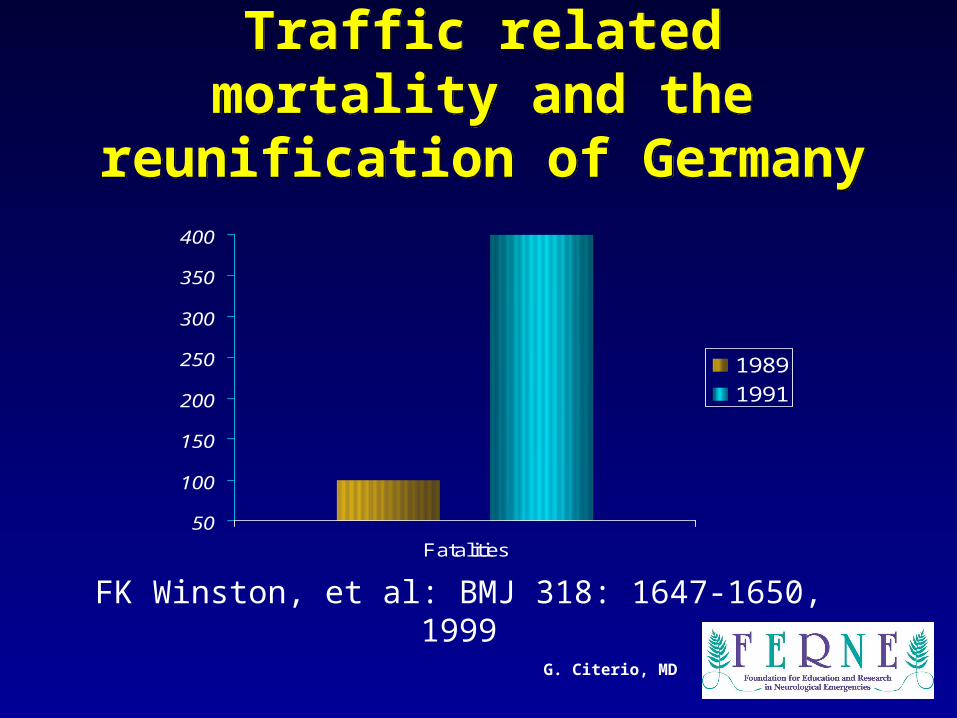
Traffic related mortality and the reunification of Germany
Traffic related mortality and the reunification of Germany
FK Winston, et al: BMJ 318: 1647-1650, 1999
50
100
150
200
250
300
350
400
Fatalities
1989
1991
G. Citerio, MD
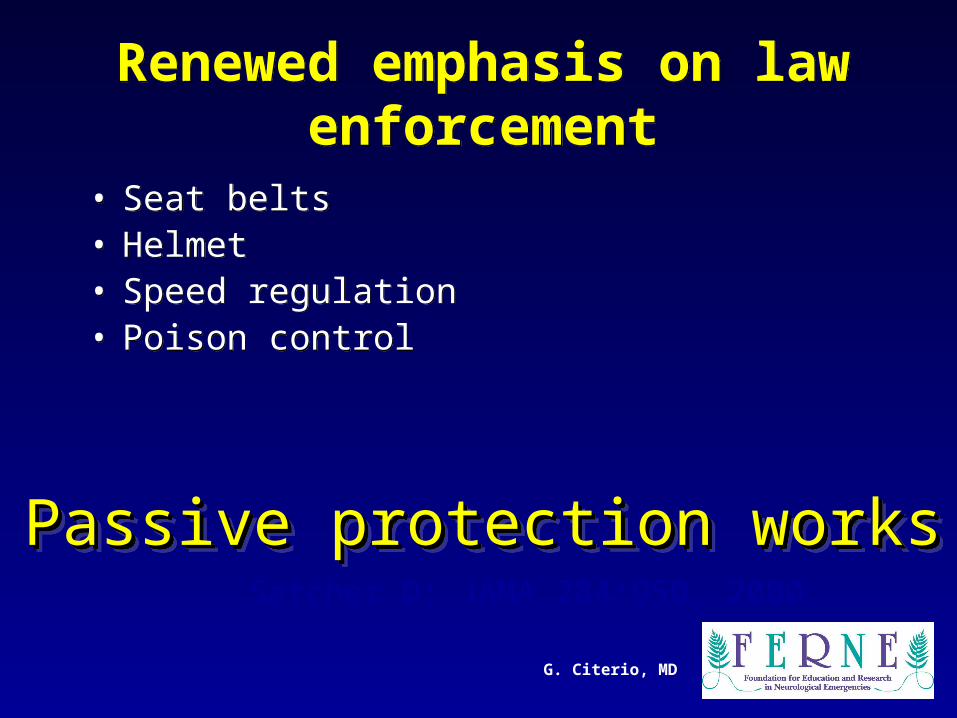
Renewed emphasis on law enforcement
Renewed emphasis on law enforcement
• Seat belts• Helmet• Speed regulation• Poison control
• Seat belts• Helmet• Speed regulation• Poison control
Satcher D: JAMA 284:950, 2000
Passive protection worksPassive protection worksPassive protection worksPassive protection works
G. Citerio, MD
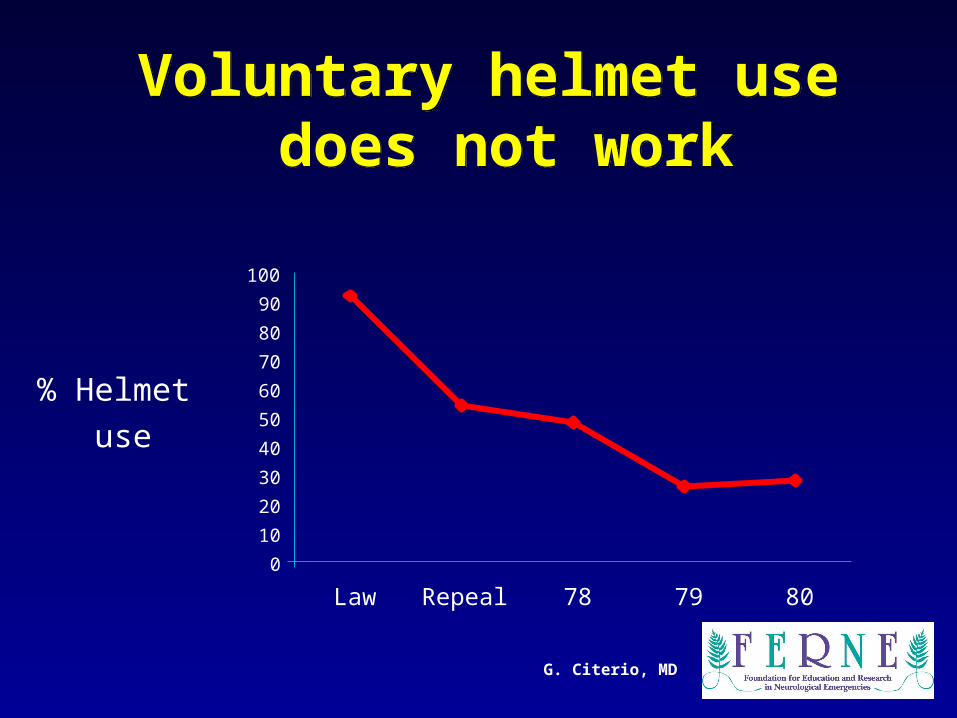
Voluntary helmet use does not work
Voluntary helmet use does not work
0
10
20
30
40
50
60
70
80
90
100
Law Repeal 78 79 80
% Helmet
use
G. Citerio, MD
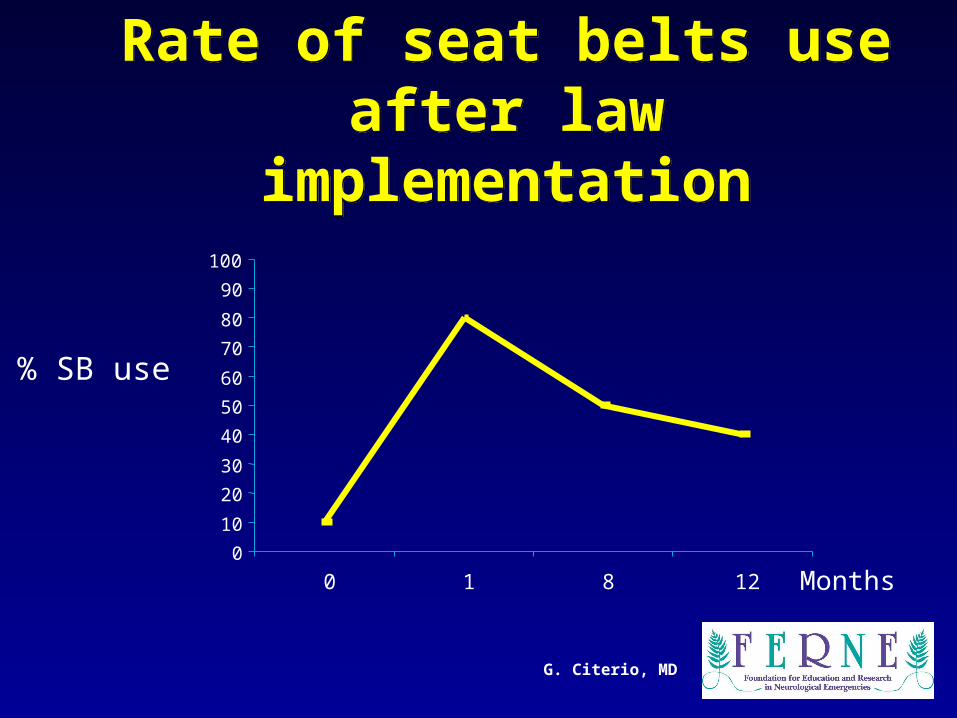
Rate of seat belts use after law implementation
Rate of seat belts use after law implementation
0
10
20
30
40
50
60
70
80
90
100
0 1 8 12
% SB use
Months
G. Citerio, MD
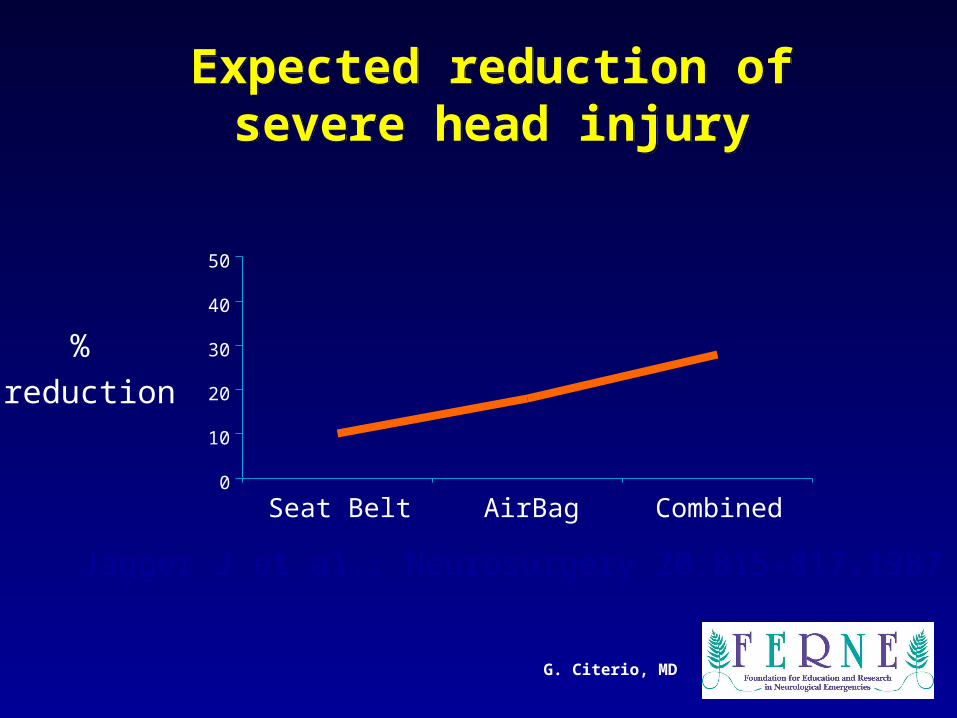
Expected reduction of severe head injury
Expected reduction of severe head injury
Jagger J et al.: Neurosurgery 20:815-817,1987
0
10
20
30
40
50
Seat Belt AirBag Combined
%
reduction
G. Citerio, MD
Violence is a leading cause of TBI--especially among males--and violence with firearms is the leading cause of TBI-associated death. Effective programs designed to decrease the occurrence of interpersonal and self-directed violence would help address this cause.
Violence is a leading cause of TBI--especially among males--and violence with firearms is the leading cause of TBI-associated death. Effective programs designed to decrease the occurrence of interpersonal and self-directed violence would help address this cause.
2. Violence2. Violence
G. Citerio, MD
Falls are the third leading cause of TBI-associated death. Among women over 75 years of age and men over 85 years of age, falls are the leading cause of TBI-associated death. Falls are also a major cause of nonfatal TBI.
Effective interventions may involve modifying the environment to reduce fall hazards and the impacts of falls and, where possible, reducing the use of medications with side effects that increase the risk of falling.
3. Falls3. Falls

Outcomes

G. Citerio, MD
Outcome trendData from literatureOutcome trendData from literature
20
40
60
Jennet TCDB Fearnside EBIC
Unfavourableoutcome
Favourableoutcome
Maas AIR: Neurosurgery 44:1286-1298; 1999
G. Citerio, MD
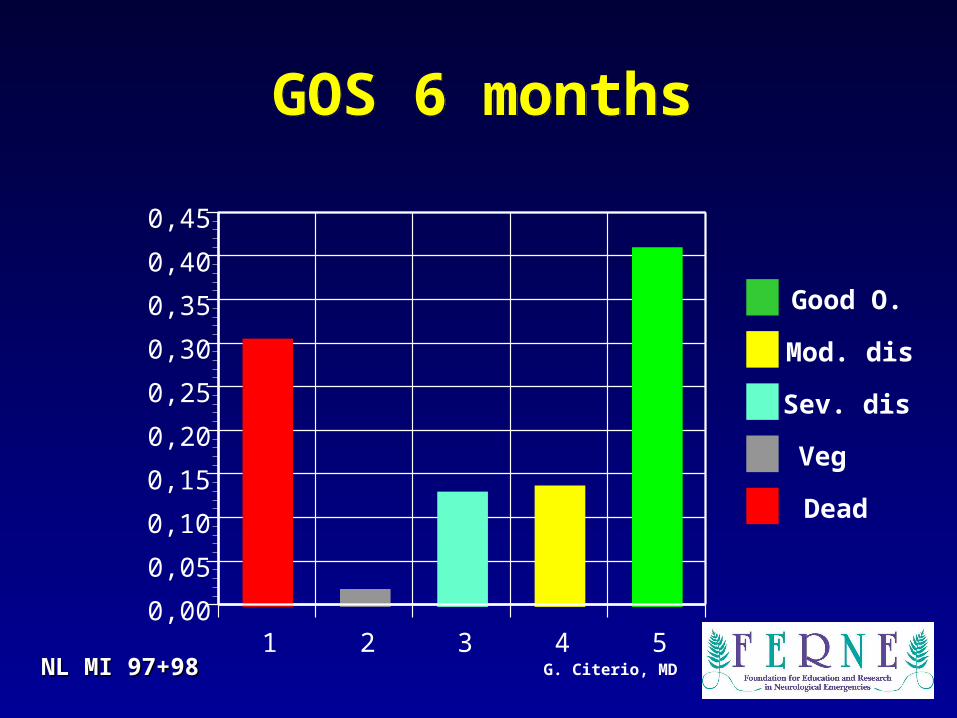
GOS 6 monthsGOS 6 months
1 2 3 4 50,00
0,05
0,10
0,15
0,20
0,25
0,30
0,35
0,40
0,45
NL MI 97+98NL MI 97+98
Dead
Veg
Sev. dis
Mod. dis
Good O.
G. Citerio, MD
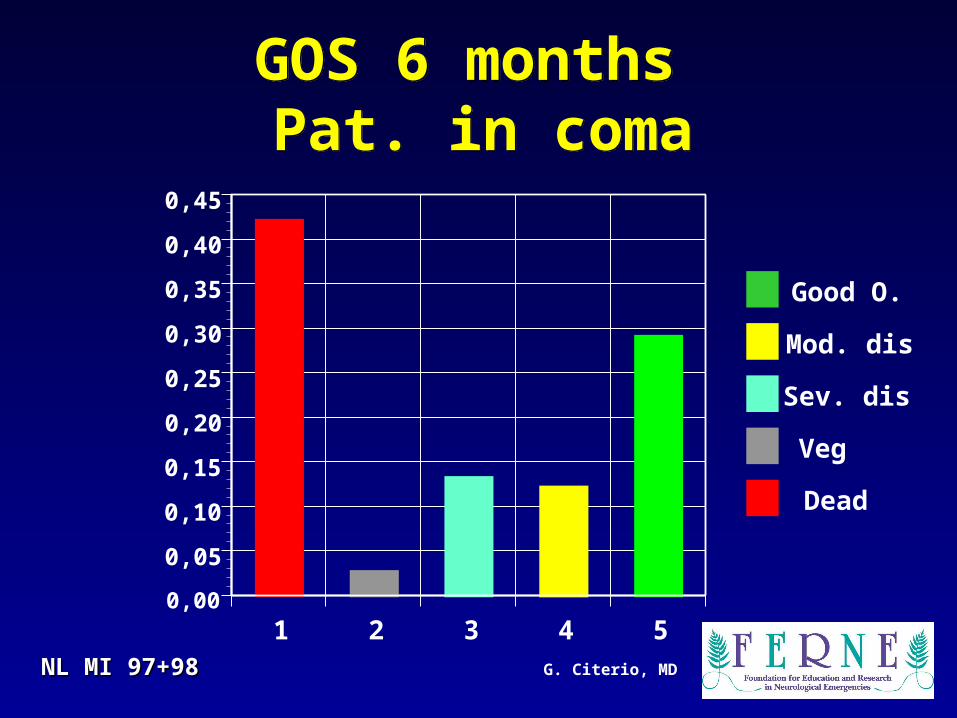
GOS 6 months Pat. in coma
GOS 6 months Pat. in coma
1 2 3 4 50,00
0,05
0,10
0,15
0,20
0,25
0,30
0,35
0,40
0,45
NL MI 97+98NL MI 97+98
Dead
Veg
Sev. dis
Mod. dis
Good O.
G. Citerio, MD
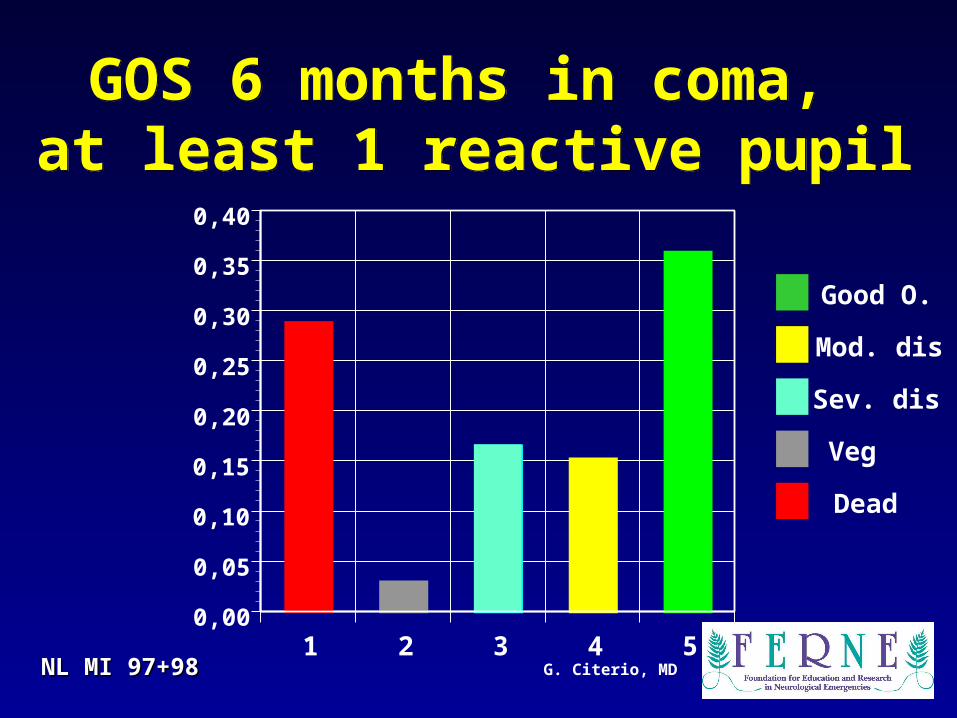
GOS 6 months in coma, at least 1 reactive pupil
GOS 6 months in coma, at least 1 reactive pupil
1 2 3 4 50,00
0,05
0,10
0,15
0,20
0,25
0,30
0,35
0,40
NL MI 97+98NL MI 97+98
Dead
Veg
Sev. dis
Mod. dis
Good O.

STROKE
G. Citerio, MD
• Stroke killed 158,448 people in 1998 and accounted for about 1 of every 14.8 deaths in the United States (is the most common life-threatening neurological disease).
• About 47 percent of these deaths occur out of hospital. Total mention mortality about 280,000.
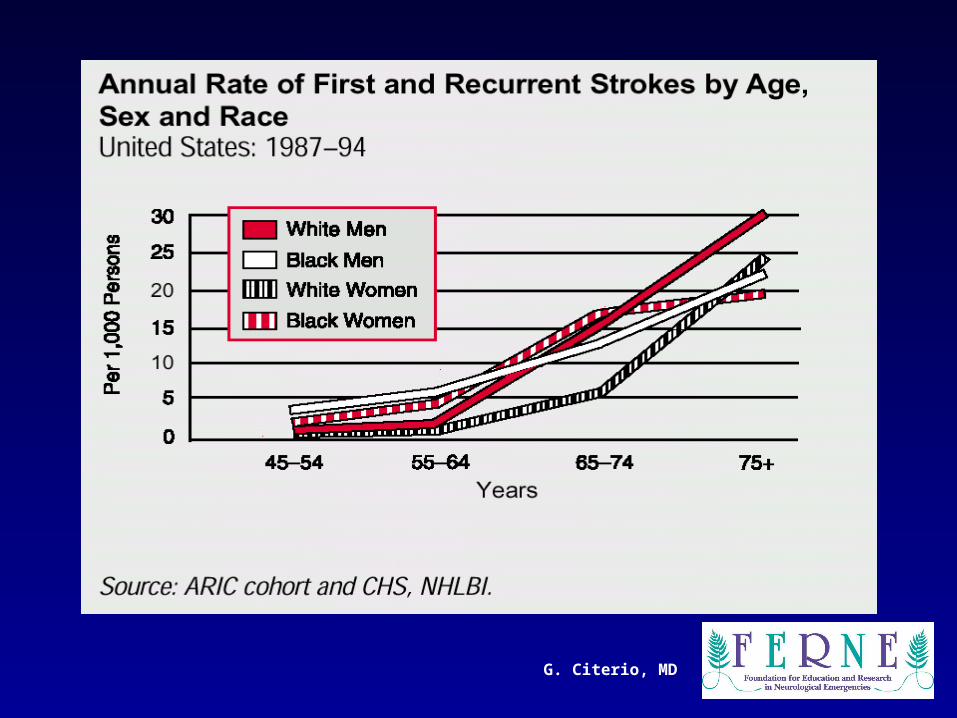
• The morbidity of stroke, i.e., incidence and prevalence, is shared about equally between men and women. At all ages, more women than men die of stroke.
• Stroke killed 158,448 people in 1998 and accounted for about 1 of every 14.8 deaths in the United States (is the most common life-threatening neurological disease).
• About 47 percent of these deaths occur out of hospital. Total mention mortality about 280,000.
• The morbidity of stroke, i.e., incidence and prevalence, is shared about equally between men and women. At all ages, more women than men die of stroke.
G. Citerio, MD
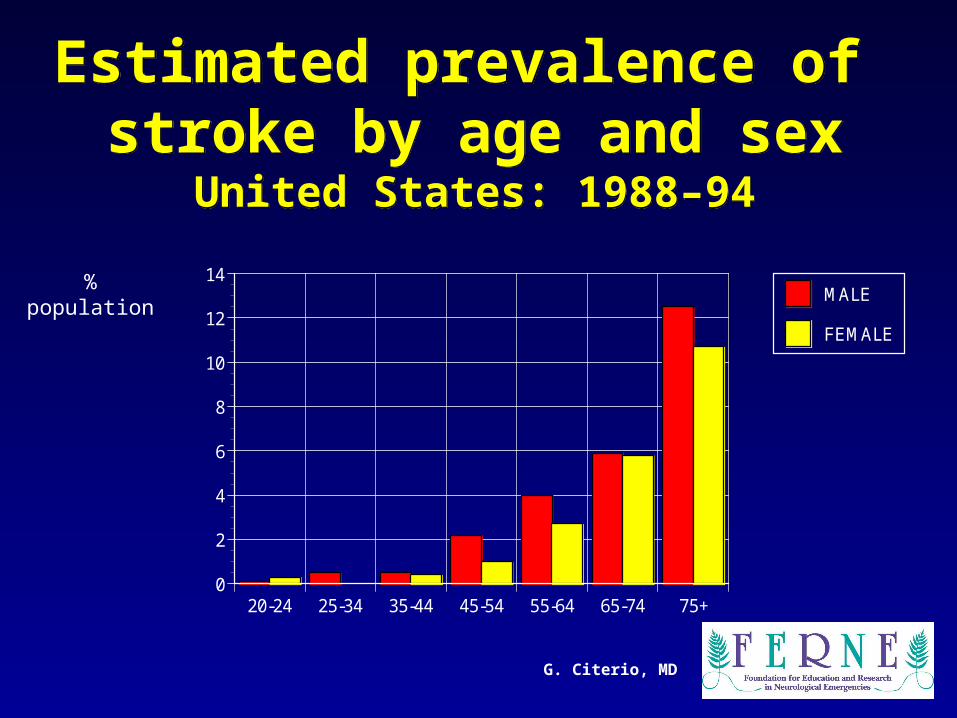
Estimated prevalence of stroke by age and sex
United States: 1988–94
Estimated prevalence of stroke by age and sex
United States: 1988–94
20-24 25-34 35-44 45-54 55-64 65-74 75+0
2
4
6
8
10
12
14MALE
FEMALE
%population
G. Citerio, MD
When considered separately from other cardiovascular diseases, stroke ranks as the third leading cause of death, behind diseases of the heart and cancer. (CDC/NCHS)
On average, someone in the United States suffers a stroke every 53 seconds; every 3.3 minutes someone dies of one.
Each year, about 600,000 people suffer a new or recurrent stroke. About 500,000 of these are first attacks, and 100,000 are recurrent attacks. (Framingham Heart Study, NHLBI)
G. Citerio, MD

G. Citerio, MD
G. Citerio, MD
The most common variety of complete strokes is atherothrombotic brain infarction, which accounts for 61 percent of all strokes (excluding TIAs).
The next most common is cerebral embolus (24 percent). (44-year follow-up of participants and 20-year follow-up of their offspring, Framingham Heart Study, NHLBI)
G. Citerio, MD
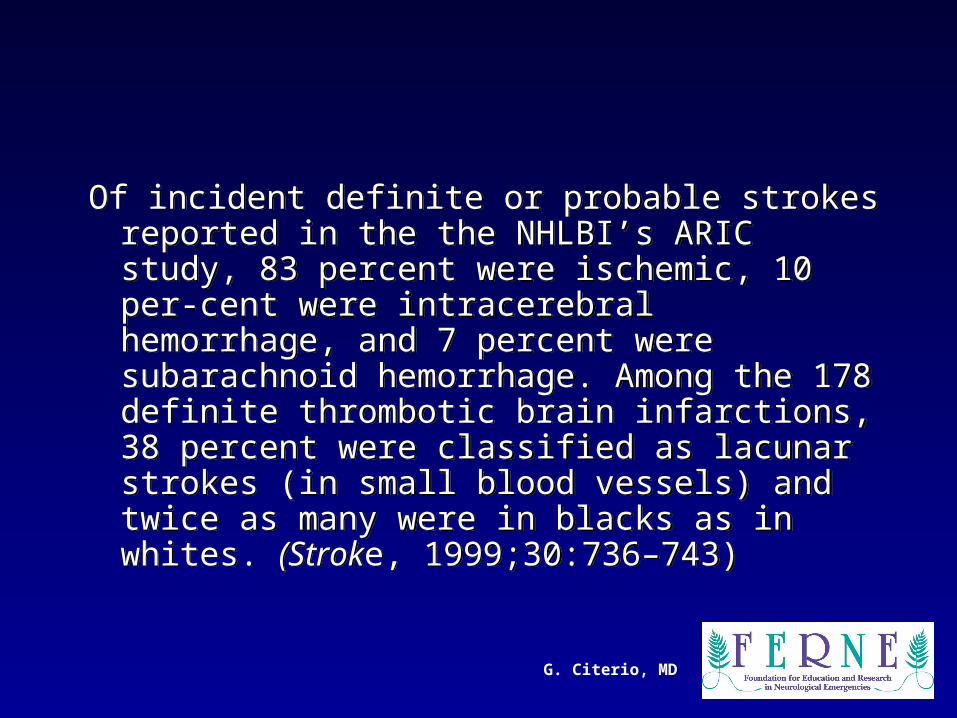
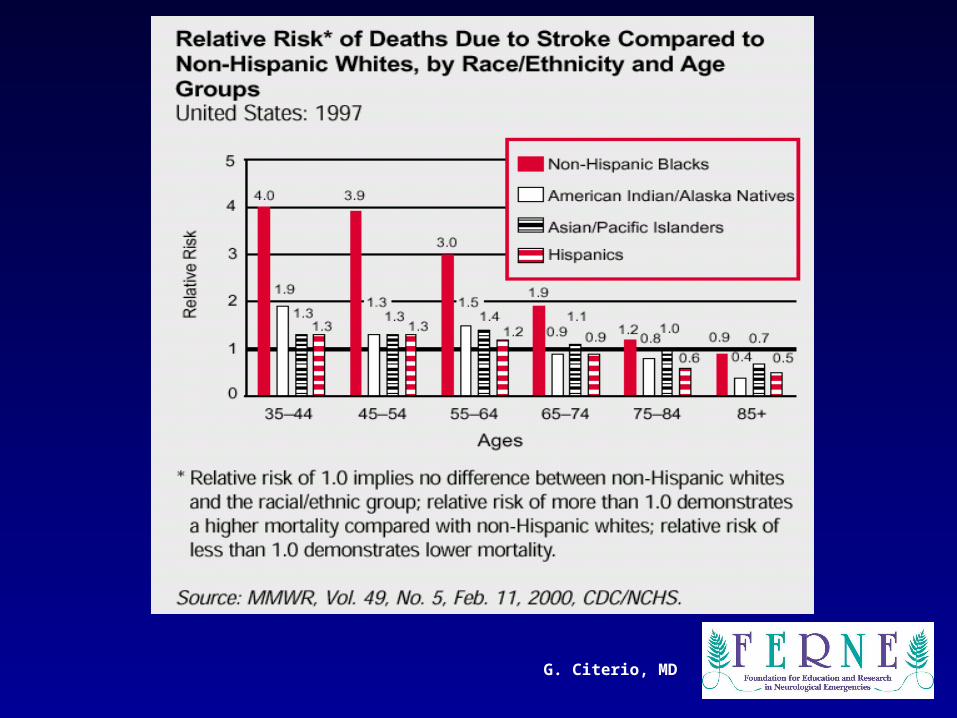
Of incident definite or probable strokes reported in the the NHLBI’s ARIC study, 83 percent were ischemic, 10 per-cent were intracerebral hemorrhage, and 7 percent were subarachnoid hemorrhage. Among the 178 definite thrombotic brain infarctions, 38 percent were classified as lacunar strokes (in small blood vessels) and twice as many were in blacks as in whites. (Stroke, 1999;30:736–743)
Of incident definite or probable strokes reported in the the NHLBI’s ARIC study, 83 percent were ischemic, 10 per-cent were intracerebral hemorrhage, and 7 percent were subarachnoid hemorrhage. Among the 178 definite thrombotic brain infarctions, 38 percent were classified as lacunar strokes (in small blood vessels) and twice as many were in blacks as in whites. (Stroke, 1999;30:736–743)
G. Citerio, MD
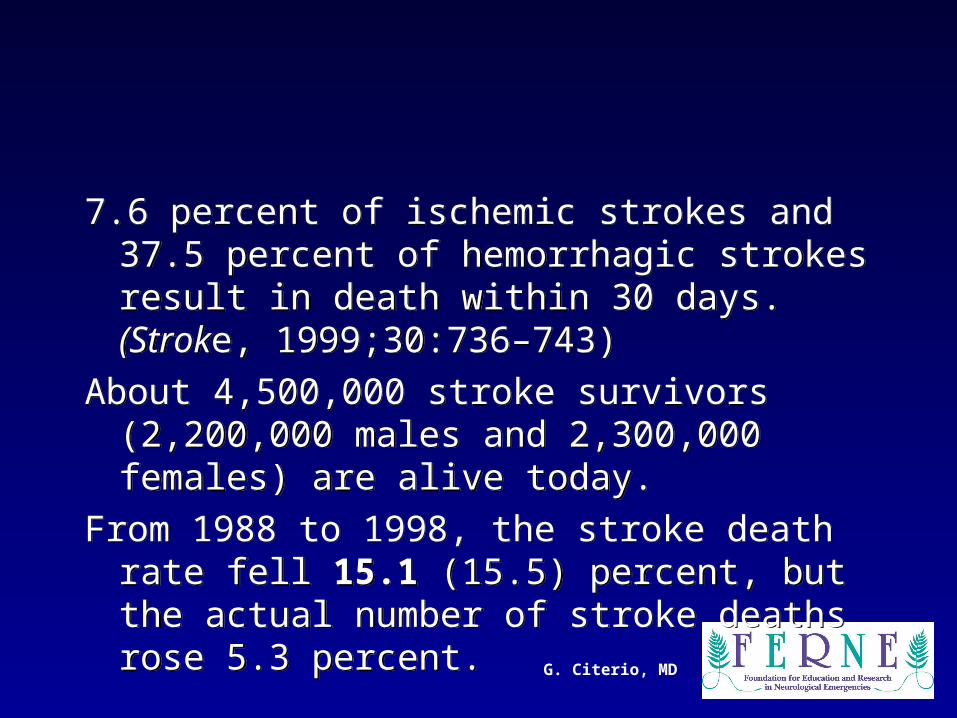
7.6 percent of ischemic strokes and 37.5 percent of hemorrhagic strokes result in death within 30 days. (Stroke, 1999;30:736–743)
About 4,500,000 stroke survivors (2,200,000 males and 2,300,000 females) are alive today.
From 1988 to 1998, the stroke death rate fell 15.1 (15.5) percent, but the actual number of stroke deaths rose 5.3 percent.
G. Citerio, MD
G. Citerio, MD
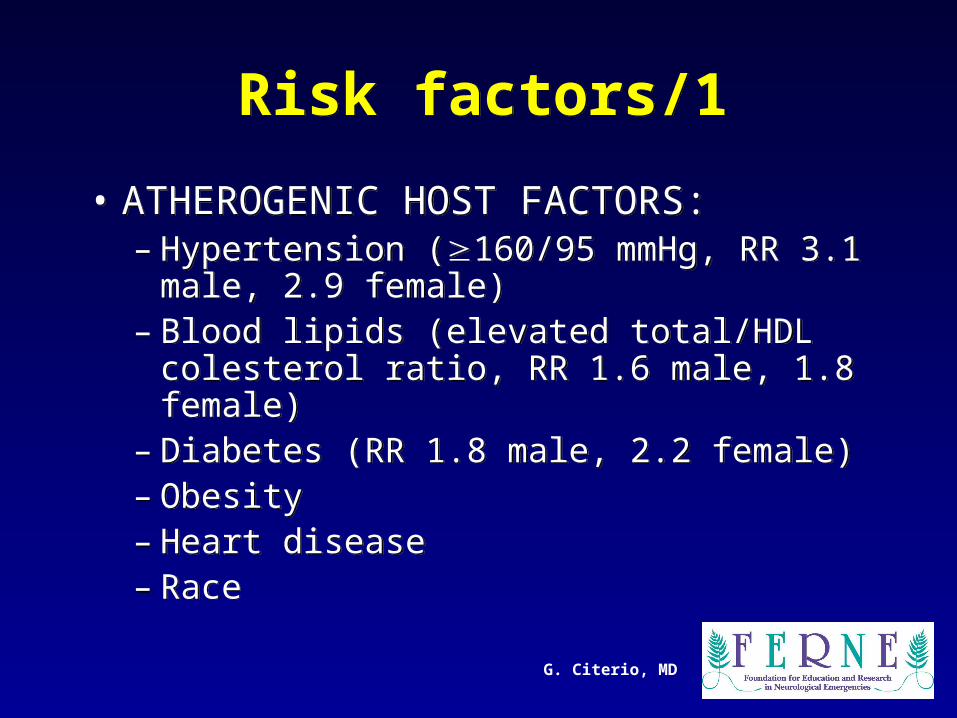
Risk factors/1Risk factors/1
• ATHEROGENIC HOST FACTORS:– Hypertension (160/95 mmHg, RR 3.1
male, 2.9 female)– Blood lipids (elevated total/HDL colesterol
ratio, RR 1.6 male, 1.8 female)– Diabetes (RR 1.8 male, 2.2 female)– Obesity – Heart disease– Race
• ATHEROGENIC HOST FACTORS:– Hypertension (160/95 mmHg, RR 3.1
male, 2.9 female)– Blood lipids (elevated total/HDL colesterol
ratio, RR 1.6 male, 1.8 female)– Diabetes (RR 1.8 male, 2.2 female)– Obesity – Heart disease– Race
G. Citerio, MD
G. Citerio, MD
G. Citerio, MD

G. Citerio, MD
Risk factors/2Risk factors/2
• ENVIRONMENTAL FACTORS:– Cigarette smoking (increased risk of SAH,
RR 4-9, and stroke)– Oral contraceptives (RR 5)– Heavy alcohol consumption (U shape
relationship)– Physical activity
• ENVIRONMENTAL FACTORS:– Cigarette smoking (increased risk of SAH,
RR 4-9, and stroke)– Oral contraceptives (RR 5)– Heavy alcohol consumption (U shape
relationship)– Physical activity
G. Citerio, MD
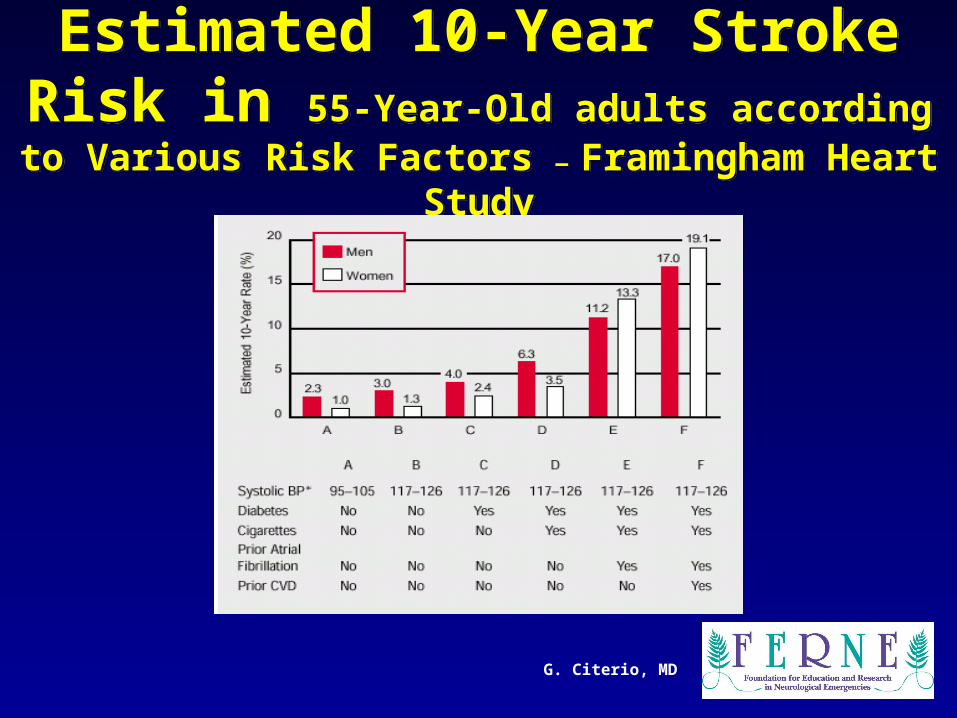
Estimated 10-Year Stroke Risk in 55-Year-Old adults according to Various Risk
Factors — Framingham Heart Study
Estimated 10-Year Stroke Risk in 55-Year-Old adults according to Various Risk
Factors — Framingham Heart Study
G. Citerio, MD
G. Citerio, MD
G. Citerio, MD
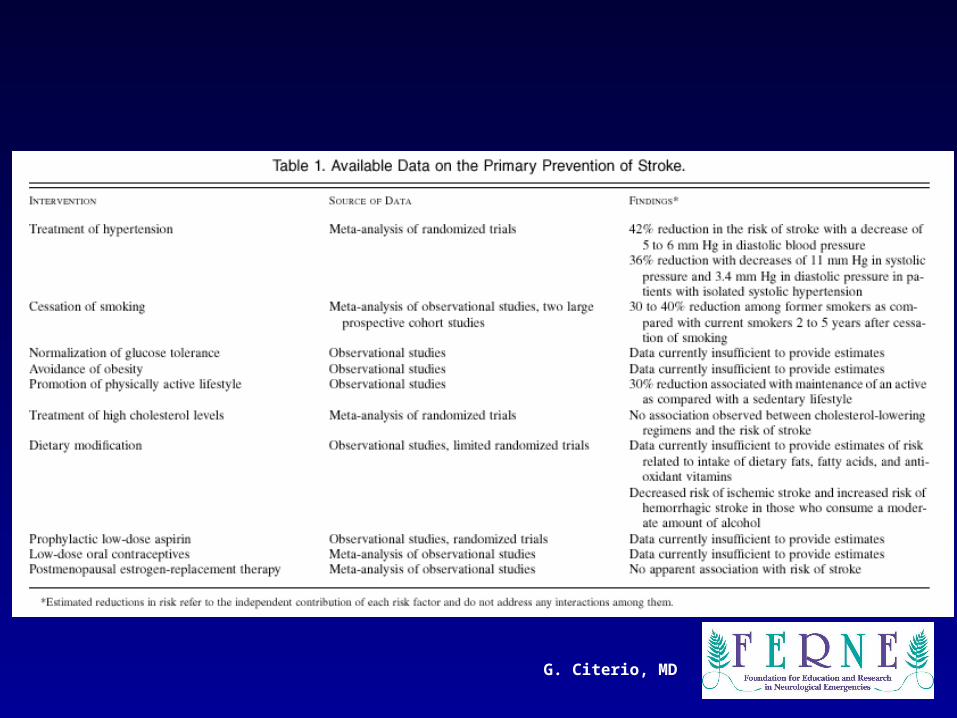
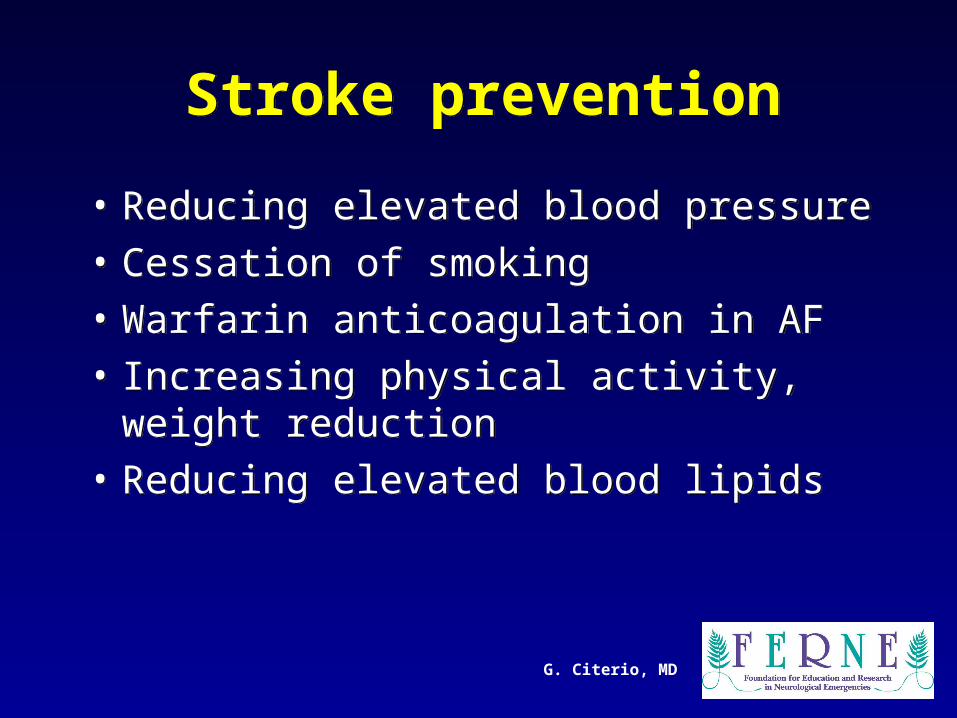
Stroke preventionStroke prevention
• Reducing elevated blood pressure
• Cessation of smoking
• Warfarin anticoagulation in AF
• Increasing physical activity, weight reduction
• Reducing elevated blood lipids
• Reducing elevated blood pressure
• Cessation of smoking
• Warfarin anticoagulation in AF
• Increasing physical activity, weight reduction
• Reducing elevated blood lipids

G. Citerio, MD