epidemiology of hypertension - university of california ... of htn franklin feb 2012.pdf · agenda:...
TRANSCRIPT

Epidemiology of Hypertension
Stanley S. Franklin, MD, FACP, FACC
Clinical Professor of MedicineUniversity of California at IrvineAssociate Medical DirectorUCI Heart Disease Prevention ProgramIrvine, California

Agenda: epidemiology of hypertension
1 BP measurement
2 Defining hypertension
3 Important public health problem
4 Global risk assessment
5 Intervention trials
6 Management strategies
7 Barriers to treatment
8 Prevention strategies
1 BP measurement
2 Defining hypertension
3 Important public health problem
4 Global risk assessment
5 Intervention trials
6 Management strategies
7 Barriers to treatment
8 Prevention strategies

1. How to measureblood pressure?

Nokolai Korotkoff, 1905
Ascultatory method ofblood pressure measurement

S:\SLIDES\2005\V\ASH_Rsnt-HTN-Shortr_OS.ppt
• Measurement error
• Small number of readings
• White coat effect
• No measure of the diurnal changes of BP
Auscultatory clinic/ office errors:

BP Measurement Techniques
Method Brief Description
In-office Two readings, 5 minutes apart, sitting in chair. Confirm elevated reading in contralateral arm.
Ambulatory BP monitoring Indicated for evaluation of “white-coat” HTN. Absence of 10–20% BP decrease during sleep may indicate increased CVD risk.
Self-measurement Provides information on response to therapy. May help improve adherence to therapy and evaluate “white-coat” HTN.

135/85 Ambulatory Pressure
140/90
Clinic Pressure Sustained
HypertensionWhite Coat Hypertension
True Normotension
Masked Hypertension
24-hour ambulatory monitoring (ABM)

Self-Measurement of BP
Provides information useful for:1. assessing response to antihypertensive Rx2. improving adherence with therapy 3. evaluating white-coat HTN & masked HTN
Home BP is more strongly related to target organ damage and has better prognostic accuracy than office BP.

150/90140/85130/80
(>135/85)(<135/85) Day-time ambulatory BP
AHA/ASH Scientific Statment

2. Defining Hypertension:
(a) By the numbers?≥95 DBP160/95140/90130/85
>120/80
“A number at which the benefits of intervention exceed those of inaction”
2098 Franklin #11
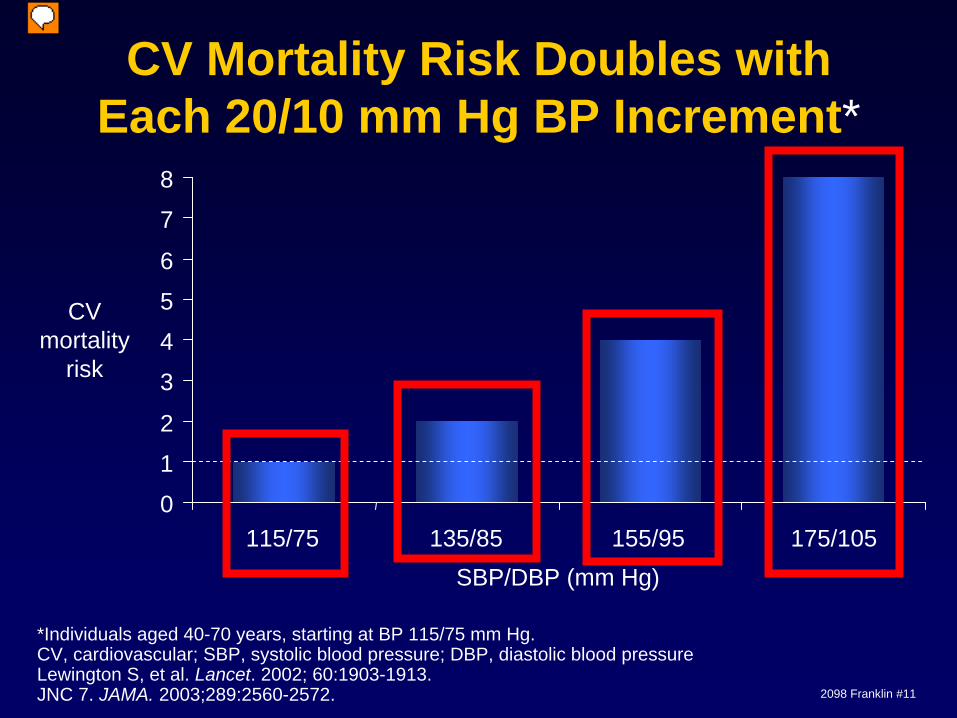
CV Mortality Risk Doubles with Each 20/10 mm Hg BP Increment*
*Individuals aged 40-70 years, starting at BP 115/75 mm Hg.CV, cardiovascular; SBP, systolic blood pressure; DBP, diastolic blood pressureLewington S, et al. Lancet. 2002; 60:1903-1913. JNC 7. JAMA. 2003;289:2560-2572.
CV mortality
risk
SBP/DBP (mm Hg)
0
1
2
3
4
5
6
7
8
115/75 135/85 155/95 175/105

2098 Franklin #12
JNC Reclassification of BP Based on Risk
Source for JNC VI: Arch Intern Med. 1997;157:2413-2446.Adapted with permission from Chobanian AV et al. Hypertension. 2003;42:1206-1252.
JNC VIJNC VISBP
(mm Hg)SBP
(mm Hg)DBP
(mm Hg)DBP
(mm Hg)SBP
(mm Hg)SBP
(mm Hg)DBP
(mm Hg)DBP
(mm Hg)
Optimal Normal80 <120<120 and 80andNormal
Hi-normalPrehypertension
120-129
130-139120-139
80-84
or 85-89
and80-89or
Stage 1
HypertensionStage 1140-159 140-15990-99or 90-99or
Stage 2
Stage 3Stage 2
160-179
≥180≥160
100-109or
≥110or≥100or
CategoryCategory CategoryCategoryJNC 7JNC 7
BP CategoryBP Category PrevalencePrevalence
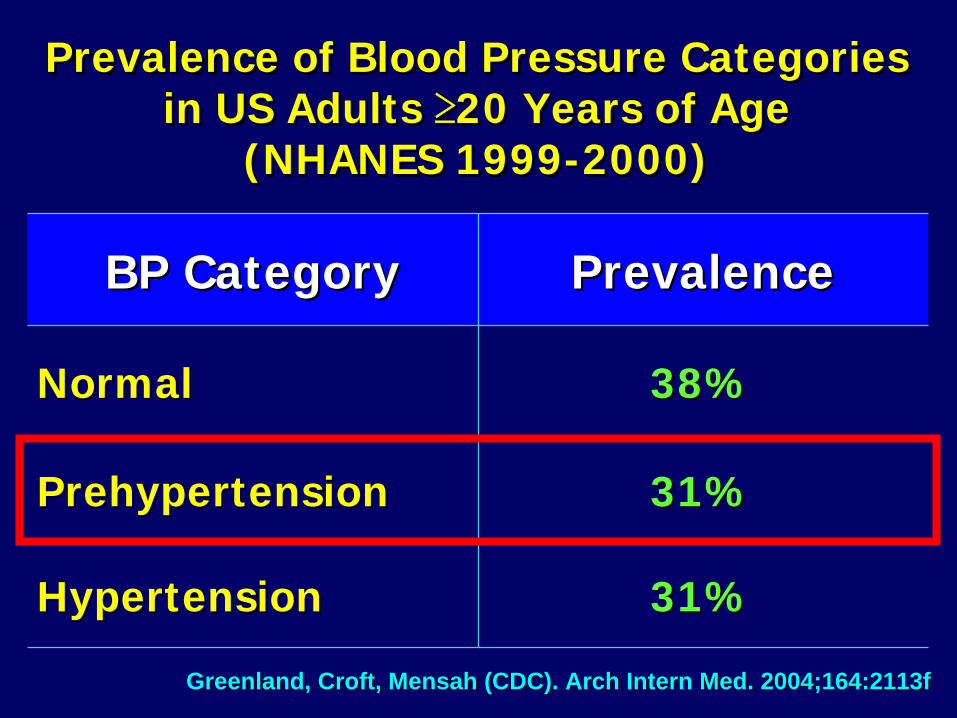
NormalNormal 38%38%
PrehypertensionPrehypertension 31%31%
HypertensionHypertension 31%31%
Prevalence of Blood Pressure Categories in US Adults ≥20 Years of Age
(NHANES 1999-2000)
Prevalence of Blood Pressure Categories Prevalence of Blood Pressure Categories in US Adults in US Adults ≥≥20 Years of Age 20 Years of Age
(NHANES 1999(NHANES 1999--2000)2000)
Greenland, Croft, Greenland, Croft, MensahMensah (CDC). Arch Intern Med. 2004;164:2113f(CDC). Arch Intern Med. 2004;164:2113f
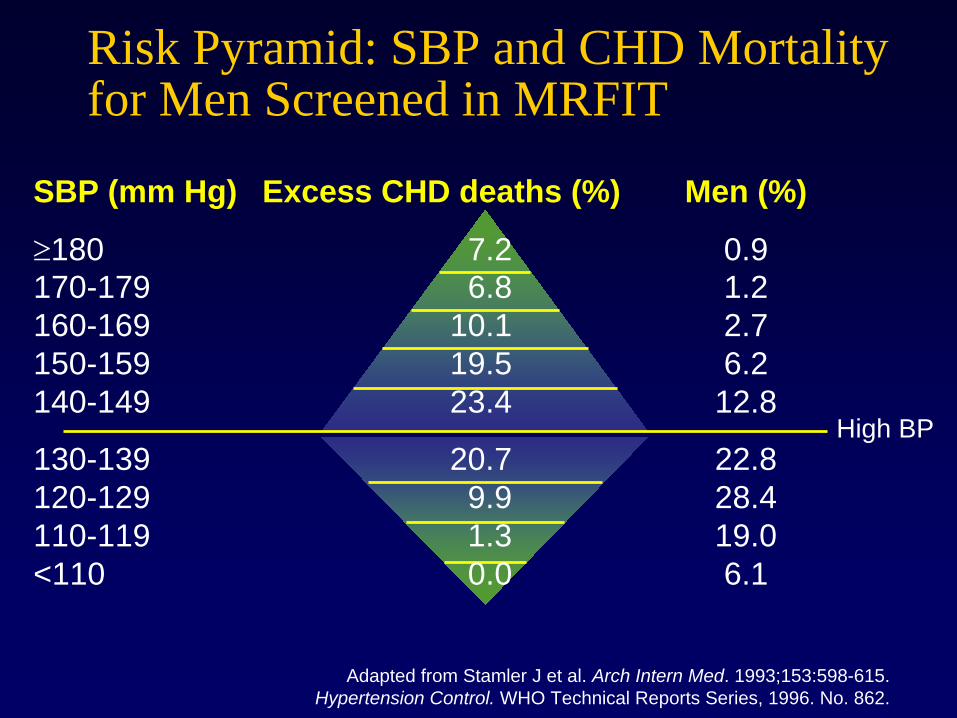
Risk Pyramid: SBP and CHD Mortality for Men Screened in MRFIT
Adapted from Stamler J et al. Arch Intern Med. 1993;153:598-615.Hypertension Control. WHO Technical Reports Series, 1996. No. 862.
SBP (mm Hg) Excess CHD deaths (%) Men (%)
180 7.2 0.9 170-179 6.8 1.2 160-169 10.1 2.7 150-159 19.5 6.2 140-149 23.4 12.8
130-139 20.7 22.8 120-129 9.9 28.4 110-119 1.3 19.0 <110 0.0 6.1
High BP
Defining Hypertension:
(b) By hemodynamic mechanism?
Increased peripheral vascular resistance
versus
Increased large artery stiffness

The Arterial Pulse Wave
75
125
Pres
sure
(mm
Hg)
Systolic Systolic pressurepressure
Diastolic Diastolic pressurepressure
Mean pressureMean pressure
Diastolic decay Diastolic decay curvecurve
DicroticDicrotic notchnotch(aortic valve closes)(aortic valve closes)
Time
Pulse Pulse pressurepressure
= 1/3 SBP + 2/3 DBP

Hemodynamic Components of BP
MAP - STEADY COMPONENT (due to CO and SVR)
• PP – PULSATILE COMPONENT (due to LV ejection
and elastic artery stiffness)
• SBP – rises with increased resistance and stiffness
• DBP – rises with increased resistance and decreases
with increased stiffness
Elzinga G, Westerhof N. Circ Res 1973;32:178-186. Yano, et al. Basic Res Cardiol 1997;92:115-122.Berne RM, Levy MN. Cardiovascular Physiology 1992:135-151.
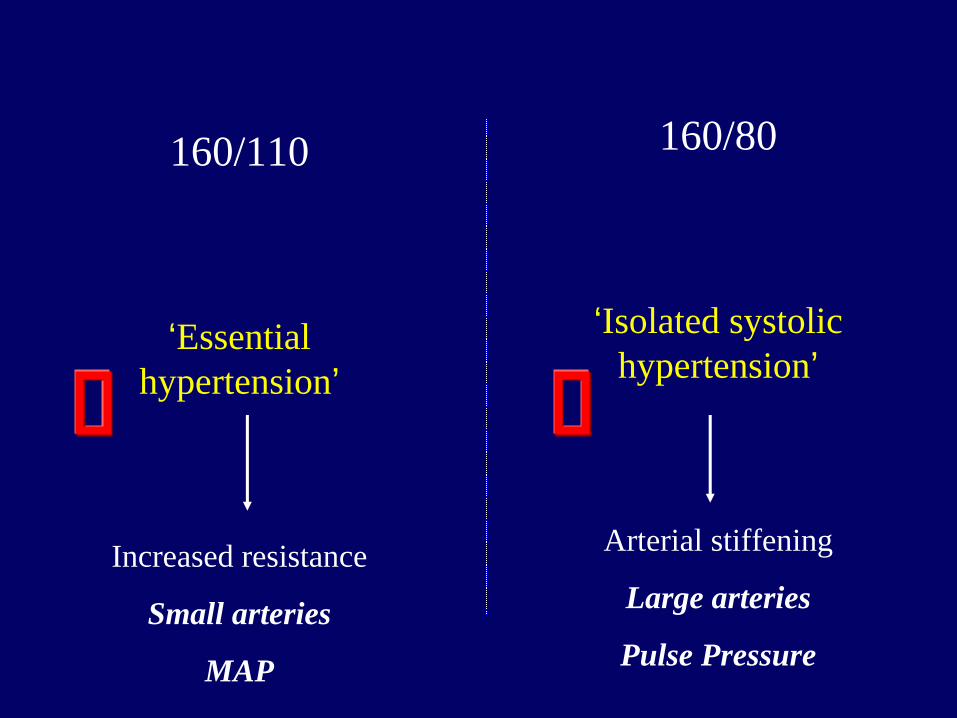
160/80
‘Isolated systolic hypertension’
Arterial stiffening
Large arteries
Pulse Pressure
160/110
‘Essential hypertension’
Increased resistance
Small arteries
MAP
Defining Hypertension:
(c) By subtype?
IDH, SDH, ISH
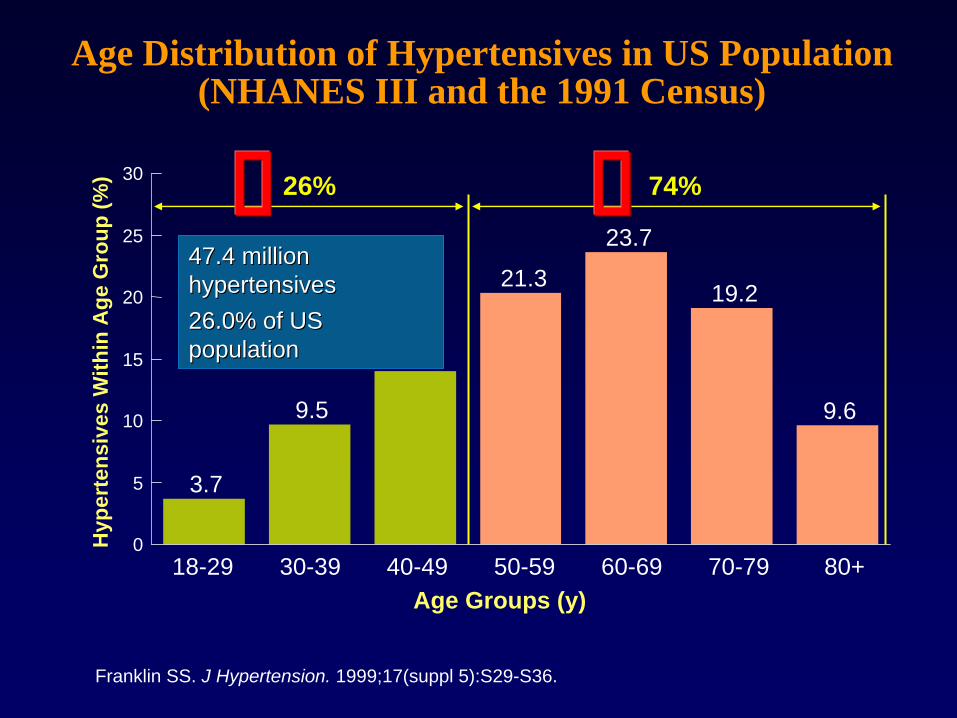
Age Distribution of Hypertensives in US Population (NHANES III and the 1991 Census)
3.7
9.5
13
21.3
23.7
19.2
9.6
0
5
10
15
20
25
30
18-29 30-39 40-49 50-59 60-69 70-79 80+
Hyp
erte
nsiv
esW
ithin
Age
Gro
up (%
)
Franklin SS. J Hypertension. 1999;17(suppl 5):S29-S36.
Age Groups (y)
47.4 million 47.4 million hypertensiveshypertensives26.0% of US 26.0% of US populationpopulation
26% 74%

<40 40-49 50-59 60-69 70-79 80+Age (y)
17% 16% 16% 20% 20% 11%
Distribution of Hypertension Subtype in the Untreated Distribution of Hypertension Subtype in the Untreated Hypertensive Population by Age Hypertensive Population by Age (NHANES III)(NHANES III)
ISH (SBP 140 mm Hg and DBP <90 mm Hg) SDH (SBP 140 mm Hg and DBP 90 mm Hg)IDH (SBP <140 mm Hg and DBP 90 mm Hg)
0
20
40
60
80
100
Numbers at top of bars represent the overall percentage distribution of untreated hypertension by age.Franklin et al. Hypertension. 2001;37: 869-874.
Frequency of hypertension
subtypes in all untreated
hypertensives(%)
} Diastolic Hypertension

An Analysis of NHANES III Blood Pressure DataSummary: Hypertensives fall into one of two
categories:
1. A smaller (26%), younger (age 50 years), predominantly male (63%) with diastolic hypertension out of proportion to systolic hypertension (primarily IDH and SDH)
2. A larger (74%), older (age 50 years), predominantly female (58%) with systolic hypertension out of proportion to diastolic hypertension (primarily ISH).
Summary: Hypertensives fall into one of two categories:
1. A smaller (26%), younger (age 50 years), predominantly male (63%) with diastolic hypertension out of proportion to systolic hypertension (primarily IDH and SDH)
2. A larger (74%), older (age 50 years), predominantly female (58%) with systolic hypertension out of proportion to diastolic hypertension (primarily ISH).
Franklin et al. Hypertension 2001;37: 869-874

Residual Lifetime Risk for Hypertension From Age 55
Vasan RS et al. JAMA. 2002;287:1003-1010.
Individuals who are normotensive at age 55 have a 90% lifetime risk of developing hypertension
Ris
k fo
r Hyp
erte
nsio
n (%
)
Time (Years)10 15 20 25
0
20
40
60
80
100
52
8391
7256
88 9378
WomenMen

Vasan, R. S. Hypertension 2009;54:454-456
Evolution of BP over the life course and constellation of factors influencing BP

2098 Franklin #25
3. Why is hypertension considered a major Public health problem in the United States?
Firstly, hypertension is very common In the adult population
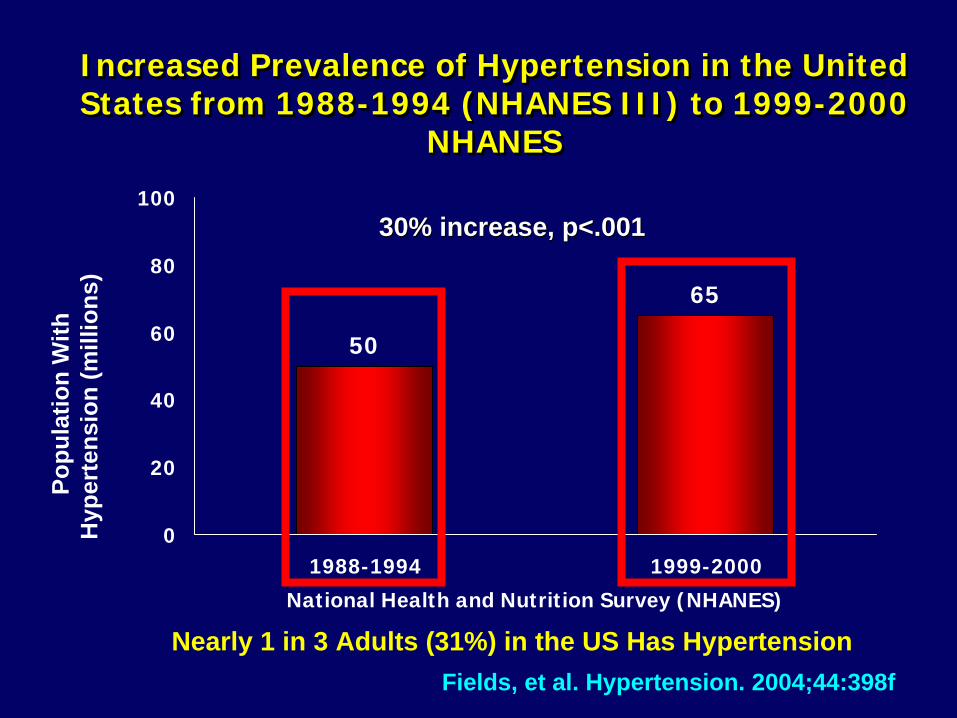
50
65
0
20
40
60
80
100
1988-1994 1999-2000
National Health and Nutrition Survey (NHANES)
Increased Prevalence of Hypertension in the United States from 1988-1994 (NHANES III) to 1999-2000
NHANES
Increased Prevalence of Hypertension in the United Increased Prevalence of Hypertension in the United States from 1988States from 1988--1994 (NHANES III) to 19991994 (NHANES III) to 1999--2000 2000
NHANESNHANES
Fields, et al. Hypertension. 2004;44:398f
Popu
latio
n W
ith
Hyp
erte
nsio
n (m
illio
ns)
30% increase, p<.00130% increase, p<.001
Nearly 1 in 3 Adults (31%) in the US Has Hypertension

2098 Franklin #27
Trends in Prevalence of Hypertension in the US Population, by Race/Ethnicity,1988-2000
0
5
10
15
20
25
30
35
Prev
alen
ce (%
)
Non-Hispanic White Non-Hispanic Black Mexican American
1988-19911991-19941999-2000
*p<0.01, **p<0.001,compared to Non-Hispanic Whites within given time period; no significant trends across time periods within gender; analyses are age-adjusted to 2000 US population. Data from Hajjar I, Kotchen TA. Trends in prevalence, awareness, treatment, and control of hypertension in the United States, 1988- 2000. JAMA 2003; 290: 199-206.
** ****
* *

Chobanian A. N Engl J Med 2009;361:878-887
Hypertension Paradox: Changes in the Prevalence and Control ofHypertension in the United States (1988-2004)
Rate of control:27% to 35%

Colors of Salt
• White• Black• Red• Yellow• Green• Brown• Clear
• Table salt• Soy sauce• Catsup• Mustard• Pickles• Soups & gravies• Saline

The connection between salt, obesity, hypertension and CVD mortality• During the past 25 years salt intake has
increased by 1/3 to 150-170 mmol/day (3.5 to 4.0 g sodium/day).
• This has contributed to the growing obesity epidemic and increased prevalence of hypertension by causing increased intake of high-calorie soft drinks containing corn sugar
• Recent studies suggests that a decrease of 50 mmol/day below the current level (a reduction of 1/3) would decrease BP by 4.0/2.5 mm Hg in hypertensives and reduce CVD mortality in the US by more than 100,000/yr.
• During the past 25 years salt intake has increased by 1/3 to 150-170 mmol/day (3.5 to 4.0 g sodium/day).
• This has contributed to the growing obesity epidemic and increased prevalence of hypertension by causing increased intake of high-calorie soft drinks containing corn sugar
• Recent studies suggests that a decrease of 50 mmol/day below the current level (a reduction of 1/3) would decrease BP by 4.0/2.5 mm Hg in hypertensives and reduce CVD mortality in the US by more than 100,000/yr.
Secondly, hypertension is associated with considerable
cardiovascular risk.
3. Why is hypertension considered a major Public health problem in the United States?
32

2098 Franklin #33
Global Mortality 2000: Impact of Hypertension and Other Health Risk Factors
EzzatiEzzati et al. et al. Lancet.Lancet. 2002;360:13472002;360:1347--1360.1360.Attributable Mortality Attributable Mortality
(In thousands; total 55,861,000)(In thousands; total 55,861,000)
High mortality, developing regionHigh mortality, developing regionLower mortality, developing regionLower mortality, developing regionDeveloped regionDeveloped region
00 8000800070007000600060005000500040004000300030002000200010001000
High blood pressureHigh blood pressure
TobaccoTobacco
High cholesterolHigh cholesterol
Unsafe sexUnsafe sex
High BMIHigh BMI
Physical inactivityPhysical inactivity
AlcoholAlcohol
Indoor smoke from solid fuelsIndoor smoke from solid fuels
Iron deficiencyIron deficiency
UnderweightUnderweight

Is it a true risk factor or a risk marker?
A true risk factor is suspected of being causative of the disease process.
A risk marker is associated with the disease process without being in the causal pathway.

TIA = transient ischemic attack; LVH = left ventricular hypertrophy; CHD = coronary heart disease HF = heart failure. Cushman WC. J Clin Hypertens. 2003;5(Suppl):14-22.
Retinopathy Renal failurePeripheral vascular
disease
Complications of Hypertension:
LVH, CHD, HF
TIA, stroke
Hypertension Hypertension is a risk factoris a risk factor

Elevated pulse pressure, an indirect (but important) measure of increased vascular stiffness Elevated pulse pressure, an indirect (but important) measure of increased vascular stiffness
Associated with:• Cardiac complications:
LVH
Atrial fibrillation
Systolic and diastolic dysfunction
Heart failure
• Large artery complications:
Myocardial infarction
Stroke
• Microvascular complications:
White matter lesions, cognitive impairment, dementia
Renal disease

2098 Franklin #37
:“Diabesity”

Association of Systolic BP and CV Death in Type 2 Diabetes
0
25
50
75
100
125
150
175
200
225
250
<120 120–139 140–159 160–179 180–199 200
Without diabetesWith diabetes
CV
mor
talit
y ra
te/
10,0
00 p
erso
n-y
Systolic BP (mm Hg)Stamler et al. Diabetes Care. 1993;16:434.

Stages of Chronic Kidney Disease
Stage Description GFRmL/min/1.73 m2
1 Kidney damage with normal or increased GFR
≥
90
2 Kidney damage with mild decreased GFR
60-89
3 Moderate decreased GFR 30-59
4 Severe decreased GFR 15-29
5 Kidney failure < 15 (or dialysis)

Proteinuria Is an Independent Risk Factor for Mortality in Type 2 Diabetes
1.0
0.9
0.8
0.7
0.6
0.50 1 2 3 4 5 6
Years
Sur
viva
l(a
ll-ca
use
mor
talit
y)
Normoalbuminuria(n=191)
Microalbuminuria(n=86)
Macroalbuminuria(n=51)
P<0.01, normo- vs micro- and macroalbuminuria.P<0.05, micro- vs macroalbuminuria.
Gall et al. Diabetes. 1995;44:1303.

Diabetes: The Most Common Cause of ESRD
United States Renal Data System. Annual data report. 2000.
Primary Diagnosis for Patients Who Start Dialysis
Diabetes50.1%
Hypertension27%
Glomerulonephriti s13%
Other10% No. of patients
Projection95% CI
1984 1988 1992 1996 2000 2004 20080
100
200
300
400
500
600
700
r2=99.8%243,524
281,355520,240
No.
of d
ialy
sis
patie
nts
(thou
sand
s)

ESRD in the USA 2002
↓ Mortality from MI & stroke over past 30 years ↑ Life expectancy contributed to ↑ ESRD Currently in USA > 300,000 patients on dialysis The cost exceeds $ 60,000 per patient per year Twenty one billion $ projected cost in 2002 First year mortality ~ 20% ~ 50% of deaths are cardiac (USRDS)
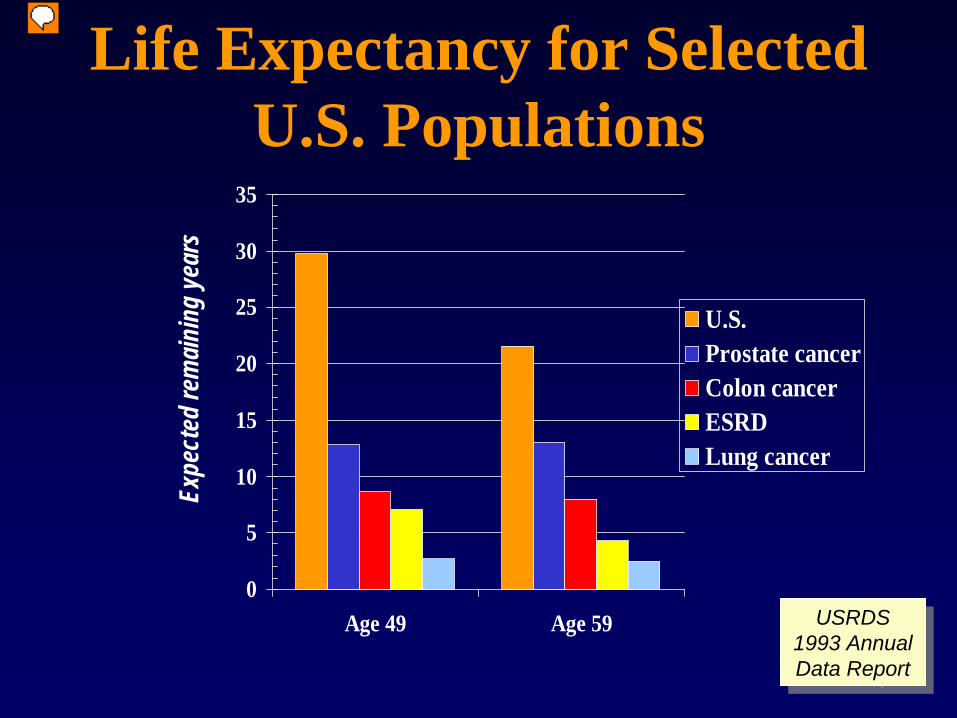
Life Expectancy for Selected U.S. Populations
0
5
10
15
20
25
30
35
Age 49 Age 59
U.S.Prostate cancerColon cancerESRDLung cancer
USRDS 1993 Annual Data Report
USRDS 1993 Annual Data Report
Expe
cted
rem
ainin
g ye
ars

Thirdly, there is considerablereduction in cardiovascular riskwith effective lowering of blood
pressure with therapy.
3. Why is hypertension considered a major Public health problem in the United States?

35%-40%
20%-25%
>50%
Average reduction in events
(%)
–60
–50
–40
–30
–20
–10
0Stroke
Myocardialinfarction Heart failure
Blood Pressure Lowering Treatment Trialists’ Collaboration. Lancet. 2000;355:1955-1964.
Long-Term Antihypertensive Therapy Significantly Reduces CV Events

Fourthly, there is insufficientawareness, treatment andcontrol of hypertension.
3. Why is hypertension considered a major Public health problem in the United States?

01020304050607080
Hypertension Awareness, Treatment, and Control: US 1976 to 2000*
NHANES III NHANES III (Phase 2) (Phase 2) 19911991--19941994
NHANES III NHANES III (Phase 1) (Phase 1) 19881988--19911991
51%51%
73%73% 68%68%
31%31%
55%55% 54%54%
10%10%
29%29% 27%27%
% A
dults
% A
dults
NHANES II NHANES II 19761976--19801980
NHANES NHANES 19991999--20002000
70%70%
59%59%
34%34%
Healthy PeopleHealthy People 2000/2010 2000/2010 Control Control Target = 50%Target = 50%
ControlControl
AwarenessAwareness
TreatedTreated
ChobanianChobanian et al. et al. JAMAJAMA. 2003;289:2560. 2003;289:2560--2572.2572.

4. Global Risk Assessment
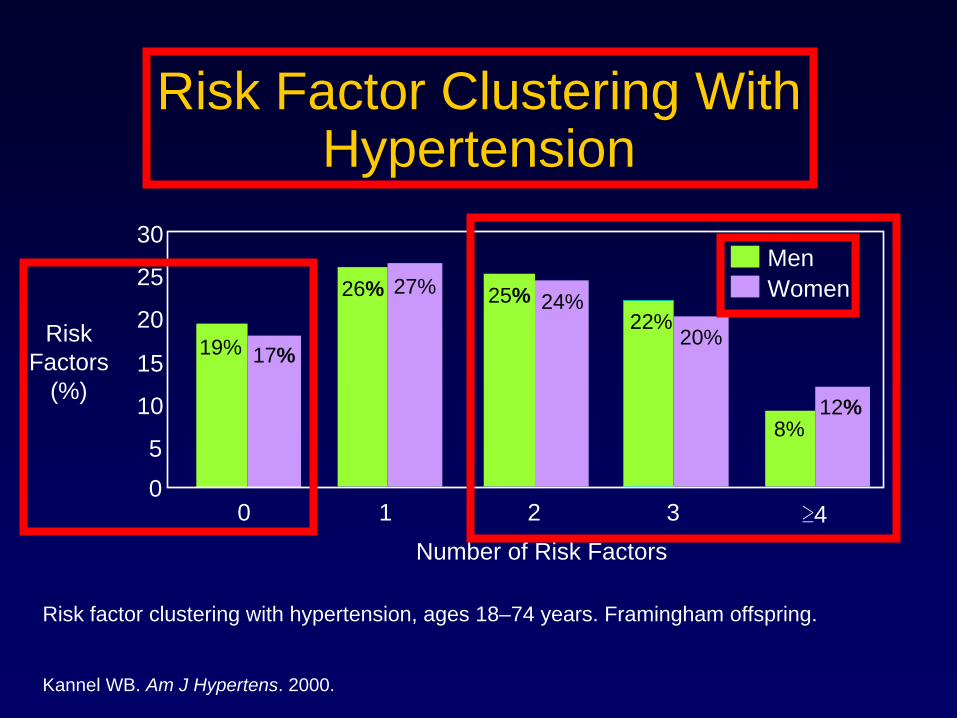
Risk Factor Clustering With Hypertension
Risk Factor Clustering With Hypertension
Risk factor clustering with hypertension, ages 18–74 years. Framingham offspring.
Kannel WB. Am J Hypertens. 2000.
0 1 2 3
5
0
10
15
20
25
30MenWomen
17%19%
26% 27% 25% 24%22%
20%
8%12%
≥4
Risk Factors
(%)
Number of Risk Factors

BP is a risk marker for “The Metabolic Syndrome”
*Diagnosis is established when ≥3 of these risk factors are present.
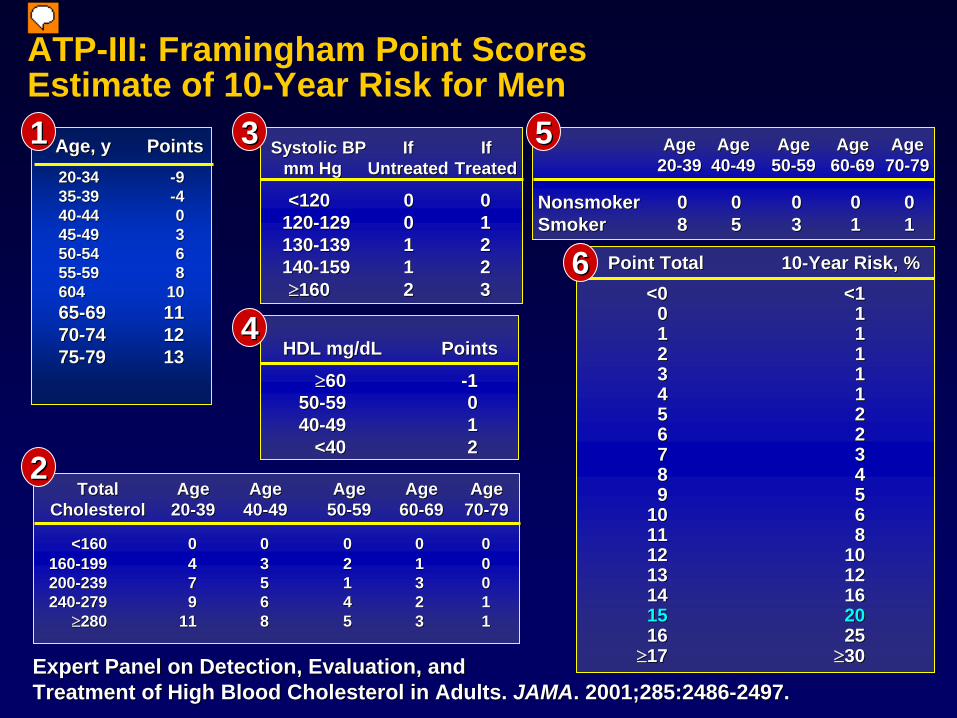
Expert Panel on Detection, Evaluation, and Treatment of High Blood Cholesterol in Adults. JAMA. 2001;285:2486-2497.
NCEPNCEP--ATP III Definition: ATP III Definition: ≥≥3 of the Following*3 of the Following*• Men: >102 cm (>40 in)• Women: >88 cm (>35 in)
Fasting glucose
• ≥130/≥85 mmHg (risk marker)
Blood pressure
HDL-C
• ≥150 mg/dLTriglycerides
Abdominal obesity (waist circumference)
• Men: <40 mg/dL• Women: <50 mg/dL
• ≥100 mg/dL

Other CVD Risk Factors: JNC 7
Physical inactivity
Cigarette smoking
Age (older than 55 for men, 65 for women)
Family history of premature CVD (men under age 55 or women under age 65)
*Components of the metabolic syndrome in blue ChobanianChobanian et al. et al. JAMAJAMA. 2003;289:2560. 2003;289:2560--25722572

700
600
500
400
300
200
100
8 Ye
ar P
roba
bilit
y Pe
r 1,0
00
Systolic BP: Cholesterol: Glucose Intol.: Cigaretes:ECG-LVH:
105 >>> 185185000
105 >>> 185335000
105 >>> 185335+00
105 >>> 185335++0
105 >>> 185335+++
Kannel, 1983
Framingham Heart Study (1983)Framingham Heart Study (1983)CV Risk ProfileCV Risk Profile
703
459
326
210
46
Expert Panel on Detection, Evaluation, and Expert Panel on Detection, Evaluation, and Treatment of High Blood Cholesterol in Adults. Treatment of High Blood Cholesterol in Adults. JAMAJAMA. 2001;285:2486. 2001;285:2486--2497.2497.
Age, yAge, y PointsPoints2020--3434 --993535--3939 --444040--4444 004545--4949 335050--5454 665555--5959 88604604 10106565--6969 11117070--7474 12127575--7979 1313
11
22
55
TotalTotal AgeAge AgeAge AgeAge AgeAge AgeAge CholesterolCholesterol 2020--3939 4040--4949 5050--5959 6060--6969 7070--7979
<160<160 00 00 00 00 00 160160--199199 44 33 22 11 00 200200--239239 77 55 11 33 00 240240--279279 99 66 44 22 11
280280 1111 88 55 33 11
AgeAge AgeAge AgeAge AgeAge AgeAge 2020--3939 4040--4949 5050--5959 6060--6969 7070--7979
HDL mg/HDL mg/dLdL PointsPoints
6060 --11 5050--5959 00 4040--4949 11
<40<40 22
Systolic BPSystolic BP IfIf IfIf mm Hgmm Hg UntreatedUntreated TreatedTreated
<120<120 00 00 120120--129129 00 11 130130--139139 11 22 140140--159159 11 22 160160 22 33
Point TotalPoint Total 1010--Year Risk, %Year Risk, %<0<0 <1<1
00 11 11 11 22 11 33 11 44 11 55 22 66 22 77 33 88 44 99 55
1010 66 1111 88 1212 1010 1313 1212 1414 1616 1515 2020 1616 2525
1717 3030
66
ATP-III: Framingham Point Scores Estimate of 10-Year Risk for Men
NonsmokerNonsmoker 00 00 00 00 00 SmokerSmoker 88 55 33 11 11
44
33


56
Advice from Woody Allen
“If I knew I would live this long I would have taken better care of myself”
“ Sudden Death is nature’s way of telling you to slow down”
“If I knew I would live this long I would have taken better care of myself”
“ Sudden Death is nature’s way of telling you to slow down”
_________________________________________________ _____
_________________________________________________ _____
_______________________________________________________ _____

5. Intervention Trials
•“Hypertension may be an important compensatory mechanism which should not be tampered with, even were it certain that we could control it.”
• “Hypertension may be an important compensatory mechanism which should not be tampered with, even were it certain that we could control it.”
Paul Dudley White, 1931 Textbook of Cardiology.

MesserliMesserli, F. H. , F. H. N N EnglEngl J MedJ Med 19951995

Hypertension Intervention Trials: 1959- 1970
Trial Severity of Hypertension
CV events/yr. In CTRL Group
CV events/yr: CTRL vs Ther. Group
Harrington, et al (1959)
Malignant Hypertension
90% Mortality 90% vs 50% (Mortality / Yr)
VA Coop. Study (1967)
Severe (DBP 115 mmHg) 187/121
29% 10:1 (1.5 Yr.)
VA Coop. Study (1970)
Moderate (DBP 105-114 mmHg) 165/105
5.5% 3.5:1 (4.5 Yr.)
TOMHSTOMHS VA VA MONORxMONORx
CONVINCECONVINCE ALLHAT ALLHAT ANBP2ANBP2
LIFELIFE
HAPPHYHAPPHY MAPHYMAPHY
INSIGHTINSIGHTNORDILNORDIL
CAPPPCAPPP STOPSTOP--22
VALUEVALUE ASCOTASCOT
ACCOMPLISHACCOMPLISH
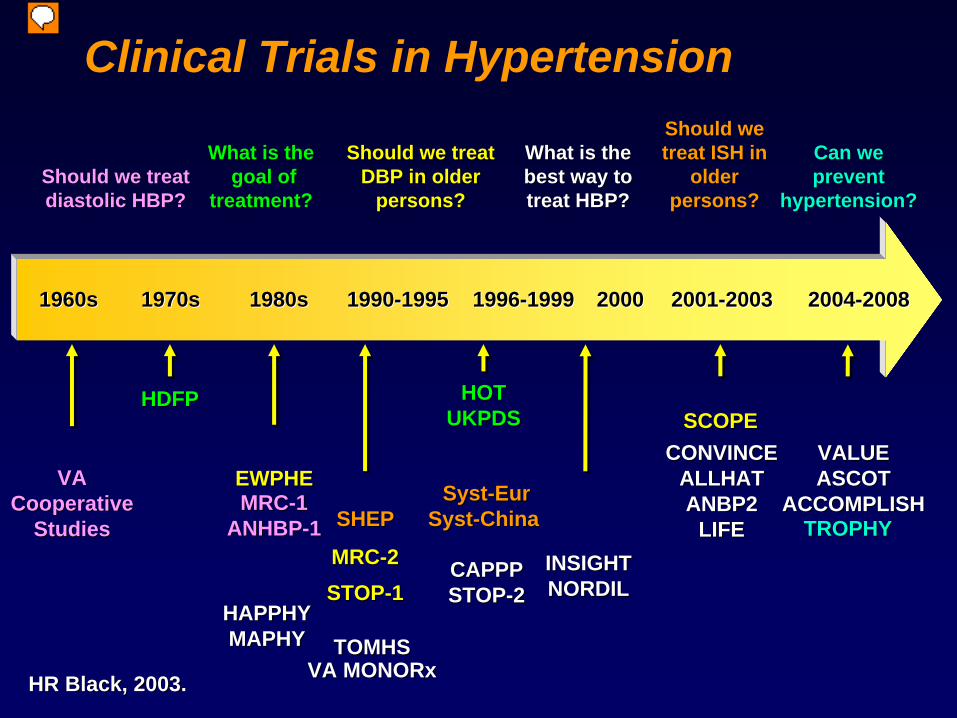
Clinical Trials in Hypertension
HR Black, 2003.HR Black, 2003.
1960s1960s 1970s1970s 1980s1980s 19901990--19951995 19961996--19991999 20002000 20012001--20032003 20042004--20082008
Should we treat Should we treat diastolic HBP?diastolic HBP?
What is the What is the best way to best way to treat HBP?treat HBP?
Should we treat Should we treat DBP in older DBP in older
persons?persons?
What is theWhat is thegoal of goal of
treatment?treatment?
Should we Should we treat ISH in treat ISH in
older older persons?persons?
Can we Can we prevent prevent
hypertension?hypertension?
VA VA Cooperative Cooperative
StudiesStudiesMRCMRC--11
ANHBPANHBP--11
EWPHEEWPHE
MRCMRC--22STOPSTOP--11
SCOPESCOPEHDFPHDFP HOTHOT
UKPDSUKPDS
SystSyst--EurEur SystSyst--ChinaChinaSHEPSHEP TROPHYTROPHY

SHEP Trial: Design
• N: 4736; 43% male• Age: >60• BP: SBP 160-219 and DBP <90• Design: Placebo control, double blind• Active Rx: Chlorthalidone (atenolol as step 2)
• SBP difference: 12 mm Hg• Duration: 4.5 years
• N: 4736; 43% male• Age: >60• BP: SBP 160-219 and DBP <90• Design: Placebo control, double blind• Active Rx: Chlorthalidone (atenolol as step 2)
• SBP difference: 12 mm Hg• Duration: 4.5 years
JAMA 1991;265:3255

SHEP Trial: Cardiovascular Disease Endpoints
JAMA 1991;265:3255

HR 95% CI P value
All stroke - 34% 0.46 - 0.95 0.025
Total mortality - 28% 0.59 - 0.88 0.001
Fatal stroke - 45% 0.33 - 0.93 0.021
Cardiovascular mortality
- 27% 0.55-0.97 0.029
Heart failure - 72% 0.17-0.48 <0.001
Cardiovascular events - 37% 0.51-0.71 <0.001
HYVET Results All Outcomes
Per Protocol
Beckett N. N Engl J Med. 2008;358: epub. March 31, 2008.

6. Management of Hypertension
Seventh Report of the Joint National Committee on Prevention, Detection, Evaluation, and Treatment of High Blood Pressure (JNC 7) EXPRESS
Seventh Report of the Joint National Committee on Prevention, Detection, Evaluation, and Treatment of High Blood Pressure (JNC 7) EXPRESS
National Heart, Lung, and Blood Institute
National High Blood Pressure Education Program

JNC 7: Appropriate BP Targets
• For both CVD and kidney disease, systolic BP is far more important than diastolic BP
• Systolic BP should be <140 mm Hg in all patients, and ideally between 120-130 mm Hg in patients with complications (diabetes, heart failure, kidney disease)
• Only a small fraction of hypertensives are achieving appropriate BP control
• Multiple antihypertensive agents are needed for most patients
• Those with SBP 120–139 mmHg or DBP 80–89 mmHg should be considered pre-hypertensive who require health-promoting lifestyle modifications to prevent CVD.
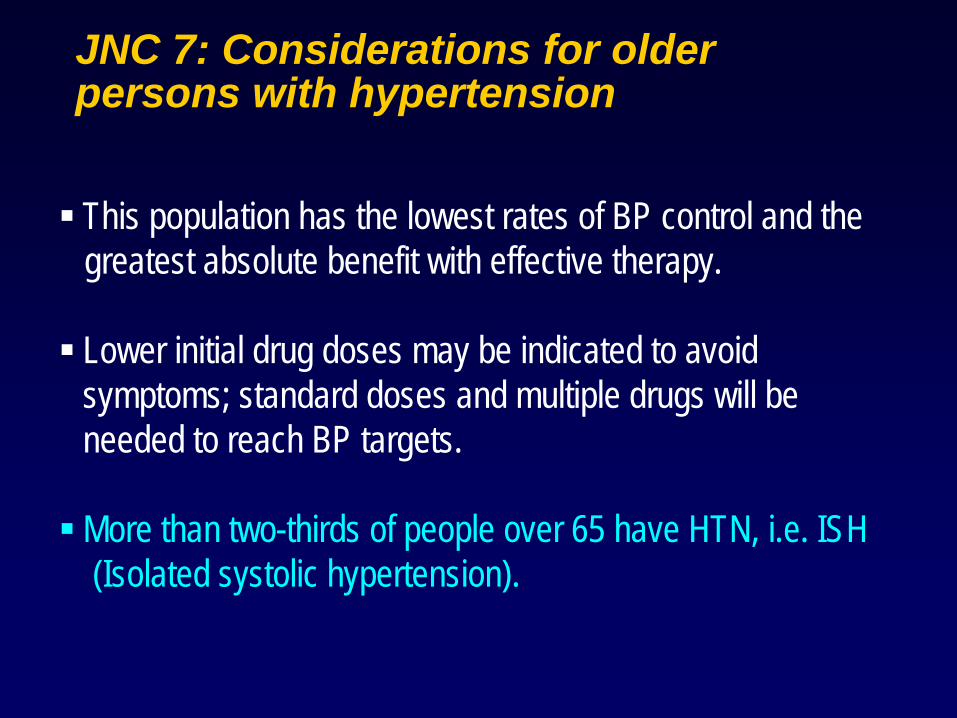
JNC 7: Considerations for older persons with hypertension
This population has the lowest rates of BP control and the greatest absolute benefit with effective therapy.
Lower initial drug doses may be indicated to avoid symptoms; standard doses and multiple drugs will be needed to reach BP targets.
More than two-thirds of people over 65 have HTN, i.e. ISH (Isolated systolic hypertension).

JNC 7: Considerations for special populations with hypertension
• Treatment generally similar for all demographic groups
• Socioeconomic factors and lifestyle important barriers to BP control
• Prevalence, severity of hypertension increased in blacks
• Treatment generally similar for all demographic groups
• Socioeconomic factors and lifestyle important barriers to BP control
• Prevalence, severity of hypertension increased in blacks
JNC 7. JAMA. 2003;289:2560-2672.
Intervention
Exercise
Weight reduction
Alcohol intake reduction
Sodium intake reduction
DASH diet
Intervention
Exercise
Weight reduction
Alcohol intake reduction
Sodium intake reduction
DASH diet
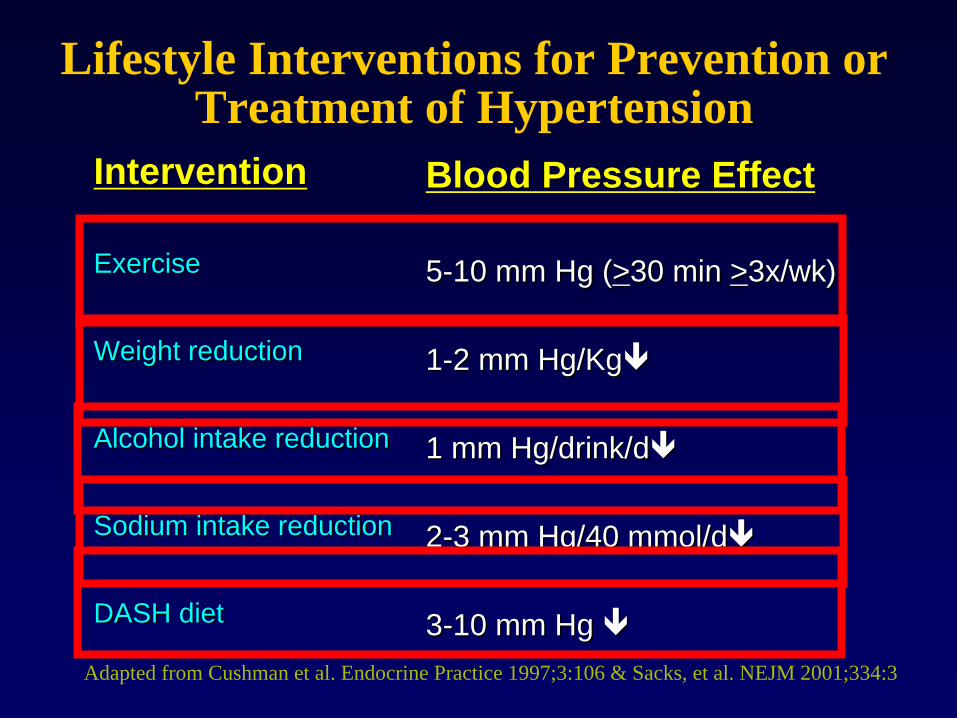
Lifestyle Interventions for Prevention or Treatment of Hypertension
Blood Pressure Effect
5-10 mm Hg (>30 min >3x/wk)
1-2 mm Hg/Kg
1 mm Hg/drink/d
2-3 mm Hg/40 mmol/d
3-10 mm Hg
Blood Pressure Effect
5-10 mm Hg (>30 min >3x/wk)
1-2 mm Hg/Kg
1 mm Hg/drink/d
2-3 mm Hg/40 mmol/d
3-10 mm Hg Adapted from Cushman et al. Endocrine Practice 1997;3:106 & Sacks, et al. NEJM 2001;334:3
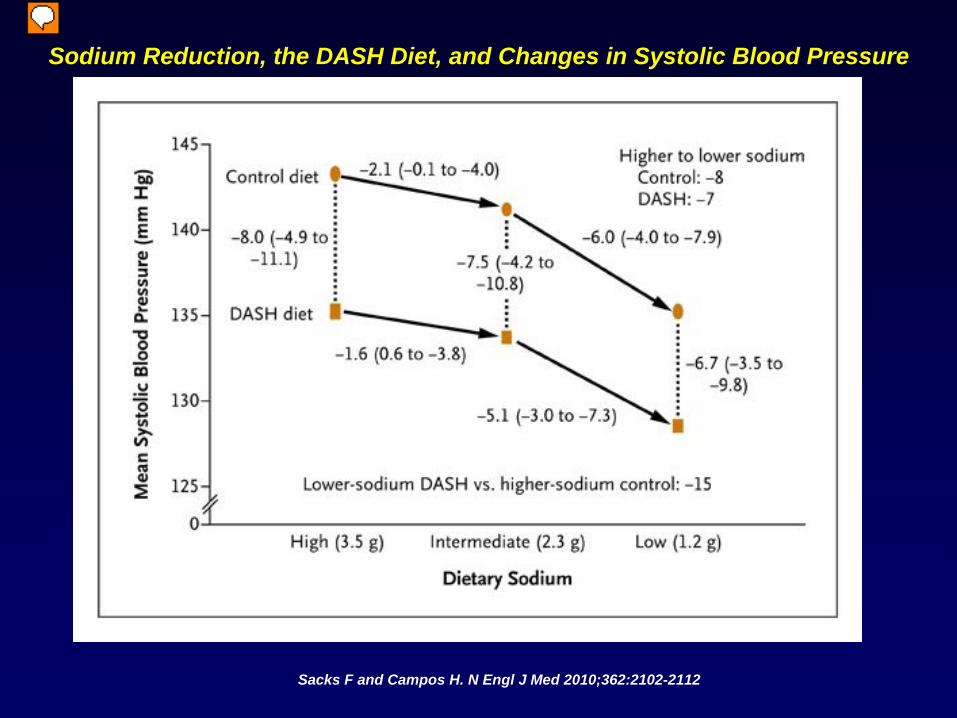
Sacks F and Campos H. N Engl J Med 2010;362:2102-2112
Sodium Reduction, the DASH Diet, and Changes in Systolic Blood Pressure

Sacks F and Campos H. N Engl J Med 2010;362:2102-2112
Effects of a Low-Sodium DASH Diet on Systolic Blood Pressure with Increasing Age

We modified the four basic food groups

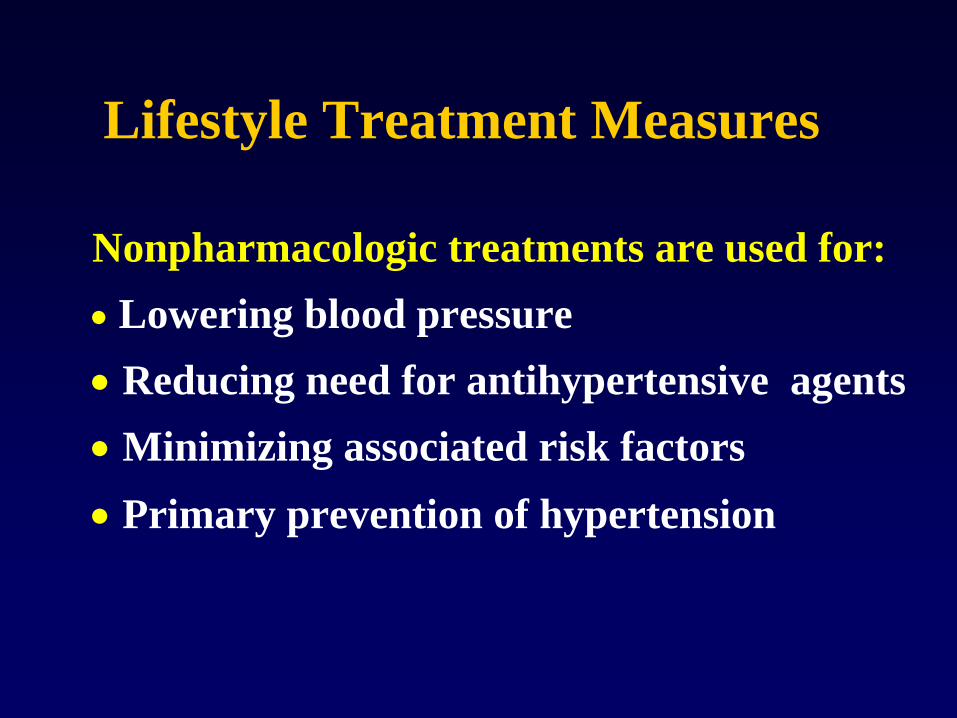
Lifestyle Treatment Measures
Nonpharmacologic treatments are used for:
Lowering blood pressure
Reducing need for antihypertensive agents Minimizing associated risk factors
Primary prevention of hypertension

19721972 19731973 19761976 19801980 19841984 19881988 19931993 19971997 20032003
Development of Hypertension Guidelines: the JNCs and Drug Therapy
NHBPEPNHBPEPSTARTSSTARTS
EarliestEarliest GuidelinesGuidelines
28 drugs28 drugs DBP DBP 105105 DiureticsDiuretics
JNC IJNC I
43 drugs43 drugs
diuretics,diuretics, --blockersblockers
AddedAdded
JNC IIIJNC III
JNC IIJNC II
34 drugs34 drugsDiureticsDiuretics
JNC IVJNC IV
50 drugs50 drugsACEI, ACEI, CAsCAs
addedadded
JNC VIJNC VI
84 drugs84 drugs7 options7 options
LowLow--dosedose
JNCsJNCs II--7.7.
68 drugs68 drugsDiuretics/Diuretics/--blockersblockers
JNC VJNC V JNC 7JNC 7
> 125 drugs> 125 drugsDiureticsDiuretics

Not at Goal Blood Pressure (<140/90 mm Hg) (<130/80 mm Hg for those with diabetes or chronic kidney disease)
Not at Goal Blood Pressure (<140/90 mm Hg) (<130/80 mm Hg for those with diabetes or chronic kidney disease)
Initial Drug ChoicesInitial Drug Choices
Drug(s) for the compelling indications
Other antihypertensive drugs (diuretics, ACEI, ARB, BB, CCB)
as needed
Drug(s) for the compelling indications
Other antihypertensive drugs (diuretics, ACEI, ARB, BB, CCB)
as needed
With Compelling Indications
With Compelling Indications
Lifestyle ModificationsLifestyle Modifications
Not at Goal Blood Pressure
Not at Goal Blood Pressure
Optimize dosages or add additional drugs until goal blood pressure is achieved
Consider consultation with hypertension specialist
Optimize dosages or add additional drugs until goal blood pressure is achieved
Consider consultation with hypertension specialist
Stage 2 Hypertension (SBP >160 or DBP >100 mm Hg)
2-drug combination for most (usually thiazide-type diuretic and
ACEI, or ARB, or BB, or CCB)
Stage 2 Hypertension (SBP >160 or DBP >100 mm Hg)
2-drug combination for most (usually thiazide-type diuretic and
ACEI, or ARB, or BB, or CCB)
Stage 1 Hypertension (SBP 140-159 or DBP 90-99 mm Hg)
Thiazide-type diuretics for most May consider ACEI, ARB, BB, CCB,
or combination
Stage 1 Hypertension (SBP 140-159 or DBP 90-99 mm Hg)
Thiazide-type diuretics for most May consider ACEI, ARB, BB, CCB,
or combination
Without Compelling Indications
Without Compelling Indications
JNC 7 Algorithm for Treatment of Hypertension
ChobanianChobanian et al. et al. JAMAJAMA. 2003;289:2560. 2003;289:2560--2572.2572.
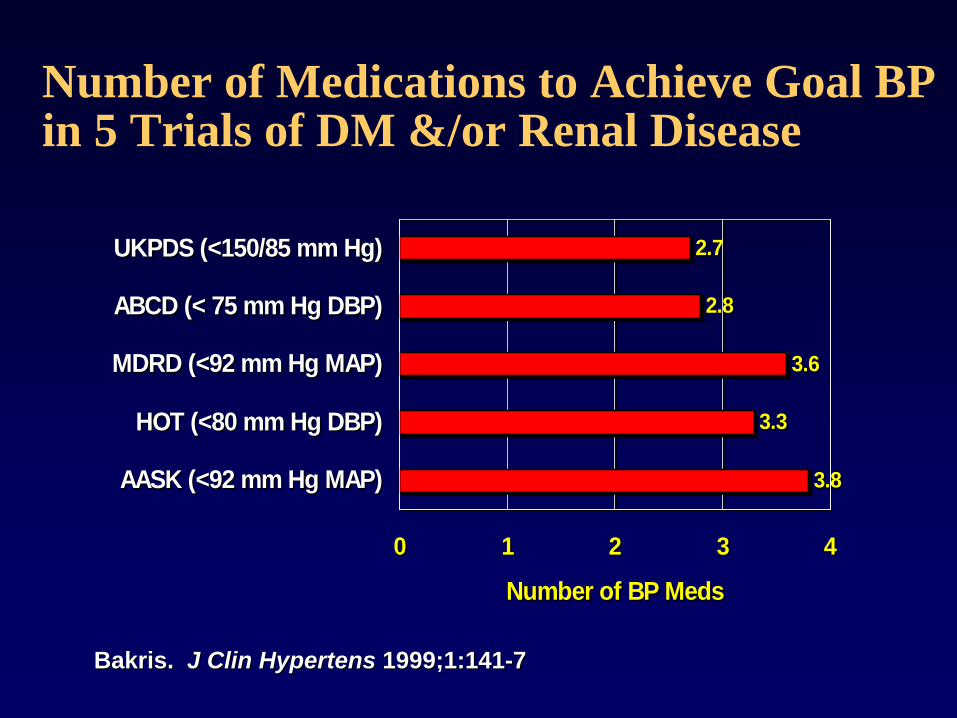
Number of Medications to Achieve Goal BP in 5 Trials of DM &/or Renal Disease
3.8
3.3
3.6
2.8
2.7
0 1 2 3 4
AASK (<92 mm Hg MAP)
HOT (<80 mm Hg DBP)
MDRD (<92 mm Hg MAP)
ABCD (< 75 mm Hg DBP)
UKPDS (<150/85 mm Hg)
Number of BP Meds
3.8
3.3
3.6
2.8
2.7
0 1 2 3 4
AASK (<92 mm Hg MAP)
HOT (<80 mm Hg DBP)
MDRD (<92 mm Hg MAP)
ABCD (< 75 mm Hg DBP)
UKPDS (<150/85 mm Hg)
Number of BP Meds
BakrisBakris. . J J ClinClin HypertensHypertens 1999;1:1411999;1:141--77

7. Barriers to Treatment

Barriers to Controlling Hypertension
Healthcare System
Patients Providers

Is this true?

82

The Initial Confrontation of the HTN Problem
• Upon making a diagnosis of HTN, tell patient the BP reading and what it should be (provide a written copy).
• Prepare patient for the probable necessity for polypharmacy to control BP with a minimum of side effects
• Advise Home BP measurement (135/85 mmHg is considered to be hypertensive).
• Upon making a diagnosis of HTN, tell patient the BP reading and what it should be (provide a written copy).
• Prepare patient for the probable necessity for polypharmacy to control BP with a minimum of side effects
• Advise Home BP measurement (135/85 mmHg is considered to be hypertensive).
Table 28. JNC 7 Report. Hypertension. 2003;42(6):1240.

8. Prevention Strategy:
General Population StrategyVersus
Targeted Intensive Strategy

Life’s Simple 7
Primordial PreventionGet activeControl cholesterolEat betterManage blood pressureLose weightReduce blood sugarStop smoking
AHA 2010
IntermediateLesion
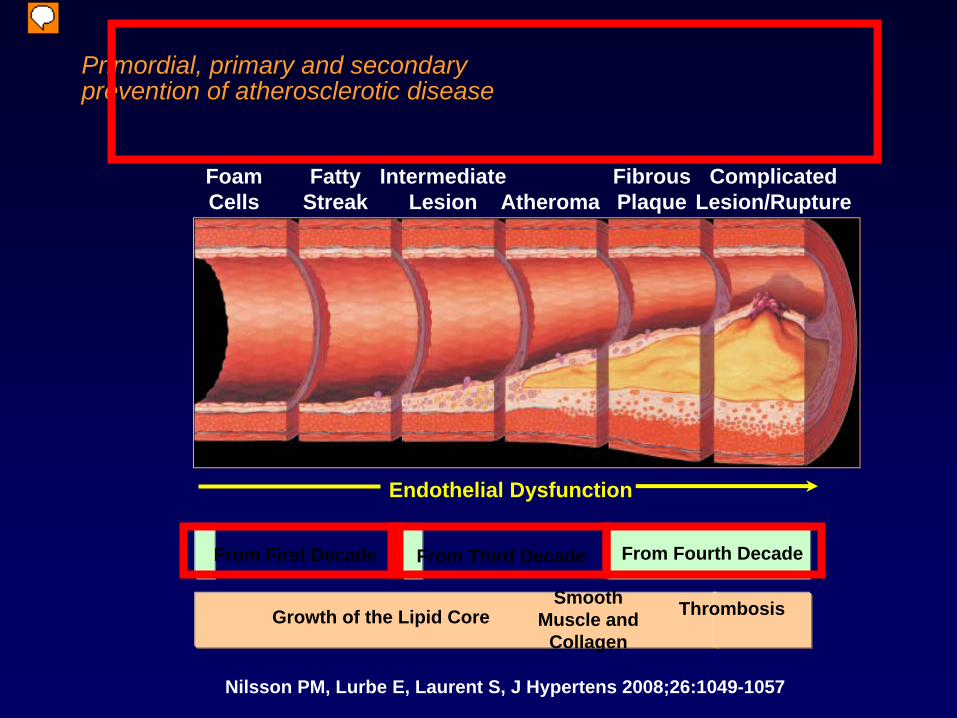
Primordial, primary and secondary Primordial, primary and secondary prevention of atherosclerotic diseaseprevention of atherosclerotic disease
FoamCells
FattyStreak Atheroma
FibrousPlaque
ComplicatedLesion/Rupture
From First Decade From Third Decade From Fourth Decade
Growth of the Lipid CoreSmooth
Muscle and Collagen
Thrombosis
Endothelial Dysfunction
Nilsson PM, Lurbe E, Laurent S, J Hypertens 2008;26:1049-1057

Natural history of CVD: a 3-act tragedy
• First act: Introduces the main characters
-- Risk factors (primordial prevention).
• Second act: Takes place over decades
-- Villains attack the arterial walls
(Primary prevention)
• Third act: Can be tragically brief
-- plaque rupture & arterial thrombosis
-- patient survives (2ndary prevention)
• First act: Introduces the main characters
-- Risk factors (primordial prevention).
• Second act: Takes place over decades
-- Villains attack the arterial walls
(Primary prevention)
• Third act: Can be tragically brief
-- plaque rupture & arterial thrombosis
-- patient survives (2ndary prevention)
Sniderman AD. Lancet 2008;371:1547-1549
Total CV prediction: an elusive goal ?
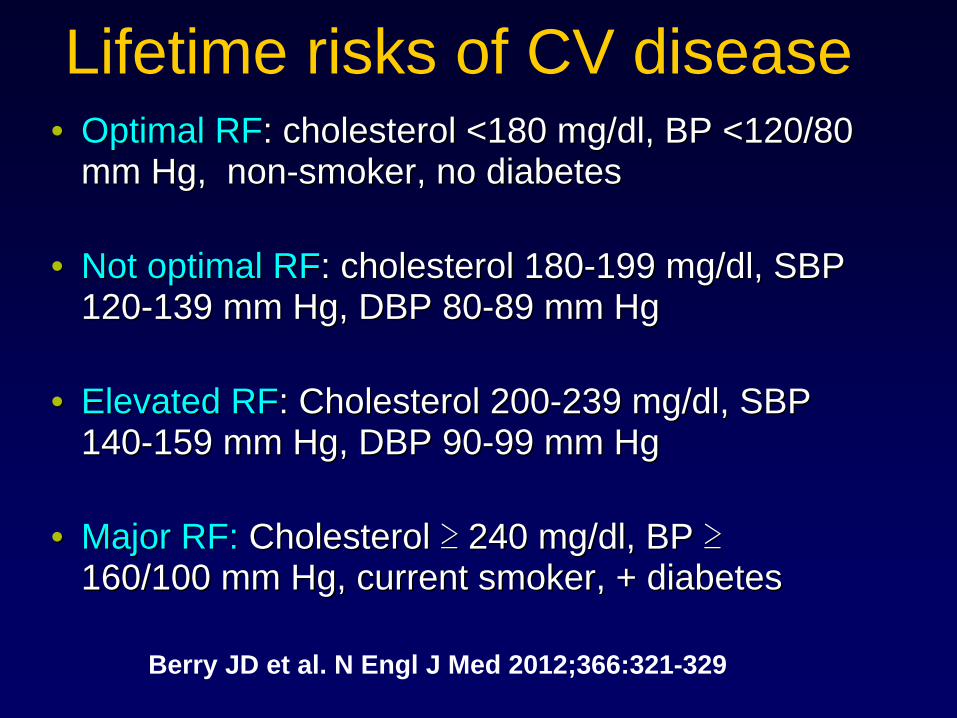
Lifetime risks of CV disease• Optimal RF: cholesterol <180 mg/dl, BP <120/80
mm Hg, non-smoker, no diabetes
• Not optimal RF: cholesterol 180-199 mg/dl, SBP 120-139 mm Hg, DBP 80-89 mm Hg
• Elevated RF: Cholesterol 200-239 mg/dl, SBP 140-159 mm Hg, DBP 90-99 mm Hg
• Major RF: Cholesterol ≥
240 mg/dl, BP ≥ 160/100 mm Hg, current smoker, + diabetes
• Optimal RF: cholesterol <180 mg/dl, BP <120/80 mm Hg, non-smoker, no diabetes
• Not optimal RF: cholesterol 180-199 mg/dl, SBP 120-139 mm Hg, DBP 80-89 mm Hg
• Elevated RF: Cholesterol 200-239 mg/dl, SBP 140-159 mm Hg, DBP 90-99 mm Hg
• Major RF: Cholesterol ≥
240 mg/dl, BP ≥ 160/100 mm Hg, current smoker, + diabetes
Berry JD et al. N Engl J Med 2012;366:321-329
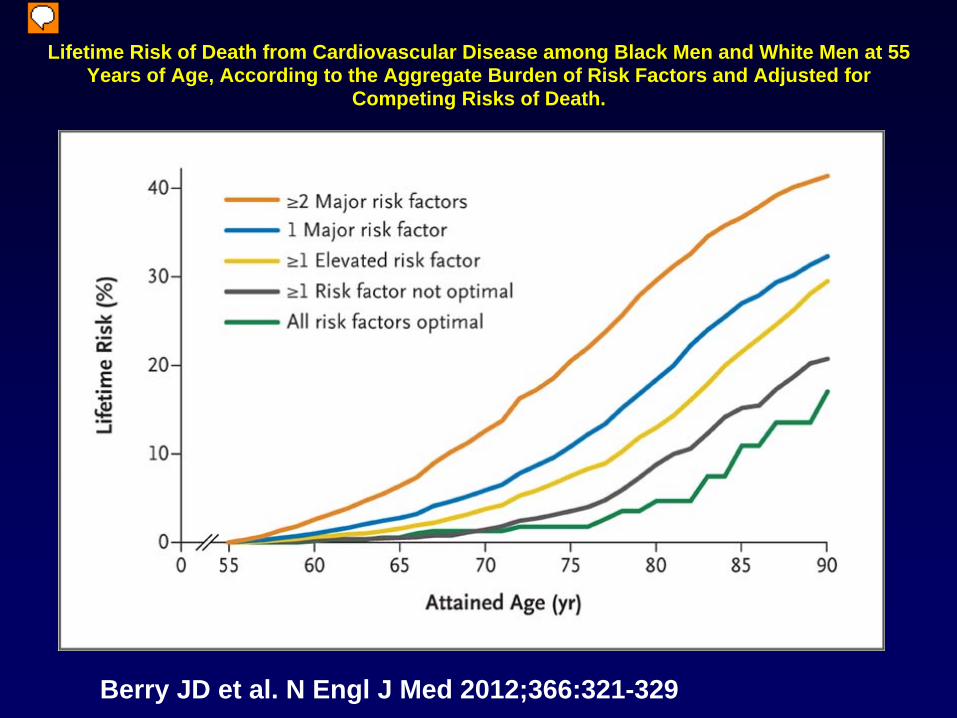
Lifetime Risk of Death from Cardiovascular Disease among Black Men and White Men at 55 Years of Age, According to the Aggregate Burden of Risk Factors and Adjusted for
Competing Risks of Death.
Berry JD et al. N Engl J Med 2012;366:321-329

Lifetime risks of CV disease• Risk factor burden related to lifetime CVD risk
• RFs: HTN, cholesterol, smoking, DM
• Consistent across race and birth cohorts
• RFs differences affect racial risk differentially
• Primordial prevention is 3-5X > primary prevention in decreasing lifetime CVD risk.
• Risk factor burden related to lifetime CVD risk
• RFs: HTN, cholesterol, smoking, DM
• Consistent across race and birth cohorts
• RFs differences affect racial risk differentially
• Primordial prevention is 3-5X > primary prevention in decreasing lifetime CVD risk.
Berry JD et al. N Engl J Med 2012;366:321-329

• Epidemiology Summary:– Increasing prevalence; world wide problem– Blood pressure as a moving target– ↑ PVR in the young, ↑ stiffness in the elderly– Predominantly isolated systolic hypertension– Consider special populations at increased risk– Hypertension as a part of absolute global CV risk– Population vs. high risk approaches for prevention
• Epidemiology Summary:– Increasing prevalence; world wide problem– Blood pressure as a moving target– ↑ PVR in the young, ↑ stiffness in the elderly– Predominantly isolated systolic hypertension– Consider special populations at increased risk– Hypertension as a part of absolute global CV risk– Population vs. high risk approaches for prevention