epic annual report to the governor and legislature · pdf fileepic annual report to the...
TRANSCRIPT
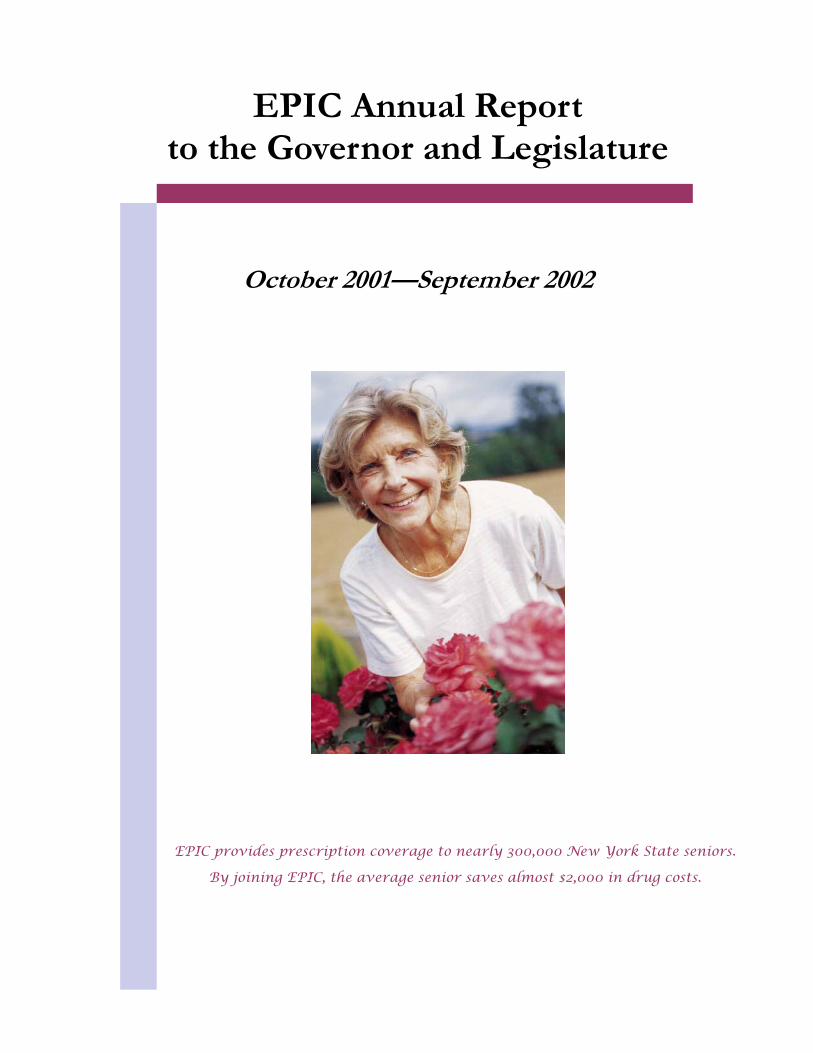
EPIC Annual Report to the Governor and Legislature
October 2001—September 2002
EPIC provides prescription coverage to nearly 300,000 New York State seniors.
By joining EPIC, the average senior saves almost $2,000 in drug costs.

MEMBERS OF THE EPIC PANEL AND ADVISORY COMMITTEE
EPIC Panel _________________________________________ Hon. Antonia C. Novello, M.D., M.P.H., Dr.P.H. Commissioner NYS Department of Health Co-Chairperson, EPIC Panel Hon. Gregory V. Serio Superintendent NYS Insurance Department Hon. Carole E. Stone Director NYS Division of the Budget
Hon. Patricia P. Pine, Ph.D. Director NYS Office for the Aging Co-Chairperson, EPIC Panel Hon. Richard P. Mills Commissioner NYS Education Department
EPIC Advisory Committee ___________________________ Andrew Barrett, R.Ph. Pharmacist Amy Bernstein Consumer Representative Michael J. Davis Manufacturer Representative Suleika Cabrera Drinane Consumer Representative Alison B. King, Ph.D. Manufacturer Representative
Bob Matalia, R.Ph. Pharmacist Sarah Pavel, R.Ph. Manufacturer Representative Milton Webber Consumer Representative Maurice Van Sice Pharmacist
TABLE OF CONTENTS
Page No. EXECUTIVE SUMMARY .....................................................................................................1 I. PROGRAM DESCRIPTION AND CHANGES
Introduction....................................................................................................................5 EPIC Program Description ...........................................................................................5 Pharmacy Reimbursement Change................................................................................6 Manufacturer Rebate Changes ......................................................................................7 Benefit Recovery Program.............................................................................................8
II. ENROLLMENT LEVELS
Introduction..................................................................................................................11 Seniors Applying for EPIC...........................................................................................11 Changes in Enrollment ................................................................................................12 Enrollment by Plan Type .............................................................................................13 Portrait of EPIC Enrollees ..........................................................................................14 Seniors with Other Insurance ......................................................................................15 Changes in Cancellation Rate .....................................................................................16
III. DRUG COST TRENDS
Introduction..................................................................................................................17 Summary of Costs ........................................................................................................17 Average Cost of Drugs.................................................................................................18 Claims, Expenditures, Revenue and Utilization ..........................................................20 Pharmacy Reimbursement Change..............................................................................22 Increase in the Cost of Drugs ......................................................................................23 State Share of Drug Costs............................................................................................24 Seniors with High Drug Costs .....................................................................................25 Two-Year Enrollment and Cost Projections ................................................................26
IV. REVIEWING UTILIZATION
Introduction..................................................................................................................27 Medications Most Frequently Used.............................................................................27 Types of Medications Used ..........................................................................................28 Therapeutic Drug Monitoring......................................................................................29 Payments to Pharmacies..............................................................................................30
V. PROGRAM OPERATIONS
Introduction..................................................................................................................31 Outreach Services ........................................................................................................31 Performance of the Contractor....................................................................................35 Pharmacy Audits..........................................................................................................36 Manufacturer Rebate Program....................................................................................36 Summary ......................................................................................................................37
APPENDIX


Executive Summary
1
EXECUTIVE SUMMARY
From our family to your EPIC family, thank you for all of your patience, quick service, and personal attention on behalf of my mom. The program made her life easier during a difficult time. Your personal service to our family is greatly appreciated. You are truly there for us.
Ms. B. Buffalo, NY
The Elderly Pharmaceutical Insurance Coverage (EPIC) Program is the largest state senior prescription drug program in the nation. Since 1987, EPIC has assisted seniors living in New York State by providing them with affordable prescription coverage. Chapter 57 of the Laws of 2000 expanded the income eligibility for the program, and lowered the fees and co-payments, enabling many more seniors to qualify and benefit from the program beginning January 1, 2001. As a result, EPIC enrollment has soared to almost 300,000 participants, exceeding expectations. This year, enrollees saved an average of nearly $2,000 on prescription medications that cost $2,500. For many seniors, EPIC means no longer having to choose between purchasing their medicine and other necessities. EPIC eliminates the fear of not being able to pay for needed medication. This annual report evaluates the second year of the program expansion that began in January 2001, and highlights recent legislative changes approved with Chapter 1 of the Laws of 2002. The report contains information on application and enrollment activities, program and drug costs, and drug utilization for the program year October 2001 through September 2002. Updates on operational activities are also included, highlighting accomplishments in the contract management, outreach, pharmacy audit, and manufacturer rebate areas. Section I: Program Description and Changes Legislative changes approved with Chapter 1 of the Laws of 2002 contained several initiatives that helped to improve the cost-effectiveness of the EPIC program. The pharmacy reimbursement methodology was modified to lower drug prices allowed by EPIC to levels consistent with that of the New York State Medicaid and other drug programs. The new rate limits the prices charged to EPIC customers to a federal upper limit set by the Centers for Medicare and Medicaid Services on multiple source generic drugs, and to Average Wholesale Price less ten percent on brand name drugs. The dispensing fee was changed to $4.50 for generics, and $3.50 for brands, providing an incentive for pharmacies to further encourage the use of generics. This pricing change has saved the program $19 million since its implementation on April 1, 2002.
The manufacturer rebate calculation was also modified to be fully consistent with that of the federal Medicaid program. The additional Consumer Price Index (CPI) rebate, which previously calculated the increase in manufacturer drug prices in excess of inflation since 1998, was modified to measure any cumulative excess price increases since the inception of the rebate program in 1991. In addition, all manufacturers are now required to pay EPIC rebates in exchange for coverage of their drug products, rather than just those manufacturers participating in the Medicaid program.
Executive Summary
2
The final change required other insurers to participate in an EPIC Benefit Recovery
Program. While EPIC is defined in law as the payer of last resort, seniors with other insurance coverage sometimes use their EPIC coverage in the first instance instead of their other coverage. The new legislation requires that other plans perform enrollment and claim file matches with EPIC at least semi-annually to identify seniors and their prescription claims that are dually covered by both plans. Insurers are then obligated to reimburse EPIC for benefits paid by EPIC that they should have paid. Section II: Enrollment Levels For the second year in a row, enrollment increased significantly, rising at a rate of 29 percent to 294,513 seniors as of September 2002. Increased enrollment in the program was primarily influenced by the program enhancements and the increased need for affordable prescription coverage. Enhanced outreach efforts used community-based informational sessions and networking opportunities to increase program awareness and educate seniors about the improved EPIC benefits. More than 92,000 new applications were received from seniors during the program year which increased enrollment by almost 42,000 seniors in the Fee Plan, and 25,000 seniors in the Deductible Plan. This represented a 23 percent enrollment growth in the Fee Plan and a 54 percent increase in enrollment in the Deductible Plan over the program year. Since the implementation of the program expansion, the demographics of the EPIC population have been changing. The average income for an enrollee increased to over $17,000, more men joined the program, and the number of married seniors enrolled increased. Also, more seniors are using EPIC to supplement their other prescription coverage. Section III: Drug Cost Trends During the program year, more than 286,000 participants purchased almost 8.6 million prescriptions costing $588.8 million. Seniors saved $460.4 million on prescriptions by using EPIC benefits. The net State cost was $345.3 million after participant fees and manufacturers’ rebates were deducted. Seniors in the Fee Plan purchased 7.1 million prescriptions and accounted for almost 88 percent of EPIC costs. Seniors in the Deductible Plan purchased 1.5 million prescriptions and accounted for 12 percent of EPIC expenditures.
This year seniors enrolled in EPIC purchased an average of 36 prescriptions at a cost of $2,487. Seniors saved an average of $1,970 after co-payments and deductibles. Fee Plan participants used an average of $2,494 in medications and saved $2,076. Deductible Plan seniors purchased $2,454 in prescriptions, and saved $1,494. EPIC seniors with income between $41,000 and $50,000 paid $1,150 in out-of-pocket costs and seniors with incomes less than $10,000 paid under $400 in out-of-pocket costs.
Approximately 58 percent of new Deductible enrollees reached their deductible, and
did so within an average of five months. The average senior in the Deductible Plan who

Executive Summary
3
reached their deductible used 44 prescriptions, saved $1,978 and had an average drug cost of $3,140. Largely due to the increased enrollment this year, the total cost of prescriptions increased by $199 million, or 51 percent, over the prior program year. Approximately 65,000 more seniors used the program this year than last, and they were enrolled for a longer duration. In addition, the average prescription cost increased by 8.2 percent from $64.65 to $69.98. Since April 1, 2002, the change in pharmacy reimbursement reduced EPIC expenditures for sole-source and brand multi-source medications by almost $11 million and for generic drugs by over $8 million. An approximate seven percent savings was realized per prescription from the prior reimbursement levels. The average savings per claim was greater on generics than brands, at $6.05 versus $4.69 respectively.
The State share was 59 percent of total prescription costs. Twenty-five percent of the costs were paid by the participant co-payments and deductibles, and 16 percent were paid by rebates from pharmaceutical manufacturers. Due to changes in the co-payment schedule effective January 2001, the total State share on co-payment claims increased from 82 to 83 percent.
EPIC expenditures were largely driven by a subset of the population that used expensive drugs or a high number of prescriptions. Seventeen percent of enrollees had drug costs that exceeded $4,000, and their prescription costs accounted for 42 percent of EPIC expenditures. Twenty percent of the prescriptions purchased cost more than $100, three times the amount reported six years ago. Section IV: Reviewing Utilization
As EPIC participants age, the number of chronic medical conditions increase and
many seniors need more medications to stay healthy. The EPIC population primarily uses drugs to treat heart disease, arthritis, gastric conditions and diabetes.
Nearly 3.5 million prescriptions for generic medications were purchased during the program year. The substitution rate for drugs having a generic alternative was 81 percent, an increase of one percent from last year. This positive rate is comparable to programs with strong generic incentives. Program expenditures directly correlate to the high utilization of brand name drugs that are available from only one manufacturer. A total of 46 percent of the drugs purchased were sole source medications, two percent less than last year. Sole source products accounted for 76 percent of the total cost of EPIC prescriptions.
Seniors with multiple medical conditions are at increased risk of adverse reactions when additional medication is consumed. To improve outcomes and minimize potential problems, EPIC operates a therapeutic drug monitoring program designed to ensure that enrollees receive appropriate drug therapy. A prospective review system sends electronic alerts to pharmacists warning them of potentially serious problems prior to dispensing the medication. Over 334,000 prescriptions were suspended for review by the dispensing pharmacist during the program year, of which 56 percent were not filled. This intervention

Executive Summary
4
prevented possible adverse consequences from occurring, and saved $3.7 million on the prescriptions not filled.
Retrospective reviews of the medication history of enrollees are also performed by
EPIC pharmacists using established clinical criteria. During the year, 7,750 clinical reviews were completed. Informational letters were sent to prescribers on behalf of 631 participants identified at risk for potential drug interactions, duplicative therapies, and overuse. Section V: Program Operations More than 700 community-based outreach and informational sessions were held across the State to promote EPIC to seniors and caregivers. EPIC staff worked closely with the State and local offices for the aging, local governments including New York City, as well as numerous business and community-based organizations. These efforts significantly increased program visibility and generated interest in the program. Throughout the year, mass media campaigns used radio, newspaper and television advertising to complement local outreach initiatives. The program distributed over one million brochures to pharmacies, legislators, local offices for the aging, physicians, senior centers, health facilities and other organizations that serve seniors across the State. As required by EPIC legislation, a fiscal agent contractor operates specific functions of the program. The current contract was extended one year until September 30, 2003. During the program year, State staff routinely monitored the operational activities performed by the contractor, First Health Services Corporation, to ensure that quality services were provided to seniors and pharmacies and satisfied EPIC requirements. This year, the contractor demonstrated competence in the administration of daily program operations, and effectively handled the expanded operational activities that resulted from the increased enrollment levels. In addition, First Health successfully implemented the legislative changes as required by Chapter 1 of the Laws of 2002. During the program year, 61 pharmacy audits were completed and approximately $94,000 inappropriate payments recovered from audited pharmacies. Through the Verification of Benefits (VOB) process that was implemented last year, statements were mailed to 25,000 participants of which 88 percent were returned to EPIC. A total of $25,000 in payment recoveries were collected from pharmacists after enrollees questioned the validity of some claims shown on their VOB statements. This year, legislative modifications to the existing manufacturers’ rebate requirements resulted in enhanced rebate collections. In total, $96 million in rebate revenues were collected by the program and applied toward the cost of participant benefits, thereby reducing the State’s program expenditures.

Program Description and Changes
5
I. PROGRAM DESCRIPTION AND CHANGES
I have been a member of EPIC for several years and I would like you to know what a great help you have been to me. I take so many medications, I could not afford them all if it were not for your program. Ms. P. Poughkeepsie, NY
Introduction During this past year, the program focused its attention on the enrollment increase that followed the eligibility expansion and enhancements effective January 2001. The enrollment increase surpassed all expectations and was accompanied by the continuing rise in the cost of drugs. This year, several cost-saving measures were passed with Chapter 1 of the Laws of 2002, to help offset the significant increase in EPIC expenditures. The legislative changes included the following:
• The pharmacy reimbursement methodology was modified to lower the prices paid for covered drugs to more competitive rates.
• The manufacturer rebate calculation was modified to increase the additional rebate,
which recovers drug price increases above the rate of inflation, to be consistent with that of the federal Medicaid program.
• All manufacturers are required to pay EPIC rebates in exchange for coverage of their
products, even if they do not participate in the Medicaid program. • Other insurers are required to participate in an EPIC Benefit Recovery Program.
This section reviews the program design, and describes the legislative changes and associated implementation activities undertaken during this program year. EPIC Program Description On September 30, 2002, the EPIC program completed its fifteenth year of operation. EPIC provides affordable prescription drug coverage to low and moderate-income senior citizens residing in New York State. On average, EPIC covers more than 80 percent of the prescription costs of seniors participating in the program. Since its inception in 1987, EPIC has helped over 553,000 seniors save over $1.7 billion on the cost of their medications. Residents of New York State are eligible for EPIC if they are 65 years of age or older and have income within the eligibility levels. As a result of the legislation that became effective January 1, 2001, the income limits were expanded to $35,000 for single seniors and $50,000 for married individuals. Seniors that receive full Medicaid benefits, or those having other prescription coverage that provides equal or better benefits than EPIC, are not eligible to join the program. However, if seniors expend their other prescription benefits, they are permitted to join EPIC for the remainder of the year until their other prescription coverage resumes.
Program Description and Changes
6
Seniors in the lower income levels pay an annual fee to receive benefits, with fees ranging from $8 to $300 per person depending on income and marital status. Instead of paying a fee, seniors in the higher income levels must meet an annual deductible to receive the benefit of paying only a co-payment for their prescriptions. The deductibles range from $530 to $1,715 per person, also based on income level and marital status. There are four co-payment amounts ranging from $3 to $20, which are based on the cost of the prescription. Seniors never pay more than a $20 co-payment, regardless of the cost of the drug. Total co-payments are limited to an annual amount, which is based on income level and provides further protection to enrollees with high prescription needs. Once a participant meets their co-payment limit, EPIC pays the full cost of their prescriptions for the remainder of their coverage year. As a result, total out-of-pocket expenditures are limited to approximately eight percent of a participant’s annual income. There are almost 4,000 New York State pharmacies that participate in the EPIC program. EPIC covers most prescription drugs, as well as insulin and insulin syringes. Participants can purchase both brand and generic drugs, and receive up to a thirty-day supply at a time, or 100 tablets or capsules if greater. Pharmacy Reimbursement Change Chapter 1 of the Laws of 2002 modified the EPIC pharmacy reimbursement methodology effective April 1, 2002. The new reimbursement is consistent with that used by the New York State Medicaid program and similar to pricing strategies commonly used by other drug programs. The financial impact of the reimbursement change is reviewed in Section II (Drug Cost Trends) of this report. As a result of the legislation, covered prescriptions dispensed on or after April 1, 2002 are subject to the following reimbursement rate:
1. Generic multiple source drugs with a Federal Upper Limit (FUL) price set by the
Centers for Medicare and Medicaid Services (CMS) are limited to the lower of:
a. The pharmacy’s usual and customary charge to the general public, including quantity and promotional discounts available to the public at the time of purchase; or
b. The FUL price, plus a dispensing fee of $4.50.
2. All other covered drugs (i.e., brand name multiple source drugs required by the
prescriber to be dispensed as written, brand name single source drugs, and generic drugs without a FUL price) are limited to the lower of:
a. The pharmacy’s usual and customary charge to the general public,
including quantity and promotional discounts available to the general public at the time of purchase; or
b. The Average Wholesale Price (AWP) minus ten percent, plus a
dispensing fee of $3.50 for brands and $4.50 for generics.

Program Description and Changes
7
Some unique attributes contained in the original EPIC reimbursement design have been eliminated in the transition to the new rate. The distinction based on pharmacy prescription volume (AWP reduced by five percent for high volume pharmacies) and services provided (higher dispensing fee for full service pharmacies - $3.00 versus $2.75) are no longer applicable. Instead, all pharmacies are now reimbursed at the same rate. Claims for prescriptions dispensed on or after April 1, 2002 are reimbursed according to the new methodology, whereas prescriptions dispensed previously are reimbursed according to the prior reimbursement calculation. In addition, the new pricing applies to deductible purchases, providing seniors with the benefit of the lower EPIC prices when paying full price while in deductible status. Manufacturer Rebate Changes Chapter 1 of the Laws of 2002 included two modifications to the EPIC Manufacturer Rebate program. The first modified EPIC’s rebate calculation to be identical, by statutory reference, to that required by the federal Medicaid program. The other requires that all manufacturers participate in the EPIC Manufacturer Rebate program in order to have their drugs covered, regardless of whether they participate in the Medicaid program. Both changes were effective April 1, 2002. The EPIC rebate calculation was modified to calculate the Consumer Price Index (CPI) rebate component consistent with the federal Medicaid program. While the “basic rebate” calculation has always been consistent with the Medicaid program, the “additional CPI rebate” added in October 2000 differed from Medicaid. The CPI rebate equals the cumulative price increase of a specific drug in excess of the increase in the CPI. However, there are two major differences between the CPI component added in 2000 and the latest revision:
• The original CPI component was applicable to all drugs (including generics), whereas the revised CPI rebate only applies to innovator drugs.
• The original CPI component used the fourth quarter of 1998 as the base for
comparing cumulative price increases against inflation increases. The revised rebate calculation utilizes the third quarter of 1990 as the base for comparison, before the start of the Medicaid and EPIC rebate programs. For drugs newly marketed after these base dates, the comparisons are made based on the first full quarter date that the drug was marketed, for both the original and revised calculation.
The revised legislation also requires full participation by manufacturers. This eliminates a loophole whereby manufacturers who did not enter into a rebate agreement with Medicaid still had their products covered by EPIC without having to participate in the EPIC Manufacturer Rebate program. Under the legislation, all manufacturers must sign a rebate agreement with EPIC in order to have their products covered. A total of 102 manufacturers were affected and notified of the new requirement. During the program year, 48 manufacturers were terminated because they refused to sign the EPIC Manufacturer Rebate Agreement. The drugs that were sold by these manufacturers’ had minimal impact
Program Description and Changes
8
on EPIC seniors when they were no longer covered, since substitute products were available from other participating manufacturers. The amendment to the EPIC Manufacturer Rebate Agreement, which modified the rebate calculation and certain administrative components, was mailed to participating manufacturers during July. Additionally, the approved amendment changes were incorporated into the Manufacturer Rebate Agreement, which is signed by new manufacturers who join the program. Rebate invoices for utilization during the second quarter of 2002 were mailed to participating manufacturers during August as required. These invoices, and resulting rebate payments, reflected the change in the rebate calculation under Chapter 1 of the Laws of 2002 that was effective April 1, 2002. Benefit Recovery Program Chapter 1 of the Laws of 2002 established the requirement that other insurance plans with prescription coverage for seniors must participate in a benefit recovery program with EPIC. The legislation requires the following:
• Insurance plans must complete a semi-annual match of enrollment files with EPIC to identify seniors that are dually enrolled in both plans. Insurers may request a more frequent match (monthly or bi-monthly).
• Insurance plans are required to provide EPIC with information about the level of
prescription coverage (e.g., co-payment or deductible requirements) available to dual enrollees. This information will enable EPIC to more effectively coordinate benefits.
• EPIC is required to provide the insurance plans with detailed data on pharmacy
claims paid within the past 24 months, but not prior to April 1, 2002, for all dual enrollees. The plans are then required to process the claim data to determine any net amount payable for which they were responsible under the terms of their coverage agreement with each enrollee.
• Within sixty days of receiving the claim data in an electronic format, insurance plans
are required to reimburse EPIC the total amount payable for all claims that were the responsibility of the plan.
EPIC is legally defined as the payer of last resort. The benefit recovery program will allow EPIC to recover the cost of claims paid for prescriptions that should have been paid by other insurance plans. EPIC participants are reminded to show both their other insurance and EPIC cards to their pharmacists. Provider pharmacies are instructed to bill the primary insurance company first and then bill EPIC. This does not always happen. This retroactive recovery process will help ensure that EPIC is effectively the payer of last resort, without impeding seniors’ access at the point of sale to the medications they need to stay healthy. In addition to cost savings, the following positive outcomes are anticipated:
Program Description and Changes
9
• Improved data on enrollees with other insurance. Seniors are asked to provide information about their other prescription insurance when applying for or renewing their coverage with EPIC. Sometimes the information provided by the senior is not accurate or complete. The enrollment match process will alleviate this problem.
• Identification of enrollees with better coverage. Seniors with other prescription
coverage that is equal to or better than EPIC are not eligible for the program. While only a few insurance plans continue to provide better coverage than EPIC, the enrollment matches with the plans will identify seniors that are ineligible for EPIC. These seniors will be advised that they can rejoin EPIC for the remainder of the year if they reach their benefit limit with their primary insurer.
• Enhanced coordination of benefits procedures. Under the new legislation, insurance
plans are required to provide EPIC with detailed benefit information. The availability of this information will allow the program to more effectively coordinate benefits with other plans and ensure that EPIC is the payer of last resort. This information will also enable EPIC to educate pharmacies and enrollees more effectively on how to use their dual coverage to maximize their savings.
EPIC has established working relationships with the other insurance plans to initiate the benefit recovery program. A standardized file exchange process and specifications, developed collaboratively, will be utilized. The process includes stringent confidentiality protocols and agreements by the plans and EPIC that guarantees the protection and restricted use of confidential data. Implementation of the recovery program is scheduled during 2003, with recovery of benefits retroactive to April 1, 2002.


Enrollment Levels
11
II. ENROLLMENT LEVELS
Thank you so much for the EPIC prescription plan. I don’t know where I would be without EPIC. Ms. D. Brantingham, NY
Introduction During the program year, EPIC enrollment continued to increase steadily as a result of the program expansion that took effect in January 2001. Nearly 295,000 seniors living in New York State were receiving EPIC benefits by the end of the program year on September 30, 2002. The success of the expansion far exceeded the expectation that enrollment would reach approximately 220,000 seniors. Enrollment increased 29 percent from the prior program year, and about 100 percent from the inception of the program changes on January 1, 2001. This section analyzes the effect of the legislative enhancements on application and enrollment processing, focusing on this latest program year. Seniors Applying for EPIC As illustrated in Figure 1, 92,227 seniors applied for benefits during the program year. Although the number of applications received this year is lower than the previous program year, application activity has remained high and is still more than double the number received before the expansion. More than 208,000 seniors applied to EPIC since the program changes were announced. EPIC outreach activities have been instrumental in maintaining the momentum of the program expansion and heightening program visibility through extensive newspaper and radio advertising. Application and enrollment activity by county appears in Table I of the Appendix.
FIGURE 1
ANNUAL APPLICATION ACTIVITY
Program Year
Applications Received
% Change From Previous Year
1995-96 20,679 -22.8% 1996-97 19,457 -6.3% 1997-98 24,648 +26.7% 1998-99 36,481 +48.0% 1999-00 40,447 +10.9% 2000-01 116,118 +187.1% 2001-02 92,227 -20.6%
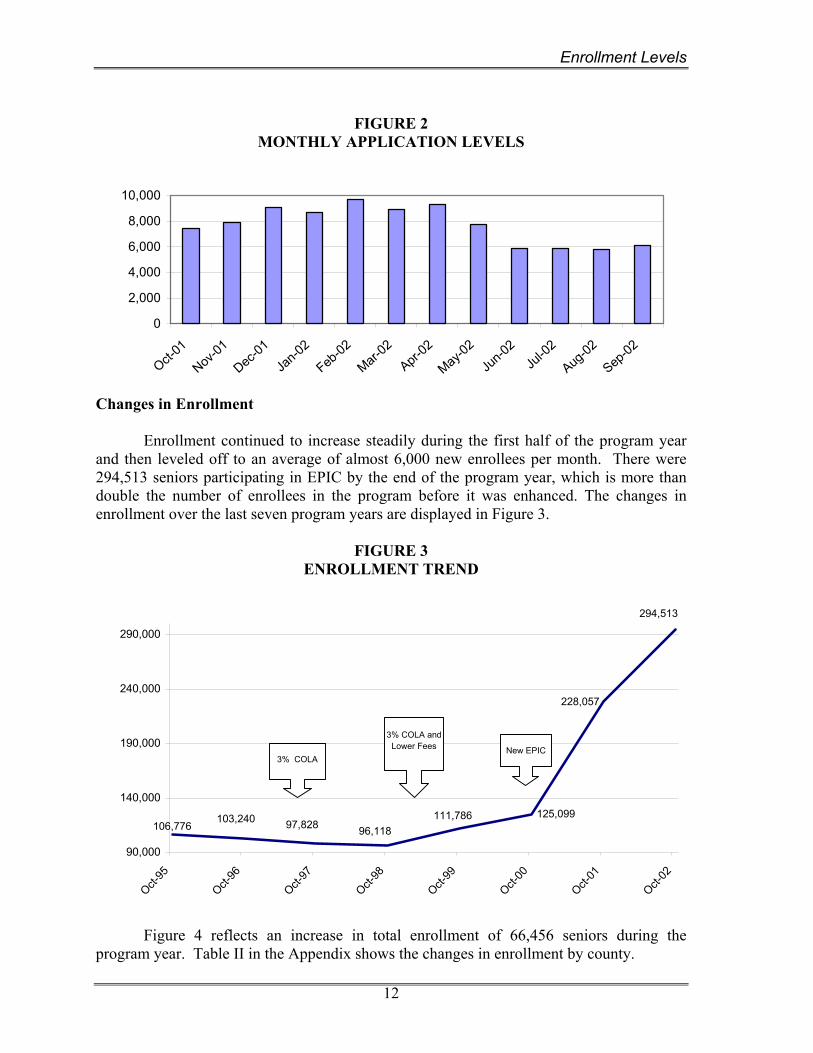
Figure 2 depicts the number of seniors applying each month for EPIC coverage. Between 5,800 and 9,800 applications were processed each month. The effects of reductions in other prescription plans on January 1st is evident between December and April, when application activity was high and averaged over 8,000 applications per month.
Enrollment Levels
12
FIGURE 2
MONTHLY APPLICATION LEVELS
0
2,000
4,000
6,000
8,000
10,000
Oct-01
Nov-01
Dec-01
Jan-0
2
Feb-02
Mar-02
Apr-02
May-02
Jun-0
2Ju
l-02
Aug-02
Sep-02
Changes in Enrollment Enrollment continued to increase steadily during the first half of the program year and then leveled off to an average of almost 6,000 new enrollees per month. There were 294,513 seniors participating in EPIC by the end of the program year, which is more than double the number of enrollees in the program before it was enhanced. The changes in enrollment over the last seven program years are displayed in Figure 3.
FIGURE 3 ENROLLMENT TREND
96,118125,099
97,828
228,057
103,240106,776
111,786
294,513
90,000
140,000
190,000
240,000
290,000
Oct-95
Oct-96
Oct-97
Oct-98
Oct-99
Oct-00
Oct-01
Oct-02
3% COLA
3% COLA andLower Fees New EPIC
Figure 4 reflects an increase in total enrollment of 66,456 seniors during the program year. Table II in the Appendix shows the changes in enrollment by county.

Enrollment Levels
13
FIGURE 4
ANNUAL ENROLLMENT CHANGES
Program Year
Enrollment at Start of Year
Enrollment at End of Year
Enrollment Increase (Decrease)
1995-96 106,776 103,240 ( 3,536) 1996-97 103,240 97,828 ( 5,412) 1997-98 97,828 96,118 ( 1,710) 1998-99 96,118 111,786 15,668 1999-00 111,786 125,099 13,313 2000-01 125,099 228,057 102,958 2001-02 228,057 294,513 66,456
Enrollment by Plan Type The percent of seniors enrolling in the Fee and Deductible Plans has changed significantly as a result of the January 2001 enhancements. Prior to the changes, 96 percent of participants were in the Fee Plan, and only four percent were enrolled in the Deductible Plan. At that time, seniors in the higher income levels could choose between the Fee and Deductible Plans. But the Fee Plan was a better option for those with drug costs, leaving few enrollees in the Deductible Plan. The changes in 2001 created a new Deductible Plan for enrollees in the upper income levels, significantly changing participation rates by type of plan. As illustrated in Figure 5, by the end of the program year 76 percent (223,640) of enrollees were enrolled in the Fee Plan and 24 percent (70,818) were enrolled in the Deductible Plan. This compares to 80 percent in the Fee Plan and 20 percent in the Deductible Plan at the start of the program year.
FIGURE 5
ENROLLMENT BY PLAN TYPE AS OF SEPTEMBER 30, 2002
FEE(223,640)
76%
DEDUCTIBLE (70,818)
24%
Over the program year, enrollment grew by 41,540 seniors in the Fee Plan and 24,916 seniors in the Deductible Plan. This represents a 23 percent increase in the Fee Plan and a 54 percent increase in the Deductible Plan. Figure 6 depicts the growth in monthly

Enrollment Levels
14
enrollment by plan type. Total enrollment grew by more than 6,500 seniors per month through May 2002, and then gradually tapered off to an increase of 2,700 seniors during the month of September 2002.
FIGURE 6 MONTHLY ENROLLMENT
BY PLAN TYPE
-
50,000
100,000
150,000
200,000
250,000
300,000
350,000
Oct-01
Nov-01
Dec-01
Jan-0
2
Feb-02
Mar-02
Apr-02
May-02
Jun-0
2Ju
l-02
Aug-02
Sep-02
DEDUCTIBLE
FEE
Portrait of EPIC Enrollees The influence of the 2001 program expansion on EPIC participant demographics is still evolving. This program year, the average income of EPIC enrollees rose to $17,214 as a result of seniors with higher income levels joining the program. Although the average EPIC participant continues to be a widowed female, there has been an increase in the number of males and the number of married seniors joining the program. Expanded outreach activities targeting minority populations has also increased the number of minority enrollees. Figure 7 reflects the impact of the expansion on EPIC participant demographics.
FIGURE 7
PORTRAIT OF EPIC ENROLLEES BY PROGRAM YEAR
1999-00 2000-01 2001-02 Average Income $10,759 $15,705 $17,214 Female 79% 74% 73% Single 77% 67% 66% Average Age 79 78 78 Deductible Enrollment 4% 20% 24% Fee Enrollment 96% 80% 76% Minorities 11% 11% 12%
Enrollment Levels
15
Seniors with Other Insurance Over the past few years, EPIC has increasingly been used by seniors to supplement
other prescription coverage. The dramatic rise in drug costs, coupled with the reduction in pharmacy benefits offered by private insurers, has increased the need for EPIC. If a senior has other prescription coverage that is equal to or better than EPIC, they are not eligible to join the program. However, if they have reached their drug benefit limit with their primary insurer, they may join EPIC for the portion of the year that they are without coverage. Most of the prescription plans have annual limits on prescription coverage, and some have quarterly limits. Seniors with other prescription coverage that is not as extensive as EPIC may enroll any time. Because EPIC is the payer of last resort, enrollees are reminded to use their primary insurance first, and any remaining drug costs can be billed to EPIC.
The EPIC claim processing system was enhanced in May 2000 to make it easier for pharmacies to electronically bill EPIC as the secondary payer. During this program year, EPIC processed 310,722 claims as secondary payer after $3.35 million was paid by other insurers. This was more than five times the percentage of claims processed last year by EPIC as the secondary payer. Some pharmacies continue to bill EPIC for the net amount without reflecting any payment made by the primary plan, making it difficult to determine the full extent of other benefits paid. EPIC continues to educate and encourage pharmacies to include other insurance information on submitted claims, to improve the coordination of benefits process.
Seniors with other better prescription coverage By the end of the program year, there were only three insurance plans that were considered to provide better drug coverage than EPIC. At year end, 747 seniors were enrolled in these three plans compared to 5,912 seniors with better coverage during the prior year. Two of the plans were reducing their benefits effective January 2003 and would no longer be better than EPIC. The one remaining plan still considered better than EPIC provided coverage to 158 EPIC enrollees who will be reverting to the other coverage on January 1, 2003 when their annual benefits resume. Seniors with other lesser prescription coverage There were 66,405 enrollees at the end of the program year with other prescription coverage not as good as EPIC. These seniors use EPIC as secondary coverage to supplement their primary prescription insurance coverage. Similar to previous years, several Medicare managed care plans terminated their coverage in certain areas around the State on January 1, 2002, impacting over 15,000 beneficiaries downstate, including 14,000 in Nassau County alone. Others continued to reduce or eliminate prescription benefits from their plans. The most significant known example is Aetna US Healthcare, leaving 19,000 seniors in Westchester and Rockland counties and the five boroughs of New York City without prescription coverage. These changes result in many seniors replacing lost benefits with EPIC, or using EPIC to supplement limited coverage. EPIC outreach staff held special enrollment and informational sessions in these areas to inform seniors about the program and offer
Enrollment Levels
16
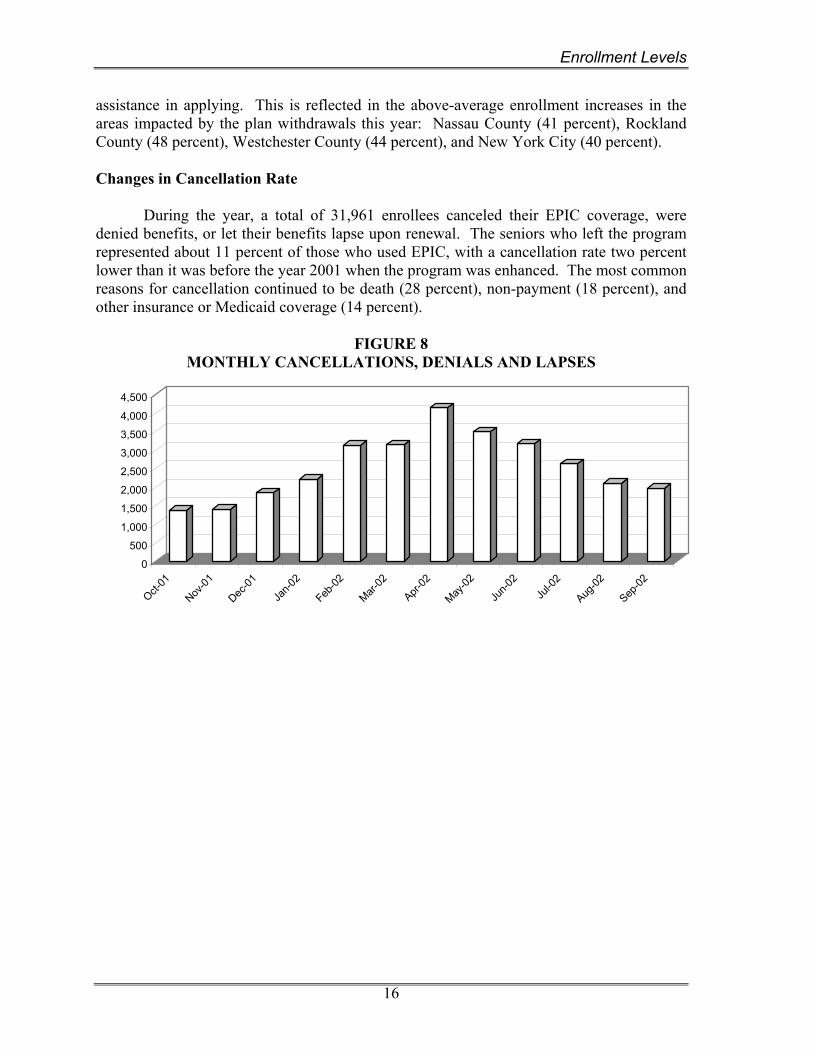
assistance in applying. This is reflected in the above-average enrollment increases in the areas impacted by the plan withdrawals this year: Nassau County (41 percent), Rockland County (48 percent), Westchester County (44 percent), and New York City (40 percent). Changes in Cancellation Rate During the year, a total of 31,961 enrollees canceled their EPIC coverage, were denied benefits, or let their benefits lapse upon renewal. The seniors who left the program represented about 11 percent of those who used EPIC, with a cancellation rate two percent lower than it was before the year 2001 when the program was enhanced. The most common reasons for cancellation continued to be death (28 percent), non-payment (18 percent), and other insurance or Medicaid coverage (14 percent).
FIGURE 8 MONTHLY CANCELLATIONS, DENIALS AND LAPSES
0
500
1,000
1,500
2,000
2,500
3,000
3,500
4,000
4,500
Oct-01
Nov-01
Dec-01
Jan-0
2
Feb-02
Mar-02
Apr-02
May-02
Jun-0
2Ju
l-02
Aug-02
Sep-02

Drug Cost Trends
17
III. DRUG COST TRENDS
I just want to express my thanks for this prescription program. Previously, I was having a most difficult time paying for my medications. Thank you again.
Ms. H. Buffalo, NY Introduction During the program year, total drug costs were heavily impacted by the increase in enrollment due to the program expansion which began in January 2001. Net state costs increased by $103 million over that of the prior program year, largely due to the significantly higher enrollment. Over 286,000 seniors used EPIC to purchase 8.6 million prescriptions. Eighty-eight percent of program costs were incurred under the Fee Plan. The increase in the average prescription cost was limited to 8.2 percent, due to the lower prices allowed under the new pharmacy reimbursement methodology. Since April 1, 2002, the change in reimbursement saved almost $19 million in drug costs. This section highlights the changes in the cost of prescription drugs and the impact of the legislation on program costs. Summary of Costs EPIC benefits were used by more than 286,000 seniors during the program year. These seniors purchased almost 8.6 million prescriptions that cost a total of $588.8 million. By using EPIC, seniors saved nearly $460.4 million at the pharmacy. After deducting participant fees and manufacturers’ rebates, the net cost to the State was $345.3 million. Figure 9 contains a summary of this year’s program statistics.
FIGURE 9 PROGRAM SUMMARY STATISTICS
Enrollment as of September 30, 2002 294,513 Seniors Active during Year 286,640 Prescriptions Purchased 8,558,607 Total Cost of Drugs $588.8M Total EPIC Payments $460.4M Fees Paid by Seniors $19.0M Rebates By Manufacturers $96.1M Net State Costs $345.3M
Figure 10 provides a review of the statistics by plan type, which highlights the differences in the enrollment and drug costs between the Fee and Deductible Plans. As shown, the rate of activity was higher in the Fee Plan than the Deductible Plan. This is partly because the Deductible Plan attracts more seniors with no drug costs who use the risk-free plan as a safety net against future expenses. Over 234,000 seniors in the Fee Plan purchased 7.1 million prescriptions, and 52,420 seniors in the Deductible Plan purchased
Drug Cost Trends
18
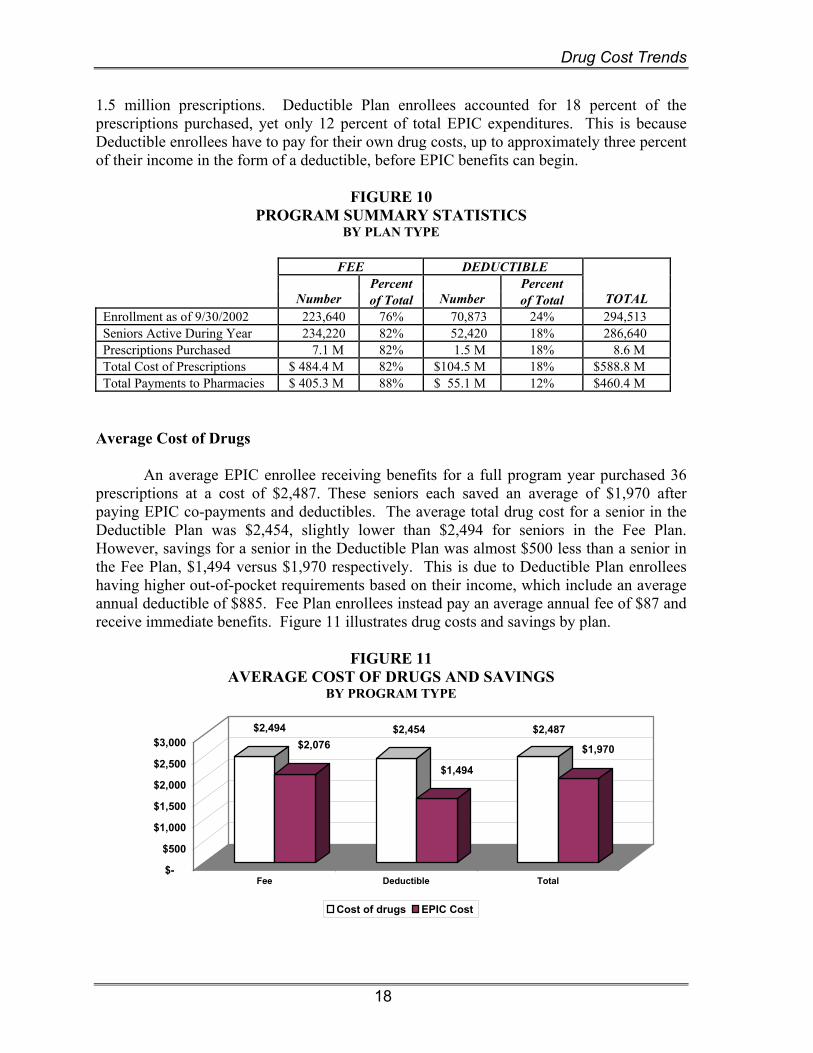
1.5 million prescriptions. Deductible Plan enrollees accounted for 18 percent of the prescriptions purchased, yet only 12 percent of total EPIC expenditures. This is because Deductible enrollees have to pay for their own drug costs, up to approximately three percent of their income in the form of a deductible, before EPIC benefits can begin.
FIGURE 10
PROGRAM SUMMARY STATISTICS BY PLAN TYPE
FEE DEDUCTIBLE
Percent Percent Number of Total Number of Total TOTAL Enrollment as of 9/30/2002 223,640 76% 70,873 24% 294,513 Seniors Active During Year 234,220 82% 52,420 18% 286,640 Prescriptions Purchased 7.1 M 82% 1.5 M 18% 8.6 M Total Cost of Prescriptions $ 484.4 M 82% $104.5 M 18% $588.8 M Total Payments to Pharmacies $ 405.3 M 88% $ 55.1 M 12% $460.4 M
Average Cost of Drugs An average EPIC enrollee receiving benefits for a full program year purchased 36 prescriptions at a cost of $2,487. These seniors each saved an average of $1,970 after paying EPIC co-payments and deductibles. The average total drug cost for a senior in the Deductible Plan was $2,454, slightly lower than $2,494 for seniors in the Fee Plan. However, savings for a senior in the Deductible Plan was almost $500 less than a senior in the Fee Plan, $1,494 versus $1,970 respectively. This is due to Deductible Plan enrollees having higher out-of-pocket requirements based on their income, which include an average annual deductible of $885. Fee Plan enrollees instead pay an average annual fee of $87 and receive immediate benefits. Figure 11 illustrates drug costs and savings by plan.
FIGURE 11 AVERAGE COST OF DRUGS AND SAVINGS
BY PROGRAM TYPE
$2,494$2,076
$2,454
$1,494
$2,487
$1,970
$-
$500
$1,000
$1,500
$2,000
$2,500
$3,000
Fee Deductible Total
Cost of drugs EPIC Cost

Drug Cost Trends
19
Approximately 58 percent of the seniors in the Deductible Plan reach their annual deductible limit. This is a relatively high number of seniors considering that 22 percent of Deductible enrollees had no prescription purchases. On average, seniors who reach their deductible purchase 44 prescriptions costing $3,140. These seniors take about five months to reach their average annual deductible of $825, and they save $1,978. Seniors with higher annual deductibles will take almost twice as long (seven months) to reach their annual deductible compared to seniors having lower deductibles (three and one-half months). EPIC seniors averaged $505 in out-of-pocket costs, including annual fees, incurred during the program year. This amount represents 20 percent of the average total cost of drugs of $2,487. Figure 12 illustrates that the out-of-pocket costs of enrollees have remained relatively low throughout the years. As shown, the average participant’s share, including co-payments, deductibles, and fees, has increased by a modest $40 since the 1995-1996 program year. In contrast, the total cost of drugs has increased over $1,000 during this period.
FIGURE 12 PARTICIPANT COST SHARE
$-
$500
$1,000
$1,500
$2,000
$2,500
95-96 96-97 97-98 98-99 99-00 99-01 01-02
Cost of Drugs Participants Costs
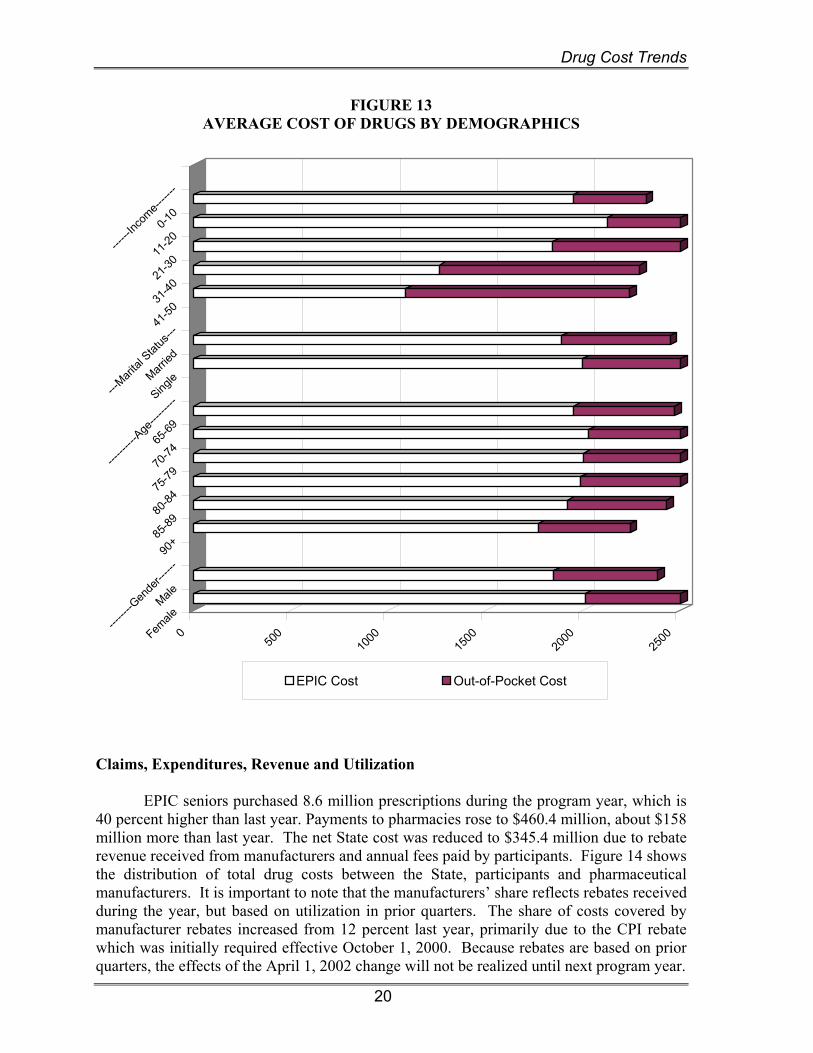
Figure 13 illustrates the divergence in the cost of drugs by participant demographics. Seniors with incomes between $11,000 and $30,000 incurred the most drug costs, by more than $200. This can be attributed to the higher annual premiums required within this income group, which limit participation by seniors with low drug costs. Also evident is the increase in out-of-pocket costs along with income levels, which is integral to the design of the program. Single seniors spent slightly more than married seniors, $2,500 versus $2,446, respectively. Additionally, seniors over the age of 90 spent about $200 less on prescriptions than the average EPIC seniors, and females spent $140 more than male enrollees on prescriptions.
Drug Cost Trends
20
FIGURE 13 AVERAGE COST OF DRUGS BY DEMOGRAPHICS
050
010
0015
0020
0025
00Female
Male
------
--Gen
der--
----
90+
85-89
80-84
75-79
70-74
65-69
------
----A
ge---
------
SingleMarr
ied
---Mari
tal Stat
us---
41-50
31-40
21-30
11-20
0-10
------
Incom
e-----
--
EPIC Cost Out-of-Pocket Cost
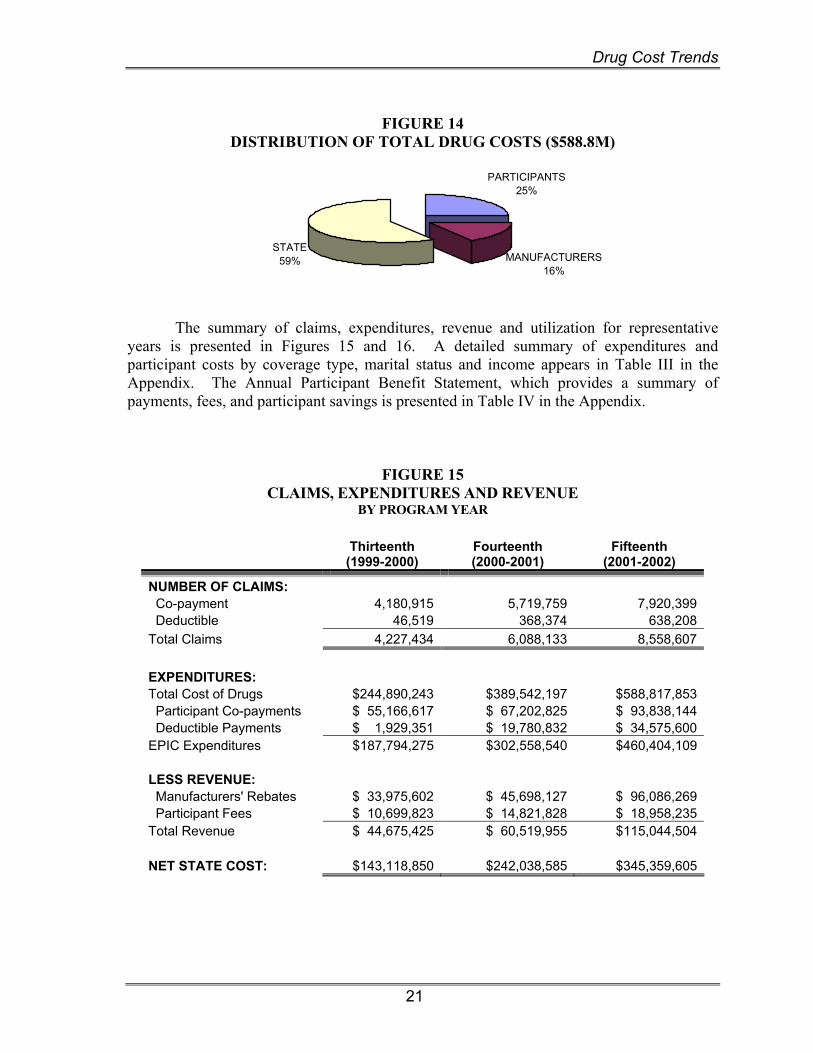
Claims, Expenditures, Revenue and Utilization EPIC seniors purchased 8.6 million prescriptions during the program year, which is 40 percent higher than last year. Payments to pharmacies rose to $460.4 million, about $158 million more than last year. The net State cost was reduced to $345.4 million due to rebate revenue received from manufacturers and annual fees paid by participants. Figure 14 shows the distribution of total drug costs between the State, participants and pharmaceutical manufacturers. It is important to note that the manufacturers’ share reflects rebates received during the year, but based on utilization in prior quarters. The share of costs covered by manufacturer rebates increased from 12 percent last year, primarily due to the CPI rebate which was initially required effective October 1, 2000. Because rebates are based on prior quarters, the effects of the April 1, 2002 change will not be realized until next program year.
Drug Cost Trends
21
FIGURE 14
DISTRIBUTION OF TOTAL DRUG COSTS ($588.8M)
STATE59% MANUFACTURERS
16%
PARTICIPANTS25%
The summary of claims, expenditures, revenue and utilization for representative years is presented in Figures 15 and 16. A detailed summary of expenditures and participant costs by coverage type, marital status and income appears in Table III in the Appendix. The Annual Participant Benefit Statement, which provides a summary of payments, fees, and participant savings is presented in Table IV in the Appendix.
FIGURE 15 CLAIMS, EXPENDITURES AND REVENUE
BY PROGRAM YEAR
Thirteenth (1999-2000)
Fourteenth (2000-2001)
Fifteenth (2001-2002)
NUMBER OF CLAIMS: Co-payment 4,180,915 5,719,759 7,920,399 Deductible 46,519 368,374 638,208 Total Claims 4,227,434 6,088,133 8,558,607 EXPENDITURES: Total Cost of Drugs $244,890,243 $389,542,197 $588,817,853 Participant Co-payments $ 55,166,617 $ 67,202,825 $ 93,838,144 Deductible Payments $ 1,929,351 $ 19,780,832 $ 34,575,600 EPIC Expenditures $187,794,275 $302,558,540 $460,404,109 LESS REVENUE: Manufacturers' Rebates $ 33,975,602 $ 45,698,127 $ 96,086,269 Participant Fees $ 10,699,823 $ 14,821,828 $ 18,958,235 Total Revenue $ 44,675,425 $ 60,519,955 $115,044,504 NET STATE COST: $143,118,850 $242,038,585 $345,359,605
Drug Cost Trends
22
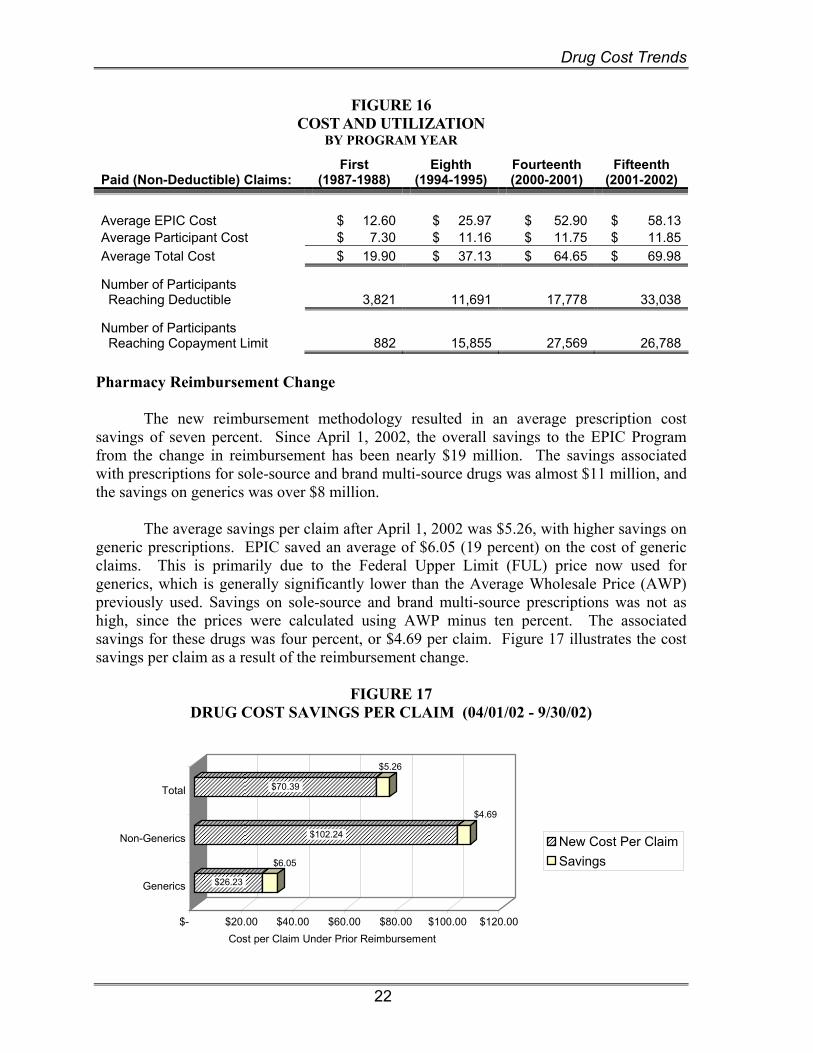
FIGURE 16 COST AND UTILIZATION
BY PROGRAM YEAR
Paid (Non-Deductible) Claims: First
(1987-1988) Eighth
(1994-1995) Fourteenth (2000-2001)
Fifteenth (2001-2002)
Average EPIC Cost $ 12.60 $ 25.97 $ 52.90 $ 58.13 Average Participant Cost $ 7.30 $ 11.16 $ 11.75 $ 11.85 Average Total Cost $ 19.90 $ 37.13 $ 64.65 $ 69.98
Number of Participants Reaching Deductible 3,821 11,691 17,778 33,038
Number of Participants Reaching Copayment Limit 882 15,855 27,569 26,788
Pharmacy Reimbursement Change The new reimbursement methodology resulted in an average prescription cost savings of seven percent. Since April 1, 2002, the overall savings to the EPIC Program from the change in reimbursement has been nearly $19 million. The savings associated with prescriptions for sole-source and brand multi-source drugs was almost $11 million, and the savings on generics was over $8 million. The average savings per claim after April 1, 2002 was $5.26, with higher savings on generic prescriptions. EPIC saved an average of $6.05 (19 percent) on the cost of generic claims. This is primarily due to the Federal Upper Limit (FUL) price now used for generics, which is generally significantly lower than the Average Wholesale Price (AWP) previously used. Savings on sole-source and brand multi-source prescriptions was not as high, since the prices were calculated using AWP minus ten percent. The associated savings for these drugs was four percent, or $4.69 per claim. Figure 17 illustrates the cost savings per claim as a result of the reimbursement change.
FIGURE 17
DRUG COST SAVINGS PER CLAIM (04/01/02 - 9/30/02)
$26.23
$6.05
$102.24
$4.69
$70.39
$5.26
$- $20.00 $40.00 $60.00 $80.00 $100.00 $120.00Cost per Claim Under Prior Reimbursement
Generics
Non-Generics
Total
New Cost Per ClaimSavings
Drug Cost Trends
23
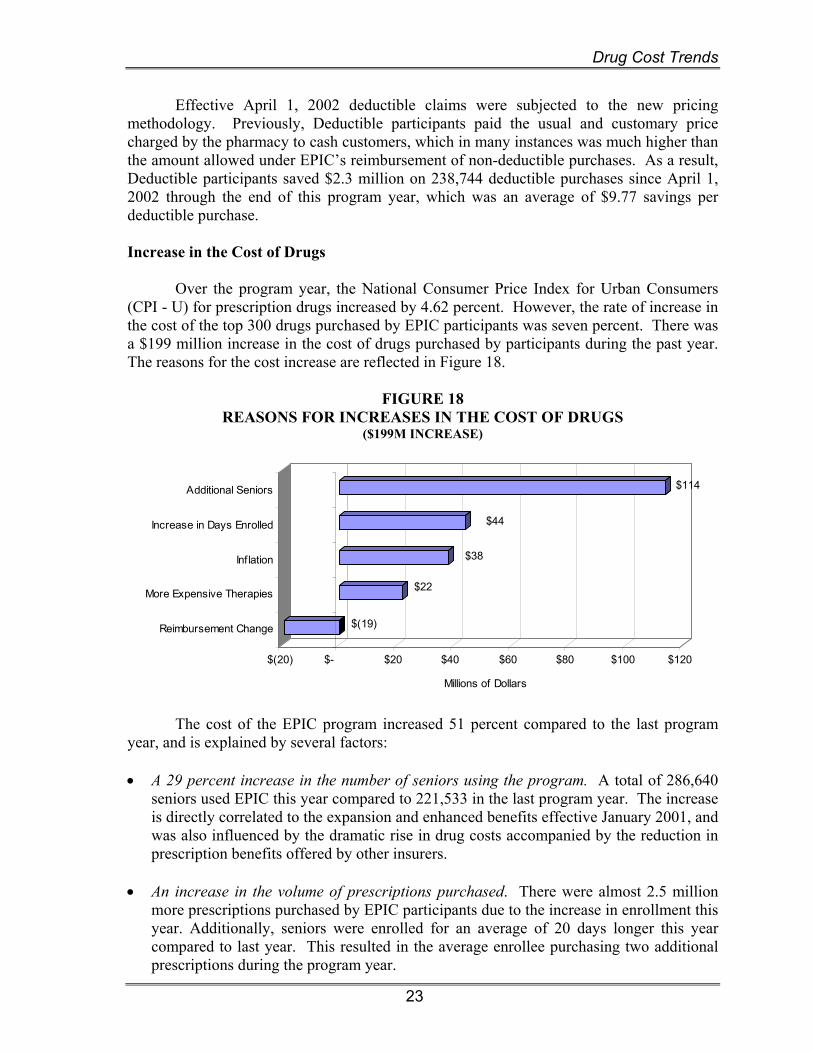
Effective April 1, 2002 deductible claims were subjected to the new pricing methodology. Previously, Deductible participants paid the usual and customary price charged by the pharmacy to cash customers, which in many instances was much higher than the amount allowed under EPIC’s reimbursement of non-deductible purchases. As a result, Deductible participants saved $2.3 million on 238,744 deductible purchases since April 1, 2002 through the end of this program year, which was an average of $9.77 savings per deductible purchase. Increase in the Cost of Drugs Over the program year, the National Consumer Price Index for Urban Consumers (CPI - U) for prescription drugs increased by 4.62 percent. However, the rate of increase in the cost of the top 300 drugs purchased by EPIC participants was seven percent. There was a $199 million increase in the cost of drugs purchased by participants during the past year. The reasons for the cost increase are reflected in Figure 18.
FIGURE 18 REASONS FOR INCREASES IN THE COST OF DRUGS
($199M INCREASE)
$(19)
$22
$38
$44
$114
$(20) $- $20 $40 $60 $80 $100 $120
Millions of Dollars
Reimbursement Change
More Expensive Therapies
Inflation
Increase in Days Enrolled
Additional Seniors
The cost of the EPIC program increased 51 percent compared to the last program year, and is explained by several factors: • A 29 percent increase in the number of seniors using the program. A total of 286,640
seniors used EPIC this year compared to 221,533 in the last program year. The increase is directly correlated to the expansion and enhanced benefits effective January 2001, and was also influenced by the dramatic rise in drug costs accompanied by the reduction in prescription benefits offered by other insurers.
• An increase in the volume of prescriptions purchased. There were almost 2.5 million
more prescriptions purchased by EPIC participants due to the increase in enrollment this year. Additionally, seniors were enrolled for an average of 20 days longer this year compared to last year. This resulted in the average enrollee purchasing two additional prescriptions during the program year.

Drug Cost Trends
24
• An increase in the cost of the average prescription purchase. The average prescription cost increased by 8.2 percent to $69.98, from $64.65 last year. The average cost of prescriptions for the past six years appears in Figure 19. As illustrated, prescription costs rose from $39.51 during the 1995-96 program year to $69.98 this year. The rate of inflation increased the price of commonly used drugs by $4.53 per prescription. However, the new reimbursement change partially offset the inflationary increase. The net increase in the cost of the average prescription was $5.33.
• A high use of sole source drugs by EPIC’s target population. A total of 74 percent of
program expenditures was spent on sole source medications, which are brand name drugs with no generic available. These drugs generally consist of the new, innovative therapies that are now on the market and are generally much more expensive than generic or brand multi-source drugs as discussed in Section IV. As an example, new studies have resulted in improved therapy including preventive treatment. Plavix has been shown to prevent heart attacks and strokes in patients who previously had them or are known to have blood circulatory problems. This medication is used extensively in the EPIC population, costing almost $11 million this year. The average annual cost of this drug is $1,250, with enrollees paying an average of $203.
• Direct consumer advertising creates high participant demand for certain prescription
medications. During this program year, half of the top twenty drugs based on EPIC payments were marketed to consumers on television and in popular magazines. They included Lipitor and Zocor, prescribed to lower cholesterol and Celebrex and Vioxx, prescribed to treat arthritic conditions. The media campaign contributed to the high usage of these relatively expensive medications.
FIGURE 19
AVERAGE COST OF EPIC PRESCRIPTIONS
$30
$35
$40
$45
$50
$55
$60
$65
$70
95-96 96-97 97-98 98-99 99-00 00-01 01-02
State Share of Drug Costs Twenty percent of the medications purchased by EPIC participants cost over $100. This is 14 percent higher than last year. As in the past, most of these medications were used for chronic illnesses such as heart disease, arthritis, cancer and gastrointestinal disorders. A small number (13,074) of EPIC prescriptions cost more than $1,000. These are predominantly biotechnology products and chemotherapy agents used in the treatment of cancer. The percentage distribution of EPIC’s covered drugs by volume and price can be
Drug Cost Trends
25
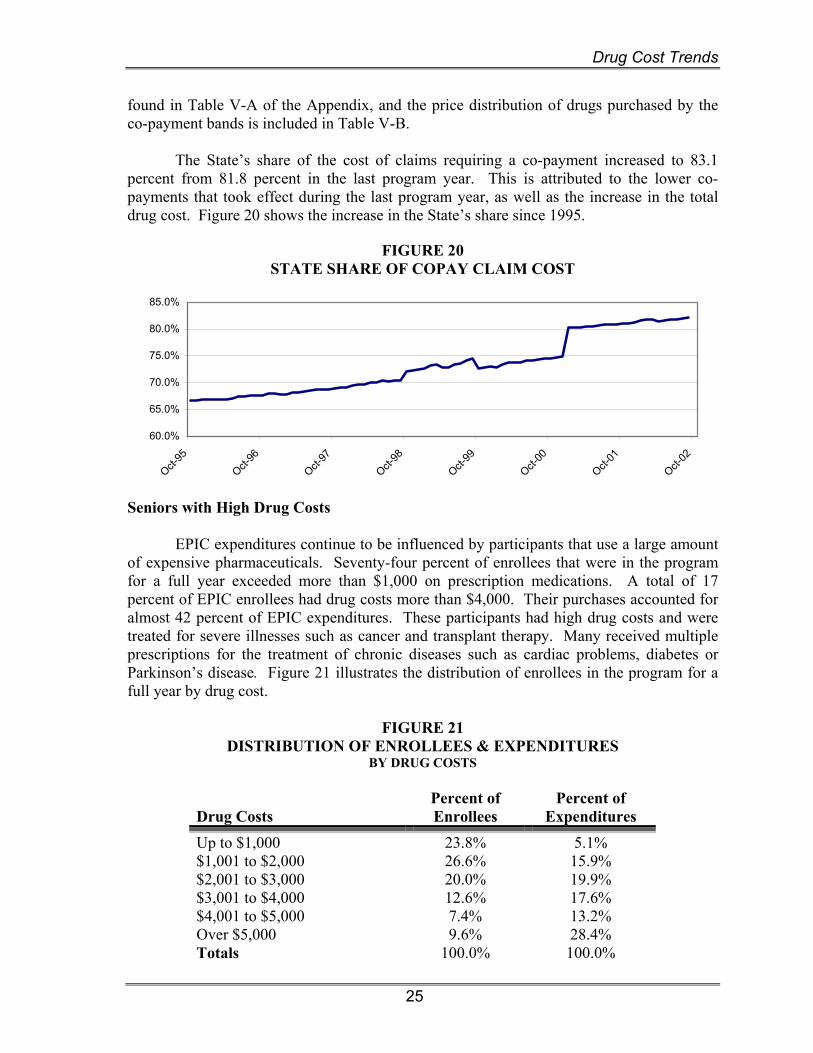
found in Table V-A of the Appendix, and the price distribution of drugs purchased by the co-payment bands is included in Table V-B. The State’s share of the cost of claims requiring a co-payment increased to 83.1 percent from 81.8 percent in the last program year. This is attributed to the lower co-payments that took effect during the last program year, as well as the increase in the total drug cost. Figure 20 shows the increase in the State’s share since 1995.
FIGURE 20 STATE SHARE OF COPAY CLAIM COST
60.0%
65.0%
70.0%
75.0%
80.0%
85.0%
Oct-95
Oct-96
Oct-97
Oct-98
Oct-99
Oct-00
Oct-01
Oct-02
Seniors with High Drug Costs EPIC expenditures continue to be influenced by participants that use a large amount of expensive pharmaceuticals. Seventy-four percent of enrollees that were in the program for a full year exceeded more than $1,000 on prescription medications. A total of 17 percent of EPIC enrollees had drug costs more than $4,000. Their purchases accounted for almost 42 percent of EPIC expenditures. These participants had high drug costs and were treated for severe illnesses such as cancer and transplant therapy. Many received multiple prescriptions for the treatment of chronic diseases such as cardiac problems, diabetes or Parkinson’s disease. Figure 21 illustrates the distribution of enrollees in the program for a full year by drug cost.
FIGURE 21 DISTRIBUTION OF ENROLLEES & EXPENDITURES
BY DRUG COSTS
Drug Costs
Percent of Enrollees
Percent of Expenditures
Up to $1,000 23.8% 5.1% $1,001 to $2,000 26.6% 15.9% $2,001 to $3,000 20.0% 19.9% $3,001 to $4,000 12.6% 17.6% $4,001 to $5,000 7.4% 13.2% Over $5,000 9.6% 28.4% Totals 100.0% 100.0%

Drug Cost Trends
26
Two-Year Enrollment and Cost Projections Enrollment and cost projections for the next two years are presented in Figure 22. These projections reflect the effects of expanded enrollment, and lower fees and co-payments that became effective on January 1, 2001, as well as the changes in pharmacy reimbursement and the manufacturer rebates effective April 1, 2002. These program changes are expected to promote additional increases in enrollment with payments to pharmacies projected to be $562.3 million in the 2002-03 program year and $662.3 million in the 2003-04 program year. These costs will be significantly reduced by manufacturers’ rebates, which have been increased by the full additional CPI rebate that will result from the legislation passed in 2002. The collection of additional rebate revenue began in August 2002 on utilization as of April 1, 2002 as a result of the passage of the Laws of 2002. Another offset to EPIC expenditures is fee revenue, which will increase only slightly with enrollment due to the reduction in fees that were implemented on January 1, 2001. As a result, the net State costs based on current law are projected to be $419.5 million in program year 2002-03 and $495.7 million in program year 2003-04.
FIGURE 22 ENROLLMENT AND COST PROJECTIONS
(DOLLARS IN MILLIONS)
Oct. 2001-Sept. 2002
Oct. 2002-Sept. 2003
Oct. 2003- Sept. 2004
Enrollment 286,513 321,500 328,000
Cost of Drugs $ 588.8 $ 703.0 $ 803.3
EPIC Payments $ 460.4 $ 562.3 $ 662.3
Fees 19.0 19.2 19.7 Rebates 96.1 123.6 146.9 Total Revenues $ 115.1 $ 142.8 $ 166.6
Net State Costs $ 345.3 $ 419.5 $ 495.7
Reviewing Utilization
27
IV. REVIEWING UTILIZATION
This is a good service you’re doing and I’m sure we physicians appreciate this, at least I do..
Sincerely, Dr. A. Introduction The average EPIC participant was 78 years old and used 36 prescriptions last year. These participants have complicated medication regimens that are prescribed to treat a variety of health conditions. The most prevalent conditions include heart disease, arthritis, gastric conditions, and diabetes. Medications Most Frequently Used
Table VI in the Appendix lists the 300 most frequently purchased medications used by EPIC seniors this year. Table VII shows the most frequently purchased types of medications by therapeutic classification. Cardiac drugs continue to account for the highest percentage of usage by EPIC seniors, at 69 percent. Other drugs used to treat cardiac conditions include classes of drugs such as diuretics, hypertensive agents, lipid lowering agents, and vasodilating agents. The next two most frequently used categories are gastrointestinal drugs (30 percent), and antidepressants (18 percent). A new category added to the top ten frequently purchased medications this year is sulfonylureas, which are used to treat diabetes. With obesity and diabetes on the rise, these agents are used to treat a specific type of diabetes mellitus, called Type 2. The American Diabetes Association stresses the importance of aggressive therapy, given the high mortality for diabetics who experience a serious heart attack or have kidney failure.
Table VIII identifies the twenty medications most frequently purchased by EPIC seniors. Although these drugs are often used to treat serious life threatening diseases, many EPIC participants use these medications for preventive treatment of heart disease or complications from diabetes. Examples from this table include the cholesterol lowering agents Lipitor and Zocor. Plavix, a blood thinner that is used to help prevent atherosclerotic events such as strokes, appears in the top twenty drugs again this year. Also, ten of the twenty most frequently purchased medications are used to treat hypertension. Last year, eight of the top twenty medications were used to treat hypertension.
Table IX lists the top twenty drugs based on EPIC payment. Prilosec, Lipitor, Prevacid, and Plavix are the top four drugs identified. Prilosec and Prevacid are used to treat gastrointestinal disorders. The newest drugs added to this list are Nexium, Protonix, Aricept, and Procrit. Nexium and Protonix are used to treat gastrointestinal disorders similar to Prilosec and Prevacid. During this program year more than 55,000 seniors used these four gastrointestinal drugs. The average cost of this therapy for each participant was approximately $800 per year; however, participants saved over 87 percent of the cost of these drugs by utilizing their EPIC benefit.
Reviewing Utilization
28
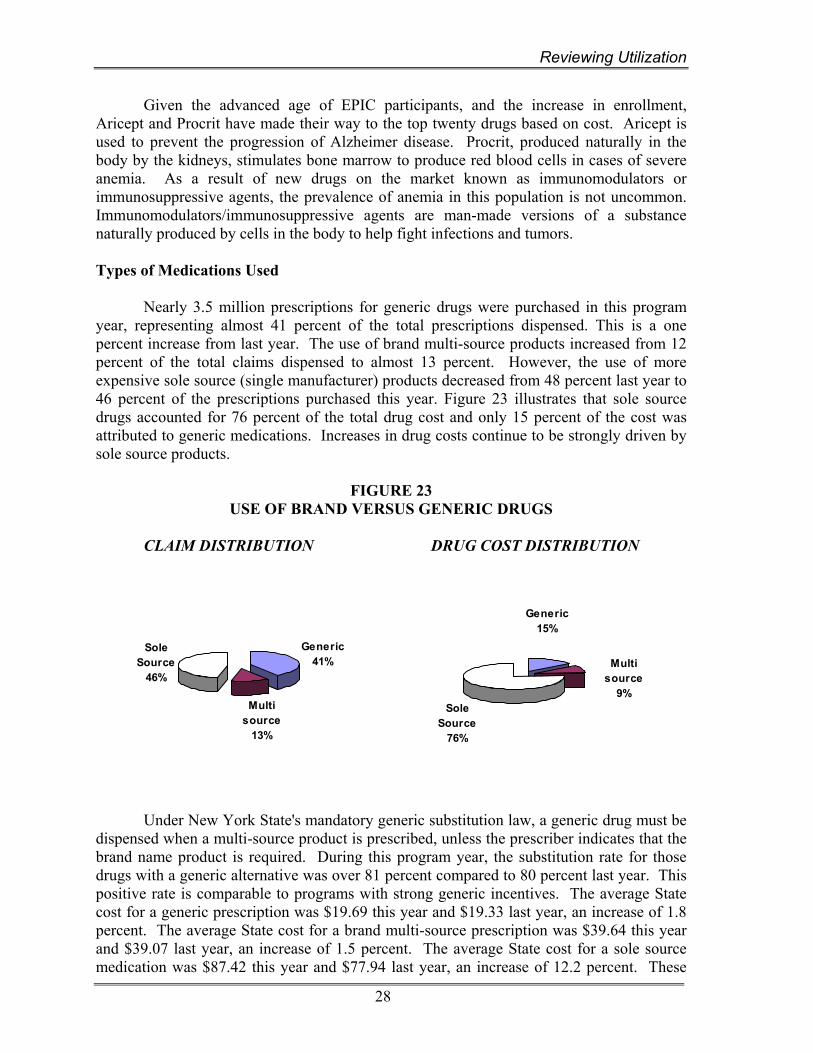
Given the advanced age of EPIC participants, and the increase in enrollment, Aricept and Procrit have made their way to the top twenty drugs based on cost. Aricept is used to prevent the progression of Alzheimer disease. Procrit, produced naturally in the body by the kidneys, stimulates bone marrow to produce red blood cells in cases of severe anemia. As a result of new drugs on the market known as immunomodulators or immunosuppressive agents, the prevalence of anemia in this population is not uncommon. Immunomodulators/immunosuppressive agents are man-made versions of a substance naturally produced by cells in the body to help fight infections and tumors. Types of Medications Used Nearly 3.5 million prescriptions for generic drugs were purchased in this program year, representing almost 41 percent of the total prescriptions dispensed. This is a one percent increase from last year. The use of brand multi-source products increased from 12 percent of the total claims dispensed to almost 13 percent. However, the use of more expensive sole source (single manufacturer) products decreased from 48 percent last year to 46 percent of the prescriptions purchased this year. Figure 23 illustrates that sole source drugs accounted for 76 percent of the total drug cost and only 15 percent of the cost was attributed to generic medications. Increases in drug costs continue to be strongly driven by sole source products.
FIGURE 23 USE OF BRAND VERSUS GENERIC DRUGS
CLAIM DISTRIBUTION DRUG COST DISTRIBUTION
Under New York State's mandatory generic substitution law, a generic drug must be dispensed when a multi-source product is prescribed, unless the prescriber indicates that the brand name product is required. During this program year, the substitution rate for those drugs with a generic alternative was over 81 percent compared to 80 percent last year. This positive rate is comparable to programs with strong generic incentives. The average State cost for a generic prescription was $19.69 this year and $19.33 last year, an increase of 1.8 percent. The average State cost for a brand multi-source prescription was $39.64 this year and $39.07 last year, an increase of 1.5 percent. The average State cost for a sole source medication was $87.42 this year and $77.94 last year, an increase of 12.2 percent. These
Generic41%
Multi source
13%
Sole Source
46%
Sole Source
76%
Multi source
9%
Generic15%
Reviewing Utilization
29
price increases were tempered by the reduction in pharmacy reimbursement that was effective April 1, 2002. Therapeutic Drug Monitoring As seniors age, increased health risks result in the consumption of more drugs needed to keep them healthy. Some seniors are at increased risk for adverse events from medications. Also, impaired hearing and vision often contributes to confusion about their medication regimen.
To improve outcomes and minimize potential problems, EPIC operates a
Therapeutic Drug Monitoring (TDM) program. Situations identified as possibly inappropriate drug therapy are communicated to both pharmacists and prescribers. These providers use the information presented to make clinical decisions about the senior’s drug therapy, and where appropriate initiate a change in drug regimen. These modifications prevent further complications and contribute to improved quality of life for EPIC seniors. Prospective Utilization Review
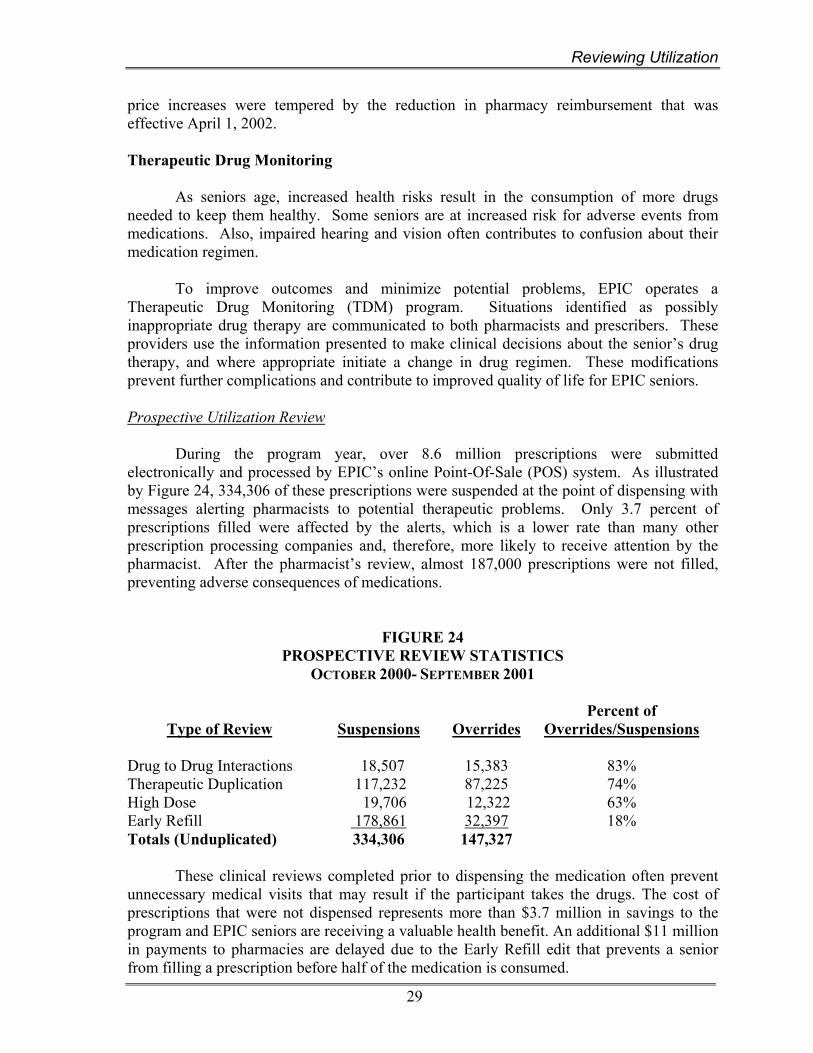
During the program year, over 8.6 million prescriptions were submitted electronically and processed by EPIC’s online Point-Of-Sale (POS) system. As illustrated by Figure 24, 334,306 of these prescriptions were suspended at the point of dispensing with messages alerting pharmacists to potential therapeutic problems. Only 3.7 percent of prescriptions filled were affected by the alerts, which is a lower rate than many other prescription processing companies and, therefore, more likely to receive attention by the pharmacist. After the pharmacist’s review, almost 187,000 prescriptions were not filled, preventing adverse consequences of medications.
FIGURE 24 PROSPECTIVE REVIEW STATISTICS
OCTOBER 2000- SEPTEMBER 2001
Type of Review
Suspensions
Overrides
Percent of Overrides/Suspensions
Drug to Drug Interactions 18,507 15,383 83% Therapeutic Duplication 117,232 87,225 74% High Dose 19,706 12,322 63% Early Refill 178,861 32,397 18% Totals (Unduplicated) 334,306 147,327
These clinical reviews completed prior to dispensing the medication often prevent unnecessary medical visits that may result if the participant takes the drugs. The cost of prescriptions that were not dispensed represents more than $3.7 million in savings to the program and EPIC seniors are receiving a valuable health benefit. An additional $11 million in payments to pharmacies are delayed due to the Early Refill edit that prevents a senior from filling a prescription before half of the medication is consumed.
Reviewing Utilization
30
Retrospective Utilization Review
In addition to the prospective review at the pharmacy, all prescriptions for EPIC seniors are subject to a retrospective review which uses established clinical criteria. A computerized review identifies participants that may be at risk, due to drug interactions, duplicative therapies, overuse, or the use of multiple pharmacies and physicians. Pharmacists clinically review the medication history profiles of those with possible problems, and informational letters are sent to all relevant prescribers.
During the program year, 7,750 clinical reviews were completed. As a result, 1,778 informational letters were sent to prescribers on behalf of 631 participants. Consistent with previous years, almost 40 percent of medical providers responded to the letters. A large number of prescribers commented about the usefulness of the information.
The effectiveness of the retrospective program is evaluated by performing a post-intervention review of drug therapy six months after a letter was sent to a prescriber on behalf of a participant. Changes in therapy, which help avoid adverse consequences of medication, occur in about 30 percent of the cases. Payments to Pharmacies Table X in the Appendix shows the distribution of claims and payments by pharmacy type and Table XI presents a summary of pharmacy claims and payments by county. Almost 4,000 pharmacies provided services to EPIC participants this year, each receiving an average annual payment of $117,000. Payments were made through an Electronic Funds Transfer (EFT) system, which ensures an accurate and direct payment to providers. Pharmacies received $460.4 million in State payments, an increase of 51 percent from last year. Fifty-five percent of active pharmacies are chain stores, 42 percent are independently operated stores, and the remainder represented institutions or mail order pharmacies. Chain stores received 52 percent of EPIC expenditures in the 1995 - 1996 program year. This rate has increased over the last five years, reaching 61 percent during the current program year. Independent pharmacies received a smaller percentage of EPIC expenditures (35 percent) during this program year.

Program Operations
31
V. PROGRAM OPERATIONS
Thank you for this program. It is truly a miracle how much it helps my budget. Ms. B. Troy, NY
Introduction EPIC operational activities focused on managing the continued program expansion and implementing the new legislation that was effective on April 1, 2002. Outreach activities helped to increase the visibility of the program and provided valuable information to seniors who lack adequate prescription coverage. As more insurance companies reduce prescription benefits, seniors are relying on EPIC to assist them with the high cost of medications. Throughout the year, pharmacy and internal audits are routinely conducted to monitor the fiscal integrity of EPIC program expenditure. The EPIC Manufacturers’ Rebate Program collected $96 million in rebate revenue. The amount received includes the additional revenue collected from manufacturers who increased drug prices in excess of inflation. Outreach Services Throughout the program year, outreach efforts were focused on increasing public awareness of EPIC and continuing to promote the program enhancements that were effective January 2001. Outreach initiatives were held across the State to inform community-based organizations, health care providers, advocacy groups and other interested parties about the program changes and to provide direct assistance and counseling to seniors considering joining the program. A large-scale distribution of EPIC enrollment brochures and the availability of promotional materials published in foreign languages helped ensure that EPIC information was readily available to all seniors. In addition, several successful promotional campaigns were conducted involving television, radio and newspaper advertising to increase EPIC’s visibility to seniors and caregivers. Partnerships with other agencies and community organizations were strengthened and others pursued to develop new and creative ways to reach out to all seniors in the State. Community Outreach
EPIC outreach representatives maintained a strong presence in communities around the State by organizing and participating in events that targeted seniors, their caregivers and families. During the program year, representatives participated in more than 315 information sessions held in senior centers, pharmacies and senior housing facilities. More than 11,000 seniors attended these events. In addition, representatives participated in other local events sponsored by ethnic and minority community-based organizations, senior services organizations, legislators, local offices for the aging, labor unions, and other interested parties.

Program Operations
32
Outreach representatives participated in 260 senior, county and community fairs during the year where they distributed program materials and assisted seniors in completing applications. Representatives also completed 74 training sessions for more than 1,400 employees of the State Office for Aging, local offices for the aging, Health Insurance Information Counseling and Assistance Program (HIICAP) volunteers, and other groups around the State.
An important initiative this year was to expand EPIC awareness in the medical
community targeting physicians, hospitals administrators, outpatient clinics, home care agencies, and veterans’ administration clinics. As part of this effort, outreach representatives met with almost 550 physicians and provided enrollment brochures for display in their offices. Representatives also contacted 300 institutional-based medical providers to promote the program. As a result of this initiative, 60 information and training sessions were sponsored by health care providers for seniors, their families, caregivers, and others who provide for the health care needs of seniors across the State.
EPIC representatives also worked in partnership with several State and city agencies and other community-based organizations across the State. These agencies and organizations have agreed to assist EPIC in its efforts to increase community awareness of the program, and distributed program materials and provided assistance to seniors who were completing an EPIC application. The City of New York, working through the Department for the Aging (DFTA), the Department of Health and Mental Hygiene, and the Health and Hospitals Corporation, supported a major outreach initiative aimed at increasing EPIC awareness for seniors living in the New York metropolitan area. EPIC outreach staff conducted a comprehensive training for over thirty New York City staff to enable them to counsel and assist seniors to enroll in EPIC. Distributing Program Information During the year, EPIC’s enrollment brochure was updated and over one million copies distributed to pharmacies, legislators, health care providers, local offices for the aging, and various other organizations and agencies that serve seniors. A targeted informational mailing to over 35,000 physicians in the State was also completed. Each physician received a letter and brochure to heighten their awareness about the availability of EPIC for their patients and encouraged them to request supplies of brochures for distribution in their waiting areas. Mailings were also completed to 110 libraries, faith-based organizations and churches. Application request postcards were distributed by mail to Meals-on-Wheels programs in upstate counties and to seniors receiving meals from the 125 programs in the New York City area. In addition 220 separate mailings to diverse ethnic organizations throughout the State were also completed. Targeted Promotional Initiatives
Reaching out to the State’s diverse ethnic and minority communities in new and creative ways is a major goal of the program’s outreach initiatives. While EPIC enrollment applications have been available in English, Spanish, Chinese, French, Hebrew, Russian, this year it was translated into Greek. Other EPIC materials are also available in Arabic,

Program Operations
33
French and Haitian Creole, Korean, Chinese, Russian, Italian, Polish, and Yiddish. Translated materials were distributed to over 300 ethnic and minority organizations across the State during the program year. Also, plans were initiated to expand the EPIC website to provide access to foreign language materials.
During the year, 100 various outreach initiatives targeting diverse ethnic groups
were conducted throughout the State. Activities included training staff working at community-based organizations, providing literature at conferences, presenting information and helping seniors enroll in the program. Outreach sessions were also conducted for many faith-based organizations. In addition, EPIC advertisements were placed in journals, magazines and newspapers that targeted ethnic populations.
When presenting EPIC information, outreach representatives advise seniors with
other prescription insurance how to appropriately coordinate their other prescription benefits with EPIC. In response to the reduction in prescription benefits provided through retired employee benefit funds and Medicare managed care plans, outreach representatives participated in informational sessions sponsored by retiree organizations, Center for Medicare and Medicaid Services, health maintenance organizations, the State Office for Aging, and local offices for aging. From October to December of 2001, outreach staff participated in 46 events that were designed to assist seniors whose other prescription benefits were being eliminated or reduced on January 1, 2002.
Working with the Media
Various statewide advertising campaigns were conducted to increase program visibility and encourage seniors to join EPIC. Television, radio and newspaper advertising campaigns were successful in reaching large numbers of seniors and their families. Testimonial-style advertisements including program enrollees were aired on 20 television stations in the spring of 2002. These ads generated over 2,100 application requests and a high number of inquiries about the program to the EPIC Helpline.
In the fall of 2001 and spring of 2002, radio advertisements aired on 45 radio
stations, including several Spanish language stations. These radio campaigns ran on radio programming that focused primarily on senior issues and generated over 3,200 application requests. In addition, outreach staff participated in nine radio and television interviews and talk shows in both English and Spanish to present information about EPIC and to respond to seniors’ questions.
While both radio promotion campaigns were underway, newspaper advertisements
promoting the EPIC program were published in 23 major metropolitan newspapers as well as 37 ethnic and minority newspapers across the State. The newspaper ads included EPIC’s eligibility criteria and a coupon that seniors could use to request program information. Both newspaper campaigns generated over 6,400 application requests.
Program Operations
34
Helpline The EPIC toll-free Helpline is a resource available to potential applicants, participants, caregivers and providers who need information or assistance. The Helpline responded to 435,074 calls received during the program year. The most frequent reasons for seniors calling the Helpline were to inquire about the program, request an enrollment application, or request assistance in completing an EPIC application. Additionally, EPIC operates a toll-free Helpline for EPIC pharmacy providers, which responded to over 31,935 telephone inquiries from pharmacies during the year. There were also 26,153 written requests for information received from seniors during the program year.
The majority of calls received by the Helpline were from English-speaking callers. However, there have been noticeable increases each year in the number of calls from Spanish-speaking individuals. During the program year, bilingual Spanish-speaking Helpline staff responded to 10,424 calls. The increased volume reflects the effectiveness of recent outreach efforts targeting Hispanic communities, especially in New York City.
The EPIC program website can be found by accessing the New York State
Department of Health on the Internet (www.health.state.ny.us). The EPIC website is available to anyone interested in obtaining detailed information regarding EPIC program benefits. Applications can be requested online, or can be downloaded and printed in English and Spanish. A copy of the latest published annual report is available for printing. The site is being enhanced to provide additional information that will be of interest to participants, consumers and the provider community. EPIC also provides an e-mail address that enables interested parties to send communications directly to program staff.
Information about the EPIC program is also available through the Senior Citizens
Hot Line operated by the State Office for the Aging, and on their website at www.aging.state.ny.us. During the year, 672 phone calls related to the EPIC Program were handled by the New York State Office for the Aging.
Cost Effectiveness of Outreach
An evaluation of the cost effectiveness of EPIC outreach initiatives was completed, as required by legislation. Outreach activities included in this review were advertising campaigns and activities related to distribution of the EPIC brochure. Based on the number of telephone calls and mail-in coupons received, 36,891 seniors applied to the EPIC program in response to the television, radio and newspaper advertisements at a cost of $41.29 per application. A total of 1,053,000 brochures were distributed to EPIC pharmacies, legislators, local offices for the aging, senior centers and other agencies. These initiatives generated approximately 55,336 new applications at a cost of $15.41 per application.

Program Operations
35
Performance of the Contractor
As specified in legislation, a contractor secured through a competitive procurement process performed major operational functions. EPIC’s current contract with First Health Services Corporation was originally for a five-year term, but was extended by one year until September 30, 2003.
The contractor’s responsibilities include monitoring and evaluating operational
functions such as application and enrollment processing, participant and provider relations, pharmacy enrollment and reimbursement, claim processing, outreach and systems development. The contractor also provides support to the State operation of the manufacturer rebate and therapeutic drug monitoring programs. Specific contract performance standards established for each function are designed to ensure quality operations.
State staff monitored First Health’s compliance with the performance standards
through routine and special audits, with emphasis on areas directly affecting participants and pharmacy providers. The contractor was compliant with all contract performance standards this program year with one exception. On June 19, 2002, computer hardware failure resulted in the point-of-sale (POS) online claim processing system not being available to all providers for a significant portion of the day. As a result, the contractor was determined to be out of compliance with the POS availability performance standard for the month of June 2002, and liquidated damages were assessed.
The legislative changes approved in 2000 expanded the EPIC program benefits
effective January 1, 2001. As a result, enrollment continued to increase dramatically during the program year. First Health displayed a high level of commitment to EPIC by effectively managing large volumes of phone calls received by the provider and participant helplines, increased application activity, and outreach initiatives.
Some enhancements and modifications to the program operations, systems development, and therapeutic drug monitoring program were successfully implemented this year, including:
• Software changes were implemented to implement program changes required by Chapter 1 of the Laws of 2002. These included modifications to the provider reimbursement rate and manufacturers’ rebate formula and participation requirement, as well as mandatory participation of other insurance plans in a benefit recovery program with EPIC.
• EPIC and Suffolk County entered into an agreement under which the contractor
produces a statement of fees and co-payments for each enrollee residing in Suffolk County at the end of their coverage year. The statements are submitted to the County for reimbursement of their EPIC fees and co-payments.
• The Retrospective Drug Utilization Review system was upgraded to more
effectively and efficiently monitor medications dispensed to EPIC participants, and inform prescribers when seniors are at risk from potential drug problems.
Program Operations
36
Pharmacy Audits
EPIC staff performed audits throughout the year to ensure the fiscal integrity of the $460 million in State reimbursement payments to pharmacies and their compliance with legislative and regulatory requirements. This year 61 pharmacy audits were completed that resulted in recoveries totaling more than $94,000. One of the audits resulted in a recoupment of $10,000 from a pharmacy whose participation in the program was terminated due to the submission of fraudulent claims. EPIC staff also collaborated with the Attorney General’s Medicaid Fraud Control Unit on three pharmacy audits to investigate the submission of inappropriate claims. These investigations did not result in any significant audit findings for the program.
To support the program’s ongoing efforts that ensure the validity of claim
reimbursements to pharmacy providers, the verification of benefits (VOB) process was expanded. During the year, the VOB selection criteria were refined and the number of letters sent to participants after each payment cycle was increased from 400 to 1,500. More than 25,000 participants whose drug utilization met specific criteria were requested to verify that they received the drugs that were billed on their behalf. These participants were sent letters along with paid benefit listings and were requested to verify directly with EPIC that they did receive the prescriptions. Over 88 percent of the selected participants responded to these letters. All negative responses were referred to audit staff for further investigation and, if necessary, on-site pharmacy audit review. Several pharmacies were scheduled for field audits as a direct result of a participant’s response to the VOB letter and more than $25,000 in audit recoveries were attributed to the VOB process.
In addition to the VOB process, audit staff also confirmed directly with over 5,500
participants the validity of the claim information submitted on their behalf. This benefit verification process was undertaken to confirm the claim reimbursements made to pharmacies that were scheduled for onsite audits. When necessary, participants’ physicians were also contacted to confirm that they authorized the dispensing of drugs in questions. This direct verification process was very important in the pharmacy audits and did result in identifying several claims that needed further on-site pharmacy audit review.
During the year, all participating pharmacies were required to provide updated
enrollment information to EPIC through the biennial recertification process. In completing this recertification, all participating pharmacies were required to confirm that the ownership and control interest information EPIC has on file was correct and up-to-date. Also, 28 applicant enrollment eligibility cases were referred by the contractor to the Audit Unit for reconsideration review. All of these cases were resolved by direct contact with the applicant or their caregiver to clarify EPIC’s enrollment eligibility guidelines.
Manufacturer Rebate Program In 1991, the EPIC Manufacturer Rebate Program was established. Under the terms of the program, pharmaceutical manufacturers contractually agree to pay EPIC a rebate in exchange for EPIC coverage of their products. More than 300 drug manufacturers, which include all major drug producers, participate in the rebate program. As a result, almost all pharmaceuticals used by EPIC seniors are covered.
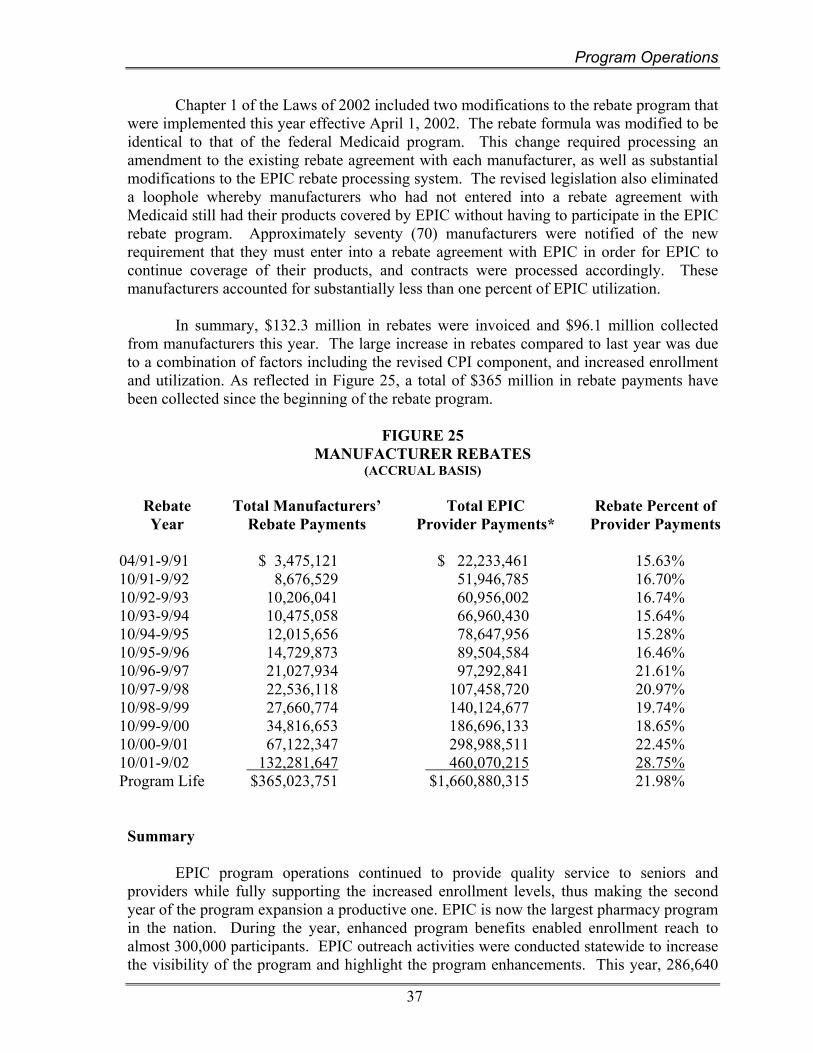
Program Operations
37
Chapter 1 of the Laws of 2002 included two modifications to the rebate program that were implemented this year effective April 1, 2002. The rebate formula was modified to be identical to that of the federal Medicaid program. This change required processing an amendment to the existing rebate agreement with each manufacturer, as well as substantial modifications to the EPIC rebate processing system. The revised legislation also eliminated a loophole whereby manufacturers who had not entered into a rebate agreement with Medicaid still had their products covered by EPIC without having to participate in the EPIC rebate program. Approximately seventy (70) manufacturers were notified of the new requirement that they must enter into a rebate agreement with EPIC in order for EPIC to continue coverage of their products, and contracts were processed accordingly. These manufacturers accounted for substantially less than one percent of EPIC utilization. In summary, $132.3 million in rebates were invoiced and $96.1 million collected from manufacturers this year. The large increase in rebates compared to last year was due to a combination of factors including the revised CPI component, and increased enrollment and utilization. As reflected in Figure 25, a total of $365 million in rebate payments have been collected since the beginning of the rebate program.
FIGURE 25
MANUFACTURER REBATES (ACCRUAL BASIS)
Rebate Year
Total Manufacturers’ Rebate Payments
Total EPIC Provider Payments*
Rebate Percent of Provider Payments
04/91-9/91 $ 3,475,121 $ 22,233,461 15.63%10/91-9/92 8,676,529 51,946,785 16.70%10/92-9/93 10,206,041 60,956,002 16.74%10/93-9/94 10,475,058 66,960,430 15.64%10/94-9/95 12,015,656 78,647,956 15.28%10/95-9/96 14,729,873 89,504,584 16.46%10/96-9/97 21,027,934 97,292,841 21.61%10/97-9/98 22,536,118 107,458,720 20.97%10/98-9/99 27,660,774 140,124,677 19.74%10/99-9/00 34,816,653 186,696,133 18.65%10/00-9/01 67,122,347 298,988,511 22.45%10/01-9/02 132,281,647 460,070,215 28.75%Program Life $365,023,751 $1,660,880,315 21.98%
Summary EPIC program operations continued to provide quality service to seniors and providers while fully supporting the increased enrollment levels, thus making the second year of the program expansion a productive one. EPIC is now the largest pharmacy program in the nation. During the year, enhanced program benefits enabled enrollment reach to almost 300,000 participants. EPIC outreach activities were conducted statewide to increase the visibility of the program and highlight the program enhancements. This year, 286,640
Program Operations
38
seniors purchased more than 8.6 million prescriptions, saving seniors more than $460.4 million. The EPIC program enables New York State seniors to receive the prescriptions they need to stay healthy by providing an affordable program that is senior-friendly and easy to use.
APPENDIX TABLE TITLE
I APPLICATIONS AND ENROLLMENT BY COUNTY
II ENROLLMENT CHANGES BY COUNTY
III UTILIZATION BY COVERAGE TYPE, MARITAL STATUS AND INCOME
IV PARTICIPANT BENEFITS STATEMENT
V-A DISTRIBUTION OF DRUGS BY VOLUME AND PRICE
V-B DISTRIBUTION OF DRUGS PURCHASED BY PRICE
VI 300 MOST FREQUENTLY PURCHASED DRUGS
VII TEN MOST FREQUENTLY PURCHASED TYPES OF DRUGS BY THERAPEUTIC CLASSIFICATION
VIII TWENTY MOST FREQUENTLY PURCHASED DRUGS
IX TOP TWENTY DRUGS BASED ON EPIC PAYMENTS
X DISTRIBUTION OF CLAIMS AND PAYMENTS BY PHARMACY TYPE
XI ENROLLED PHARMACIES, CLAIMS AND PAYMENTS BY COUNTY

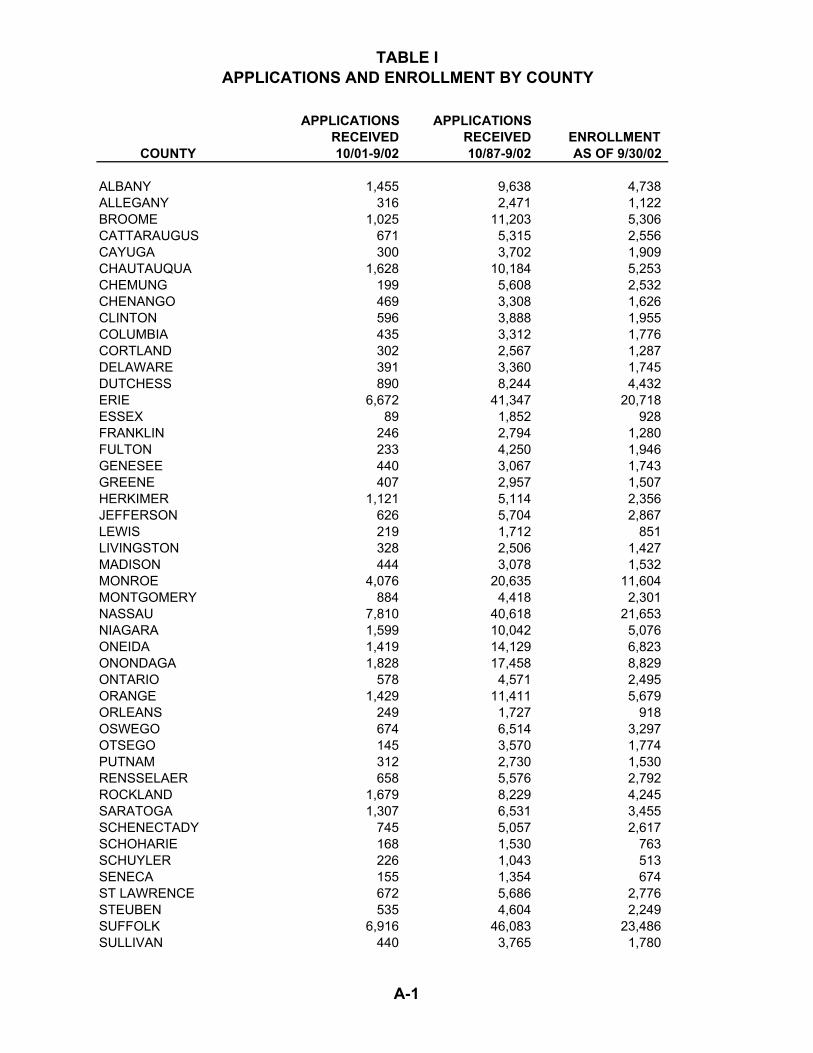
TABLE I APPLICATIONS AND ENROLLMENT BY COUNTY
APPLICATIONS APPLICATIONSRECEIVED RECEIVED ENROLLMENT
COUNTY 10/01-9/02 10/87-9/02 AS OF 9/30/02
ALBANY 1,455 9,638 4,738 ALLEGANY 316 2,471 1,122 BROOME 1,025 11,203 5,306 CATTARAUGUS 671 5,315 2,556 CAYUGA 300 3,702 1,909 CHAUTAUQUA 1,628 10,184 5,253 CHEMUNG 199 5,608 2,532 CHENANGO 469 3,308 1,626 CLINTON 596 3,888 1,955 COLUMBIA 435 3,312 1,776 CORTLAND 302 2,567 1,287 DELAWARE 391 3,360 1,745 DUTCHESS 890 8,244 4,432 ERIE 6,672 41,347 20,718 ESSEX 89 1,852 928 FRANKLIN 246 2,794 1,280 FULTON 233 4,250 1,946 GENESEE 440 3,067 1,743 GREENE 407 2,957 1,507 HERKIMER 1,121 5,114 2,356 JEFFERSON 626 5,704 2,867 LEWIS 219 1,712 851 LIVINGSTON 328 2,506 1,427 MADISON 444 3,078 1,532 MONROE 4,076 20,635 11,604 MONTGOMERY 884 4,418 2,301 NASSAU 7,810 40,618 21,653 NIAGARA 1,599 10,042 5,076 ONEIDA 1,419 14,129 6,823 ONONDAGA 1,828 17,458 8,829 ONTARIO 578 4,571 2,495 ORANGE 1,429 11,411 5,679 ORLEANS 249 1,727 918 OSWEGO 674 6,514 3,297 OTSEGO 145 3,570 1,774 PUTNAM 312 2,730 1,530 RENSSELAER 658 5,576 2,792 ROCKLAND 1,679 8,229 4,245 SARATOGA 1,307 6,531 3,455 SCHENECTADY 745 5,057 2,617 SCHOHARIE 168 1,530 763 SCHUYLER 226 1,043 513 SENECA 155 1,354 674 ST LAWRENCE 672 5,686 2,776 STEUBEN 535 4,604 2,249 SUFFOLK 6,916 46,083 23,486 SULLIVAN 440 3,765 1,780
A-1
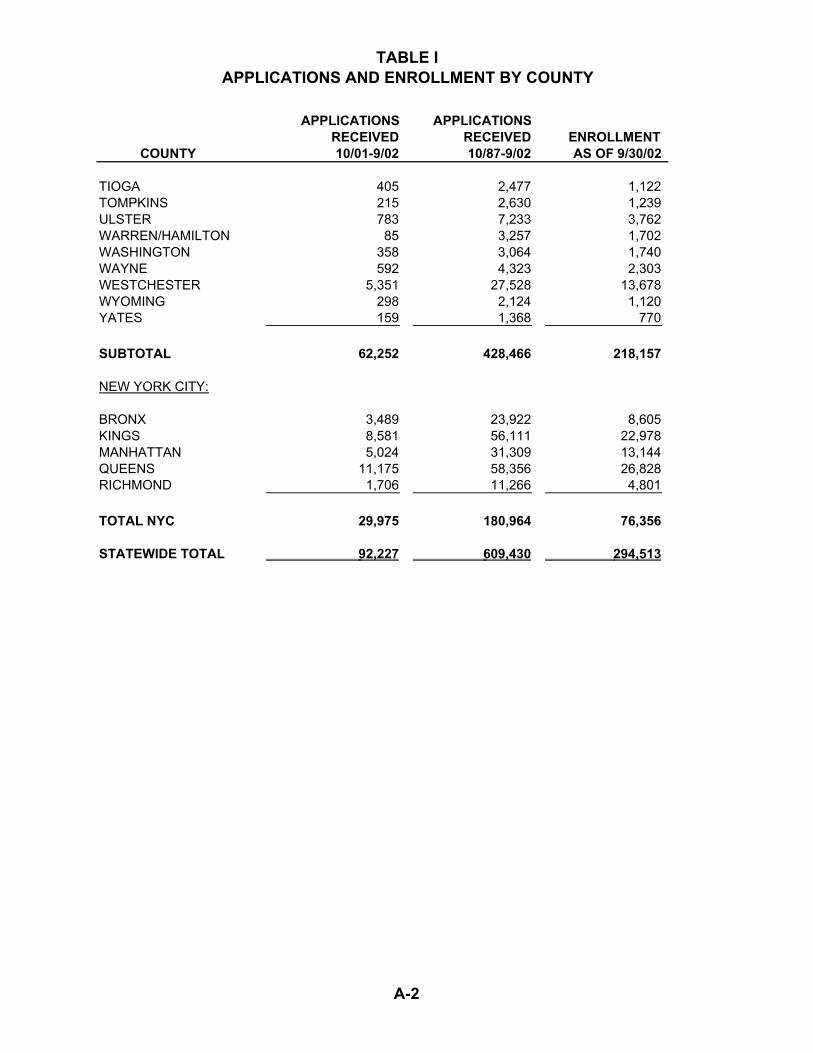
TABLE I APPLICATIONS AND ENROLLMENT BY COUNTY
APPLICATIONS APPLICATIONSRECEIVED RECEIVED ENROLLMENT
COUNTY 10/01-9/02 10/87-9/02 AS OF 9/30/02
TIOGA 405 2,477 1,122 TOMPKINS 215 2,630 1,239 ULSTER 783 7,233 3,762 WARREN/HAMILTON 85 3,257 1,702 WASHINGTON 358 3,064 1,740 WAYNE 592 4,323 2,303 WESTCHESTER 5,351 27,528 13,678 WYOMING 298 2,124 1,120 YATES 159 1,368 770
SUBTOTAL 62,252 428,466 218,157
NEW YORK CITY:
BRONX 3,489 23,922 8,605 KINGS 8,581 56,111 22,978 MANHATTAN 5,024 31,309 13,144 QUEENS 11,175 58,356 26,828 RICHMOND 1,706 11,266 4,801
TOTAL NYC 29,975 180,964 76,356
STATEWIDE TOTAL 92,227 609,430 294,513
A-2
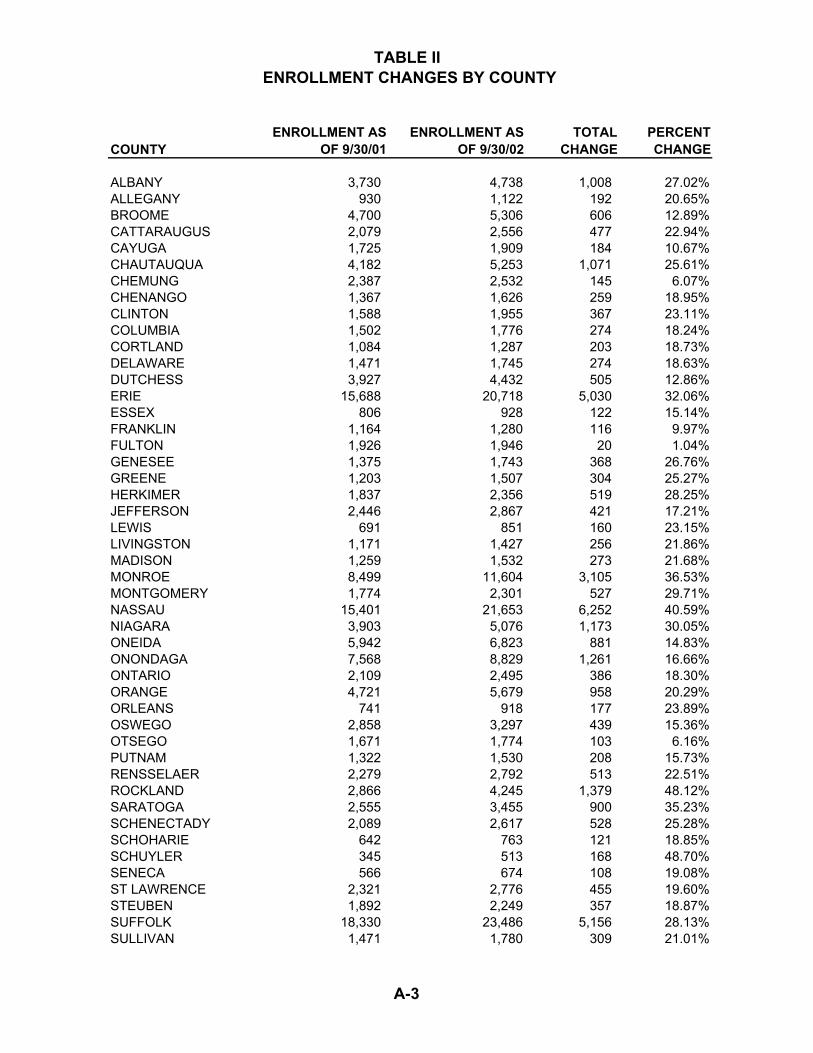
TABLE II ENROLLMENT CHANGES BY COUNTY
COUNTY ENROLLMENT AS
OF 9/30/01 ENROLLMENT AS
OF 9/30/02 TOTAL
CHANGE PERCENT CHANGE
ALBANY 3,730 4,738 1,008 27.02%ALLEGANY 930 1,122 192 20.65%BROOME 4,700 5,306 606 12.89%CATTARAUGUS 2,079 2,556 477 22.94%CAYUGA 1,725 1,909 184 10.67%CHAUTAUQUA 4,182 5,253 1,071 25.61%CHEMUNG 2,387 2,532 145 6.07%CHENANGO 1,367 1,626 259 18.95%CLINTON 1,588 1,955 367 23.11%COLUMBIA 1,502 1,776 274 18.24%CORTLAND 1,084 1,287 203 18.73%DELAWARE 1,471 1,745 274 18.63%DUTCHESS 3,927 4,432 505 12.86%ERIE 15,688 20,718 5,030 32.06%ESSEX 806 928 122 15.14%FRANKLIN 1,164 1,280 116 9.97%FULTON 1,926 1,946 20 1.04%GENESEE 1,375 1,743 368 26.76%GREENE 1,203 1,507 304 25.27%HERKIMER 1,837 2,356 519 28.25%JEFFERSON 2,446 2,867 421 17.21%LEWIS 691 851 160 23.15%LIVINGSTON 1,171 1,427 256 21.86%MADISON 1,259 1,532 273 21.68%MONROE 8,499 11,604 3,105 36.53%MONTGOMERY 1,774 2,301 527 29.71%NASSAU 15,401 21,653 6,252 40.59%NIAGARA 3,903 5,076 1,173 30.05%ONEIDA 5,942 6,823 881 14.83%ONONDAGA 7,568 8,829 1,261 16.66%ONTARIO 2,109 2,495 386 18.30%ORANGE 4,721 5,679 958 20.29%ORLEANS 741 918 177 23.89%OSWEGO 2,858 3,297 439 15.36%OTSEGO 1,671 1,774 103 6.16%PUTNAM 1,322 1,530 208 15.73%RENSSELAER 2,279 2,792 513 22.51%ROCKLAND 2,866 4,245 1,379 48.12%SARATOGA 2,555 3,455 900 35.23%SCHENECTADY 2,089 2,617 528 25.28%SCHOHARIE 642 763 121 18.85%SCHUYLER 345 513 168 48.70%SENECA 566 674 108 19.08%ST LAWRENCE 2,321 2,776 455 19.60%STEUBEN 1,892 2,249 357 18.87%SUFFOLK 18,330 23,486 5,156 28.13%SULLIVAN 1,471 1,780 309 21.01%
A-3

TABLE II ENROLLMENT CHANGES BY COUNTY
COUNTY ENROLLMENT AS
OF 9/30/01 ENROLLMENT AS
OF 9/30/02 TOTAL
CHANGE PERCENT CHANGE
TIOGA 913 1,122 209 22.89%TOMPKINS 1,058 1,239 181 17.11%ULSTER 3,354 3,762 408 12.16%WARREN/HAMILTON 1,582 1,702 120 7.59%WASHINGTON 1,489 1,740 251 16.86%WAYNE 1,869 2,303 434 23.22%WESTCHESTER 9,440 13,678 4,238 44.89%WYOMING 895 1,120 225 25.14%YATES 647 770 123 19.01%
SUBTOTAL 173,350 218,157 44,807 25.85%
NEW YORK CITY:
BRONX 6,233 8,605 2,372 38.06%KINGS 16,924 22,978 6,054 35.77%MANHATTAN 9,531 13,144 3,613 37.91%QUEENS 18,354 26,828 8,474 46.17%RICHMOND 3,665 4,801 1,136 31.00%
TOTAL NYC 54,707 76,356 21,649 39.57%
STATEWIDE TOTAL 228,057 294,513 66,456 29.14%
A-4

TABLE IIIUTILIZATION BY COVERAGE TYPE, MARITAL STATUS AND INCOME
PERCENT OF ENROLLEES
EPIC PAYMENTS
PARTICIPANT COPAYS
PARTICIPANT DEDUCTIBLES
COVERAGE TYPE
FEE PROGRAM 81.7% 405,255,471$ 82,066,454$ -$ DEDUCTIBLE 18.3% 55,148,638 11,771,690 34,575,600
TOTAL 100.0% 460,404,109$ 93,838,144$ 34,575,600$
MARITAL STATUS
MARRIED/LIVING APART 2.0% 9,344,534$ 1,718,859$ 249,274$ MARRIED 30.3% 125,894,282 25,009,399 20,109,382 SINGLE 67.8% 325,165,292 67,109,886 14,216,944
TOTAL 100.0% 460,404,109$ 93,838,144$ 34,575,600$
ANNUAL INCOME
$5,000 OR LESS 2.6% 12,142,962$ 1,677,273$ 10,705$ $5,001-$10,000 19.0% 88,347,767 16,738,312 55,569 $10,001-$15,000 31.2% 155,386,904 32,448,715 186,779 $15,001-$20,000 20.2% 102,860,570 21,870,779 280,422 $20,001-$25,000 12.1% 56,581,135 11,738,641 7,087,515 $25,001-$30,000 6.7% 23,469,908 5,008,982 9,788,448 $30,001-$35,000 4.0% 11,327,250 2,374,657 7,938,402 $35,001-$40,000 2.0% 5,250,230 1,023,203 4,231,083 $40,001-$45,000 1.4% 3,415,317 665,680 3,257,177 $45,001-$50,000 0.7% 1,622,065 291,902 1,739,500
Total 100.0% 460,404,109$ 93,838,144$ 34,575,600$
A-5

A-6
TABLE IV PARTICIPANT BENEFITS STATEMENT
PARTICIPANT BENEFITS STATEMENT
15TH PROGRAM YEAR
(Millions)
PROGRAM LIFE
(Millions) BENEFITS SUMMARY
Payments to Pharmacies $ 459.9 $1,766.4 Payments to Participants .5 10.3 Total Benefits Paid $ 460.4 $1,776.7 Plus: Savings from Repricing 48.3* 175.1 Benefits in Billing Process 0.5 9.7 Less: Prior Period Benefits ( 0.9)** 0
Total Benefits Provided $ 508.3 $1,960.6 FEES AND PREMIUM SUMMARY
Fees and Premiums Paid 19.0 153.4 Plus: Prior Year Prepaid Fees 3.6 0 Less: Prepaid Fees ( 5.0) (28.7)
Net Revenue $ 17.6 $ 124.7 NET BENEFITS SUMMARY Net Benefits Provided (Total Benefits Provided - Net Revenue)
$ 490.7
$1,835.9 * A significant increase in repricing has resulted from the pharmacy reimbursement change **Prior year end accrual not used in consolidated report

TABLE V-ADISTRIBUTION OF DRUGS BY VOLUME AND PRICE
CUMULATIVEPRESCRIPTION PERCENTAGE PERCENTAGE
COST OF CLAIMS OF CLAIMS
$0-$5 1.6% 1.6%$5-$10 13.0% 14.5%$10-$15 8.1% 22.7%$15-$20 5.2% 27.9%$20-$30 9.5% 37.4%$30-$40 8.8% 46.2%$40-$50 8.1% 54.3%$50-$60 6.0% 60.3%$60-$70 7.6% 67.9%$70-$80 5.4% 73.3%$80-$90 3.8% 77.1%$90-$100 3.3% 80.4%$100-$250 16.2% 96.6%$250-$500 3.1% 99.7%$500-$2500 0.3% 100.0%$2500 AND OVER 0.02% 100.0%
TABLE V-BDISTRIBUTION OF DRUGS PURCHASED BY PRICE
PERCENTAGEOF CLAIMS
UP TO $15 22.7%$ 15.01-$35 19.8%$ 35.01-$55 15.2%$ 55.01-$100 22.7%OVER $100 19.6%
Total 100.0%
A-7
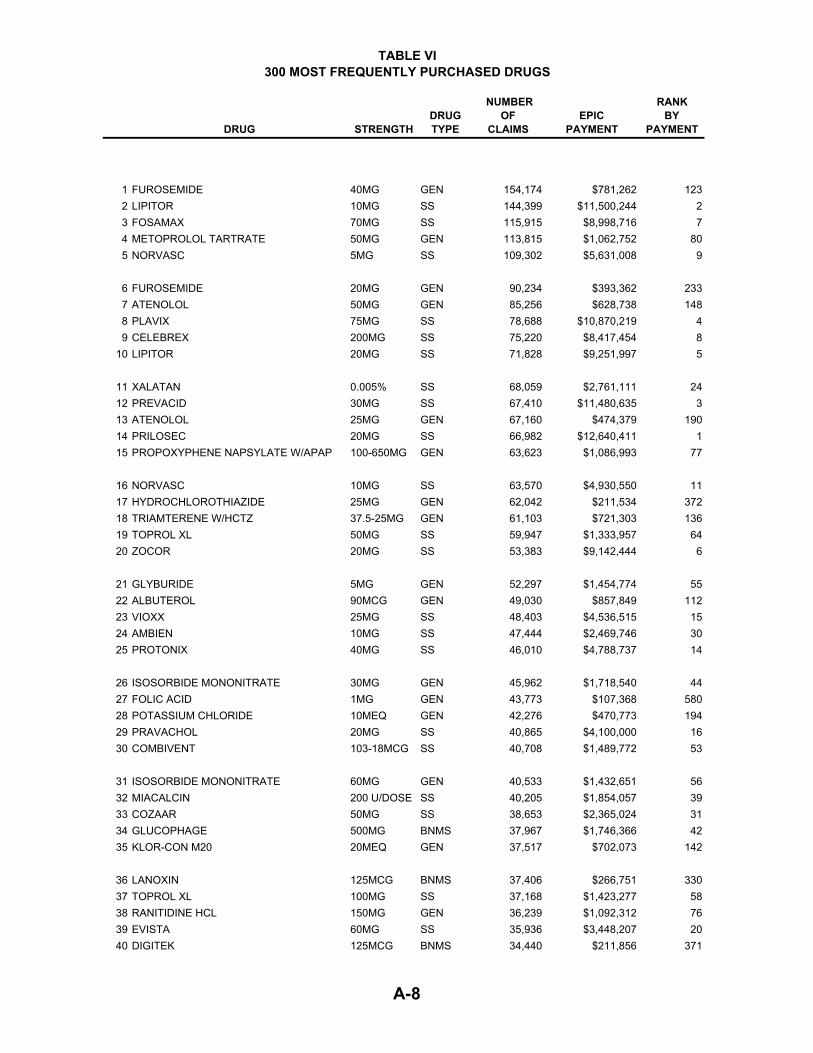
TABLE VI 300 MOST FREQUENTLY PURCHASED DRUGS
DRUG STRENGTHDRUGTYPE
NUMBEROF
CLAIMS EPIC
PAYMENT
RANK BY
PAYMENT
1 FUROSEMIDE 40MG GEN 154,174 $781,262 1232 LIPITOR 10MG SS 144,399 $11,500,244 23 FOSAMAX 70MG SS 115,915 $8,998,716 74 METOPROLOL TARTRATE 50MG GEN 113,815 $1,062,752 805 NORVASC 5MG SS 109,302 $5,631,008 9
6 FUROSEMIDE 20MG GEN 90,234 $393,362 2337 ATENOLOL 50MG GEN 85,256 $628,738 1488 PLAVIX 75MG SS 78,688 $10,870,219 49 CELEBREX 200MG SS 75,220 $8,417,454 8
10 LIPITOR 20MG SS 71,828 $9,251,997 5
11 XALATAN 0.005% SS 68,059 $2,761,111 2412 PREVACID 30MG SS 67,410 $11,480,635 313 ATENOLOL 25MG GEN 67,160 $474,379 19014 PRILOSEC 20MG SS 66,982 $12,640,411 115 PROPOXYPHENE NAPSYLATE W/APAP 100-650MG GEN 63,623 $1,086,993 77
16 NORVASC 10MG SS 63,570 $4,930,550 1117 HYDROCHLOROTHIAZIDE 25MG GEN 62,042 $211,534 37218 TRIAMTERENE W/HCTZ 37.5-25MG GEN 61,103 $721,303 13619 TOPROL XL 50MG SS 59,947 $1,333,957 6420 ZOCOR 20MG SS 53,383 $9,142,444 6
21 GLYBURIDE 5MG GEN 52,297 $1,454,774 5522 ALBUTEROL 90MCG GEN 49,030 $857,849 11223 VIOXX 25MG SS 48,403 $4,536,515 1524 AMBIEN 10MG SS 47,444 $2,469,746 3025 PROTONIX 40MG SS 46,010 $4,788,737 14
26 ISOSORBIDE MONONITRATE 30MG GEN 45,962 $1,718,540 4427 FOLIC ACID 1MG GEN 43,773 $107,368 58028 POTASSIUM CHLORIDE 10MEQ GEN 42,276 $470,773 19429 PRAVACHOL 20MG SS 40,865 $4,100,000 1630 COMBIVENT 103-18MCG SS 40,708 $1,489,772 53
31 ISOSORBIDE MONONITRATE 60MG GEN 40,533 $1,432,651 5632 MIACALCIN 200 U/DOSE SS 40,205 $1,854,057 3933 COZAAR 50MG SS 38,653 $2,365,024 3134 GLUCOPHAGE 500MG BNMS 37,967 $1,746,366 4235 KLOR-CON M20 20MEQ GEN 37,517 $702,073 142
36 LANOXIN 125MCG BNMS 37,406 $266,751 33037 TOPROL XL 100MG SS 37,168 $1,423,277 5838 RANITIDINE HCL 150MG GEN 36,239 $1,092,312 7639 EVISTA 60MG SS 35,936 $3,448,207 2040 DIGITEK 125MCG BNMS 34,440 $211,856 371
A-8
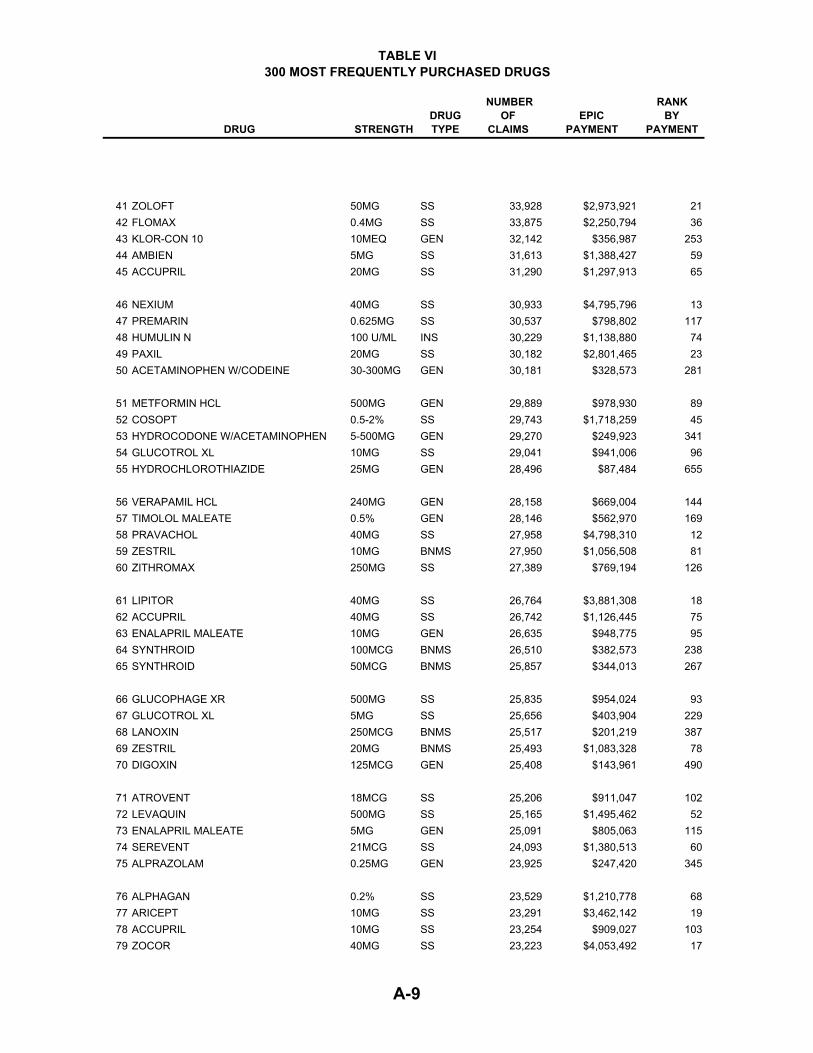
TABLE VI 300 MOST FREQUENTLY PURCHASED DRUGS
DRUG STRENGTHDRUGTYPE
NUMBEROF
CLAIMS EPIC
PAYMENT
RANK BY
PAYMENT
41 ZOLOFT 50MG SS 33,928 $2,973,921 2142 FLOMAX 0.4MG SS 33,875 $2,250,794 3643 KLOR-CON 10 10MEQ GEN 32,142 $356,987 25344 AMBIEN 5MG SS 31,613 $1,388,427 5945 ACCUPRIL 20MG SS 31,290 $1,297,913 65
46 NEXIUM 40MG SS 30,933 $4,795,796 1347 PREMARIN 0.625MG SS 30,537 $798,802 11748 HUMULIN N 100 U/ML INS 30,229 $1,138,880 7449 PAXIL 20MG SS 30,182 $2,801,465 2350 ACETAMINOPHEN W/CODEINE 30-300MG GEN 30,181 $328,573 281
51 METFORMIN HCL 500MG GEN 29,889 $978,930 8952 COSOPT 0.5-2% SS 29,743 $1,718,259 4553 HYDROCODONE W/ACETAMINOPHEN 5-500MG GEN 29,270 $249,923 34154 GLUCOTROL XL 10MG SS 29,041 $941,006 9655 HYDROCHLOROTHIAZIDE 25MG GEN 28,496 $87,484 655
56 VERAPAMIL HCL 240MG GEN 28,158 $669,004 14457 TIMOLOL MALEATE 0.5% GEN 28,146 $562,970 16958 PRAVACHOL 40MG SS 27,958 $4,798,310 1259 ZESTRIL 10MG BNMS 27,950 $1,056,508 8160 ZITHROMAX 250MG SS 27,389 $769,194 126
61 LIPITOR 40MG SS 26,764 $3,881,308 1862 ACCUPRIL 40MG SS 26,742 $1,126,445 7563 ENALAPRIL MALEATE 10MG GEN 26,635 $948,775 9564 SYNTHROID 100MCG BNMS 26,510 $382,573 23865 SYNTHROID 50MCG BNMS 25,857 $344,013 267
66 GLUCOPHAGE XR 500MG SS 25,835 $954,024 9367 GLUCOTROL XL 5MG SS 25,656 $403,904 22968 LANOXIN 250MCG BNMS 25,517 $201,219 38769 ZESTRIL 20MG BNMS 25,493 $1,083,328 7870 DIGOXIN 125MCG GEN 25,408 $143,961 490
71 ATROVENT 18MCG SS 25,206 $911,047 10272 LEVAQUIN 500MG SS 25,165 $1,495,462 5273 ENALAPRIL MALEATE 5MG GEN 25,091 $805,063 11574 SEREVENT 21MCG SS 24,093 $1,380,513 6075 ALPRAZOLAM 0.25MG GEN 23,925 $247,420 345
76 ALPHAGAN 0.2% SS 23,529 $1,210,778 6877 ARICEPT 10MG SS 23,291 $3,462,142 1978 ACCUPRIL 10MG SS 23,254 $909,027 10379 ZOCOR 40MG SS 23,223 $4,053,492 17
A-9
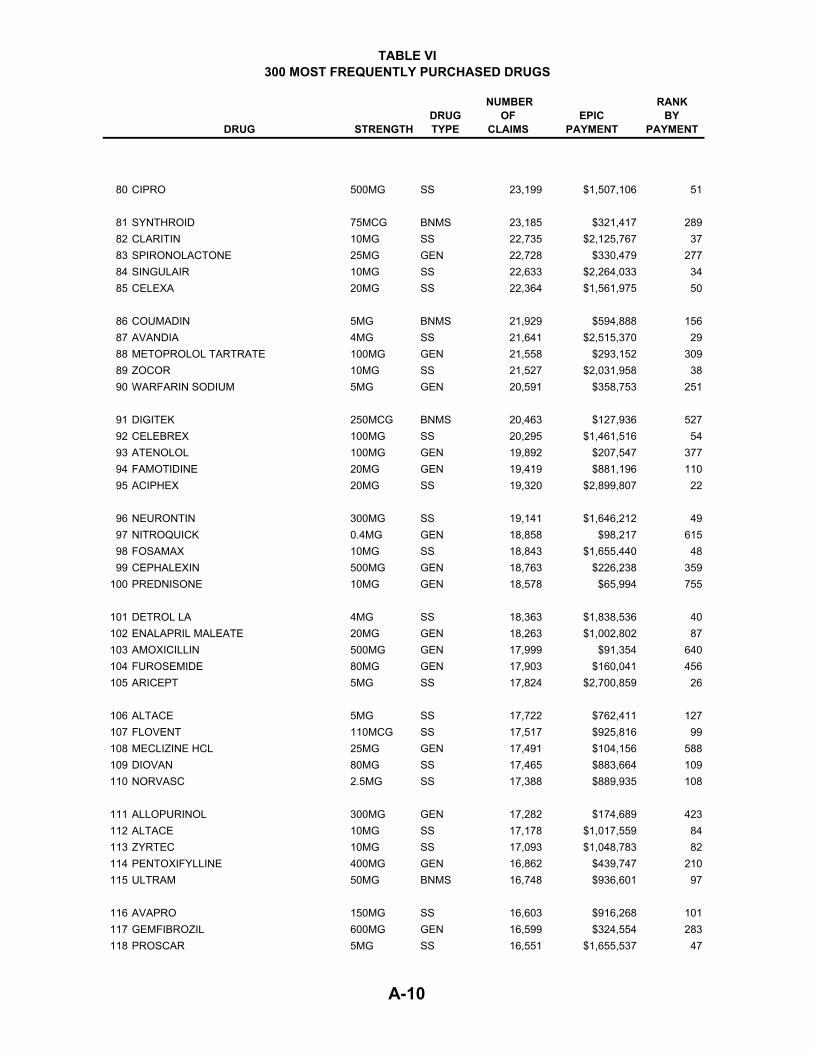
TABLE VI 300 MOST FREQUENTLY PURCHASED DRUGS
DRUG STRENGTHDRUGTYPE
NUMBEROF
CLAIMS EPIC
PAYMENT
RANK BY
PAYMENT
80 CIPRO 500MG SS 23,199 $1,507,106 51
81 SYNTHROID 75MCG BNMS 23,185 $321,417 28982 CLARITIN 10MG SS 22,735 $2,125,767 3783 SPIRONOLACTONE 25MG GEN 22,728 $330,479 27784 SINGULAIR 10MG SS 22,633 $2,264,033 3485 CELEXA 20MG SS 22,364 $1,561,975 50
86 COUMADIN 5MG BNMS 21,929 $594,888 15687 AVANDIA 4MG SS 21,641 $2,515,370 2988 METOPROLOL TARTRATE 100MG GEN 21,558 $293,152 30989 ZOCOR 10MG SS 21,527 $2,031,958 3890 WARFARIN SODIUM 5MG GEN 20,591 $358,753 251
91 DIGITEK 250MCG BNMS 20,463 $127,936 52792 CELEBREX 100MG SS 20,295 $1,461,516 5493 ATENOLOL 100MG GEN 19,892 $207,547 37794 FAMOTIDINE 20MG GEN 19,419 $881,196 11095 ACIPHEX 20MG SS 19,320 $2,899,807 22
96 NEURONTIN 300MG SS 19,141 $1,646,212 4997 NITROQUICK 0.4MG GEN 18,858 $98,217 61598 FOSAMAX 10MG SS 18,843 $1,655,440 4899 CEPHALEXIN 500MG GEN 18,763 $226,238 359
100 PREDNISONE 10MG GEN 18,578 $65,994 755
101 DETROL LA 4MG SS 18,363 $1,838,536 40102 ENALAPRIL MALEATE 20MG GEN 18,263 $1,002,802 87103 AMOXICILLIN 500MG GEN 17,999 $91,354 640104 FUROSEMIDE 80MG GEN 17,903 $160,041 456105 ARICEPT 5MG SS 17,824 $2,700,859 26
106 ALTACE 5MG SS 17,722 $762,411 127107 FLOVENT 110MCG SS 17,517 $925,816 99108 MECLIZINE HCL 25MG GEN 17,491 $104,156 588109 DIOVAN 80MG SS 17,465 $883,664 109110 NORVASC 2.5MG SS 17,388 $889,935 108
111 ALLOPURINOL 300MG GEN 17,282 $174,689 423112 ALTACE 10MG SS 17,178 $1,017,559 84113 ZYRTEC 10MG SS 17,093 $1,048,783 82114 PENTOXIFYLLINE 400MG GEN 16,862 $439,747 210115 ULTRAM 50MG BNMS 16,748 $936,601 97
116 AVAPRO 150MG SS 16,603 $916,268 101117 GEMFIBROZIL 600MG GEN 16,599 $324,554 283118 PROSCAR 5MG SS 16,551 $1,655,537 47
A-10
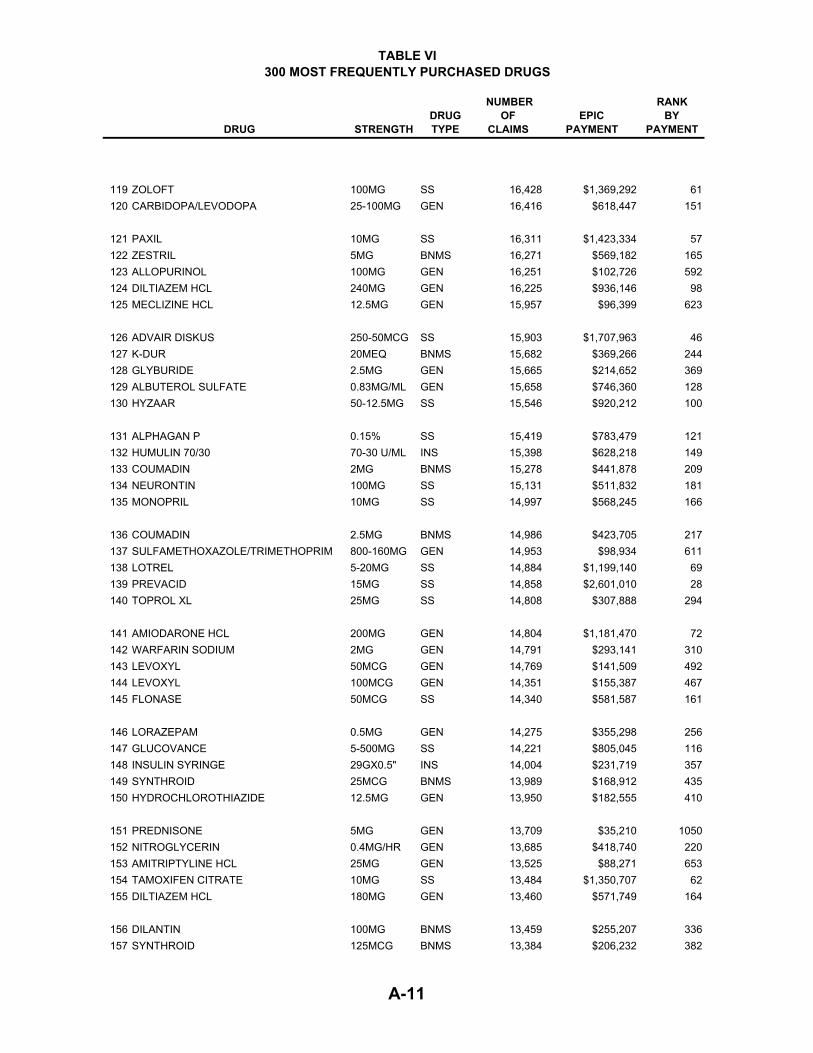
TABLE VI 300 MOST FREQUENTLY PURCHASED DRUGS
DRUG STRENGTHDRUGTYPE
NUMBEROF
CLAIMS EPIC
PAYMENT
RANK BY
PAYMENT
119 ZOLOFT 100MG SS 16,428 $1,369,292 61120 CARBIDOPA/LEVODOPA 25-100MG GEN 16,416 $618,447 151
121 PAXIL 10MG SS 16,311 $1,423,334 57122 ZESTRIL 5MG BNMS 16,271 $569,182 165123 ALLOPURINOL 100MG GEN 16,251 $102,726 592124 DILTIAZEM HCL 240MG GEN 16,225 $936,146 98125 MECLIZINE HCL 12.5MG GEN 15,957 $96,399 623
126 ADVAIR DISKUS 250-50MCG SS 15,903 $1,707,963 46127 K-DUR 20MEQ BNMS 15,682 $369,266 244128 GLYBURIDE 2.5MG GEN 15,665 $214,652 369129 ALBUTEROL SULFATE 0.83MG/ML GEN 15,658 $746,360 128130 HYZAAR 50-12.5MG SS 15,546 $920,212 100
131 ALPHAGAN P 0.15% SS 15,419 $783,479 121132 HUMULIN 70/30 70-30 U/ML INS 15,398 $628,218 149133 COUMADIN 2MG BNMS 15,278 $441,878 209134 NEURONTIN 100MG SS 15,131 $511,832 181135 MONOPRIL 10MG SS 14,997 $568,245 166
136 COUMADIN 2.5MG BNMS 14,986 $423,705 217137 SULFAMETHOXAZOLE/TRIMETHOPRIM 800-160MG GEN 14,953 $98,934 611138 LOTREL 5-20MG SS 14,884 $1,199,140 69139 PREVACID 15MG SS 14,858 $2,601,010 28140 TOPROL XL 25MG SS 14,808 $307,888 294
141 AMIODARONE HCL 200MG GEN 14,804 $1,181,470 72142 WARFARIN SODIUM 2MG GEN 14,791 $293,141 310143 LEVOXYL 50MCG GEN 14,769 $141,509 492144 LEVOXYL 100MCG GEN 14,351 $155,387 467145 FLONASE 50MCG SS 14,340 $581,587 161
146 LORAZEPAM 0.5MG GEN 14,275 $355,298 256147 GLUCOVANCE 5-500MG SS 14,221 $805,045 116148 INSULIN SYRINGE 29GX0.5" INS 14,004 $231,719 357149 SYNTHROID 25MCG BNMS 13,989 $168,912 435150 HYDROCHLOROTHIAZIDE 12.5MG GEN 13,950 $182,555 410
151 PREDNISONE 5MG GEN 13,709 $35,210 1050152 NITROGLYCERIN 0.4MG/HR GEN 13,685 $418,740 220153 AMITRIPTYLINE HCL 25MG GEN 13,525 $88,271 653154 TAMOXIFEN CITRATE 10MG SS 13,484 $1,350,707 62155 DILTIAZEM HCL 180MG GEN 13,460 $571,749 164
156 DILANTIN 100MG BNMS 13,459 $255,207 336157 SYNTHROID 125MCG BNMS 13,384 $206,232 382
A-11
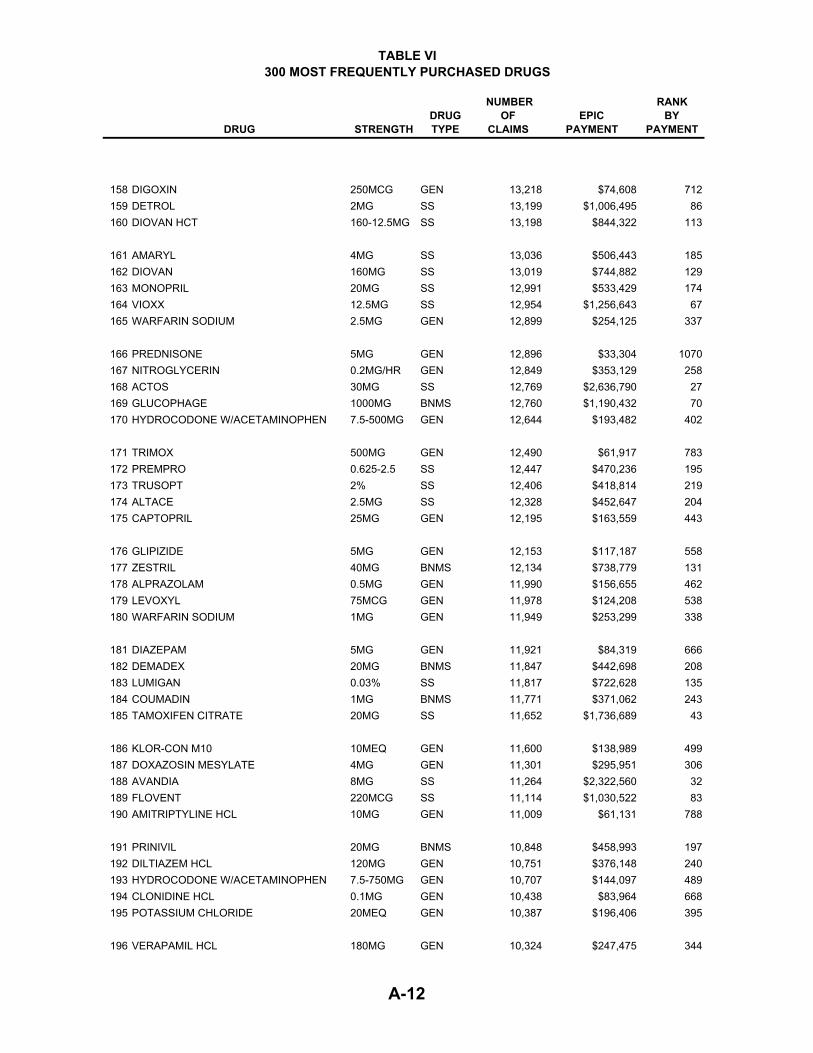
TABLE VI 300 MOST FREQUENTLY PURCHASED DRUGS
DRUG STRENGTHDRUGTYPE
NUMBEROF
CLAIMS EPIC
PAYMENT
RANK BY
PAYMENT
158 DIGOXIN 250MCG GEN 13,218 $74,608 712159 DETROL 2MG SS 13,199 $1,006,495 86160 DIOVAN HCT 160-12.5MG SS 13,198 $844,322 113
161 AMARYL 4MG SS 13,036 $506,443 185162 DIOVAN 160MG SS 13,019 $744,882 129163 MONOPRIL 20MG SS 12,991 $533,429 174164 VIOXX 12.5MG SS 12,954 $1,256,643 67165 WARFARIN SODIUM 2.5MG GEN 12,899 $254,125 337
166 PREDNISONE 5MG GEN 12,896 $33,304 1070167 NITROGLYCERIN 0.2MG/HR GEN 12,849 $353,129 258168 ACTOS 30MG SS 12,769 $2,636,790 27169 GLUCOPHAGE 1000MG BNMS 12,760 $1,190,432 70170 HYDROCODONE W/ACETAMINOPHEN 7.5-500MG GEN 12,644 $193,482 402
171 TRIMOX 500MG GEN 12,490 $61,917 783172 PREMPRO 0.625-2.5 SS 12,447 $470,236 195173 TRUSOPT 2% SS 12,406 $418,814 219174 ALTACE 2.5MG SS 12,328 $452,647 204175 CAPTOPRIL 25MG GEN 12,195 $163,559 443
176 GLIPIZIDE 5MG GEN 12,153 $117,187 558177 ZESTRIL 40MG BNMS 12,134 $738,779 131178 ALPRAZOLAM 0.5MG GEN 11,990 $156,655 462179 LEVOXYL 75MCG GEN 11,978 $124,208 538180 WARFARIN SODIUM 1MG GEN 11,949 $253,299 338
181 DIAZEPAM 5MG GEN 11,921 $84,319 666182 DEMADEX 20MG BNMS 11,847 $442,698 208183 LUMIGAN 0.03% SS 11,817 $722,628 135184 COUMADIN 1MG BNMS 11,771 $371,062 243185 TAMOXIFEN CITRATE 20MG SS 11,652 $1,736,689 43
186 KLOR-CON M10 10MEQ GEN 11,600 $138,989 499187 DOXAZOSIN MESYLATE 4MG GEN 11,301 $295,951 306188 AVANDIA 8MG SS 11,264 $2,322,560 32189 FLOVENT 220MCG SS 11,114 $1,030,522 83190 AMITRIPTYLINE HCL 10MG GEN 11,009 $61,131 788
191 PRINIVIL 20MG BNMS 10,848 $458,993 197192 DILTIAZEM HCL 120MG GEN 10,751 $376,148 240193 HYDROCODONE W/ACETAMINOPHEN 7.5-750MG GEN 10,707 $144,097 489194 CLONIDINE HCL 0.1MG GEN 10,438 $83,964 668195 POTASSIUM CHLORIDE 20MEQ GEN 10,387 $196,406 395
196 VERAPAMIL HCL 180MG GEN 10,324 $247,475 344
A-12

TABLE VI 300 MOST FREQUENTLY PURCHASED DRUGS
DRUG STRENGTHDRUGTYPE
NUMBEROF
CLAIMS EPIC
PAYMENT
RANK BY
PAYMENT
197 PREDNISOLONE ACETATE 1% GEN 10,268 $150,112 477198 FLUOXETINE HCL 20MG GEN 10,227 $872,181 111199 HYDROCHLOROTHIAZIDE 50MG GEN 10,219 $51,997 874200 DITROPAN XL 5MG SS 10,188 $961,120 91
201 HYZAAR 100-25MG SS 10,172 $787,205 120202 COLCHICINE 0.6MG GEN 10,106 $80,985 684203 LOTREL 5-10MG SS 10,089 $734,825 133204 METFORMIN HCL 1000MG GEN 10,058 $665,880 145205 PRINIVIL 10MG BNMS 9,966 $381,432 239
206 TOBRADEX 0.3-0.1% SS 9,955 $342,790 269207 ACTOS 45MG SS 9,840 $2,260,732 35208 TERAZOSIN HCL 5MG GEN 9,815 $489,267 188209 TRAZODONE HCL 50MG GEN 9,733 $74,302 714210 TRIAMCINOLONE ACETONIDE 0.1% GEN 9,622 $54,362 856
211 METHOTREXATE 2.5MG GEN 9,612 $414,502 223212 COREG 6.25MG SS 9,605 $904,976 104213 ADVAIR DISKUS 100-50MCG SS 9,559 $781,699 122214 LORAZEPAM 1MG GEN 9,556 $330,652 276215 BETOPTIC S 0.25% SS 9,517 $495,068 187
216 LEVAQUIN 250MG SS 9,432 $412,817 225217 ISOSORBIDE DINITRATE 20MG GEN 9,398 $42,269 966218 CIPRO 250MG SS 9,371 $434,272 211219 SYNTHROID 88MCG BNMS 9,338 $132,504 517220 ALLEGRA 180MG SS 9,330 $681,001 143
221 ACTONEL 5MG SS 9,173 $717,445 138222 TRICOR 160MG SS 9,151 $899,521 107223 GLIPIZIDE 10MG GEN 9,067 $147,094 482224 CARTIA XT 240MG GEN 8,916 $635,650 147225 ENALAPRIL MALEATE 2.5MG GEN 8,899 $226,008 360
226 METOCLOPRAMIDE HCL 10MG GEN 8,874 $89,214 651227 OXYBUTYNIN CHLORIDE 5MG GEN 8,804 $96,473 621228 QUININE SULFATE 260MG GEN 8,674 $62,785 773229 PREDNISONE 1MG SS 8,672 $105,420 585230 ISOSORBIDE DINITRATE 10MG GEN 8,650 $34,660 1058
231 IPRATROPIUM BROMIDE 0.2MG/ML GEN 8,609 $954,688 92232 HYDROCODONE/ACETAMINOPHEN 5-500MG GEN 8,609 $93,873 632233 ACTONEL 30MG SS 8,592 $834,844 114234 AZMACORT 100MCG SS 8,578 $432,991 212235 CAPTOPRIL 50MG GEN 8,578 $198,787 393
A-13
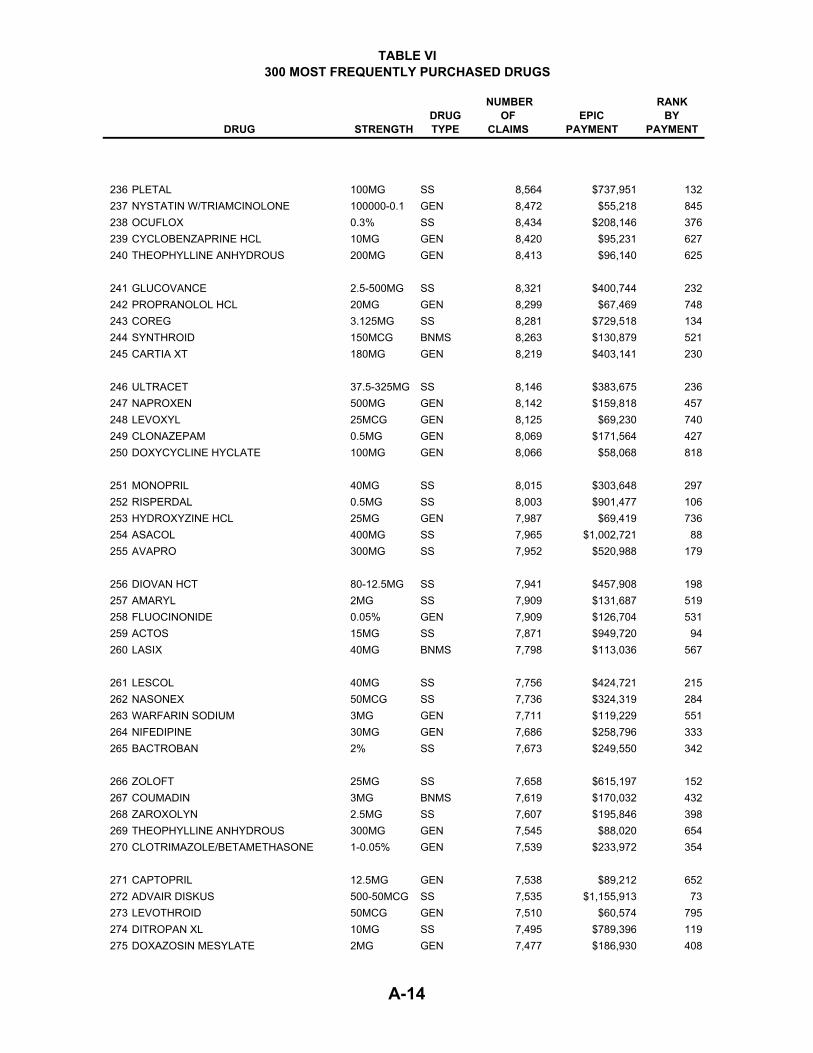
TABLE VI 300 MOST FREQUENTLY PURCHASED DRUGS
DRUG STRENGTHDRUGTYPE
NUMBEROF
CLAIMS EPIC
PAYMENT
RANK BY
PAYMENT
236 PLETAL 100MG SS 8,564 $737,951 132237 NYSTATIN W/TRIAMCINOLONE 100000-0.1 GEN 8,472 $55,218 845238 OCUFLOX 0.3% SS 8,434 $208,146 376239 CYCLOBENZAPRINE HCL 10MG GEN 8,420 $95,231 627240 THEOPHYLLINE ANHYDROUS 200MG GEN 8,413 $96,140 625
241 GLUCOVANCE 2.5-500MG SS 8,321 $400,744 232242 PROPRANOLOL HCL 20MG GEN 8,299 $67,469 748243 COREG 3.125MG SS 8,281 $729,518 134244 SYNTHROID 150MCG BNMS 8,263 $130,879 521245 CARTIA XT 180MG GEN 8,219 $403,141 230
246 ULTRACET 37.5-325MG SS 8,146 $383,675 236247 NAPROXEN 500MG GEN 8,142 $159,818 457248 LEVOXYL 25MCG GEN 8,125 $69,230 740249 CLONAZEPAM 0.5MG GEN 8,069 $171,564 427250 DOXYCYCLINE HYCLATE 100MG GEN 8,066 $58,068 818
251 MONOPRIL 40MG SS 8,015 $303,648 297252 RISPERDAL 0.5MG SS 8,003 $901,477 106253 HYDROXYZINE HCL 25MG GEN 7,987 $69,419 736254 ASACOL 400MG SS 7,965 $1,002,721 88255 AVAPRO 300MG SS 7,952 $520,988 179
256 DIOVAN HCT 80-12.5MG SS 7,941 $457,908 198257 AMARYL 2MG SS 7,909 $131,687 519258 FLUOCINONIDE 0.05% GEN 7,909 $126,704 531259 ACTOS 15MG SS 7,871 $949,720 94260 LASIX 40MG BNMS 7,798 $113,036 567
261 LESCOL 40MG SS 7,756 $424,721 215262 NASONEX 50MCG SS 7,736 $324,319 284263 WARFARIN SODIUM 3MG GEN 7,711 $119,229 551264 NIFEDIPINE 30MG GEN 7,686 $258,796 333265 BACTROBAN 2% SS 7,673 $249,550 342
266 ZOLOFT 25MG SS 7,658 $615,197 152267 COUMADIN 3MG BNMS 7,619 $170,032 432268 ZAROXOLYN 2.5MG SS 7,607 $195,846 398269 THEOPHYLLINE ANHYDROUS 300MG GEN 7,545 $88,020 654270 CLOTRIMAZOLE/BETAMETHASONE 1-0.05% GEN 7,539 $233,972 354
271 CAPTOPRIL 12.5MG GEN 7,538 $89,212 652272 ADVAIR DISKUS 500-50MCG SS 7,535 $1,155,913 73273 LEVOTHROID 50MCG GEN 7,510 $60,574 795274 DITROPAN XL 10MG SS 7,495 $789,396 119275 DOXAZOSIN MESYLATE 2MG GEN 7,477 $186,930 408
A-14
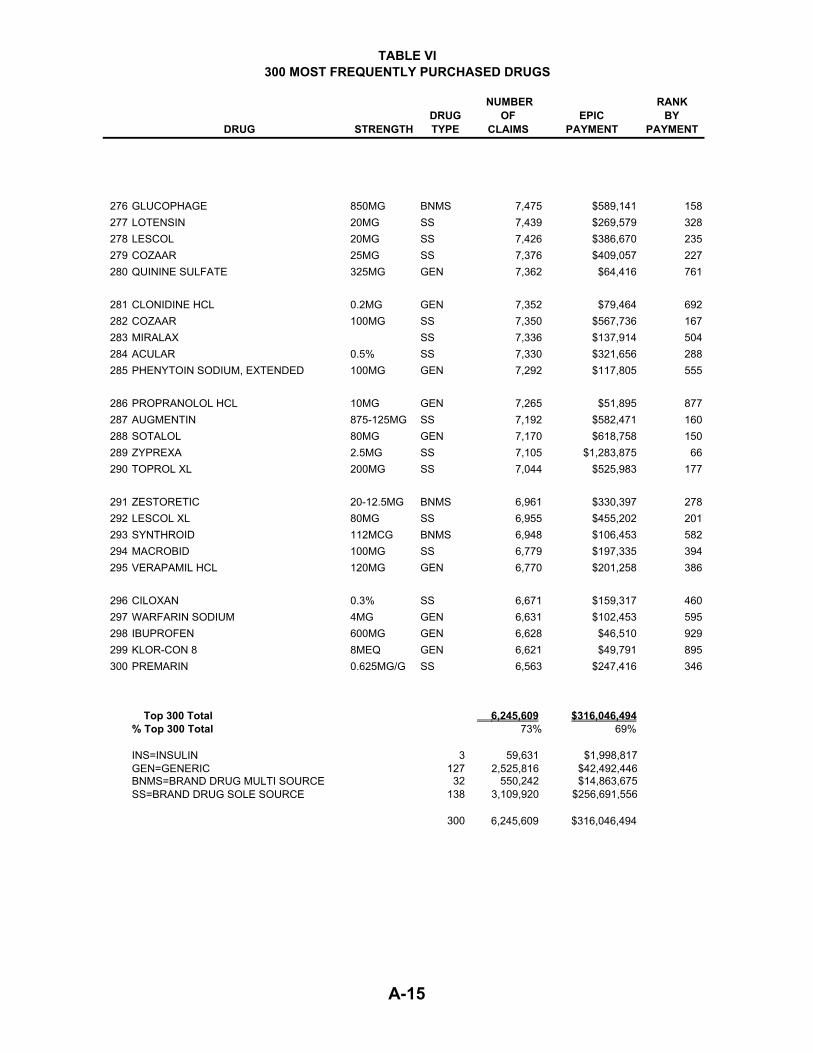
TABLE VI 300 MOST FREQUENTLY PURCHASED DRUGS
DRUG STRENGTHDRUGTYPE
NUMBEROF
CLAIMS EPIC
PAYMENT
RANK BY
PAYMENT
276 GLUCOPHAGE 850MG BNMS 7,475 $589,141 158277 LOTENSIN 20MG SS 7,439 $269,579 328278 LESCOL 20MG SS 7,426 $386,670 235279 COZAAR 25MG SS 7,376 $409,057 227280 QUININE SULFATE 325MG GEN 7,362 $64,416 761
281 CLONIDINE HCL 0.2MG GEN 7,352 $79,464 692282 COZAAR 100MG SS 7,350 $567,736 167283 MIRALAX SS 7,336 $137,914 504284 ACULAR 0.5% SS 7,330 $321,656 288285 PHENYTOIN SODIUM, EXTENDED 100MG GEN 7,292 $117,805 555
286 PROPRANOLOL HCL 10MG GEN 7,265 $51,895 877287 AUGMENTIN 875-125MG SS 7,192 $582,471 160288 SOTALOL 80MG GEN 7,170 $618,758 150289 ZYPREXA 2.5MG SS 7,105 $1,283,875 66290 TOPROL XL 200MG SS 7,044 $525,983 177
291 ZESTORETIC 20-12.5MG BNMS 6,961 $330,397 278292 LESCOL XL 80MG SS 6,955 $455,202 201293 SYNTHROID 112MCG BNMS 6,948 $106,453 582294 MACROBID 100MG SS 6,779 $197,335 394295 VERAPAMIL HCL 120MG GEN 6,770 $201,258 386
296 CILOXAN 0.3% SS 6,671 $159,317 460297 WARFARIN SODIUM 4MG GEN 6,631 $102,453 595298 IBUPROFEN 600MG GEN 6,628 $46,510 929299 KLOR-CON 8 8MEQ GEN 6,621 $49,791 895300 PREMARIN 0.625MG/G SS 6,563 $247,416 346
Top 300 Total 6,245,609 $316,046,494% Top 300 Total 73% 69%
INS=INSULIN 3 59,631 $1,998,817GEN=GENERIC 127 2,525,816 $42,492,446
32 550,242 $14,863,675 138 3,109,920 $256,691,556
300 6,245,609 $316,046,494
BNMS=BRAND DRUG MULTI SOURCESS=BRAND DRUG SOLE SOURCE
A-15

TABLE VII TEN MOST FREQUENTLY PURCHASED TYPES OF DRUGS
BY THERAPEUTIC CLASSIFICATION
NUMBER PERCENT OF OF EPIC NUMBER OF
THERAPEUTIC CLASS CLAIMS CLAIMS PAYMENTS PARTICIPANTS
CARDIAC DRUGS 1,849,392 21.61% 74,006,697$ 203,612DIURETICS 531,342 6.21% 4,397,329 108,298ANTIHYPERLIPIDEMIC DRUGS 510,174 5.96% 56,158,256 103,817GASTROINTESTINAL DRUGS, MISC. 377,071 4.41% 48,546,550 79,544ANTIDEPRESSANTS 282,892 3.31% 18,551,985 53,438VASODILATING AGENTS 271,143 3.17% 8,727,944 48,702OPIATE AGONISTS 252,070 2.95% 9,292,143 65,996THYROID AGENTS/HORMONES 249,153 2.91% 3,067,087 44,440NON-STEROID/ANTI-INFLAM. AGENT 245,170 2.86% 19,866,932 68,474SULFONYLUREAS 220,403 2.58% 5,949,699 36,068
TOTAL 4,788,810 55.95% 248,564,622$
A-16

TABLE VIII TWENTY MOST FREQUENTLY PURCHASED DRUGS
RANK BY CLAIMS DRUG STRENGTH
DRUG TYPE
NUMBER OF CLAIMS
EPIC PAYMENTS
RANK BYPAYMENT
1 FUROSEMIDE 40MG GEN 154,174 781,262$ 1232 LIPITOR 10MG SS 144,399 11,500,244 23 FOSAMAX 70MG SS 115,915 8,998,716 74 METOPROLOL TARTRATE 50MG GEN 113,815 1,062,752 805 NORVASC 5MG SS 109,302 5,631,008 96 FUROSEMIDE 20MG GEN 90,234 393,362 2337 ATENOLOL 50MG GEN 85,256 628,738 1488 PLAVIX 75MG SS 78,688 10,870,219 49 CELEBREX 200MG SS 75,220 8,417,454 810 LIPITOR 20MG SS 71,828 9,251,997 511 XALATAN 0.005% SS 68,059 2,761,111 2412 PREVACID 30MG SS 67,410 11,480,635 313 ATENOLOL 25MG GEN 67,160 474,379 19014 PRILOSEC 20MG SS 66,982 12,640,411 115 PROPOXYPHENE NAPSYLATE W/APAP 100-650MG GEN 63,623 1,086,993 7716 NORVASC 10MG SS 63,570 4,930,550 1117 HYDROCHLOROTHIAZIDE 25MG BNMS 62,042 211,534 37218 TRIAMTERENE W/HCTZ 37.5-25MG GEN 61,103 721,303 13619 TOPROL XL 50MG SS 59,947 1,333,957 6420 ZOCOR 20MG SS 53,383 9,142,444 6
TOP 20 TOTALS 1,672,110 102,319,070$
% OF TOTALS 19.54% 22.22%
SS=Sole Source 974,703 96,958,747$ GEN=Generic 635,365 5,148,788$ BNMS=Multi Source 53,383 9,142,444$
A-17
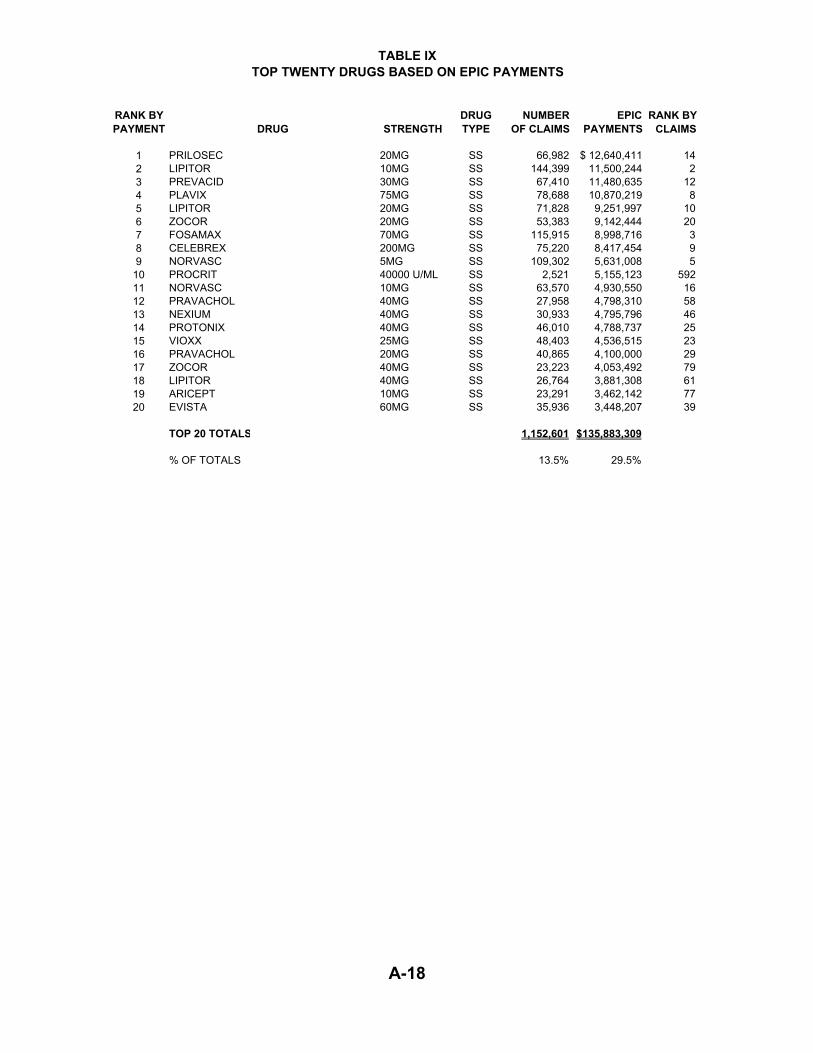
TABLE IXTOP TWENTY DRUGS BASED ON EPIC PAYMENTS
RANK BY PAYMENT DRUG STRENGTH
DRUG TYPE
NUMBER OF CLAIMS
EPIC PAYMENTS
RANK BYCLAIMS
1 PRILOSEC 20MG SS 66,982 $ 12,640,411 14 2 LIPITOR 10MG SS 144,399 11,500,244 2 3 PREVACID 30MG SS 67,410 11,480,635 12 4 PLAVIX 75MG SS 78,688 10,870,219 8 5 LIPITOR 20MG SS 71,828 9,251,997 10 6 ZOCOR 20MG SS 53,383 9,142,444 20 7 FOSAMAX 70MG SS 115,915 8,998,716 3 8 CELEBREX 200MG SS 75,220 8,417,454 9 9 NORVASC 5MG SS 109,302 5,631,008 5
10 PROCRIT 40000 U/ML SS 2,521 5,155,123 592 11 NORVASC 10MG SS 63,570 4,930,550 16 12 PRAVACHOL 40MG SS 27,958 4,798,310 58 13 NEXIUM 40MG SS 30,933 4,795,796 46 14 PROTONIX 40MG SS 46,010 4,788,737 25 15 VIOXX 25MG SS 48,403 4,536,515 23 16 PRAVACHOL 20MG SS 40,865 4,100,000 29 17 ZOCOR 40MG SS 23,223 4,053,492 79 18 LIPITOR 40MG SS 26,764 3,881,308 61 19 ARICEPT 10MG SS 23,291 3,462,142 77 20 EVISTA 60MG SS 35,936 3,448,207 39
TOP 20 TOTALS 1,152,601 $135,883,309
% OF TOTALS 13.5% 29.5%
A-18

TABLE XDISTRIBUTION OF CLAIMS AND PAYMENTS BY PHARMACY TYPE
TYPE OFPHARMACY
NUMBER ACTIVE
NUMBER OFCLAIMS
PAYMENTS TOPHARMACIES
CHAIN 2,173 5,474,700 281,511,099$ CLINICAL 108 355,444 14,710,160 INDEPENDENT 1,647 2,696,904 162,015,399 MAIL ORDER 7 31,559 2,167,450
TOTAL 3,935 8,558,607 460,404,109$
A-19
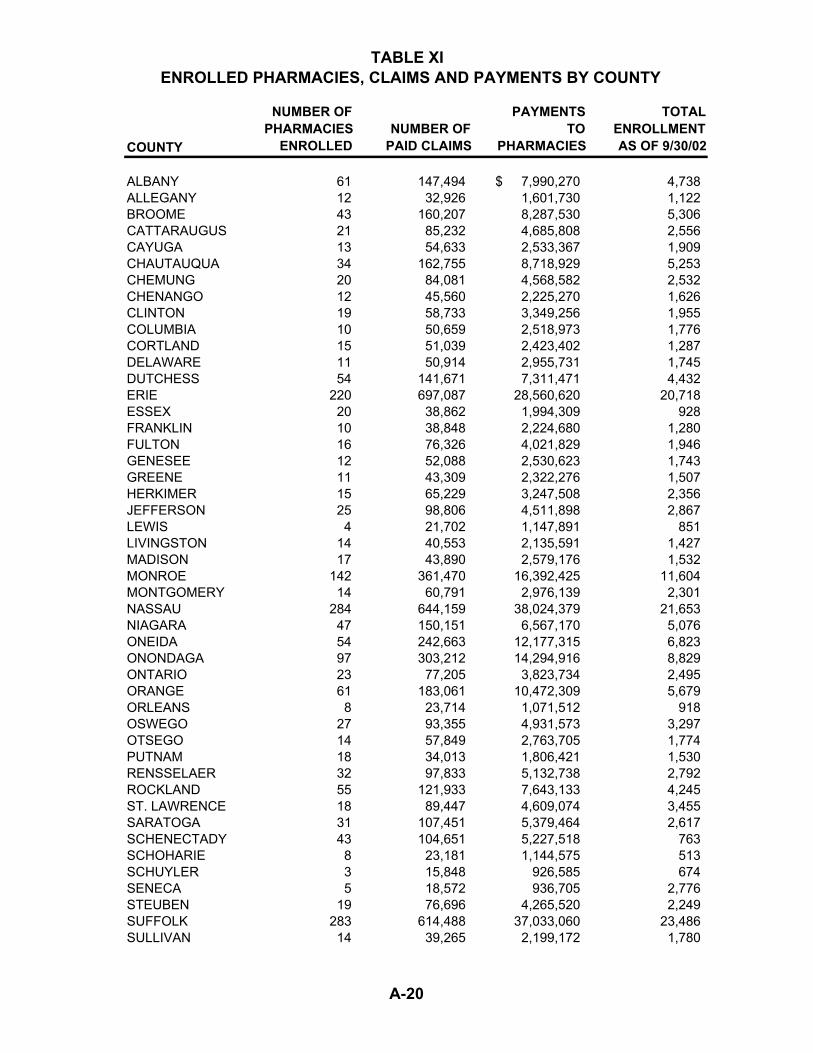
TABLE XI ENROLLED PHARMACIES, CLAIMS AND PAYMENTS BY COUNTY
COUNTY
NUMBER OFPHARMACIES
ENROLLED NUMBER OFPAID CLAIMS
PAYMENTSTO
PHARMACIES
TOTALENROLLMENTAS OF 9/30/02
ALBANY 61 147,494 7,990,270$ 4,738 ALLEGANY 12 32,926 1,601,730 1,122 BROOME 43 160,207 8,287,530 5,306 CATTARAUGUS 21 85,232 4,685,808 2,556 CAYUGA 13 54,633 2,533,367 1,909 CHAUTAUQUA 34 162,755 8,718,929 5,253 CHEMUNG 20 84,081 4,568,582 2,532 CHENANGO 12 45,560 2,225,270 1,626 CLINTON 19 58,733 3,349,256 1,955 COLUMBIA 10 50,659 2,518,973 1,776 CORTLAND 15 51,039 2,423,402 1,287 DELAWARE 11 50,914 2,955,731 1,745 DUTCHESS 54 141,671 7,311,471 4,432 ERIE 220 697,087 28,560,620 20,718 ESSEX 20 38,862 1,994,309 928 FRANKLIN 10 38,848 2,224,680 1,280 FULTON 16 76,326 4,021,829 1,946 GENESEE 12 52,088 2,530,623 1,743 GREENE 11 43,309 2,322,276 1,507 HERKIMER 15 65,229 3,247,508 2,356 JEFFERSON 25 98,806 4,511,898 2,867 LEWIS 4 21,702 1,147,891 851 LIVINGSTON 14 40,553 2,135,591 1,427 MADISON 17 43,890 2,579,176 1,532 MONROE 142 361,470 16,392,425 11,604 MONTGOMERY 14 60,791 2,976,139 2,301 NASSAU 284 644,159 38,024,379 21,653 NIAGARA 47 150,151 6,567,170 5,076 ONEIDA 54 242,663 12,177,315 6,823 ONONDAGA 97 303,212 14,294,916 8,829 ONTARIO 23 77,205 3,823,734 2,495 ORANGE 61 183,061 10,472,309 5,679 ORLEANS 8 23,714 1,071,512 918 OSWEGO 27 93,355 4,931,573 3,297 OTSEGO 14 57,849 2,763,705 1,774 PUTNAM 18 34,013 1,806,421 1,530 RENSSELAER 32 97,833 5,132,738 2,792 ROCKLAND 55 121,933 7,643,133 4,245 ST. LAWRENCE 18 89,447 4,609,074 3,455 SARATOGA 31 107,451 5,379,464 2,617 SCHENECTADY 43 104,651 5,227,518 763 SCHOHARIE 8 23,181 1,144,575 513 SCHUYLER 3 15,848 926,585 674 SENECA 5 18,572 936,705 2,776 STEUBEN 19 76,696 4,265,520 2,249 SUFFOLK 283 614,488 37,033,060 23,486 SULLIVAN 14 39,265 2,199,172 1,780
A-20
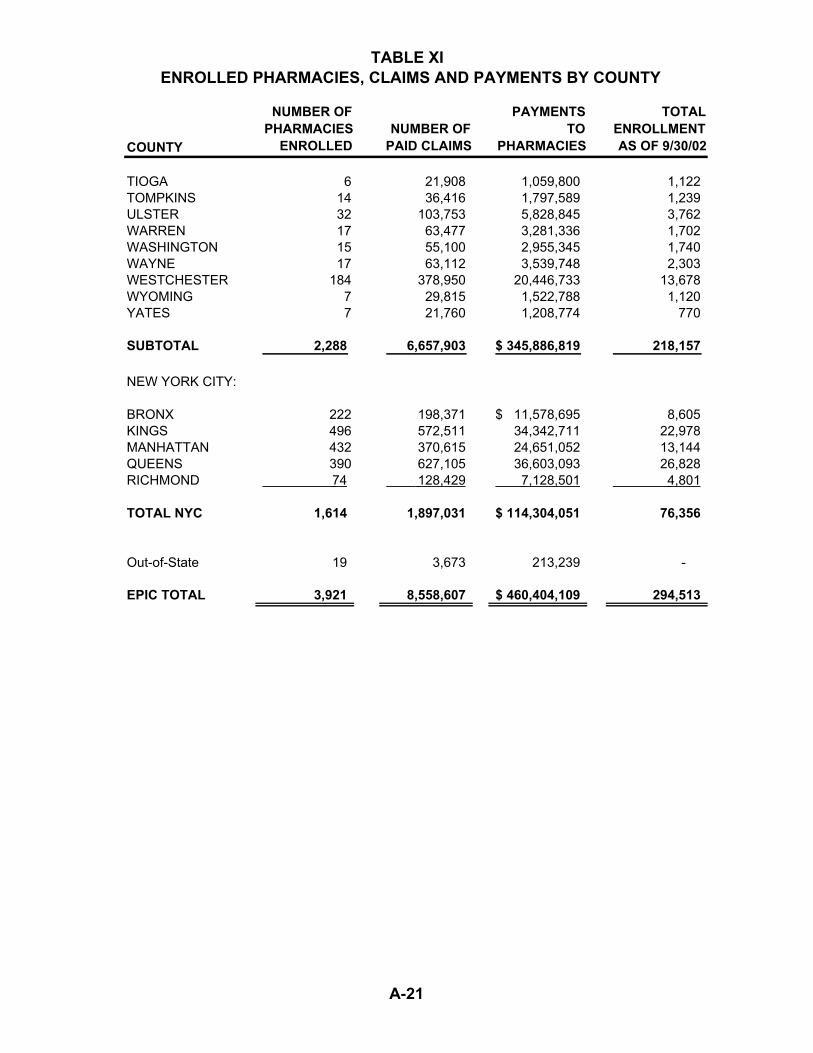
TABLE XI ENROLLED PHARMACIES, CLAIMS AND PAYMENTS BY COUNTY
COUNTY
NUMBER OFPHARMACIES
ENROLLED NUMBER OFPAID CLAIMS
PAYMENTSTO
PHARMACIES
TOTALENROLLMENTAS OF 9/30/02
TIOGA 6 21,908 1,059,800 1,122 TOMPKINS 14 36,416 1,797,589 1,239 ULSTER 32 103,753 5,828,845 3,762 WARREN 17 63,477 3,281,336 1,702 WASHINGTON 15 55,100 2,955,345 1,740 WAYNE 17 63,112 3,539,748 2,303 WESTCHESTER 184 378,950 20,446,733 13,678 WYOMING 7 29,815 1,522,788 1,120 YATES 7 21,760 1,208,774 770
SUBTOTAL 2,288 6,657,903 345,886,819$ 218,157
NEW YORK CITY:
BRONX 222 198,371 11,578,695$ 8,605 KINGS 496 572,511 34,342,711 22,978 MANHATTAN 432 370,615 24,651,052 13,144 QUEENS 390 627,105 36,603,093 26,828 RICHMOND 74 128,429 7,128,501 4,801
TOTAL NYC 1,614 1,897,031 114,304,051$ 76,356
Out-of-State 19 3,673 213,239 -
EPIC TOTAL 3,921 8,558,607 460,404,109$ 294,513
A-21


EPIC STAFF
Julie Naglieri Acting Director
Michael Brennan Bureau Director
Program Development & Review
Rhonda Cooper Assistant Director
Program Development & Review
Richard Rees Manager
Systems Development & Research
Stephen Abbott Project Director
Program Operations
Helen Articolo
Santa Bates
Lubna Chauhan
Edward Dombroski
Marilyn Fortin
Valerie Giroux
Edward Hart
Kiki Karathanasis
Gloria LeBesco
Timothy McAuliffe
Diane Reed
Sheila Rounds
Tracy Sackett
Charles Teuscher
Lisa Tice
Richard Tompkins
Debbie Vitale
ACKNOWLEDGEMENTS
Special thanks to former staff members, Denis Dulin and Toni Duncan, for their contributions during the year.

State of New YorkGeorge E. Pataki, Governor
Department of Health State Office for the Aging