epa energy star updated score for hotels energy star updated score for hotels ... objectives of...
TRANSCRIPT

EPA ENERGY STAR
Updated Score for Hotels
Matt Burgess
ENERGY STAR for Commercial Buildings

Agenda
• ENERGY STAR score overview
• Update to Hotel score using CBECS 2012• Objectives
• New data available
• Changes to the model
• AH&LA survey data testing/analysis
• Portfolio Manager Amenity Category analysis
• Guidance moving forward

The 1-100ENERGY STAR score

ENERGY STAR Score Objectives
• Provide a comparative, national benchmark for your buildings energy performance
• Provide a single score for a whole buildings energy use• Fairly compare buildings nationwide• Rank buildings relative to similar peer buildings• Compare buildings on a 1-100 percentile scale, where 50 represents median
energy performance
• Identify and recognize best performers in the market• Score of 75 required to earn ENERGY STAR certification.
• Motivate organizations to develop a strategic approach to energy management
• Buildings with low scores (under 25) have room for efficiency improvements and savings.
• Track improvement with ENERGY STAR Score

ENERGY STAR Score Development Process
• Analyze national survey data
• Commercial Building Energy Consumption Survey (CBECS)
• Portfolio Manager Data is NOT used as an input
• Develop regression models
• Normalize for different business activities
• Assign a “normalized mean” to each property based on its operation
• Compare actual energy use with normalized mean from the model
• More efficient: Actual < Normalized Mean
• Less efficient: Actual > Normalized Mean
• Create scoring lookup table
• Scores are based on the distribution of energy performance across commercial buildings
• One point on the ENERGY STAR scale represents one percentile of buildings

6
What does a regression model look like?
• Example model
• Coefficients (C1 and C2) represent the average effect of each operational characteristic (Char) on energy use intensity (EUI).
• Coefficients provide adjustments for each operational characteristic
• Does not add the kWh of each piece of equipment
• Does adjust energy based on correlation between operating characteristic and energy use
EUI = Co + C1* Char1 + C2*Char2 + etc…

EPA Criteria for Including Variables in Analysis
7
• Include key business activity/service provided variables
• Examples: Workers, Cooking, Refrigeration
• Do not include or normalize for variables for specific technology choices.
• Examples: Lighting Technology, Window Type

Example of Including Variables in model for score equitability
8
Operational Characteristic
Building #1 Building #2
Size 100,000 = 100,000
Rooms 100 = 100
Workers 25 = 25
Cooking Yes = Yes
Refrigeration Density 0.05 ≠ 0.1
Predicted EUI = 188
Actual EUI = 150
Energy Star Score = 71
Predicted EUI = 196
Actual EUI = 150
Energy Star Score = 75

Example of Excluding Variables from model for score equitability
9
Predicted EUI = 188
Actual EUI = 150
Energy Star Score = 71
Predicted EUI = 188
Actual EUI = 140
Energy Star Score = 77
Operational Characteristic
Building #1 Building #2
Size 100,000 = 100,000
Rooms 100 = 100
Workers 25 = 25
Cooking Yes = Yes
Refrigeration Density 0.05 = 0.05

Data Available: New 2012 CBECS Survey Available
10
• 2012 CBECS Data is the only direct input to the Hotel ENERGY STAR
Score
• Published by EIA in 2016
• More current data than 2003 CBECS
• Nationally Representative survey of many property types
• Larger sample
• 29% larger than 2003 (6,720 vs. 5,215 records)
• More buildings and bigger buildings in the U.S.
• 14% increase in the total number of buildings
• 22% increase in total building floor space

Determining the Correct Model
• Statistical properties of CBECS data to assess:
• Regression model statistics (R2)
• Individual variable statistics (t-stats)
• Additional factors evaluated with both CBECS and
Portfolio Manager
• Distribution of scores
• Scatterplots of score as compared with key characteristics
• Physical understanding of results
• Relationship between EUI and score11

Objectives of Analysis and Score Update
12
• Leverage the most recent market data• This will show us if buildings are becoming more or less efficient
• If the market is getting more efficient, then it may become harder to qualify for ENERGY STAR
• Re-assess key drivers of energy use• Have the relationships between operating characteristics and
energy intensity changed in the last 10 years?
• Are there new variables in CBECS that we should be adjusting for going forward?

13
1-100 ENERGY STAR Score
Update for Hotels

Existing ENERGY STAR Hotel Score
14
• Developed using Nationally Representative CBECS 2003 data
• Contains Adjustments for • Rooms• Workers • Refrigeration• Food Preparation• Weather
• Updated Score Scheduled to launch August 2018

Update to Hotel Score - New 2012 CBECS Hotel Data
15
• Increased size of hotel sample• 295 observations vs. 260 observations in 2003
• New variables in CBECS related to Hotels• Room occupancy (percent)• Conference space (percent) • Half-size and compact refrigerators• Icemakers• TV/Video displays• Employee lounge, breakroom, or pantry

Additional Data Available for Testing and Validation
16
• AH&LA Survey• Supplemental hotel survey provided by AH&LA
• Portfolio Manager Data• Hotel data entered into ENERGY STAR’s Portfolio Manager tool
• Both not used as direct input to Score model, but for• Testing
• Validation
• Impact analysis

Update to Hotel Score – Other Considerations
17
• Scoring equitably across hotel size
• Scoring equitably across amenity category
• Do models developed with CBECS 2012 score Portfolio Manager data and AH&LA Data equitably?

Major Findings from Hotel Model
18
Adjustments in Current Hotel Model - 2003 CBECS
Included in updated model
Rooms per 1000 sq. ft. �
Workers on the Main Shift per 1000 sq. ft.�
Presence of Commercial Food Preparation (yes/no)�
Number of Open/Closed/Walk-in Refrigerators and
Icemakers per 1000 sq. ft. �
Percent of the Building that is Heated and Cooled�
Weather and Climate (using Heating and Cooling Degree
Days) �
• Overall adjusts for same characteristics as previous model

Major Findings from Hotel Model
19
• New model uses Workers per 1,000 sq. ft. instead of the natural logarithm of Workers per 1,000 sq. ft.
• New model still uses Rooms per 1,000 sq. ft. • But a floor and cap is now applied (next slide)
• Model coefficients have changed to reflect 2012 data

Adjusting for Room Density
20
• Room Density is still a strong driver of EUI in Hotels
• Including “Rooms per 1,000 sq. ft.” term, favored smaller hotels
• Motels and smaller hotels tend to have higher Room Density
• New model uses adjusted room density term with a cap and floor
• Statistically significant relationship with EUI• Low room density hotels (often large hotels) receive a higher
baseline energy allowance with this term.• higher room density hotels (often small hotels) receive a lower
maximum energy allowance with this term.• Score equitability

Bias for or Against Business Characteristics
• Plot of ENERGY STAR Score vs. key building characteristics
• Plots are examined to ensure there is no bias for or against any key characteristics.
21
EN
ER
GY
ST
AR
Score
Key Characteristic
No Bias (Good)
EN
ER
GY
ST
AR
Score
Key Characteristic
Bias (Bad)

ENERGY STAR Score vs. Room Density
22
0
10
20
30
40
50
60
70
80
90
100
0.0 0.5 1.0 1.5 2.0 2.5 3.0 3.5 4.0
EN
ER
GY
ST
AR
Sc
ore
Rooms per 1,000 sq. ft.
• Room Density included in model (with floor at 3 and cap at 4).
• Scores are equitable across all values for Room Density in Portfolio Manager data.

ENERGY STAR Score vs. Worker Density
23
0
10
20
30
40
50
60
70
80
90
100
0.0 0.1 0.2 0.3 0.4 0.5 0.6 0.7 0.8 0.9 1.0 1.1 1.2 1.3 1.4 1.5
EN
ER
GY
ST
AR
Sc
ore
Workers per 1,000 sq. ft.
• Worker Density included in model.
• Scores are equitable across all values for Worker Density in Portfolio Manager data.

ENERGY STAR Score vs. Commercial Refrigeration Density
24
0
10
20
30
40
50
60
70
80
90
100
0.00 0.05 0.10 0.15 0.20
EN
ER
GY
ST
AR
Sc
ore
Open, Closed, and Walk-in Refrigeration Units per 1,000 sq. ft.
• Commercial Refrigeration Density included in model.
• Scores are equitable across all values for Commercial Refrigeration Density in Portfolio Manager data.
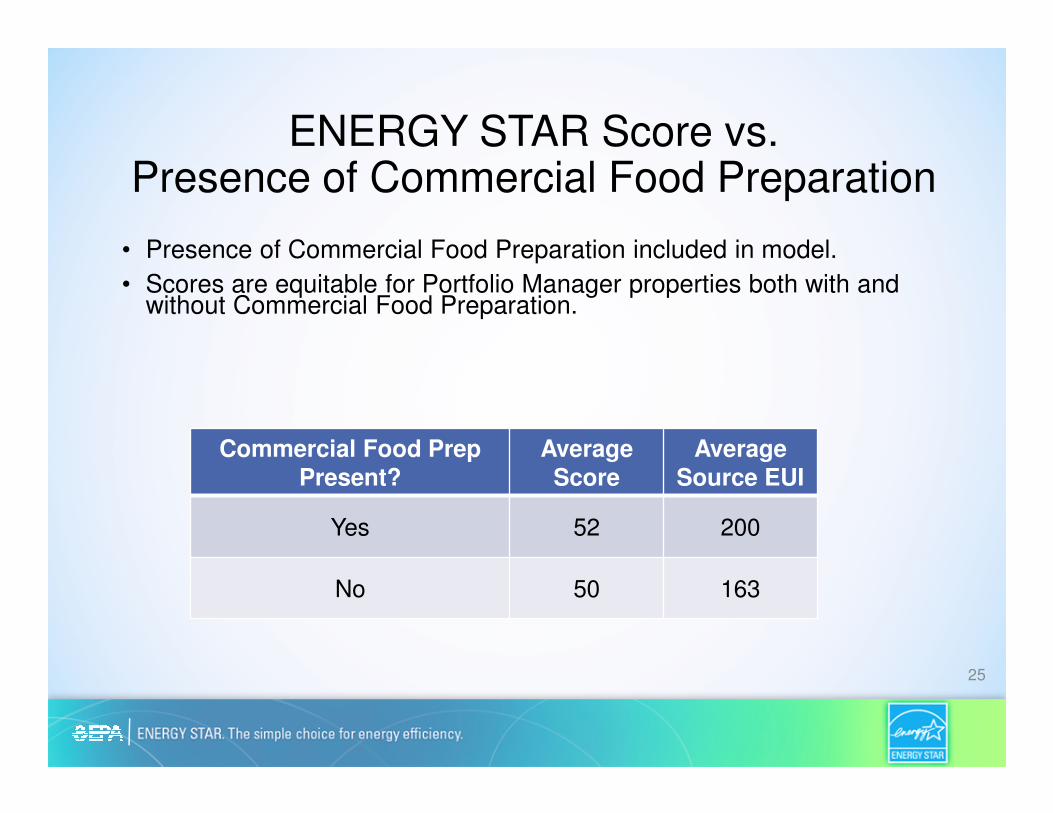
ENERGY STAR Score vs. Presence of Commercial Food Preparation
25
Commercial Food Prep Present?
Average Score
AverageSource EUI
Yes 52 200
No 50 163
• Presence of Commercial Food Preparation included in model.
• Scores are equitable for Portfolio Manager properties both with and without Commercial Food Preparation.

ENERGY STAR Score vs. Building Size
26
0
10
20
30
40
50
60
70
80
90
100
0 200,000 400,000 600,000 800,000 1,000,000 1,200,000 1,400,000
EN
ER
GY
ST
AR
Sc
ore
Building Size (sq. ft.)
• Building Size (Gross Floor Area) not included in model.
• Scores are equitable across all values for Building Size in Portfolio Manager data.

Business Characteristics NOT Included in the Model
• Data showed that certain characteristics did not belong in the regression model (They were not statistically significant)
• Laundry
• Room Occupancy
• Conference Space
• Still examined Graphs of score vs. characteristics NOT included in the regression model to ensure no bias.
• ENERGY STAR Score is still equitable across all values of these characteristics
27

Average Room Occupancy Percentage
• Occupancy variable was not significant in regressions, and was not included in final model.
• Scores are equitable across all values for Occupancy Percentage in CBECS data.
28
0
10
20
30
40
50
60
70
80
90
100
0.0 20.0 40.0 60.0 80.0 100.0
EN
ER
GY
ST
AR
Sc
ore
Average Occupancy (%)

Conference Space• Was not significant in final regressions and not included in final
model.
• Scores are equitable across all values for Conference Space in CBECS data.
29
0
10
20
30
40
50
60
70
80
90
100
0 10 20 30 40 50 60
EN
ER
GY
ST
AR
Sc
ore
Conference Space (% of total area)

Laundry
• Tested in a variety of model specifications and the presence of a laundry facility was never found to have a significant positive correlation EUI.
• Hotels with laundry facilities actually used less energy on average.
30
Commercial Laundry Facility Present?
Average Source EUI
CBECSPortfolio
Manager
Yes 150 180
No 160 199
AH&LA Supplemental Survey
• Ensure equitable results for variables that are not in CBECS
• We cannot adjust for variables that are not in CBECS, but we can
make sure there is no bias
• The goal of the survey was to help confirm that a proposed model
works for hotels of different amenity category
31

AH&LA Supplemental Survey Data
20
1
125
15
63
106
0
20
40
60
80
100
120
140
All Suites / Extended
Stay
Economy/Budget Full Service Hostel Limited/Select/Focused
Service
Luxury Resort
Pro
pe
rty
Co
un
t
Amenity Category
Observations within Each Amenity Category

AH&LA Survey Conclusions and Analysis
• Hotel model developed from 2012 CBECS was tested using AH&LA
data to validate/confirm model
• Scored all hotels in AH&LA, CBECS, and Portfolio Manager. The
sample of AH&LA buildings and Portfolio Manager buildings both
score just above 50 on average.
• Reinforced trends from both Portfolio Manager and CBECS
• Averages for laundry, occupancy, conference space were similar
to other data sets
• Limited effectiveness of hotel amenity category analysis due to small
number of observations for certain categories.

• With limited AH&LA amenity category data we turned
to Portfolio Manager to test for equitable results
• Amenity category variable does not exist in Portfolio Manager
• Used property names to organize data into hotel brands and
then assigned amenity category
• Resulted in a larger more useable data set of 3,506
observations to test equitability
34
Portfolio Manager Analysis – Amenity Category

Portfolio Manager Analysis – Amenity Category
20 1
125
6310
409
751
1192
987
167
0
200
400
600
800
1000
1200
1400
All Suites / Extended Stay Economy/Budget Full Service Limited/Select/FocusedService
Luxury
Co
un
t
Observations within Each Amenity Category
AH&LA Survey Portfolio Manager Data

Portfolio Manager Analysis – Amenity Category
0
10
20
30
40
50
60
70
80
90
100
All Suites / ExtendedStay
Economy/Budget Full Service Limited/Select/FocusedService
Luxury Grand Total
EN
ER
GY
ST
AR
Score
Average Score by Amenity Category for Portfolio Manager Sample
Current ENERGY STAR Score Updated ENERGY STAR Score

Portfolio Manager Analysis – Amenity Category
37
0
10
20
30
40
50
60
70
80
90
100
All Suites / Extended Stay Economy/Budget Full Service Limited/Select/FocusedService
Luxury
EN
ER
GY
ST
AR
Score
Average Scores of Leading Hotel Brand in each Amenity Category
Current ENERGY STAR Score Updated ENERGY STAR Score

Next Steps
38

EPA Schedule for Score Revisions
39
• Perform detailed analysis (~18 months)
• Started May 2016
• Analyze energy performance by property type
• Explore new variables captured by CBECS
• Determine appropriate changes to regression models used for score calculations
• Order of analysis
• Office & Retail / Supermarket
• Hotel & K-12 School
• Warehouse & Worship Facility
• Update source factors for all buildings
• Program new scores into Portfolio Manager (~6 months)
• Documentation / extensive testing
• Release new scores to the public (~ August 2018)

What should you expect?• Expect some changes
• Correlations between energy use and key activities
(workers, rooms, cooking, etc.)
• The scores of your properties!
• EPA’s basic approach is not changing
• Provide a national level benchmark
• Use regression models to assess/adjust for factors that
impact energy consumption
• Include variables that capture weather and business
activity
• Exclude technology variables, in order to reward
technology that saves energy40

Continue Benchmarking
• There is time • Changes are not anticipated until 2018.
• We will keep you informed• We will give ample notice of an exact date.
• We will not revoke prior certifications• All of your certified properties will still be on
our registry.• If you have top performers that are not
certified, now is a good time to pursue certification.
41

• Questions & Discussion