epa-ed162870
DESCRIPTION
EPATRANSCRIPT

DOCUMENT BUM
ED 162 870 SE 025 370
AUTHOR Parker,-Denny S.; And Ctherq ,.
TITLE Process Design Manual for Nitrogen Control.INSTITUTION Brown 8 Caldwell, Walnut Creek, Calif. ._
SPONS AGENCY Environmental Protection Agency, Cincinnati, Ohio.Office cf Technology Tranifer.
PUB DATE Oct 75r.NOTE. , 476p.; For related documents, see SE 025 268-369;.
Contains occasional stall and fight type,
s.
.
EDO PRICE HP-$0.83 HC-$26.11 Plofostage.'DE-SCRIPTORS
*
*Detign; *Engineering; Environment; Enwircnmental'Technicians; Inservice Education4.*Initrottional
1
°Materials; Manuals; Pollution; *PdstsecontaryEducation; _Science.Education; Utilftes; *Waste-Disposal; Water Pollution COntrolireiterResources
IDENTIFIER *Nitrogen; Waste Water ireateent
ABSTRACTThis manual presents theoretical and picceSs degn
criteria for the isplemertation of nitrogen control technologymunicipallwa-stesater treatment facilities. Design concepts areemphasized throingh exaiination, of data from full-scale and, pilotinstallations. Design data are included cr biological nitrificationand deniiirification, breakpoint chlorination, icn exchange, and airstripping. One chapter presents the concepts involved in asseiblingvarious unit processes into rational treatment trains and, presentsactual case examples of specific treatment systems that irccrporatenitromenlcontrol process-4s. (Author/BB)
\
4
,
****+******************************************************************* Reproductions supplied by EDES are the best'that'can be made *
* from the original doCument. *
****************************!******************************************
CO
U.S. DEPARTMENT OFNIALT14.EDUCATION & WELFARE -NATIONAL INSTITUTE QF
EDUCATION
THIS DOCUMENT HAS BEEN REPRO -OUCED EXACTLY AS RECEIVED FROMTHE PERSON OR ORGANIZATION ORIGIN-ATING IT POINTS OF VIEW OR OPINIONSSTATED DO NOT NECESSARILY REPRE-SENT OFFICIAL NATIONAL INSTITUTE OF .
EDUCATION POSITION OR POLICY
PROCESS DESIGN MANUAL
1-4 FOR
CI NITROGEN CONTROL
U.S. ENVIRONMENTAL PROTECTION AGENCY
Technology Transfer
a
4
0
October 1§75
ACKNOWLEDGEMENTS
..This design manual was prepared for the Office of Technology TrTsfei of the U.S.-Environmental Protection Agency. Coordination and preparation of themanual was carriedout by the firm of Brown and Caldwell, Walnut Creek, California, under the. direction ofDenny S. Parker with assistance from Richard W. Stone and Richard J. StenqUist. Chapters7, 8,. and portions of Chapter 9 were prepared by Gordon Culp of CuiplWesner/Culp.Clair N. Sawyer and Perry L. McCarty served as consultants to the U.S..EPA for the purpose).of reviewing portions of t text. U.S. EPA reviewers were Edwin F. Barth and Irwin J.Kugelman of the U.S. EPA ational Environmental Research Ceriter, Cincinnati, Ohio, andRcibert S. Madam.), of the Office of Technology Transfer, Washington; D.C.
NOTICE
The mention of trade names of commercial products in this publication is for illu4trationpurposes and does not constitute endorsement or recommendation for ,use 'by theEnvironniental Protection Agency; *,
ii

ABSTRACc
This manual presents theoretical and process -design criteria for the implementation 'of-.
nitrogen control technology in municipal wastewater treatment facilities. Design concepts
are emphasized as much as possible through examination of data from full -scale and pilot
installations., It
;Design data are included on biological nitrification and denitrification, breakpointchlorination, ion exchange and air stripping. One chapter presents the concepts involved in
assembling various unit processes into rational treatment trains and presents actual case
examp les of specific treatment-systems that incorporate nitrogen controlprocg2s.
Chailter
ACKNOWLEDGEMENTS
CONTENTSY.
LIST OF FIGURES
I, ST OF TABLES
FOREWORD
It TRODUCTION
1.1 Ba¢ cground and Purbose1.2 `Scope of the Manual 1-2
1.3 Guide to the User 1-2
NITROGENOUS MATERIALS IN THE ENVIRONMENT ANDTHE NEED FOR COliTkOL IN WASTEWATER EFFLUENTS
2.1 Introductionw2.2 The Nitrogen Cycle 2-1
2.2:1 The Nitrogen Cycle in Siirface Waters and Sediments 2-5,2.2.2 The Nitrogen Cycle in'Soil and Groundwater 2-5
2-1
2.3 Sources of Nitrogen
2.3.1 Natural SOurces,2.3:2 Man-caused Sources
o 2-.4 Effects of Nirogen Discharge . 2 -12
i
2.4:1 Biostimula of Surface Watera 2-122.4.2 Toxicity. . 2-132A.3 Effect on Disinfection Efficieney 2-132.4.4 Dissolved Oxygenl)epletion in Receiving Waters I, 2-14
2.4.5 Public Health 2-142.4.6 Water Reuse - 2-16
2;8
2-82-9
Chapter
CON*NTS L Conlinued
\ _
\ I- -2.5 treatme, t proCessescKor Nitrogen Removal . 2-16.
"i- \2.5.1 Co vetional Treatment Processes , 2-16 ,
. 2.5.2 Aciv. n4:I Wastewater Treatment Processes. , 2-1701. 2.5.3 Maio' .N trogeniZemoval Processes ' .2-171_
t
Page
i2:5.3.1 .biological NitrifiCation-Denitri ..--2-1812.5.3:2 Breakpoint Chlorination ,218 ,.,, 1 . .2.5.3.3 elective ron Exhanke for Mn MOVal 2-122.5.3.4 \Stripping.fOr AnimoniaRein ' 2-0 -i
ti
2.5.4 Other Nitr g1 en Kemoval Processes2.5.5 Suminary
2.6 References1 .
'
PROCESS CHEMISTRY' Np BIOCHEMISTRY OFI11TRIFICATION AND a ENITRIFICATIOk
I
3.1: Introduction.3.2 Nitrification
. ,t.Ct
3.2.1 Biochemical Pat ways`3.2',2 Energy and Sytyt esis Relationships3.2.3 Alkalinity and p, Relationships3.2.4 Oxygen Requirem nts3.2.5 Kinetics of Nitrific tion '
, -
2-202 j20
2 -21
s
3-1 ,
3 -i
3-13-2 .
,343 -6
3.2.5.1 EffeCt of mOnia Conceiitratipn on Ki etits 3-63.2.5.2 Relations4 of Growth Rate to Oxidatio Rate 3-73.2.5.3 Relationshi of Growth, Rate to Solids
Retention time I 3L 8
3.2.5.4 'Kinetic Rate Constanots for. Temperature aNitrogen Co centration 3-8.
3.2.5.5 Effect of.Diss lved Oxygen on Kinetics :3-123.2.5.6 Effect of-pH b Kinetics 3-133.2.5-.7 Combined Kin tic. ExpresSions I 314
3.246. Population:Dynamics 3-17Nitrification Rates in Activated Sludge 3-21
3.2.8 Nitrification Rates'in Trickling Filters and Other`Attaciled'Growth Systenis 3-27
3.2.9 _Effie Ct .of Inhibitors on Nitrification 3-27
t
Denitrification.
3.3.1 Biochemical Pathways'3:3.2 Energy and Synthesis Relationships
.3.3 Alkalinity. and'pH Relationships3.3'.4 Alternative Electron Donors'3,3.5 Kinetics of DenitlifiCation
, 4
3.3.54 EffeCt of Nitrate on Kinetics ' 0
3.3.5.2 RelatiOnship of Grdwth *ate to Removal Rat3.3.5.3 Solids Retention Time .
3.3.5.4 iCinetic Constants for Denitrification ;
3.3.5.5 Eff'dct of Calton' concentration pn Kinetics ..
3.3.5.6 .Effect of pH on kinetics3:3.5.7 Combined Kinetic'ExPression
T-293:303-343-34c;
3-36
3:3.4 Effect ortIO on Denitrification Inhibition
3.4 References
BIOLOGICAL INIITRIFICATION
,
4.1 Introdudion,-4.2 - Classification of Nitrification Processes,4.3 Combined Carbon Oxidation-Nitrification in Suspendej
Growt Reactors.
I
'3-36'3-36,
13-37
3-373-40
"3-41
1.2
4 3.1- Activated Sludge Modifications
4.3.1:1 CoMplete Mix Plants4.3.1.2 Extended.AeiationZlants4.3.1.3 Conventional or Plug. FlOw plants
.
:4-1
4-2 .

chapter
CONTENTS Contiriued
Pi 4.3.1.4 Contact Stabilization Plants4.3.1.5 Step Aeration and Sludge Reaeration Plants
Page
4-44-6
., 4.3.1*.6 High Rate and Modified ActiV.ated'Sludge 4-64.3.,1.7 High Purity Oxygen Actiyated Sludge Plants 46
,i, , ,
4.3.2 ,i'Utility of Nitrification Kinetic Theory in Design4.3.3 Complete. Mix Activated Sludge Kinetics
4.3.3.1. Effect of Temperatufeand Safety Factor on---- '44Design . 3
4.3.3.2 Considefation in the Selection of SF 4_,3
,,. .....
4.3.4 10,5tended AeratiOn ActivatedSludge Kinetics 4-20, 43.5 Conventional Activated Sludge (Plug Flow) Kinetics 4-20, .
,t 43.5.1 Cynsiderations in the Selection of the Safety' ,.r Factor. -
.' 4.3.5.2 Kinetic Design Approach
4-7,
.4.3.6, 'Contact Stabilization Activated Sludge KinetiCs4
4.16.1 Design Example'
4-23. k-
4-23
4-23
4-24
4.3.7 Step Aeration Activated Sludge Kinetics . ''',,', 4-304.3.8 Olieraling Experience with Combined Carbon'Oxidation-
Nititfication in Suspended Growth Reactors 44301 ,
4.3.8.1, - Step Aeratiori Activated Sludge In a MOderate. . , b
A Climate . -%
4-30 .1I
4.3.8.2 St9p Aeration Activated Sludge in a RigorousClimate ' ''' 4 .. 4-32
4.3183 iniventional Activated Sludge ID a Rigorous% , 1Climate 4-32.
4.4 ;Combined Cart;ttn\ Oxidation-Nitrification In Attached Growth,Reactors, 4.35
4.4.1 Nitrification with Trickling Filters in coinbined CarbonOxidation-Nitrificgion Applications,: 4-35

CONTENTS Continued
Page
4.4.1.1, Media Selection 4-354.4.1.2 Organic Loading Criteria 4374.4.1.3 Effect of Media Type on Allowable Organic
Loading4.4.1.4 Effect of Recirculation on Nitrification 4-40'4.4.1.5 Effect of Temperature on Nitrification -4.4.1.6 Effect of Diurnal Loading on Performance 4-41
4.4.2 Nitrification with the Rotiting Biological Disc.Process inCombined Carbon Oxidation-NitrificationApPlicatioos, 441
,
4.4.2.1 Loading Criteria for Nitrification 1443 ,.
4.4.2.2 Effect of Temperature 4-43. 4.4.2.3' Effect of Diurnal Load Variations +43
.4.5. Pretieatme,nt for Separate Staie Nitrification 4-45
4.5.1 Effects of Pretreatment by.Chemical Addition 4-46
4.5.2 Effedts of Degree of Organic Carbon Removal 4504.5.3 Ptotection Against Toxicants . 4-51
------- .../-4.6 Separate Stage Nitrification with Suspended Growth Processes
.
4-52
4.6.1 Application of Nitrification Kinetic Theay. to Design 4-52
4.6.2 Solids Retention Time A p p r o a c h .: 4-53.
4.6.2.1 Choice of Process Configutation4.6.2-2 Choice of the Safety Factor
4.6.3 Nitrification Rate Approach.4.6.4. Effect of the BOD5/TKN Ratio on Sludge Inventory
Control4,6.5 Comparison of the, Use of Conventional Aeration to
the Use of High PuritX Oxygen
4,6.51 High Purity Oxygen Nitrification 'With andWithout pH Control
ix
.4-534754
4-55
457
4-58
Chapter
CONTENTS Continued
Page
4.6.5.2 Comparison of Conventionii.Aeration andHigh Purity Oxygen at the Same pH 4-59
. . .4.7 Separate State Nitrification with Attached Growth Processes 4-61
,
4.7.1 Nitrification with Trickling Filters
4.7.1.1 Media Type and Specific Surface4..7.12. Ivoading Criteria4:7.1.3 Effect of Recirculation4.7.1.4. Effluent Clarification4.7.1.5 Effect of Diurnal Load Variations4.7.1.6 Design Example.
.4.7.2 Nitrification with the Rotating Biological Disc Process
4.7.2.1 Kinetics
4-62
4-6*4-6247.66
4-664-664,-68
4:7.3 Nitrification with Packed-Bed Reactors 4-7;
4.7.3.1 Oxygenation Techniques 4-734.7.3.2 Media Type;Backwashing and Loading Criteria 4-73
4.8 Aeration Requirements 4-76 ,
4.8.1 Adaptability of Alternatiire Aeratibn Systems to DiurnalVariations in Load - , 4-79
4.8.2 Oxygen Transfer Requirements 4804.8.3 Example Sizing of Aeration Capacity A
4-84
4.9 pH Contfol 4-85
4.9.1 Chemical Addition and Dose Control 4?-86.
4.9.2 Effect of Aeration Method on Chemical Requirements 4-86
4.10 Solids-Liquid Separation . . 4-894.11 Considerdtioris for Process Selectibn -4-94
4.11.1 Copparison to Physical - Chemical Alternatives 4-94
Chapter
CONTENTS, Continued
4.11.2 Choice Arriong iilternat Nitrification Systems
Page
4-942
4.1.2 References 4-99
BIOLOGICAL DENITRIyCATION 5-1
5.1 Introduction5.2 Denitrification in Suspended Growth Reactors Using
Methanol as the Carbon Source
,
5.2.1 Denitrification Rates 5-3
5.2.2 Complete Mix Denitrification Kinetics, 541'
° 5.2.2.1: 'Effect of Safety Factor on Steady-StateEffluent Quality 5-8
5.2.2.2 Effect of Diurnal Load Variations on EffluentQuality 5-8
\5.2.3 Plug FloW Denitrification kinetics5.2.4. Effluent, Quality from Suspended GroNirth
Denitrification Processes
g.2.4.1 Experience at Manassas, Va..5.2:4.2 Experience at the CCCSD's Advanced.
Treatment Test Facility
5.3 Denitrification in Attached. Growth Reactors Using Methanolas the' Carbon Source
5.3.1 Kinetic Design of Attached Growth Denitiifrc ation
5-10
512
5-12
5-13
5-15
Systems .5-155.3.2 Classification of Column Configurations 5-17
. .5.3.2.1 Nitrogen 4 Filled Demtnfication Columns - .
Packed Bed , 5-175.3.2.2 Submerged High"Porosity Media Columns -.
Packed Bed ' , . , 5-225.3.2.3 Submerged bow Porosity Fine Media
Columns - 'Packed Bdd Configuration 5-23
CONFENTS Continued
. Chapter
5.3.2.4 Submerged .High PoroSity. Fine. Media ColiminsFluidized Bed
513.2,5 ComParison-OtAttached Growth --Dexiitrification Systems'
. ,
5.4 Methanol Handling, Storage, Feed. ContrMethanol.,Removal
5.4.1 Properties of Methanol
d Excess...
Page
5-29
5-52
532 _
5-33:5..4.2 Standards foi Shipping, Unloading, Stoiage and
. Handling5.4.5 Methaliol,Delivery. and Unloading5.4.4 Methanol Storage5.4.5 Transfer and Feed5:4.6 Methanol -Feed:Control5.4.7 Excess Methanol Removal.-
. .
7
5.5 Combined Carbon thddationrIlitrification-DenitrificaticinSystems with Wastewater and,Endogenous Carbon Sour. ces
5.5.1 Systems Using Endogenous Respiration in a SeqUentialCarbon Oxidation-NitrificationiDenitrification System 5-39f
5.5.2 Systems USing Wastewater Carbon in'Alternating /Aerobic/AnOxic Modes 5-42
5.5.2.1 A robic/Anoxic Sequences in Oxidation Ditches 5-425.5.2.2 Denitrification in an Alternating Contact Process 5485.5.2.3 The Barderipho Process' 1 5-495.5.2.4 Alternating Aerobic/Ancodc System-Without
Internal Recycle . 5 -525;5.2.5 Kinetic Design of Alternating Aerobic/Anoxic
Systems
5-335-345756' 1
5375-5?
, 5-38;. ,
5.6 "Solids-Liquid Separation5.7 Considerations for Process Selection
5.7.1 CompariSon to Physicl-Chemical Alternatiyes 5-615.7.2 Chbice Among Alternative_Denitrification Systems 5-61
.'
CONTENTS Continued
Chapter Page
BREAKPOINT CHLORINATION
6.1 . Process Chemistry
6.1.1 Chemical Stoichiorn6.1.2 The Breakpoint
6.2 Process Application COnside ations-.
6.2.1 Chlorine Dosage Requirement
6.2,4.1 Effect of Pretreatment6.2.1.2 Effect of pH and Temperature6.2.1.3 Initial Mixing of Chlorine
6.2.2 Residual Nitrogdnous Materials6.2.3 Alkalinity us lementation6.2.4 Reaction ". s
6.2.5 Effect on Tot41 Dissolved Solids6.2.6 Reactions with Organic (Nitrogen
6.2.7 Disinfection
6.3 Pro ss ControMnstnirnentation
6.3.1 -Pr ess Control System
6.3:1.1 hlorine Dosage. Control6.3.1.2 pH Control
6.3.2 Process Control ccOpOnents
6.4 Dechlorination Tec y 'clues
6-1
6-1
6 -5
6-5
6-6
6-6.6-76-7
6-96-126-126-136-146-15
6 -15
6-15
6-156-18
6-18
6.4.1 Sulphur Dioxide Dechlorintion .6-19
6.4.1.1. Stoichiometry 6-19
6.4.1.2 Reaction Rates 6-20
6.4.1.3 Significance of Sulphur Dioxide Overdose '6-20
6.4.1.4 Process Application and Control 6-20
r.
CONTENTS Continued
Chapter Page
6.4.2 Activated Carbon Dechlorinatfon 6-21
6.4.2.1 Stoichiometry 6-216.4.2.2 Process Application 6-22
.
6.5 Design Example 6-.226.6 Considerations for Process Selection 6-246.7 Referenes 6-25
SELECTIVE ION EXCHANGE FOR AMMONIUM REMOVAL 7-1
7.1- Chemistry and Engineering Principles 7-R
7.1.1 Basic Concept 7-17.1.2 Ion Exchange Principlesr f 7-2.,7.1.3 Properties of Clinoptilolite 7-
s:'
,
7/1.3.1 -Selectivity A ,_
7:1.3.2 Mineralogical Classification 7 -5
7.1.3.3 Total Exchange Capacity 7-77.1.3.4 Chemical Stability 7-77.1.3.5 Physical Stability ' 7-87.1.3.6 tensity 7-9
7.2 MajOr Service Cycle Variables 7-9
.
'7.2:1 ,pH 7-97.2.2 Hydraulic Loading Rate 7-97.2.3 linoptilolite Size 7-97.2.4 Pretreatment 7-107.2.5 Wastewater COmposition- 7-107.2:6 Length of Service Cycle 7 -10. ,
7.2.7 Bed Depth 7-117.2.8 One Column vs. Series Co '.Oferation 7-127.2.9 Deteimination of Ion Eichanger Size . , 7-14
7.3. Regeneration Alternatives 7-16
7.3.1- Basic Concepts 7-16
xiv 1.4
Chapter
7.3.2 Regeneration. Process
7.3.2.1 High pH Regeneration'7.3.2.2 Neutral Regeneration7.3.23 Effects on Effluent TDS
CONTENTS Continued.
7.3.3 Regenerant Recovery Systeins.
7-17
7-177-177-.19
7-19..
7.3.3.1 Air Stripping of High .pH Regenerant 7-1973.3.2 Air Stripping of Neutral pH Regenerant 7-227.3.3.3 Steam 'Stripping 7-247..3.3.4 Electrolytic Treatment of Neutral pH
Regenerant 7-26
7.4 Considerations in. Process Selection7. References
R STRIPPING FOR NITROGEN REMOVAL
7-277-28
8-1
8.1 Chemistry and Engineering Principles , 8-1
8.1.1 I3asic Concept
8.2 Environmental Considerations
Air. Pollution. 8.2,2 Washout of Ammonia froni the Atmosphere
8.2.3 Noise
8 -1 :
8-1
8-28-48-5
8.3 Stripping Tower System Design Considerations 8 -5
8.3.1 -Type of Stripping Tower-8.3'.2 pH8.3.3 Temperature8.3.4 Hydraulic Loading8.3.5 Tower Packing
83.11.1 Packing Depth8.3.7.2 :Packing Material and Shape
8-5
8-5
8-68 -7
8-9
8-9
xv
15
Chapter
CONTENTS Continued
Page
8.3.5.3 Packing Spacing and Configurtion '8.710
8.3.6 Air Flow8.3.7 Scale Control.
8.4 Ammonia Recovery or Removal From Off -Gases
8.4.1 Acid Systems8.4.2 Nitrification-Denitrification
8.5 Stripping Ponds8.6 Considerations in Process Selection8.7 References
TOTAL SYSTEM DESIGN
° 8-11871t
8-13
'8 -138-15
8-178-198-20
9-1
9.1 Introduction 9-19.2. Influence of. Effluent Quality Objectives on Totirl System
Design 9-19.3 Other Considerations in Process Selection 9-49.4 Interrelationships with Phosphorus Removal 94
9.4.1 Alternative Systems9.4.2 Considerations in System Selection
9-59-8
9.4.2.1 Phosphorus Removals Obtainable 9 -8
9:4.2.2 Impacts on Sludge Handling 9-9 °9.4.2.3 Reliability - 9 -119.4.2.4 Flexibility of Operation in Multipurpose
TreatMent Units9.4.2.5 Cost
9-129-12
9.5 Case Eiamples 9-12
9.5.1. Case Examples of Nitrification for Ammonia Reduction 9-13
9.5.1.1 Jackson, Michigan 9-139.5.1.2 Valley Community Services District, California 9-16
xvi
16

ChapterI
CONTENTS-- Continued
Page
9.5.1.3 Livermore, California9.5.1.4 San Pablo Sanitary District, California
9.5.2 Case Examples of Nitrification-Denitrification forNitrogen Removal
9-229-23
9-29
9.5.2.1 Central Contra Costa Sanitary District, California 9-29
9.5.2.2. Canberra, Anstralia9.5.2.3 Washington, D.C.9.5.2.4 El Lago, Texas
.
9.5.3 Case xamples of Breakpoint Chlorination for NitrogenRe oval
9-39 ,466
9-409-49
9.5.3.1 Sacramento, California9.5.3.2. Montgomery County, Maryland
9.5.4 Case Exaniples of Selective Ion Exchange for NitrogenRemoval
9-55
9-559-62. N,
9-70
9.5.4.1 Upper Occoquan Sewage Authority, Va. 9-70
9.5.4:2 Rosemount, Minnesota 9-77
9.5.5 Case Examples of Air Stripping for Nitrogen Removal 9-8.1
- -
9.5.5.1 South Lake Tahoe, California 9-81
9.5.5.2 Orange County Water District, California' 9-87
9,6 References
APPENDIX A - GLOSSARY OF SYMBOLS
APPENDIX B - METRIC EQUIVALENTS
,
. 9-91
A-1
B-1
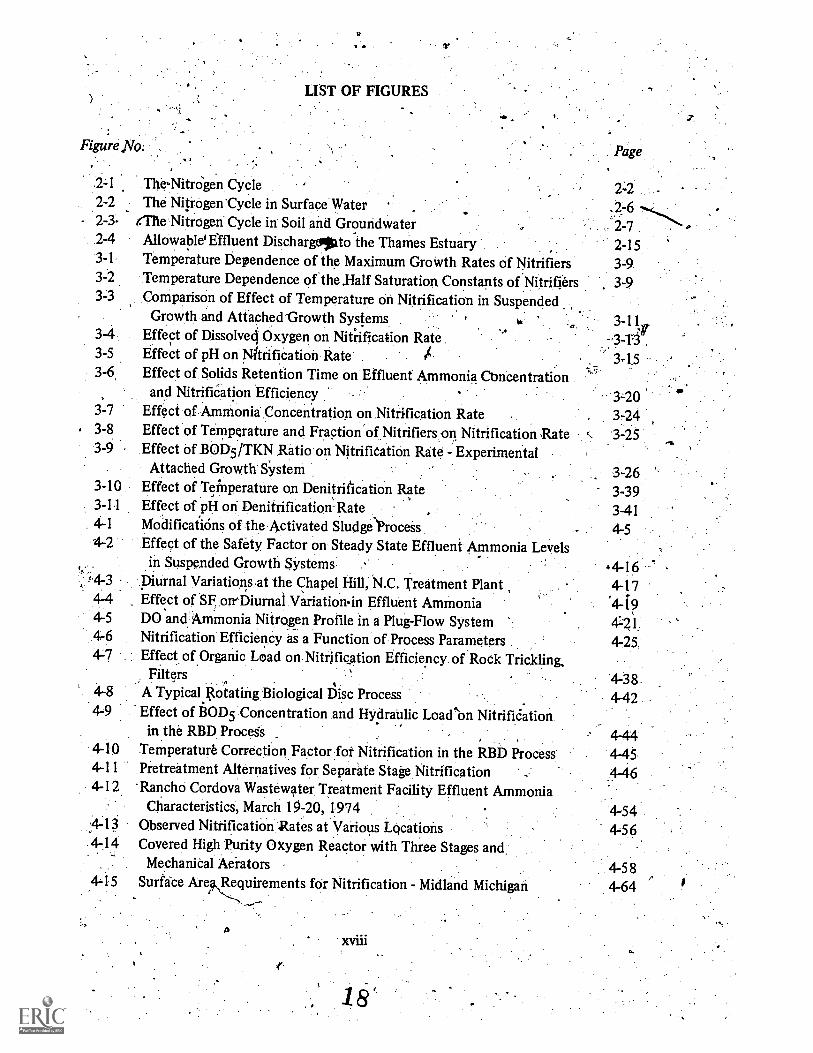
Figure No:
2-1 The-Nitrogen Cycle
LIST OF FIGURES
2=22-2 The Nitrogen "Cycle in Surface Water - .2-6 ,...2-3. alte Nitrogen Cycle in Soil and Groundwater 2 -7 -...2-4 Allowable' Effluent DischargelOto the Thames Estuary 2-153-1 Temperature Dependence of the Maximum GroWth Rates of Nitrifiers 3-93-2 Temperature Dependence of the ,Half Saturation. Constants of Nitrifiers 3-93-3 Comparison of Effect of Temperature on Nitrification in Suspended
Growth and Attached-Growth Systems ,
. k,. 3 -11113-4 Effect of Dissolved Oxygen on Nitrification Rate -3-1-3 .
3-5 Effect of pH on Nitrification Rate IA 3-153-6 Effect of. Solids Retention Time on Effluent Ammonia Ctmcentration
and NitrifiCation Efficiency 3 -203-7 Effect of Ammonia Concentration on Nitrification Rate 3-243-8 Effect of Temperature and Fraction of Nitrifiers on Nitrification Rate 3-253-9 Effect of BOD5/TKN Ratio on Nitrification Rate - Experimental
Attached Growth SYstem 3-263-10 Effect of TeMperature on Denitrification Rate 3-393-11 Effect of pH on Denitrificatiori Rate , 3-414-1 Modifications of the Activated Sludge\ProceSs 4-54-2 Effect of the Safety Factor, on Steady State Effluent Ammonia Levels
in Suspended Growth SYstems .- 4-163 Diurnal Variations.at the Chapel Hill, N.C. Treatment Plant 4-17
Effect of SF, orrDiurnal Variationin Effluent Ammonia 4-194-5 DO and'Ammonia Nitrogen Profile in a Plug-Flow System 47-21,4-6 Nitrification Efficiency as a Function of Process Parameters 4-254=7 Effect of Organic Load on Nitrification Efficiency of Rock Trickling,
Filters 4-38.4-8 A Typical Rotating Biological Disc Process 4-424-9 Effect of BOD5 Concentration and Hydraulic Load'on NitrifiCation
in the RBD Procegs 4-444-10 Temperature Correction Factor:for Nitrification in the. RBD ProceSs' 4-454-11 Pretreatment Alternatives for Separate Stage Nitrification . 4-464-12 'Ranchd Cordova Wastewater Treatment Facility Effluent Ammonia
Characteristics, March 19-20, 1974 4-544-13 Observed Nitrification Rates at Various Locations 4-564-14 Covered High Purity Oxygen Reactor with Three Stages and
MechaniCal Aerators 4-58,.4.15 Surface Are Requirements for Nitrification - Midland Michigan 4-64
A
18
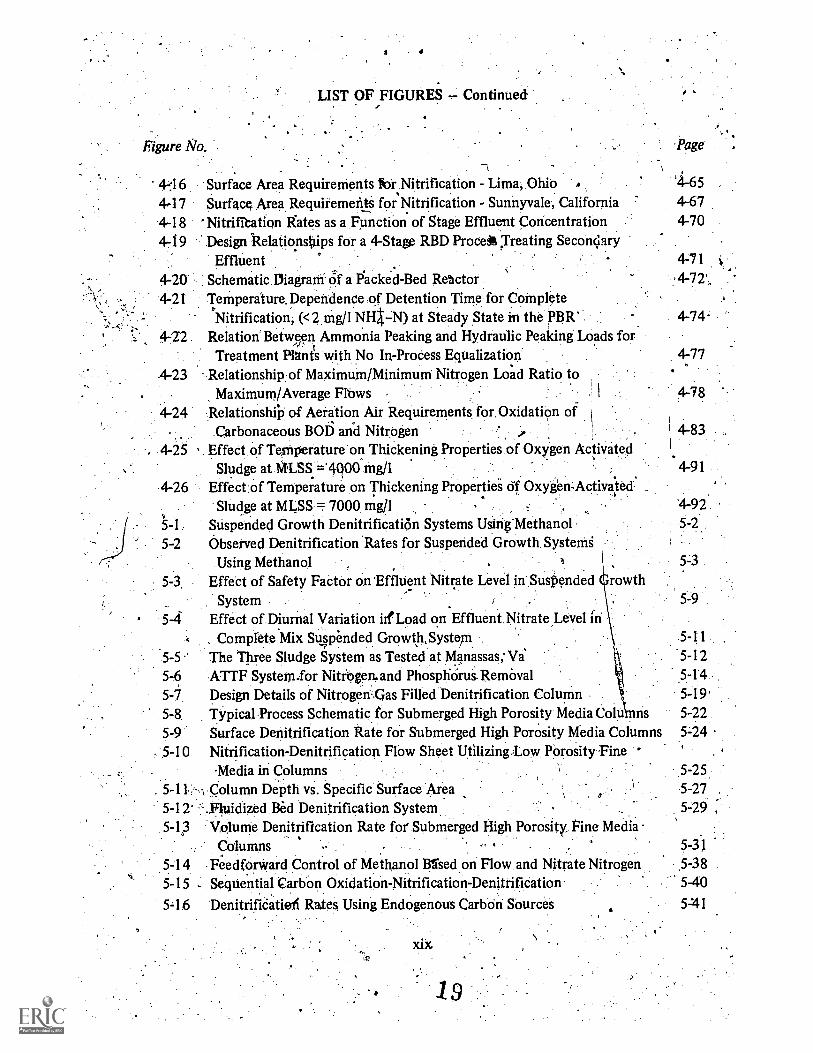
LIST OF FIGURES Continued
Figure No. Page
.
416 Surface Area Requirements forNitrification - Lima, Ohio A '4-65
4=17 Surface Area Requiremente for Nitrification - Sunnyvale, California 4-67
4-18 'Nitrifibation gates as a Function of Stage Effluent Concentration 4-70
4-19 Design RelationsOips for a 4-Stage RBD Proceit ;Treating SecondaryEffluent 4491:
4-20 Schematic. Diagrarri. Of a Packed -Bed Reictor 4-72',,
4-21 TeMperature.Dependende.of Detention Time for Completel'Nitrification, (<2 mg/lNHN) at Steady State hi the PEiR' 4-74
Relation Between Ammonia Peaking and Hydraulic Peaking. Loads forTreatment Plants with No In-Process Equalization 4-77
4-23 Relationship of Maximum/Minimum Nitrogen Lo'ad Ratio to. Maximum/Average Rims - .. 4-78
4-24 Relations* of Aeration Air Requirements for. Oxidation ofCarbonaceous B015 and Nitrogen .). i 1 4-83
. 4-25 Effedt of Temperature on Thickening Properties of Oxygen Activated .I
Sludge at HISS :=-4000 mg/1 ' 4-91
4-26 Effect.Of Temperature on Thickening Propertiei Of Oxygen-Activaled:Sludge at MLSS = 7000 mg/1 , . ..,.. '4-92
''5-1, Suspended Growth Denitrification Systems Using-Methanol , 5-2.
5-2 Observed Denitrification Rates for Suspended Growth. SysterngUsing Methanol ,
. , 5 -3
5-3, Effect of Safety Factor on 'Effluent Nitrate Level in Susfiended rowthSystem ,. . 5-9
° 5-4 Effect of. Diurnal Variation iif Load on Effluent. Nitrate Level in. Complete Mix Suspended Growth 5-11
5 -5 The Three Sludge System as Tested at Manassas;Va. 5-12
5-6 ATTF System.for Nitrogen, and Phosphorus. Removal 5-14
5-7 Design Details of NitrogenQas Filled Denitrification Column 5-19'5-8 Typical .Process Schematic for Submerged High Porosity Media Coluinns 5-22
5-9 Surface Denitrification Rate for Submerged High Porosity Media Columns 5=24
5-10 Nitrification-Denitrification Flow Sheet Utilizinglow. POrosity Fine °
'Media in Columns 5-25
. 5-11:-.,, Column Depth vs. Specific Surface Area 5-27
5-12' -'',,Fluidized Bed Denitrification System ... 5-29 ,
5-13 Volume Denitrification Rate for Submerged High Porosity_ Pine MediaColumns , . 5-31
5-14 Feedforward Control of Methanol Bt'sed on Flow and Nitrate Nitrogen 5-38
5-15 , Sequential Carbon Oxidation-Nitrification-Denitrifidation . 5-40
5 -16 Denitrifidatie6 Rate5 Using Endogenous Carbon Sources 5-41
422

LIST.OF FIGURES Contin ed
Figure No. Page
5-17 Pasveer Ditch or endless Channel ISystem for Nitcog n Removal 5-43
5-18 Vienna-Blumenthal Wastewater Treatment Plant 5-44
5-19 Alternating Contact Process , .-5-49
5-20 Operational Sequencing of One ofTwo,Aeration Tanks in Alternating.Contact Process .,
5-21 The Bardenpho System - Se-quential Utilization of Wastelter Carbonand Endogenous Carbon ; '5-51
5-22 Blue. Plains Alternating Anoxic Aerobic System 5-52
5-23 Effect of Temperature on Peak Denitrification Rates with WastewaterCarbbri Source 5-57
5-24 .Comparison of Denitrification Systems 5-63
6-1 Relative Amounts of HOCI and OCV at Various pH Levels 6-2
6-2 Effects of pH and Temperature on Distribution of Ammonia-andAmmonium Ion in Water 6-3
,6-3 Theoretical Breakpoint Chlorination Curve 6-6
6-4 Effect of C12:N1-q-N on Nitrogen Residuals in Lime ClarifiedFiltered Secondary Effluent
6-5 Comparison of Germicidal Efficiency of HypOchlorous Acid,Hypochlorite Ion, and Mon chloramine for 99 Percent Destructionof E. Coli at 2-6 C 6-16
6-6 Breakpoint Chlorination Con 1- Functional Schematic 6717
Selective Ion Exchange Process7-2 Generalized Ion Exchange Isotherms 747-3 The 23 C Isotherms for the Reaction, (Ca)z + 2(NH))N 2(NH4)z +
(Ca)N with Hector-clinoptilolite and IR 120 . 7-5
7-4 Selectivity Coefficients vs. Oxicentration Ratios of Sodium orPotassium and Ammonium in the Equilibrium Solution with HectorClinoptilolite at 23 C for the Reaction (Y)z.+ (N114)N = (NH44)z + (Y)N 7-6
7-5 Selectivity Coefficients vs. Concentration Ratios of Calcium or. Magnesiumand Ammonium in the Equilibrium Solution with Hector Clinoptilolite ,
at 23 C for the ReactiOn (X)z + 2(NI4)N = 2(Nif4)z + (X)N
5-50
7-7
7-6 Isotherms for Exch,ange of NH4 for K+, Na+, Ca++, and .Mg onClinoptilolite 7-8
7-7 Minimum Bed Volumes as a Function. of Influent NHTrN Concentrationto Reach 50 Pekent Breakthrough of Ammonium 7-12
7-8 Ammonium Breakthrough Curves for a 6 ft Clinoptilolite Bed atVarious Flow Rates _ 7-13
7-9 Effect of Bed Depth on Ammonium Breakthrough at 9.7 BV/hr 7-14
xx

LIST OF FIGURES Continued
Figure No.
1
. .7-10 Variation of Ammonium Exchange Caps ty with CoMpeting Cation
Concentration for a 3 ft Deep Clinoptiloli e Bed 7-15
7;11 Ammonium Elution with 2 Percent Sodium Chkirid Regenerant 7-18
7-12 - Example Ion Exchange- Air StripPingSygtem for gh pH Regenerant 7 -20
7 -13:, , Flaw ,Diagram, of Neutral pH Regeneration System Lsing Air Stripping' 7-23.4
.7-14 Typicael.ElutiOn Curve 7-25
7-15 Simplified FloW Diagram of Electrolytic Regenerant TreatmentSystem 7-26
8-1 Ammonia Stripping Process: 8-2
8-2 Types of. Stripping Towers , 8-6
8-3 Effect of Temperaturp on Ammonia Removal Efficiency Observedat Blue Plains Pilot Plant
.8-7
8-4 .Percent AMmonia Removal vs. Surface Loading Rate for' VariousDepths of Packing . 8-8
8-5 Illustrative Packing Configuration 8-10
8-6. . Effect of Packing Space on Air Requirements' and Efficiency of.. 4mmonia Stripping . . 8-11
8-7 Process for Ammonia Removal and Recovery 8-14
8-8 AmmoniaElimination System 8-16
8-9 Ammonia Stripping Pond System 8-18
9Alternate
'
- .. .
-1 Process Sequencing for Systems Yielding Combinqd Nitrogenand Phosphorus Removal - Systems with Coagulant Addition toPrimary Sedimentation .9-6
9-2 Alternative Process Sequencing for Systems Yielding Combined,Nitrogen and. Phosphorus Removal - Systems with. Coagulant Addition -after Primary Treatment 9-7 'i,
9 -3 Schematic. Flow Diagram -South Lake Tahoe, California Plant 9-10 .,4,
9-4, Jackson, Michigan Wastewater Treatment Plant Flow Diagram 9-15
9-5 Valley Community Services District (Calif.) Wastewater TreatmentPlant Flow Diagram 9-19
9:6 Holding Basin at the Valley Community Services District (California).1-!- Wastewater Treatment'Plant .9-21
9 -7 City of Livermbre Water Reclamation Plant (Calif.) Flow Diagram 9-229-8 Aeration Tank at the Livermore Water Reclamation Plant (California).
With Roughing Trickling Filters in Background .9 -25
9-9 San PabloSanitary District Treatment Plant (California) Flow Diagram 9-27
9-10 Liquid Process Flow'Sheq - CCeSD Water Reclamation-Plant 9-33
1L4

M1
9-1.2
9-13
9-14
9-15
9-16
9.17
9-189-19
and Fine Media Type on Left - 9-53
9-20 Hypochlorite Generation Schematic - Sacramento RegionalWastewater Treatment Plant: 9-59
9-i1 Plan and Section of the Breakpoint Facility at.the SacramentoRegional.Wastewater Treatment Plant , , 9-60
9-22 Flow Diagram of therMontgomery Couhty, Maryland Plant 9-63.9-23 - Membrane Cell Used for-Hypochlorite Production .. 9-649-24 Overall System Using Membrane Cells for Hypochlorite Production 9-65
9-25 Schematic of Montgomery County, Maryland Breakpoint. 1
Chlori4ation Process9-26 Flow Diagram -Upper OccoquanASewage Authority Plant (Virginl4)9-27 Plan and Section of Ion Exchange Beds at. Upper Occoquan Plant ' '\
9-28 Added Details - Ion Exchange Beds at.Upper Occoquan Plant9-29 Plan View of ARRP Module -Upper Occoquan Plant9-30 Section of ARRP Module z Upper OCcoquan Plant'9-31 Schematic of Rosemount, Minnesota Plant9-32 Orange Co. Ammonia Stripping/Cooling Tower: Section9-33 Overall View of the Orange County Water District9-34 Stripping tower Packing Module at the O_ range County Water.
District Plant
Page
Nitrification-DenitrificatiOn System at the CCCSD Water ReclamationPlant Y \
Solids Flow Diagram at the CCCSD Water Reclamation PlantProcess Flow Diagram for the Lower Molonglo Water Quality
Control Centre (Canberra, Australia) \
Section Through Nitrification Tanks at the LMWQCC, CanberraAustralia it
Washington, D.C. Blue Plains.Treatment Plant Fl Ow Diagram ofAPrimat'y and Secondary SystemsWashington, D.C. Blue Plains Treatment Plant Flo* Diagram of
,Nitrification and Denitrification Systems -, q
Washington, D.C. Blue Plains Treatment Plant Flow\\
Diagram ofFiltration and.Disinfection Systems
El Lago, Texas Wastewater Treatment Plant, Flow DiagramEl I..ago, Texas Denitrification Columns, Coarse Media Type on Right
9-36'9-38
9-41
9-44
9-46
. 9-47
\ 9-489-51
9-679-7.1
9-73 ,19-749-75
IP9-709-799-889-89
9-90
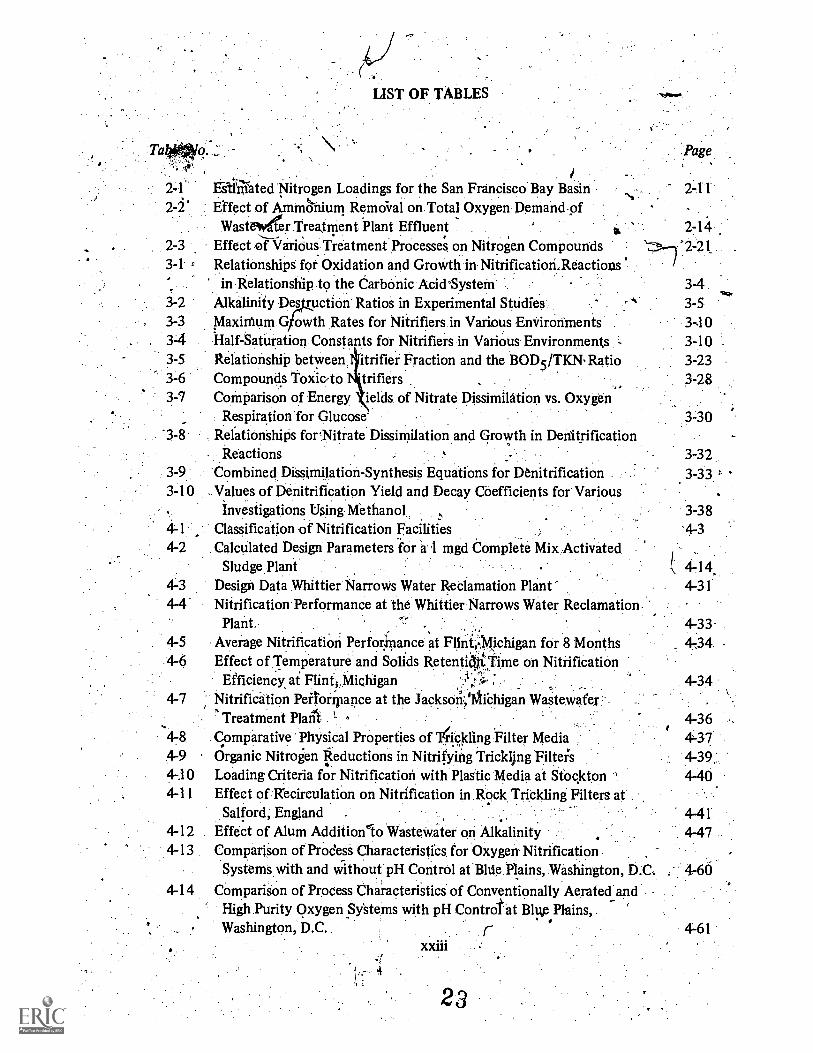
LIST OF TABLES
2-1 Eteated Nitrogen Loadings for the San Francisco Bay Basin2-2' Effect of Ammonium Remoiral on Total Oxygen Demand.of
Wasteiver Treatment Plant Effluent 2-142-3 Effect of Varibus freatment Processe; on Nitrogen Compounds3-1 s Relationships for Oxidation and Growth in Nitrification: Reactions
in Relationship to the Carbonic AcidSystern
.Page
3-43-2 Alkalinity Des uctiOn Ratios in Experimental Studies 3-53-3 MaxiMum G owth Rates for Nitrifiers in Various EnVironments 3-103-4 half-Saturation Constants for Nitrifiers in Various. Environments 3-103-5 Relationship between itrifier Fraction and the BOD5/TKN,Ratio 3-233-6 Compounds Toxic/to triflers , 3-283-7 CoMparison of Energy gelds, of Nitrate Dissimilation vs. Oxygen
Respiration.for Glucose 3-30"3-8 . Relationshilis forNitrate Dissimilation and Growth in Denitrification
Reactions 3-323-9 Combined Dissimilation-Synthesis Equations for Denitrification 3-333-10 . Values of Denitrification Yield and Decay Cbefficients for Various
Investigations Using Methanol 3-3841 Classification of Nitrification Facilities '4-3.4-2 Calculated Design Parameters for al mgd Complete Mix Activated .
Sludge Plant l 4714,4-3 Design Data Whittier Narrows Water Reclamation Plant 4-314-4 Nitrification Performance at the Whittier Narrows Water Reclamation
Plant. 4-33-OA
4-5 Average Nitrification Performance'at Flini;Nichigan for 8 Months 4344-6 Effect of Temperature and Solids Retenti4n, Time on Nitrification
EfficienCi at Flint5Michigan4-7
,Nitrification Pertoripance at the Jackson:,*chigan Wastew4fer-7* Treatment Plan" t 4-36
4-8 Comparative' Physical Properties of ilickling Filter Media _ 4374-9 Organic Nitrogen Reductions in Nitrifying Trickling Filteis 4-39.410 Loading Criteria for Nitrification with Plastic Media at Stockton 4404-11 Effect of Recirculation on Nitrification in. Rock Trickling Filters at
Salford, England4-12 Effect of Alum Additionlo WasteWater on Alkalinity4-13 Comparison of Prodess Characteristics for Oxygen Nitrification
Systems with and without Control at Bltte Plains, Washington, D.C, 4-604-14 CompariSon of Process Characteristics of Conventionally Aerated and
High. Purity Oxygen Systems with pH Control'. at Blite Plains,Washington, D.C. r 461
4-34
. 4414-47
23
'LIST r TABLES -- COntinued _
Table No. 'Page
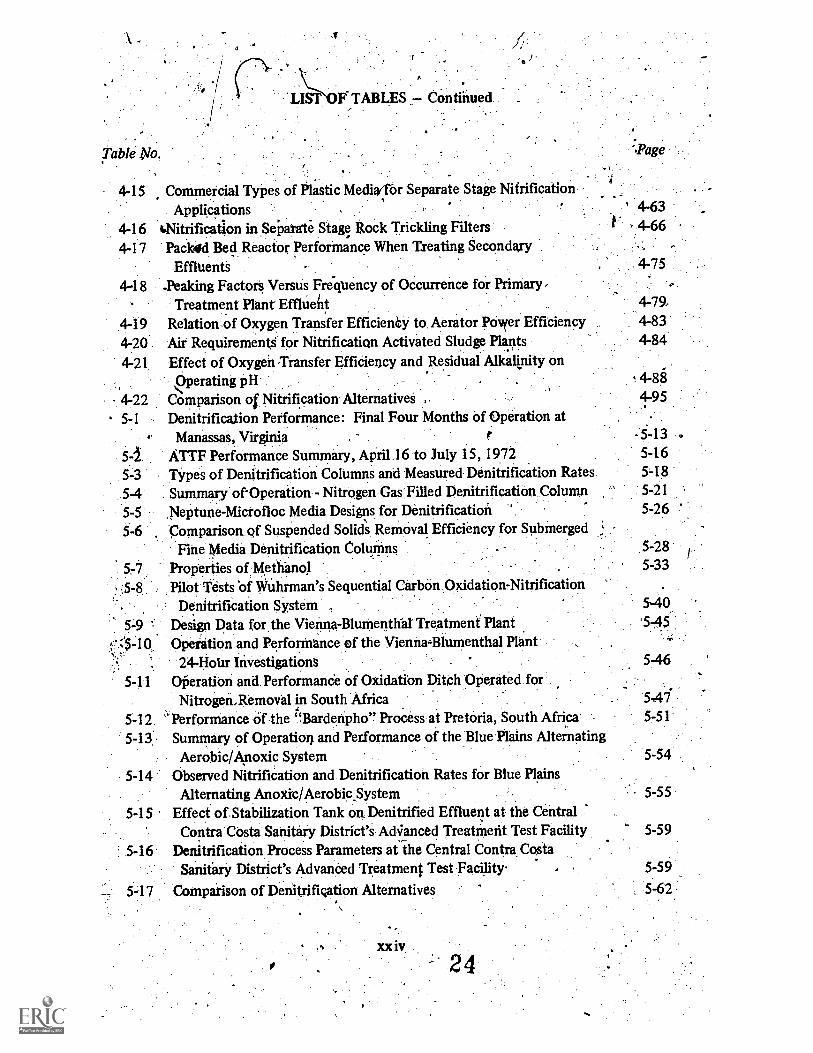
4-15 Commercial Types of Plastic Media/for Separate Stage Nitrification
4-164-17
4-18
4-194-204-21
4-225-1
545-3
5-45-55-6
5 -7
,5-8
5 -9
z"5-10
5-11
5-125-13
5-14
5-15
5-16.
5.17
Applications . ' 4-63
'Nitrification in Seiatete Stage Rock Trickling Filters 4-66Padlold Bed Reactor Performance When Treating Secondary
Effluents 4-75
-Peaking Factors Versus Frequency of Occurrence for PrimaryTreatment Plant Effluent 4-79
Relationof Oxygen Transfer Efficiency to. Aerator Power Efficiency 4-83
Air RequirementS for Nitrification Activated Sludge Plants 4-84
Effect of Oxygen Transfer Efficiency and Residual Alkalinity onOperating pH 4-88
Comparison of Nitrification Alternatives a 4-95
Denitrification Performance: Final Four Months of Operation atManassas, Virginia t -5-13
ATTF Performance Summary, April 16 to July 15, 1972 5-16
Types of Denitrification Columns and Measured Denitrification Rates. 5-18
Summary of Operation - Nitrogen Gas Filled Denitrification Column " 5-21
Neptune-Microfloc Media Designs for Denitrificationcomparison of Suspended Solids Removal Efficiency for Submerged
5-26
Fine Media Denitrification Columns 5-28
Properties of Methanol 5-33
Pilot Tests of Wiihrman's Sequential Carbon Oxidation-NitrificationDenitrification System , 5-40.
Design Data for the Vienna-Blumentha Treatment Plant '545.Operation and Perforinunce of the Vienna-Blumenthal Plant
24-HoUr Irivestigations 5-46
O_Oration and. Performande of Oxidatibn Ditch Operated forNitrogen,Removal in South Africa 5-47
4Performance of the t`Bardenpho Process at Pretoria, South Africa 5-51
Summary of Operation and PerforMance of the Blue Plains AlternatingAerobic/Anoxic System 5-54
Observed Nitrification and. Denitrification Rates for Blue PlainsAlternating Anoxic/AerobicSystem 5-55
Effect of. Stabilization Tank on Denitrified Effluent at the CentralContra Costa Sanitary District's AdVanced Treatment Test Facility 5-59
Denitrification Process Parameters at the Central Contra CostaSanitary District's Advanced Treatment Test Facility. 5-59
Comparison of Denitrification Alternatives , 5-62
4

LIST OF TABLES -- Continued
Table No. Page
6-1
6-2-
6-3
6-47 -1
Effect of Pretreatment on C12:NH441-N.Brepkpoint RatioEffect 9f Pretreatment on Formation of Nitrogenous Residuals at
Breakpoint 'EffeCts of Chemical Addition.on Total Dissolved Solids in Breakpoint
Chlorination tt,Effect of Breakpoint Chlorination on Soluble Organic NitrogenInfluent Composition'for Selective Ion Exchange Pilot Tests at
Different Locales ,
;
6-8
6-10
0-136-14
7 -11-- 9-1 Effident Nitrogen Concentrations in. TreatMent Systems Incorporating
Nitrification- Denitrification ° 9-2-9-2 Effluent Nitrogen Concentrations in Treatment Systems Incorporating
Ion Exchange 9-29-3 Effluent Nitrogen Concentrations in Treatment Systems
Incorporating Breakpoint Chlorination 9-39-4 Effluent Pliosrihorus- Concentration from Alternaiive Systems 9-119-5 DesigkData, Jackson, Michigan Wa§tewater Treatment Plant 9-1°49-6 VCSD Wattewater Treatment Plant Design Data 9=179-7. Nitrification Performance at Valley. Community Services District
Wastewater Treatment Plant, California -, 9-209-8 itrogen Analyses on 24 Hour Coniposite Effluent Samples at the
,Valley Community. 'Services District Treatment,P1a0 9-21
9-9 i sigrf Data - Livermore Water Reclamation Plant' 9 -249-10' Nitrification Performance at tlf0 Livermore Water Reclamation-Plant 9-26941 Designaata, San Pablo Sanitary District Treatment Plant 9-289-12 Nitrification Performance at the San Pablo Sanitary District
Treatment Plant a9-30
9-13 Average Process Loading Conditions at the Set Pablo SanitaryDistrict. Treatment Plant During Special Test, May 19th to July. 8th,1974
9-1,4 Performance Summary for the San Pabloanitary District TreatmentPlant During Special Testing, May 19th to July 8th, 1974
9-15 Central Conth Costa Sanitary District Water Reclamation Plant -Design Data 9-34
9-16 LOwer Molonglo 'Water Quality Control Centre, Design Data 9-42
9-31
9-17 Anticipated PerfOrmance Data and Effluent Standards - BluePlains Plant .
9-18 Design Data, El 1410, Texas Wastewater Treatment Plant9-19 Initial Performance of Fine Media Denitrification Columns at
El Lago, Texas - June 4 to July 6, 1973 9-54
945

LIST OF TABLES Continued
Table NO. . Page
IP,
9-20' Initial Perfontance of Coarse Media Denitiification Columns - atEl Lago,'Texas - July 8:to August 31, 1973 9754
9-21 ,Subseqiiezit;Performance of Fine Media Denitrifieation Columns at ';'-
. - El Lago, TeXas - Olot6ber 1 through Cictober 31, 1914- . , , 97559-22 Design criteria, forllygochlonte Production Facility Sacramento.
Regional Wastewater Treatment Plant -, . 9-57 .
9-23 Capital. 04t:BreakdOWn. for Breakpoint Chlorination at tlieSacramento regional Wastewhter Treatment Plant
9724 Total Annual Cost Breakdavvii for Breakpoint Chlorination a1., - Sacramento RetAonal Wastewater Treatnient Plant
3
9 -25 , Design Criteria for Hypochlorite Production FaCility,at thMonApinery County,Facility . 9-66
9-26 Breakpoint Chlorination Design Criteria for the Monlgomery County _.
-Facility" _ 9-68;i9-27 Estimated Costi'of Breakpoint Chlorination at the Montgomery
County Plant.
9-69".9-28 Design,Criteria Selective Ion Exchange Process-for Amnioniuin
Removal at the Upper Oecoquan Plant . - 1942.
9-29 Regeneration and Regenerant Recovery System,
Design. Criteria at-,, t
the Upper Occoquan Pla4 9-.77.-- ,
9 -30. Estimated Costs of Selective IT Exchange at the Upper OiccoquanPlant I_.--------T 9-78 '
9-31 Rosemount Ion Exchange Design Criteria / 9-809-32 Design Data, Ammonia Stripping Tower at South Lake Tahoe,
5 California '. ,
9-33 Operating Costi for Ammonia Stripping for Continuous. Operation of , .
Tahoe Air Stripping Tower at 7.5 mgd9-34 "Design Data and Estimated Nitrogen Removals for All-Weather
Arhmonia Stripping at South Tahoe, California' '9-85
9-82
9-84

'1
.1111 FOREWORD
The formation of the United States Environmental Protection Agency marked a new era ofenvironmental awareness in*Crisrica. This agencY's
andare national in scOpe and
encompass broad responsibilitMjhe area of air and water pollution, solid Avastes,pesticides, and radiation. A vital part of EPA's national water pollution control effort is theconstant development and dissemination of new technology for treatment.
It is now clear that only the most effective design and operation of wastewater treatmentfacilities, using the latest available techniques, will be adequate, to meet the future waterquality objectives and to ensure protection of OE nation's waters. It is essential that thisnew technology be incorporated into the conternC,rary design of waste treatment facilitiesto achieve maximum benefit of ourpollution control expenditures. .
1 _
The purpose of this manual is to provide the ensineering community and related industrywith a new source of information to be used in the planning and design of present andfuture wastewater treatment facilities. It is recognized that there are a number of designmanuals and manuals, of standard practice, such is those published by the Water PollutionControl Federation, available in the .field that adequately describe and' interpret currentengineering practices as related to traditional plant design.lt is the intent of this manual tosupplement thiS existing body df knowledge by desCribing new treatment methods, and bydiScussini the application ,of new techniques for more effectiitly removing a broad
. spectrum of contaminants from wastewater.
Much of the information presented is based on the evaluation and operation of pilot,demonstration, and full-scaleplant& The design criteria thus generated represent typicalvalues. These values should, be used as ,a guide, -and: be .tempered with soundengineering judgment based on a complete analysis of the'specific application.
This manual is one of se'eral available throUgh the EPA Office 'of Technology Transfer todescribe recent technologicatadvances andtnew information. Future editions will be issuetfas warranted, by advancing s te-of-the-art to include new inforin'ation as it becomeavailable and to revise ileac, ptena as additional full-scaleoperational information isgenerated.

4.
CHAPTER 1.
INTRODUCTION-
1.1 Background and Purpose
Man's influence on the environment is receiving increasing public and scientific attention.The' quality of some of the nation's water bodies has been subjected to continuingdegradation as a result of man's activities. While there has been considerable success inreversing this trend, one roadblock to greater progress often has been the lack of thenecessary technology to reliably and economically .remove the pollutants which are thecause of degradation of receiving waters. While conventional technology is well developedfor removing organics from wastewater, the processes for the control of nitrogen inwastewater effluents have been developed only recently.
The beginnings of the implgmentation of nitrification on a significant scale occurred in theU.S. as late as the 1960's. The practice of nitrification was widespread in England muchearlier. The first implementatidn of full nitrogen removal was as late 'as 1969 at South LakeTahoe in California and even this installation encountered many problems. A flurry ofresearch and development activity on.the various nitrogen control methods occurred veryrecently beginning in the late 1960's and continues to date. Recent legislation and stateregulatory activities have spurred many localities into nitrogen control projects.
Nitrogen control, techniques are divided into. two broad categories. The first group ofnitrogen control processes is involved with the conversion of Organic and ammonia nitroillhoto nitrate nitrogen, a less objectionable form. These processes are termed nitrificationprocesses. The second category involves processes y,thich result in the removal 'of nitrogenfrom the wastewater, not kilt merely the conversio n? of nitrogen from one form to anotherform in the wastewater. This latter group includes biological nitrification-denitrification, ionexchange, ammonia stripping and breakpoint chlorination. _
The purpose of this'manual is the dissemination of the available data on the nitrogen controltechniques developed to date. Purther, this manual is not simply ,an assembly of data,rather,- data from a variety of sources has been scrutinized. and reasonable design criteriadrawn on the ,basis of all available, sources. Where design procedures come directly from asingle investigator, appropriate reference is made to the work.
This manual Could not have been prepared five years ago because of the state of nitrogencontrol technology at that time. It may well be that continuing research will require anUpdate of this manual in the future. Nonetheless, the body of knowledge on nitrogen controltechniques is now well developed and municipalities and local agencies have 'a firm basis uponwhich 'to plan those wastewater treatment 'facilities which require nitrogen controltechniques.
1-1
1.2 Scope of the Manual
This manual presents theoretical and process design infOrmation on a number of nitrogencontrol prOcesses. While all of the possible nitrogen 'removal processes are discussed, details
are presented only on those general methods which are most technically and economicallyfeasible, as evidenced by their actual or planned full-scale application. One exceptiori to this
is nitrogen control in oxidation ponds; material on nitrogen control in oxidation pondsystems was not included because of the paucity ofgeneially applicable design information.
Another exception is land treatment; nitrogen removal by land treatment systems is beyond
the scope of this manual.
The information in this manual was developed from the following sources: (1) theexperience of the individuals involved in the preparation of the manual, (2) the. EPAresearch, development and demonstration: -program, (3) the literature, (4) from progreSs
iWrts on on-going projects, (5) from private communication with investigators active inth,Weld, and (6) from operating personnel at existing wastewater treatment plants.
1.3 Guide to the User
A perusal of the table of contents *ill give the reader a fairly complete picture of thesubject matter contained in this manual. The following chapter-by-chapter description isoriented toward providing a general description of the contents of each Chapter.
Chapter 2, Nitrogenous Materials in the Environment and the Need fo. rControl inWdstewater Effluents, describes the sources of nitrogen-compounds entering water bodies,
the nitrogen transformations which take place in the environment, and the effects ofnitrogen compounds as pollUtants. Also givenin Chapter 2 is a general introduction,into the
various types of nitrogen control methods and their applicability to the individual chemical
farms of nitrogen. Chapter is useful for establishing the rationale for nitrogen removal.
Chapter 3, Process Chemistry and BiocheMistry of Biological Nitrification and Denitrlfica-
tion, is a presentation of the basic factors affecting the growth of nitrifying and denitrifying.)
organisms. With an understanding of these factoip on a fundamental level, the designconcepti evolved in Chapters 4 and .5 can be better appreciated. However,,should the reader
decide not to involve himself in basic theory, Chapters 4 and 5 are designed to stand bythemselves without requiring reference to Chapter 3 except when detailed explanations of
individual points are required.
Chapter 4, Biological Nitrification, presents design criteria for a wide variety of nitrification
processes. Since it has been anticipated that the greatest number of manual users will beconcerned with ammonia oxidation, 'as opposed to nitrogen removal, Chapter 4 presents
more material than any (idler chapter. Both combined carbon oxidation-nitrification andseparate stage .nitrification systems are described with details, whether given on attached
growth or suspended growth processes. The aiternative methods for pretreatment for
organic carbon removal prior to separate stage nitrification systems are presented.. Sectionsare included on aeration, pH control, and solids-liquid separation.
Chapter 5, Biological Denitrification, completes the sequence of the three chapters ortthebiological approach to nitrogen removal. Design Information is provided for both- attachedgrowth and suspended growth denitrification system& For those systems using methanol asthe carbon source for denitrification, a section is included describing the methods forchemical `handling. The increasingly popular systems using wastewater carboA sources aredescribed in detail: Chapter 5 concludes with a section on solids-liquid separation and aqualitative comparison of the alternative &nitrification techniques.'
. Chapter 6, Breakpoint Chlorination, is the first of a set of three chapters on physical-chemical techniques for nitrogen removal. Basic process chemistry is presented along with ahost of process design considerations for breakpOint chlorination applications. BeCause ofthe importance of proceSs control, details of methods are given. Information is presented onthe removal of toxic chlorine residuals.
'Chapter 7, Selective Ion Exchange for Ammonium Removal, is a presentation of the deSign. concepts involved in the use of clinoptilolite, a natural zeolite exChange material, forammonium, removal from wastewater. Ion exchange fundainentals are discussed along withclinoptilolite properties. Process loading and regeneration relationships are presented.Alternative methods of regenerant recovery are described.
Chapter 8, Air , Stripping for Ammonia Nitrogen Removal, describes the applicationrefammonia stripping to wastewater treatment. The air pollution aspects of the method arediscuSsed and general conclusions drawn. The major factors affecting &Sign and processperformance are described. The problem of equipment scaling and its :control is givendetailed consideration...Methods of removing ammonia and controlling the carbon dioxidelevels in the stripping air are:described.
Chapter 9, Total System Design, describes the concepts involved in assembling various unitproCesses into rational treatment trains that can accomplish not only nitrogen removal, butOrganics removal and phosphorus removal (where it is required). The main thrUst of Chapter9 is'to present actual examples of treatment sySten-is that incorporate the nitrogen controlprocesses described in the .previous chapters of this manual. DesignconcePts that evolved tosuit local circumstances are givelt emphasis.
CHAFFER 2
NITROGENOUS MATERIALS IN THE ENVIRONMENT AND THENEED FiaR CONTROL IN WASTEWATER EFFLUENTS
,--2.1 Introduction
Various compottnds containing the element nitrogen. are becoming increasingly important inwastewater management programs because of the many effects that nitrogenous materialS'inwastewater effluent can hpve on the environment. Nitrogen, in its various forms, can depletedissolved- oxygen leveks in receiving waters, stimulate aquatic growth, exhibit Joicicitytoward aquatic life, affect chlorine disinfection efficiency, present a public health hazard,and affect the suitability of wastewater for-reuse. BiolOgiCal and chemical processes which--,...occur in wastewater treatment plants and in the natural environment can change thechemical form in which nitrogen exists'. Such change may eliminate one deleterious; ffect ofnitrogen while producing, or leaving unchanged, r-Changed, another effect. Foexample, by convertingammonia in .raw wastewater ,to nitrate, the oxygen-dePleting and toxic effects of ammoniaare eliminated, but the biostimulatory effects may not. be changed significantly.
\It is important, therefore, prior to the detailed discussions of nitrogen removal processeswhich form the principal content of this manual, to .review the chemistry of nitrogen andthe effeCts 'that the; various compounds can have Several specific aspects are discussed in
this chapter. First, the nitrogen cycle for both surface water and soil/groundwaterenvironments is described4liffoemphasis on the important compotinds and feictionsassociated with each Second, sources of nitrogen, both natural and man-caused, arediscussed. Importan elerneritvor the latter category( include domestic and industrial
wastewater, urban aid subuthan ransoff, 'surface and subsurface agricultural drainage, andemissions to the atmosphere whith in\ay eventually enter the aquatic env' onment through
precipitation or dustfall. Then,. the effects of nitrogen discharge to surface water,groundwater, and land are summarized. And finally, introductory to t e following chap ers,
`)1a grief discussion is. presented on the relationship tween the vari s nitrogen compo d
and process removal efficiency.
2.2. The Nitrogen Cycle r/.
Nitrogen exists in -many .compounds beCause of the high number of oxidation states-it can
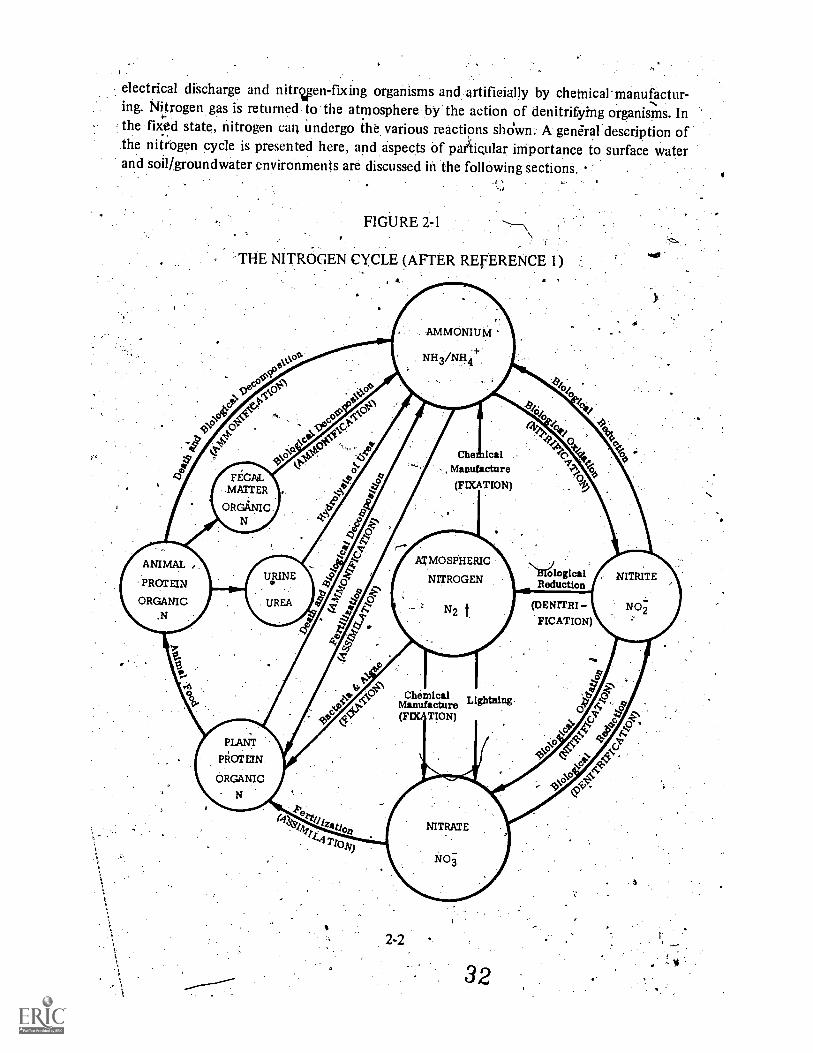
assume.' 'ammonia or organic compounds, the form most, closely associated with plantsand animals, its oxidation state is minus3:. At the other extreme its oxidation state is plus 5when in the nitrate form. In the environment, changes from one oxidation state to anothercan be brought aboAt biologicallY by living organisms. The relationship between the variouscompounds and tiairansformations which can occur are often presented schematically in adiagram knckvn as tlie nitrogen cycle. Figure 2-1 shows a common mariner of presentation. I
The atmosphere serves as a reservoir of N2 gas from which nitrogen is removed naturally by
2-1
1.
electrical diScharge and nitrven-fixing organisms and artifieially by chemical manufactur-ing. Nitrogen gas is returned to the atmosphere by the action of denitrifying organisms. Inthe fixed state, nitrogen can undergo the various reactions shOwn. A general description ofthe nitrogen cycle is presented here, and aspects of patkigular iMportance to surface waterand soil/groundwater environments are discussed in the following sections.
FIGURE 2-1
THE NITROGEN CYCLE (AFTER REVERENCE 1)
ANIMAL
PROTEIN
ORGANIC,N
FicAlMATTER
ORGANICN
URINE
UREA
PLANT
PROTEIN.
ORGANIC
N
4°
qF
II
Wization
AMMONIUM
boor .
4.04
), 0
., ,
Che ice 4 > c
Manufacture 1> ?eq io
(FIXATION)a'2
ATMOSPHERIC
NITROGEN
-" N2 t
qi/
NBiologicalReduction
ChemicalManufacture Lightning(F TION)
NITRATE
2-2
NO
32
(DENITR I
FICATION)
Yst.
NITRITE
NO2
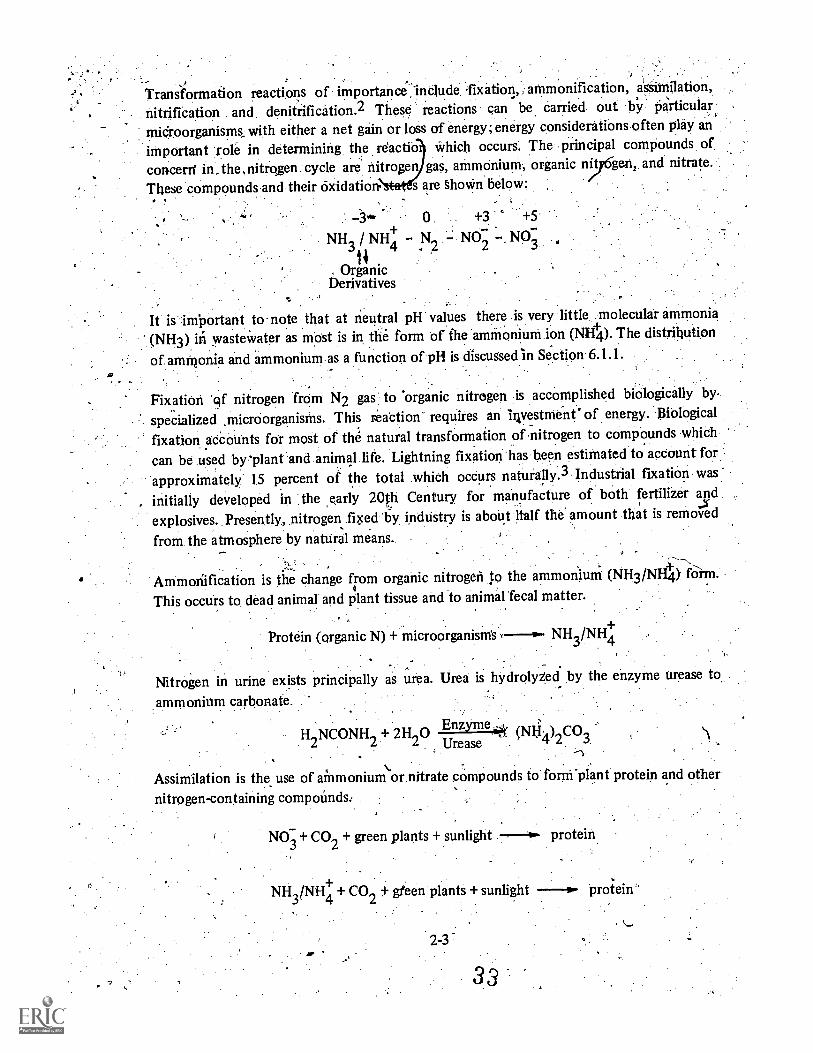
Transformation reactions of importance :include fixation, ammonification, as.similation,
nitrification and denitrification.2 These reactions can be carried. out by Particular
miCroorganisms with either a net gain or loss of energy; energy considerations often play an
important role in determining the reactio which occurs. The principal compounds of
concerti in,the,nitrogen. cycle are nitrogen gas, ammonium, organic nit gent. and nitrate.
These compounds-and their oxidation s are shown below:
0. +3 +5'+
2NH3
/ NH4N N0 NO. 2
. Orga9nicDerivatives
It is "`important to note that at neutral pH values there is very little molecular ammonia(NH3) in wastewater as most is in the form of the ammonium ion (N11+4). The distribution
of aminonia and ammonium as a function of pH is discussed in Section 6.1.1.
Fixation 'of nitrogen from N2 gas to 'organic nitrogen is accoMplished biologically by
specialized ,microorganisms. This reaction requires an investment' of energy. Biological
fixation accounts for most of the natural transformation of nitrogen to compounds which
can be used by'plant and animal life. Lightning fixation has been estimated to account for
approximately 15 percent of the total which occurs naturally.3 Industrial fixation was
, initially developed in the early 20th Century for manufacture of both fertiliier and
explosives. Presently, nitrogen fixed by industry is about ltalf the amount that is removed
from the atmosphere by natural means.
Ammoriification is the change from organic nitrogen to the ammonium (NH3/NH4) form.
This occurs to, dead animal and plant tissue and to animal' fecal matter.
Protein (organic N) + microorganism's --g-- NH3/NH+
Nitrogen in urine exists principally as urea. Urea is hydrolyZed by the enzyme urease to.
ammonium carbonate.
H2NCONH
2+ 2H
20 Enzyme,,,. (Nti4
2Urease 3
.. . .
Assimilation is the use of ammoniumor. nitrate cOmpounds to forni-plant protein and other.
nitrogen-containing compoUnds:
NO3
+ CO2+ green plants + sunlight protein
NH / H4 + CO2 -,1- gfeen plants + sunlight protein"
2-3AP
7 3 3
Animals require protein froni plants or from other animals. With certain specific exceptions,they are incapable Qf converting inorganic nitrogen, forms into organic forms.
The term "nitrification" is applied to the biological oxidation of ammonium, first to thenitrite, then to the nitrate, form. The bacteria responsible for tJies reactio are termed'chemoautotrophic because they use inorganic chemicals as their sou of ene . Generally,the Nitrosomonas genera are involved-in conversion of ammonium to ru e under aerobiccOnditions as follows:
2NH+4 + 3O2 bacteria2NO
2 + 4H + 2112 0
The nitrites are in turn oxidized to nitrate generally by Nitrobacter according to thefollowing reaction:
baca2N0+ teri2NO3
The overall nitrification reaction is as follows:
NH4 + NO3+ 2N ++ H2O
'To oxidize 1 mg/I of ammonia:nitrogen requires about 4.6 mg/1 of oxygen when synthesis ofnitrifiers is neglected. The nitrate thus formed malt' be used in assimilation as describedabove to promote plant growth, or it may be us in denitrification, wherein throughbiological reduction, first nitrite and then nitrogen gas are formed. A fairly broad range ofbacteria can accomplish denitrification, including nuedomonas, Micrococcus, Achromo-bacter, and Bacillus. In simplified form, the reaction steps are as follows:
+ 0.33 CH3OH IP- NO2 + 0.33 CO2 -+ 0.671120
(organic carbonsource)
02 + 0.5 CH3OH Q.5 N2 + 0.5-H20 + + 0.5 CO2
(organic carbonsource)
Here methanol is used as the example organic carbon source, although many natural andsynthetic organic compounds can serve as the carbon source for denitrification.
2-4
3.4
Oxidation of organic matter to carbon dioxide and water furnishes energyfor bacteria.Either oxygen or nitrate may be used for the oxidation,,but the use of oxygen results in therelease Of more energy. When both oxygen and nitrate are present, bacteria preferentiallyuse oxygen. TherefOre, use of nitrate for denitrification can only occur Under anoxicconditions, an important consideration when attempting to remove nitrate from wastewater.
B
Nitrite, since it.is an intermediate in the nitrification and denitrification processes, can linkthe nitrification and denitrification steps directly without passing through nitrate.. First,nitrite i0 formed' from oxidation of ammonium by Nitrosomonas,., then nitrite can be
denitrified to nitrogen gas. By this route less oxygen is required for nitrification and less
organic matter (energy) is required for denitrification. This is a special case, however, and
not broadly applicable to municipal wastewater treatment. .-
In discussing the nitrogen cycle, it is useful to differentiate, between the surface Water andi'ediment environment and'the soil/groundwater environment. This aids in understanding theroles° ,that nitrogenous compounds play in each and the problems which can be,encountered.
2.2.1 The Nitrogen Cycle in,Surface Waters and Sediments
A modified representation of the nitrogen cycle applicable .to t urface water environment
is presegited in Figure 2-2.4 Nitrogen can be added by precipitation and dustfall, surfacerunoff; subsurface groundwater entry, and direct discharge 'of wastewater effluent. Inaddition, nitrogen from the atmosphere can be fixed by certain photosynthetic blue-green
algae and some bacterial species.
Within the aquatic environment ammonification, nitrification, assimilation, and denitrifica-
tion can occur as shown in Figure 2-2. Ammonification of organic Ynatter is carried out by. `-microorganisms. The ammonium thus formed, along With, nitrate, can be assimilated byalgae and equatioplants; such growths may. create water qUality problems.
Nitrifieition of ammonium can occur with a resulting depletion of the dissolved oxygen'
content of the water. To oxidize 1.0' ing/1 of ammonia-nitrogen, 4.6 mg/1 .of oxygen is
required.
kDenitrification produces nitrogen gas which may escape to the atmosphere. Because anoxicvconditions are required, the oxygen-deficient hypolimnion (or lower layer) of lakes and the
sediment zone of streams and lakes are important zones of denitrification action.4
2.2.2 The Nitrogen Cycle in Soil and GroundWater.
Figure 2-3 shows the major aspects of the nitrogen cycle associated with the soil/ground-,,,,water environment.5 Nitrogen can enter the soil from wastewater or wastewater effluent,artificial fertilizers, plant and animal matter, precipitation, and dustfall. In addition,
2-5
35
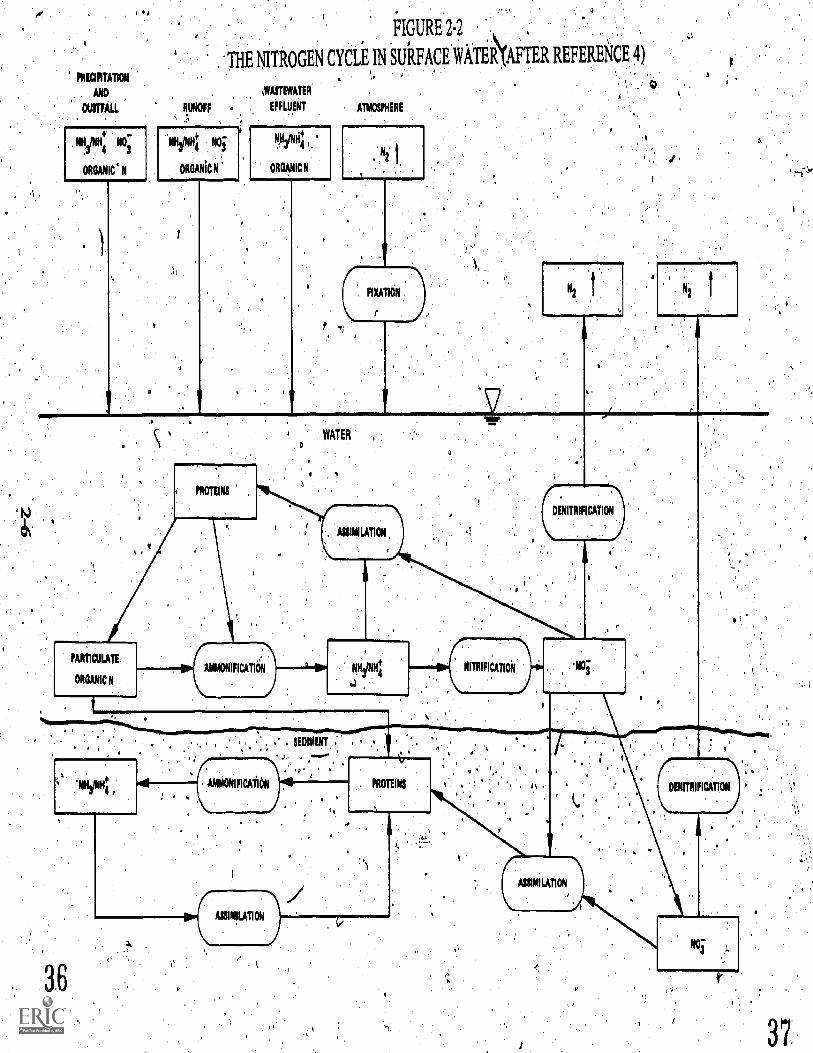
FIGURE 2.2
THE NITROGEN CYCLE IN SUIZFACE.WATRAFTER REFERENCE 4)PRECIPITATION
AND .WASTEWATER
DUITFALL RUNOFF EFFLUENT ATMOSPHERE
14.3.
ORGANIC N
NY4R+4
ORGANIC N
FIXATION
WATER
36
AMMONIFICAilON
ASSIMILATION
PROTEINS
37
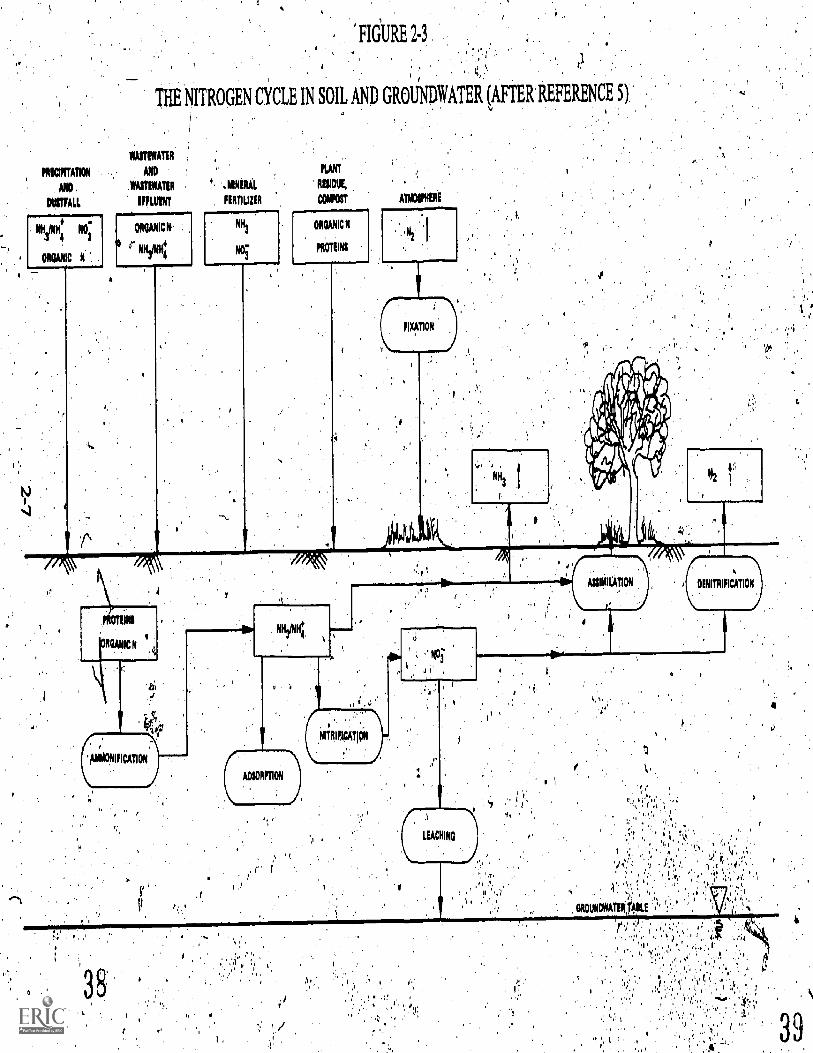
FIGURE 2.3
0
FRICIPITATION
MO
DUETFALL
NII30014 NO
ORGANIC N
THE NITROGEN CYCLE IN SOIL AND GROUNDWATER (AFTER REFERENCE 5)
YIAITEIV ATER
AND FLINT
IMAXMATIR AINIRAL AMOK,
EFFLUENT FERTILIZER COINOST=,.OHMIC N. NHI
° NYM+4 NO3
DENITRIFICATION
J

.....nitrogOn-Axink bacteria GO rt nitrOgen gas into forms avilable to plant life: Man has p,
Increasedthe amount of nitr gen fixed biologically by cultivation of. legUminous crops (6.g.; ."....1?Pas, . and ;beans). It is estimated, that nitroge, -'fixed by legumes n4y41:' accounts forapprOjciMately.25 percent of the total fixed.3 .' '.
more than 90 perbent.of the nitrogen present in soil is organic, either in living plants',and animals or in humus originating from decomPbsition of plant and animal residues. -Mostof the renfainder is ammonium (NH4), which is tightly bound to soil particles. '
in many areaL.1;lenitrification, which is the dominating reaction below the aerobic top layer .'
... .,.
The'nftrate convent is generally low due to assimilation by plant roots and 'leaching by inter, ...- ...PercolainethroUgh the soil. Nitrate pollution is the principal groundwater quality prObIein
Of soil, Farely. removes: all nitrates adde51,to the soil from fertilizers or wastewater effluentsThus,, most qf .th,e nitragek;which is not assimilated-by plant growth eventually enters the
. groundwater in the;nitrate form.
2.'3 Soitrces of Nitrogell.
Nitrogenous Materials inay.enter the 'aquatic environment,ftoin7etther natural.Or,inaP7caUsedsources. Further; the :quantities from natural sources'are.afteniticread by :inarei';aCtivity.For example, while SoMe'-nitrogen may be expected in rainfall, the $onxbus,tiOhof fossilfuels or the application olliquid ammonia agricultural fertilizers with subse4itent release tothe air through volatilization can increase rainfall concentrations of nitrogen substantially. Itis 'useful to have an ,understanding of the various sources of nitrogenous Materiagand tohave an appreciation of the quantities of nitrogen which may be expected-from
Although: the source of nitrogen causing a specific pollution problem is':ote.difficUlty,,may be encountered in determining which:, of several possible sources is muSl..importailt.' As an example, if a stream with excessive aquatic growths due16:mtrOtenreceives effluent from a sewage treatment plant, drainage from fertilized cropland;' andrunoff ftom pastures or tedlots, the contribution of nitiogen from the treatment plant maybe a small fraction of that from the other two sources. Thus, in analyzing a nitrogenpollution problem, care must be taken tp.ensure that ;all possible ources are investigatedand that tl amount to be expected from each is : accurately estimated. Once aneslimate is,
'made,' nitrogen control measures can be oriented toward the more significant sources.,,
2.3 1 Sources
,. .. ...!, .:.rWsopfces ',of nitidgenpuS substances include precipitation; dustfall, nonuiban runoff,'...':., .
.,) ,..,...d. biolOgiCal fixation: Amounts froin all may be increased in some way by man: It maybe .7
quite difficult-to determine 'q4ntities which Might be expected under:,conipletely natural.,: ,
conditions. , . ..-.:,.
lb Order. to find levels. of .nitrogenous substances in Precipitation ; which are as close to .
... .
'r..,"natural" as possible; it is necessary to take samples far flit.' uiban_ot agriculturahitreas... .

Even these values may be suspect, however. In one review of nutrient levels in precipitation,total nitrogen in rainfall in Sweden was cited as 0.2 mg/1.6 The average concentration ofnitrogen in western snow samplek mainly in the Sierra Nevada Mountains, was 0.15 ppm ofammonia-nitrogen, 0.01 ppm of pitrite-nitrogen and 0.02 ppm of nitrate-nitrogen. Howrepresentative such values are of "natural ":conditions cannot be determined with any
' certaMtye ;... '-',.` .
The quantitipa of nilicigen in nonurban runoff froth min-fertilized land may be expected tovary greatly.;:i depending -On the erosive characteristics. of the ,soil. One study found that-.runoff from retreated land in Washington contained 0.13 mg/1 of nitrate-nitrogen and 0.20
- ing/1 of fOtainitrogen..7 .,. .
, . .
Biologicaltlication may add nitrogen to both soil and . surface water environments. Ofparticular interest is the role of fixation in .eutrophication of lakes. Certain photosyntheticblue-green al0e, such .'as the species ,of,Nostoc, Anabaena, Gleotrichia and Calothrix, arecommon nifxoge,n fixers..
As much as 14 percent 21 the total:nitrogen entering eutrophic Lake Mendota, Wisconsin;'A
was added by fixati0.4 'The, role '6f nitrogenk-fixatiun in oligotrophic lakes has not been
established.
23.2 Man-caused Sources
The activities of man :inay increase - quantities Of nitrogen added to the aquaticenvironment from three' of the sources discussed above: precipitation, duitfall, andnonurban runoff. These Sources are increased principally by fertilization of agricultural land; ..and the combustion of fossil fuels.
"Other man-related sources include runoff from urban areasiand livestock feedlots, municipd1
wastewater effluents, subsurface drainage from agricultural lands and from, septic tank leach,fieldg, and industriatwastewater,s.
. , .
,. .,V : -)':.
in are, .
Nitrogen concentrations n raw municipal wastewaters e mell documented:4,8,9 Valuesgenerally range from 15. to 50 mg/I, of which apProxithatOly 60 percent..is ammonia-nitrogen, 40 percent is organic nitrogen, and a negligible amount (onifiercent).*nitrite- andnitrate-nitrogen. Ufiless wastewater . treatmel- facilities' are . designed to remove nitrogenspecifiCally,. most .,will paks..tlieolig,h the treatlient :Works to the receiving waters or land
g An estimate' for the 10ta,l amount pf nitrogen discharged into sewerage systemsin- : domestic Waileviateris 0.84 million metfictops- per Year in the UnitedStates.9
-4:
Nitrogen discharged into individual septic tank 'systems can also create pollution problerns.It has been stimated that up to percent of the national population utilizessystems,9 contributing up to 0.23 million metric tons of nitrogen annually. In awell-operating septic tank system, most of the nitrogen leaving tlresiank will be converted tonitrate in the leaching field. This may then percOlaie downwafd to a grounciwpter table.
Problems from high .nitrate concentrations occasionally, occur when septic tank. waste .
dispOsal is located near Shallow 'Wells used for water supply, particularly on the fringes... of. urban areas where the pOpulation densitij may be fairly high.
The nitrogen content of industrial wages varies dramatically from one,industry to the next.Among those industries whose wastewater !nitrogen,...Contents may be quite high are meatprocessing plants, milk processing plants,' petroleum refineries, ice plants, fertilizer.:,,,,manufacturers, certain synthetic fiber plants, and industries using ammoniafor scouring andcleaning operations.4 fr
t:t
Feedlot runoff constitutes a source of nitrogen which has become significant as 'a result ofthe increased number of concentrated, centralized feedlots. Ammonium is a- major,constituent of feedlot waste as a result of urea hydrolysiSt Ammonia-nitrogen concentra-tions may reach 300 mo48 ,10, and organic nitrogen concentrations of up to 600 mg/1have been reported.8,10 The. total annual nitrogen 194:from livestock in the U.S. isestimated to be 6.0-million metric tons.4 While the majOr.4,,:i,t.:4 animals are apparentlystill raised on small farms, the, trend toward feedlot dperatiOris ie:continuing, and'unlesssteps are taken to prevent drainage. and runoff, serious loalized problems can occur.
t
Urban runoff can contribute significant quantities of nitrogen to receiving waters during andafter pericids of precipitation. Average concentrations which have been reported are 2.7 mg/1total nitrogen in Cincinnati,' 1 2.1 mg/1 total nitrogen in Washington, D.C.,12 2.5 mg/1 totalnitrogen in Ann Arbor, Michigan,13 and 0.85 ..mg9!1 organic nitrogen in Tulsa, Oklahoma: l4Sanitary or combined sewer overflows can als6 add: to the nitrogen load.
,
The use of artificial fertilizers has increased' :the nitrogen concentrations which can'' expected in nonurban runoff. in rural Ohio, runoff from a 1.45 acrefiefd planted in winter
wheat contained an average of 9 mg/1 total nitrogen.15 For agricultUral land in Washington,'the nitrate-nitrogen concentration was 1.25 mg/1.7 On a 75-acre site in North Carolinawhich consisted of graSsed pasture, wooded pasture, corn field, and orchard, the meannitrogee6anceptration in the runoff was 1.2 mg/1.16
Sul sUrfac,Ordgation drainages from fertilized cropland can contain::;) igh concentrations of;Orates.,, ,agricultural areas of California's San Joaquin Valley, Monitoring of subsurfacethe tiaiirale systems between 1966 and 1968 showed average nitrate-nitrogen concentra-tions of 19.3 mg/1.17
In the same way that increased nitrogen concentrations in nonurban runoff and subsurfacedrain4e have been caused by man's activities, increased nitrogen. levels in precipitation anddustfall have also resulted. For example, high ammonium concentrations in spring rains inCalifornia are due to the use of liquid ammonium, fertilizers there.6 Most atmosphericnitrogen (other, than nitrogen Ras), however, is,..assoc9ted with soil picked up by the windand can. be redifned to earth by gravitational selfling (dry fallout) or in precipitation, andseveral studies have been Conducted to .determine the quantities to be expected froin such
o .2-10
42.1*. 2
sources. The 10-yeat average' of .arritnenia=" p,lqs:filtiaielnitrogeri concentrations in rainfall at
Geneva, New Yorki, Was 1::1 Mg/t.6":Sndcv samples from -Ottawa, Canada, over 17 years
' contained' an average of P ganiC nitrogen.6 Rainwater from the same area forthe same period had1":Conbeiltrations of 1.8 mg/I ammonia - nitrogen and -0.35 mg/Initratenitrogen. In rainfall-measurements at Cincinnati, Ohio, total and inorganic nitrogen
,concentrations'. were 1.27 and 0.69 mg/1, respectively.15 For a rural area near Coshocton,
: Ohio, the respective concentrations were 1.17 and 0.80 mg/1.15
A study made near 'Hamilton, Ontario,' was cited6 which 'related dustfall to rainfall. It wasfound that the nitrogen fall totaled 5.8 lb 'per acre per year Approximately 61 percent ofthe nitrogen cameldown on rainy days, which constituted 25 percent of-the days. monitoredddring the test.
In a study on dustfall, in Seattle18 the fall rate for soluble nitrate-nitrogen was,0.63 lb peracre per year. The Concentration of nitrate-nitrogen in the total dustfall was 700 ppm.
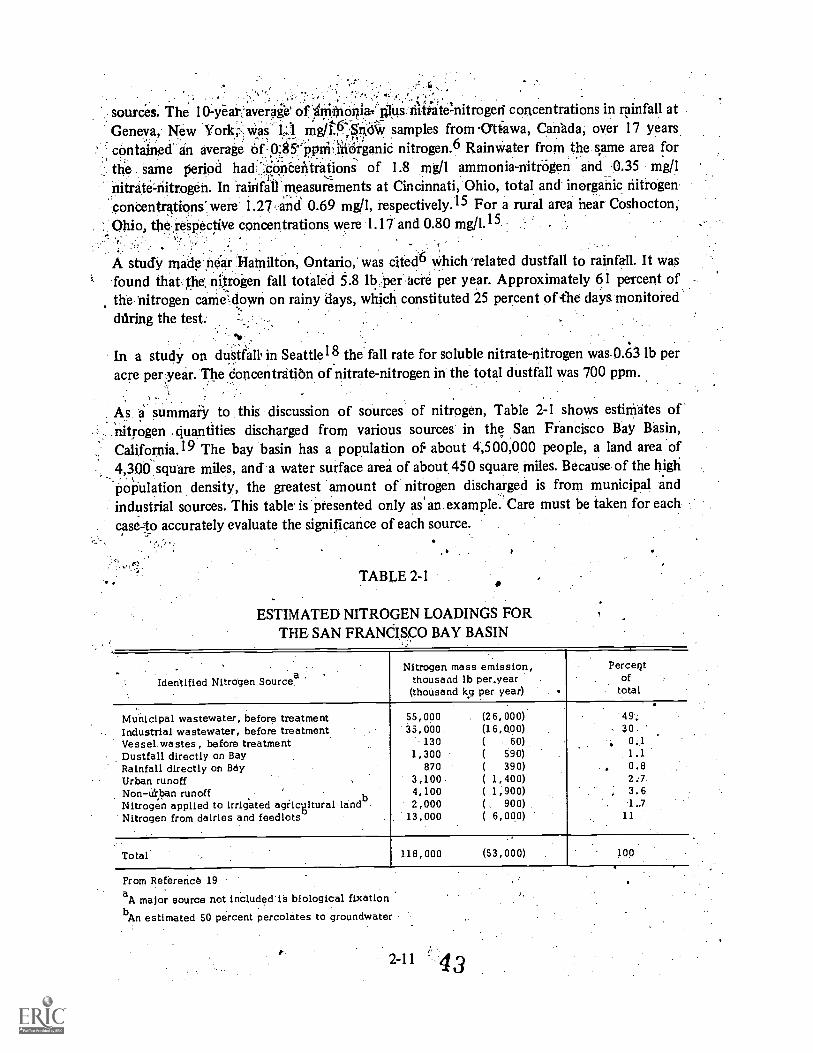
As a summary to this discussion of sources of nitrogen, Table 2 -I shows estimates ofnitrogen .quantities discharged from various sources in the San Francisco Bay Basin,California.19 The bay basin has a population o1 about 4,500,000 people, a land area of4,300square miles, and a water surface area of about 450 square, miles. Because of the highpopulation density, the greatest amount of nitrogen discharged is from municipal andindustrial sources. This table is presented only as'an example. Care must be taken for eachcase-Ito accurately evaluate the significance of each source.
TABLE 2-1
ESTIMATED NITROGEN LOADINGS FORTHE SAN FRANCISCO BAY BASIN
Identified Nitrogen SourceaNitrogen mass emission,
thousand lb per.year(thousand kg per year)
PerceQtof
total
Municipal wastewater, before treatmentIndustrial wastewater, before treatment
55,00035,000
(26,000)(16,Q00)
49;30.
Vessel wastes , before treatment 130 ( 60) , 0.1Dustfall directly on Bay 1,300 ( 590) 1.1Rainfall directly on By 870 ( 390) 0.8Urban runoff 3,100 (1,400) 2:7.Non-itban runoff 4,100 ( 1,900) 3.6Nitrogen applied to irrigated agiicgltural landb 2,000 ( . 900) 1..7Nitrogen from dairies and feedlots 13,000 ( 6,000) 11
Total. 118,000 (53,000) 100
From Reference 19a A major source not included'is biological fixationbAn estimated 50 percent percolates to groundwater
p2-11 43

2.4 Effects of Nitrogen Discharge
It. was previously noted that nitrogenous compounds discharged from wastewater treatmentfacilities can have, several deleterious effects. Although biostimulation of receiving watershas generated the most concern in recent years, other less well publicized impacts can be ofmajor importance in particular situations. These impacts include toxicity to fish 'life,reduction of chlorine disinfection efficiency, an increase in the dissolved oxygen depletionin receiving waters, adverse public health effects principally in groundwater, and areduction in the suitability for -reuse.
2.4.1 Biostimulation of Surface Watersro
A major problem in the field orwater pollution is eutrophication, excessive' plant growthand/or algae "blooms" resulting from over-fertilization of rivers, lakes, and estuaries. Resultsof eutrophication include deterioration in the appearante of previously clear waters, odorproblems from decomposing algae, and a lower dissolved oxygen leyel which can adverselyaffect fish life.
Four basic factors are required for algal growth: nitrogen, phosphorus, clrbon dioxide, andlight energy. The absence of any one will limit growth. .In special cases, trace micronutrientssuch ys cobalt, iron, molybdenum and manganese may be limiting factors under naturalcoOditions.
Good generalizations concerning which factor is growth limiting and at what concentrationare 'difficult to make. Light and carbon dioxide are essentially impossible to control. Bothnitrogen- and phosphorus are pre4ent in waste discharges and hence subject to control. Thequestions which must usually be answered when faced with a eutrophication problem are: isnitrogen or phosphorus (or neither) the limiting nutrient, 'and if either one is, can theamount entering the receiving water be siknificantly reduced by removing that nutrient fromthe waste stream? In some cases algal assay procedures may allow a conclusion as to whichnutrient is limiting. Under some circumstances, however, removal of both nitrogen andphosphorus may be undertaken to limit algal growth.
Eutrophication is. of 'most concern in lakes because nutrients which enter tend to be .recycled within the lake and build up over a period of time.9 A river, by contrast; is aflowing system. Nutrients are' always entering or leaving any given section. Accumulationstend to occur only in sediment or in slack water; and the effects of these accumulations arenormally moderated by periodic flushing by floods:
In' estuaries and oceans, nitrogen -compounds are often present in very low concentrationsand may limit the total biomass and ther,types of species it contains.9 Thus, upwelling,which brings nutrient-rich waterstto, the surface, may result in periodic blooms of algae..prother aquatic life. While in some estuaries discharges from wastewater treatment plants mayincrease nitrogen concentrations to the level where blooms occur, the high dilution 'provided
2-12 44

by a direct ocean discharge probably eliminates the danger of algae blooms caused by such
discharges. In summary, while nitrogen in wastewater treatment plant -eflluents can in
particular cases cause, undesirable aquatic gowths, determination Of the linliting constituent
and other sources of that constituent (such as feedlot runoff or fixation) should be made
before the decision is made to require nitrogen removal from municipal wastewaters.
2.4.2 Toxicity
The principal toxicity problem is from ammonia in the molecular form (NH3) which can
adversely affect fish, life in receiving waters, A slight increase in pH may cause a great
increase in toxicity as the ammonium ion (NH4) is transformed to ammonia in accordance
with the following equation.
+NH4
+ OH ...-=1" NH + 03 2
.Factors which may increase ammonia 'toxicity at a' given pH are: greater concentrations of
dissolved .oxygen and carbon dioxide; elevated temperatures; and bicarbonate alkalinity.9
Reported levels at which acute toxicity is detectable have, ranged from 0.01 mg/19 to over
2.0 mg/12° of molecular ammonia-nitrogen.
2.4.3 Effect on Disinfection Efficiency
When chlorine, in the form of chlorine gas or hypochlorite salt, is added to wastewater
containing ammonium, chloratnines, which are less effective disinfectants, are formed:.The
major reactions are as follows:
NH4 2+ HOC1 NH Cl (monochloramine) + H2O + H÷
NH2C1 + HOC1 NHC12 (dichloramin ) '+ H2O
NHC12+ HoC1 IIC1
3(nitrogen ttichloride) H2O
Only after the addition of large quantities of chlorine does free available chlorine exist. If
the effluent ammonia-nitrogen concentration were 20 mg/1, about" 200 mg/1 of chlorine
would be required to complete 'ie reactions vtth ammonium and organic compounds. Only
rarely in wastewater treatment is this level of chlorine 'addition ("breakpoint" chlorination)
used Therefore, s a practical matter, the less effective combined chlOrine residuals
(monochloramine nd dichloramine) must be relied upon' for disinfection.. This results' in
increased chlorin dose requirements for the same level of disinfection. Further information
on the relative effectiveness of free chlorine and combined residuals is presented in Section
6.2.7.
2-1345
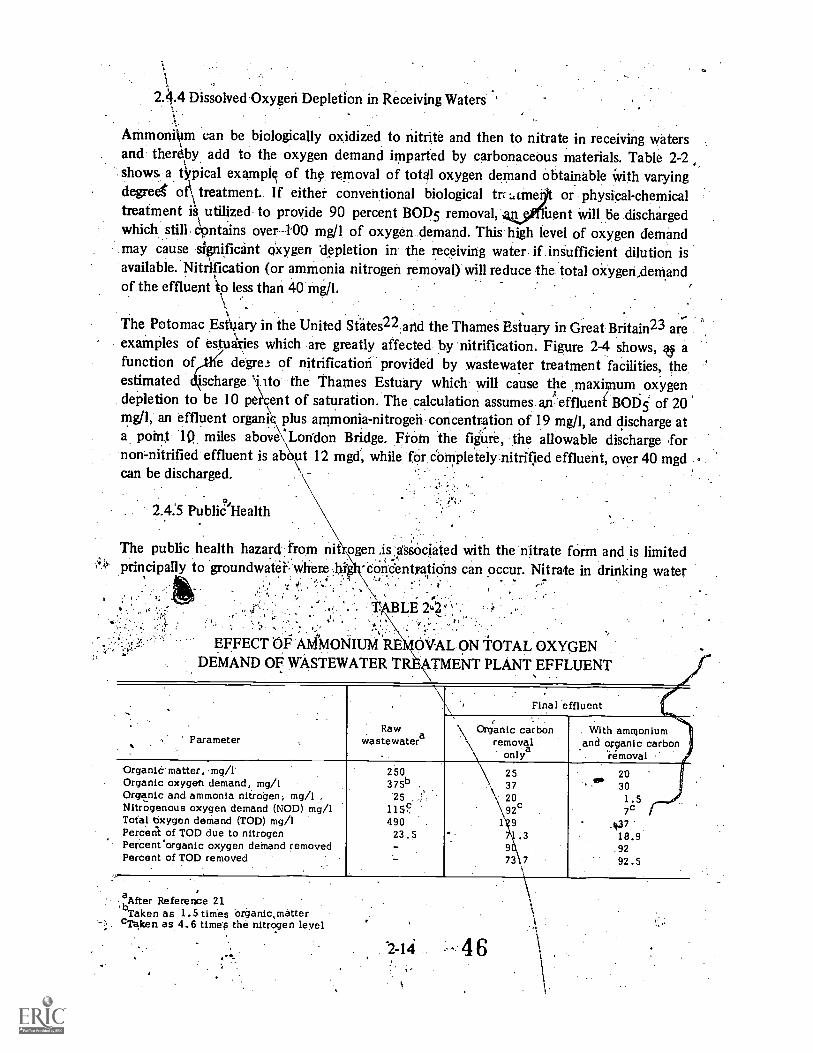
2.4.4 Dissolved Oxygen Depletion in Receiving Waters
Ainmonim can be biologically oxidized to nitrite and then to nitrate in receiving watersand ther6by add to the oxygen demand imparted by carbonaceOus materials. Table 2-2shows a typical example of the, removal of total oxygen demand Obtainable with varyingdeged of\ treatment.. If either conventional biological tr :ame or physical-chemicaltreatment is utilized. to proyide 90 percent BOD5 removal, bent will lie .dischargedwhich still. cpntains over--100 mg/1 of oxygen demand. This high level of oxygen demandmay cause significant oxygen 'depletion in the receiving water if insufficient dilution is
,
available. Nitrification (or ammonia nitrogen removal) will reduce the total oxygeridemandof the effluent io less than 40 ing/I.
\,.
The Potomac Estary in the United States22.arid the Thames Estuary in Great Britainzi areexamples of estuaries which are greatly affected by nitrification. Figure 2-4 shows, qj afunction of e( degre! of nitrification provided by wastewater treatment facilities, theestimated *scharge Vto the Thames Estuary which will cause the maximum oxygendepletion to be 10 peicent of saturation. The calculation assumes an effluent BOEis. of 20mg/1, an effluent organ plus ammonia-nitrogen concentration of 19 mg/1, and discharge ata point .1(1, miles abovecLondon Bridge. From the figure, the allowable discharge fornon nitrified effluent is ab6u\ t 12 mgd, while 'Or donipletelyInitrified effluent, over 40 mgdcan be discharged. \-.
2.4:5 PubliC'Health
The public health hazard from nit ogen :is Asociated with the nitrate fOrm and is limitedprincipally to groundwatef, where . 'concentyatiobs can occur. Nitrate in drinking water
BLE
EFFECT OF AMMONIUM RE \OVAL.ON TOTAL OXYGENDEMAND OF WASTEWATER TRETMENT PLANT EFFLUENT
ParameterRaw
wastewatera
Final effluent
\ Organic carbonremoval.
only
. With ammoniumand organic carbon
removalOrgani& matter, mg/lOrganic oxygen demand, mg/IOrganic and ammonia nitrogen; mg /1Nitrogenous oxygen demand (NOD) mg /1Total oxygen demand (TOD) 'mg/1Percent of TOD due to nitrogenPercent'organic oxygen dethand removedPercent of TOD removed
250375b
25115.490
23.5
25
92020
1'29
9
7317
aAfter Reference 21,bTaken as 1.5 times onganic,mattercraken as 4.6 time's the nitrogen level
2 -14 46
2041. 30
701.5
-0718.99292.5

was first associated in 1.945 with methemoglobinemia, a sometimes. fatal blood disorderwhich. affects infantsiess than three months old. When water high in niti-te is used forpreparing infant forMulas,- nitrate is reduced to nitrite in the stomach after ingestion. Thenitrites react with hefnoglobin in the blood to form' methenioglobin, which is incapable of R.
carrying Qxygen. The result is suffocation accompanied by% bluish tinge to the skin, which:accounts for the use of the term ``blue babies" in conjunction with methemoglobinemia. In:,.suspect .areas water should be analyzed for both nitrite and nitrate since either fOrm.i,ini.cause methemoglobinemia.
FIGURE 2-4
ALLOWOLE EFFLUENT DISCHARGE INTO -THE THAMES ESTUARY .
.,
2w
20u_wwcoQ .
o 10
(AFTER REFERENCE 23)
BOD5 OF WASTEWATER EFFLUENT : 20 mg/1POINT OF DISCHARGE : I 0 MILESABOVE LONDON BRIDGE
MAXIMUM OXYGEN DEPLETION:10 PERCENT OF SATURATION
25 50 75 100
PERCENT NITRIFICATIONOF WASTEWATER EFFLUENT
2-1547
v.

Since 1945 about 2,000 cases of methemoglobinemia have been reported in the U.S. anEurope, with, a mortality rate of seyen to eight percent. Because of.difficulty in diagnosingthe disease and because do reporting is required, the actual incidence may be many timeshigher. l0
The EPA's interim primary drinking water standard (40 CFRPart 141) for nitrate is 10 mg/1as nitrogen. This standard is exceeded most often in shallow wells in rural areas.
;.4.6 Water Reuse
While direct wastewater reuse for domestic water supply is not yet a reality because ofpublic health considerations, plans for industrial reuse are being carried out in several areas.When reclaiming wastewater for industrial purposes, ammonia may need to be removed inorder to prevent corrosion. Further, nitrogen compounds can cause bjostimulation incooling towers and distribution structures.
2.5 Treatment. Processes for Nitrogen Removal
In the past several years th'e number of processes Autilized in wastewater treatment has'increased rapidly. Many of these,processes have been'developed with the specific purpose oftransforming nitrogen compounds or removing nitrogen from the wastewater stream. Others:
;can remove several compounds, including significant amounts of nitrogen. Still others may.remove only a small amount of nitrogen or a particular form of nitrogen which is a smallfaction of the total.
In determining which, method is most suitable for a particular application, considerationmust be given to six principal aspects: (1) form and concentration of nitrogen compounds inthe process influent, (2)(iequked effluent quality, (3) other treatment processes to beemployed, (4) cost, (5) reliability, and (6) flexibility. Great care must be taken indeveloping and .evaluating alternatives.
"Presented below are brief descriptions of the various ,processes. employed in wastewatertreatment' facilities which, to varying. degree4,;,remoti;nitiogen. the caste stream.Process characteristics, compound ieleetkiiy,,mid iordai ran& of .effigepcy are presented.It is stressed that this discussion is descriptive and is intended Orikk'l,toiipivide an
4 introduction to the following chapters: of this manual. 4vi,74.1"
2.5.1 Conventional Treatment Processes
Nitrogen in raw domestic wastewaters is princip51,1yin 'the formsoluble and particulate, and ammonia. The `soluble organic nitrogen 6urea and amino acids. Primary sedimentation acts to .re (pie a portilorganic matter., This generally will amount to less than percententering the plant. .
2-16
48
dotal nitro en
othran of
articulate
Biological treatment will remove more particulate organic nitrogen and transform, some totunmonitim and other inorganic forms. A fraction of the ammonium present in the wastewill be assimilated into organic materials of cells formed by: the biological process. Solubleorganic nitrogen is ,partially transformed to ammonium by microorganisms, but concentra-tions of 1 to 3 mg/I are usually found in biological treatment effluents.24 Through theseprocesses, an additional 10 to 20 percent of the total nitrogen is removed when biologicaltreatment 'and secondary sedimentation follows primary sedimentation. Thus, total nitrogen.'removal for a conventional primary-secondary facility will generally be less than abou30percent.
2.5.2 Advanced Wastewater Treatment Processes
Advanced treatment processes designed to remove wastewater constituents -other thannitrogen often remove some nitrogen compounds as well Removal is often restricted toparticulate forms, and overall removal efficiency is rarely high.
Tertiary filtration can remove a significant fraction of the organic nitrogen prent. Overallremoval depends n the amount of nitrogen m the suspended organic form. As' ted above,most of the organic nitrogen in secondary effluent is insoluble, but ammonium usuallyaccounts for the majority of the total nitrogen. Carbon adsorption, used to 'remove residual
; organics, will also remove Organic nitrogen. The amount of organic nitrogen remaining:atthat point in the', treatment scheme will generally be quite small.
Electrodialysis and reverse osmosis ate to p,FOCesses used primarily for reduction oftotal dissohied solids. Nitrogen entering suchlitiiems is mainly in the ammonium, or nitrateform. Electrodialysis can be expected to remove about 40 percent of these fOtms; reverseosnosis, 80 percent. However, these, processes are not currently in use for treatment ofmunicipal wastewater.
Chemical coagulation, often utilized for phosphate removal, also aids in refnoval ofparticulate matter, including particulate organic nitrogen.; While chemical coagulation doesnot remove ammonium directly, lime addition is Used prior to ammonia stripping (discussedin Section: 2.5.3.4) in order to raise the pH and allow the process to proceed.
Land diSposal ina)i be used to remove nitrogen. Re7moval occurs when the effluent is usedfor irrigation APurpOses., with the nitrogen assimilated by growing crops which aresubsequently harvested. However, nitrogen removal by land treatment systems is not withinthe.scOpe 96ins manual.
2.5.3 Major NitrOgen Removal Processes
T-he major processes considered in this manual are nitrification-denitrification, breakpointchlorination (or superchlorination), selective ion exchange for ammonium removal, and air

stripp g for ammonia removal (ammonia strippin'g). These are the processes which aretechni y and economically most viable at the proent time
3.1.Biological Nitrification:Denitrification
Biological nitrifibation does not increase the removal of nitrogen from the waste stream overthat achieved by conventional biological treatment. The principal effect of the nitrificationtreatment process is to transfOrm amnionie-nitrogen to nitrate. The nitrified effluent can .-
then be denitrified biologically. Nitrification is also used without subsequent biologicaldenitrification, when treatment requirements call for 'oxidation of ammonia- nitrogen.Oxidation of ammonium can be as high as 98 percent. Overall transformation to nitt4depends on the extent to which organic nitrogen is transformed to ammonia-nitrogen in'thesecondary stage or 'is removed' by another process.' Nitrification can be carried out-inconjunction with secondary treatment or in a tertiary Stage; in both cases, either suspendedgrowth reactors (activated sludge) or attached growth reactors (such as trickling.filters) canbe used.
Biological denitrification can also be carried out in ,either suspended growth or attachedgrowth reactors. As previously noted, an anoxic environment is required for the reactions toproceed. Overall removal efficiency in a nitrification-denitrificatiOn Plant can range from 70to 95 percent.
2.5.3.2 Breakpoint Chlorination
Breakpoint chlorination (or superclilorination) is accomplished by the addition of chlorineto the waste stream in an amount sufficient to oxidize ammonia- nitrogen to nitrogen gas.After sufficient chlorine is added to oxidize, the organic matter and other readily oxidizablesubstances present, a stepwise reaction of chlorine with ammonium .takes place. The overalltheoretical reaction is as follows:
3C1 + 2NH+ N2
+ 6HC1 + 2H+4 .
In practice, approximately 10 mg/1, of chlorine is required for every. 1 mg/1 ofammonia-nitrogen. In addition, acidity produced by the reaction must be neutralized by theaddition of caustic soda or lime. These chemicals add greatly to the total dissolved solids andresult in a substantial operating expense. Often declilorination is utilized followingbreakpoint chlorination in order to reduce the toxicity of the chlorine residual in theeffluent.
An important advantage of big method is that ammonia-nitrogen concentrations can bereduced tojlear zero in the effluent The effect of ,breakpoint, chlorination on organicnitrogen is uncertain, with contradictory results presented in the literature. Nitrite andnitrate are not removed by this method.
2-18 0

2.5.3.3 Selective Ion Exchange for Ammonium Removal
Selective ion exchange for removal of ammonium from wastewater can, be accomplished by
passing the Wastewater through a column of clinoptilolite,aturally occurring zeolitewhich has a High selectivity for ammonium ion. The fiklt.extensivO:study was undertaken in1969 by Battelle North West in a federally sponsored deinonSt4tirprojecf. Regeneration ofthe clinoptilolite is undertaken Mien aH .the.,exChange sites Ate utilized and breakthroughoccurs.
Filtration prior to ion, exchapge is usually required to prevent fouling of gm. zeolite.Ammonium removals of 90-97 percent can be expected. Nitrite, nitrate, and organicnitrogen are not affected by this process:'
2.5.3.4 Air Stripping for Amm Onia Removal.
Ammonia in the molecular form is° a gas.whichdissolves in water to an extent controlled bythe partial pressure of the ammonia in the air adjacent to the water. Redwing the partialpressure causes ammonia to leave the water phase and enter the air. AmMOnia removal fromwastewater can be effected by bringing small drops of water in contact with a large amountof ammonia-fiee air. This physical. process is termed des tion, but the common name. is
"ammonia stripping.'.'
In order to 'strip ammonia from wastewater, it mus be in the molecular form (NH3) ratherthan the ammonium ion (NH4) form. This is accomplished by raising the pH of thewastewater to 10 or 11, usually by the addition of lime. Because lime addition is'often used
for phosphate removal, it can serve a dual role. Again, nitrite, nitrate, and organic nitrogenare not affected:
The principal problems associated with ammonia stripping are its inefficiency in coldweather, required shutdown during freezing conditions, and formation of calcium carbonatescale in the air stripping tower.
1
The effect of cold weather has been well documented at theSouth Lake Tahoe Public
Utility District where ammonja stripping is used for a 3.75 Ingd tertiary facility. Thestripping tower is designed to remove 90 percept of the incoming ammonium during warmweather. During freezing conditions, the tower is shut .down. One mechanism of scaleformation is attributed to the carbgn diOxide in the air reacting with the alkaline wastewaterand precipitating as calcium carbonate4,22 In some instances, removal with a water jet hasbeen possible; in other applications the Scale hiS been extremely difficult to remove. Somefactors which may affect the natureof the scale are orientation of air flow,fecirculation ofsludge., pH of the wastewater, and chemical makeup of the wastewater.22
2-19

er.Nitrogen Rem qr1 Processes
In additio to the processes listed above, there are other -methods for nitrogen removalwhich might usefully tie discussed. Most are itt the experkmental stage of development oroccur. coincidentally with another process.
Use of Anionic exchange resins for removal of nitrate was developed principally fortreatment of irrigation return' waters.22 Two major unsolved problems are the lack of resins...which have a high selectivity for nitrate over chloride and disposal. of nitrogen-ladenregenerants.
Oxidatiqn 'Ponds can rem nitrogen through microbial denitrifica0On in: the Anaerobic.
bottom layer or by ammonia emission to the atmosphere. The latter`effect is essentially
4iriostudy of raw wastewater lagoons in California, removals of 35-85 percent were reportednia stripping but is relatively inefficent due .to 'a low surface - volume ratio And.low pH.
fin...YVell-operated lagoons.5' Ls.
Nitrogen in OxidAtiiian ponds is assimilated by .algal cultures. If the algal cells are ,tenloy'ldfroin the pond effluent stream, nitrogen removal is. thereby effected. Methods.fof removalof algae are summarized in the EPA Techmilogy Transkr Publication, UpgradingLagoons.25
It wastoted pieviously secondary biological treatment and inlitrification, somenitrogen is incorporated in bacterial cells and is remaved friim the waste stream:with thesludge. If an'"organic carbon source such as ethanol or glucose is added to the wastewater,the solids production will be increased and'' a greater nitrogen removal will` be effected.Disadvantages are that large quantities of.sludge 'are produ d and that difficulties occur inregulating the addition of the carbon source; with hi effluent BOPS- values or highnitrogen levels resulting.2
2.5.5 Summary s,Table 2-3 summarizes t e effect of various treatment processes on nitrogen removal. Shownis the effect. that the process has on each of' the three major. fonts: organic. nitrogen,.
.ammonium, and nitrate. In the last column is shown.normal removakPercentagea which canbe expected from that pro s. Overall removal fora particular treats ent plant will depend .iton the types of unit pro Vises -and their relation to .each other..FOr example, while. Manyprocesses deyeroped for nitrogen removal are ineffective in removing 'organic nitrogen,incorporation of 'chemiCal coagulation or: multimedia filtration into the .overall. flowsheetcan result _in a low concentration of, organic 'nitrogen in the plant efillAnft. Thus, theinterrelationship between 'processes must be carefully' analyzed in designifecir nitrogen
;`''.removal. Furtherdiscussion.of prOcess interrelationships i.5. presented in Chapter 9.
2-20
52
f
''.;*!7'

TABLE 2-3
E F OF if. vows Thpvpo.rr.fpg.pa§E§ ON NITROGEN COMPOUNDS..
..,/
Tretatment process . a
.... .
4.
:
.' ...'". !
Effect on Constituent
..
.
Removal oftotal .nitrogen
entering. process,percentaOrganic N ' NH3/NH4 '
. ... :1403.;.
. ..'Codventional:treatment processes,..,,./ 'Primary. ' . '.' ''..`.:'. Secondary,''' : :
.
10-20% removed,......:16-2596 remavedb' "..
, .
urea -s- NH3 /NH4
no' effect'.<10% removed
--.. , ' .
.'no effectnil
5-1010-.20
.
Advanced wastewater treatment aocessesFiltrationcCarbon sorptionElectrodialysis . :. '.', ..
,
. Reverse osmosis.
Chemical coaciulatXfi
.
30-95% removed30-50%'removed1,00% of suspend
.'. organYC N removed7100% of suspend
organic N removed,56 -2d% removed...
L,
nilnil40% removed_____
.
'86% removed ......-...!:',86%
nil,
nilnil40% removed'
removed
nil : .
20-4010-20.
. 35-45
80-90
.20-30
. -..
:.."
,1:and application ,
. .Irrigation .
,...V, .
v Infiltrationippi-opration .
."-... NI-i37141-P4'
:
-+ NI-Ii/N114",,... ,
-i. NO3... .Plant N.-... Nog
-0., plant N
.--.. N2
: '' .40 -90
.
0-50
'
".
Major nitrogen reradVal;abcaaselNitrification ..-...' ...'
.. Denitrffiiatton '.. I .' Breakpoint'.614orthaffon .., .' . .
. Selective ion exchange la ammonium:
Ararrionia stripping ,' .. . :.:
limited effectA noteffeCt:"uncertain'a'orne removal, un-
''*.tio effect1
NO3.,
.-... 3: '.:,no effect ;
'90-106.16.remoited.90-97% 'reirovid, .
60-95% removes ':
.
no effect.80-911% removed'......'Ito effect :
igriittect .
'no effect ...' ''.*
5-10" 70-9 5
.
.. ,10-9 5. , 80-95: :. .
.:56,so. . 4.
-
.
Otheisr nitrogen removal processes ..
Selective ion exchange for nitrate`l Oxidation ponds
-
Algae stripping .
..". Bacterial assimilation
.
.::'.. .nil ,...
partial transformation's to. N1-13/NNI
'partial transformationto NI-3 /N1.14 ..
no effect'
nil .' ; :. -.:
partial removal ,'by stripping . ,'
..-...'''...,.dahl(rific.itfOrl-- cells
40-70% removed
. . .
i5.91:196 removedA partlarremoval by
. ':nitrification-......
'',.:4. Cells ; .;
limited' effect...,
. ,..
7090' .,20;96; '.. .....'.!-
'..'.' ''',50-60
..
.
30-70:
,..
.',
. '. ' .
clepancj. on the fraction of influent nitrogen for which the process is effective, which may depend'or'cither processes'- . the,tifRapnent plant.
'Soluble brganic nitrogen, in the form of urea and amino acids, is substantially reduced by secondary treatment..
'c..May be used to remove particulate orgahic garboriiti-ptOte.whereammonia 'Or nitrate are removed by other processe ,
r4 kr 2.6 References
,1. Sawyer, C.N., and P.L. IcKarty,..Chemistry, for Sanitary Engineers. New York,McGraw-Hill Book Co., 1967.
,
1 Christensen, M.H., and P. Harrernoes, Biological Denitriication in WaStewatirfTreatment. Report 2-71,.Department of Sanitary Engineering, Technical University ofDenmark; 1971. .
3. Delwiche, C.C., The Nitrogen Cycle. Scientific American, 223, No '3, pp.,I37.146.19170).
4. Martin, D.M., and D.R. Goff, The ROle of Nitrogen in the Aquatic Etivironciient.Report No. 2 Department of Limnology, Academy of Natural Sciences of .Phila-delphia, 1972.
. Sepp, E.; Nitrogen Cycle in Groundwater. Bureau. Of Sanitary Engineering, State ofCalifornia Department of Public liealth, 1970. , . .
.,. ,
mpcayty, p.L., et al, Sources of Nitrogen and Phosphorus in Wate'r Supplies. JAWWA,' 59, pp 344(1,967). '"
..
, ,;.
. .
',------ .7. -Silvester, R.O., Nutrient Content of, Drainage Wdter for Forested,. Urban,."sand'Agricultural Areas. , Algae and MetropolitariNVi§tESTRobert--A. Taft Sanitary Engineer-
.
!
ing Center, Tech°. Rep. W61,3,1963..
S.' .Reeves, T.G., :Nitrogen Removal: A Literature RevielV, JWPCF; 44, No 10, pp1896-1908 (1972).
9. Nitrogenous. Compounds in the Environment Hazardous Materinls ,AdvisOry Com:\%!
mittee (i6,the.tPA), EM-ASB-73-90 I ,I5ecember; 1973%.: q =
.10.' Kaufman, Chemical Po llution:: of GroUnd Waters. .TAWW A, 66,.No. 3, pp 152-159
.'
11. Weibel, S.R,., :Anderson, R.J., and R.L. WoodWard, Urban-Land Runoff as a,:Faetor inStream POlitilion. JWPCF, 43, p 20334971).
.
12:', American Public Works Association, Water Pollution Aspects of Urban Rutio'APCA Report No. WP-20-15, JanuarY, 1969
0
3 turn, Krawezyk, D.F., and G.T. Harlow, Chemical anti Physical CoMijt;risOn:oe
:.COMbined and Separated Sewer Discharges.,JVIPCF,,',40' , pp 112-(1968).,
. Avco Economic Systems Corporation, Storm:Water PollutiOn From Urban Land.,Activity. EPA.Report No 11034 FKL 07/76, Julk, 1970.
Weibel, et al.,' Pesticides and. Other Contaminants in Rainfall and Runoff'JAWWA, 58, pp 1075 (1966).
Dept:. orBiolOgical and-Agricultural Engineering, North Carolina State University atRaleigh, Role (If Animal Wastes in Agricultural-Land.Runoff EPA Repoit No': 13020DGt08/71 ; August 1971:, ; . .
. .California Dehartinent of -Water Resources, kitrtents From Tfle. Drainage Systems.
.SPA Report No-13030 ELY 5/11,3;'14ay1971..
Johteiti, Rossano, A.T., Jr., and R.O. Sylvester, Dustfall as alSource of Waterduality Impairment, ASCE, JSED, 92, No. SA1, pp 145 (1966),
9. , California State.Water Resources.,Control Board, Tentative Water Quality Control Plan,San Francisco Bay Basin. November,,: 1974: . t
,e140.:W/1 and Caldwell/Dewante and Stowell, Feasibility Study for the Northeast-CentralSii.ileictge Service Area Prepared for Cbunty of Sacramento, Departinent of Public" .
-Works, November' f972.
.g21. Ehreth,DJ., and E. Barth; Control of Nitrogen in W4steiDater Effluents. Frepalred for .
the EPA.TechhgJ gy.Transfer Program, March, 1974.
22. Nitrbgen .e ova from Wastewaters. 'EPA Advanced Waste Treatment Reearch
Labm.t°rYiDIOR -P7010,,October, 1970.
t°
23. Effects of PollutIrm Disdharges,:on the Thames Estdary. Department of ScintifiCIndustrial Research, Water Pollution Research Technical Paper No. 11, Her'Majesty7sStationery Office, 1964.
r.!
1 24. :Patkirt;Id.F., and P.L. McCarty, The Nature, Ecological Significance, and Removal ofSoluble Organic Nitrogen in Treated Agricultural Wastewaters: Stanford University,prepared for ,the Bureau of Reclamation, Contract USDI- 14-06-200-6090-k.September, 1973.
ci-'
25. Caldwell, D.H., Parker, D.S., and W.R. Uhte, Upgrading Lagoons. Prepared for the EPATechnology Transfer Program, August, 1973.

3.1 Introduction
.1"
. CHAPTER 3.
. .,
PROCESS CtigMISTRY,AND BIOCEMISTRY OF .
NITRIFICATION SAND DEislITRIFICATION.
a.11' ..A
.
The puiPose of this .chapter is to prelen't a. treatment proces's-oriented reVieW Of the,chernistrk 'and biochemistry of nitrification 'and dwitrification. An .enderttanding of.this itsubject is useful for developing dn avpreciatton of the flctOrs affectingihe perfarmarice,design, and pperatiOn of niirificatiOn and' enitrificakr?processes.Subsequent Chapters deal 0with design aspects. a nitrification (Chapter 0) and denittification (Chalker 5). Since theselatter chapters are laid out ito be used without reference to this chapter" &view Of4he.theoretical material in this chapter is not.mandalory:
Biological processes folicontrol of nitr6genous residuals in efflpents can be classified in twotiroad areas,- first, a process designed to prodUce an. effluent where influent nitrogen,(amMonia, and organic .nitrogen) is hubstantially converted to nitrate 'nitrogen can'- be .considered. This process, nitrification, is carried out by bacterial populations thatsequent 11 oxidiie ammonia to nitrate with intermediate formation of nitrite. Nitrcati6nwill -satis ffluenf to. receiving vater standards where reduction of residual nitrogenousoxygen dema d due to ammonia is mandated or where ammonia reduction.for other reasonsis required fo the treatment system.:The second type of process, denitrification, reduces
,nitrate to iiit;ogen gas and can be used folloWing nitrifitation when the total nitrogenouscontent of the.effluent must be reduced.
3.2 Nitrification
The two principal genera of importance in biological nitrification prooesseS aresortionas and Nitrobactee.Both of these groups are classed as autotrophic organiSins: Theseorganisms are distinguished from "heterotrophic bacteria in that they dedve e-Aergij forgrowth from the oxidation of .,inorganic nitrogen compounds, rather than from the
A iiairoxidation of organic matter. n er, feature of iOese organisms is that inorganic- carbon(carbon diokide) is used for synthesis rather than organic carbon. Each group is limited tothe oxidation 'of specific species of nitrogen compounds. Nitrosomonas can oxidizearnmonia'to nitrite, but cannot complete the oxidation to nitrate. On the other hand,Nitrobacter is limited to the oxidation of nitrite to nitrate. Since complete nitrification is a
, sequential reaction, treatment processes must be designed to provide an environment.suitable tcithe growth of both vgroupsof nitrifying bacteria.
is
'43.2.1, Biochemical PathWays
On a biocherhical level, the nitrification process is morth complex thL1 simply the sequentialoxidation ofammonia4o nitrite by Nitrosomonas and the Subsequent oxidation of nitrite t&
3.1.1
I

nitrate .I5y Nitrobacter. Variou's reaction intermediates and enzymes are 'involved) Moreimportant ,than an understanding of the§e path ways is knowledge of the response of"
nitrification organisms to environmental conditions.
3.2.2. Energy and-Synthesis Relatioriships
The stoichiometric reaction for oxidation of ammonium to nitrite by Nitrosomonlas is:,
NH4,,, + -1.5 02 2H+ + H0 + NO-4 2 2 2
OM
(3-1)
The loss of 'free energy by this reaction at physiological concentrations of the reactants has
been estimated by various investigators to be between 58 and 84 kcal per mole ofIrmo onia.1,2
The reaction for oxidation of nitrite to nitrate by Nitrobacter is:
(3-2)
This reaction has been estimated to release between 15.4 to 20.9 kcal per mole of nitrite
under in vivo conditions'.2 Thus, Nitrosomonas obtains more energy per mole of nitrogerioxidized than Nitrobacter. If it assumed that the cell synthesis per unit of energy produced
i9 equal; there should be. greater mass of Nitrothmonas formed than Nitrobacter per mole ofnitrogen oxidized. As will be seen, this is in fact the case.
The overall oxidation of ammonium by both grotiPs is obtained by addirig Equations 3-
and 3-2;
NH4 + 202_ --- NO3 + 2H+ (1.3)
As previously mentioned, these reactions furnish the energy required for growth of the
nitrifying organisms. Assuming that the empirical formulation of bacterial cells is
5H7NO2, the equations f6r the growth of Nitrosomonas and Nitrobacter are ,.shown in
Equations 3-4 and 3-5, re4pectively;
15th2
+ 13N1-t+' 10N02
+ 3C5
H7
1\102
+ 23H+ + 4H20 (3-4):
Nitrosomonas
5C0 NH4 + + 1610 + 2H20 IONO3
+ C5
H7NO
2NitroNicter
3-2
57
+H (3-5)
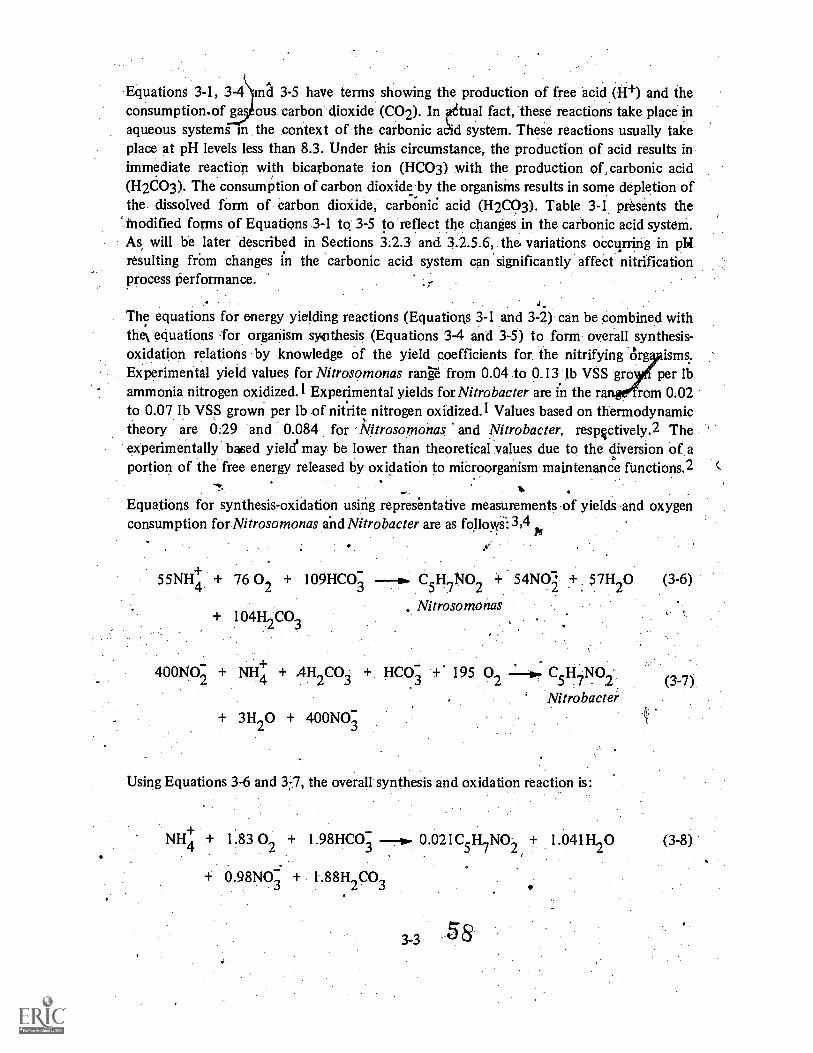
Equations 3-1, 3-4 nil 3-5 have terms showing the production of free acid (H+) and theconsumption.of ga ous, carbon dioxide (CO2). In etual fact, these reactions take place inaqueous systems in the context of the carbonic acid system. These reactions usually takeplace at pH levels less than 8.3. Under this circumstance, the production of acid results inimmediate reaction with bicarbonate ion (HCO3) with the production of, carbonic acid(H2CO3). The consumption of carbon dioxide-by the organisms results in some depletion of
.the dissolved form of carbon dioxide, carbonic acid (H2CO3). Table 3-1 presents theModified forms of Equations 3-1 to 3-5 to reflect the changes in the carbonic acid system.As will be later described in Sections 3.2.3 and 3.2.5.6, the variations occurring in phiresulting frOm changes in the carbonic acid system can 'significantly affect nitrificationprocess performance.
The equations for energy yielding reactions (Equations 3-1 and 3-2) can be combined withthe equations for organism synthesis (Equations 3-4 and 3-5) to form overall synthesis-oxidation relations by knowledge of the yield coefficients for the nitrifying Org isms.Experimental yield values for Nitrosomonas range from 0.04 to 0.13.1b VSS gro per lbammonia nitrogen oxidized.' Experimental yields for. Nitrobacter are in the r rom 0.02to 0.07 lb VSS grown per lb of nitrite nitrogen oxidized.' Values based on thermodynamictheory are 0:29 and 0.084 for -Nitrosomonas and Nitrobacter, respgctively.2 Theexperimentally based yield` may be lower than theoretical values due to the diversion of aportion of the free energy released by oxidation to microorganism maintenance functions.2
Equations for synthesis-oxidation using representative measurements of yields and oxygenconsumption for Nitrosomonas and Nitrobacter are as follows: 3,4
55N1I+ + 76 0 + 109HCO3
C H NO + 54N01 . 57H 0 (3-6)24 5 -7 2 - 2
. Nitrosomonas+ 104H2C0
4001\102 + NH4 + .41-12CO3
3H20 + 400NO3
HCO3 195 02 C5 7H NO2 (3-7)
Nitrobacter
Using Equations 3-6 and 377.7, the overall synthesis and oxidation reaction is:
NH4 + 1.83 02
+ 1.98HCO3
0.021C5
H7NO
21.041H20 (3-8)
+ 0.98NO3 + 1.88H2C0
3-3

In these equations, yields for Nitrosomonas and Nitrobacter are 0.15 mg cells /mg NH4 -N
and 0.02 mg cells/mg NO2-N, respectively. On this basis, the removal of twenty. mg/I ofammonia nitrogen would yield only 1.8 mg/I .of nitrifying organisms. This relatively lowyield has some far reaching implications, as will be seen in Section 3.2:7. Oxygen'consumption ratios in the equations are 3.22 mg 02/mg NH4-N oxidized and 1.11 mg,
NO--N oxidized, which is in agreement with measured values.4
3.2.3. Alkalinity and pH Relationships
Equation 3-3A (Table 3-1) shows that alkalinity is deStroyed by the oxidation of ammoniaand carbon dioxide (H2CO3 in the aqueous pha e) is produced. 'When4synthesis is neglected,it can be calculated that 7.14 mg of alkalinity s CaCO3 is destroyed per mg of amMonianitrogen oxidized. The effect of synthesis is r atively small; in Equation 3-8, the ratio is7.07 mg of alkalinity per mg of ammonia nitrogen oxidized. Experimentally determined'ratios are presented in Table 3 -2; differences between the experimental and theoreticalratios are due either to errors in alkalinity or nitrogen analyses or the inadequacy of theory.
TABLE. 34
RELATIONSHIPS FOR OXIDATION AND GROWTH IN NITRIFICATIONREACTIONS IN RELATIONSHIP TO THE CARBONIC ACID SYSTEM
Reaction EquationEquation
No.
ORdationNitrosomonas
Oxidation -Nitrobacter
Oxidation -overall.
-Synthesis -Nitrosomonas
Synthesis -Nitrobacter
NH4
+1 .502+ 2 HCO3 -I. NO2 + 2 H Ca
3+ H2O
NO - NO2 3
NH4 + 2 02 + 2 HCO3 NO3
+ 2 H2CO
3 2+ H2O
13 NH4
4- 23 H CO3
'8H2CO3 + 10NO2 +
3 C 5H 2NO2 + 19 H 20
NH4 +' 10 NO, + 4H 2C
3 H 20 + C5 7
H NOiy
+ HCO3
10 NO3
+
3-1A
.3-2
3-3A
3-4A
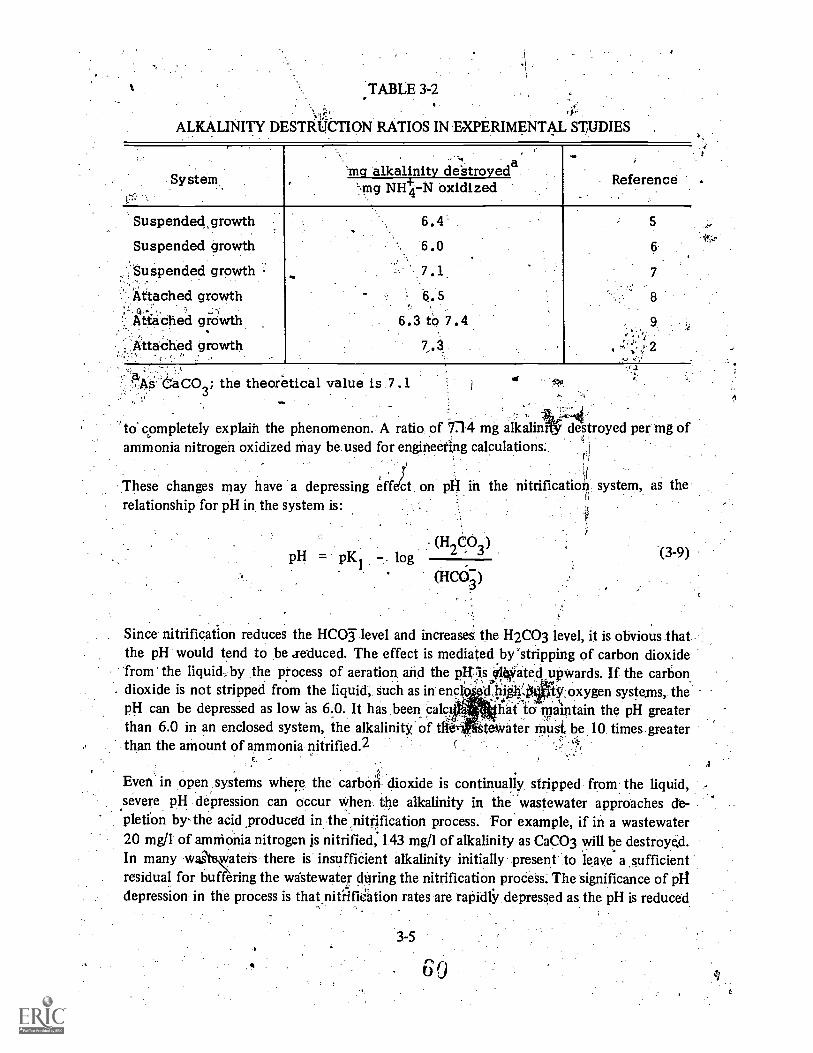
ALKALINITY DESTRUCTIONDESTRUCTION RATIOS IN EXPERIMENTAL STUDIES
System 'mg alkalinity destroyeda.mg NH4 .-N oxidized Reference
Suspended ,growth
Suspended growth
. Suspended growth
Attached growth: a -
Attached growth
.ttaChed growth
6.4'
6.0
7.1
6.5
6.3 to 7.4
S:6aCO3; the theoretical value is 7.1
6
7
8
'to- completely explain the phenomenon. A ratio. of 714 mg alkalinammonia nitrogen oxidized may be used for engineering calculations:,
These changes may have a depressing eff ct on pfl in the nitrificatio4 system, as the.
i
relationship for pH in the system is:
destroyed per mg of
pH = p log(H CO
2 3
(HCO3)
(3-9)
Since nitrification reduces the HCO-§ level and increases the H2CO3 level, it is obvious thatthe pH would tend to be reduced. The effect is mediated by' stripping of carbon dioxidefrom' the liquid-, by the process of aeration and the pirjszyliviated upwards. If the carbondioxide is not stripped from the liquid, such as in enc ty,oxygen systems, thepH can be depressed as low as 6.0. It has, been calc naeto, maintain the pH greater
ofthan 6.0 in an enclosed system, the alkalinity of tit& Mater must be 10 times greaterthan the amount of ammonia nitrified.2
Even in open. systems where the carbon dioxide is continually stripped from' the liquid,severe pH depression can occur when the alkalinity in the approaches de-pletion by-the acid ,produced in the ,nitrification process. For example, if in a wastewater20 mg/1 of ammonia nitrogen is nitrified, 143 mg/1 of alkalinity as CaCO3 will be destroyed.In many wagteTters there is insufficient alkalinity initially present to leave a sufficientresidual for buffering the wastewater airing the nitrification proCess. The significance of pl-Idepression in the process is that nitrification rates are rapidly, depressed as the pH is reduced
3-5
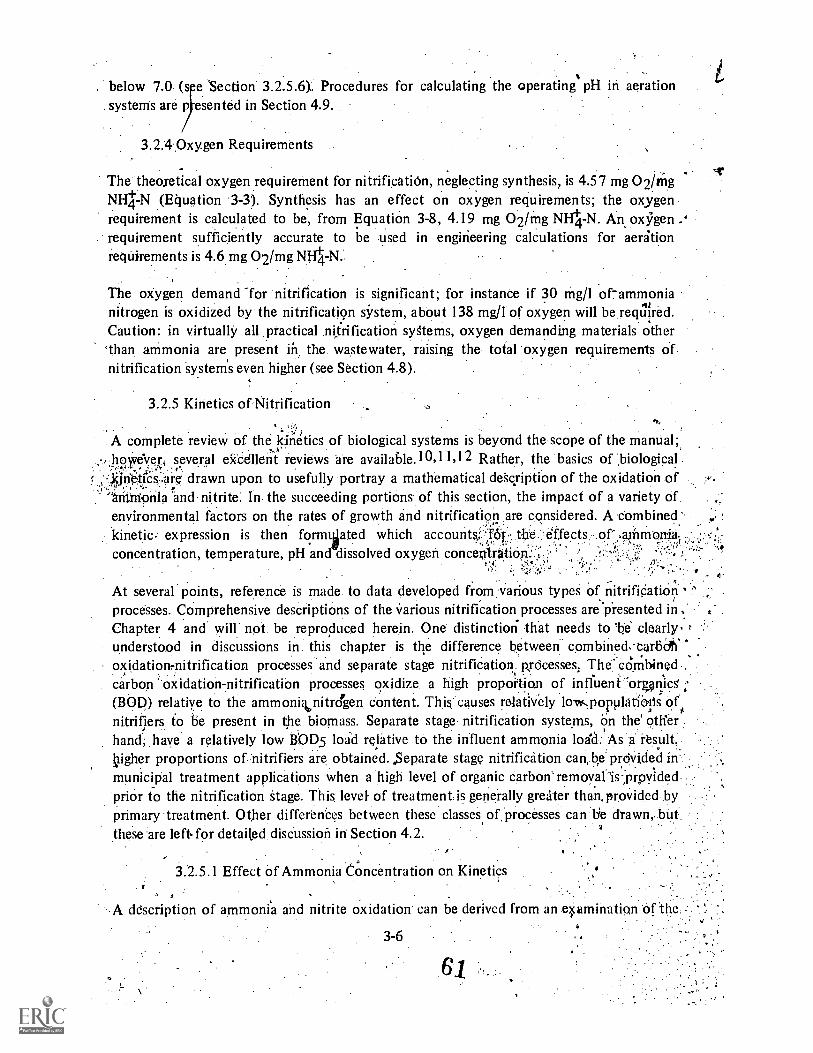
below 7.0. (ssystems are p
e Section 3.2.5.6). Procedures for calculating the operating pH in aerationesented in Section 4.9.
3.2.4 Oxygen Requirements
The theoretical oxygen requirement for nitrificatiOn, neglecting synthesis, is 4.57 mg 02/mgNH4 -N (Equation 3-3). Synthesis has an effect on oxygen requirements; the oxygenrequirement is calculated to be, from Equation 3-8, 4.19 mg 02/mg NH4 -N. An oxygen
. requirement sufficiently accurate to be used in engineering calculations for aerationrequirements is 4.6 mg 02/mg NIA-N.
The oxygen demand "for nitrification is significant; for instance if 30 mg/1 of-ammonianitrogen is oxidized by the nitrification system, about 138 mg/1 of oxygen will be reqUired.Caution: in virtually all practical nitrification sygtems, oxygen demanding materials otherthan ammonia are present in the wastewater, raising the total oxygen requirements ofnitrification 'systems even higher (see Section 4.8).
3.2.5 Kinetics of Nitrification
A complete review of the kinetics of biological systems is beyond the scope of the manual;,hove-N/9-, several eicdllent reviews are available.10,11,12 Rather, the basics of biologicaljn:ettcs:.are drawn upon to usefully portray a mathematical deScription of the oxidation of
`ari-ftrionla and nitrite: In the succeeding portions. of this section, the impact of a variety ofenvironmental factors on the rates of growth and nitrification are considered. A combined'kinetic,. expression is then forme ated which accountsf4,. the.:,effects..orconcentration, temperature, pH and dissolved oxygen concetfiratiOt:L;,,i '
.
At several points, reference is made to data developed from:various types of nitrification 'processes. Comprehensive descriptions of the Various nitrification processes are in ,Chapter 4 and will not be reproduced herein. One distinctiori that needs to be clearly. =understood in discussions in this chapter is the difference between. combined,-carbdhsoxidation- nitrification processes and separate stage nitrification. processes; The combinedcarbon 'oxidation-nitrification processes oxidize a high propoition of influenf.:organ'ics(BOP) relatiye to the ammonia.nitrolen content. This causes relatively low.popplatiOlis ofonitrifiers to be present in the biomass. Separate stage nitrification systems, on the otherhand; have a relatively low BODE load relative to the influent ammonia load: As result,.tigher proportions of :nitrifiers are obtained. Separate stage nitrification can be provided inmunicipal treatment applications when a high level of organic carbon'remoyat 'is ,provided :
prior to the nitrification Stage. This level- of treatment:is generally greater than.provided, byprimary treatment. Other differences between these classes of processes can lie drawn,. but..these :are left- for detailed discussion in Section 4.2.
3.2.5.1 Effect of Ammonia Concentration on Kinetics
A description of ammonia and nitrite oxidation can be derived from an examination 'of the
3-6
4.0
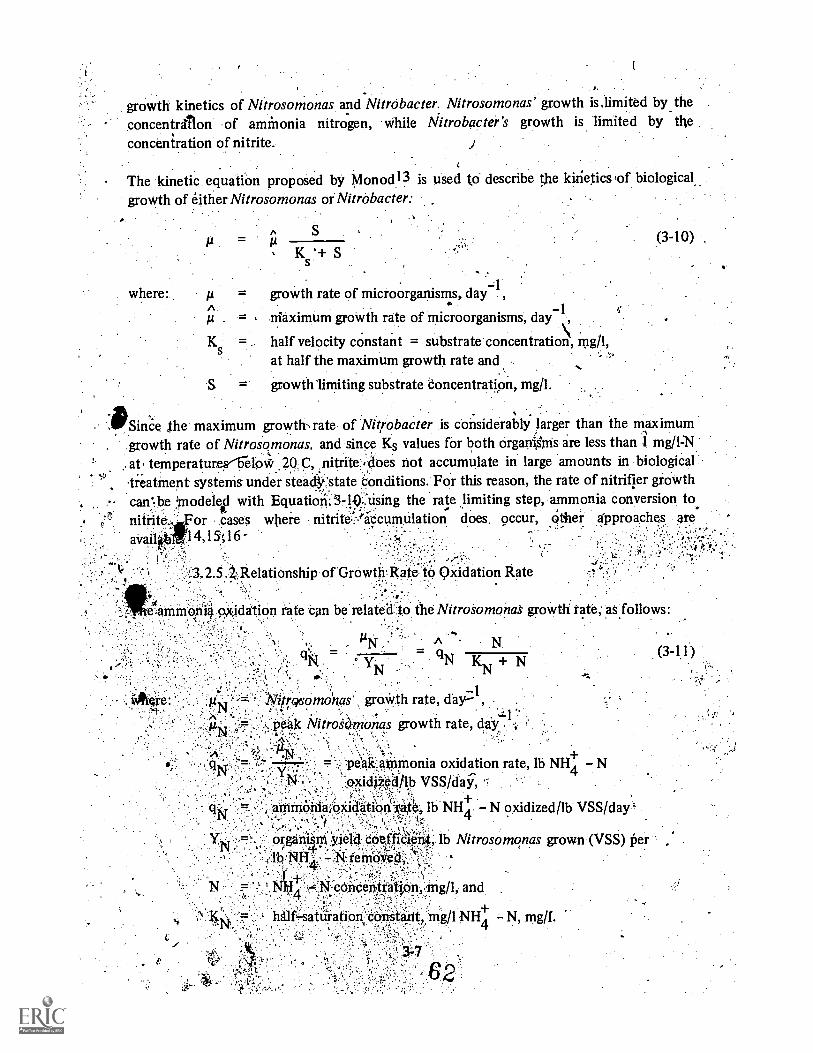
growth kinetics of Nitrosomonas and NitrObacter. Nitrosomonas' growth is.limited by the
concentration of ammonia nitrogen, While Mtrobacter's growth is limited by theconcentration of nitrite.
The kinetic equation proposed by Monod 13 is used to describe the kizietics of biological,.
groWth of either Nitrosomonas or NitrObacter:
A S
Ks *-F S
where: µ = growth rate of microorganisms, day ,
A1.4 = r ri aximum growth rate of microorganisms, day-1,
Ks half velocity constant = substrate concentration\, mg/1,
at half the maximum growth rate and
S = growthlimiting substrate concentration, mg/l.
:10SinCe Ihe maximum growth rate of Nit,robacter is considerablY larger than the maximum:growth rate of Nitrosomonas, and since Ks values for both organtlnis are less than 1 mg/INat temperaturef(-betoW 20; C, nitrite'..40es not accumulate in large amounts in biologicaltreatment. systems under steady state Conditions. For this reason, the rate of nitrifier groWthcan be :Modell! with Equatiori 3 -10 using the rate hmiting step, ammonia conversion to
nitrite. For cases where nitriteCcumtilation does, occur, other approaches areaVail 14;15;16-
(3-10)
.
1.3.2.5.Z Relationship of Growth Rate to Qxidation Rate
ea.mmonia oxidation rate can be related io the NitroSomonas growth rate; as follows:
- IAN A N.
NKN + NN --
..itrqsomonas groWth rate, day-1
Peak NitrW4znonas growth rate, dav
.peak:aMmonia oxidation rate, lb NH4 - Naxidii,e411b VSS/day,
arritriiiiiia.OicidiatiO0=kitb; lb NH - N oxidized/lb VSS/dayl.4
:organism yieltiCOefficvit; lb Nitrosomonas grown (VSS) per,
;cdncent at onong/1, and
hilikatUration'coitarit mg/13\1H - N, mg/I.

In Equations 3-10 and 3-11, only 'the effect of ammonia concentration is considered; in Thtertions, the effects of temperature, pH, and dissolved oxygen are considered.
3.2.5.3. Relationship, of 'Growth Rate to Solids Retention Time
The growth rate of organisms can be related to the design oPactivated sludge systems bynoting the inverse relationship between solid retention time and growth-rate of nitrifiers:
1
c 11
where:ec = solids retention time, days.
y.5. _
The solids retention time can be calculated from system operating data by dividing theinventory of microbial5inass in the treatment system by the quantity of, biological masswasted daily Egli° ations applicable for this calculation are presented in. Section 4.3.3.
3.2.5.4.Kinetic Rate Constrils for Temperature and Nitroglen ConCentration
The Most:widely accepted kinetic constants for the nitrifers are those- presented by DoWningand coWdikers.17,18 Their'results are presented in Figures 34*nd°3-2. As can be seen, t',Ioththe maximum growth rate, p, and the half saturation conStants, Ks for Nitrosomonas andNitrobacter are markedly affected by temperature. Further, the maximum growth rate forNitrosomonas in activated sludge was found to be considerably less than for Nitrosomonasin pure culture.',1
e,Kinetic constants found by other investigators are summarized in Tables ,37.3 and 3-4. Theobservations of maximum growth rates of NitrosoMonas of Gujer 'And Jenk;inS4Wuhnnann19, Loehr, et a1.22, Podusia,,and Andrews155..,' and Lawrence and BrONYii2, arecloser to the pure culture yalues of NitrosOrnon4 raiher than the activatecVSludze values inFigure 3-1. This suggests that some additional Such as dissolved oxygen (DO) mayhave been limiting Downing's activated sludge ineasurements.4 The influence of DO is
.discussed in the next section. For illustrative use in this manual the pure culturevalues ofDowning, et al:, for Nitrosornontis are used for considering the effect of tempefatUre andammonia` On 'growth and nitrifiCation rates. The expressiohs for the half saturation constantfor oxidation of ammonia- nitrogen, KN, is:
0:051T - 1.158= 10 mg/1, as IS,
T = temperature, C.
(3-13)
The expression for the effect of temperature on the maximum growth rate ofNitrosomonasis:
k:17
0,098(T-15) 1p = 0.47e day (3-14)
3-863
t
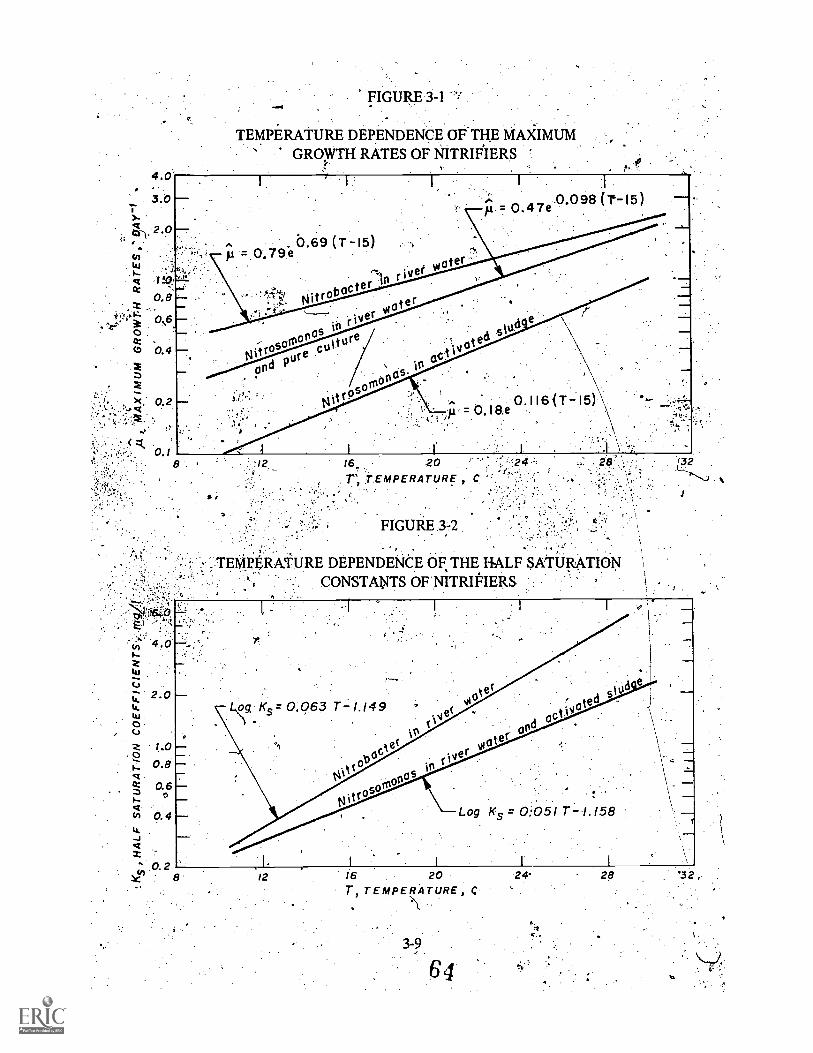
4.0.
3.0
2.0
fn
.1qcc
0.8
cc0.4
X. 0.2
FIGURE 3-1 7
TEMPERATURE DEPENDENCE OF THE MAXIMUMGROWTH RATES OF NITRIFIERS.
161
,TEMPERATURE , C
FIGURE 3-2
TEMPERATURE DEPENDENCE OF THE HALF SATURATIONCONSTANTS OF"NITRIEIEItS
:32
.0
V2.0
U.
0, c.J
1.000.8
Q.cc 0.6
Q-O 0.4
-Jq
0.2(f> 12 16 20
o
T, TEMPERATURE, C
3-9
64
24- 26
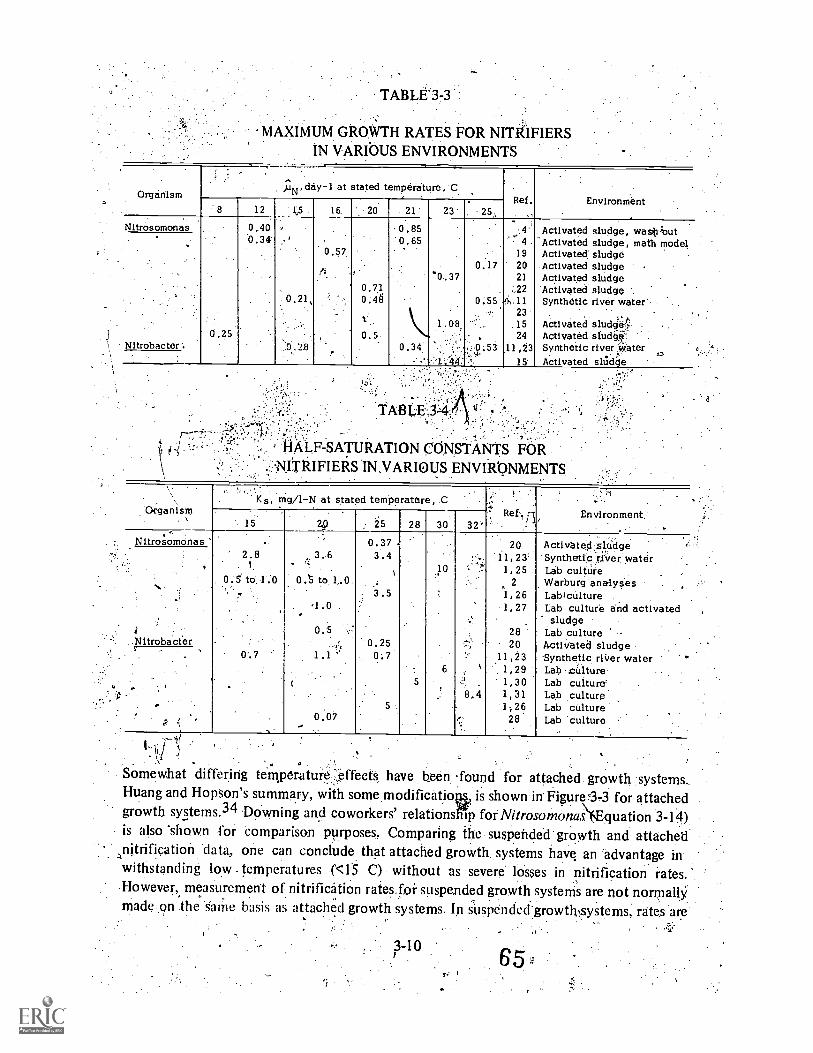
TABLE-3-3
'MAXIMUM GROWTH RATES FOR NITMFIERSIN VARIOUS ENVIRONMENTS
OrganismAiN, day-I at stated temperature, C
Ref.,
Environment8 12 1,5 16. 20 21 23' 5,,
Nitrosomonas
0.25
0.400.34
.-
0.21,
0.29
0.57
f';.
0.710.46
t0.5
0.850.65
0.34'
*0.37
1.08
-1:44
0.17
0.55
,,
: .53
... 44
192021
.22A11
231524
11,2315
Activated sludge, wast;OutActivated sludge, math modelActivated sludgeActivated sludgeActivated sludgeActivated sludgeSynthetic river water
t'iActivated sludge;Activated sludgeSynthetic river WaterActivated shidge
Nitrobacter .
thAF-SATURATION CONSTANTS FOR`; IITtIFIERS IN,VARIOUS ENVIRONMENTS
'Organism, mg/1-N at stated teMperatare,, C .
Ref,,--
.
Environment.15
.
29 ,, 25 28 30 3V.t
Nitrosomonas' 2.8
I .
0.5 to 1;0,
0.7
.
"'
3.6. l.::
0. to 1,.0.
,1.0
0.5
1.1 ''
0.07
0.373.4
.3.5
0.250:7
5
5
10:.',-.
, .-
:L:,'
'.`
,...
8.4
.20
11,23;1,25
2
'1 , 261,27
2820
.11,231,291,301,311,2628
Activated,z1tidgeSynthetic river waterLab cultireWarburg 'analys'es .LabicultureLab culture and activatedsludge
Lab cultureActivated sludgeSynthetic river waterLab cultureLab culture'Lab cultureLab cilltureLab culture
N
Nitrobacter.
.
,if ,\
)
Somewhat differing temperature. ;effects have been found for attached growth .systems.Huang and Hopson's summary,' with some modificatiou is shown in Figure 3-3 for attachedgrowth systems.34 Downing and coworkers' relationship for Nitrosomona.4Equation 3-14)is also "shown for comparison purposes, Comparing the suspended growth and attached
,nitrification data, one can conclude that attached growth systems have an advantage inwithstanding low - temperatures (<15 C) without as severe losses in nitrification rates.However, measurement of nitrification rates,fot suspended growth systerris are not normallymade on the same basis as attached growth systems. In slispendedgrowthlsystems, rates are

expressed On leper . unit of ibmaSs basis (musisq is used).1'reCiSepgasUrement of biomass.
is normally, not possible in attached growth' systems Scilb*r` parameters are Used such asreaction rate per unit sUrface; Or. volume. Therefore, attached growth- systems cancompensate for :colder temperature conditions by the effective, shine 'gro,Wth.,,growingthicker. T rates could, be expressed on a. unit biornass. basis fbr 'bah-system types,reaction Vailat* with temperature might be, more similar...
It could Elie ar that conipenSation for low temperatnre in suspended grOwth systemscould be Ptdifi :by allincrease in mixed liqUor level; mu Kas'an increase in slime growth
;b.dc.Uis 1pl .attaCIfi :'growth systems. However,, suspended eiwth. Systems are limited by,
reactor:-sedi1cle at 12 tank interactions' which at cold tempera res might prohibit this dueto reduction of thickening rates.of the sludge (cf. Section 4.0).
. r ,
Other differences hi reaction:rates shoWn fromin Figure 3-3 may arise the fact tht somedeterMinitions were on seggale-itage nitrification systemS while others were made oncombined, carbon oXidatiallitrificatiori processes: (.
FIGURE 3-3
COMPARISON OF EFFECT OF TEMPERATURE ON NITRIFICATION INSUSPENDED GROWTH AND ATTACHED GROWTH SYSTEMS (REFERENCE 34)
/00 enrj.". .:
d ...''''''..
i IZ .i .
rr). 80
Q;,
z 600Q.U
tt 40
. LL.0
im 20Et °
Q.
ATTACHEDG ROW T H
V.!
SUSPENDED.. GROWTH
Buswed,et al. (32)Haug 1..McCarty,( 2)Balakrishnan, et al. (33),Huang Hopson,(34)
Downing, et al. ,(17,18)'
25TCMPERAT,URE , C
3-11
6
N
3.2.5.5 Effect of Dissolved.00gen.On:Kinetie
The concentration of dissolved oxygen (DO) has a signifi'cant effect on 'the rates of nitrifiergrowth and *nitrification ih biological: tr.eatiiietat.systems.11e Monocl relationshiP hasbeen used to model the effect of dissolVed oxygen,' considering oxygen, to be :a gfoWthlimiting subktiate, as follOws:
4' 7: ,
where: DO
KO
dissolved-oxygen, mg/1, andhalf-saturation constant for oXYgen, mg
British investigators found that the K02 value' was about '1.3 mg/I at an :unspecifiedtemperature.35 One U.S. investigator has suggested: a relationship that would iiidicate.',.half-saturation constants of 0.15 inW1 at 15 C and 0.42 mg/1 at 25 C,bUt did not ProVidesupporting.data.14 Studies conducted by the Los Angeles.County Sanitatiori Distriels#t itsPomona Water Renovation Plant represent one of the most careful attemptSAO eValuategieeffect of DO on nitrification rate:36 This faaility a combined carbon ',`oxidationnitrification plant. Sludge_ samples.Were withdrawn, dosed with ammonia, 'and aerated atvarious DO levels. Nitrification rates determined from the data collected 'are shown m Figure3-4.36 Fitted to this data is a Monod expression for nitrifiaation rate 1s a fiinetioic of DOThe K02 determined from- this data is .2.0,, met Temperature was not :specified;,, butindicated to be above 20 C.
Several' investigations have provided indirect evidence of the importance of the effect of DOon nitrification rate. A treatment plant .Operated continuously at a DO neat 1:trig/1 gavelower ,degreeS of nitrification than plants held at 4 and 9-mg/I.37 When'small scale activated::`sludge plants were held at 1, 2, 4, and 8 mg/l. British investigators, foUnd that the riitrification rates at 2.0 mg/1 were about 10 Percent lower than ate higher ;levels of DO, althoughnitrification was complete.35 Pilot investigations at the MetrO SeWer District of CinCilinati, ,
Ohio; showed that when the DO was held at 2 mg/1only about 40 percent nitrification :,
occurred, but when the DO was increased to 4 mg/1, about 80 percent nitrificationplace.38 Murphy found that in two, parallel activated sludge plants, that nitrification was..enhanced in the plant maintaining the DO at 8 mg/1 compared to the plant where. the'DO'Was maintained at 1 mg/I.39 '
The influence of DO on nitrifidation rates hasbeen somewhat controversial, as examples ofplants can be found' with completely nitrified effluents with operating DO levels of 0.5mg/I: However, this type of evidence does not indicate that nitrification rate was unaffected,merely that nitrification could be completed in the, presence of a low DO level. Lownitrification rates, depressed by low DO levels, an still be sufficient to cause completenitrification if the aeration tank detention time is large enough.
3-12
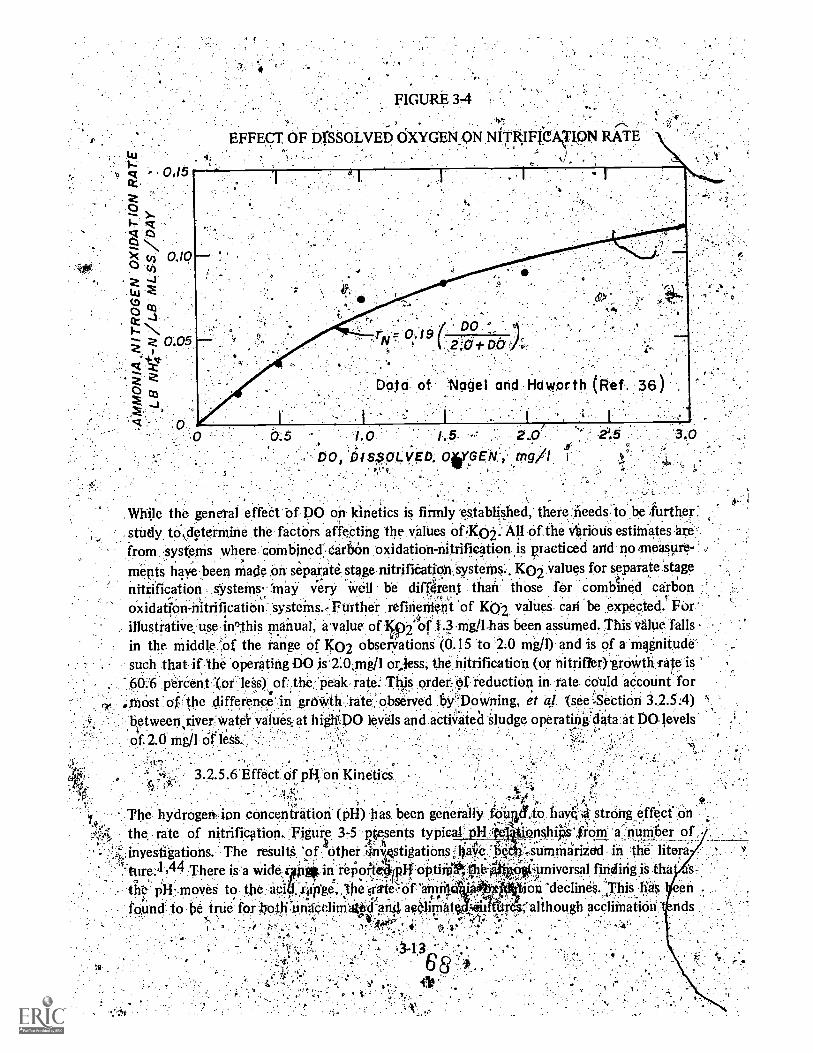
FIGURE.34
,
EFFECT. OF DISSOLVED OXYGEN_QN NITRIFICATIQN RATE
`
1%.
1
. DO.°2'f7 t6
Dafci of Nagel and Haworth (Ref. 3
I
b.5 1.4 2.0/00, _DISSOLVED. 0401GEN:; mg/1 1`
3.0
While the general effeot of DO on kinetics is firmly established, there needs:to be further:study todetermine the factors affeeting the values, oflo. All of the Orions estimates are'.from systems where. combined.Cartion oxidation-nitrifitation is practiced and heaSure-,
meets have.been made On separate stage nitrifitatiOrriysterns.. Ko2 values for separate 'stage
nitilfication systems' may very Well be difOrent thane those for 'combined carbonoxidation-nitrification systeins.- Further refinenient of KO2 valUeS can be expected. For.'illustratiVe, use in),this manual, avalue of Ii9214 1.3 mg/1 -has been assumed. This value fallsin the middle: of the range of KO2 observationS (0.15 to 2.0 mg/l) and is of a magnitudesuch that if the gperating DO is.2:0,rnel orjess; the nitrification (or nitrifier)-groWth fi4e60::6 pereentior leSs)..ofthe, 'peak rate This order; Of reductiOn in rate could aecount for
,Most .of:the difference: in growth :rate.:obseived .6)/,'Dovining, et aj '(see :S-ettiori 3.2.5:4)between river-Watel. Values:at higliiDO levels and, activated Sludge operatingdata at DO,levels
of 2.0 mg/1 of less.:
3.2.5.6tffect. of pH on Kineticsf'
The hydrogen, ion concentration (PH) has, been generally foUyt.to hay' strong effect onthe rate of nitrification. Figure 3-5 .kesents typical OW; iOnshiPtificim a number of
.5k,inyestigations. The results of other: tinvestigations:10aye."k4 ;..stirmilarizetd in the litera, There is a wide Pi, in refioPt4/00:oPtiM thitAittielpimiversal finding is .tha
the pH-, moves to the aq rage, the sr1teZ:bl" am lion 'declines. 'This hasfound to be true for llot,Ii!'iir;a,Cclirn4li'lj'an4 ag4ipilit -,ea ttars, although accliMatiOn
to moderate'.p1 -i tffects. The findings for an attached growth-reactor. (Curve 4, Figure XI)are very similar'to.the.fiticlings for an, activated slu ge.(CUrveC). In neither case were thecultures acclimated to e'an pH value prior to eterrnining- nitrification rates. When athree-week acclimation period was provided for e attached gtowth reactor, it, was foundthat the rate at pH 6.6 rose-to-85 percent of- the optimum rate at pH 8.4 to 9.0.34
Various investigators have reported the 'effects of pH depression on nitrification.' Forinstance, in an activated sludge with insufficient wastewater alkalinity, pH. values df 5 to 5.5Were attained. This high acid concentration resulted in a cessation of nitrification; at the
'same time sludge bulking occurred. The point. at which the rate of nitrification decreasedP 'Was pH 6.3,6.7.1 Parallel investigations on air and high purity oxygen-activated shitlgek systems at the Blue Plains Treat-I-fent Plant, Washihgton,,D.C., have shown that depressed
pH values in the last oxygen activated sludge stage produced slightly loWer nitrification ratesthan when the system was operated at higher pH.45 Further information on the EPAinvestigations,at the Blue Plains Treatment Plant is presented later in Section 4.6.5.
4In a study of the effect of abrupt changes in pH, ft vias. found that an abrupt change .inreactor PH from 7.2 to 6.4.caused no adverse effects. However, when the pH was,abruptly. changed from. 7.2 to 5.8, nitrification performance deteriorated markedly as effluentammonia levels rose from approximately zero to 11 rrig/lNH14-N. A return to pH 7:2 causedrapid improvement indicating that th6 lowered pH was lonly inhibitory and not toxic.15Haug and McCarty shOwed that nitrifierscould adapt to nitrify At pH levels as loW as 5.5 to6.0:2 1-1(')wever, since the concentration of biomass in their column was not defined eachpH level, no conclusions can be drawn from their work as to the effect of pH on the peakammonia oxidation rate, qN.
For illustrative use in th1is manual, the equation of Downing, et a1.431 shoWing the effect ofpH on nitrification is adopted. Fur pH values <7.2:
NA
N= 1.2 (I. 0.833(3.2 pH)) (3-16)
For p1-1 levels between 7.2 and. -rate is assumed 'constant. This .expresion wasdeveloped for combined catboh oxidation-nitrification: systems, but its application toseparate stage nitrification systems is probably conservative.
Because of the'effect of :pH on nitrification rate, it. is espkiallY. important that there besufficient alkalinity in the. washater to balance the acid produCed by nitrification.Equation 3-3A (Table 3-1) indicates that 7.14 mg of alkalinity are destroyed. per mg ofammonia 'nitrogen. caustic or lime addition ,may be required to supplement moderatelyalkaline wastewaters.; Msign considerations for pH control are presented in Section 4.9.
3.2.5.7 Combined Kinetic Expressions
-In previous sections, the effect of ammonia leVel, temperature, pH and dissolved oxygen onnitrification rate has been presented.. In all piactical systehis, these parameters act to affect
3-14
69

100
0
*FIGURE 3-5
EFFECT OF pH ON NITRIFICATION RATE(AFTER SAWYE , ET AL.) 1,
.o 't
_I I
4 --.ir- = "1"-- -z---..-=-=-_ .......t. _
. a. ...
.,7.
-.
....-
4.---..,.-4-;,...._,40:,
,-.
1
,,. .-;,,... I rt4
--
if
/// ''t
;,,*/ ,
*
...
.:;
...
. ..-
RIP
\E, ,
A, '
/.
er.
D/i , r
, :e
E ..
'
C.
:
.
...
.
. .
,
-i .of. I
. ,I
.
I I :i i_ i i
.
I
.:B
i i;-
'ti
I I,
60
KEYSYMBOL
A
BtD
E.
7.0
ENVIRONMENT
8.0
Ph
Ni4osomonas pure cultureNitrosornonas pure cultureActivated sludge at 20 CAct rioted sludge
9f0
REFERENCE
10 0
Engle and Alexander (4'0)M.yer hot (41)
*Sawyer, et al. (42) a,.
Downing, et al. (43)Attached 'growth reactor at 22 e Auang and Hopson (34)
a
the nitrification rate simultaneously. It has been shown that ta combined effect of several
limiting factors on biological growth can be introduced as a product of Monod-type
factors:46
where: L
concentration ocgrowth limiting substance N,
P concentration of growth limiting substance P, and
K L' N'KN, and KP
= half-saturation constants for substances L, N, and P, respectively.
KL + L KNN+
S.
concentration of growth lithiting substance L,
3 -15
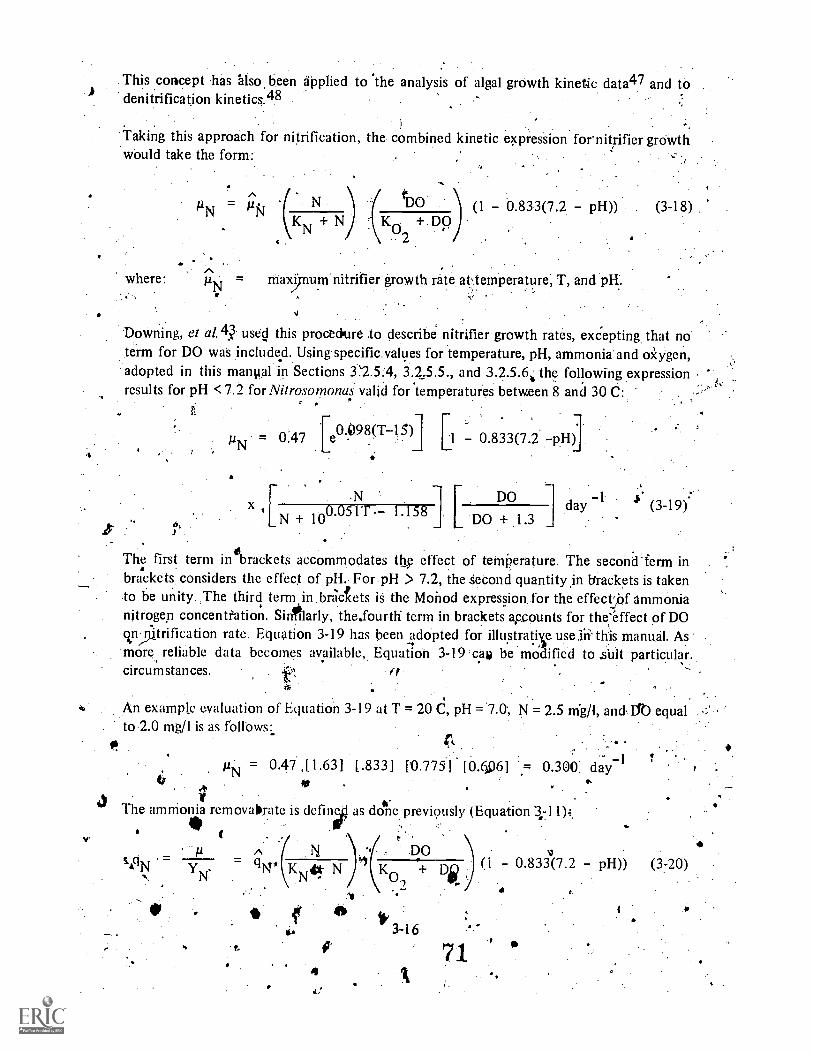
) This concept has 'also been applied to the analysis of algal growth kinetic data47 and todenitrification kinetics.48
Taking this approach for nitrification, the combined kinetic expression for'nitrifier grOwthwould take the form:
where:
=
K N+
.
tDO
" K + DK. nr- 0.833(7.2 - pH)) (3-18)
maxp-num nitrifier growth rate at:temperature, T, and pH.
Downing, et a1.4 used this procedure to describe nitrifier growth rates, excepting that noterm for DO was included. Using specific values for temperature, pH, ammonia and oxygen,adopted in this manual in Sections 3.'2.54, 3.2.5.5., and 3.2.5.6% the following expression ,
results for pH <7.2 for Nitrosomonas valid for temperatures between 8 and 30 C:it
I)
v.
14N = 0.47 fe0.098(T)] _ 0.833(7.2 -pH)
N DOx [N + 100.051T.- 1.158 [ DO + 1.3
day (3-19).
The first term in brackets accommQdates the effect of ternPerature. The secondlerm inbralickets considers the effect of pH. For pH > 7.2, the Second quantity.in brackets is takento be unity.,The third term in brictets is the Monod expression,. for the effect Of ammonianitrogen concenteation. Sintlarly, the.fourth term in brackets accounts for the:effect of DOon rate. Equation 3-19 has been adopted for illustrativ use.iii this manual. Asmore reliable data becomes available, Equailoh 3-19 .cats be mOdified to suit particular.circumstances. if
An example evaluation of Equation 3-19 at T = 20 C, pH = 7.0', N = 2.5 mg /t, and lib equalto 2.0 mg/1 is as follows:
0.47 j1.631 l.8331 ['0.775] W.6061 0.300 dayle
The amrnonia removalbratc is Mini as done previously (Equation 3;11):.
-IIYN.
1,
Nq
. DO
N + (1 0.833(7.2 pH)) (3-20)o.
it.
is
P
3-16
a.
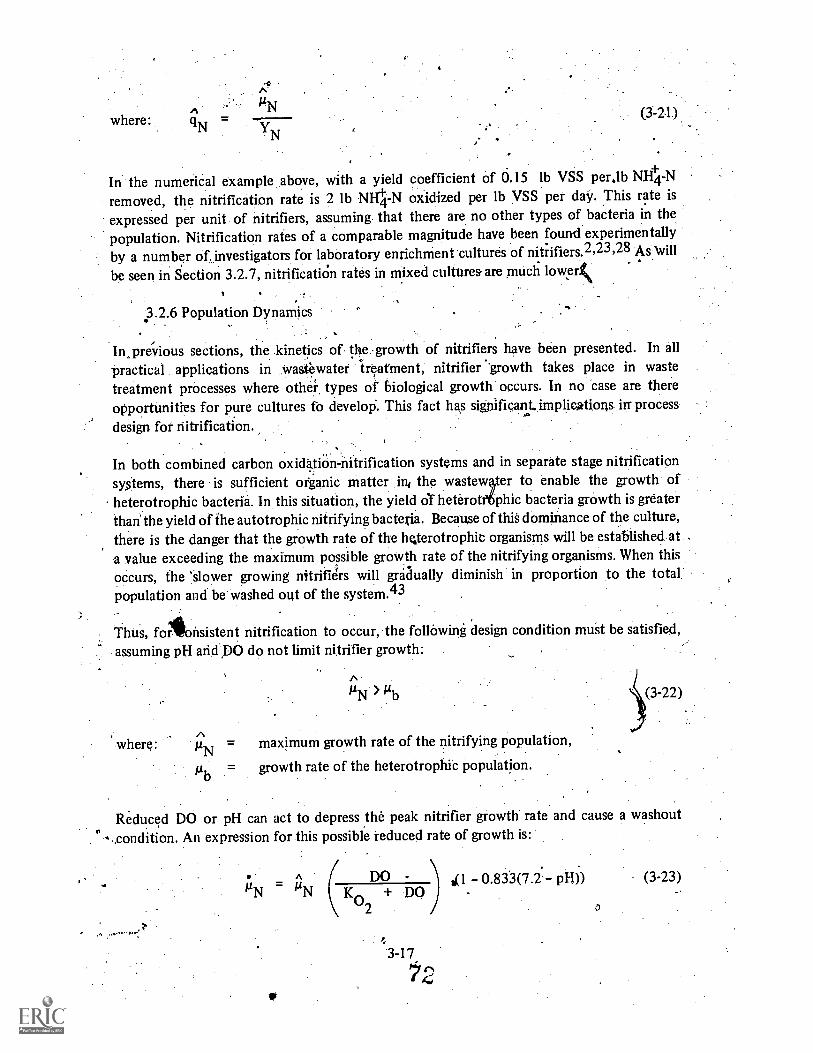
where:11N (3-2-1.)
In the numerical example above, with a yield coefficient of 0.15 lb VSS per.lb NH4 -N
removed, the nitrification rate is 2 lb NH4 -N oxidized per lb VSS per day. This rate isexpressed per unit of nitrifiers, assuming that there are no other types of bacteria in thepopulation. Nitrification rates of a comparable magnitude have been found experimentally
by a number of investigators for laboratory enrichment cultures of nitrifiers.2,23,28 As will
be seen in Section 3.2.7, nitrification rates in mixed culturea are much lower!
3.2.6 Population Dynamics
In.previous sections, the kinetics of the .growth of nitrifiers have been presented. In allpractical applications in wastewater 'treatment, nitrifier 'growth takes place in wastetreatment processes where other, types of biological growth occurs. In no case are there
opportunities for pure cultures fo develop. This fact has significantimplications in processdesign for nitrification.
In both combined carbon oxiaticin-nitrification systems and in separate stage nitrificationsystems, there is sufficient organic matter in the wastewter to enable the growth ofheterotrophic bacteria. In this situation, the yield Of heterotriphic bacteria growth is greaterthan' the yield of the autotrophic nitrifying bacteria. Because of thiS dominance of the culture,there is the danger that the growth rate of the hqterotrophit organisms will be established at .
a value exceeding the maximum possible growth rate of the nitrifying organisms. When thisoccurs, the 'Slower growing nitrifiers will gradually diminish in proportion to the total.population and be washed out of the system.43
Thus, foilkinsistent nitrification to occur, the following design condition must be satisfied,assuming pH arid p0 do not limit nitrifier growth:
where: gN = maximum growth rate of the nitrifying population,
Pb growth rate of the heterotrophic population.
Reduced DO or pH can act to depress the peak nitrifier growth rate and cause a washout
..condition. An expression for this possible reduced rate of growth is:
a DO - \ 41 0.833(7.2 pH)) (3-23)'N /1"11%1 + DO -
2 /
3 -17
72
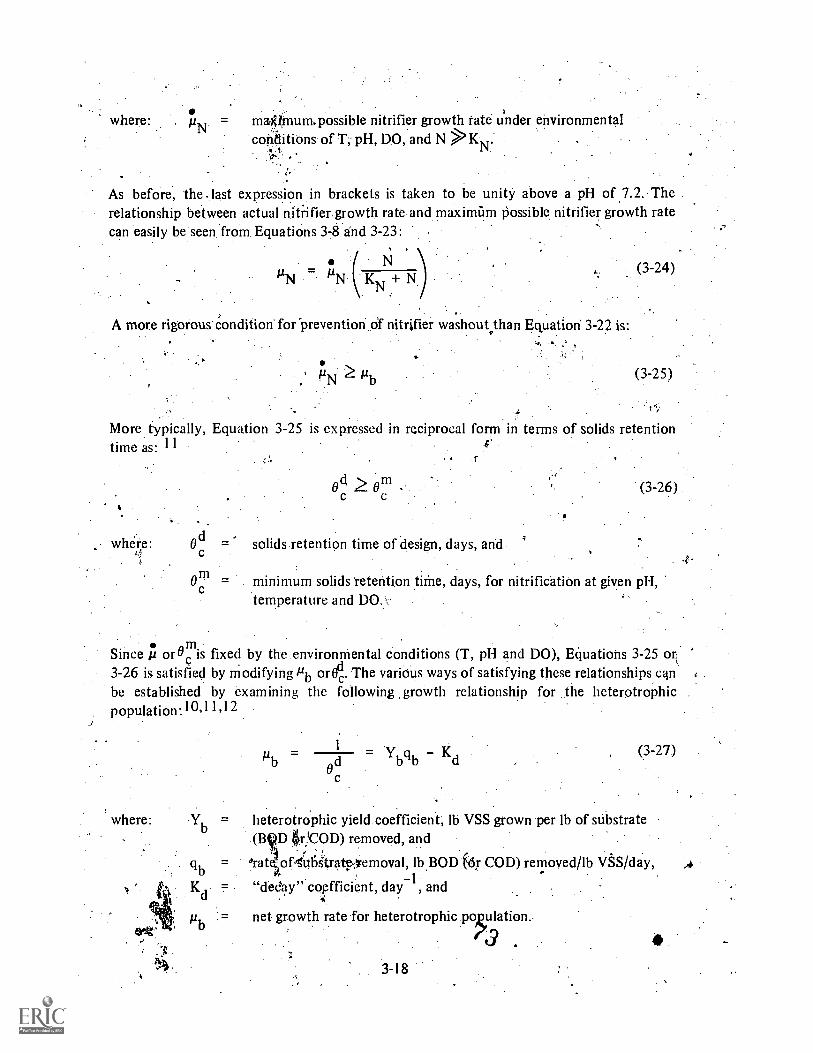
where: , tiN ma 1i nitrifier growth rate under environmentalcofielitions of T, pH, DO, and N N'
As before, the . last expression in brackets is taken to be unity above a pH of 7.2. Therelationship between actual nitiifier growth rate and maximum Possible nitrifier growth ratecan easily be seen from Equations 3-8 and 3-23:
N
/IN = KN +
A more rigorous condition for-prevention of nitrifier washout than Equation 3-22 is:
(3-24)
(3-25)
More typically, Equation 3-25 is expressed in reciprocal form in terms of solids retentiontime as: 11 e.
r
. where: Od =c
=c
Since 1.1 oroe is3-26 is satisfiedbe establishedpopulation:1°,1
where:
oci tomC C
solids retention time of design, days, and
(3-26)
minimum solids retention tithe, days, for nitrification at given pH,temperature and
fixed by the environmental conditions (T, pH and DO), Equations 3-25 orby modifying Pb or4. The various ways of satisfying these relationships canby examining the following growth relationship for the heterotrophic1,12
= Y KdOc
(3-27)
heterotrophic yield coefficient; lb VSS grown per lb of substrate(Bt ID or!COD) removed, and
tate:of4u# U4ate,..yemoval, lb BOD for COD) removed/lb VSS /day,
"delay" coefficient, day 1, and
net growth rate for heterotrophic population.
3-18

The rate of substrate removal is defined as:
where:
'HT =X1 =
influent total BOD (or OD), mg/1,
effluent soluble BOD (or COD), mg/1,
hydraulic detention time, days, and
MLVSS, mg/l.
(3-28)
Since both Yb and Kd are assumed to be constant, the only way Pip or Oc can bemanipulated 'is by altering qb. One way the substrate remoVal rate .can be reduced isto place an organic carbon removal step ahead of the nitrification stage, creating a "separate
stage" nitrification process. The result of' this procedure is to reduce the food, available tothe heterotrophic bacteria and to lessen their dominance in cor4rolling the solids retention
t time. Separate nitrification stages can have very long solids retention times (6d = 15 to 25days). Another procedure for reducing the substrate removal rate, without separating thecarbon oxidation and nitrification processes, is to increase the bioldgieal solids in thesystem. This can be done by increasing the concentration of biological solids under aeration(the MLVSS in the activated sludge system) or by increasing the volume of the oxidationtank while maintaining the concentration of biological solids at the same concentration.
s.
The level set for biological solids retention time, 6d , establishes the biologiCal solids
retention time (Or growth rate) of the nitrifiers, since selective wasting of the heterotrophic
population is not practical. Therefore, the' design solids retention time can be related to the
effluent ammonia level through the Monod relationship and the inverse relationship between
nitrifier growth rate and solids retention time (Equations 3-12 and 3-24). With specific
values of 0 cd , T, pH and DO, Equations 3-12 and 3-24 can be solved for the effluent
ammonia level. Figure 3-6 was developed by such a procedure, with the assumption of T
15 C, DO = 2 mg/1, and pH >7.2 <8. Also plotted is the nitrification efficiency, assuming
an influent Total Kjeldahl Nitrogen (TKN) concentration of 25 mg/1 and that all of theinfluent onitrOgen is available for nitrification: As can be seen; significant ,breakthrough of
. ammonia from the system does not occur unless the solids retention time is reduced below 5
days. At that point,' ammonia nitrogen breakthrough is very abrupt, rising from 1 mg/1 at
.0 c 4.9 days to the at 0 c = 3.6 days. The ptiycipal cause of the sharpness of the'. 'ammonia breakthrough is due to the low value of 41 (0.40.mg/1 NH4- N in this case). Anumber of investigators have experimentally determined very similar relationships to ghat
shown in Figure 3-6.
f.
19,20,21
LaWrende and McCarty I I have introduced the concept of a safety 'factor (SF ifitheapplication of biological treatment process kinetics to design. The safety factor w* defi d
rs
4.4

as the ratio of the design solids retention time to the minimum solids retention time; thesafety factor, can also be related to the nitrifier growth rates thr6ugh Equation 3-12..Theexpression for the SF is:,
ode NSF = (3-29)
Om /IN
A .conservative safety factor was recommended to minimize,process variations caused by pHextremes, low b(i.cOnqentratiohi,"and toxicants. I I Also, the. SF can be used to ensure that
, .
.ammonia breakthrough does not occur during diurnal peaks in load (see Section 4.3.3).,'I -
y..Interestingly, Equationl 314101409nipt*ted tokshowifiat the specification:of a SF of 2'wjll esthlish an ammonia Itiel4 equal '16, KN in. the effluent of a complete mix activatedsludge Plant, d there is 4 high D041pvel.(DO not limiting).,This is bedause the processWillbeoperating it one;half its niaxiniutn growth rate...Recall that tge half-Skiiration- constant, K/4,in this Monod expres:sion.is defined.aS the:100'4f substrate huh will daitse,,the- orgrism-i9
,
FIGURE 3t,
EFFECT OE tETENTION TIME ON EFFWENT'AMMONIA;..CONCENTRATION AND NITRIFICATION EFFICIENCY-
4.1., -7-777.7- 100
'90
.
.
.c76. 7--
\; :r
5 O.'''. .
*o!"'-
,';
1
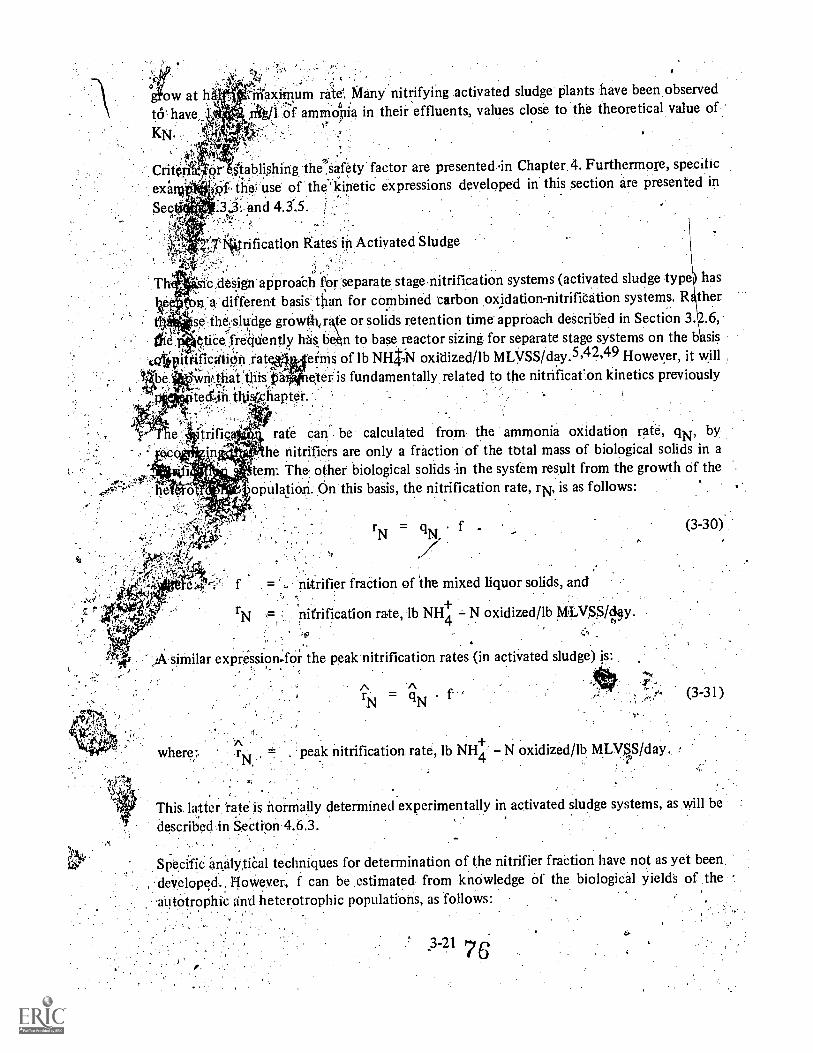
, .riiiaxfinum rite: Many nitrifying activated sludge plants have been observed
"g/1 .of ammonia in their effluents, values close to the theoretical value of
-
qr stablishing the ,safety factor are presented in Chapter. 4. Furthermore, specificuse of the 'kinetic expressions developed in this section are presented in
rification gates in Activated Sludge
.5.'e design approach for:separate stage nitrification systems (activated sludge type has
a: different basis'than for combined carbon oxidation-nitrifiCation systems. R ther
se.fhe,sludge growth* or solids retention time approach descrilied in Section 3. .6,Ctiee freqdently lAsbe6 to base reactor sizing for separate stage systems on the b sis
irittificatis$n rat,parierins of lb NH .N oxidized/lb MLVSS/day.5,4,49 However, it will"*wnt.tfiat`this..,04e,ter is fundamentally related to the nitrification kinetics previouslytect,jh thisCchapter. ,
rate can be calculated from the ammonia oxidation rate, qN, byn!..qtroy he nitrifiers are only a fraction of the total mass of biological solids in a
tem. The. other biological solids in the system result from the growth of theopulatiOn. On this basis, the nitrification rate, rN, is as follows:
rNf .
nitrifier fraction of the mixed liquor solids, and
nitrification rate, lb NH4 N oxidized/lb MLVSS/flay.
similar expression-for the peak nitrification rates (in activated sludge) is:
A 'A
Nr = q
Nf
peak nitrification rate, lb NH4 N oxidized/lb MLVSS /day..
(3-30)
(3-31)
This latter, 'rate is normally determined experimentally in activated sludge systems, as,will be
described #n Section 4.6.3.,
Specific 'analytiCal techniques for determination of the nitrifier fraction have not as yet beendeveloped,, However, f can be estimated from knowledge of the biologiCal yield's of the..antotrophic and heterotrophic populations, as follows:
.3-21 p?

where:
1%1'
MN + Mc
nitrifiers grown through oxidation of ammonia, and
heterotrpphs grown through oxidation of organic carbon;
M and. M can be estimated 'as follows:N . c
where:
where:
(N0 N1)
TKN in the influent, mg/1, and
NE N in the effluent, mg/l./4
(3-32)
(3-33)
S05
carbon (BOD5 or COD) in the influent, mg/1
S1 carbon (BOD5 or COD) in the effluent, mg/1, and
b net Yield of VSS of heterotrophs per unit of carbon (BODCOD), removed.
(3-34)
This proCedure neglects the ammonia assimilated by heterotrophic, growth and therefore isapproximate. A further approximation is that the net yield of the heteiptrophs has beeriassumed constant,,,whereas it is known that it varies with solids retention' time.
Several examples can be drawn for separate stage nitrification systems as compared tocombined carbon oxidation-nitrification systems. In a 'separate stage "system, 'Illustrativevalues of BOD5 removed and TKN oxidizedwouldte 50 mg /I and 25 mg/1, respecti\ty. Areasonable estimate for YN is 0.15 4b/lb NHZ-N rem. (Section 3.2.2) and for Yb (D),0.55 lb/lb BOD5 removed. Thus; for'this separate stage example, `f can be calculated to be
0.15(25) 0.120.55(50 1- 0.15(25)
A :similar example can he drawn for combined carbon 'oxidation-nitrification. systems.Assurning 200. mg/I of BOD5 removed and 25 mg /I Of TKN oxidized, f Can be calculated tobe:
0.15(25) 0.0330.55(200) + 0.15(25)
3-22
i.

Thus, it can be seen that the fraction of nitiifiers is :lower in combined carbonoxidation-nitrification systems that in separate stage nitrifitation systems.
Equation 3-32 can be reexpressed in terms of the BOD5/TKN ratio in the influent,:, by
assuming effluent BOD and ammonia are negligibly small:
legamsr'leftk. . ,7,-'::k ,
condition. where YN ;-= .0.15 and ,Vb (BOD5) = .55. For most separate stage nitrification 'p
f5 riTable 3-5 presents numerical values for the fraction of nitfiefs, using Equation 3-35, and 'a
systems; the BOD5/TKN ratio is greater than 1.0 and less than 3.0 (Section 4-2). Thus evenin separate stage systemS, the fraction of4nitrifiers is relatively low. For the assumed yieldvalues, the fraction is less than 20 percent and greater than g percent. It must be emphasizedthat the values of nitrifier fraction given in Table 3-5 are estimates only, and not supported.by actual measurements of nitrifier fractions:Table 3-5 does haVe value in that it shows, atleast qualitatiVely, the impact of influent BODs/TKN iatio on the Traction of-nitrifiers in a
. , nitrification syStem. The influence of this ratio on "nitrifier fraction and nitrification rates.was recognized as early as ,1940, when Sawyer showed that the 130D5/NH3 ratio correlatedwith .the nitrifying ability of various activated shidges.'u .--
so
NO
The, effect of ammonia concentration on the nitrification rate is portrayed in Figure 3-7.The assumptions made, were f = 0.1, pH > 7.2 <8, and the DO = 2.0 mg/1..Equations 3-20,3-21, and 3-27 were eitiPloyed to construct the figure.,As Can be seen, the nitrification rates
TABLE 3-5
RELATIONSHIP BETWEEN'NITRIFIER FRACTIONAND THE 801415/TKN RATIO
BOD5/TKN ratio
Nitrifierfractiona
BOD /TKN ratio
0,. 5
1
2
3
4
0.35
0.21
0.12
0.083.
- 0.064
5
6 .
a Using. Equation 31-35. and LN=o . is, Yb. = 0.55.
3-23
78
Nitrifierfraction
0.054
0.043
0.037
0.033
0.029
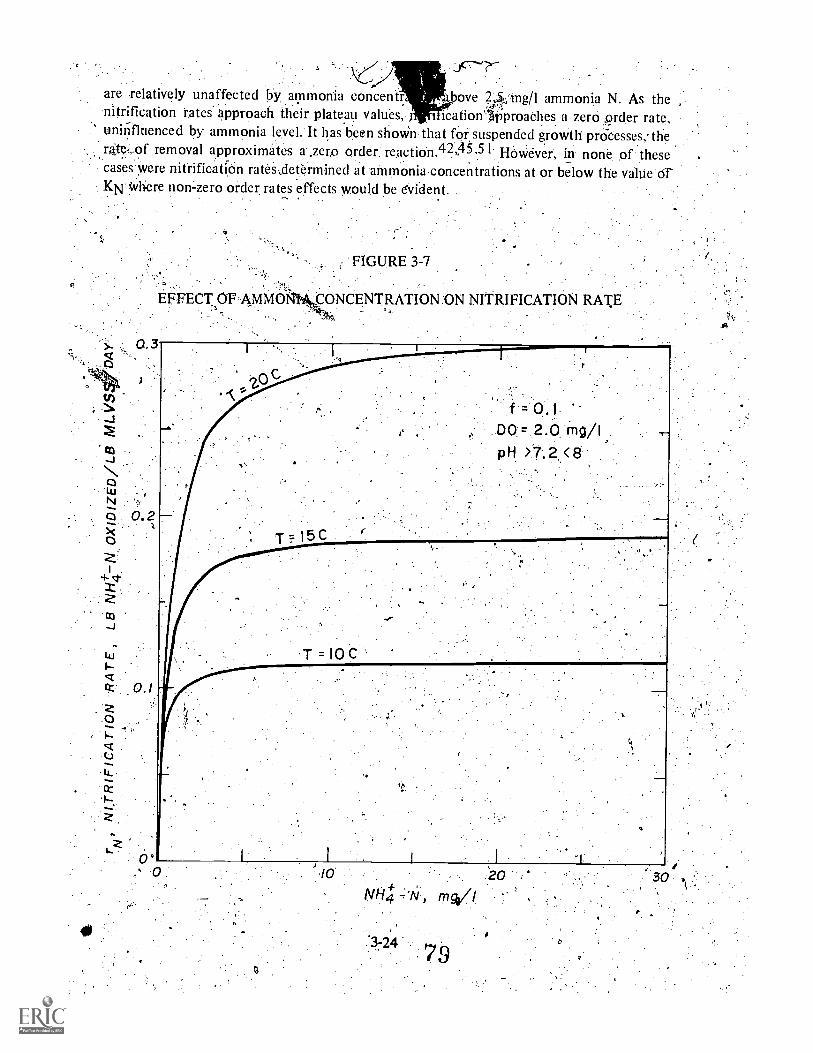
are relatively unaffected by ammonia concentr bove 2 ,'mg/l ammonia N. As thenitrification rates approach their plateau values, i icationlyproaches a zero order rate,uninfluenced by ammonia level. It has been showsn that for suspended growth processes therate,, .of removal approximates a .zero order reaction.42,0,51 However, in none, of thesecases were nitrification rates, determined at ammonia concentrations at or below the value drKN ivhere non-zero order rates effects would be evident.
EFFECT OFAMMONIVONCENTRATION ON NITRIFICATION RATE

The fraction of nitrifiers has a marked effect o'n the nitrification rates. Figure 3-8,
demonstrating this effect, was developed similaily to. Figure 3-7, excepting that the effluentammonia nitrogen concentration was assumed to be 2.5 mg/l. A principal means ofincreasing the nitrification rate is to increase the fraction of nitrifiers Prom Table-3-5, it canbe seen that this can be accomplished by lowering the BOD5 /TKN ratio. In terms of plant
FIGURE 3-8
EFFECT OF TEMPERATURE AND FRACTION OFNITRIFIERS ON NITRIFICATION. RATE

design, the BODITI(N ratio.can be altered by increasing the organic carbon removal aheadof the nitrification Unit
It must be emphasized that the nitrification rates 'developed in this section are only,estimated relationships based on theoretical considerations. Actual measured values. are
4aitipresented in Section 4:6.3.;
, .
.4t§ a practical example of the effect of the,130D5/TKN. ratio on nitrification rates, rate datafor an attached growth system44 are Plotted against the B065/TIOI ratio in. Figure 3-9. Theeffect .of BOD5 in the sinthetic Waste was to displace nit;ifiers Witiffieterotrophic bacteria inthe bacterial ..Elm, thereby reducing the nitrifier fraction. tend the 'nitrification rate.
.InterstinglY, a small amonrit of .BOD5 ,ti 10 mg/I) to enhance the nitrificationrate.
EFFECT OF BOD5/TKN RATIO ON NITRIFICATIONRATE - EXPERIMENTALATTACHED-6-ROWTI-I'SYSTEM
Initial,.>N047N.=,-- 20 mgtialContact Time' 94 sec,phf97:41, Temperature
.; $
"3.21:2-Nitrification Rates iri Trickling Filters and Other Attached Growth Systerris
.
Disclissibn of kinetic rates in the previous sections has..beeil:.primarily oriented to,nitrification in activated. Sludge type (sUSPended growth) nitrification SysternS, althoUgh
some comparisOns' have been drawn with attached. grOwt1). , System ",measurements fOr
comparative purposes. The growth, and oxidatiOn 'rate 'relationships presented inSectiOrW.:3.2.5.7'arid 3.2.6 are directly applicable to design of suspended growth systei.aS, as,Will be
shown in Chapter 4, While these relationshipi are OperatiVe in attaCked growth systems,
application is cOmplicated by the fact that 'oxygen. mass .transfer limitations through t.he,
. bieferial slimes may limit reaction rates in some, sitdrationi..A biofilm piodelhas. beendeveloPed ',which yields insight into which factors, are controlling ,2' but it haOlhot,ietbeen extended to the point where it can be applied directly ,to design applications. Asaconsequence, the 'design relationships presented for attachedgrowth nitrificattiorOn.Chapter
4 are empirically based and therefore, lesi' thebretically :pieciSe than those del/6161;0 for
suspended agrOwth syterns. Though the design relationships presented-are' empirical, where
pOSsible the loading relatiOnshiPs are ,presented on 'basis that;is'atjeast consistent with .the
biofilm model. Vol. instance, ammonia-nitrogen oxidation rateiraie epreSsed on a,surface'area 'basis, when describing separate stage nitrification in ;trickling filters .and the rotating:
biological disc procegs{Sections 4.7..1 and,4:7.2):::. ,
. , .Some -of--the conclusions that - can be :drawn from the biOfiirri 'zriodel of interest in 1!
.
cdnsideriwirface ammonia removal rates,in ,attacjied groWth ,Systems:Thebiofilm'model
. shows e ammonia oxidation' rate in attached systenis'shoUld notbedecreaged:
as drislically under adverSe environmental conditions as ,in.s1Spended growth systems:
:This firtding is consistent With the observation made m Section; 3.2.5.4,. namely thatattached igrowth systems have an advantage over suspended growth in withstanding',:
lower temperatures without as severe, losses in littrification rates:
The biofilminodel also shows that the dissolved 64geniconcentration must be' 2.78tirries
the ammonia nitrogen cmceritiation to prevent oxygen transfer, froth. Iimitirig,nitrification
rates in attached grocAh SYstems.5/ Two operational procedures, have beenuggested.lo.overcome this limitation:'(1X,dilution ot,the ammbnia nitrogen through r lation and
increasing the oxygen transfer through the use-,of high purity 94 2 The .first
recommendation has been made in this iri`annal in Sections 4:4:1.4 and 4.7.1,;
,
3.2:9 Effect of Inhibitors .on Nitrification
- ?":4
.CertOn..:1-ieavy m_ etals and, organia' compounds are toxic toliitrifiets:Io date, these 'effects.have not been qUantitatively incOrporated:into'the kinetic description of nitrifiergioWtir,..''
44hough such approaches ave been used to describe toxicity,in-other,biological, Systems. A
ligting *Of subStarices toxic to unaecliniated nitrifying organisms is presented in
Which is drawn primarily from the'reVieW by Painter:.
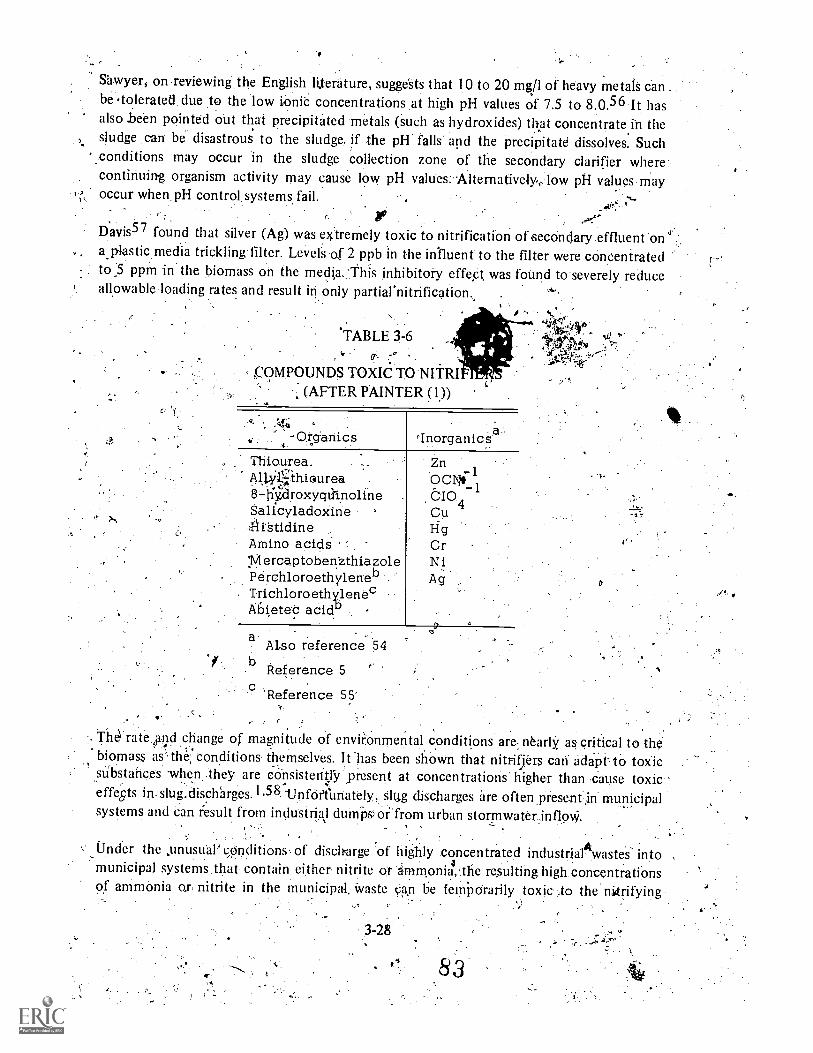
. .
Sawyer, on reviewing the English literature, sugge`Sts that 10 to 20 mg/1 of heavy metals can .
be °tolerated due to the low ionic concentrations at high pH values of 7.5 to 8.0.56 It hasalso been pointed out that precipitated metals (Such as hydroxides) that concentrate in thesludge can be disastrous to the sludge. if the pH falls. and the Precipitate dissolves. Such
'conditions may occur in the sludge collection zone of the secondary clarifier where:continuing organism activity may cause low pH values:-Alternatively,, low pH values mayoccur when pH control systems fail.
r..
Davis57 found that silver (Ag) was, extremely toxic to nitrification of secondary effluent on, a. plastic media trickling filter. Level's of 2 ppb in the influent to the filter were concentrated
to,5 ppm in the biomass on the media...This inhibitory effe,ct, was found to severely reduceallowable loading rates and result in only partiarnitrification.,
S:414b
.3t''1V;! t,tr'
'TABLE 3-6
< COMPOUNDS TOXIC TO NITRI(AFTER PAINTER (I))
Organics 'InorganicsThiourea,Aityi` .thiourea8-KyaroxygdipolineSalicyladoxine4-11.§tidineAmino acids1\ilercaptobenZthiazolePerchloroethylenebTrichloroethylenecAiSietec acid'
a Also reference 54b
Reference 5
`Reference 55-
ZnOCNt
1
dm4
1
CuHgCrNiAg
The,.rate u.).0 change of magnitude of environmental conditions are; nearly as critical to the.,
biomass as' the: eonditions.themselves. It-has been shoWn that nitrigers can adapt-to toxicsnbstaribes when they are consister41Y present at concentrations higher than cause toxiceffests slug.dischhrges. 1.58 tlnfoilunately,,slug discharges are often.prese.n(in municipalsystems and can result from industrial durnpsOi.from urban stormwaterinflomi.
Under the ,unusual'Onditions, of discharge of highly concentrated industrial*wastes' into;municipal systems.that contain either nitrite or acmmonia,the resulting high concentrations
of ammonia or nitrite in the municipal. Waste can he temporarily toxic:.to the nitrifying
3-28
83

ti
kn
:-. population. 7 When these conditions are suspected, the reader is ferred to reference 59
which contains &tarts which allow the identification of the .'regions of tocicity. Undernormal fluiniCipal 'conditions of pH and concentrations complete nitrification will occur.
When concentrated indtglrial wastesNe present, slug discharges should be avoided; rather,
storage facilities should be provided so that wastes can be metered into the collection
system at a rate sufficient to ensure dilution to safe loads.
In sum, the possibility of toxic. inhibition must be recognized in the design of nitrificationsystems., Either imPlementation et' source' control programs or inclusioT of upstreamtoxicity removal processes may be required, particukfly in those Ases where significantindustrial dischargers are tributary to the collection syIteni.,
3.3 Denitrification - *
The biological procesS of denitrification involveslpe conversion ornitrate nitrogen to agaseous nitrogen Species. The gaseous product is priaarily nitrogen, gag but also, may benitrous oxide or nitric oxide*Gaseous nitrogen IS relatively unavailible for, biologicalgrowth, thus:denitrification converts niftgen which may 1411 an objectionable form to onewhich. has.no significant effect on environmental quality.
'As opposed to nitrification, a . relatively, broad range of bacteria can accomplishxlenitrification; including Psuedomonas, Micrococcus, Archromobacter and. Bacillus. Thesegroups accomplish nitrate reduction by what is knovni;'as a process of nitrate dissimilationwhereby nitrafe.or nitrite replaces oxygen in the respiratory processes of the organism underanoxic conditions. Because ofihe ability of these organisms to use either nitrate or oxygen
as the terminal electron acceptorS while oxidizing organic matter, these organism; aretermed facultative heterotrophic. bacteria.
Confusion has arisen in the literature in terminology; the process has been termed anaerobicdenitrification. However, the principal biochemical pathways are not anaerobic, but merelyminor modifications of aerobic biochemical pathways. The term anoxic denitrification ispreferred, since it describes the environmental condition of theebsence of oxygen, withoutimplying the nature of the biochemical pathways.
3.11 BioChemical Pathways
Specific information on the specific bjochemical reaction intermediates involved. in
denitrification are available in the literature60 and only certain.aoncepts are of interest inProcess=design applications; Denitrification is a two-step process in which the first step is a'conversion of nitrate to nitrite. The second step carries nitrite through intermediates tonitrogen'Oas. This two -step process is normally termed "dissimilation."
Denitrifieri are also capable of an assimilation process whereby nitfate.(through nitrite) isconverted tip ammonia. Ammonia is then used for the bacterial cell's nitrogen requirements.
,
3-29

If ammonia is already present, assimilation of nitrate need not occur to satisfy cellrequirements.
As will be shown in Section 3.3.2, electrons pass from. the carbon source (the electrondonor) to nitrate or nitrite (the electron acceptor) to promote the conversion to nitrogengas. This invokes the nitrifiers "electron transport system" and is involved with the releaseof energy from the carbon source tOr use in organism groth. It happens"that this electrontransport system is identical to thit used_ for respiration lby organisms oxidizing organicmatter aerobically, except for one en4me. Because of this close relationship, manyfacultative bacteria can shift between -using oxygen nitrate (or nitrite) rapidly andwithout difficulty.
3.3.2 Energy and Synthegis Relationships
The use of oxygen as the final electron acceptor is more energetically favored thlan the useof nitrate. Table 3-7 compares the energy yields per mole of glucose when oxygen andnitrate are used as electron acceptors.6 I The greater free energy released for oxygen favorsits use whenever it is available. Therefore, denitrification must be conducted in an anoxicenvironment to ensure that nitrate, rather than oxygen, serves as the final electron acceptor.
'TABLE 5-7
COMPARISON OF. ENERGY YIELDS OF NITRATE DISSIMILATIONVS OXYGEN RESPIRATION FOR GLUCOSE
Reactiona
Energy yieldaper mole glucose,
kilocalories
Nitrate dissimilation5 C.
611 1L n 0 6
+ 24 KNO
Oxygen respirationC H 0 + 60 0-6C06' 12 6 2
300O2 + 18H20 + 24 KOH + 12N2
+2
6F120
570
686
RefeFence ,61
.
-Methanol, rather than glucose or any other organic, has seen widest use as,, the plectron'donor in the U.S. (see Section 3.3.4). Using, methanol as an electron donor and ne ting.synthesis for the moment, denitrification can be represented as a two-step process as ownin Equations 3-36 and 3-37:
3-30
85
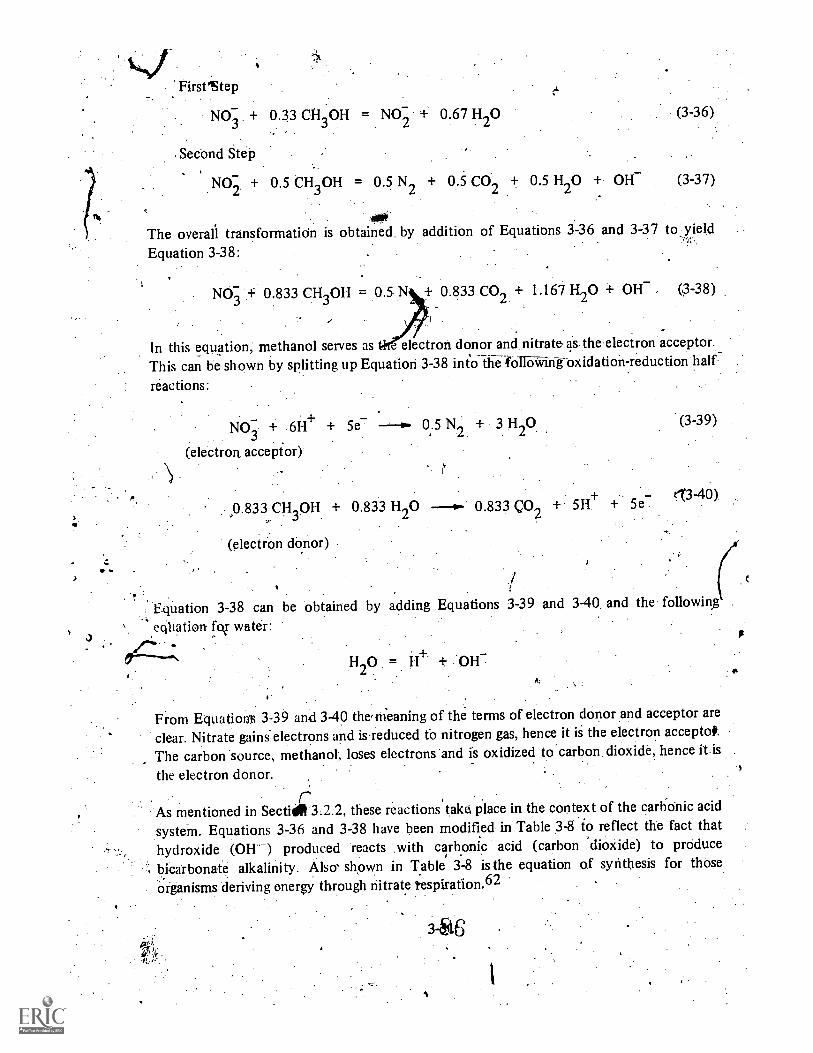
".
a
First'Step
NO3 + 0.33 CH3OH = N0-2
0.67 H2O
Second Step
(3-36)
NO3 + 0.5 CH3OH = 0.5 N2 + 0.5 CO2 ± 0.5 H2O + OH (3-37)
The overall transformatiOn is obtained by addition of Equations 3-36 and 3-37 to yield
Equation 3-38:
NO3 + 0.833 CH 30H = 0.5 N + 0.833 CO2 + 1.167 H2O + OH (3-38)
In this equation, methanol serves as - electron donor and nitrate as the electron acceptor.
This can be shown by splitting up Equation 3-38 into the 611Wirigoxidation-reduction half-
reactions:
NO3 + 6H+ + 5e 0.5 N2
+ 3 H2O
(electron. acceptor)
0.833 CH3OH + 0.833 H2O
(electron donor)
0.833 c02 + 5H+
(3-39)
13-40)
w.
Equation 3-38 can be obtained by adding Equations 3-39 and 3-40 and the following
equation for water:
./*"'H2O = + OH
From EquatiorA 3-39 and 3-40 the,m-eaning of the terms of electron donor and acceptor are
clear. Nitrate gains'electrons and iseduced to nitrogen gas, hence it is the electron acceptotThe carbon source, methanol; loses electrons and is oxidized to carbon dioxide, hence it.is .
the electron donor.3
As mentionedmentioned in Secti. 3.2.2, these reactions take place in the context of the carbonic acid
system. Equations 3-36 and 3-38 have been modified in Table 3-8 io reflect the fact thathydroxide (OH--) produced reacts with carbonic acid (carbon 'dioxide) to prciducebicarbonate alkalinity. Also' shown in Table 3-8 is the equation of synthesis for those.
organisms deriving energy through nitrate tespiration.62
3-E46

The equations for energy yielding reactions (Equations 3-36 and 3-37) have been combinedwith the equation for oganism synthesis (Equation 3-41, Table 3-8) through knowledge oforganism yields and are summarised in Table 3-9. Also, shown for completeness is the
T)
combined expression, for oxygini respiration (Equation 3-44) since, if any oxygen is present,it will be used ptefereintially. Sithilar expressions can be developed for other organic sourcesserving as electron donors if organism yield.s.are knawn.63.
TABLE '3 -8
RELATIONSHIVS FOR NITRATE DISSIMILATION AND GROWTH INDENITRIFIC4TION REACTIONS
Reaction EqUation Equation
a
Nitrogen dispimilatipl
Nitrate tenitrite
Nitrite tb nitrogen gas
Nitrate to nitrogen gas
Synthesis denitrifiers
NO3
+- 0.33CH3OH =
NO2 +0*.33H20 +0.33H CO3
02 2
+0.5 CH 30H + 0.5H CO3
=
0.5N + HCO3 H2O
NO3 + 0.833 CH 30H + 0.1 42H CO3
= 0.5 N2 r 1.33 H2O + HCO33
14 CH3OH +3 I103 4H CO
3=,
'3.05
H 702N + 20 H 0, 3 HCO3
V
3-36A t,
3-37A
3-38A
3 -41
The theoretical methanol requirement 0r nitrate reduction, neglecting synthesis, is 1.9 mgmethanol per mg nitrate N (Equation 3-36, Table 3-9). Including synthesis (Equation 3-42),the requirement is increased to 2.47. Similarly, EquatioN 3-43 and 3-44 in Table 3-9 allowcalculation of methanol requirements for nitrite reduction and deoxygenation to allow acombined expression to-be formulated for the methanol requirement:62
= N + 1.53 NO;
3-32
0.87 DO (3-45)
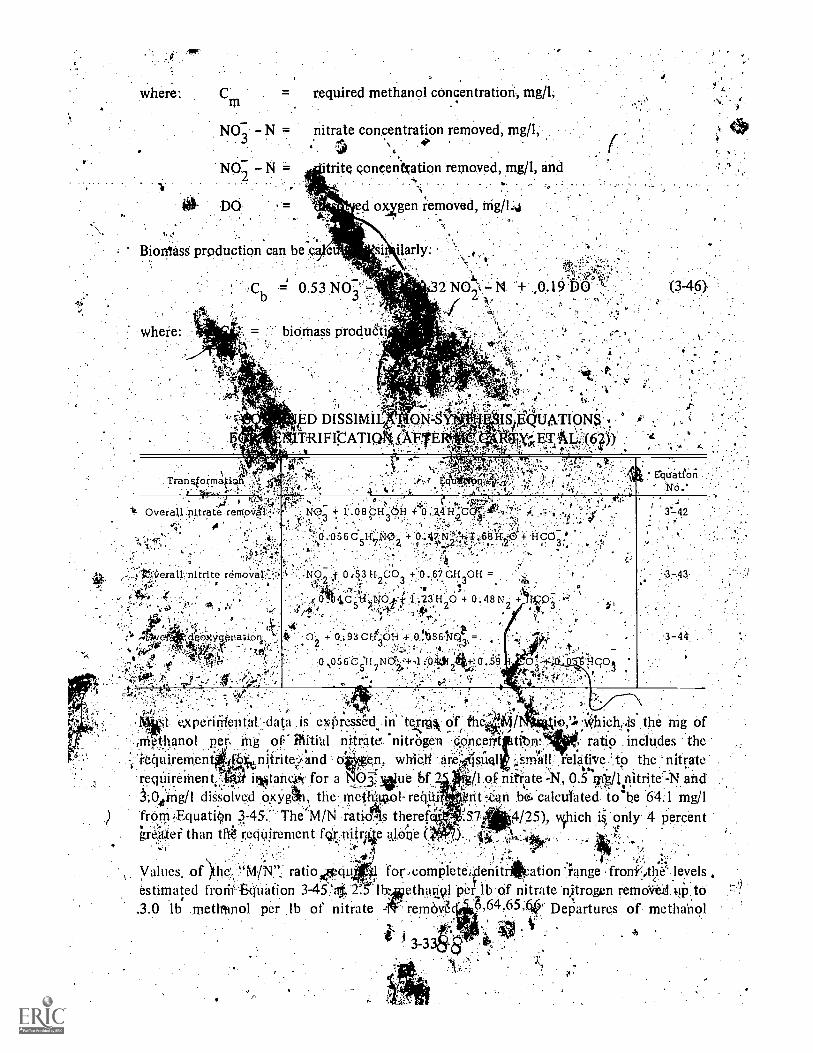
where: required methanol concentration, mg/1,
NO3 N = nitrate concentration removed, mg/1,
trite concentration removed, mg/1, and
DO 1,744,4 -d oxygen removed, trig /l:4t,
ilarly:
D DISSIM11,4TRIFTCATI
E'quttCtli
t14,1 tk:. ; doa.Xygpltdorl.,,,
;,0 .056 C5H:N+29' + ..174.,113;+,0.t8A ,17t- H CO
:No
. . .
,f 04.5,3 H2CO3 '0 .,6,7 CH 30H =
314, zN.j15.44 ..23H 0'1- 0 48 N +ticr)f0 4C,/,ir 5 7-0-4..,t 2
o? 3
a:93 cte Ot-1 4 13%5611Q1' =
0 056 O "(lid{4.
56 )15 7 2 2 .: 03 tiQ,Q gol
Nt expe-ririlepfali..daca is eOress&d:: in twsik. of thr
'which,.,is the mg ofsiriethanol p4, iii of thitial nitrate. "nitrbgen CA:wet:0 trOrc . ratio .inCiudes the
.-. re_mirernen ; . nitrite van en w e are AisualA f4 ''' d ot* hi I/ ..' '' small felative .' to the nitratereqUirethen(-.: it*tarie:cit for a 12.S4sihe bf -7 /1 of nitrate 4%1, 0.5 tr:g/lnitrite.-N and
,13..t.ing/1 dissolved oxYgtt1, the rnetli!,90:retitt1 tit.ori be. calculated to'be 64.1 mg/I.
from EquatiOn 3-45.- The'M/N ratios theref...
greater than tfIZ requirement fcirpiirfa4e ajoile t4125), which ii only 4 Percent
. ',
it,, Aolti ,; -..
' -4 AIL . :. ' .(:',..` '..-1.Values, of )the. "Mii\i'', ratio4cq 1 focompletei..denitniration range front /the levels.estimated trorh -84ta,tion 345'4, 2. ethanyl per lb of nitrate njtrogen remcilitel up to,...
,64,65;,(iti,.3.0 lb methtmol per lb of nitrate i '-reinOVZ Departures of methaholV
,w3_3
4t xitit
(?,requirements from Equation 3-45 are Most due to variations in sludge
:exp Tim etital SYstenik. It been suggested 'that column deriltrificariOnlotker MIN ratio 11146,NsuSpended growth sySterns,clue to the higherconcentra;rio
'maintained in the corturin systernS.67.Highef biomass levels produce longer soltd4e:tentiqp..-es and redtice organiStp "yields due to increased endogenous metabolism. InItiftrAl)ier yietd would..result in less methanol reqtrire,d fof Ynthesis and reduce fhe
ratio. , .f0 : .. ':. ,.:...'-',' :4.:- ':4:,...,,
In 4-general, * M/Nifatio of 3.0 will erktble:`,`complete"'denitrification (95 prcentcretrirciV414of 41?1 .,
\ Thnifrate) and this value'may be used for design purpoSeS. when methanol is ernployqd ki. e .
. lca.clion spice fbr denitrification. 4.,c 4
,. All, .
3'3.5 Alkalinity and,p171 Relationships. .
IqUationst -42 and 1-43 (Ta.fiN 3-9) show that ibiearbtate i roduced an ca iirilq.j 1
, ... .. 4 i
tostoceptriition is ,redtfred whehver nitrate or ,iiiti-ite if?, denitri.Oed'fo ri);trOgtn, gas.414 11:e44. .
hlk 1 t..'4 'Ceti ''cr dsiistoichipmetric qtantity o lkaliu4y prodXced is 3:5,7 mg a ini ys.as a ,31pro Lice .. cr6- 4 ..4. k rrngof,nitrate orsnirl,rite 211,,reducod- t4t) nitrogep gas. ..
10 f1 .
-r. . ; ;,i ; ? t-0Y1
C +
Sinue 3601i
etalkplini ty conce, t it rati.!34 ,
It i' nc re' u: sed and the ch' ibbife;aid c,' oncg'
.,
tra' tibn is1red4ed..th teAenc r ap n T a on is-:to :at l east partia if y ie r ,t h ,, ftActs of
nitrifiqatiotand'AsoWte pH tit t&- bidlogieal reactiop:(Equatisiii,3).Q.triitrjfic4tion onlypartially offsets Ote alll ilinity loss cauel liy,nitricioa,tion, sincelliealkliqity g4i9 per.mg ofnitrogen-is orilx(trre,half the los c.ausedtby filliiificafion 6eisection 3^',i6....
0-.:i .. 4,-, 4,;- .. f ,
Measured alkalinity p tdy'ctio`r ias been re-fiatgd: to be esoineivihat loVver thih, indicatedtheoiefically.tE5tperitt&trts with an attached gfoWqh.litv.0.4.,;(*.hi5mMilif-7thaWlite alkalinityproduced averaged 2.95ppg as ,CaCO3 per f iiiipgen rf '61. 5 Similarly, the ratii4 fora suspendO0groyksystent Aik 2.89.6 'De tures frOmithOty may be 'clueg.,the fact thatEquations P3-42 ktind ....It, (Tibe 3-9) .'representa',..orisitripliartioli'S 'of he biological
transformationN ,'king e anno not kclii de all*-4,:torS;affeCting atikatinity prodUction.V
A value for .41inity p o for enginteri4; cal6tilatitinS, would .be 3.0 mg.t54
alkalinitYasga(0 eriiig nitrogen reduced: 4, ,
3.14 A.ltern/tiv.e.leCtron Donorsx i ...
AlthOugh .meiliaitill ht.. found Alredorninatice 'in practice.:
as the electritri 'donor. ofU.S.,,
.,, . ii,-.,.
choice, the significance the cost of the organic sen Pk the process ha? led to theconsideration of alteinat electron.don ailable, particularly those from Waste sources.
,Considering alternate' c mod ,,.al sources, methanol Scetils to cOntinue to be the :mosteconomic cliofce, bOcausc.,price inaels in vlilternatt sources have paralleled those formethanol. 4, . a,
*4 i1
3734.
89
A variety of compounds that can substitute for, methanol have been experimentallyevaluated,60 but design data are available only for muniCipal wastewater organics, volatileacids, brewery Wastes, and molasses. The use of wastewater organics for &nitrification isdiscUsSed extensively in Section 5.5.2. Denitrification rates with wastewater :pganics areapproximately one:third of those when methanol 'W employed. Therefore, denitrificationreactors must be proportionately larger. Since using wastewater organics adds amthonia andorganic nitrogen to the wastewater the sequence of nitrification-denitrification steps mustbe modified to ensure that thes; compounds do not escape from the: system. Thus,wastewater organics are not completely interchangeable with methanol; their attraction,,'however, is the possible reduction in operating costs with the elimination. of the need formethanol in the treatment plant
L.
In studies conducted for the development of the City of Tampa, Florida's treatment plant,it was shown that brewery wastes, could substitute .for methanol when. used in bothsuspended growth and column denitrification systems.68 Bench scale studies exhibiteddenitrification rates of 0.25 to 0.22 lb NO3- -jv rem./lb MLVSS/day with brewery wastescompared 'to 0.18 lb NO3 IN rem./lb MLVSS/day with methanol at a temperature in therange of 19 to 24 C. Solids production was found to be greater with brewery wastes thanmethanol, but values were not given. Removal efficiencies were similar in a parallel test ofbrewery wastes and methanol using columnar denitrification.68.
Volatile acids have also been used as aj carbon source for denitrification. .In studies ofnitrate reduction in wastewaters generated in the manufacture ofnylon intermediates, it wasfound that a mixture of C1 to C5 volatile acids. was very effective as a carbon source fOrdenitrification.69 Denitrification rates with this mixture Were 0.36 lb. NO -N rem./lb.MLVSS/day at 20 C and 0.10.1b NO3 -N rem./lb MLVSS/day at 10 C. These rates comparefavorably with those measured 'for use with methanol (see Section 5.2.1). Volatile acids canbe produced from wastewater organics by. anaerobic fermentation or byrloiv temperature wetoxidation. In 'either case, the product will contain varying amounts of ammonia nitrogenwhich may have to be removed in the pro6ess (as described in Section 5.5.2). or removedprior to use by,ammonia stripping.
Molasks was tested at the Central Contra Costa Sanitary District's Advaticed TreatmentTest, facility as a substitute for methanol" Peak denitrificatibn rates at 16 C in a suspendedgrowth reaction were found to be only 0.036 lb NO3- -N rem./lb MLVSS/day. In addition tohaving a slower reaction rate with molasses, the sludge tended to bulk to a greater degreethan with methanoli rising from a sludge volume index (SVI) averaging 164 Ml/gram to onehaving a SVI averaging 257 ml/gram. This caused a decrease in the settling rates of thesludge when molasses was employed.
ii
Some of the alternatives cause greater sludge production than otbe . For instance, abouttwice as much, sludge is produced per mg of nitrogen reduced whet saccharose is used thanwhen methanol is employed. On,,the other hand's acetone,' acetate and ''ethanol produced,similar quantities of sludge to that produced whet methanol is employed*.

:4 . .
Methanol has certainsa0a.htages over wastewater carbon sources. It is free of contaminants,such as nitrogen, and theretre cart: be used directly in the process without taking the special.precaution's that muss be madefop. t4e of with a waste carbon source. Second, the product isof consistent qualitOvhile wastewater sources may vary in strength andcomposition either
$10-daily or §easonal cRmplicating prOcess control and optimization. .Use off Wastewatersources will requir regibar4taYing of the source to check its purity, strength and biologicalavailability. Methanol also lias the advantage of being nationally distributed while suitable
.
Waste carbon sources may not be geographically close to the point of use Nonetheless, thesignificant disadvantage of methanol is its cost and this alone mandates the necessity of
. !:::,economic comparisons Of alternate carbcin sources.
3.3.5 Kinetics of Denitrification
.Just as in the case of nitrification (Section 3.2.5), environmental factors have 4
significanteffect on the kinetic rates of denitrifier grdwth and nitrate removal.. Factors,c-onsidered insubsequent sections are temperature, pH, carbon concentration and nitrate concentration. Acombined kinetic eXpreSsian incorporating all these factors is presented.',
3.3.5.1 Effect of Nitrate on Kinetics
The absence of significant quantities of nitrite in deratrification systems60,71 has led to thedescription of the kinetics of denitrification, as a one-step process from nitrate to nitrogdigas. The Monod expression is employed to describe the influence of nitrate on growth rate:
where:
A DKr) D
groWth rate, day -1
maximum denitrifier growth rate, day 1-
0
aonceritration of nitrate nitrogen, mg/1, and
= half sa Iration constant, mg/1 NO - N.
3.3.5.2 Rela kinship of Growth Rate to Removal Rate. N-
Denitrification rates can be rillated to the oganisthrelationship:
aD µ6 /YD
(3-47)
growth rates by the 'following
#where: '= nitrate removal rate, lb NO3., N rem. /lb VSS/day, and
YD = denitrifier gross yield, lb VSS grOwn/lb NO3 - N removed.
3-36
91

i. ,'Similarly, peak denitrification rates are related to maximum denitnfier growth rates as
'l. Vfollows: ,,,.7.'"r
3.3,5,,q,Solids Retention Time'-','V';',.' : t ..
0.,
Consideration of ds Production and .solids retention time is an important designconsideration::A is balance of, the biOmaSs in a completely mixed reactor yields the
ivrelationship. ,"r
(3-49)
I
-4:. ;
,0c
= YD
q --411111D
where: 0 = solids retention time, days, and
,,,decay coefficient; day .
3.3.5.4 Kinetic Constants for Denitrification
The: value' of the half saturation constant, KD, is very low. Investigators at the University'of,California at Davis, found .CD for susperped growth systerne to be 0.08 'mg/1 NO3 -Nwithout solids recycle and 0.16 mg/lN05--N with solids recycle at 20 C.71,48 For attachedgrowth syStems the value of KD wa's folmd to be 0.06 mg/1 NO3 -N at 25 e.72,73 It can beseen from examination of Equation 3-47 using these values of KD that nitrate has almost noeffect on denitrificatiOn abOlie 1-2 mg/Lnitrate -N and appioaches a zero order rate. Theobservations of several investigators subrt theselovAv'alues of KD,' as they have reportedzero order rates'above 1-2 mg/1 nitrate -N.60,74,75,76
Yield and decay coefficients from data, of a number Of investigations are shown in Taple3-10. In most cases only net yields are reported or can be calculated from the data reported.The relationship betWeen the gross yield in Equation 3-50 and the net yield IS:
YD(1D Kcl YD
whefe:
ctD d
denitrifier net yield, lh,VSS/lb NO3 N rem.
(3 -51.)
The data of Stens-el, et al. 74 for Kd has been used in sotne case's to derive, calculated .
values for those cases where none waszeported (Table 3-10). Data from -another study48'

allow calculation of both `YD and Kd at 20 C. The value of Kd of 0.04 day is consistentwith Stensel's findings at 20 C. Values suitable for use in engineering calculations are YD =0.6 to 1.20 and Kd = 0.04 dayl. 0
It is notable that when an aerobic stabiliiation step.was incorporatedlinto.the procesS afteranoxic denitrification, net yields reduced py.alinoit an order of magnitude.78,80 This effectwas attributed to enhanced endOgenOus ::metabolism . where oxygen is .provided, as anelection-aCeeptor:80 Table 3-1 ,showS a calculated value for Kd under these cOnditions of0:19 days-1, almost five tins the rate when nitrate serves as the electron acceptor forendogenous etabolism. Thi concept is supported by the results of other investigators'who data,shoW that the endogenous respiration rates wheri'-expressed on an equivalent.basis arc significantly greater when oxygen serves as the electron acceptor than when nitrate,
.dees,81;.82
4;Both , organism growth rate and nitrate removal. rate are significantly affected byfernpeiatiire. Only one investigator has reported. growth rates,74 all others have reportedremoval rates. To show the effect of temperature on groWth and denitrification rates, theavailable:data have been summarized in Figure 3-10 on a basis that is normalized withregpect to the rate at' 20 C. It can be seen that. denitrificittion Proceeds at a' reduced rate as
o..-
TABLE 3-10
VALUES OF DENITRIFICATION YIELD AND DECAY COEFFICIENTS.FOR'VARIOUS INVESTIGATIONS USING METHANOL
%
Process description Ref.
qD.
days-1
''''',,.,
YD'
lb' VSS
''
D' '.
lb VSS.d'
1'days fernp, L_. .,
lb NO3-N rem; lb NO3 -N rem
` 'SIthpprided growth, no solidsrecycl'e,.coptinuoiTs
...
.41'
,.Suspended growth, b'atch
',Suspended growth, solidsrecycle: contintioup
Suspended growth', solidsrecycle,' continuous,aerated stabilization.
797974'71'77
75a62
5
48787978
VariableVariable 4Variable.
0.12' to0.320.1.6 to 0.9
- .,.. .
0.24 to 3:8Variable
: -b0.1,31 to 0.34?
0.25',..e
0.30
VariableVariable'Variable
.0.55 to 1.4' 0.57 to 0.73
0.45 to 1.43'.0.53
0.58 -"'0.542 to 0.703
0%990.7 to 1.9
0.061
0.570.630.67
-
0.77c0.89c0.6S
0.83 to 1.67. 0.650
9
,0.050.040.02
:-
0.04d .
0.,,04
d0.040.09d0.19c .
10
20 ..?'
302020
S to °2720
16 -to 2020
...16to 1849,
14,;:to 2.0
a Substrate was. sodium citrateb g̀ not givei\; but Gc = 8.0
c Cal.Fulated':.d Assub ecl)
8 = 3 to 6 dayt
3 -3893.

180
160
140
N 120
ti
ti
110
p 80
tirtZ.
60gar
k.
- 40
ti
Cki 20rtLAJ
FIGURE 3 -10
EFFECT OF TEMPERATURE: ON DENITRIFICATION RATE
q Pp Electrondays-' days-i. donor
at 20C75,83 Sodium Citrate. S.G.
xxxxx 60, Endogenous *S.G.
5 1,07- Mettianoi S.G.
* 84 0.24 Methanol S.G.85 0.33 Methanol 6 S.G.-
74 1.7 1.04. Methanol S.G.
86 Methanol86 Methanol A.G.
o o 87 Methanol .A.6.
S.G. = SusRended Growth.-A.G. = Attached Growth
10" 15
TEMPEOAtURE , C
3-39

low as 5 C.;!Above20 CT-four out of seven sets of data indicate that the denitrification ratesfund plateau Values, at some temperature and do not keep, climbing.'..; The parallel systeins'study orMurphy et' al. 86 is'interesting in that it shoyvs attached growth systemsk,zto be lessaffected. by cold,. temperatures than 'suspended growth' systems. Differences _betweenattached growth systems and suspended goWth ,syst0-rfs." may. reflect .differences in theMethod of measurement,,rather than differenteS in organism reaction rate. Attached growthsystenrremoval rates were exporessed.on,a unit surface, basis while suspended groWth-systemswete expressedper unit of biomass (M/LVSS) in Murphy's study.80 It is probable thatsurl:ape slimes in--attaclred growth systems expand in .cold weather and'cornpensate forreduced. reaction' rateS:Afghe bioMass level could be measured the, rate per unit 3f biomassmay very well be similar. Ritinstance, in one study paralf r tests of suspended and attqchedgrowth sysierns were at 30 C. Bibmgss Feasurements were made. inboth systems and peakdenitrificatiOn' rates were found to be comparable-40:381b NO3 -N rem./113 MLVSS /day forthe suspended growth system and 0145 lb. NO3 rem./lb MLVS/day for the attachedgrowth systC6.88: 0
.
Further ,information on the effect of temperature on denitrification rate§,is presented in.Chapter 5 . \. -1*.
.
33.5.5 Effect of Carbon Concentration on Kinetics
The effect of carbon conctntrati2dpcin the rate or denitrificition has.beeri modeled in terms.of a Monod type of expressiqn. When. methanol serves as the carbon source, the expressioni:74,89
= methanol concentration,.0101
K. = half saturation'copStant fdr. methanol, mi/1of methanol.
.':,. Jsed .The orliest investigators ci a nOnspecific test for methanol, COD.' 4 As a.resillt the initial
-Ivaluaticm of Km was iipmewbat obscured: A later more definitive investigation evaluatinggt*.1-Km used a specific test,TOr methanol A chemoStat system operating at'a solids retention ,
tifn0 Of . five-Cias And a. temperature of ),.04C was olierated; in a manner :whereby re4tion,
r'itesvic' ere limitiid.bYlnethanol and not nitrate. The value:of KM 'was found to be veiy.low,0,.;1 mg/1 as niethanoL'The praCtical implication. Of this findingiSithat:to ?chip* 90 percent4:4.1`.the' maxiinum. denitrification rate in a suspended grOWth'reattor, only, aboufl 4-r'lg/1 ofMedal-1o! need :'3;61,In the pffluent. In other' words, great excesseb,s of inetliOol AbovestoichionietriC .requirenients need not be q the effluent frOin a suspended, growthdenitrification process to ich.i&ve nearly thelri.aXim'um denitrification rates.
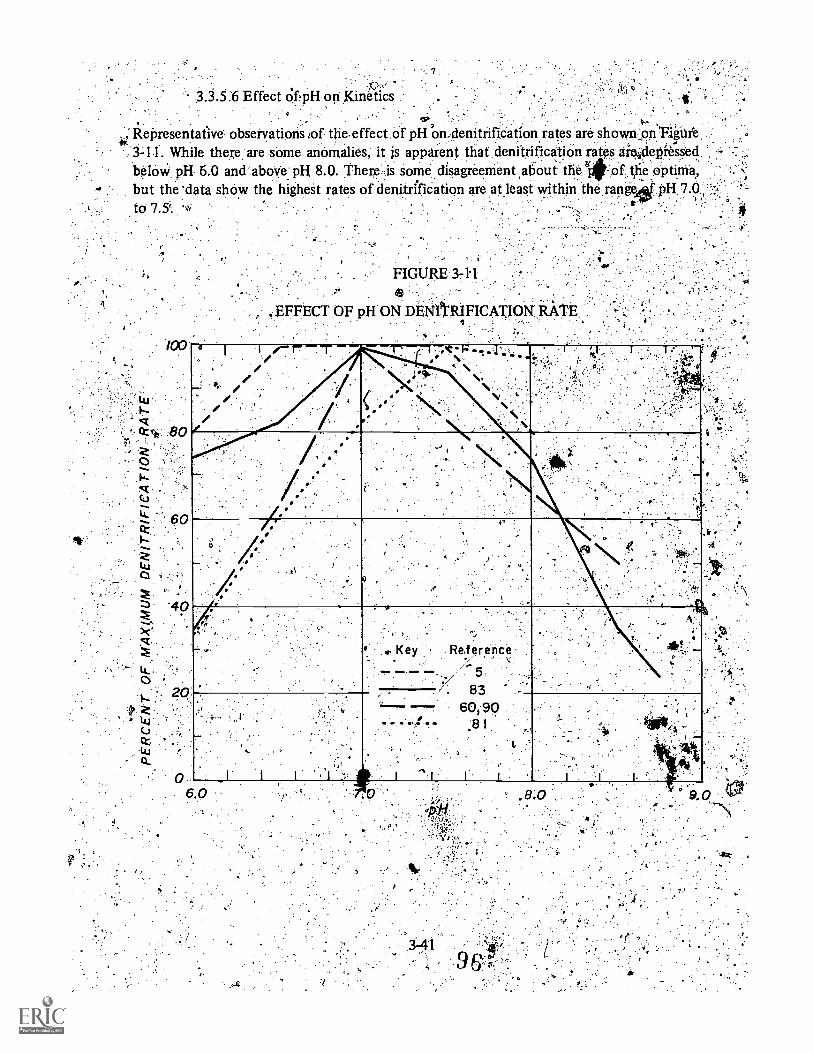
3.3.5.6 Effect df pH on Kinetics
'Re Presentative observations tof the.effect of pH 6,4enitrification rates are shown on'3-11. While there are some anomalies, it is apparent that denitrificatiOn rates aieideOfesSedbeloW pH 6.0 and above: pH 8.0. TherOs some disagreement about thea of theoptima,but the data show the highest rates of denitriTiCation are at least within the range, pH 7.0;6:
to 7.5'.
,.81, //
FIGURE 3- t I
EFFECT OF pH ON DENIICRIFICATION: RATE
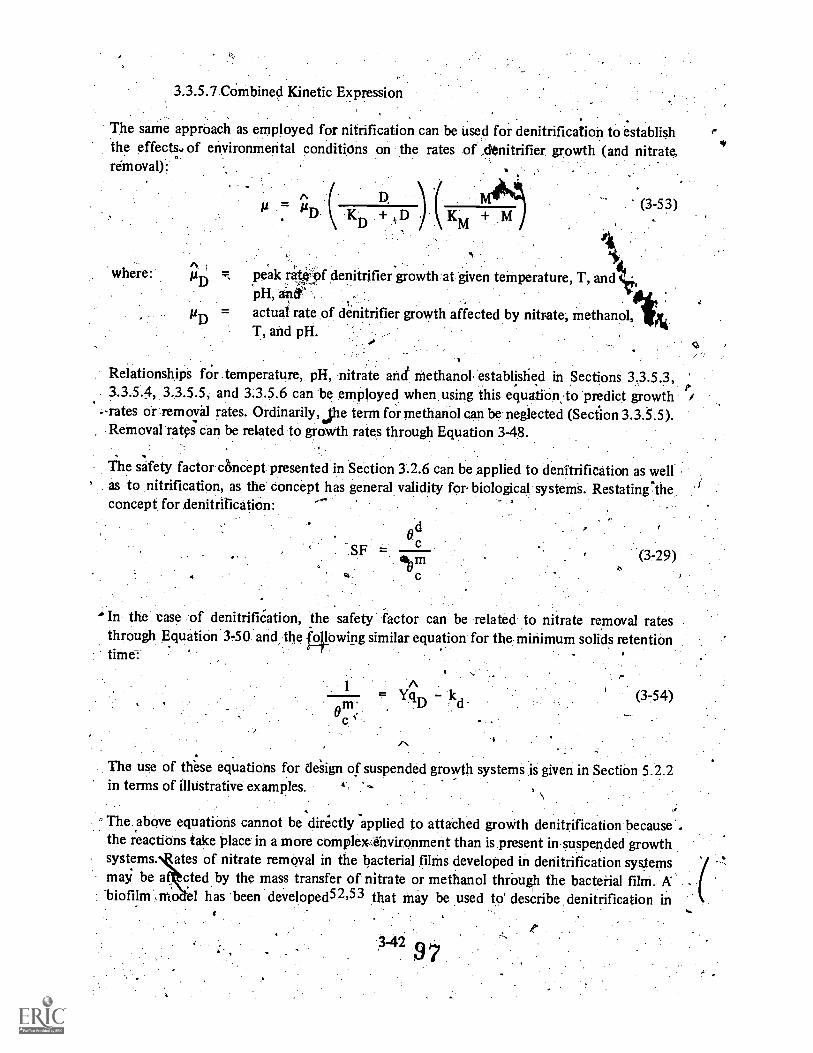
3.3.5.7 COmbined Kinetic Expression
The same approach as employed for nitrification can be used for denitrification to establishthe effects. of environmental conditions on the rates of ,dtnitrifier. growth (and nitrate,removal):
where:
(3-53)
A
'4peak rat#i9f denitrifier growth at given temperature, T, and Si,pH, "and' .
. 'I'.
actual rate of denitrifier growth affected by nitrate, methanol, AtT, and pH.
Relationships fOr temperature, pH, nitrate and methanol, established in Sections 3.3.5.3,3.3.5.4, 3.3.5.5, and 3.3.5.6 can be employed when, using this equation, to predict growth /
-rates or removal rates. Ordinarily, Jhe term for methanol can be neglected (Section 3.3.5.5).Removal rates can be related to growth rates through Equation 3-48.
The safety factor concept presented in Section 3.2.6 can be applied to denitrification as wellas to nitrification, as the concept has general validity for biological systems. Restating theconcept for :denitrification:
SF
c
(3-29)
In the case of denitrification, the safety factor can be related to nitrate removal ratesthrough Equation 3 -50 and the Wowing similar equation for the minimum solids retentiontime-
A .
Y-(ID(3-54)
The use of these equations for design of suspended growth systems is given in Section 5.2.2in terms of illustrative examples.
The above equations cannot be directly applied to attached groWth denitrification because .the reactions take place in a more complek.senvironment than is present in suspended growthsystems. ates of nitrate removal in the bacterial films developed in deriitrification systemsmay be a cted by the mass transfer of nitrate or methanol through the bacterial film. Abiofilm smo 1 has been developed52,53 that may be used to describe denitrification in
1
342 9 7
bacterial slimes, but' its use has not yet been extended to the pointwhere it can be, used insystem design. However, the model' indicates that removal rates are most usefully expressedon a unit surface area basis and this is the procedure adopted in Section 5.3.1 to describedenitrification in the various attached wth.syStemS.
The biofilm model ,useftilly predictS certain properties of attached growth denitrificati4that are significant in design. The model shows that the nitrate removal 'rate in attak*Agrowth sytems should not be dristically , affected by adverse, environmental coiiditiontcompared to effects in suspended growth systems:52 In ection 3.15.4, for instance/fit wasshown that attached growth systems are less affected by 'cold temperatures than siisPended.growth systems.. Another.interesting prediction of-the biO01rn inodel is that methanol willnormally be film transfer limiting rather than nitrate, unless the methanol is supplied inconcentrations five times as large as the nitrate concentration52 (an imtnactical situation).
3.3.6 Efecti of DO on Denitrification Inhibition4
The role of dissolved' oxygen in denitrification is generally to suppress :denitrification.Thishas been ,explained on k the basis that the rate of dissiMilato nitrate reduction isconsiderably slower than the rate of aerobic redissimilatory.71 While it has been observed thatdenitrification can occur in' the presence of low levels!of D0,6,66 the mechanism ofdenitrification is attributed.to an oxygen gradient in the system whereby some cells' are atzero dissolved oxygen and thus able to re,u,ce nitkaje. 126,91
3.4*Refeiencei s
Painter, H.A,, A Review of `Literature on Inorganic Nitrogen Metabolism inMicroorganisms. Water Research, 4, No. 6, pp 393-450 (1970).
J2. Haug, R. T., and P. L. McCarty, Nitrification with the Submerged Filter Report
prepared by the Department of Civil Engineering, Stanford University for theEnvironmental Prbtection Agency,iRsearch Grant No 17010 EPM, August,-1971.
'3. Notes on Water Pollution No. 52, Water. Pollution Research Laboratory, Stevenage,England, 1971.
Gujer, W. and b .Jenkins, The Contact Stabilization Procesi-Okygen and Nitrogen Mass'Balances. University of California, Sanitary Engineering Research Lab, SERL Repprt742, February, 1974. ,
5. 7Millbarger, M. C., The Three Sludge System for Nitrogen and Phosphorus Removal..Presented at the 44th Annual. Conference of the WiterPollution Control Federation,San Francisco, California, October, 1971. °
1

/6. - Horstkotte, G. A., Iles, D.G., Parker, D.S., and D1.11: Caldwell, Full-Scale Testing of A
Water Reclamation S tem..' JWPCF, 46, No. 1, pp 181-197 (1974). /
7. , Newton, D., and T.E. Wilson, Oxygen Nitrification Process aiTainPa. In Applications Iof Commercial Oxygen to Water and Wastewater Systems, .Ed. by R.E. Speece and J.F.Malena, Jr., Austin, Texas: The Center for Research in. Water Resources, 1973.
sser, J.A., Chen, C.L., and R.P. Miele, Fixed-Film 1VItrification of Secondarryffluent. Presented at the EED-ASCE Specialty Conference, Penn. State -Univer;i
/ Pa., July, 1974.
9. Osborn; D.E., Operating Experiences with Do-uble Filtration in Johannesburg.-j. Inst.oSew. Puff.; Part 3, 272-281 (1965).
,10. Pearson, EA., Kinetics of Biological Treatinent. In Advances in WatCr Quality
linproveMent. 2d. by. E.F.TGloyna and. W.W. Eckenfielder;Austin ; TeXas: University ofTex as Press, 1968:
11. 4Lawrencer AN, and P.L. McCarty, Unified Basis for Biological Treatment Disign and\Operation ISED, Proc. ASCE"; 96, No SA3, pp 757-778_(1,970).
. .
12. Jenkihs; D.;',and W..E. Garrison; Control of Activated Sludge by. Mean Gell Residence:Time. JWPCF, 40, No. 11, pp 1904-1919 (1968).
13. Monod, J., Researches sur la crbissance des cultures. Heimann and Cie; Paris, 1942.
14. StankeNVich, M. J., Biological Nitrification with the High Pdrity-Oxligenation Pro'cess.Presented at 27th Annual Purdue Industrial Waste Conference, Lafayette, Indiana,
M1
'15. Poduska, R.A. and J.F. Andpews, Dynamics of Nitrification in the Activated SludgeProcess. Presented at the 29th Industrial Waste 'Conference, Purdue University,Lafayette, Indiana, May 7-9, 1974. ,
16. Christensen; D.R. and. P.L. McCarty, Bio-treat: A Multi-Process Biological TreatmentModel. 'Presented 'at the 47th Annual Conference of the Water Pollution ControlFederation, Denver, Colorado, October, 1974.
17. Knowles, G., Downin4d.L., a#1 M.J. Barrett, Determination of Kinetic ConstantsforNitrifying Bacteria in7fflx-ed Culture, with the Aid of An Electronic Computer. J. ben.MicrobiologY:38, p 263 (1965).
18. Downing, A.L., and A.P. Hopwood, Some Observations on the Kinetic,s NitrifyingActivated Sludge Plants. Schweiz..Zeitsch f Hydra, 26, No. 2, p 271 (1964).
344
99
, .
19. Wuhrrnann, K., Research Developments in Regard to Concept and Base Values of thoActivated Sludge System. Ed. by E.F. Gloyna and WM. ECkenfielder, Ausitin; Te)6s::University of Texas Press, 1968. , , \,\r),
20. Melamed, A., Saliterrkik,..C., and A.M. Wack. BOD :Removal and Nitrification- ofAnaerobic Effluent by Activated Sludge., Presented at the,5th IAWPR ConferefiCe, Sgn\Fiancisco, California, July-August, 1970.
21. alakrishnati, S., and W.W. Ecken'fielder; Nitrogen Relationship's in Biological WasteTreatinent Processes ,I, Nitrification in the Activated Slddge Procesi Water Research,3,, pp 73-81 (1969).
22. ,Ldehr, R.C., Pralcasam, T,B.S., Srinath, E.G., and 'Y :D. Joo, Development andonstration of Nuirient Removal from Animal Wastes. Report prepared for the
Environmental protection Agency, EPA-R2-73-095, January, 1973.
23. Stratton, F.E., and P.L. McCarty, Prediction of Nitrification Effects on the DissolvedOxygen Balance of Streams. Environmental Science and Technology, :1, No. 5, pp405-410 (1967).
24. Lawrence, A.M., and C.G: Brown, Biokinetic Approach to Optimal Design and Controlof Nitrifying Activated Sludte Systems. Presented at the Annual Meeting of the NewYork Water Pollution Control Association, New York City, Yanuary 23. 1973.
25. Hoffman, T., and H. Lgei, The Biochemistry of Nitrifying Organisms 4, TheRespiration and Intermediate Metaboldm of Nitrosomonas. BioChlmistry Journal, 54,575-583 (1953).
26. Ulken, A.; Die Herkunft' des Nitrits in der 'Elbe. Arch. Hydrobiol.59, pp 486-501,1963. A
27. Loveless, J.E., and J.E.,tainter, The Influerzt of Metal Ion Concentration and pH Valueon the Growth of a ,Nitrosomonas Strain Isolated. From Activated Sludge. J. Gen:Microbiology, 52, pp 1-14 ( F968).
I28. Williamson, :K.J. and P.L. McCarty, Rapid Measurement of Monod Half-Velocity
Coefficients' for Bacterial' Kinetics. Un blished paper, Stanford University, May,1974.
29. Lees, H., and Ht. Simpson, The Biochemistpy of Me Nitrifying Organisms, 5, NitrateOxidation by NitrobaeOr. Biochemistry Journal, 65, pp 297-305 (1957).
30. Gould, G.W., and H. Lees, The Isolation and,Culture of the NitrifAng thgtnisms. PartI. Nitrobacter. Can. J. Microbiology, 6; pR299-307 (1960).
,O
, --,:.. ,
.. 31. Linda lot,.
H., and L Van Tichilen, Kinetic's of Nitrite Oxidation by Nitrobacter.
Winogradskyi, J. Bact., 79.; pp 39-42 (1960).
3. Buswell, A.H., Shiota, T., Lawrence, N., arid I. Van Meter, Laboratory.Studies on theKinetics-of the Growth of itrosomonas with Relation to the Nitrification Phase of theBOD Test. Applied Mierolicology, 2, pp 21 -25 (1954).
(Bafakrishnan; $., and W.W. Eckenfielder, Nitrogen Relationships in Biological WasteTreatment Processes "Nitrification in Tridkling Filters. Water Research, 3, pp167-174 (1969).
34. Huang, C.S., and ,N.E. Hopson, Temperature and pH Effect on the BiologicalNitrification Proceks. Presented at the Annual Winter Meeting, New York Water
1 Pollution. Control AssdeiatiOn, New York. City, January, 19'74.,.14
35. Water Pollution Reserch, .1964. Don don: HMSO, 1965.
36. Nagel, C.A. and Haworth, J.G., Operatjonal Factors Affecting Nitrification in. teActivated Sludge' Process: Presented at the 42nd Annual Conference of the WaTerPolluation Control Federation, Dallas, Texas, October (1969), (available as a reprintfrom the County Sanitation Districts of.Los Angeles County).
37.' Wuhrrnan, K., Effects of Oxygen Teniion on Biochemical Reactions in SewagePurification. In Advances in iological Treatment, Proc. 3rd Conf Biological waste ,
Treatment,. Ed. by-Eckenfie r, W.W., and J. McCabe. (New York, 1963), PergamonPress..
38. Schwer; A.D., Letter communication to D.S. Parker = Metropolitan Sewer District ofGreater Cincinnati, March 9, 1971.
39. Murphy, K.L., Persontl communication to D.S. Parker, MeMaSters University, Ontario,July, 1974.
40. Engel, M.S., and M. Alexander, Growth and :metabolism ezl:'Nitrosomonas europaea.:JoUrnal Bacteriology, 76, pp 217-222 (1958)..
41. Meyerhof, 0., Untersuchungen uber den Atmungsyorgany Nitrifizierenden Bakterien.Pflugers Arpges Physiol., 166, pp 240-280, 191,7 ,
.
42. Sawyer, C.N., Wild, H.E., Jr., and T.C. Mckalion, Nitrification and DeizitrificationFacilities, Wastewater Treatment. Prepared for tye EPA Technology Transfer Program,August, 1973.
101

43. DoWning, A.L., and G. Knowles, Population Dynamics in Biological Trea ment Plants.Presented at the 3rd Conference of the IAWPR, Munich, 1966. I
44. Huang, C.S., Kinetics and Process Factors of Nitrification on a Biological ,Film Reactor.:Thesis submitted in parttal satisfaction of the requirements for the degree of Doctor ofPhilosophy,. University of New York at Buffalo; 1973.
45. Heidman, J.A., An Experimental Evaluation of Oxygen and Air Activated SludgeNitrification Systems With and Without -pH Control. EPA report for Contract NO.68-03-0349, 1915. . \
.
. 46. Chen, C.W., Concepts4hd .Utilities of EcOlogical Model. JSED, Pros. ASCE, 96, NSA5, pp 1085-1097 (1970). '
1
1
47. Middlebrooks, E.J., and D.B. Porcella, Rational Mulfivariate Algal Growth Kinetics.JSED, Proc: ASCE,.97, SA I; pp 135=140.(1971).
-1
48. Engberg, D.J., and:E.D. Schroeder, Kinetics agl Stoiciziometiy of Bacterial Denitrif1-cation, as d F&nction of Cell Residence Time University of California it' Davis, .
unpublished paper, .1974..4
49. Stamberg, J.B., Hais, A.B., -Bishop; D.F., and J. Heidman, Nitrification in Oxygen- Activated Sludge. Unpublished paper, Environmental Protection Agency, 1974,
SO. Sawyer, C.N., Activated Sludge Oxidations, r. The Influence of Nutrition inDetermining Activated SludggCharacteristics. 'Sewage WorkL.Journ'al, 12, No 1, pp3-17 (1940).
51. Kiff, R.J., The Ecology of Nitrification1Denitrification in Activated Sludge. WaterPollution Control, 71,.p 475 (1972).
52. Williamson, K.L. and P.L. McCarty, A Modl of-Substrate Utilizatibn by Bacterial-Films. Presented at the 46th Annual Conference of the 'Water Pollution pontfolFederation, Cincinnati, Ohio, October, 1973.
53. Williamson, K.L. and P.L. McCarty, Verification Studies of The Biofilm Model forBacterial Substrate Utilization. Presented at the 46th Anittial Conference of the. Water-Pollution Control Federation, Cincinnati, Ohio, October, 195(3.
54. Interaction of Heavy Metaliwand Biological Sewage Treatment Processes. Division ofWater Supply and Pollution Control, USPHS, May, 1965.
55. Environmental Quality Analysts, Inc., Letter Report to Valley Community ServidesDistrict, March, 1974.
s
1-47
02

56. Sawyer, C.N.; Lettet communication to D.S. 'Parker, January 24;1975... ,
57. . Davis, G., P6rsopal communication. with. D.S. Parker, B. V. Goothich, Co' August,1974.
K58: Tomlinson, ,T.G., Boon, A.G., and C.N.A. Trotinan; Ahibition of Nitrificatipn in theActivated' ludge Process of Sewage' Disposal. J. Appl:.Bact., 29, pp 266=291 (1966).of
59. AnthoniSen, A,C., Ls'pehr, .,R.C., Prakasain, T.B.S. and E.G. Srinth,L7nhibilidn of ',
Nitrification by UmiOniz6d Ammonia and UnOonized Nitrous; Acid. Preserited at the47th Annual Conference, Water Pollirtion Control Federation, -Denver, Colorack;, ;October, 1974. -!
§0. Christensen, and , P. Harremoes; Bio agwal Denitrifkation f WastewaiprTreatme?Tt. Report 2-72, Department. ilt' Sanitary Engineering, Technical Unkrsity ofDenmark, 1972. J
61. Derwiche; C.C., The Nitrogen Cycle. Scientific American, 223, No 3, pp, .137-14.6(1970).
,9
,62: WeCarty6,P.L., Beck, L., and P. St. Aiiiabt, Denipification of Wastewaters, by
Addition of Organic Materials. In4Joc. of tbe Sth Industrial Waste Conference:May6, 7, and 8,.1969. Lafayette, Indiana: Puidue University, 1969. °
3. WCarty; P.L.; Stoichiometr; .,of Biological Reactions. Presented 'at the SummerInstitute in Water Pollution Control, BiolOgical Waste Treatri1ent, Manhattan-College,New York, N.Y., May, 1974:
64.. Dholakia, S.G., Stone, ' J.H., and H.P.LBArchfield, Methanol Requirement andx. Temperature Effects, in Wastewater Denitrification U.S. Environmental. Protection
Agency,Washington, D.C., WPCRS 17010 NIT 09/70, August, -1970.
65. 'Jeris, John: S., and R.W. Owens, Pilot Scale High, Rate. Biological Denitrification at.Nassau CAOnty,,,N. y. Presented at the Winterigeeting,of the New York Water PollutionCOntrol Association; January1974.
66. Smith, J.4,, Masse, A:N.r.I eige, W.A., and L.J. Kaixiphake, Nitrogen Removal fromMunicipal. Wastewater by Columnar Denitrification. Environmental Science andTechnology, 6, p 260 (1972).
67. Michael, R.P., and. W.J. Jewel), Optimization of the Denitrification Process. Journal ofc>.the Environmental Engineering Division, Proc. ASCE; in press.
o)
348
4 103
I. . 9
.
68z Wilson, T'E.,,and 1)., Newton, Brewery ,Wastes as a Carbon.SoUrce for Denitrification atTampa, Florida. Presented a te 28th Annual Purdue Industrial Waste Conference;May, 1973.
69. Climenhage, D...._ --
Presented at the
.
, Biological Denitrification of Nylon Intermediays Waste Water.d..Canadian Chemical Engineering Conference, September, 1972,
70. Central Contra Costa Sanitary District, Operating Report, Advanced Treatthent testFacility: January, 1974. , ' C.
71. Moore, S.F., and ED. Schroeder, The Effect of Nitrate Feed Rate Qn Denitiification:Witer Research, 5, pp, 445-452 (1971).
°P1
71. Requa, D.A., 'Kinetics of Packed Bed Denitrificatton. Thesis subthitted in partialsatisfaction of the requireMents for the degree of Magter of Science in Engineering, 1,1
University of California at Davis, 1970: -
73. Requa, D.A., and E.D.,Schroeder, Kinetics of Packed Bed Denttrifieation. JWPCF, 45,No. 8; pp 1696-1707 (1973).,
74 Stensel, I-14p.,Loehr, R.C., and A.W. Lawrence, Biological K0e.ttcs of the Suspended_I Growth Denitrzfication. JWPCF, 45, N. 2, pp 249-261.('1 973).
.
75: Murphy, __Wt.; and R.N. Diatvson, he Temperatures Dependency of ,BiolOgicalDenitrification. Watqr Research, 6, pp 71-83 (1972). .
76. Ericsson, et cal., Nutrient Reduction at Sewage Treatment Plants. KTH Publication67:5, Stockholm,'1967. .
77.. Moore, S., grid E.D". Schroeder, An. Investigation of the Effects of Residence Time on4zaerobic BactertalWeriitrificatton. Water Research, 4, Pp 685-6940 WO)._
78. Parker, D.S.; Zadick, El., and .E. Train, Sludge PrOcessing for. Combined .
Rhysical.:Chemical-BiologicUl Sludg . Prepared. for the EPA, Report No. R2-73-250,July, 1973.
7
79 Sutton, P.M., Murphy, K.L., and R.N. tiawson, Low Temperature BiologicalDenitrification of WastAvater. JWPCF, 47, No 1, pp 122.134 (1975).
,
80. Parker, D.S., Aberley, R.C., and PM. Caldwell, Development and Implementation ofBiological. Denitrification for Two Large Plants. Presented at the Conference onNitrogen as a; Water Pollutant, sponsored by the IAWPR, Copenhagen, Denmark, '
Angtest, 1975..
e . 3-49
104'
,81. Clayfield, G.W., Respiration and Denitrificatior! Studies on 'Laboratory and Works
.Activated Sludges. Water Pollution Control, London, 73,-,No. 1, pp 51-76-(1974),.
'82. Balakrishnan, S., and W.W. Eckenfielder,'Nitrogen Relationshi0 it Biological WasteTreatment Processes III, Denitrification in the Modified Activdted.SlUdge Process.Water Research, 3, pp 177-188 (1969). .
'83. 'Dawson, R.N., ancl K.L., Murphy, Factors Affecting 'Biological benitrificaticin inWasteWater. In Advances in Water P011ution ReSearch, S.H. Jenkins, Ed., Oxibilt,England: Pergamon Press, 1973.
4
84. Piker, D.S.,..Case Histories of Nitrification and Denitrifieation Facilities. 'Prepared forthe EPA TechnolOgy Tra/tsfer Programs May, 1974.
1Bishop, D.P., Personal communication to D. S. Parker. *EnvironmenIA ProtectionAgency, Washington, D.C., April, 1974.
h K.., and PM. Sutton, Pilot Staler Studies on 'Biological Denitrification.Presented the. 7th Internationil Conference on Water Pollution Research, Pails,September, 19.7 .
8.
87. Epotrol; Biologi r I Dnittification _ yling Fluidized . Bed Technplogy. August,19741-
88. Jewell, W.J.ft and R.J. Timings, DenitrificatiOn of Concentrdted Wastewaters.Presented at the Water 13% ution Control Federation, Cleveland, Octobet, 1973.
89. Kaufman,'G., and E. Schroed r, Personal communication to D.S. Parker. Uniyersity ofCalifornia at Davis, July, 1974.
90. Re er, Produktion of Nitric Oxide and Nitrous Oxide. During Denitrificatidn byCorn bileterium niphridli. J. B. cterial., 101, pp 821-826 (19.70). -
;91: Skerman,,V.B.D., and LC. acRae, The Influence of Oxygen Availability on , the
Degree of Nitrate Reduction r y Pseudonaitas Denitrificans. Can. J. Microbiology, 3,pp505-530 (1957).
3-301 5

4.,,1 IntroAction
CHAPTER 4
BIOLOGICAL NITRIFICATION
'
The application of biological nitrificatiOn in municipal wastewater teatment is particularlyapplicable to cases where an ammonia removal requirehient exists; Without need forcomplete nitrogen removal. Biological nitrification is also the first step, of the biologicalnitrification-denitrificatiOn approach to nitrogen removaL '
1
1
4.2 Classification. of Nitrification Processes
The first means of categorizing nitrification systemS concerns the degree of separation of thecarbon removal and nitrificiflon processes. The, first nitrification processes, developedcombined the functions, of carbon-Oidation and nitrification in one process. The extendedaeration, modification of the activated sludge process is an example of a combined carbonoxidation-nitrification process. Combined carbon oxidatiOn-nitrification procesSes generallyhave low. populations of nitrifiers due to a high ratio of BOD5 to Total KjeldahlNitrogen(TKN) in the influent (see Section 3.2.7 for iedisginsion of this effect). The bulk of theOxygen requirement for this process comes from the oxidation Of organics.
Separate stage nitrification is the other category of nitrification processes. In this process,there is a lower BOD5. load relative to the influent ammonia load. As a result, a higherproportion of nitrifidrs is obtained, resulting in higher rates, of nitrification.. The bulk of theoxygen requirements in the nitrification stage derive frOm ammonia oxidation. To obtainseparate stage nitrification, pretreatment is required to ldwer the organic load orBOD5/TKN ratio in the influent to the nitrification stage.
Both the combined carbon oxidation-nitrification and separate stage nitrification processescan be further subdivided into suspended growth and attached growth processes. Suspended'growth processes are those which suspend the biological solids in a !Tided liquor by somemixing Mechanism. A subsequent clarification stage is required for returning these solids tothe nitrification stage. Attached growth procesies, on the other hand, retain the bulk of thebiomass on..the media and therefore do not require a solids separation step forretuining thesolids t6 the nitrificakion reactor. In separate stage' processes operated in the attachedgrowth mode; a clarification step may not: be required since solids synthesis is low and thesloughed solids are/often low hl concentration.
There are many different configurations of suspended and attached'gro;ith reactors; theseare described in subsequent sections of this mapfil. For suspended growth reactors refer toSections 4.3 and 4.6; for attached growth reactors refer to Sections 4.4 and 4.7,
41 as

.4Using the classification described above, rePrEse.ntative nitrification procesSes have been
classified in Table 4-1 according to the degree of separation, of the carbon removal andnitrification processes. Many of 'these facilities are described in further detail ip either this
. chapter. or Ch,pter 9: Each facility listed has been. categorized according to the BOD5/TKNratio. of the wastewater influent 16 the nitrification process: !interestingly, the processeslisted Can all be categorized according to whether the BOD5ITtN ratio is less than 3.0!rgreater. than 5.0. If the BOD5/TKN ratio is less than 3.0, the systerit can be claSsitied as a
'. separate stage nitrification process. If the BOD5/TICN is greater than 5.0, the prOcesS can beclassed as a combined carbon oxidation-nitrification proceSs. Also shown in Table. 4-1 is thedistribution a total oxygen demand. in the process between carbonaceous sources (BOD5)and. nitrogenous sources (NOD). It can be seen that in separate stage proCeSses, theproportion of nitrogenotis oxygen demand is at least 60 percent of the total: In combinedcarbon oxidation-nitrification processes; the proportion of nitrogenous oxygen demand islower than 50 percent.
(
There exists a range of BOD5/TKN ratios between 3.0 and 5.0 where no practical examplesCurrently exist. Facilities in this.range could be considered.to. provide an intermediate degreeof separation orcarbon remaval and nitrification.
4.3 Combined Carbon Oxidation-Nitrification in Suspended Growth Reac'tors
The conventional activated si e process 'has seen relatively wide application in GreatBriMin for use in obtaining effluents low in ammonia nitrogen. Much of the U.S.)practicederives from that experience. Recent. U.S. design practice has provided onliplifyinginfobnation. .
General design concepts, for- the activated sludge process are covered in the Technology[trans'fe publkation: Process Design Manual for Upgrading Existing Wastewater Treatment
Plants. The following sections provide an extension of these concepts to combined carbonoxidation-nitrification applications.
4.3.1 Activated Sludge Modifilcations
Not all of The various modifications ofthe activated sludge process are appropriate fornitrification applications, althdugh some See use where only pactiai ammonia removal isrequired. Figure 4-1 gives pictorial representations of four common modifications.
4.3.1.1 Complete Mix Plants',
ti
Many plants are designed lo operate on the complete mix principle. Shown on Figure 4-1 isan example of the'feed and withdrawal arrangement fora complete mix plant. The complete .mix design provides uniformity of load to all points within the aeration tank, easing theproblems of oxygen transfer presented in the head end of the conventional plants. CompleteMix plants can be designed for comPlete nitrification at loading rates Comparable to
42107.
*I
a

TALE 4a
CLASSIFICATION OF NiTRIFiATION FACILITIES
Type and Location
, ,
..
Scale,
mgda
,
BOD6/TICN
., Ratio
Oiliyissegtxreild,nDeoomgen
Demand
,... .
Ref,
Degree of Separation
-
stage
.
i
Pretreatment
Combined
oxidation -
nitrification
Separate
RODS'
,,, .
NOD r'''
' 1
,
Suspended Growth,.0,2 1,2 '20 80' 1
, .,x , Activated sludge .
hianassas, Val .
,.i Hyperion, Los Angeles, Ca. i49 7.0 .61 39b 2. ' ` .. Primary, treatment
Central Contra Costa Sanitary 1.0,d4ign 30 2,4 34 '66 3 '' o x Lime primary treatment
District, ta.. ,' '..rkpliet.. 1,0 18r 82 r. 4 . . x Activated sludge
Livermore, Ca, ' . ,..ait '2,8 38 62 5 x Roughing filter
Flint, Michigan , a 7 'y'34 5,5' 65 35b . 6 x .. Primary treatment
Valley .CommunitY Services DistriA,Ca, 2,8 10,8b . 70 30b 3 x Primary treatment . :
,Blue Plains; D. C. pilot, design , 1,3 to,3,0 22 to 39 61 to 78 7, 8 ,
,t0
x,. , Activated sludge
309 ,t
:Primary,'Whittler, Narrows, LACSD, Ca, , 12 . 6,6 ,,,,, 61^ 39 9 x treatment
'Jackson, Michigan. 13,5 9 .1. 66 34 10 x Primary. treatment
Tampa, Florida pilot 3.0 il,... 4G ,, 60 , 11 x Activated sludge
design 60. , ,,:
,
South Rend, Indiana pilot '1,8 . R 72 , 12 , x ActiVated sludge .
New,Market,,Ontario, Canada 2,4 , 2,6 ,36. 64 13: Lime primary treatment
Cincinnati; Ohio . pilot 7,2 61 H 39 14 Primal)? treatment '
Old. 1,0c 18a 82a 15 ' xt , Activated sludge
Fitchburg, Mass,;' pilot r I. 0d
18 \ 82 16 , ,,,:t : :,,, Activated sludge'
Marlboro, Mass, : pilot 3.6 40 60 17 , x:,,,,,. : Trickling filter
Amherst, N. Y,,
Col,
pilot
pilot .
1 0,8 to 2.0
2,7
, 22'
37'
78 .
63 .
.18
19, 20
i. .
x
' Activated sludge
Activated sludge
ttacheci Growth
...
Stockto n. Ca, 1, pilot :5,3 54 46' .21 x primary treatment
'design 58 .'
Midland,. Mich, pilot 1,1 19 81 22 . ,Trickling filter
Union CIty, Cs. pilot 1..7 27 78. . 23, 24 x .; Activated sludge
Allentown, Pa. 40 1,9 30 704 , 25 x ,; Trickling filter
Lima, Ohio, pilot 0,79 '15 85 26, 27 x
.1
'Activated sludge
,
amgd 0,044 rn3hiec
Calculated from effluent
Apkoxiniatel. calculated from.COD data
d :130D/N1144.7. N ratio; BOD /TKN youlibe, about? 3,
° 108,
109
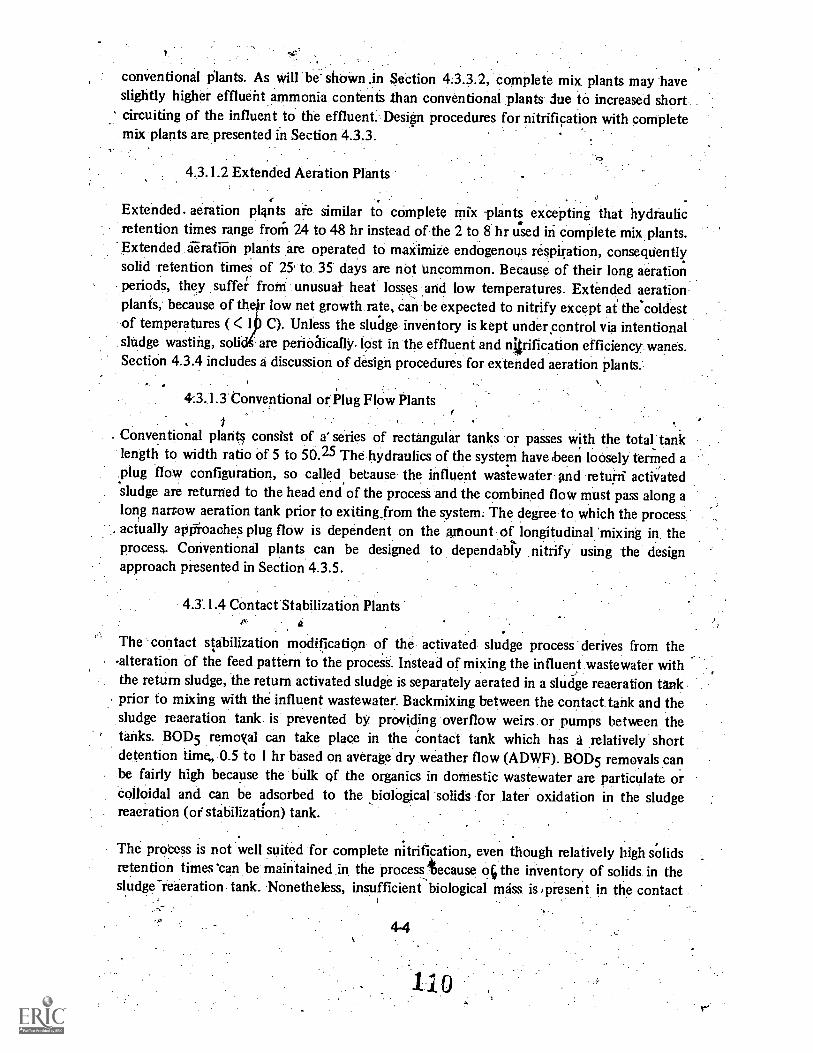
conventional plants. As will be shown in Section 4.3.3.2, complete mix plants may haveslightly higher effluent ammonia contents than conventional plants Sue to increased shortcircuiting of the influent to the effluent. Design procedures for nitrification withcompletemix plants are presented in Section 4.3.3.
4.3.1.2 Extended Aeration Plants
Extended. aeration plants are similar to complete mix -plants excepting that hydraulicretention times range from 24 to 48 hr instead of the 2 to 8 hr used in complete mix plants.Extended aeration plants are operated to maximize endogenous respiration, conseqUentlysolid retention times of 25 to 35 days are not uncommon. Because of their long aerationperiods, they suffei from unusual heat losses and low temperatures. Extended aerationplants, because of th r low net growth rate, can be expected to nitrify except at the coldestof temperatures ( < 1 C). Unless the sludge inventory is kept undersontrol via intentionalshidge wasting, soli -are periodicaliY lost in the effluent and n4rification efficiency wanes.Section 4.3.4 includes a discussion of design procedures for extended aeration plants.
4-.3.1.3" Conventional or Plug Flow Plants
. Conventional plants consist of a' series of rectangular tanks or passes with the total tanklength to width ratio of 5 to 50.25 The hydraulics of the system have been loOsely termed aplug flow configuration, so called betause the influent wastewater and return' activatedsludge are returned to the head end of the process and the combined flow must pass along along narrow aeration tank prior to exiting_from the system. The degree to which the processactually approaches plug flow is dependent on the afinountof longitudinal 'mixing in theoprocess. Conventional plants can be designed to dependably nitrify using the designapproach presented in Section 4.3.5.
4.3.1.4 Contact Stabilization Plants
The contact stabilization modification of the activated sludge process derives from the-alteration of the feed pattern to the process. Instead of mixing the influent wastewater withthe return sludge, the return activated sludge is separately aerated in a sludge reaeration tankprior to mixing with the influent wastewater. Backmixing between the contact tank and thesludge reaeration tank is prevented by providing overflow weirs or pumps between thetanks. BOD5 removal can take place in the contact tank which has a relatively shortdetention time, 0.5 to 1 hr based on average dry weather flow (ADWF). BOD5 removals canbe fairly high because the bulk of the organics in domestic wastewater are particulate orcolloidal and can be adsorbed to the biological solids for later oxidation in the sludgereaeration (of stabilization) tank.
The pro'cess is not well suited for complete nitrification, even though relatively high solidsretention times 'can be maintained in the processtecause oi the inventory of solids in thesludge -reieration tank. Nonetheless, insufficient biological mass is spresent in the contact
110
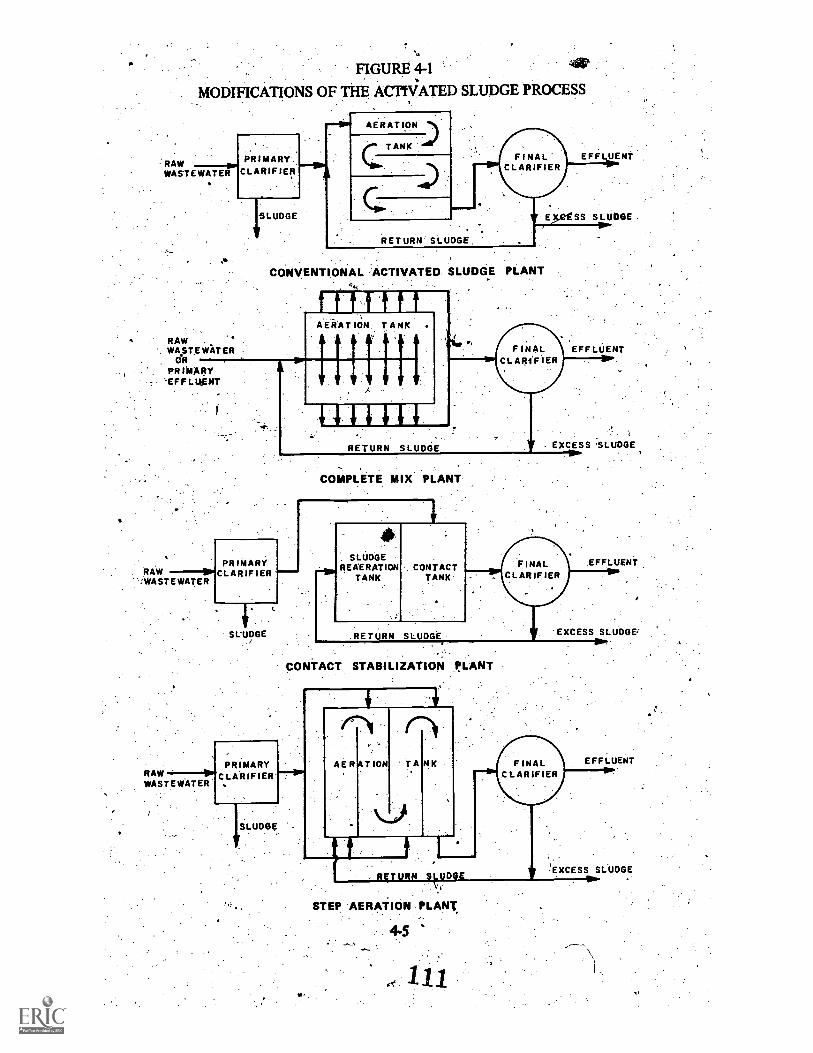
FIGURE 4-1 4117.
MODIFICATIONS OF THE ACTIVATED SLUDGE PROCESS
RAWWASTEWATER
AERATION
PRIMARY.CLARIFIER A
RAWWASTE WATER
OAR
. PRIMARY` EFFLUENT
RAWWASTEWATER
TANK
RETURN SLUDGE.
FINALCLARIFIER
CONVENTIONAL ACTIVATED. SLUDGE PLANT
PRIMARYCLARIFIER
SLUDGE
PRIMARYRAW -----0".0 L AR IF IERWASTEWATER
HIMAERATION. TANK
'Ii'!'RETURN SLUDGE
F INAL
CLARIFIER
EFF UENT
Epg SS SLUDGE
EFFLUENT
1
. EXCESS 'SLUDGE
. .
COMPLETE MIX. PLANT
SLUDGEREAERATION
TANKCONTACTTANK
RETURN SLUDGE
FINALCLARIFIER
CONTACT STABILIZATION PLANT
1110.
SLUDGE
AER AT ION TA N. K
.EFFLUENT
EXCESS SLUDGE,
RETURN SL{
STEP AERATION PLANT
4.5
111
EXCESS SLUDGE

tank to completely nitrify the 'amthonia and since ammonia is not adsorbtld on thebiological floc, ammonia will bleed through to the effluent. Partial nitrification can beobtained at levels which can be predicted by methods presented in Section 4.3.6.
4.3.1.5 Step Aeration and Sludge Reaeration Plants.
A typical step aeration .plant is illustrated on Figure 4-4. Like-the conventional plant, thereturn sludge is introduced at the head end of. the tank. However, the step aerationplant differs from the conventional plant in that influent waste$vater is introduced at severalpoints along the aeration tank. This diStribution of influent flow reduces the initial oxygendemand usually.experienced in the conventional plant.25
,A variation on the step' aeration .plant that has been popular .on the West Coast is tointroduce no feed into the first pass while directing the flow into the remaining.downstream .
passes. k sludge reaeration zone is established in the first pass and this variation has becomeknown as a "sludge reaeration plant." ormally, no provision is: made to prevent baCkmixing:between the sludge reaeration pass and ihe.downstream passes.
The ammonia bleedthrough characterizing. contact stabilization plants is avoided in a stepaeration plant because of the greater contact times employed and backmixing of influentoccurs. Nonetheless, some bleedthrough of ammonia as well as organic. nitrogen can occur.This breakthrough results from short circuiting of influent to the effluent and insufficientcontact time for complete organic nitrogen hydrolysis.(animonification) and oxidation ofammonia. . .
4.3.1.6 High Rate and Modified Activated Sludge
High rate activated sludge processes (high MLSS) and modified activated sludge (low MLSS)processes are characterized by low solids retention times (0.5 days). Under these conditions,a nitrifying activated sludge cannot be, developed. The high rate and modified activatedsludge processes are acceptable. pretreatment techniques for separate stage nitrification.proCesses (Section 4.5).
4.3.1.7 High Purity Oxygen Activated Sludge Plants
'Both covered and uncovered ictOrs have been used with pure oxygen activated sludge, butteonly the former technique has seen, actual implementation in full-scale plants..28 Thecovered reactor approach involves the recirculation:of reactor off-gases to achieve efficientoxygen utilization: As asonsequence, the carbon dioxide which is present in the off-gas isreturned to thilquid. The end result is that high carbon dioxide concentrations buildup inthe mixed liquor and recycle gases, depressing the mixed liquor pH. pH levels as low as 6.0.are not 'uncommon. This effect can have 'a depressing effect on nitrification rates (cf.Sections 3,2.5..6 and 4.6.3); resulting in the requirement. for somewhat longer solids,retention times for nitrification than would Otheryise be the case.
Virtually all applications of the high purity oxygen activated sludge.process to nitrificationhave been for separate. stage nitrification applications (Section .4.6), rather than forcombined carbon oxidation-nitrification applications.
4.3.2 Utility of NitrificationiKinetic Theory in Design
The nitrification kinetic theory presented in Chapter 3 may be directly applied to design`of those activated sludge modifications Compatiblevith nitrification. The equations must be-adapted to the hydraulic corifiguration under consideration; but in all eases this adaptationis relatively straightforward.
Nitrification kinetic theory can bevery usefully applied to define the following parameters:
1. The safety factor required to handle diufnal.qransients in loiding to preventsignificant ammonia bleedthrough under peak load conditions.
The design solids retention,time under the 'moSt adverse conditions of pH, DO, andc..,temperature.
The allowable organic loading on' he combined carbon oxidatiOn-nitrification-,., stage. ,
The required hydraulic detention time in the aeration tank at ADWF.
The excess sludge wasting schedule.
. Tke following sections ,preselit the design procedures in terms of a number of specificexamples. The procedure developed for each case has often been termed the "solidsretention time" design approach.
4.3.3 Complete Mix Activated d ge Kinetics
As a design example, consider a 1 mgd treatment plant that must achieVe completenitrification at 15 C. The plant incorporates primary treatment primary effluent I3OD5 is150 mg/I, including solids handling return streams to the primary. Total Kjeldahl Nitrogen
'(TKN) is 25 mg/1 as N. As a simplifying assumption, neglect that portion of the TKN that isassimilated into bi6mass or associated with refractory .organics. The wastewater' has an.alkalinity of 280 mg/1 as CaCO3. The-procedure is as follOWs:-
1. Establish the S'afety. factor; SF. The SF is affected by the desired effluent quality.Assume a minimum SF of 2.5 -isiequired due to transient loading conditions atthis particular plant (see Section 4.3.3.2).
2. Establish the minimum mixed liquor dissolved oxygen (DO)
4-7
concentration.

Consideration of, aeration efficiency at the peak hourly load is required (see', Section 4.8). Assnnie a minilnum DO of 2.0 mg/1 is selected as a comprom1se
,between power requirements and a consideration of the depressing,effects of lowDO levels on the rate of nitrification as discusSed in Section 3.2.5.5.
Estimate the procesS operating pH (see SeCtion 4.9.2).ApproXimately 7.'14 mg/1of alkalinity as CaCO3 is destroyed per mg/1 of NH4 -N oxidized. Neglecting theincorporation of nitrogen into biomass, the alkalinity remaining after nitrificationwill be at least:
280 [7.14(25)1= 102 mg/1
If a coarse bubble aeration system is chosen, the-pH should remain above pH 7.2and Chemical addition is not required for pH control (see Section 4.9.2).
. -
4. Calculate the maximum growth rate of nitrifiers at 15 C, DO = 2 mg/1, andpH > 7.2. The appropriate equation to be used was presented in Section 3.2.6 andis as follows:
le
DO'_N N K + DO -
r 8.33(7.2 - pH)02
where: =
A
PN
-maximum possible mtrifier,growth rate, day 1,
environmental condition's of pH, temperature, and DO,
maximum'nitrifier-growth rate, day 1, and
- (3-23)
half-saturation constant for.oxygen;.mg/1.02
The last,,brapketeil.6rm is taken as unity at,a pH above 7.2. Using the specificvalues adopted Section 3.1.5 for µN and K02 leads to the following expres-.sion:
= 0.47 {e 1 ° E - 0.833(7.2 - pil0.098(T 5)
N DO + 1.3
Using the numbers given above:
,, -p, .7 (0.47)(0.61) 7 0.285 day
1
Pd
5. Calculate the minimum solids retention time for nitrification. From Equation3-15, the correct expression is:

em=
where:
For this example:
(4-2)
minimum solids retention time, days, for nitrification at pH,temperaflire and DO.
in0 =c_
1= 3.51 days
0.285
6. Calculate the design solids retention' time From Equation 3-29, the correctexpression is: t?
N
*here,:
d0 = SF.
solids retention time of design, days.
(4-3)
7. Calculate the' design' nitrifier growth rate. From Equation 3-12, the correctr expression is:
where: MN
For this example:
nitrifier growth rate Nitrosomonag , day1.
1
IN 8 78 = 0.114 day
Calculate the half-saturation constant for ammonia' oxidation at 15 C The properexpression is:
.100.051T - 1.158 .
+half-Saturation constant fOr N114 N, ing/1, and
Teftiper.ature, C
For this example:

O. Calculate the steady state aninionia. content of the effluent, Equation,. 3-24 isdirectly aPplicable to complete mix activated sludge systemi, where N is tlieeffluent ammonii-nitrogen content:
where: N1
For this case:
NI
N+ N
I
(3-24)
effluent NH4 - N, -mg/1.
= .114 = 0.285
= 0'.27
Transient loading effects on effluent quality are presented in Section 4.3.3.2.
NI+ 0.405
910. calculate -the organic removal rate. The design solids retention time Oc applies toboth the Mtrifler population and the heterotrophii population. Equation 3-27 canbe applied to determine substrate removal rate
.
heterotrophic yield coefficient, lb 'VSS grown per lb BOD5removed,
rate of substrate removal, lb. BOD5 removed/lb VSS/day, and
"decay" coefficient, day-1.
Assume representative values for Yb and ISI:29
Yb = 0.65 lb VSS/lb BOD rem.
= 0.05 Clay."
Therefore:
0.114 = 0.0qb - 0.05
0.252 lb BOD rem. /lb MLVSb

In the abovecalculation of qb, it is assumed that the fractioliof nitrifiers is lowandnd can be neglected (see Section 4.6.1 for a. discussion of this point).
Determine the hydraulic detention ,rime at ADWF. In. this analysis, rite MLVSScontent and effluent soluble BOD must be known. The effluent soluble BOD5can be assumed to be very low (say 2 mg/1). The MLVSS content is dependent onthe mixed liquor total suspended solids, which is in turn 'dependent on the-operation of the nitrification sedimentation tank Section 4.10). Aisume for thepurposes of this example that the design, mixed liquor content at 15 C is2500 mg/l. At a volatile: content of '75' Percent, the NIL'VSS is 0.75 (2500) =1875 mg/1. From Equation 3-28, the expression for by rat is detention time is:
where: HT
1.
Sc;
HT=S
1
X1qb
:hydraulic, detention time, days,
mixed liquor volatile suspended solids, MLVSS, mg 1,
influent total 130D-5ong/1, and
S1
= effluent soluble BOD, mg/1.
For this p)rample., the hydraulic detentiiin time at ADWF is
148' 0.313 days
(1875)(0.2521
12. Determine the' organic loading per unit volume. The volume required in theaeration basin f mgd flow is
olume = Q = 1(0.313) = 0.313 mil gal =41,844'cu ft
where: Q ,rr influent flow rate, mgd
The BOD5
loading is:
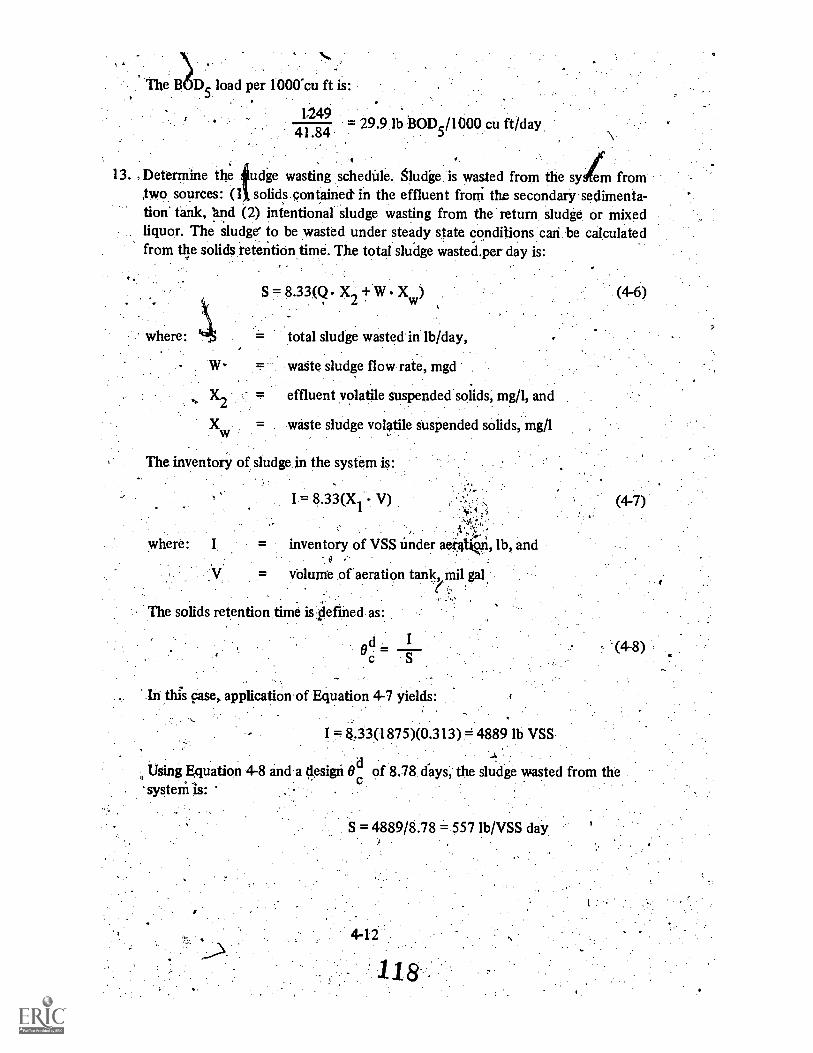
The B D1 load per 1000.cu ft is:
124941.84
= 29.9 lb 130D5/1000 cu ft/day
13. , Determine the udge wasting schedUle. sludge is wasted from the sylm fromttwo sources: (1 solids contained in the effluent froM the secondary sedimenta-tion' tank, 'and (2) intentional sludge wasting from the return sludge or mixedliquor. The sludge to be wasted under steady state conditions can be calculated
. . .from the solids retention time The total sludge wasted.per day is
where:
S = 8.33(Q X2 + W Xw
) (4-6)
total sludge wasted in lb/day,
waste sludge flow rate, mgd
effluent volatile suspended solids, mg /l, and
= waste sludge volatile suspended solids, mg/1
The inventory of sludge in the system is:
I = 8.33(X.1 V) (4-7)
inventory of VSS under aeratitr, lb, and#
Volume of aeration tank, mil gal(
The solids retention time is slefined as:
ead =
In this case, application of Equation 4-7 yields:
I = 8.33(1875)(0.313) = 4889 lb VSS
Using Equation 4-8 and a cIesign Oc of 8.78 days, the sludge wasted from thesysteM
S = 4889/8.78 =.557 lb/VSS day
The sludge contained in the effluent at 1 rtigd can be calculated assuming that.theeffiu-ent volatile suspended solids is equal to 12 mg/1: ' ) 4
8.33 (1) (12) = 100 lb VSS/day
By difference, the lb of MLVSS to be wasted from the mixed liquor Or return sludge is:
557 7 100 = 457 lb VSS/day
4.3.3.1 Effect of Temperaturt and Safety Factor on Design4
The design example presented in the previous section provided one solution to , a set ofstated condition& Alteration of the lowest temperature at which nitrification will besupported, or the design safety factor, or the wastewater strength; or the assumption ofdifferent kinetic constants can materially alter the design.
To give one illustration, Table 4-2 has been prepared using differing safety factors'(2.0 to;3.0) and differing minimum wastewater temperatures' With design calculations to derive thecomputed quantities shown. Assumptions have been made for illustratiVe purposes as to thealloy/able MLSS. Allowable mixed liquor levels are a function of sedimentation tankoperation. The mixed liquor level that can be maintained will be affected by reducedsedimentation efficiency at lower temperature& Consideration of aeration tank-secondarysedimentation tank interactions is presented in Section 4.10.
'As can be seen from Table 4-2, low temperature applications (10"C) of combined carbonoxidatiorimitrification in complete .mix activated sludge systems require very long hydraulicresidence times to achieve favorable conditions for nitrification: This factor was one of,the :
reasons for the development of separate stage nitrification systems. As temperatUres rise,required residence times are materially reduced: At 20 C, less than five hqurs is requited forvirtually complete nitrification in the specific case examined. While it is possible to designfor nitrification using the relatively low detention times given in Table 42 for 20 C, specialattention must be given to oxygen transfer as a very high oxygen demand is expressed perunit rlume. Considerations for. oxygen transfer are given in Section 4.8.
e
4.3.3.2 Consideration in the Selection of SF
In introducing the safety . factor.' concept to . the design of biological treattne systems, .,Lawrence and McCarty29 noted that the SF' was necessary to achieve hi efficiencY oftreatment;. to 'insure process stability and to provide resistance to toxic. upsets. Ekcessively
. high safety factors resulted in higher operating and capital costs. It was noted that the safety .
factor concept had been implicitly incorporated into treatment plant design practice by theseleCtion, of solids retention times in excess Of
, .
1194-13
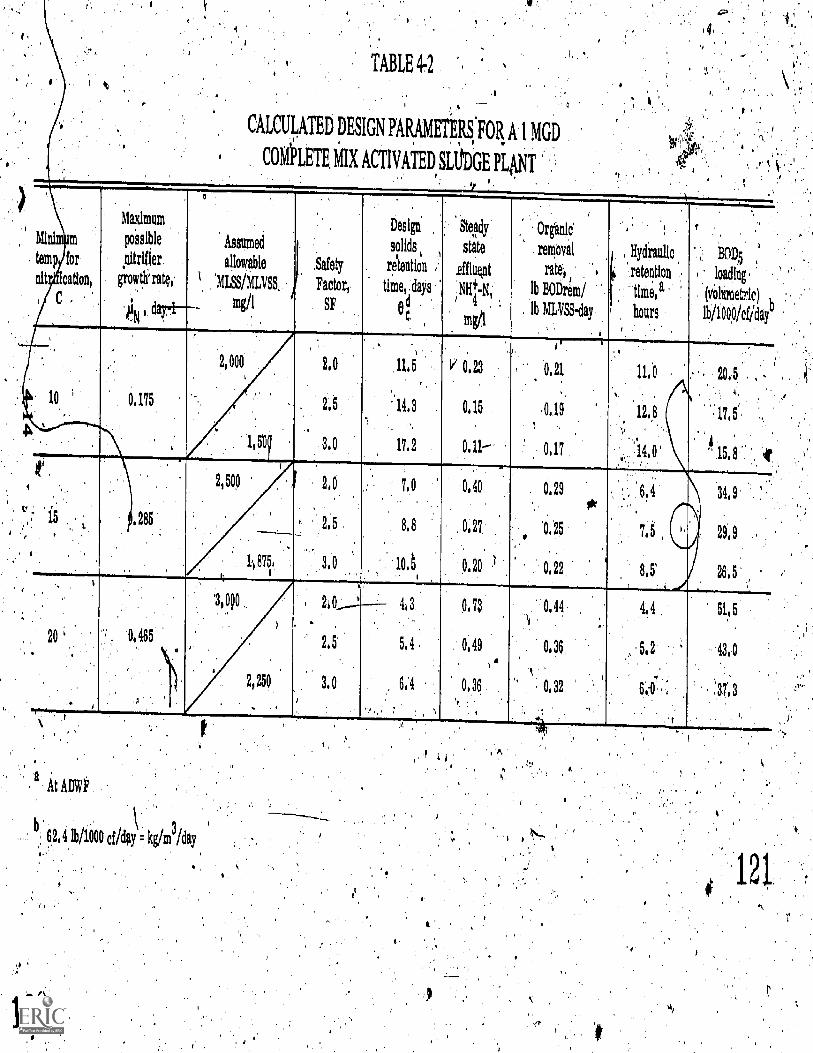
TABLE t1-2
CALCULATED DESIGN PARAME'rERS:FOR A 1 MGD
COMIIETE MIX ACTIVATED, SLIJDGE PLANT
mini m
temp for
nit ication,
C .
Maximum
possible
pitrifier.
grovitillk
kill d
"
Assumed
allowable
1 'MISS/MUSS
mg/I
Safety
Factor,
SF
Design
solids
retention ,
timel.days
ed
Steady
state
,effluent
NH+41
'±
m et
,
Organic
removal
rate,
lb 130Drem/
lb MLVSS -day
,Ilydraulic
retention ,
bellhours
130D5
, loading,
(Volumetric) 1,
lb/100,0/cfiday4.
.. '2,000 2,0 IL 5 V 0.23 0,21 11;0 20,5 ,
6 10 0.175 2.5 1413 0,15 0,19 12.8 '1.7,5
1,50! 3,0 17,2 0111 . 0117 14,0" 15 8
2,500 ' 210 7,0 0,40 0129 '6,4 34,9/0'
,:' 15 .285 , 2.5 8.8 0.27 0,25 7.6 29,9
1.1875,i
3,0 10.,
0.20 0,22 8,5' I.. 26 5
;0c10 ,
k
20..._---- 4,3 0.73 0.44 4.4 51,5
20 ' 0,4652,5 5,4 0.49 0,36 5,2 43,0,
, ,
2,250 3,0 6.4 0 26. 0,32 6,-0, : .37,3
b 62,4 lb/1000 efiday = kg/m-/day

Because the SF, concept is relatively new, there is no ,plant scale experience with itsapplication accumulated as yet on which to base broad recommendations. Rather, kinetic ,theory itself is Used in this section'to establish minimum factors of safety considering thedesired degree of nitrification under steady state and transient load conditions. It must beemphasized that these are minimum valdes and individual designs may exceed these valuesfor, a variety of reasons. For instance, the presence of industrial wastes may adversely affectnitrification rates, requiring conservatism in the selection of the SF.
Figure 4-2 proVides a wider array of safety factors for the design example presented in Table+2. As may be seen, the selection of the SF has a marked effect on the calculated steadytlate4values of ammonia in the effluent. If relatively complete nitrification is to be obtained(at steady-state) resulting in 0.5-:2 mg/1 of aminonia-nitrogen in the effluent, a minimum SFof 1.5 is,,appropriate for application to complete mix activated sludge systems. Further,effluent values for a comparable plug flow system are also shown in Figure 4-2 (see Section
, 4.3.5 for plug 'flow data). Asmay be seen, complete mix syitems have higher effhientammonia levels than plug flow systems at the same SF.
In all practical applications, waste treatment plants do not operate at "steady state."Significant diurnal variation in the nitrogen loading on such systems Occurs. Figure 4-3shows the diurnal variations in influent flow and TKN loading-experienced at, the ChapelHill, N.C. treatment plant. The ratio of the maximum TKN loading to the average was 2.17,while the ratio of: the Maximum to minimum was 6.72. The Chapel Hill systein is a relativelysmall system (1.8,mgd),Vir'ith high peak to average ratios for all constituents.30.ihe variationin load for each community . will be a function of the unique' characteristics of thatcommunity (see Section 4.8), and data fnust be individuallY developed for each situation.
TKN load Sariations hey gnificant impact OA nitrification kinetics, and ammoniableedthrough can occur ;peak load situations: ,32 Kinetic-theory can be applied to
';these situations, howeVer, d' the' safety factor' established at .levels which will preventammonia bleedthrough from causing signific4nt:d'eteiioration of effluent quality.
A mass balance on nitrogen in the organic and ammonia fOrm can be made at any timeduring a diurnal cycle which states that the influent TKN load is equal to the effluentammonia load plus dial nitrified in the complete -mix reactor during any time, At:
4'
N = q fX Vtit + No N .1. 1
QM.
where: 'No
N1
Q
e
= -" influent TKN concentration,-mg/1,
effluent ammonia nitrogen concentration, mg/1,
influeint or effluent flow rate, mid,
timeincrement,
4715
(4-9)
44

= ,volumeof aeration basin, mil gal,,
= nitrifier fraction of the mixed liquor solids
FIGURE 42
EFFECT. OF THE SAFETY FACTOR ON STEADSTATE'EFFLUENTAMMONIA LEVELS IN SUSPENDED GROWTH SYSTEMS
6
E
+
2
-1
1 . 1 .1. 1 1 4. 1 T
A. at 20Cb.
COMPLETE MIX
PLUG FLOW
0 I I I I I I I
, -1 0 1.2" 1.4 1.6:.1,8 2.0 2.2 2.4 2.6 2.8SAIFETY FACTOR ,SF
2.5
0, 2.0
1
3.0.
2 1.5
/.0
0,5 PLUGFLOW
. 1.0 1,2 1.4 1.6 1,8 2.0 2.2SAFETY4 FACTOR
4-16 23
2.4 2.6 2.8 3.0SF.
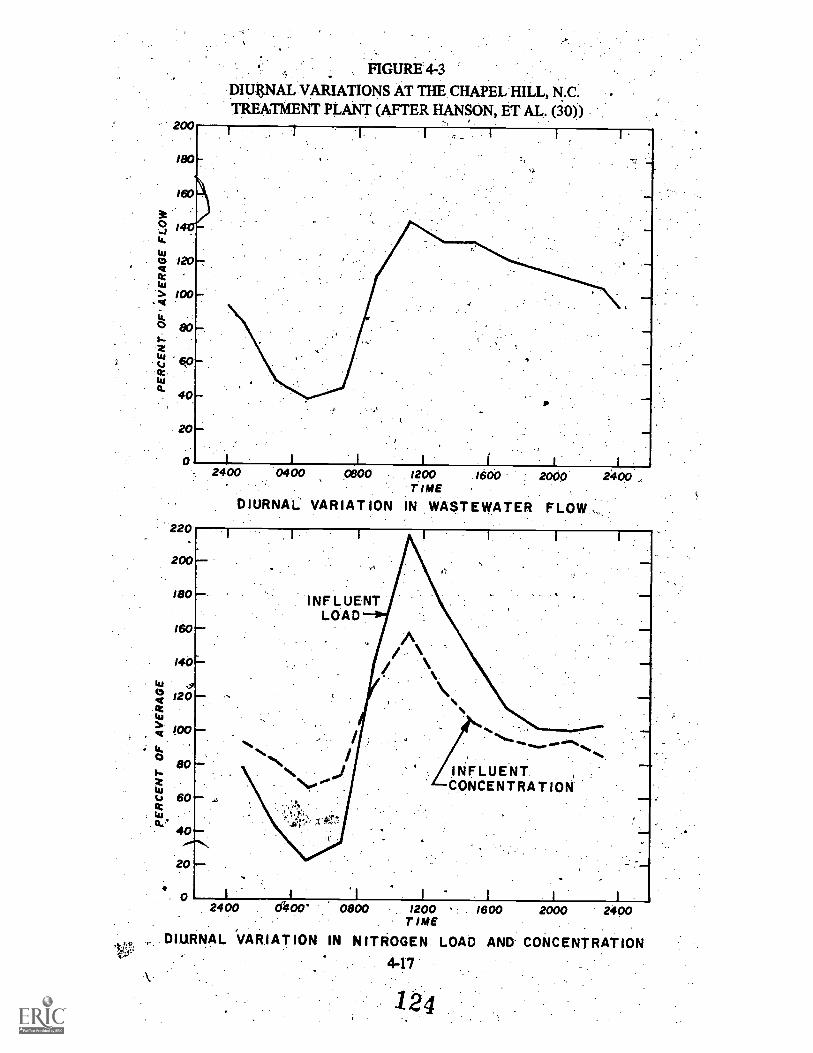
200
180
160
3140
cD 120
or
/00
O 801Ztuc 6k0or
40.
20
FIGURE 4-3
DIUI3NAL VARIATIONS AT THE CHAPEL HILL, N.C.TREATMENT PLANT (AFTER HANSON, ET AL (30))
2400 0400 0600 1200 1600 2000 2400TIME
DIURNAL VARIATION IN WASTEWATER FLOW
2400 . clkiocr 0800 .. 1200 : 1600. T IME
,..DIURNAL VARIATION IN NITROGEN: LOAD AND CONCENTRATION4-17
2000 2400
124
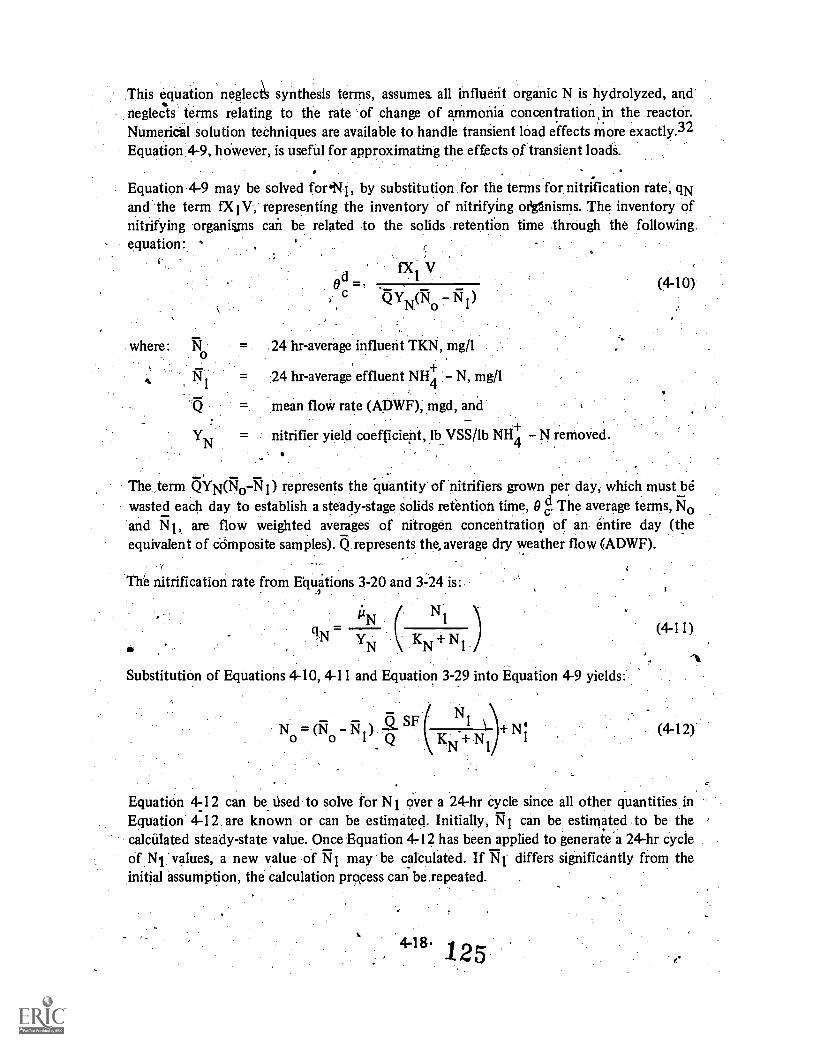
This equation neglect synthesis terms, assumes, all influent organic N is hydrolyzed, andneglects terms relating to the rate of change of ammonia concentration in the reactor.
.
Numerical solution teChniques are available to handle transient load effects more exactly.32Equation 4-9, however, is useful for approXimating the effects of transient loadS.
Equation-4-9 may be solved foolsli, by substitution for the terms for nitrification rate; qNand the term fX1V, representing the inventory of nitrifying ottanisnis. The inventory ofnitrifying organigns can be related to the solids retention time through the followingequation: °
r.
fX1
V
'(5Y11(17To 511)
where:0
24 hr-average influent TKN, mg/1
,24 hr-average effluent NH+ N, mg/1
mean flow rate (ADWF),mgd, and
= nitrifier yield coefficient, lb VSS/lb NH4 N removed.
(4-10)
The term QYN(NoN1) represents the quantity of nitrifiers grown per day, which must_ bewasted each day to establish a steady-stage solids retention time, 0 g. The average terms, sloand Ni, are flow weighted averages of nitrogen concentration of an entire day (theequivalent of composite samples). Q.represents the, average dry weather flow (ADWF).
The nitrification rate from Equations 3-20 and 3-24 is:.
11N N
YN KN N(4-11)
Substitution of Equations 4-10, 4-11 and Equation 3-29 into Equation 4-9 yields:
.::$ SF ( (4-12)'
Equation 4-12 can be used to solve for NI over a 24-hr cycle since all other quantities, inEquation 4-12 are known or can be estimated. Initially, R- I can be estimated to be thecalculated steady-state value. Once Equation 412 has been applied to generate'a 24-hr cycle .
of N1 values, a new value of N1 may be calculated. If N1 differs significantly from theinitial assumption, the calculation process can be repeated.
418. 1 25

Equation 412 -has been applied to the variations in load obsered at Chapel Hill, and Using:the design informatiow,used to generate Table 4-2 at a temperature of 15 C. The results ofthis analysis are 'plotted in Figure 4-4 for three chlfeileni assumed safety factors; 1.5, 2.0;and 2.5.. As may . be seen, the assumption of the s'fifety. factor has a marked effect on theaverage effluent ammonia content, Sir. For this particular case, the ratio of peak to averageTKN loading was 2.2; the SF had to exceed this ratio (2.5) to produce an effluent that had, .
on the average, less than 1 mg/1 of
The application or-Eduation 4-12 to several other such Cases' showed the same effect;namely, the minimum safety factor should. equal or exceed the ratio of peak ammonia loadto average load to prevent high ammonia bleedthrough at peak loads. This statement may beused as "a rule of thumb" for designing suspended growth nitrification syetems operated inthe complete mix mode.
A flow equalization 'procedure applicable to reducing diurnal peaking on nitrificationsystems is presented in Chapter 3 of 'the Process Design Manual for UPgrading ExistingWastewater Treatment Plants. 25 By incorporating flow equalization into treatment 'plants,
20
FIGURE 4-4
EFFECT OF SF ON DIURNAL VARIATION IN. EFFLUENT AMMONIAI
S F = 1.5
N1 = 5.-5
1
N1 =24 hr average.composite NH4 -Nconcentration
A/
SF = 2.5Ni = 0.6
0
SF = 2,0
= 1,5
.0800 1200 ,
TIME,1600 2000 2400
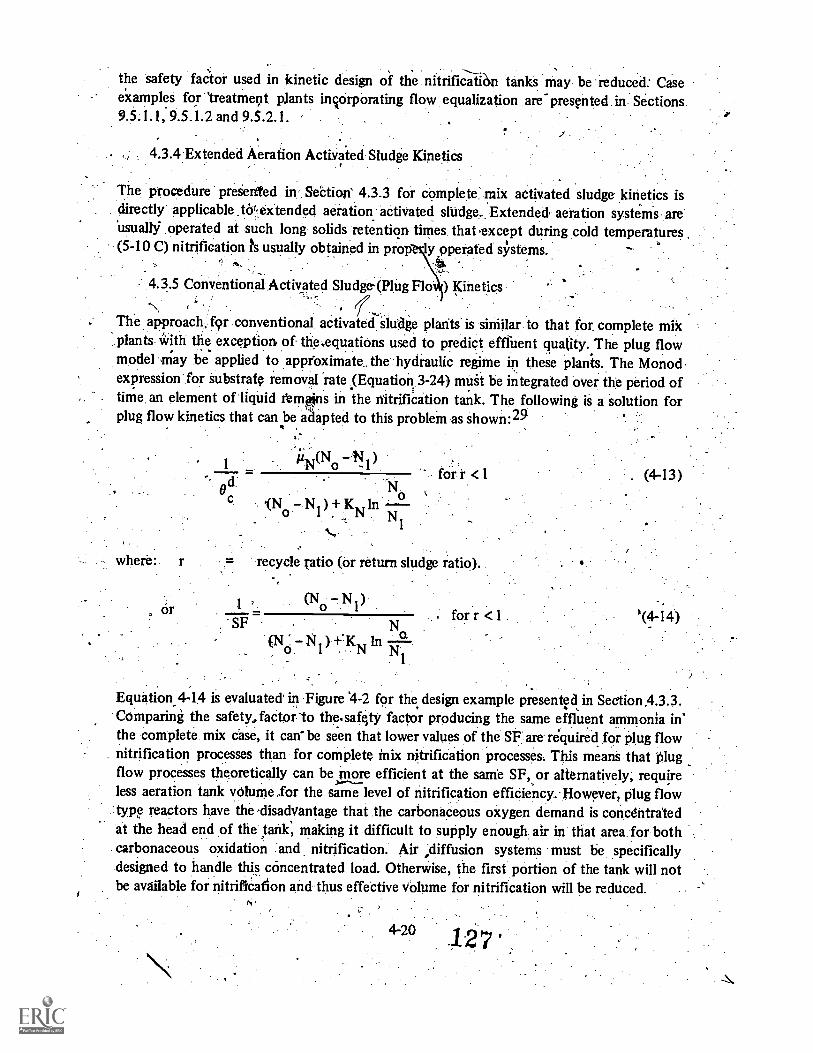
the safety faaor used in kinetic design of the nitrifici n tanks may be reduced: Caseexamples for 'treatment plants incorporating flow equalization are presented in Sections9.5.1.1, 9.5.1.2 and 9.5.2.1.
4.3.4 Extended Aeration Activated Sludge Kinetics
The procedure presenled in SeCtions 4.3.3 for complete mix activated sludge kinetics isdirectly' applicable .teE:ex tended aeration 'activated sludge. Extended aeration systems are'usually operated at such long solids retention times that except during cold temperatures(5-10 C) nitrification usually obtained in prop ly operated systems.
4.3.5 Conventional Activated Sludge(Plug Flo ) Kinetics
The approach. for conventional activatectiluage plants is siMilar to that for complete mixplants with the exception of the equations used to predict effluent quality..The plug flowmodel may he applied to approximate the .hydraulic regime in these plants. The Monodexpression for substrate removal -rate (Equation 3-24) must be integrated over the period oftime, an element of liquid *mains in the nitrifiCation tank. The following is a solution forplug flow kinetics that can be adapted to this problem as shown:29
.
where:
or
d
IIN(No -1!1) ford <1 . (4-13)
.(No7N.I)+KN In
N1
No
recycle ratio (or return sludge ratio).
(No - N1)
SF01:5 - ln
. 1
for r <1 .
,
'(4-14)
Equation.4-14 is evaluated' in Figure 4-2 for the design example presented in Section,4.3.3.Comparing the safety., factor the.safeAy factor producing the same effluent ammonia inthe complete mix case, it can-be seen that lower values of the SF are required for plug flow
. nitrification processes than for complete mix nitrification processes: This means that Plugflow processes theoretically can before efficient at the same SF, or alternatively; requireless aeration tank volume for the same level of nitrification efficiency However, plug flowtype reactors have the disadvantage that the carbonaceous oxygen demand is concentratedat the head end of the tank, making it difficult to supply enough. air in that area for bothcarbonaceous oxidation and nitrification. Air ;diffusion systems must be specificallydesigned to handle this concentrated load. Otherwise, the first portion of the tank will notbe available for nitrification and.thus effective volume for nitrification will be reduced.
420 .127

A typical DO and nitrification pattern for plug floW tanks where aeration capability islimited in the front end of the tank is presented in Figure 4-5, where an aeration tankprofile for DO and ammonia nitrogen is plotted. Asimay be seen, nitrification is inhibited inthe first portion of the, tank, because, of the. DO suppression due to carbon oxidatiOn. Oncethe DO rises, theeammohia le ''el falls at a reaction rate that approximates zero order, areactor ordei predicted by kinetic. theory (Section 3.2.7). ,It is notable that if sufficientaeration capability had been available in the head end of the tank, virtually completenitrification probably would have been obtained.
Thus, the first portion of plug flow tanks may be ineffective for nitrification, reducing theeffective contact time for nitrification. If oxygen supply limitations are present hi the headend of the tank, the plug fl6w type reactor's advantage over the complete mix reactor is:,reduced. '
/
The degree to which full-scale nitrificatiOn tanks approach plug-flow operation, can beexamined through reactor diffudoh theory.34,35 Reactors can be characterized byan.axiialdisperson number, D/uL, where D is the axial .disperson coefficient in square ft per hr, u isthe mean displacenient velocity along the tank length, in feet per hr; and L is the anklength, ft. In the calculation of the axial disperson number, u' and. L are kriown fo any
FIGURE 4-5
DO AND AMMONIA NITROGEN PROFILE IN A PLUG-FLOW SYSTEM(AFTER NAGEL AND HAWORTH (33))
4.4
15
I
kj. OMMo
..0""i I ,I50 100 150 .
DISTANCE ALONG TANK , 'FEET
i200
2.5
2.0
1.5lu
LO
0.5 --I(f)cn
I 0250

particular plant design and D must be measured. A Valid empirical relationship for D forboth fine and coarse bubble diffused air plants is as follows:35
where:
D = 3.118 W2(A)0.346
. tank width, ft and
= air flow per unit tank volume, instandard cubic feet per minuteper 1,000 cu ft.
The axial disperson coefficient, D /uL is zero for true plug flow plants and infinite (oo) for
(4-15)
true complete mix plants. Plants with D/uL between 0 to 0.2 are usually classed as plug floWreadtors, while for complete mix systems, D/uL is usually in the range .from 4.0 to 00.36
As an example, calculation, the Central. Contra Coita Sanitary District (CCCSD) plant'snitrification tanks (Section 9:5.2.1) have the following characteristics:
Air flow (at) = 51.1' SCFM/1000 CFWidth = 35 ftArea of tank = 525 sfLength (all 4 passes) = 1080 ft`Flow each tank (4 passes) @ 50% recycle = 22.5 mgd
From the 'above data, the mean displacement velocity can be calculated to be 239 ft/hr.From Equation 4-15, the diffusion coefficient is:
D = 3.118 (35)2 (51.1)11346 = 14,989 ft2/hr.-
D/uL = 14,898/239 (1080) = 0.058efore:
0..
erefore; the.CC SD.nitrification tanks closely approach a plug flow reactor.
h,
Equation 4-15 canwhether-they appronitrification. It is pphig flow. Foremployed which
e utilized to evaluate mixing in actual plant designs to determineh plug flow closely enough to allow use of Equation 4-15 to describe
bable that most plants operated in the conventional mode do approachse plants with intermediate values of DAIL, complete mix kinetics can be
yield conservative answers.
The h draulic nfiguration of nitrification tanks can also be designed to discourage backmixi g. A serie of complete mix tanks can approximate a plug flow reactor. In the caseexample for Ca berra, Australia 9.5.2.2) completeemix reactor ate used in seriesfor nitrification. Absolute preVention of back mixing is icrOided by virtue of the mixedliqtior overflo ng! weirs between . reactors. Available head at the site was utilized,
4-22 129

eliminating the need for mixed liquor pumping.
4.3.5.1 Considerations in the'Selection of the Safety Factor
,
The factors affecting'the choice of the SF for plug flow activated sludge are similar to those,for ..complete mix applications. Diurnal peaking in load has an important influence on thechoice of the SF, although kinetic models have not been extended to handle diurnal loads inplug flow systems at the present, time It can be expected that the effects of diurnal loads on °'
plug flow systems will be similar to thoge for complete mix systems as when the effluentammonia nitrogen` level rises to 2 to 3 mg/i or above, the rate of removal becomes a zeroorder.- reaction (unaffected by ammonia nitrogen concentration).-In zero order reactionsituations, differences between plug flow and complete mix kinetics are negligible. .
Therefore, the adoption of the criteria advanced for complete mix systems (that theminimum SF equal or exceed the ratio of peak ammonia load to average daily load), shouldprevent' high ammonia bleedthrough during diurnal, peak loads. The problem of glow,dissolved oxygen due to carbonateou-s load in the head end of plug flow systems should beconsidered in aeration design, for combined' caibon oxidation-nitrification applications;indeed, this facto alone would justify a conservative safety factor.
7
4.3.5.2 Kinetic Design Approach
The kinetic -design approach for plug now . (conventional) plants is identical to thatpresented in Section 4.3.3, excepting in Step 9, where Equation 4-13 is used instead ofEquation 3-24. If a portion of the nitrification tank is rendered ineffective by DOsuppression at its head end, then only the sludgeinventory maintained under adequate DOconditions shOuld be used in the calatilatiQn of '0 or or the SF.
4.3.6 Contact Stabilization Activated Sludge Kinetics
Gujer : and Jenkins37,3.8 have developed the kinetic design procedure for nitrification mcontact-stabilization activated sludge plants. The procedure described herein is a summaryof their aPproach, and the reader is referred to their publications for theoretical bases...
The overall nitrifier growth rate in the contact stabilization process is the weighted mean oftheir growth rate in the contact tank and in the stablization (sludge reaeration) tank: ,
where:
C, B =
N=
c
growth' rate of the nitrifiers in the overall process,in the contact and stabilization tanks respectively.(day 1)
the fractions of total sludge in the contact andstabilization basins respectively.
4-23.
an
(4-16)

Gnjer and Jenkins used Equation 4-16, and Monod type eXpressions for complete mik tanksto develop a graphical solution for nitrification in contact stabilization (Figure 4-6). InFigure 4-6, the effleiencY of nitrification, nnit, is defined as a fractiOn by
where: (NO3 )c
(NO3)s
03 HN level in the contact tank, mel, and
NO3 - N level in the stabilization tank, mg /1..
4.3.6:1 Design Example
As a design example, consider a 1 mgd contact stabilization plant operated at a mihimumtemperature of 15 C. Influent BOD5 is 150 mg/1, including solids handling returns to theprimary. Total Kjeldahl Nitrogenis 30 mg/1, of which 21 mg/1 is ammonia -N and 9 mg/1 isOrganic N. The wastewater has an alkalinity of 210 mg/l. The effluent requirement is notmore than 10 mg/1 reduced soluble nitrogen (organic and ammonia). The procedure is as;follows:
1P
. Establish a reasonable safety factor for nitrification,'say 2.5 as-in Section 4.3.3.
2. Establish the minimum mixed liquor DO; assume 2.0 mg/l as in Section 4.3.3.
3. Establish the maxnnuin growth rate of nitrifiers, assuming for the moment thatthere is sufficient alkalinity in .:the wastewater to buffer the nitrification pH togreater than 7.2see step 14). Therefore,
liN = 0.285 day as in Section 4.3.3, step 4.
4. Calculate the minimum solids retention time, the design solids retention time andthe actual nitrifier growth rate (as in Seation 4.3.3, Steps 5, 6, 7):
= 3.51 days
d = 8.78 daysc
IAN =7. 0.114 day 1
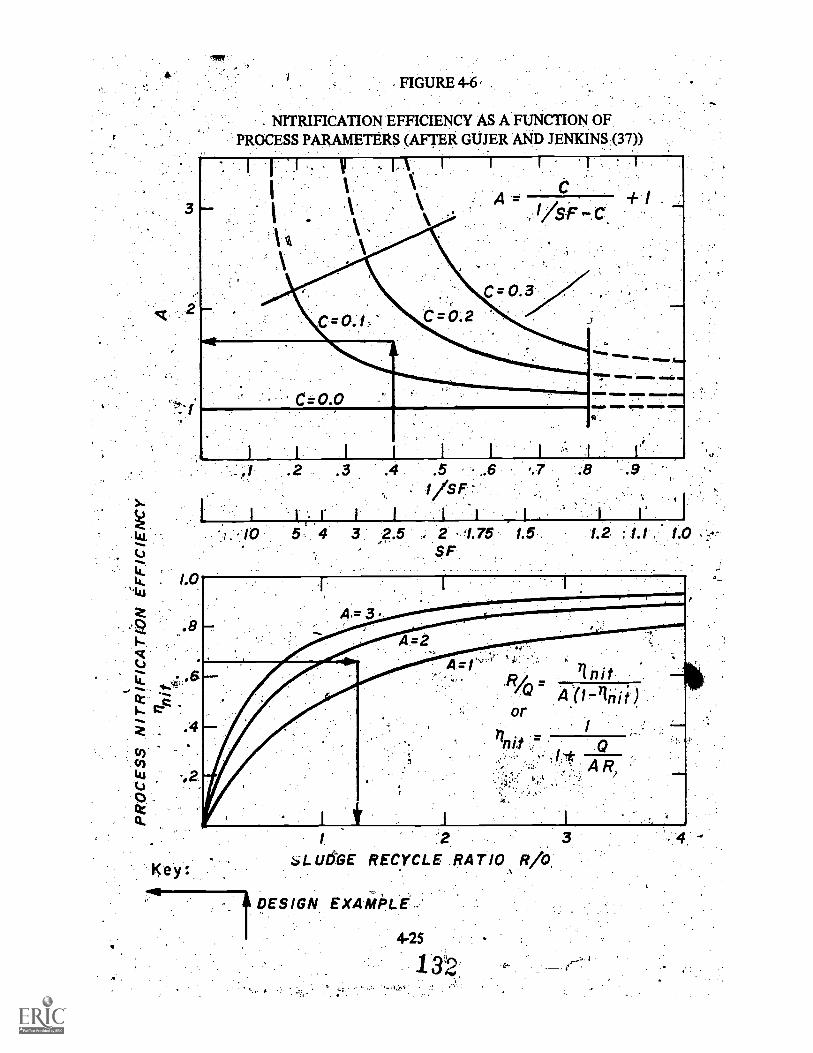
FIGURE 4-6,
. NITRIFICATION EFFICIENCY AS A FUNCTION OF.PROCESS PARAMETERS (AFTER GUJER AND JENKINS (37))
I
=P.m mewlmo awl&
1 2 3 . .5 .6/SF
I I
IO 5..4 3. .2.5 2. '1.75 1.5 1.2 :1.1 . 1.
SF
Key:
I. 3LUDGE RECYCLE RATIO R/O,
DESIGN EXAMPLE
4-25

-Calculate the organic removal rate, as in Step 10 ; ,Section 43.3:
qb -= 0.252 lb pop rem/lb MLVSS /day
.,41:Calculate the VSS produced per unit of wastewater treated:
(So 7. S1) µN /q \= (150 7,2)(0.114)/0.252 = 674 mg/1
;Compute the nitrogen incorporated into. VSS,. assuming. 12 'percent nitrogenincorporated into VSS:
0.12 (67.0) = 8.0 mg/1 N
Compute the soluble N content of the effluent, assuming no depitrification. The-effluent soluble N = the total influent N minus N incorporated into VSS:
30 $.o = 22.0 mg/1 soluble N
Calculate the s41ulile, organic N in the effluent.. Gujei'and Jenkins found that 40percent of the itfiluent organic N appeared in solUhle form in the effluent:
0.4 (9) = 3.6 mg/1 organic N
4.0 mg/1 organic N
Calculate aMmonia nitrogen in the effluent under 'steady state conditions:
Total reduced N --,organic N = 10=-4 = 6 ing/I NH+ -N.
Calculate nitrate nitrogen in...the effluent and in the contact tank under steadystate conditions:.
Tootal soluble N al.rdUcedN-= (NO3.c --
''(NO3 =,-,22 7 14= 12 mg/1
'Calculate the required, nitrification efficiency from Equation 4-17:
unit = 12/(1. = 0.667.. .
In this calculation, it is assumed that the concentration of nitrate nitrogen in thestabilization tank (NO3 )s totals, 18 mg/1, since the contact' tank concentration is12 mg/1 and with the assumption that the 6 mg/1 a, ammonia nitrogen iscompletely nitrified in the stablization tank.
,r.
133.3.

13. Calculate the required sludge recycle ratio. Assume the fraction of biomass in theicontact tank is 15 percept (C= 0.15). The dimensionless number A, is used in -the.calculation; A is defined as folloWs:
For this example:0.150.1
. c+
3. I.4°
, 2.5
..4.
The required' sludge recycle ratio, 'R/Q,required.nitrification efficiency 2S follows:
ni t
A(1
n
onit
depends on the 'iValue and the 1.
Where: .R = -*recycle flow rate, mg:-
Q = influent flp.w rate, mgd
" For this example:
. R/Q 0.667 .
1.60(1 0.667r:
Since Q has been assumed. to 1:411nigd, the return activated sludge rate is 1.2mgd.;:44V-
.0.- .q.c.: This examptelS also worked graphigally in Figure 4-6. The top part, of the figure is '
used first' by .bnteripetke abscissa with the value of the SF and ris1Pg vertically tothe chosen value of't. and then redtlini the value of k f:iin the ordinate. Thebottom part of Figuie 4-6 is then lisecyrthe nitrification efficiency,' onit, isentered on `the ordinate and travelili :horizontally to the value of A justdetermined and then finding the required recycle ratio on the absciss. Figure 4-6also demonstrates , a general result; in order to obtain high nitrification efficir ,-,1-
,,,, ,
a hkgher.tlian normaledudge recycle ratio must be employe& , ...,41 .1
.., .
.,.
,!. ..,
4. Check the buffering of the wastewater. The* quantity of ,apitn9niii intrified isreflected by the' level of nitrate in the process effluent Aptf6Ximately 7.14 mg/1
° + -1. 9A''.of alkalinity as CaCO3 is destroyed per mg/1 of N1-14-N xidized. The alkalinity- :remaining after nitrification would be at least

210 7.14 (12) = 124 mg/1 as CaCO3
This:sh,Ould,. be sufficient residual alkalinity, to maintain: the, pH; above;:.7.2 forCoarse;bulible aeration systems. If a fine bubble aeration system were chosen,,';chemical addition would be required and the dose estimated from the',titOcedurek dIscusseil In Section Altspativoly, a lOWeP operating pH couldbe used Withengerfairatititiperiod, '
Calculate reagtiifi.olumes. As in Section 4p3:3, assume the mixed liquor°.content in:the cOntact;;;tank. is 2500 mg/1 at a volatile, content of 75 percent Themixed ,liqUor'vOlatile Suspended solids in stabilization daii.ibe obtained from thebalance::
where: Xc
=
contact 'MLVSS; mg/1, and
stabilization MLVSS, mg/l.
Tle16fore: Xs = 1875 1 ÷.25
The total sludge inventory_ can be CalCulated Win the following.equation forsubstrate removal rate:
Q(S67 S )
'EXVr
EXV = total inventory of MLVSS in the:COptact and,, stabilization tanks, lb
1(148)(8.i31)._= 4889 lb
(.252)therefore: EXV
Of this inventory, 15 percent is in the contact tank:,
0.15(4889) i--.733 lb MLVSS
,.,_,The"remainder is in the stabilization tank:
4889 = 733 = 4156* NOSS
4-28
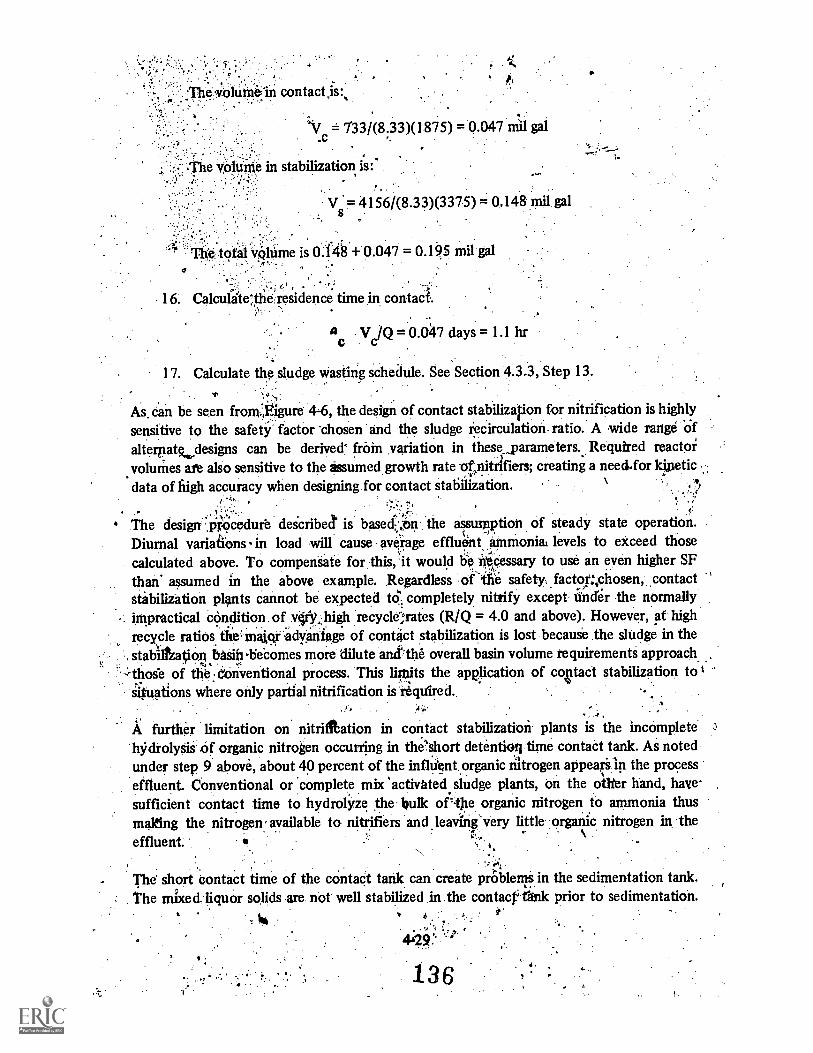
. , ..
e Tolumein contact is:,
733/(8.33)(1875) = 0.047 Mil gal
Vs = 4156/(8.33)(3375) = 0.148 mil gal
.totalvi5liiine is 0:148' +0.047 = 0.195 mil gal.
16. Calculate; the, residence time in contact.
ac Vc/Q =- 0.047 days = 1.1 hr
17. Calculate the sludge wasting schedule. See Section 4.3.3, Step 13.
As can be seen from, agure 4-6, the design of contact stabilization for nitrification is highlysensitive to the safety factor 'chosen and the sludge recirculation- ratio. A wide range ofalternatedesigns can be derived' frain variation in these_parameters.. Required reactorvolurries are also sensitive to the assumed growth rate-of,riitiifiers; creating a need.for kineticdata of high accuracy when designing for contact stabilization.
Str
The design :,Plocedufe deicribect is basek,,t;ii the assumption of steady state operation.s,
Diurnal variations in load will cause average effluent: .arnmonias levels to exceed thosecalculated above. To compeniate for, this, 'it would be.ikCessary to use an even higher SFthan assumed in the above example. Regardless of the safety factor,chosen, .contactstabilization plants cannot be expected td,', completely nitrify except under the normallyimpractical condition. of 110..; high recyclerates (R/Q = 4.0 and above). However, at:highrecycle ratios the.maiqi adyaritage of contact stabilization is lost because the sludge in thestabilhation basal liecomes more dilute an the overall basin volume requirements approach.
-4.hose of the conventional process. This lirpits the application of contact stabilization to tsituations where only partial nitrification is iiqnired. .
A further limitation on nitriftation in contact stabilizatiori plants is the incomplete 3
hjfdrolySis. of organic nitrogen occurring in the'.'Short detention time contact tank. Ai notedunder step 9 above, about 40 percent of the influent. organic nitrogen appeari in the processeffluent. Conventional or complete mix 'activated sludge plants, on the otter hand, havesufficient contact time to hydrolyze the bulk or;the organic nitrogen to ammonia thusmaking the nitrogen' available to nitriiiers and leaving very little organic nitrogen in theeffluent "'
N.
The short contact time of the contact tank can create prOblems in the sedimentation tank.The mixedliquor solids are not well stabilized in the contact'tank prior to sedimentation.
-1r a t
4;29
136

Denitrification activity in the sedimentation tank is therefore greater than in conventionalor complete mix plants and floating sludge m4/ be the result Procedures forcircumventingthe floating sludge problem are discussed in Section.41.10.
.
4..7 Step Aeration Activated Sludge Kinetics
Because of backmixing, the step feed pattern of step aeration plants causes the kinetics ofsuch plants to more closely approach complete mix tr:tari:tijuglyeye As a result, the design .approach developed for complete mix (Section 4.3.3) can usually be employed for stepaeration plants as a reasonable approximation. In those steP4aeration plants where influent isfed to the last pass. (as in Figure 4-1), there is the danger that there will be insufficient timefor the organic nitrogen to be hydrolyzed prior to discharge, resulting in elevated quantitiesof organic nitrogen in the effluent Further discussion of this effect is presented in Section4.3.8.2 which is a description of an operating step aeration plant.
sf
4.3.8 Operating Experience with Combinedrarbon Oxidation-Nitrificationin .SuspendedGrowth Reactors
'While activated sludge-type systems are commonly used in Englarici3O. obtain dependable.nitrification, their use in the U.S. has not been wideSpread. Ea4i. II:S. activated sludgeplants of the conventional design nitrified in the warmer months of the year or if they wereunderlOaded. But nitrification became unpopular because of the additional aeration powercost and, the, propensity of some sludges to float in the sedimentation tank when nitrifying,and it4at,..41estioned whether the added expense was worth iOkimariy cases 39,40 As aco*equencfeAvays and means were sought to prevent nitrification::tather than to encourage
.,..fitithrough..;Acreasing: orgarrit loading or through taperederation,pr.by picking''41nq4ifitpza1idris of the process which were less.. favorable . for nitrification: This early
experience,with the process may have led to uncertainty about its reliability....
Nonetheless, . there have been several plant-scale operations in the U.S. which 'havedemonstrated the viability of the process. The purpose of this section is to review some ofthese cases. Other case'examples are presented in Sections 9:5;1 and 9.5.2.
4.18.1 Step Aeration Activated Sludge In.5tVoderate Climate
` The Whittier Narrows Water Reclamation Plant is a 12 mgd activated sludge plant designedand operated by the Los Angeles County Sanitation Districts. The basic purpose of the plantis to reblaim.water for groundwater recharge; the entire effluent of the plant is, discharged tospreading basins for recharging groundwater aquifers.
pDesign data fox the plant are summarized in Table 4-3.41 The plant operates at either aconstant Eiplv rate or Sconstant oxygen demand lOad by pumping wastewater from a trunksewer and returning grit, skimmings; primary and waste activated sludge back to the trunk.No solids handlinyfacintips are provided as the solids returned to the trunk are processed at
,
4-30
-4,
1.
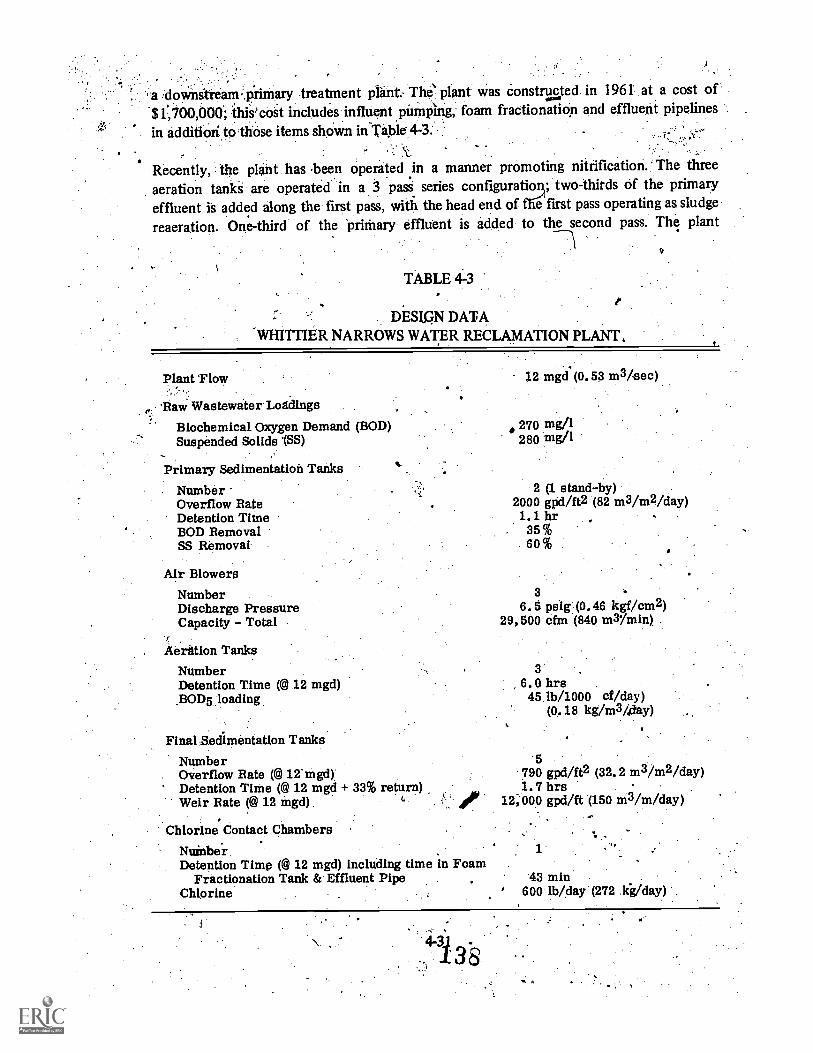
a :downstiiam.primary treatment plant: The'. plant was Constructed. in 1961 at a cost of
.$ 000,000.; this'cOit includes. influent pUinping, foam fractionatiOn and effluent pipelines
in additiotito 'those items shOwn inlable4-3.
Recently, the plant has been operated in a manner promoting nitrification.: The three, .
aeration tanki- are operat6c1 in a 3 pass series configuratioi; two- thirds of the primaryeffluent is added along the first pass, with the head end offg first pass operating as sludgereaeration. One-third of the 'prithary effluent is added to the second pass. The plant
TABLE 413
Disr,qN DATA-WHITTIER NARROWS WATER RECLAMATION PLANT,
Plant Flow
Ravi Wastewiter LoddIngsBiochemical Oxygen Demand (BOD)Suspended Solids VS)
Primary Sedimentation Tanks
NumberOverflow RateDetention TimeBOD RemovalSS Removal
Air BlowersNumberDischarge PressureCapacity - Total
Aeration TanksNumberDetention. Time ((4) 12 mgd).BOD5 loading
Final_Sedimentation Tanks
NumberOverflow Rate (© 12' mgd)Detention Time (@ 12 mgd + 33% return)Weir Rate 12 mgd)
Chlorine Contact Chambers
Number.Detention Time (@ 12 mgd) Including time in Foam
Fractionation Tank & Effluent PipeChlorine
12 mgd (0.53 m3/sec)
270 mg/I280 mg/I
2 (1 stand-by)2000 gpd/ft2 (82 m3/m2/day)1.1 hr
35%60%
36.5 psig. (0.46 kgf/cm2)
29,500 cfm (840 m3 /min) .
3, 6.0 hrs
45 lb/1000 cf/day)(0.18 kg/m3/glay)
5790 gpd/ft2 (32.2 m3/m2/day)1.7 hrs
12,000 gpd/ft (150 m3/m/day)
1
43 min' 600 lb/day (272 kg/day)

performance reflects its very careful control andj.operation; operating data for a one-yearperiod are summarized in Table 4-4.9 While organic nitrogen data are not available, the dataindicate that year-round complete nitrification has been obtained. Climaticconditions forthis California treatment plant are very favorable for nitrification as average monthlywastewater temperatures did not fall below 21 C for the year examined.
4.3.8.2 Step Aeration Activated Sludge in alligorous Climate
The Flint, Michigan sewage treatment plant is being upgraded to comply with requirementsof the Michigan Water Resources Commission which mandate nitrification for the purposeof, preventing DO depletion in the Flint River. In connection with this upgrading, a largescale test of .combined carbbn okidation-nitrification was conducted with the existingactivated sludge plant over a tenifnonth period to determine design conditions for the plantupgrading. The minimum wastewater temperature tested was 7 C.6 During the test, ferricchloride and polymer wereadded to the primary treatment stage for phosphorus. removal.This also had the effect of reducing the organic loading to the aeration tank.
The existing plant had three aerationkanks, each with four passes providing a 750,000 cu ft(21,240 -cu m)-capacity: With aje average design BOD5 loading of 24,500 lb/day (11,110kg/day) to the aeration tanks at a 20mgd (75,700 cu m/day) flow, the aeration tank loadpas 32.7 lb/1000 cu ft/day (523 kg/1000 cu m/day). Flows were varied to the facility,however, to provide variation in loads. Three secondary sedimentation tanks were providedhaving a design overflow rate of 678 gal/sq .ft /day (27.6m3/m2/day) at ADWF. The plantwas usually operated in a step aeration mode, With one-half the influent directed to the headends of the second and third passes.
Average effluent qualities for eight months of the test are shown inTable 4-5. While nitrateand nitrite are not shown,' it is reported that a relatively good balance between ammoniaremoval and nitrate production was obtained.6 Nitrite nitrogen was always less than 0.1mg/l. The appearance of high concentrations of organic nitrogen wai'attributed to the lowrate of hydrolysis-of organic nitrogen compounds.6 It is probable that the provision offeeding wastewater to the last pass exacerbated the problem by causing insufficient contacttime for that portion of the wastewater to complete the ,hydrolysis of organic nitrogen toammonia.
.-;
The effect of temperature and solids retention are considered in Table 4-6. Effluent qualitiesdeteriorated somewhat with colder temperatures, with only 75 percent ammonia removalbeing obtained at 10 C. This ammonia bleedthrough may have been due to diurnal peakingin ammonia at the relatively low solids retention time employed (c.f. Section 4.3.3.2).
A
4.3.8.3 Conventional Activated Sludge In a Rigorous Climate
The Jackson, Michigan wastewater treatment plant is a 17 mgd conventional activated sludgeplant designed, for year-round complete nitrification.1° The existing plant was uPgraded in
4-32
139
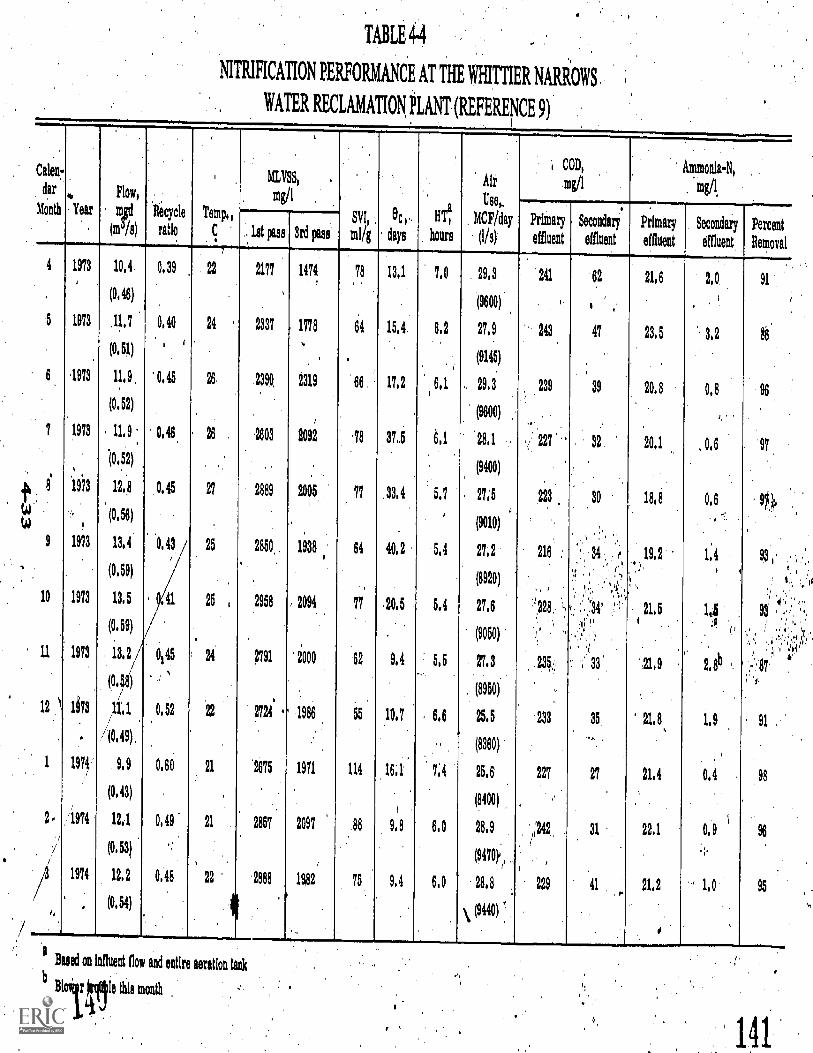
TABLE 4.4
NITRIFICATION PERFORMANCE AT THE WHITTIER NARROWS
WATER RECLAMATION, PLANT (REFERENCE 9)
,
, COD, Ammonia -N,Calera-, MINSS, , Air mg/I .meldar Flow, ing/l Use,.
Month Year m, Bicycle Temp., svi, ac,.. Er MCF/day Primary Secondary. Pilmary Secondary Percent(e/0 ratio c .1st pass 3rd pass mug days hours (Ifs) effluent effluent effluent effluent Removal
4 1973 10,4 0,39 22 2177 1474 78 13,1 7.0 29,9 241 62 21,6 2,0 91,
(0.48)(9600) .
5 1073 .11,7 0,40 24 2937 , 1778 64 15,4 6.2 27,9 243 47 23,5 . 3,2 BB
(0.51) '(9145)
6 1973 11,9 0,45 26 2390, 2319 66 17,2 6,1 .. 29,3 299 39 20,8 0,8,
(0,52)(9600)
7 1973 . 11,9 0,46 28 .2603 1092 .78 37..6 6,1 28,1 . : 227 32 20,1 , 0,6 97
(0.12)(9400)
4 8 1993 12,6 0,45 27 2889 2005 77 33,4 5. 7 27;5 223 30 18,8 0,6 .94 .
(0.56)(9010)
, , ...
9 1973 13,4 0.43 25 2850 1938 64 40,2 5.4 27,2 216 .4
19,2 1:4 93,'(0,59)
(8920) P 1,
',.. li 't
10 1973 13.5 26 Q 2958 2094 77 20,5 5,4 27,6 .: 2 21,5 LS 93 , ,.
1 .'.$ .(0,59)
(9050)
i ;11
11 1973 13.2 0,45 24 2791 2000 62 9.4 5,5 27.3 21,9 2,8b i. ' '(09 )
. (8950)
12 k 1173 ,11.1 0,52 22 2724 ' 1986 55 10.7 , 6,6 25.5 233 35 21,8 1.9 91
,, /(0,49) .
(8960)
1 1974" 93 0,60 21 2675 1971 114 16,1 7;4 25,6 227 27 21.4 0.4 98
(0.43)(8400) ,
2 1974 12.1 0,49 21 2867 2097 88 9.8 6.0 28.9 .(242 31 22.1 0,9
(0.53)(9470y
1974 12,2 0,48 22 2888 1182 75 9.4 6.0 28.8 229 41 21,2 ' 1.0 95,
' , (0,54),
\ (9440)d' .
.
aBased on influent floe and entire aeration tank
Bloir ale this month
4,
141
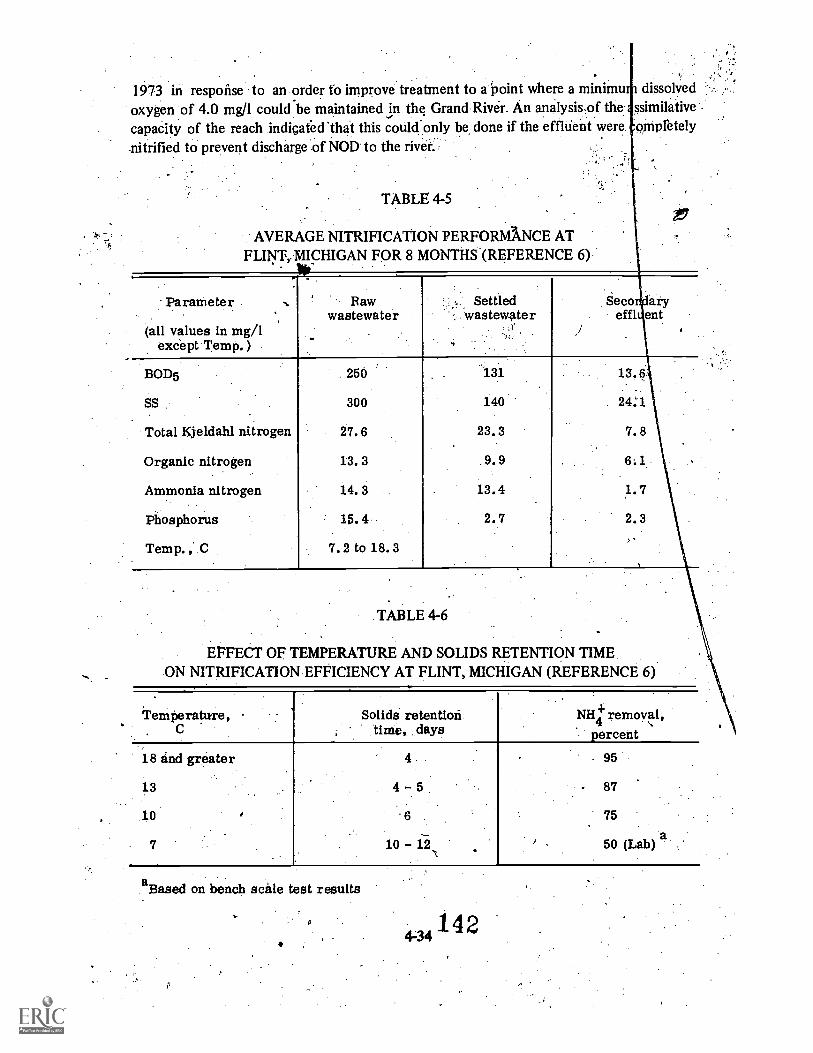
1973 in response to an order to improve treatment to a Point where a minimu dissolved
oxygen of 4.0 mg/1 could be maintained in the Grand River. An analysis.of the ssimilativecapacity of the reach indicated 'that this could only be done if the efflUent were opipletely-nitrified to prevent discharge of NOD to the river.,
TABLE 4-5
AVERAGE NITRIFICATION PERFORMANCE ATFLINT,. MICHIGAN FOR 8 MONTHS (REFERENCE 6)
Parameter -. Rawwastewater
Settledwastewater
Seco aryeffl ent
(all values in mg/1except Temp. )
I j 4
BOD5 250 131 13.6
SS 300 140 24:1
Total Kjeldahl nitrogen 27.6 23.3 7.8
Organic nitrogen 13.3 .9.9 6.1
Ammonia nitrogen 14.3 13.4 1.7
Phosphorus 15.4 2.7 2.3, -
Temp. , C 7.2 to 18.3
TABLE 4-6
EFFECT OF TEMPERATURE AND SOLIDS RETENTION TIMEON NITRIFICATION EFFICIENCY AT FLINT, MICHIGAN (REFERENCE 6)
remperattrre,C
18 and greater
13
10
7
Solids retentiontime, days
NH4 removal4percent
4
4 - 5
6
10 - 12
95
87
75
50 (Lab) a
aBased on bench scale test results
1 4 2
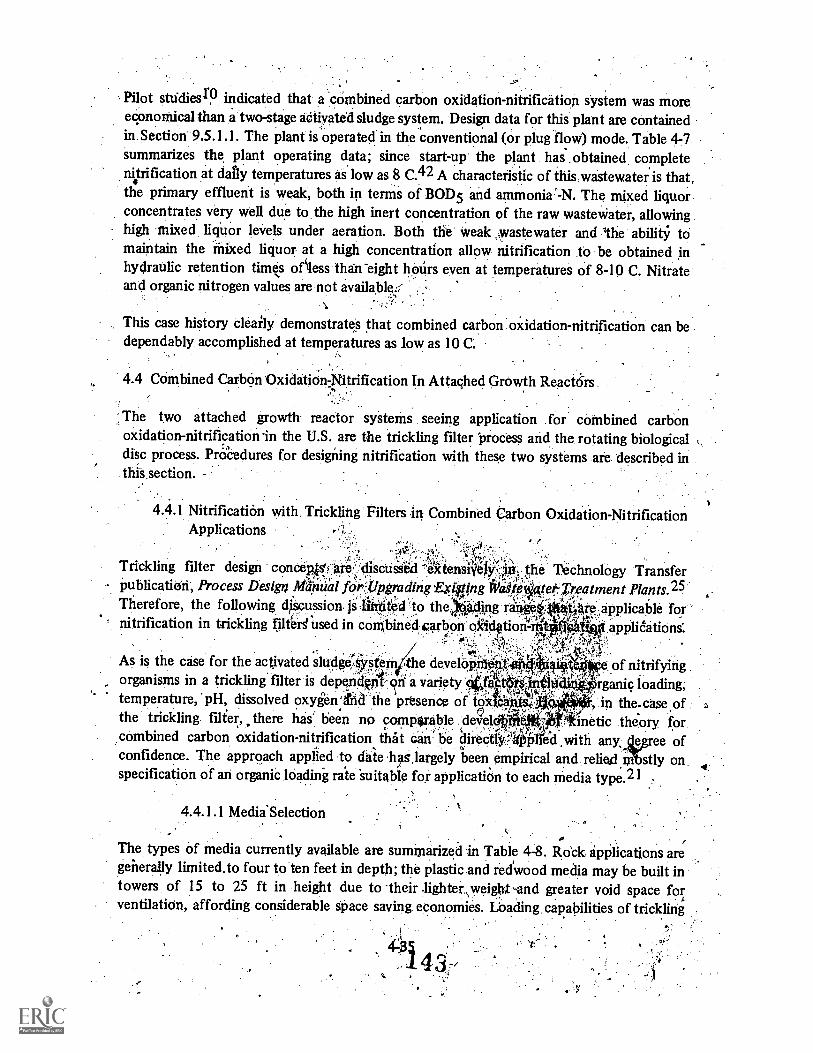
Pilot studiesr9 indicated that a combined carbon oxidation-nitrification system was moreeconomical than a two-stage activated sludge system. Design data for this plant are containedin. Section 9.5.1.1. The plant is operated in the conventional (or plug flow) mode. Table 4-7summarizes the plant operating data; since start-up the plant has obtained completenitrification at day temperatures as low as 8 C.42 A characteristic of this wastewater is thatthe primary effluent is weak, both in terms of BOD5 and ammonia The mixed liquorconcentrates very well due to the high inert concentration of the raw wastewater, allowinghigh mixed liquor levels under aeration. Both the weak ,wastewater and 'the ability tomaintain the mixed liquor at a high concentration allow nitrification to be obtained inhydraulic retention times of\less than-eight hoUrs even at temperatures of 8-10 C. Nitrateand organic nitrogen values are not available:,:.
This case history cleaily demonstrates that combined carbon oxidation-nitrification can bedependably accomplished at temperatures as low as 10 C.
4.4 Combined Carbon Oxidation-Nitrification In Attached Growth React&s
The two attached growth reactor systems seeing application for combined carbonoxidation-nitrification in the U.S. are the trickling filter Process and the rotating biological t\
disc process. PrOcedures for designing nitrification with these two systems are described inthiS.section.
4.4.1 Nitrification with, Trickling Filters in Combined Carbon Oxidation-NitrificationApplications
-::{til!, ,ei 'e
Trickling filter design concePtsyafe,' discusse:d TeTciensiMy,0, the Technology TransferPublicatidri, Process Design ilikniial for Upgrading WOO (4,tet Treatment Plants.25Therefore, the following discussion is liii:Oted to the;' kding r v''' ,,,,4ts,applicaf:ile for"nitrification in trickling filters' used in combined carbon oiiiktiont * appliCations:
.,As is the case for the activated sludgeAsys.fern..the developnl5-nt 6 of nitrifyingorganisms in a trickling filter is dependOnt.dn a variety ; k rganic loading;
'' temperature,'. pH, dissolved oxygen ii the presence of iC,:4** , in the. case ofthe trickling filter, there has' no comp#rable devel inetic theory forcombined carbon oxidation-nitrification that can be direct4f:'''413:11ed ,with, any, tree ofconfidence. The approach applied to daie been empirical and relies! stly onspecification of an organic loading rate 'suitable for application to each media type.21
4.4.1.1 Media'Selection
The types of media currently available are suminarized in Table 4-8. Rock applicationsaregenerally limited.to four to ten feet in depth; the plastic and redwood media may be built intowers of 15 to 25 ft in height due to their lighter \weight ,and greater void space for,ventilation, affording considerable space saving economies. Loading. capabilities of trickling

144
TABLE 4.7
NITRIFICATION PERFORMANCE AT THE JACKSON, MICIUGAN
WASTEWATER TREATMENT PLANT (REFERENCE 42)
Month Year
.
(
Flow,'
mgd
(m3/813
I
Recycle
ratio
Temp.,
0
IIMMIIMIWINIIMMYYMIMMIMMII....1.....=.MOMI.011111111MMOMMOININ
EAmei,
.
SVI,
ml/g
eci,
days
HT1
hours'
Alt
unel,
MCF/day
BOD5,
mg/I
Ammonia -N,
mg/1 ,
Primary
effluent
Secondary
effluent
Primary
effluent
4
Secondary
'effluent
Percent
Removal
8
9
10
11.
12
3
1973
1979
1973
1979
1973
1974
1914
1974
14.5
(0.63).
t
12,4'
.(0 54).
19.2,
(0.58)
'12,2
(0.53)
11,4
(0,50)
14.0'
(0,81)
14.2
(032) .
18,4,
(0,81)
8
,38
,40
.49
,43
21.7
204
17.2
15.8
12,
11,1
10,8
11,1
4320
4110
;4390.
4'','''''''.
0, ,),/,,;1',..,,l'a
4,11'4580'
4830
;4800
.
4930
.
42
45
41
47
45
43
42
38
15.8
16,4
16,7
18,8
16.4
0,3
11,0
'11,1
7.5
8,8
8;3
0
9.9
7,9
8.2
6.3
14
.14
14
14
14
14'
14
75
82
,
84
85
97
104
./ 90
2,5
2.6
3
5
4
8.4
9.9
11,6
11.0
11,5
9.2
9.3 .
7.1
0.6.
0.7
1.2
0.8
0.6
0,7
0.6
.
0.5
9a
93
90
93
95
94,
93
4
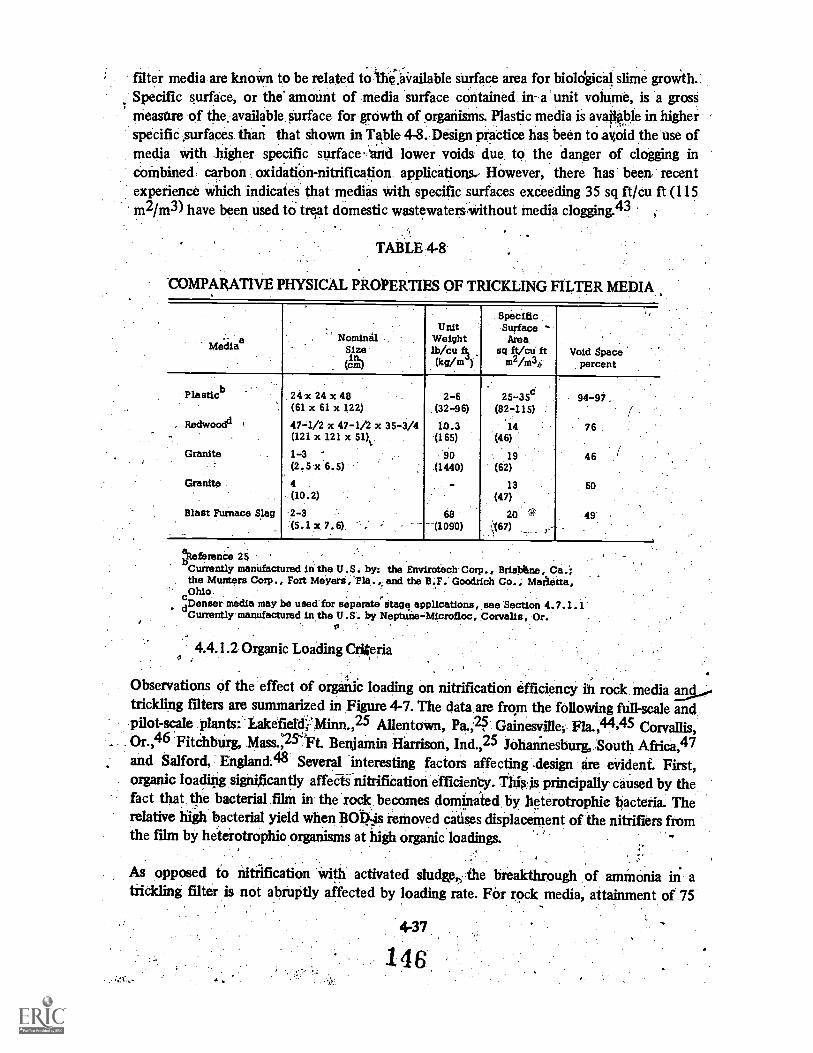
filter media are knoivn to be related to The.aVailable Surface area for bioldgical slime growth.'Specific surface, or the amount of media surface contained in a unit volume, is a grosSmeasure of the available surface for growth of organisms. Plastic media is avaRlge in higherspecific surfaces than that shown in Table 4-8. Design practice has been to avoid the use ofmedia with higher specific surface .,.and lower voids due, to the danger of clogging incombined: carbon oxidaticin-nitrification applications.- However, there has been recentexperience which indicates that medias with specific surfaces exceeding 35 sq ft/cu ft (115m2/m3) have been used to treat dOmestic wastewaters mithout media clogging.43
TABLE 4-8
COMPARATIVE PHYSICAL PROPERTIES OF TRICKLING FILTER MEDIA
MedianNominal
Size(g)
UnitWeightlb/cu(kg/m )
SpecificSurfaceArea
sq ft/cu ftm2/mst,
Void spacepercent
Plasticb 24 x 24 x 48 2-6 25-35c 94 -97,(61 x 61 x 122) (32-96) (82-115)
Redwoodd 47 -1/2 x 47-1/2 x 35-3/4 10.3 14 76(121 x 121 x 51)x (165) (46)
Granite 1-3 90 19 46(2.5 x 6.5) 41440) (62)
Granite 4 13 60(10.2) (47)
Blast Furnace Slag 2-3 68 20 49(5.1 x 7.6) (1090) ;;(67)
aReference 25Currently manufactured in the U.S. by: the Envirotech. Corp., Brisbline, Ca.;the Meters Corp., Fort Meyers, 'Fla.. and the B.F. Goodrich Co., Marlette,Ohio
cDentier media may be used' for separate applications, ,see 'Section 4.7.1.1aCurrently'rnanufactured in the U.S. by Neptuee-Microfloc, .Corvalis, Or.
4.4.1.2 Organic Loading Criteria
Observations of the effect of organic loading on nitrification efficiency in rock media andtrickling filters are summarized in figure 4-7. The data are from the following fuill-scale andpilot -scale .plants:..takefieldIdinn.,25 AllentoiVn, Pa.;25' Gainesvi le Fla.,44,45 Corvallis,Or.,46 'Fitehbtirg, Mass2,25.Ft. Benjimin Harrison, Ind.,25 Johannesburg, South Africa,47and Salford, 'England.48 Several interesting factors affecting ',design are evident. First,organic loading significantly affeefinitrifieatiori efficieny. Thi pis principally caused by thefact that the bacterial .film in the rock becomes dominated: by heterotrophie bacteria. Therelative high bacterial yield when BOOlis removed causes displacement of the nitrifiers fromthe film by heterotrophicorganisms at high organic loadings.
As opposed to nitrification with activated sludge; :the breakthrough of ammonia in atrickling filter is not abruPtly affected by loading rate. FOr rock media, attainment of 75
4-37
146

peicent witrification or better requiresAhe organic loading to be limited to 10-12 lbBoD5/1000 cu ft /day (0.16 to 0.19 kg/In3/.4y). At higher organic loading rates the degrqesof nitrificatidtr.diminites, such that above::30:td 40 lb BOD5/ 1000 cu ft/day (0.48 to 0.:64kg/m3. /day) very little, nitrification occur* These findings are consistent with those:of' the.National Research Council whose evalitatiOn of World War II Tnilitari pstallationg indicatesthat; the organic loading should not exceed 12 lb BOD5/10007.cu ft/day (0.19 kg/rdiday)fdr rock,media.49
/',11i.."Partial nitrification occurringoat intern diate loading rates can cause confusion when
attempting to anAlyte organic-carbon reitioy0 across trickling filters wilh tha.::13,0Dtest.Samples frornzsitic.,.effluent of these partially nitrifying trickling filters will.cont4n a
FIGURE 47
EFFECT 01-4'''oRGANIC LOAD.ON NITRIFICATION EVFICIENCYOF ROCK TRICKLING FILTERS

ficant quantity of intrifiersthat could at as seed for promoting riitnlication within theray incubation periOd of' the'BOD5 test 21;50 About 1.5 mg/l.of ammonia riitrogen. is
added to the. dilution. water in the BOD5 test and will also be nitrified. This will result in'unexpectedly high oxygen. demands. If the BOD5, test is to measure organics in effluentsfrom trickling filters, then nitrification must be suppressed. The same istrue for activatedsludge, but to aesser degree.aspaitiataitnfication is less prevalent
4
As: opposed to the relatyely efficientlemoial of ainmoniasin,trickling.filters, it appears thatreauCtions in organic nitrogen are variable and range between 20 and 80'JC..e#ent. (Table
nitrogen reduction can be "'obtained. through employing effluent filtration' toremove partiolge rganic Tritrogen. IlOwe{ter; all treatment systems are limited to about Ito 2 mg/1 of Soliibleo'iganic nitrogen, contained in refractory organics, and therefore there
.
arc,Jinlits to. Iheiniproyementslkat can be obtained witk'eMuent.filtration.
4.4.1:3 Effect of MediaType on Allowable Organic Loading.
The specific surface of media seleeted has a substantial' effect'' on the allowable organic:loading rate for trickling filters: 'Greater specific surface 'in .the,:niedia, allows' greaterbiological film development and therefore a greater concentrati&sof,orgaiiisms Wain a unitvolume. Therefore, the organic loading. may be higher in cases where ibe siecific surface of
,: ORGANIC NITROGEN ItEDUCTIO15ISIN NITRIFYING TRICKLING FILTERS.
TABLE
(:. FacilityLocation
Organicload,
lb 1301%/1000 cu ft /day(kg 1301.05/m3/day),
*DepthIts(m)
4,,
MediaInfluentorganic-N,
Effluentorganic-N,
mg/1
, 'Organic-N, removal,
percent
,
m6/1
Gainesville, Fla.a(pilot) -
31.5(0.50).
. 6
(I.8)' 1-1/2 - 2-1/2 in
(3.6 - 6.4 cm)16.6 7.3 56 ---
Johannesburg, S..Ab.*,,(full-scale)
31.2(0.50
19.6(0.31)
13.1(0.21)..
10.5(0.17)
6.8(0.11),
.
.
12(3.7)
,6(1.8)
12(3.7)
'? 2 In(SrgcrQ
1-1/2 in '
(3.8 7tm)
2-3 in.(5.1i,..;Z.6 cm)
.
..
7,
: ::;
9.8i y
.6.3
8.2
9.6:
13.9
4.7
2.5 ,
3.6
2.2 .
2.1
52 '
60
-,56*
7e
85
Stockton, Ca.c(pilot)
14(0,22)
22(0.35)
-,.21 .. 5(6.6)
.
..
plastic27,5f4pu A(86'm /in
,: 11.3
11.4%
8.
9.0
*21
,
: :
1 1
.
a.References 44, 45,
bReferthice'47
Referehces 21,,S1
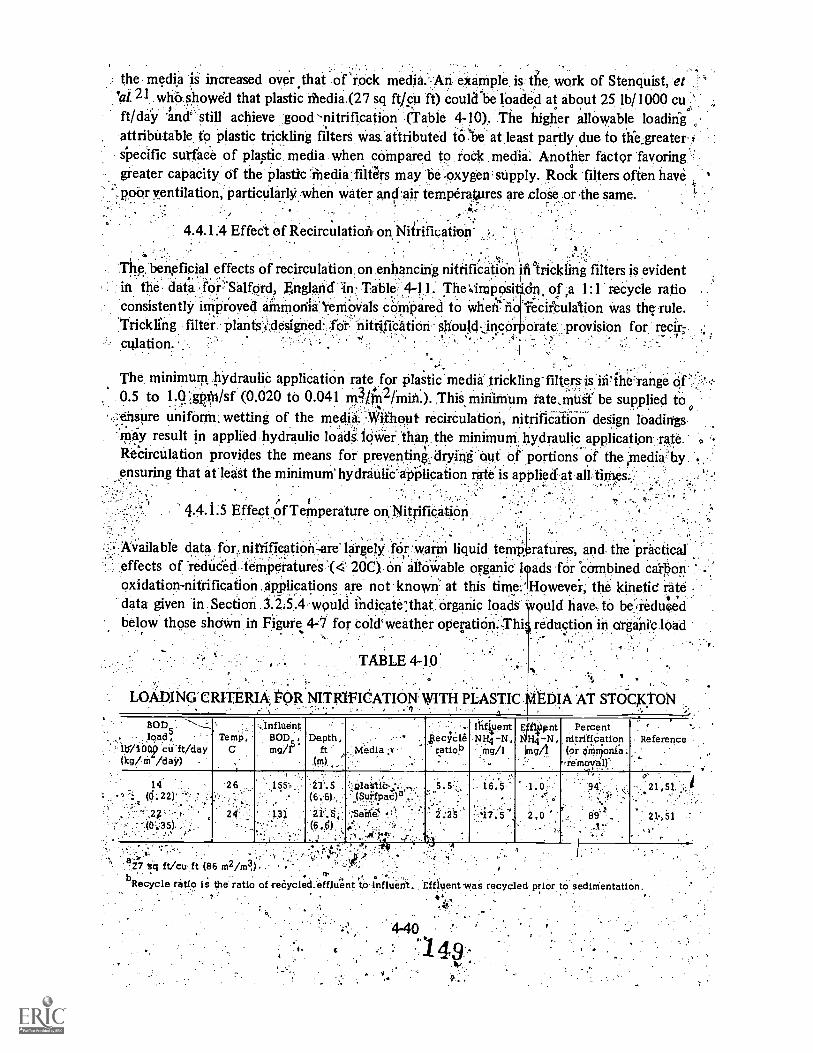
the media is increased over that of rock media:-: An exainple is die, work of Stenquist, et.al. 21 who S owe that plastic ffiedia (27 sq ft/cu ft) could'be loaded at about 25 lb/1000 cu:h 'il
ft /day 'nd°' still achieve good 'nitrification (Table 4-10). The higher allowable loadiniattributable to plastic trickling filters Was. attributed to: bye at least partly due to tife_greater- ispecific surface of plastic media when compared to rock media: Another factor favoring '
greater caPacity of the plastic :thediarfilQrs may be oxygen' sUpply. Rock filters often havepoOr yentilation, particularly when water and temperapres are cloSe or .the same...
4,1..,,
,,
4.4.1.4 Effedi of Recirculation on Nitrification.
The, beneficial effects of recirculation, on enhancing nitrificatin ifi lriekling filters is evidentin the. data f'oi:''Salford, England in. Table. ,4-11. The '<.inapOsitidn. of ,a 1:1 recycle ratioconsistently improved ammonia `removals compared to 'Tecirbulation was the rule.Trickling filtei plants.'s'slOignpd: for nitrifiation should inco orate provision fora recir;
,The, minimum hydraulic application rate for plastic media trickling-filters:is itiiherange of0.5 to 1.0',gpsh/sf (0.020 to 0.041 m4/1-n2/inin.). This minimum rate,mUit' be supplied to
...:...ensure uniform. wetting of the media. :Without recirculation, nitrification design loadingsMO result in applied hydraulic loads lower than the minimum, hydraulic: application Tate. cs
Recirculation provides the means for preventing dryfni Out of portions of the ;rnedia.byensuring that at least the minimum' hydraulic' application rate is applied at all times::
4.4. L5 Effect of Temperature on Nitrification
available data for nitrification-are largely for warm' liquid tempeffects of Tednded.temperatures 20C) on allowable oTganic Ioxidation-nitrification . applications are not known' at this time.'data given in Section 1.2,5.4 would indicate' that.: organic loadsbelow those shown in Figure 4-7 for cold' weather operatiOn..Thi
TABLE 4-10'
ratures, and the practicalads fOr *combined caiponHowevei; the kinetic rateould have to be.redueedreduction in argani'c lOad
11 1
1g
1, . 1
LOADING CRITERIA FOR NITRIFICATION.WITH PLASTIC EDIA AT STOCK:TON
BODc.. load;
cut/day(kg/M /day)
Temp,C.
=; InfluentBOD5 Depth,
ft(m)
Media ;1;
...gec;cle
ratiob
I14UentNI14 -N ,
11.1g/1
lf11.1ent1-14 -N ,
mg/1
PercentnitrifiCation(or fflionta.
..Pre-mcnral)'
Reference
140:22Y
877 gq ft/cu ft (86 m2 /m3r. .`"Recycle ratio the ratio of reeycled,effluent to influent. Effiuent.was recycled prior to sedinientation.
. je
4-40.
49
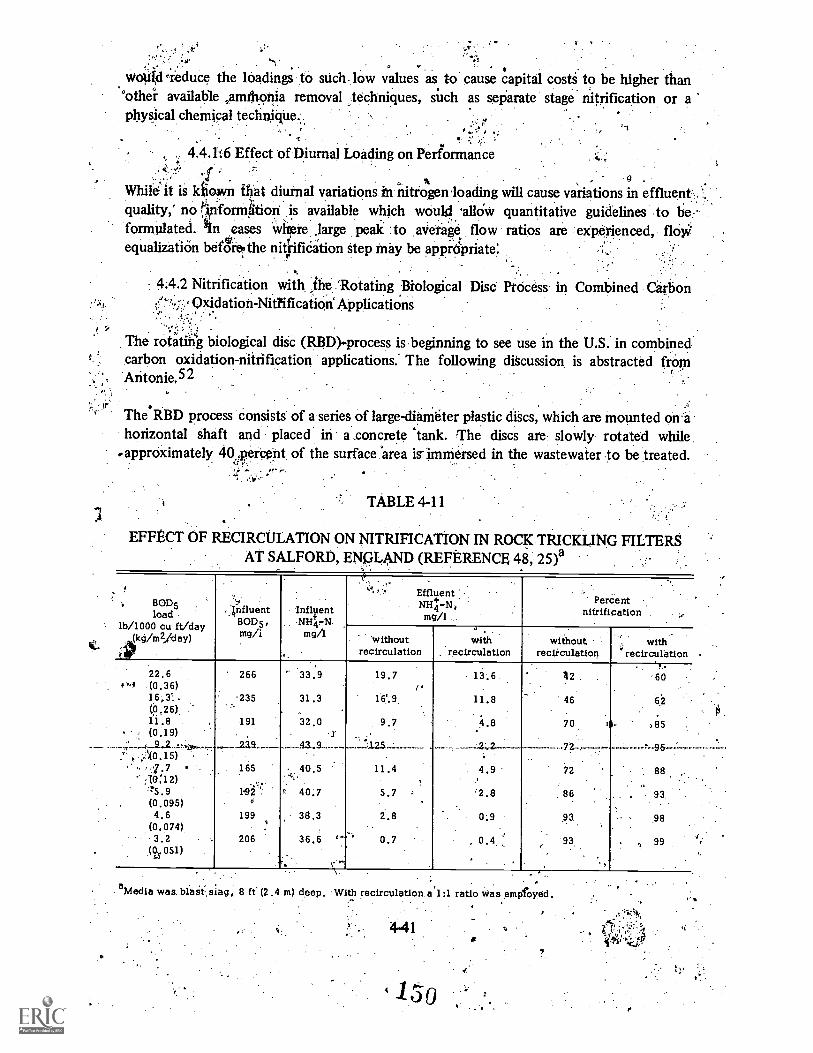
wop1d 'reduce the loadings to stich. low values as to cause capital costs to be higher than'other available Amritortia removal techniques, such as separate stage nitrification or aphysical chemical technique..
4.4.16 Effect of Diurnal Loading on Performance a.,
While it is kilown that diurnal variations it nitrogen loading will cause variations in effluent .quality,' no ,')...mforrnalion is available which would llow quantitative guidelines to he.formulated. 1n eases :where .large peak .to average flow ratios are experienced, floyiequalization bear& the niiifiCation step may be apprdpriate:
4.4.2 Nitrification with he Rotating Biological Disc Process in Combined CarbonOxidation-Nitlificatioi Applications
The rotating biological diic (RBD)-process is beginning to see use in the U.S. in combinedcarbon oxidation-nitrification applications: The following dicussion is abstracted fromAritonie.52
The'RBD process consists of a series of large-diam6ter plastic discs, which are mounted on.ahorizontal shaft and placed in a concrete 'tank. The discs are: slowly rotated while.
..approximately 40 .percent of the surface °area is immersed in the wastewater to be treated.".. k"'
TABLE 4-11
EFFECT OF RECIRCULATION ON NITRIFICATION IN ROCK TRICKLING FILTERSAT SALFORD, ENQLAND (REFERENCE 48,. 25)a '
.. 130Dload
5
lb/1000 cu ft/day(kg/m2iday)
.:0
influent130D5,mg/I
InflentNH4 -N.
mg/1
.
v nt,
Efflue+
N}14-N1mg/
Percentnitrification ..
withoutrecirculation
a
withrecirculation
withoutrecirculation
withrecirculation
. .22.6 266 ' 33.9 19.7 13.6. 112 '60
# vi (0.36) r16,31 235 31.3 16'.9 11.8 46 62(0.26) ,
. .11.8 191 32.0 9.7 4.8 70 ,85(0.19) ,
.
-2-..2.-- 72- -95- `----- .-..----1- 7-9-2...-iv2....-.....' ;(0.15) '......2.3.9.___. ....._43...9._......--...-t3.2.5 .
",.;7.7 ' 165 40.5 11.4 4.9 72 88:(0;12) -'
11.5.9 192' ^ 40.7 5.7 . '2.8 86 93(0.095) d
,4.6 199 38.3 2.8 0.9 93 98
(0.074) .
3.2 206 36.6 '' 0.7 , 0.4r 93 , 99
(%051).
.- ".
aMedia was. blaii,siag, B ft. (2.4 m) deep. With recirculation a'1 :1 ratio was employed.

Shortly after start;up , organisms present in flie):*astewater begin "to adhere to the rotatingsur6ces and jrow until in about one, week, the entire surface area is cayeret with a layer of
Aerobic biomass. In rotation, the discs pick ilea thin film of wastewater, 00WS dotinthe "surfade of the diScs and absoibsiokygen &sin thef'air. Microorganisms aeinOve bath edissolved oxygen and organic, materials from this thin filmeof wastewater Shearing forcesexerted on the biomass, as it Asses through the wastewater strip excess grqrth froni the ,
discs into the mixed liquor. The mixing action of the rotating discs keeps the sloughad;solidsin suspension, and the wastewater tilow carries them out of **disc sections into asecondary clarifier for separatiOn and disposal: :Tie discs also serve to mix the,. contents of .
earch treatment'reatinent 'Stage. Tread wastewatef and sloughesolidsflOw to a secondary cfariflerwhere the solids Settle out and the eoffhtent passes ,on,for further treatment or disinfection.The settIed solids, which can thicken up to 4 Percent solids content in the secondaryclarifier, are removed for treatment and disposal. A flow diagram for a typical application ofthe RBD process is shown in Figint 4-8.
%FIGURE 4-8
ATYPICAL ROTATING JitIOLOGICAL DISC PROCESS(COURT SY OF THE AUTOTROL CORP.)
Priniary Treatment Secondary Clarifier
Raw.Waste *Effluent
V`.,...93":".,14.Jy:..trrt,:.$ 77., :1RP MUN41044OLLW744:4*,.d., 4.
Solids Dispaal
Otle current disc: design consists' vacuum formed polyethylene sheets formed into,concentric, corrugations which-provide a high density of surface area. The corrugated sheetsare then welded together to form a stack of discs. with approximately PA in. (3.2 cm) .
center-to-center spachlg. This type of construction has a surface area density of,approximately 37 ft2/ft3i121 m2/m3). A key. featdre of this disc design is theprovision ofradial passages extending from the ghaft to the outer perimeter of the disks. This'assures that
,wastewater,,air,' and stripp4d biomass can pass freely into -and.out Of the disc assembly. Inthe twelve -ft (3.74m) .diameter size, radial passtgeS are provided every thirty'degrees.
The, 'disc units are normally. housed 11.to avoid. temperature drops "across the process, topfevent algae growth on the disc surface, and to protect the surface from hail or rain whichcan. wash the slimes off. Information on disc types and on the general design of theserealities can be obtained from the various disc manufacturers.
4-42
4,

4.4.2.1 Loading Criteria for Nitrification .
As the rotating 'discs operate in series, organic matter is removed in the first disc stages and-subsequent disc stages are ,used for nitrification.This.separatiori of function occurs withoutthe need for intermpdiate'diarification. Nitrification does not commence until the bulk ofthe BOD5 is oxidizd. When low levels of BOD5 are reached, the disc stage is no longerdorninated iby heterotrophs, and ni!rification can proceed.
Antonie5313.as summarized 'the effects of process operating conditions on nitrification. Testdata frqm a number Of locations are shown in Figure 4-9B. The degree of ammen*.,.oxidation is 'related to the hydraulic-loadinron the rotating m'edia as gallons per day perunit surface of dvailable surface area Also important; as it affeCts 'population dynamics, isthe influent BOD strength. The data in Figure 4-9B, was.USed.to arrive at the design criteriashown in Figure 4-9A. Two cha es have been Made tO allow use of the relationShips indesign. One is ticat there is, a m imum ammonia nitrogen concentration for which the datais considered valid. This. concentration is generally 1/5 to 1/10 the influent BOD5*,concentration. When the ammonia concentration. exceeds . these maximum ammonianitrogen concentrations on the aPpropriate130D5 curve, itdhaS been recommended that the '
design curve be usesI which is rated for that ammonia concentration.53 The #econd.changemade.'.in Figure 4-9A is the identification, of a region of unstable nitrification; that is, .aregion .of hydraulic loading. where either *a slight change in the hydraulic loading.oi influent' -
BOD strength could result in a displacement of the nitrifying population. It is consideredadvisable to stay out of thatregion even during daily peak flow conditions.53
4.4'.2.2 .Effect of Temperature..
Investigators at Rutgers University54 found that the nitrifying capability of the discs wasrelatively constant in a temperature range from 15 to 26 C. Simliar results were obtained byAntonie53 who has found no effect of temperature above 13C. Temperature cOrredtiori:factors derived from pilot 'data are shoWn in Figure 410.53 These correction factors shouldbe used to ;reduce the design hydraulic loading determined in Figure 4-9A, for anywastewater temperature lower than 13 C.
4.4.23 Effect of Diurnal Load Variations
w__Precise_ design for..11 an RBLi_unitshave.mat_been.foimulatedThe concern has been, that high BOD5 .concentrations would break thrpugh to:the last discstage during peak loads 'and would cause displacement of nitilifiers frOm that stage.53 Whilefirm design recommendations have Vot been made, there are two general, approachesavailable. One.is to arbitrarily .derate the surface hydraulic loading to the dist to ensure lowBOD loadings at all times. This will result in a larger:amount of rotating surface area. Theother is to install flow equalization to reduce, thepeak to average flow ratio.53
4-43
152

FIGURE 4-9
EFFECT OF BOD5 CONCENTRATION AND HYDRAULIC LOAD ON
NITRIFICATION IN THE RBD PROCESS (AFTER ANTONIE (53))
/00 250 150
9
90
85
8
a 75,*x
700
/6o
95
tu
cctua.
tU
t 85tu
cc
80
Z 75
120 100 80-'1Inlet BOD6Concentration., mg/1
40 35 25 20 15 ....--Ammonia NitrogenConcentration, mg/I
Design Relationship
NITRIFICATION OFPRIMARY EFFLUENT
Temperature,)13C
tRegion of IlitstcibleI. Nitrification 11
I gpd/sq ft =.41 2/ciay 1 t II I I
II
I .1 I 4 1! 1 1 1 1 ,
0.5 1.0 1.5 2.0 2.5HYDRAULIC LOADING, gpd /sq. ft
3.0 3.5 4.0
I I
(1 gpdisq ft = 41 .1 /m2/day)
'B. Experimental. Data
Inlet, BOD5,mg`/1 250 150
NITRIFICATION OFPRIMARY EFFLUENT
Inlet BOD5 = 75 to 120 mg/Io Tallahassee, Fla. 95-120 mg/I
Pewaultee, Wis. 75-87 mg/IGt Spring,City;Pa. 126 mg/I
--,111--Ettoom;1111mis--Mansfield , Ohio
4,1?- Washington, Pa. 120 mg /1
Inlet 8095= 150 to 350 mg/I. S Tallahassee, Ha. '150 to 180 mg/I
Peviaukie,Wis. 220 to 350 mg/ILuverne, Minn. 175 mg/I
II-Spencer, Iowa 210 to 350 mg/II . I I If'
Temperiature,>13C
700 ' 1
0.5 1.0 ;-* -1.5 ' 2.0 2.5HYDRAULIC LOADING, gpd/sq ff
444
153
3:0 3.5 4.0
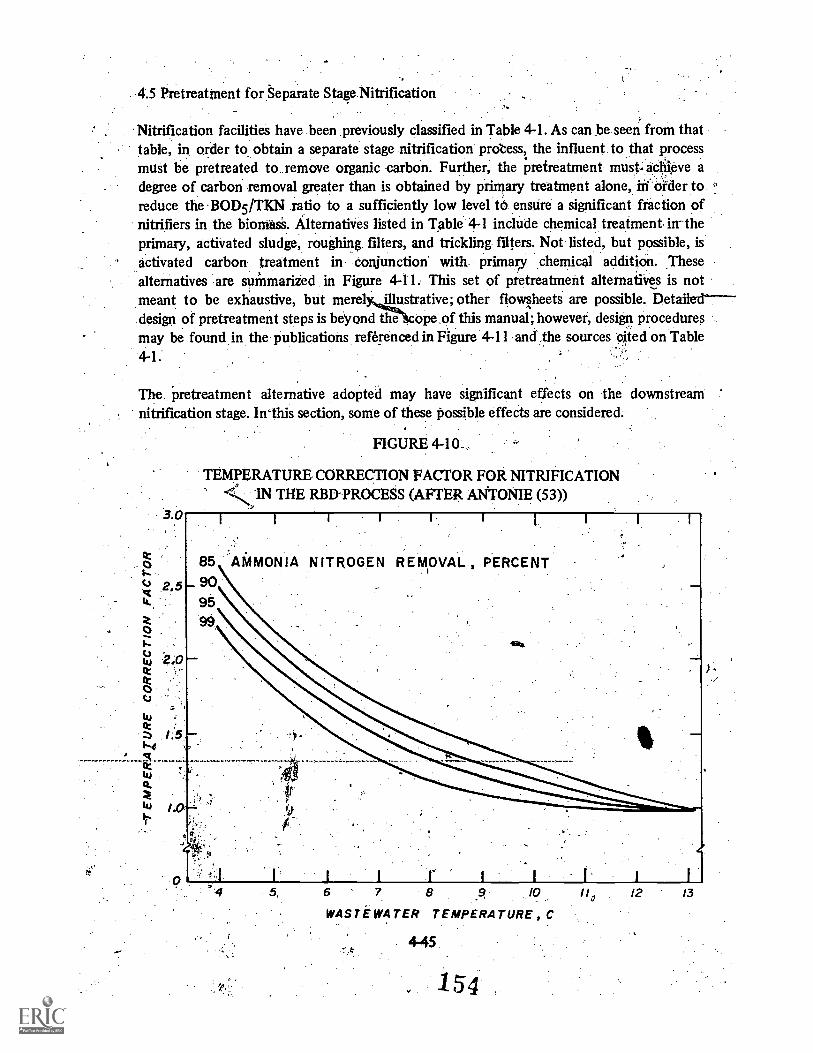
4.5 Pretreatment for Separate Stage. Nitrification
Nitrification facilities have .been .previously classified in Table 4-1. As can be seen from thattable, m order to obtain a separate stage nitrification profess, the influent to that processmust be pretreated to remove organic carbon. Further, the pretreatment must. achieve adegree of carbon removal greater than is obtained by primary treatment alone, if order toreduce the BOD5/TKN ratio to a sufficiently low level tel ensure a significant fraction ofnitrifiers in the biomass. Alternatives listed in Table 4-1 include chemical treatment in- theprimary, activated sludge, roughing filters, and trickling filters. Not listed, but possible, isactivated carbon treatment in conjunction with primary chemical addition. .Thesealternatives are summarized in Figure 4-11. This set of pretreatment alternatives is notmeant to be exhaustive, but merelstrative; other flowsheets are possible. Detailal---design of pretreatment steps is beyond thecope,of this manual; however, design proceduresmay be found in the publications referenced in Figure 4-11 and. the sources cited on Table4-1.
The pretreatment alternative adopted may have significant effects on the downstreamnitrification stage. In'this section, some of these possible effects are considered.
FIGURE 4-10_
TEMPERATURE CORRECTION FACTOR FOR NITRIFICATION4°..c:IN THE RBD-PROCESS (AFTER AN'TONIE (53))
3.0 I I 1 t 1
t .. o 85 AMMONIA NITROGEN REMOVAL , PERCENT
Q 2.5 90
lu(t
1-4
ct
Q.
1.0
5, 6 7 8 9 10 11 12 /3
WASTEWATER TEMPERATURE, C
445
154

4.5.1 Effects of Pretreatment by Chemical Addition
Thp chemical treatment step may cause significant changes in alkalinity and pH in thedownstream nitrification stage. Several alternate chemicals are available and their, resultsdiffer.
o.:
- .
FIGURE 4-11r.4
RtiREATMENT ALTERNATIVES FOR SEPARATE STAGE NITRIFICATION,"1
:!.. 8005 RemovalPrior to
NitrificationReferenOes. - v . . .
-
RAW
CHEMICAL ADDITION IN PRIMARYCHEMICAL
;
50 to 75 25,55PRIMARY
CLARIFIER.
SEPARATE'' STAGE.NITRIFICATIONWASTEWATER
(SG or AG)
ACTIVATED SLUDGE .
60 -t0 95 25,36RAW. PRIMARY
(OPTIONAL)
ACTIVATEDSLUDGE
INTERMEDIATECLARIFIER H-0"
SEPARATESTAGE
NITRIFICATION
(SG or AG)..,
WASTEWATER }ROUGHING FILTER .-'7' A
t :4
45 to 50 25,36.RAW PRIMARYCLARIFIER-*
ROUGHIfiGTRICKLING
FILTER .
-0AERATION ANDNITRIFICATION
TANK
......... NITRIFICATION.WASTEWATER CLARIFIER.
.:; .
.(SG)
(or RBD Process)
TRICKLING FILTER. .
60 to 90 25,36tRAW PRIMARYCLARIFIER
TRICKLINGFILTER
.INTEOMEDIATECLARIFIER ...-111'.
SEPARATESTAGE
NITRIFICATIONWASTEWATER
(or RBD Process)(SG or AG):
PHYSICAL CHEMICAL 'TREATMENT.CHEMICAL
80 to 90 25,55,56
RAW PRIMARY MULTIMEDIAFILTRATION m-.-10
,
ACTIVATEDCARBON
ADSORPTION'.IIIm
SEPARATESTAGE
NITRIFICATION,....
WASTEWATER CLARIFIER' ".....111:
. . (SG or AG)
KEY
SG Suspended growth.AG Attache!! growth
4-46 55
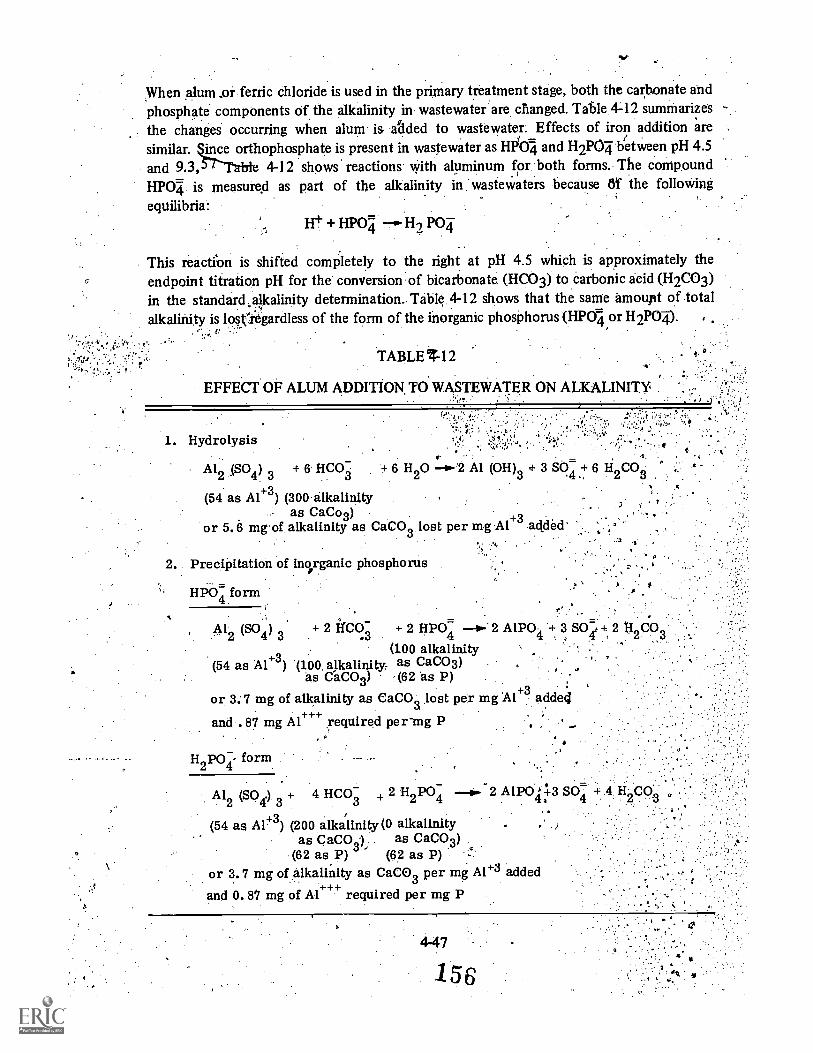
When alum or ferric chloride is used in the primary treatment stage, both the carbonate andphosphate components of the alkalinity in wastewater 'are changed. Tat le 442 summarize
. the changes occurring when alum is added to wastewater: Effects of iron addition aresimilar. ice orthophosphate is present in wastewater as HI O4 and H2PO4 between pH 4.5
and 9.3,5T-Table 4-12 shows' reactions with aluminum for both forms. The compoundHPOI is measured as part of the alkalinity in wastewaters because 8t the folloWingequilibria:
+ HP071 I-12 POT,
This reaction is shifted completely to the right at pH 4.5 which is approximately theendpoint titration pH for the conversion of bicarbonate (HCO3) to carbonic acid(H2CO3)in the standar& alkalinity determination. Table 4-12 shows that the same amount of totalalkalinity is losCtegardless of the form of the inorganic phosphorus (HP07-1 or H2PO4).
TABLE Z-12
EFFECT OF ALUM ADDITION, TO. ON ALKALINITY
1. Hydrolysis
(54 as Al +3) (300 alkalinity- as CaCo0) +3
or 5. 6 mg of alkalinity as CaCO3. lost per mg Al added-
rAl2 (SO4) + 6 HCO3 6 H20 -- 2 Al H)
34- 3 SO4 + 6 H
2. Precipitation of inorganic phosphorus
HPO: form ? '
,.. '.,,
Al2 (SO4) + 2 ifC03
+ 2 HPO4 .4-'2 AIPO4 + 3 SO4 + 112C..(100 alkalinity
(54 as Al+3) (100. alkalinity. as CaCO3) .
as CaCO3) (62 as P)
or 3: 7 mg of alkalinity as CaCO3 lost per mg Al+3 added
and .87 mg Al+++ required per-mg P
H2po4 - form
Al2 (SO4) + 4 HCO3 + 2 H2 PO4 4AIPO SO4 H
. 4H2CO3
(54 as Al+3) (200 alkalinity (0 alkalinityas CaCO3) as CaCO3)
(62 as P) (62 as P)or 3.7 mg of alkalinity as CaCO3 per mg Al+3 added
and 0.87 mg of Al+++ required per mg P

As an illustrative example of the results of alum addition, couSidena case where 10 mg/1 ofinorganic phosphorus is precipitated in the primary stage of treatment. Using a value of 0.64mg P removed per mg of aluminum added`resylts in the following aluminum use:
10 mg/l.
0.64 ir,1Z P
mg Al
15.5 m.g/1 Alm required (total)
The aluminum used in phosphorus precipitation is (Table
10 mg/1 P(0.87 1-ngP
- ) = 8.7mg
.By difference the aluminum used iffhydrolysis is:
15.5 - 8.7 = 6.8 for hydrolysis,
TiiCalk4linity.iloss due to hydrolysis is (Table4-12). .
(5.6 mg CaCO )+44 CaCO3
mikAl
The alkalinityloss-due-Oitrecipitarion is (Table 4-12):
4t,
Thus; a total alkalinity loss' of 79\ will 06411'T/hen 10 mg/1 of P is removed. This loss,depending on'-the in tial Viw istewater lkalinitx, ma rf have to be made up with downstreamchemical addition . to key .ent..:a:dietse Operating pH of nitrifiCation. (seeSection
On the other'thafdilimeaddit i; to:the Iiritay*O'have quite the opposite effect of alum.The changes iti.:tikalinity occurring ,kvithiiii:iiddition,are dependent on lime dose (or pH)
..and the quality' of'.the3:W ,W4Stewatef:',,CiSesObOth increases and decreases in alkalinity;:with lime tfeAtmeiit 55
Lime addition, it*y. 41:44.'cause elevation`; of thc. operating pH of the nitrification stage.3Primary effluen t aftert,tnIke treatment ...0:4Pkally:have a pH between 9.5 and 11.0,depending ofelime dose,and;tNatmerkt reii4Oethenis.55..,ThiS pH is higher than can normallybe discharged or introdued doWristrearn units. To reduce the pH, normal
15?
practice is to "recarbonate" the high pH primary effluent. Conventionally, this inVolvesctheintroduction of gaseous caAon dioxide (CO2) into the high pPf primary effluent in areaction basin of at; least 20 minutes detention time. Typically the carbon dioxide is eitherdrawn from refrigerated storage or furnace stack gase0ontaining carbon dioxide are usesThe recarbonation step tean'tze thought of as the conversion of alkalinity A;',the hydroxideform (OH-) to that in ii)lelbiarbonateiOrm (HCO) as, follows: 55
;t.,;v
Ca(OH)2 2CO2 Ca(HCO3)2
:-d- ..=
In many cases there is sigficient carbon dioxide prodUcpd front' the oxidation of organic.-,--carbon...and from nitrification to completely satisfy recarbonation requirements. In a lime
precipitation-nitrification sequence in CalifOrnia,3 it was found that external carbon dioxide..;requirements;weie minimal And only occasionally :required. In this case., it was calculated ;;:.' that approximately two-thirds of the carbOn,: .dioxide produced was4derived from c
,,.
nitrification, while the remaining one-third was".derived frOm the oxidation of the organkccarbon ,remaining in the primal:Y effluent. When the same process was tried at the EPAPC
,
pilot plantcat Blue Plains, it was found that supplemental carbon dioxide was continuously.required to maintain a neutral PH. This.is because wastewater in the Washington area isweaker than in the California case. There is less production of carbon dioxidebecause thereare lower concentrations of Oxidizable'substnees entering *the .nitrificatiod7itage at BltiePlains. ..: ' )... t ,..1:.
The tendency is-for;the-high-pHm ---ef-fln,ent-of the-Iime prima ocery.prss p the W.levate h .pJin
the nitrification reactor. Often this effect enhances nitrification rates (see SAtionY".
. ,
When lime primary treatment is employed, care be taken notto mix the pritharyeffluent with he return activated sludge prior 46 entry into the nitrifibation tank. the highpH of the pdrnary effluent return activated sludge mixture would be toxic to both thenitrifieri.and heterotrophic bacteria in the return sludge.
A concern often Axpressed is that the phosphips removal obtained in a chemical primary'treatment step will be so great as to staftecethel downstream nitrifying biomass forphosphorus as a nutrient for growth. Actulkly the requirements for phosphorus in a:separate stage nitrification system are very low. TyPically, organism biomass contains about2.6 percent phosphorus. This number can be used to. calculate phosphorus requirements, asin the_followingexample Assume a case wher5.36.mg/1 of TICN are nitrified and 60 mg/1 of
.BOD5 are removed in a separate nitrification stage. The quantity of bionlaSs grown can beconservatively estimated as follows: (see Section 3;2.7)
.1%)1 triflers:
/Heterotrophs:
Total biomass:
0.15 36)'0.55 (60)
4-49
1.58
5.4 mg/1 VSS33.0 mg/1 VSS
38.4 .,rrig/1 VSS
The phosphorus required is 2.6 percent of,the VSS gown:
0.@26(38.4) =4.0 nig/1 as P
Thus, the phosphorus, rgclOg'ement in this example is only 1.0 ,..mg/1 P. In most cases, the-B01:15- and.TKN leVels will be less than given in the example, so that the 1 mg/1 requirementc, be considered a maxiinum requirement for separate stage nitrification.
. ,
1t is a relatively simple natter to manipulate;dhernical doses in the primary so thatphosphorus residuals4i:e'Sufficierit to support biological gyowth.3 It may be that low
.4i!OUpttosphorus or scinie trace micronutrient remoVed'hy1.the primary may cause "bulking'?a -suspended' growth type nitrification stage.58 Veryligh syt Measurements were obserVedin'qhe nitrification stage following lime treatment at the Central Contra Costa sanitarybistrict's, Advanced treatnient jest Facility.3 However, it has liteeri found,thatpiis bulking
'.'could be very effectively; cOnticilled:Ily a Continuous low. dose of chlorine to the .returnslUdge, without impairment of nitrification efficiency. A dose. Of2 to 3.:.11). 'per 1;000 lb.MLVSS per day (2 to .,3 g /kg/day) in the inventory reduced the SVI frCirn:1.60-200 to 45-80,rnl/grAnf. pyerdosing ,af 6 to ;.;7 lb./1,000 lb:/day (5 to 7 g/kg/daY) cauied.imPairment ofnitrifition -and higher 6rfludfit solids.59
frectS bf Degree of Organic Carbon. Removal. .
The pretreatnient alternatives arrayed in Figure 4711 provide varying degrees of organiccarbon removal ahead Of. the 'nitrification "step. Not only is there variation among thealternatives, but there is possible range of intermediate effluent qualities within eachalternative. It was shown in Chapter3 that high degrees of organic carbon removals led tothe highest nitrification rates: This implies that reactor requirements. diminish withincreasing degrees of carbon removal in' the pretreatment stage.
Very low levels of organic carbon in the nitrification process influent has differing .
implications for suspended 'growth and attached .growth nitrification reactors. The effluentsolids from the sedimentation step in a suspended growth. syslern can exceed the solidssynthesized in the process c.when the level of organics is low. This leads to a requirement ofcontinuously wasting solids from other suspended growth stages. (carbon removal ordenitrification) to the nitrification stage or to increase the BOD of the influent in order tomaintain, the inventory of biological solids in the system. This point is discussed further inSection 4.6.4.
Low levels of organics in the influent' to attached growth reactors can be advantageous. Thesynthesis of solids, occurring with low levels of influent organics results in very low levels ofsolids in the effluerft from an attached growth reactor. In some cases this can eliminate theneed for a clarification step, especially if multimedia filtration follows or thete is someother downstream treatment unit such as denitrification.

4.5.3 ProteCtion Against Toxicants
All of the pretreafinentalternatives portrayed in Figure 4-11 provide a degree of removal ofthe toxicants present in raw xastewater. However, the types of tbxicants removed by eachpretreatinent stage vary among the alternatives. Chemical primary treatment,can be usedwhere toxicity from heavy' metals is the .major problem. Lime primary treatment is one ofthe most effective processes for remoyal`aa wide range of Metals.P Chemical treatifient isusually not effective for rernoval.,Oforganic toxicants, unless if is coupled with a carbonadsOrPtion :.step such asiin the. PhifSkialChemical treatment: Sequence. The biological:pretreatment alternatives (activated Sludge 'trickling filters, and'rOUghing 'filters)8prOvide adegteeyot Witectiori against both brganie and.;lie.av metal toxicants;'An exception would,:be
.,;
or i6s:IfesiStitrt to biological oxidation; such as the golvents perchloroethylene andtrichloroethyleno which have been identified as...toxicants which can upset nitrificatiOn:1,60
When'.materials toxic to nitrifiers' are present! in the influent raw wastewater on a regularbasis, the pretreatment technique most suitable for their removal canbe used in the plant .
design to safeguard Ihe nitrifying population. The-determination Of the most suitable- systemconfiguration need not involve an extensive, sampling or elaborate pilot prograin. A recentlydeveloped bench top analysis can be used to screen alternates.§1.:the test procedure involves.:batch,oxigen uptake" tests using a respirdmeter to measure oxygen utilization. CoMpositewastewater samples are sUbjectedto various pretreatments, aluin or powdered activatedCarbon via a jar test prftsyure or to hiolOgical Txidation by batch aeration. Each treated,sample :is then splitI.and placed into two -resptrometers. 'One respirorneter is -used, as a;non-nittifying control treatment with a nitrification inhibitor such as Allythiourea
I(ATU):61 The other respironieter is inoculated with a small amount of mixed liquor from anitrifying activated sludge plaint Differences between,the oxygeh used in the control and inthe seeded sample can be used to-establigh batch nitrification rates. At the end of the test,the respirometer contents are sampled and analyzed for the nitrogen species to confirm
. whether nitrificatiomtook place in the inoculated samples as well as to check the conqol.'.The adequacy of -the seed used can also . be checked by ,running an inoculated,' butuninhibited-sample, knoWn. to contain amonia and organics, but no toxicant
,
The batch nitrification rates, determined by the batch procedure,r,can be examined todetermine the pretreatment technique apparently most suitable among optionsexamined. Often, some of the inetreatinent techniques will result in little or no nitrificationin the inoculated sample, indicating inadequate removal of 'the oxicalit(s).4. Other cases,.
:
the pretreatment techniques willremoval of the toxicant(s).61 Thalso indicate the type of toxicantidentificatiOn and climinatiOn of thtreatment is effective, the problein mlime. Alternatively, if biological oxidaallows nitrification to proceed, then: aSpecific analyses can t.hen be run in the id
llow vigoIous nitrification:in the sample indicating' goodparticular pretreatment technique that is 'effectiVe..inay
that is interfering with nitrification 'and- may' permitsource tributary to the system. For instancejf limey be a heayy, metal ;that can be precipitated by the
on, ineffective 'lint activated carbon treatmentOnbiodegradable organic' is snspect, SUbsequent "
tifiethcategory of compounds: If the' toxicants

cannot be elimiTiateidentified. by #tePilot gtddies,toxicants, something
a source control program, .;.often a pilot study of the proces'Ssale procedure can be justified to Conf .",the process.selection.'-ue tit determining' the ability of the
atoll test is not capable of doing..
4.6 Separate Stage NitrificitiOn WithSuspenOedCrOwth Processes
triflers to adapt to the
There are many examples of sepaVe'stage nitrification irocesses in the U.S. (Table 4-1)'The initial developMent of the suspended' growth process in,separate stage application wasoriented to the isolation of the oPeration_ of the carbonaceous, removal.and nilrificationprocesses so that eac4 could be separately controlled and optimized. IS By placing a carbonremoval system (originally conceived as a high. rate activated, sludge system) ahead of theseparate nitrifiCatiOn stage, the sludge would be enriched with nitrifiers as opposed to themarginal poPUlation present in combined carbon oxidation-nitrification systenis. By thisenrichment process, nitrification, would be expeCted to,be less temperature sensitive than ina combined 'carlfan oxidation-nitrification system:
. 4 . -
. First applications of the process were in the northern portion of the U.S. where low ( < 10C) liquid temperatures were obtained in the wintertime: Subsequently, the system hasbeenapplied in,. moderate cliniates such. as Florida and California where some of the otheradvantages of the process have made its applicatiOn desirable.
4.6:1 Application of Nitrification. Kinetic Theory to Design.
The kinetic approach for design of separate stage nitrification in suspended growth systems.fundamentally related to the kiiietic design approach used for combined carbon
oxidation-nitrification, as was shoWn in Section 3.2.7. To date, hOwever, the practice hasen to adopt the "solids retention time".',design approach for combined carbon
oxida itrification' apPlieatiOns -and to use the nitrification rate approach for separatestage design. The nitrification rate approach has been based, on experimentally measuredrates, 1,62,63 'rather Than attempting to relate the rates to fundamental kinetic theory (seeSection 3..2:7). The. theoretically determined nitrification rates are limited in theirapplicability chiefly because the nitrifier fraction of the mixed liquor cannot be accuratelyassessed. Nonetheless, the concepts developed from kinetic theory are applicable even in theabsence of information 'about the nitrifier frabtion.
The 'Solids retention time design approach is also 'directly applicable to many separate stagenitrificatio:n design problems., The limit of its applicability is related to the difficulties withthe nitrification rate approach, that is,the yield of nitrifiers grown through nitrification isnot. ccurately known,' However, for designs where the BODE level R the nitrifiotioninflant is JO to 60 ing/1 (or BOD5/TKN ratio is 2 to 3) the growth of nitrifiers willgeneially be a smallyraction relative to the heterotrophic population°. In this case, the errors .
ins assumption of the yield of nitrifiers will be masked by the growth of heterotrophs. FortheSe cases, the contribution. of the nitrifiers to the overall process growth rate may be
1'
4-52
neglected with the assurance that their contributisan is less than 12'percent (Section 3.2.7).A model which explicitly coniiders the nitrifiei contribution to the system growth rate is'available which can be used when accurate' yields for nitrification beconie- known. 38.
. ,
In situations where_tbje_organic -carbon is low in the influent (BOD5/TKN ratio 0.5 to 2.0)the e nitrification st ge; both the assumptions for heterotrophic and nitrifier yields beconie
uncertain. These low BOD5/TKN ratio §ituationsjie usually, cases !where a well stabillied'secondary effluent is being nitrified..- Residual BOD5 in these effkients.is often biological,'solids rather than residual-42w wastewater matter: The bitirnass Yield in thenitrification stage for these cases is less Well defined. Thisleads to Uncertainty in estimatingdesign sludge inventories-and wasting schedules when using the solids retention time designapproach.
1,4
In this section,' both the 'solids retention time approach and the,nitrifiCation rate approach:.'are 'presented. The direct theoretical'interrelationships of the Appioaches,, as developed hiSection 3.2.7, should not be overlooked. .
4.6.2 Solids Retention Thhe Approach.
The design procedures developed in Section .413 are directly applicable- to separate stagenitrification design when the BOD5/TKN ratio equals. or exceeds 2.0. A Summary of these,design concepts follows.
.
4.6.2.1 choice of ProCess Configuration
In general, the favored system for separate stage nitrification is the plug fltiw-system.. if wasalready shown in Section 4.3.5 that the plug flow process results in.lOWer effltient` ammoniathan a complete mix process at the same SF, or alternately, the same ammonia level at a'.lower SF. The only disadvantage of the process in combined' carbon oxidation-nitrification.applications is the difficulty in supplying adequate DO in the head end of the system,rendering that zone ineffective for nitrification in cases ,of low DO. With a carbon, removalstep ahead of the separate nitrification stage, the high oxygen demand at.the head end ofthe system is minimized, and less difficulty is found in designing aeration systems thatensure: adequate DO levels throughout the, nitrification tanks. With adequate DO levelsthroughout the tanks, the full advantage of plug flow kinetics over the kinetics of any otherconfiguration is obtained.
In cases where a lime precipitation-step precedes the nitrification step; it is often desirableto use the carbon dioxide (CO2) produced W the nitrification process for recarbonation(c.E Section 4.5.1). Since the process of nitrification will be spread throughout the plugflow reactor, and rqcarbonation is desired at its head end to avoid pH toxicity, only a
'portion of the carbon dioxide produced in the process is available for recarbonation at thehead end of the proCes& A 4,olution to this problem is to increase the use of egtemal carbondioxide' On' the other band, extepal carbon dioxide usage may be minimized by adopting

one of the other process configurations such as complete mix,that more evenly, spread outthe toad throughout the aeration tank, thereby taking full advantage of the.carbon dioxide generation for recarboriation..
.
4:6.2.2 Choke of the Factor
. ,
The same considerations discused! in Section 4.3.3.2 are applicable, -to separate sludge,applications. Diurnal variations: in nitrogen load will effect efflUent quality in the samemanner as for combined carbon oxidation-nitrification applications. However, Upstreamtreatment, steps may moderate the fluetuatiOns in nitrogen load experienced by separatestage 'nitrification' processes. While prinrary treatment' and roughing filters ha.;e so littleliquid holdup that little or no 'nitrogen load equalization is, prOvidec, this i§ not true,, ofeither the activated shidge or .trickling filter:.Pretreatmeot alternatives. Both of thesealterndtives provide.a degree of nitrogen load ecalization..
A typical ammonia load curie for the secondary.effluent. from the Rancho Cordova,California treatment plant is shown in Figure 4-,12. The plant provides activated sludgetreatment. On the date monitored, ,the average flow was 1.9 mgd with a.peak hourly flow-of
FIGURE 412
RANCHO CORDOVA WASTEWATA TREATMENT FACILITYEFFLUENT AMMONIA CHARACTERISTICS, MARCH 19-20, 1974,:.
1:116=i454. Kg
1.00
,-;- ...:1600 1 '2666 -1.
TI*E" OF'',D4Y

3.0 mgd,.for a flow peaking factor of 1.6. The ammonia loading behaved similarly with an1 average load of 252 lb /day and a peak hourly load of 379 lb /day for a nitrogen loadpeaking factor of 1.6: Using the cor?Cept developed in Section 4.3.3.2, the minimum safety'factor adOpted for a- separate stage nitrification process serving this plant ihould be 1.6, toprevent significant ammonia leakage during the peak hour.
4.6.3 Nitrification Rate Approach
The kinetic design approach using nitrification rates places reliance on experimentallydetermined rates obtained from pilot-studies. Available' data are summarized in Figure 4-13,plotted' against temperature. Also shown are two other principal variables that can effectnitrification rates, the BOD5/TKN ratio and the mixed liquor pH.
iIn general, the nitrification rates follow the predictions of the theor(Spction 3.2.7). As theternperature rises, nitrification rates increase. The BOD5/TKN ratio strongly influences thenitrification rates. Comparing the Manassas, Blue Plains and Marlborough data, it can beseen that the loWer the BOD5/TKN ratio (and the higher the nitrifier fraction) the higherthe nitrification rates. Also the effects of pH depression on nitrification rates.is apparentParticularly interesting is the data from Bfue Plains for the air and oxygen system run-atapproximately the same pH, but at differing BOD5/TKN ratios. The air nitrification system,running at a. lower, influent BOD5/TKN ratio exhibited higher nitrification rates than theoxygen system running at a relatively higher BOD5/TKN ratio. It is notable that whenoxygen and air nitrification, systems were run in parallel at the same pH and influent.BOD5/TKN ratiosthe .same nitrification rates were obtained.8 A further comparison ofoxygen and air nitrifiCation is presented in Section 4.6.5.
In the 'absence -of pilot data specific to a particular situation, Figure 4-13 can be used toapproxiinhte design nitrification rates. What must be known or estimated is the BOD5/TKN°ratio in the influent, the minimum temPeraturefor nitrification and the mixed liquorpli.' Inessence, Fig. .4-13 is a plot of experimentally determined values of the peak nitrificationrate, as defined in Section 3.2.7 as folloWs:
o
rN
= qN
f (3-31)
where: rN peak nitrification rate, lb .NH4 -N oxidized/lb MLVSS /day,
nitrifier fraction, and
peak ammonia oxidation rate, lb NH4 N rem/lb VSS /day.
In other words, these rates are determined at values where the DO and the ammonia levelare not -limiting the rate of nitrification. However, to be useful for design purposes, theeffects of ammonia content and DO should be c'Onsidered. The effect of operating DO can
4-55!
164

FIGURE 4-13
vOBSERVED NITRIFICATION TES AT VARIOUS LOCATIONS it
TI I 1 I I
Key ,to.Indivdual Data Points
7,1South. Bend, Indiana
(ief.12); BOD5/TKN =1.8 OrDenver, Colorado
(ret, 19 20 ), BOD6/1*KN = 2.7
BluePlains, pH 6.8 to 7,2 ,.(Air System)
(ref. 7') 8005/1"101
(ewe
4
I
C
0.1
Marlborough, Mass,
(ref..'62) BOD5 iTKN :3,0t I I
10 11 12 13 14 '15 16 17 18 19 20. 21
rEkPiRATURE, C
Blue Plains, pH 7:0. (Oxygen System'(.ref. 8) BOD5/TKN:3.0
H .F6 t22 23 ..21 '25" eff' 2( 28 .29 39
be. incorporated through the Monod expression for DO. The effect of desired effluentammonia content can be 'considered through the safety factor concept. The use ofEquations 3-31, 3-20, and 3-29 yields .the following expression for either a complete mix,orping flow system:
111 -7 SF ko + DOrN .DO
2
(4-22)
.
NEffluent ammonia nitrogen content can be estimated for a complete mix system'at steadystate from the equation: .
1N1
4).SF N 1 + KN
(4,
For plug flow reactors, the effluent ammonia content can be estimatedfrom Equation 4-14.Criteria for establishinthe safety factor are discussed in-Sections 4.3.3.1, 4.3.3.2, and
'4.8.2.2.
Once the design value of the nitrification rate is established, the design can proceed in a.manner similar to the F/M design approach adopted for activated sludge design. The totalnitrogen load per day and the nitrification rate are used to establish the mass of solids thatmust * maintained in the nitrification reactor. The volume of reactor Is determined; fromthe allowable mixed liquor solids level and the inventory of solids required. The allowablemixed liquor level is,ififluenced primarily by the efficiency of solids-liquid separation(Section 4:10).
4.6.4 Effect of the BOD5 /TICN Ratio on Shiclge InlitittorY ControlA
,
At Man4ssas, Virginia, Jackson17, Michigan, and -'Contra CoSta, California, difficulty wasexperienced in maintaining a nitrifying sludge inyentory when the influent contained low,amounts of organics (low BOD5/TKN ratios).64,10,4. Typicalry, effluent solidsliu'ctuatedbetween 10''and 50 mg/I and the efflupts contained a good deal.of dispersed solidi thatwere not captured in the secondary, clarifier. It has been SuRisted-that a high fraction-of themixed liquor mit be heterotrophic to maintain good bioflogculation in a separate stageittrification system.12 Since ibe synthesis of solids in these, systems is often less than the
arlids al:4ring in thrfflUent from the system, an unstable .condition ,can result. Severallemedies are,pailable. At the three locations mentioned, solids from the upstream activatedsludge process were periVcally transferred to the separate stage nitrification Process tomaintain the
4In othertases, fretreallthent Veps haVe been purposely chosen which do not prbvide as higha degree of carbon removal as activated sItidge and therefore cause greater synthesis ofheterdtrophic biomits in the nitrification stage. *Examples are lime precipitation in theprimary3 and 'modified aeration activated sludge with alum addition.65 In still another case,10 Jerceit 13f the primarY effluent was bypassed around the activated sludge carbon'removalstep to a sepaiite stage nitrification step.11 The amount of primary effluent bypasged can
457
166-
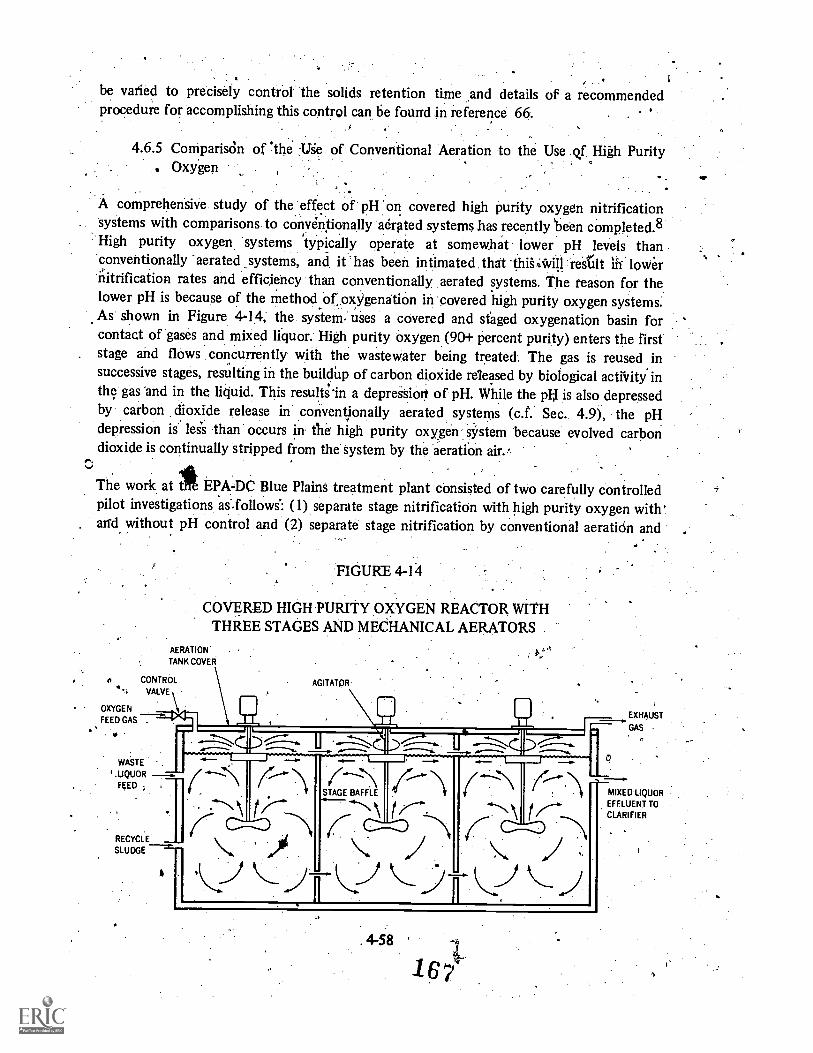
. I
be varied to precisely control 'the solids retention time and details of a recommendedprocedure for accomplishing this control can be fouffd in reference 66. . "
4.6.5 ComparisOn of the -Lige of Conventional Aeration -to the Use .qf. High Purity. Oxygen
A comprehensive study of the effect of pH on covered high purity oxygen nitrificationsystems with comparisons to conventionally aerated systems has recently 'been completed.8High purity oxygen 'systems 'typically operate at somewhat lower pH levels thanconventionally -aerated systems, and it has been intimated that "thigvill result in lower,nitrification rates and efficiency than conventionally aerated systems. The reason for thelower pH is because of the method of oxygenation in covered high purity oxygen systems.As shown in Figure 4-14, the system. uses a covered and staged oxygenation basin forcontact of gases and mixed liquor: High purity oxygen (90+ percent purity) enters the firststage and flows concurrently with the wastewater being treated. The gas is reused insuccessive stages, resulting in the buildUp of carbon dioXide released by biological activity inthe gas and in the liquid. This results' n a depress' iort of pH. While the phi is also depressedby carbon dioxide release in conventionally aerated systems (c.f. Sec.. 4.9), the pHdepression is' less than occurs in the. high purity oxygen system because evolved carbondioxide is continually stripped from the system by the aeration air.'
The work at It EPA-DC Blue Plains treatment plant consisted of two carefully controlledpilot investigations aS.follows*: (1) separate stage nitrification with high purity oxygen withand without pH control and (2) separate stage nitrification by conventional aeration and
FIGURE 4-14
COVERED HIGH PURITY OXYGEN REACTOR WITHTHREE STAGES AND MECHANICAL AERATORS
AERATION
TANK COVER
CONTROL
VALVE \
OXYGEN
FEED GAS
WASTE
.UQUOR
FEED ;
RECYCLE
SLUDGE
AGITATOR
1 . , ,--........... -.--...... ,,.----......- ........... ....;_--4,"..,......--..
i ...i\.
(-Th
-,,s
(...STAGE BAFFLE
s/V.''-,i
( ...
r\.
('''. '
i-4-\i ,,,,,,\:
. 4-58
EXHAUST
GAS
MIXED LIQUOR.
EFFLUENT TO
CLARIFIER
. 43'z.
high purity oxygenation ccintrolledat the same pH levet The purpose of this 'section/is toreview the salient features of this work:as it affects nitrification design with high purityoxygen. No attempt will be made to present general high purity oxygen design concepts astheselie covered in the EPA Office of Technology Transfer's publication, Oxygen ActiihatedSludge Wastewater Treatment Systeihs Design Criteria and Operating. Experience.67
4.6.5.1 High Purity Oxygen Nitrification. With and. Without pliControl
Operational results are shown in Table 4-13 for a higlj purity oxygen pilotplant without pHcontrol and a plant with the last of four stages held at pH 7.0 by lime all dition to the firststage. As may be seen from the table, the systeit with pH control provided an effluent withsomewhat better quality. Lime addition to the pH contr011ed reactor caused buildup ofinerts 'which resulted in better thickening sludge and better clarification efficiency at the
expense of greater sludge production.8 The effluent ammonia level was somewhat lowerwith pH control, but the difference is not significant whenit is considered that a chlorine'dose as little as 10 mg/I would be sufficient to remove all traces of ammonia in both.wastewaters .(c.f. Chapter 6). It should be noted- that both systbms were operated at highsolids-tetention times and therefore had high SF values. Therefore, differences in effluentammonia levels would be expected to be small.
Comparisons of nitrification rates did not present a clear picture of differences between thetwo syttems. \However, it was shown that when the pH drops below 6.0, nitrificationrates did' decline. However; the. pH generally did not drop below 6:0 in the sytei withoutpH control until the 'last reactor stage, but there was so little ammonia 'remaining to beoxidized there that essentially no effect of pH on nitrification performance could bediscerned.
In sum, the work at Blue Plains deMonstrates that the pH of the nitrifidation reactor candrop as low-as 6.0 and `allow accliniation of the. nitrification organisms with attainment ofcomplete nitrification., The pH should lidt be allowed to drop below 6.0, except'perhapi inthe last reactor stage, and in those cases where the carbon 'dioxide evolution is sufficient to
cause the pladrop below 6.0, pH lcontrol should be implemental. From an organicsstandpoint, erflueni,A:qualitiies are superior -Cm the pH controlled System because of limeaddition, anA this shotild be kept in mind when:. designing for stringent effluentrequirentefits. :4
4.6.5:2 COmparisOn of Conventional Aeration andHigh Purity Oxygen at the Same pH
S ..Table 4-14 shoWs the results of a, parallel study of a conventionaj. aerated nitrificationsystem with a high purity oxygen_system; both systems were Yield at pH 7.0 in the last stageof a four-stage sYitetn.8 As may be seen from the table, the concentration of organics andnitrogen species were virtually identical in the two systems. Greater lime was required in the
11;
high, purity oxygen system than in the conventional system to maintain the same.pH level..
I
4196 8

This greater lime dose resulted in: greater sludge production in the oxygen system but alsoimproved the sludge thickening properties, allowing the same MLVSS level to be maintainedin both systems at higher MLSS level in the oxygen system.. Nitrification kinetic rates werefound. to be the t'ame in both-Systems. Choice between the two pH controlled systemsshould be based on economic considerations as the systems are equivalent in other respects.
TABLE 4-13
COMPARISON OF PROCESS CHARACTERISTICS FOROXYGEN NITRIFICATION SYSTEMS WITH AND WITHOUT
pH CONTROL AT BLUE PLAINS, WASHINGTON, D.C.
With pHcontrol,
days 51-150a
Without pHcontrol,
days 26-85a
Operating Parametersb
Oxygenation time, hrsc
rim ratiod .Solids retention time, days!'
MLSS, mg/1
MLVSS; mg/1 .
Retire sludge SS, mg/1
. Sedimentation tanitoverflow rate,° gpd /sq ft
m3 /m2 /day
Sludge production, mg/1
Lime dose (CaO), mg/1
4.0
0.15
13
5,660
2,620'38,650
620
25.3
69
126
3.9
0.16
17
3,520
2,780
13,640
645
26.3.35.4
Effluent Qualitiesb
Concentration, mg h Influentmean
EfflueritInfluent
mean
Effluent''
mean standard 4deviation mean standard
deviation
BOD5..
-COD _
SS
VSS
tKN
NI-11.-N
NO2-4. NI03--N
'
67
152
77
58 -----
21.7
14.9
-
6.3e
26.4
10
.6.01.3
0.15
, 13.4
3.1e
6.2
4..8
4.20.6
0.11
1.1
70
152
75
58
22.7
150
-
8.6e42.5
24.0.
17.1
2.4/
0.64
12.8
,e3.08.2
1'6
.,',f0
,
Z ,, . I,-0.6it,
Li
aDa.y 1 4' January 1, 1974bDate from reference. '8 ; while the data are not from the same time period, data from a common timeperiod (days 56-85) showed the same trends..
cBased on influent flow '1
dF /M ratio is the ratio of the lb BOD5 in the Influent-to the activ,eted sludge process and the lb ofMLVSS inventory under aeration or oxygenation.
:Nitriftcation railbited -4 .
4-60
169
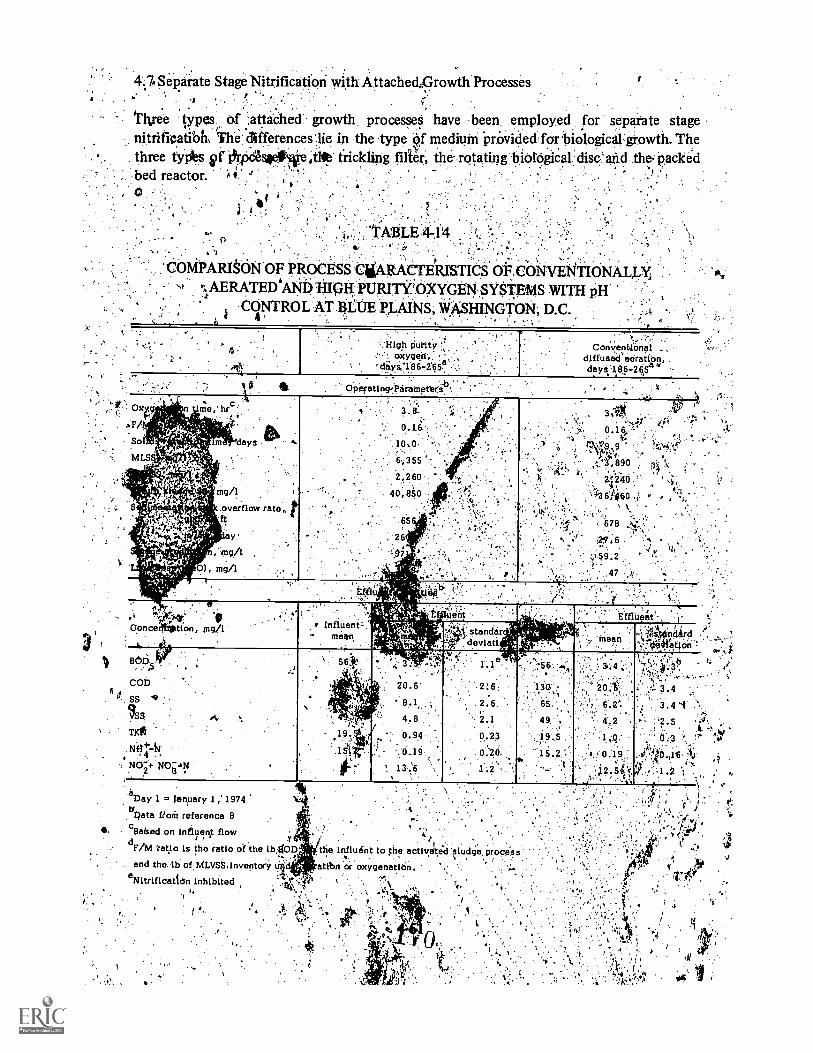
4.7 Separate Stage Nitrification with AttachedGrowth Processes;.
Three types of :attached growth processes have been employed for sepaiate stagenitrificatibh. l'iledifferene,es 'lie in the type Of mediuM PrOvided for 'biological growth. The
. three typts pf frickling, the. rotating biologiCal the. Packedt,
bed reactor. I,*
TABLE 444. 0 ..
'COMPARISON OF PROCESS .CMARAeTERISTIO OF,CONVENTIONALLI;r/AERATED'ANDingx PURITi(OXYGEN SYSTEMS WITH pH
CONTROL AT BLUE PLAINS, WASHINGTON, D.C.
34'/
'So
MLS
m0/1
overflow rate,,ft
YP
, mg /1
mg /I
AS
Convent4ona1diffused'aeratiOn,days186265a''
34t 0.16
,890
2i240. I
678
.27:6 ..
159.2
47
,',.. -,. *.;14".: 1pConceilbletion, ing/1
s, b.4 Influent
mean,
v. y,5; ,..' ,-s
....s '
3 -
,, Z0.6
4.80.94
0.19
' 13.
.f.,:ent
standar ,.t,i',.ed Watt i
1 . 1
2:6
2.62.1
0.23
0. 20.
1.2 -
.
tii.
it
...4
130
65, '
49 ,. ,
..,19.5
15.2 I',
,
Effluent trl
8,
mean,
2 ,
6.2t4.2
1 0,
, 0.19',}2.54 v,
-".k.
...1'-t4a0.1.11,d4rdv:ipra,kion,11 e' 4.,..
: 3.43.41 \'2.5
0:3 ' '1
:4.,16- iii. +.1 C)
.1.2 ;. ' \
BOD Nw
COD
SS 9/SSTKO
Ni-lt.1, 4
NO -+ NO-4N2 0
.0.
.
l 56
y
tii
- 19.. ..,
lel
i
. ,
.
aDay 1 = jenpary 1 , 1974
°Data ffoth reference 8
cilaised on Influenp flowYd
Firs ratio is the ratio of the 1b,410D
and the lb of MLVSS, inventorir
aNitrlflcatiOn inhibited
the 7nflu6nt to $he activated ;sludtia, Process
atibn Croxygenatien.
aS:in operatiOn at several military installations during World War II. Initially,triC,Itligg filtratiOni process ,was developed to increase the removal of organics
!its frOrrithe higli'rate: trickling filters, Later, it was observed that under some
f .7Jr t 6 n with Tritkling Filters. ,,
The 'deVY' ment of two-stage trickling filtration or double filtration preceded thedevelop of two-stage suspended growth systems for nitrification. In fact, two-stage
4§filtrathe:1win th eOperatlig' t
'*k
stage nifil intealttifnitive
d stage produced a well nitrified effluent.68
.
cation Aptilication, trickling filters can follow a high rate tricklingiate clarification, or an activated sludge process or any of the other
It has :been
ia Type iind Specific Surface
at in separate stage nitrification applications, the rate of nitrification isprooitioAthe surface...area -exposed to the liquid being nitlified.69,70 In othet words,
r factors are held .constant, the allowable loading rates can be expected to be';re1a edia surface area, rather than to the media volume.
'ale biological film development has been observed in separate star applica-1,72 As a consequence
7pluggage of voids in the media and ponding,b,ecornes of less, 4
ncerri than' in combined ,carbon oxidation-nitrification applications. Media of highercif t surface than normally employed may be used Plastic media is ch' teriNd by
having very high specific: surface available while maintaining a high void io 90percent). The high specific surface area of plastic media allows the trickling filter volume tobe reduced, significantly reducing the cost of the distributor arms and the structure.
Available types of plastic media are summarized in Table 4-15. Most experience iiPthe U.S.been with the ,Corrugated sheet module type, rather than with the dumped media whichjust become availgble.: Media applicable to nitrification applications is commerciallyable in sPecific,Surfaces 'ranging from 27 to 68 sq ft/cu ft (89 to 223 rn2/m3).
- 4.7.1;2 ,Loading Criteria
As previously stateil, nitrification rates in trickling filters are related to the wetted surfacearea of the media. Therefore, the most rational criterion would be in terms of surface areaUnfortimately; information on specific' surface is not always available, and volumetricloading criteria, must occasionally be resorted to.
The,.pilot, study at the 'Midland, Michigan Wastewater treatment plant provides the, mostcomprehensive set of data currently available on nitrification with trickling filters.22,71The
fluent to the ,pilot plant' was well treated trickling filter effluent with BOD5, SS and/arilinonia-N' values ranging from 15-20,-15-20 and 8-18 respectively. The BOD5/TKN ratio
4-62.
7

TABLE 4-15
COMMERCIAL TYPES OF PLASTIC MEDIA FORSEPARATE STAGEJNITRIFICATION A.PPICATIONS
'ManufactUry TradeName
ci f ic .surface, aval?blesficte ft (rn / fir )
. .
Envirotech Cotp., Brisbane,Ca.*
Surfpac. Corrugated shcot. modulei
. 27 (89)
B.F.Goodrich, Marietta, Ohio Vinyl Co're ..6orru4atelosheet 30.5 (100).moduleg'i
. .. 45 (148)
st-Enviro Development Co. , Inc.'
Palo Alto, Ca.bFlocor Corrugated 'sheet
modules2740 ('131)
Mass Transfer, Ltd. , Houston,. Filterpack Dumped rings 36 (118)Texas
r(189)
Norton Co., Akrbii, Ohio Actifil ,Dumped rings 27 (89) .
42 (138)
cviunters Corp., Et .;'04eyers, Fla. PLASdek Corrugated Sheet 42 (138)modules 68 : (223)
aFormerly available from the Dow Chemical Co, Midland, Mich.Under license from ICI, Great Britain; formerly available from the Ethyl Corp.,Baton lipoge, La.
was 1.1, indicating a high degree of'BOD removal in the pretreatmen1 stage: The pilot unitwas a 21.5 ft (6,55 m) unit filled with Surfpac Media. During the 18 month project period, avariety of climatic conditions were experienced with 'wastewater temperatnres in the pilotunit as low as 7' C and as high as 19 C encountered.
The data from the various operating periods for the project have been reexpressed in Figure4-15 in terms of the surface: area required for nitrification and the desired effluent ammonianitrogen content. As may be iseen, greater surface area is required at lbw tempprature (7 to11 C) than high temperatures (13 to 19 C), Further, to obtain ammonia-N contents below2.5 to 3.0 mg/1, greater surfaCe area is required than for effluent ammonia contents above2:5 to 3.0 mg/1 ammonia-N.
When effluent ammonia -N, leyels less than 2.5 mg/1 are desired, conSi$eration should begiven to using breakpoint chlorination (Chapter 6) for removing amm6rila residuals ratherthan increasing the .surface area of the filter, as the cost of removing the last 1-3 mg/1 ofammonia becomes very high because of the very much larger trickling filters required.
Figure 415 was developed solely from the Midland, Michigan' data. Data are available fromtwo other locations which allow calculation of surface requirements or nitrification. 27,73Figure 416 shows surface reaction rates for Lima, Ohio data27 compared with the trendlines developed from the Midland, Michigan data Lesser surface area is required at the Lima
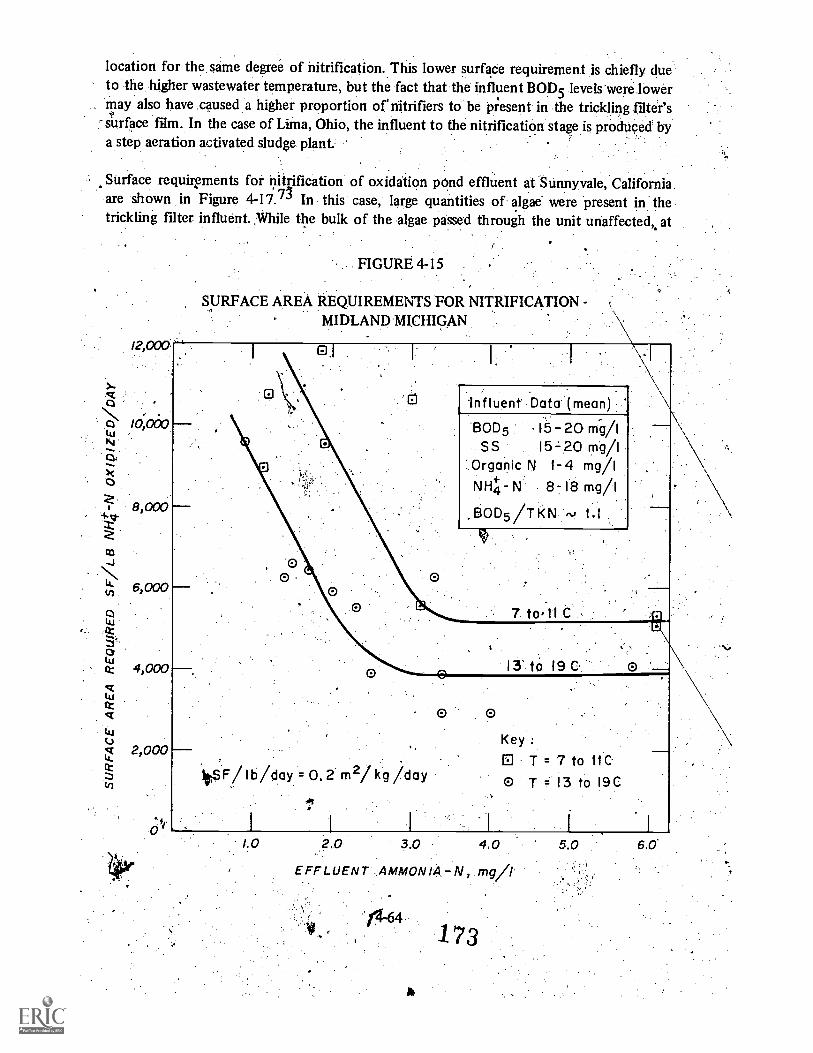
location for the same degree of nitrification. This lower surface requirement is chiefly dueto the, higher wastewater temperature, but the fact that the influent BOD5 levels'were.lowermay also have caused a higher proportion or nitrifiers to be present in the trickling filter's
-surface film. In the case of Lima, Ohio, the influent to the nitrification stage is produced bya step aeration activated sludge plant.
Surface requirements for nitrification of oxidation pond effluent at Sunnyvale, Californiaare shown in Figure 4-17.73 In this case, large quantities of algae were present in thetrickling filter influent. ,While the bulk of the algae passed through the unit unaffected,. at
12,000
0N0 /0,000
>co
8,000
co
u.) 6, 000
o
tt 4,000
4.1
tc
vt 2,000
(r)
FIGURE 4-15
SURFACE AREA REQUIREMENTS FOR NITRIFICATIONMIDLAND MICHIGAN
*Influent' Data (mean
BOD5 15 20 millSS 15 =20 mg/I
Organic N 1-4 mg/INH4- N 8-18 mg/1
.E30D5/TKN 1.1
ItSF/lb/c1ay = 0. 2 g /day
9
Key :
T = 7 to 11C-
o T 13 to 19 C
1.0 2.0 3.0 4.0 5.0
EFFLUENT AMMON1AN, mg/I
A
x73
6.0
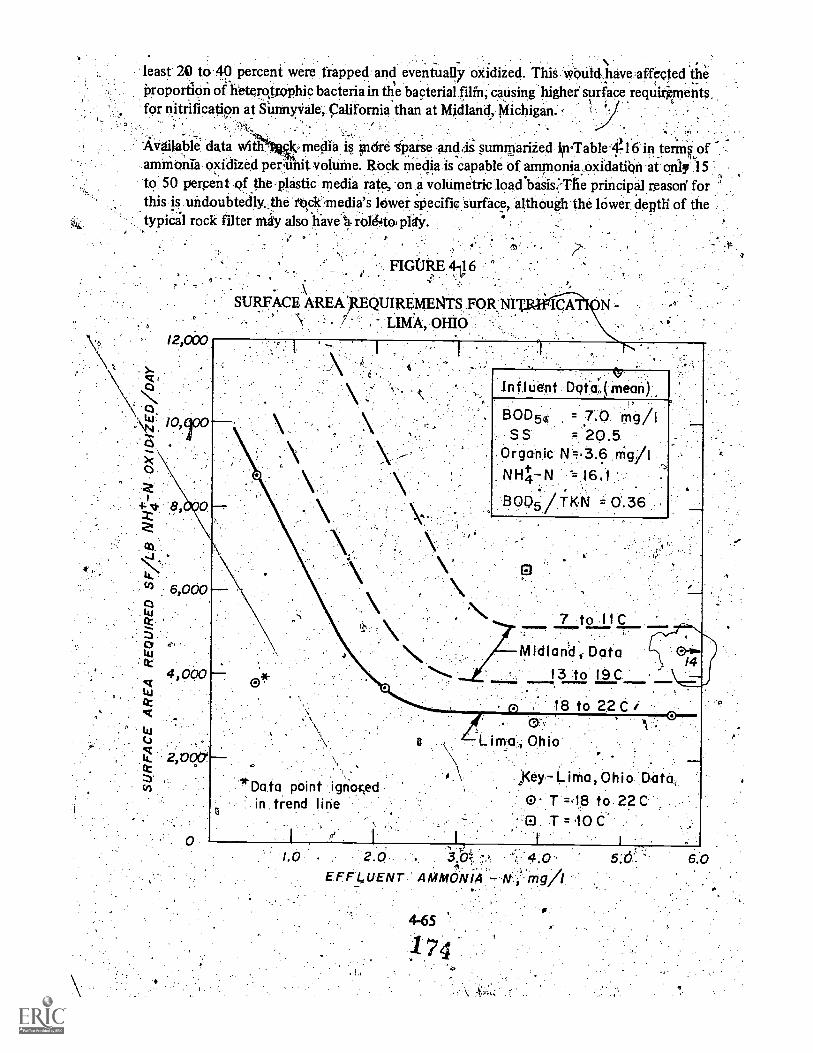
. .
least 20 to 40 percent were trapped and eventually oxidized. This wOuld,have 'affected 'the..,
Proportion of li'eterotrophic bacteria in the bacterial Min, causing higher surface reqnirkrnents,for nitrification at Siumriale, California than at Midland, Michigan. , 1 °
Available data vdil*Ic, media. i mare sparse and summarized 1p:fable 4)-16 in tenns,of. ,
ammonia oxidized per unit volume. Rock media is capable of ammonia oxidatibn at only 15to 50 percent of the-plastic media rate, on a volumetric loadloasis."-The principal reason' forthis is undoubtedly,; the rosk media's lower specific surface, although the lOwer. depth of thetypical rock filter may also have a roldit play.
FIGURE 4116
SURFACE AREA REQUIREMENTS FORNI/1. LIMA, OHIO
cl) 6,000W.cc
e
4,00014,
cc
c.)
2,00Y
cf)
1,0 2.07.?
*, 4 .0EFF 4UE1VT AMMONIA mg/1
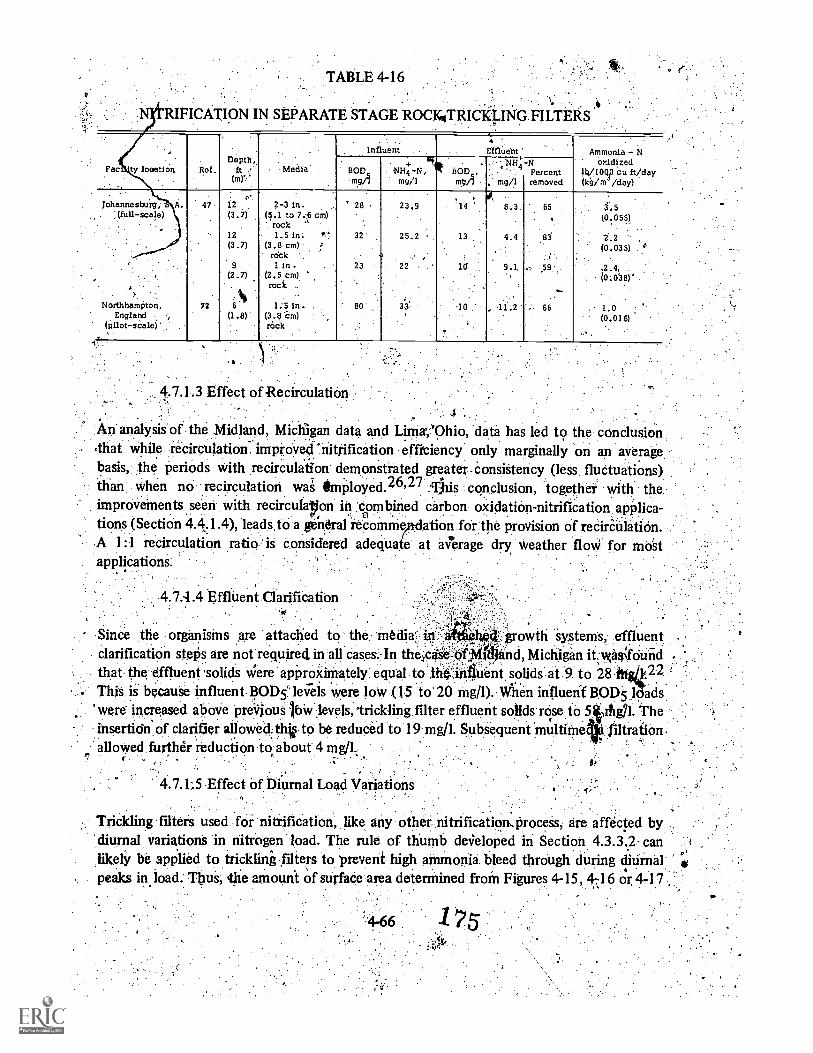
RIFICATION IN SEPARATE STAGE ROCK4TRI&LING FILTERS
Fac ty legation.
.
lief.Depth,
ft(m)'''
Media
Influent4
Effluent.' Ammonia - Noxidized
Wioy cu ft/day(kg/m /day)
BOD5mg
+ Ift44H4 -N, '"i.'
mg/180D
raP
-11H+-14..4
. mg/1Percentremoved
johannesbuig; .(full- scale).
Northhameton,England .
(pilot- scale)
47
72
12(3.7)
12(3.7)
9
(2.7)
6
(1.8)
2-3 in(1.1 to 7,16 cm)
rock1.5 in. 7.'"
(3.8 cm) .a
rock '.1 in.
(2.5 cm)..
rock ..
1:5 in(3.0 cm)rock
'.28
32
23
80
23,9.
.
25.2 ,
a22
33
,
'14
13
.
lii
-10
.
,'
0,6.3.
4.4
9.1
.11.2
,v
'.;
65
83
59,
66
.3.5(0..035)
(0.035)
2.4,io.081'
1.0(0.016)
4'
4.7.1.3 Effect of Recirculation
An analysis of the .Midland, Michigan data and Limay''Ohio, data has led to the conclusion.that vvhile recircUlation. unproved' nitrification efficiency only marginally on an averagebasis, the periods with recirculation demonstrated greater -ConsiStency (less fluctuations)than when no recirculation waS 1.1mOoyed.26,27 .41')iis conclusion, together with theimproveinents, seen with recirculayon in 'combined carbon oxidation-nitrification applica-tions (Section 4.4.1.4), leads,to a geildral recommrdation for the provision of recire-ulation..A 1:1 recirculation ratio is c,onsidered adequate at average dry weather floW for mdstapplications.
4.7.4.4 Effluent Clarification
. .
Since the organisms are attached to the media': owth Systems, effluent..,clarification steps are not required in all cases.-In thesqi&o. nci, Michigan ity4aaNfound ...
-
that the effluent 'solids Were approximately equal to th.':infin'ent. solids at .9 to 2841%422This is becauSe influent BOD541e;els were low. (15 to 2() mg/1). When influent BOD5 loadswere increased above previous low levels, '.trickling filter effluent solids rose to 5i,rfig7l. Theinsertion of clarifier allowed:thio to be reduced to 19 mg/l. Subsequent multimeiti filtration.
. . . .allowed further reduction to about 4 ing/l.. , ..
4.7.1;5 Effect of Diurnal Load Variations
Trickling filters used fore nitrification, like any other nitrification.Proceis, are affected bydiurnal variations in nitrogen load. The rule of thumb dmieloped in Section 4.3.3,2 can t
likely be applied to trickling filters to prevent high ammonia bleed through during diUrnalpeaks in load. Tips, the amount of surface area determined froin Figures 4-15, 4,1.6 or 4-17

r,under average daily loading co,nditions should be multiplied by the ratio 'ofReak ammoniaload to average load to establish design surface area An alternative would be to provide flow
,
equalization.
1'
FIGURE 4-17
SURFACE AREA REQUIREMENTS FOR NITRIFICATION -' . SUNNYVALE; CALIFORNIA
14,.000 xt.I I18 200 ,
48;560
.
12;000
W.N.
k i0,00
4. Ct.!),
82000gr
-4
LA. 4'
.. 6,000
ttQ:
q. '4,000LA.
cc
. .
2,000
ra
4d 4
Influent Data (mean)
COD = 2 lb mg/1SS = 104 mg/f
Organic N= 10:0 mg/1,NH4 N = 16.7 mg/1
Sunnyvale, California DataI 3,..0 to 1.9 C
0 0
.411116-
gi'dland ;Michigan Data .
.13 .C, to 19
- ,
Key:: ,
. ". . O Test result frprriSunnyvale :work
18
EFFLUENT.
fo"
M1N0N 44-L1v;
. ,4,67 2
'0476:
,441, g
n
MIN
1O 12

\4.7.1.6 Design Example
As an examPle consider a 10 mgd conventional activated sludhie plant' that must upgrkdedto meet effluent requirements of 4 ing/i ammonia nitrogen and 10 mg/1 suspended,solidsop
,4an average' basis. The plant is located' in. a temperate zone, and the minimum wastewatertemperature is.,15. C. Present average effluent qualities are mg/1 organic nitrOgen, 20 mg/1ammonia nitrogen, 15 mg/1 of .,suspended solids, and a BOD5.Of,' 25 mg/l. The, peik,tpaverage nitrogen load ratio is 4.9. Consider as one alternative,a plastic media trickling filter.
1. `r Calculate the BOD5/TKN ratio: --
BOD5/TKINI= 25/21 -1.19
.Z The closest, set of data based- on *130D5/TKN ratio, and teMperature, is that forMidland, Michigarf(Pigtire 4-15). For an effluent ammonia nitrogen concentrationof 4 mg/1 at 15 C, the unit 'Surface area recitiOment is abaut 3,800-sf/lb NH4-N.oxidized/day. a.
Calculate the ammonia nitrogen oxidized, daily. The' following , equationappropriate:
IF
Q(N (4 -24)%
4
" ,NT annnonia nitrogen oxidized, lb per day
Q aVciage daily flow, mgd,
influent NH' ing/1.i. r , ;.
effluent NH4
- N' mg/1
A ;
F6i-this eAturiple; assuming no chiige in the organic nitrogen leVef, tlti result
where: .
0
. =
NT =.78,33 (JO) (20-40= 1,332 lb/day.
Find the total 'area requirement undei' average load-conditions.' MUltiplyMg the nitrogen -oxidized per day (step 3).by- the,unit surface area requirement
r '(step 2) results in:
(1.,332) (3;800) = 5,061,00 sf Of media
.
Consider diurnal peak loading. .0ne approach would be to provide flowequalization. Assume that in thiicase site r6strictions prevent this. 'Therefore,"increase the surface; requirement by the peak io average ,nitrbgen load:ratio.asfollows (Section 4.-7.1.5): -

1.5 (5,061,000) = 7,592;000 sf
Choose' a media type and establish media volume requirements. Effluent BOD5and SS are low enough so that fairly high density media can be employed. In thisinstance, a corrugated sheet module media having a specific surface of 42 sf/cu ft
'is chosen. Media volume requirements are defterminea'by dividing the total surfacerequirement by the specific surface as
`.4,Vat41'7:: ,41.!
7,592,000/4q.=180,750 c 4
n.
This volume could be provided by a variety of configurations; for instance two 75ft diameter trickling filters with a media height of 21 ft would have theiecessaryvolume. T media. Whatever configuration is chosen, the filter shouldn t be lessthan abcfut .12 to 1,5 ft in height because of the danger of short circuiting: Usualpradice is to consult with the-media manufacturer(s) prio to final selection ofmedieanfiguratOn.
:47
Establish recirculation, rate. At 10 mgd ADWF, a 1 recycle is adequate (Section4.7.1.3); therefore 10 mgd of recirculation capacity is recommended.
Establish clarification. requirements. Fffltient solids in the nitrification process.
effluent will be approximately at the influent SS level, 15 mg/1. Therefore,meet a 10, mg/1 requirement, some.forni of effluent clarification is required suchas dual or multimedia filtration.
4.7.2.Nitrification with the Rotating Biological Disc Process
The rotating biological disc (RBD) process, ,discussed in Section 4.4.2 for combined carbon *.
oxidation-nitrification applications may, also be applied to nitrifying secondary effluent&The process is constructed as shown in Fig. 4-8, exCepting that it may be ixissible toeliminate the secondary clarifier when the secondary effluent being treated has a BOD5 andsuspended solids less than about 20 mg/1:74 Under this,.circUmstance the very tosw netgrowth occurring in the nitrificationttage causes the RBD process effluent suspended solidsto approximately equal 'the influent solids level. If lower levels of suspended solids arerequired, the RBDitocess could be followed directly by tertiary filtration without the need,for intermediate clarification. 74
a/J.One manufacturer has announced the ofi media especially adapted ,; tonitrification. The minimal biomass film development in separate. stage nitrificationapplications has allowed a 50 pereent increase in surface area of the csnxiigated polyethylenemedia. Stan i ard, shafts were 100,0p sq .ft (9300 m2) of available surfice area; the new,.media is ay.. ble. at 150,000 sq ft (13,900 m2) of surface per Shaft lis results in areduction of on d in the number of shaft .assemblies required for nitrification with theRBD proCes&74 .,
4-69
178
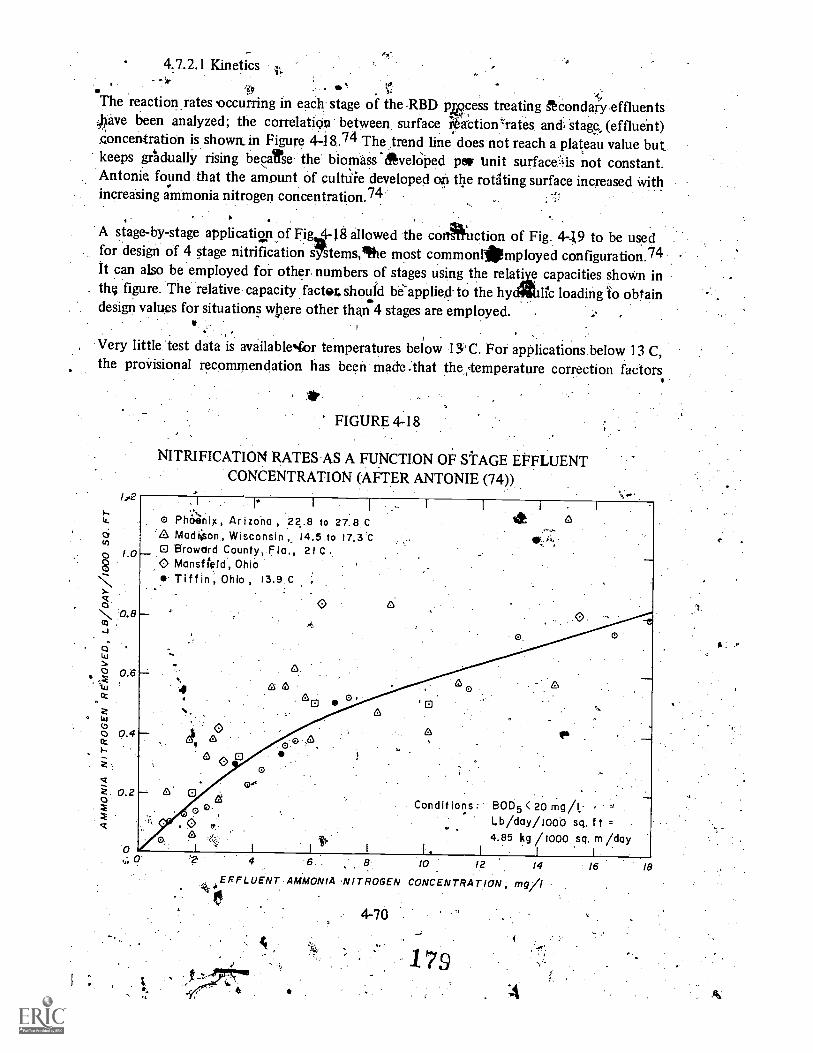
4.7.2.1 Kinetics-
,14t .
The reaction rates 'occurring in each stage of the RBD pwcess treating gtcondary effluents:31}ave been analyzed; the correlaticin between surface if4action'rates and stage, (effluent)goncentration is shown. in Figure 4-48..74 The trend line does not reach a plateau value but.keeps grhdually rising becaltse the biomass 'AvelOped pe Unit surface not constant.Antonie found that the amount of cultdie developed on the rotating surface increased withincreasing ammonia nitrogen concentration. 74 _ .
tA stage-by-stage application.of Fig 18 allowed the co A ction of Fig. 449 to be usedfor design of 4 stage nitrification sitems,Vie most commonfibmployed configuration.74It can also be employed for other. numbers of stages using the relative capacities shown inthe figure. The relative capacity fact$L should be the hydetilic loading to obtaindesign values for situations where other than 4 stages are employed.
. .
Very little 'test data is available4or temperatures below 13,.C. For applications. below 13 C,the proVisional recommendation has been made .that the,- temperature correction factors
1,0
1.08N
N 0.8co
ci
Iz 0.6
o 0.4
zz
2.0
c
4.
FIGURE 4-18
NITRIFICATION RATES AS A FUNCTION OF STAGE EVFLUENTCONCENTRATION (AFTER ANTONIE (74))
I I
o Phoenix, Arizoha , 22,8 to 27.8 CLN Macli;son, Wisconsin ,,, 14.5 to 17,3'CO 'Broword County, Fla, 21 C0 Mansf kid., OhioO Tiffin, Ohio, 13.9 C.
ti
4
0
"0
0 12)0
a !O it
%;:;
I 10'
0.
Conditions: 130D5 < 20 mg/1.- ,,
Lb /day /t000 sq. f t =4.85 kg /MOO sq. m /day
I 1. I ,I I.10 12 14 16
CONCENTRATION , mg/I
6.. 8
EFFLUENT AMMONIA .NITROGEN
4
4-70
1794
18

developed for combined carbon oxidation-nitrific\ation'(Section 4.4.2.2) be applied forseparate stage nitrification.1',1.
Figute 419 may also be used for hour-by-401r analysis of the effects of diurnal variations inflow on effluent quality.74 This may tend to overestimate effluent quality 44ring peakingperiods, however. To 'ensure that severe ammonia bleedthrough does not occur during peakload periods, it would appearprudent to adopt the rule formulated in Section 4.7.1.5 fortrickling filters. Namely, the surface area deterinined from Figure 4-19 should be multipliedby the ammonia nitrogen:peaking ratio to establish the design surface area.
/00
95
o 90ct
a.
85
ct
Oru
80o
.
z 5O
Z
650
FIGURE 4-19
DESIGN RELATIONSHIPS FOR A 4-STAGE.RBD PROCESS'PREA'kING SECONDARY EFFLUENT (AFTER ANTONIE (74))
1
RELATIVE CAPACITIESIESFOR STAGED OPERATION(90 -95 %, Nitrification)
No. Stages Relative Capacity
1 0.602 0.803 0.904 1.006. 1.07
Condit ions
Temperature >13CBOD5 < 20 mg /I.
Inlet Ammonia NitrogenConcentration, mg/I 40
1 gpd sq ft = 41 .1)/m2/day
2 3
Hi'DRAULIC LOADING, GPO/SO Fzr ti
7

4.7.3 Nitrification with Packed-Bed Reactors
Packed bed reactors4( PBR) for nitrification are a comparatively recent development, havingprogressed from the laboratory stage to pilot-scale and commercial availability in a- period ofonly 5 years,23,24,75,76,77,78,79
Figure 4-20 shows one design. 77,80 A PBR consists of a bed of media upon which biologicalgrowth occurs overlaying an inlet chamber, much as in an upflow carbon column or filter.Wastewater is distributed evenly across the floor of the PBR by baffles, nozzles or,strainers,similar to the way backwash water is distributed in down flow rapid sand filters. Thewastewater flow is upward, and a nitrifying biological mass is developed on the large surfacearea of the media.
FIGURE 4-20
SCHEMATIC DIAGRAM OF A PACKED-BEDREACTOR (PBR). (AFTER YOUNG, ET AL., REF.77)
14,
MEDIA
AIR
WASTEWATER INFLUENT t
4-72 si
EFFLUENT
SUPPORT MEDIA
INLET CHAMBER.
.1 Oxygenation Techniqifs#1,
Several me ave been employed for supplying the necessary oxygen for nitrification. Thef .earliest work used injection of air into the feed line entering the chamber.79 A subsequentpilot-scale investigation used a similar procedure, excepting that the air was distributedacross the PBR fl,dor,. as shQwn 'in Figure 4-20.77 High purity oxygen has been used in two
"'alternative prOcedures.23,75,76 In one She oxygen was bubbled directly into the*PBR. In1the second procedure, the liquid was preoxygenated in A reaction chamber prionto entry
into 'the PBR, §ince preoxigenation is limited to satisfying the oxidation of.aboht 10 mg/1' NH4 -N due tollfe solubility of oxygen in water effluent was recycled at a 2 to 3:1 ratio to
provide sufficient oxygen for nitrification. t.
4.7.3.2 Media Type, Backwifiashing and Loading Criteria4 . /
pSeveial types of media 14ve successfully performed in the PBR including 1-1.5 in. (2:5 to3.8 cm) stone 0.5 cm gravel, 1.8 mm (effective size) anthracite and 9 cm "Maspac," a
IPplastic dump , media manufactured by the Dow Chemical Company, Midland, Michi-
if ,.... » ,7.0175 23 8 77, b'''''
In the studies using the relatively light, an thracitedensity anracite and Maspac where air was injecteddirectly into the PBR, no backwashing was found to be necessary due td the turbulencedeveloped in the bed.77 Despite this, the General Filter Company recommends that whenanthracite' is uSed, provision be made for increasing the hydraulic loading in surges for 1 to 2hours to about foilr times the average rate, with air at a rate of 0.5 to 1.0 scfm/sq ft (2.54 to5.08 1/s/m2). The frequency of the swing will vary, depending on influent quality and'flow rate. With the plastic media, the frequency of the surging can be reduced considerablybecause of the high void volume, and in most cases) excess solids' can be withdrawn simplyby draining or backflushing the unit on a monthly'or less frequent schedule.82
With the gravel media, stande practice was to backwash the reactor at 25 gpm/ft,(1271/02)'at least three times per week and in some cases daily.81 In the studies with thestone media:backwashing was requited with both direbt and pre-oxygenation. Gravitydraining at 6 to 20 gpm/sq ft (30 to 102 1/s/M-42) once or twice per week was sufficient toprevent clogging. 23,24
Data available:for formulation of design criteria for PBR units are summarized in. Table4-17. Oxidation -rates' fall m the range of 4 to 27 lb /%114-N oxidized pet 1000 cu .ft/day(0.06 to 0.43 'kg/iiNday). Factors -affecting the oxidation rate are the influent quality(BOD5, TICI1 and N4 -N), teinperathre, and the type of media selected as a.growth Surface. OxidatiOn rates at Pomona; .Ca. were much greater than those at Ames, Iowaat the same temperature, which is very probably dud to the higher BOD5 and lowerammonia content of the Ames secondary effluent. Very likely, there was a higlier fractionof nitrifiers in the Pomona biofilm. Interestingly, chemically clarified raw sewagi (BOD = 93mg/1) was compared to secondary erfluerit (COD = 46) at Pomona and only 60 percent
4773
182

nitrificaAon was, achieved., to prodMe virtually complete.
that ,this reduced efficiencywhermhemically clarified, was
chemically,clarified feed at the detention time sufficientcati8n of the secondary effluerit.81 It is very probable
by a higher fraction qf iieteroirophs being presenteing treaede.
3:v.Ocess. 4-21 shows; the detenti9n time
trzi,*-N) at: steady staq as a functionR,\Jattention'crnust also be given. tq
'40,multiply- the detention timetgen lOad ratio O. establish the
m,onia :bleedtfirough during
Temperattre has a strong effect onrequired fl5 relatively complete, nitrifiof ternpediurnal yade term fined
design detendiurnal peak cdh
igure 4-21 is useddin nitrogen
re 4.,21 by the .
This should.
The media typ6",instance, Tableoxidation rate'0compared tegivr4ag,
'ffects the ant tpF
that anthraeite' w10.41.7.-, this may tie due,to thle,
OVe Iiitiljtier growth:: For ;
c;'? i termsrfaoe-area 7o1 anthr
. b
YE141).BRATURE
;NTRtFICAPON
FIGURE 4;21' ,(2k
DArgivt0EN93,0E:0EMNTION-T FOR COMI?LETE;
= :
to. ,17" E FOR PO,M DATA.. (Ret 81)
.
15
0
KEY:..c.rRef:. :Lcieat ion
6 V I0 181:';
8123777777
..1
PoMona , Ca.Pomona ,.Ca. 44Pomona , Ca.Union City, Ca,Ames, IowaAmes, Iovd_Ames, Iowd'
. #2,0
Commend
-Grir One Calrwo ColUmnst02
(Travel ne C Air .StoneAnthracitIkMaspacSeries. Maspac Antprckcite
I I
a>
iti40 100 120 '140
EMPTY BEd sION TIME; MIN.,
V74
183
r
/60
.40
180 200-
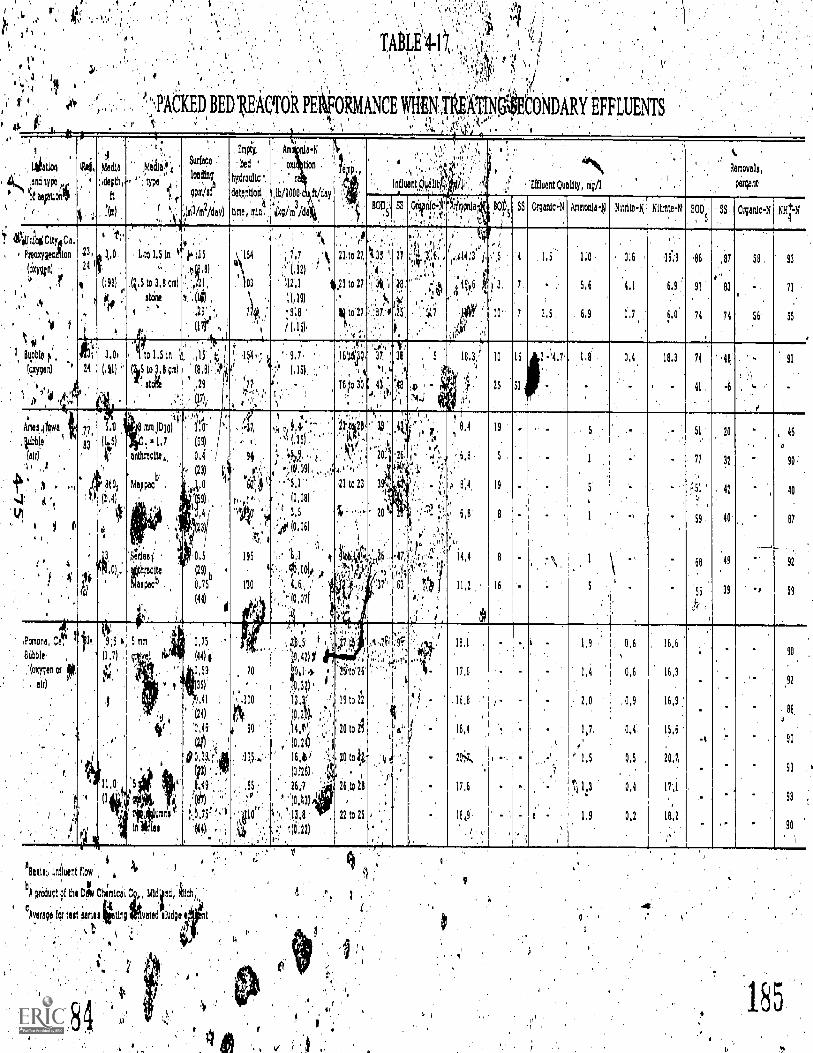
TAtLE\*11
CONDARY EFFLUENTS
1
Nationarici.cyk.,,,,
.11.1 ooptio441.,
Rsi,I'.,,Aepth)
;I,:
Media
ft
',Itn)
-arlicilat
..,tylye. ',0
:. 1, c
$ `.
Su$18;8
lo ,.A1;14:5
9PI8/!:
',IM3/m2/day)
,,Empty,.
: bed '
hydraulic',
deterilioita
time, miu.
,
Am nla-N
oxi ion
ra
i,lb/10030, ft/day
'koim /d,a)
I, ',
,
6,,, ,,I
,
,.6 ','.,' ,66 .... 'Influont,O4alitk /
'1,
a\7
,., Effluent Quel1tY, MO
Removals,
perqnt,6._
6a;.3
03
6:
OilthfcN 11Pala-' ;,'f.
.,'
A SS Organic-N Ammonlai ,Nitrite-161 Nitrate-11 RODS SS Orcanic-N NH -N4
1
1nialCityi#Ca.
Preoxygengion
(*nil),', ,,r
4
,0 11
k, Ss °
Bubbler ,
"c:xygen) '
° '0 4 q ,,.4..
236
241V
,
I'
'' 't"a 3,.0 ,
(.91)
0... l'
',iv
,1
, 1.63 1.5 in
"A.5 to 3,8 cm)
gam1 )6 7
w
kW. :1S
',:ta.8),,, : 41,
1 ':(14) .
..29..,6,
II It'
'154
4,
03
7 0,.6 -
41
.7.7 ..k(.12) / .
1.12,1 4.21,to
'; (619)
.9.,9 ...
'I 1.1516
r,
21,6°27,
'.
27
'
lito21
II',.
li ;33
...',13i,',
;
:37.'0
'.27
1
'4' ;';' t41;`k" 1:',/ .,,,,36, , ,...6,14.3 16.6
'',;.,,''1,' '' ..,.-A ,. 18,8 ,i
, i '5
r 64$1)r
',,5
?
10..
1.5
2.5 ,
1:0
5,6
. 6.9
0,6
4,1
1.7
.15;9
6.9
6,0'
'86
91
74
,87
4
83
74
.58 .
56
93
71
55
il;
24
3,06
(.41)
(
Yr to,1,51n
.121S to b8 cm)
41'. stofk
,11 k:
(8.8). ',°1i
.29 '
(7),.
1,, 1,5416',',..
',
4"r.
.
' 9.7,
.'',.' 1,15.
0 r
1634906'
, .1.4,,
T6tto 30
37 ',
11.,!'
6.43.
1.6
31
, ,
'Iro.,p,,,-r ,
, 183:v
r',11,J .4446; ;t
10
25
16
Si
2 -\4.7 , (.8
-
0,4 , 18.3 74
41,
' 8
-6
91
-
Arne3,61kwa i
le.
air)
6 , ,,0
1 ' 71 ,
I: ., ,c,
!s 1 f
4
6
,
,77,
83
i..i
113i
01,
.0(V(1
Hal
(2.61)
.,,,,'3
74.0).
m81,113101
. 81,7
anthracite.,
h
stopple; ,
); P I
,S,Ori es i .
diktat!iraspacb ,
6
.1
11 0`
(59)
0,4 I
6. (23)
0
9).
(23)
0.5
(29) h
.0,75'
(44)
,r;-37,
.6..6,,
94
....
-(e,
t,.'!,''' 10 .4
6 ,
195
4:...,
110
'6;6 ..r? , ',',"
..`,1 051: "
t 4 9, ., t1" '
',,1(1.09), ,,,.6,,..4.4...,
'5.1
(0,08)
'',/ 3.5
'i0 046)
',,.. 1,1 t,ili,10k 0 ,
", 4,6,, . 104.,''.(0,07i 5...1641
'
1.1.z125.''9,Ii,k1;;,66
21 to 23
.
,
4*,i;et,;,1,.,26,
i;P4i,'I.
.. .6
0
3
,- 20 0
s
.37',
;4
.
6
6s7,,
'f,!;
63
,I
,,, i, .', 8,4
.,,'' ..,
'' 4 I, ' 6 8 ,6
,' ,s.i
. '.' A 8,44 i
,6
S.8
1' .. r''6..:,,,Z.,,, . Ica!.'1:',', ..1.1
., 14 11,2.
i
19
,
19
16
5
6
1
-
51
77
,'. '
59,
68
'56
20
32
. 42
40:
49
39
-
, 46
u
90
40
87
.,
92
59
t.Pomona, Ca, '"
Thibble. ,
Amen or 0,air) °
s
lilt. 1;5
il ,7) .
.
1
.
' 11,0
(1
1I
5 ran
q vel
.
7
..1 ,0
,
ritigjumns
in Aries
0,75
(44)1'
0,59'
(35)'
,, ,41
(24)
'0,45
(24
0 0,3946'JII
,r.,,)1 ' .7
;!(8i1)
;;,0,7j1:!,.,')
(44), .
70
6'6100
4 0
14.4,',
'9..,ss.
''' ',0
662t'.,5
11,4210
110,1,7,, 1..
,i0,1, 321 . , $ ;
1341 .i'(0,21.
',4.1frv.: ,
16,85 .;';',4620
(0116), $
26:7 .' '.
°. '(0,83)
:I, '11.8
, .',' 4;22)
'r7,i4'
Sto'26
,
19 to 22
20 to 21
;to it
2619218
22 to 25
',,,,7,F1
t.
:4 6,44
I
, ,
..f.
i
,
18.1 6
17,66
° - .16,8
,1 .
- 16,4
- 20.4,77.,
17,6
18 9 ,
. r
6 -6
-
-
-
-
j -
, 1.9
1.4
2.0
1,7,
" 1.5
6, 1 '.3
1,9
0,6
0.6
. 0,9
,0..4.
0,5
0.4
0,2
. ,
16.6
16,3
16,9
15,6
20676
' 17,1
,
18,2
-
-
.
.
-
-
90
,92
88,
4
90
91
93
90
1
influent flow
bA *duct of the 0;4 Chemical MIdtnd3161;,,
Average for test series ke tin; voted 'fudge e
185
.7a

JotEffluent BOD and SS Weis are affected by the type of aeration (see Table 4-17).PreoXygenation allows the PBR to 'produce diluents of sithilar: quality to tertiarymultiMedia 'filtration. Bubble aeration, however, caiises: continuous shearing of thebiological film from the media, resulting in lower reditt*of BOD and suspended solids.When very low levels of effluent solids are required, -.e 'iieAt filtration may be requiredwhen, bubble aeration is used'in`the PBR.
1'
4.8 Aeration Requirements
Care 'musty be exercised in designing aeration systems for nitrification. Unlike BOD,ammonia is not adsorbed to the biological floc for later oxidation, and therefore the ammoniamust be oxidized dining the relatively short period it is in the: nitrification reactor.Therefore, sufficient oxygen must be provided to handle the lead inipiessed on :thenitrification process at all times. ThiS problem ik,Particularly critical when either activatedsludge or a packed bed reactor system is used for nitriffCation; in the other attached grOwth,systems the aeration is provided as the liquid spills over the media and the designconsiderations relate to proper,ventilation rather than oxygen tr er.
Very significant diurnal changes in nitrogen load have been observed. Load variations:at theChapel Hill tieatriient plant are shown in Fig. 4-3 and the load pattern would berepresentative of systems provided with no significant in-process flow equalization. In thiscase,. peak to average nitrogen load Rise to nearly 2.2, considerably above the peak 4oaverage flow ratio of 1.44. As an example of a plant with some in-process flow'equalization,Fig. 4-12 shows the load variations observed in the activated sludge effluent qf the RanchoCordova Wastewate0Trietment Plant In this case the nitrogen peaking is moderated by theequalization
*
in quOy provided by the. activated sludge aeration tanks and secondary:clarifiers. the ammonia peak o average ratio at 1.63 approximates the flow peak to averageratioof 1.57.
I). t
In addition to being, ffected by in-process flow equalization, the diurnal variation innitrogen loading is 31so very signitcantly affected by equalization in the wastewater6 .
,collection system. Large collection systems serving spreadout urban areas, have high built-in ,,:
storage providing unintentional flow and quality equalization: This relationship is indicated;,,in Fig. 4-22 where the nitrogen load peaking (expressed as the ratio of the maximum hoc.0trly,
load to average load) is plotted for eight treatment plants having no significant in-p1-O6eisequalizatiory: There is an interesting relationShip between flow peaking and ammonfa load6 pealchig shown in Figure 4-22. In large plants such as Bjue Plaips plant at Washington, D.C.and 'Sacramento, California a spread out collection srstem .causes moderation of both flowand nitrogen load peaking. In the smaller systems, however, without such "flow
Vequalization," ammonia lOad peaking can be substantial; for example at the Central ContraCosta Sanitary District's (CCCSD) plant an hourly peaking fact9r of 2.4 has been Measured.Tifie aeration system must accommodate these changes in loads to avoid ammonia bleedingtieugh during the peak load period. The diurnalyariations in load can be quite extreme; inFre 4-23 the peak to minimum hourly loads are plotted,akainst the flow peaking factor.( R i os as high as 10:1 have been obvrved.\
4-76
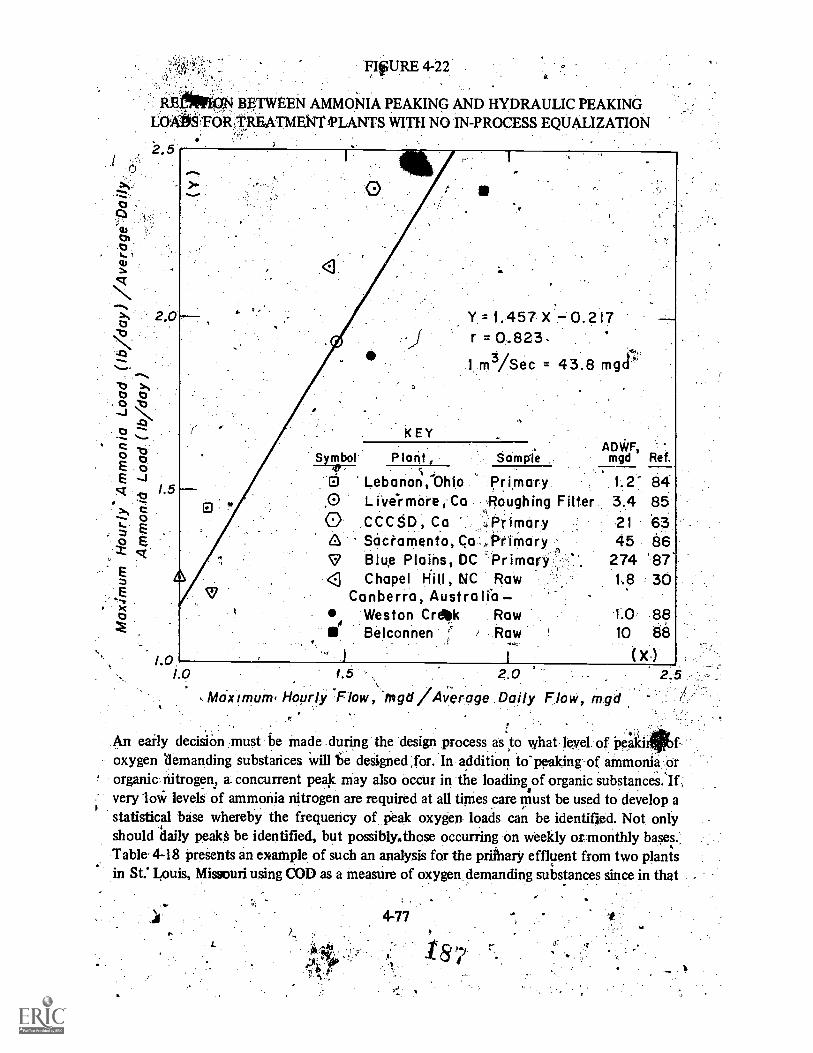
FIFURE 4-22
REMINIOIBETWEEN AMMONIA PEAKING AND HYDRAULIC PEAKINGLOAS.F6R:TREATMENTIPLANTS WITH NO IN-PROCESS EQUALIZATION
2_5
Y =1,457 X 0.217r = 0.823 -
1, m3/Sec = 43.8
o KEY
o6co
c .,.,
/.5EE
,IE
Symbol P loaf, Sample mgd Ref.ADWF,
i Lebanon,-Ohlo Primary. 1.2- 84H 0 i_ i Ve-r more , Ca Roughing Filter 3.4 85
0 .CCCSD, Ca Primary 21 638 Sactornento, Ca Primary 45 86V Blue Plains, DC 'Primary ;-,r 274 87'1 Chapel Hill, NC Raw 1,8 30
0. Canberra, Australiat 0 Weston Crdlik Raw 1.0 88
Belconnen r , - .Raw 10 88
0z>,
.Ex
Lc) 1 1 (x-)/0 1.5 2.0 2.5
Maximum. Hourly Flow, mgd /Average Daily Flow, mgd
An early decision must be Made during the design process as, o what leyel. of peak]oxygen demanding substances will be designed for In addition to peaking of ammonia ororganic, nitrogen, a concurrent peak may also occur in the loading of organic substances. If;very -low levels of ammonia nitrogen are required at all times care must be used to develop astatistical base whereby the frequency of peak oxygen. loads can be identified. Not onlyshould daily peakS be identified, but possiblythose occurring on weekly or monthly bases.;Table 4-18 presents an example of such an analysis for the prithary effluent from two plantsin SC Louis, Missouri using COD as a measure of oxygen demanding substances since in that -

particidar. instance nitrificatiOn was not .required. As may be seen, significant departuresfroin a4rage conditions occur on a fairly. frequent basis. Similar analYses may be justified
/It when deiigning for nitrification.
The,:extr4 aeration capacity required for handling diurnal variations in nitrogen load, coupledwith the xtra tankage and equipment required, may dictate in-plant flow; equalization inmany instances. The redUctions in capital and operating cost of aeration tankage-andaeration 'facilities must be dompared with the cost offlow equalization to determineapplicability to specific case . esign procedurei. for flow equalization I, 'are contained inChapter ss Design Manual for Upgrading Existing Wasteivater TrecitmentPlants, 25
FIGURE 4-23RELATIONSHIP OF MAXIMUM /MINIMUM NITROGEN
LOAD RATIO TO MAXIMUM/AVERAGE FLWO
1=1 12
L 11
E /0J
o,ty
7
J 6
fs
5
Eezt
E.z 2
p
Y= .,9.461 X 8.28= 0.871
I..5
Maximum, Hourly Flow, mgd Average -Daily Flow, mgd
4-78.
2.0 2.5
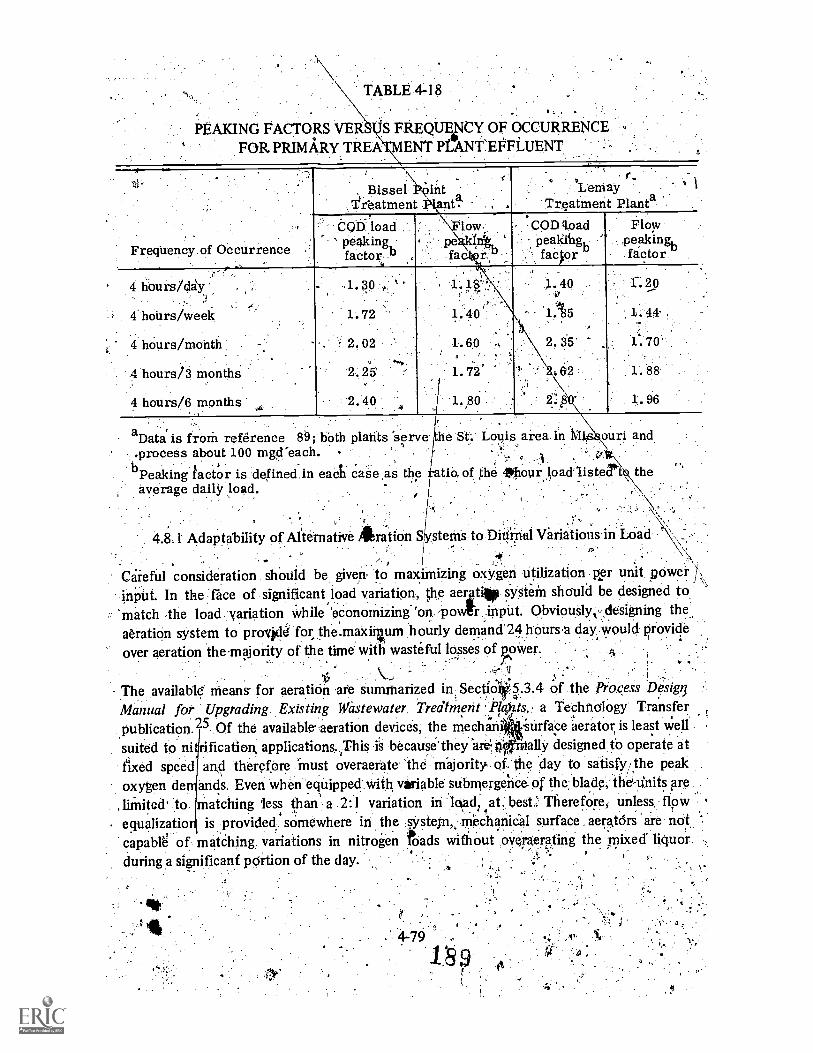
\ TABLE 4-18
PEAKING FACTORS VERFOR PRIMARY TREA
S. FREQUENCY OF OCCURRENCEENT PI ANT'EFFLUENT
. .
Bissel untTreatment Pang .
LemayTreatment Plant
Frequency of Occurrence .
oct. loadPeakingfactobr,
low ., pe 144,... '
fa iy:'
COD fioad. peakibgh
. ' faepr '
Flow:.peakingb
factor.
4 hours/c3y
4. hoUrs/week
4 hours/month.
4 hours/3 months
4 hours/6 months
.1.30 i.
1.72
' 2.02.
2.25
-2.40
, 1.1
1 40
1.60. a ,
1.72'
'1.80
_
1. 40
'1:135
2.3'5'
t, 2 ,
.
L 20
1.'44
1. 70'
1.88
1..96
aData'is froth reference 89; bbth plants serve.process about 100 my:reach. .
bPeaking factor is defineclin each Case as theaverage daily load.
he St.' Louis area. in Mios ouri and
atio, of the 41k,hour.1.oadAistecrtthe
4.8.1 Adaptability of Alternative /ration System's to bittinal Variations in LOad
6reful consideration should be given, to maximizing oxygen utilization per unit, pOwer. .
input. In the face of significant load variation, the aere, system should be designed to
'match the load = variation while 'economizing 'on. 'Powr input. Obviously; designing the,aeration system to provid4 for...the.maxilum hourly demand.24 heursa day Would provide
over aeration the-majority of the time with wasteful losses of yoWer.
.p.., \..., ', .; :The availabl means for aeration are summarized in. SectioV5.3.4 of the Proc,ess DesioManual for Upgrading Existing Wastewater. Treatment 'P15.zts,, a Techticilogy Transferpublication.25 Of the available-aeration devices, the mecha'ri. surface aerator is least well
fication, applications. ,This is becausethey 'ar0 0 ally designed to operate atand therefore Must overaerate the majority of;the day to satisfy/ the peak
ands. Even when equipped with variable ,submergence_ of the:blade, the:-Units reMatching less than a 2:1 variation in load: at best' Therefore, unless, flow
_.
is provided' somewhere in the systejn,.. rnehanical surface , aerators are not' %.
suited to nifixed speedoxygen de
.liinited. toequalizatiocapablb of matching; variations in nitrogen Toads without oVeraerating the :mixed liquor.during a significant portion of the day.
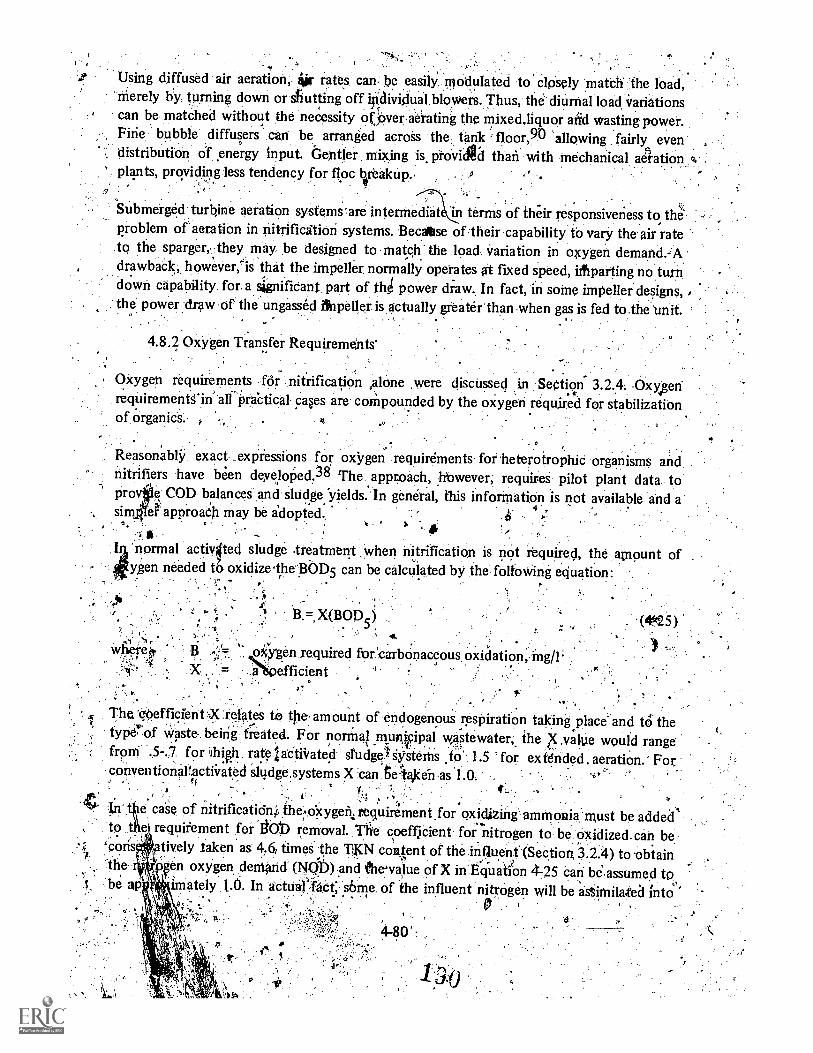
Using diffused air aeration, allir rates can be easily. modulated to Closely match the load,Merely by turning down or shutting off individual blowers. Thus, the diurnal load variationscan be matched without the necessity of:Over aerating the mixed.liquor alit wasting power.Fine, bubble diffusers can be arranged across the tank Aloor,90 allowing fairly. even'distribution of energy input Gentler mixing is provikl than with mechanical ael-ationplants, providing less tendency for floc breakup.,,.. . . T
Submerged turbine aeration systems are intermediat in terms of their responsiveness to theproblem of aeration in nitrification systems. Becatse of their capability to vary the air rateto the sparger,,;they may be designed to match. the load Variation in oxygen demand.-Adrawback, however,Is that the impeller normally operates at fixed speed, iffiparting no turndown capability for a signifiCant part of th4 power draw. In fact, in some impeller designs, ,the power draw of the ungassed finpeller is actually greater than when gas is fed to the 'unit.
9
4.8.2 Oxygen Transfer Requirements'
Oxygen requirements for nitrification ,alone were discussed in Section 3.2.4. -OxyigenrequirementS'in all Prictical cases are compounded by the oxygen required for stabilizationof organics.
1
Reasonably. exact ..expressions for oxygen requirements for heterotrophic organisms andnitrifiers have been develoned.38 The approach, yowever; requires pilot plant data toprove COD balances and sludge -yields. In general, this information is not available and a
o.simfef approach may be adopted., ii.
normal activ4ted sludge .treatment" when nitrification is not required, the amount ofI fygen needed to oxidizethe'BOD5 can be calculated by the folloWing equation:r.
a... X(DOD5)
wherewl ere B oicygen required for.' carbonaceous-.: N
efficient5
. 7,-
.The 'qbefficient X:relates to the amount of endogenouS respiration taking place-and to thetype of waste- being treated. For normal muricipal wastewater, the X .valtie would range:-.from .5-.7 for thir,h. rate: actiiratect stud& iiitertis ,to' 1.5 for extended. aeration.' ForconventionaVactiiiatod sludge,systems X Can te 'i'aXeii .as 1.a
of
1,11 e oak of nitrifiCatidr4 thedxygen4re9uirement,for oxidizing'ammonia'must be addedto tYle requirement for Iii0D removal. The coeffjcient for nitrogen to be oxidized. can be
1, 'cons tively taken as 44 times. the TICNI content of the influent (Section, 3.2.4) to -obtainthe o en oxygen dentarid" (NQ :) and fhe'value of X in Equation 4-25 can be.assumed to,be ap unately 1.0. In aCtiiil'..fact: s6me of the influent nitrogen will be assimilated into
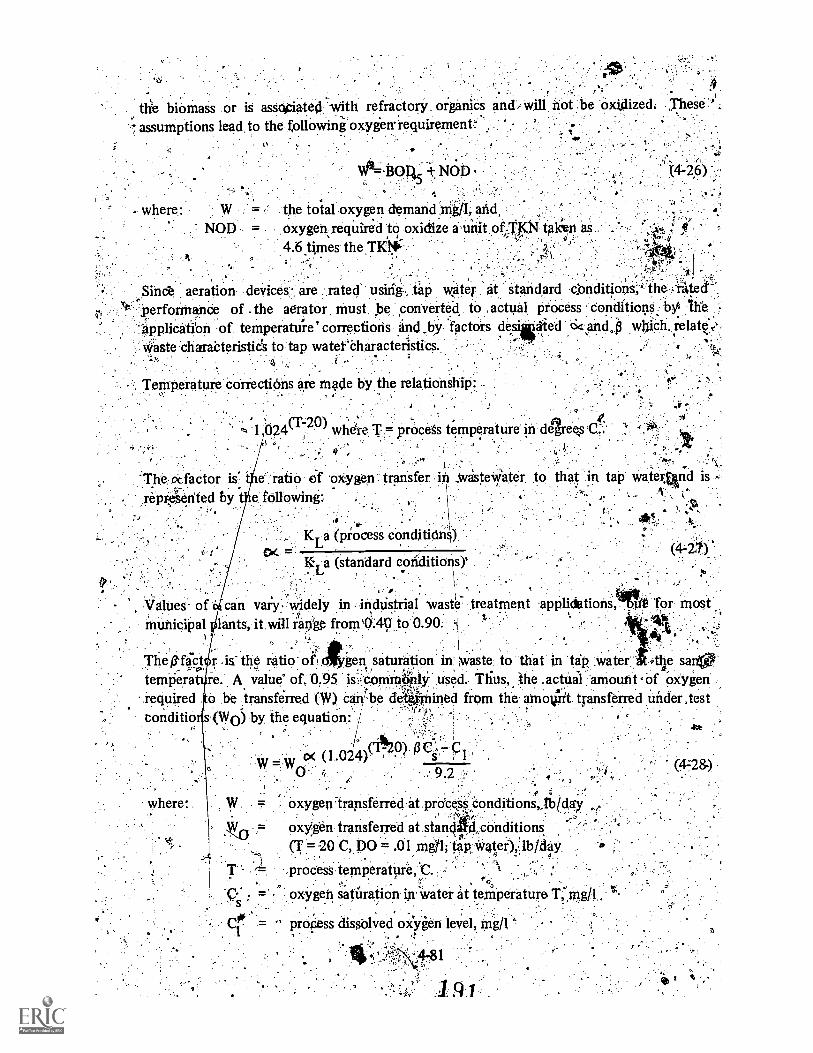
th'e biomass or is assctciated with refractory organics and,-will not: be xidized, . These 'assumptions lead to the follOwing oxyien requirement'
where:
0=-B014 # NOD
the total oxygen demand andOxygen.required to oxidize a unit of..Ti,CN talri as4.6 times the Tletli
, .
Sin& aeration devices- are rated using -, tap water at standard cinnditions';'.'the...* -:
7!::Terforrintnce of . the aerator Must be converted to ,actua1 process Conditions.. b}* the .!
,application of temperature' corrections and by factois de died cSdand13 which.. relate.:t..,
Waste chardcteristicts to.tap.wateeCharacteristics. .C-1,'
..
e .
Temperature Corrections are Made by.the relationship::.
(T 20) 'I 024 where process temperature in degrep,sC2-2,''
The a factor is e ratio of oxygen transfer in wasteWater to that in tap vva.terlid isrepresented by e following:
; ,0
IC, a (piocess conditidnS)
K a (standard conditimils)'
Values of can vary widely in industrial waste treatment applichations,V0 Tor mostmunicipal lants, it.will range from0:40 to 0.90.
The 0147e,tor is the ratio of c gent saturation in waste to that in tap :water idle sang!tempera re. A value: of 0.95 is, commonly used.: Thus, the .actUal amount °Of okygenrequired o be transferred' (W) canoe d rnzned from the anoint transferred under testconditio s:(Wo).by, the equation: /
where:
(1.024)(9.2
W. , Oxygen 'transferred at prdcess. Conditions,,Th Iday
oxYgen transferred at.stand4conditions(T = 0 C, DO = .01 me; tap Water),:,1b/daY
T process temperatpre, C.,
oxygen saturation in water at temperature T:mg/1
C'd! = " proess dissolVedoXVien level, mg/1,
81
9 1
(4=28
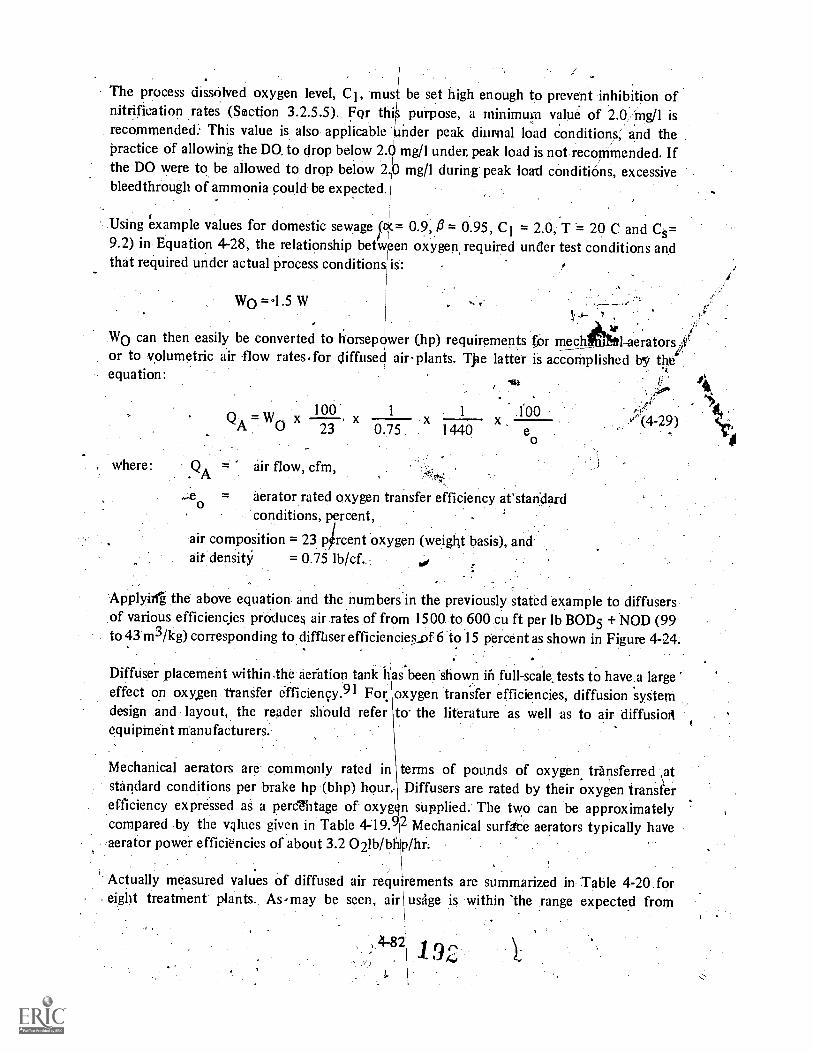
I/The process dissolved oxygen level, C1, must be set high enough to prevent inhibition ofnitrification rates (Section 3.2.5.5). For thi purpose, a minimum value of 2.0, mg/I isrecommended: This value is also applicable rider peak diurnal load conditions; and thepractice of allowing the DO, to drop below 2.( mg/1 under, peak load is not recommended. Ifthe DO were to be allowed to drop below 2.0 mg/1 during peak load conditions, excessivebleedthrough of ammonia could be expected.
Using example values for domestic sewage px.= 0.9, 13 = 0.95, C1 = 2.0, T 20 C and Cs=9.2) in Equation 428, the relationship between oxygen, required under test conditions andthat required under actual process conditions is:
W0 =01.5 W
AfortW0 can then easily be converted to horsepower (hp) requirements Or mechn.141-aeratorsileor to volumetric air flow rates- for diffused air- plants. Tpe latter is accomplished b' theequation:
where:
eo
,100 1 1 100 lir,
x x / (4-29)23 0.75 1440 eo41
air flow, cfm,
aerator rated oxygen transfer efficiency at'standardconditions, percent,
air composition = 23 prcent oxygen (weight basis), andair density = 0.75 lb/cf.
Applyin the above equation and the numbers in the previously stated example to diffusersof various efficiencies produces air rates of from 1500 to 600 cu ft per lb BOD5 + NOD (99to 43 m3/kg) corresponding to difflaser efficiencies of 6 to 15 percent as shown in Figure 4-24.
Diffuser placement within the aeration tank has been shown in full-Scaletests to have a large'effect on oxygen transfer efficiency.91 For oxygen transfer efficiencies, diffusion systemdesign and layout, the reader should refer to the literature as well as to air diffusionequipinent manufacturers;
Mechanical aerators are commonly rated in terms of pounds of oxygen. transferred \atstandard conditions per brake hp (bhp) hour.. Diffusers are rated by their oxygen transferefficiency expressed as a perantage of oxyg n supplied. The two can be approximatelycompared by the values given in Table 419. 2 Mechanical surflte aerators typically haveaerator power efficiencies of about 3.2 021b/bh /hr.
Actually measured values of diffused air requirements are summarized in Table 4-20 foreight treatment plants. As-may be seen, air \ usige is within the range expected from
4-82 x9i,;

FIGURE 4-24
RELATIONSHIP OF AERATION AIR.REQUIREMENTS FOROXIDATION OF CARBONACEOUS BOD AND NITROGEN
kg/m3/day = 62-.4 lb /1000 CF/day
Temperature 20 C6 ---I I 11
500 1000' '1500 1700
4IR -REQUIRED, CU FT413 13005 + NOD
theoretical consideraiions for cane bubble aeration systems. It should be noted that none. of the plants listed in. Table 420 have automated blower control sykeits linked to DQ
pro*. When the Livermore, California plant staff manually; adjusted. the blower output,according to the DO probe reading, they, were able to reduce, the aft requirement to an'average for the day of 680 CF/lb BOD + lb NOD (42 m3/kg) based on hourly variations in
TABL'471 9
RELATION OF OXYGEN TRANSFER EFFICIENCY TOAERATOR POWER EFFICIENCY (AFTER NOGAJ (92))
Diffuser oxygentransfer effi,cleicy, ,
percent ,
(at standard conditions)
Aerator powereffipiency
lb 02/bhp4,hr
4 1.23
6 1.85.
8 2.46,
10 3.08'
12 3.70
4-83
193.

load.85 Thus, it is possible that automated blower operation may reduce aerationrequirements.
In addition to determining the total air requirement, attention should also be given to airdistribution within the aeration tanks. If the conventional (or plug flow).mode of operationis: stablished as the normal operating procedure, the air requirements will be greatest at thehead end of the'aeration tanks (see Section 4.3.5)':
\ABLE 4-20
AIR REQUIREMENTS FOR NITRIFICATION ACTIVATED SLUDGE PLANTS
Treatment .plant'
''
Configuration...
Diffuser type
Oxygen demanddistribution,% ''cu .ft,/lb of BOD
and NODa "
.
Data referenceBOD
5NOD
Medford, Oregon ,
,
Flint, Michigan
Livermore, Calif.
..
.
Central' Contra Costa .
'Sanitary District, Calif..
Jackson, Mich.
1
Hyperion Treatment PlantWest Battery,Los Angeles, Ca.
.
Whittier,Narrows,CoUntY SanitationDistricts,of Los AngelesCountY, Ca.
. .
San Pablo Sanitary District, Treatment Plant, Ca
Plug flow or.step aeration
Plug flow orstep aeration
Separate stage;roughing'bio-filter followedby nitrification
!
Separate' stageslime followedby nitrification
Plug flow
.
Plug flow
Step aeration
.
Plug flow; I
roughing' filterfollowed bynitrification ; ,
. I _1_
Coarsebubble
Coarsebubble
Coarsebubble
Coaisebubble..
Coarsebubble
.
.
;Coarsebuipble
Coarsebubble
73.
65
50
21
66
61
\
59b.
59
. '''T
35
50
79
,.
34.
39
41
41,i, .,
1390.
'1280
...1250
1700
910
. ,....
' 1166.,
(..//1180, .
. . .141e.'
3.
..
93
6
42
9
94
'
.
al cu ft/lb = .062 m3 /kgbAssuming primary effluerit BOD5/COD ratio of 0.6
During June 1974 when nitrification run at design loads .
4.8.3 Example Sizing of Aeration Capacity,
4
As a design example, consider a 10 mgd plant, lime clarification in the primarysedimentation stage:
/4;484 is
1 94414

Given the folloWing primari;7`effluent properties:.
Desigh frovi = 10 mgdAverageB0D5 load ,-= 4,170 lb/elayAverage TKN load =.2,1001b/day.
. -Peak/average TIC14 load ratio = 1.8Peak/averay BOD5 load ratio 7 1.5 (coincident. Arith peak TKN load)
Average load condition;
BOD5 = 4,170 lbs/abrNOD = 4,6 x 2,100 = 9,660 lb/dayBOD5 + NOD = 13,83010/day .
Peak hourly load condition:
BOD5 = 4,170 k 1.5 = 6,260 lb/dayNOD = 9,660 ie 1.8 = 17,390,lb/dayBOD5 + NOD = 23,550 lb/day
Ratio peak hourto average load: '1.7.
For the purposes Of this example assume a fine bubble diffused air aeration with adesign fighre of 725 cf/lb BOD5 + Nop.
AVerage aeration requireMent:
725 x 13,830/1,440 = 6,963 CFM
Peak aeration' requirement:
725 x 23,550/1,440 = 11,860 CFM
In sizing plant air' requirements, separate provision must be made for preaeration, air inmixed liquor and return sludge clannels; and air requirements for aerated stabilization indownstream denitrification processeg:
4.9 pH Control
The implications of adverse operating pH and its causes have been diicussed previously in.. Sections 3.2.3 and 3.2.5.6. In cases where The alkalinity of the wasteVatet will be depleted
by the acid prouced by Qitrification, the natural alkalinity of the wastewater will haVe tobe supplementedby chemical additioh. As diScussed in Section 4.5.1, the effects ofoperation of upstr6am processes on alkalinity and pH must be considered. Alum ofiron
4-85
19.
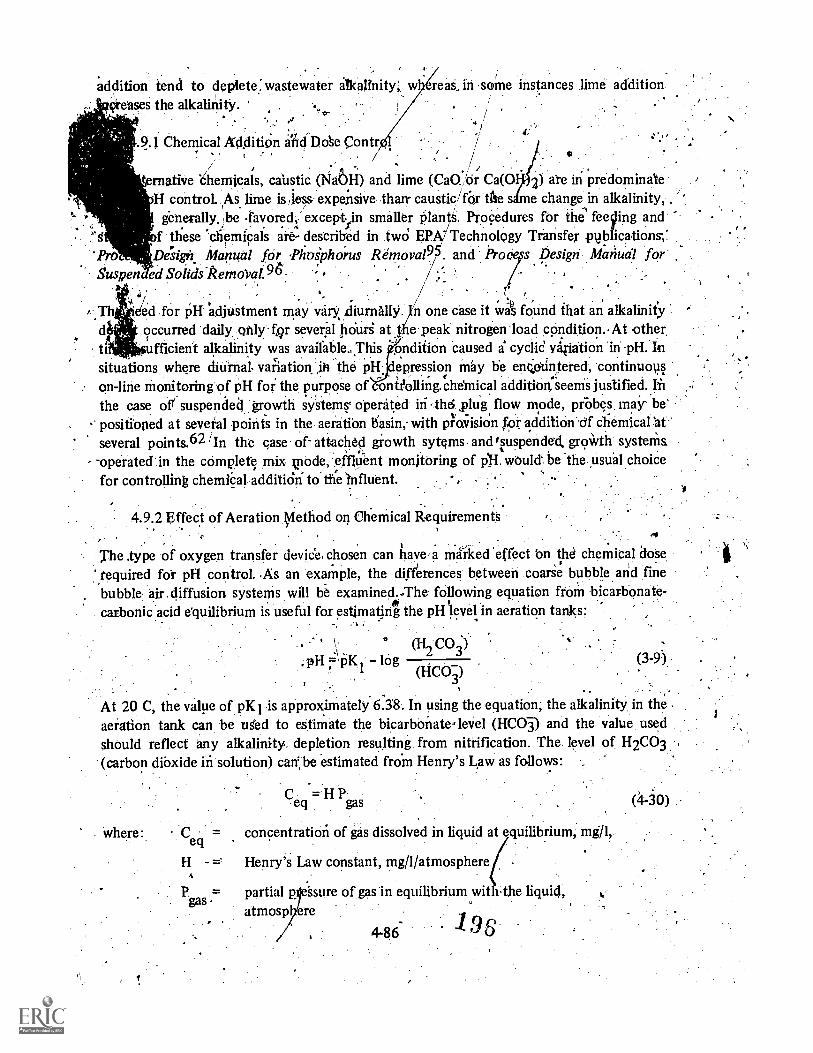
addition tend to deplete:wastewater alkalinity; w real. in some instances lime additioncreases the alkalinity. .
.9.1 Chemical Addition AdDok Contr
/
rnative 'dhemicals, caustic. (Nao1-1) and lime (CaO;Or Ca(0 2) ate in predominateH control As lime is ,less- expensive than- caustic/ for the s me change alkalinity, ,
generally.jbe favored,: excepyn smaller Plants. Procedures for the feesling andf these "chemipals are- described in two EF'A/Technology Transfer publications
'Pro Design. Manual for Phosphorus Rimoval9S . and Pro s Design. Marival forguspen ed Solids-PernaO1.96 -0
hd for 6H "adjUstment may vary iiurnalW. n one case it ,:val found that an alkalinity-
occurred daily. only tor several hours at e peak nitrogen load condition At other,ufficient alkalinity was available., This -ondition caused a eyelid vifiation 'in pH. In
situations where diurnal vanation ii9..the p1-1: epression may he eng,otintered, continuousmonitoring` of pH for the purpose of dinitriolling.chelnical addition:Seenii justified. In
the case oft suspended growth system operated the; plug flow mode, prObes may be-- positioned at several points in the aeration tg,;asin, with aavisiOn for addition df chemical at
several points.62 'In the ease of- attached gi-owth sytems and suspended. growth systems-operated in the complete mix knode, effluent monitoring of al woul. be the.usual choicefor controlling chemiCal additithi to' the Influent. .
4.9.2 Effect of Aeration /lethod on Chemical Requirement's
The .type of oxygen transfer device, chosen can have, a marked 'effect bn the chemical dose'required for pH control. As an example, the differences between coarse bubble and finebubble air diffusion systems will be examined.. -The following equation froM bicarbonate-carbonic acid equilibrium is useful for estimating the pH level in aeration tanks:
' (H2 ay. pH =4.5IC log
(HCO-3)
At 20 C, the value of pK I is approximately 6.38. In using the equation; the alkalinity in theaeration tank can be used to estimate the bicarbonate-level (HC0j) and the value usedshould reflect any alkalinity, depletion resulting from nitrification. The level of H2CO3(carbon dibxide in solution) care, be estimated froin Henry's Law as follows:
(3.79)
C =HPeq gas
where: Ceqconcentration of gas dissolved in liquid at equilibrium, mg/1,
H = Henry's Law constant, mg /I /atmosphere
partial p eSsure of gas in equilibrium wit ithe liquid,atmosp ere
4-86- 1 98
(4-30)

The Henry's law constant' for carbon di, idat 20 C is 1688 ingil/atmosphere. To establishCeq for use in Equation 3-9, the ley et of . arboln 'dioxide int the .aeration air must beestimated. In unpollUted astmospherit a. the partial pressure of .carbon dioxide is onlyabOnt 0.0003 atm. However in aeration carbon dioxide is generated from the oxidationof organics and from nitrification. For the ix of organics in municipal wastewaters, aboutone mole of carbon dioxide i& produced Per mole of oxygen consumed. Similarly for.nitrification, about one mole of carbon dioxide is produced per mole of oxygen consumed( f. Section 3.2.2)! On a weight basis, for eve ry lb of oXygen consumed about 1.38 lb ofcar ipxide is 'produced. Equations ',3-9 and 4-30 can 'be solved simultaneously to -IIdetermine the amount of dissolved Carbon 'dioxide in the liquid and the amount present inthega&as well as the process operating pH. '
Tile following examplesis illustrative of the Procedure. Assume a residual'alkalinity of 150mg/1 as CatO3L (3 x 10,3 moles/liter of HCO3) and an .,,oxygen transfer efficiency of 12percent u4,der standard conditions. Equation 4-29 would indicate that 725 cu ft/lb BOD5'+NOD is reqUired. Assume .also that the example conditions given in Section 4.8.3 are used,namely 'that 13,830 lb of oxygen demand are contained in 10 million gallons of Wastewater;this alloWs the calculation that 1 ,lb of oxygen demand is contained in 725 gklOns.Therefore the aeration rate. is 1 cu ft/gal of wastewater nitrified (725 cu ft/725 gal)..Asstiming a pH of 7.1 (by trial and error), Equation 3,9 allowi.calculation.of the disstedcarbon dioxide concentration, and for this case it is found to be 25 mg/l. TherefOre ati thisconcentration, 725 gallOns contain 0.15 lb of carbon 'dioxide (CO2) of the total.evOlyed(1.38 .1b of CO2 evolved/lb, of oxygen). Equation. 4-30 allows calculation of the partial.pressure of CO2 in the off gases; thecalculated result is 0.0149 atm. This concentiarion,Plus the volume of gas required allows .calculation that the zas.containg 1.23 lb: of Carbon
' dioxide. The total is then 1..38 lb which checks with the expected result. If the total had notbeen 1:38 lb, -a new pH value leyel yi/ould be assumed and the procedure tried again until abalance is obtained. '
.
Table 4-21 presents the results :for: a number of oxygen transfer effiCien values, using theprocedure outlined above. The trend& shown are valid fof municipal wastewaters, althoughthe absOlute value. of the p1-1 may differ, sjightly from those indiCate,d due to variation fromthe assumed conditions. r'Examining' Table 4-21, it can be seen, that fine bubble diffuser systems, at high oxygen;transfer efficiency, will operate at lower operating)* levelS than coarse bubble diffusers'
' operated at lower oxygen transfer effi'ciencieslIf the same operating pH is to bemaintained, this will tranAate into higher chemical doses for fine bubble aeration systems.For instance, Table 4-21 shows that if the residual alkalinity is 100 itg/1, a pH of 7.0 can bemaintained with a .coarse bubble aeration system rated at 9 percent efficiency understandard conditions. For a comparable fine bubble -systeM rated at 18 percent ,,understandard- conditions, the residual alkalinity would have' to be raised to 150 mg/1 as CaCOmaintain .the pH at 7.0: This would require an extra lime dose of at least 28 mg/1 as CaO. .
.
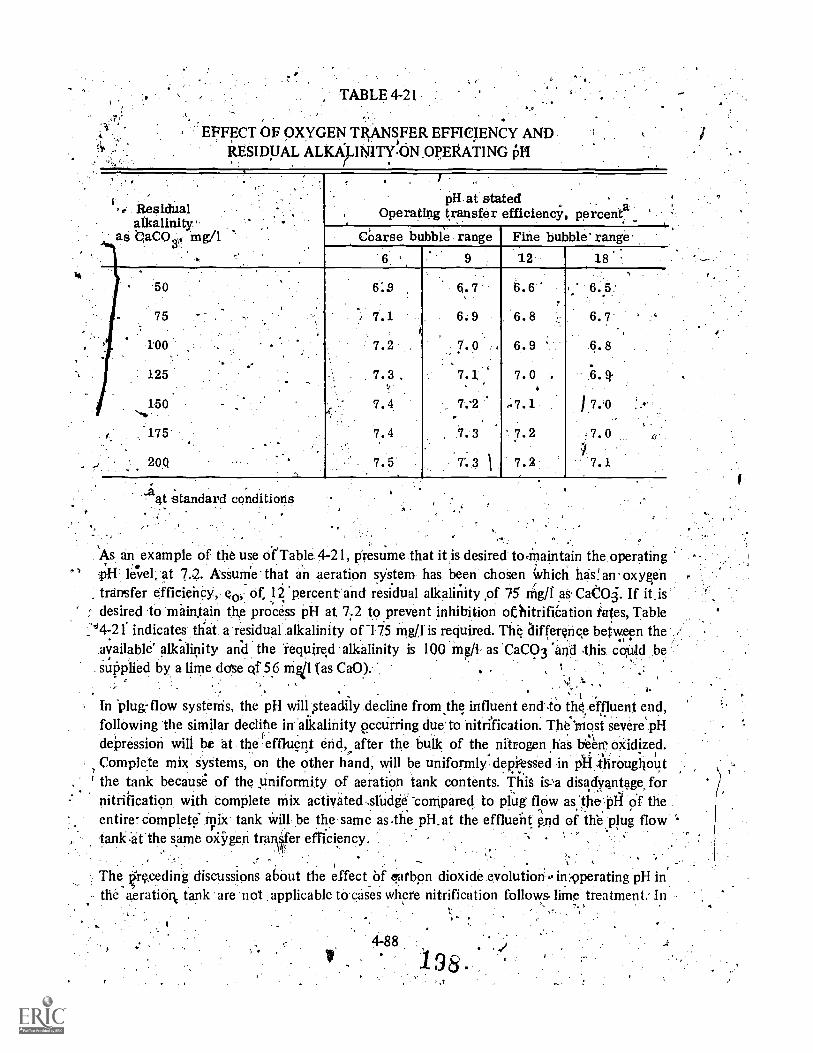
D41
TABLE 4-21
EFFECT OF OXYGEN TRANSFER EFFICIENCY ANDRESIDUAL ALKAIII4ITY.#ON OITRATING ISH
I
Residualalkalinity.
as CaCO 3,, mg/1
pH at statedOperating transfer efficiency, .percents -
Coarse bubble range6 9
Fine bubble' range.12 18
50
75
100
125
150.
.175'
20Q
6:9
7.1
7.2
7.3
7.4
7.4
7.5`
8.7
6.9
7.0
7.2
7.3
7". 3 I
6.6
6.8
6.9
7.0
7.1 1 7.0
6.7
6.8
6. g-
7.2
7.2
7.0
7.1
at standard conditions
As an example of the use Of'Table 4-21, Presume that it is desired to,- maintain the operatingle'vel, at 7.2. Assume that an aeration system has been chosen which has! an oxygen
transfer efficiency,: eo,. of, 12 percent: and residual alkalinity of 75 rtligg as CaCO3. If it.isdesired to maintain the process pH at 7,.2 to prevent inhibition of itrifieation fates, Table
'4-21. indicates that a residual alkalinity of-175 ingit is required. The aitTerOge between theavailable' alkalinity and the required alkalinity is 100 mg/1 as 'CaCO3 .and this could besupplied by a lime dose of SG mg41 tas Ca0). . ' ,
t
In Plug,7flow systerns, the pH will, teadily decline from.the influent end to the effluent end,following the similar dedifie in alkalinity occumng due.to nitrification. The 'most severe pHdepression will be at the effluent end, after the bulk of the nitrogen has Veen', oxidized.Complete mix Systems, 'on the other hand, will be uniformly .depessed in IA ilirOughout
' the tank because of the uniformity of aeration tank contents. This is:.a disadVantage, fornitrification with complete mix activated,srudge"-coMpared to plug flOw. as;the..014 of theentire! complete Tix tank will be the same as the pHsat the effluent end of the-plug flowtank:at the same oZ5/gen traper efficiency.
The 6regeding discuSsions about the effect of earbon dioxide.evolutioh,in;cperating pH in.
.. the aeration tank are not .applicable to cases where nitrification follows. him. treatment: Int
4-88
198.. .

these cases, the carbon dioxide that is evolved is used in recarhonation reactions and very,
little enters the aeration air (c.f. Section 4.11)..3
4.10 Solids-Liquid' Separation
. In all pe ded growth systems and in most attached growth systems, the nitrification stage
m s be fo owed with a solid's removal stage.lecause of the complexity of the solids-liquidsep tion problem, full coilideration-p4nnOt be.given to it within the scope of this manual.
:Rathe a brief review of the problem is given with reference to the pertinent literattire.
.t
In some attached growth nitrification sYstems, multtrhedia filtration is provided followingthe nitrification stage as theolevel of effluent. solids is low.,Design criteria for multimedia
filtration ;are presented in the EPA Technology Transfer Publkation, Wastewater.Filtrati6n,Design Considerations.97 General design criteria for secondary sedimentation as well asmultimedia filtration applicable to nitrification processes are presented in the, Process DeSign
Manual for Upgrading Existing Wastewater Treatment Platzts.25
In suSpended growth systems, there is a strong interrelationship between operation of thesecondary clarifier ail operation of the aeration basin. The degree to which the returnsludge can, be thickened will ..affect. .the allowable mixed liquor in the aeration tank and,;
therefore the size of the aeration tank. Dick and coworkers have presented designrelationships which are useful for' analyzing clarifier-aeration tank interactions.98,99,100.
, . . ., .
Consi eration of several factors is required when designing secondary sedimentation tanks:
Mech lcal design of the tarti is veiny important Inlet turbulence must not upset the tank;an ene gy dissipating inlet VI6A serves- the purposes of distributing the flow equally acrossthe., tank and ofproviding for some mild tufbuleribe to help aggregate the 'fine13. divided
solids into 'floc yid increase the separation efficiency. Efflnent launders must --be sized. and
placed so that rrents are not created that will upset the, tank and cause short-circniting of
the solids to the effluent. The tank must also have sufficient depth to allOw a sludge blanket
to forth under all conditiOns,''' especially under 'those conditions, which occur when thesystem operation is limited . by the ability td oPtain a specific return activated sludgeconcentration. Overflow rates must not be so great that sludge is uspended in the "upflow"and carried over the .weir's: Lastly, the sludge must be quickly removed from the tank tominimize the.dcurrence and durailon of anoxic (zero DO) conditions..
The ifature of the biological solids developed, in suspended growth systems plays an, important role in the operation and design of the Secondary sedimentation. tank. First, theabiKy of the mixed liquor to be clarified will affect the size of the required sedimentationtank .;This property is dependent on the extent of.difsorson.of,ihe biological solids: If alarge proportion of ,the biological solids are finely div6ed, the separation efficiency of £hesesolids will be poor. If, however, only small portions of the biologiCal solids are Aspersed
the bulk is incorporated into floc, the geparatiOn efficiency of the mixed liquor should behigh.° Consolidation of the small dispersed particle& into the large floc to improve effluent
4-89 ,
1:9 9
clarity can be encouraged by a number of techniques. Chemical coagulation of the dispersedsolids has been successfully employed to enhance the flocculation of biological' solids.101"Physical conditioning of the activated sludge floe-prior-to secondary sedimentation is ,
another technique which can be used with or without chemicals It has been found that byincorporating mild turbulence beweeen the oxidation tank and he secondary sedimentationtank, effluent clarificalion can be enhanced 102 Mild vturbi1en6e can be conveniently;accomplished by using mild .aeration in transfer -chanliels ands by ,inedrporating energydgsipating inlet wells in circulal secondary sedimentation tanks.
Die thickening qualities of the sludge will determine the required area for sludge thickening4.the tank,dependingt on the desired or optimal MLSS or Return Activated Sludge l'Z.AS)els. The limiting design consideration for thickening is usually at peak wet weather how'
(PWWF),. for it is under these conditions that the solids loading on the secondary sedimenttion.tanks are the greatest. Secondary sedimentation tanks must be sized such that mNkdliquor solids are 'not lost in the effluent ;diving PWWF conditiOns. IPOlymer feed facilities'are appropriate to allow short-term polymer dosing duting wet weak.'Peak load conditions toenhance the thickening qualities of the sludge.
Thickening qualities' will decrease and sedimentation tank area requirements will increaseWhen wastewater temperatures decline/Figures 4-25 and 4-26 show the effect of
;temperature on,three.different oxygen activated sludges and the temperature trends wouldbe expected to be similar for air activated sludges. In sedimentation tank design, solidsloadings shbuld reflect the minimum wastewater temperatures expected. When temperaturesdecline the mixed liquor levels that can It maintained under aeration also decline due to Thedecreased level of thickening that can be obtained in the sedimentation tank.
Rising sludge caused by denitrification in secondary clarifiers has occasionally plaguedAitrification.4erations, Deniirification occurs becausithe organisms in the biological sludgein the secondary clarifier can utilize nitrate and nitrite. as electron acceptors to oxidizeorganic compounds in the sludge layer. The formation of bubbles from nitrogen gas evolved
! .ty, in .denitrification and;other gasses, such as carbon dioxide, can then cause flotation. Early ,
experimental work by Sawyer and BradneyM4 and subsequent experimental and theoretical. , work by Clayfield .10 have identified the important parameters affecting denitrification. A
factor of foremost importance is the presence oiladequate quantities of nitrites or nitrates inthe wastewater to cause bubble formation. In essence, the dissolved gases in the wastewater
" (nitrI !en; 'carbon dioxide, and oxygen) must be in sufficient concentration so that the sumof their pSawyer and Bradn work, as little as 4-6 mg/1 of nitrate-N nitrite-N would cause
.flotation in a gradyatid cylinder, while Clayfield found that 1_6- mg/I :nitrate-N wereneeded to cause flo an in full scale sedimentation tanks. Differences between estiga-
dions are in part due to the greater liquid pressures in deep Sedimentation tanks compared to:graduated cylinders and may also re'flect 'differing .levels of concentration Of other gases,such as carbon diOxide. '
.
ressures equals or exceeds the ambient liquid pres§ure. In the case of'.
-o2uO.j
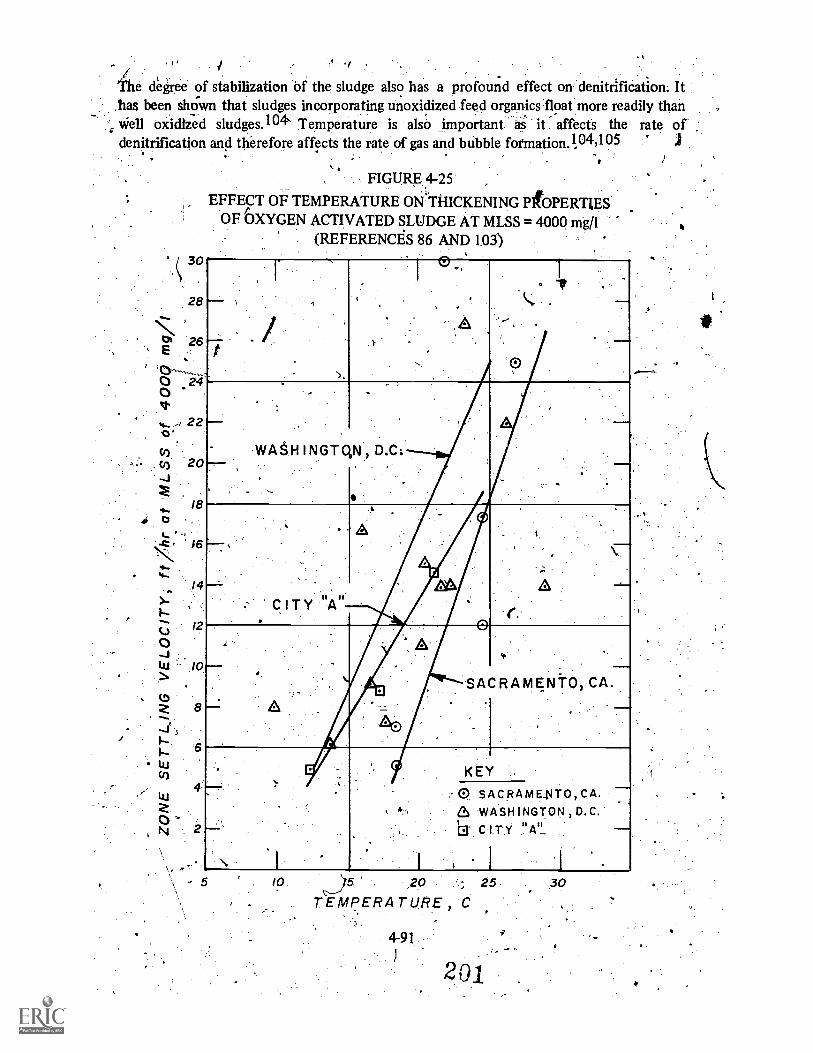
.1, i :4 .,/The degree of stabilization Of the sludge also has a' profound effect on denitrification, It :has been shown that sludges incorporating unoxidized feed organics :float.more readily thanwell oxidized sludges.104 Temperature is also important as it affects the rate of
."denitrification and therefore affects the rate of gas and bubble formation, 104,105 j. ,
30
28
Xto 26E
o 240
2 20(1)cn 20
FIGURE 4-25
EFFECT OF TEMPERATURE ONTHICKENING PROPERTIESOF OXYGEN ACTIVATED SLUDGE AT MLSS = 4000 mg/1
(REFERENCES 86. AND 1.03)
WASH INGICIN, D.C:
, A
se-
14
/2CJ0
10
0
- 5
. h.
Lucry
0p -
N
S A CRAMENtO C
KEY
SACRAMENTO, CA.
6 WASHINGTON, D.C.$
CITY n A_
1
5 . 10 d5 _20
TEMPERATURE, C
491)
2 5 .
201
30

FIGURE 4-26
EFFECT oF.TEMPERATURE ON THICKENING PROPERTIES.Ot' OXYGEN ACTIVATED SLUDGE AT MLSS 7000 mg/1
1 ; (REFERENCES 86 AND 103)14
CtE-
.00ti
M.
rrCvJ
KEY: I .. I
O SACRAMENTO., CA,"7.?:i. WASHINGTON , D.C.
,CITYo "A"4
0
WASHINGTON,
O
CITY "Au
SACRAMENTO, C
10 15 20 25
T EMPERATURE , C
to following conclusions can be diawn about ,denitiification in secondary clarifiers, basedOn work done to date:33, 104,105 (1) Rapid sludge removal can prevent sufficient' timebeing available for nitrogen bubble formation; (2) sludges with low SVI values are, preferable
and sludges willform a flcylinders, bubbleslaboratory will fn oa0.faster in, the
as they c'an be ,withdrawn faster; (3) since the greatersaturation level of nitrogen is eater in deeptanks than
30
4-92'
than in' the re CI 1.\' laboratory field; the is a inimum concentration of _/1 _trate mitrogen belowwhich' there is insufficient nitrogen to cause flotation. In weak wastewaters- or for those,plants in which nitrification is suppressed, sludge flotation will not Occur; (5) a drop.intemperature will reduce denitrification rates, and may render rising.sludge a problem only
der .warm conditions; (6) an eqUivalent amount of nitrite will Traduce flotation fasterth nitrate, becaute- denitrification is more rapid when nitrite serves,,as the electronacceptor rather than nitiate;'(.7) a sludge with low activity, or low rate of denitpilcaticnishould be less susceptible to frOtation. Sludge activity 'will :Vary among the ,types` Of-suSpended growth processes. For instance, separate.. stage nitrification. sludge is lestsusceptible to flotation than combined carbon oxidation-nitrification sludges due to the low
*c \loading on the former process and resUltant lower aclirty with respect to carbonox atign and denitrificationAn 'sedimentation tanks. Among mbined carbon oxidatiOn-,nitrification alternatives: the contact stabilization and_step aeration alternatives are most
N susceptible to sludge flotation due to 'the enhanced possibility in .those modifications ofinfluent organics being incorporated into. the mixed liquor without being oxidized prior tothe clarification step: To a le;sser jlegree, complete mix systems are also prone to sludgeflotation for\ the same reason.'
Control measures for preventing floating sludge should be incorporated into the initial plantdesign. PrAsion of rapid sludge 'removal (vacuum pickup type) idsedimenotation tankdesign can prevent there:being sufficient contact tiMe for bubble formation to occur andcause 'flotation. Flexibility in influent, feed points (e.g.; allowing` switching from stepaeration to plug flow in warm weather periods) can prOvide the operator with .options inprocess operation that allow him to getout of difficult operating situations. Provision, fir
chlorination 9f the return activated sludge is recommended ,.fOr all, suspended growthapplication& Recent work done in California' has shown that continuous' ,low .:dose -
chlorination can be used for: controlling sludge bulking aml teducing the sludg 4volumeindex, apparently, without impairing nitrification (See Section 4.5.1159 This allows morerapid sludge withdrawal froM the sedirnentation tanks...When nitrification is not reqUired,hiiher doses. of chlorine can be used to suppress nitrification and thus avoid flotation.Overdosing chlorine on a shig dose or continuous dose basiS should, be.avoided, however, asit an causeincreases in,pie level of organics in.the prneesS effluent 104°
Coritxol of' solids retentiOn time to values% belOw that which will support nitrification has-been a procedure that has been occasionally recommended for cases where nitrificationisnot required and sludge flotation is to be preVented. However, when the DO level. or pH isnot limiting the nitrification rate, nitrification will proceed atiolids detention tiMes as lowas 1.50 days at temperatures equal to or greater than 20 C (Section 3.2.5A). This render'sthe control of nitrification impractical with solids retention time control in warm weather asstable operation ,at spch a loW value for the solids retention time would not be possible. Itmay be possible to supprest nitrification through control of DO to levels <0.5 mg/1 andthereby limit the nitrifier, growth rate to levelshich--result in washout of the-nitrifyingorganiSrns, but this will require accurate around-the-clock control of DO, Further,maintenance of low DO. can cause anothir operational problem, sludge bulking.
4 -93200 3
4.1.1'Considerations for Process Selection
In selecting nitrification as the process for ammonia removal, two kinds of comparisons canbe Made. First, The process can be compared to the physical-chemical alternkives. Second,alternative nitrifickion processes can be ,compared. It is emphasized that no singlealternative will be the best choice for all situations.
4.11.1 CoMpariion to"Physical-Chemical Alternatives
Several facto =dictate the choice between biological and physical-chemical techniques forammonia removal. Cost is. often the Single most influential factor in process choice.Ammonia removal via the nitrification p\rocess is widely re'cognized to be the 4east costlyammonia removal alternative. Unless phosphorus removal is also required, the combinedcost, of lime precipitation-air stripping is normally greater than the cost for nitrification.Likeivise, breakpoint chlorination and ion exchange are normally. more costly thannitrification.19§.
In the majority of situations existing ficilities are utilized when treatment is upgraded,rather thar, construction of wholly new facilities. l'he layout of the existing facility may bemore adaptable to one specific alternative Of another, In many-Instances, it has been foundthat biological nitrification has been the process most easily incorporated'into the uPgradedtreatment system.
Very low temperature operation ( < 1(1'x.) may favor a physical-chemical process ratherthan a biological process as reaction rates become very loW, requiring very late reactors.Physical chemical'processes are also affected by low temperatures, but to a lesser degree.
. .
The presence of compounds toxic to nitrifiers may also dictate against the choice ofnitrification. Some,toxicants are resistant (e.g., nonbiodegradable solvents) to most forms ofprettrekirient. Unless 'a very effective Source control program can be iMplemented for thesecompounds', depand e operation of nitrification may become impractical.
4.11.2 Choice Among Alternative °Islitrificatior) Systeins
All of the factors described in Section 4.11.1 are also factors to be considered In selectionamong nitrification systems. Other factors affecting choice among nitrification alternativesare summarized in. Table .4-22 as a guide for. Process selection. Each of these factors ISconsidered earlier m this chapter.
Higher effluent ammonia (1-3 mg/1) in the attached growth effluents than suspended growtheffluent is cited as a disadvantage of attached growth systems in Table 4-22. HoweVer,
breakpoint chldiinatior is easily appended to attached growth systems, as the chlorine dosefor breakpoint is loit( < 0 mg/I). The addition of breakpoint chlorination putOttachedgrowth Systems on an equ Footing with suspended growth systems with respect td ammoniacontrol.
494204
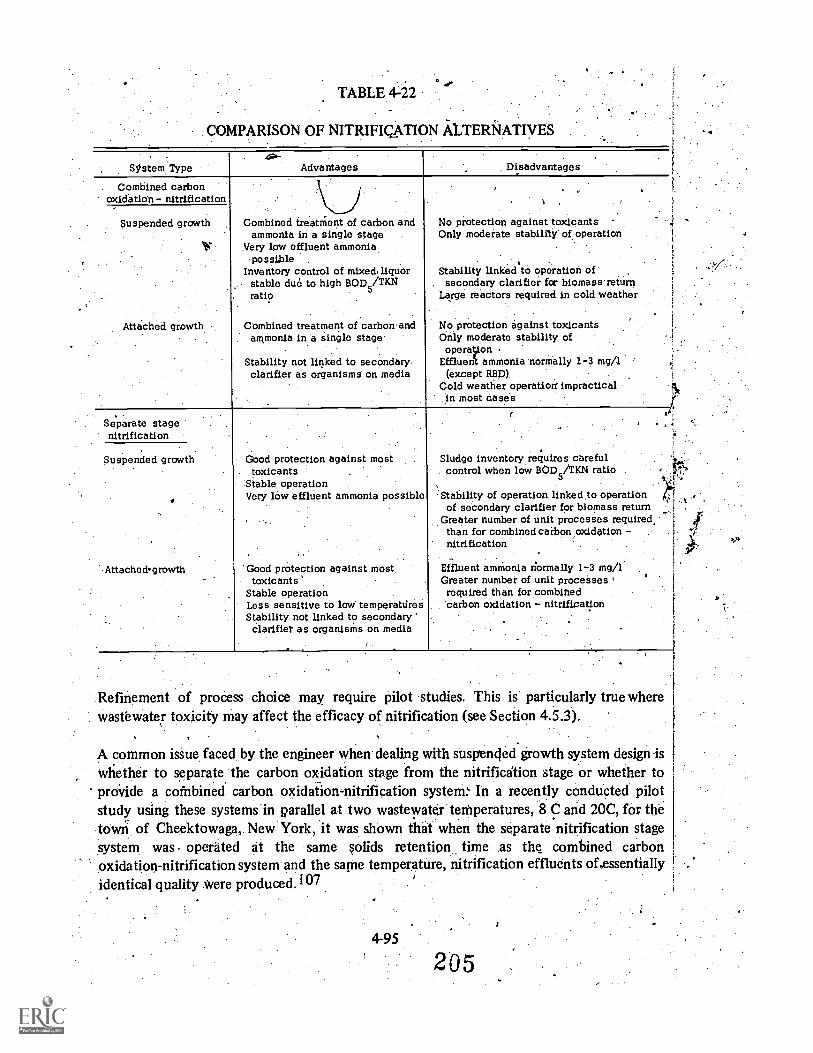
TABLE 4-22
COMPARISON OF NITRIFICATION ALTERNATIVES
System Type Advantages Disadvantages
Combined carbonoxidation - nitrification
Suspended growth
Attached growth
Combined treatment of carbon andammonia in a .single stage .
Very low effluent ammoniapossible
Inventory control of mixed,liquOrstable due to high BOD
5/TKN
ratio
Combined treatment of carbon andan in a single stage
Stability not linked to secondaryclarifier as organisms on media
No protection against toxicants.Only moderate stability of operation
Stability linked to operation of. secondary clarifier fcc biomassreturn
Large reactors required in cold weather
No protection against toxicantsOnly moderate stability ofoperlion
Effluent ammonia normally 1-3 mg/1(except RBD)
Cold weather operation' impracticalin most cases
Separate stagenitrification
Suspended growth
Attachedgrowth
Good protection against mosttoxicants
Stable operationVery law effluent ammonia possible
'Good protection against most,toxicants
Stable operationLess sensitive to low temperaturesStability not linked to secondaryclarifier as organisms on media
Sludge inventory requires carefulcontrol when low BODc/TKN ratio
Stability of operation linked to operationof secondary clarifier for biomass return
Greater number of unit processes required,than for combined carbon oxidation -nitrification
Effluent ammonia normally 1-3 mg/1Greater number of unit processes
required than for combinedcarbon oxidation - nitrification
yv
Refinement of proCess choice may require pilot studies. This is particularly true wherewastewater toxicity may affect the efficacy of nitrification (see Section 4.5.3).
A common issue faced by the engineer when dealing with susgencled growth system design iswhether to separate the carbon oxidation stage from the nitrification stage or whether toprovide a coenbined carbon oxidation-nitrification system: In a recently conducted pilotstudy using these systems'in parallel at two wastewater temperatures, 8 C and 20C, for thetown of Cheektowaga, New York, it was shown that when the separate nitrification stagesystem: was operated at the same solids retention time as the combined carbonoxidation-nitrification system and the same temperature, nitrification effluents of,essentiallyidentical quality were produced. I07
4-95
205

The investigators concluded that. in most cas8s c o bined carbon-oxidation nitrificationsystem should be chOsen for the following real
1. Use of the biolOgical solid's retention time co cept,aflid controlled sludge wasting makethe .combined carbon, oxiditrification system as controllable as a two stagesuspended', grOwth system. The. investigato did' not agree with the often statedconcept that separating the stages leads t more positive control of the carbonoxidation and nitrification functions, as their experimental study demonstrated qiiitethe opposite.
. The use of combined carbon oxidation-nitrifica on results in lower sludge quantities tobe wasted than in a two stage suspended grow system. This is because the first stage(carbon oxidation) operates at a low solids re ention time (say Oc = 2 days) whichresults in less solids destruction than when 10 or 20 days are'used in 'the combinedcarbon oXidation-nitrification system. This ph nomenon has also been observed by .
1others. 08,109
3. The longer sludge retention times employed in separate stage nitrification systems ( Oc= 1.0 to 20 days) results in improved sludge settling characteristics as compared to.highrate activated sludge systems (a,
c 2 days).
4. A two stage suspended grow4system appears to be more prone to control problemsrelating to sludge inventory control. The separate stage reactor's sludge inventory mustbe maintained by shifting inventory from the first stage, or by some other means(Segtion 4.5:2). Further, two sets of sedimentation tanks are required. Sedimentationtanks are often the most vulnerable components of the activated sludge system. "Thusit is 'difficult to envision that the path,. to increased contr011ability of nitrifyingactivated sludge should lead to a doubling of the least stable element in the processcifiguration, i.e.; the clarifier. Rather, if a two stage nitrification system is required, itawpears more reasonable to explore the capabilities of a fixed film nitrificationreactor : . ."107
.
5. Toxicants affecting nitrifiers present in the raw sewage or primary effluent are oftencited as a reason to provide a nigh rate activated sludge effluent to act as a toxicantremoval step ahead of a separate stage nitrification unit. First, a detailed evaluationmay show that in fact toxicity is not a problem. "Secondly, toxic materials mightbetter be excluded from wastewater systems by regulation rather than relying on
biosystems to protect the nitrifying 'capability of the system. Thirdly, inmost cases it may become attractive to remove phosphorus in 'primary treatment bythe addition of coagulants."107
These conclusions are presented in this manual as an excellent basis for consideration of thereasons for procesS selection. In many cases effective counter argumentscan be presented.In the last analysis, the process photee must be made by, the local agency and its engineering
4-'96
206
4'consultant.or staff. As an example, Counter-arguments are listed in the same order as theargtiments previously' Presented: .
407
The parallel study of carbon dxidatiod-nitrification and t*o sludge Systems atCheektowaga was based primarily on municipal sewage, with only 10 percent industrialload.101 Situations do exist *here significant industrial contributors of organic loadare tributary to the municipal syStem. For instance, seasonal canning industriestributary to. California municipalities treatment planti in-some instances cause 3 to .4times the non anning season organic load at the peak of the canning season. Further,industrial w e production may vary from year to year:depending on factors beyondcontrol or Ccurate prediction. In the face. of this unpredictable variation it may bedifficult or uneconomic to design a system for combined carbon oxidation-nitrificationdue to the sensitivity of nitrification to solids retention time. Less difficultIF isexperienced in designing for high rate activated sludge in a two stage system, asproduction of effluent of a quality suitable for -separate stage nitrification is not assensitive to load or solids retention time as is nitrification.
The -phenomenon of lower sludge prodUction from a two stage. suspended grOwthsystem compared to a combined carbon oxidation-nitrification system is, wellestablished and cannot be contested. However, from an energy standpoint, thegpreater sludge production from the two stage system may be an 'advantage for two
.:reasons. First, the lower sludge production of the combined- carbon oxidation-nitrification system is obtained at the expense of:greater power tellitireMents becausegreater amounts of oxygen must be supplied for the oxidation of solids. Second, ifanaerobic digestion is employed and the .gas recovered for useful energy purposes, lessenergy is.available froM the digestion process when less solids are produced. However,theSe two factors may be outweighed by the increased cost of ultimate disposal insome cases.
It has 'occasionally been found that the longer solids retention times (10 to 20 days)also result in sludge settling difficulties.
4. With careful monitoring, the separate nitrification stagits inventorysrequireinents canbi managed. In some situations where industries are tributary, the inventory contrplproblem may be easier with a two stage system (see counter-argument 1 above).'
Two sets of sedimentation tanks do present more control requirements than one set.However, if the conditions for tank upset are present when two sets are provided, theyalso can be present for one set. Careful control, of sedimentation tank operation ismandatory in either case.
J5. In the ease of the parallel study at Cheektowaga, there was no evidence of significant
toxicants in the primarily domestic sewage processed.107 Pserhaps, it is natural todiscount the difficulty in dealing with this problem
4-97
207
The Unfortunate aspect of the presence of toxicity in waStewater, that it is oftenenhemeral in plature; it's there and then it's gone. Toxicants dischargeb, on a
Jr,
continuqus basis are handled with relative ease compared to the occasional dump.Unless the problem is recognized in its earliest stage, the causative agent may not evenbe sampled.'by plant personnel, rendering it impossible to trace. Even if a sample is
(caught, tracing it back through the system is not always possible until the nextoccurrenle: Another aspect of the Problem is that the clumps offer no opportunity forthe lgojilass to adapt to the toxicant, whereas, if it were continuously present.,adapta0on of the nitrifiers inight be possible(see Section,3.2.9).
In cases where toxicants are occasionally present, the issue boils down to the need for..Plant reliability. In cases of discharge to an estuary or groundwater where mixing in theenvironment, causes' dilution of the effluent,. occasional process failures may beaccepted, However, where stringent regulatory requirements exist or where the water isreused and the water user demands the consistent performance expected of a waterutility, some coMpensation must be made to handle the problem of toxic upsets. Thismay be 'done by any number of means, one of which is to proyide pretreatment viachemical addition oic-by a biological treatment stage(SeCtion 4.53): Another is toprovide supplemental 'breakpoint chldrination at :the end of the system. The cost of thelatter facility is very much affected by the degree of upset in nitrification expected.
a)In the last analySis, the parallel study at Cheektowaga showed that :combined carbonoxidation-nitrification could : be just as reliable as separate stage nitrification at lowtemperatures (R C) with a .primarily donieitic wastewater.' 07 The study provides furtherproof dispellini the poor reputation that the combined carbon oxidation-nitrification-system has acquired in the U.S. Its wide' application in England where it is coupled with atoxicity source control program offersiditional testimony to the efficacy of 'the process.
Similar lengthy discussions, could be prepared. which present the pros and cons of othersystems: e.g., rotating bi`ological ,discs versus plastic media trickling filters. Thesecomparisons, not only are 15*.ond the scope of this; manual but would not have generalvalidity. It is a haiardous ta to make such ary attempt as the specifics of individualcircumstances affect the decisio to a large degree. There is no universally best nitrificationapproach.' Rather, the brOad vane 'of alternatives should be viewed as a positive situation.The fact that there are many altematves makes the task of adapting nitrification into wastetreatment easier, not harder. A myriad f flowsheets incorporating nitrification are not onlypossible, but economically feasible and 'th proper design and operation, quite reliable.
4-98
208

4.12 12)eferences
1. Mulbarger, M.C. , The Three Sludge System for Nitrogen .and -Pliosphbrus Removal,Presented' at the '44th Annual Conference of the Water Pollutidn Control Federation,San Francisco; California, October, 1971.
2. City of Log Angeles, California;_ Hyperion Tiecitinent Plant ,West Battery Operating'Reports. January through March, 1969.
,
3. Horstkotte, G.A., Niles, D.G., Parker, D.S., and D.H. CaldWell,Full-Scale Testing of aWater Reclamation System...JWPCF , 46, No 1, pp 181-197 (104).
4. 'Weddle, C.L., Niles, D.G.; Goldman, E., and J.W. Porter; Studies of. MunicipalWastewater Renovation forIndustrial Water. Presented at the 44th 'Annual Conferenceof the Water Pollution, Control Federation, San Francisco, California,' October, 1971.
t :
. Loftin; Annual RepOrt, Livermore Water Reclamation plant, 1970. City of. Livermore, California, March, 1971. ,
6. Beckman, W.J.,' Avendt,.R.J., Mulligan, T.J., and G.J. Kehrberger, Combined CarbonOxidation-Nitrification. JWPCF, 44, No. 10, pp 19164931 (1972).
.
. Stamberg, J.B., Hais, A.B., Bishop, D.F., and IA: Heidman, Nitrification in OxygenActivated Stodge. Unpublished paper, Environmental Protection Agency, 1974.
8. ,,Heidman, J.A., An Experimental Evaluation of Oxygen and Air Activated SludgeNitrification Systems With and Without pH Control. EPA report for Contract No. ,
68-03-0349, 1975.
9. County Sanitation Districts of Los Angeles County, Monthly Operating Reports,Whittier Narrows Water Reclamation Plant. April; 1973 to March, 1974.
10. Greene, R.A., Complete Nitrification' by Single Stage Activated, Sludge. Presented atthe 46th Annual Conference of the Water 'Pollution COntrol Federation, Cleveland,Ohio, October, 1973. .
11. Newton, p., and T.E. Wilson, Oxygen 'Nitrification Process at Tampa: In 401/cationsof. Commercial Oxygen Water and Wastewater Systems, Ed. by. R.E. Speece and J.F.Malena, Jr., Austin, Tvcw The Center for Research in. Water Resources, 1973.
12. Tenney, M.W., and.W.F. tchelberger, Removal of Organic and Eutrophying Pollutantsby Chemical-Biological Treatment. Prepared for the EPA, Report No. R2-72-076(NTIS PB-214628), April,- 1972.
499 20

13. Black, S.A., Lime Treatment for Phosphorus Removal at the New Market /EastGwlllimbury WPCF. Paper No W3032, Ontario Ministry of the Eniiiionment, Research,Brarich,.May, 1972.
J 14. Schwer, A.D., Letter communication to.D.S. Parker Metropolitan Sewer District ofGreater Cincinnati, March 9, 1971.
15. Barth, E.F,, Brenner, R.C., and R.F; Lewis, Chemical- Biological Control of Nitrogen inWastewater Effluent. JWPCF, 40, No 12, pp 2040 2054'(1968).
16. Rimer, A.E°., and R.L. Woodward, Two Stage A ctivated Sludge Pilot Plant Operatiohs,FitChburg, Massachusetts. JWPCF, 44, No 1, pp 101-116 (1972).
17. Wild, H.E:, Jr., Letter'- communication to D.S. Parker. Briley, Wild and 7ssociates,.Orniond Beach, Florida, September 9,.1974.
18. Union Carbide Corportion, "UNOX" System-Study at Town of Amherst, New York. .1972..
19. Linstedt, K.D., and. E.R. Benneq, Evaluation of Treatment for Urban WastemiaterReusp. Report PrePared for tie Environmental. Protection Agency, EPA-R2-73-122,July, 1973.
20. Linstedt, K.D., Letter communication tcyD.S. Parker. University of Colorado, Boulder,Colorado, August 5, 1974.
're'q
21. Stenquist, R.J., Parker, D.S., and T.J. Dosh, 91112on OxidationrNitrification InSynthetio Media Trickling Filters. JWPCF, 46, No. 10, pp-2327-2339 (1974)..
22. Duddles; G.A., Richardson, S.E., and E.F. Barth, Plastic Medium Trickling Filters forBiological Nitrogen' Control. JWPCF, 46, No:5, pp 937-946 (1974).
23. McHarness, D.D.,, Haug, R.T., and P.L. McCarty, Field Studies of Nitrification withSubmerged Filters. JWPCF, 47, No. 2, Pp 291-309(1975):
24. McHarness,.D.D., and 13,L. McCarty, Field Study of Nitrification with SubmergedFilter. Report prepared for the EPA, EPA -R2 -73 -158, Februay,.1973.
-1.25. Process Design Manuitlfor Upgrading Existing Wastewater Treatment Plants. U.S. EPA,
Office of. Technology TranSfer,.Washington, D.C. (1974).
26. Richardson, S.E., Pilot Plants Define. Parameters for Plastic Media Tricklin FilterNitrification. Presented at .the 46th Annual Conference of the Water Pollution ControlFederation, Cleveland, Ohio, October, 1973,
4-100 ,
2-1 0

27. Sampayo, Felix F., The Use, of Nitrification Towers at Lima, Ohio. Presented at theSecond Annual Conference Water Management Assotiation of Ohio, Clumbus, Ohio,' .October, 1973.
28.. Brenner, R.C., EPA Experiences in Oxygen Activated Sludge. Prepared for the EPATechnology Transfer Program, October, 1973.
29. Lawrence, A.W., and Pl. McCaity, 'Unified Basis ('or. Biological Treatment Design anckOperation. JSED, Proc. ASCE, 96(No. SA3, pp 757-778 (-1970).
30. Hanson, R.L, Walker, W.C., and 1.C. Brown,- Ilbriations in Characteristics ofWastewattr Influent at the Mason Farm Wastewater Treatment Plant, Chapel Hill, No.Carolina. Report No 13, UNC Wastewater Research Center, Chapel Hill, N.C.,FebruarY, 1971.
31. Lijklema, L, A .Model for Nitrification in the Activated Sludge Process. ESEPublication No 303, Department of Envirbnmental Sciences and .Engineering,University of Nort,t Carolina, June, 1972:
32. Poduska, R.A. and J.F. Andrews;Dynamics of Nitrification in the Activated SludgeProcess. Presented at the 29th In-dustrial WA:4e Conference, Purduepniversity,Lafayette, Indiana, May 7-9, 1974.
-*\
33. Nagel, C.A. and J.G. Haworth, Op ational Factors Affecting Nitrification in thectivated Sludge Process. Presented 'at the 42nd Annual Conference of the Water
Pollution Control Federation, Dallas, exas, October (1969), (available as'a reprintfrom the County Sanitation Districts of. Los Angeles County).
34. Murphy, K.L, and P,L. Timpany, Design and Analysis of Mxing fc;r an Aeration TankJSED, Proc. ASCE, 93, No. SA5, pp 1-15 (1967).
, .
15. Murphy, and Boyko,' I ongitudinal Mixing in Spiral Flow Aeration Tanks;JSED, Proc. ASCE, 96, No. SA2, pp 211-221 (1970).
36.. Metcalf ind Eddy, Inc., Wastewater Engineering. New York, McGrdw Hill Book Co.:1972.
37. Gujer, W. and D. Jenkins, A Nitrification Model for the Contact Stabilization,ActivatedSludge Process. Water Research, in press.
,' 38. Gujer, W. and D. Jenkint, The Contact Stabilization Process-Oxygenrand Nitrogen MassBalances. University of California,,Sanitary Engineering Resehrch Lab, SERL Report74-2, February, 1974.
21_4-101

A . t.39. Sawyer, C.N., Letter comniunicationto D.S. Parker§-January 24,;1975.
-, ....,
40...Sawyer, C.N., Activated Slusge. Oxidations, HI. Factors Involved in Pro'onging theHigh Initial Rate of Oxygen Utilization, by. Activated Sludge Mixtures. SeWage WorksJournal, 11, No 4, pp 395-606 (1939).. - ,-.
41. County Sainitation _Districts of LOs Angeles County, it Plan for. Water fieuse. Reportprepared for the members of the Boards of Directors, July, 1963.
42. - City of Jackson, Michigan, Sewage Treatment- Plcint Operating Reports. August, 1973to March, 1974. .
43. Bruce, A.M., and J.C.,Meikins, Fu ether Studies of Partial. Treatment of Sewage by HighRate Biological Filtration. Water Pollution Control (London); pp 499-527, 1973.
44. Grantham, G.R., Phelps, E.B., Calaway, \V.T., and D.L. Emerson; Progress Report .onTrickling Filter Studies. Sewage and Industrial Wastes, 22; No.' 7, pp'863-871 (1950).
45. Grantham, G.R., Trickling Filter Performance at Intermediate Loading Rates. Sewageand Industrial Wastes, 23, No. 10, pp 127-1234 (1951).
46. Burgas F.J., Gilmour, C.M., Merryfield, F., and J.K. 'Carswell, Evaluation Criteria forDeep Trickliqg filters. JWPCF, 33, No. 8, pp 787-799 (1961):
47. OsbOrn, D.E. Operating Experiences with Double Filtration in Johannesburg J. Inst.of Sew., Purif , Part 3, pp 272-281 (1965).
48. Stones, T., Investigation on,Biological Filtration at Salford. Journal of the Institute of.Sewage Purification, No 5, pp 406-417 (-1961).
49. Mohlman, F. . Norgaard, IT., Fair, GA., Fuhrman, R.E., ehlbert, Heacox, R.E.,
, ind C.C. RuchOft, Sewage Treatment at Military Installations.' Sewage Works Journal,18,110. 4, pp 789-1028 (1946).
50. HeukeIgkian, H., TO. Relationship Between Accumulation, Biochemical and BiologicalCharacteristicssof Film and Purification Capacity of a Biofilter and a Standard Filter.Sewage Works Journal, 17, No 3, pp 516-524 (14945).
51. Brown and Caldwell, . Report on Pilot Trickling Filter Studies at the Main Water QualityControl Plant. Prepared for the City of Stockon, California,. March, 1973.
'41
52. Antonie, R.L.; Three Step Biological Treattherit with the Bio-Disc Process-Presenteck atthe New York Water. Pollution "Control Association; Spring Meeting, Mantauk, NewYoik, June, 1972. ,
4-102 21 ti
53 Antonie, R.L., Nitrification and Denitrification with tlip7Bio-Sdrf Process. Presented atthe Annual Meeting of the,New England W.P.C. Associationin Kennellunkport,June 10-12, 1274.
54., Rotating BiolOgical Disk- Wastewater -Treatment ftocess ,Pilot nt Evaluation.Report by the Department of Environmental Sciences, RutgerS Univ ity, preparedfor .the. Environmental Protection Agency, Project No..17010 EBM, August, 1972.;
.55. Brown and Caldwell, Consulting:Engineers, Lime Use in Wastewater Treatment:Designand Cost Data Report submitted to the U.S. Environmental Protection Agency, 1975.
56. Procesh Design Manual for Caibon Adsorption. U.S. EPA, Office echnology
Transfer; Washington, D.C. (1974).I,
57. WainiVater, F.H. and L.L. Thatcher, Methods for Collection and Analysis of WaterSamples. GeOlogical Survey Water-Supply Paper 1454, USG110, 1960.
58. Wood, D.K. and G. Tchbanoglous, Tracy Elements in Biological Waste Treatment withSpecific Reference to the Activated Sluflge Process. Presented at the 29th IndustrialWasIe Conference, Purdue University, Mar, 1974.
59; Eisenhauer, D.L., Sieger,. R.B. and D.S. Parker, Design of an Integrated Approach toNutrient Removal. Presented at the. EED- ASCE Specialty Conference, Penn. StateUniversity, Pa., July, 1974.
60.. Environmental Quality Analysts, Ipc., Letter Repoit to Valley Community ServicesDistrict, garch, 1974.
. 61. Stens% H.D., Oases. Wastewater Characterization Study,.Chattanopga Moccasin BendWastewater Treatment Plant. Report prepared by Air Products and' Chemicals, Inc.,1975. tc
62. Sawyer, C.N., Wild, H.E., Jr., and T.C. McMahon, Nitrification. and DenitrificationFacilities, Wastewater Treatment. Prepared for the. EPA Technology Transfer Program,August, 1973..
63. Parker, D.S., Case Hisiories of Nitrification and Denitrifkation Facilities. Prepared forthe EPA.Techriology Transfer Program, May, 1974.
64. Mulbarger, M.C.; Private communication to D.H. Caldwell, 1971.
65. :Schwinn, D.E.; Treatment Plant Designed. for Anticipated Standards. Public Works,
104, No., 1., pp 54-57 (1973).
- 103213

k6. Wilson, T.E., 'and' M1D.R. Riddel, NitrOgen Removal: Where Do We Stand? Water and.
Wastes Engineering, 11, No. 10, pp 56-61 (1974).4t
Wilcox, E.A., 'an A.A. Thomas, 0,xygN,7Activated Sludge Wastewater Treatmentii.Sy.xtemS, Design eria andppebratintExperience. Prepared for the. EPA Technology;,.,Tiansfer Program, August, 1973.
.1i,Sorre LH., and Zeller, Two-Stage Trickling Filter rformance.. Sewage andIndustrial Wastes, 18,, o. 8, pp 943-954 (1956). .
59. . /Huang, C.S., Kinetics and Process Factors of NitrificatiOn On a BiOlogical FilmReactor. Thesis submitted in pa tial satisfaction of the rearrements for the degree ofDoctor', of Philosophy, Univeirsity f New York 4t Buffalo,,1973:
O
70. Williamson, I.L. and P.L. McCart A Model of Substrdte Utilization by BacterialFilms. Presented at 46th Annual fkonference of the Water Pollution ControlFederation, Cincinnat' Ohio, October, 1973.
71. Duddles, G.A. and S.E. Richardson,Applicalion of Piastic Mglia Trickling. Filters forBiological Nitrification, Report prepared for the Environmental Protection Agency,EPA R.2-73-199, June, 1973.
72. Bruce, A.M., and J.C. Merkens, Recent Stialies of High-Rate Biological Filtration.'Water Pollution Control, pp 113-148 (1970).
73. Brown and Caldviell, Report on Tertiary Treatment Pilot Plant Studies. ,Prep4red forthe City of Sunnyvale, California, February, 1975.
74. Antonio, : R.L., Nitrification of Activated SludgePresented at the Annual Conference of the Ohio.'T'oledo, Ohio, June 7-13, 1974.
Effluent with the Bio-Surf Process.Water PollutionControl Association,
75. Haug, R.T., and P.L. McCarty, Nitrification with the Submerged-Filter. JWPCF, 44, p. I
2086 (1972).
7 Haug, R.T.,. and P.L. McCarty, Nitrification with the SUlimerged Filter. Reportprepared by the Department of Civil; Engineering,. Stanford University, for theEnvironmental Protection Agency, Research Grant No. 17010 EPM;August, 1971.
77. Young, J.C., Baumann, E.R., and D.J. Wall, Packed-Bed Reactors. for SeCondaryEffluent BOD and Ammonia Removal JWPCF, 47, No 1, pp 46,56 (1975).
78. General Filter Co, Paktor, Pa ed Bed Reactor, Bulletin No. 7305, 1974.

'.,i
. ,79. Mechalas, j3J., Allen,',P.M. and W.W. Matyskieia, A ,Study. of Nitrification andDenitrification. A report prepared. for .the Federal Water Qualify Administration,
. ,
WPCRS 17010 DRD 07/70, July, 1970. i
'80: Young, J.C. and M.C. Stewart, Advanced WaSiewater Tieatinent with Packed BedReactors.' Report of the Engineering Research Institute, Iowa State' Univers4y, No.ERI-73108;May, 1973.
z
- 81: Gasser, J.A., Chen, C.L., and R.P. Miele, Fixed -Film Nitrification of Secondary-Effluent. Presented at the EED-ASCE Specialty Conference, Penn. State UniVersity,Pa., July, 1974.
82. Kenney, F.R., Letter communication to D.S. Parker. General Filter Co., Ames, Iowa,September, 1974.
83. Young, J.C., Unpublished da4, September 27; 1914.
84. Smith, J., Personal communication to D.S. Parker. Environmental Protection Agency,Cincinnati, Ohio,. March, 1974.
85. Loftin, W.E., Personal communication to D.S. Parker. City of Livermore, CaliforniApril, 1972.
86 Sacramento Area. Consultants, Oxygen Activated Sludge Pilot Studies for theSacramento RegiOnal Treatment Plant. Report prepared for the Sacramento RegionalCounty Sanitation District of Sacramento County, California, July, 1974.
.
7. ...Bishop, D.F. , Personal cgmmuni to D.S. Parker. Environmental ProtectionAgen.ey, l athington, D.C., ApiiI,1i974.
88.'%Cominonwealth Department of Works, Australian. Capital Territory, Letter communi-cation to.R.C. Aberley, datedJune 1 and July:20,-1972.
89. Metropolitan St. Louis Sewer District and Havens andeErnerson, Ltd., Cost-EffectiveDesign. of 'Wastewater Treatment Facilities Based on Field Derived. Parameters.Prepared fOr the EPA, Report No. EPA-. 670/2-74-062 (PB-234 356), July, 1974.
90. Aberley, R.C., Rattray, G.13. and P.P. Dougas; Air Diffusion Unit. J*PCF, 46, No 5,pp 895-910 (1974).
91. Leary, R.D.; Ernest, LA., and W.J. Katz, Full Scale Oxygen Transfer Studies of SevenDiffuser Systems. JWPC F, 41, No. 3, pp 459-473 (1969).

92. Nogaj, R.J., Selecting Wastewater. Aeration Equipment. Chemical Engineering, April,1072:
93. C}4/ of Medford, Oregon, Seii;age Treatment Plant Operating Reports. July, 1974.
94.. San Pablo .ry District, Calif la, Wastewater Aeatment Plant Operating,Reports.June, I 73, tq July, 1974.
95. Process Des ,Manual for Phosphurz s Removal. U.S. :EPA; Office of Te-chnology.Transfer, W hington. D.C. (1971).
96. Process Desi Manual for Suspended Solids Removal U.S. EPA, Office of TechnologyTransfer, Wash gton, D.C., January, 1975.
1.97.Cleasby, J. ., and EX Baumann, Wastewater Filti;ation, Design Considerations.Prepared fo thetEPA Technology Transfer Program; July, 1974.
98.: Dick, R.I., Ro of Activated Shldge Final Settling Tanks. JSED, Proc. ASCE, 96, No.SA2, pp 423 6 (1970). ,
.
1
299. Dick, R.I and A.R. Javaheri, Discussion of Unified Basis for Biological Treatment- Desigp.a d Operation by A.W. Lawrence and PL. McCarty.. JSED, Proc. ASCE, 97,
SA2, pp 34-238 (1971).
100. Dick, R.I. sand KM. Yot g, Analysis of Thickening Performance of Final SettlingTanks. Presented at the 27th Industrial Waste Conference, Purdue University,Lafayette, Indiana, May 7-9, 1974.
101. Tenney, M.W. and W. Stumm, Chemical Flocculation of Microorganisms in BiologicalWaste Treatment. JWPCF, 37, p. 1370 (1965).=,
102. Parker, D.S.; Kaufman, and D. Jenkins, Physial Conditioning of ActivatedSludge Floe.. JWPCF, 43,.No. 9, pp 1817-1833'(1 971).
103. Stamberg, J.I3 Bishop, D.F., Hais, A.B.., and S.M. Bennet, System Alternatiks inOxygen Activated Sludge. 'Presented at the 45th Annual. Conference of the WPCF,Atlanta, Ga., 1972.
104. Sawyer, C.N., and L. Bradney; Rising of Actikted Sludge in Final Settling rinks.Sewage Works. Journal, 17, No. 6, pp. 1191-1209 (1945).
,,105.. Clayfield, .G:W., Respiration and Denitrification Studies on Laboratory and Works
Activated Sludges. Water. Polldtion.Contro Lon don,..73, No 1, pp 51-76 (1974).
4-106216

106. Stone, R.W., Parker, and, Cotteral, Upgrading.Lagoon Efflfirt to Meet BestPracticable Treatment. Presented at the 147th Annual Conferenee of the WaterPollution Control Federation, DenVer, Colorado:, Oetpber, 1974.
107. 'Lawrence, A.M., And C.G. Brown, Biokinetic Approach to Optimal Design and Controlof Nitrifying Activated Sludge 'Systems. Presented at the, Annual Meeting of- "the NewYork Water. Pollution Control Asociation, New York' City, January 23; 1973.:i,
108. StairP.
Sherweod, One Sludgy or Two. Sludge? Water: .PiltesEn ii p, 4144, April, 1974:
109... Sutton, P.M'.,' Maphy, K.L., and. B.E. Jank, Biological Nitrog5n,,Remf9val TheEfficacy of the AitriAcation Step. Presented at the WPCF Conference, Denver,October, 1974.
4-217

CHNER 5 ,
BIOLOGICAL DENITRIFICATION
5.1.Introduction
The process of biological, denitrification is applicable 'to the removal of nitrogen fromwastewater wherithe nitrogen is predoMinately in the nitrate or nitrite form. In municipalapplications, the nitrogen in the raw .wastewater is primarily present as organic' andammonia-nitrogen and first must be converted to.-an oxidized fo-rm (nitrite or nitrate) priorto biological denitrification. The biological oxidatiOn. process used for this conversion,nitrification, was described in Chapteis 3 and 4.
This chapter presents design criteria for several alternatiVe denitrification systems includingsuspended gr th and attached growth systems using methanol as the carbon source andcombined carb oxidationqiitrification-denitrification systems using wastewater or endo-genous carbon s urces. The basic chemistry of denitrification was described in Section .3.
5.2 Denitrification in Suspended Growth Reactors Using Methanol as the Carbon Source
The suspended growths denitrification process is a form of the activated sludge process.There are several differences between its typicAl application fororganic carbon removal andin its use for denitrification. In common is the provision of a reactor, in 'which the biomass iskept in suspension in the liqUid by mixing. Also provided in both applications is a'=-sedimentation'tank for separation otthe mixed liquor 'solids from the effluent, allowing thebiomass to be recycled in the system and allowing the production of a clear effluent fordischarge or subsequent treatment Twbs typical susPended growth denitrification systemsare illUstrated in Figure 5-1.
. .
There are other analogies between "suspended growth .systems. Used for denitrification andorganic carbon removal. In organic carbon remoVal aPplOtions, dissolved oxygen isintroduced into' the reactor by aeration' so that biological' oxidation of the organic mattercan take place. In the process of carbont xidation, oxygen is. consumed as the electron.acceptor in the oxidation process: fir ; procesS of denitrificatibn, .6arbori, (usually.methanol) is oxidized with nitrate or serving as the eleCtrAti acceptor (see Section3.3.2).. In denitrification- as opposed to gardes removal,, it is the nitrate that is the
. . ,
pollutant that 'is to be remdved and the 'Caibon source that is added. In organics:re,movil, itis the carbon that is the pollutant that is to be removed 'and. the oxygen that is added.Needless to say, only sufficient carbon (such as methanol) is added in denitrification toaccomplish the nitrate removal; as excess.. dosing causes organics to appear in the effluentunless control measuies are undertaken: 'These residual organics, itleft in the effluent,
-'would-ek4ert BOD, 5, and might cause violation of effluent requirements,

FIGURE 54
SUSPENDED GROWTH DENITRIFICATION,SYSTEMS USING METHANOL
DENITRIFICATION SYSTEM (Reference I)
METHANOL
NITRIFIED
EFFLUENT
1
ANOXIC MIXED
D'ENITR IF ICAT 1014 REACTOROENITR;IFICIATION
CLARIFIER'
AERATED
, NITROGEN STRIPPING
CHANNEL T :5 min,
RETURN DENITRIFIED SLUDGE
B. MODIFIED DENITRIFICATION SYSTEM (Reference .2 3)
METHANOL
NITRIFIED
EFFLUENT
ANOXIC. MIXED'.
DENITRIF ICAT ION REACTOR
AERATED
STABILIZATION
TANK
T 50Min.
DENITRIFIED
EFFLUENT..
1
DENITRIFIED
EFFLUENT
MILDLY AERATED
PHYSICAL CONDITIONING
CHANNEL '
21S
RETURN DENITRIFIED SLUDGE6
2020
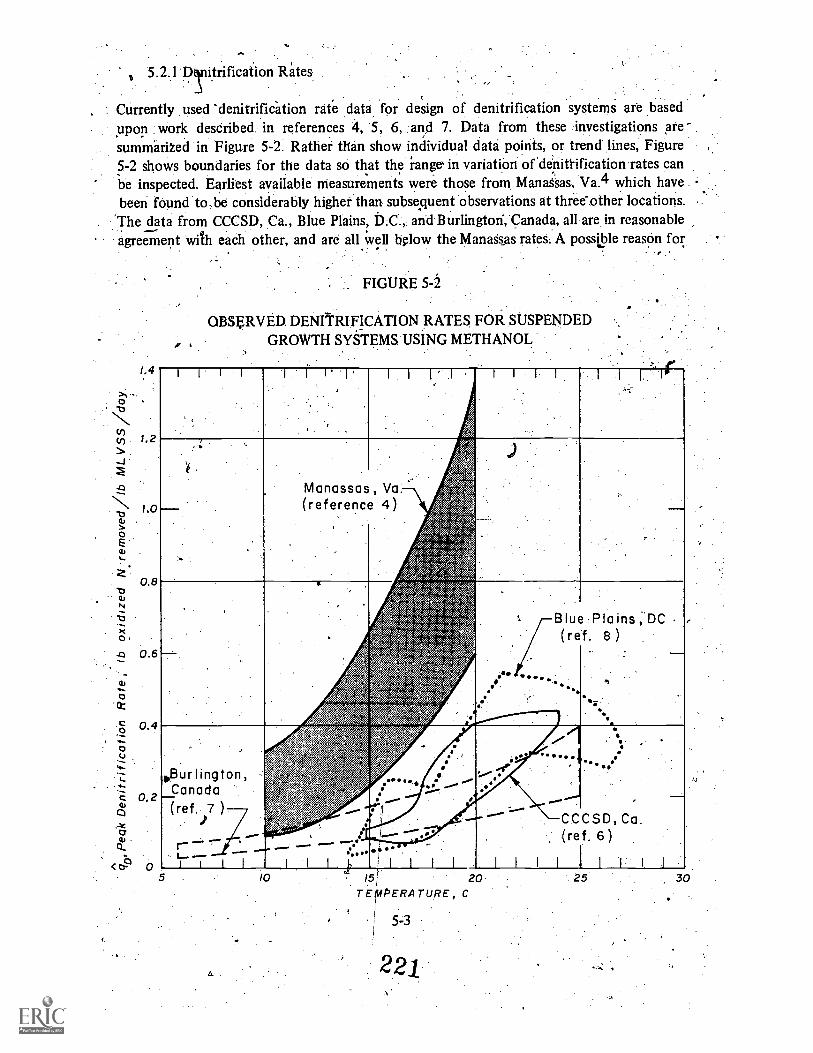
5.2.1 DTitrification Rates
, Currently used 'denitrification rate data for design of denitrification systems are basedupon work deseribed in references 4, 5, 6, and 7. Data from these investigations aresummarized in Figure 5-2. Rather than show individual data points, or trend lines, Figure5-2 shows boundaries for the data so that the range in variation of denittification rates canbe inspected. Earliest available measurements were those from. Manaisas, Va.4 which havebeen found to.be considerably higher than subsequent observations at three-other locations.The data from CCCSD, Ca., Blue Plains, D.C., and Burlington, Canada, all, are in reasonableagreement with each other, and are all Well blow the ManaSs_as rates. A possible reason for
FIGURE 5-2
QBSRVED DENITRIFICATION RATES FOR SUSPENDEDGROWTH SYSTEMS USING METHANOL
Blue Plains; DC(ref. 8 )
5 10 15[ 20 25 30TEMPERATURE, C
5_3
221
°
the higher measurements at Manassas is that an acid solubilization procedure Was employedprior to the volatile solids determination, which may have acid hydrolizedorganic ,matter.resulting in low measurements' of volatile solids (and higher apparent denitrifidation rates).The earlier work at ManassaS9 prior to implementation of the acid step showeddenitrifiCation rata closer to the observations of other locations. .
Laboratory studies n synthetic nitrate containing .wastes have .shown much higherdenitrification rate an are found in Figure 5-2. I0,1 I However, the. biOlogical solidsdeveloped in such laboratory systems do not contain the. levels of refractory solids thatbuild up in practical syStems operated under field conditions. Therefore, the data developed,from such laboratory studies are not directly useful in establishing accutate designparameters. .
Conditions mainfained.dtiring the field studies may influence, field measured denitrificationrates considerably. When the denitrification reactor is.continuously operated close to themaximum growth rate of the denitrifying organisms, it is probable that the denitrifyingactivity of the biomaSs is higher than when the system is operated with a high safety fictor.FOr instance, in-- studies in Ontario it was found that measured peak.denitrification rateswere approximately 311, percent greater at a solids retention time of 3 days than ratesmeasured at a solids -retention time of 6. days. 12 Thus, differences in measured rates mayreflect variations in Operating conditions among The various locations. . .*
Observed rates in Figure 5-2 are essentially the experimentally deterniiiied vahies of theterm CID using the notation presented in Section 3.3,5.2. The peak nitrate removal rate, b,
.
is the reaction rate ,when neither methanol nor nitrate. is limiting the reaction rate.. Sub -sequent sections show how these peak nitrate removal rates are used in design calculations.
5.2.2 Complete Mix Denitrification Kinetics
The equations presented in Section 3.3.5 are directly applicable to the design of completemix' denitrification systems. The design procedure for denitrification- uses the safety factor
. concept- to relate peak nitrate rem-oval.,rates, 'CiD, to design nitrate removal rates, qp.Expressed in terms of solids retention time, the safety, factor concept is
Od
SF =Bc
where: SF- = safety factor,
- (3-29) .
c= solids retention time of design; days, and
re .
Om = minimum solids retention time, days, for .
;denitaication.
541 222
Tfie design nitrate removal ratOND, can be related to .the safety factor and the peak nitrate
removal Ate by using the following equations in conjunction with Equation 3-53:
where:
1
m
(3-50)
(3-54)
denitrifier gross yield, lb VSS"gtjown/lb NO3removed,
decay coefficient, day ,.
(IDnitrate removal rate, lb NO N Isrem./lb VSS-day, and.
n = peak nitrate removal rate, lb NO3 N rem./lb VSS-day.
In ecaluating these equations in design,calculations, the specific values of Y and Kd given in
Section .33.5.4 may be used Figure 5-2 may be-used to arrive at estimated values of qD.
Considering the range iri the data in Figure 5-2, conservative practice' in the absenCe of pilot
data would be to pick the lowest denitrification rates observed for ic\o, e.g. at 10 C qD =
0.05, at 15 C = 0.08, at,20 C qD =0.15, and at 25 'C'qD = 0.p. Use f these minimum
values oftib will result in very conservative reactor designs. Pilot plant studies may be useful
to define applicable values of/c\o, as the potential for establishing higher denitrification ratesfor a particular location is good; evidence of this is the range of denitrifiCation rates among
the various locations shown in Figure 5-2.
. A
As a design example consider a case where the temperature is 25 C, qD = 0.2 lb NO rem/lbMLVSS/day,Y = 0.9 lb VSS/lb.NO-S rem., Kd = 0.04 dayI., and KD = 0.15 ing/L,Assunie .
that due to diurnal variations in load (Section 5.2.2.2),-a Minimum safety factor of 2.0. is
adopted. Consider a '30 mgil treatment plant,. where 25 mg/1 olnitrate-N must be removed.
1. ' Using EquatiOn 3-54, calculate the minimum solids retention time for denitrifica-
tiOn:
= 0.9(0.2) 0.04 = 0.14Om
Om = 7.14 days)
. Calculate the design solids retention time (Equation 3-29):
Od =.2.0(7.14) = 14.3 days
Calculate the design nitrate removal rate (E,quation 3-50):
1'4,.3= 0.9q
D - 0.04
0:12 lb NO37N rerrylb MLVSS/day.
-Calculate the steady state nitrate 'content of the effluent. The expression relat gremoval rates to nitrate level, from Equations 3-47, 3-48 and 3-49, is as folio s:
iWhere: half saturation constant rtig/1 NO '--N, and, 3
effluent concentration of nitrate nitrogen mgil.re.nS
Evaluation of this equation for this example yields:.
D0.12 = 0.20 1
0.15 +
D = 0.23 mg /1 NO31 .
(5-
5. Determine the hydraulic detention time at average dry weathei flow. Theequation for nitrate removal rate is useful in this calculation.
Do - DI
X1
HT
where: D = influent NO3 -N, mg/1
DI = effluent NO3 -N, mg/1
X1 = MLVSS, mg/1, and
HT = hydraulic detention time; days,
224
(5-2)

The mixed liquor volatile suspknded solids ('MLVSS) level is 'dependent on the
mixed liquor total sUspende d s , which is in turn liepenident on the operation
of the denitrification sedimentation tank (see SeCtions 4.10 and 5.6). Assume for
the purposes of this example that the design mixed liquor content at 25 C is 3000
mg/l. At a volatile content of 80 percent, the MLVSS is 2400 mg/l. From
Equation 5-2, the hydraulic detention time
FIT (25 -0.2) Q.083. days(0.12)(2500)
= 1.99hr
Determine the sludge wasting schedule. The equations developed for wasting. 7in the nitrification system are directly applicable here. The necessary sludg
inventory is:
where:
V
I = 8.33(X1 V)
inventory of VSS in the anoxic denitrification
= MLVSS in the reactor, mg/I, and
volume of the reactor, mil gal.
In the example at hand:
.
(4-7)
I = 8.33(2400)(0.0 &3)(30) = 49,780 lb VSS
From Equation 4-8, the sludge wasting from all sources is, defined by the
following equation:
For this example:
total sludge wasted in lb/day
S = 49,780/14.3 = 3,481 lb VSS/day.
L(5-3)
The iota] sludge to, be wasted each,day is made up of twO'components, as shown:
225-
(4-6)

4
influent (or effluent) flow rate, mgd,
waste sludge flow rate, mgd,
effluent volatile suspended solids, mg/f, and
waste sludge volatile suspended solids; mg/l.
The sludge contained in the effluent (the term Q.X2 above) can be calculatedassuming that the effluent VSS is 10 mg/1:
. 8.33(10)(30) = 2,499 lb VSS/day
By difference, the lb of MLVSS to be wasted from the mixed liquor or return%ludge is:
3,481 2,499 = 982 lb VSS/day
Methanol requirement. From Section 3.3.2, an estimate of 3.0 lb per lb of nitrateN removed iereasonable. The methanol requirement it:
3.0(25 0.23)(8.33)(30) 7 18,570 lb/day
The sludge yield and decay values used above are. for a case where only a short aerationperiod is used prior to clarification. When an aerated stabilization step is employed; verymuch lower sludge wasting is tequired than presented in the above example. In cases wherean aerated stabilization tank employed, only, the sludge inventory under anoxic conditionsshould be considered in th sizing of the anoxic reactor for denitrification (Step 5).
5.2.2.1 Effect f Safety Factor on Steady-State Effluent Quality
In the design example pr iously presented, the safety factor was assumed to_be 2.0,,basedon considerations presente in. ction 5.2.2.2. The effect of alternative assumptions on theeffluent nitrate level are presented in Figure 5 3. As may be seen, the assumpticrafethesafety factor has a marked effect, on the effluent qu lity of complete mix ,denitrificatiensystems.
5:2.2.2 Effect of Diurnal Load Variations;on Effluent Quality-
As is the case for nitrification, load variations have a significant effect, on effluent quality.Since Apstream treatment units to some extent equalize load variations, the peak to averageload ratio is generally lower than for the nitrification .:'stage. The effect of loadvariations can be analyzed in a similar manner to that used for nitrification (Section4.3:3.2). By analogy to the 'nitrification case, the mass balance yields the followingexpression, for nitrate at any time:
5-8 226
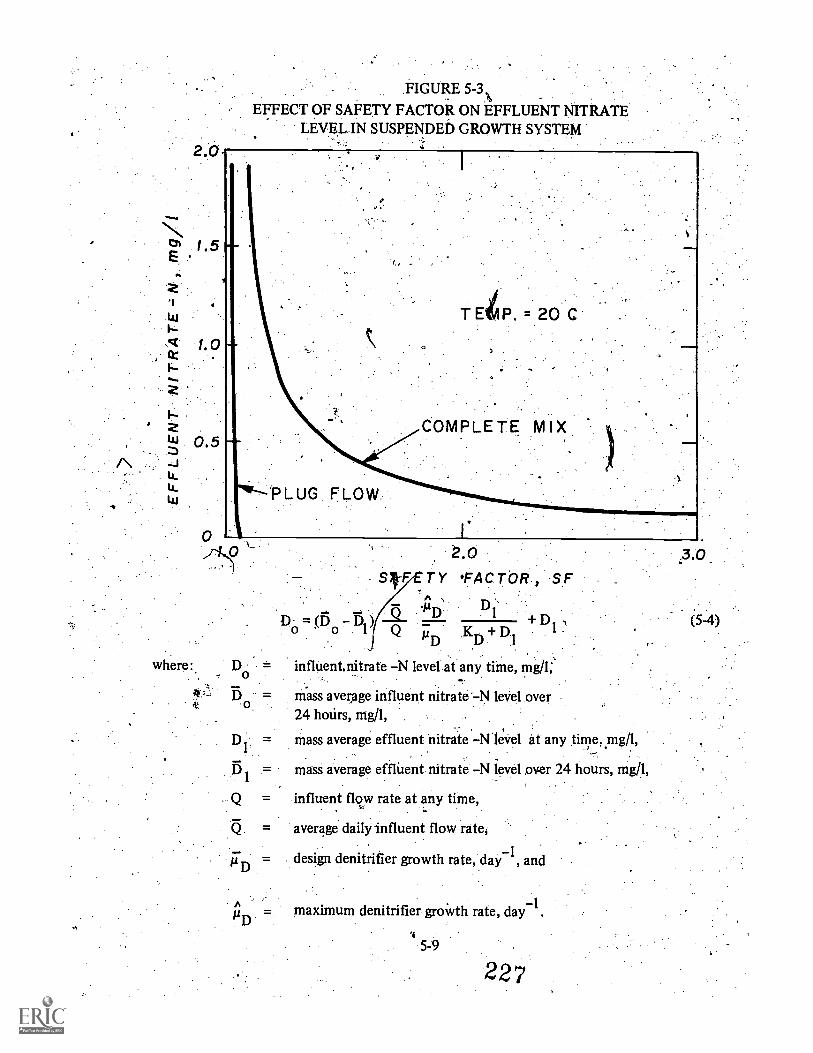
FIGURE 5-3.
EFFECT OF. SAFETY FACTOR ON EFFLUENT NITRATELEVEL. IN SUSPENDED GROWTH SYSTEM
where:.. Do
D
Q.
Q
SF TY FACTOR SF
41D D1
Q -12-D ICD-1-D1
influent, nitrate N level at any time, mg/I;.
mass average influent nitrate---N level over24 hours, mg/1,
mass average effluent nitrate N level at any time,mg/1,
mass average effluent nitrate N level over 24 hours, mg/1,
influent flow rate at any time,
average daily influent flow rates
design denitrifier growth rate, day 1, and
maximum denitrifier groWth rate, day 1.
5 -9
227

Equation 5-4 has been used to evaluate the effect of the diurnal load variations shown onFigure 5-4 using the design example conditions given in Section 5.2.2.1. The influeritnitrate-nitrogeh concentration was assumed constant at 25 mg/1, and the load variation wasassumed 'to be due to variation in flow only. Several trial calculation using Eqtiation 5-4over a '2,4 hour cycle were to derive values of D 1 Results of these calculations forseveral values of 'the SF are also showilion Figure 54 As may be seen, the safety factor, SF,has a marked effect on the nitrate bleedthrough occurring during peak load conditions. Inthe case examined, 'a safety factor of 2.0'was sufficient to prevent excessive, nitrate leakage,.,The peak to average load for this case was 1.5. In summary, it would appear that as aminim'um, the safety factor should exceed the peak to average load ratio to preventexcessive nitrate leakage during peak load conditions.
5.7.3 Plug Flow Denitrification Kinetics
The design approach for plug flow denitrifica actors Omilar to the approadh2- developed for complete mix reactors, with the ex eption 4:0f:the 'equations used to .predict'
effluent quality. Lawrence and McCarty's13 solution for plugildw kinetics is applical?le:
<1
c
YIAD(D076 )D
-D)+K In °o 1 D DI
All these terms are as defined previously in Section 5.2.2.
The kinetic design approach for plug flow follows that used for complete mix systems in'Sectioh 5.2.2, excepting that at step 4, Equation 5-5 is used instead of gquation 5-1 to findthe effluent nitrate level.
Equation 5-5 can also be used to find the safety factor required to..obtain any desired nitratelevel. This has beendone for the example, presented in Section' 5.2.2.1 and plotted ih Figure.5-3. A comparison of the safety' factor required' to obtain the same nitrate level in' acomplete mix system yields the concluSion that phig flow systems' be designed withconsiderably lower safety factors while obtaining the same effluent. quality.
While kinetic models have not been extended to the pOint where they can be expected to .
describe the effect of ,diurnal variations on plug flow systems, it can be expected that theeffects of 'these loads will be similar to those'experienced in' completemix systems. This.Is aresult of the fact once the effluent level rises above 1 mg /l' nitrateA-Ni.... thedenitrification rate becomes essentially 'zero ordel-. For zero order reactions., there is little.difference between plug flow and domplete;mix reactfon- kinetics. Therefore, the nitrate°bleedthrough in a plug flow reactor can be expected to cloSely approach thatin a complete
reactor under diurnal peak load conditions. To prevent excessive' nitrate leakage during,peak load conditions, the recominendation in Section .should be adopted;-ag' aminimum, the safety factor should exceed the peak to average load Titio:
5-10
228
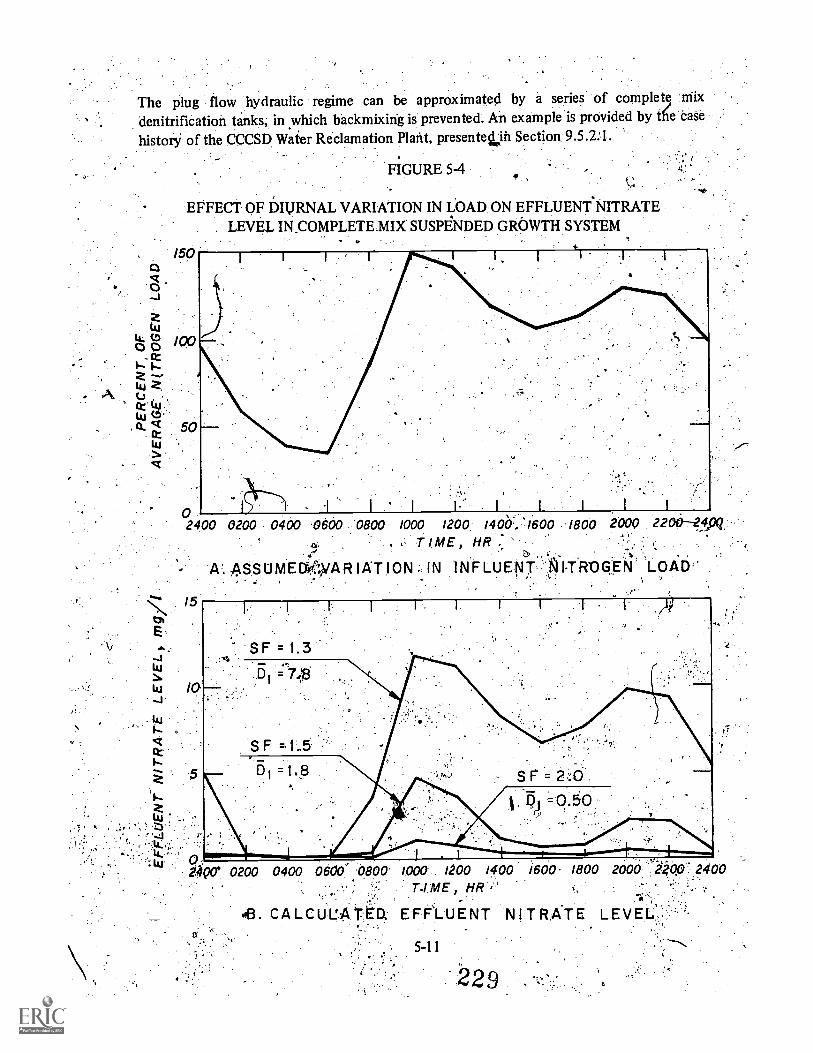
The plug flow hydraulic regime can be approximated by a series of complete mixdenitrification tanks, in which backmixing is prevented. An example is provided by t6 casehistorY of the CCCSD Water Reclamation Plant, presented in Section 9.5.2.1.
FIGURE 5-4
EFFECT OF DIURNAL VARIATION IN LOAD ON EFFLUENT NITRATE. LEVEL INCOMPLETE.MIX SUSPENDED GROWTH SYSTEM
0 I I I 1 I I
2400 0200 0400 0600 0800 1000 1200 1406.:1600 1800 2000 2206--2!19Q,
TIME, HR
A. ASSUMECt4ARIATION, IN INFLUENT 41-TROGEN LOAD.'
0400 0600 0800 ma 1200 1400 ;600. 1800 2000 200 2400ME , HR
08.CALCULAT.6. EFF`LUENT NITRATE LEVEL...
5 -11
229

5.2.4 Effluent Quality from Suspended Grg,vvth Denitrification Processes
Since denitrification technology is new, there is a concern on the part of some desigriengineers that biological nitrification-denitrification systems are unstable and produceresults of high variability. However, large scale tests of biological nitrogen .removal have.demonstrated over relatively long periods that a consistently low nitrogen level can beobtained.
5.2.4.1 Ex,perience ai Matiassas, Va: ,.
The EPA conducted a 0.2 mgd (760 cu m/day). test of the "three sludge" system for eightmonths
,at rQuas,sas,; Va. The system consisted of primary treatment and three separate
suspended' gibivtit stages for-organic carbon oxidation, nitrification and kIenitrificationfolloWed by filtration, as shown in Figure 5:-5.. Alum was added to the first and thirdsuspended growth stages for PhosphOrus removal. A dose ofpolymer was added to the thirdreactor effluent. Performance.data,;presented in the form of frequency distribute ildiagi-arns .;Show that the performance of the closely rnonitdied system was very stable. tabular ;-":summary of denitrifteation effluent quality as showit4bie 5-1 for the last fOur morithi'ofoperation. As may be seen, an effluent very low in to:4a! pkosphorus and total nitrogen was! .;obtained from the denitrification systemfand filtration provided further reductions. Furtherdetails'are availAble in the papers produced from the project 4;9
:...
. ,.
.)--'it. (f .
. .
THE THREE SLUDGO.,;SXTEM AS TESTED AT MANASSAS,NN(REFEREIICE 4) .
FIGURE 5-5
BACNWASH.,
111.0 @
.RETURN SLUDGE ,RETURN SLUDGE IT, I 8 IrC KWASH s:',
: . is_ 7. 10r ti e.
. 1-; T YPICAL WASTE SLUDGE LINE
*
a
ytWASTE TO SOLIDS HANDLING SYSTEM' ANEV,UCTIMATE DISPOSAL"
. PRIMARYTREATMENT.
'HIGH RATEACTIVATED SLUDGE
NITRIFYINGACTIVATED SLUDGE
.. cDENITRIFYINGACTIVATE GE
POST. .4. TREATMENT
°SEDIMENTATION.TANK
AERAT ION, TANK.
SEDIMENTATIONTANK . , 1 ),
OAERATION TANK
0 SEDIMENTATIONTANK
BANOXIC REACTOR.
AERATED CHANNEL
OSEDIMEN.TATION TANK
1,41AED MEDIA FILTERS
CHLORINE CONTACT
II AERATION
3 9

(TABLE
s .:Dt,NITRIFICATION PERFORMANCE: PINAL FOUR MONTHS':. ,'OF- OPERATION AT MANASASS, VIRGINIA (REFERENCE4)'
After finalclarification,
mg/1
1.8 ".
5.2.4.2 Experience at the CCCSD's Advanced. Treatment Tes Facility
',1,\.: .In Noveriiber, 1971, the Central COntra . Costa Sanitary' District (CCCSD) began. the..!'1 bperation OP -a full-scale AdvanCed Treatment Test Facility (ATTF) at .its:,exiking ; .
.. #astewater treatment plant in California.3 Operation of the facility ultimately extended.f', '' er 23' monihs. A purpose of the test facility-was to-obtain data on the ATTF, System
uen'ce of proCesses (Figure 5-6) that had been ;: proposed for _the! CCCSIS Watereclamation Piant.14 Another purPose was tp.".4ispo.ihe .nation tharthe nitrification and
enitrification :,...Neesses were unstable due' to the erratfe.ifitrifiCation-denitrification results.
1 , i3,15;16 .. ,
,,. previously oblainekl in a small-scale pilot study.
The ATTF-13,qma
ce units had capacitieS ranging from 2:.5;ingd m/day) in thetep to WS' cu m/day) in the denitrificationi facilities. Primary
clam ation follows lime additiOn, and preaeration and is coupled With a separate stagenitrification step. The use of lime in the primary stage remove§ much of the organic carbonload from the nitrification stage,; .thus allowing stable oxidation of ammonia to nitrate.Addition or lime also enhances the removal of phosphorus; heavy Metals and viruses.Addition of lime in the initial stage of treatment, in :contrast to the use of lime after.conventional secondary treatment, enables the achievement of better stability in succeeding
,, .

FIGURE 5-6
ATTF SYSTEM FOR NITROGEN AND PHOSPHORUS REMOVAL
RAW WASTEWATER ,1
I,. I M.!
L I ME-.REAd:T.013!:.( PR E A 6i't 41",
PR I MARYSEDIMENTATION :TANK,
POLY.MER OR
FERRIC. CHLORIDE
CHEMICALPRIMARYEFFLUENT
C 0 2,.
bX IDAT IONNITRIFICATION TIK
SECONDARY-..SEDIMENTATION TANK
11DGE TOSOL IDS
PROCESSING
).ii-r AIR.
RETURNSLUDGE
MET 1-1 ANOL
DENITRIFICAT IONTANK
WASTE SLUDGEIP TORAW WASTEWATER
M I X ING
asRETURNSLUDGE
AERATEDSTABILIZATION TANK.
SEDIMENTATION TANK..A
CHLORINE CONTACTrib
ADDITIONAL TREATMENTFOR INDUSTRY
5-14
WASTE SLUDGETO
RAW WASTEWATER
232
.v
.treatment processes and alSct allow& the elimination of the need for a biologicaltreatment
.step, for organic carbon removal. ahead .Of the nitrification stage. Biological deriitrificationfollows nitrification, concirting;:nitrate to nitrogen:gas.
Performance data for a representative three,Months of operation of the ATTF are shown inTable 5-2.3.0f particular interest is the fact that.; the; 90 $ercentile performance level did not .
vary widely from themedian performance level fol. the various constituents. This providesstatistical confirmation that the nitrification and denitrification performanc of the ATTFsystem was quite stable. The concentration of Organics in the nitrified and denitrifiedeffluents was low, as measured by BOD and organic 'carbon. Operation for completenitrification also resulted in high organic removals. Similarly, suspended matter 'iii the 'nitrified and denitrified effluents were also exceptionally low (Table 5-2). Nutrients areeffectively removed in the ATTF system. Total nitrogen in the denitrified effluent averagesless than 2 mg/l. Total phosphorus. averaged 0.5 mg/l.
i5.3 Denitrification in Attached Growth Reactors Using Meili4gOl,as- 0,Carbon SOurce
Denitrification in attached growth -reactors has been acciiinplished in a wide variety ofdenitrification column configurations using various media to support the growth ofdenitrifiers. In part because of this variability among systems, it is .difficult to et forthgenerally useful design criteria at the present time Several useful approaches are suggestedfin characterizing denitrification in attached growth systems and presently available data(1975) are analyzed by these procedures.
5.3.1 ICineticiDelign of Attached Growth Nnitrification Systems
In order to size an attached denitrification reactor, knowledge is required of the reactionrates taking place in the reactor vokiine. In estimating reaction rates, the level of biomasseffective in denitrification must also be known. One approach is to estimate the level ofbiomass 99;:themedia surface and thenuse measured reaction rates per Tit of biomass toobtain :e nitroien removal capability of a column containing tliestimated amount ofbionidSS. approach is limited in its usefulneis in desigif,:applications becausetheiiViii&itisiltficient data available' at the present time to predicein,::ailvance,the level ofbibipasS:Aliewill develop on the media. Biomass development will ,1;i6' dependent onhydraulic regime, type of media, loading,, means for prothoting sloughing and possibly thetempeTature of operation.
An indirect prOcedure for consideration., of denitrification rates in design is to adopt the .
approach in which denitrification rates are expressed m ternist:of surface nitrate removalrates,: lb nitrate N removed per sq ft per day.7,18,20 On this basis, high surfaceremoval rates would reflect extensive biological film:°;development, whereas low sin-face
removal rates -wolild reflect minimal surface filni!,cleyaopment. The surface denitrificationrate varies considerably among the various denitrification colunin configurations and isaffected by the loadings under which the process is operated.
5-15 233

ATTF Pg#ORMANCESUMMARY,ARIL 1,6 TO JULY 15, 172
(CENTRAL CONTRA COSTA SANITARY DIiTRICT, ;3)
..."----1- P'......00Immmom.........1mi
, . t aw, ivastewater, mg /1 Chemical primaryh. mg/1
/. Nitrified effluent, mill Denitrified effluent? mg /1
COnsfltuent ..' .
. '.,.
'meanom median,
90 %a mean m an 90%a mean m an . 90 a men median ? 90(ka
t ,
130D5
c203 ', 199 235 57 '. 54 79 3,6 3,5 6,8 3.2 3,0 4.8
.
TOCc .'
122 120 152 42 , 41. 55 8.9 8.5 11.5 9,5 9,0 11
SOC , 22 .. 23 25 27. 27 31 5.6 5 5, 6.7 5.9 6;0 6.6SS 214 212 295, 26 23 45 4.5 4.0 7.8 4.5 4.0 7,7 ,
Turbidity (JN) .- , , , le '.. 12;8 12,0 23 1.4 ,11,3 '2,2 1.4 1.3 1.8Settleable solids (m1/1) 13,5 13,0 16.5 .084', 0 ,37 VI
0 *Mc N . _ .26 0 .67 1.1, 1,1 2.5NH4 - N - 24.0 23.8. ,, 28.5 L48 .30 .58 .31 .30 .40NO3 - N i . .
17 27 32' ',48 0 .79NO2 li , .. . -
'015 .01:3 .027 ,009 .008 .018
,Total P 9.86 9.57 11.19 .86 .59 1.85 1;04 , .* .72 2,11 .50 .36 . .98
4,Ortho P
,r1
9.74 9.90 11.24 .61 At 1.75
1
100 .71 .
.
1.80 .52 .36 ,.90
TDS , 583. 561 750 94 636 \ 724 537 551 . 616
Conductivity (105, mho/cm) 1230 1210 1366 -, - ,,1226 1223 , 1394 1160 1147 1318
Alkalinity 215 218 ,, 237 254 249 293 105 106 127 183 187 217Cad
dMg ,
67.9.
84,0
66.0
84.0
78.5
95.6
155
38.6
150,
34.0
184
74.0
159
67'.3
161
61.0
187
'73,0
174
30,1
172
30,0
194
48.4
.,
a90% of observations axe equal to or less them stated value,
,bpH 10.2 operation to June 1, pH 11.0 thereafter. .
°IOC c total organic carbon, pc = soluble organic carbon
dasCaCO
3
234235.
5.12 Classification of Column Configura'tions
.The various types of denitrification columns currently available are summarized in Table 5-3along-with calculated peak surface denitrification rates. The first type of categorization iswith respect to the condition .of the void space in the column. Until, very recently, alldenitrificatiOn work has been conducted on submerged columns wherein the voids werefilled with the fluid being denitrified.: Very recently, a. new type of coluinn has beendeveloped in which the voids are filled with'nitrogen gas, a product of denitrification.6,21The submerged columns can be further subdivided into packed bed and fluidized bedoperations.
The varieties of media being employed for commercial application are also shown in Table5-3; the listing is not meant to exclude commercial products which may be, equivalent 'tothose listed. For instance, other vendois of plastic Media'are listed in Table 4-15.
Details of design construction and Operation of each column type are presented in thefollowing sections. Also included is a comparison of column systems.
5.3.2.1 Nitrogen Gas Filled Denitrification Columns Packed Bed
The nitrogen gas filled column was ricently developed for.use at the Lower Molonglo.WaterQuality Control' Centre (LMWQCC), currently under construction.6,211 Details of thecolumn design used for this Canberra, Australia installation are shown in Figure 5-7. Thecolumn media consists of corrugated plastic sheet modules .of the same type used in plasticmedia trickling filters '(Table 4-15). As opposed to previously developed attached growthprocesses, the present column system is nol submerged with liquid; rather, the column'svoid spaces are filled with nitrogen gas, a reaction product of the denitrification process.
In the denitrification column the influent wastewater is spread out over the top of themedia and then the li uid flows in a thin filhi over the media on which the organisms grow.These organisms main n a balance so that an active biological film develops. The balance ismaintained by sloughing bi s from the media, either by death or by hydraulic erosionor both. Sufficient voids are present in the media to prevent clogging and ponding. Thedenitrification column must be followed by a clarification step to remove 'sloughed solids.Pilot studies for the LMWQCC facility indicated that effluent solids should be sufficientlylow so that the effluent can go directly to a tertiary multi-media filter.
Oxygen rhust beexcluded from the denittilecation Mullin since its presence would .preventnitrate or nitrite in the applied liquor from serving as the electron acceptor in the biologicaloxidation of the applied carbon (methanol). Therefore, the denitrification column is sealedto prevent intrusion of air. The 'units are vented to allow outflow of nitrogen gas whilepreventing inflow of atmospheric air. Soon after start-up, the nitrogen gas displaces the airOr other gases initially present, leaving a nitrogen gas atmosphere in the voids. This ensuresthe anoxic environment that is required for denitrification.
5,11
236.

TABLE 5-3
r.
TYPES OF DENITRIFICATION COLUMNS AND MEASURED DENITRIFICATION RATES
Vold
Sou Type
Nature of
Surface
Ref,
No,
hledle
trade name
specificeurface
slim /1
(mho)(mho)Voids,
percent
. .
Surface or volume'dealtriflutlon rite at stated temptrature, C'
lb N rem /et/day n 104 i (lb N rem /1000 cf /day )
5 10 11 12
.13 14 15
.
16 17 18 19
4
20 21 22 23 a 24 25 26 27 Other
'Nitrogen
PiPacked bed High porolity
corrugated sheet'
mooluies
a
21
6,
21
Minters
Pludek
.,
68
(2231
42
(138)
.95
.v95 '
.
.6,2(42)
,
18,6
11261
12.1
182/
Liquid
I
0
Pecked bed
:
HIgb porollty
corrugated cheat
modules or
dumped media
1
.
22
23
24
7,
20 '
17,
25
Koch
Flextrings
EnvIrolech
Surfpac
Koch
Flexiriags
Intilox
saddles
-Aaachig
Nage
.
65
(213)
27
(89)
105
(344)
142 to 274
(466 to 899)
79
(259)
96
94
92
70 to 78
80
.32
(4,5
to
8,8)
. .
,
.37
(5,3
to'
10,1)
.43
(2,8)
.50
(3,3)
.28
(3.7
to
7,1)
,
.53
(3,4
1.2
(8.5)
.95
(13.5
. to
26)
1,1,(7.2)
,
a
D,
.59
(3.B)
,
.
1.1
(15,6
to
30.11
2,4°
(19)
Mr112)
'.
2.02
121)
,93e
(2,5)
Low poroeity
fine media
1
18
26
24
27,
28
Gravel
.d50,3,4 toits mm
sled
d50.0,9mm 1
sod
d50g3 to
4 mm
at0.2.9mmU. C.. I. 13
.
245 lo 85
(804 to 279)
1
4501
. (1,476)
250
(825)
270119961
2B to 37
...
.
40
, .
i1'(,.
'
0,8
1161
.
.
I
2,3
-
2.9
(73)
4.6
11241
3.9
(176)
;,,
I
!.'
Fluidized
, bed
'
High porosity
Rne media,
andActivated carbon
29 .
30
d304,85mml
d10.0.63mm
so q
130!
(426)
390g
(1,279)
-
,
.,
(257)
55
1720)
-
1308)
98
(1275)
-
(292)
(388)
-
(424)
c
1 kg/m-/day , 0,205 ibie
b I kg/0/day 62;4109
fc 111.2 ;6 ', ' e
dI hear detention 0 ..iil
2 hour defeetio i , it ',
. , ; t .,
1.! f .,' ',' .. , , .. , . :,
0 ,:g!tlEnited'Ir* dals,ligublIcallon ,,
i 'PriOr i.i(ed,ripiiiilon
.,. , 4
0 11.4'101! 1 0 tdfective also, 50 . median paditicip size, 60 panicle size at which 60 percent of the materiel Is smeller
. ,
: t std U.C, . uniformity coec4fficient , 601'10
237
238

982m .1225m
TYP CELL . :TYP, Cal
30Orrim DUWAD
CROSS CHANNEL
SEE DETAIL
arraain EFFLUENT 5.500m CORRUGATED DETRIBUTION TROUGH
COLLECTION CHAMBER SHEET,NEDIA
ADJUSTABLE HANGER RODS
FIGURE 5.7
.
DESIGN DETAILS OF NITROGEN GAS FILLED..
DENITRIFICATION COLUMN (REFERENCE; fl
.4 ,
233

Media specific surface and configiration must be Carefully selected to-ensure that cloggingdoes not occur. liking can occur under high loadings if the restrictions in the media aretoo small. Pilot studies may be warranted for media selection when design conditions departfrom those previously tested: Once the proper media is selected, the process has theadvantage_ that backwashing is not required; considerably -simplifying design, construction,and operation: Further, the column construction is simplified since it need not be a pressUre'vessel as the coluinn is at approximately atmospheric pressure.
The denitrification column was first tested at the Central Contra Costa Sanitary. District'sAdvanced Treatment Test Facility (ATTF).6,21 The test program had three primary,objectives: the firSt was to develop confidence in the ability of the attached growth reactorto function consistently and predictably; second, to determine the optimum specific area ofthe Plastic media; third, to develop criteria upon which design of the prototype colunins forthe LMWQCC could be based. -
The test denitrification column consisted of a sealed vertical 24-inch (6 ro, rim) diameterreinforced concrete pipe 12 ft (3.66 m) in height and filled with 10 ft (3.09 m) of media.Plastic media consisted of PVC corrugated sheet modules, supplied by Munters Corporation:The top of the column was sealed by a gasketed cover and the nitrified liquor was applied tothe top of the tower by a round pattern nozzle: After passing through the column, thedenitrified effluent was collected in a sump from where it was discharged. Provision wasmade to allow Pumping of column effluent bacKto the influent of the column to test themerits of recirculation. A brief, description of t4;/ test program and a summary, of the resultsis presented on Table 5-4. The initial media tested had a specific surface of 68 sq ft per cu ft(223 m2/m3). This media clogged at the high application rates applied in May and June1972 and was subsequently replaced with media having a specific surface of 42 sq ft per cuft (138 m2/m3). Recirculation of effluent was not found to be required and was droppedfrom the test program because of the high energy costs that would be incurred ifrecirculation was used in the full-scale plant.
Experience with the pilot column indicated that an application rate of 5 gpm appeared to bea 'reasonable flow that could be applied continuously without an objectionable buildup of :growth on the Media. That value is equivalent to a rate of 245 gallons per cubic foot per day(33,3001/M3/day). Because the Contra Costa wastewater haS a lower nitrogen concentrationthan the wastewater at the LMWQCC; the hydraulic lc:Z:ling rate was adjusted to ensure anequivalent nitrogen load was applied. The value was then further reduced.to permit lowerloadings at low wastewater temperature. Taking these factors into account, an ADWFloading rate of 144 gallons per cubic foot per day (12,5621/m3/day) was selected for designputpoSes. In terms of nitrate removal rate on the basis,of Media surface, this corresponds to9.9 x -10-4 lb NO3 N rem/sq ft/day (4.83 x 10⁻³ kg/m2/day).
While media with a speific surface of 42 sq ft per cu ft (12.8 m2/m3).is believed to be notsusceptible to Clogging in municipal applications based on the limited experience to date, itwould appear prudent to provide chlorine addition capability to aid sloughing ,shouldclogging,occur.
5-20 2 41

TABLE 5-4
SUMMARY OF OPERATION - NITROGEN GAS FILLED DENITRIFICATION,COLUMN
.4.
Date,1972
. Effluent
flow rate, .
gpm!
Recirculation
rate.gpma
,Apri1.24
April 27
May 2
May 8 .
May 11
5.32.32.12. 0
9.49.4
t 9.4. 9.4
8.0
27
22
28
'30,'24.-5
May 16 2.5 28May 18 1 5/5. 0 0. 27Way 23 5.0 274tay 26 10.0'May 31 10. 0 0 22
Jun I. 15.0 25.5June 5 15.0
. JLine 9 . r 10.0. 0 27June 12 10.0 0 27June 15 7.0. 0 27
June 16
July 27
July 28 5.0 15.3August 1 5.0 0 13.5August 4 5.0 0 11,8August 9 5.0 0. 11.8August 15 5..0 0 9.8August 21 5. 0 0 13.2August 25 5.0 0 12.5
August 28 5.0 0 23
August 30 5, 0 0 .30September 1' 5. 0 0 18
September 7 5. 0 27
Septertbei 12 5.0 0 17.
September 19 5. 0 0 24.5September. 27. 5.0 0 18October 5..0 0, 19
October 25.- 5. 0 20
mg/1 TOC,' mg/1
Out
4.51.6
<0,2
<0.4
Nil
<1
3.4
1
5
6.8
5.4
2.52.71.0
Nil
4.0.5.0
17
22
3.20.5
Nil
Nil
0.8
Nil
1.4
In
26
21
37
36
40
`10'
9
8 .
9
7
8
7.5
46
10
73
11
.
8
8
a
8'
8.58
8,6.5
Out
15. 5
19
25
11
16
1357
14
16
38
10
45
14
18
13
12.5
13
13
18.512
12
15.5
11.
Comment :
Nir
Media. Installed had 68, seVeii..1(t.:14: 7 in7.).. .
3rn )
Eliminate recirculation and increase rioW rate.
Column being overloaded.;,,,
Severe foaming. Feed rate decreased.. ,
0
Mechanical breakdowns and operation difficulties.Test 'results unreliable.
Media removed.
New Mekla used was 42 sq, ft/cu ft.(12.8 m`.1m3)
Denitrification reestablished.
a1 gpm 0.065 l/s
242

Tie! deSign!of. the &nitrification columnipilhe LMWQCC is "portrayed in Figure 5-7 and=
design data are givedn in Section 9.5.2.2.4/p0ation'will be by gravity flow, as the LMWQCCis located on a very steep site ViXe "distribution troughs with splash plates were.ysed tohandle the wide range in flows'expeet and to minimize the restrictions in the distributionsystem which might be clogged by th growth of denitrifiers. Further, top lay6r. ofdumped media'is `Placed over the corrugate media to ensure good disiilibution and gov,that the top of the column.
5.3.2.2. Submerged High Porosity. Media Columns Packed Bed!. I .
,
Submerged denitrifieation columns'-packed with high potOsity media e been.piloted afseveral locations7,I,20,22,23 and tested full-scale' atl Lago, Texas.24
_
.,;
A typical schematic illustrating essential process elements is shown on Figuie:,5-8. The mediais normally .!cOntained in pressure vessels.. To obtain sufficient .contact ;; time, a seriesconfliguration.6t 2 or 3 vessels is employed. 7,20,24. Eithqr an upflOw Or downflow columnoperation, may be Used While a variety of media types have been used (Table 5-3), a,
. .,. . . As' : ',;; 't ^
FIGURE 5--8
' ;. -
TYPICYR6CESS SCHEMATIC FOR SUBMERGED '
,HIGH POROSITY MEDIA COLUMNS
BACKWASH WATERTO STORAGE
.
DENITRIFICATION
COLUMN
DUMPEDMEDIA(TYPICAL)
MffHANOL
INFLUENT.PUMP
'
'T.
EFFLUENT TO 'CLARIFICATION OR .
FILTRATION
. ,
DENITRIFICATIONCOLUMN
4.
CLARIFIEDBACKWASHWATER
BACKWASHPUMP

. ,..-coOnlon characterrstie is that a high void volume is rhaintained in the unit. As a ..4-consequence, bionia is:allowed to continuously slough from the,,media, mlnimizing the
.!'requirements for, ba washing: A corollary is thattliikmedia does build up thlayers ofbiomass that would' develoifif lilt vpid fr.actlizin.Were.Snialier such as with sand .Or pebble
%inedia.23 The lower surface' deiiittifICation rates for ormedia compared, to sand orrock (Table 5-3) reflect this 'cliff** in attached` !biomass development.' MO.Sf'aftendumped media have been used, thdugh there is One instance when Corrugated.:shOl.mediahas beeri,tried,23
Backwashing,::thotigh infrequently Used; is still requirecl. Al:i Lago, Texas, where the media.. ..
was Koch 'F leXirings, the water backwash rate was 10 gpm/sf 0'3.5 1/s/rn2) coupled with an.
air backwash ..rate of 10 cfm/sf (3.6 rd/m2/min). Backwashing was routinely done everyfour weeks.24. Backvvashing in thii hype, oCcOlunin is not required due to excessive headlosses in the column; rather, it is requiredto prevent the accumulateclsgolicls in the coluninfrom continuously sloughing into the effluent. and causing high effhierfCsuspended solids.Others have ,.used backwash rates.up to 44. gO in/Sf..(29.7 1/s/m2) but did not use an airbaCkwask'PrOCedure,7,20 The El Lago air-watei'lAck'i'itaSh procedure' is the reCommenaecl-,approacH'If6 ,)'q sign purposes. As opposed to, the situatiOn with respect to other columndesigns, a fairly brdad data' bise:ekists for this colUinniVpd. SinlfaCe removal rates ob.served.,at various locations a.re:SifinMaiized in. Figure 5-.9. As may be seen,:rriost data points fit theme`
;: data correlation of Sutton,:.*..21,20fOr IntalOx saddles.
Figure 5-9 may be used to Size,thedenitrification column. First, peak diurnal nitraWlciading'.., .:and mininium 'wastewater temPerature must: be known From Figur6,.5-9; surface.remoyal :
rate can be determined.. Then from the loading, the media surface'area can be'Calculated.,:..Finally a specifid media is selected and column volume requirements ari:Calculated.. :,
5.3.2.3 Submerged Low Porosity Fine Media:Columns Packed Bed ConfiguratioW .
The submergOcli(q iorosity column using .fine media (Table 5-3) is the column' Systemseeing widest .c8mmercial application at the Dkesent time One manufacturer's concept(Dravo);;of hOW to incorporate this type of colenfinb:treatment plant is shown in Figure.5-10.2r in .this flowsheet combined Carbon wcidatiOn:nitrification Is accomplished in an
,
activated4udge step, Of course, other nitrification' processes could be employed forproducing a nitrified effluent... Clarified nitrified,' effluent' then flows to the denitriflca-tion column. The concept employed in this -floWsheet is that the column cdmbines twofunctions in one First, it serves the purpose Of denitrifying the wasteviater; second, the'column serves the purpose of effluent filtration:Ilia:I normally would .be required in manyplants anyway 27 A disCusion of the cost-effectiveness-of combining.thederiftrification andfiltration functions is presented at the end of this section.
The units manufactured by the bravo Corp. typically consist of 6 ft (1.83 in) of uniforMlygraded sand 2 to 4 mm in size. FiltratiOn rates normally recommended bithe Dravo Corp.When removing 20 nrig/1 NO3 N froni.tnunicipal.-wastewatels are 2.5 :and'1.0 gpm/sf for

FIGURE 5-9
SURFACE DENITRIFICATION RATE FOR SUBMERGEDHIGH POROSITY MEDIA COLUMNS
KEY.
SYMBOL LOCATION REF.
.
MEDIA '
lZ eECIF ICSURFACESF/CU FT*
AVV ID4
.1
1-.,,PERCENT
DaVii,Ca. ^17, Rasctihr 79 80, .a . ',,.. 25 rings
Hamiltb(1., 7, Intalox 142 to. 70 to .78.Ontat;io.- 20 .saddles: 274-,Firebatigh, 22. 'Koch .
Flexiringi05+,
Ai '....1 ET,Lago; 24 Koch 105 - 92,Texas Flexirifigs : . , ..
*I SF Cu Ft =-3.. 28 m2/m3 .
9,5 % CONFIDENCE LEVEL ..
:FOR ONTARIO DATA
.WEIGHTED LEAST pcit..IARs FirFOR ONTARIO DATA .(Rifs: ar14 20
-"'°9° lb/sf/dayK= 90.4e RT
.1'
III
,I kg/ in7day 0 ibitsfiday
,
:. /5 7
.T0/3,E.OATURE,.;
minimum wastewater temperatures of 21 C` and 10 C respectively.31"
The procedure. for backWaShing the Thivo filter begins with one or two riiinu.tes of airagitation followed by 10 to 15 minutes qfairand water ioouring'and finally five minuteswater rinse. Air and water 'backwash...rates. ref:online/00d by 'Dravo are 6 cfih/sf (4.83
.,m3 /m2 /min)` and 8 gpm/Sf(5411/s/M2), respeciively.3Nn addition; it has;b4een fouhd thatnitrogen ,gas aocwnulates in the filter during a' filter run. This imposes a loss of head'on
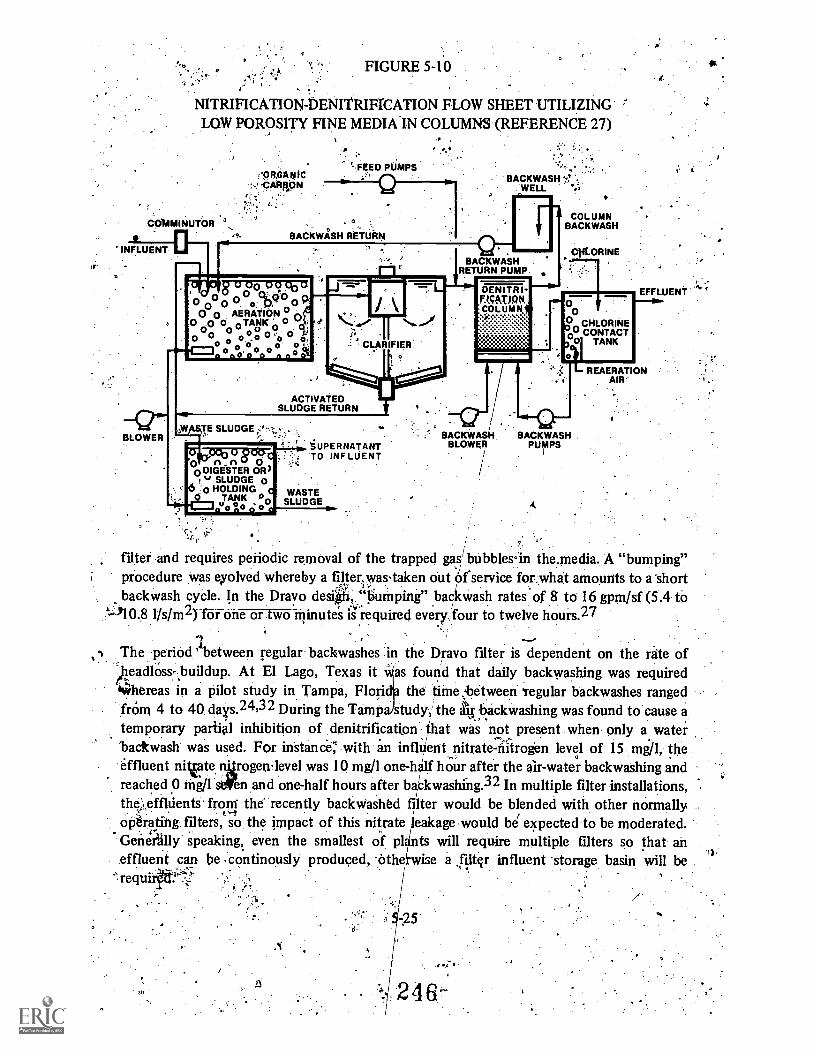
. . FIGURE 5-10
NITRIFICATION-bENITRIFTCATION FLOW SHEET UTILIZINGLOW POROSITY FINE MEDIAN COLUMNS (REFERENCE 27)
FEED PUMPS
C0MMINUTOR
'INFLUENT 1:1
BLOWER
:-..'0A11110N
'4.
.2a
BACKWASH RETURN
a0 0 0 9 20
0pO 0 Q.000 n
0 .0 0 0TANIC 0 "'0 0 AERATION - iNcr0, 0 0 0 0`,0, )
O 0 o. .0 o0 boa, 0 o °
BACKWASHRETURN PUMP.
1.
1 CLARIFIER.
ACTIVATEDSLUDGE RETURN
TAE SLUDGE'
SUPERNATANT
A 10 INFLUENTDIGESTER OR)w SLUDGE 0.0 HOLDING C WASTE
JAaN_K ...00 SLUDGE0 a. a o
DENITRI-MATIQN.icoLuipti
:
1COLUMN
BACKWASH
CIILORINE
00
2 CHLORINE-0tc; C OTNATNAKC T
a0
EFFLUENT
---0-BACKWA51. BACKWASH
BLOWER PUMPS
REAERATIONAIR
filter and requires periodic removal of the trapped gas bubbles-hi the.media, A "bumping"procedure was evolved whereby a filter,wastaken out of service for what amounts to a-shortbackwash cycle. In the Dravo desiii%"bumping" backwash rates of 8 to 16 gpm/sf (5.4 to
1/s/m2) for one or two minutes is required every four to twelve hours.27
The period between regular backwashes in the Dravo filter is dependent on the rate ofeadloss, buildup. At El Lago, Texas it as found that daily backwashing was required
4:ihereas in a pilot study in Tampa, Flori the time ::between Tegular backwashes rangedfrOm 4 to 40. days.24,32 During the Tamp study,' the ais backwashing was found to cause atemporary partial inhibition of denitrification that was not present when only a water
./'backwash was used For instance; with an influent nitrate-nitrogen level of 15 mg/1, theeffluent nitiate qrogen-level was 10 mg/lone-half hour after the air-water backwashing andreached 0 mg/1 Men and one-half hours after bablcwashing.32 In multiple filter installations,theleffldents from the recently backWashed fllter would be blended with other normallyoperating filters, so the impact of this nitrate leakage would be expected to be moderated.Generlally speaking, even the smallest of pldnts will require multiple filters so that aneffluent can be continously produced, -.6thei,vise a .,filt4r influent storage basin will bereq
S
246-

leptime-Microfloo, Inc. has Made available suggested design guidelines for their Mediafesigns.33Four*redia designs were tested on a nitrified effluent cOntainipg 20-30 mg/1 of103-N from an ,ixtended aeration plant. Best ctverallpezformarice was obtained from thewo media design's shown in Table 5-5. Basic conclusions of tke,study were afolloWs:
"Utilizing a' 36:inch (0.92m) mixed-media filter (F-III)! essentially' cempletedenitrifioation of a highly nitrified wastewater can be knieved at filtration' ratedof 1.5 gpm/sq ft (1:01/i/m2) for temperatures , and at 3 gpM/s.f(2.01/s/m2) at tempeiptires Of 2d C.4Themethar;ol_to nitrate nitrogen ratio wasfound 40, be between 2:0 and 2.5. At applied nitrate nitrogen concentrations,of 10mg/1, filter run times between 16 and 24 hoiirto 8 feet ofiradl^ wer9 realizedat a filtration rate of 3 gimi/sq ft: (2.01/s/m2). At highq applied nitrogen levels,
filter runs were reduced in direct relation to nitrogen concentrition."33 Cn another study of a Neptune-Microfloc filter, .a fully nitrified, effluent 'from a tricklingliter was denitrified. No attempt,was made to ddermine:fithiting filter loadings, hoWever.
110,
. .TABLE 5-5
NEPTUNE-MICROFLOQ;MEDIA DESIGNSFOR DENITRIFICATION (REEERENCE 33)
Layer depths, inches (cm)
Filter Mate rival
Garnet Sand40 O. 27:Trim
Silica Sank"d10 0.5 mma
. Anthracite Coal- d10 1,1.05 mma
Anthracite Coal .
d10 1. 75 mma
3
(7.6)
9(22.9).
18(45.1)
3
(7.6)
9(22.9)
(20. 3)
' 16(40.6)
= effective,size,5126.
247`
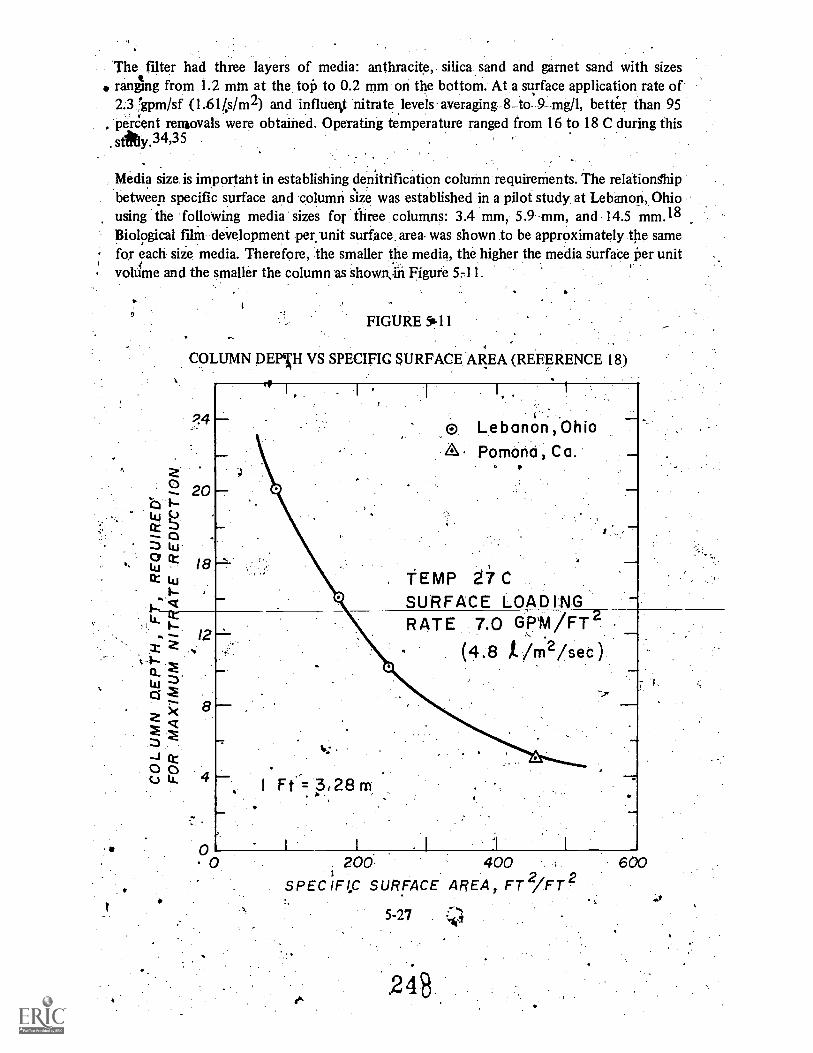
The filter had three layers of media: anthracite, silica sand and garnet sand with sizesranging from 1.2 mm at the to to 0.2 mm on the bottom. At a surface application rate of2.3 gpm/sf (1.61/.s/m2) and influerkt nitrate levels averaging-8--to- 9 mg/1, better than 95perCent removals were obtained. Operating temperature ranged from 16 to 18 C during this
. sttly.34,35
Media size is importaht in establishing denitrification column requirements. The relationsthipbetween specific surface and column size was established in a pilot study at Lebanon, Ohiousing the folloWing media sizes for .three columns: 3.4 nn, 5.9 -mm, and 14.5 mm.18Biological filin dev- elopment per, unit surfAce area was shown to be approximately the samefor each size media. Therefore, the smaller the media, the higher the media Surface per unitvolume and the smaller the column' as showiviii Figure 5711.
FIGURE *11
COLUMN DEPNI-1 VS SPECIFIC SURFACE AREA (REFERENCE 18)
20
(-)cr 5
ct18
kJt-
12
ci>c
-J0C.) IA.
p. Lebanon, OhioA Pomonci , Ca.
TEMP C
SURFACE LOADING
200 400SPECIF1,C SURFACE AREA, FT2/FT
5-27 :,47;
.24B

Care should be exercised in the design of the column underdrain system. Neptune-Microfloc
recommends that an extremely open underdrain system be employed (pipe lateral, Leopold
tile, etc.) to avoid the very real possibility that an overfeed of methanol will cause denitrifier
grOwth to clog the underdrain as was experienced in one test with a nozzle -type
un derctrain . 3
Since it has been proposed to use this type of column for both filtration of suspended solids
and nitrate removal, it would, be well to examine the performance of the columnar system
for suspended solidrremoval. Various observations of suspended solids removal are s wn in
Table 5-6, With the exception of the El Lago, Texas data, the performance of these c umns
FP as tertiary filters falls within the range normally expected for tertiary filtrati n (for
comparative data see Section 9.3.2.3 of the Process Design Manual for Suspended Solids.
Removal, an EPA Technology Transfer publication).36 Suspended solids remova will be
affected by filter desigii and the fact that the filter is operating as a biolo treatment
system as opposed to a purely physical separation process.
In considering the use of this process as both an effluent'filter and a denitrification system,.
an important design factor should be borne in mind that has considerable implications on
TABLE 5-6
COMPARISON OF SUSPENDED SOLIDS REMOVAL EFFICIENCYFOR SUBMERGED. FINE MEDIA DENITRIFICATION COLUMNS
Location Media type. Reference
Surfaceloading
gaihninisfql/ahnq
Depth,It(m)
InfluentSS,
mg/1
.
EffluentSS,
mg/1
Pt
SS removal .
efficiency,percent
El Lago, Texas. Dravo 24 6.27 13 37 17' 54
--(150-=-3-to-4mma (laz) (4) :North Huntington
. Township, Pa
Tampa, Fla.
Draw?d10 = 2.9 mrn,10
pray°
27,28,31
27,31
0.72(0.49)
2.5
6.0(1.8)
a
16
20
7
5
56
75
u10 = 2.9 mm (1.70)'
Lebanon, Ohio d50 = 3.4mma 18 7.0 10 13 4 ' 69
(4.75) (3.1)
d 50 = 5.9mma 18 7.0 20 13 2 85
(4.75) (6.1)
d50 = 14.5mma 18 7. Q 20 13 1 92
(4.75) (6.1)
Corvallis, Or.. Neptune 33 3.0 2.5 25-65 68-88
Media F-fibD (2.04) (0.,76)
Media F-III b 34,35 3.0 3.0 25-65 84-93(2.04) (0.91)
2.5 5.0 13-30 2-10 67-93
Midland, Mi. Nepttme . (1.70) (1.50)
auniformly gradedb Table 5-5
5-28
243
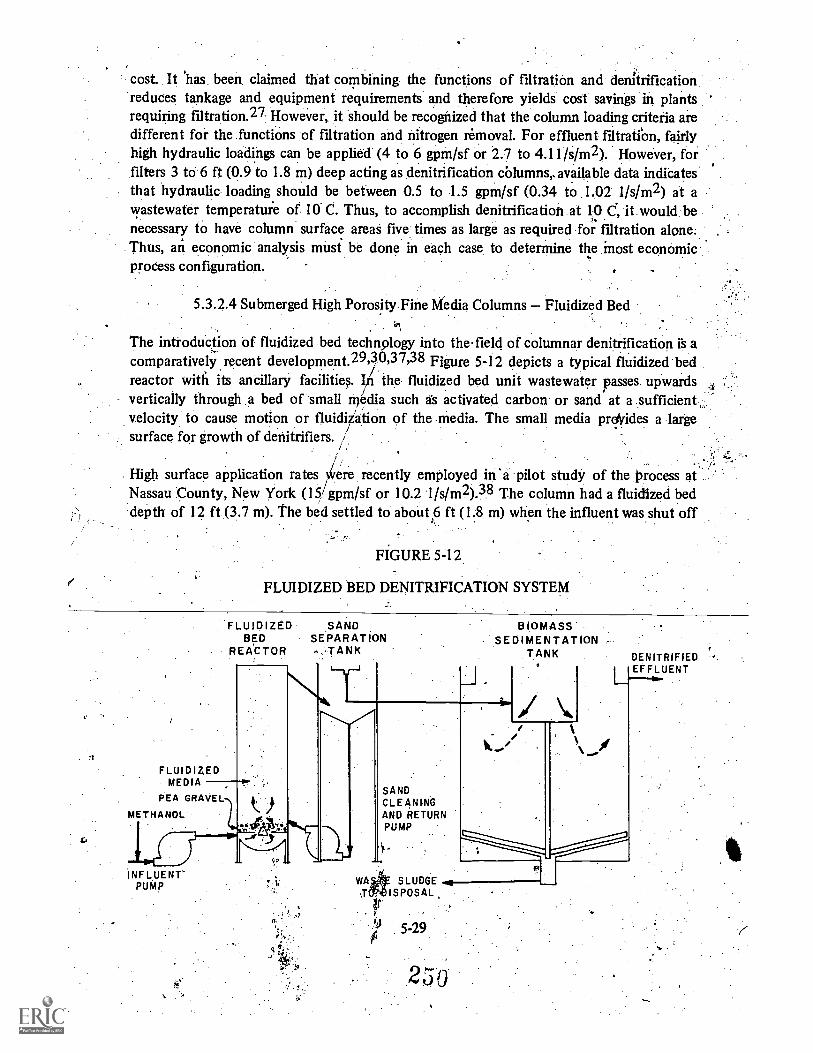
cost. It 'has been, claimed that combining the functions of filtration and denftrificationreduces tankage and equipment requirements' and therefore yields cost savings in plantsrequiring filtration.27 However, it should be recognized that the column loading criteria aredifferent for the functions of filtration and nitrogen removal. For effluent filtratiOn, fairlyhigh hydraulic loadings can be applied (4 to 6 gpm/sf or 2.7 to 4.11/s/m2). However, forfilters 3 to 6 ft (0.9 to 1.8 m) deep acting as denitrification columns, available data indicatesthat hydraulic loading should be between 0.5 to 1.5 gpm/sf (0.34 to 1.02 1/s/m2) at awastewater temperature of 10. C. Thus, to accomplish denitrification at 10 C, it would benecessary to have column surface areas five times as large as required for filtration alone:Thus, an economic analysis must be done in each case to determine the most economicprocess configuration.
5.3.2.4 Submerged High Porosity Fine Media Columns Fluidized Bed
The introduction of fluidized bed technology into the field of columnar denitrification is acomparatively recent development.29,30,37,38 Figure 5-12 depicts a typical fluidized bedreactor with its ancillary facilitiq. I,E the fluidized bed unit wastewater passes upwardsvertically through a bed of small media such as activated carbon or sand at a sufficientvelocity to cause motion or fluidiiation of the media. The small media pro's/ides a largesurface for growth of denitrifiers.
High surface application rates i*ere recently employed in 'a -pilot study of the Process atNassau County, New York (15/gpm/sf or 10.2 1/s/m2).3.8 The column had a fluidized beddepth of 12 ft (3.7 m). The bed settled to about,6 ft (1.8 m) when the influent was shut off
FIGURE 5-12
FLUIDIZED BED DENITRIFICATION SYSTEM
FLUIDIZED SANDBED SEPARATION
REACTOR -..TANK
N,T
BIOMASS'SEDIMENTATION -
TANK
FLUIDIZED
WA
.TIt
SANDCLEANINGAND RETURNPUMP
SLUDGE*
MEDIA
PEA GRAVEL
METHANOL
iNFLUENT-PUMP
ISPOSAL
111, .14
.11A
5-29
250
DENITRIFIEDEFFLUENT

so bed expansion during operation waS100 percents Initially the clean bed in the colUmncontained 1.5 in. (38 min) of pea gravel and 3ft (0.91 m) of silica sand with an effecXivesize of 0.6 mm and a uniformity coefficienfZf 1.5. During operation, the media became,.completely covered. With denitrifier growth and the indiyidual particles grew in, size.During the initial: lab-scale test for this process,. the media grew fron0.65 mm particles, toparticles 3 to 4 mm in size." The attached growth accounts for the greater depth of mediain the non-fluidized bed after the column had been in operation..
In a packed bed, this growth of particle size would result in high heacIfoss, channeling, and ailoss in efficiency. In an expanded bed, however, there are sufficient voids between the
,:
denitrifier-sand particles to provide gOod liquid contact at modestheadlosses. This greaterbiological mil .development all6ws higher surface reactionxates.(expretssed per unit, of mediasurface) than for6any other type of column configudtion as shown in Table 5-3. Since thesurface contained in a unit- volume is-- high, higher volumetric ldadings are also possible ascompared to ank:other.column configuration (Table 5-3). Empty bed detention time duringthe recent pilOt It"Stat..lsSan County was only 6.5 min. Maximum nitrate removal rates as afunction of temperature are shown in Figure 5-13: and are based on the Nassati`Connty.data.39 If diurnal variations in nitrogen load are to be accOmmodated. by :the columnwithout nitrate bleedthrough, then column volume requiremeill be greater than thatdetermined in Figure 5-13. A provisional recommendation would be to increase the reactorrequirements by the ratio of the peakTO average nitrogen loads...
The process has been 'shown to be responsive to both diurnalloa. d variations and to coldtemperature operation.29 Methanol fee.d was not automatically controlled, so periods ofnitrate bleedthrough occurred.29 When methanol feed was tinder control, 99 percentremoval of influent nitrate:and nitrite was demonstrated:Total nitrogen reductions were notgiven.29,38
. .
.While backWashing facilities are not required in this type of column, facilities must beprovidedforinangingtlieolumn--inedia-inven tow_aurin.gioperation4he sieni trific a tioncolunig increases in depth due to biological growth causing a continuous Smalljoss of media'from. the system. Further, diurnal flow variations cause height variations which .maycontribute to media loss.. This loss can be minimized by provisiorr of ffOki.equalizationfacilities (see Chapter 3, Flow Equalization, Proeess Design Manual for Upgrading Existing,Wastewater Treatinent Plants., an EPA Technology Transfer Publication)..4u
The Manufacturer' of the system suggests 'that for most plants subject to diurnal flowvariations, media losses,:and effluent solids levels can be controlled by placing two tanks in.series with the column as shown in Figure5-12. The first tank would be a sand separationtank followed by a biomass sedimentation tank-, for' t;iological solids removal. The sandseparation tank might.be Ory.sniall, as a' tank with an overflow rate of 13,600 gpd/sf (554in3/m2/clay) served satisfactorily during the pilot study. It has been suggested by Ecolotrol,the manufacturer of the fluidized bed system,.that the swixl concentrator- which wasdeveloPed for grit removal from combined storth*ater and wastewaters could serve as the...
5-30
251
.
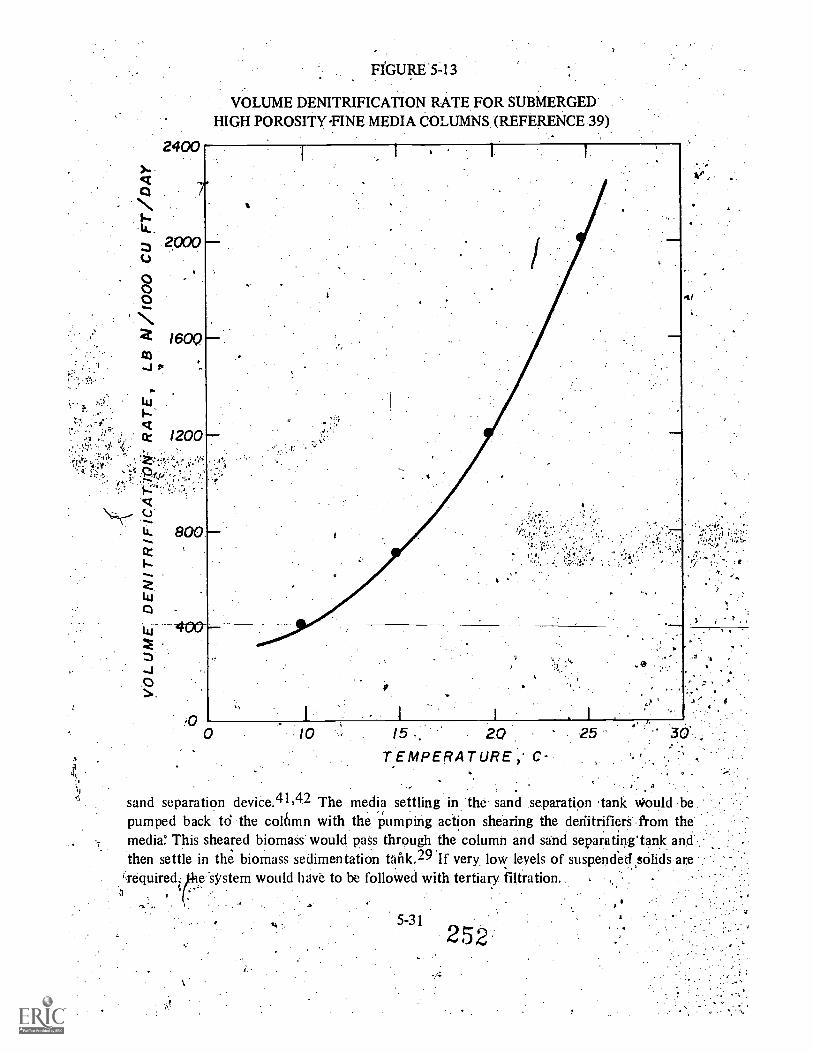
cc 1200
pryt
u- 800.Et
FIGURE'S-13
VOLUME DENITRIFICATION RATE FOR SUBMERGEDHIGH POROSITY -FINE MEDIA COLUMNS (REFERENCE 39)
O -
10 15 2.0 25 30'..
, TEMPERATURE , C-,fi
,
sand separation deviCe.41,42 The media settling in 'the sand separation 'tank Would bepumped back td the col&mn with the Pumping action shearing the deriitrifierS from themedia! This sheared biomass would pass through the column and sand separating' tank andthen settle in the biomass sedimentation tank.29 If very low levels of suspended solids are
',required; e'sS/stem would have to be followed with tertiary filtration.
5-31
252
Theinafitifacturer's cost estimate indicates that the fluidized bed syStein is competitive withgrowthgrowth or packed bed columnar. systems, but it was also stated that these must beby larger scale tests on. the fluidizes 'bed system.29
5.3.2.5 Comparison of Attached drowth Denitrification'Systems
The three column systems previouslY descAbed;in Sections 5.3.2.1, 5.3.2.2, and 5.3.2.3 are'speliai.,Commercial applications at this ti the fluidized bed system described in
,:;Sect on( 5.3.2.4 will likely see application in ,e ri.dar future. T!erefore, the design engineer,'his'ifotr alternative column systems to considei.
Ai/hete:low treatment plant effluent-'solids are required, tertiary filtration will have to followall column systems except the low porosity fine media system described in Section 5.3.2.3.
p1T2ts, the elimination of a unit process may favor cOmbining the denitrificationand filtrdtion functions. In larger plants the cost trade-offs betWeen alternatives need to beconsidered.
--..Where space restrictions exiSt at a plant site, there is an incentive to pick those systems.requiring 'the least land.area possible. While from Table 5-3 ifmight appear that the fluidized:.hed.,,had the distinct achantage because of highest' volumetric loading rates, the ancillary-sand separation and biomass sedimentation tanks diminish its advantage over the submergedfine media column and the nitrogen'gas filled COIiiinn.
.k1he submerged high pOwity Column configuration appears to offer the least attractivealternative: Both surfac*d voldmetric removal rates are 10W; reqqirhig comparatively large
`reactors 'Further, thes-unit must incorporate the,.:Aq'sigrr features, of a filter,withetit. having t 6..'advarieige of :low effluent suspendOd sOlids: of 'the submerged lowporoSity ' coluin, ,he System hag an advantage for 4011, treatment plants in thatbackwashing is i:irifreqiieriOltequired and can be Schedilled to coincide with plant staffavailabili
-.
The advantageg*O( the nitrogen gas filled ti?Iprnin are (1) similar space requirements to lowporosity submergedicolunmS .(2).;coluM.n.,walls need not be designed to handle hydrostaticloads and (3) with, proper. 'rnedia..selectic4/, slou g occurs naturally and backwashing is
.
not required.
5.4 Methanol Handling, Storage, Teed CO)itiql;:and tX&SS Methanol Removal
Methanol is a chemical not norinallk:dealt*ithiffWastewatet.treatment plant operation andcare must be exerted in the design 4eraliatatinethanOt handLing,..storage and feedingfacilities to ensure its safe and proper. '14Se
,. , - .
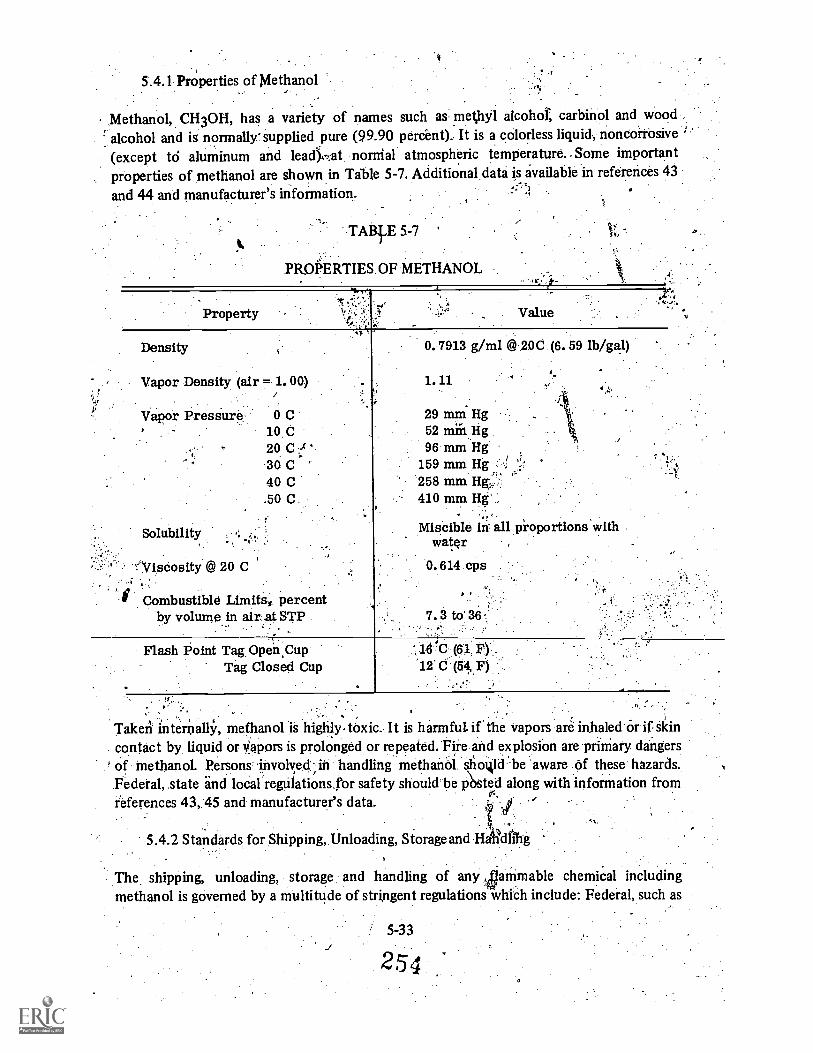
5.4.1 Properties of Methanol,
Methanol, CH3OH, has a variety of names such as methyl alcohol, carbinol and woodalcohol and is normally' supplied pure (99.90 percent). It is a colorless liquid,noncorrosive
(except to aluminum and lead"),tlat nomial atmospheric temperature Some importantproperties of methanol are shown in Table 5-7. Additional data is available in references 43
and 44 and manufacturer's information.
TAPE 5-7
PROPERTIES OF METHANOL
Property Value
Density
Vapor Density (air = 1.00)
Vapor Pressure'
Solubility
@ 20 C
Combustible Limits., percentby volume in air, at STP
0 C10 C20 C '30 C40 C
.50 C.
0.7913 g/ml @ 20C (6.59 lb/gal)
29 mmHg52 min Hg96 nun Hg
159 mm Hg .
258 mm410 mm Hg
Miscible all proportions withwater
0.614 cps
I.
7.3 to 36
Flash Point Tag Open CupTag Closed Cup
16 (61. P)'12' C (54, F)
. . ,
Taken internally, methanol is highly. toxic. It is harmful if' the vapors are inhaled or if skincontact by liquid or Vapors is prolonged or repeated. Fire and explosion are priniary dangers
° of methanol. Persons involved;ifi handling methanol oi4ld be aware of these hazards..Federal, state and local regulations.for safety should be p ted along with information from
P,references 43,.45 and manufacturer's data. roec.,4_
5.4.2 Standards for Shipping, Unloading, Storage and Handling
The, shipping, unloading, storage and handling of any krrimable chemical includingmethanol is governed by a multitude of stringent regulations which include: Federal, such as
5-33
254

the Department of Transportation (DOT) and the Octupational Safety and Health Act(OSHA); State, which has various safety orders and codes; municipal ordinances;independent associations. such as the.4National Fire Protection Association (NEPA) and theManufacturing Chemists AssociatioT(MCA) and insurance requirements. It is necessary thatall of these regulations be reviewed and studied before the design of any methanol facilities, .
and all such regulations must be followed.
5.4.3 MethanolpeliVery and Unloading
Meththibl may be feceived,O:S.gall&n (208 1) metal drums, tank wagon, tank truck or tankcars. Other methods of 41 :Wing; not discussed herein, are 6y barge, metal drums (less than55 gal) and glaS's and metal cans., Tank' 'N,tailons are normally 1,000 to 4,000 gal (3;785 to15,142 1) in siZe..e.taiik trucks range frOa4:000,to 9,000 gal (15,142 t6,34,069 1) while tankcars are shipped in 6,000, 8,000 and 10,000 gal (22,713, 30,283, 37,8541) capacities. Tankcars and tank trucks are the most economical shipping mode for most plants. However, for.pilot work and small plants, 55 gallon metal drums may be feasible. Since methanol is !
classified as flariimable liquid by ;the; DOT, all shipping containers must be approved andlabeled in aad6tilarl'te With applicablepOT reiulations.
.
The-xeCprinn*idedAnethod of unloading methanol from any container is by pumping. Some.,2.,barge's' and1/2tank*agons have their own pumps for unlqading. Tank cars andtiuCls.,can be
,unloaded .frOnflhe.ton or bottom and lie ..punied.br.donveyed by gravitY or syphoning: Thepreferted method' of unloading. is pumpirig from: the lop via an eductor tube. Syphoning and.,gFvity unloadirig, are only permitted vtlien the. top of the storage vessel is,below the bottom-of contalner.:-, Due to the increase ,spillage probability using bottom untoadirig,it is only peimitte& 62.0 di$.-61..trucks apProvel for bottom unloading which Include ,valvink..approved by the.Ass*ation of Arneriban Railroads (AAR) and in agreement with the DOTreqifirernents. This r7 0,1 11°elps contain the product by safely controlling flow. AdditionalpriCantioiis such as.fa*link Valves and excess flow valves may be used.
i,preSsunzation of the tank ("air padding") must never be used for methanol unloading.top unloading using the water displacement method 'or inert gas padding, i.e::
641:bOng-dioxide, nitrogen, etc., may be used if the exact unloading procedures are as providedthe;heinical Manufacturer. Unloading procedures can be found in referenc s 43 and 45
andthe supplier's data
General requirements for the4
design of unloading' facilities for methanol e applicable toboth tank car and truck. The unloading area should be arranged to avoid affic areas. Also,all facilities should be outside due to the fire hazard and all equi nt in the vaPOr areamust be explosion-proof, Class I, Group D, Division 1, or 2 per the National ElectricalCode.Tools should be "non.vparking." Unloading should occur during daylight hours since thesafety and lighting requiremehtS for night Operation are very extensive. Ample 'fireextinguishers, safety ;blankets, deluge showers, eye' washes, no smoking signs and 'unloadingsigns are also required.
5-34
255

If Op unloading will be practiced, approach platforms are required for access to the top of,
the tank.461; 7'he approach platforms used at the CCCSD Water Replamation Plant are steel,
swinging "type: with pneumatic operated drawbridges. These drawbridges provide for three
feet (0:9 m) of horizontal adjustment, 30 in (76 cm) of vertical adjustment and a 45 degree
pivot to either side: for ease in Unhiading both tank cars and trucks. The drawbridges fold to
the platforms when not in use 'providing the required railroad clearances.
In all unloading setups, all equipment must be grounded. This includes the shipping vessel,interconnecting piping, pumps, approach platforms, etc. Also, bonding jumpers must beused to provide a good continuous,system. Periodic checks of the grounding system must bemade.
Static electricity buildup must be minimized since it is not dangerous until aCthe sparkdischarge level. A spark diSeharge can easily start a 40, or cause an explosion. Ikefer to
a.
reference 47 for static electricity accumulation preV.entl,* ...
,:-.:1 .;
..: i. , , ,
Facilities for truck unloadi4 Must provide"for ease in,trutkThaneu v g and
leaving the area ConsideFaliOn must be given to the niimber.OffirOliddii,a1 bnlOadirig spotsregarding freqUeney.;6fine, sPice and simultaneous .unI4c1big. For eaSein truck traffic, it isbest to have parallel unlOading. areas for straight-through driving. ,
Rail unloading createS'..additional considerations: Unloading areas must have derails or aclosed switch a minimum of one car length from the car. A=',primary concern is who spotsthe cars,. the plant or the, railroad:"' It is preferable to have pthate sidings so the railroad can.drop off or pick 'up cars at any time without disrupting plant operations. Als0;the cost ofhaving the railroad spot cars at night, over weekends or fr. olidays is high and because therailroad cannot guarantee time of shipment, safety, provisions and lighting must be.providedfor night Operations. Two sidings, one for empty cars and one for full cars should be.provided. The cars can be spotted by the plant personnel With rail car movers which operateboth on rail or streets or in the case. of short distances, car-votters (winches) can be used
j3y paving the ,railroad yard area, both truck and rail unloading can be practiced. This is.,:..hviintageous because major strikes'affecting either kind of-transport cannot cripple the
plant. At the CCCSD Mater ReclamatiOn Plant (described in Section 9.5.2.1), two sidingsare provided with space for ten cars on each track for storage. Unloading,iaings with twoplatforms and two bottom stations will be used for simultaneous spotting and unloading. Arail car mover with a' capacity of two is also provided.
Unloading 'equipment is.normally .steel but many othg materials, except aluininum, areacceptable. providing they can withstand the pressure and are Completely grounded.Pumps must.be !`non-sparking",such as bronze fitted steel pumps with bronze impeller& Many materials..
are compatible with methanol so seals and gaskets can. -be common materials. Pumps may beeither centrifugal or positive displaCeMent gear,type. However pOsitive displaceliient pumbs
must have relief valve's. Because of the widely varying heads encountered during .

-'4 S
4r hArunloading, care must be taken-. in. pump selection. Piping should have as few: join4,possible and should be Schedule 40-minimuM. Splash guards at joints maybe desiitptiri traffic
'.areas. Valves may be gate, plugof diaphragm, iron or steel With bronze: trim, and neoprenePlugs in the plug valve or a neoprene disc in thediaphregm valves..Refineries,on theNest2Coast have adopted a standard f .cast steel N?alVes on all flammable materials to :preventdamage during a fire:, Couplings) st.tegjeak tight and is preferable, to have a valve,neXt tothe coupling to limit material .andwaste. ddring disconnection. If flexible: hoseconnections are used, a cou an pteiral valve can be used A strainer should beused aheardOf any puMping
Care must be exerci&ed' to-snot-15vshutoff should be utilized. Due to*P.the increasing cOst of 'methanol, it niay be desirable Itohave a flowineter in the unlOading vessels must be vented during unlciading or .
loading., 7
, the storage vessel. A .high level alarm.anfl :pump
:.544.Methanot Storage
In ortler, to provide for posSible delays in methanol delivery, a storage capability, of two to..
fonr Weeks. supply is recommended. The volume of storage will "be determined by varioussite and cost requirements; however, storage of less than two weeks is too short for expecteddelivery delays and strike& Tank truck delfveries require in-plant storage. However, with raildelii7eries; the rail cars can be used for sforage, but charges (demurrage) are levied by thecarriers for time on,site ex4tess of a fixed time For small plants, demurrage may becomecost effective. However, carriers may have a time limit on cars or have excessive demurragecharges.
Methanol may be stored in vertical or horizontal tanks above ground inside or outside, orburied. It is strongly 'recommended that all fnethanol equipment. and tanks be locatedOutside. If interior storage is required refer to reference 43 and 44 for detailedrequireinents.An exception to this ride is drum storage which, if not stored indoors, must be shaded froindirect sunlight or constantly sprinkled with water.
Layout of methanol tanks shoiiid be,in accordance with reference 48: There should also be adike ,around each aboveground tank or group of tanks to contain 125 percent of the largesttank volume in case of rupture or fire. If the tanks are notof steel, care must be taken so that afire will not cause' a rupture in the -grqup -of ,tanks thereby overflowing the dik.. Fireprotection is very critical, especially when the 'tanks are near other structures. Fir largevolumes of methanol storage, low expansion alcohOl-type foam is used for fire extinguish-ing. For very. small fires, dry chemical or carbon dioXide extinguishers can be usedRate-of-rise or ultraviolet detectors may be used for sensing of fire and initiating automaticfoam releases Wate)- should not used, but may be used for plant area fire control.
Sttrage tanks are, normally of steel, but most materials are satisfactory except for aluminum.Tank size is only dependent epori the capacities required and any size limitations imposed
5-36
25 '7

by the tank material. Piping, valves,'.eitc.i..;should bias deSCribed;-in SechQn 5.43. Tankfittings should include. the following: i(I) an `inlet with dip tube to prevent sPlash and Static-electricity, (2) an'.anti-siphon valve or` hole Onthe: inlet tOprevent back siplionage; (3) ventpipe with pressurevaciitini relief valve48 with flame arister, (4) an. outlet connection; (5)-a,drain connection, and (6) various oPenings for depth ianges,sample points, level Switches,'
.etc. Manholes, for access should also be provided. AlsO;extrprne corrosion will-take'place ifthe tank is drained dry. The tank must also be gr, nikd. to increasing air pollution,requirements, venting must be controlled by' conse atiOn type vents or bk.niaintaining..aslight negative,pressure in the tank using a small ejedt
To)naintain a correct inventory of tank contents,., a diaphragm. leiel sensor Or float shouldbe used Low 'and high level, alarms are needed fort protection against 'overfill' and settledmaterial at the bottom of the tank. The high level arm should heieparate from the tanksensors for a fait'- -safe design.
5.4.5 Transfer and Feed
Methanol must be transferred and controlled from t storage vessel to the point ofMethanO1 is removed from the tank and is fed by gra ty or pumps: Norrnally,,puMping:Willbe utilized for ease of control. The transfer pumpeshOuld. always have poSitiye.,st4tiori'pressure and should be protected by a strainer. As with all methanol situations;, it.desirable to mount all equipment outside. There are three basic pumping arrarigernentSWhich can be used (1) diaphragm chemical feed pumps ,using an adjustable strOies'for .volume control; (2) positive displacement pumps with variable 'speed driVegCOntrolle'd bY.
either counting revolutions to obtain flow or using a flow meter;':(3) centrifugal orregenerative turbine pumps with variable speed drives controlled by a flow meter.: Eacharrangement has its own particular problems and must be studied for each installationr-Tocover the widest range of feed rates, arrangements. are used due to, the liinitedaccuracy-range of flow meters.
A .
All punips, piping, etc., should be the same as noted in Section 5.4;3: All piping should betested for 1.5 times- the maximum system 'pressure for 30 minutes with zero leakage.;
/Methanol addition to the denitrification process is relatively simple -In 'the CCcSD's,,,Advanced Treatment Test Facility, methanol was pumped into the influent line ahead of the'denitrification reactor and the stirring of the reactor was sufficient' mixing. In the cccspWater Reclamation Plant, a multi-orifiee diffuser is used to evenly distributemethanol in thechannel ahead of -denitrification.
5.4.6 Methanol. Feed Control
Because methanol, is expensive and a methanol overdose: can result in a high effluent BOD5,it is essential to accurately pace methanol with oxidiied nitrogen load. Simply pacing-methanol dose against plant flow is inaccurate as ikdoes not account for daily and diurnalvariations in the nitrate concentration. Feed forward control utilizing plant flow and

nitrification went nitrate nitrogen is shOwn in Figure .5-1 Feed ratio is apProximatelythree parts methanol per part of nitrate nitrogen by weight (See Section 3.3.2). This, methOdrequires; continuous on-line measurement of nitrate _Utilizing an .automated: wet chemistryanalyzer. The wet chemistry analyizef (AIT) outputis proportional to nitrate concentration .
in the nitrification ,effluent. The manual. controlconcentration
(HIK) provides means' to selecteither the analyzer output nu. or to enter a manual. concentration Value in case of analyzer*failure. The outptit of 'HIK is multiplied' bya signal ,proportional_to,flow from the ratiostations (FFIK) to obtain a signal"Proportional to required methanol flow ratio:This signal.May then be fed to a chemical proportioning pump, as shOwn, or may be the setpoint of aflow control idoop FFIK provides mean to adjust the methanol feed ratio. The
-dependability of this control procedure is predicated Oh the reliability, of the automated wetchemical analyzer. These analyzers require very careful routine maintenance and calibration.In a °research laboratory environment methanol was paced with the use of a Technicoh AutoAnalyzer for one week periods between maintenance checks.
NITRIFICATON,EFFLU,ENT:
FIGURE571 4
FEEDFORWARD CONTROL OF METHANOLBASED ON FLOW AND NITRAWE NITROGEN
fot
O
01D
, A I T.
,NO3
DRAIN
5.4k7:',.Exce§s Methanol RenioVal
Unless specie,,. measures'. 14 e: taken to provide. for ;Methanol removal, 'methanol addition ,;1
above stoichi'yietric requirements .(Section will 'cause methanol to appeaDln-the
. KEY:
FT = Flow Tl'anamitterFFIK = Ratio Station -
A.IT = WeVChernicai..Analyzer
-1-11iK.FAutp/Mariva I
;Control Station.I`
.5;CI:1Anilog:MuLtiplier
TO! D.ENITRIFICATION
.denitrificatiorirocess,effluent.3,41,) 5,1 6,21;29,32,49,50 In one. instance, : alnevii-; anoloverdose cause Igt effluent BODT5 -of 106 ,mg/1.3 Placing tOtalreliaiipe on th0.'ineti441-01,feed,'":::,:45
control system .tb ?prevent methanol overdoses piay `.be un4atktic :in sm4BijiTarikltdite.:atrained technician'S 'attention can be expected, o e iriffeili4iit,. The Ptijitit;W ,-,,,a*odmethanol control system' and a methandl .-rein vi pritpain, aS.:;tilOkiiPsiir40, nearlyfaikafe operation in terms Of. rtreyeriting eft cants **II:ley:els Ofciriernes,;
=
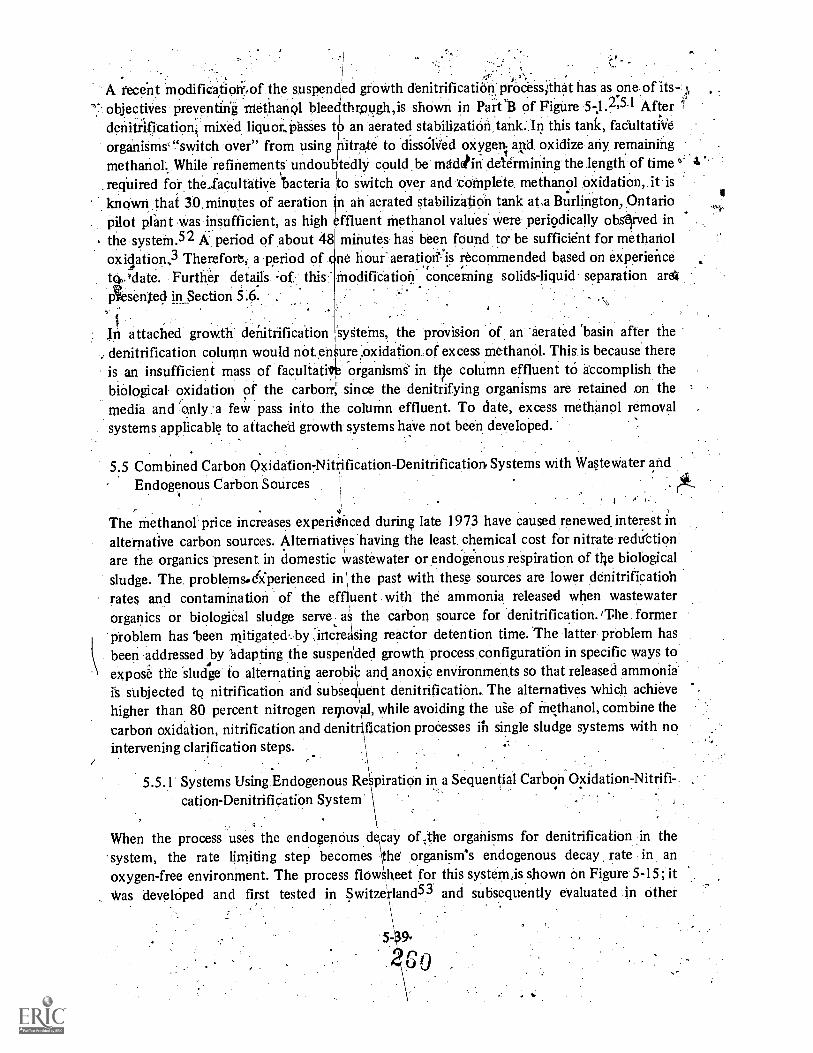
..i
A recent modifiCatiolifof the suspended &mirth d'eriitrificationprOceSs'ithat has as one:of its- ,!,objectiVes. preventing methanol bleedthrpugh,is shown in Part Is of Figure 51.451 After 1
.,
deriiirification mixed liquor..PaSSes t an aerated stabilizatiOri;tank.ln this tank, faehltatiVeorganisms- "switch over froth using i.itrite to dissOlVed oxygeni and. oxidize any remainingmethanol While refinements undoubtedly could .be madatin determining the length of time '4. 4.'
.reqUired for the-facultative bacteria to switch over and tOinplete methanol Oxidation, it isknown .that 30Minutes of aeration n ah aerated stabilization tank at.a Burlington, Ontario ..i.
pilot plant was insufficient, as high ffluent methanol values' were periodically obArved in. the systein.52 A period of about 48 minutes haS been found to be sufficidnt fdr methanol
oxi4ation.,3 Therefore, a period of he hoursaeratiorTis recommended based on experience.:tO,.vdate. Further detail's 'of: this Modification concerning solids-liquid separation areaAsenIed in Section 5.6.
. ,,:. -
\.; .
in attached growth. denitrification SySterns, the provision of an aerated 'basin after thedenitrification column would notenSure.oxidatiOriof excess methanol. This is because. thereis an insufficient mass of facultatil; organisms' in the colUmn effluent to accomplish thebiological oxidation of the carborr since the denitrifying organisms are retained on the ,
/media and only:a few pass into the column effluent. To date, excess methanol removal .
systems applicable to attached growth systems hive not been developed... .
. .
5.5 Combined Carbon Oxidation7Nitrification-Denitrification Systems with Wastewater and
Endogenous Carbon Sources.
.
, . .The Methanol price increases experienced during late 1973 have caused renewed interest inalternative carbon sources. Alternatives having the least chemical cost for nitrate rechi'ction
are the organics present in domestic wastewater or endogenous respiration of the bio14calsludge. The. problemsdiperienced in '\ the past with these sources are lower denitrification
rates and contamination of the effluent with the ammonia released when wastewaterorganics or biolocal sludge serve as the carbon source for denitrification. /The formerproblem has been mitigated,. by ,iricreaSing reactor detention time. The latter problem hasbeen addressed by adapting the susperided growth process configuration in specific ways toexpose the sludge to alternating aerobe and. environments so that released ammonia.is sUbjected to nitrification and subsequent denitrificatibn, . The alternatives which achievehigher than 80 percent nitrogen rerpoVal, while avoiding the use of methanol, combine thecarbon oxidation, nitrification and denit 'fication processes in single sludge systems with nointervening clarification steps.
/ '5.5.1 Systems Using Endogenous Respiration in a Sequential Carbon Oxidation-Nitrifi-. .
cation-DenitrifiCation System.
When the process uses the endogenOus d cay of,the organisms for denitrification in thee
system, the rate limiting step becomes the organism's endogenous decay rate in anoxygen-free environment. The process flow beet for this systein:isshown on Figure 5-15; itwas developed and first tested in Switzerland53 and subsequently evaluated in Other
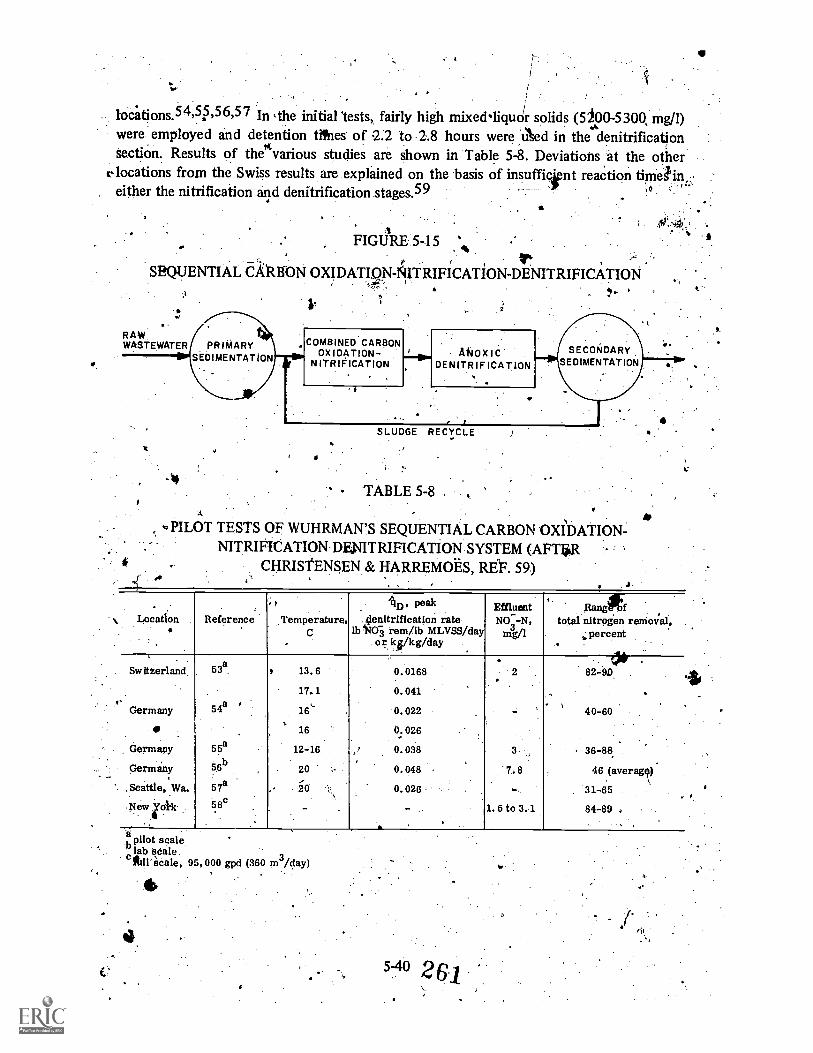
loc..ations.4,5,5657 In ,the initial 'tests, fairly high mixedliquoir solids (5/00-5300, mg/1)were employed and detention tines of 2.2 to 2.8 hours were used in the denitrificationsection. Results of thew`various studies are shown in Table 5-8. Deviations at the other
("locations from the Swiss results are explained on the basis of insufficient reaction thrieJtinc,either the nitrification and denitrification stages.59
SEQUENTIAL
FIGURE 5-15 'vb
&It BON OXIDATION-AITRIFICATION-DENITRIFICATION
le
RAWWASTEWATER PRIMARY
SEDIMENTATION
it
Hk-='
COMBINED CARBONOXIDATION-
NITRIFICATION
t
ANOXICDENITR IF ICA T ION
SLUDGE RECYCLE
TABLE 5-8
SECONDARYSEDIMENTATION
aPILOT TESTS OF WUHRMAN'S SEQUENTIAL CARBON OVDATION-
NITRIFICATION DENITRIFICATION SYSTEM (AFTVARCHRISTENSEN & HARREMOES, REF'. 59)
S.
Location Reference
,
Temperature,C
4ID' Pe akdenitrification rate
lb 'NO3 rem/lb MLVSS/dayor kji/kg/day
EffluentNO-N,
mph
,Ranglitf
total nitrngen removal.percent
I
Switzerland
Germany
(III
Germany
Germany
, Seattle, Wa..
New Yak
53a
54a
55a
b56b
57a
58c
t
,
13.6
17.1
16,_
.
16
12-16
20
20
.
0.0168
0.041
0.022
0.026
0.038
0.048
0.026
-
2
i
3
7.8
-
1.6 to 3.1
-
.
82-9D
.. .
40-60
36-88
46 (averag)
31-65
84-89
pilot scalelab Seale
Atill'scale, 95,000 gpd (360 m3/day)
54° 261
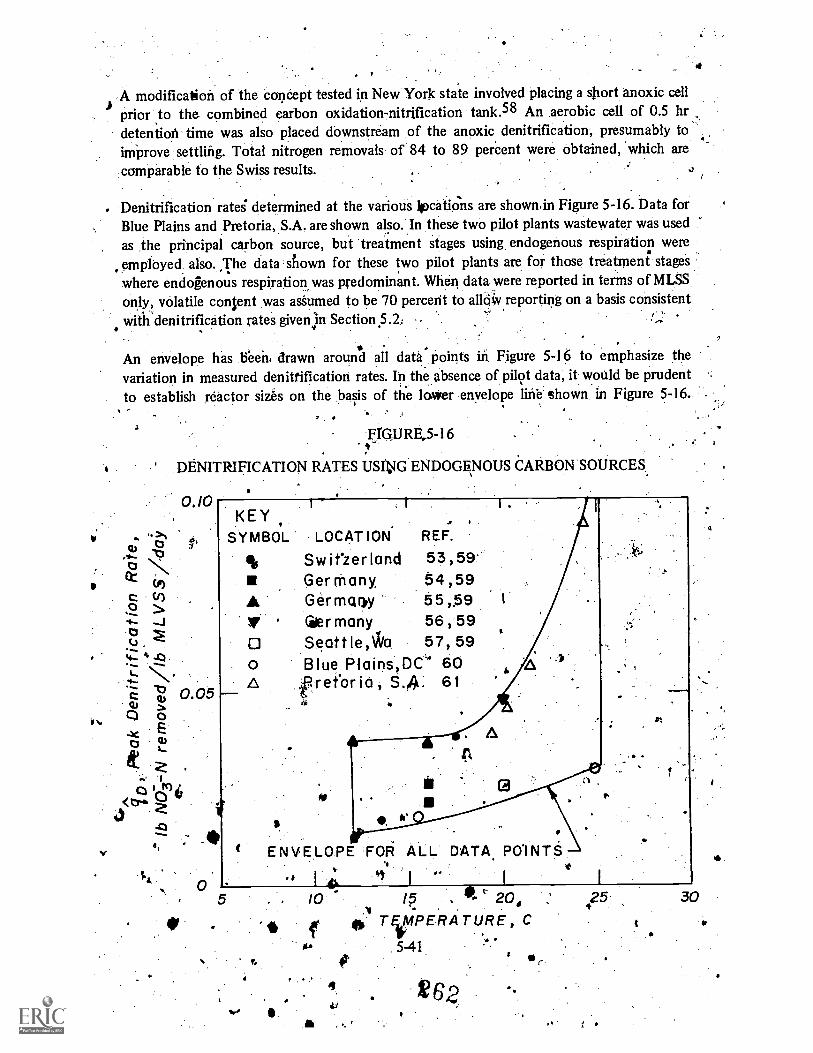
A modification of the concept tested in New Yorjc state involved placing a short anoxic cell
prior to the combined carbon oxidation-nitrification tank.58 An aerobic cell of 0.5 hrdetention time was also placed downstream .of the anoxic denitrification; presumably toimprove settling. Total nitrogen removals of 84 to 89 perCent were obtained, 'which arecomparable to the Swiss results.
Denitrification rates determined at the various liocatip-ns are shown.in Figure 5-16. Data forBlue Plains and Pretoria, S.A. are shown also.In these two pilot plants wastewater was usedas the principal carbon source, but treatment stages using endogenous respiration were
employed. The data shown for these two pilot plants are for those treatment stageswhere endogenous respiration, was predominant. When data were reported in terms of MLSSonly, volatile consent was assumed to be 70 percent to all,* reporting on a basis consistentwith .denitrification rates give* Section 5.2:
An envelope has been, drawn around all data points in. Figure 5-16 to emphasize thevariation in measured denittification rates. In theabsence of pilot data, it would be prudentto establish reactor sizes on the basis of the lower envelope line shown in Figure 5-16.
F]rQURE..5-16 .
DENITRIFICATION RATES USIbiG ENDOGENOUS CARBON SOURCES.
0.10KEY
SYMBOL
o Blue.Plains,DC' 60A 19 r et or i a , S.A. 61
LOCATION REF.
Switzerland 53,59'Germany, 54,59Germary 55,59Gier many 56,59Seattle,ka 57,59
ENVELOPE FOR ALL DATA POINTS
". 10 t 20,
f 0 TVIPERATURE, Csia 5-41
it' go,
25 30

Further, rates shown in Figure 5-16 'are peak nitrate removal rates, to, and a safety factormust be employed in design to ensure low nitrate levels in the effluent, as is done,in Section5.2. It is notable that these rates fall considerably below those shown for n4thanol as thecarbon source in Figure 5-2. For instance, median values at 20 C for methanol andendogenous carbon are about 0.25 lb. NO3 N rem. /],b IILVSS/day (0.25 g/g /day) and 0.04lb NUJ- N rem./lb MLVSS/day (0.04 g/g/day). Therefore, a denitrification reactor using anendogenous carbon source would have to be about six times larger than a reactor with a ,methanol carbon source at 20 CY.
Tile Combined carbon oxidation-nitrification step can be designed with the criteria set foithin Sections 4.3:3 and 4.3.5, because it has beam, found that the anoxic denitrification step..has no 'impact on sludge. activity, if the length of the anoxic period is below 5 hours.5.5,62In the calculations for the carbon,oxidationnitrifkaticin function, only the inventory underaeration should be included in the solids .retentipn time., growth rate, and removal rate'calculations. t.
A
5.5.2 Systems Using Wastewater Carbon in Alternating Aerobic/Anoxic Modes
All of the systems using wastewater as the chief organiecarbon source for denitrification usean alternating aerobic-anoxic sequence. of- stages, without intermediate clarification, toeffect total nitrogen-removal while attempting to avoid ammonia nitrogen bleedthrough.Some of the demonstrations of these systems have Shown that removals of 90 percent were,possible with the alternating mode concept.
5.5.2.1 Aerobic /Anoxic Sequences in Midation Ditches
Pasveer was the first to investigate denitrification in oxidation ditches and reported totalnitrogen removals of 90 plient, but few details have been reported.59,63 Subsequentinvestigators have confirmed Pasyeer's results and defined the conditions required for
I. denitrification in oxidation ditches:-a
,
Ditch design has varied among investigators pkiricipallAin themeans used for aeration. Eventhough aeration devices have ranged from KesSner brushes and cage aerators to verticalturbine mechanical aerators, all the variations can be termed oxidation ditches because alluse the concept of a channel with aeration devices placed at localized points as-shown inFigure 5-17. By controlling the level of aeration, the mixed liquor is exposed to alternatingaerobic and anoxic zones. The channel operates as an "endless channel" since only a portionof the mixed liquor passing the channel outlet is withdrawn, with the bulk of the flowremaining in thechannel. In this way, the mixed liquor is recirculated many times throughaerobic and anoxic'zones prior to discharge from the channel.
The largest scale test of the oxidation ditch employed for nitrogen removal has taken placeat the'Vienna-Blumenthal plant in Vienna, Austria.64,65 The plant flowsheet is shown inFigitre 5-18 and design data are giyen in Table 5-9. The plant consists of a pumping station,
5-42
263
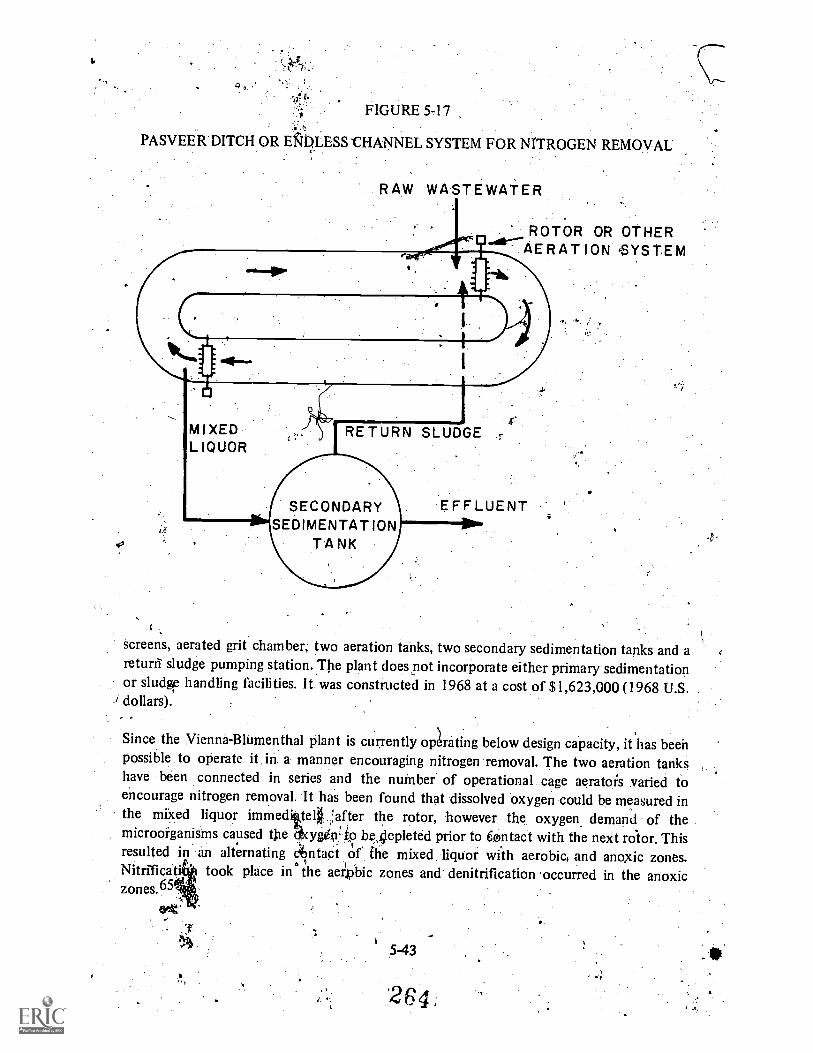
I
FIGURE 5-17.
PASVEER DITCH OR EgOLESS CHANNEL SYSTEM FOR NITROGEN REMOVAL
RAW WASTEWATER.
ROTOR OR OTHERAERATION ,SYSTEM
RETURN SLUDGE r
SECONDARYSEDIMENTATION
TANK
EFFLUENT
screens, aerated grit chamber, two aeration tanks, two secondary sedimentation tanks and areturn sludge pumping station. The plant does not incorporate either primary sedimentationor sludge handling facilities. It was constructed in 1968 at a cost of $1,623,000 (1968 U.S.dollars).
Since the Vienna-Blumenthal plant is currently opLuting below design capacity, it has beenpossible to operate it in a manner encouraging nitrogen removal. The two aeration tankshave been connected in series and the number of operational cage aerators varied toencourage nitrogen removal. It has been found that dissolved oxygen could be measured inthe mixed liquor immedittelVafter the rotor, however the oxygen demand of themicroorganisms caused the tfxygfin:ip be,filepleted prior to contact with the next rotor. Thisresulted in' an alternating c6ntaCt of the mixed liquor with aerobic, and anoxic zones.Nitrfficati took place in the aerObic zones and denitrification -occurred in the anoxiczones.65
ert
5-43
264,

, EFFLUENT%
FIGURE 5-18.
VIENNA-BLUMENTHAL WASTEWATER TREATMENT PLANT
a
PAIR OF MAMMOTH ROTOR
AERATIONTANKS
RETURN SLUDGE:4 PUMP STAT ION
[15 X C E S,S
SLUDGETO SEWER
GE.
fo
FINALSETTLING
TANKS
,GRIT .CHAMBER
IlkSCREENPUMP STATION
INFLUENT
5-44
65
l" '
OPERATIONBUILDING

TABLE .5-9
. ,
DESIGN DATA FOR THE VIENNA-BLUMENTHALTREATMENT PLANT (REFERENCE'65)
Population equivalentsAverage dry:weather flow (ADWF)
,Aerated grit re,rtioval, tanks
/slumber" a
Volatile '
Detention tithe,. . . .
Aeration tanks 4 '
is0, 00e-'22.8 mgda (1.0 m3/sec)
19,500 cu ft (270 m3)
4.5. min .
"..NumberPassiSs/tank I
WidthiPaSS 'DepthVolume - total.Detetitiotvtltne:ADWF.Cage aeratdt Pairs/tank
...HorSePower eAch, rotor,
SecOndary. gedithentstion4anks
NurntierDiarneter. -f,
''A.Verage,.depth' . . .
Overfinv,4rste, ADWF
2492 ft (150mj49, ft (8.5M)
t 8 2.ft (2 5m) -
`.420,, 000 Gu 4.(12; 000m'.3314r`
- ' 2. '148 ft (45m) '
ft (3.014e70gpditid (27: tin trn'/day)
,Estimate, current connectionsykultimate capacity estimated tO be,3000' population equivalents,.
The results. of'While in- smile.nitrate nitrogenSpecial, attedeterttion.tihigh Values,overflow ratm3/m 2/day).the ability toaeration deten
1
hr tests at the Vienna-Biumenthat plan/ areable Eta on total nitrogen ar6income that ,nitibgen removals of 80 'to19
given to the operating conditions-fq5 to 8.4 hr,,thi mixed liquprsolidsmg/l. ThegthighOLS8 levefs wern the sedimentation tanks 12would be .to-use higher overt.'
gb MISS levels under aeratie-s (see Sectioni 4.10 516);ti
ernative' aeraf rty),
ae were arr4nged in :a series of font camonitorid oVer- 011 year of weather condiVorYSin
were.evaliiited in, a r
!Dim in Table 5-104e, the ammOn and
percent are} obta e.
A6, teSts. AtilR.4erationet%,,maiyitaine at relatively444.possi* due tq,therovt`,,
o 41Q' d/sf ,or111...441`d 1*6
talesconsegiiently requiting higher
S.',
t.Ow problem that was eventually-overcome thAfrican work 'was floating sludge
the sedimeniktion tank., Xhis condition Nyva fly prevalent 'when an anqxiC, channel' y
section ,precedid the sedimentation tank. The cOAditiqn was cotrected by ensuring' that each
.., channel had sufficient aeration to maintain DO.: the channel the 'disc. Before. the diSC
'
% 5-45
..

.TABLE 5-:10,
NCE.OF THE VIENNA-13LUMENTHAL PLANTESTIGATIOVS (REFERENCE 65)
Sept ;:2,/971
-Feb. 17,-1972 ','
= June26,1974
July 16,1974
July 31,1974
Aug."7;1974
8Influent flow rate, mgd (ms
Aeration detention time, h$),MLSS,mg/1 . , In 11,,
- It.,1.Return sludge SS, mg/I
Average sedimentation tankOverflow, rate, 9 :'-1/s
'm , /in
Aeration tank temperati 6, p
Operating rotors, tank li t: -- to. lit,
Sludge loadlng, .
Ilb BOD5/lb ML$S/ ,,
.6(0:42)
6,100z's
111,000
<
28011,4,
1,8 %, '.
? 71.11'
14;0(0,61)
5.56,200 ;
10,300
. ,
41016.61
12.' .
:
-
. 3
12.4(0.54)
;. 6J5,300 _
8,000
36014.7
18
3, 3
0.20
10.9(0.48)7.05,900
9,000
32013.0
20
4, 2
0.19
9.5(0.42)
8.05,400
7,900
28011.4
19
4, 3
0.16
9.0(0.40)8.4
5,400
8,400
27040.9
20
4, 4,:--.
0.2;1.Influent concentra
BOD5
CODTOC :,''
.,: Total -N'.4.''.;;AlAnonla'- N .,f, -,,,
..,_.,(-. Effluent coneertftrUtions, mg
CODTOC - 4 Z4Total--,N
-iAmmbnla - N ,_.- ,..,"1
Removal effIc,
:
len e
. BOD5 ..:?.COD 7. rTOC .4Total -.N -1
Ammdnia -
-
,, .,413..
f,...
49',14
43.8
-. .
95
90918883 .
200
384.126
24,,9:0.
. r3.50 ,
, , 13.
2..7-
-, 93
87, '90
-- 8211
: 76
268
463128a
21.8
10
3912a
6.3
96
9291a71
:-.a.
574143a_
14.6
a
3914a
3.9
a
9390b
76
a -
515134a
17.2
a
3513a
2.4
a
9390c
86
a
778.
208a
21.2
a
3515a
2. 7
a
9293 -
d87'
allot available
Not avallalile, but no nitrate - N In effluentm 'aNOt aiallable, but only 0.3 mg/I Nitrate 7 N in effluent
, Not avoll* but only 2.4 mg/I Nitrate - N In effluentrye:'
+ aerator; as allowed to,drop to zero. Slice mixed liquor was withdrawn after the disc inalResh 'c.onditiou a sparkling clear effluent was produced.
Table 5:11 suni rizes the perforniance data for the successful configurations of aeration inthe auth African study. Nitrogen removal averages 79 percent. A detailed 4-day analysisduringmeriod when 86 percent nitrogen removal was observed showed that 40 percent ofthe initiient nitrogen was inCorpOrated in the sludge, 45 percent was nitrogen gas lost to theatmosphere and 14 percenpappeared in the effluent.
5-46267
F.
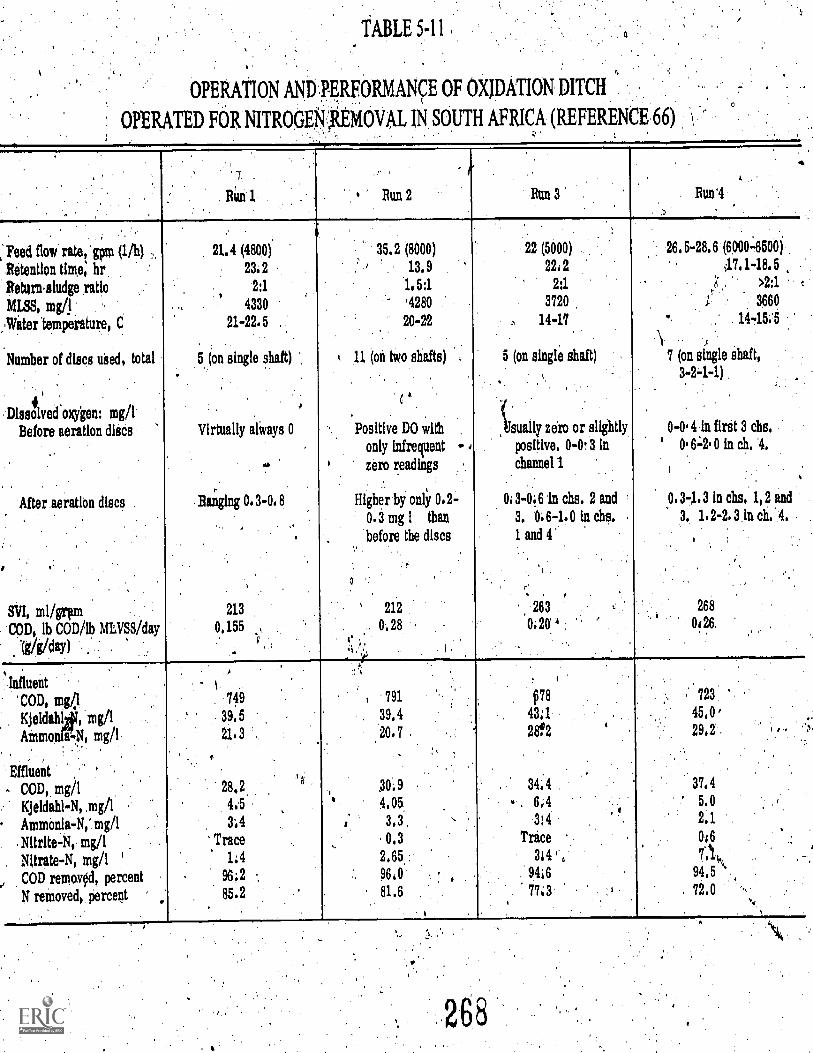
OPERATION AND PERFORMANCE OF OXIDATION DITCH
OPERATED FOR NITROGEN ,REMOVAL IN SOUTH AFRICA (REFERENCE 66)
.
-t
Rim 1
r
Run 2 Run 3 Bunl
:Peed flow rate, gpm (1/h) ,.Retention time; hrReturnsludge ratioMLSS, mg/IWater 'temperature, C
Number of discs used, total
.
Disso4 lved oxygen: mg/1
Before aeration discs.
After aeration discs
,
SW, ml/grpmCOD, lb COD/lb MLVSS/day
1g/g/day) , .
.
.
21,4 (4800)
23.22:1
4330
21-22.5
.
5 (on single shaft)
,
Virtually alWays 0
...
Ranging 0.3-0.8
.
213
0,155 ,,
'
.
35.2 (8000)13.9
1.5:1'4280
20-22
. 11 (on two shafts) .
( '
Positive DO with .
only infrequent
zero readings
Higher by only 0.2-0.3 mg 1 than
before the discs
' 212
. 0,28%
6 ,
i 1
-"- ''t
..
22 (5000)
22:22:1
3720
, 14-17
5 (on single shaft),
Sisually zero or slightlypositive, 0-0.3 Inchannel 1
0;3-0;6 in chs. 2 and3. 6.6-1.0 in chs,1 and 4.
263
0.20'' .
\
'
26,5-28.6 (60004500)47,1-18.5
>2:1.
3660
14 -15.5
..,
7 (on single shaft,3-2-1-1)
,
.
0-0.4 in Brit 3 chs,0.64.0 in eh. '4,
1
0.34.3 in chs, 1,2 and3. 1.2-2.3 in ch. 4,
268
026.
Influent'COD, mg/1
Kjeldahlhi, mg/1AmmonSN, mg/1
Effluent .
COD, mg/1Kjeldahl-N, .mg/1
Ammonia-N; mg/1
Nitrite -N, mg/1Nitrate-N, mg/1 '
COD rernavOd, percent
N removed, percent .
.
-
749
39.521.3
,.
28,2 lj"
4.53;4
Trace1;4
96;2 .
85.2
, 791
39,4
:
20.7.
30.94.05,
r 3,3 -0,3
2,65:
96081,6
f7843;1
2842.
.
34.4.. . 6;4
3', 4. I.
Trace314 e,
. 94677,3
.
i 723
45,0'29,2 ...
37,4
5,02,1
0/67',1,, .
94,5 '72.0 ,

The sludge in the South African study was always in a bulkingsondition, with SVI levelSranging from 212 to 268 ml/g. This , bulking tendency may be a general property of .
alternating aerobic-anoxic processes, as bulking sludges haVe developed in other alternatingaerobic/anoxic'systems (see Sections 5.5.2.3 and 5,5.2.4).
. ,
It has been found that the cage aerators Which are typically employed in the oxidation ditchare not well suited to nitrogen removal applications: 67 The cage aerator is not capable ofsimultaneously mixing and maintaining DO control; too much oxygen is imparted to .allow .
development of alternating aerobic and anoxic zones while maintaining sufficient ditch,velocities (1 fps or 0.30. m/s) for prevention of settling of solids in the ditch. In one case, theproblem was solved by providing separate submerged propellers for mixing which -allowed`the cage aerators 'to be managed for .D0 'control alone.67 An aeration system has beendeveloped that can both control the mixing level and the level of aeration simultaneously.Vertical shaft aerators are placed at the channel turning points in restricted areas so that thefluid rotation generated by the aerator,is marshalled to move the flow around a semicircularturn. Power input and the number of on-line aerators can be varied to control DO levelWhile maintaining' sufficient mixing in the system: Nitrogen pmovals of s0 to"87 percent are
,reportet1.68
5.5.2.2 Denitrification in an Alternating Contact Process
The novel alternating contact process shown in Figure 5.-19,,has been tested in Denmark inboth lab-scale and full-scale tests at wastewater flows up to 1.5 mgd (0.067 m3/sec).69 Theprocess is similar to the 'oxidation ditch a mach in that alternating aerobic and anoxicresidence periods are 'provided in contact w th'raw wastewater. The means of accomplishingthis alternating contact are very different from an oxidation ditch, however.
The operational _Sequence consists of the fou,r phases shOwn in Figure 5-19. Aeration air. iscontrolled to provide alternating aerobic alut:4noxic' conditions. When anoxic conditionswere required, the aeration air was merely turned down to a level sufficient to keep thesludge anoxic but in suspension. Raw wastewater is alternately, directed to one or the other'of the two tanks, according to a predetermined cycle: The cycle that alindividual tankpasses through is depicted on Figure 5-20., The operational phasing of Wastewater additionand aeration are shown in addition to the phasing of nitrification and denitrification.Multiple liquid expoSure to anoxic and aerobic zones is done by limiting the sequence timeso that an average, of 6 to 15 cycles are completed prior to liquid discharge. The effluent isdischarged from the tank to sedimentation only when the tank iseimder aeration.
The stoichiometric parbon to nitrogen ratio for denitrification was defined in terms of a 7day 130D and found to be 130D7/NO N = 5.2: penitrification rates are summarized inSection 5.2.6. Effluent nitrate levels of 2.0 to 5.0 mg/1 appeared Obtainable with properselection of design and operating. mode. A full description of the mathematiCal model used-,for process design can be found in reference 69.
548,, 269

FIGURE 5-19
ALTERNATING CONTACT' PROCESS
Phase 1- Denitrificatioh/Nitrification Phase 3 Nitrification Denitrification
RAW.WASTEWATER
r.
° RAWWASTEWATER
SLUDGE RETURN SLUDGE. RETURN
KEY
AN = Anoxic conditions , = Aerobic. conditions, SF Sedimentation
A recent South African deyelopment for nitrogen reniovar using both wastewater andendogenous;; carbon for denitrification is shown in-Figure 5-21. Termed the "Bardenpho"proceisiy,by its deyeloper, the system is a combination of two previously :developedprocesseS.70 Mix'ed liquor containing nitrate is recycled from the second (aerobic) tank tothe initial (anoxic) tank for denitrificatiOn.71 Appended to the first two tanks is a third(anoxic) tank for removing the nitrate remainingikthe effluent from the second (aerobic)tank., In this .third tank endogenous respiration used for:clenitrification in the mannerdescribed in Section 5.5.1. Finally, a period of.aeration is provided to improve sedimenta-tion.
P.
Initial lab,,scale tests of the Bardenpho process showed that nitrogen removals of 9,3, percent..were possible tt recycle rates of 4:1 and 1:1 of mixed liquor and return sludge, respectively.

FIGURE 5-20
OPERATIONAL SEQUENCING C)F ONE OF TWOAERATION TANKS IN ALTERNATING CONTACT PROCESS
\0.5 (TSEQ)
Ts EQ
TLp4., Tj q TLp+
Wastewater Add i t ion No Wastewater Addition
Effluent to other Effi to SedimentationReaction Tank s, 'Tank
No Aeration 'Aerat ion
Anoxic
De.nitri.fication
TO SEQUENCING. T IMES'}1
TSEQ = Overall Anoxic -Aerob*c .Sequence TimeTip; = Lag phase "of Denitrif icat ion
TLp+ = Lag phase of Nitrification
TIA Intermediate Aeration Time,.
Under this condition, 5.to 7 mg/1 of total nitrogen gppeared in the.effiuent pilot teSt.
of 9 months duration was then .conducted to determine the long-term of theSystem on i,scale of 26,00& gpd (100 in3/ciay). DUring the 'last three months of the study,nitrogen recnoVals were in the range of 80 to" O percentfil Observations of denitrification 4rates for the first (anoxic) rank are.sumniarized in Section 5..5.2.f and denitrification rates
for the third (anoxic) tank Where endogenous is emploOd' are pre§ented in Section
5.5.1. '. 4
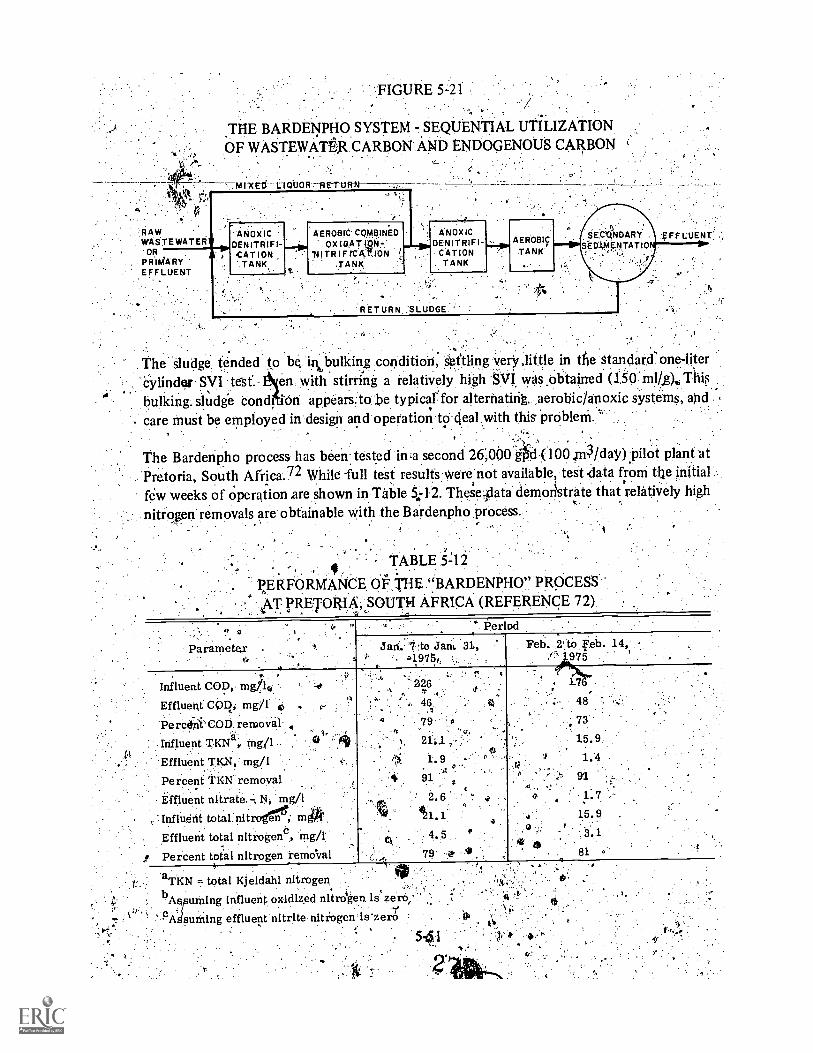
'FIGURE 5-21
THE BARDENPHO SYSTEM SEQUENTIAL UTILIZATIONOF WASTEWATER CARBON AND EN. DOGENOUS CARBON
RAWWASTEWATER!'OR
. PRIMARYEFFLUENT
e
ANOXIC AEROBIC'. COMBINED ANOXIC
DENITRIFI- OX DENITRIF I- ;;L,Iii,CATION. 'NI TR I F YCA.tiON ?. CATION
TANK TANK . TANK
:
AEROBIC
TANK.
'EFLUENT...
R E T UR N SLUDGE
.Cylindg.SVI tat'. len with stirring a relatively high SVI was obtained (150 ml/g)b This,
The Sludge. tended to be in bulking condition, *ttling very,little in the standard' one-liter
bulking. sludge Cond appears.to'be typical for alternating, aerobic/anoxic systems, and
care must be employed in design and operation to-deal with this problem.
The Barderipho process has been tested in,asecond 26,000 gO'd.(100.rd/day)pilOt plant atPretoria, South Africa.72 Willie full test result's were not available, testdata from tlie initial
few weeks of Operation are shown in Table 5;12. Thes'e4lata demonstrate that relatively highnitrogen removals are obtainable with the Bardenpho process.
TABLE 5:12
PERFORMANCE OP,tHE "BARDENPHO" PROCESSSAT pRETORIA,,SOUTH AFRICA (REFERENCE 72)
Parameter .
Influent COD, mght;Effluent COD; mg/1
Percixii'COD rernevil.,
Influent TKO,. ing/1-Effluent TKN, mg /1
Percent TKN removal- .
Effluent nitrate, L. mg/1
Influent totaL nit en m"Effluent total nitrogene, 'mg /1'
Percent total nitrogen remo*Val
` Period
Jail. "7,to Jan,. 31,,1975r, .
. .
aTKN -7 total .kjeldahl nitrogen/4Aientrning influent oxidized niirdgen is`zero;
PA4urning effluent nitrlte.nitiOgen'is'zer-S
226
7a21:1 ,
1.991
A
2,6t1.1
4.579 z4,
Feb. 2 to Feb. 14,
1.76
48
73
15.91.4
91
1.715.9 .
3.1
81
541
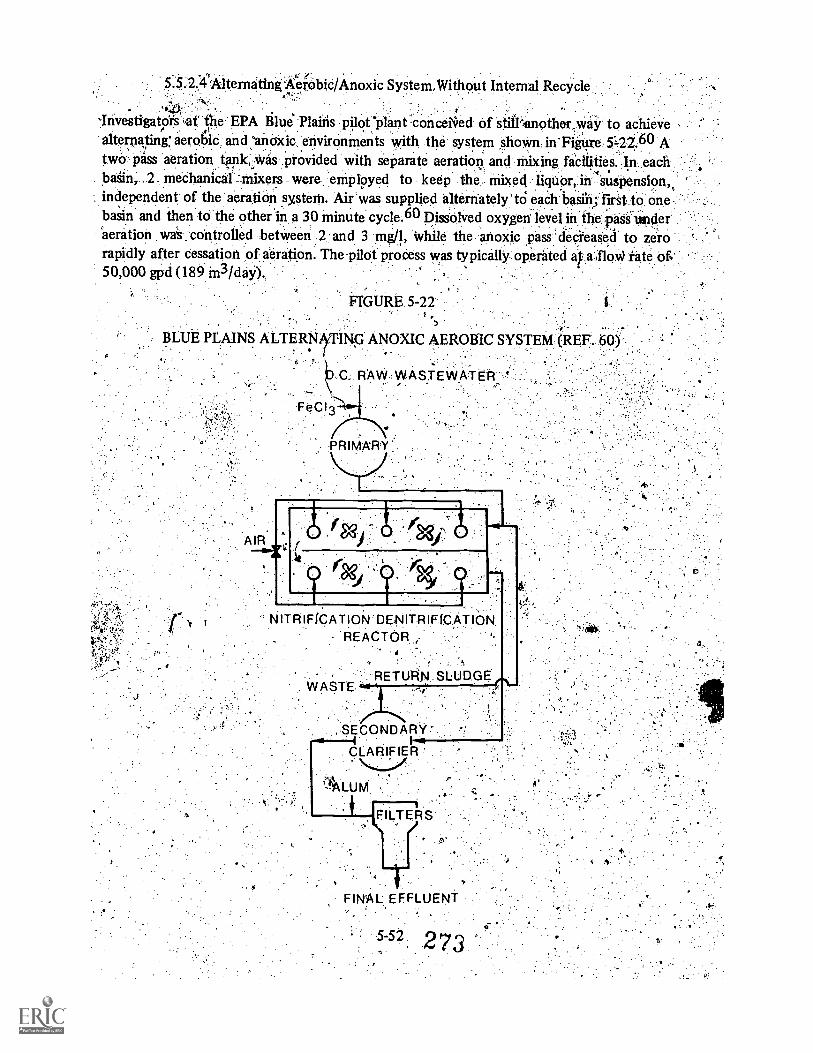
515.2.4Alternating keiobic/Anoxic System,Without Internal Recycle.40;
Investigators at the EPA Blue Plains pilot'plant -conceiied of still'anotherwaY to achievealternating: aeroidc and `anoxic environments with the system shown in-Figure 512Z60 Atwo pass aeration tank, Was provided with separate aeration and mixing ficiiities-In each
_ bagin.2 mechanical :mixers were employed to keep the mixed liqUOr, in Suspension,,independent of the aeration system. Air was supplied alternately td. each bask; first to onebasin and then to the other M a 30 minute cycle.60 Dissolved oxygen leVel in the. pass under,.aeration was controlled between 2-and 3 mg/l, While the anoxic pass decreased to zerorapidly after cessation of aeration. The-pilot process was typically operated at a.floW rate of,50,000 god (189 m3 /day).
0.
FIGURE 5-22
BLUE PLAINS ALTERNfiNp ANOXIC AEROBIC SYSTEM (REF. 60)-%
,C RAW-WASTEWATER'
NITRIFICATION DE,NITRIFICATIONREACTOR ,

A .summary of operating and performance, data for the 9 onths of test work is shown inTable 543. During 9 months of operation, the plant was operated at a F/M ofapproximately 0.1 lb BOD5 /lb MLVSS/day (0.1 g/g/day), ex essedon the basis of the totalinventory in the reactor. This 'F/M was sufficiently low to s ermit the development' of amixed culture of organisms for carbon oxidation, nitrification d denitrifleation:
s,'Nitrogen removals during the study varied from 54 to 84 percen , but Operational probleps,,,contributed to the lOwer reported removals. Theseifiroblems ma be avoidable in fu,I14caleoperation. For instance, in July and August, ferric chloride ddition in the :primarytreatment stage reduced the COD/TKN ratio from 10 to about 7. to 8.0; and resulted in asituation -in which. the lack of a, sufficient organic carbon sourcdenitrificatiOn obtainable. The lower removals experienced in Ap,the, fact. that during a portion of each month, the alternatealtered to a full aerobic mode to rid the system of filamentous
+.During September,,,,' performance deteriorated for an unexpected The flow eet inFigure 5 -22 was modified to include two more reactor stages. prior `to t 6 clarifie'r. In thefirst added stage, ,an anoxic one methanol was added to cause denitrifit ation of residualnitrite and nitrate. An aerobic stabilization step was added as the last stage. It was found"that methanol addition caused'an immediate ammonia increase in the proce\ss. Subsequentstudies`thowed that methanol istOxiC to mitrifiers.
limited the degree ofafd May -*ere due to
anoxio,,,tegime was
V.zkib,;`n ,cam*
Since all operating problems can "fie explained, it can be concluded that t1 e system iscapable of 84 percent nitrogen removal in the summer (23 C) and 75 perce t nitrogenremoval in the winter (14 C).
tike in other. alternating aerobic/anoxic studies, it was found that a severe filamentousulking condition developed in the sludge, limiting ;wintertime clarifier overflow rates to
"about 300 .grpdAf.60 Bulking sludge has been ,observed at low temperatures at Blue/Plains
and low F/M operation at Blue Plains and at other plants..Whatever the cause of the
bulkint problems, it appears that clarifier. operation will limit operation of , this
aerobic/anoxic system, as it will limit the other aerobic/anoxic systems.
Kinetic data was obtained during the study. On and off aeration of samples of the pilot
plant mixed liqiior was employed over cycles to simulate operation of the pilot unit.Nitrification and denitrificatiOn rates determinedby this procedure are shOWn in Table 5-14.
Nitrification rates were similar through all.cycles, while denitrification rates decreased as the
batch reaction continued. Denitrification Yates measured in the first cycle represent peakrates possible when a readily available carbon source is available during denitrification. By.,
the third or fourth ,cycle, the rates represent denitrification when the readily availablecarbon is depleted and an en'dogenou,s:carbon source is Used: Deititrification rates foriycle 1
are also presented in Section 5.5.2.5 with measurements of other observors, while rates for
cycle 4 are presented in Section 5.5.1'.
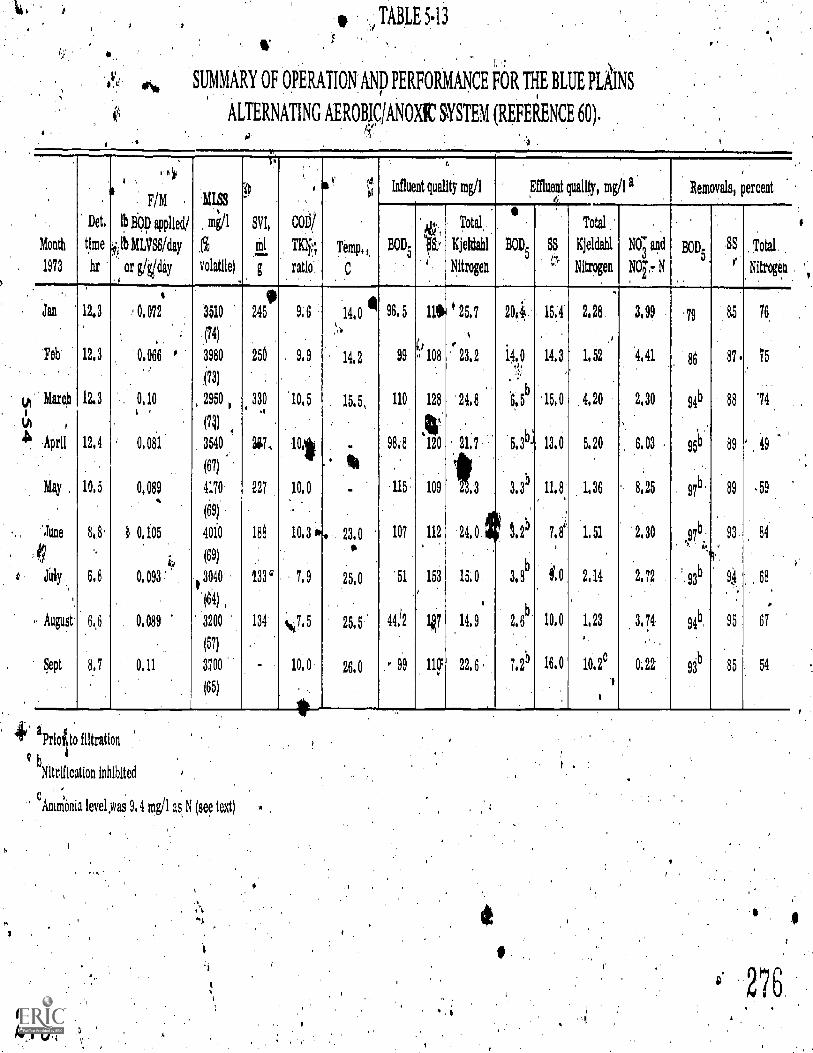
TABLE 5.13
A
SUMMARY OF OPERATION AND PERFORMANCE FOR THE BLUE PLAINS
ALTERNATING AEROMCIANOXIC SYSTEM (REFERENCE 60).
VI
p
Month
1973
Det,
time
hr
..i.
F/M
lb NI) applied/
iilbMLVSS/day
or g/giday
MISS
mg/1
.(%
volatile)
i
)
SVI,
MI
g
COD/
TR;ratio',
Temp,
C
1 Influent quality mg/1 Effluent quality, mg/I a Removals, percent
BOD
06..
'VS?
Total,
Kjeldahl
Nitrogen
BOA SS,,,,'''
Total
Kjeldahl
Nitrogen
NO`" and
NO'2'.- N
BoD5 SS
''
. Total.
Nitrogen
.
an
'Feb
March
April
May
',rune
0.?
JJuly
, August
Sept
12.3
12,3
12.3
12.4
10,5
8 8.
6.8
6.,6
8, 7
i 0.072
0.066
. 0,10
0.081
0,089'IA
i 0,105
-4 :,
0.093 :
0.089
0,11
3510
(74)
3980
(73)
2950
(71)
3540
(67)
4170.
(69)
4010
(69)
3040
3200
(57)
3700
(65)
9245
250
330
244.
227
188
,
i33'
134
-
9.6
9,9
10,5
10,1iIF
10,0
10.3
7.9
si7.5
10, 0
,',.
.
.
14,0
14,2
15,5,
-
-
23, 0
26,0
25,5
26, 0
096, 5
99
110
98.8
.115-
107
'51
44,12
i' 99
11$
1,..
,; 108
128
%120
109
112
153
4,7
110'
25,7
4
23,2
24.8
.21,7
/.3
24,0
15.0.
14,9
22. 6 ,
201ii.
;
i4. 0,,,
':, 5
5.3
3.3b
k 2
8b
2, 6
7, 2b
15,4
14,3
'15,0
, 13,u
11,8
7. e
9'.0
10,0
16.0
2.28
1.52
4,20
5.20
1.36
1,51
2.14
1,23
10, 2e
3,99
'4.41
2,30
6.03
8.25
2.30
2.72
3.7.4
0; 22
.79
96
94b
90
9713'
97
93b
94b,
93b
8,5
87.
88
89
89
93
.
9'
95
85
76,
75
'74
49
, 59
84
68
67
54
aPrloi to filtration
bNitrification inhibited
cAninionla level ,was 9.4 mg/1 as N (see text)
275
276
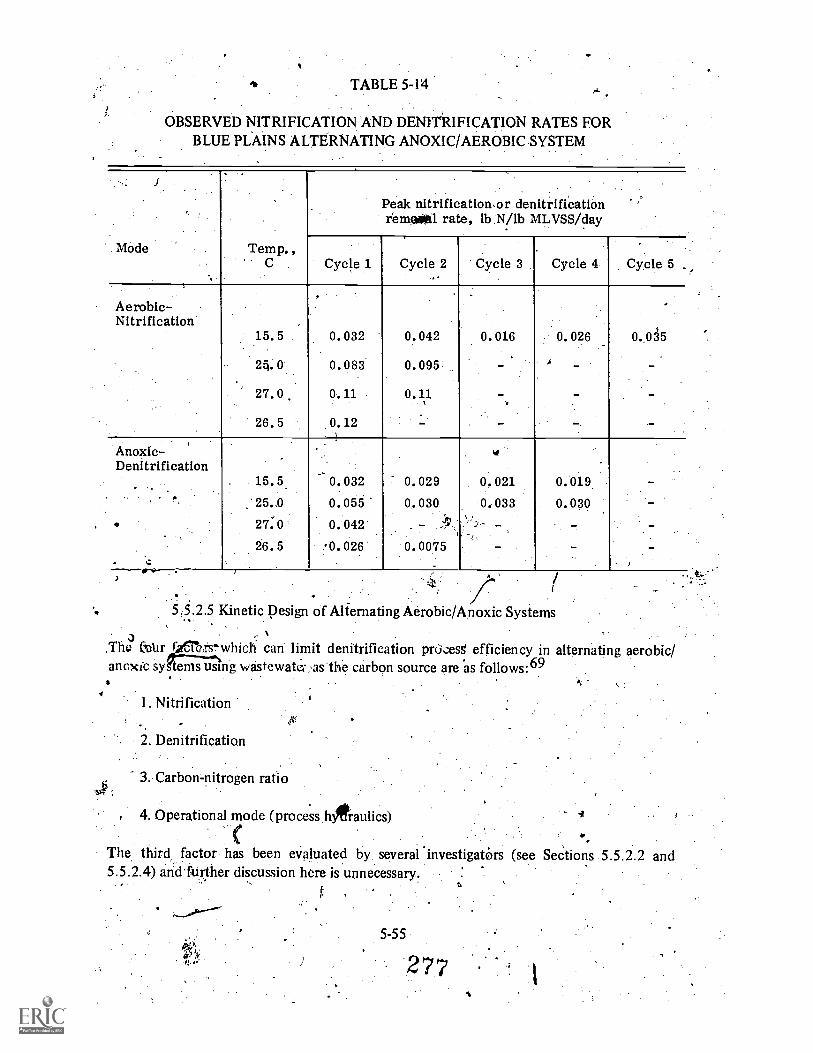
TABLE 5-14
OBSERVED NITRIFICATION AND DENITRIFICATION RATES FORBLUE PLAINS ALTERNATING ANOXIC/AEROBIC SYSTEM
Made Temp. ,
Peak rarIfIcatIon.or denItrIficatIonremolifil rate, lb .N/lb. MLVSS /day
Cycle 1 Cycle 2 Cycle 3 Cycle 4 Cycle 5
Aerobic -Nitrification
15.5 0.032 0.042 0.016 0.026 0,035
25.0 0.083 0.095
27.0 0.11 0.11
26.5 0.12
Anoxic-DenItrIfIcatIon
15.5 0.032 0.029 0.021 0.01925..0 0.055 0.030 0.033 0.030
27:0 0.042
26.5 .0.026 0.0075
/5..2.5 Kinetic Design of Alternating Aerobic/Anoxic Systems
.
.Tha (eau ,rs,which can limit denitrification palcesg efficiency in alternating aerobic/anoxic s. y terns using wastewatec,,asthe carbon source are as follows:69
1. Nitrification
2. Denitrification
3. Carbon-nitrogen ratio
4. Operational mode (process hOtraulics)
CThe third factor has been evaluated by several investigators (see Sections 5.5.2.2 and5.5.2.4) andurther discussion here is unnecessary.
1
5-55
277
.
To evaluate nitrification limitations on the system, nitrogen loads and nitrification ratesmust be taken into account. Most investigators agree that the design of the combinedcarbonoxidation-nitrification functiOnsv of the aerobic phase can be separated from the anoxicphase.61,69,73 It has been found that orioicic periods up to 5 hours have no impact onaerobiC sludge activity.62;59 Therefore, the ,Carbon oxidation and "nitrification calculationsfor the, aerobic periods can be virtually identical o those advanced, for combined carbonoxidation-nitrification Sectiretention time, nitrifier growttht solids inventory under aeaerobic for nitrifier growth to accur. As alwa
4.3.3 and 4. .5. In the, calculations of nitrifier solids%and remov rates in the altfobic residence periods, only
is employ This is because the environment must be; a safety factor must be employed.
Sizing of denitrification steps must,,. consider pitrite load and nitrate removal rates andnsideration of the safety factoreconcept in design. Of the two models formulated for thesestems, the safety factor concept is used dnly for the nitrification step, in the Bardenpho
design, but for some unapparent reason not for denitrification.61 The safety factor conceptwas not used for nitrification or 'rihitrificIan in the alternating contact ,process design(Section 5.5.1.2).-60 it miW be eMbhasized'that unless a safety factor is incorporated in thedesign, nitrogen removal will under peak load umditions.
9 .
Most of $he alternatingpropetses employ both wastewater carbon and endogenous carbonfor denitrification
Pat some point in theystem. Observed denitrification rates for
endogenous carbon have been suugmarized in Section 5.5.1. Experimentally determineddenitrification rates in altematin*erobic/anoxic systems"'wlih iyastewater as the carbonsource areshown in Figurr 5-23. When data were reported in terms of MLSS only, volatilecontent was assumed to be 70,,percent to allow reporting on a basis consistent.with the"denitrification rates shown in Section 5.2. These rates are peak nitrate removal rates, and areexprissedjs ping the terminology developed in Section 13.5.2. As can be seen fromFigure 5-23, there is a wide variation in measured denitrification rates ir systems usingwastewater as the organic carbon source. As a result, it may not be a conservative practice to
V use -the denitrification rates given in Figure 5-23; rather, it would appear prudent to conductpilot investigations, to verify design parameters for denitrification when wastewater is thecarbon source for denitrification.
The rates for denitrification with wastewater as the carbon source fall b'elo those found farmethanol as the carbon source shown in Figure 5-2. Median rates at 20 C r methanol andwastewater carbon are about 0.25 lb NO3 N removed/lb MLVSS/day (0:2 g/g/day) and0.07 lb NO3 N removed/lb MLVSS/day (0.0. g/g/day), respectively. A denitrificationreactor using a wastewater carbon source would have to be about three and one-half timeslarger than a denitrification reactor using methanol as the carbon soprce.
One cause of the 'difference in reaction rates between methanol and wastewater carbonrelates to biological availability. Methanol is a simple, easily degraded compound, whereas/wastewater contains a mix of eisilkclegiaded.and hard to degrade compoundi. Wastewatersmay vary in the relative distributiOn of.easily degraded and hard to degrade compotinds,thus causing variations ?n denitrification rates between locations.
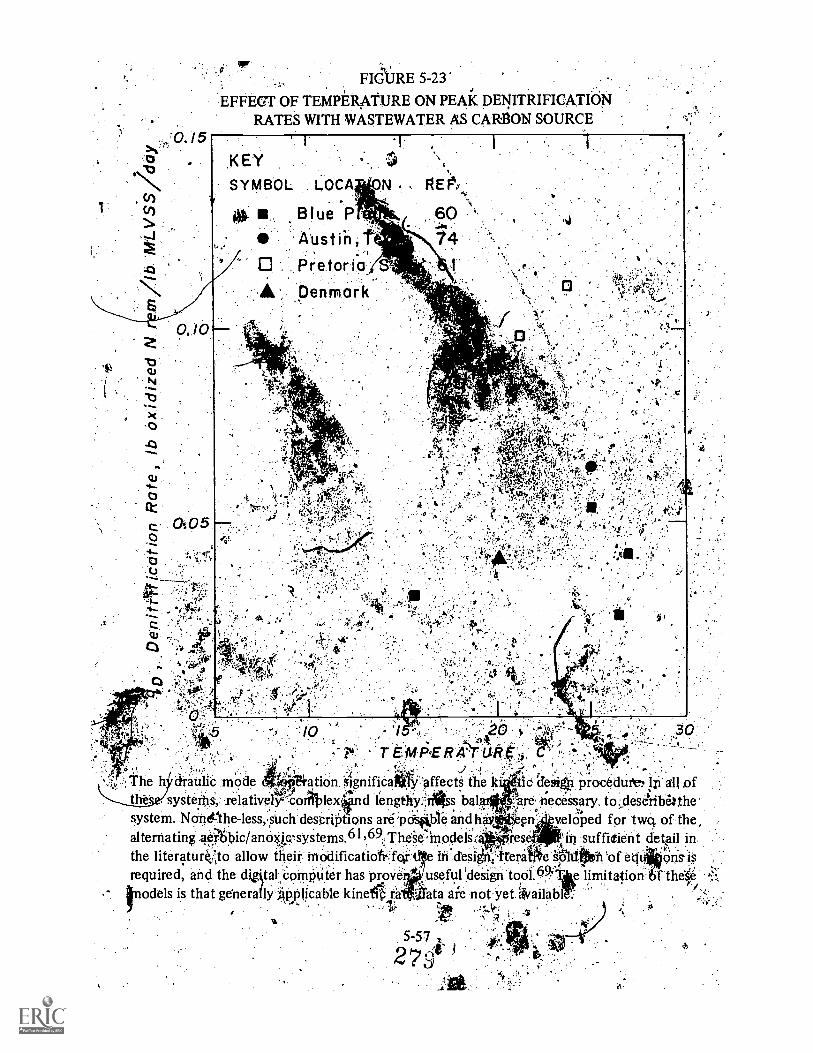
:0.15
FIGURE 5-23'
EFFECT OF TEMPERATURE ON PEAK DENITRIFICATIONRATES WITH WASTEWATER AS CARBON SOURCE
.1
,KEY °. `04..
SYMBOL LOCA .
04: Blue P 60.Austinif 14
1
PretoriaDenmark
0
''
0 f
TE.)14/3ERA'Yiik.e,,
drauliC mode ation AgnificaAktsi 'affects the I( tic desi procedurt.,Ip all ofVei
systerbi; relativelyrcoriilolexiend lengthyrgitss -are necessary, to,desetibelthe'system. Nonethe-less,,stich desCriPtions are'pcisfiple and hay crt veloped for two of the,alternating aeitbicianthgc,systems.61,69TheSeModelst res suffitient detail inthe literaturCto allow their irtoclificatioftjqi e iri desigK'tteraitfe kali:169h 'ofrequired, and the digital-ComPtiter has prove useful !design tool.691' the#
Inodels is that generally Ap li ca ble kine ra , ata are not yet aiivailab
5-57 =
2 7j6
5.6 Solids-tiquid Separation
.The consideOtions for design Hof sedinientation tanks for denitrificationsysteins are thesame as:thosie diSctisSed for hiification systems in Sectioh 4:10 and those,pctints.oprriMonto.bbth will not be repeated h in:,
ltiSing sh*ge, has "occasionally Plaguefr,.denitrification *-5ysterris, depending on Sy Stande§fgn,3,4,7, r$,49',.SO To remedy this'and'bther problems, :the original suspended growth ' ,d,, * .
denitrificati6Nsystemv(iishig methanol) .was Modified by. Plaoing an aerated Stabilization.;:l, .
step betyeen ther.andiXic demtnfication reactor .and the .denitrification clanfier, .(Figure'-'. , 5-1B).2,,35 I This step was Taken because it Was fOUnd that the aconventiOrial7 ,design, ,,,..taken
'I . ,
was basically, an thistat)le'proCess.,In theconventiOhal system, the methanol': nitrcigeitrtio:,(M:N ratio) hag, to bei'kepit:at precisely the optimurn,level(15 to 3.-.14).:When methanOtas,::overfed, thae*efflud'nt*BOD5 world rise. When inethanOl.waS ., derfeck nitrate would bled'''
, through t9,:the larifier,'a,hddenitriffeation would proceed in- th clarifiergping the sludge04,..;thg;, carboh source. Pleating sludge, buoyed up by nitrohn' gakubbiN caused a ,Oitpt
Adeterioratiovi,in pffl ivent quality. ' i .
, ,
. , t ,t-N. \
* ..
is residence period inlii.61110clif,I. d 4The coupling ofan anoxia vcsitlence perioc1,410ansystem (Figure .5-1)0 i abased n the recognition t fit dissimilaton!..denitriflio4tioh is ,41
N .. % .
accomplished by. f'aculta ive bacte a usingbioch leal.pattiWays fliat,arelifrioqld Rtical tg,aerobic biochetriiiialpethww. 11.6 ri'i*ain,differen le in..the'hiochemicarpathivays,lie0p telectron transport system a'erViliile terrtaal16nz ,tne;ie.chartged*id hitratkrep,laseiecnenas the final tlectron acceptor. P73' These facultatT "b4cteria,,,can shiftIttiaty ..froth.'usrtig.:. I` , ' ' . ,;.,"' 4. , .e.VV;4. .
/ .. L
nitrate to using Qxygen artil vice versa.,In:ItiO aerldy ietW, the excess methan ");pcidizqclf,,tiand the mixed li9uor, solids On obi 0 ptabiliiii1:,;,th:7 aerobic larik-als&s es he;
purpose of stripping supersatura nitro gas from sbitition so that 4itrogen gas.bel.;1216S;--:, , ..., .. ,,,,,, iwill not form dulling sedpsn tab*:
11y,:.'
lo*
. i.4.,,, fp' X n
A mildly aerated ph4stopl danditioninUtannel trans the 4eriitrifidAlloh.Mixed liquthe final clarifier. Re*Eignizigg, th. 'IA e ve turbulent conditiois ill ifi.eiiia'td.ralitlii. iontank causes floc breakup imil disp '' d' fin, in sus*" nsitn, the rkhrpoiSe of the cheat is toallow those disperSed particles to be irfiii5Orporatecl into floe unclerlinklfurbuience,epreditions
,that favor aggregation ovVreakti.tp.?.76, ."'', ':..111:, '
___ t Aw.: '4Tests of, the originalAyl mo id4'''system'Si.were, cc iduC-tethat the. Central CostaSanitary District's Adv'anced Treatment Test FacilitY,Z,3,21351 Comptlini-Perform ance
.with stabilization: to performance yitliout it (Tables' 5-15. and 5-16), indicates thesubstantial merits of theapr1Ced , abilizati tank. The test period yrithoilt stabilization wakeone in which daily adjustnsiehts were mad the rriethanolie te, haide there was littleif any methanOl.bled into the $fti It. This is refle n the low soluble BOD5 of 5 mg/l.During the test period with ,,pera d ,,stabilihtion, ess care611 control was exerted inMethanol feed which resulted in a fairly high,14/tratio.of 3.3.,DeSpite this overfeeding ofmethanol, the effluent soluble .30E45 rer ire r 5, m01. In other words, the aerated
, ,e,
..,

stabilization tank .formed aefavorable environment forth oxidation'of the e,xcess methanol.
One signifiCant'factor contributing tp less suspended solids and turbidity in the effluent wasthe development, of a ciliate and _rotifer , population in the cUltufe. Previously theseorg4nisnis were not abundant: With a signiflcrit aerobic residence:period, these organising-
TABLE 5-15
EFFECT OF STABILIZATION TANK ON DE\IITRIFIEti EFFLUENT AT THECENTRAL CONTRA COSTA SAITARY DISTICT'S . *,
ADVANCED TREATMENT TEST FACILITY (REFERENCE 3)
ConstituentMean effluent quality
without stabilization, -mg/1(Feb. 13 to Mir. 13, 197k)
Mean effluent qualitywith stabilization, mg/I
(Mar. 28 to April 20, 1972) .
Nitrate as N
Total BOD5
Filtered BOD5
Suspended Solids
Turbidity
Total organic carbon
Soluble organic carbon
Temperattire
0. 5
37
5
145a
18;
7
16 to 17b
0.7
6
5
4
1.3a
8.6
5
16 to 19b
adegrees C
TABLE 5-16
DENITRIFICATION PROCESS PARAMETERS AT THE CENTRAL CONTRA COSTASANITARY DISTRICT'S ADVANCED TREATMENT TEST FACILITY (REF. 3)
Parameter
Without stabilizationFeb. 13 to
Mar. 13, 1972
Flow, mgd .46
Residence time, hrreactor,stabilization tank
.850
MLSS, mg /1 3000
SVI, ml/g 143
Nitrogen rem lb/lb MLVSS/day .23
Methanol/nitrate - N ratio 2.8
With stablilizationMar. 28 lo
April 20, 1972
5-59
2S/
.47
:82. 79
2500.
242
. 18
3.3
1

could.flourish and clarify the liqUad. Sulfide odors in the sludge were eliminated by themodification.
In addition. to stabilizing the id, the siege is stabilized as well: Without the stabilizationink, solids appearing ffiuen t contained' about 2.3 lb BOD5 per lb of SS. Withstabilization, .effluent solids e ntaiii le OD5 with a BOD5 /SS repo of 0.25.,The'net effectof this is to reduce the effluent BO from 37 to 6 mg/1. This'reduetia in BOD5 value ofthe'Solids is very likely due to.enhanced endogenoue respiration m the stabilization tank..
. I-Another indication of shoidge stabiliiation in the aerated stabilizati9R444, is the reductionin.denitrifieafion rat:S"'Cibserved- in the modified system cornpatef5t0the conventionalsystem..Prior lo the modification, denitrification rates,were as high as 0.3 to 0.56 lb Nitrate-N rein./lb MLVSS/day at 16 to 18 C and these rates were below the peak limiting rate, qp,as effluent nitrate was always low. This range in rates is roughly twice the range in rate,
, shoWri for the systein employing aerated stabilization at CCCSD as shown_ in FigureWhile one impact of aerated stabilization is to decrease denitrification rates and thereforeincrease anoxic reactor requirements, the other effect of this impact is to render thsludgeless active and..more resistant to the rising, sludge prOblem in thkdenitrification clarifier dueto -denitrification. This is in agreement with theconclusiOns drawn in Section 4.10, whereitis shown that the tendency for rising sludge was related to denitrification rays and sludgeresidence time in the clarifier. Rapid sludge removal equipment, such as the .vacuum pickuptype, should be provided in all sedimentation tanks to minimize sludge-residence 'time andreduce the likelihood of rising sludge. .
Similar to the findings with methanol based denitrification, an aerobic step has beenusefully employed in comblted carbon oxidation - nitrification- denitrification systems,Generally, a 1 to 2 hr residence period is provided prior to mixed liquor separation in thesedimentation step.
Reactor7clarifier interactions should not be ignored. For instance design examples arepresented in the literature fortlternating aerobic/anoxic systems where the mixedliqUorsolids are assumea to `be 5000 gig (at'14 C) and 7000 mg/1 (at 10 C).61,69, Current U.S.praCtice is:to limit Mixed liqu levelltbelow 3000 mg /l unless clarifier overflow rates arereduced to account for the need to t n and return the sludge.4° Operation at 5000 to7000 mg/1 would require very 1 iers to ensure that solids are not lost at peak wetakathex .flOw conditions. BUlkin udge tends to occur in the combined carbon=oxidation-nitrificatiOn-denitrifiCation systems which manteS even greater conservatism in allowablemixed liquor levels and clarifier design than Would normally be the case.
5.7 Considerations for Process Selection
The choiie of denitijfication for nitrogen removal mandates the process sequenCe ofnitrificati3n-denitrification for nitrogen removal. Two kinds of comparisons in denitrifica-tion process selection can be made. first, the nitrification-denitri7ication sequence can be
cy,5-60
sf
compared to. the 1;hysical-chewnical alternatives. Second, if nitrification-denciiification ischosen, &nnparisons must be made among the denitrification alteritiiiyes, to make the
_process selection.
Comparison to Physical-Chemical Alternatives
The comparison madq between the nitrification portion of the sequence and thephysical-chemical alternativesin Section 4.11.1 need not Oe repeated here.
Total dissolved solids (1: Crement in the nitrpgen removal system* willtaie a bearing onprocess selection in many ,situatiOn's..Nitrification-denitrification leads to a net reduction'inwastewater allplinity and no change in the total mineral idiot of ihe water. Both the,breakpoint chlorination and the selective ion exchange proceMO, to TDS increases.
5.7.2 Choice'Among Alternative Denitrification Sys,tems
Many of the considerations presented in Section 4.11 are applicable to denitrificationsystem selection and Are not repeated here. Other faclors affeetiAg process, choice aresurnmariged in Table 5-17'. Most of these factors were considered earlier in this chapter.
.
In some treatment plants', both nitrgen and phosphorus removal has been mandated.' TheCombined carbon oxidation-nitrifieat?on-denitrification systemS are somewhat restricted, inthe sequencing of the phosphorus removal step. Chemical addition in the primary treatmentstage cannot be employed, as this would not leave sufficient organic carbon influent to the
o
process to complete denitrification.
Another factor listed in Table 5-17 is stability of operation and degree of nitrogen removal.Several long-term tests of denitrification systems using methanol have successfullydemonstrated consistently high levels of nitrogen 'removal. Equivalent operational exper-ience with the combined carbon oxidation-nitrification-denitrification systems will soon beobtained, as 1L.ge-sCale experimental work is currently underway in the 114,Denmark,South Africa, When the results of this work are available, fair comparisoris canbetween the two typei of systems. Based upon presently available data,'keiPpears that thecombined carbon oxidationnftrification-denitrification Systems, are capable of 90percent nitrogen rernoval; in comparison, r;ethanol based s'Ystems QM achieve fl'to 95Percent nitrogen removal.
One other kind of comparison can be made,,between the systems using methanol and thecombined systems. Since the rate of,denitrificafion with wastewater as the carbon source inthe combined. system is lower than with methanol as the carbon source;;, greaterdenitrification reactor sizes are required for the combined system.. This issue can best beanalyzed with an example comparing the° alternative systems. A design example for theBardenpho process has been presented in the literature that can be usefully( employed forthe 1.4nriParison.61 Specific loading criteria are .ncit important in this example; for .thesd'the
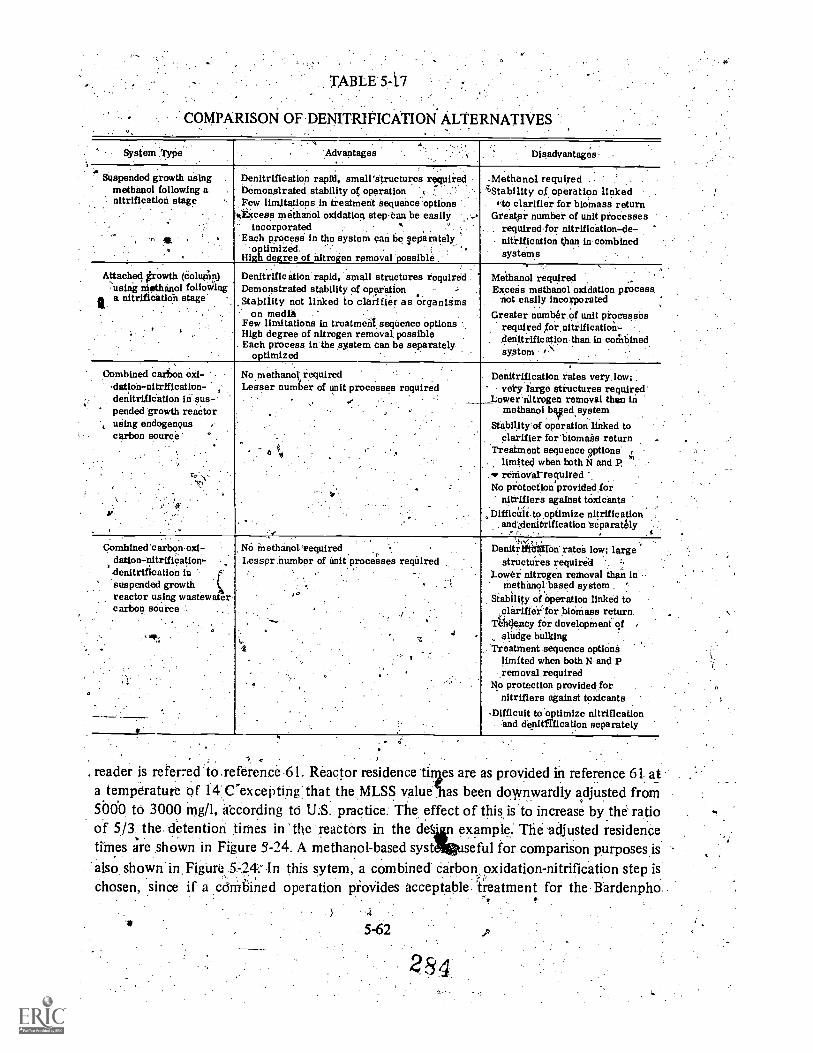
TABLE 547
COMPARISON OF DENITRIFICATION ALTERNATIVES
System .Type Advantages Disadvantages.
Suspended growth usingmethanol following anitrification stage
Attached trowth (Colun)using Methanol folloviing
a a nitrificatioh. stage..
DenitrilleatIon rapid, smairetructures requiredbernonatrateci stability of operationFew limitations in treatment Sequence 'optiOns
ktimess methanol oxidatiou step.ban be easilyincorporated
'Each process in the system can be geparately'optimized.
High degree.of nitrogen removal possible
,Methanol required .
"6stability of operation linked4to clarifier for bloinass return
Greatpr, number of unit processesrequiredfor nitrification-de-nitrification than in combinedsystems
Denitrificationrapid, small structures requiredDemonstrated stability of operation -,
. ..orStability not linked to clarifier as ganisms
on media . - , , .
Few limitations in treatment. sequence options ...High degree of nitrogen removal. possible
. Each process in the system can be separatelyoptimized
Methanol requiredExcess methanol oxidation process.
not easily incorporatedGreater numb& of unit processes
required for.nitrification-denitrificationthan in canhinedsystem f.S
Conibined carbon oil-,dation-nitrification-detiltrification in sus-pended growth reactor
' using endogenous ,
carbon source
yw
No methanol requiredLesser number of unit processes required
Denitrification rates very.lOw;vely large structures required'.
Lowernitrogen. removal thenmethanoi bardsystem
Stability of operationlinked toclarifier forblomaas return
Treatment sequence options'. limited when both N and p.
retithvarrequiredNo protection provided for
nitrifiers against toxicantsoptimize nitrification
ancidenitirification beparately
Combined'carbon oxi-dation-nitrification-denitrification insuspended growthreactor using wastewatercarbon source
NO Methanol 'requiredLessor number of Unit processes reqUired
Denitritittllod rates low; largestructures required
Lower nitrogen removal Until in. methanol based system .
Stability of Operation linked toaral iffer'thr bidniass return.
Tendency for development ofslncige bulking
Treatthent.sequence optionelimited when both NontiPremoval required
No protection provided for .
nitrifiers against toxicantsDifficult to.optimize nitrification
and denitfrfication separately
. reader is refer-ed toseference 61. Reactor residence tinges are as provided in reference 61 ata temperature of 14.C'excepting.that the MLSS valuelms been downwardly adjusted from5000 to 3000 mg /1, according to U.S. practice. The effect of this is to increase by the ratioof 5/3 the detention times in 'the reactors in the detifin example: The adjusted residencetimes are .shown in Figure 5 -24. A methanol-based systftiseful for comparison purposes isalso. shown in.Figurh 5 -24° In this sytem, a combined xidation-nitrification step ischosen, since if a cdrirliined operation proVides acceptable treatment for the Bardenpho
)
5-62
2s4

INFLUENT:,1;...; WAS I E.WAT E R
`FIGURE 5-24
COMPARISON,OF DEN,ITRIFICATION SYSTEMS
RETURN SLUDGE
ANOXICDENITRIFICAT ION'
'TANK (41-IR)
'AEROBICCOMBINED CARBON
OXIDATION-NITIFICATION
TANK
z
w
cc0
wX
ANOXICDEN I. R IF ICATION
TANK, (5 HR)
AEROBIC TANK' 2 HR).
w
U)
w
,
.SEDIMENTATION'TANK(8 .HR)
'DENITRIFIEDEFFLUENT
A. Bardenpho Process -29 hr).5-63
2&5
-INFLUENTWASTEWATER
COMBINED. CARBON()MOAT ION
N I TRIFICAT IONTANK
(10 HR)
iY
INTERMEDIATESED IMENTATiON*
TANK (4 H.13)
METHANOL
smonim.
DENJTRIFICATIONTANK' (g HR) T
0 wi l °:,
CDlir i . ca
AEROBIC TANK (I.HR-) ..Ld
,, z
cr-F INALk
SEDIMENTATION w1.--
. TANK 44 HO.' cr
It
DENITRIFEFFtUEN
B. A-Iternatiy. ihethanolBased SYiftni' (21 hr)
.
process it would also work effectively for The 'comparative case. .Solids retention time (andhydraulic detention tithe) of thejlitrification.Step would be the same as fdr the 'nitrificationtank in the Baidenpho process: .
.Since denitrification- fates are more rapid, the denitnfication tankin the methanol.-based
. . .
system can be proportionately smaller than in the Ar enPho process. Interpolatin,gdenitrification rates from FigureS '5-2 , 5=23, about 2 haul* be required.Aresidence time of 4 hours isasstimed for sediMentationAanks in the Fiethanokbased system,whereas 8 hours is assumed for the Bardenpho prOc4S due to the bulking tehdency of thesludge. CoMparing the two ayernative'systems, it can be seen that the alternating aerobic/anoxicsystem requires greater tankage Than the methanol -based system (294pours compared to 21,hours). In terms of econoinics, differences in the systems, can be §een as a trade-off of.capital cost.(tarikage) iithVperating cost (methanol)'.
5.8 Aefesences
1. Barth, E.F'.,. Brenner, R.C.,,and R.F. Lewis, Chemical-Biological Control of Nitroges inWastewater Effluent. JWPCF, 40, No 12, pp 2040 -2)054 (1968).
2. Parker D.S., ZadiCk, and ICE. Train, Sludge Processing for Combined Physical-Chemical-Biological Sludges_-Prepared for the EPA, Report No R2-73-250, July, 1973.
3 Horstkotte, G.A., Niles, D.G.; Parker, D.S., and WI. Caldwell,.Full-Scale Testing ofaWater Reclamation Systerit. JWPCF, 46 No 1, pp 481-197 i 1974).
4. Mtilbarger, The Three Sludge Systems for Nitrogen and Phosphonii Reinoval.'Presented at the 44th Annual Conference of the Water' Pollution Control Federation;San Francisco, California, October, 1971:
Sawyer, C.0.: Wild, H.E., and T.C. McMahon, Nitrification and,,,Denitrificatio,nFacilities, Oastewater:Treatment. Prepared for the EPA Twhnology Transfer Program,Atigust, 19')1.
Parker .ftS:, Case Histories of Nitkificatian and DenitrifiCation Facilities. Prepared forthe EF'AtTechnOlogy Transfer Ppgiam, May, 1974.
, 4e '
Murphy Sutton, Pilot Scale Studies on BiologiCal Denitrification. 'Presented.; at,the 7th international COnference on Water PollutiOn Research, PariS,Septembei, 1974.
. .
Oidisflop, D.E , :Persbnal :copurAmication to D.S. Parker. Environmental Protection'Agency, Withington, D.C.; April; 10974.
if
. .°;,4,4
Nitrification' sand ,Denitrificatipn in : Activated Sludge ..SYStorks,.JWPCF, 43, No. 10:fpp 2059-2070 (1971).
.5 -64sa.

10. Dawson, R.N., and K.L.' Murphy, Factors Affecting- Biological Denitrificatiorti0
WasteWater In Advances. in Water Pollution Research; S.H. Jenicins, Ed' OxfordEnviand: Fergam on Press, 1973.
.1 I. Stensel, H.D., Loehr, R.C.$and A.W. Lawrence, Biologica/ Kinetics ofGrowth Denitrification. JWPCF, 43, No. 2, pp 240-261 (1973).
12. Sutton, P.M., Murphy, .K.L.,. and R.N. Dawson, ContinuOUS Biologii.al.Denitrillcationof Wastewater. Environmental OrOtection Service (Canada), RepOrt. EPS 4-WP-.745,,August, 1974.
.
13. Lawrence, A.W., and P.L. McCarty;. Unified Basis foti,Biologithl Treatment Designand,.Operation.- JSED,'Proc. ACE; 961 No SA3, pp 757-778 (1970).:
14..' Brawn and Caldwell; Project Report for the Water Reckmution Plqng, -Repdirt toCentral Contra Cpsta Sanitary District,',Novembei, It 9 7 1 .
15. C.L., D.Q., G-Oicnan, E., land j.W: Porter, Studies of municipalWasteOater Renovation for Industrial. Water. Presented at the 44th Annual Conferenceof.the, Water Pollntion Control Federation; San FranOsco;'California,4otober; ,I 9712
16 Horstkotte,'`G.A., Jr., Pilot DemonstratiOn Project for Industrial Reuse- of ReirovqtedMunicipal Wastewater Prepared for (e EPA, EPA-670/2-71-064, August, 1973
, .
Requa, DA., and E.D.',Schroeder: Kinetics pf Packed Bed Denitrifiiation. J, P &,45,No. 8", pp 1696-1707 (1973),,
-.160,1-.-
4-
18.- Smith, J:M., Masse, A.N., Feige, WA.; and. L.J. Kamphalce, Nitrogen Removal fromMunicipal, Wastewater` b}; COlumnar De-nitrification. Environmental Science ancEreph-
,
n-ology, ,6z p 260 (1972).
19. Jewell, .W.J.; and R.J. Cumming.s, Denitrification Of Concen,ttated Wastewqters.Presented atthe Water Pollution Control Federation,'Cleveland, October, 19737
2p. Sutton, FM.; Murphy, K.L.; and R.N' Dawson, 'Low. TeMperalure BAlogica7111,
Denitrification of. Wastewater. JWPO; 47, Nb2 1, pp 122-134 (1075).
- ..
.; Parker, D.S., Aberley, R.C. and D.H. dwell, Development. and ImPlementation of.",$lo logical Denitrification for Two Large PlantStiOteseili d'' at the Conference on:"' '.,
l'',' iIitrogen as 'a -Water Pollutant, sponscired by tiliklitAWPR; Copenhagen:Denmark, " ..
August, 1975. .s.. : ... . , .. ., C .
G
2. Denitrification for "A naerobic. Filters and ,Ponds; Phase IL Robert S. Kerr WaterResearch Center, ,EPA WPCRS 13030 ELY, 06/71,14, June, 1911.
23. Denitrificatpn for Anaerobic Filters'and Ponds. Robert S. Kerr Water Research Center,EPA WPCWS 13030 ELY 04171-8, April, 197,1.
24., Description of the El Lago, Texas. Advanced Wastewater Treatment Plant. Seabrook,Texas: Harris County Water Control and Improvement District Number 50, March,1974.
25. Requa, D.A.', Kinetics of Packed Bed Denitrification. Thesis submitted in partialsatisfaction of the requirements for the degree of Master* Science in Engineering,University of California at Davis, 1970.
1!$
26. *English, 'J.N., Carry, C.W., Mass; A.M., Pitkin, J.B., and F.D. n, Denitrificationin Granular Carbon and Sand Columns. JWPCF, 46, No. 1,'pp 284 974).
27. Savage, E.S., and J.J. Chen, Operating Experiences With Columnar Denitrification.Pittsburgh, Pennsylvania: Di'avo Corporation, 10.3.
28. Lamb, G.L., Nitrogen Removal Utilizing 'Single Stage A &ivated Sludge and Deep BedFiltration. Presented at the Joint ,Meeting of the Sanitary Engineering Section, ASCE,and the Metropolitan Section, NYWPCA, New York, N:Y., March, 1972.
29. Ecotrol, Inc., Biological Denitrification Using Fluidized Bed Technology: AuguSt,' 1974.
30. Jeris, .J., Beer, C., and J.A. Mueller, High Rate Biological' Denitrification Using aGranular Fltiidized Bed. JWPCF, 46, No. 9, pp 2118-2128 (1974).
31. Chen, J.J.; Letter communication to D.S. Parker, Dravp Corporation, November, 1974.
32. Kapoor, S.A., and T.E.- Wilson, Biological Denitrification on Deep Bed Filters atTampa, Florida. Unpublished paper, Greeley and Hancn, Engineers, Chicago, Ill., (nodate).
33. Hansen, S:E., Letter communication to D.S. Parker. Neptune MicroFloc Inc, Corvallis,Oregon, September 11, 1974.
34. Duddles,.G.A., Richardson, S.E., and E.F. Barth, Plastic Medium Trickling Filters forBiological Nitrogen Contrul. JWPCF, 46, No. 5, pp 937-946 (1974).
Duddles, G.A. and S.E. Richardson, Application of Plastic Media Trickling Filters forBiological Nitrification. Report prepared for the Environmental Protection Agency,EPA-R2-73-199, June, 1973.
36. Process Design Manual for Suspended Solids Removal. U.S. EPA, Office of TechnologyTransfer, Washington, D.C., January, 1975.
:5,66

37. Jeris, J.S., and F.J.: Flood, Plant Gets New Process.Watet and Wastewater 1 ngineering,pp 45-48March, 1974.
38. Jeris, John S., and R.W. Owens, Pilot SCale High Ratte. Biological Denitrification atNassau County,: N. Y. Presented at the Winter Meeting of the New York WAer PollutionControl Association, January, 1974. , .
t:4 , n
Corp39. Owens, R., Letter communication to D.S. Parker, Ecolotrol Corp., October, 1974.. - .. .
40: Process Design Manual for Upgrading Existing Wastewater Treatment. Plants. U.S, EPA,
Office of Technology.Transfer,`WashingtOn, D.C. (1974).
41. EcolOtrol, Inc., Hy-Flo' FluidizedDed Denitrification, Ecolotrol TechnicalBultetin, No.123-A, November, 1974.
42. Sullivan, Cohen, M.M., Ure, J.E., and F. Parkinson, The Swirl Concentrator as aGrit Separdtor Device. Prepared for the EPA by the American Public Works.Association, EPA-670/2-74-026, Juile, 1974.
,oe -
43., Manufacturing Chemists Association,. Properties and .ESSential InformationHandlirig and Use of. Methanol, Chemical Safety Data 'Sheet,SD-221, 100:
.44. Austin, George. T., Industrially Significant Organic Chemicals Part .7.. Chemical
Engineering, 81, No. 13, pp 152-153 (1974)..
45. Manufacturing Chemists As'sociation, Recommended 'Practice Unloading Flammable'Liquids from Tan'k Cars, Manual Sheet TC-4. 1969.
46. Manufacturing Chemists Association, Tank Car Approach Platforms,. Manual. Sheet,TC- 7 1965,.
47. National Fire Protection AssOciation, Static Electricity 1966,,'NFPA No. 77. 1966.
..
48. National Fire Protection Asgociati n, Flammable .and.Combustible Liquidi Code 1972;NFPA No. 30, 1972. '
49. Srriith, A.G., Denitrification Reactor Studies in a Lime Treated Sewage Plant. PaperNo. 2029, Ontario. Ministry of the Environment, Research'pranch, July, 1972.
50: Tenney, M.W., and Echeiberger, Removal of Organic.and Eutrophying Pollutantsby Chemical-Biological Treatment. Prepared for the EPA, Report. No. R2-72-076(NTIS PB-214628), April, 1972.
/51. Pa er, D.S., and D.G. Niles, Full Scale Test Pla t at Contra Costa TurnsOutValUable
Data n Advanced Treatment. The Bulletin (o theCalifomia Water Pollution ControlAssocihtion), 9, No..1, pp 25 -27 (1972)
I
52. Sutton, P.M., Murphy, K.L., and B.E. Jank,Ni rogen Controt:A.Basis for Design With.Activated Sludge Systems. Presented atAli Conference on Nitrogen as a WaterPollutant, sponsored by the IAWPR, Copinha n, Denmark, August, 1/975.
53. Wuhrmann, K., Nitrogen Removal Ii/ Sewage Treatment Proces.i4 Vprh. Int. Ver.Limnol., 15, pp 580-596 (1964). 4.
54. Hunerberg and Sarfert, ExperiMents o the Elimination of Nitrogen from BerlinSewage. Gas u. Wasserfach, Wasiir=fhw er, 108, pp 966-969 and 1197 -1205 (1967).
)* (.55. Hamm, The Influence on Denitrtfica on of Phosphate Precipitants. Z. Wasser and
AbwasserfOrschung, 2, pp 180-182 (1 69).
,
56. Schuster, Laboratory Experiments on Removal of Nitrogen Compounds fromDomestic Sewage. Fortschr Wasserch m. Greng., 12, pp 139-148{1970).
57. Carlson, D., Nitrate Rei#Oval from 1 cthated Sludge Systerris. Report for OWRR,Project A026, July, 19701;
58. Beer, C., Hetling, and R.E. Mc inney, Nitrogen- Removal and PhosphorusPrecipitation in a Compartmentalized A ration Tank Technical.Paper 32, New YorkState Department of Environmental Conservation, February, 1974.
59. Christensen, -M.H., . and P. HariernoeS, Biological .Denitrification in WastewaterTreatment. Report 2-72, Department of Sanitary Engineering; Technical University ofDenmark, '1972. 4
60. Bishop, D.F., Ileidman, JA., and J.B. Stamberg, Single Stage Nitrification-Denitrification. Preisented at the 47th Annual Conference of the Water Pollution,
Control FederationDenver, Colorado, October 6-11, 1974.
61. Barnard, J.L., Cut P and. :11 Without Chemicals. Water and' Wastes Engineering, 11, No.7, pp 33-36 (1974) and No 8, pp 41-94 (1974).
62. WuhrnAal n, K., Effect of Oxygen Tension on Biological Treatment. Processes,. Proc.ThireLlInference Biological Waste TreatMent, Manhattan College, , N.Y., 1960, pp27-38.
.
63. Pasveer, A., Contribution on Nitrogen Re. rWoval from Sewage. Muncher Bertrage zurgbwasser-Fishereiand Flussbioiogie, Bd 12, pp 197-200 (1'965)/
5-68
2Y rj. .
64. Matsche, N., The Elimination of Nitrogen in the Treatment Plant of Vienna,-Blumenthal. Water Research, 6, No. 4/5, pp 485486 (1972).
65. Matsc,he, N.F., and G. Spatzierer, Austrian P6nt Knocks Out Nitrogen. Water andWastewater Engineering, 12, No. 1,, pp 18-24 (1975).
66. Drews, R.J.L.C., and A.M. Greeff, Nitrogen Elimination 'by Rapid Alternation ofAerobic/ "Anoxic" Conditions in "Orbal" Activated Sludge Plants. Water Research, 7,pp 1183-1194 (1973).
67. Halvorson, H.O., Irgens, R:, and H. Bauer; Channel Aeration Activated SludgeTreatment at Glenwood, Minnesota. JWPCF, 44, No. 12, pp 2266-2276 (1972).
68. Zemaitis, W.L., Letter -communication to D.S. Parker. Envirobic Systems, Inc., NewYork, New York, September 27,1974.
69. Christensen, M.H., Denitrification of Sewage by Alternating Process Operation.Presented at the IAWPR, Paris, September, 1974.
70. Barnard, Denitrification. Presented at the monthly meeting of theSouth African Branch of the Institute of Water Pollution4Control, August, 1972.
71. Ludzack, F.J., and M.B. Ettinger,.Controlling Operatioli to Minimize Activated SludgeEffluent Nitrogen. JWPCF, 34, No. 9, pp 920-931 (1962).
12. van Vuuren, L.R.J., Letter communication to D.S. Parker, February, 1975. '
73. Gujer, W. and D. Jenkins, The Contact Stabilization Process-Oxygen and Nitrogen MassBalances.. University of California, Sanitary Engineering Research Lab, SERL Report74-2, February, 1974.
74. Balakrishnan, S., and .W.W. Eckenfielder, Nitrogen Relationships in Biological WasteTreatment Processes III, Denitrification in the. Modified Activated Sludge Process.Water Research, 3, pp 177-188 (1969).
75. Schroeder, E.D.; and A.W. Busch, The Role of Nitrate. Nitrogen In Bioxidation.-JWPCF, 40, No. 11, pp R445-R45 7 (1968).
76. Parker, D.S., Kaufman, W.J., and D. Jenkins, Physical Conditioning of ActivatedSludge Floc. JWPCF, 43, No. 9, pp 1817-1833 (1971).

6.1 Process Chemistry
CJIAPTER 6
c -
BREAKPOINT CHLORINATION
When chlorine is added to dilute aqueous solutions containing ammonia nitrogen, reactions'occur which may lead ultimately Ws oxidation of the ammonium, ion to end productscomposed predominantly of nitrogen gas.. such chemical .prodesses are performed' inwater and wastewater' treatment for the purpose of ammonft nitrogen removal, theprbcedtire is termed breakpoint chlorination. This chapter discusses : the theoretical,stoichiometry of breakpoint chlorination, presents the practical process considerationswhich influence actual'', chemical consumption, reaction end preddcts and rate' of.,Jhereaction,;and presents process design criteria.
Recent work at the. Blue Plains wastewater treatment pilot plant in Washington, D.C.has: confirmed breakpoint chlorination reaction products. Gas, c'nP6matography was'useclatBlue Plains tp identify breakpoint reaction products from buffered aquepus wastewater"samples in laboratory tests. Further confirmation of breakpoint'reaction end products wasqbtained in pilot scale investigations with wastewater effluent of different qualities.
,
Breakpoint chlorination tests on domestic wastewaters at the Blue Plainspilot plant showed,that 95 to 99 percent of the ammonia nitrogen in solution is converted:to nitrogen .gas.2,3No breakpoint reaction intermediate compounds of N20, NO'or NO2 were detected. Theoxidied ammonia nitrogen fraction which did not appear as nitrogen gas was found to bemade up of nitrate and nitrogen trichloride.
6.1.1 ChemicaliStoichiometry.
When chlorine gas is dissolved in water, hydrolysis of ihe chlorine molecule occurs accordingto the following relationsfiip:
HOC1 + H+ (6-1)(hypochlbrous acid)
The active (oxidizing f orms of chlorne in! solution are hypochlbrous acid and itsdissociation product, hypoChlorite ion. ,
}pa 4._-_' oci- =+ K 3.3 x 10⁻⁸(6-2)
at 20 C
, where: K = dissociation constant
6-1
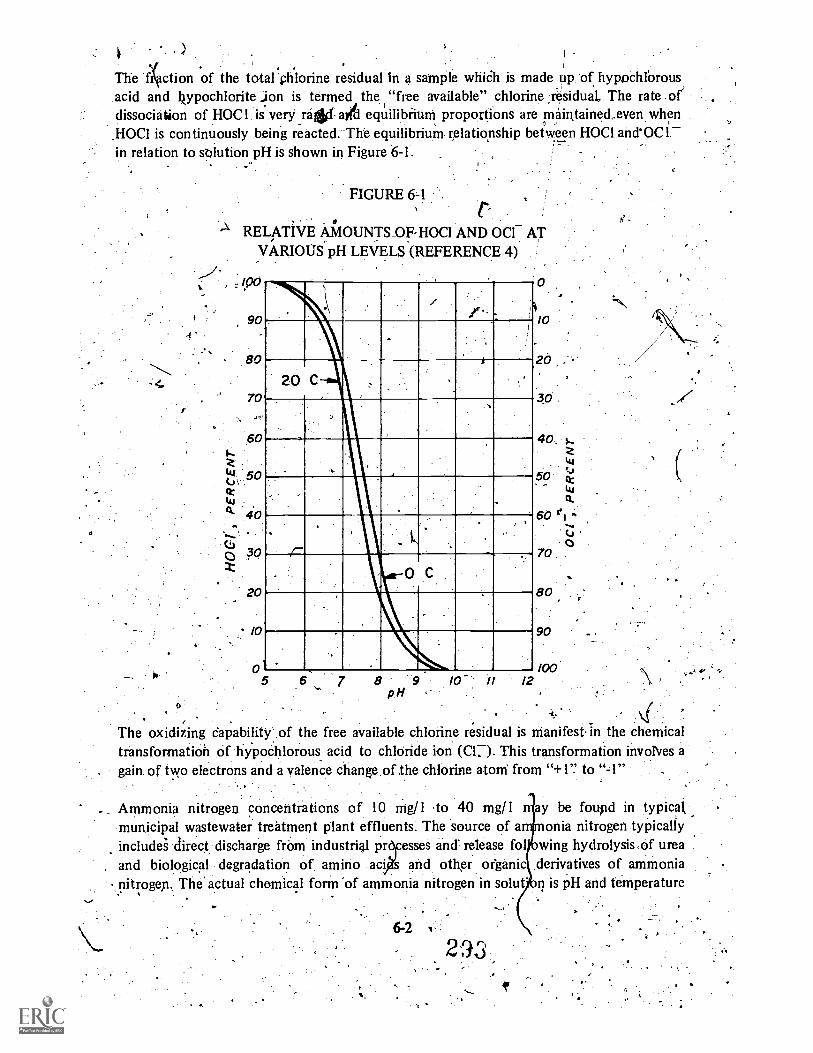
S
)
The fiction of the total chlorine residual in a sample whiCh is made Up of hypcChlbrousacid and kypochlorite ;ion is termed the "free available" chlorine residual, The rate .of"dissociation of HOC1 is verVra- aped equilibrium proportions are maintained even when
HOCI is continuously being reacted. The equilibrium relationship between HOCI and'OC1in relation to solution pH is shown in Figure 6-1.
FIGURE 6 -1
"\ RELATIVE AIVI OUNTSDF-HOC1 AND 00 ATVARIOUS pH LEVELS (REFERENCE 4)
90
20 C
Lk' 50
a. 40
c 30
200 C
/0
6 8 9pH
/0
20
qd .
40,
ti
50 iit)
4.
60 eC.)
OTO
80
90
/1-
/00 -* 0-
,.The oxidizing capability' of the free available chlorine residual is nianifest in the chemicaltransformation of hypoChlorous acid to chlOride ion (C17). This transformation involVes again of two electrons and a valence change.of the chlorine atom from "+1'? to "-,1"
. _ Ammonia nitrogen concentrations of 10 mg/1 to 40 mg/I ay be found in typicalmunicipal wastewater treatment plant effluents: The source of a onia nitrogen typicallyinclude; direct discharge frOm industrial pr esses and release fol wing hydrolysis,of urea)cand biological degradation of amino acr s and other ofgani derivatives of ammonianitrogen. The actual chemical form 'of ammonia nitrogen in solut ill is pH and temperature.. ,
6-2
2 33
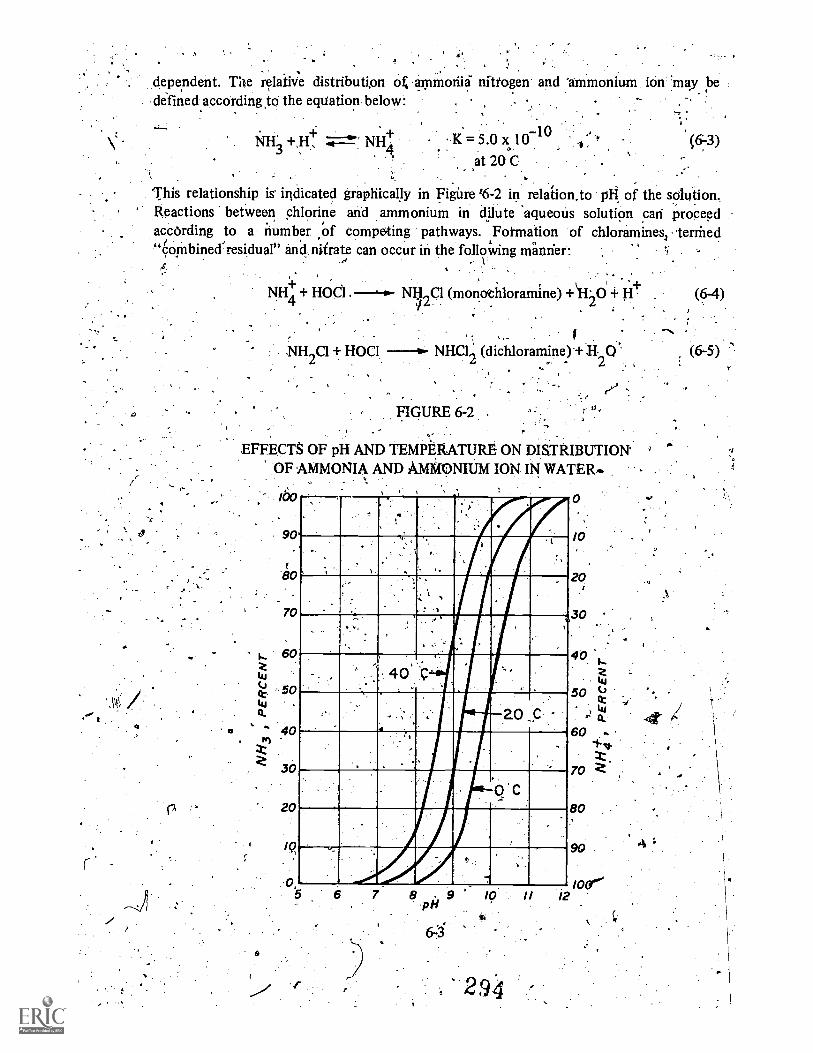
dependent. The relaihre distribution ot ammonia nittogen and 'ammonium ion May bedefined according to the eqtiation below: - .
, ,-,, -
.
+.+ . K = 5.0 x 10⁻¹
.,NH (3)at 20C
. 'This relationship i5 indicatedReactions between chlorineaccording to a number of"CoMbinedresidual" and nifra
'..c
a
graphically in FigUre '6-2 in relation.to pFI of the solution.and ammonium in dilute aqueous solution can proceedcompeting pathways. Foimation of chloramines ..ternied
to can occur in the following manner:
NH4
+ HOCI NH2
Cl (monothloramine)2
+ H
..
(6-4)
NH2
Cl+ HOCI2
NHC1 (dichloramine) +B-
FIGURE 6-2
EFFECTS OF pH AND TEMPERATURE ON DISTRIBUTION 'OF AMMONIA AND AMMONIUM ION IN WATER.
2
20
/0
10
C
0
10
20
.30
40,
14J
50 ()
60
70
80
11 12
2 94
(6-5)

- NHC1 +140C1.. NC13 (nitrown trichloride) + H2O
and
NH4 + 4H0C1 HNO3 O + 5H+ + t4C17 + HBO
(6 -6) -
(6 -7)
The...reactions are'..dependetit upon; certain process variable's, inchrdint pH, tempgatute,contaCt, time, andtheinitiatChlorine to ammonia nitrogen ratio (C12: 4-N).5,-6,7
.Breakpoint chlorination occurs when stiffiCient chlorine has been added to 'water orwastewater sample to cause the chemical" oxidation Alf the ammonium in solution. tonitrogen gas. and other end products..
.
.. ,§ignificant aspects of breakpoint chlorination piocess chemistry which were studied diring
the 'Blue Plains Pilot work included identification of the predominant end products of thebreakpoint reaction. Tests on municipal wastewater and wastewater treatment .plarit effluentat Blue Plains. indicated that 95 to 99 perCent of the ammonia nitrogen in 'solution'wasconvert01.,t6 'nitrogen gas: Nitrate ,andiiitrogen trichloride account .foro,the remainingfraction. Thf overall reaction betWeenThe amrrionium ion and .ch nne leading to formatiiinof nitrogem,gas may be expressed in terms of the simplifier) NO. ictns
E, .
. .
- +NH4 HOC1.5---- NH Cl + 1-1 ID H2
NH 2C1 + 0.5 HOC1 0.5 N 0:5 H 0 + 1.5- H+ + 1:5 Cc21-
2
(6-4)
°
(6-8)
(6-9).1:5
a
0.5 N- + 1 5 IP 0 It1.11 + -1-'1.5 Cl-HOC1--4 + .
2 2
' -P
Stoichiometrically, 'tte breakpei reactiOn ; ;Cif Etwation. 6-9 rewires a weightchlorine to ammonia nitrogen at the breakpciit of 7:6:1, as shown belOy:
11,.
"
Molecular Weight HOC1:=70.9 (expressed as C12)
Molecular,Weight NH4 = 14.0 (expressed as N)
Therefore, Niveight ratio of C12:N111:1 -N at breakpoint:.
+C12:NH4 -N =.(415)(70'.9) : (1)(14.0) = 7.6:1
ratio, of

Therefore 7.6 parts of chlorine are theoretieally required to-chemically Oxidize one part ofammonia nitrogen in aqueous solution. In practice, the actual weight ratio of chlorinetoammonia nitrogen at breakpoint has ranged froM about :1 to 10;11..Many of.the processvariables which are known` to affect the total chemical requirencent for this process havebeen identified and those factors are discussed in sitbseqUent sections.
6.1.2 The Breakpoint Curver4
The breakpoint chlorination curve is a graphical repreentaqon cherhical relationshipswhich exist as varying amounts of chlorine are added to dilute soluticins of 'ammonianitroten.An investigation in 1939 led to the 'discovery that increasing the chlorine dose inCertain waters resulted in an overall` reduction in the chlorine residual measured in the watersample/following contf t:8 The point of maximum reduction of chlorine resii`dual wastermed t "breakpoint".
. _
The theoretical breakpoint curve shown iti Figure 6 3 has several characteristic features. Thecharacteristics .ofi, the breakpoint curve shown in Zoite 1 include principally -the reaction
between chlorine and ammonium indicated in Equation 6-4. The hump of the breakpointcurve occurs, theoretically; at a chlorine to ammonia nittbgen weight ratio of 5:1 (molar_ratio, of 1:1). That ratio. corresponds to, the point at which the reacting molecules atepresent in solution4n equal numbers." ,
The chemical equilibria of Zone 2 favor the formation of dichloramine (Equat ,6=5) andthe oxidation of ammonium according to Equation 6-9. These reacti proceed iKcompetition .1o, theoretically, a C12:NFI44-N weight ratio of 7.e:1..At the breakpoint, theammonium concentration is 'minimized.
To the right of breakpoint, Zone chemical equilibria include the build-up of free chlorineresidual: as well as the presence oEtall quantities of dichloramine (Equation 6-5), nitrogen,trichioride (Equation 6-6), and nitrate: (Equation 6-7).1 The free chlorine residuals whichresult from dosages beyond bireakpoint are known to be considerably more bactericidallypotent than the combined residuals found at lower chlorine dosages (See Section 6.2.7).
6.2 Process Application Considerations
The basic theoretical b_,ackground chemistry Must_ be combined with application funda-mentals if proper process 'designs and operations are to be achieved in full scale wastewatertreatment practi9e. Much ackground work on breakpoint chlorination has been done on alaboratory "pure systeM" basis and in potable water. This. informatiOn is useful, tilt notalways applicable to wastewater treatment considerations. Generally, tie-presence of high
.concentrations of ammonia nitrogen and other amino substances as well as the presence ofother chemical constituents in wastewater effluents' contribute to the discrepancy betweensome data available from laboratory testing and that collected in actual wastewatertreatment applications. ,.
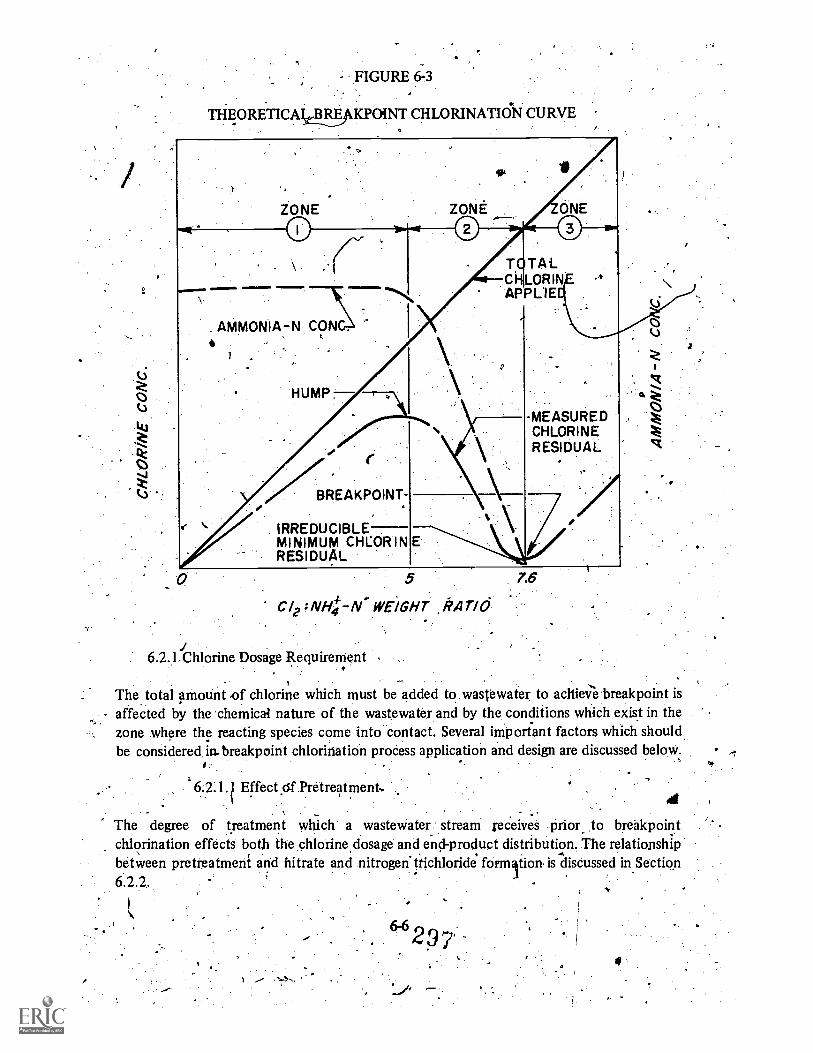
FIGURE 6 -3
THEORETICAIKPOINT CHLORINATION CURVE
ZONE
O
9
ZONE ONE
--.7\AMMONIA-N CONC.. '
HUMP ,
TOTALCHLORINEAPPLIEd
,BREAKPOINT-
IRREDUCIBLEMINIMUM CHLORINRESIDUAL
6.2.I Chlorine Dosage Requirement
MEASUREDCHLORINERESIDUAL
E
5
WEIGHT ,1?And
76
O
.9 .
The total amount of chlorine which must be added to wastewater to achieve breakpoint isaffected by the chemical nature of the wastewater and by the conditions which exist in thezone where the reacting species come into contact. Several important factors which shouldbe considered in.breakpoint chlorination process application and design are discussed below.
6.2. 1.1 Effect df Pretreatment-.de
The degree of treatment which, a wastewater' stream receives Prior. to breakpointchlorination effects both the chlorinedosage and end-product distribution, The relationshipbetween pretreatment and nitrate and nitrogen ttichloride formition is discussed in Section6.2.2.
1
645 29 7
a
The chlorine demand of a wastewater treatment plant effluent sample is the total chlonneoxidative capacity conseatied during a given period of time by substances in-solution whichdo not result in measurable Chlorine residual or chemical oxidation of ammonia nitrogen.This is the chlori;ie oZidative capacity which is essentially "lost" Rom participation indesired breakpoint reaction. Chlorine,demand may be exerted by a number .of substances"commonly present in ,yvastewater, including S2,HS'SO3,NO2,Fe\2+, phenols, aminoacids, proteins and carbohydrates?
Generally, as the degree of pretreatment of wastewater is increased, the chlorine demandexerted by the substances noted atnive is reduced. One particularly important factor is thatif 'a treatment process employing anoxic conditions precedes a chlorination facility,substances .in solution may be converted from an oxidized to a reduced form and thechlorine demand may be substantially increased.
LaboratoRy and pilot plant studies of breakpoint chlorination at the Plains pilotplant1,2 and atSunnyvale10,11 have shown that increasing levels of pretreatm nt decreasethe mount of chlorine required to aFhieveJareakpoint. Table 6-1 shows. tha laboratorytests on buffered distilled water con.taihing only ammonia nitrogen reached bre kpoint atC12:NH4-N ratio of 8:1, a level near that predicted by chemical stoichiom etry (7.6:1). Incomparisoniaraw wastewater required a C12:NH4 -N, of 9:1 - 10:1 to reach breakpoint:Arrimonia nitrogen concentrations in the samples following breakpoint were found to be-consistently in the range of 0.2 mg/1 or less. Pilot plant scale testing of breakpointchlorination processes has confirmed chlorine dosages predicted through laboratory work:,,
6.2.1.2 Effect off' pH and Temperature
Laboiatory studies at Blue Plains1,2 in which buffered distilled ammonia nitrogen solutionsof 20 mW1 concentration were subjected to breakpoint chlorination dosages showed 4a.definite optimum pH for breakpoint in the range of pH '..6 to 7. The chlorine dosage at-optimum pH levels was found to be C12:Na4 -N of 8:1. BreakPoint tests conducted outsidethe apparent optimum range of pH 6 to 7 showed an appreciably higher chlorinerequirement for breakpoirit and slower reaction rates.
Comparable tests carried out with filtered secondary effluent did not show a clearly definedrelationship between pH and C12:Natt-IN to reach breakpoint. Formation of other
residualssiduals (NO3 and NC13) was considered to be the con4rolling criteria in.selection of the optimum pH operating range of pH 6 to 7 (See Section 6.2.2).
There is no evidenceithat- ordinary variations in the temperature of wastewater efflaffect the C12:Na4-N:to reach breakpoint.
it 2.13 Initial Mixing of Chlorin
The significance of initial mixing in certain unit processes of sanitary engineering has been
.1
6-7,
a
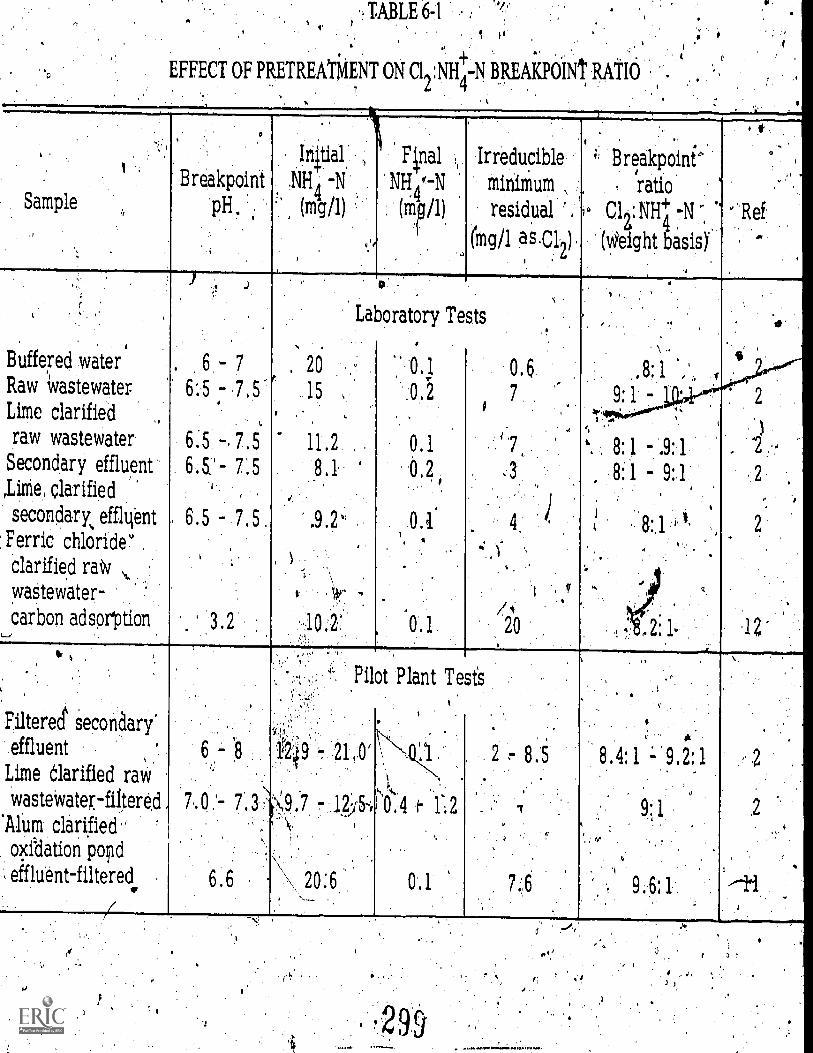
EFFECT OF PRETREATMENT ON CI :N
i4
4-NBREAKPOiNT, RATIO
SampleBreakpoint
'pH. '
riitial'
.NH -N "1\111.4'7N(mg /1)
Fnal
(m /1)
. ,,
Irreducibleminimum ,
residual ,
(mg/1 4sCl..z ),
, Breakpoinib, ratio
Cl NH+4 7N ',
(Weight basis).
. * ,
v Ref.
I
Buffered waterRaw wastewater-
Lime clarifiedraw wastewater
Secondary effluent,LiMe, clarified
secondary, efflgentFerric chloridC .
clarified raw ,,
waStewater-
carbon adsorption
. 6 - 76:5 ,7 5-
6..5 - 7.56 5: 7:5
'
6.5 7,5 .
3.2
Laboratory
20
15, .
11 .2 ,
8.1
,9.''
,
:Tests
0
'0.1
..0 2
0 . 1
0.2
OA. .
0,1
,
0,57 ,
7
, a
4,
20
. c
.
',
1 ..
,8: 1 , ,
9 :1 -* :.4., .4!
t
' 8 :1 .9: 1
.8:1 - 9:1
8:1
,
, 1.
2
)2
.' 2
2
12b- t, )
,
Filtered', secondary'effluent .
Lime Clarified rawwastewater -fit
Al'um clarified '
, oxfdation pondeifhtent-filtered
/
T. 7.3 '%,,,-
6.6
. Pilot
:;
'.f..49 .7 21,0`
93 .1,2').5-,.6,,- \<,
\ 20;6
Plant Tests
. .
t
I- 1:2
0..1
.
8.5
1
7 :;,6
.
8,4:1 7' 9.2:1
. ,,
9:j
..
9. 5: 1
..

amply demonstrated. Tests13 have shown Significantly improved alum coagulationefficiency as a direct result of increasing the level of turbulence of mixing in the zone ofalum application to a water sample. Improved disinfection efficiency in laboratory tests wasalso noted when the application of chlorine to a wastewater effluent was accomplished atincreased levels of turbulent mixing.
Recent data from Blue Plains". have shown the .total chlorine dose required to reachbreakp.Oint is not affected by initial mixing conditiOns to thp degree which was firstreported. A number of pilot plant tests with. secondary effluent in which the chlorine wasdosed into a mechanical mixer showed no differeride in-the efficiency of chlorine utilizationwhether or not the pixer was operating. Other laboratory studies have shown, theC12:NH4 -N ratio at breakpoint. to be unaffeeted by the degree of mixing in the reactionzone.
N .
In plant-scale .design of breakpoint chlorination facilities; a quantity , of hydraulic 'ormechanicalrenergy sufficient fo facilitate rapid and thorough blending-of the chlorinesolution, pH adjustment chernical and process influent should be provided. The blending ofcheMidalswith the process influent initiates:the breakpoint reactions and alloWs completionof the breakPoint reaction within the contact zone, provides the basis for containment ofprocess odors and assures process consistency; a necessary prerequisite fore feedbackelement of process control (Section 6.3).
6.-2?2 Residual Nitrogenous Materials;ti
Nitrate (NO-3) and nitrogen trichloride (NC13) are occasionally found inttli -effluent fromthe breakpoint chlorinatiOn process. Both compounds can be found in varying con-centrations, depending upon the degree of pretreatment and pH in the eaction zone. Thetotal concentration of these residuals seldom exceeds 10 percent the influent ammonianitrogen concentration.2
Nitrogen trichloride is a particularly volatile compound whit exh its a very strongchlorinous odor. It is an extremely strong oxidizing agent, havin been sed for many yearsin the bleaching of flour. Formation of NC13 in breakpoint chlo ation even in fairly smallconcentrations, is undesirable becaUse of the obnoxious and dandangerous c aracteristics of.thecompound in the gaseous form. Nitrate formation in breakpoint chlo ation should beavoided since it represents a reaction product which has consumed considerable amounts ofchlorine (Equation 6-7) and because ireduces the overall nitrogen removal capability of thebreakpoint process.
. ,
Table 6-2 presents data on the effect of wastewater pretreatment on the, formation ofresidual nitrogenous materials.at breakpoint.1,2 Althoughthe investigators concluded thatNC13 formation decreased with decreasing pretreatment, it appears that very highly treatedeffluent may be bfeakpointed with the production of negligible levels of NC13. Nitrateproduction was similar at each treatment level.,
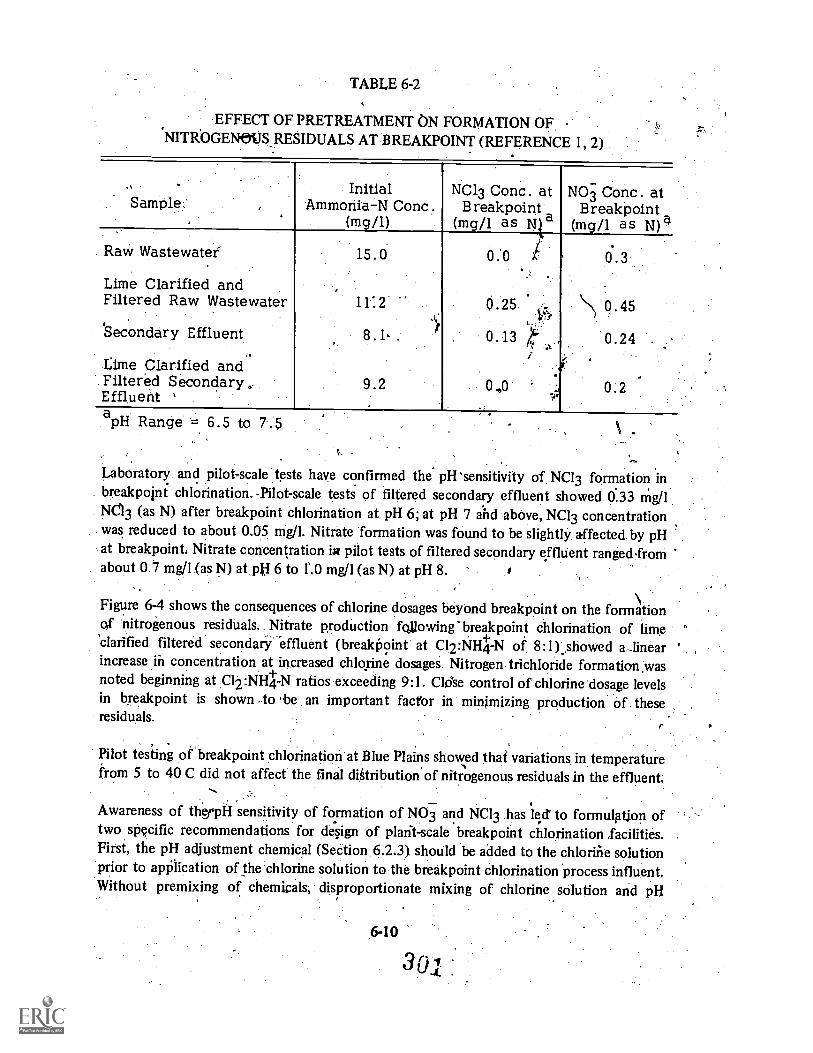
TABLE 6-2
EFFECT OF PRETREATMENT ON FORMATION OF,.NITROGENOUS RESIDUALS AT BREAKPOINT (REFERENCE 1, 2)
,.
Sample_ : ,
InitialAmmonia-N Conc.
(mg/1)
NC13 Conc. atBreakpoint
(mg/1 as
NO3 Conc. atBreakpoint
(mg/1 as N)a.
Rai, Wastewatet
Lime Clarified andFiltered Raw Wastewater
'Secondary Effluent
Lime Clarified and.Filtered Secondary..Effluent '
15.0.
11:2
8.1, .t
9.2.
OA i
Q.251-'.
, 0.13 ",..t
0 0 ,,.,-
0.3
0.45
0.24 .
.0.2
apH Range = 6.5 to 7.5
Laboratory and pilot-scale tests have confirmed the pH 'sensitivity of NC13 formation inbreakpoint chlorination. -Pilot-scale tests of filtered secondary effluent showed 0.33 mg/1,NCI3 (as N) after breakpoint chlorination at pH 6; at pH 7 and above, NC13 concentrationwas reduced to about 0.05 mg/l. Nitrate formation was found to be slightly affected by pHat breakpoint, Nitrate concentration in pilot tests of filtered secondary effluent ranged,fromabout 0.7 mg/1 (as N) at pf,I 6 to f.0 mg/l(as N) at pH 8.
Figure 6-4 shows the consequences of chlorine dosages beyond breakpoint on the formationof nitrogenous residuals. Nitrate production fao,,ving breakpoint chlorination of lime'clarified filtered secondary effluent (breakpoint at C12:NH44-N of 8:1). showed a_linearincrease in concentration at increased chlorine dosages. Nitrogen trichloride formation wasnoted beginning at C12:NH4-N ratios exceeding 9:1. Clase control of chlorine dosage levelsin breakpoint is shown to .be an important factor in minimizing production of theseresiduals.
Pilot testing of breakpoint chlorination at Blue Plains showed that variations in temperaturefrom 5 to 40 C did not affect the final di4tributionof nitrogenous residuals in the effluent.
Awareness of thyspil sensitivity of formation of NO3 and NC13 has led' to formulation oftwo specific recommendations for deOgn of plarit-scale breakpoint chlorination facilities.First, the pH adjustment chemical (SeCtion 6.2.3) should be added to the chlorine solutionprior to application of the chlorine solution to the breakpoint chlorination 'process influent.Without premixing of chemicals; disproportionate mixing of chlorine solution and pH
6-10
301

E
0.5
04
Q) 02O
0.8
0.7
0.6
O./
FIGURE 6-4
EFFECT OF CI2. 4.NH+ -N ON NITROGEN RESIDUALS IN
LIME CLARIFIED FILTERED SECONDARY EFFLUENT (REF. '1)
AMMONIA-N CONC. = 9.2
pH RANGE 6.5.- 7.5
C 12: NH4 -N DOSAGE AT BREAKPOINT =7:I to 81
9/I
NITROGENNITRATE TRICHLORIDE
. 00.0 Al---^^&----21- A A .A .A
1 2 3 4 5 6 7
CL2:NH,47-N WT. RAT/0
adjustment chemiCal in the.breakpoint reaction zone can result in "pockets" of liquid in thebreakpoint reaction zone not at the desired pH level. Occurrence of the breakpoint reactionin such "pockets" could-lead to formation of excessive concentrations of NO3 and NC13.
I I
.10 /1 12
A. second design recommendation is that the operating pH for breakpoint chlorinationshould be maintained at pH 7. This pH allows optimal C12:NH-N ratios and reaction ratesand also reduces the. NC13 production and attendant,odor production to about 0.2 mg/1 orless, as long as careful control over chlorine dosage is maintained.
In summary, the design'engineer should be cautioned that a poorly designed or maintainedsjrstem for breakpoint chlorination pH and chlorine dosage control can result in thegeneration of chlorinous odors due to the formation of nitrogen trichloride. However, itappears that if appropriate care is exercised in the design and maintenance of pH andChlorine dosage systems, the , breakpoint chlorination process can function satisfactorilywithout the need for odor control facilities.
6-11'
02

o.2..5 Alkalinity supplementation.
In the addition of chlorine to a wastewater sample fOr the pUrposes of breakpointchlorination, acidity is generated through the hydrolysis of chlorine gas (Equation 6-1) andoxidation of ammonium (Equation 6-9). Theoretically, four moles of hydrogen ions aregenerated for every mole of ammonia,nitroan which is, oxidized with chlorine gas.
1.5 + 1.5 H20 .5 HOC1-i- 1.5 H÷ + 1.5 Cl (6-1)
NH4 + 1.5 HOC! 0.5 N2 + 1.5 H2O + 2.5 H+ 1.5 Cl (64)
+1.5 C12 NH4 0.5 N2 + 4H+ + 3C1 (6-10)
The buffering capacity (alkalinity) of the breakpoint Process influent is consumed by theacidity of Equation 6,10. Stoichiometrically, 14.3 mg /1 of alkalinity (as CaCO3) isconsumed for each 1.0 mg/I of ammonia nitrogen which is Oxidized in breakpointchlorination. In actual practice, 'around 15 mg/1 alkalinity is consumed due to the hydrolysisof chlorine needed beyond that predicted by stoichiometry:
It is apparent that if the ammonia nitrogen concentration in the breakpoint process influentis high, or ifthe wastewater alkalinity % relatively low, insufficient buffering capacity willbe available to maintain the process.pH at a reasonable level. Any alkaline substance may beused to supplement the natural alkalinity for pH control but, sodium hydroxide (NaOH) andlime (CaO) are the compounds ,most commonly used. If all of the acidity generated inbreakpoint Must be neutralized through chemical addition, 1.50 parts of sodium hydroicide(NaOH) would be needed for each part of 'chlorine, or 1.05 parts of lime (CaO) would iSe"needed for each pail of chlorine. In practice, the alkalinity of the process influent maysupply a portion of the total buffering capacity needed under breakpoint conditions. If ahighly alkaline'stream is to be treated (such as might result from a. lime precipitationprocesS), alkalinity supplementation would not be needed and, perhaps, acid addition wouldbe needed to achieve the recommended operating pH of 7: Iii situations where breakpointchlorination is used for removing low ammonia nitrogen residuals (< 3 mg/1) fromnitrificatori process effluents, there may be sufficient remaining alkalinity to buffer thewater without the need for addition of neutralizing chemicals.
6.2.4 Reaction Rates
The reaction' rate for breakpoint chlorination has not been measured quantitatively, butseveral investigations2.1 I have noted that the reaction is very rapid. According to reaction
&12
303

rates estalltshed by MOrris,6,7 the reactIon i)etween ammonium and hypOchlorous acid"'(Equation 6-4) to form monochloramine is:99 percent complete in 0.2 seconds at pH 7 andC12:3\11-114:N of 0.2:1. The optimum reaction pH was shOwn to be pH. 8.3, allowing 99percent conversion to monochloramine in 0.069 seconds- Obviously, the rate of thisreaction is important in breakpoint since it is the first of several' sequential reactions:
Laboratory studies have shown the breakpoint reaction rate to vary,;depending upon pH..AtpH levels between 6 and 7\,\ the *breakpoint reaction was foun to proceed-to completion in
less than 15 seconds. when Secondary effluents were tested. When reaction rates at pH levels4. \
outside the range\ of pH 6-7 were tested, the rate was found to be slowedconsiderably. At pH '3.5, for example, the breakpoint chlorination reactions were notcomplete following two' hours 'of contact.
The rapid rates noted for breal point reactions conducted in the pH range of 6-7 lead to thedesign recommendation that a breakpoint chlorination contact period of one minute issufficient for plant-seale applications. The design of the contact basin should provide, asclosely as possible, a plug flow cvcact regime. The blending of breakpoint diem als with
the process influent should be carr\ed put as indicated. in Section 6.2.1.3..
6.2.5 Effect on,Total Dissolved Solids.
In many instances where high levels of wastewater Areatment_are required; total dissolved
solids (TDS) limitations may be a controlling criterion in the selection of alternativetreatmeneprocesses. Breakpoint chlorination can involve the addition of large quaritities ofchemicals to solution. The TDS increment attributable to each of several .chemicals which
may be utilized in breakpoint chlorination summarized in Table 6-3.
TABLE 6-3
EFFECTS OF CHEMICAL ADDITION dNIOTALDISSOLVED-SOLIDS IN BREAKPOINT.CHLORINATION
Chemical Addition TDS Increase : NH4 -N
Breakpoint with chlorine gas 6 . 2 : 1
Breakpoint with sodiumhypochlorite 7.1 :'1
Breakpoint with chlorine.gasNeutralization of allacidity with lime (Ca0) 12.2 : 1
93,
Breakpoint with chlorine gasNeutralization of all aciditywith sodium hydroxide (NaOH) :14.8 : 1
6-13
and
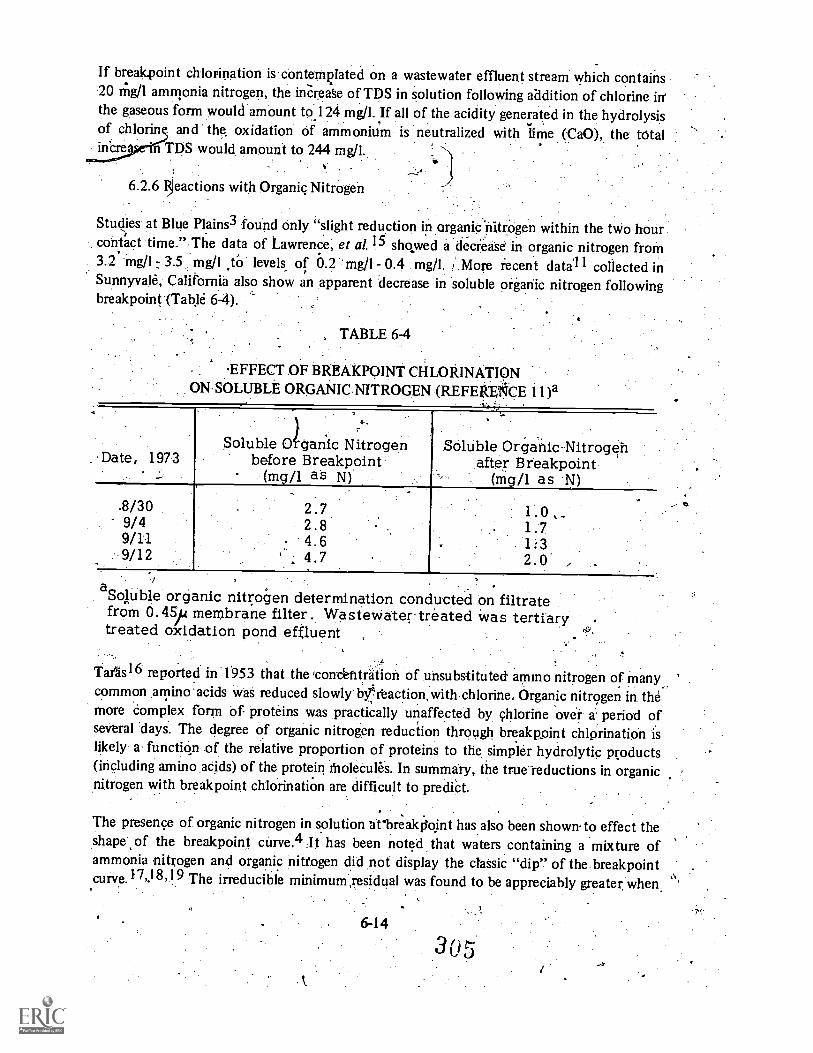
If breakpoint chlorination is contemplated on a wastewater effluent stream which contains0 nig/1 ammonia nitrogen, the idere8e of TDS in solution following addition of chlorine in'the gaseous, form would amount toI 24 mg/I. If all of the acidity generated in the hydrolysisof chlorin . and the oxidation Of ammonium is neutralized with lime (CaO), the totalMCre n TDS would amount to 244 mg/I.
6.2.6 reactions with Organic Nitrogen
Studes at Blue Plains3 found only "slight reduction in organic'nitrogen within the two hourcontact time." The data of Lawrence; et at 15 shoyed a'decrease in organic nitrogen froth3.2 mg/I 3.5 mg/I to levels of 0.2 'mg/1- 0.4 mg/I. 1` More recent deal I collected inSunnyvale, California also show an apparent decrease in soluble organic nitrogen followingbreakpoint:(Table 6-4).
TABLE 6-4
EFFECT.OF BREAKPOINT CHLORINATIONON- SOLUBLE ORGANIC .NITROGEN .(REFEREfICE 1 1 )a
..
Date, 1973. ,
Soluble dganic Nitrogenbefore Breakpoint
(mg/1 as N)
-8/30 2.79/4 2.89/11. 4 . 6
:9/12 4 . 7
Soluble Organic-Nitrogenafter Breakpoint
(mg/1 as .N)
aSoluble organic nitrogen determination conductedfrom 0.45/4 membrane filter.. Wastewater treatedtreated oxidation pond effluent ,
on filtratewas tertiary
Tarts16 reported in 1953 that the iconchtration of unsubstituted amino nitrogen of Many_common amino' acids was reduced slowly by-Yeaction, with chlorine. Organic nitrogen in themore Complex form of proteins was practically unaffected by chlorine over a. period ofseveral days. The degree of organic nitrogen reduction through breakpoint chlprination islikely a function of the relative proportion of proteins to the simpler hydrolytic products(including amino acids) of the protein tnoleCules. In summary, the true reductions in organicnitrogen with breakpoint chlorination are difficult to prediCt.
The presence of organic nitrogen in solution arbreakpoint has also been shown to effect theshape of the breakpoint cUrve.4 :It has been noted that waters containing a mixture ofammonia nitrogen and organic nittogen did not display the classic "dip'.' of the breakpointcurve.17,18,19 The irreducible minimum residual was found to be appreciably greater when
6-14
305
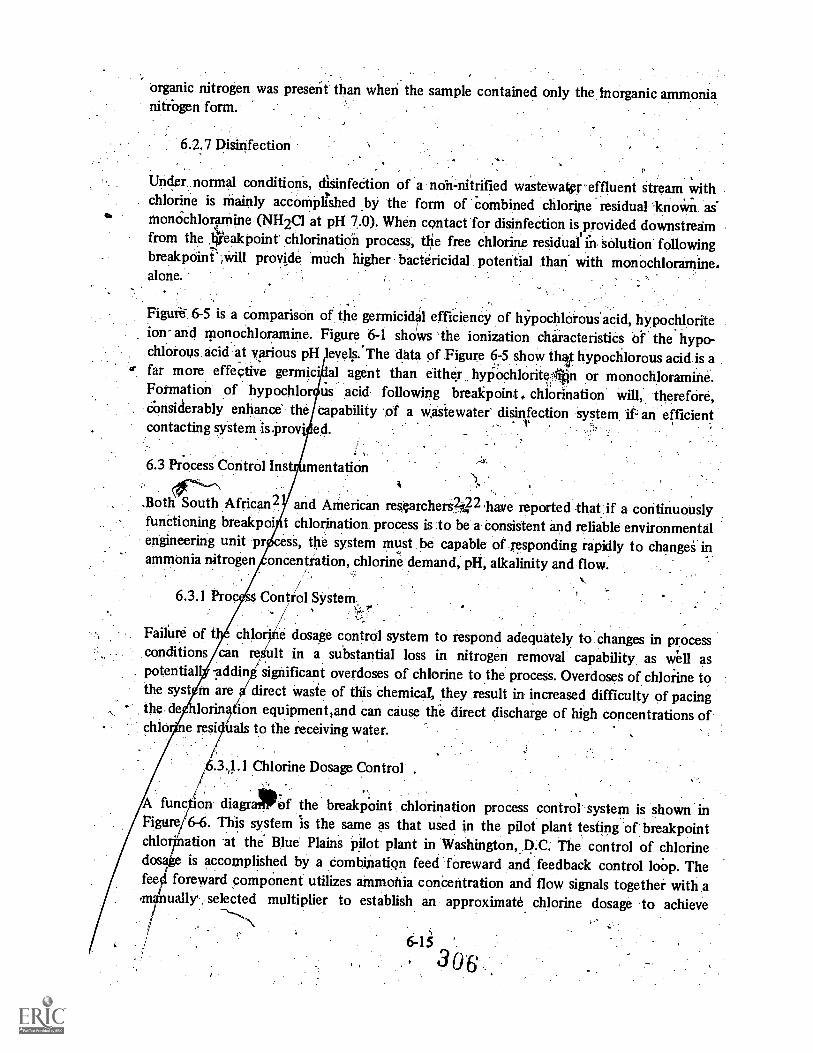
organic nitrogen was present than when the sample contained only the, inorganic ammonianitrogen form.
6.2.7 Disinfection
Under normal conditions, disinfection of a non-nitrified wastewater effluent stream with. chlorine is mainly accornphshed by the form of 'combined chlorine residual as
monOchlOramMe (NH2C1 at pH 7.0). When contactfor disinfection is provided downstream,from the .lieakpoiunt chlorination process, the free chlorine residual m 'solution following
breakpOint'.,Will provide much higher bactericidal potential than with monOchloramine,alone.
FigunS 6-5 is a comparison of the germicidal efficiency of hYpochlorous'acid, hypochloriteion- and monochloramine. Figure 6-1 shows the ionization characteristics o'f the hypo-chlorous acid at various pH evels.The data of Figure 6-5 show thtt hypochlorous acid is a
a far more effective germicidal agent than either hyriochloritedtn or monochloramine.Formation of hypochlors us acid following breakpoint, chlorination will, therefore,considerably enhance the capability a wastewater disinfection system it an efficientcontacting system is.prov ed.
6.3 Process Control Ins mentation
,Both South African2funetioning breakpoiengineering unit prammonia nitrogen
tand American resgarchers2 2 have reported that ifa continuouslychlorination process is to be a consistent and reliable environmental
ss, the system must be capable of responding rapidly to changes inoncentration, chlorine demand, pH, alkalinity and flow.
6.3.1 Pro Control System./Failure of t chlorine dosage control system to respond adequately to.changes in processconditions can result in a substantial loss in nitrogen removal capability as well as
. potential -addin significant overdoses of chlorine to the process. Overdoses of chlorine tothe syst m are direct waste of this chemical, they result in increased difficulty of pacingthe de lorina ion equipment,and can cause the direct discharge of high concentrations ofchin e resi nals to the receiving water.
4.1 Chlorine Dosage Control .
A function diagraiikf the breakpoint chlorination process control system is shown inFigure 6-6. This system is the same as that used in the pilot plant testing of breakpointchlo ation at the Blue Plains pilot plant in Washington,. p.c. The control of chlorinedos is accomplished by a _Combination feed foreward and feedback control loOp. Thefee foreward component utilizes ammonia concentration and flow signals together with a
nually selected multiplier to establish an approximate chlorine dosage to achieve
6-153 0 6
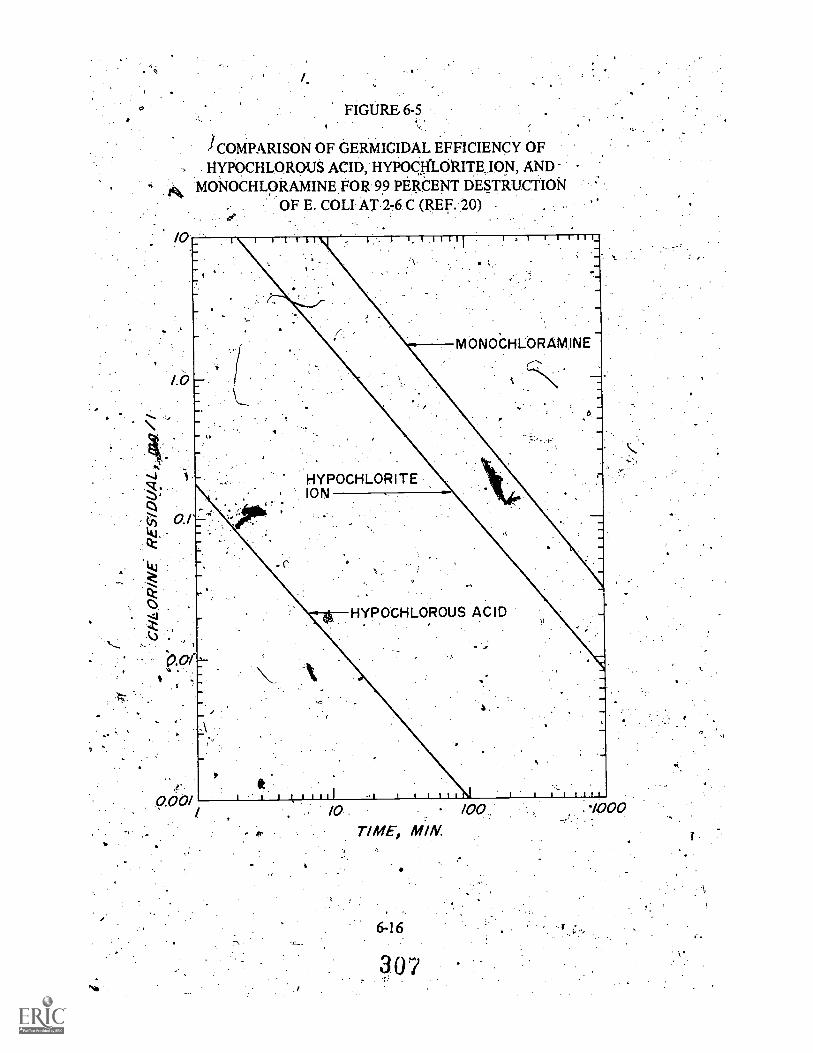
FIGURE 6-5
) COMPARISON OF GERMICIDAL EFFICIENCY OFHYPOCHLOROUS ACID, HYPOCHIORITEJON, AND
04, MONOCHLORAMINE FOR 99 PERCENT DESTRUCTION. . OF E. COLI AT 2-6 C (REF. 20)
HYPOCHLORITEION
HYPOCHLOROUS ACID
10 /00TIME, MI/V.
6-16
307

FEED.
FOREWARD
CONTROL
COMPONENT
BACK
, CONTROL.
COMPONENT
308
FIGURE 6.6
BREAKPOINT CHLORINATION CONTROL FUNCTIONAL SCHEMATIC
AMMONIA 1
CONCENTRATION
(PROCESSINFLU,ENT) (MULTIPLY),k
PROCESS.
FLORAE
1.1 MEASURED
FREE CHLbR1NE
RESIDUAL CONCENTRATION
(PROCESS EFFLUENT)
SIGNAL FOR AMMONIA MASS FLUX
.PRESELECT
MULTIPLIER ""1(CORRESPONDS TO Cli:NH4 N)
I.,
(MULTIPLY)LY) ..
PRESELECTED
FREE CHLORINE --RESIDUAL CONCENTRATION
SIGNAL FOR.COMPLITED
CHLORINE REQUIREMENT
ELECTRONIC
FUNCTION
GENERATOR4ff
(SUBTRACT(
SIGNAL INDICATING DEPARTURE
FROM DESIRED FREE CHLORINE
RESIDUAL IN PROCESS EFFLUENT
,
e
..,..NO
HLORINATION
PACING
SIGNAL
309
breakpoint. The manually preselected multiplier 'corresponds to the' C12:NHI-N ratiorequired for brealcpOint and varies from values of about 8 to 10.
The feedback control 1 p involves measkement.of the free chlorine residual in the processeffluent The level of m ured free chlorine residUal is compared to a setpoint value(usually .24 To) using a tandard process controller and a signal is generated, whichprovides ."trimming" of the chlorine dosage to the system.
6.3.1.2 pH Control
Under most circumstances, a base is added to the bre.akpoinf process to neutralize a portionof the acidity gener.Iin the chlorine addition (Equations '6-1 and 6-9). The baserequirements at a p lar installation are related to wastewater alkalinity, individualtreatment processes employed prior to breakpoint chlorination as well as pH or alkalinityrestrictions, which might be imposed upon the breakpointteffluent.
- ,
pH control in the breakpoint chlorination procesS may be effectively aChieved using a,
combination feed foreword and feedback ''systern. The feed foreward component of thesystem involves pacing the base addition directly on the Chlorine application rate. Thisaccomplishes *neutralization of a preselecfed portion of the chlorine acidity. A feedbackloop is employed to "trim" the system to a designated pH level. Accurate pH control of theprocess promotes efficient utilization of Chlorine and can reduce or eliminate undesirable
4.
end products of the reaction. ii: A
:I.,.
6.3.2 Process...Control Cemponents °,/ 4
Effective control over breakpoint chlorination requires utilization of accurate and reliablesensory equipnient; In this regard .tWOCoinponents deserve special atten4ion; namely theammonia: nitrogen and free chlorine monitoring elements.
The ammonia nitrogen and free chlorine monitoring device which was used during the BluePlains pilot testing of breakpoint-chlorination was an automated wet chemical analyzerusing colorimetric techniques to, measure the ammonia nitrogen and free chlorineconcentrations in small individual samples of the process influent. A continuous -duty freechlorine residual.. analyzer was also successfully used at Blue Plains to provide a feedbacksignal fdr breakpoint chlorination control. -L.
6.4 Dechlorination Techniques
.Dechlorination is a unit process which eliminates the active chlorine residual in solutionprior to effluent discharge or additional treatment steps. Current emphasis on,elimination ofchlorine residual from wastewater . treatment effinents has . resulted in dechlorinationrequirements in many. cases. Frequently,, dechlorination will be required as a companionproceSs to breakpoint chlorination. Dechlorination techniques using sulphur dioxide andactivated carbon may be used.
0 6-183\ O

6.4.1 Sulphur Dioxide Dechlorination
iSulphur dioxide is a colorless, odorless gas which hydrolyz s in aqueous solution to fOrmsulfurous acid, a strong reducing agent'..When added to .,a sa pre containing active chlorineresidual (oxidizing agent), the chlorine residual is converte to'a non-toxic fo , normallyrnchloride. ion.
6.4.1.1 Stoichiometry
Sulphur dioxide reacts with both free and combined forms of chlorine .7e'ST:luals according to' the expressions nOted below:
I.
.a. Reaction with free chlorine residual (i.e.H0C1)
_HOC1+ HSO
3Cl + SO4 + 2H
SO2
+ HOC1 +iH2O Cl + SO4 + 3H
(6-11)
(6-12)
(643)
h. Reaction with combined chlorine residual (i.e. NH2C1)
SO2 + H2O SO3 +.1-14.
Cl + HS03
+NH CF+ 2H2 2
Cl + 0 + H4 + H
= +Cl + SO4 + NH4 + 2H+
- Several important observations can be made from the cheMical reactions presented inEquations 6-11 to ,6-15. First, both combined and free chlOrine residuals are reduced tochloride ion following the reaction. The sulfite ion is correspondingly oxidized tothe sulfateion. Both chloride and sulfate ions are usually present in abundance in wastewater,. so that.the additional indiement added in dechlorination is usually insignificant.
6-19

The predictiohs of sulphur dioxide dosagesrequiied ffor dechlorinatiOn (Equations 6-13 and06-15) suggest an --S02:C12 molar ratio of 1:1. This corresponds to a _weight ratio of 0:9:1. Inpractice, 0.9 to 1.0 parts of SO2 are required for dechlorination of 1.0 part Of chlorineresidual (expressed as eti).,
The acidity generated in dechlorination, while appearing to be Significant on a molar Vasis, is:seldom an important factor in praCtice. Roughly 2 mg/1 of alkalinity are consuted for each1.0 mg/1 of sulphur dioxide applied. The chlorine residual remaining in solution followingbreakpoint chlorination and disinfection contactis usually low enough (approximate rangeof 1 mg/1 to 8 mg/1) so. that the alkalinity consumption pH- change resulting from...-,sulphur dioxide addition, may usually be negleCted.:
6.4.1.2 Reaction Rates
The rate of reaction between SO2 in solution and chlorine residual is pricticallytantaneous. The high specificity of SO2 in solution for the chlorine and the rapid
reac 'on rate tend tereduce to very low levels competing side reactions which could resultinwa.tage of the sulphur dioxide.
6.4.1.3 Significance of Sulphfir Dioxide Overdose
Sulphur dioxide dechlorination is most often accomplished to eliminate the chlorine inducedtoxicity in a wastewater effluent prior to discharge. Studies on primary and secondaryeffluents23,24 have shown that effluent toxicity following chlorination-dethlorination; as'measured by fish bioassay, is reduced to a level slightly beloW that measured on comparablennchlorinated effluent. These studies indicate that sulphur dioxide dechlorination caneliminate acute toxicity related to chlorine residual. Tests in an aerated continuous -flow fishbioassay apparatus at sulphur dioxide overdoses of abottt 70 mg/l (as SO2) beyond thatnecessary for dechlorination showed no adverse effects on the test fish.
.Large overdoses of sulphur-dioxide should be avoided in pipit scale dechlorination systemsbecause of chemical Wastage/and. the oxygen demand exerted by the excess sulphur dioxidein solution. Excess sulphur dioxide reacts slowly with dissolved oxygen' in all ionaccording to the following equation:
HSO + 0.5 02 SO4 + H+
The net result of this reaction can be a reduction in wastewater effluent dissolved oxygenand an increase In the measured effluent COD and liOD levels. Proper control. of 'thedechlorination system is essential to minimize these adverse effects.
6.4.1.4 Process Application and Control
Chemical dechlprination using sulphur diokide_can be a rather inexpensive process for

reducing effluent toxicity relateZ to .chlorine residual!. Much of the process equipment,'chemicarhandling and chemical addition components of a .4ulphur:d1oXide dechlorinationsystem are identical to those used in a chlorMation system. For eianiple, gageous'chlorinators are used to feed sulphur dioiide; (evaporaters may be used practfCailyinterchangeably between chlorine and sult.hur ,dioxide, and 'piping, valve's and gase ipus.injectors are identical in the two Systems. The speed of the reaction preclUdes the nyessityfor providing a sepailte contact basin as in chlgrine contact for disinfection. The doge
_sulphur dioxide required is only that' amount needed' te dechlorinate the effluent followingthe chlorine contact period, a level substantiallyiess-thanthe total chlorine doSe::'
'There are no analytical Instruments currently on the market Whiqc have demonstrated .acapability to reliably and accurately measure the excess sulphur *Ade in Solution followingdechlorination. This, is why the process control schemes which have been deVised dO not
.have the feedback lelf-correbtive" aspects which proliide.a;:tigh degree of consistency toeffluent quality. Control is usually. achieved by paCing the echlorination equipment onsignals of flow and chlorine residual measured .directly upstramsfrorn the.point Of sulphur
,dioxide application. Operator surveillance and frequent man.lial adjustments to the systemare needed to4naintain a slight overdose of sulphur dioxide, say 0.5. nag/1:
more complicated control scheme which does incorporate Positive control featuresinvolves application of a preselected chlorine dosage to a small side stream of dechlorinatedeffluent. If, for example, a preselected chlorine dose of 1 mg/1 is applied and &chlorinationis paced to maintain, a chlorine residual of 0.8 mg/1 in the "biirsed" 'side stream, the neteffect of the control system would be to provide a -controlled overdose of 0.2 rn-' g/1(expressed as C12) of sulphur dioxide. .
_
With either control scheme, the Sulphur dioxide overdose in the final effluent may becontrolled to 0.5 mg/1 (as C12). or less. Given that the reaction rate of Equation 6-16 is veryslow, the effect of the overdose on plant effluent dissolved oxygen concentration would beminimal, .probably less than 0.7 mg,/1 DO depletion. In such a case, 'aeration followingsulphur dioxide dechlorination would seldom be warranted.
.
6.4.2 Activated Carbon Dethlorination
&Chlorinatio of wastewater effluent streams using activated carbon can serve severalfunctions' other than removal of chlorine residuals. In the case of breakpoint chlorination, 'the activated carbon can effectively catalyz6 the chemical rNitiOr; Serving.as a "reactionbed." Some removal, of soluble organics is also accomplished through adsOrpthen.
6.4.2.1 Stoichiometry
Activated carbon (01,)n reacts with both free arid.; combined chlorine residuals, in they9 following manner:

Reaction with free chlorine residual
Reactions with
C* +
+ 2H0C1 CO2 + H + 2C1
mbined chlorine residual
H2Cl + 2H20 CO
2+ 2*i+
4 + 2C1
.
(617)
Carbon dioxide is formed in each case following reaction with chlorine residual. Ammonia isreturned to solution following reaction of carbon with monochloramine, but diChlo4.amine
has observed to decompose to nitrogen gas following contact with activated carbon.
These chemical pathways have been confirmed by several recent studies:25,26
406.4.2.2 Process Application
Studies by StaSiuk et aL 25 showed complete dechlorination of: both free and combinedchlorine residuals' following carbon contact ,times of JO minutes.' Studies.s on thedechlorination Characteristics of granular' activated carbon haVe been conducted27,28,29which show a variation in' the' &chlorination capacity of activated carbon as a function ofthe hydraulic al:40i 'on rate and particle size. Those data suggest the formation of adechlirination inte ary compound, riaiieni oxygen, on the surface of the carbonwhich builds up- anit uses a gradual loss .,ordeChlorination'qfficiency. Regeneration of thecarbon was accom ed by heating, in the absence of air at 400 C or higher. Smalleractivated carbon particles were found to,give enhanct;c1 dechlOrination capacity. One cubicfoot of activated carbon was found to dechlorinate 0.55 million gallons at 2 gptn/sq fthydraulic_ application .rate and S mg/1 free chlorine residual. Approximately 3.6 milliongallonS of the same water could be dectilorinated by the activated carbon when applied at aFate of 1:gpm/s4 ft.'
6.5 Design Example
)
As an example; onside,r,,,,a 10 mgd coiventional activated sludge plant that must beupgraded to meet an effluent nitrogen limitation of 2 mg/l. Present effluent quality is 1 mg/1organic nitrogen, 20 mg/1 ammonia nitrogen,:1.5mg/1 of suspended solids, BOD5 of 25 4/1and pH of 7.0. The peak to average nitrogen load ratio is 1.9 The breakpoint chlorination 2'
design should provide capacity for removal of all ammonia nitrogen in the plant effluent.
6-22

1. Calculate the average ammonia nitrogen oxidized dail;A
NT = 8.33 Q(N0`.- N1) (4-24)
r?where: NT = ammonia nitrogen oxidized, lb per day
Q. = average daily flow, mgd
No = influent ammonia nitrogen, mg/1
.. N effluent ammonia nitrogen, mg/1,. .
.
For this example, the, result is
-NT = 8.33(10)(20-0 = 1,666 lb /day
2. To calculate the average daily chlorine consumption, a C12; -N of approxi-mately 9:1 would be appropriate. The average daily chlorine consumption wouldbe:
Aveiage daily C12 = (9)(1,666) = 14,994 lb/day
. The peak rate of chlorine utilization, that rate used to size the chlorine feedsystem, may be computed by multiplying the peak to average nitrogen load ratioby the average daily chlorine consumption as follows:
Peak Cl2
= (1.9)(14,994) = 28,489 lb/day
To calculate the, average daily quantity of alkalinity supplementation, assume thatsodium hydroxide is to be usssl. Since the effluent pH is at pH 7 prior tobreakpoint chlorination,and the breakpoint process itself should be conducted atpH 7, all acidity generated in breakpoint chlorination must be neutralized by thesodium hydroxide added. Since 1.50 lb. of NaOH are required ,per lb of .C12added inthreakpoint, the average daily NaOH added per day would be
Average daily NaOH ,= (1.50)04,994) = 22,491 lb/day
5. The TDS increment added to the plant effluent as a result of breakpoint'chlorination can be computed from data of 'pilole 6-3. For breakpoint.chlorination with chlorine gas and neutralization all acidify with sodium'
r
6-23
315 -]
hydroxide, the TDS increase per mg/1 of ammonia nitrogen consumed is 14.8.mg/l. The total TDS increase in this example would be:
TDS increase = (14.8)(20) = 296 mg /1.
6. To compute the average daily consumption of sulphur dioxide needed tocompletely dechlorinate the plant effluent prior to discharge, assume 'that the
'average Chlorine residual following breakpoint chlorination and disinfeCtion is 5mg/l. The average daily sulphur dioxide consumption would be:
Average daily SO2 = (8.33)(10)(5)(1.0) = 416 lb/day.
6.6 Considerations for Process Selection
The breakpoint ,chlorination process offers a number of 'advantages which should beconsidered when evaluating alternative nitrogen removal processes:
Ammonia nitrogen ,removal may be accomplished in a one-step process toconcentrations less than 0.1 mg/l(as N). The major end product of the breakpointreaction is nitrogen gas which is evolved to the atmosphere.
2. 'Breakpoint chlorination is free from the toxic upsets and acclimation periodswhich can affect biological nitrification and denitrification processes. Ammonianitrogen may *be successfully removed from solution regardless of upstream'`treatment processes. Breakpoint chlorination is also rather insensitive to changesin procesS temperature.
3 The breakpoint process may be operated intermittently or in split-streamarrangements as needed to meet .individual receiving water nitrogen limitations.The process can be used as a polishing step for other ammonia removal processessuch as nitrification to provide low ammonia nitrogen concentrations.
4. Breakpoint chlorination is reliable and consistent in terms of process perfor-man ce.
5. Disinfection of a wastewater effluent is enhanced following breakpoint chlorina-tion due 164fiet01-"esenceof free-available chlorine residuals (HOC1'and 0C1
6. The loW spacial requirement of the breakpoint proCeSs makes it particularly ..suitable for certain applications, including addition to an existing facility, where
.
nitrogen removal is required 'but where space constraints exist.
6-24
316
7. The cost of physical facilities for breakpoint chlorination is much less than for
biological nitrificatioh-denitrification facilities.'
A list of potential disadvantages of the breakpoint chlorination process includeS:
The breakpoint chlorination processis usually quite high *in operating 'costs.
2.. The addition of chorine, pH adjustment chemicals and sulphur dioxide allcontribute to the level of total dissolved solids in the wastewater effluent, Some
treatment plants haye TDS limitations which would limit the applipbility ofbreakpoint chlorination. )
Dechlorination will be required in many cases to remove the potentially toxicchlorine residual. It should be noted, however, that this is a disadvantage of any
chlorination process.
6.7 References
1. Pressley, T.A., Bishop, D.F., and S.G. Roan, Nitrogen Removal By Breakpoint
. Chlorination. Report prepared for the Environmental Protection. Agency, September,
1970.
2. Pressley, T.A., Bishop D.F., Pinto, A.P., and A.F. Cassel, Ammonia-Nitrogen Removalby Breakpoint Chlorination. Report prepared for the Environmental Protection .Agency, Contract Number 14--12-818,'February, 1973.
. Pressley, T.A., et al., Ammonia Removal by Breakpoint Chbrination. EnvironmentalScience and TeChnology, 6, No. 7, 662, July;.1972.
4. White, G.C., Handbook of Chlorination. New York, Van Nostrand Reinhold Company,1972.
5. Morris, J.C., and I. Weil,. Chlorine-Ammonia Breakpoint Reactions: Model Mechanism
and Computer Simulation. Paper, annual meeting Aim Chem. Soc., Minneapolis, Minn.,
April 15, 1969.
6.: Morris, J.C, Weil, I., and R.H. Culver, Kinetic Studies on the Break-Point with.Ammonia and Glycine. Unpublished copy from senior author, Harvard Univ: (1952).
7. Morris, J.C., Kinetic Reactions between Aqueous Chlorine and Nitrogen Compounds.
Fourth Rudolphs Res. Conf., Rutgers Univ. (June 15-18, 1.965).
8. Griffin, A.E., and N:S. Chamberlin, Some Chernical Aspects of Breakpoint Chlori-nation. Ltilt.1EWWA, 55, pp 371, 1941.
6-25
3
9. Weber, W.J., Jr., Physiochemical F'rocesses for Water Quality Control. New York,Wiley-Interscience, 1972.
10. Stone, R.W., Parker, D.S., and J.A. Cotteral, Upgrading Lagoon Effluent to Meet BestPracticable Treatment. Presented at the 47th Annual Conference of the Water°Pollution Control Federation, Denver,Colorado, October, 1974.
11 Brown and Caldwell; Report on Tertiary Treatment Pilot Plant Studies. Prepared fOrthe City of Sunnyvale, California, Febniary, 1975: -
\
12. Steains and Wheeler, Wastewater Facilities Report. Cortland, New York, May, 1973.
13. Stenquist; RJ., and W.J. Kaufman, Initial Mixing in Coagulation Processes. Preparedfor EPA, Project EPA-R2-72-053, November', 1972.
14. Schuk, W., personal communication with D.S. Parker. EPA-DC Blue Plains Pilot Plant,September 9, 1974.
15. Lawrence, 'AM., et al., Ammonia Nitrogen Removal from Wastewater Effluents byChlorination. Presented at the 4th Mid-Atlantic Industrial Waste Conference,University of Delaware, November, 1970..
16, Taras, M:J., Effect of Free Residual Chlorine on Nitrogen Compounds in Watb..JAWWA,.45, 47,(1 953).
17. Griffin, A..; and N.S. Chamberlin, Some. Chemical Aspects f Break-PointChlorination. J. NEWWA, 55, pp 371(1'941).
Griffin, A.E., Chloririe for Ammonia.Removal .Fifth Annual Water Conf. Proc. Engrs.Soc. Western Penn., pp 27 (1944).
-19. William, D.B., private communication with G.C. White, BrantfOrd, Ontario Canada(1967).
20. Clarke. N.A., 'et aL, Human Enteric Viruses in Water: Source, Survival andRemovability. International Conf. Water Poll. Research, Pergamon Press, London(September, 1962).
21. van Vuuren,- L.R.J., et al, Stander Water ,Reclamation Plant: Chlorination UnitProcess. Project Report 21, Pretoria, So.-Africa, November, 1972. .1
-.22. Pollution: Engineering and Scientific Solutions. E.S. Barrekette Ed., New York,.Plenum Publishing Corp., pp 522-547.
6-26
31
23. 'Esvelt,, L.A., Kaufman, W.J:;--and R.E. Selleck, Toxicity Removal from MunicipalWastewater. University of California, Sanitary Engineering Research- LaboratoryReport 714, 1971.
24. Stone, R.W., Kaufnian, WJ:,7 and A.J. Horne, Long-Term Effects of Toxicants andBiostimulants on, the Waters of Central San Francisco Bay. Univeisity of California,Sanitary Engineering"Reseirch Laboratory Report 73 -1, .May, 1973.
25. Stasuik, W.N., Het ling, L..1,, and W.W. Shuster, Removal of Ammonia Nitrogen by.Breakpoint Chlorination lisitg an Activated Carbon Catalyst. New York StateDepartment of Environmental Conservation Technical Paper No. 26,'April, 1973. .
27. Hagar, D.G., and M.E. Flentje, Removal of Organic Contaminants. by Granular CarbonFiltration_. JAWWA; 57,-1440 (November, 1965).
28. Kovach, J.L., Activated Carbon Dechlorination. Industrial Water Engineering, pp30-32, October/November, 1973.
39. Cdlgori Corporation, Bulletin 20-44.'
6:27
-329
CHAPTER 7
SELECTIVE ION EXCHANGE FOR AMMONIUM REMOVAL
7.1 Chemistry,and Engineering Principles.
The basic concepts of the ion exchange process apply to its use for ammonium removal and.these concepts'are discussed in the following paragraphs.
j7.1.1 Basic Concept
' The use of conventional ion exchange resin for removal of nitrogenous material from`wastewaters hasAot proven attractive because of the preference of these exchangers (or ionsother than ammonium or nitrate ions., In 'addition, the regeneration of .conventional ionexchange resins results in regenerant wastes which are difficult to handle. The non-selectivenature of conventional resins is unfortunate because as a unit proCess, ion exchange is easilycontrolled td achieve almost .any desired product quality. The efficiency of the process isnot significantly impaired at temperatures usually encountered and ion exchange equipmentcan be automatically controlled, requiring only occasional monitoring, inspection, andmaintenance.
The above limitations of conventional resins may be largely overcome by using an exchanger. which is selective. for ammonium. The exchanger currently favored for this -use is-
clinoptilolite, a zeolite, Which+ occurs naturally in several extensive deosits in the western.United States. It is selective for ammonium relative to calcium, magnesium and sodium: Theremoval of the ammonium from the spent regenerant perinits regenerant reuse. Theammonium may be removed froM the regenerant and released to the atrripsphere asammonia (in certain situations) or nitrogen gas or jt may be recovered as an ammoniumsolution fOr use as a fertilizer: Figure 7-1 is a simplified schematic of the process.
The wastewater is passed downwhif) through a bed ofclinoptilolite (typically 4-5 ft or 1.2to 1.5 m of 20 x 50 mesh particles) during the normal service cycle. When the effluentammonium concentration increases. to an objectionable level, the clinoptilolite is regen-
ierated by passing a conaentrated salt solution throddi the exchange bed. By removing theammonia from the spent regenerant, the regenerant May be reused, eliminating the difficultproblem of 'brine disposal associated. with conventional exchange resins. Some of; theregenerant recovery techniques, as diScussed later in detail,Temove the ammonia as nitrogengas which is discharged to the atMosphe4 while others remove and recover the ammonia insolution formibr potential Ilse asa fertilizer.
7-1

INFLUENT
FIGURE 7-1
SELECTIVE ION EXCHANGE PROCESS .
4-/
SPENT REGENERANT
EFFLUENT4
I
I
4
REGENERANT,RECOVERY
AMMONIA ORNITROGEN GAS\N,-,1 OR RECOVEREDAMMONIASOLUTION
FRESH REGENERANT
7.1.2 IOn Exchange Principles
lon exchange is a process in which ions held by electrostatic forces to charged functional..groupS on the surface of a solid are exchanged for ions of similar charge in a solution inwhich the solid is immersed. It is a stoichiometric, reversible exchange of ions between aliquid and solid which produces no significant changes in the structure of the solid. Themass. action equilibria expression prbvides a' useful model for ion exchange behavior. In abinary system, the reaction,
+a.-oA + aBZb bAZa +ait+P (7-1)
lectxpressds the reversible equilibrium here a and b are the valences of ions A and B,respectively, and Z is the exc ange site in the solid.1 This reaction may be expressed as theequilibrium constant,
V-frfa,,bjA4.f.. 113
K = (7-2)(a)A
b
321
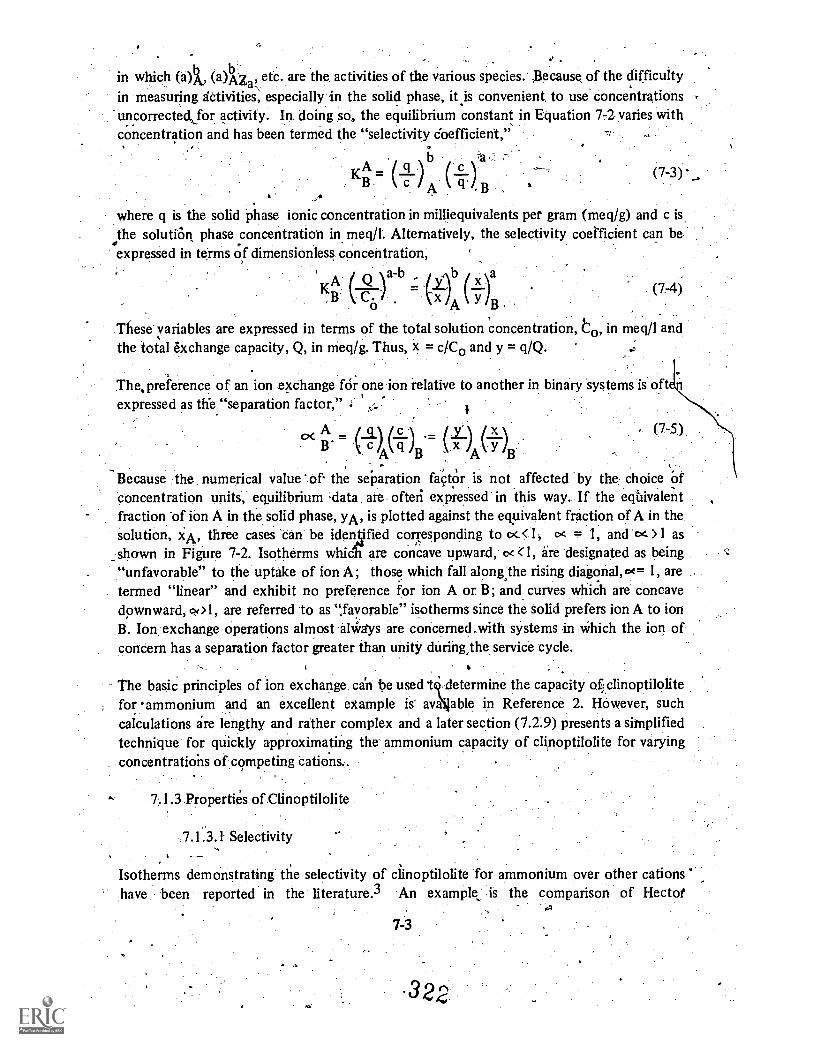
in which (a), (a)Az etc. are the activities of the various species. ;Because of the difficultyin measuring activities, especially in the solid phase, it is convenient, to use concentrationsuncorrectedjor activity. In doing so, the equilibrium constant in Equation 7 -2 varies withconcentration and has been termed the "selectivity Coefficient,"
1;qKB= (\ 7)4 (
where q is the solid phase ionic concentration in milliequivalents per gram (meq/g) and c isthe solutiOn phase concentration in meq/1. Alternatively, the selectivity coefficient can beexpressed in terms of dimensionless concentration,
KA )b a
(B C. y
A B
These' variables are expressed in terms of the total solution concentration, t0, in meq /l andthe total exchange capacity, Q, in meq/g. Thus, X = c/C0 and y = q/Q.
. (74)
The, preference of an ion exchange fOr one ion relative to another in binary systems is oftexpressed as the "separation factor,"
«B'c x
B c)(q) (x (/ )A B A B
. (7-5)
Because the numerical value of the separation factor is not affected by the choice Ofconcentration units, equilibrium data are ofteii expressed in this way. If the eqUivalentfraction of ion A in the solid phase, yA, is plotted against the equivalent fraction of A in thesolution, xA, three cases 'can be idenlified corresponding to oc.< 1 o. = 1, and De- > 1 asshown in Figure 7-2. Isotherms whic are concave upward, 04 <1, are designated as being"unfavorable" to the uptake of ion A; those which fall along.the rising diagonal, ot=1, aretermed "linear" and exhibit no preference for ion A or. B; and curves which are concavedownward, ool, are referred to as ",favorable" isotherms since the solid prefers ion A to ionB. Ion exchange operations almost aliidys are concerned.with systems in which the ion ofconcern has a separation factor greater than unity during,the service cycle.
The basic principles of ion exchange can be used 't .determine the capacity oLclinoptilolitefor 'ammonium and an excellent example is avNable in Reference 2. HOwever, suchcalculations are lengthy and rather complex and a later section (7.2.9) presents a simplifiedtechnique for quickly approximating the ammonium capacity of cl ;noptilolite for varyingconcentrations of competing cations..
7.1.3 Properties of Clinoptilolite
7.13.1 Selectivity
Isotherms demonstrating the selectivity of clinoptilolite for ammonium over other cations'have been reported in the literature.3 An example, is the comparison of Hectot
47 -3
322

1.o
W 0.9Q.x 0.80Q "-
0;7_ 0Z' 0.6
-0 0.51-(3
0.4CC
0 0.31-
.20LAJ
Q0.1
0LAJ ' 0.0
0,0 0.1 02 0.3 6.4 0.6 0.6 0.7 0,8 0.9 1.0
EQUIVALENT. ION, FRACT ION IN SOLUTION PHASE, x4.
Clinoptilolite and a strong acid. polystyrene resin, IR 120, shown in Figure 7-3. The totalequilibrium solution normality was constant at 0.1N. The terms (Ca)z, (NH,T)z =,equivalentfraction of calciuM or ammonium on the zeolite. The terms (Ca)N, = normality ofcalciuni Or ammonium in the equilibrium solution. The ammonium capacity oIR 120.was4.29 meq/g of air-dried resin: A comparison of the generalized isotherm presented in. Figure7-2 with Figure 7-3 clearly shows that IR 120 prefers calCium to ammonium ions.Clinoptilolite, on the other hand, prefers ammonium tOcalciumion and is of greater utilityfor ammonium ion removal from wastewaters containing calcium.
FIGURE \
GENERALIZED ION EXCHANGE ISOTHERMS
.77
The ion exchange equilibria for the systems NH4-Na+, N11414-K+, N114-Ca+2 and NH-Mg+2.,with clinoptilolite and other zeolites, are also available in the literature.2 Plots ofthelII141-selefivity coefficients vs. the solution concentration ratios of the cations are shown inFigures 7-4 and 7-5. Using these data :in conjunction with published calculationtechniques, 2 it is possible to accurately predict the ammonium capacity of clinoptilolite inthe presence of various concentrations of other cations.
- 7-4
323
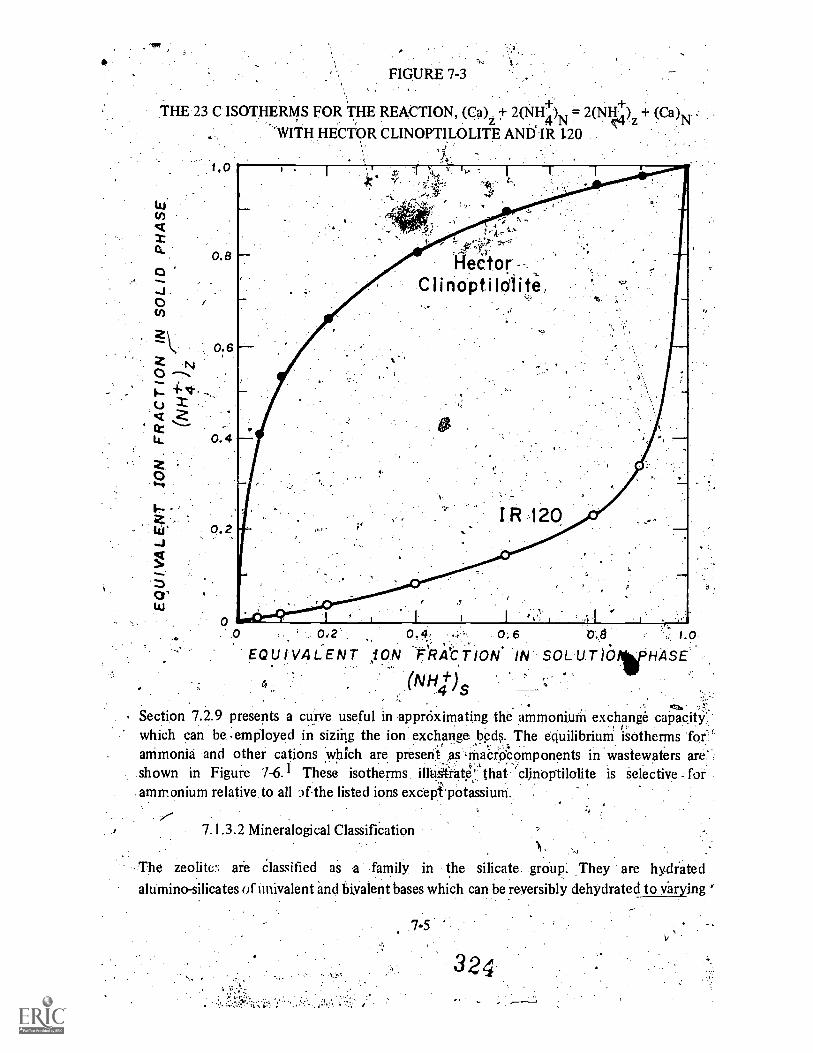
FIGURE 7-3
THE 23 C ISOTHERMS FOR THE REACTION, (Ca)z ;F. 2(NH4+)N = 2(NHIce-dz + (Ca)N.
"'WITH HECTOR CLINOPTILOLITE AND IR 120
ick
'N
zW'
z0'
EQUIVALENT .10.N. FRACTION IN SOLU.Ti011irHASE
(NH+). S
Section 7.2.9 presents a curie useful in approximating the ammonium exchange capacity'.which can be -emPloyed in sizing the ion exchange beds. The eciuilibrium isotherms for'ammonia and other cations which are preseni as 41a4Ocomponents in 'wastewaters are'
.shown in Figure 7-6.1 These isotherms iltugfrate'. that 'clinoptilolite is selective forammonium relative to all Dfthe listed ions exceptpotassium.
7.1.3.2 Mineralogical Classification
The zeolite% are classified as a family in the silicate. group. They are hydratedalumino-silicates of univalent and bivalent bases which can be reversibly dehydrated to varying
7-5

rA
FIGURE 7-4
SELECTIVITY COEFFICIENTS VS. CONCENTRATION RATIOS OF SODIUMOR POTASSIUM AND.AMMONIUM IN THE EQUILIBRIUM SOLUTIONWITH
HECTOR CLINOPTILO,LITE AT 23 C FOR THE. REACTION
(y)z +(NH4+)N = (NH4+)z (Y)N,r
CONCENTRATON AT,10,
degrees without tirittrgoin''a qhange in crystal - structure and are capable of undergoingcation exchange. The general ",composition of . zeolites is glyen by the formula 1'
,(M',N2)0-!A1203nSibrnH20 where g and N are, reSpecilyely, tlker alkali metal..:aiidalkaline eaithcoUnter ions, present in the zeolite cavities:
Clinopti101ite ;common material found in bentonite depasitg in the western UnitedStatei The lafgest known deposit of clinoptilolite in the United Slates is found in southern;California within a deposit of bentonite called Hectorite becati'se ofits proxiMity. to Hectoi;.',
The: U.S:: deposits are predomina,ntly in the .sodium form. Although a widely;'.,.occurring material, not all dekkits produce wclinoptflolite of adequate structural strengthto withstand the handling which occurs in a.columnai operation.

:
e-FIGURE 7-5
SELECTIVITY COEFFICIENTS VS. CONCENIMATION RATIOS OF CALCIUMOR MAGNESIUM AND' AMMONIUM IN THE. EQUILIBRIUM SOLUTION WITH .0
HECTOR CLINOPTILOLJTE AT 23 C FOR THE REACTION..(X) + 2(Isie) =.2(NH+) + (X)'
Z 4 z N
10
IQ
kts;
104AL
O(.1 103>-
102
JL
104.1
(f)
Ca
114.,,J I .140.1 1 din,' I 11,.1 1161 I !Hint,
10':' 102 103. 101 105 108. 01' 108
(X) N,,CONCENTRAt 1.2N RATIO,
I
7.1.3.3 Toi'al Exchinge Capacity
,41;Although the total .ian exchange capacity of a material is by no means a 'complete,'.'description of its ion exchange properties, it is an indication of the applicability. of the
substance;for process use For example, New Jersey greensan4, which was widely usewater softening baOrte the development of organic exchangerS4, has a total exchange cape
of 0.17 meq/g.1 In compa son, the eftionge capacities of strong acid'cation ex an ct
usually 4 to 5 meq/g. T tOtalexVhinge capacity of clin'optilolite as measur .sever
different investigators ranges from 1.6 to 2.0 meq/g and is slightly lower than ge
for zeolites. With typical cation concentrations encountered in municipal w si' the -
capacity for NHfs typically 0.4 meq/g (see Section 7.2.9).
7.1.3.4 Chemical Stability%1`.:47^11-.1:
16,
.'
The instability of 'iatural clays and zeolites toward .acids and alkalis 'is known as thesmaterials are widely used in water softening. Hovider, clinoptilolite is considerably more
I
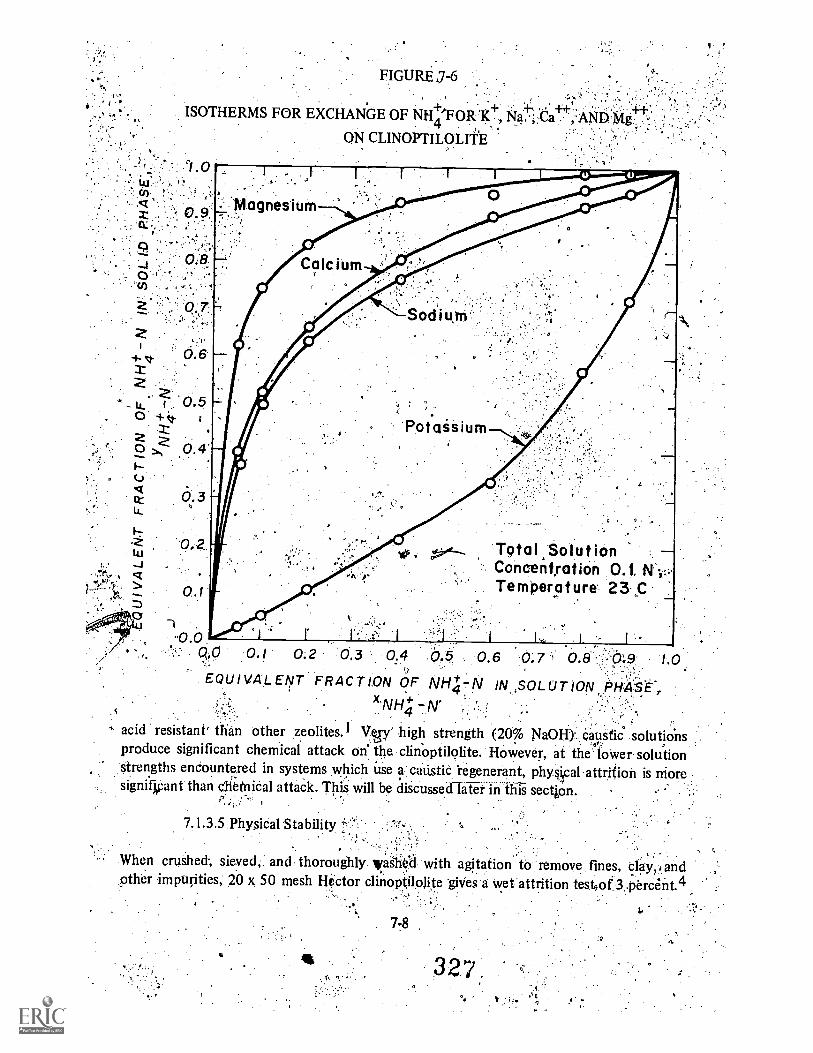
ISOTHERMS FOR EXCHANGE OF NH4 1FORK+
ON CLINOPTILOLITE
Potaisium
6.3
0,2wJ.Tf's q
7 7k1r 0.
--1 ..0.0 ... i . I-:'
.:.: co 0.1 0.2 0.3 0,4 b.. 0.6 (.% 7 i 0.8 i:!-09 1.03
EQUIVALENT FRACTION OF NH4 N IN.,SOLUT ION PHASE-NH -N. '.
.,- x .44.,
acid resistant' than other zeolites. I Vey' high strength (20% NaOH)-. caustic solutionsproduce significant chemical attack on the clinoptilolite. However, at the' loWer solutionstrengths encountered in systems which use a caustic Yegenerant, physilcal attrition is moresignify ant than clietnical attack. This will be diScussed later in iliii section. ' ,. ,
Tatal,SolutionConcentration 0.1. NTemperature' 23 C
7.1.3.5 Physical Stability
When crushed, sieved, and thoroughly. Wad with agitation to remove fines, clay,,,andother impUrities, 20 x 50 mesh Hictor clinoptilolite 'gisies a wet attrition tested 3.4;ercent.4
,
the wt attrition test determines the amount of fines (less than 100 mesh) generated by._grams of the granular zeolite during rapid mix,ing with 75 milliliters of water on a paintshaker for 5 minutes. Commercial zeolites, such as erionite and chabazite, which are
' powdered, mixed with clay binder, extru0ed, and fined, will generally give a wet attrition'test of about 6 percent or twice that of the Hector clinoptilolite. Low wet attrition is
.important to minimize losses of clinoptilolite in an ion exchange column operation.,
. .
,. 7.1.3.6 Density
ClinoP:tifolite (20.x 50 mesh) has been reported to have a wet particle specific gravity of1..5.9 and a bulk density of 0.7.4-0.)79 g/cci.
7.2 Major Service Cycle Variables
The faci3OrS which have a major effect on process efficiency include: pH, hydraulic loadingrate, clipoptilcilite size, pretreatment, wastewater composition, and bed depth.
72;4 pH=
,Withinan influent'pH range of 4 to 8, optirmim ammonium exchange occurs.' '.the pH'drops below this range, hydrogen ions begin tcreompete with ammonium for the availableexchange capacity. As the pH values increase above 8, a shift in the Nt-13-N1 equilibrium
itawards NH3 beginS. Operaliqn outside of the pH range of 4 to 8 results in .a rapid decreasef exchange capacity and incased ammonium leakage.
7.2.2Hydraulic Loading Rate
'VAriations in cciluinn loading; rates within tht range of' 7.5-20 Bed Volumes (BV)/hour (7.5BV/hr is eqn4lent to 0.95:gpm/cP ft or 2.15 1/m3/sec) have been shown to produce no
,sfgnificagt'.effeets. on the a o pm removal efficiency of 20 x 50 mesh clinoptilolite.3. ArnrnOnium concentrations in the n til ite effluent of 0.22-0.26 mg/1 were produced
Throughout the above range'in one set..,:of t ts.1 When rates' exceed 20 13V/hour, theex ch a nge kinetics suffer as demonstrated by a significant leakage olinnmoniurn early in 'theloading' cycle. The effe:ets of loading rate as a funalon ofclinoptilolite size are discussed inthe next section.
7.2.3 Clinoptilolite Size
Mine-run clinoptilolite .is.typically 112,.:incli (25 -to 51 mm) chunks which must be groundand screened to the size desired for column operation. As would be expected, the smallerthe clin*tilolite size:: the better the kinetics of the exchange reaction This effect isillustrated. by data that Show that 20 x 501nesh clinoptilolite kinetics begin to suffer (seeSection* 7.2.2) at rates. of 70-30 BV/hour WhileS0 x 80 mesh kinetics do not suffer untilrates of 40 BV/hour are reached. However, the improved rate of exchange is accompanied
7-9
,
,32
by the disadvantage of higher head loss. It appears that 20 x 50 dineiti clinoptilolite (aboutthe size of typical filter sand) offers an adequate compromise between acceptable headloss
.
and exchange kinetics. At a loading of 15 BV/hour in a3 ft (0.9m),deep bed (5.6 gpm/sq ftor J.8 1/m2/Sec), the headloss is 2.1 ft (0.64m) with 20 x 50 .mesh clinoptilolite. Lowerheadlosses could be obtained by lower rates. Use of deeper beds would ;esUltrin greater .......headlosy.e., 6 11 (1.8 m) depth would have a headloss of 4.2 ft (1.28 m) at 5.;,6 gpifilsq ft ,
.(3.8 1 /m2/sec). These headloss values do not include losses in inlet and outlet piping or inthe underdrain system.
7.2.4 Pretreatment
to avoid excessive headloss, the clinoptilolite influent must be relatively free of suspendedsolids pref6rably less than 35 mg,/1. Tests, with clarified and filtered raw wastewaterindicate no problems with organic fouling. Biological growths which occurre,:dewereadequately removed in the regeneration cycle.2 Additional data on pretreatment effects arepresented in the next section:
7.2.5 Wastewater CompiSiitiong
As noted earlier, although clinoptilolite prefers anfunonium ions to other cations, it is notabsolutely selective and other cations do compete for the available exchange capacity. Pilottests conducted at several locations illustrate the effects of wastewater comPositian.On theuseful .capacity of the clinoptilolite.3 Tests at three locales that span a wide range ofwastewater compositions are shown in Table 7-1.
>4;
; The equilibriaftr NH4-N bed loading computed Nt:each of he wastewaters listed in Table7-1 was 4.1 g/1, 3.9 g/1, and 4.3 g/1, respectively, for Tahoe, Pombna, and,Blue Plains. Figure7-7 presents equilibrium bed loading in an alternate way. The minimum bed volumesrequired to attain equilibrium NH44,-N loaciiiiig are expressed as a function of the NI-114-11concentration in the influent wastewater. The equilibrium bed volume values given,in:Figure7-7 normally represent the 50 percent breakthrough point (the effluent concentration '.is50perceut of the feed concentration). The wateilowest in competing cations (Bluqlains) hadthe greatest ammonium removal Capacity. hi the 10-20 mg/1 influent N14-N range; thelower competing ion concentrations at Blue Plains resulted in the useful ammonium
;exchange capacity being about 33,:06ieekit greater than that for Pomona with its higher TDS*Water. The lower degree of pretreatment at Blue Plains (i.e., no biological pretreatment) didnot impair the effectiveness of the clinoptilolite for ammonium removal.
7.2.6 Length of Service Cycle:
$i.i"
To illustrate the" determination of a permissable length setvice cycle for a given wastewater,ammonia breakthrough curves for a single 6 ft deep (1.8m) bed of clinoptilolite areillustrated in Figure 7-8 for Tahoe tertiary effluent with flow rates varying from 6.5 to 9.7
7-10
329.
. a
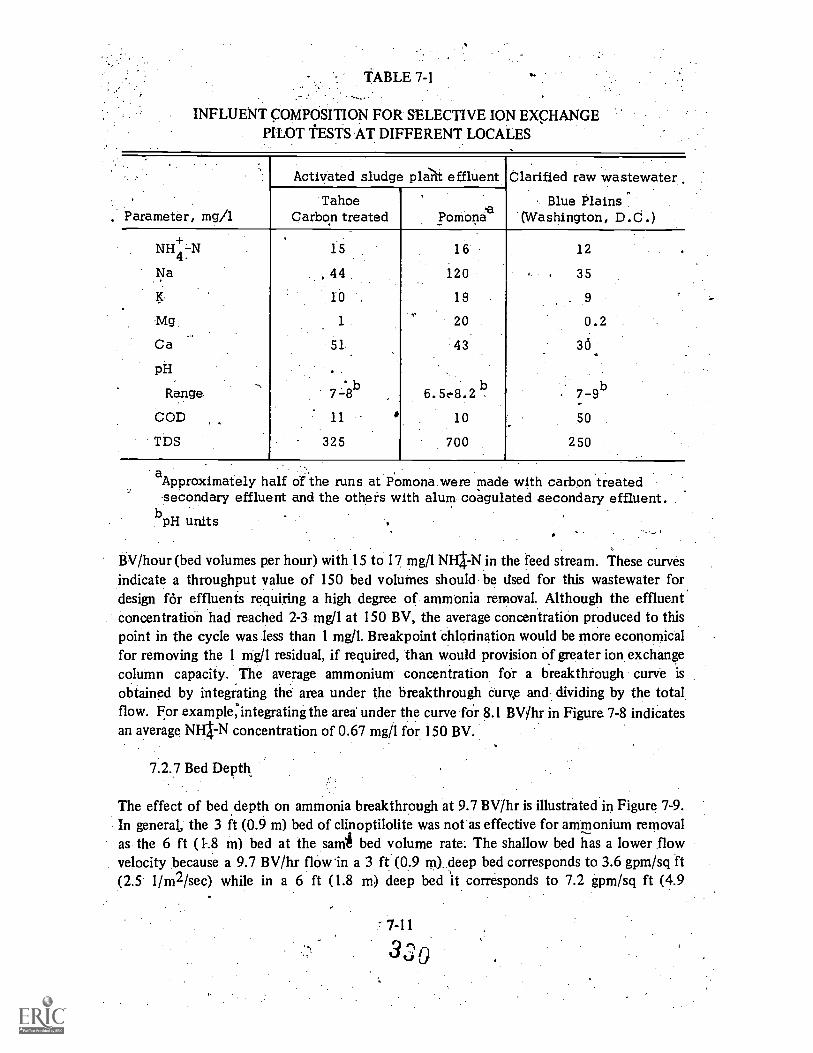
TABLE 7-1
INFLUENT COMPOSITION FOR SELECTIVE ION EXCHANGEPILOT TESTS AT DIFFERENT LOCALES
Parameter, mg/1
Activated sludge plate effluent Clarified raw wastewater
Blue Plains(Washington, D.C.)
TahoeCarbon treated Poniona'a
. _
NH 15 16 12
Na 44 120 35
10 18 . 9
Mg 1 20 0.2Ca 51 43 36
PH
Range 7- 8b 6.5e-8.2 7-9b
COD 11 10 50
TDS 325 700 250
aApproximately half or the runs at Pomona were made with carbon treatedsecondary effluent and the others with alum coagulated secondary effluent.
bpH units
BV/hour (bed volumes per hour) with 15 to 17 mg/1 NH4 -N in the feed stream. These curvesindicate a throughput value of 150 bed volumes should be used for this wastewater fordesign fOr effluents requiring a high degree of ammonia removal. Although the effluentConcentration had reached 2-3 mg/1 at .150 BV, the average concentration produced to thispoint in the cycle was less than 1 mg/l. Breakpoint chlorination would be more economicalfor removing the 1 mg/1 residual, if required, than would provision of greater ion exchangecolutnn capacity. The average ammonium. concentration for a breakthfough curve isobtained by integrating the area under the. breakthrough curve and dividing by the total.flow. For example, integrating the area under the curve .fo'r 8.1 BV /hr in Figure 7-8 indicatesan average NI-4-N concentration of 0.67 mg/1 for 150 BV.
7.2.7 Bed Depth
The effect of bed depth on ammonia breakthrough at 9.7 BV/hr is illustrated in Figure 7-9.In general, the 3 ft (0.9 m) bed of clinoptilolite was not as effective for ammonium removalas the 6 ft (1-.8 m) bed at the sami bed volume rate: The shallow bed has a lower flowvelocity because a 9.7 BV/hr flow in a 3 ft (0.9 m), deep bed corresponds to 3.6 gpm/sq ft(2.5 1/m2/sec) while in a 6 ft (1.8 m) deep bed it corresponds to 7.2 gpm/sq ft (4.9
7-11
3(30

40
E 30
20
OC.)
2 10
-J
0
FIGURE 7-7
MINIMUM BED MMES AS A FUNCTION OP INFLUENT
NH44N CONCENTRATION TO REACH 50 PERCENT
BREAKTHROUGH OF AMMONIUM (REFERENCE 2)
0 100 ,200 300 400MINIMUM BO VaLUMa'S,'
1/m2/sec). The lower velocity might increase the, likelihood of plugging of portions -of thebed, Plugging would cause poor flow distribution and lower bed efficiency. As discussed inthe design examples in Chahlr 9, full-scale designs are using bed depths of 4-ft (1.2 m) witha high degree of pretreatment (coagulation and filtration) which will minimize plugging ofthe clinoptilolite bed.
500
7.2.8 One Column vs. Series Column OperationI .
Operation to the 150 bed volume throughput value (Figure 7-9)percent
maintain an averageNH4 --N concentration at or below 1 mg/I uses only 55 to 58 percent of the zeolite'sequilibrium capacity. The number of bed volumes throughput per bed can be increasedwhile maintaining low NH-44N effluent concentrations with semi-countercurrent operation,using two beds in series. Semi-countercurrent operation is achieVed by first operating the
7-12
33.E

FIGURE 7-8
AMMONIUM BREAKTHROUGH CURVES FOR A 6 FT CLINOPTILOLITEBED AT VARIOUS FLOW RATES
OPERATING CONDITIONS:
1
ZEOLITE GRAIN SIZE: 20 x 50 MESHBED VOLUME: 50 FT3 14161)FEED: TAHOE TERTIARY EFFLUENT
InfluentSymbol Flow Rate N H N', mg/it
4 8.1 BV/hr 15
6.5 17
9.7 (7
O
I I .1
20 40 60 80 100 120 140 160 , 180 , -
BED VOLUMES.
columns in a 1-2 sequence and then placing column 2 into the lead position, after the firstregeneration, with column I becoming the polishing column. A column is removed from theinfluent end wt.* it becomes 'loaded while simultaneously adding a regenerated column. atthe effluent end. This procedure in effect moves the beds countercurrent to liquid flow bycontinually shifting the more saturated beds closer to the higher influent concentrations.Beds can be loaded nearer to capacity with .this procedirre than with single Cblumn orparallel feed multi-column operation. The. most highly loaded column is alwayS. of theinfluent end backed up by one (if two in. series) or more columns having decreasing loadingsand NH,TN concentrations at locations progressively nearer the end of the series. Removalof a column is not decided by applying a breakthrough criterion to the column's own effluent .
but ,by breakthrough t the end of the series. 'Tests have indicated that the ammoniumloadings could be increased from 55-58 percent of the equilibrium capacity to 85 percent byusing two columns in series.2 Average throughputs for tlite Tahoe,example discussed earlierincreased from 150 to 250 BV/cycle. However; such a two column operation requires threecolumns (two on stream while the third is being regenerated) and moreore compliCated valvingand piping than a parallel column operation. Because of the added capital costs involved in a
, 7-13
3 o
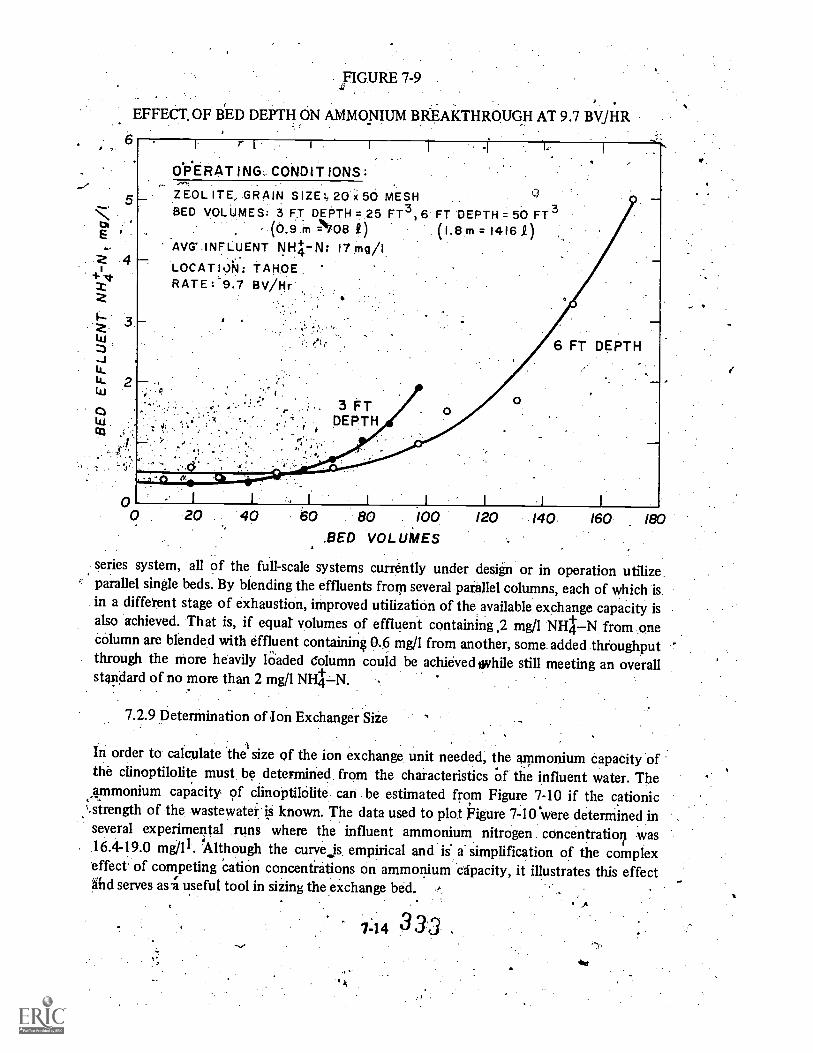
6
FIGURE 7-9
EFFECT, OF BED DEPTH ON AMMONIUM BREAKTHROUGH AT 9.7 BV/FIR
OPERATING. . CONDITIONS:
ZEOL ITE, GRAIN SIZE:, 20 x 50 MESHBED VOLUMES: 3 FT DEPTH 25 FT3, 6 FT DEPTH 50 FT3
(0.9 rn =7708 9) (1.8 m 1416 I)AVG' INFLUENT 1H-N: 17m9/1LOCATI41: TAHOERATE: 9.7 BV/Hr
6 FT DEPTH
3 FTDEPTH
20 40I I
60 80 ioo.BED VOLUMES
120 140 160 180
series system, all of the full-scale systems currently under desiin or in operation utilizeparallel single beds. By blending the effluents from several parallel columns, each of which isin a different stage of exhaustion, improved utilization of the available exchange capacity isalso achieved. That is, if equal volumes of effluent containing ,2 mg/1 NH44N from onecolumn are blended with effluent containing 0.6 mg/1 from another, some added throughputthrough the more heavily lo'aded column could be achieved twhile still meeting an overallstandard of no more than 2 mg/lN1114N.
7.2.9 Determination of Ion Exchanger Size
In order to calculate the size of the ion exchange unit needed, the ammonium capacity ofthe clinoptilolite must be determined, from the characteristics Of the influent water. Themmonium capacity of clinoptikilite- can be estimated from Figure 7-10 if the cationic
.strength of the wastewater is known. The data used to plot Figure 7-10 were determined inseveral experimental runs where the influent ammonium nitrogen concentration was.16.4-19.0 mg/11. Although the curvejs empirical and is a. simplification of the complexeffect. of competing cation concentrations on ammonium 'Capacity, it illustrates this effectgfid serves as useful tool in sizing the exchange bed.
7-14 33
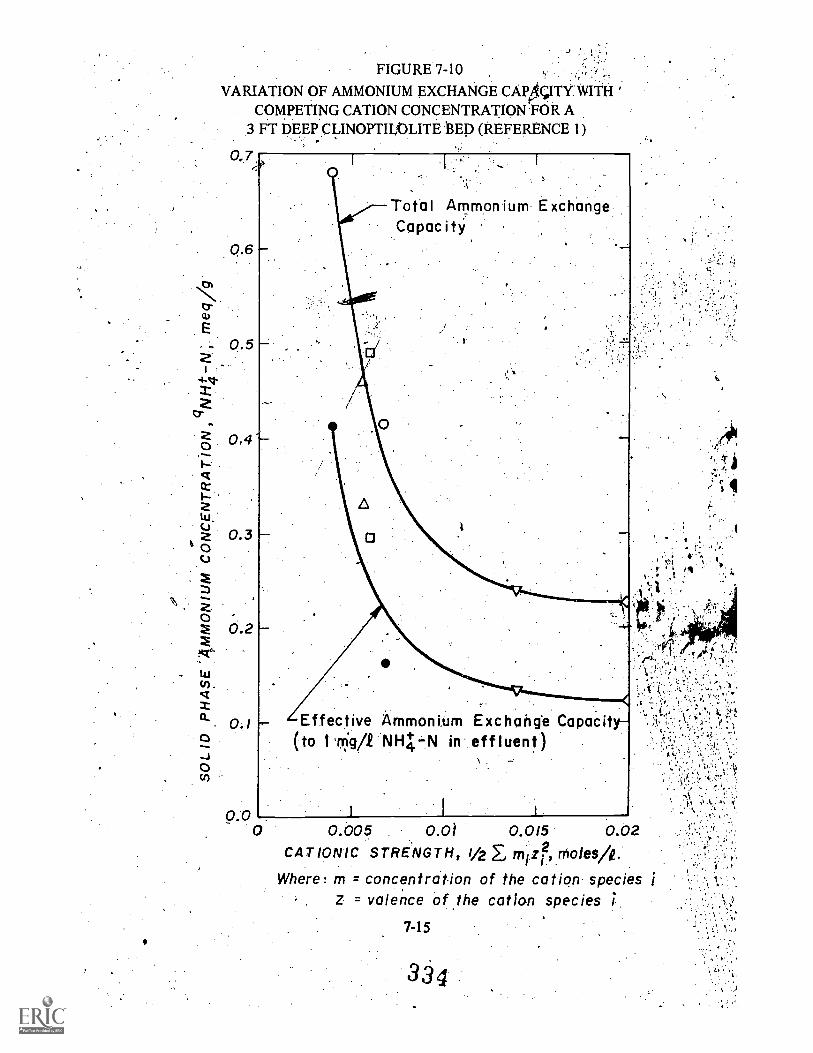
FIGURE 7-10
VARIATION OF AMMONIUM EXCHANGE CAP4CITY WITHCOMPETING CATION CONCENTRATION FOR A
3 FT DEEP CLINOPTILOLITE )3ED (REFERENCE 1)
0,7,
0.6
0.5
OZ. 0.2
Fzta.
co..zrz
0.1Q.
O.co
0.0
a;.t
Effective Ammoni.um Exchange Capacity-(to 1rrigti NH4 -N in effluent)
0 0.005 0.01 0.015 0.02CATIONIC STRENGTH, I/2Z mtzr, moles /p.
Where: m = concentration of the cation species 1Z = valence of the cation species 1,
7-15
334
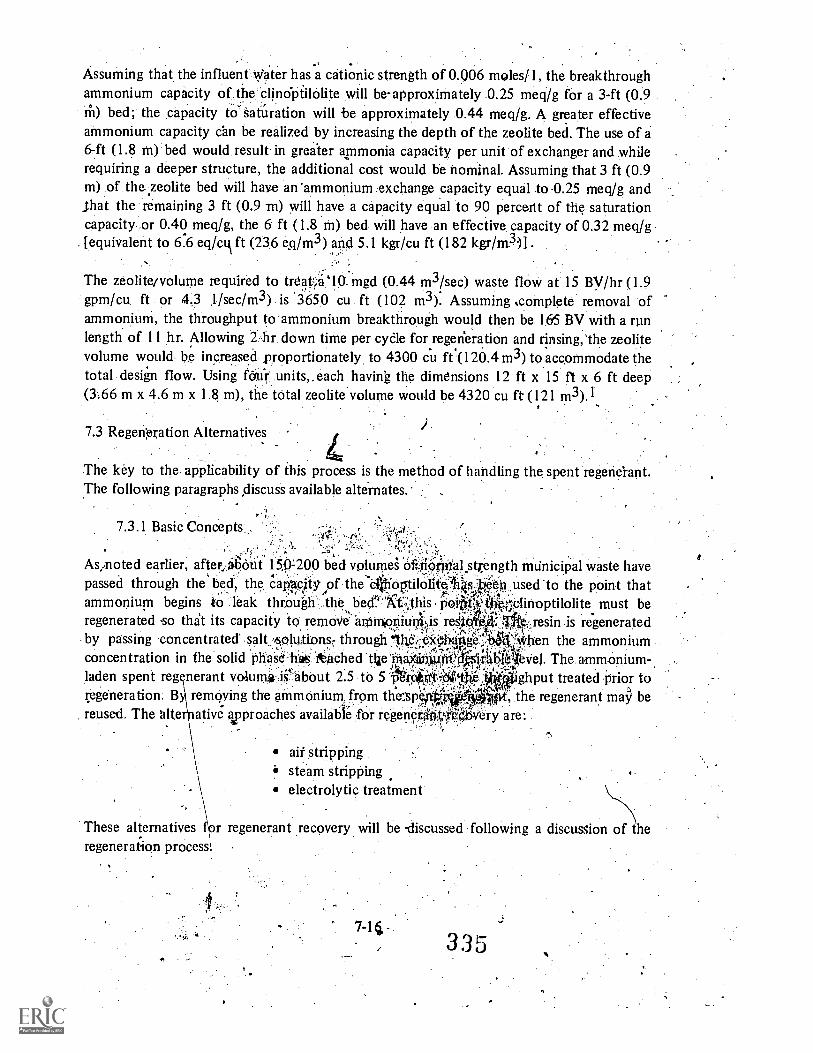
Assuming that the influent .water has -a cationic strength of 0.006 moles/1, the breakthroughammonium capacity of:the clinOptilolite will be-approximately 0.25 meq/g for a 3-ft (0.9rh) bed; the capacity to' saturation will be approximately 0.44 meq/g. A greater effectiveammonium capacity can be realized by increasing the depth of the zeolite bed. The use of a6-ft (1.8 m) bed would, result in greater ammonia capacity per unit of exchanger and while .
requiring a deeper structure, the additional cost would be nominal. Assuming that 3 ft (0.9m) of thezeolite bed will have an 'ammonium exchange capacity equal to -0.25 meq/g andjhat the remaining 3 ft (0.9 m) will have a capacity equal to 90 percent of the saturationcapacity. or 0.40 meq/g, the 6 ft (1.8 m) bed will have an effective, capacity of 0.32 meq/g
. [equivalent to 6:6 eq/cui ft (236 esi/m3) and 5.1' kgr/cu ft (182 kgr/m3)].
The zeolite/volume required to treattala mgd (0.44 m3/sec) waste flow at 15 BV /hr (1.9gpm/cu ft or 4.3 .1/searn3) is 3650 cu. ft (102 m3).. Assuming complete removal ofammonium, the throughput to ammonium breakthrough would then be 165 BV with a runlength of 11 hr. Allowing 2 hr down time per cycle for rregenteration and rinsing,'the zeolitevolume would. be increased proportionately to 4300 cu ft (120.4 m3) to accommodate thetotal design flow. Using four units,, each having the dimensions 12 ft x 15 ft x 6 ft deep(3.66 m x 4.6 m x 1.8 m), the total zeolite volume would be 4320 cu ft (121 m3).1
7.3 Regeneration Alternatives
The key to the applicability of this process is the method of handling the spent regenerant.,
The following paragraphs discuss available alternates.'
....
7.3.1 Basic Concepts. , :
-..y:,.. .
As noted earlier, after.diont 150L200 bed volurnei Of,tiorjnA strength municipal waste havepassed through the bed? the cai*City of the eirorilolift4s 0 ,used to the point that-, ,-!..: .`/ammonium begins to leak through thebee'At.:.this . pOiiif,le *Clinoptilolite. must beregenerated -so thdt its capacity to remove anlmori--, iiiikis re41
'.resin is regenerated
by passing .concentrated' salt .,solWionsr through "t1IP.,:eicOartge;,, d 'viten the ammonium'il:,,,
concentration in the solid pha'sd..* 'leached tliel04iiiijiyik, r 0 vel. The ammonium-,laden spent regenerant volurr4.i'about 2.5 to 5 t i t rp*A-' ghput treated prior toregeneration. B removing the ammonium from th'e3pe.riViete ', the regenerant may bereused. The alte ative ipproaches available for regeneOtilt,If v'ery are:
-These alternatives fpr regenerant recovery will be discussed following a discussion of theregeneration process.
ail strippingsteam strippingelectrolytic treatment
7-14, 335

7.3.2 Regeneration Process
The ammonium retained on the clinopTholite exchange sites may be eluted by either sodiumor ,calcium ions contained in a regenerant solution. While the normal service cycle isdoWnflow, regeneration is carried out by; passing the regenerant up through the clinoptilolitebell.
1
7.3.2:1 High pH Regeneration
I
. he approach originally studied for wastewater applications w o use a lime slurry (5 gm/1).s the regenerant so: that the ammoniumaMmoni stripped frornIthe be during regeneration would
.4,4
lie
It was..found that eldtiOn with lime could be sp up by the addition offre converted to gaseous ammonia which .could then be remov from the regenerant by air
sufficient Neel to render the regenerant O. IN with respect to NaCI. 3
In addition to converting. thstargmoninm n to ammonia so it can readily be removed fromthe regenerant, the Volume igreg#14fit...tequired for complete regeneration has been foundto decrease with increasing i6iiiiera'rti-pH. I However, high pH regeneration was found to beaccompanied by an operational problem of major 'significance.2,3 Precipltation ofmagnesiurn. hydroxide and calcium carbonate occurs within the exchanger during theregeneration cycle. This leads. to plugging of the exchanger inlets and. outlets, as well ascoating of the clinopti101ite particles.- Violent backwashingof the clinoptilolite-Was.found tobe necessary to remove theSe precipitants fromthe clinoptilolite particles, which resulted inincreased mechanical attrition of the clinoptilolite. Chemical attrition also increases atelevated pH. values.
Substantial data have been collected on high pH regeneration and are available in references0.M 2 and 3 if this approach is considered. However, the practical problems of scale control
are major limitations which cam be overcome by using,neutral regenerants. The use of closedloop regenerant recovery processes negates the disadvantage of higher regenerant volumesrequired at lower regenerant pH values (See SectiOn 7.3.2.2).
7.3.2.2 Neutral pH Regeneration;
Two of the largest municipal wastewater installations under design which will useclinoptilolite are the Upper Oecoqiia# (Virginia) Regional Plant (15 mgd or 0.66 rd/sec) asdescribed in Section 9.5.4.1 and the Tahoe-Truckee (California) Sanitation Agency plant (6mgd or 0.26 m3 /sec), both Or wich will utilize a regenerantlwith a pH near neutral. Theacti e portion of the regenerarit a 2 percent sodium chloride solution. Calcium andpot 'nm will be eruteC1 as well a's..ammonia and will build up in, the regenerant until theyreach equilibrium. The typical elution curve for ammonium with a neutral pH regenerant isshown in Figure .7-11, Approximately 25-30' t3V were required beforelhe ammoniumconcentration reached equilibrium.5 AlthoutkgPeateg regenerant Vohlmes are required than

with a high pH regenerant (10-30 BV), this is not a major disadvantage if the regenerant isrecovered, and reused in a closed loop system.
Variations in in regenerant flow rates of 4-20 BV/hr do not affect regenerant performance.Higher rates result in less ammdnia removedper volume of regenerant. Typical design valuesare 10 BV/hr which insures efficient use of the regenerant while keeping headloss values atlow levels. Provisicms should be made for backwash at rates of 8 gpm/ sq ft (3.9 1/m2/sec)and surface wash of the contactor prior to initiation of the regenerant flow. Additionaldetails on neutral pH regeneration are contained in' Section 9.5.4.
1000
.Q.lai 600
,
6.1WCt
00clt
3004.*
FIGURE 7-11
AMMONIUM ELUTION WITH 2 PERCENT SODIUMCHLORIDE REGENERANT (REFERENCE 5)"
so ri zo 25
BED VOL UMES
7-18

7.3.2.3 Effects on Effluent TDS
4*0)'','Effluent 'Total Dissolved Solids (TDS). is an important consideration in many plants. Vhen:d2-3 percent solution of salt is used' for regeneration, elution of this salt remaining in thObel'after regenetation at the start of the service cycle may result in an increase in TDS of about50 mg/I. The increment would be, greater with stronger regenerants. The TDS effect is much,less than for the breakpoint proces, however:
7.3.3 Regenerant Recovery Systems
Ammonia may be removed from the regenerant so that the regenerant may be reused. Airstripping of a high pH regenerant, air stripping of a neutral regenerant, steam stripping, orelectrolytic treatment may be used.
7.3.3.1 Air Stripping of High pH Regenerant
In the-original pilot work on this approach to regenerant recovery, a stripping tower packed,with 1 inch (2.54 cm) polypropylene saddles was used.2,3 Because the regenerant volume isonly a small portion of the total wastewater flow, it becomes feasible to heat the air used inthe stripping process. The regenerant was normally recycled upflow through the zeolite bedat a -flow rate of 4.8-7.1 gpm/sq ft (3.3-4.8 1/m2/sec) until the NH3N approachedmaximum concentration. The regenerant was then recycled through both the-zeolite bedand the air stripper until the NH3N was reduced toabout 10 mg/I. The liquid flow rate tothe stripper was normally 2 gpm/sq ft (1.36 1/m2/sec) with an air/liquid ratio of 150cu ft/gal (1.1 m3 /1). Ammonia removal in the air stripper generally averaged about 40percent per cycle at 25C. Calcium carbonate scalin*occurred on the polypropylene saddles,but the scale could generally be removed by water sprays. The headloss through the 1 inch(2.54 cm) pilot plant saddles caused the power requirements for the air stripping to beexcessive. It was suggiested° for a full -scale design that the ammonia stripping tower be sizedto treat the contents of an elutliant tank in 8 hours, using two passes through the tower at85 percent removal per' 'Pass at an air-to-water ratio of 300 cfm/gpm (2.2 m3/1), and a.loading of 3.5 gPm/ft2:(0.63 1/m2/sec).2 The tower would be a modified cooling towerwith .low differential pressure across the tower as discussed in Chapter 8.
An .example,design of a 7.5. mgd (0.33 m3/seC) system' illustrates how the air strippingsystem can be integrated into an overall system.2 A scherriatiC 'diagram of the ion exchangebeds, lime elutriant system, and amnia air stripping.system is shown in Figure 7-12. For
flows,ows, nine bedS (12 ft or 1-:65 m diarrieter'and 8 ft or 2.4 m deep) would be inservice and three beds in regeneration. The:direction of flow for the beds in service would bedownflow. All beds woulir operate in 'parallel. When; a given volume of Wastewater haspassed through, a set of three beds,, for example, beds I , 2, and 3, the:set of beds would betaken off line for regeneration. At this time elutriant'tank A would ctintain elutrianfwaterfrom a previous regeneration with a very'high ammonia nitrogen content (say 600 mg/I);tank B would contain clutriant water with a low'amrnonia nitrogen content'(say 100 mg /I);
7-19
3,38

. FIGURE 7-12./ `'.I y
EXAOLE ION EXCHANGE - AIR STRIPPING SYSTElif pOlt,HIGH pH REGENERANT
INFLUENT PEED
4;
4101414,14T 10101N OuT k T RADIA
ION,t
t EDS
111tAT10 MUM
4platiON
. WW1
IIAMA14,
RIGINIIIANT IOW110N
Nut 4(Am ,
MINIUM 10 klgIONKIC1104 1141
NI IhG
A 1 t
KOBE ANT MIRA E TANKS
TOW INF WIN!
PAM
itIffUl 11 F WINT 1141
,1177NoTes
Eos 1,i A 3 ARE SHOWN N REGENERATION CYeL'S
0"2 BEDS 4 .12,ARE SHOWN IN SERVICE CYCLE
1 TOWER SHOWN STRIPPING FROM REGENERANT
TANK A, SINGLE CYCLE
TANKS B A C ARE IN REOEIJERATiON CYCLE
4 0, INDICATES VALVE CLOSrD
5 X INDICATES VALVE OPEN
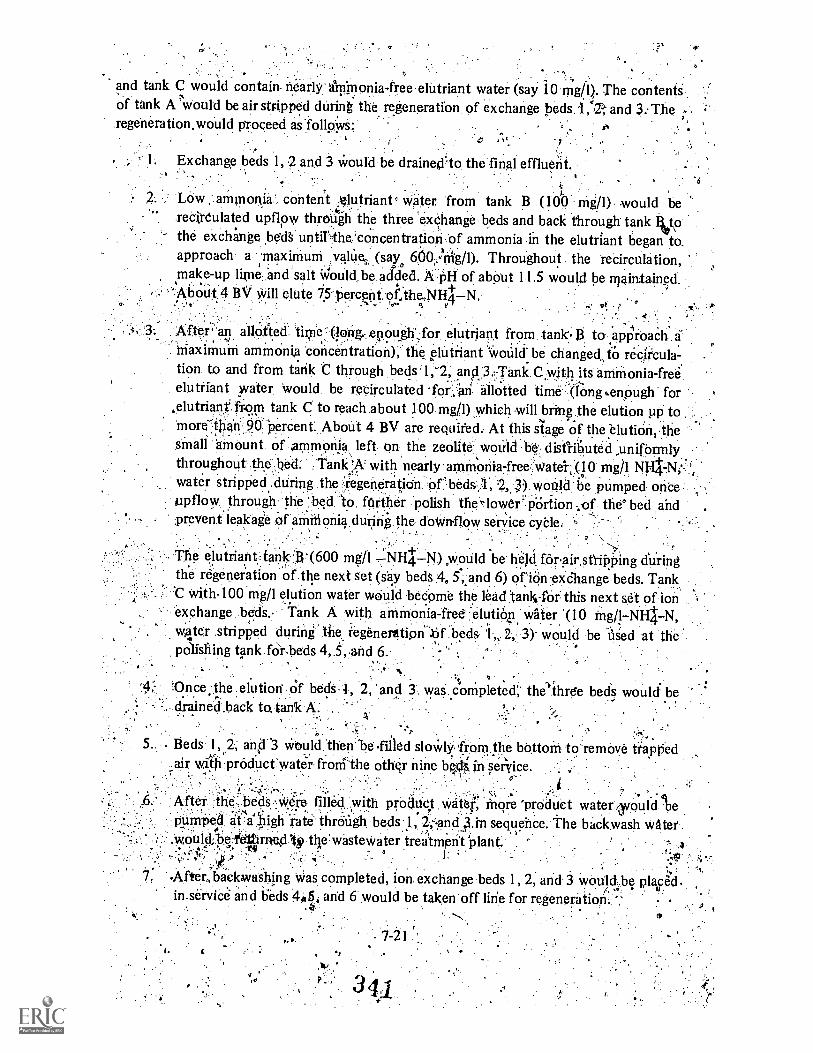
and tank C would contain. nearly- ammonia -free eliitriant water (say 10 ing/1). The contentsof tank A would be air stripped dUring the regeneration of exchange heds 4:2; and 3: The ;regeneration,woUld proceed as.followS.;
Exchange beds 1, and 3 would be drainecno the final effluent.1
, 2.. Low ammonia, content .*lutriantm water from tank B (100 rig /1) would berecirculated upflow throUgh the three exchange beds and back through tank libto
,.
the exchange bed untirthe'coneentratiori of ammonia in the elutriant began toapproach. a maximum val4; (say 600,'Mg/1). Throughout the recirculation,make-up lime:and salt viould.be added. A PH of about 11.5 would be maintained.
'' About 4 BV Will elute 15'Perdent of:the,NH4N.
Arter'an allotted time s(long.- enough,for elutriant from tank. B to approach a'maximum ammonia concentration); the plutriant Would be changed, to recircula-tion to and from tank C through beds'1,-2, and 3.-,Tank C with its ammonia-freeeluttiant pater. Would be recirculated for:, an allotted time (long %enough' for
eelutriant from tank. C to reach about 100 mg/1) which willbring:the elution up tomore than 90: percent ,About 4 BV are requited. At this stage of the elution, thesmall amount. of .ammonia. left on the zeolite would be distributed uniformlythroughout .the ;bed :Tank:A: with nearly animbnia7freewatel.;,(10mg/1water stripped .thiring the ,)regeneratiOn .Orbeds:,1, wo* be pumped onceupflow through the:bed:1o. further polish thes.lower:p*Ortion -of the° bed andprevent leakage of ammonia during the doWnflow service cy'ale,
' The elutriant ar* :B. (600 mg /1 7NH4-N) ,would be held forair,stlihPing duringthe regeneration of the next set (say beds 4 5,.and 6) of:iOn-exclange beds. TankC with100 mg/1 elution water would beCome the lead tanklOr this next set of ionexchange bed's. Tank A with ammonia-fre :elutibp water '(I0 MONH-4N,water stripPed during' .'the tegeneratiOnnkif :beds, i 2, 3) would be used at thepolishing tank fOrbeds 4, 5,and 6.
,`Once; the. elution Of beds 2, 'and 3 was completed, the1,
thrde beds would bedrained.back to. tank A.
Beds 1,2.; and 3 would, then befilled slowly, from the bottom to remove trapPedair with produefwater froni`the other nine bes.fLii service.
After :thes:heds were filled with product Watef, more 'product watercrouldP:Iiin011 aTafligb *rate' throUgh beds 1, 2,-and sequence. The backwash water
tll& wastewater treatmr. nt plant. .4
\tip r
Afterhackwashing was completed, ion exchange beds 1, 2, and 3 WoUldbe playedin.service and beds 44,5, and 6 would be taken off line for regeneration.
,

Ammonia in4,the elutriant solution would be removed by air stripping at a pH of about 11.5..In the preceding: example, during the regeneretion of beds 1,, 2, and 3, the very highammonia.' nitrogen. content (600 mg/kin the' ekitriant solution of,tank A was torbe airstripped. The following procedure would be used :'
' 4t1., The contents of tank A would 'pass through the tower down into the recycle basin
below the tower.
°
2., ','Zhe contents of the recycle basin then be pumped back up through thetower once again°. This time, however, the .effluent from the tower, would flowback to tank'A.
The contents of tank A would now contain about 10 mg/1 of ammonia, andwould be ready to serve as the polishing volume during the regeneration of ionexchange beds 4, 5, and 6.
By using the. above batch countercurrent recycle technique, it is possible to achievecomplete regeneration with only about:4 ,BV requiring stripping per cycle. This a key tomaking steam stripping (as discussed later) practical.
ii7t3.3;:2-Air Stripping of Neutral pH' Regenerant
As previously discussed, the use of high pH regenerant is accompanied by scaling.problemswithin the ion exchange beds. Thus, as discussed in Section 7.3.2.2, a regenerant with 2percent sodium chloride as the active agent and pH nearer' neutral has been used toovercome the scaling problem. This regenerant may also be recovered fOr reuse by airstripping. Figure 7-13 is a sch4atic diagram of such a system.6 In this system, the stripping,tower off,gases are not discharged to the atmosphere but are instead, passed through anabsorptiOn tower where theammonia in the off -gases is absorbed in sulfuricwacid. Thestripping gases are recycled to the tower. This approach eliminates discharge of ammonia tothe atmosphere and recovers the ammonia in a form suitable for fertilizer usage. Thestripping-absorptiOn approach is applicable to high pH regeneration systeMs as well. It also
:reduces scaling problems in the stripping tower by limiting the CO2 content of the stripping:air. This system (the Ammonia Removal and Recovery Process "ARRP") is.also dismissedin Chapter 8 (see Section 8.4,1, and Figure 8-7).
Iii the system 'shown in Figure 7,13, batch-countercurrent regenerant flow similar to thatdesCribed ab6ire for the high pH regenerant is practiced to reduce the amount of regenerantwhich must be stripped per cycle. The first 11 BV of spent regenerant are discharged to the .spent regeneraht tank for stripping. The second and third 11 BV batches are stored and usedas the first 22 BV of regenerant flow in the next regenerant cycle, The last 6.41 BV batch ofregenerant is iTIN ed with "the 11 BV of stripped regenerant for use as the final regenerant
.
flow in the next ,cycle. Thus, although, 40-44 BV of;Jegenerant are passed through theexchanger per cycle, only 11 BV are actually renovated by air stripping per cycle.
7-22(-7

ry
.t4.;
FIGVRE" 7-13 ....6 4
4 OP 4b
FLOW DIAGRAM OF NEUTRAL pH RE6ENERAtIONt 9 g'
SYISTEASING AIR STRIPPING
FIRST 1.1 'BED VDLUMES w , 11 BED VOLUMV.PER REGENERATION
a
CLINDBED
SPENTREGENERANT
.. TANK.
L-14SE6DND11 BED
I VOLU,MES
1.
INTERMEDIATE(REGENERANT
TANK
TFIRST 11 BEDliVOLUMES:'1
tTHIRD 11 BED'VoLUMES"o
i
,
INTERMEDIATEREGENERANT`
TANK
Ii
1 [LAST 6-11
SECONIJ 11BEDVbIlES.
riE5-9oLaks i* I
CLARIFIER
lowSLUDGE
.Mg(DH)2
STRIPPER I 'ABSORBER
RECOVEREDREWEBANT
TANK
LLAST 17 - 22 jBED VOLUMES' .7-23
ARRP
la
>-0w
f
MAKE*NaCI,
343
(N11442Spicar
r

Regenerant stored in the tanks shown in Figure 7-13 varies /In ammonium-nitrogenconcentration from about 250 mg/lin the spent tank to 50 MVlin the recovered regeneranttank. The intermediate tanks have intermediate concentrations. The regenerant pH variesfrom about 9.5 sin, the recovered regenerant tank to about 7.0 in the spent tank. As discussedearlier, higher pi values produce more efficient regeneration but near-neutral pH levelsavoid problems with magnesium hydroxide precipitation in the bed during regeneration andattrition of the clinoptilglite caused by high pH. Media attrition has been insignificant inpilot studies under these pH conditions.6
A typical ammonium elution curve is shown on Figure 7-14 with the background.
concentrations in each regenerant stOrage tank also shown. At the end of the cycle, the lastportion of spent regenerant is discharged to the recovered regenerant tank. This has theeffect of neutralizing the alkaline pH from the ARRP process. ARRP effluent is normally ata pH of 10.7 to 11.0. This is reduced to 9.5i- by recycling the last portion of spentregenerant. In this manner, pH is controlled without use of acid.
When spent regenerant is accumulated to a predetertnined amount, the recovery portion ofthe process' is activated. This system operates at a flow rate of approximately '1/13 of .
average plant flow since the regeneiant concentration is about 13 times as concentrated asplant waste. Initially, sodium hydiOxide is added to the spent regenerant to achieve:a pH ofabout 11. Sodium chloride is also added .because of some salt loss from the regenerant .solution in sludge removal and bed rinsing. Following pH 'adjustment, the regenerant isclarified and ,any magnesium hydroxide ;formed is removed. the clarified regenerant at pH=-11 is :then pumped to the ARRP process for ammonia removal and recovery. The ARRPeffluent flows to the recovered regenerant tank where it is mixed with the last 6-11 13V of
. spent regenerant for pH adjustMent prior. to reuse.
This system is being used in the design of plants for the Tahoe-Truckee Sa tation Agency(Califoviia) and for the Upper OccOquan (Virginia) Regional Plant disc issed in Section9.5.4.1.
, 7.3.3.3 Steam Stripping
Steam Stripping of regenerant is being practiced at the 0.6 mgd (0.026 m3/sec) Rosemount,Minnt-;ota physical-chemical plant.7,8 This process is economically feasible only with highpH regenerant.
The higher regenerant voltinies resulting, from the neutral regenerant approach' are noteconomically treated by this approach. This process is feasible only if the regenerant volumerequiring stripping is held to 4 BV per cycle which is achievable with the high pH regenerantbatch recycle system discussed in'Section 7.3.311.9 In this case, the necessary pOrtion of thespent regenerant is stripped in a distillation tower in which steam is injected counterthrrat,witt the regeneran4 -An air cooled plate-and-tube condensor condenses .the. vapor forcollection in a covered tank as a one percent -aqueous ammonia solution /Which could be

500
400
300
cv)
200
100
'FIGURE 7-14
TYPICAL ELUTION.CURVE
1
`CONCENTRATION 'BEINGELUTED FROM BED
BACKG`ROUNI)4 CONCENTRATIONIN FIRST REGENERANT TANK
MD MD OM
162SECOND :REGENERANTTANK
105RECOVEREDREGENERANTT-4VNK
50
10 .20 JO ,
TOTAL BED VOLUMES40
used as a fertilizer. A stripping tower depth of 24' feet (7.3 m) and a loading of '7 gpm/ sq ft(21. 1/m2/sec) are being used -at Rosemount. Cerainic saddles are used rather than woodenslat packing because wood is not a suitable packing in'a high pH- steam environment.--
Heat exchangers are used to transfer heat from the stripped regenerant to the incoming, coldregenerant. Heat transfer to the incoming regenerant from the condenser used to condensethe stripped regenerant may also be attractive. Provisions for scale control in the heatexchangers should be provided. TV steam requirements have been estimated to be 15pounds per 1,000 gallons (1.8 g/1). Added information may be found in the Rosemountdesign example, Section 9.5.4.2.
7-25
345
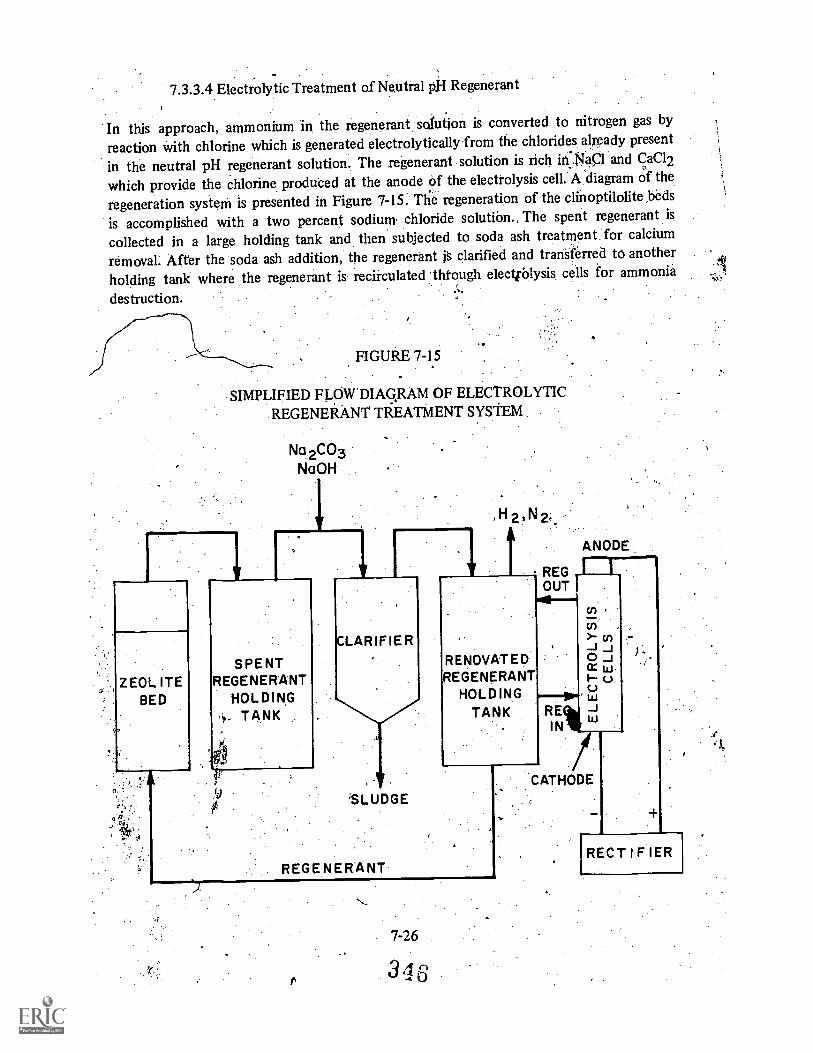
7.3.3.4 Electrolytic Treatment of Neutral pH Regenerant
In this approach, ammonium in the regenerant solution is converted to nitrogen gas by
reaction with chlorine which is generated electrolytically from the chlorides already present
in the neutral pH regenerant solution. The regenerant solution is rich id.Na,C. 1 and CaC12
which provide the chlorine produced at the anode of the electrolysis cell. A diagram of the,
regeneration system is presented in Figure 7-15. The regeneration of the clinoptilolite _beds
is accomplished with a two percent sodium chloride solution., The spent regenerant is
collected in a large holding tank and then subjected to soda ash treatment, for calcium
removal. After the soda ash addition, the regenerant j§ clarified and transferred to another
holding tank where the regenerant is recirculated .thtough electiblysis cells for ammonia
destruction.
ZEOL ITEBED
FIGURE 7-15
SIMPLIFIED FLOW.DIAGRAM OF ELECTROLYTICREGENERANT TREATMENT SYSTEM
Na2CO3NaOH
SPENTREGENERANT
HOLDINGw. TANK
CLARIFIER
SLUDGE
REGENERANT
,H2,N2,
RENOVATEDREGENERANT
HOLDINGTANK
7-26
343
ANODE
REGOUT fLi
cn
CATHODE
RECT IF IER
During therregeneration of the ion exchange bed, a large amount of calcium is eluted fromthe zeolite along with the ammonia. This calcium tends to scale the" athode of theelectrolysis cell, greatly reducing its life. Calcium may be removed from the spent regenerantsolution by a soda .ash softening process prior to passing the sRent regenerant through theelectrolytic cells. High' flow velocities through the electrolysis cells are required additionto a low concentration of MgC12 to minimize scaling of the cathode by calcium hydroxide'
,
and calcium carbonate. The effects of flow rate are well illustikted by pilot test data,5. Usingthe system shown in Figure 7-14, the flow rate through the 41-Was initially set atiiielOCitie'sof 0.13 to 0.16 ft per second (0.04-0.05 m/sec) and a thin buildup of scale was0Serstedthe cathode at the bOttom cell inlet end after 160.'houis of operation. Aftef 239.tiOnisoperation, the flow velocity was reduced 'to 0.06 ft per second (0.018 m/sec) and Pirery'-iigiitscale buildup was observed depositing over the entire cathode, area Scale was removed frOma one-square inch (4.45 cm2) area of the cathode and the flow velocity through the cell .Was.,increased to 0.21 ft 'per second (0.064 m/sec) to determine the effect of scaling at highercell velocities. At this increased flow which was maintained for most of the period of thisstudy, no new scale was dePosited on the cathode. Visually,,it appeared that from 25 to 50percent of the previously deposited scale was removed. These observations suggest ihatscaling within the cell can be, controlled by sufficient flow velocities. Acid flushing of thecells is necessary to remove this scale when -the cell resistance becomes <too high foreconomical operation.
In pilot tests of the electrolytic treatment of the regenerant at Blue Plains, about 50watt-hours of power were required to destroy one gram of ammonia nitrogen.2 Whenrelated to the treatment of water containing 2,5 mg/1 NH4N, the energy consumed wouldbe 4.7 kwh/1.,000 gallons (1.2 watt-hrs/1),.Tgsts at South Tahoe also indicated that a value
,
of 50 watt-hours per gram is reason.ablp foi design
The electrolytic process also results iff abbut 56 cu ft (15861) of hydrogen gas being evolvedper pound of ammonia nitrogen. destroyed. Provisions must be made to vent, burn, orotherwise adequatelyontrol-the hydrogen gas evolved in the electrolytic process.
The major disacNantagb.of the electrolytic approach is the substantial amount -of electricalenergy required. The electrical requirements of the air stripping (ARRP) system described inthe preceding section are only about 10 percent of that required by the electrolytic process.
7.4 Considerations ih Selection!i
.s1
,The selective ion .exchange process has the advantages of high of ency,Insensitivity totemperature fluctuations, and removal of ammonium with a minimal addition, of dissolved.Solids. It may also be used with regenerant recovery systems which enable the recovery ofthe nitrogen removed frOin the wastewater in a reusable form. Its major dislidvantagesis itsrelatively complex.' operation. The procesS should be controlled by .a asystefn which will 'automatically initiate and program the regeneration .cycle and return the ion exhangers tonormal service..
7-27
3 4
The process is particularly attractive for those cases requiring year-round high level removalof nitrogen and where effluent TDS is of major concern. Although the effluent TDS isincreased by the process (see Section 7.3:2.3), the overall increase is much less than for thebreakpoint chlorination process: It must be recognized in the sizing.of the upstream processcapacities that there will be backwaqh wastes returned from the ion exchange procesS. The
irecapacity of the clinoptilolite may be predicted accurately, based 'on.the concentrations ofions present in the wastewater, minimizing the need for pilot tests for defining ion'exchangecapacity. Pilot tests of the overall ion exchange-regenerant recovery system may be useful,however, in evaluating physical and economic aspecti-Of the proposed system design asapplied to a specific wastewater.
7.5 References
fKoon, J.H. and W,J. Kaufman, Optimization of Ammonia Removal by Ion ExchangeUsing 'Clinoptitolite. Eiwitonmental Protection Agency Water Pollution °Control;:/-,Research Series No. 17080 DAR 09/71.
2, Battelle Nokthwest and the South Ti.61,:i.ii-Ptitylic:Iitility.District,Removal by Ion Exchange. Environmental PrOteCtion Agent WaterPd11ution.ControlResearch Series No 17010 ECZ 02/7I';'rebiury',
3. Battelle Northwest, Ammonia Removal from Agriculturdl Runoff and SecondarY''..Effluents by Selective 'Ion Exchange. Robert A. Taft Water ReSearch Center' RepOrt
TWRC -5, March, 1969.=
a
4. Mercer, B..W. 3 Clihoptilolite in Water Pollution ContraOregon Dept. of Geology and Mineral Industries, p. 209; Noverriljer,!1P69.
j..
.
5.. Prettyman, .R., et, al, Ammonia'. Removal by Ion 'Exchange ..-and ..Electrolytic.Regeneration. Unpublished report; CH2M/Hill Engineers, peeeMber,-.1973.,
/ .
6, Suhr, L.G., and KepPle, Design of a Selective lon'Exthange System for AmMonia:.,Removal. Presented at the AS .Environmental Engineering Confereriee,,.PennSylvania State Univtrsity, July, 1974.
7. Physical-Chemical Plant Treats Sewage Near the Twin.6ties. Wafer and Sewag0 WorkS;p. 86, September, 1973.
°
8. Larkmafi, D., Physical-Chemical Treatment. ChemicV Engineering, Deskjaook Issne,87, -June 18, 1973.
9. Personal tommunication,,B.W. Mercer, Battelle NorthieSt, December14J9732; it
7-283.1 8

CHAPTER 8
AIR STRIPPING FOR NITROGEN REMOVAL
8.1 Chemistry and Engineering Principles
The ammonia stripping concept is based on very simple printiples. Because of its simplicity;it offers a reliable means of ammonia iemoval_hen applied under appropriate conditions.The following sectiadescribes the basic concept.
8.1.1 Basic Concept
The equilibri* equation-for ammonia in water is represented by
NH4 f. NH3
4 + H+
At ambient temperature§ :an d. pH 7, the reaction is nearly comPlete ici;stite:left and only-57ammonium ions are preSent:r.AS the.pH is increased above.;.7i:thre;aCti:O11;ig:driVen t6 thetight, and the fraction of .:dissolved ammonia gas increases 4.intil pH,values of '10.5-11.5,'essentially all of the
stripping.is Converted to NH3 gas (see Figure 6-2). The gaseous.form
,:may be removed by striPPirrig..'
(8-1)
he airunonia stripping prOCess itself (Figure 8 -j) consists Of: (1) raising the pH of the water. to yalue§::in the range of 19.8 to 11.5 generally with the lime used for phosphorus removal,:.(2)*rmatioic and reformation of water droplets in a stripping tower, and (3) providing:air-Water;vintact, and drOplet agitation by circulation of large quantities of air through theto:wet. The towers utlk for ammonia stripping of municipal wastewaters closely resemble
.
.s. k IFarivenlOrial cooking, towers. Countereurrent towers, as opposed to cross-flow towers,aP41 .best ssuited to ammonia stripping applications.
tietailedidiSOSsions'Of enthalpy relationships and theoretical mathethatical modelss.,df:the';sfrippirif proceSslt$iaypjlable in references 2, 3 and 4. However, these models are notnorrna*ilied'foi.:striPP:ini,ier design, and an empirical design procedure is used,
Before dressing detailed des10,n considerations, the general environmental impacts of thest-pppi,ng evaluated. It is obvious from Figure 8-1 that ammonia is being4iseharg9;;Vinta. the:a4604).116t. .Does the 'process solve a water pollutibn problem while
\Creating in airspOlhitiOn',.iprOtAern? What is the fate of the ammonia in the atmosphere?se questions must be rsgtisfactoribi addressed prior to the selection of air stripping for
ia nitrod.en.ren-taVal:
8.2L pqroninental.Ortgde4itioni
Ther thre rnalOr potential, 'environmental impads w
8-1
3.9
e evaluated if use of the

FIGURE 8-1
AMMONIA STRIPPING PROCESS
"4;-4' AIR + NH3
OUT
HIGH pHINFLUENT
EFFLUENT TO pH ADJUSTMENTAND OTHER AWT PROCESSES
ammonia stripping process is proposal: airs pollution, washodt of anun onia from theatmosphere, and noise. If these three-i0ifcerns cannot be favorably resolved for any givensituation, then the potential process ad*ntages of simplicity and low cost may become onlyacademic.
8.2.1 Air Pollution
At an air flow of 50Q cu a per gallon (3.7 m3/1) and at an ammonia concentration of 23mg/1 in the tower influent, the concentration of ammonia in the stripping tower discharge isabout 6 mg/m3. As the odor threshold of ammonia is 35 mg/m3, the process does notpresent a pollution problem in this respect. Concentrations of 280-490 mg/m3 have beenreported. to cause eye, nose, and throat irritation.5 COncentrations of 700 mg/m3 can haveadverse effects on, plants. Concentrations of 1,700-4,500 mg/m3 must be reached before
8-2
33-o

human.. or animal toxicities begin to, occur. Ammonia discharged to the atmosphere is astable' material that is snot oxidized to nitrogen oxides ht. the atmosphere.6 Ammonia canreact, with sulfur diox and water to'foim an ammonium sulfate aerosol.. HoWeiyer, for thisebhaiqration to be a Him tion, the stripping tower would have to be located adjacent to aPat source of sulfur dioxide.
The production and release of ammonia as part of the natural nitrogen cycle is about50,000,000,000 tons per ,yeas. Roughly 99.9 percent of the atmosphere's ammonia.concentration is produced by natural biological processes, primarily the: bacterial breakdown
amino acidS.5,6 Although'itiey are relatiVely insignificant sources, biliiiing of coal and oilprOduces measurable qUantilies of ammOnia.6 The back ound leveig of ammonia in the .
;4tmosphere have been observed to vari:from..001 nrig/m .to'0.02 mg /m3 with-a; Value of0;006 mg/m3.being typical.6
,;`,Available difftision technology can be used Ito estimate the atmospheric concentration of ;aiiimbnia.4-:any point downwind of the:striPpini. t6Wer:7 Calculations' were made for theOrangee:C? unty, California stripping tower foflow;inixing conditions (wind speed 1 m/sec).,
.
r s lting surface concentrations at the center of the downwind diScharge zone inCludingn'atural background levels were as follows:
o
Distance from Towerft. nr
Surface Air COncentrationof Ammonia, mg/m3
300 91 5.21,000 305 1.61,600 488 0.63,200 975 0.2
.16,000 4,877 0.0006
Ilackgrorid levels of ammonia are reached within 3 miles (4.8 km). No U.S. ammoniaemission standards have been established by regUlatory agencies because there are no knownpublic health implications at concentrations normally encountered. ,
The American Conference of Governmental Industrial Hygenists recommended in 1967 an_ occupational threshold limit of 35 mg/m3.5 The permissible limit for ammonia in a
submarine during a 60 day dive is 18 mg/m3.5 The Navy's Bureau of Medicine and Surgeryhas recommended an ammonia threSliOld limit fqr 1 hour of 280 mg/m3. All of these valuesare above, the 6 mg/m3 which will typically occur at the tower discharge:la noted above,no ambient air quality standards for' ammoilia ekist for the United States. powutpr, suchambient air standards exist for Czechoslovakia, the:U.SISt12., and Ontario, Canada;: as shownbelow:5

Location
L-Czechoslovakia
Ontario, Canada. ,
a 2 Washout 'of;Ammonia fxbin -Ole Atmosphere.
Basic Standard Permissiblemg/m3. Averaging mg/m3 Averaging
Time Time".
0.10.2
3.5
6:3 30 min7.0.2 20 min
/ ; % /
: Th0.6 is a-large turnover of ammonia:in they atmosphere with the total ammonia content,.,` being 'displaced once per week on the average. Ammonia is returned to the earth through'',
: .. gaseous. deposition (60 percent), aerosol deposition (22;.percent), and precipitatiOn (18. ' ppii,Cent).5 Although not the most significant mechanism:for removal of ammonia from the
atmosphere,- precipitation' does provide one pathway for the return of atmospheric ammonia -,,to bodies of water and to soil. In rainfall, the natural background ranges froM 0.01 to 1 ''
with the m t frequently reportedmg/1
cibs rted values of 0.1 to 0.2 mg/1. The amount of ammonia in,rainfall is irectly related to the concentration of ammonia in the atmosphere. Thus,` anincrease in the ammonia in rainfall would occur only in that area where the stripping towerdischarge increases the natural' background ammonia concentration in the atmosphere.Calculations for the ammonia washout in the rainfall rate of 3 mm/hr(0.12 in./hr)have been"made for the Orange County, California project with the folloWing results:
Distance From:TowerPeak Rainfall Ammonia
Concentration, mg)I,ft m
300 91 601,000 305 18.1,600 4883,200 975: 5
16,000 4,877 0.5
The concentrations of ammonia in the rainfall would 'approach natural background levelswithin 16,000 ft (4.8 km) of the tower. The ultimate fate of the ammonia which is washedout by rainfall within this 16,000 ft (4.8 km) downwind distance depends on the nature ofthe surface upon which it falls. Most soils will retain the That portion which landson paved areas Or directly. on a stream will appear in the runoff from that area Unless thestripping towerls located upwind in close proximity to a lake or reservoir, the direct returnof ammonia to the aquatic environment by atmospheric washout should not make asignificant coAtrib'ution to the total ammonia disclialged to the aquatic :environment.However, this' is a factor which must be carefully evaluated for each potential application.
e

are: three potentially significant noisesourCes in pan ammonia ,stripping tower: (1)Irr-otore:, and fan drive equipinent; (2) fans; and water splashing. The following controlnjealures ate aVailable:
ors-. .--. proper installation, maintenance and insulationans --reduction in tip speed and exhaust silencers
*. 'Water shielding of the tower packing and air inlet plenum
Based on sound level measnienients from the tower at Lake Tahoe, the eXpectednoise level at.the .tower is calctilated to be about 64 decibels (dBA). This noiselevel-can be rechicedltO 46dBA at 600 ft (1.83 m) from the towers by control measures. The Orange County project (Sec.9.5.5.2) includes several specific noise control mea4siires. Before construction of theambient nighttime noise levels in the residential neighborhood around the Orange toun'typlant were 40-45 dBA. . .-
8.3 Stripping Tower System Design Considerations
The major factors affecting design. and process performance include the tower configuration,pH, temperature, hydraulic loading, tower .packing depth and.spacing, air flow, and controlof calcium carbonate scaling.
8.3.1 Type of Stripping Tower
Thefe are two basic types of stripping towers now being used in full-scale applications:countercurrent towers and cross-flow towers (see Figure 8-2). Countercurrent towers (theentire airflow enters at the bottom of the tower while the water enters the top of towerand falls to the bottom) have been found to be the most efficient. In the crossilow towers,the air.is pulled into the tower through its sides throughout the of the packing. Thistype of tower has been found to be more prone to scaling problems (see Section 8.3.7).
8:3.2 pH
The pH of .the water has a major effect on the efficiency of the process. The pH must beraised to the poirri-that all of the ammonium ion is converted to ammonia gas (see Section8.1.1). If phosphorus removal is required, the use of lime as the coagulant will generallyenable the necessary pli_elevation to be achieved concurrent with phosphorus remoVal. IfpH, elevation does not occur in some upstream processes, Op the economics of thestripping process are adversely affected since the costs of pH. elevation Must then beincurred solely for ammonia stripping.

0
TYPES OF STRIPPING TOWERS (REFERENCE 8
WATER. INLET
AIRINLET -7'11)IFLET
WATER'OUTLET.7
'WATERINLET
>>>>>>>>>>>>>>>>>>>DRIFT
:
DISTRIBUTION" .
SYSTEM
8.3.3 Temperature
FILL "?.....^r",..-
AIR INLET AIR INLET/WATERCOLLECTING BASIN
COUNTERCURRENTTOWER
A, critical factor is the air temperature. The water temperature reaches equilibrium at a valuenear the air temperature in the top few inches of the stripping tower. As the watertemperature decreases, the solutbility of ammonia in water increases and it ,,becomes moredifficUlt to remove the ammonia by stripping.- The amount of, air per gallon must beincreased to maintain a given degree of removal as temperature decreases. However, it is notpractical to supply enough air to fully offset major temperature decreases. For example, at20 C, 90-95 percent removal of ammonia is typically achieved. At 10 C, the maximumpractical removal efficiency drops to about 75 percent. Data collected hi.pilot tests by EPA
Iat the Blue Plains plant in Washington, D.Cf well illustrate the temperature effects and'areshown in Figure 8-3.9 In warm weather tests at pH 11.5, with inlet' air and waterteMperatures averaging 25.5 C and 26 C respectively, air stripping cooled the outlet watertemperature by evaporation of the liquid within the tower to an average of 22.2 c. In a
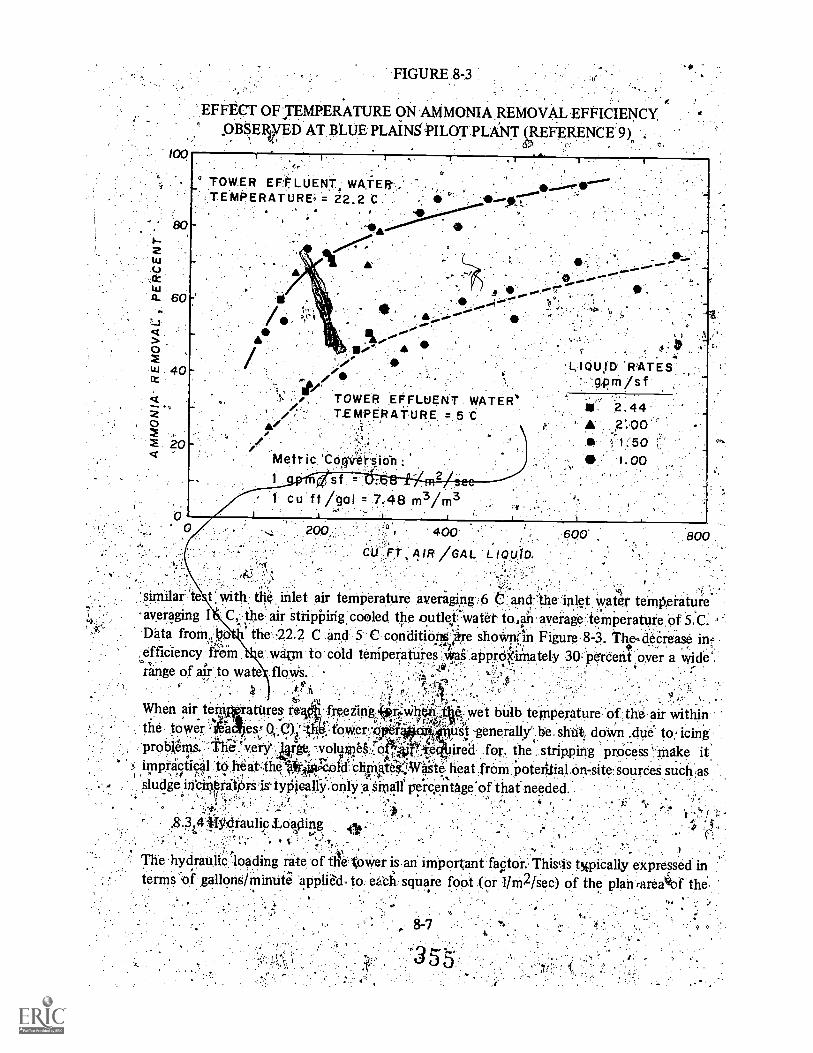
00
(.3.ctLirA. 60
>
z
40
020
0
FIGURE 8-3
EFFECT OF TEMPERATURE ON AMMONIA REMOVAL EFFICIENCYOBSERVED AT BLUE PLAINS,PILOT PLANT REFERENCE 9),,it.
. .
° TOWER EFO:LUENT, WATER,
TEMPERATURE.= 22.2 C
. . s TOWER .EOPLUEN'T WATERT.EMERAT-URE. =.56'I
1,
Metric 'Cori'Verijen. sf. =
1 cuff /gal = 7.48 m3
200 400
A /GAL L
:1-IQU,ID. 'RATES..
gpmjsfU. 2.44.
'
.1-1;50
1.:00
te t with the inlet air temperature averaging .6 t and the inlet water temperatureaveraging I C,. the air stripping cooled the outleewatet to,ian average-.temperature Of 5.C. '-Data from,po the 22.2 C and 5 C conditio!ps:',Are shoWrOn Figure 8 -3. The 4eOrease inefficiency frOin e walrm to cold temperatures apprdOnately 30 Pereent over a wide'.range of air to wate .flows..
When air tein*rattires: reAfreeiing;411 e wet bulb temperature of :the air withinthe tower .'4actes--: 0.0.49:14 ust Tenerally''. be. shtik dorm :due to icing,
hell for. the.:. stripping process 'r.make it.impractical 14 heat:the lrlyt cold ch ktiKOvit4it heat from otetitial onsite:sourdeS siieh,assludge incinritiOrS-ig-tyPically.only a Sinalf perc,entage'of that needed.
"' :
Pytl rau lip Lolling .41,0
The hydraulic loading rate, of theloWer isan important fa5tor. ThiOs twically expressed interms gallons/inimit& appliad, to eacfi, sqUare foOt (or l /m2 /sec) of the plan rarea4of the:
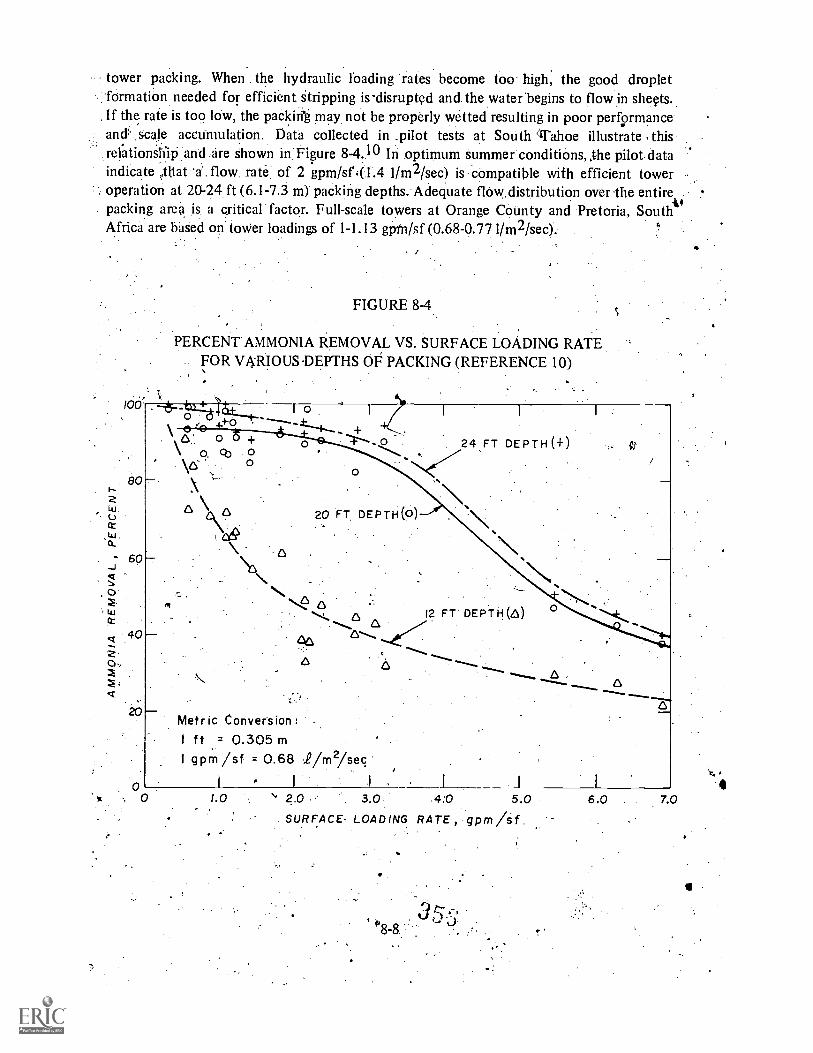
tower packing. When the hydraulic loading rates become too high, the good dropletformation needed for efficient Stripping is disrupted and the waterbegins to flow in sheets.If the rate is too low, the packiri'g may not be properly wetted resulting in poor performanceand scale acculnulation. Data collected in .pilot tests at South 'Tahoe illustrate thisrecationSfiiP and are shown in: Figure 8-4.10 In optimum summer conditions, the pilot. dataindicate ,t1tiat 'a . flow rate: of 2 gpm/sf,(1.4 1/m2/sec) is compatible with efficient tower
:.operation at 20-24 ft (6.1-7.3 m) packing depths. Adequate flow: distribution over entirepacking area is a critical factor. Full-scale towers at Orange County and Pretoria, SouthAfrica are baSed on tower loadings of 1-1.13 gpfri/sf (0.68-0.771/m2/sec).
100
80
W.
ccW.ck.
60
0
CC
40
0,Z=
FIGURE 8-4
PERCENTAMMONIA REMOVAL VS. SURFACE LOADING RATEFOR VARIOUS DEPTHS OF PACKING (REFERENCE 10)
I o+
24 FT DEPTH (+)
20 FT. DEPTH(0)
66 12 FT DEPTH(6)
0.n.9
6
Metric Conversion:1 ft = 0.305m1 gpm /sf = 0.68 .2/m2/sec
1.0 3.0 4.0 5.0 6.0 7.0
SURFACE- LOADING RATE, gpm/sf.
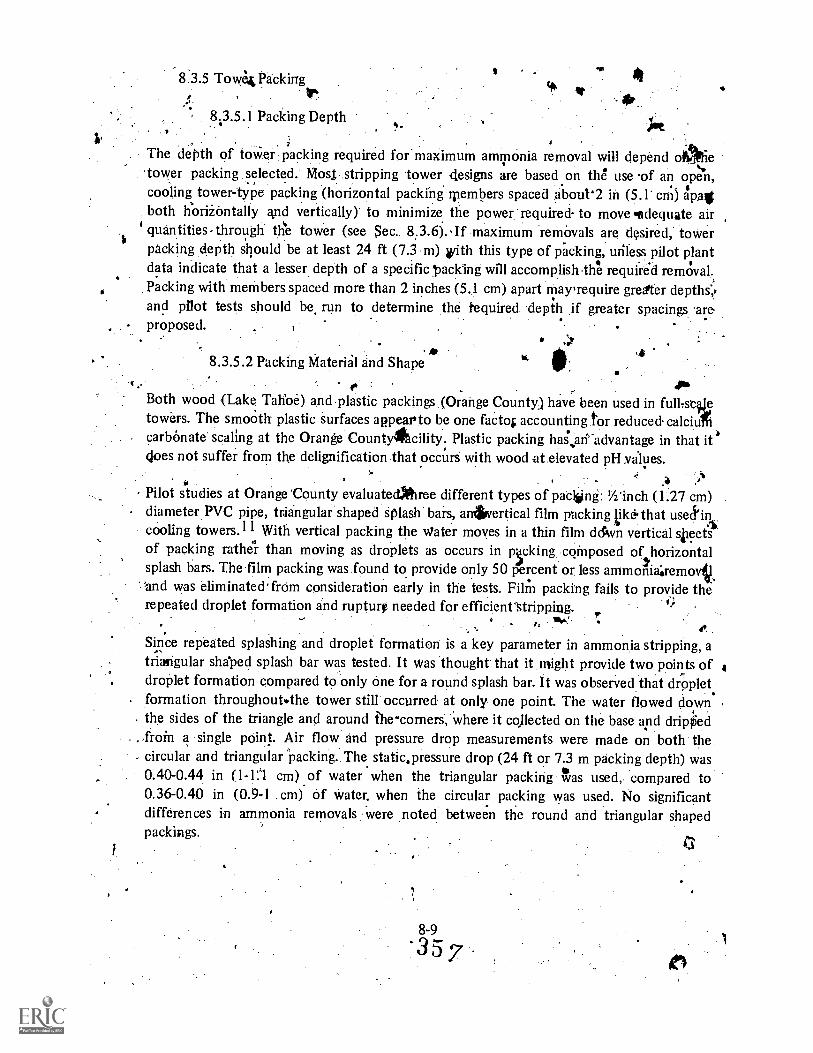
8.3.5 Tow4Packing
8.3.5.1 Packing Depth
a
The depth of tower; packing required for maximum ammonia removal will depend oOlietower packing selected. Most stripping tower designs are based on the use of an open,
Icooling tower-type packing (horizontal packing members spaced about2 in (5.1* cm) apaitboth hOriiontally yid vertically)' to minimize the power required- to move Nadequate air
4 quantities-through the tower (see Sec. 8..3.6).If maximum removals are desired, towerpacking depth should be at least 24 ft (7.3 m) with this type of packing, unless pilot plantdata indicate that a lesser depth of a specific packing will accomplish .the required removal.Packing with members spaced more than 2 inches (5.1 cm) apart rnarrequire grea.ter depths',,and pilot tests should be run to determine the fequired depth if greater spacings 'areproposed.
8.3.5.2 Packing Material and Shape4
' a, JibBoth wood (Lake. Tahoe) and plastic packings (Orange County) have been used in fulkektowers. The smooth plastic surfaces ap,pearto be one facto; accounting for reduced calciAcarbonate' scaling at the Orange Countylacility; Plastic packing has,ad -advantage in that it'does not suffer from the delignification that occurs with wood at elevated pH values.
Pilot studies at Orange 'County evaluated free different types of packing: Winch (1.27 cm)diameter PVC pipe, triangular shaped splash bars, aneisvertical film packing likethat usechncooling towers.11 With vertical packing the Water moves in a thin film ddwn vertical slieet'sof packing rather than moving as droplets as occurs in pyking composed of horizontalsplash bars. The film packing was found to provide only 50 percent or, less ammonia'aremovil,'and was eliminated; from consideration early in the tests. Film packing fails to provide the
ed:repeated droplet formation and rupturf needed for efficienrStrippiug.teok'
Since repeated splashing and droplet formation is a key parameter in ammonia stripping, a.91
triangular shaped splash bar was tested. It was thought that it might provide two points ofdroplet formation compared to only one for a round splash bar. It was observed that dropletformation throughout.the tower still occurred at only one point. The water flowed down
. the sides of the triangle and around ihe-comers, 'where it collected on the base and dripiiied..,froin a single point. Air flow and pressure drop measurements were made on both the- circular and triangular packing.. The static capressure drop (24 ft or 7.3 m packing depth) was
0.40-0.44 in (1-11 cm) of water when the triangular packing Was used, compared to0.36-0.40 in (0.9-1 cm) of water, when the circular packing was used. No significantdifferences in ammonia removals, were noted between the round and triangular shapedpackings.
. 1
8-9
3 5 7

8.3.5.3 Packing Spacing and Configuration
Figure 8-5 is 'a sideview of a typical.packing configuration using wood or plastic slats. In thisexample, he slats are spaced 2 M. (5.1 cm) apart (center to center) on the horizontal and1.5 in. (3.8 cm) apart vertically. Thig spacingis referred to as 1.5 x 2 in.(3.8 x 5.1 am).Figure shows that the. spacing or the tower packing is impQrtant in determining the airrequirements for ammonia stripping. The 1.5 x.2 in.'(3.8. X. 5.1 cm) packing has 2.66 moreslatp for drOplet'formation and coalescing than does a 4 x 4 inch (10.2x 10.2 cm) packing..Although spacing the 'packing members closer than 1.5 x 2 inches (3.8 x 5.1.:cn-i) wouldimprove. performance, the increased pressure drop would greatly increase. pcxwei asts (seeSec. 8.3.4).
.Tests at 0range. !County indicate that packings in which alternate layers of packing areplaced at right angles' rather than the parallel position shown in Figure 8-5, maintains betterflow distribution and may be less susceptible to scale accumulation.
1
0
4
S
#
0
FIGURE 8-5
ILLUSTRATIVE PACKING CONFIGURATION
" -9.1
5.,1 Cm
.48 -10'
358
1
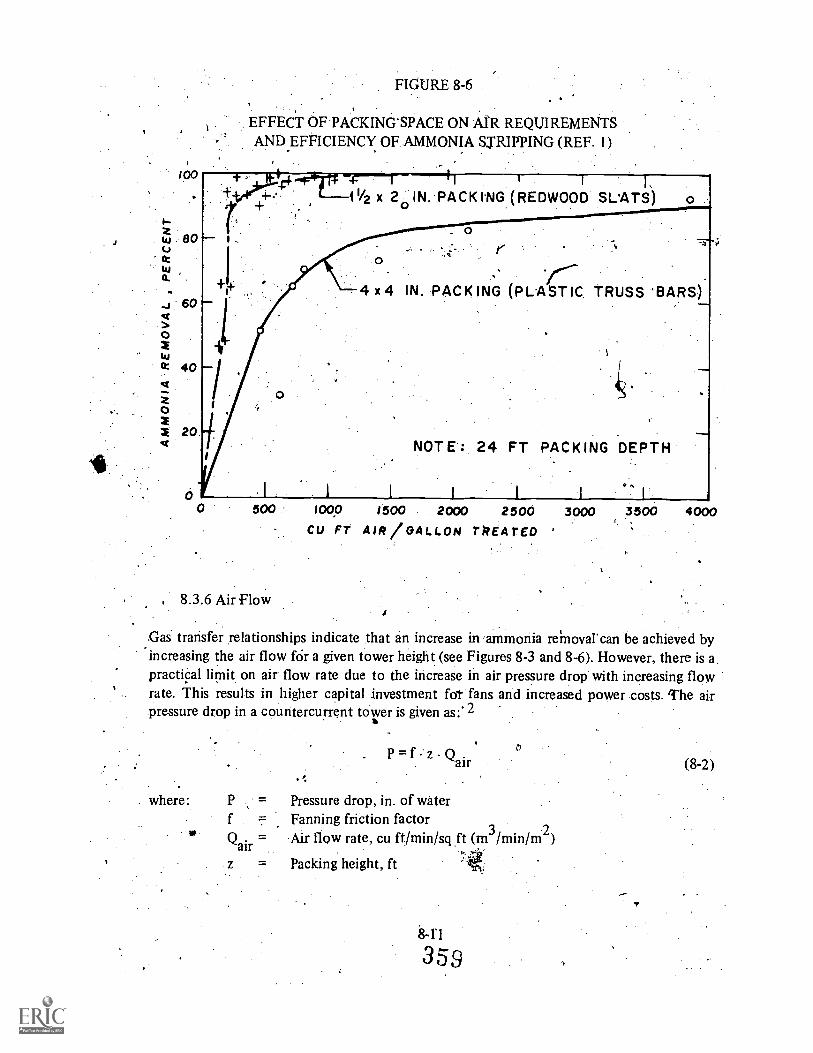
100
tu 80U
tua.
60
0
tucc 40
0XX 20.
FIGURE 8-6.
EFFECT OF PACKING'SPACE ON AIR REQUIREMENTSAND EFFICIENCY OF. AMMONIA STRIPPING (REF. 1)
-CT* 11/2 x 20 IN. PACK l'NG (REDWOOD SLATS)I I,
p--4 x 4 IN. PACKING (PLASTIC TRUSS 'BARS)
NOTE: 24 FT PACKING DEPTH
, 1 I I 1 I I I
500 100.0 1500 2000 2500 3000 3500CU FT AIR /GALLON TREATED '
8.3.6 Air FlowI
4000
Gas transfer relationships indicate that an increase in ammonia removal can be achieved byincreasing the air flow fOr a given tower height (see Figures 8-3 and 8-6). However, there is a.practical limit on air flow rate due to the increase in air pressure drop with increasing flowrate. This results in higher capital investment fot fans and increased power costs. The airpressure drop in a countercurrent tower is given as:* 2
where: P
fvt
Qairz = Packing height, ft
P f z Qair
Pressure drop, in. of waterFanning friction factorAir flow rate, cu ft/min/sq .ft
841
359
0
m3/min/m2)
(8-2)

Pressure drop increases, exponentially With ,air flow rate. In general, air velocities of 550 cuft/min/sq ft (1600 '.m3/min/m2) are considered to tit. the practical' upper limit forcountercurrent towers. The friction factor should be obtained from the packing manufac-turer. General guides for wood grids' are available in reference 3.
4
Figure 8 -3 reflects the effects of the ratio of air to wastewater as observed at the Blue Plainspilot plant. These data are in general agreement with similar pilot data collected at SouthLake Tahoe (Figure 8-6). For warm weather conditions, typical air requirements are about300 cu ft/gal (2240 m3/m3) for 90 percent removal and 500 cu ft/gal 3740 m3/m3 for 95percent removal. In cold weather conditions, the air requirements to achieve maximumtower efficiency increase, substantially.4Vull-scale data at Tahoe indicate that, for theirpacking design, air flows of about 80(2 cu ft/gal (5980 m3/m3) would be needed to achieve90 percent removal at an air temperature of 4 C. fiowever, reliance solely on the strippirigprocess in cold weather conditions is usually not practical, and most designs, are based onmoderate to warm weather conditions. Typical air design quantities for 90 percent removalare as follows: Orange County, California 400 cf/gal (2990 m3/m3); South Lake tahoe390 cf/gal (2920 m3/m3); Pretoria, South Africa 338 cfl/gal (2530 m3/113)
The required air quantities areusually provided by a fan located on top of the tower. Twospeed fan motors may be used to better match air supplied to the actual requirements.Because of the low pressure drops associated with the types of packings typically used (lessthan 1 inch or 2.5 cm water), the horsepower requireinents for the fans are not great forthese large quantities of air. For the 15 mgd (0.65 m3/sec) Orange County plant, the totalinstalled fan brake horsepower is 1380 HP.
8.3.7 Scale Control
A factor which may have an adverse effect' on tower 'efficiency is scaling of the towerpacking resulting from deposition of calcium carbonate from the unstable, high pH waterflowing through the tower. Scaling potential can be minimized by maximizing the extent ofcompletioniof the calcium carbonate reaction in the lime treatment step. Using .a-high level
.of: solids grelcycle in the clarification step will ensure more complete reaction. Anotherapprok h ritbOimitiate CO2 from thC'air (see Section 8.4).
, t ,
. .,.
The original drossflow tower at the South Lake Tahoe plant has suffered a severe scalingproblem, The severity of the scaling problem was not anticipated from the pilot studies in`'which a 'countercurrent tower was used: Asa result, the full -scale cross -flow tower packingWas not designed with access for scale removal in mind. Thus, portion's of the tower packingare inaccessible for cleaning. Those, portions which Were accessible were headily' 'Cleaned byhigh pressure hosing. .4 ,
i..:The severity of the scaling problem hos varied widely. Perhaps the Most severe case is thatreported at tli, Blue Plains pilot plant. 9 When operating at a pH of 11.5, a heavy "scale of'
8-i 2 :3 6
calcium carbonate formed on the crossflow tower packing,(polypropylene grids). The scalewas crystalline, hard, and could not be removed by a high pressure water hose. In, contrast,.several rnmilis.,,4,:of operation of the countercurrent pilot tower at Orange County at pHvalues abdife 11 resulted in only a thin coat of calcium carbonate scale on the 0.5in.(I.3.cm) diameter PVC. pipe packing. The thin coat ofscale stabilized and di pt continue toacetimulate. The scale was friable and easily renr3ved by water hosing. The Orange County .
pilot tower was later moved to South Tahoe where.several months of operation indicated no'scale buildup. The differences in operation 'between the pilot tower at Tahoe and thefull-scale Tahoe tower were as follows: packing of plastic rather than; wood, packing shaperound rather than rectangular, countercurrent tower rather than parallel. The relativeimportance of these factors in eliminating the scaling noted in the full-scale Tahoe tower. is
. .
Uncertain. The experience with the full-scale (1 mgd) countercurrent tower at Pretoria,South Africa is similar to that at the full-scale Tahoe tower in that the scale formed can bereadily Rushed from the packing by a water jet.12 The feeding of a scale-inhibiting polymerto the tower Mfltlent may also offer a means of scale control and such provisions are beingmade in the Orange ounty
In light of the. as-yet unpred table nature of. factors contributing to scaling of towerpacking, it is prudent to co 'uct pilot tests for 3-6 months on thespecific wastewater
"'involved with the specific tower configuration proposed. The pilot vs.. full-scale experienceat Tahoe and the . independent pilot tests at Orange County indicate that the use of.countercurrent rather than- crossflow towers will reduce scaling problems. Also, accessshould be provided to all of the tower packing for cleaning (see Sec. 9.5.5.2 for a discussionof the Orange County plant).
8.4 Ammonia Recovery or Removal From Off-Gases
As noted 'earlier, the calcium carbonate scaling problem can be minimized or eliminated byremoving carbon dioxide (CO2) from the stripping air. This section describes twoapproaches which accomplish this goal by removing ammonia and CO2, from the off-gtifrom the tower and recycling the air.
8.4.1 Acid Systems
,
An approach, to overcoming the limitations of the stripping ocess is ',currently .beikg,developed.13 It appears that the process overcomes many lirnital (30ops hel stripping
. 1. '% , -', '
, 14? ' . tg ... ,process and has the adyantage of recovery of ammonia as a by.produa;.' Actt.,..y,
PF 1 ' ' 4' 1mf ....: 'The improved process is shown diagramatically on Figure 813..Tli 'proodlgs include.
ammonia stripping unit and an ammonia absorption, unit. Both 91':;iiese 314%, tire'sfrom the outside : air but are connected by appropriate .ductirPg. th'el stripping t-whichinitially is air, is maintained in a 'closed cycle. The striivinVit rerates- In tii'',.saill4manner as is now being or has 'been done in a number of system
,'4. V I 'ivilht the ex'cep ioti, t latille
gas stream is recycled rathe han outside air being used in a sintie Ass; maime`r. ;,, , ' ar; ..1 I l'emi.
4 ,, qi..
tfI r8-13
36..E
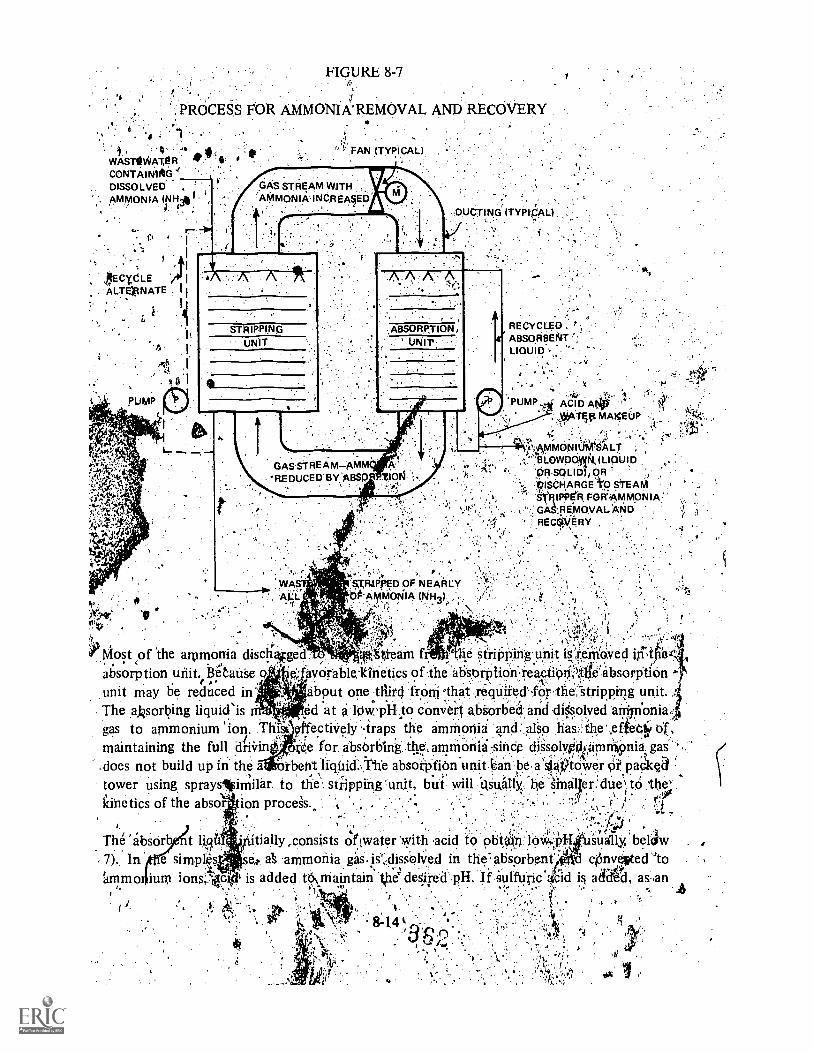
A
FIGURE 8-7
PROCESS FOR AMMONIA' REMOVAL AND RECOVERY
§
FAN (TYPICAL')wAs-rtioa-tpi 1
cowl-mm/10DISSOLVEDAMMONIA (MIA/
r- 741.e
,ttEcyoLEI
ALTE:ANATE .
i
GAS STREAM WITH'AMmciNik Ep.qe
STRIPPINGUNIT
ar
'L/MP ACID ANA..t/ATft MAI1EUP
In.owoofiktuouie. 'On.scii4OLon
.b..1$64,ARGE to STEAMiTIPPeR FOR:sAMMONIA:
' ,.; GA REMOVAINDRECOVERY
.
WA gFiaPi:TD OF NEARLYALL OF-AMMONIA (NH 3I
r* *(i1.i..r.i'64;i;.14f, .. 1'
..P"., ,.. ,k:,4,,.-..Most of the ammonia dischlged:a ,..'t f , , lie stripping unit igtremoved ip.ifiex' .
absorption unit.A.
BetanSe 0 e; avOrable,tinetics of the 'absorption reactiOn,14,tibsorptiOn --, .
unit may be inreduced about onefilircl frOni that ,requited for tbe,-stripping unit.The aksorbing liquid -is ed at low.pli..to convert absorbed and d4sOlvecl arrIn'onia,.gas to ammonium 'ion. Thisr; pffectiVely traps the ammonia and ulSo hasthe',efte4t;,1:4,maintaining the full driVin ' te,e for absOrbIng ttle'.aninionisinde diSsolyitVpirtiO nig gas
,
.does not build up in the a ibetit:liqUid:,The absorption unit.an be a'SOtOWer rk.pacic,d :.tower using spraysiiirriilar to the: shipping unit, but will ilsuAIly, he ginalrer:due\ to the-
1
kinetics of the abso tion procas. . . J.., ,:j.i, :. i. i l':.
Th6 sorb t ligti tially ,consists Oftwater 'with acid t6 pi*, low.. i'.1allyftbeljw, 7). In e sinwNs e A ammonia gas.is'AissOlVecl in the absorbent ti Onvelpted'''toammo lulu lons;1'49; ' is added timaintain tie deSiteil pH. If Sulfuric% did is adied, as an
4 , 44.N
! '

example, 'an, ammonium sulfate salt solution is formed. This salt solution 'continues to buildup: in concentration and the ammonia is finally discharged from;the abiOrption device as a
,.7)*
liquid oil sphd (precipitate) blowdqwn of the absorbent. With shortages or ammonia basedfertiliZeri;.a 'saleable byproduct may result. Ammonia sulfate concentrations of 50 percent'are obtainable.
d
: Mist eliminators are necessary between the absorber and stripper to prevent carryover of the.
a ia.laden moisture from the absorber to the stripper effluent. Because of the headloss
'rmist eliminators and absorber packing, tetal headloss for the air apPrOaches 2 inches
(5.1 cm): It is believed that the .usual scaling problem associated with ammonia strippingwers be reduced by the improved process, since the carbon dioxide which normally
reacts with the calcium and hydroxide ions in the water to forth the calcium carbonate scaleis eliminated from the stripping air during the first few passes. The freezing problem iseliminated due to the exclusion of nearlY.all outside air. The treatment system will normallyoperate at the temperature of.the wastewater.
s.
As discussed in Chapter 7, this approach is being used for stripping of ammonia fromselective ion exchange process regenerant. Because of the higher power`requirernents (ascompared 'to single-pass stripping), the use of this process may be limited tosegeneration ofthe brines from. the seleOtive ion exchange process. Full-scale designs of this application areUnderway for a 22.5 mgd (1.0 m3/sec) plant serving the Upper Occoquan Sewage Authority,Virginia' and for a 6 mgd (0.26 in3/sec) 'plant tor the'ClahOe-Truckee Sanitation Agency,California. Design criteria for this application are presented frilec. 9.5.4.1. which describesthe Upper Occoquan plant.
;8.4.2 Nitrification-Denitrification
1 Another approach to achieving many of the same objectives ot"the acid system described3-* aboye is 'also being .developed,14 The system,- termed the Ammonia Eliminkion System
(AES), is.shown in Figure 8-8. Basic elements of th-&-proc.ess are, as folloWs:
Ammonia Stripping Tower. Ammonia is transferied in this tower from,fie liquidstream to the gas stream at high pH.
Ammonia Absorption-Oxidation ToWer. Ammonia is transferred from the gasstream to the liquid stream at about pH 8. Amrnonia,is oxidized to nitrate by-nitrifying Ncteria in this tower.. The following reaction' summarizes the reactionsin this tower:
NH3
+ HCO3
+ 202 NO3
+ H2CO
3+ H2O (8-3)
Denitrifying Reactor. Nitrate is reduced to nitrogen gas in this reactor (methanolor a waste carbon source is added to the reactor) as shown by the reaction:
5
363
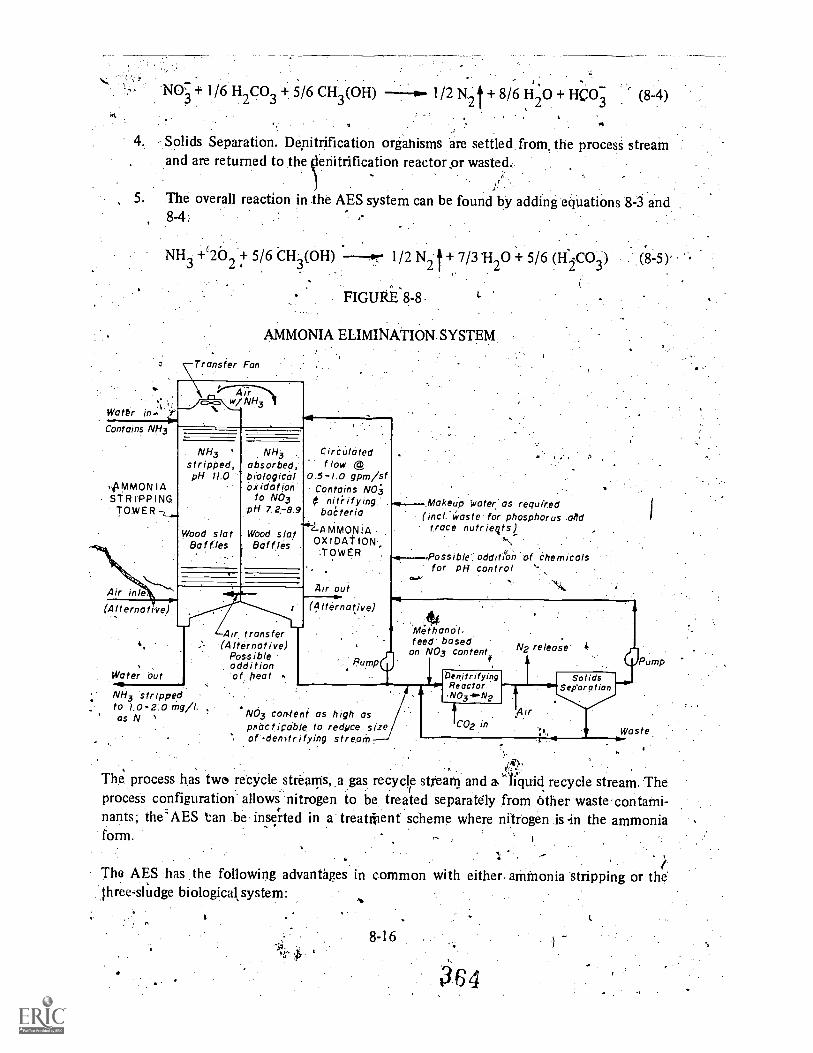
.
4. Solids Separation. Depitrification orgahisms are settled from the process streamand are returned to the enitrification reactor or wasted,
.. ,.
5. The overall reaction in the AES system can be found by adding equations 8-3 and8-4:
NH3 +`2O2 + 5/6 CH
Watt,. interContains NH3---\-
Transfer Fan
OH) 1 /2 N2 t + 7/31-120 + 5/6 (HCO3) . (8-5)'
FIGURE'S-8
AMMONIA ELIMINATION. SYSTEM
Air___/,=NH3 1
MMON IASTRIPPING.
TOWER
Air inle(Alternative",
Water out
NH3stripped,pH 11.0
Wood slatBaffles
NH3 Circulatedabsorbed,' f low gbiological 0.5-1.0 gpm/sfaiidat ion Contains NO3
to NO3 $ nitrifying.' .., .Makeup Water as requiredpH 7.2, -8.9 baCteria (incl.Waste for phosphorus .ald."62-A MMONIA trace nutrieqts)
Wood slatOXIDAT tON I,...,.
Baf (les.TOWER ..,,,
_ Possible'..odditi'On of chemicalsfor PH control
NH3 strippedto 1.0-2.0 Mg/1, ,as N
Air transfer(Alternative)
Possibleadditionof heat
Air out
(Alternative)
Pump.
NO3 con-fent as high aspfibetiCable to red4ice sizeof den)tr ifying stream.
:114Methanol,feed basedon NOg content
DenitrifyingReactor.,NO3-0Ne
ICO2 in
N2 release'
Solids;'Sep'aration
!Air. Waste
The process has two recycle strearris, a gas recycle stteam and a liquid recycle stream. Theprocess configuration' allows nitrogen to be treated separaIdly from Other waste'containi-nants; the' AES tan be inserted in a treatitient scheme where nitrogen is -in the ammoniaform.
.
The AES has .the following advantages in common with either. an-in-Ionia 'stripping or the1hree,sludge biological, system:
8-16
364

Removal of nitrogen from the main flow stream by a physical process (which has .
advantages over biologiCal systems in terms of.ease of process control).
2.. Isolaticin of the nitn on stage from most agents in the plant influent whichare toxic to nitrifyin ganisms.
!.
Isolation of the'ammonium oxidation stage from the carbon oxidation or removalstage.
4: -Nitrogen, is eliminated frOm the system as inoffensive nitrogen gas.
In addition to the above advantages, t'he' AES has the following potential alvan ies notshared by either ammonia stripping Or the three sludge system:
The InsulatiOn and heating of the liquid recycle strea dation column,denitrification reactor, and clarifier(s) to increase. Proc efficiency becomes,economically feasible.
A wastecarbon source may be used in place of methanol,'since denitrification is-accomplished on a side stream.
The AES shares the following advantages of the acid system described. in Sec. 8.4.1:
1. `Free ammonia gasis not discharged to the atmosphere.
2. Water vapor is not dischargett.tO the atmosphere, in large volumes.
3. The heating of air to prevent tower freezing and increase process efficiencybecomes economically feasible due-to gas recycle.
Gas recycle reduces scaling problems in the stripping tower as recycle gas will bevery much lower in CO2 content than atmospheric air.
From Equati n 8-4, it can be seen that there is no net requirement for acid, as in the acidsystem desc ed in Section 8.4.1.
8.5 S tri ppin g' Pon ds
The .South Tahoe. system has b,een modified to reduce the impact of temperature and scalinglimitation* encountered at ine plant.,15 Basically, the modified process consists of threesteps (See Figure 8-9): (1) holding in high PR, suilacF agitated ponds, (2) stripping hj amodified, crossflow forced draft tower through water sprays installed in the tower, and (3)breakpoint chlorination (see Sec. 9.5.5.1 for pilot plant results). This system wasinspired byobservations in Israel of ammonia nitrogen losses fivin:ltligh pH holding ponds.16 '

'.! AIR SPRAYING OF RECYCLED POND WATER- IN SECOND PONOTwO.
IN THE SECOND OF TWO PONDS RECYCLE PUMPS .
34 nvIAPACITY4Y, TO I3Y, RECYCLES
CLARIFIEO LIME.TREATEO WASTEWATER. 444.
pH. 11.0
TWO HIGH pH PONOS IN SERIES7T0 10 HOURS OE TENT ION TIME r ,OUT pH .10.8
FLOW, VARIES, 2.5 107.5 mud
Nevi High pH F low Equalization, Ponds:
AIR FLDW
EXISTING CROSS FLOW AMMONIASTRIPPING TOWER
NEN'WATER,SPRAYS
NISI ELIMINATOR'
WATER IN
41WATER OUT
p 1 0 0 .
RECYCLE WATER
Stripping Tower Modified with New Sprays
CO,,OR CI;
41.11,. ,. EXISTING ?STAGERE CARBONATION
BASIN
pH 7.0 pH TO
TO FILTERS AND .!
CARBON COLUMN
4
AMMIRI amNEW. BREAKPOINT EXISTING VAG
CHLORINATION BALLAST PONDCHAMBER FOR CHLORINE CONrACT.
Breakpoint Chloffn'ation
,/ .8-18
366

Pilot tests at South Tahoe indicated that the release of arrnriania front' high pli'Ponds couldbe accelerated by agitation of the pond surface. In the Modified Tahoe system, the high pHeffluent from the lime clarification process flows to hOlding ponds. Holding pond detentiontimes of-7-18 hours are used in the modified South Tahoe plant. The pond contents areagitated and 'recycled 4-13 times by primping, the -pond contents through vertical spray,nozzles into the air above thetonds. The holding pond detention time and number ofrecycles vary with plant flow With the time and cycles &Creasing as plant flow increases. AtleaSt 37 percent' ammonia removal In the ponds is anticipated, even in cold weatherconditions..The pond contents are they sprayed into the forced draft tower. The packinghas been removed from the toter and the entire area of the tower is equipped with watersprays. At least 42 pertent removal of the ammonia in the pond effluent is anticipated,based on pilot tests, ,froin this added spray in cold weather that includes recycling of the!fond effluent through the tower to achieve. 2-5 spraying cycles. The ammonia eCaping thisprocess is removed by downstream breakpoint chlorination. It appears that stripping pondsoffer an approach that takes advantage of the low cost and simplicity of the strippingproces§ for removal of the bulk of the ,nitrogen,, making breakpoint chlorination moreattractive for complete removal of ammonia....
8:6 Considerations in ProceSs Selection
One of the great advantages!A of air stripping is its extreme simplicity. Water is merelypumped to' the top of the tower at a high pH, air is drawn through-the fill,: and the ammoniais stripped from the water drOlilets. The only control required is the proper pH in theinfluent war r. This simplicity of opetatiOn enhancei the reliability of the process:'-Theprocess cos4 are also significantly less than any alternates_Method of nitrogen removal;assuming that the needed pH elefation occurs in conjunction with upstream phosphorusremoval:
The .major engineering limita0P4 on implication of the process result from its sensitivity totemperature variations and from #01ntial:scale accumulation on the tower paCking: Thefirst of. these limitations is that ol:e44,0rature as discussed in .Section 8.3.3. Animoniaremovals de,Crease as air-, and .i,attilterli0+atures deCrease. ,dough increased air flows canOffget ternperature effects to some d4ree, it is not Practical to, supply enough air tb offsetmajor ternperature drops.. It has not been pracfical to operate striAing towers at ambient airterriperattres..below 0 C. Of course, this is not limnmitiititorf in climates Where freezing
. temperatures do not occur or for plants where nitrogen rtntival iS not required during coldor freeiing weather., (Section 8.4) of the arrunonia stripping.process are beingdeveloped, which May eliminate temperature limitations. .6!
For applications in cold weather where a high degree of nitrogen removal is required, thestripping process itself will generally not be adequate. It is usually not, practical to heat thelarge quantities of air required fOr the'stripping process unless oneis so fortunate as to have alarge source of waste heat in proximity to the stripping tower (see Seffion 9:5.5.2 for adescription of theuse of waste heat froM a desaltingsplant to heat stripping tower air while
providing needed Fooling of.desalting plant water and wastes). The use of. .strippingprocess supplemented as needed in cold weather. by breakpoint chlOrination is a processcombination that may be attractive'in some cases where efficient cold weather: operation isne,,eded and cold wather,Conditions do not pekist for prolohged portions:of the year.'
A potentially serious.problem is the formation and accumulation of calcittrn oarbbnate scaleon, the tower packing. Designs should anticipate this prOblem and provide for easy-access for-cleaning the packing as has been donein the Orange CoUnty tower (Sec. 9.5.5.2). It appearsthat scaling is not as severein a countercurrent tower as in a crossflow tower and' that scaledoes not adhere as tightly to the srnboth, hard-surface of plastic paCking as it does to therough, soft wood surface; The more ope'n "Criss-cross" type of packing developed at OrangeCounty may also be more resistant scale "accumulation than the Parallel packingarrangement used at Tahoe. ExperiericVo date indicates that if adequate provisions aremade in the desie of stripping towers fot'access to packing, in many cases scale removalcan be accomplished by water ,sprays without the use of chemicals or mechaniCal means.However, this is.' 'a factor that deierves special consideration and investigatiOn at eachlocation, since the scaling charaCteristics of different wastewaters may differ markedly. Inlight of the as-yet unpredictable nature of causes contributing to scaling of ,tower paseking, it.would be prudent to conduct pilot tests for 3-6 months on the specific wastewater involvddwith the specific' tower configuration Proposed:
8.7 References. .
1. ' Slechta, A. F., and L. Culp: Water Reclamation Studies at the South Tahoe Public''' Utility Digtr,it; JWPCF, 39, No.5, pp 787-814 (1967). .
42. Roeslen J. R and R.:G. Eilers, Mathematical Simulation Of Ammonia
Stripping Towers for 'Wastewater Treatment. U.S. Department of Interior FWPCA;Cjicir)liati, Ohio, Januacy-?1970..';
Roesler, R0J "., and Eilets, Simulation of Ammonia Stripping rnFrO1 "Wastewd ter. JSED; Proc: P:SCE, 97, 47o.SA. 3, pp 269 -286 (1971).
.4.
. .4. Perry, J.H., qemical Engineering qatebolc. McGraw Hill. Book Co:; N6Nv Yotic, NY., ,
5: 'Miner, S., Pr li fainary.Air Allution:SrurPgy of Ammonia. U.S. Public Health Service,'Contragt No PI-01:68-25, Octob0196% ,.
:6: Compounds in" tag fnKironment. EPA Report'iSAB-73-001 December, .
1973. 4.
, .... ...
trnosplrcric
8. Culp, R.L., and G.L. Culp, Advil{New York, 1971.
Nostrand
Co., Ltd., Lontion, 1962.
Ji,
Wastewater Treatment. Van Nostrand ReinhOld,
8:2d-

T.P., bishOp, .D. F., 'and-'-A.F. Cassel, .Nitrogen Remo Pat by Ammonia,Stripping. EPA Repor(670/2-73-040; September, 19;73.',
10. .SoUth Tahoe Public ;Utility Distrkt, Advanced Wastewater Treatment as Practiced at,Sbtith Tahoe: 'EPA Report 17,010ELQ.08/71,August,1 971. 1:
11: Wesner, G.M., and D.G.: Argo, Report on Pilot WaSte Water%Reclamatiott Study OTangeCounty Water District Reliort;-Jul.si,.1973: I
'12. van VUUren, personal May 5.0, 1972:
13. KepPle, L G.,.,Ainmonia Removal and Rei:i)very Becomes Feasible. Water 4nd SewaeWorks, .p. ,
'14: Brown and CaldWell; :A.pplicatin for, a Researek Contract for the AmmaviaElimination System ..SubrrAitt:eci to the2bffice .of.ResearC:h and Development, .WaterQuality Offit;e, EPA, MarCh, 1971.
15. :Gonzales, J , and R.L. Culp. New LievelopMents ii2,ArnmdniaAtiipping.,Publie Works,1.04, No 5,.p, 78. (1973) and.N6. 6,, p 82 (1973): 0,.
71 1
Lj16. .Folkman, y., and' A.M. Vachs, Nitrogen Removal Through Ammonia Release FromPonL PrOceedings,; 6tit AnnUal Intteindtional Water Polltitione:Research CeinforencoiTel ,wilt, Israel; June 1.8-23, 1972 :
physical7ckemical Techniques for Nitroget novat Prepared, for the EPATehnOlogy Transfei program,, July, 1974.
CHAPTER
TOTAL SYSTEM DESIGN
Introduction
-° ttr.With a defined set of effluent qu bjectives, the environmental engineer must develop a`cost-effective treatment system that is suited to the local situation. A variety of nitrogenremoval options are presentechin this manual that may form a 11 of the total treatmentsysit.in. No one combination of processes is universally applicable:
=The' main ,thrust of this chapter,is to present specific examples of treatment systems thatlidyg", been selected and implenlented. Design concepts that have evolved' to suit localcirefunstances are emphasized. ,
9.2 Influence Of Effluent Quality Objectives on Total System Design
The effluent, quality obtainable from a treatment system has the most significant impact onits selection or rejection. When only ammonia removal (or conversion). is required, asopposed to total, nitrogen removal, cost considerations would dictate selection- ofnitrification over any other Method of ammonia removal in most cases. Exceptions wouldbe low temperature ( < 5 C) situations or where ,toxiCants. which cannot be effectively:removed by .a source control program are present in the wastewatep Other possibleexceptions are cases wherein influent nitrogen levels are so low that they can beeconomically removed by breakpoint chlorination and where the carbon to nitrogen ratio issuch that all the nitrogen can be assimilated into biomass during biological oxidation oforganics..
.
In Section 2.5.5. the effectiveness of each type of process in removing the various nitrogejspecies was summarized. 9-2 and 9 -3 contain representative nitrogen data forfinal, effluents frOrn systems incorporating nitrification-denitrification, ion exchange, andbreakpoint chlorination. Ammonia stripping has notkeen included, since it Usually must bebacked up by breakpoint chlorination to achieve consistently low effluent nitrogen levels.These systems are Cap-able of producing average effluent nitrogen levels,of 2.0 to 3.0 mg/I,'whether the nitrogen removing processes are biological or physical chemical in nature.
Each nitrogen removal system should be assessedfrojnf.',the standpoint of its reliability inmeeting effluent objectives. Factors resulting in the failure. Of a system to achieve nitrogen
'.removal objectives are as follOws: .4
Toxicity upsets
Overloading
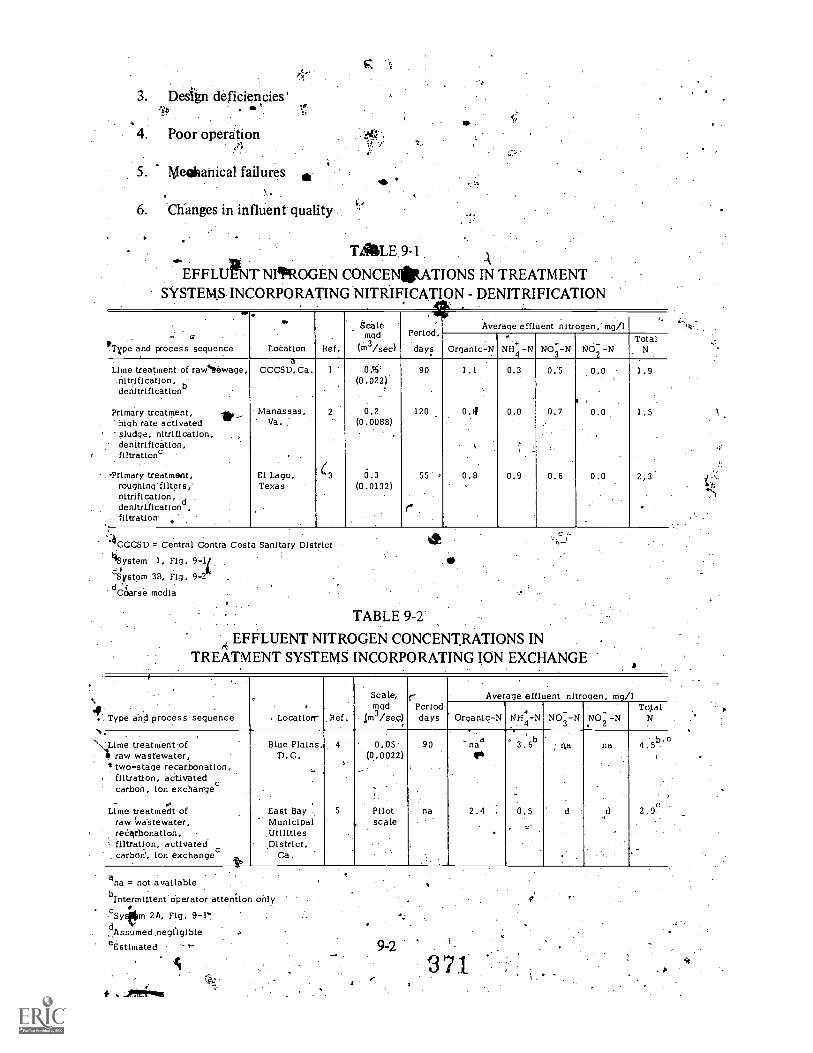
3. Design deficiencies'
4. Poor operation
5. Meekanical failures
6. Changes in influent quality
TALE 9-1
EFFLUPNT NITROGEN CONCEARATIONS IN TREATMENTSYSTEMS. INCORPORATING NITRIFICATION - DENITRIFICATION
aIPType and process sequence
..
Location Ref.
8calamgd
, . ,(m3 /sec)sec/
. 411ip
Period,
days
Average effluent nitrogen, mg/1
Organic-N NH4
-N NO3 -N NO2 -NTotal
N
Lime treatment of rawNewage,nitrification,denitrlficatlon
Primary treatment, _ii,high rate activated wsludge, nitrification,denitrification,filtrationc
Primary treatment,roughing filters,nitrification,denitrificationd,filtration
aCCCSD,Ca.
Manassas,Va.
El Lago,Texas
1
.
2
0.5'(0.022)
7
0.2(0.0088)
'
0.3(0.0132)
90
120
55 ,
1.1
0.4
0.8
0.3
0.0
0.9
0.5
0.7
0.6
0.0
0.0
0.0
.
1.9
1.5
2.3.
4CCCSD = Central Contra Costa Sanitary District
biSystem 1, Fig. 9-1i.cSystem 3B, Fig. 9-2
Coarse media
TABLE 9-2
EFFLUENT NITROGEN CONCENTRATIONS INTREATMENT SYSTEMS INCORPORATING ION EXCHANGE
,
Type and process sequence . Location- Ref.
Scale,mgd
im 3/sec)
rPerioddays
.
Average effluent nitrogen, mg/1
Organic-N +NH4 -N NO3 --N
_NO
2-N
TotalN
.
'Lime treatment.ofI raw wastewater,11 two-stage recarbonation,
filtration, activated.
carbon, ion exchange c
.Lime treatment of
kraw wastewater,recarbonation,filtration, activatedcarbon', ion exchanges
il,,
Blue Plains,D.C.
.
.
East BayMunicipalUtilitiesDistrict,
Ca.
,
5
.
. 0.05(0.0022)
Pilotscale
90
na
"naaeh
2.4 .
.6b
..
0.5
: qa
d ,
na
d
4.5b.4,
e2.9
Ana = not availablebIntermittent eperator attention only
cSy#m 2A, Fig. 9-1` .
dAssumed negfigible r
eEstimated ."
tr ...4,Lormes
9-2
. tr.,\'

TABLE 9-3/4'
EFFLUENT NITROGEN CONCENTRATIONS IN. TREATMENTSY*MSINCORPORATING BREAKPOINT CHLORINATION
,
Type and process sequence Location
.
Ref.
Scalemgd
(m3/sec)Peri-od,days
'...
Average effluent nitrogen, mg/1 .'. ,,,'I4,1
Organic-N 1111.4-N-
NO3-N NO-2 -N,' '1,;;51
il,*.;'Lime treatment ofraw wastewater,
.two-stage recarbonatlon,filtration,. breakpointchlorirkation, activatedcarbon"
Lime treatment ofraw wastewater,filtration, activatedcarbon, breakpoint chlorin-,atlon, and dechlorinationby activated cerbonb
Primary treatment,oxidation ponds,
.algae removal byalum-flotation,filtration, breakpointchlorination
Blue Plains,D.C.
."Same,digitalcontrol
Owosso,Michigan
Sunnyvale,Ca.
.
*
4
6
7
8
0.05(0.0022)
0.05(0.0022)
0.02(0.0009)
.
0.01(0.0004)
120
9.
11
2
naa.
na.
0.58.
.
2.6
na
na..,
1.42
.0.2
.
na
na
c
0.4
'
na
na
c'
0.0
1,1.6 .,,,., .
2.0
3.2
) - -
ana = not available from public tionSystem 2A, Figure 9-1
cAssUmed to be negligibledEstirilated ;
Toxicity upsets affect only biological nitrogen removal processes. A degree of protectionagainst toxicity upset can be pr&ided for the nitrification-denitrification system byproviding pretreatment processes as described in Section 4.5.3. Several case histories arepresented in this manual which show a very high stability for the biological processes, due inpart to pretreatment. There are classes of toxicants, such as nonbiodegradable solvents,which are not effectively removed by pretreatment. Reliability under this circumstance isdependent on source control. Under some 'circumstance, the reliability of the sourcecontrol program may be not effective enough 16 allow qepentlable nitrificatiofi.
The other factors listed affect both physical-chemical and ological systems to varyingdegrees. Overloading can be defined as operation whic exceeds design conditions.Obviously both physical-chemical and biological proves can be expected to Joseeffectiveness when overloaded.
Theoretically sound processes can fail to meet objectives due to design deficie.ncies,- mechanical breakdown or poor operation.. This is true for bothlhysical-chemical procegses
).and biological processes.
Some of 'the nitrogen removal systems are more sensitive to the sform of nitrogen in theE:tinfluent than others. Generally, the physical-chemical' processewre geared to a specific
(t.
9-3
372

chemical form of nitgen; for instance,' urea cannot be removed by air stripping or ,
breakpoint chlorination. Biological systems hav(the inherent capability to transform .amultitude of nitrogenous compounds to ammonia for subsequent conversion to nitrate,' aform suitable for denitrification. Thus, if changes in the distribution of influent nitrogencompounds occur with time, .the biological processes may be more able to adapt totreatment of the new compounds than the physical-chemical processes. ,
In sum, the issue of relative reliability of the various-approaches is, mixed, and it cannot beclaimed that some specific approach has d clear advantage over the others for generalapplication. When stringent regulations require enhanced reliability, it is relatively simple toprovide breakpoint chlorination for effluent polishing. Since breakpoint chlorination has noeffect on nitrate or nitrite, it cannot make up for deficiencies in the denitrification process.However., in the nitrification-denitrification system, it is' the nitrification step that is. mostsusceptible to upset, and the breakpoint process provides full backup for it.
9.3 Other Considerations in Process Selection
'Costs of the alternative nitrogen removal systems, are specific to each situation andtime-frame and generalizations about the alternatives are difficult to make. Long-run .operating costs are of interest, but the long-term prices of chemicals 'and enctrgyparticularly difficult to estimate. !A"' -
%Total dissolved solids (TDSI in the process effluent is sometimes a consideration. )biologicalnitrification-denitrification results in little change in TDS, whereas both ion exchange Idbreaik-pOint chlorination result in an increase in TDS.
Low 'liquid temperatures ( < 10 C).: often favor physical-chemical systems because thetankage :reqiiirements kr biological nitrification-denitrification become very ldarge. Biologi-cal nitrification-denitrification. becomes less cost-effective below 5 O.
Receiving water standards or effluent requirements may dictate intermittent nitrogenremoval. requirement may favor breakpoint chlorination. An example is the nitrogenremoval facility for the Sacramento Regional 'heatment Plant, described in Section 9.5.3.1.In this case, breakpoint chlorination was chosen because its relatively low capital costavoided the higher cw(ed costs of the other alternatives.
9.4 Intel-relationships with Phosphorus Removal
Phosphorus removal is the subject. of. another 'publication of the EPA Office of TechnologyTransfer.9 However,. experience Indicates 'that the majority of 'treatment plants beingdesigned for nitrogen removal also have a tquirernent for phosphorus removal. As these tworequire. ments have very differeQt influences on treatment plant .design, some consideration.needs to be, given to how nitrogen and phipsphorus removal are interreldted inAreatmentsystem design.
.03
9.4.1 Alternative gskins
Figures 9-1 and 9-2 are summaries of the five general approaches currently being considered,oor implemented for cases where high' degrees of phosphorus and nitrogen removal are
reqUired. There .are few exceptions to the listing; one exception concerns nitrogen removalfkim oxidation pond effluent, but these approaches tend to be very case specific and are
"sdifficult to generalize.
. - .
fl§4.11 owzdiagranis in Figures 9-1 and 9-2 are capable of achieving low effluent le'vels of nitrogen,and phosphorus. These levels are taken as averaging 2-3 mg/I of total nitrogen and 0.1 to 0.3mg/1 of total phosphorus. Multipoint chemical addition and tilt-ration are shown to achievelow phospi/orus levelV in the final effluent If lesser degrees of pho.sphorus removal arerequired, then some of these steps may be eliminated. Also, in eacitcase, it,is assumed thateffluent kOlis objective is on the order of 10-15 mg/l. If further organic ,reduction isrequired,Tupplemental treatment is also required. Figures 9-1 'and 9-2 also show variations
.44within the five flowsheets where substitute processes are possible. The flowsheets are general'process arrangement; for example, a block showing denitrificatiod could mean either anattached growth process or a suspended growth process with a sedimentation tank.
System No. 1 is an integrated chemical-biological system using lime or other metal salt inthe primary treatment stage to reduce phosphorus and organic loads followed bynitrification and denitrification stages 'And filtration., By moving. lime treatment. to theprimary treatment stage, as opposed to tertiary applications, several advantages are gained.First, moving lime treatment to the primary stage causes enough organic reduction in theprimary. tanks to eliminate the need for a separate carbon removal step.'Second, lime dosecan be adjusted to elevate the pH in the nitrification step to the Optimum range fornitrification as well as to compensate for any alkalinity depletion due to nitrification.Lastly, protection for the.nitrifiers against most toxic heavy metals is prgvided.
Systems 2A aOci 2B are the independent physical-chemical treatment sequences incorporat-ing- physical-chemical nitrogen removal. A coagulant such as lime; or a metal salt and
- polymer, is used in the primary step for organics and phosphorus reduction. Activifedcarbon is provided for further organics reduction.' In System 2A, either breakpointchlorination Or-ion exchange is usual for nitrogen removal: In System 2B, ammonia strippingis used for nitrogen removal. Filtration is placed ahead of carbon adsorption in both
:Va'riations "of System 2; however, it -may be placed after carbon adsorption in certaininstances. For considerations in arrangement. of the adsorption component of .physical-.chemical systems, the, reader is referred to the Process Design Manual for CarbonAdsorp(iop, a publication of the EPA Office of Technology Transfer.10
Another, approach to integration of biological and physical-chemical treatment is provided,by Systems 3A and 3B: System 3A takes advantage of the favorable effect' of alkalinitydepletion in nitrificatign on reducing lime dose in thd chemical ,precipitatibn step as limedose is directly affected by alkalinity) 1,12 System 34 shows a slightly different way of
rs
9 -5
3 4

'FIGOR09-1
SS, SEQUENCING FOR SYSTEMS YIELDING COMBINED''AND PHC4P4710.RUS RENwig..=sYstEms
ADDIT(O.N :TO PRIM.4.7iNtbIMENTATION.
(GREENED 17"
wkp.TEWAtE,R
and or',METAL OALT
AIR STR
,
FINAL EFFVUBN;t0
SYSTEM 1
INTEGRATEDCHEMICAL-BIOLOGIC
'TREATMENT
EkAMPLESA CONTRA COOAli.4 CANBERRA
EXAMPLE7F FWSEMONT-
9-6
375

411'S 11' :111.01
ALTERNATIVE PROCESS'SEQUENCING tOR-SYSTEMSNITROGEN AND RPSPHORUS RVOYALT SYSTWylpi;,COAGULANT ADDITION AFTERIPRPIARY TREAD05_ fk,
CREEN DEGRITT1' RAW fiA (WATER
2 111.
'f,PRIMARYSEOIMENTATION4
V 14
. LAME t 'and /orbIWALSill?
ILCIAMICAL
PREeIPITAT
COMBINED CARBONQXIDATION.NITRIFICA-TIOARENITIRIFICATIOR
Mar -btcombi
stiP ' dad/or
METAL. SALT
M T IfiNOL
,t1ra !I
DENTRIFICATON
GRVAICALPREC4PriATION
METHANCOV fArlikNOLFel OESIDUAL
r pORATIa
`Vt.,
METALSALT
(ALTE1WATE,)%,.
CO2(WITHLIME EFFLUENT)
METAL SALT, `
FILTRATION
F I LTftATIONF ILI ROION
SO2 FOR
DECHLORINATION IFBREAKPOINT EFFLUENT
DISINFECTION(IF KO BREAKPOINT)
02ea; 4, for Dechlorination
aysitv 3p
INTEGRA(1443fIRAL - E. ICAL
''.SYSTEM' 4I
%
EXAAIRLES:r LAt gt
J
COMONE0 'SYSTEM.
WITH: TERTIARYPHOSPHORUS AND
RESIDUAL NITRATE'REMOVAL " 1
C.41
LI A hiP LES; 'NONE
FIallkEFFLUENT FINAL EFFLUENT
SYST'EM' 5A . SYSTEM' 58
BIOLOGICAL TREATMENT.kITH TERTIARY PHOSPHOROUS ANDPHYSICAL - CHEMICAL 'NITROGEN REMOVAL
.
EXAMPLES; SOUTH LAKE TAHOEORANGE COUNTY
,MONTGOMERY COUNTY''UPPER OCCOOUAN

accomplishing the s e objective. In this case metal salt is added to treatment units such asthe carbon oxidatio. step and the filtration step, avoiding the need for the separateprecipitation step of System 3A.
System 4 uses a combined carbon oxidation-nittification-denitrification, sequence. Theorganic carbon in the primary effluent serves as the carbon source for the removal of thebulk of the nitrogen in the influent wastewater. This effluent is polished, with a tertiary.,phosphorus removal step. Residual nitrates are removed in the wastewater: filter. System 4ha o er operating costs than System 1 or 3 because of the elimination of the bulk of themethanol costs incurred in the.latter systems. On the other hand, the phosphorus removal.step must he placed after the biological treatment step in System 4 for two reasons. First,precipitation of phosphorbs in the primary step would reduce the organics in the primaryeffluent to the point where denitrification could not be .supported. Second, metal saltaddition to the biological step would add so many solids as to render unmanageable thesimultaneous operation of carbon oxidation, nitrification and denitrificatiOn.
System 5 was the first system implemented in the, U.S. and was -used at South Lake Tahoe.(in the System 5A configuration). It consists of conventional biological treatment followedby tertiary steps° for phosphorus removal and physical-chemical nitrogen removal. System5A employs air stripping with polishing by breakpoint chlorination while System5B Useseither breakpoint chlorinatibn or ion exchange for nitrogen removal.
.
In conjunction with the system descriptions in Figures 9-1 ang 9-2 are listed the caseexamples presented in this chapter which generally fit the system description. In most casesthe xamples do not precisely follow the system description beaause local requirements haiedi ated lesser:or greater degrees of treatment. However, the cit. se examples are close enougho be fitted into system categories.
9.4.2 Considerations in System Selection
Each of the systems outlined in Section .9.4:1 has its inherent advantages and disadvantagesthat need to be considered by the treatment plant designer in each individual situation.Some of these considerations are described in this section.V
*9.4.2.1 Phosphorus Removals Obtainable 41,
Perhaps because of the long experience accumulated with Vstem 5A (Figure 92) atnSouthLake Tahoe and the more recent development of alternativgsystems, System 5A or 5B werethought to have had a detided advantage in terms of low phosphorus residual over any ofthe integrated systems (System 1-, 3A and 3B). It has been suggested that the integratedsystem, even with proper coagulant dosage, is limited to reduction of effluent phosphoruslevels to'0.5 mg/1 totbphosphorus and that when lower pho'sphonis levels are required,Sistem 5A or 5i3 should he employed. l
9-8
377

In actuality, the degree of phosphorus removal is not primarily affected by the tsyStemselected but by the pattern of chemical addition, the nature and doses of the chemicals usedand 'the sophistication of process 'control. Regardless of the system selected, low effluentphosphorus levels are made posiittii:ilijY multiple phosphorus removal steps; this may beachieved by multipoint chemical addition or chemical addition in conjunction with otherphosphOrus removal methods such as tertiary filtration. .
An example 'is provided by the well documented operation 'of the South Lake Tahoeplant.13 .A flowsheet for the plant as it ex iste.d in 1970' is presented in Figure 9-3.Multipoint chemical addition was practiced with lithe treatment of the secondary effhientplus alum treatment at the tertiary filtration step. .Phosphorus removal resulted at both these
-steps. In, addition, phosphorus uptake occurred in the activated sludge step and possiblYsome removal occurred in the carbon adsorption step.. The lime treatment alone reduces thephosphorus level to about 0.6 mg /l entering the filtration step., Ji..bout 30 percent phosPhorusremoval occurred in the filter without alum addition. With alum .addition, the effluentphoiphorus leVel was reduced to 0.1 mg/1 in a special one month test.13 The phosphorusresiduals for a one year period averaged 0.17 mg /l in the plant effluent as shown in Table 9-4.Alum dosage reqUired to boost phosphorus removals by the filters from 361't'O 90 percent wasOnly 10 mg/1.1 3
From the Tahoe example it can be seen that the key to obtaining a low phosphorus residualis multiple removal steps. Multiple phosphorus removal steps have been included in all of thetreatment systems portrayed in Figures 9-1 and 9-2. For instance, the option of metal saltaddition to tertiary filters is available to all of the systems, not just System 5A or 5B andcomparable performance can be expected in each application. System performance is given
Win Tee 9-4 o? alL systems except System 4. Favorable example's were chosenkor each casein T e 9-4 and other cases for each system could be found with higher effluent
orus values. These. examples are illustrative of what good design, operation, andntrol can produce.
4,, At,. .
-9.41,k2 Impacts on Shidge Hantlling
In Systems 3A, 4, 5A and 5B, Figure 9 -2): chemical precipitaW.,..can be kept separate fromorganic sludges.. In Systems 1,-2A, 2B and 3B, (Figures 9 -1 4042) chwical sludges arecombined with organic sludges. Separation of sludges alloWs -the plant 4igners moreoptions in sludge handling. For instance, chemical sludges Can be subjected to coagulantrecovery operations while processing of organic sludges can proceed without the hindering:effects of the inert chemical sludges.
It has also been suggested that tertiary phosphorus removal (Systern 5A or 5B) may have an °
advantage in that lime recovery can pg. practiced.12 However; System 1, -2, 3A and 4 allpossess an advantage in common with 5A' or 5a;_namely, the ability to recover lime if it isthe chosen coagulant.

MAJOR PIPES,'
OF TREATMOIT'
PROVIDED,'
FIGURE 9!3
1.
RE,MATJULOW DIAGRAM - SOUTH LAKE TAHOE, CALIFORNIA PLANT (1970)
PR4RY. SE'CONDARYCHEMICAL TTREAtMENT TREATMENT
AN(SOLIDS (BIOLOGICAL
PHOSPHATE R
SEPARATION) ,,TROTMEN,T)
WASTE VCR:
FLOW'
THROUGH
PLANT
j,
'PFttilEiMEAND OTVISION
BAIIIHNUTORS I FLOW DIVISION 601
A
PRIMARY
CLARIFIER
IC71
PLANT INFLUENT
. POKE RAINS
SPLIDS
'HANDLING
LIME AND
CARBON
RECLAMOION
pRIMARt
SLUDGE PUMPS
OLD DIGESTERS'
EMERGENCY.
PRIMARY SLUDGE
STORAGE
SLUDGE
THICKENER..BIOLOGICAL '
SLUDGE PUmP
CENTRIFUGE- .0
AERATION
182111
I. I
NITROGEN ,' FILTRATION' ACTIVATED I . . I
CARBON ,DISINFECTION.:
REMOVALI
ADSORPTION
'I if I60kIG EmERGENCY
AI 1 VOIDING POND'
1 . I #-,CARBON
I I. COLUMNS
FILTERS
RECAP BOW ION
IMMO VI
FLOCCULATION
SECONDARY I RAPID
CLARIFIERS MIX
CHEMICAL
CLARIFIER
moNIA
STRIPPING
TOWER
I
REACTION
BASIN
ACTIVATED
SLUDGE
RETURN'
SLUDGE
RE-
CARBONATION
BASIN
SECONDARY FINAL
OALLAST I BALLAST.
POND eje
TERTiiRY
PUMP
STATION
LIME SLUDGE
S47C.01 "4PUMPS
\(DARY
SLUDGE PUMPS
SLUM FLOWDIVISION 10X
WASTE ACTIVATED'
SLUDGE
BIOLOGICALI ..
SLUDGE
'FIANCE
/ LIME SWAGE
ILINE MUD'
THICKENER
LIME SLUDGE
PUMPS
LIME.
RECALCIN NO
.FURNACE,
RECALCINED LIME
TO 11E-USE
I
4
BACKWASH
WATER
DECANTING
TANN
STERILE ASH
TO DISPOSAL
3790'
[ARGON
ISLURRY PuMPS
CARBON
(*WATERING
TANKS'
:
CARBON
FURNACE
CHLORINE 'RETURN TO
APPLICATION I SECONDARY BALLAST
POND AT PLANT
44#
I mG
;URGE
TASK
RECLAIMED
WATER TO
INDIAN
CREEK
pESERVOIA
LUNA PASSFINAL BOLSTER PUMP
EFFLUENT STATION
PUMP
STATION.
CARBON
O'SLURRY
PUMPS
I
REGENERATED ,
CARBON TO ;
RE-USE
CARBON
DEFINING
TANKS
r-

TABLE '9-4o
EFFLUENT PHOSPHOROUS CONCENTRATION FROM
ALTERNATIVE SYSTEMS.
Type and process sequence
,
.
.
Location Ref,.
.
Scale,'mgd
(m3/sec)
Period,
days,
Average effluent
,
phosphorup,
mel 1
Average effluent
total suspendedsolids, mg/1Total P PO4 -P,
System 1
CCCSD, Ca,a
, .
.
: Blue Plains,D ;C.,
Manassas, .
+1a.
:.
,
4 -
,.
4South Lake 13
, I ,
Tahoe, Ca.i
19
.
. . :
2
.
,.
.
.
0.5 to(0.022)'
.
.
0.05
(0.0022)
.
0.02
{0 . 0009)
2.4 .
(0.11)
. . 10b
.,
4'80
J.',r
.
,
120
. .
365.iii.-
0
...
.
.
.
,
,
,
1
0.84; 0.01
.
3.0
4.0
0
0
'
, .
,..,,
.
Lime (With recalcination and
recycle), nitrification,denitrificationi without 'filtration ,
. ,,,
System 2A
. .
0.14 '.
.
,
I
0,3.. .
0.17vl
na
tna
114.
i
na
V
Lime with iron in second.
settling tank, filtration,.
ion exchange cr break- .
point, filtration.
System 3B ,
,
,.
.
Carbon oxidation- .
nitrification-denitrificatign ,
filtration'With alum additionto carbon, oxidation and
derfitification '
System 5Pp
Carbon oxidation,:,lime,.
ammonia stripping)
recaibonation, filtrationwith alum addition, carbon
adsorption.
.
aCCCSD = Central Contra Costa SanitaryDistrict
bAugUst 1 to 10 1973A
c1970; representative year, the plant has been operational since 1968.
,
0
L380
9.4.2.3 Reliability
Factors affecting the reliability of nitrogen removal processes have already beerrdescribed inSection 9.2. Most of these same factors affect phosphorus removal and will not be repeatedhere.
The longest record of reliable 'experience in Obtaining low phosphorus roiduals is at the .
South Lake Tahoe Plant, operational since 1968 (Table 9-4):...Low values have also beenobtained consistently:for long periods with, phyil&al-Cheinical systems (System 2A). In thelatter casd, iron has been uSeki in a seconkstage settler after lime treatment andrecarboriation, achieving further,phosphorus removals. Less experience is available withSystems 1, 3A or 3B, but the limited testing to'date indicates Vry low phosphorus residualscan to consistently obtained.
.
9.4.2.4 Flexibility'of Operation in MultipurrioSe Treatment Unitst
The systems portrayed in Fi es 97.1 and 9-2 incorporate varying degrees of integration' ofprocess function into the vario streatment units. Systems 4, 5A and 5B represent extremesin terms of combining functions; in System 5A or 5$ the tendency, is for individual steps toperform a minimum of purposes while in System 4 many furietioftarddrripliShed in
, . - s/parallel4in each step. \
The argutnent can be made that the level of integration in a planreln, affect its.flexibility ofoperation in terms of adjusta ility of the system to meet varying lbads or in terms of r
I !
providing 'redundancy, for possi le process faiJu'res. The, degree of integration possible is best,studied by examinatio of pilot or full-test results. Tliere have'been full-scale tests that haveshown that nothing ha been lost in terms of flexibilitY.,or performance with a degree. Of-,,process integration: E mples are provided t yll(he ManaSsas and CCCSD experienc6(Systems 1 and 3B) described in Section 5.2.4. No orh;-term test results are, available for.System 4, whiclpis unfortunate, si,nce a high degree of ntegration of function is pnovided,inthe combined carbon oxida,tion-nitrification-denitrification 'step.
9.4.2.5 Cost
Cost is an essential. factor in 'process selection. It recognized; that the integratedapproaches hold a potential of cost savings over'dkititSlogical-tertiary approach (System5).1,12,15 The reality of this cost saving will be determined in individtial situations by local ,
factors and must be 'specifically evaluated: in each case by_ssAt-effective analyses of the ,alternative systeais. .
".9.5 Case ExaMples
Fourteen case examples of nitrogen control are pt'kented, each showing how the Various AC.:nitrogen removal systems described in this chapter have 'beet) applied. These include.:* four '
9-12.
examples of .nitrification' for .ammonia reduction, four examples of nitrification-denitrification for nitrogen: removal, and two examples each of breakpoint chlorination, ion
..? , .exchange and air stnpping for nitrogen removal.
-,f).
9.5.1 Case Examples of Nitrification for Ammonia Reduction,
Four examples. of how biological nitrification hias- been implemented are presented in thefollowing discussion. The .4ackson, Michigan, plant design °was oriented to reducing thenitrogenous oxygen demand (NOD) of the plant effluent in the receiving, waters. The deignsof the Valley CommurittY Services District plant aii,d the City of .Livermore's plant*ereoriented to satisfying /the'very low conform requirements set by the State of Califorrlia. Iii
:these cases, ammonia reduetion allowed' fficient disinfection after breakpoint.chlorination.In the. design of another .California 4plin t, operated by the S'aLkablo Sanitary District,nitrification was included so that effluent toxicity requirements could be mei.
Other, case exarnplese. of nitrification were presented previously in Section 4.3.8. Theseincluded the Whittier Narrows Reclamation Plaat in California which is 'oriented to 2groundwater recharge and the Flint, Michigan plant, designed for NOD. removal._
Jack:son, Michigan
Tlif City of ackson operating a '17 mgd (0.74 m3/sec) activated sludge plant that isdesigned to ni ypar-round. Nitrification ise..provided for removal of nitrogenous oxygendemand so,th iecelvinewater, the 'Grand' ver; can be maintained at dissolved, oxygenlevels of abo t 4.0 mg/1., Since ihe implem nt4tion of full nitrification at this plant, thisrequirement has been consistently met in th zone of influence of the plant's discharge.,
Tjtie City of Jackson, Michigan, with n equivalent population of 60,000 has been served bya.conventional activated sludge trea ent plant since 1936.16 Title-current upgrading 4f theplant was completed itt 1973 and resulted in the plant depicted i*Figure 9-4 with the designd to sho 'Nrn in Table 9-5. During this pgrading, the following facilities were added: (11) new.prithary,efiluent pumps, (2) a storrnw ter retention b4iri, (3) siormwater pumps, for.the releotion basin, (4) additions to:th6 aeration tanks (5) additions to the .secondaryisedimentation tanks, (6) new return a tiVated sludge pumpS; (r'%) three new blowers and ablower building for Plp.secchfclaty trp tment- additions, and (8) a new plant' eleetridal and
tvA 41: . . _ .control System. 1.N4 Thiswork waSbid.to December-1 1.970 and totaled $3,2001000 including,legal,'Iengineering arid, Ontingency.cOSte OperatiOn and maintenance costS4or the _entireplant, for fiscal olear:, 103/1914 totaled $464,1 on gallon59 for" 5155 millillons: treated or$88f mil ga1.18
Several featurq have been incorporAte into Plant that," fraVe been stressed in thismanilal. ,First, th#3 activated sludge sYst m is operated in :the conventional or plug flowmannetto- ggiqhighest efficiency of pi cation qervitsthe,colde§t.temperature conditions.(as ioW as C). Coarse bubble aeration is utilized. Another feature .of the plant is the
,
a
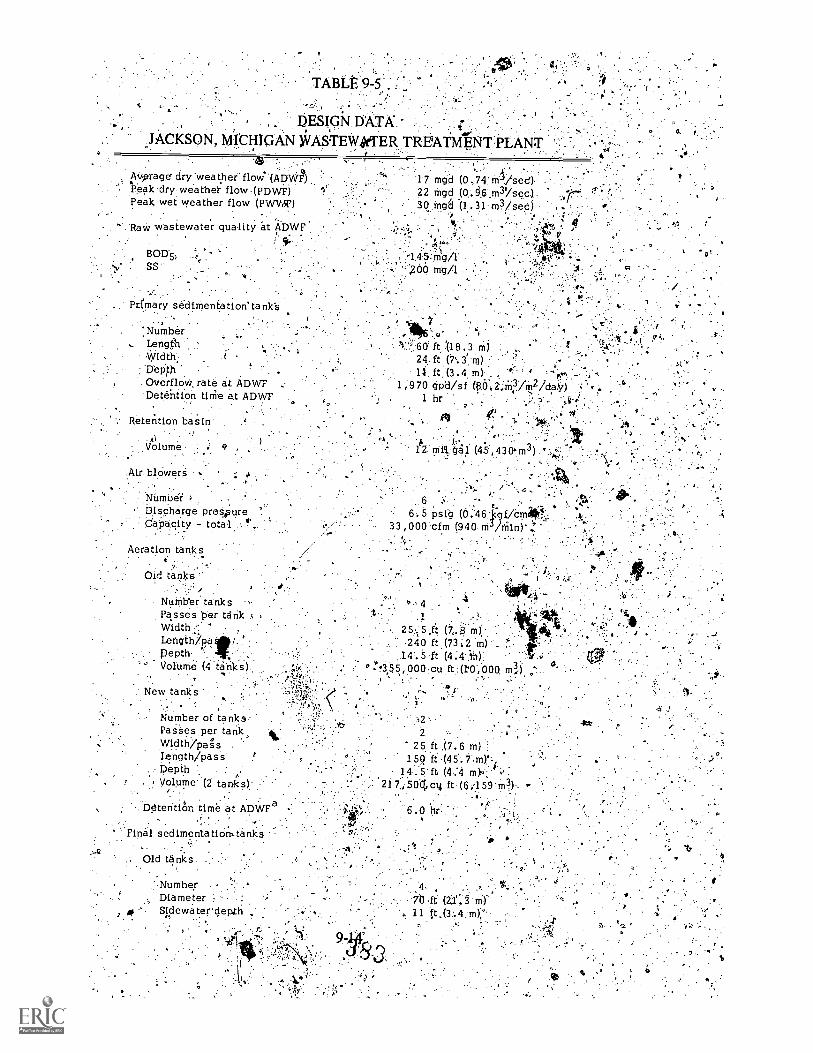
TABLE 9-5'.
DESIGN. DATA.', .JACKSON, MICHIGAN WASTEW.KER TREATMENT PLANT
Avg-rage' dry weather flow° (AMAPeak dry weathei: flow(PDWF)Peak wet weather flow (PWVT)
Raw wastewater quality at ADWF
17 mgd (074:10/sed),22 ingd3(1,ing8 (1.31 m3 /sec),
Ptfinary sedimentation' tank's
NumberLengthWidth.DepP'iOverflow. rate at ADWFDetehtfon time at ADWF
Retention basin
Volume
Air blOwers
NUmudi 4- Discharge prespure
Capacity - total r
Q.
't 60 ft '08.3 mj24. ft (7`.33 n1)
'
1,970 gp'd/sf (60c2iri3 /m2/daW1 hr ;*
.
k.1,'
Aeration tanks
0.1d ta s
NuMb'er tanksPasses Per tank ,
Width .'. 'Length/pitDepth.. '...VoIume (4 'tnk's)
New tanks...Number of tanks-PasSes per tank,Width/Pa'S'sLength/passDepthVolume (2 taril:s)
m)240 ft (73 m)
14.5 ft (4.4 in)"!3.55,000 cu ft (T0,000 m3,.
DOtentiOn time at ADWFa
Final sedimentation, tanks
Old tanks.
2
25 ft ,(7.6 m)15Q ft (45'.7.m)'-i
14.5 ft (9: ),,4 m, v`-21 7,,501ct ft (6,459m3) "
6.0 hr
'.NumberDiameter :Sidewa ter' depth
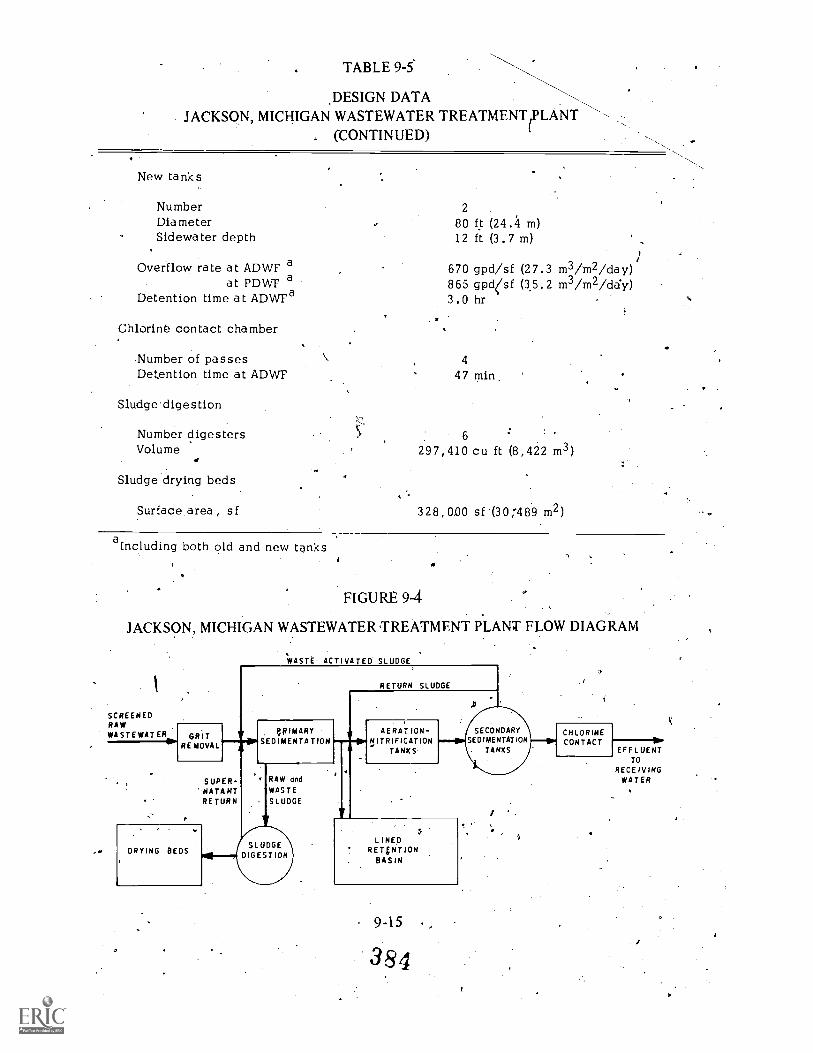
TABLE 9-5
DESIGN DATAJACKSON, MICHIGAN WASTEWATER TREATMENT
(PLANT(CONTINUED)
New tanks
NumberDiameterSidewa ter depth
Overflow rate at ADWF aat PDWF a
Detention time at ADWFa
Chlorine contact chamber
Number of passesDetention time at ADWF
Sludgedigestion
Number digestersVolume
Sludge drying beds
Surface area, sf
2
80 ft (24.1 m)12 ft (3.7 m)
670 gpd/sf (27.3 m3/m2/day)865 gpdsf (35.2 m3/m2/da'y)3.0 hr
4
47 min,
6
297,410 cu ft (8,422 m3)
328,000 sf (30:489 m2)
a Including both old and new tanks
FIGURE 9-4
JACKSON, MICHIGAN WASTEWATER TREATMENT PLANT FLOW DIAGRAM
SCREENEDRAWWASTEWATER
WASTE ACTIVATED SLUDGE
ION
RETURN SLUDGE
.1)
SECONDARYSED IMENTATGRIT
REMOVAL
PRIMARYSEDIMENTATION
AERATION -NITRIFICATION
TANKS
CHLORINECONTACT
EFFLUENTTO
RECEIVINGWATERSUPER-
'NATANTRETURN
RAW and
WASTE
SLUDGE
LINED. 4.
DRYING BEDSSLUDGE
DIGEST IONRETVILION
BASIN
9-15 ,
384
X

primary effluent ret on basin. Rather than designing the secondary facilities for the fullwet weather .flows; fl above about 22 mgd are pumped to the retention basin. This flow,is brought -back by gravity to the secondary facilities when storm flows subside. It is alsoanticipated thal the retention basin will serve as flow equalization storage during dryweather, once plant flows reach design capacity. This will be done to prevent itimmoniableedthrough during peak flow 5eriods.18
The retention basin is lined, but has no provision. f* mixing. Actual operation indicates verYsatisfactory performance without odor developMent during storage. Except for completelydraining the basin, cleaning is limited to once Or year.18
Performance of the plant has been exceptionally stable and was previously summarized inSection 4.3.8.3. It should be noted, that the plant iq not yet being operated at its deiignflow.
tr
9.5.1:2 Valley Community.Service. District, California
The. Valley, Community Services District ( SD) Wastewater Treatment Plant atCalitbrnia, is treating an average daily flo of 3.7 mgd (0.16 m3/sec) from a largelyresidential service area. The original plant, consisting of raw wastewater screening, gritremoval, primary sedimentation, activated sludge aeration, secondary sedimentation:digestion and sludge lagooning, was construe ed in 1960 for approximately $1.5 million In1972, an additional primary sedimentation to k and appurtenances, an additioI
nal secondaryclarifier, a digester, dual media filters, and lor4nation and dechlorination facilities were'constructed for about $3 million. These fa ilities raised the average dry weather flowcapacity of the plant to 4 mgd (0.17 m3/sec) The design data for the plan are shown inTable, 9-6.1, 9
fip
Waste discharge requirements mandate effluen r filtration, as the State of Cali rnia requiresthat any effluent' that may be used, for water co tact sports bust be coagulate and filtered.Requirements also dictated that'tice median co iform content must not excee an MPN of2.2 per 100 ml. This plant incgrporates nitrifi Lion for ammonia reductidn so that residualammonia can be, economically breakpointed. Tit's allows'disinfection to proceed with a freechlorine residual so that the stringent bacteriological requirements may be met.
A flow diagram of the existing facilities (Fig. 9-5) shows a ho mg basin .which isttoutinelyused for flow equalization after primary treatment, Figure -6 is a photo of theliTildingbasin. The holding basin is asphalt-lined and is equipped wit a sprinkler system for washingout, accumulated solids when the basin is drained.-The sprinkler systr4was adined by plantstaff and was found to be very effective for odo control. The basin is emptied daily. 'Apeak-to-average flow ratio of 3.4:1 is equalized the .holding basin to maintain stablebiological treatment conditions. It was foundeprior to the 1972 additions to the plant thatoperation.. without flow equalization resulted in ammonia .bleedthrough and eventualcomplete loss of nitrifying capability. The aeratjon ark is generally operated with the first
9-16
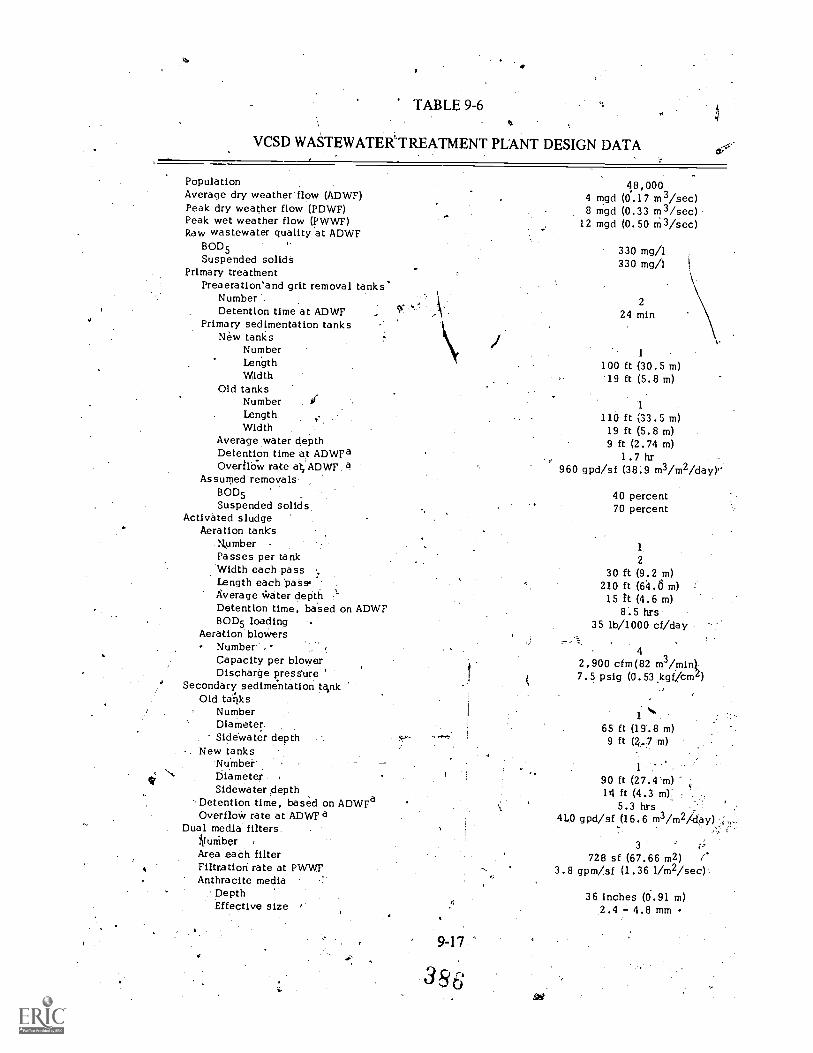
TABLE 9-6
VCSD WASTEWATEWTREATMENT PLANT DESIGN DATA
PopulationAverage dry weather flow (ADWF)Peak dry weather flow (PDWF)Peak wet weather flow (PWWF)Raw wastewater quality at ADWF
BOD5Suspended solids
Primary treatinentPreaerationsand grit removal tanks'
NumberDetention time at ADWF
Primary sedimentation tanksNew tanks
NumberLengthWidth
Old tanksNumberLength !-
WidthAverage water depthDetention time at ADWFaOvertIOW rate A ADWF.
Assumed removals.BOD5Suspended solids
Activated sludgeAeration tanks
NumberPasses per tankWidth each pass'Length each Pats,Average Water depthDetention time, based on ADWFBOD5 loading
Aeration' blowersNumber. .°Capacity per blowerDischarge pressure '
Secondary sedimentation tasnkOld talks
NumberDiameter. .
Sidewater depth. New tanks
NumberDiameterSidewater depth
-.Detention time, based on ADWFaOverfloW rate at ADWFa
Dual media filters.
Area each filterFiltration rate at PWWFAnthracite media
DepthEffective size
9-17
366
48,0004 mgd (0.17 m3/sec)8 mgd (0.33 m 3/sec)
12 mgd (0.50 m3 /sec)
1
100 ft (30.5 m)19 ft (5.8 m)
1
110 ft (33.5 m)19 ft (5.8 m)9 ft (2.74 m)
1.7 hr960 gpd/sf (38.9 m3/m2/day)
40 percent70 percent
1
2
30 ft (9.2 m)210 ft (64.6 m)15 It (4.6 m)
8.5 hrs35 lb/1000 cf/day
4
2,900 cfm(82 m3/minL7.5 psig (0. 53 .kgficmh)
1
65 ft (19.8 m)9 ft (2..7 m)
90 ft (27.4 m)14 ft (4.3 m)
5.3 hrs4L0 gpd/sf (16.6 m3/m2/-0Y
3 ;-728 sf (67.66 m2) ('
3.8 gpm/sf (1.36 1/m2/sec)
36 inches (0.91 m)2.4 - 4.8 mm
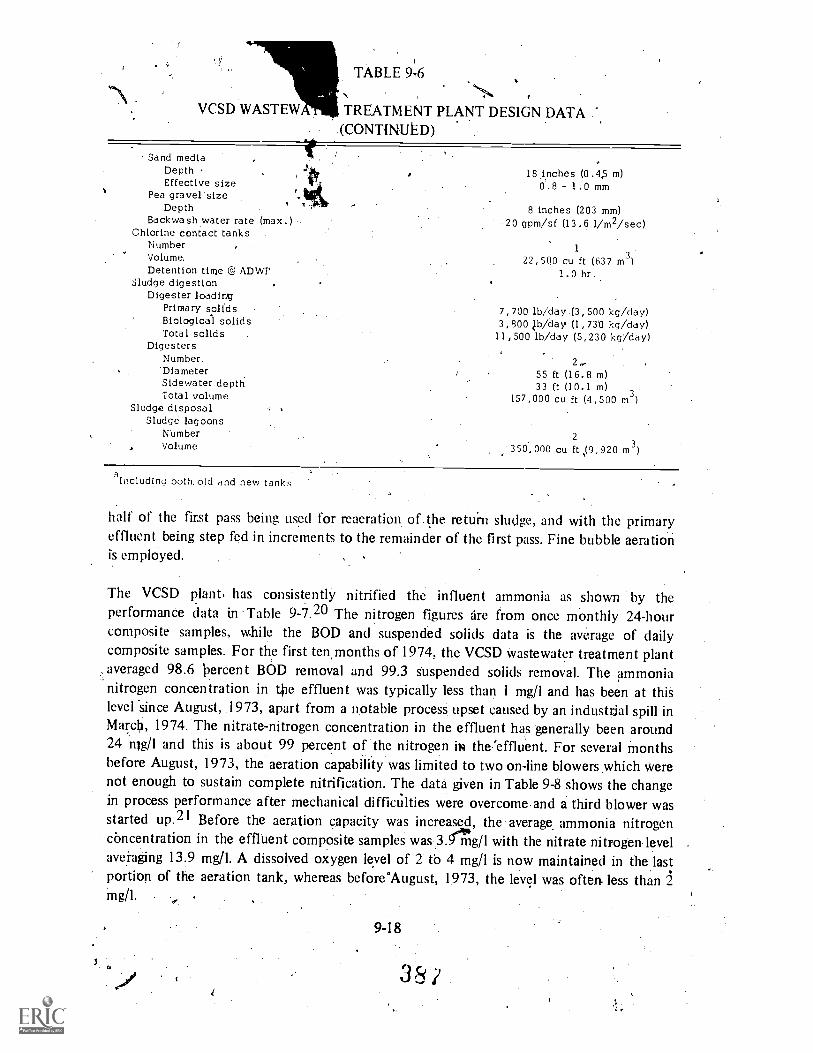
VCSD WASTEW
TABLE 9-6
TREATMENT PLANT DESIGN DATA(CONTINIA,D)
Sa'nd mediaDepthEffective size
Pea gravel sizeDepth
Backwash water rate (max.)Chlorine contact tanks
NumberVolume.Detention time @ ADWF
Sludge digestionDigester loading
Primary solidsBiological solids.
Total solidsDigesters
Number.'DiameterSidewater depthTotal volume
Sludge disposalSludge lagoons
NumberVolume
1,17. 18 inches (0.4.5 m)0.8 1.0 mm
8 inches (203 mm)20 gpm/sf (13.6 1/m2/sec)
1
22,500 cu ft (637 m3)1.0 hr
7,700 lb/day (3,500 kg/day)3,800 ib/day (1,730 kg/day)11,500 lb/day (5,230 kg/day)
2.55 ft (16.8 m)33 ft (10.1 m)
157,000 cu ft (4,500 m3)
2
350,000 cu ft ,(9,920 m3)
alncludtncboth. old and new tanks
half of the first pass being used for reaeration of.the return sludge, and with the primaryeffluent being step fed in increments to the remainder of the first pass. Fine bubble aerationis employed.
The VCSD plant, has consistently nitrified the influent ammonia as shown by theperformance data in Table 9-7.20 The nitrogen figures are from once monthly 24-hourcomposite samples, while the BOD and suspended solids data is the average of dailycomposite samples. For the first temonths of 1974, the VCSD wastewater treatment plantaveraged 98.6 'percent BOD removal and 99.3 suspended solids removal. The ammonianitrogen concentration in tie effluent was typically less than 1 mg/1 and has been at thislevel since August, 1973, apart from a notable process upset caused by an industrial spill inMarch, 1974. The nitrate-nitrogen concentration in the effluent has generally been around24 mg/l and this is about 99 percent of .the nitrogen na the 'effluent. For several monthsbefore August, 1973, the aeration capability was limited to two on-line blowers which werenot enough to sustain complete nitrification. The data given in Table 9-8 shows the changein process performance after mechanical difficulties were overcome and a third blower wasstarted up.2I Before the aeration capacity was increased, the average ammonia nitrogenconcentration in the effluent composite samples was 3.911g/1 with the nitrate nitrogen levelaveraging 13.9 mg/l. A dissolved oxygen level of 2 to 4 mg/1 is now maintained in the lastportion of the aeration tank, whereas beforeAugust, 1973, the level was often- less thanmg/I.
9-18
3 S?

FIGURE 9-5
VALLEY COMMUNITY SERVICES DISTRICT (CALIF.)WASTEWATER TREATMENT PLANT FLOW DIAGRAM
SLUDGELAGOON
SLUDGEANAEROBICDIGESTIO
RAWAND
WASTESLUDGE
PREAERATIONAND GRIT REMOVAL 7
f
RAWIIPP
WASTE WATER
SCREENS
SECONDARYSEDIMENTATION
TANKS:
PRIMARYSEDIMENTATION
TANKS
RETURNSLUDGE
EMERGENCYHOLDING
BASIN
f
INFLUENTDIVERSIONSTRUCTURE
MAIN PLANT FLOWDIVERSION FLOW
FLOW
AERATIONTANK
J' WASTE MIXE:JLIQUORTO PRIMARY
EQUALIZATION PUMPS
DECHLORINATION WITH SO2
CHLORINE
7!)CONTACT. TANK
TERTIARYFILTRATION
TO
AL A MO CANAL
9-19
35'8
ALUMAND/ORPOLYMER
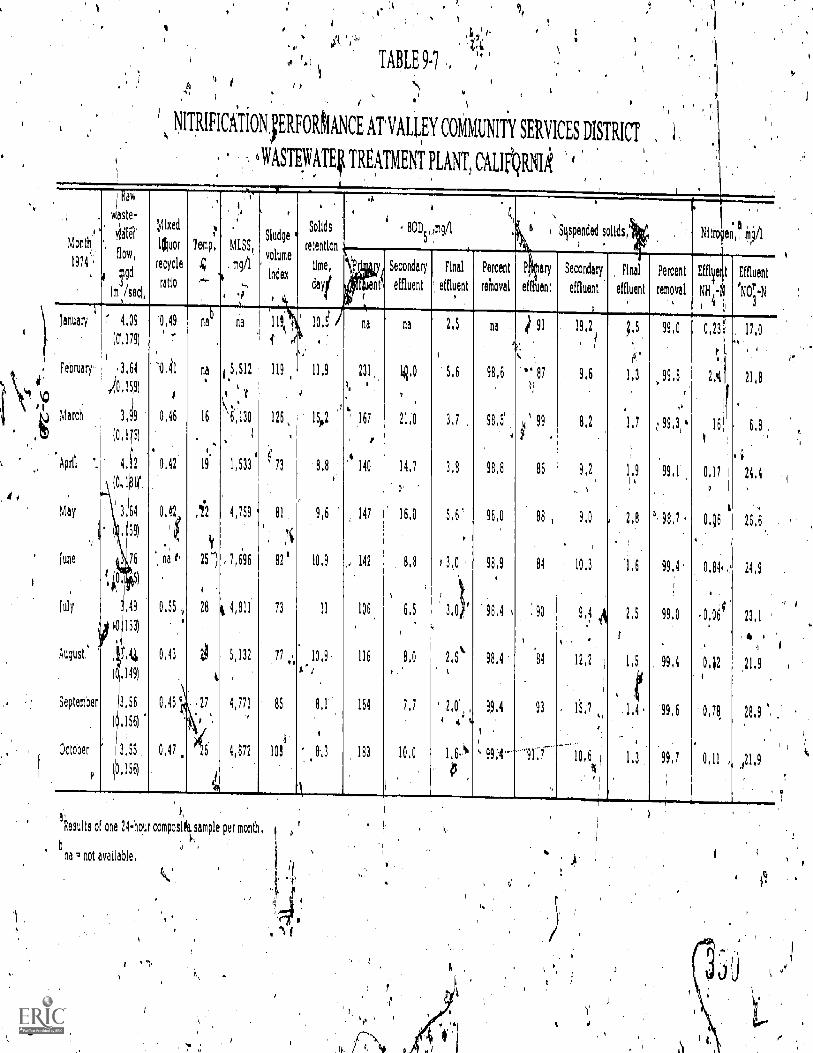
Month'
1974
Raw
waste-
vigflow,
4 itgd
(m /sec),
January 4,09
(0',179)
February.' 3.61
March
' ,11-1 (1,1"5)
.Aprfl . 4,12
May V 3 64
59)
lune 76
[uly ,99
Fa 153)
August
(0.119)
September 3,56
,156)
October 3,55
0.156)
, 71
1 Itt Z.
tA 101 TABLE 9.7 . ;41
NITRIFICATION; ERFOAANCE AT'VALLEY COMMUNITY SERVICES DISTRICT
WASTEWAT4 TREATMENT PLANT, CALIORICh
ixed
ltuor
recycle
ratio
0,19
0,46
0,42
0,42i)
na
0,55
0,13
?Grp,
nab
na
16
4
19
25-1
28
0,45 ' 27
60,47
MLSS,
mg/1
ria
1,533
4,759
,7,696
5,132
1,771
1,872
Sludge
volume
index
re
119
126
f73
81
82'
73
A
85
!Results of one 24-hour composik sample per month.
, bna = not available.
3S9
olids
tendon
.A
I
Ia
, BODs,' mg/I ,
.
a 4-
I Suspended solids,. .-
hNitro en,a mgit
time,
dayi4
`Pm, i
(. ent(
Secondary
effluent
Final
effluent
Percent
removal
P ary
effluent
Secondary
effluent
Final,
effluent
Percent
removal
Effle t
Nil -11
..
Effluent
N'NOr-N'NO3
10.61
11,9
15P
2
8.8
9,6 '
10,9
11
10,9
8,1
. 8-.3
na
231
167
.4 140
147
, 142
106
116
164
183
na
1o3.0
.
21,0
14.7
16,0
13,8
6,5
8,0,
7,7
10,0
1.5
5,6
3.7
3,8
5,6'
,
3.0 ,
3,11
2,5k
' 2,0',4 0,t
1,0
na
')
98,6
98,5'
4
98,8
96,0
98.9
98,4 ,
98,4
99,4
I
'''' 99;4-
,i) 91
~' 87
,;\ 99
86
88 ,
84
:90
84
93
"'91,],,
19,2
,
9,6
8,2
9,2
9,2
10,3
9.1 A
12,2
15,7
41
10.6 I
,
I
;,5
e'1,3
,.
1,7
1,9,
, 2,8
'1.6
2,5
1,5
, t1,4 .
1,3
99,0
99.5
; 99,3,'
99.1
', 98,7
99.4
99,0
99.4
99,6
99,7
,
0,23:
;'2,4
16!
0,17
.
o.q6
0,84,
0.068
0,i2
0,78.
0.11
17,0.,
I
21,8
6,8
. a
24,4
,
26,6.
21,9
23,1
21.9
28,9
,
121,9
(

A,
FIGURE 9-6
HOLDING BASIN AT THE VALLEY COMMUNITY SERVICES
DISTRICT (CALIFORNIA) WASTEWATER TREATMENT PLANT
Aid146. di
gosit,,,,-., _.ailliglirr.- ;..'*..-7.00g47-' ,
NA* ' ,;1'..1$fr 7.1%.41.... t Tot:: .
li1 7 4.
'71' 1.e,r '7 , ., 'SOW 1.7 ..
ji*Iiit': ::: 4 71:'
orw..771
7
TABLE 9-8
4;
IITROGEN ANALYSES ON 24 HOUR COMPOSITE EFFLUENT SAMPLES ATTHE VALLEY COMMUNITY SERVICES DISTRICT TREATMENT PLANT
Datesampled,1973,
Nitrate nitrogenas N, mg/1
Ammonia nitrogenas N, mg/1
Junea 9.9 6.3julya 16.5 '2.0
.August4.7
Septemberb '14.0 0.39.Octoberb ,26.7 <0.06Novemberb 26.0 0.30Deceinberb 27.1r <0.06
Two blowers op' line .
bThree blo,;VctiS on-line.9-21
391
O

The VCSD staff feels that this type of nitrification system is particularly subject to upset ,
due to toxicants in the primary effluent. One recurring loss of nitrifying ability wasultimately trjced to the periodic discharge o\f a solvent), trichlorethylene.22,0nce theindustrial discharger was lOcated and the spills ceased; the problem disappeared.
.
Operation and 'maintenance costs have averaged $350 per/trillion gallons since the 1972additions.'
9.5.1.3 Livermore, California
Since 1967; the City of Livermore has operatell the 5 mgd (0.22 m3/sec) Water ReclamationPlant whose flow diagram is shown in Figure 9-7. Before 1967, the original plant includedprimary treatment, trickling filters; secondary sedimentation, polishing treatment withoxidation ponds and sludge digestion. During the 1967 enlargement, existing stnctures wererearranged in. the flowsheet and additional facilities were added.23 Afterethe enlargement;'the plant consisted of preliminary treatment and primary sedimentation, roughing filters,activated' sludge for nitrification, and chlorination. The existing oxidation ponds wereconverted to.emergency holding basins.;gludge disposal is by digestion with digested sludgebeing applied to sludge lagoons. Drying beds 'are used intermittently.
The plant layout was oriented to meeting discharge requirements mandating an effluent thatcontained no more than: ')..0 mg/1 of BOD5, 20 mg/1 of SS, and a. five-day-median total
Grin of 5 MPNTer 100 ml. The low bacteriological requirements dictated apt the plant
FIGURE 9-7
CITY OF LIVERMORE WATER RECLAMATION PLANT (CALIF.) FLOW DIAGRAM
EMERGENCYHOLDINGBASIN
a,SCREENED PRE-RAW L,AERATiow PRIMARY
WASTE- r 0 GRITSEDIMENTATION
R REMOVAL TANKS
RAWANDWASTESLUDGE
'RECIRCULATION
ROUGHINGTRICKLING
FILTER
1
AERATION -NITRIFICATION
ERATION -N ITRIF IC AT ION
TA NKS
9-22
BREAKPOINTTb
SECONDARY S.EC H LO R INORSEDIMENTAT ION AND
DISINFECTION RECEIVINGO
WATERI ,
RETURN ACT IVAT ED SLUDGE
SLUDGE
I . .
HASTE ACTIVATED
ANAEROBICDIGESTION
FILTRATE OR SUPERNATANT
SLUDGELAGOONSS
SLUDGEDRYING BEDSD S
T
4
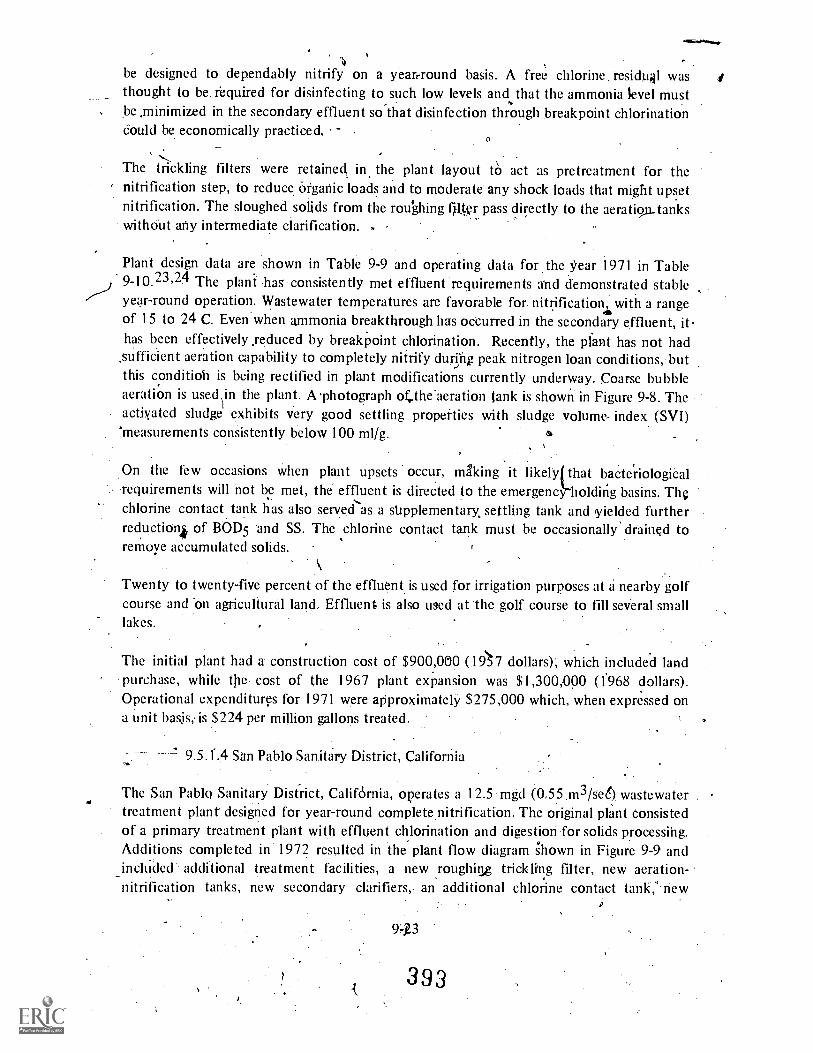
,v1
be designed to dependably nitrify on a yearrround basis. A free chlorine residuR1 wasthought to be required for disinfecting to such low levels and that the ammonia level mustbe ,minimized in the secondary effluent so'that disinfection through breakpoint chlorinationCould be economically practiced,
The trickling filters were retained in the plant layout to act as pretreatment for thenitrification step, to reduce Organic loads and to moderate any shock loads that might upsetnitrification. The sloughed solids from the roughing filter pass directly to the aeration_tankswithOut any intermediate clarification.
Plant design data are shown in Table 9-9 and operating data for the Year 1971 in Table9-10.23,24 The plant has consistently met effluent requirements and demonstrated stableyear-round operation. Wastewater temperatures are favorable for nitrification with a rangeof 15 to 24 C. Even when ammonia breakthrough has occurred in the secondary effluent, ithas been effectively seduced by breakpoint chlorination. Recently, the plant has not had
,sufficient aeration capability to completely nitrify during peak nitrogen loan conditions, butthis conditioli is being rectified in plant modifications currently underway. Coarse bubbleaeration is used
1
in the plant. A .photograph ofethe'aeration tank is shown in Figure 9-8. The.activated sludge exhibits very good settling properties with sludge volume. index (SVI)'measurements consistently below 100 ml/g. 4
On the few occasions when plant upsets occur, making it likely that bacteriologicalrequirements will not be met, the effluent is directed to the emergency' holding basins. Thgchlorine contact tank has also served as a stipplementary, settling tank and yielded furtherreductionk of 130D5 and SS. The chlorine contact tank must be occasionally' drained toremove accumulated solids.
Twenty to twenty-five percent of the effluent is used for irrigation purposes at a nearby golfcourse and On agricultural land, Effluent is also used at the, golf course to fill several smalllakes.
The initial plant had a construction cost of $900,000 (197 dollars); which included landpurchase, while the cost of the 1967 plant expansion was $1,300;000 (1968 dollars).Operational expenditurp for 1971 were approximately $275,000 which, when expressed ona unit basis,.is $224 per million gallons treated.
San Pablo Sanitary District, California
The San Pablo Sanitary District, California, operates a 12.5 mgd (0,55 m3/see) wastewatertreatment plant designed for year-round complete nitrification. The original plant consistedof a primary treatment plant with effluent chlorination and digestion for solids processihg.Additions completed in 1972 resulted in the plant flow diagram shown in Figure 9-9 andincluded additional treatment facilities, a new roughinj trickling filter, new aeration-_
nitrification tanks, new secondary clarifiers, an additional chlorine contact tank,".new
943
393

:TABLE 9-9.
1DESIGN DATA - LIVERMORE WATER RECLAMATION PLANT ,
PopulationAverage dry weather 'f w (ADWF)Peak dry weather flo (PDWF)Peak wet weather fl w (PWWF)Raw wastewater loadings
BOD5Suspended solids
Primary treatmentPreaeration and grit removal tanks
NumberDetention time at ADWF
Primary sedirAentation tanks .
- Numb&LengthWidth .
Average water depthDetention time at ADWFOverflow rate at ADWF
Emergency holding basin'Volume
Roughing filtersNumber
'DiameterDepth of mediaTotal voldme of mediaMedia type,Media size.Recirculation ratio at ADWFBOD5 load
Air blowersNumberDischarge pressureCapacity - total
Aeration-nitrification tankNumberPasses per tankLength/passWidth/passDepthDetention time at ADWFBOD5 load
Secondary sedimentation tankNumberDiameterSidewater depthOverflow rate at ADWF
Chlorine contact tank (Breakpoint chlorination)NumberPases per tankDetention time at ADWF
Anaerobic digestion!lumber ,.VolumeLoading, total solidsVolatile matter, percent
Sludge, isposalDigested sludge lagoons
NuMberTotal volume
Sludge drying bedsNumberTotal area
' 62,5005mgd (0.22 m3/sec)
10 mgd (0.44 m3/sec)18 mgd (0.79 m3/sec)
12,500 lb/day (5,670 kg/day)12,500 lb/day (5,670 kg/day)
j
2
36 min"
2
124 ft (37.8 m)19 ft (540)9 ft (2.7 m),
1.5hr1,050 gpd/sf (42.8 m3/m2/day)
31 mil gal (117,000 m3)
2
110 ft (33.5 rp) )4.25 ft (1.3 m)
80,152 cf (2,270 m3)Rock
2 to 4 lb.3,0 'to 1.0
100 lb BOD5/1,000 cf/day (1.62 kg/m3/day)
3
7.5 psi (0.53 kgf/cm2)6,000 cfm (170 m3 /min)
1
2160 ft (48.830 ft (9.2,m)15 ft (4.6 m)
5.2 hr28 lb BODO ,000 of /day (0.45 kg/m3/day)
1
90 ft (27.4 m)12 ft (3.7 m)
762 gpd/sf (3112 m3 /m2 /day)
1
2
1 hr
2
27,500 cf (779 m3)11,800 lb/day (5,350 kg/day)
75
' 2
320,000 cf (9,060 m3)
22,400 sf (2,080 m2)
9-24
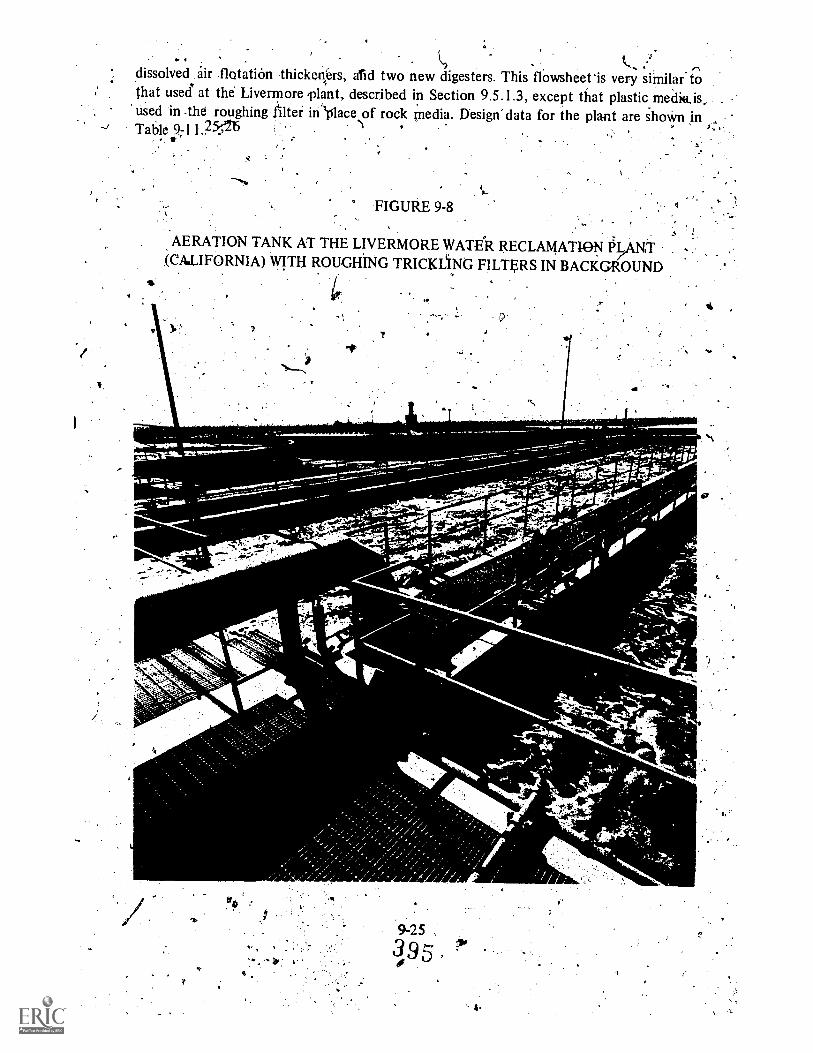
6.
. .
k..., ....dissolved air flotation thicke,Ors, and two new digesters. This flowsheet is very similar tothat used at the Livermore plant, described in Section 9.5.1.3, except that plastic mecliais.used in -the roughing Iilter in 'place of rock Media. Design' data for the plant are shown in
1 . . . :,.Table 9711.2415:
FIGURE 9-8
AERATION TANK AT THE LIVERMORE WATER RECLAMATION P NT(CALIFORNIA) WITH ROUGHING TRICKLING FILTERS IN BACK OUND
7
-
elrAis';
.7
9
9-25 ,
395 ,

dissolved air flotation thiclthat used at the Livermoreused in -the roughing filterTable 9.1 I .5::;7215
AERATION TANK A(CAZIFORNIA) WITH
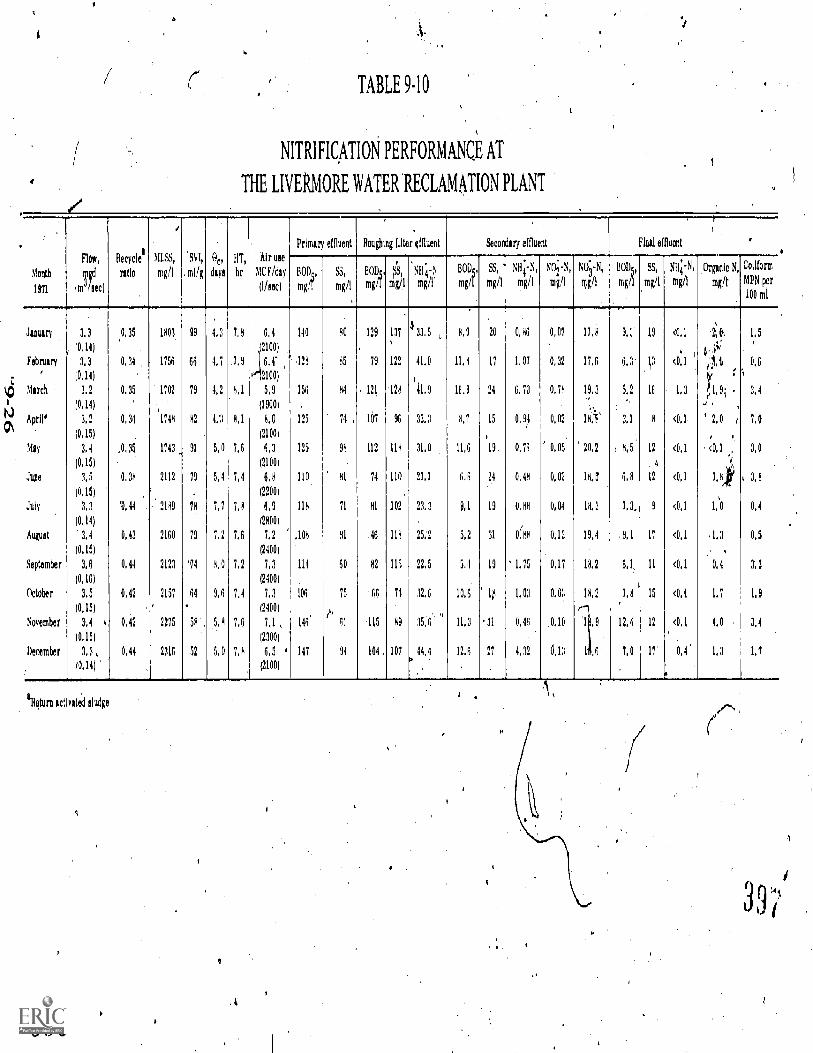
TABLE 9.10
NITRIFICATION PERFORMANCE AT
THE LIVERMORE WATER RECLAMATION PLANT
1
Month
191
Flow,
TO
elle)
Recycle
ratio
MLSS,
mg/I
SV1,
, ml/g
Oc,
days
11T,
hr
Air use
MC F/day
, oiled1
Primary effluent
,
Roughing filter effluent Secondary effluent Final effluent '
1
BON,
meSS,
mg/1
BODs,
mg/f
SS,
mg/I
, .
NH 0mg/I
BUN,
mg/l
,,,,q,
mg/I
1411;-N,
mg/I
N0i7S,
mg/I
NO.37N,
rug/I
130115,
mg/I
SS,
m /1
NII,i-N,
mg/I
Organic N,
mg/1
Colltorrn
Piro Per100 ml
January 3,3 0,35 1803 99 4.3 7,8 6,4 140 80 129 137 33, 5 8,9 20 0,86 0,07 17,8 9,3 19 <0,1 2ti 0, 1,5
February
'
10,14)
3,3
(0,14)
0,34 1756 66 4.7 7,8
(21001
.,.\ 6,4"
, 2100)
128 (15 79 122 41,0 11,8 17 1,07 0,32 17,6 6,3 1 <0,1 'j 3r
,
0,6
March 3.2 0.35 1702 79 4,2 8,1 5,9 1511 84 121 128 41,9 16,9 24 6,73 0,78 19,3 5,2 16 1,3 1,9; 3,4
(0,14) (1900) .., .,
April' 3,2 0,34 1741 82 4;3 8,1 8,0 125 74 , 107 96 33.3 8,7 15 0,94 0,02 18',I1' 3,1 8 <0,1 ' 2,0 / 7.0
(0,15) (2100)
May 3,4 .0.35 1743 91 5,0 7,6 6,3 125 98 112 118 31.0 11,G ID 0,76 0,05 '20,2 8,5 12 <0,1 <0,1 ', 3,0
(0,15) (2100) 4 'i,
June 3,5 0.38 2112 79 5,4 7,4 6, 8 110 41 74 110 27,1 6,6 24 0, 48 0,02 08, 3 6,8 12 <0,1 7, 8 I 3,8
(0,15) (2200)
July 3,3 '0, 44 2189 78 7,7 7,6 6,9 118 71 81 102 23.3 9,1 19 0, (111 0,04 18,3 7,3. <0,1 1;0 0,4
10.14) 12800)
August 3,4 0,43 2160 79 7.2 7,6 7,2 104 41 .46 118 25,2 5,2 31 0'88 0,12 19,4 .8,1 17 <0,1 .1,3 0,5
(0,15) (2400)
September 3.6 0,44 2123 '74 8,0 7,2' 7,3 114 60 82 115 22,5 5,4 19 1.75 0,17 18,2 6.1 11 <0,1 0,4 3,3
(0,16) (2400)
October 3.5 0,42 2157 64 9,6 7,4 7,3 106 75 66 74 32.6 10,6 li 1, 03 0,03 14,2 7.8 15 <0,1 1.7 1.9
(0,15).
12400)
November 4 i. 0,42 2275 5 5,8 7,6 7,1 , 146' 63 115 89 15,0 11,3 '31' 0,46 0.10 '1 .9 12,4 12 <0,1 4,0 3,4
(0,15) (23001
December 1,3 , 0,44 2316 52 5, 0 7, 8 6,5 ' 147 94 104 107 44,4 12,6 27 4, 32 0,13 1 ,6 7,0 17 0, 4 1,3 1.7
(0.14) (2100)
`Return activated !lodge
4

Current discharge requirements are essentially. those defined by EPA for municipalsecondary treatment plants with additional requirements set on effluent toxicity.26 In
addition, the effluent pH is restricted to the range of 6.5 to 8.5. The acid production fromnitrification and subsequent chlorination normally forces the effluent pH below 6.5. Thishas necessitated the addition of caustic to.the final effluent to raise the pH to or above 6.5.Toxicity requirements state that fish bioassays must be run on the undiluted effluent andthat 9'0 percent of a series of 10"consecutive tests must show 70 percent Fish survival for
96 hr. Experience.at this plant has indicated that the requirements cannot be met withoutremoval of ammonia through nitrification.26
A primary design consideration in laying out the plant for nitrification was the presence of asignificant' volume fraction (11 to 13 percent) of potentially toxic industrial wastes in theinfluent wastewater. Tank truck Washing residues and the waste from a manufacturer oforganic peroxide and phenol formaldehyde are the major industrial waste sources. Theroughing filter is used 'in the treatment plant to protect the nitrifying organisms frominfluent wastewater toxicity. Toxic dumps have caused severe sloughing and loss of growthon the'media in the roughing filter, but nitrification remained unaffected.26
FIGURE 9-9
SAN PABLO SANITA1,ZY DISTRICT TREATMENT PLANT(CALIFORNIA) FLOW DIAGRAM
SCREENEDRAW
WASTEWATER
SUPERNATANT
PRIMARY LOWS 'IN EXCESS OF 30 MGD
ts. EFFLUENTTO
RECEIVINGWATER
SEDIMENTATIO(EXISTING)
,ROUGH.I.E0
RETURN
........4S,ECONDARY' CLARIFIER
SLUDGE
AERATEDGRIT
REMOVAL
PRIMARYSEDIMENTATION
(NEW)
AERATION-NITRIFICATION
TANKS
CHLORINECONTACTTRICKLING
\FILTER
ISSOLVEDAIR
CAUSTICADDITION
RAWSLUDGE
SUBNATANTTO HEADWORKS
ACTIVATED
WASTE ACTIVATED SLUDGEFLOTATIONTHICKENING
HEADWORKS ANAEROBICDIGESTION/
FLOAT
SLUDGE TO DRYING BEOSCENTRIFUGES (FUTURE)
9-27
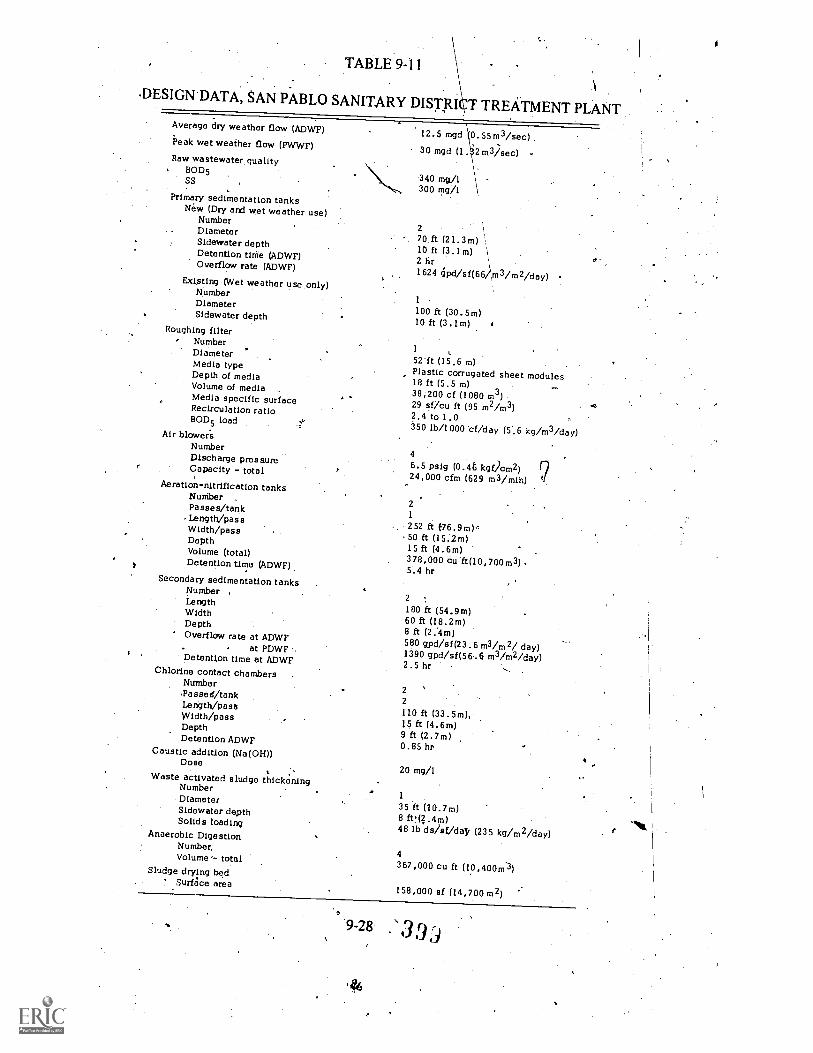
TABLE 9-11
DESIGN DATA, SAN PABLO SANITARY DISTRI T TREATMENT PLANTAverage dry weather flow (ADWF)
Peak wet weather flow (PWWF)
Raw wastewater, qualityBOD5SS
Primary sedimentation tanksNew (Dry and wet weather use)
NumberDiameterSldewater depthDetention time (ADWF)Overflow rate (ADWF)
Existing (Wet weather use only)Number
1Diameter100 ft (30.5m)Sidewater depth10 ft (3.1m) i
Roughing filterNumber
1Diameter52 ft (15.6 m)Media typePlastic corrugated sheet modulesDepth of media18 ft (5.5 m)Volume of media38,200 cf (1080 m3)Media specific surface29 sf/cu ft (95 m2/m3)Recirculation ratio 2.4 to 1.0BOD5 load350 lb/1000 cf/day (5.6 kg/m3/day)Air blowers
Number4
Discharge pressure6.5 psig (0.4t, kgf)cm2)Capacity - total24,000 cfm (629 m3/mih)
Aeration-nitrification tanksNuniber
2Passes/tank1. Length/pass252 ft t76.9mrWidth/pass
.50 ft (15.2m)Depth15 ft (4.6m)Volume (total)378,000 cu ft(10,700m3).Detention time (ADWF)5.4 hr
Secondary sedimentation tanksNumber ,
2Length180 ft (54.9m)Width60 ft (18.2m)Depth8 ft (2.4m)' Overflow rate at ADWF580 gpd/sf(23.6 m3/m2/ day)at PDWF1390 gpd/sf(56.6 m3 /m2 /day)Detention time at ADWF 2.5 hr
Chlorine contact chambersNumber
2,Passel /tank2Lengthpass110 ft (33.5m),Width/pass 15 ft (4.6m)Depth9 ft (2.7m)Detention ADWF0.85 hn
Caustic addition (Na(OH))Dose
20 mg/1Waste activated sludge thickening
Number1Diameter35 ft (10.7m)Sideweter depth8 ft'(?.4m)Solids loading48 lb ds/sf/da9 (235 kg /m2/day)Anaerobic Digestion
Number.4Volume- total367,000 cu ft (10,400m.3)Sludge drying bed
' Surface area158,000 sf (14,700m2)
12.5 mgd 0.55m3/sec)
30 mgd (1. 2 m.3 /sec)
340 mg /1
300 m9/1
2 \70.ft (21.3m) \,10 ft (3.1m) 1
2 lir 1
1629 6Pd/sf(66)m3/m2/daY) '
. 3 9
-Consistent year-round nitrification is obtained in this plant as is shown in Table 9-12. Whileonly once-monthly analyses of nitrogen are shown in Table 9-12, the 'consistency ofnitrification in the plant is confirmed by daily ammonia nitrogen analysep of grab sampleswhich normally show less. than 0.2 mg/1 ammonia nitrogen. Wastewater temperatures arefavorable for nitrification, typically 'dropping to only 17 C, the average monthlytemperature in January.
e The treatment plant is currerftly operating at only one-half of its design capacity. To test thenitrification portion of the system at close to its designtanks was taken out of service during May, June ansedimentation tanks remained in service during this periperformance for this period are summarized in Tablesnitrification was maintained throughout this special test p
ondition, one of the two aerationJuly. of 1974. Both secondary
d. Operating conditiOns and plant-13-and 9-14 respectively.27 411riod.
Examination of Table 9-14 provides some insight into th operation of the roughing filter.Total BOD5 and total COD. remained relatively unaffecte i by the roughing filter, operation.Evidence of treatment, however, is provided by the solubl BOD and soluble COD tests andthe total suspended solids (TSS) determinations. A reduc ion in soluble BOD5 and solubleCOD occurred coincidentally, with an increase in TSS. T s indicates organic removal withassociated growth of biomass. In this plant's o eration, the roughing filter converts influentorganic matter to biological organisms. Sub quent treat gent in the aeration:nitrificationtank provides further oxidation and nitrification.
Construction cost of the added facilities totaled $4,900,000, including legal, engineering andcontract administration. The contract was awarded in ctober 1970 and constructionessefrtially completed by October, 1972. Treatment plant o erating costs totaled $397,500for fiscal year 1973/1974, during which time, a total of 2,:00 million gallons (9.8 millionm3) were processed thtough the secondary treatment facili ies. On a unit basis, treatmentplant O'& M costs total,f153/mil gal for fiscal year 1973/1974.26
9.5.2 Case Examples of Nitrification-DenitrificatiOn for Nitrogen Removal
Four examples of the incorporation of biological nitrification-denitrification in treatmentplants for nitrogen removal are presented in this section. The Central Contra Costa SanitaryDistrict's plant design is oriented towards reuse of the reclaimed water by nearbykindustriesas well as meeting discharge requirements. The designs of the Canberra; Australia,Washington, D.C., and El Lag., Texas plants are laid out so that nitrogen and phosphorusare removed to protect the receiving waters.
9.5.2.1 Central Contra Costa Sanitary District, California
The Central Contra Costa Sanitary District (CCCSD) has under construction a new 30 mgd(1.31 m3/sec) Water Reclamation Plant near Concord, California. Due to go on-line in 1976,
.
the plant is designed to produce water for sale to the Contra \Costa County Water District
9-29
4 i) 0
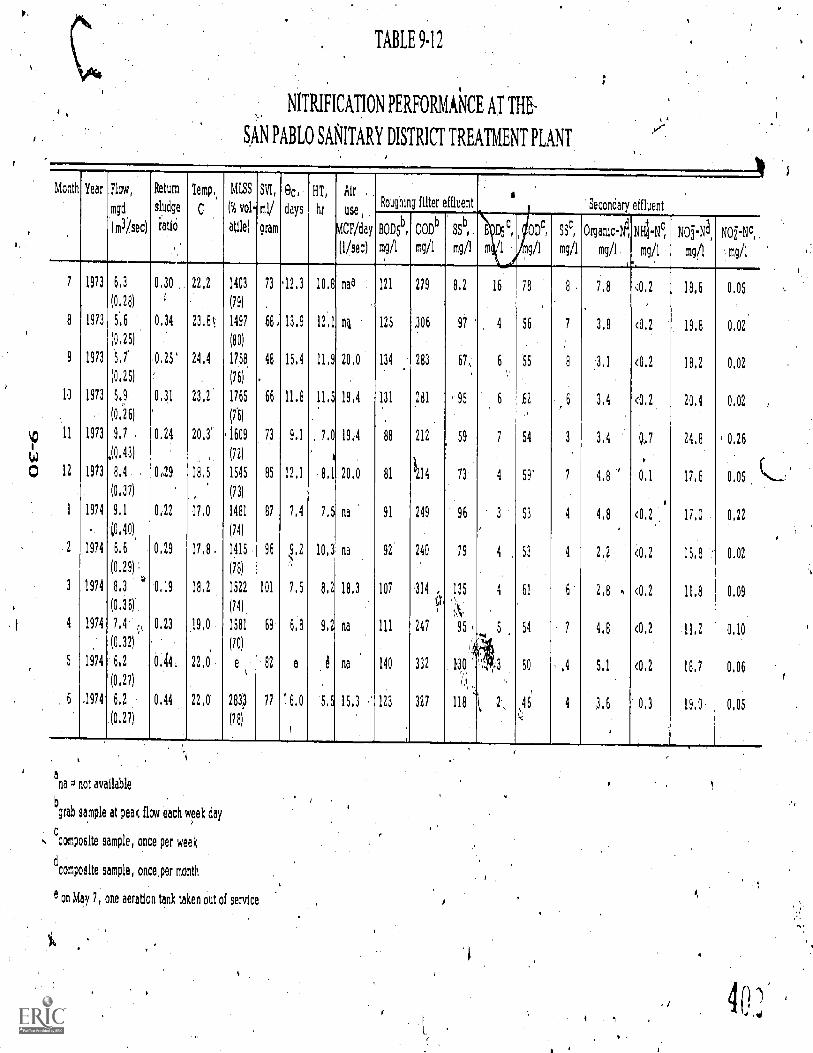
p,
D
0
TABLE 9.12
NITRIFICATION PERFORMANCE AT THE-
SAN PABLO SANITARY DISTRICT TREATMENT PLANT
Month Year Flow,
mgd
(m3 /sec)
Return
sludge
ratio
Temp,
C
MISS
(% vo1-
stile)
SVI,
ml/
gram
9c,
days
HT,
hr
Air .
use
MCF/day
(1/sec)
Roughing filter effluent Secondary effluent
BOD5b,
r18/1
CODb
mg/1
SSb,
mg/1
.1 c,
mi 1
0Dc,
g/1
SSc,
mg/1
Organic-N,
mg /1
1,14-11c,
mg/1
N*111,
mg/1
No-NC,
, mg/1
7 1973 6.3 0.30 22,2 1403 73 '12.3 10.8 naa 121 279 8.2 16 78 8 . 7,8 4,2 18,6 0,05(0,281 (79) ,
8 1973 5,6 0,34 23.6 1497 68 , 13.9 12,1 al 125 306 97 4 56. 7 3,8 <0,2 19.8 0,02
(0.251 (801
9 1973 5,1 0,25' 24,4 1758 48 15.4 11,9 20,0 134 283 67,; 6 55 8 3,1 <0.2 18,2 0,02
(0.25) . (76) .
10 1973 5.9 0.31 23,2 1765 66 11.8 11.5 19,4 131 281 95 6 62 6 3,4 <0,2 20,4 0,02
(0,261 (76)
11 1973 9,7 0.24 20,3' .1609 73 9,1 , 7.0 19,4 88 212 59 7 54 3 3.4 07 24,8 , 0.26
,10.43) (72) 1
(12 1973 8.4 0,,29 18.5 1545 85 12,1 8.1.20,0 81 k,14 73 4 59' 7 4,8 ' 0,1 17,6 0.05(0.37) (73)
1 1974 9.1 0.22 17.0 1481 87 7,4 7.5 na 91 249 96 3 53 4 4.8 <0.2 17,0 0.22
(0.401 (74)
2 1974 6.6 0.29 17.8. 1415 96 9 2',
10 3 na 92 240 79 53 4 2,2 <0,2 15.8 0.02
(0.29) I (78)
3 1974 8.3 '' 0,19 18.2 1522 101 7,5 8,2 18,3 107 314 135 4 61 6 2,8 , <0,2 11,8 0.09
(0.36) (74) l'' ,\,
4 1974 7,4' , 0.23 19,0 1581 69 6.8 9,2 na 111 247 95 . 54 7 4.8 <0,2 11.2 0.10
(0.321 ' (70)
5 1974 6,2 0.44. 22,0 e 82 e .6 na 140 332 130 .,:s, 50 , .4 5,1 <0.2 18.7 0.06
(0.27) ,i,
6 .1974' 6.2 .. 0.44 22,0 2833 77 6,0 5,5 15.3 .' 123 327 118 ,46 4 3,6 0.3 19,0 0,05
(0,27) (78)
ana =not available
bgrab sample at peak flow each week day
composite sample, once per week
dcomposite sample, once,per month
e on May 7, one aeration tank taken out of servicea,

TABLE 9-13
AVERAGE PROCESS LOADING CONDITIONS AT THE SAN PABLO SANITARYDISTRICT TREATMENT. PLANT DURING SPECIAL TEST,
MAY 19TH TO JULY 8TH, 1974
Flow, mgd (m3/sec) 6.30(0.28)Temperature C 23.0Roughing filter
BOD loading,lb BOD5/1,000 cf /day(kg /m 3 /day)
Hydraulic loadinggpm/sf (m3/m2/min)
(Aeration-nitrification tanks
199 (3:19)
2.1 (0.086)-:
MLSS., mg/I , 3070Percent volatile 78.2SVI, ml/gram 80.2Average detention time, hr 5.4BOD 'load
lb BOD5/-1,000 cf /day (kg/m3/day) . 35.8 (0.57)lb BOD5 /lb MLVSS/day (kg/kg/day) 0.24 (0.24)
Solids retention time, days 6:6
Secondary sedimentation tanksAverage overflow rate, gpd/sf (m3 /m2 /day) 292 (11.89)Average return ratio 0.48Average 'solids load, lb/sf/day (kg/m2/day) 11.0 (5$.7)Return activated sludge, mg/1* 6835
TABLE 9-14
PERFORMANCE SUMMARY FOR THE SAN PABLO SANITARY DISTRICTTREATMENT.PLANT DURING SPECIAL TESTING, MAY 19TH TO JULY 8TH, 1974
. .Characteristic
'
Rawwaste-watera
Primaryeffluent
'Roughingfilter
effluent a
Secondaryeffluenta
Total BOD5, mg/1Soluble BOD5, mg/1
220nab
14597.5
12952.8
3 . 3
Total COD,COD, mg/i na , 322 , 334 47 . 5Soluble COD,. and /1 na 191 137 . ' 40.7TSS, mgil ', 191 86. 8 M21 °' 4:9AmmoniarN na na 19.8 <0.2Nitrate-N na na na 19.0Zlitrite--N -
na . na na 0 . 04 c
aComposite sample each weekday,, except as Indicated
na = not available '
cGrabsample att*peak flow
9-31
which will resell th water to large industries for cooling and process water. The°reclamation contract calls for production f a water containing less than 10 mei of BOD5,1 mg/I total phosphorus and-5 ring/1 total itrogen.I
The liquid processing flowsheet for the CCSD Water Reclamation. Plant is shown in Figure9-10 and design data are in Table 9-1 29 Primary treatment follows lime addition andpreaeratiOn and is followed with a sepa ate stage nitrification step. the use of lime in theprimary treatment stage removes' the bulk of the organic carbon before nitrification,resulting in a very stable oxidation of mmonia to nitrate.' Addition of lime also enhancesthe removal of organic nitrogen, hosphorus, heavy metals and viruses. Biologicaldenitrification follows nitrification, converting nitrate to nitrogen gas. Multimedia filtrationwill also be provided prior to distribilition of .reclaimed water to industry. Not shown in,Figure 9-10 is -a 140 million gallon (530,000 m3) storage basin that can be used to storeprimary effluent to reduce peak wet weather loads on the nitrification and denitrificationunits. Also, the filtration facility hai been provided with a 5 million gallon (18,900 m3)storage basin for equalizing filter influent arnda 30 million gallon (11.4,000 m3) clear wellforastoragedof filtered water before pumping it into the distribution systein.
There is no intervening recarbonation stage between the primary clarification andnitrification stages. External carbon dioxide (CO2) is added directly to the first pass of theaeration-nitrification tanks as needed.. External requirernents are minimal as the chief source ,
of CO2 is not the external source, but the CQ2 generated in the process. Carbon dioxide isderived from the oxidation of both organic carbon and ammonia. The in-:process CO2generatiOn .capability is an example of lime clarification-nitrification compatibility. Thenitrification pH is also kepf in the 7.0 to 8.5 range, which is optimal for nitrification.
"Based upon tests" by the City of Milwaukee in the 1>960's30,31 and testing perforrned.at theSouth Eastern Purification Plant in-Melbourne, Australia,32 the decision was made to useflat porous plates arranged uniformly over the bottom of the aeration-nitrification tanks.This method of fine bubble aeration gives an oxygen transfer efficiency of between 14 and20 percent under standard conditions. The porous plates are 14 in. (36 cm) in diameter by
' 11/4 in. (3.2 cm) thick and are secured in polypropylene holders as shown in Figuie 9-11.Thirty plates are arranged in a single precast panel; there are 40 panels per pass. Each panelhas an inverted channel shape and is grouted to the tank. By using an inverted channelshape, the cbapinel forms an air duct with the bottom slab of the aeration-nitrification tanks.Each channel has a manual (drain so that each pass may be drained during start-up andshutdown operations. Four panels are fed by each downcomer pipe, thereby allowingthrottling of the downcorner pipes and a tapered aeration operation. Air for the nitrificationtanks, channel aeration, and preaeration is provided by two 60,000 scfm (1,698 m3/min)steam turbine ddensingle-stage centrifugal blowers and is filtered in large compartment-type bag filters, to achieve .a particulate concentration of less than 0.09 mg/1,000 cu ft(0.32 mg/100 m3) of air.
9 -340.4

FIGURE 0
LIQUID PROCESS
WASTEBIOLOGICALSLUDGES
FLOW SHEET CCCSD
RAW WASTEWATER
PRECHLORINkT
WATER RECLAMATION PLANT (CALIF.)
ION .
<
SCREENING
INFLUENT PUMPING
POLYMERand/or Fe C13
MAKEUP .LIME
RECLAIMED LIME.
LIME RtACTORAND PREAERATION
NITROGEN GASTO
ATMOSPHERE
STABILIZATIONAIR
PRIMARYSEDIMENTATION
SLUDGE
4PRIMARY. EFFLUENT
PUMPING
AERATION -NITRIFICATION
SECONDARYSEDIMENTAT ION
DENITRIFICATICNIII----MIXINGREACTOR'AERATED
STABILIZATION
SOLIDSPROCESSING
(STEAM
TURBINEBLOW t RS
AIR
RETURNSLUDGE
METHANOL
FINALSEDIMENTATION
RETURNSLUDGE
ASH TODISPOSAL
gp, WASTE SLUDGE
POSTAERAT ION AIR
POSTC HLOR INAT 10 N
TO PREAERATION
WASTE SLUDGE""TO PREAERATJON
FINAL EFFLUENT"PUMPING f I L T R AT ION
CHLRRINATION
9-33
4_05
INDUSTRIAL SYSTEMPUMPING
RECLAIMED WATERTO INDUSTRY
EFFLUENT TO":SUISUN BAY
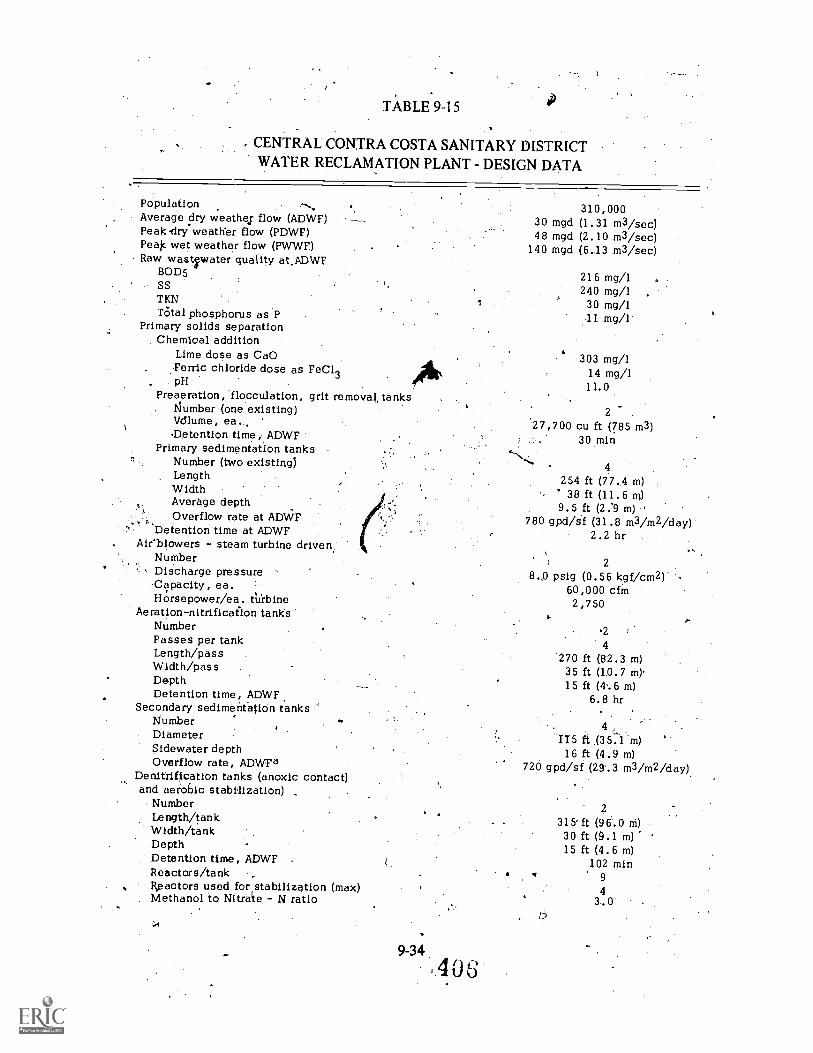
TABLE 9-15
. CENTRAL CONTRA COSTA SANITARY DISTRICTWATER RECLAMATION PLANT - DESIGN DATA
Population 310,000Average dry weathel flow (ADWF) 30 mgd (1.31 m3/sec)Peakdry weather flow (PDWF) 48 mgd (2.10 m3/sec)Pe* wet weather flow (PWWF) 140 mgd (6.13 m3/sec)Raw wastrater quality at,ADWF.
BOD5 216 mg/1SS 240 mg/1TKN z 30 mg/1TOtal phosphorus as 'P 11 mg/1Primary solids separationChemical addition
Lime dose as CaOFerric chloride dose as FeC13
. pH
Preaeration, flocculation, grit removal, tanksDumber (one existing)Vdlume, ea..Detention time, ADWF
Primary sedimentation tanksNumber (two existing) 4Length 254 ft (77.4 m)Width 38 ft (11.6 m)
Detention time at ADWFAir'blowers - steam turbine driven.'
780 gpd/if (31.8 m3/m2/day)2.2 hr
Average depth 9.5 ft (2:9 m)Overflow rate at ADWF
.
Number' Discharge pressure
Capacity, ea.Horsepower/ea. turbine
Aeration-nitrificafion tanksNumberPasses per tankLength/passWidth/passDepthDetention time, ADWF
Secondary sedimentation tanksNumberDiameterSidewater depthOverflow rate, ADWFa
Denitrification tanks (anoxic contact)and aerobic stabilization)
NumberLength/tank 315'ft (96.0 m)Width/tank 30 ft (9.1 m)Depth 15 ft (4.6 m)Detention time, ADWF 102 minReactors/tank 9Reactors used for stabilization (max) 4Methanol to Nitralte - N ratio 3.. 0
303 mg/114 mg/111.0
2
27,700 cu ft (785 m3)30 min
2
psig (0.56 kgf/cm2)60,000 cfin2,750
24
270 ft (82.3 m)35 ft (10.7 m)'15 ft (4.6 m)
6.8 hr
115 ft (35.1 m)16 ft (4.9 m)
720 gpd/sf (29.3 m3/m2/day)
9-34
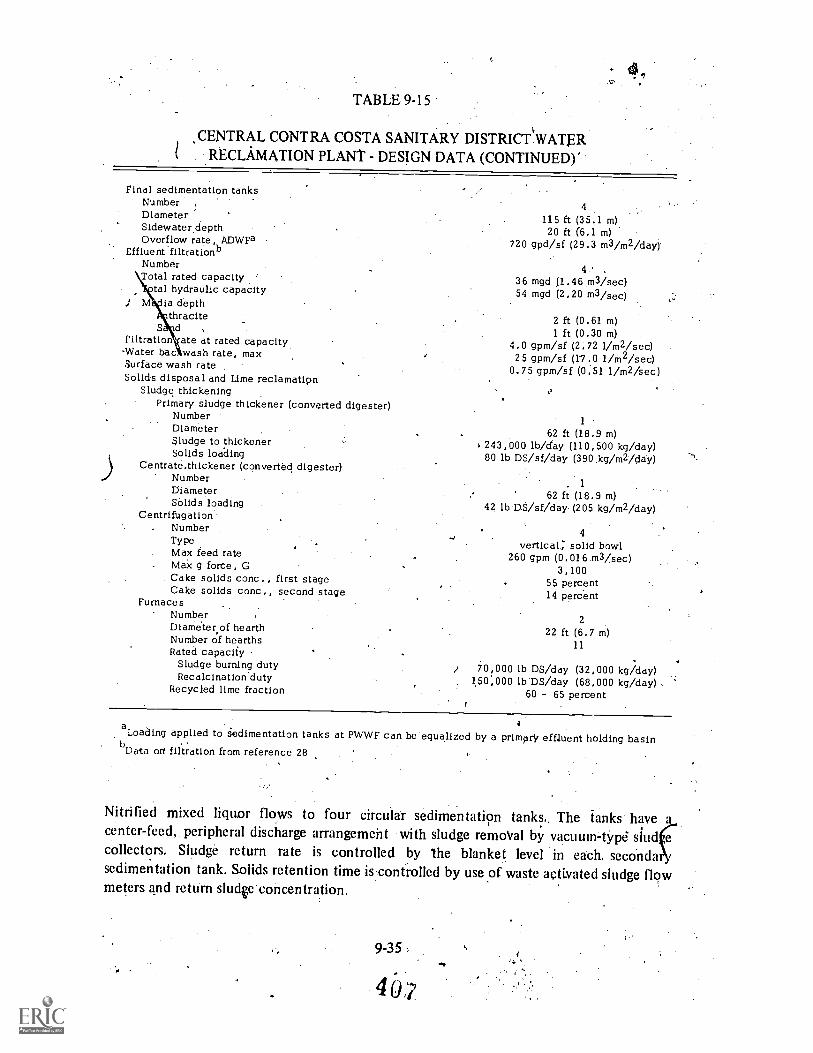
- 4TABLE 9-15
,CENTRAL CONTRA COSTA SANITARY DISTRICT WATERRECLAMATION PLANT - DESIGN DATA (CONTINUED)'
Final sedimentation tanksNumber 4Diameter. 115 ft (35,1 m)Sidewaterdepth 20 ft (6.1 m)Overflow rate, ADWFa 720 gpd/sf (29.3 m3 /m2 /day)'
Effluent.filtrationbNumber
4Total rated capacity 36 mgd (1.46 m3/sec)
tal hydraulic capacity 54 mgd (2.20 m3/sec)J M&lia depth
thracite 2 ft (0.61 m)S d , 1 ft (0.30 m)Filtration ate at rated capacity 4.0 gpm/sf (2.72 1/m2/sec)-Water bac wash rate, max 25 gpm/sf (1.7.0 1/m2/sec)Surface wash rate . 0.75 gpm/sf (0.51 1/m2/sec)
Solids disposal and Lime reclamatipnSludge thickening
Primary sludge thickener (converted digester)Number
1Diameter 62 ft (18.9 m)Sludge to thickener v 243,000.1b/day (110,500 kg/day)Solids loading 80 lb DS/sf/day (390 kg/m2/day)
Centrate.thickener (converted digester)Number
. 1Diameter 62 ft (18.9 m)Solids loading 42 lb DS/sf/day (205 kg/m2/day)
Centrifugation'. Number
4Type vertical; solid bowlMax feed rate 260 gpm (0.016.m3 /sec)Max g force, G 3,100Cake solids conc., first stage 55 percentCake solids conc., second stage 14 percent
FurnacesNumber
2Diameler,of hearth 22 ft (6.7 m)Number of hearths
11Rated capacity
Sludge burning duty / 70,000 lb DS/day (32,000 kg/day)Recalcinatiodduty 150,000 lbDS/day (68,000 kg/day)
Recycled lime fraction 60 - 65 percent
aLoaaing applied to sedimentation tanks at PVVWF can be equalized by a primary effluent holding basinbData on filtration from reference 28
Nitrified mixed liquor flows to four circular sedimentation tanks. The tanks' have acenter - feed,, peripheral discharge arrangemeht with sludge removal by vacuum-typd stud ecollectors. Sludge return rate is controlled by the blanket level in each, secondasedimentation tank. Solids retention time is controlled by use of waste activated sludge flowmeters and return sludge concentration.
9-35
4

FIGURE'9-1 1,
NITRIFICATIONIFDENITRIFICATION SYSTEM AT THE
CCCSD WATER RECLAMATION PLANT,(CALIFORNIA)
'.. . ,
SECONDARYEFFLUENT ./CONDUITS pc ,/,./
A
1
SECO ''RYSEDIMENTATANK
TO'
ECONDAFFLUEONDUIT
,;
DENITRIFICATANKS
EFFLUENT FROPRIMARYSEDIMENTAT 10
AERATEDSTABILIZA-TION TANK
(MAKREACTORS)
NITRIFIED MIXED=OR CHANNEL
RNS CHANNELr.-mElli=F;
TR IF !CATION
SEE
q
2
()ETA!
TA
AEAl
KS
.
ION
AERAT'ION-;-
1,
NJ
. /
EFFLUENT
L.0
2
Ar' FC.IFIXNNEY
4.J. i 'JJ --JRDS CHANNEL
dENITRIF IED MIXED .I LIQUOR CHANNEL
FINALSEDIMENTATIONTANKS
f.
FINAL. \V,\VV.EFFLUENTCONDUIT! -"II IICHLORINEMANHOLE --
SECTION
; ,4
PAss yo2241_'-c)AIR PLENUM CHANNELTYP OF 4IG PER PASS
3C-6_ "
RAT ION 0 C' O C., 0DOWN-
COMER
(. 0;
)
/POROUS PLATEDIFFUSERS ITYPI
DISTRIBUTIONP fPE
4T)
DETAIL (.41)
AIR FEED PIPE'
ENITRIFIEDGE (RDS) PUMPS
11-11111111=1IMMO=
POSTAERAT ION,CHANNELS
PLAN AND FLOW DIAGRAM
b
_PLENUM DRAIN
SECT ION
POROUS 'PLATE
POLYPROPYLENE HOLDER
ti
PLENUM
9-36 I (56 ,
".1
A
NI
Suspended gri2wth denitrification used fpr nitrate removal. Uncovered *adt0i-S areemployed, as jitial testis owed them to be acceptable.' 140,1 parallel denitrificationtanks '*Consist nin cornpletely mixed reactors- in serie\_ This arrangement allows'apprsvimation of a plug flow hydraulic regime. Each reactor th equipped with a low-shear
.cturbine type mixer,to keep the mixed, liquor solids in suspension. The last four reactors inthe series are -diipped with sparger-s for' aeration. With this arrangement,_ the first five cells
7t, irilii-seties. can be used for anoxic denitrifieation reactors and the last cells can' be'used for denitrification or aerated. siabili4ation .depeqing on whether or not aeration isused The 'yolume devoted 'to each function can be Varied. to meet seasonail,oids:temperatures. The anoxic reactors ate designed, to operate at 0.1 lb NO3 N Yein./lbMLVSS/clay MLSS levels ranging from 330 to 4000 mg/l. The gates between the last fivereactors alloik positive prevention of backmixing of oxygen between the reactors selected;for denittifiCation and the reactors selected' for aerated stabilization: The gates are open at
, the top to prevent trapping of floating -solids in.ahy reactor. The denitrified mixed, liquorchannel between the denitrification tanks,and the filial sedimentation tanks is, aerated for :
. further stabilization. Final sedinientation tanks are similar to the secondary sedimentation 41tanks. ,
'All waste sludge produged -in the CCCSD Water Reclamation Plant is eventually cycled intothe primary sedimentation tanks and appears in the primary underflow. SOurces of sludgeN,include the suspended solids- associated with the raw wastewater, the solids that are wastedto the ifrimary sedimentation tanks from the subsequent biological treatment stages, and theinorganic sludges that are precipitated due to chemical action.
To maintain a pH of 11.0 in the primary sedimentation tatilOarge quantities of lime,approximately 400 mg/1 as. Ca(OH)2, must. be 'used. The need' for such a large dosage.predicates the 'economical recovery and reuse of the lime. The solids flowsheet is shown'inFigure 9-12. The heart of ',the system is a two-stage centrifuge process using vertical"solid-bowl centrifuges; where krimary sludge is separated into two components; sludge cakerich in calcium carbonate (Cab03) and centrate containing most of the organic material;magnesium and phosphorus. The first stage" centrifuge cake is aPproximately 70 perc6httaCO3. This cake is recalcined in a multiple hearth furnace, subsequently dry ,classified andthe lime returned to storage. The lime recover}, is expected to be approximately 60-65percent of the lime used.33
The first stage centrate is thickened before being clarified in centrifuges identical to thoseused for primary sludge classification.. The resulting ,cake is reducgol in a multiple-hearthfimace (MHF) to'a sterile ash which:is used for landfill. The MHF is identical to that usedfor recalcining,
4:
Energy in the hot off-gases from each MITF is reclaimed Via waste heater boilers. Recoveredsteam is used to run the turbines which power the aeration blowers.
9-37
406

Suspended gx,bwth denitriemployed, asjitialtestirr!tanks '.Consist pf nin cc
. appavcimation of a plug fl.cturbinetYperilixer,to keer
the series are Atiipped witinthr-shies. can be usedused for dellitrification orUsed. The yalume devoteCtemperatures. The anoxicMLYSSiday kat MLSS levelsreaCtors alloik positive pre'for denittifiCation and thethe top to prevent trappin,channel between the clenitfurther stabilization...Finaltanks. ,
'All waste sludge produced -
the primary sedimentationinclude the suspended solid:to the ftrimary sedimentatio:inorganic sludges that are pr.(
To maintain a pH of 11.0approximately 400 mgil aspredicates the 'economical r(Figure 9-12. The heart Q1solid-bowl centrifuges, wherrich in calcium -carbonate (magnesium and phosphorustaCO3. This cake is recalcirthe lime returned to storalpercent of the lime used.33
The lirst stage centrate is tlused for primary sludge clatUrnace (MHF) to'a sterile afor recalcihing.
Energy in the hot off-gases isteam is used, to run the turb:

FIGURE 9-12
SOLIDS.FLOW DIAGRAM AT THE CCCSD WATER RECLAMATION PLANT (CALIF.)
RECYCLE LIME
MAKEUPL IME
I
L IMESTORAGEEQUIP.
EXHAUSTGAS TO
. ATMOSPHERE
STEAM
WASTEBIOLOGICAL
LIME SOLIDSFEEDEQUIP. OVERFLOW.
RETURN
POLYMER and/or F*C13
WETSCRUBBER
DRYSCRUBBER
4
SCREENEDWASTEWATER
LIMEREACTOR# PREAEi
AT ION
PRIMARYSEDIMENTATION
TANKS
PRIMARYSLUDGE
THICKENER
THICKENER UNDERFLOW
CaCO3
LFIRST STAGE CENTRATE
WASTE CENTRIFUGEHEAT (WETBOILER CL ASSIF ICA
TION) CENTRATETHICKENER
RECALCINEFURNACE
RECALCINEDASH
r.
4RECYCLE LIME
CAKE
L
DRY LIMECLASSIFICATION
REJECTS
PRIMARY
EFFLUENT
THICKENEROVERFLOW OVERFLOW
TO PRIMARY,INFLUENT
THICKENEROVERFLOW
A
THICKENEDCENTRATE STEAM
STAGE WASTE( >jSECOND POLYMER
CENTRIFUGE HEAT BOILER I
WETSCRUBBER
EXHAUSTGAS TO
AT MOSPHERE
CAKE
SLUDGEFURNACE
GRIT
IA
YDRYC RUBB ER
9-38 4
ASH TOowDISPOSAL
Operational control of the CCCSD Water Reclamation Plant will be divided into four areas,each of which will be manned by a senior operator, operator, and,various maintenance menduring each shift. The four areas are: (1) primary treatment, (2) biological treatment, (3)
, filtration, and (4) solids handling and conditioning. Because of the highly autom4ed controlsystem, cathode ray tubes (CRT) are provided in each operator control room, eliminatingthe need for lighted coritrol panels. In addition to the main CRT's in the computer room,
liCRT's are located throughout t hi !ant for data monitoring. Because of the very 'exactingstandards required of industrial ter, this plant is designed to prevent potential plantupsets by incorporating a direct digital control (DDC) dual-computer system to monitor andcontrol all process functions.34 Operation of the on-line computer is by a "management byexception" basis which means that as long as the process status is within normal limit4s,information is not printed, displayed, or needlesSly alarmed.
While this plant will not go on-line until 1976, the process was rigorously monitor in a-full-scale test at the existing CCCSD plant for a 23-month period. Portions of the test dataare summarized in Section 5.2.4.2.
The construction contract for the first phase of work, excluding effluent filtration, totaled$47,000,000 and was let in mid-1972. The construction contract for the effluent filtrationand appurtenances totaled approximately $14,000,000 and was let in the fall of 1974.Operation and maintenance costs were estimated for fiscal year 1976/1977. at $300/mil galbased on an average dry weather flow of 30 mgd.
9.5.2.2 Canberra, Australia
The Lower Molonglo Water Quality Control Centre (LMWQCC), an advanced wastewater_treatment plant under construction, is designed to serve the City of Canberra, Australia'snational capital. Present discharges from Canberra's existing plants are causing algal growthproblems in the receiving water and in a downstream reservoir. To circumvent theseproblems, it was established that the LMWQCC should produce an effluenf that contains:35
Substantially, no settleable solids, turbidity, color or odor.
2. BOD5 and suspended solids concentrations of less than 5.0 mg/l.
3. A median fecal coliform content less than 50 per"100 ml and a 90 percentile valueof less than 400 per 100 ml.
. ,
4. Total nitrogen not exceeding 2.0 mg/1 as N and total phosphorus not exceeding0.15 mg/1 as P. °
5. Detergent concentrations less than 0.5 mg/1 of MBAS.
No stilastances toxic to aquatic biota.
9-39
411
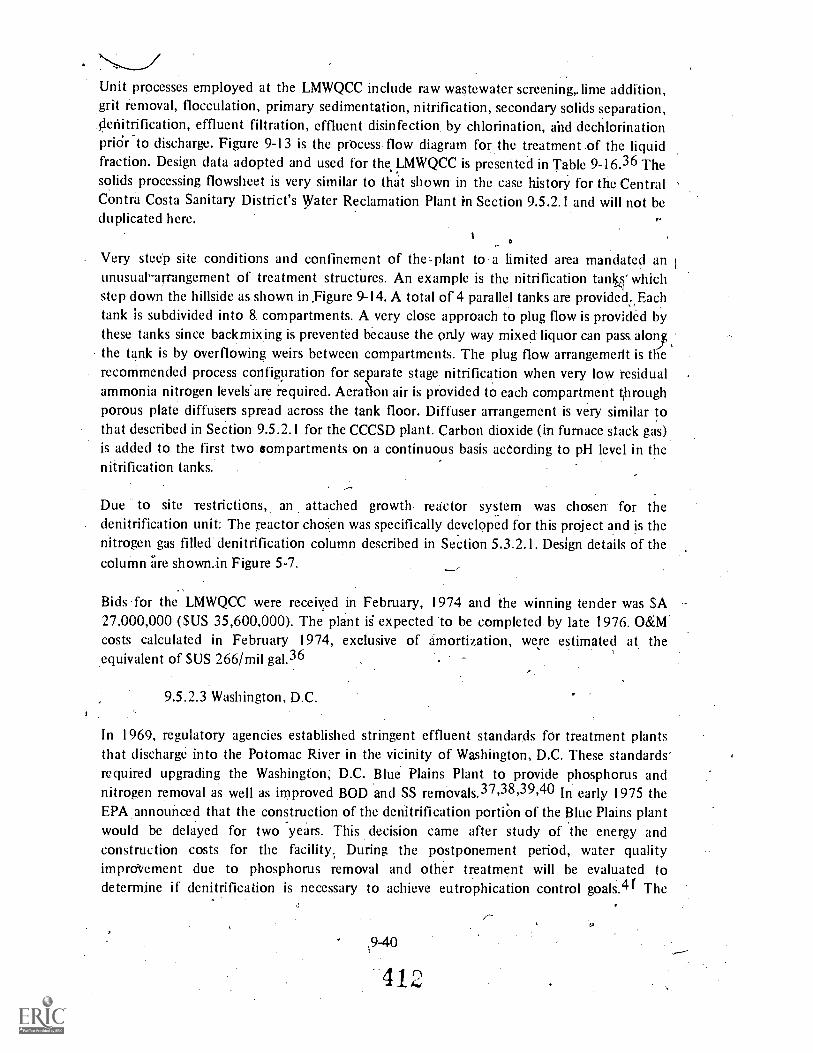
jUnit processes employed at the LMWQCC include raw wastewater screening,. lime addition,grit removal, flocculation, primary sedimentation, nitrification, secondary solids separation,f.lenitrification, effluent filtration, effluent disinfection, by chlorination, aid dechlorinationpriOr to discharge. Figure 9-13 is the process flow diagram for the treatment of the liquidfraction. Design data adopted and used for the LMWQCC is presented in Table 9-16.36 Thesolids processing flowsheet is very similar to tha't shown in the case history for the CentralContra Costa Sanitary District's Water Reclamation Plant in Section 9.5.2.1 and will not beduplicated here.
t0
Very steep site conditions and confinement of the plant to a limited area mandated anunusual-arrangement of treatment structures. An example is the nitrification tanks' whichstep down the hillside as shown in Figure 9-14. A total of 4 parallel tanks are provided. Eachtank is subdivided into 8. compartments. A very close approach to plug flow is provided bythese tanks since backmixing is prevented because the only way mixed liquor can pass alongthe tank is by overflowing weirs between compartments. The plug flow arrangement is therecommended process configuration for separate stage nitrification when very low residualammonia nitrogen levels'are required. AeraZion air is provided to each compartment throughporous plate diffusers spread across the tank floor. Diffuser arrangement is very similar tothat described in Section 9.5.2.1 for the CCCSD plant. Carbon dioxide (in furnace stack gas)is added to the first two compartments on a continuous basis according to pH level in thenitrification tanks.
Due to site restrictions, an attached growth reactor system was chosen for thedenitrification unit: The reactor chosen was specifically developed for this project and is thenitrogen gas filled denitrification column described in Section 5.3.2.1. Design details of thecolumn are shown.in Figure 5-7.
Bids for the LMWQCC were received in February, 1974 and the winning tender was $A27,000,000 ($US 35,600,000). The plant is expected to be completed by late 1976. O&M"costs calculated in February 1974, exclusive of amortization, were estimated at theequivalent of $US 266/mil ga1.36
9.5.2.3 Washington, D.C.
In 1969, regulatory agencies established stringent effluent standards for treatment plantsthat discharge into the Potomac River in the vicinity of Washington, D.C. These standards'required upgrading the Washington; D.C. Blue Plains Plant to provide phosphorus andnitrogen removal as well as improved BOD and SS removals.37,38,39,40 In early 1975 theEPA announced that the construction of the denitrification portiOn of the Blue Plains plantwould be delayed for two years. This decision came after study of the energy andconstruction costs for the facility; During the postponement period, water qualityimprdvement due to phosphorus removal and other treatment will be evaluated todetermine if denitrification is necessary to achieve eutrophication control goals.41 The
.9-40
4.2,
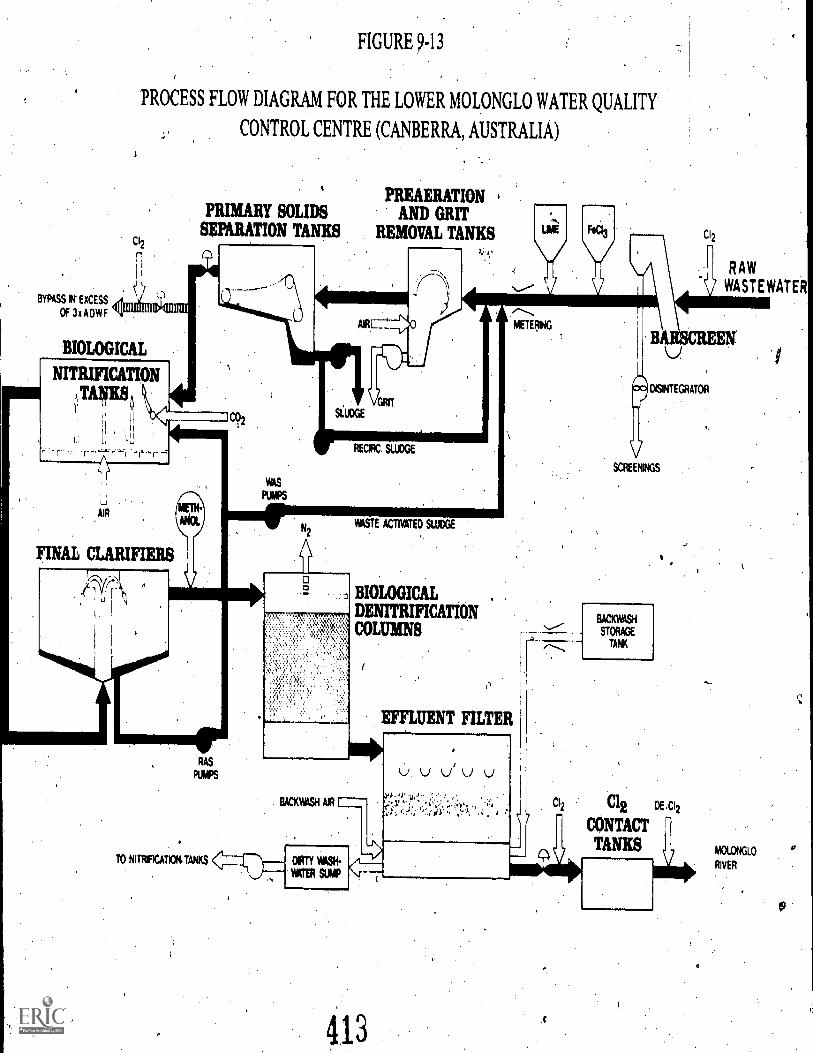
FIGURE 9-13
PROCESS FLOW DIAGRAM FOR THE LOWER MOLONGLO WATER QUALITY
CONTROL CENTRE (CANBERRA, AUSTRALIA)
Cl2
PRIMARY SOLIDSSEPARATION TANKS
PREAERATIONAND GRIT
REMOVAL TANKS C'2
4
--RAW
WASTEWATERBYPASS IN EXCESS
OF hADWF
BIOLOGICAL
DISINTEGRATOR
WASTE ACTIVATED SLUDGE
FINAL CLARIFIERS
BIOLOGICAL .
DENITRIFICATIONCOLUMNS
RAS
PUMPS
TO NITRIFICATION.TANKS
BACKWASH AIR L
VATTER SUMP
DIRTY VMS*
,e+-';'
SCREENINGS
BACKWASH
STORANK AGE
T
Clp Clg oc12
CONTACTTANKS
913
MOLONGLO
RIVER

TABLE 9-16'
LOWER MOLONGLO WATER QUALITY CONTROL
CENTRE (AUSTRALIA), DESIGN DATA
Population 269,000Avenge dry weather flow (ADWil 28.8 mgd (1.26 m3/sec)Peak dry weather flow (PDWE 43.3 mgd (1.90 m3 /sec)Beak wet weather flow (PWWF1 144.0 mgd (6.30 m3 /sec)Raw wastewater quality at ADWF
80 '221 mg/1SS
5242 mg/1
1\11-1,4i-N 35 mg/1TKN 59 mg/1
Primary ,solids separationChemical addition
Lime dose as CaO 230 mg/1rerric chloride dose 20 mg/1pH 11.0
Flocculation and grit removal tanksNumber 2Volume (each) ; 27,700 cu ft (785 m3)Detention time (ADWF) 20 min
Primary sedimentation tanksNumber 4Length 212 ft (64.7 m)Width 38.4 ft (11.7 m)Depth 8.9 ft (2.7 m)Overflow race at ADWF 880 gpdi.sf .(1 3.5.7rm3/rn`/daY)Detention time at ADWF
Air blower. /Number / 3
7.5 prig (0.53 kgf /cmDischarge oressure )
Capacity - /total 90,000 cfm (2,550 m3/min)Biological nitrification tanks
Number of tanks. - 4 fCompartments per tank 8Width 35 ft (10.51m) ;Length/compartment 39.4 ft (121m)Depth 16.2 ft (4.95 m)Volpme (4 tanks) 565 cu ft (19,960 m3)CO2 requiredDetention time at ADWF
3,600 lb/da4y,4(1h3r,600 kg/day)
BOD5
load 0.18 lb BOD5/1b MLVSS /dayFinal Sedimentation tanks.
Number 5Diameter 120 ft (36.6 m)Sidewater depth 20.6 ft (3.28 m)Overflow rate at 3 x ADWF 1;635 gpd/sf (66.6 m3 /m2 /day)
Biological denitrification columnsNumber of cells 8Width/cell 32.2 ft (9.8 m)Length/cell 40.2 ft (1,2.3 m)Media depth 20 ft (5.8 m)
_Total media -volume 196,750 cu ft (5,572,m ),Application, rate 146 gal/cu ft/day (19.0 re/re/dal')Methanol to nitrate - N ratloa
Effluent filtrationNumber . 4Width 23.75 ft (7.24 m)Length 105 ft (32.00 m)Media depth
Anthracite 3.5 ft (1.06 m)Sand 1.5 ft (0.45 ml
Filtration rate at 3 x ADWF 6.0 gpm/sf (4.1 1/m /sec)Water backwash rate 18.6 gpm/sf (12.65 1/m2/sec)
9-42
414

TABLE 9-16.
LOWER MOLONGLO WATER QUALITY CONTROL
CENTRE (AUSTRALIA), DESIGN DATA (CONTINUED)
,Effluent chlorination7dechlorinationNumber of tanksContact time at ADWF
Solids disposal and lime reclamattbnPrimary underflow solidsFirst stage centrifugation (classification)
Number of centrifugesCalcium carbonate recoveryCake solids contractionTotal solids capture
Second stage centrifugation (clarification)Number of centrifugesCake solids concentrationTotal solids capture, minimum
FurnacesNumberDiameter of hearthNumber of hearthsRated capacity
Sludge burning dutyRecalcination duty
Reclaimed lime to storageRecycled lime fraction
1
50 min,
198,450 lb/day (90,000 kg/day)
1
90 percent50-60 percent
60 percent
3
12-18 percent70 percent
2
22 ft (6.7 m) z/9 /
70,400 lb DS/day 02,000 kg/day)237,600 lb DS/day/(108,000 kg/day)
47,960 lb/day/(21,800 kg/day)68/percent
aAssumed influent nitrate nitrogen: 28 mg/1
discussion which follows includes the design of the denitrification facilities for this plant asit provides an example of how denitrification can be incorporated in a large plant. Most ofthe discussion in this section is drawn from the Process Design Manual for UpgradingWastewater Treatment Plants, an EPA Technology Transfer publication.37
In 1,969, very Mlle performance data were available on the alternative phosphOrus andnitrogen removal methods that might be used in this situation: Through the cooperation ofthe Joint EPA-DC Pilot Plant, it was possible to pilot and evaluate several alternativenutrient removal treatment sequences. Based on these studies, two-point addition of a metalsalt was selected fOr phosphorus removal, and it was determined that nitrogen removalwould be best achieved through biological nitrification and denitrification processes. Thepilot studies also indicated that to consistently meet the established effluent standards,multimedia filtration Was required. Anticipated performance data for the upgraded plant arepresented in Table 9-17: Figures 9-15, 9-16 and 9-17 show, respectively, the flow diagramsfor the primary and secondary systems, nitrification and denitrificatiOn systems andfiltration and disinfection systems of the plant.
The existing secondary system consists of four aeration tanks and 12 sedimentation unitsTo handle the anticipated increase in plant design flow from 240 mgd to 309 mgd, (10.5m3/sec to 13.6 m3/sec) the existing secondary system' will be enlarged with two additional
9-43
415

FIGURE 9.14
SECTION THROUGH NITRIFICATION TANKS AT THE LMWQCC,
CANBERRA, AUSTRALIA
EFFLUENT
COLLECTOR PIPE
..x.0:00016')SYNj
hao»Wolokot0:0110X0OXCEC
PM-Avacyo;:
MI'XE
,L IOU
LEVEL
CONTROL PRIMARY SOLIDS
GATE SEPARATION TANK
a
RETURN ACTIVATED SLUD4
DISTRIBUTION CHANNEL1
CARBON DIOXIDE
. (STACK GAS)
COMPARTMENT TYPICAL')
TO
FINAL
CLARIFIERS
..0`6WOMAN
AIR (TYPICAL
PLUG FLOW NITRIFICATION TANK ,(OrstE OF FOUR)
ti
417
TABLE 9-17
ANTICIPATED PERFOR D A AND EFFLUENT STANDARDSBLUE PLAINS' PLANT (REFERENCE 39)
InfluentSecondaryEffluent
NitrificationEffluent
DenitrificationEffluent
FiltrationEffluent
..
EffluentStandard
BOD, mg/1 206 35 10 6 4 5
Total phosphorus, mg/I,4v
8.4 2.0 1.0,
0.5 0.2 .0.22 ,
Nitrogen:Organic-N, mg/I 8.6 3.0 1.0 -1.0 0.5 4-N/11-N, mg/1 13.7 -14.8 1.5 1.0 1.0 -
NO2 4- NO3-N, mg/1 j 0 0.2 11.1 1.0 0.5 -Total N, mg/1 22.3 18.0 13.6 3.0 4' 2.0 2.4
aeration tanks and 12 additional final sedimentation tanks. The aeration tanks are designedfor a volumetric loading of 120 lb BOD5/1,000 cu ft/day (1.92 kg/m3/day), an organicloading of 2.4 lb BOD/lb MLSS/day and a MLSS concentration of 1,300 mg/1. Sinc; theincreased design loadings require more air per unit volume than the existing aeration systemcan deliver, the existing aeration capability will be increased. This system will be modifiedfrom a coarse-bubble, spiral-roll system to a coirse-bubble, spread-pattern system toimprove oxygen transfer efficiency. The secondary system air capacity 1.ts been designed toprovide 0.54 lb 02/lb BOD5 removed.
Alum or ferric chloride will be added to the mixed liquor of the secondary system .and isexpected to remove approximatelyjO percent of the phosphorus contained in the plantinfluent. The addition of metallic salts to the secondary system is also expected to improvethe BOD remoJal in the secondary system- from 75 percent to 85 percent. This'will ensure asecondary effluent BOD concentration of less than 40 mg/1, which was found during Pilottesting to be desirable for successful nitrification in' the second stage. To remove most of theremaining phosphorus, metallic salts will also be added to the nitrogen release tanks.
Biological nitrification facilities are designed for oxidation of 0.066 lb NH4-N/lb MLVSS/dayat Minimum wastewater temperatures and a MLVSS concentration' of 1,700 mg/l.At the stoichiometric oxygen requirement of '4.6 lb 02/lb NH-N oxidized, one hundredand twenty - 75 hp turbine aerators are required. Maximum air supply to the turbines willbe 88,000 cfm (2500 m3/mit0. The turbines were selected in this instance because, due tothe limitations of the site, the nitrification tanks are designed to haye. depths 0430 feet(9.15 m) to obtain the required volume. The turbines will provide adequate mixing to thisdepth and are capable of supplying a range of oxygen to the system as required by varyingammonia-nitrogen influent loads and varying wastewater temperalures. Lime will be addedto the nitrification reactor to maintain a minimum wintertime pH of 7.5.
9-45
4 8

ANACOSTIA
FORCE MAIN
FIGURE 9-15
WASHINGTON, DC, BLU
FLOW 6IAGRAM OF PRI
CL24
+u
AINS TREATMENT PLANT
RY AND SECONDARY SYSTEMS
FERRIC OR AL M
f,
I
1
/8111111111111O
DISINFECTIONTANKS
EXcESS FLOW TO'RIVERNamoommemilo =we risimumo elm= um+
SECONDARYSED. BASINS
RAW V
WASTEWATER
PUMPSTATION
Eiturmii]t
FERRIC OR ALUM
0z SLUDGE I
PROCESSINGRECYCLE
EXIST.SECONDARYREACTORS
NITRIFICATIO
INFLUENTv
ALT. TOFILTERS
OROUTFALLRAW II
WASTEWATER
EXIST.PUMP
STATION
EXIST
AERATEDGR,I1 CHkMBER
EXIST,
SECONDARYREACTORS
EXIST.SECONDARYSED. BASINS
LEGEND
CONTINUOUS INTERMITTENT
FLOW i? FLOW
SLUDGE swei.intan.m.
WASTEWATER M1031=11113
CHEMICALS 481-UNIMS1111
(INC. AIR)
PRIMARY SLUDGE
)
OR
RSL ,,RETURN SOME
1,1
WSL WASTE SLUDGE
V .
WSL
TO FLOTATION THICKENERS
Alf. TONITRIFICATIO
ORDENTTRIFICATION

LIME
SECONDAIY.
EFFLUENT
FIGURE 9-16
WASHINGTON, D.C. BLUE PLAINS TREATMENT PLANT
FLOW DIAGRAM OF NITRIFICATION AND DENITRIFICATION SYSTEMS
FP0171MER
NITRIFICATIONREACTORS
A
RSL
4
AIR
..=1
' NITRIFICATION.SED. BASINS
ALT. WSL FROMSECONDARY
ORDENITRIFICATION
T wsi
l'MmOMMOMOOMMMEIMMW#OF
METHANOL
k
PUMPSTATION
SPENTWASHWATER
FERRIC OR ALUM
AIR
r-DENITRIFICATION I.
REACTORS
POLYMER
tNITROGENtELEASE.
TANKS
...,
114411
R.SL
DENITRIFICATION TO MULTIMEDIA'SED. BASINS
FILTERS
WSLTO
FLOTATION THICKENERS
r
ALT. WSL FROM
' SECONDARY'OR
NITRIFICATION
WSL
SLUDGE
WASTEWATER
CHEMICALS
(INC. AIR)
RSL
WSL
LEGEND
CONTINUOUS
FLOW
mminamoNuolm
4
' INTERMITTENT
FLOW
0#111#0111=11=1=1.1
#II MiII ON=0
4
RETURN SLUDGE
WASTE' SLUDGE

SPENT WASHWATER
TO NITROGEN 'RELEASE'
INFLUENT CHANNEL
DENITRIFICATION
FIGURE 9-17
WASHINGTON, D.C. BLUE.PLAINS TREATMENT PLANT
FLOW DIAGRAM OF FILTRATION AND DISINFECTION SYSTEMS
I
tyr
EFFLUENT
,
PUMP'
STATION
POLYMER
PUMP
STATION
ALT.
SECONDARY
EFFLUENT
CL
r.
) WASH
WATER
MULTI-MEDIA
FILTERS
!tram" ALT, .
i
; (.1;
v/
LEGENIy
N..
' CONTINUOUS- ',INitFIS11TTENT
' 'FLOW ' . FLOW
WASTEWATER ;070.7077!
CHEMIdILLS isPimmork
INCINERATOR
SUS-COOLING
WATER
4
CL2
OUTFALL 10
RIVER
C 2,
RECLAIMED
FINAL,EFf
PUMPS
i;LUSHING, SERVICE AND
DILUTION WATER
4
ALT.
SECONDARY
EFFLUENT
)7.
Ihe nitrification sedimentation tanks are designed for average and peak hydraulic and solidsloadings of 0 and 1,310 gpdtsq ft (23.6)i)3/an2/day and 49.3 m3/m2/day) and 17.4 and'136.6 lti/s ft/day (85 and 14 kg/In2fday),. respectively. The sludge return sStstem. is
r;designed to provide retI Urn of 40 percent Of peak flow: However, the system will normally,
be operated ;return `30 percent, of the average flow. Continuous monitoring of the DOcontent of the nitrification effluent Will 156 prOvIded lo enshre that the influent DO to.the'denitrificatiOn system is Minimized. . i ,'". ' " \ I
The biological. denitrification systernislaid OW:to:Molt:1de reactors, nitrogen reldase tankSand sedimentation tanks. ,The rezictors have been designe4.,for.removal of 0.0425 lb NO3N /day /lb; NILVSS at a design M.LVSS-ConCentratiOn of 2,1;00 mg/1, with up to,4.5 lb
. methanol added/lb NO3- applied. The reaotOrsivilk,be'.44 ft (13.4 m) deep and -beequipped with forty-eight - 75 hp mixers, and will be 'covered but not airtight. ,
The nitrogen release tanks were designed to serve three functions: (I) to strip supersaturated. nitrogen gas; (2) to provide mixing for second-stage metal salt, addition for,tresidual
phosphorus removal an (3) to provide an aerobic zone for removal of exce/snetlianol.1 ,
'Mhese tanks will furnish a 20-minute detention peridd at average flow and 12 minutes at,,,,,,,i ,`., Peak flow.4Q
II:
the denitrification sedimentation tankSar6,d'esigned for hydraulic loadings of 670 g pd/sq ft32 32(27.3M/m/day) a4rafe low,,,and,1:410 gpd/sq ft (57.4 m/m/day) at peak flay.
Solids1 loadings are 25.6 : 'd 54.0 lb/Sq ft/day. (125 and 264 kg/m2/day) at average and pe,alcflows, respectiifetY. , r
... .
,'he 36 multimedia filters a4 designed for filtration, rates of 3.0 gpni/sq ft (2 1 /m2 /sec) ati
0; ,
,airerage :flow and 6.2 gpints ft (4.2 1/in2/slec) at peak flow. 13ackwashirii yij1 b4,;tion'atintervals' of 24 hours at a ratr of 25 gprnisVft,, (17 1/m"2/sec). The backwash water'ivifi be;,
,;" lized in conduits and may, be returne.duptream of either the secondary reactors or thein In release tanks. ,
- -,1 .
,.,Noy on has been made to db1:* e either Otrearn or downstream of the filters with 24`detention provided in cvi act tanks'following the filters.
..,,:....
.....Trqessing facilities will include graVity 'thickening 6C:primSry sludge, flotation,.....,:. flotation
,,thickening of se.condary, and advanced treatment sludges, vaeiium filtration and slOge'neineration. ,.
:...
9.5.2.4 El Lago, TeXas ;:*1.
El L gol?,Texcas, is a small suburban community of 3,000 persons located near the LyndonJoIt.Space Center. The operating agency for wastewater treatment is the Harris County f.Wa tkontrol.and,Iinprovement: District *50. This district currently operates a 0.3 mge,,77:(0.0 tri /sec) treatment plant, In 69, the District received an order from'the Texas
9-49
432
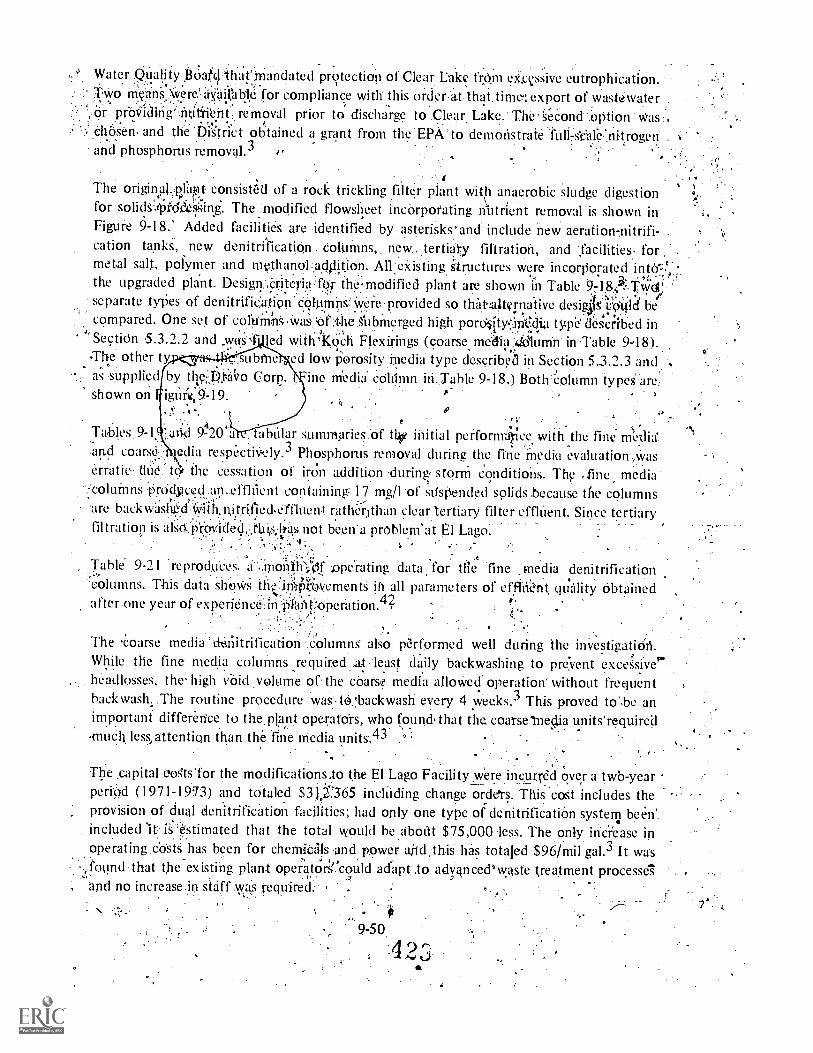
Water Quality.,BOatdthat'mandatecl protection of Clear Lake frOm excessive eutrophication..' Two Means 'i'vere'thi,ailliblc for compliance with this order 'at.that.tinwl export of wastewater.,Or pr'6(iiding'initti'ent removal prior to discharge to ,Clear Lake. The second 'Option *was.,
Chosen and the '1".ii'4riset obtained a grant from the EPA: to demOlistrate'fulhs'esafe)ii-trogen.
and phosphorus removal.3
The original.plakit consisted of a rock trickling filter plant with anaerobic sludge digestionfor -solidS.,,pfd&'siiing. The modified flowslieet incorporating nutrient removal is shown inFigure 9 -18.' Added facilities are identified by asterisks and include new aeration-nitrifi- .
cation tanks, new denitrificatiOn eoltimns new...tertiatcy filtration, and 'facilities: formetal stilt, polymer and rnethanol:;a4litiOn, All existing structures were incorporatedthe upgraded plant. Designeriterit!''fOr the modified plant are shown in Table 9 -18 Two'separate .types of denitrific;ation'COlumns*ereprovided so th4t.talternative desigjigyOttld becompared. One set of CoitiM;ril S..),ya4:;6:r..the:Slibinerged high pord0r:ipsicli4i- tstpe' described in
'Section 5.3,2.2 and .waSi. led w.ith'kOeh Flexirings (coarse mcititi:4..q1urrin in .Table 9-18).The other ty subtle ed low Porosity.Media type described in Section 5 3:2.3 andas supplied by ths;:,Pkiio Corp. ine 'media coltimn iii. Table 9-18.) Both column typei.tireShown on
r ;-Tables. 9-1 titi-d 9-20'a tabular summpries..:of tlf initial perfornrailce...withthe fine mexiiti.and cotirsii edit' respe'ctiVely.3 Phosphonis removal during the fine inedki evaluationWaserratic- dire. t the cessation of iron addition .during. storm conditions. The tine media'columns PrOdpced.tm..effhlent containing: 17 'my,/l.of suspended solids .because the columns.tire rather)than clear tertiary filter effhient. Since tertiary
.
filtration is zdsd..::provided,...tti,s.11.4. not been 'a prOblem'at Lago.
Table 9-21 reproduee.s. Dperating data, for 'tlie fine -media denitrificationcolumns. This data shows ilielir41:gyementS it) all parameters of efiltint quality obtainedafter one yeti'. of experience,iii?Pl1Mt.7Opertition.4?
The Coarse media clealitrilication ,columns also performed well during the investigatidn.While the fine media columns required at least daily backwashing to prevent excessivheadlosses, the high void .volume of. the coarse media alloWed operation' without frequentbackwash..The .routine procedure was t6.!backwash every 4 weeks.3 This proved to'be animportant difference to the.plantoperatOrS, who foundthat the coatsetiedia units'required,much less, attention than the fine media units,L"
The capital c'oSts'for the .modifications to the El Lago Facility were incurred over a two -yearperiOd (197.1-1973) and totaled $30;365 including change orders. This cost includes theprovision of dual denitrification facilities; had only one type of denitrification system been'.included it,.1§'.estimated that the total would be about $75,000 less. The only increase ipoperating.CdstS has been for chemials ond power and, this has totaled $96/mil ga1.3 It was
,
-. found that theexisting plant operatots!., could adapt adyanced' waste treatment processes'and no increase. in. .;,/as -required:- . r
N
9-50
94'-,
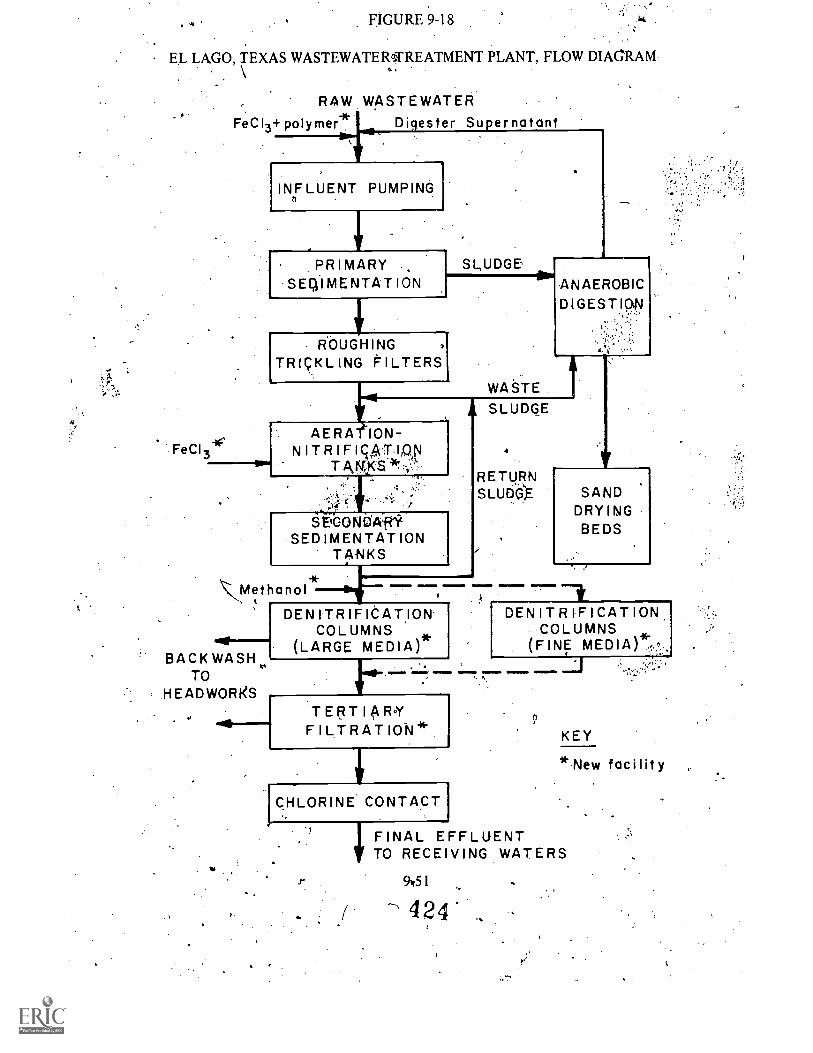
A
FIGURE 9-18
EL LAGO, TEXAS WASTEWATER'REATMENT PLANT, FLOW DIAGRAMa.
Fe CI
RAW WASTEWATERFeCI3+ polymer* Digester Supernatant
INFLUENT PUMPINGf3
PRIMARYSEDIMENTATION
ROUGHINGTRICKLING FILTERS
AERArION-N ITR IF lc A.T.1,clq1
TANKS
SLUDGEANAEROBICDIGEST ION.,,,...:.
S GONA fri`SEDIMENTATION
TANKS
Methanol*
BACK WASHTO
HEAD WORKS
DEN ITR IFICATION'COLUMNS
(LARGE MEDIA)
TERTIARYFILTRATION*.
CHLORINE CONTACT
WASTESLUDGE
RETURNsLuEiGE
; '
SANDDRYINGBEDS
1DEN I T R IF I CAT ION
COLUMNS(FINE MEDIA) 0
0
KEY
*New facility
FINAL EFFLUENTTO RECEIVING WATERS
951
7 424%
.

TABLE 9-1
DESIGN DATA, EL LAGO, TEXASVASTEWATER TREATMENT PLANT
Vbpulatton...Ave6g4.dry'weather flow (ADWF))Peak dry weather flow (PDWF)Peak wet weather flow (PWyVt)Raw wastewater quality
. 5SS
Total Kjeldahl nitrogenPrimary sedimentation tanks (existing)
Number ..;
Detention time (ADWF)Overflow rate (A!'WF)
Roughing trickling filter (rock, existing)NumberDepth
-. Rock sizeVolume of mectli!'Ofganic load (ADWF)Recirculation rate
Mr blowers (new)NumberDischarge pressUreCapacity total
Aeration-nitriabation tanks (new)NumbArrangementVolume - TotalDptention time (ADWF)trlt,VSSSolids retention time
Secondary spdimentatiop tanks (existing)Number / . ,
Detention tirrie'VA,1)4.A/F)Overflow ra;te..at.ADWr
< Overflow tate at PWWFDenitrificagon. columns
Coarse..ilieCila(eries)
Type'DiameterMedia depthMedia type ,
Specific surfaceVoidsEmpty bed contact timeSurface application rate at'ADWFMr backwash rateWater backwash rate
Fine mediaNumber (series)TypeDiameterMedia heightMedia typeSpecific surface
.\.zoldsEmpty bed contact timeSurface application rated at ADWFAir backwash rate..Water backwash rate
9-52
rt;
3,0000.3 rngd (0.013 m3/sec)0.5 mgd (0,022 m3/sec)1.0 mgd (0.044 hi /sec)
161 mg/1195 mg/1
37.5 mg/1
2
1.6 hr440 gpd/sf (30;i:0/m2/d/3y)
2
6.5 ft (2.0 m)"4 in (100 mm)
20,900 cu ft (590 m3)12 1):1410D,'/1,000 cf/day (0.192 kg/m 3/day)
5.3 mgd (0.013 m3 /sec)
2
6.5 psig (0.46 kgf /cm2)900 cfm (25.2 m3/min)
2
Series10,100 cu ft (302 m3)
6.1 hr1,000 mg/1
10 days
2
S.4 hr320 gpd/sf (13 m3/m2/day)
1,060 gpd/sf (42 m3/m2/day)
2
50 psig (3.5 kgf/cm2) pressure vessel10 ft (3 m)10 ft (3 rn)
Koch Flexirings.105 sf/cu ft (346 m2/m3)
92 percent'1 hr
2.5 gpm/sf (1.6 1/m2/sec)10 cfm/sf (3.1 m3 /m2/min)20 gpm/sf (13.5 1/m2/sec)
2
50 psig (3.5 kgf/cm2) pressure vessel6 ft (1.8 m)
6.5 ft (2.0 m)3 to 4 mm uniform sand
.250 sf/cu ft (825 m2/m3)40 percent
0.25 hr7.4 gpm/sf (5 1/m2/sec)
8 cfm/sf (2.4 m3/m2/min)20 gpm/sf (13.5 1/m2/sec)
425
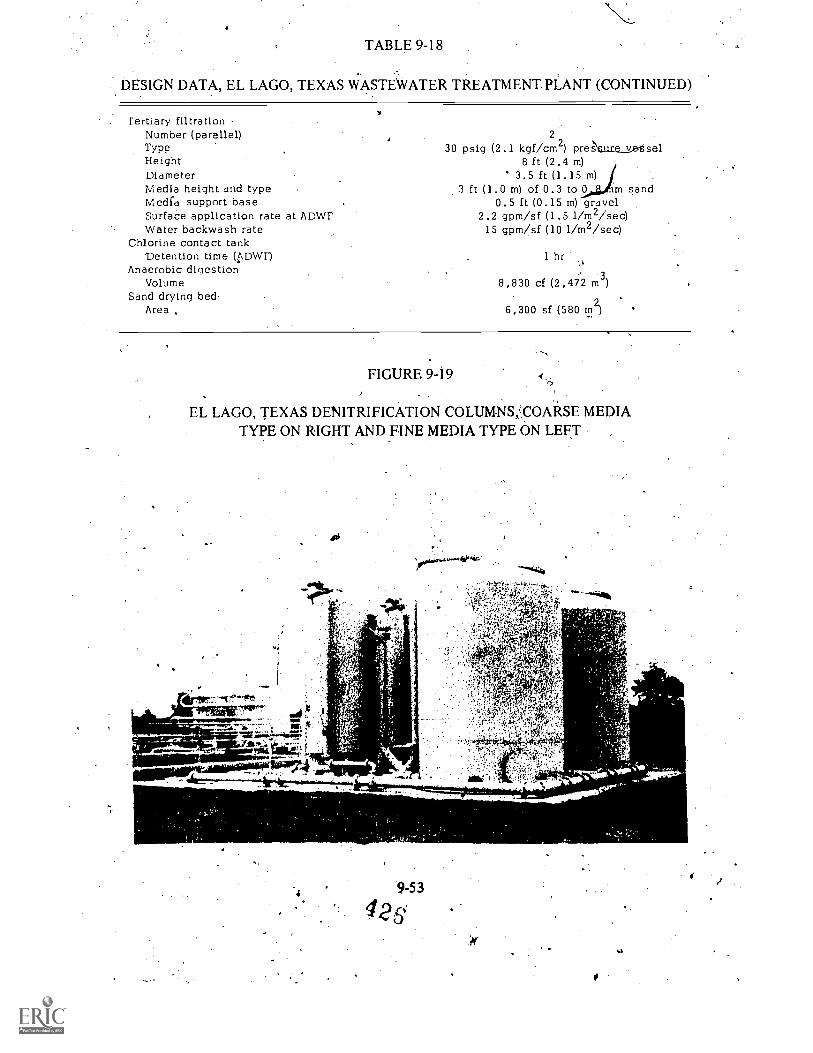
TABLE 9-18
DESIGN DATA, EL LAGO, TEXAS WASTEWATER TREATMENT. PLANT (CONTINUED)
Tertiary filtrationNumber (parallel)TypeHeightDiameterMedia height and typeMedia support baseSurface application rate at ADWFWater backwash rate
Chlorine contact tankDetention time (ADWF)
Anaerobic digestionVolume
Sand drying bedArea ,
2
30 psig (2.1 kgf/cm2) preh.ure veetsel8 ft (2.4 m)
3.5 ft (1.15 m)3 ft (1.0 m) of 0.3 to 0 m sand
0.5 ft (0.15 m) gravel2.2 gpm/sf (1.5 1/m2/sec)15 gpm/sf (10 1/m2/sec)
1 hr
8,830 cf (2,472 m3)
6,300 sf (580 m2)
FIGURE 9-19 4
EL LAGO, TEXAS DENITRIFICATION COLUM-NS,ICOARSE MEDIATYPE ON RIGHT AND FINE MEDIA TYPE ON LEFT
6
'4. 9 -53
426

TABLE 9-19
INITIAL PERFORMANCE OF FINE MEDIA DENITRIFICATION COLUMNSAT EL LAGO, TEXAS JUNE 4 TQ JULY 6, 1973
constituent
Mean value, mg/1 at indicated sample location
Rawwastewater
Primary Primaryeffluent
Nitrifiedeffluent.
Denitrified.,deffluentsFinal
effluentTotal P 12.8 15.4 8.9 7.3 Ec-6 9.8Soluble P 115.3 4.7 9.1 .3.4 5.5 3.6SS 113 289 72 37 17 3
NH4 -1V 18.7 21.7 21.5 0.9 0.8 0.6TKN 42.6 38.6 30.2 3.7 2.4 3.3
NO 3-Ne
15.2 2.6 2.3BOD5 175 222 65f 9 9
COD. 297 488 181 llf 72 51
Temperatureg 26..5
a0 b
def
Average flow to plant: 0.307 mgd (0.013 m33/ %c)Peak daily flow to plant: 1.0 mgd (0.049 m /sec)Average flow to denitrifIcation columns: 0.254 mgd (0.011 m3/yc)Peak daily flow to derittrification columns. 0.420 mgd (0.018 m /sec)Nitrite N always less thar00.2 mg/1Includes methanolDegrees C
TABLE 9-20t
INITIAL PERFORMANCE OF COARSE MEDIA DENITRIFICATION COLUMNS
AT EL LAGO, TEXAS - JULY'8 TO AUGUST 31, 1973
Mean value, mg/1 at indicated sample location
CbestItuentRaw
wastewatera.,bPrimaryInfluent
Primaryeffluent
Nit rifledeffluent
Denitrifiedeffluents'
Total P 12.3 13.1 6.7
Soluble P 10.3 - 3.1 2.4SS 102 231 63 43 19
NH 4t. -N 16.3 14.6 144 0.9 1.2TKN 29.7 31.8 26.7 2.6 2:5NO
3-Ne - ' 13.6 0.9
BOD5 143 156 87 43f 15
COD 248 336 167 4 107f 52
Temperatureg 27.2
Finaleffluenteffluent
2.8
2.3
9.5
0.9
1.7
0.6
8 r38
abcde
g
Average flow to plant: 0.320 mgd (0.014 m3 /s3ec)Real( daily flow-to plant: 0.900 mgd (0.039 m /sec)Average flow to denitrification columns: 0.315 mgd (0.014 m3/yc)Peak daily flow to denitrification columns: 0.632 mgd (0.028 m /sec)Nitrite - N always less than 0.2 mg/1Includes methanolDegrees C 9-54
42 ?
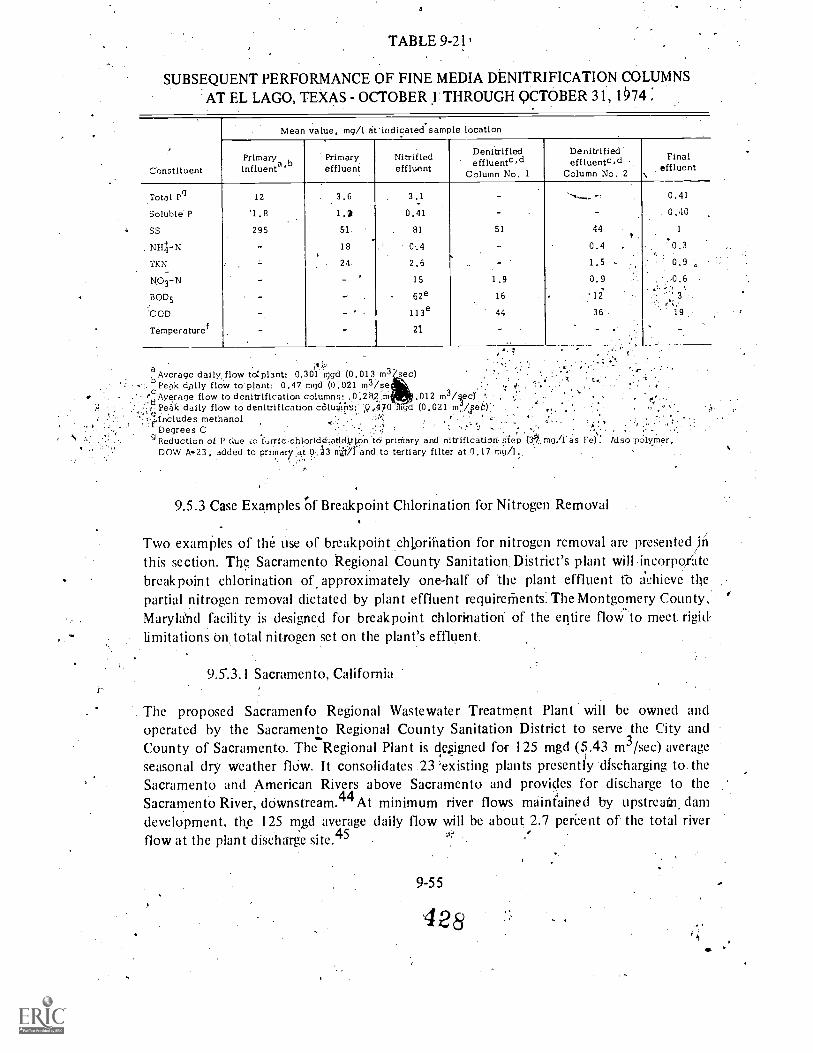
TABLE 9-21'
SUBSEQUENT PERFORMANCE OF FINE MEDIA DENITRIFICATION COLUMNSAT EL LAGO, TEXAS OCTOBER 1 THROUGH QCT013ER 31, 1974
Mean value, mg/1 a 'indlcatedsample location
ConstituentPrimarYa 13influent '
Primaryeffluent
Nitrifiedeffluent
Denitrifiedeffluentcod
Column No, 1
Denitrifiedeffluent
Column No. 2
Finaleffluent\
Total Pg 12 3.6 3.1 - __.. 0.41
Soluble P '1.8 1 .gt 0.41 - - 0.40
SS 295 51 81 51 44 1
. N1-144--N -. 18 0.4 - 0.4 .0.3
TKN 24 2.6 - 1.5 - 0.9
NO3 -N - 15 1.9 0.9
GODS - - 62e 16 'li ;-, 3
'COD 113e 44 36 19
Temperaturef - 21 - - . -..
a Average daily, flow to:planti 0.301 rsgd (0.013 m3 sec)b
. Peak dally floW to'plant: 0.47 mgd (0.021 m3/se"'cAyerage flow to denitrification columns: ,0.282Si 3/ )' '..012 m vc ,
..: Peak daily flow to denitrification colusiii5:' 9,:47-0 igd (0.021 mipe6):',,e ,
.t.;.Includes methanol ' ''Degrees C N
g Reduction of P aue i.ofurrfcoh.lorid6:a14.ktton.td:prirerary and nitrification. step (3k mg.il'as Fe) :DOW A -23, added to prima ryrat 0.33 nit/1 and to tertiary filter at 0.17 mg/1.,
--
9.5.3 Case Examples Of Breakpoint Chlorination for Nitrogen Removal
Two examples of the use of breakpoint Chiprihation for nitrogen removal arc presented/inthis section. The Sacramento Regional County Sanitation. District's plant will incorpor7ate-breakpoint chlorination of approximately one-half of the plant effluent to achieve thepartial nitrogen removal dictated by plant effluent requirethents. The Montgomery County,Maryhend facility is designed for breakpoint chlorination of the entire flov to meet rigid-limitations on total nitrogen set on the plant's effluent.
9.5.3.1 Sacramento, California
The proposed Sacramento Regional Wastewater Treatment Plant will be owned andoperated by the Sacramento Regional County Sanitation District to serve the City andCounty of Sacramento. The Regional Plant is designed for 125 mgd (5.43 m3/sec) average
Seasonal dry weather fldw. It consolidates 23 'existing plants presently discharging to. theSacramento and American Rivers above Sacramento and provides for discharge to theSacramento River, downstream." At minimum river flows maintained by upstreatn. darndevelopment, the 125 mgd average . daily flow will be about 2.7 perc. ent of the total riverflow at the plant discharge site. 45
9 -55
428qr
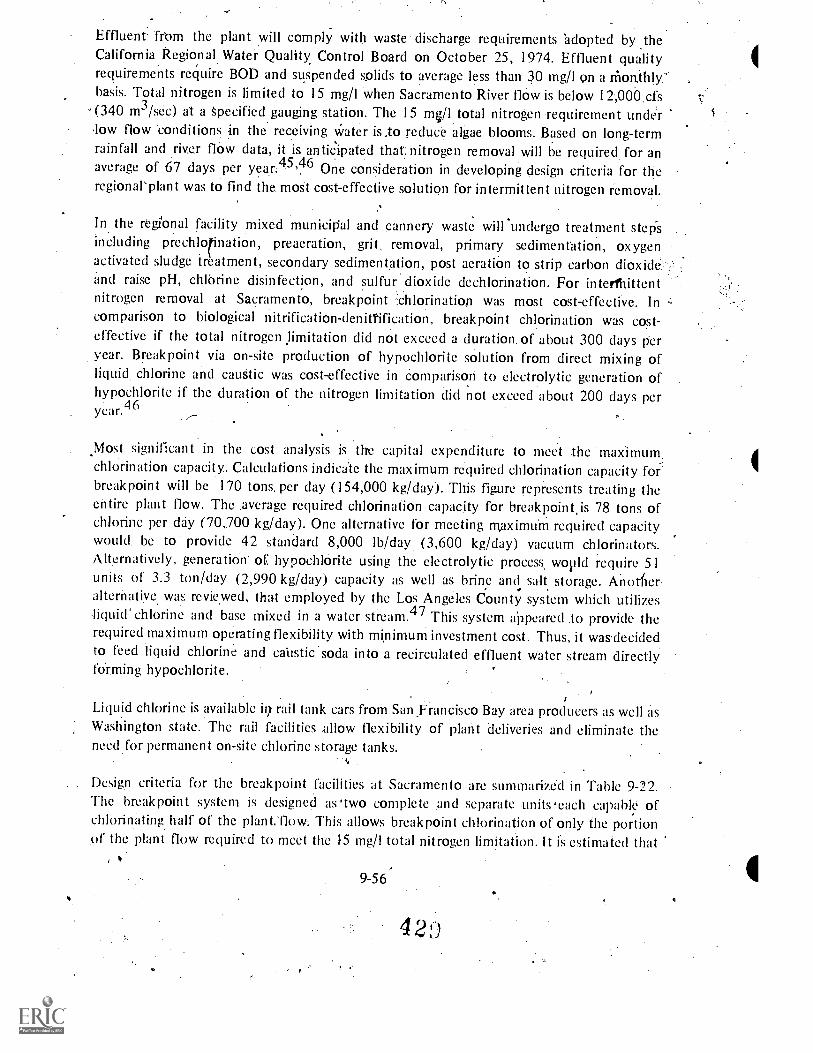
Effluent froth the plant will comply with waste discharge requirements adopted by theCalifornia Regional Water Quality Control Board on October 25, 1974. Effluent qualityrequirements require BOD and suspended solids to average less than 30 mg /I on a Monthly'basis. Total nitrogen is limited to 15 mg/1 when Sacramento River flow is below 12;000 cfs(340 m3 /sec) at a Specified gauging station. The 15 m4/1 total nitrogen requirement underlow flow conditions in the receiving water is.to reduce algae blooms. Based on long-termrainfall and river flow data, it is anticipated that nitrogen removal will be required for an
6average of 67 days per year45 ,4 One consideration in developing design criteria for theregional`plant was to find the most cost-effective solution for intermittent nitrogen removal.
In the regional facility mixed municipal and cannery waste will'unclergo treatment stepsincluding prechlotination, preacration, grit, removal, primary sedimentation, oxygenactivated sludge treatment, secondary sedimentation, post aeration to strip carbon dioxide.and raise pH, chlbrine disinfection, and sulfur dioxide dechlorination. For interthittentnitrogen removal at Sacramento, breakpoint '::chlorination i was most cost-effective. In '-
comparison to biological nitrification-deniffification, breakpoint chlorination was cost-effective if the total nitrogen limitation did not exceed a duration. of about 300 days peryear. Breakpoint via on-site production of hypochlorite solution from direct mixing ofliquid, chlorine and caustic was cost-effective in Comparison to electrolytic generation ofhypochlorite if the duration of the nitrogen limitation did not exceed about 200 days peryear. 46
Most significant in the cost analysis is tire capital expenditure to meet the 'maximum,chlorination capacity. Calculations indicale the maximum required chlorination capacity forbreakpoint will be 170 tons, per day (154,000 kg/day)..T1Us figure represents treating theentire plant flow. The ,average required chlorination capacity for breakpoint.is 78 tons ofchlorine per day (70,700 kg/day). One alternative for meeting maximuin required capacitywould. be to provide 42 .standard 8,000 lb/day (3,600 kg /day) vacuum chlorinators.Alternatively, generatiOn' of hypochlorite using the electrolytic process, would require 51units of 3.3 ton/day (2,990 kg/day) capacity as well as brine and salt storage. Anotfieralternative was reviewed, that employed by the Los Angeles County system which utiliiesliquid' chlorine and base mixed in a water stream. 47 This system appeared to provide therequired maximum operating flexibility with minimum investment cost. Thus, it wasdecidedto feed liquid chlorine and caustic soda into a recirculated effluent water stream directlyforming hypochlorite.
Liquid chlorine is available ir7 rail tank cars from San Francisco Bay area producers as well asWashington state. The rail facilities allow flexibility of plant deliveries and eliminate theneed for permanent on-site chlorine storage tanks.
Design criteria for the breakpoint facilities at Sacramento are summarized in Table 9-22.The breakpoint system is designed as'two complete and separate .units'each capable ofchlorinating half of the plant. low. This allows breakpoint chlorination of only the portionpf the plant flow required to meet the 15 mg/1 total nitrogen limitation. It is estimated that
9-56
42u
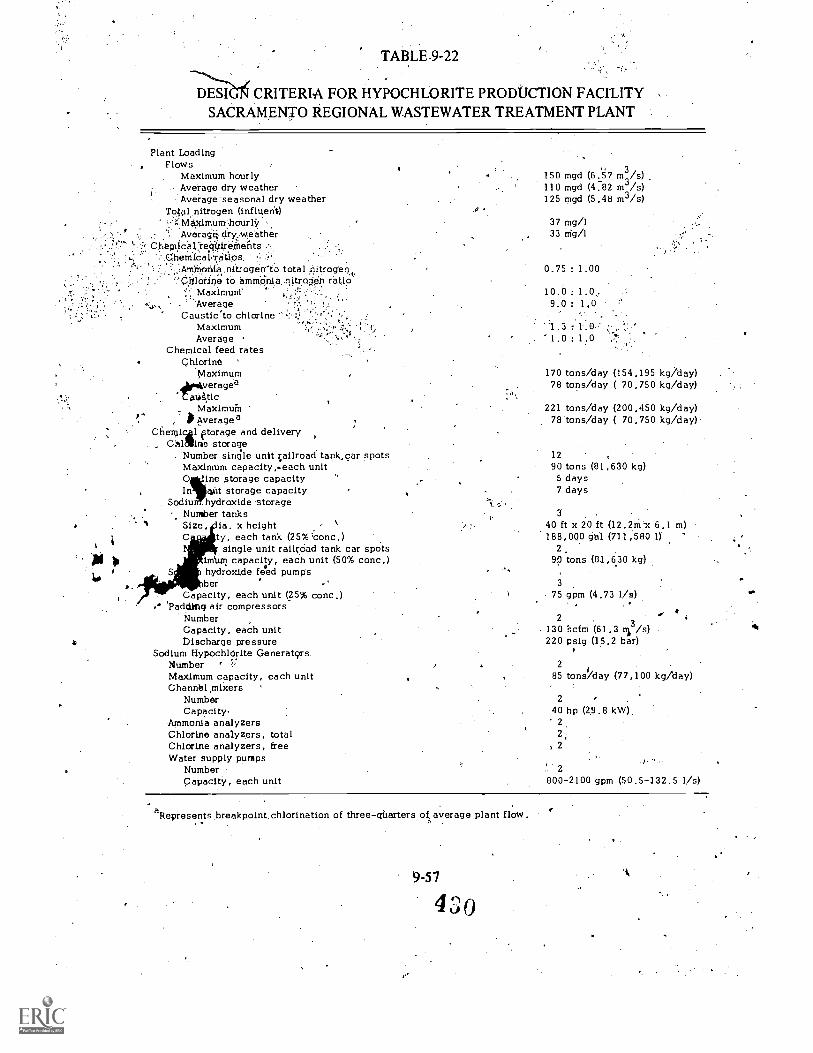
TABLE.9-22
DESIGN CRITERIA FOR HYPOCHLORITE PRODUCTION FACILITYSACRAMENTO REGIONAL WASTEWATER TREATMENT PLANT
Plant Loading, Flows
Maximum hourlyAverage dry weatherAverage seasonal dry weather
To;a1.nitrogen (influent)t...,:.MaXimum:hoUrly
:',. AveragOry_weetherCheinicel,:re.Oireilients ..1.
...ChernicaLTafios. ..". '.','
''..:A_rn.iiiotita.nitrogerr'to total Attrogen.,........ .,' C.Illorine to 8mmiinia..riltrOer1 ratio
Maximum' ' .'-.,..!....,. ,,.;:.,, .
'AverageCausticto chlorine
MaximumAverage
Chemical feed rateschlorine '
Maximumdirliveragea
'CA 1 h glticMaximufn
JO Average aCilergicAl etorage and delivery
C'nlgifine storage. Number single unit railroad tarik,car spots
Maximum capacity,each unit0 ine storage capacityIn gilt storage capacity
Sodiu .hydroxide storageNumber tanksSize, ia. x height , \C ty, each tank (25%7conc)
single unit railroad tank car spotsimam capacity, each unit (50% conc.)hydroxide feed pumpsber ,-.'
Capacity, each unit (25% conc.)'Padding air compressors
NumberCapacity, each unitOischarge pressure
Sodium HypochltMite Generators.NumberMaximum capacity, each unitChannel mixers
NumberCapacity,
Ammonia analyzersChlorine analyzers, totalChlorine analyzers, freeWater supply pumps
NumberCapacity, each unit
150 mgd (07 m3.../s)110 mgd (4.82 m3 /s)125 mgd (5.48 m3/s)
37 mg/133 mg /1
0.75: 1.00
10.0 : 1.0,9.0 : 1,0
170 tons/day (154,195 kg/day)78 tons /day.( 70,750 kg /day)
221 tons/day (200,450 kg/day)78 tons/day ( 70,750 kg/day)
1290 tons (81,630 kg)
5 days7 days
3
40 ft x 20 ft (12.2m-x 6.1 m)188,000 gal (711,580 1)
2
90 tons (81,6.30 kg)
3
75 gpm (9.73 1/s)
2
130 'scfm (61.3 9,3/s)220 psig (15.2 bar)
2
85 tons/day (77,100 kg/day)
2
40 hp (29.8 kW).2
2
, 2
2800-2100 gpm (50.5-132.5 l/s)
aRepresents.breakpoint.chlorination of three-gtiarters of, average plant flow.
9-57
4 3 0
'4.

both units will be required to be operational at certain times to maintain effluentrequirements. Figure 9-20 is a simplified schematic of the breakpoint chlorination systemand its control instrumentation. The process consists of producing sodium hypochlorite byinline mixing of liquid chlorine,' water, and caustic at a chlorine concentration of7,000-8,500 ppm and a pH of .7.5. Maintenance of proper pressures in the chlorine feedsystem is the key to successful operation of the hypochlorite generation system. Experienoeat Los Angeles County White Point- plant indicates a necessary pressure of 40 psig (2;8_kgf/cm2) in the mixing tee and greater than 110 psig (7.73 kgf/crti2) at the chlorine feedvalve. These pressures require pressurizing ("padding") the chlorine railcars with 175 psig(12.30 kgf/cm2) dry air.
A chlorine reserve tank is ilsed to provide chlorine during periods when empty chlorine tankcars are being replaced with full cars and can provide about a one-hour supply of chlorine.
,
The feed rate of liquid chlorine is measured with steel.tube rotameter and controlled withan automatic valve. Pressure drop from the chlorine feed line to the mixing tee and initialmixing of chlorine, caustic and water is partially accomplished using a plug injector. To.,improve mixing immediately downstream of the mixing tee, an inline powered mechanicalMixer is provided. The hypochlorite solution line then includes three taps for pH meteringand a back pressure valve to maintain 40 psig at the mixing tee. The pH meters areduplicated for each unit. The duplication is, for improved reliability 'of the pH system andthe multiple taps are for additional flexibility in selecting the point which is monitored forconrol purposes.
The related feeds of caustic and water are proVided by pumping from the chemical storage.area and the effluent channel. Caustic is fed from storage_ tankS.:iitoighcentrifugai pumps;.automatic control valves, and magnetic flow meters. The-, control:signal is proportional tothe chlorine feed with feedback control provided by.the;PH metcrs.:_Manual caustic feed isprovided for breakpoin-t start-up and for pH adjustment'of final'effluent.
Plant .effluent is used for sodium hypochlorite solution water and is provided by twovariable greed pumps located as shown in Figures 9-20 and 9-21. The control Of the solutionflow (via..pump speed) is proportional to the chldrine feed. The solution water flow ismeasured by magnetic flow meters just ahead of the mixing tee.
The plan view of Figure: 9-21 also shows the application points for the breakpointchlorination located at the end of each battery of secondary sedimentation tanks. To insure-rapid mixing, two spargers are installed with orifices that insure a minimum exit velocity ofabout 10 fps (3.1 m/sec). Automatic valving provides one sparger for lower feed rates andtwo when flows cause back pressure to reach the control limit of the hypochlorite backpressure valve. Immediately downstream of the breakpoint spargers is a mechanical mixerfollowed by a submerged overflow weir. The mixing channel.and the post-aeration channelfollowing are covered. The exhaust can be passed through mobile activated carbon filters toremove Odors, such as nitrogen trichloride, if necessary. The activated carbon filters are
9-58 4 3
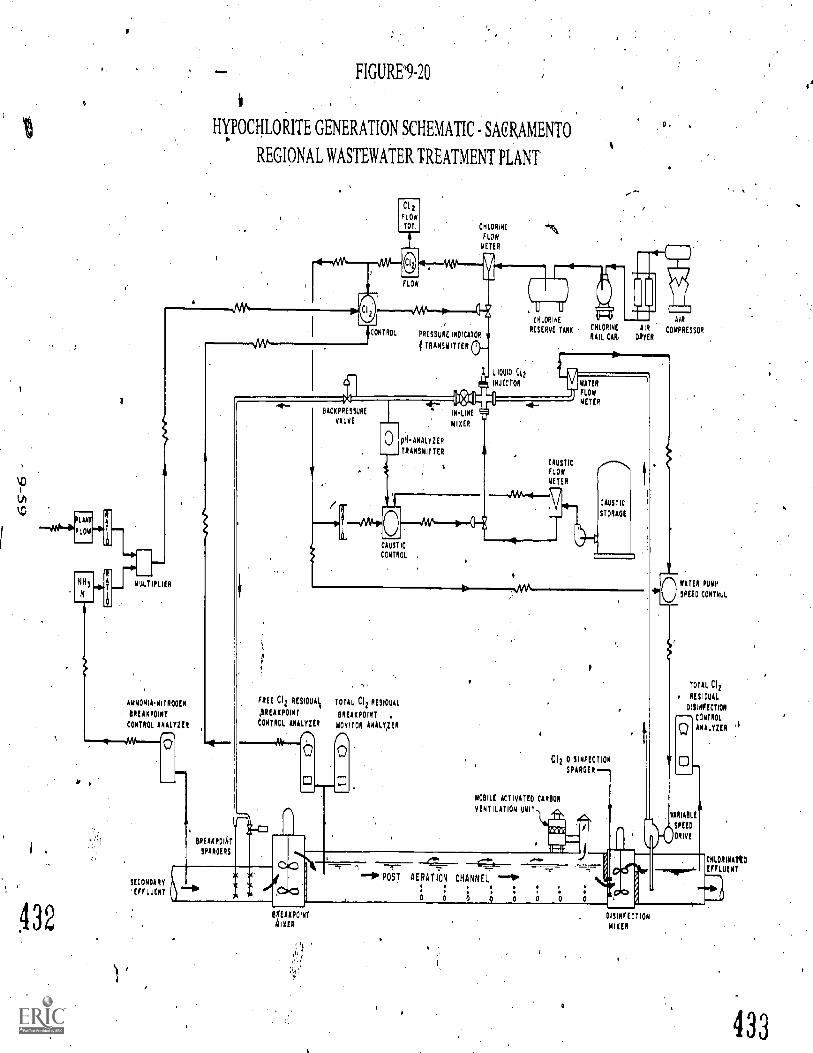
a
432
FIGURE9-20
HYPOCHLORITE GENERATION SCHEMATIC SACRAMENTO
REGIONAL WASTEWATER TREATMENT PLANT
MOLT FLIER
AMMONIANITROOEN
BREAKPOINT
CONTROL ANALYZIA
SECONDARY
'EFFLUENT
CitFLOW
TOT. CHLORINE
FLOW
METER
FLOW
CONTROL
t
PRESSURE INDICATOR
TRANSMITTER
BREAKPO KT
SPAFICIE S
BAC K PRESSURE
VALVE
LIQUID C(2
INJ CC TOR
,U U
CHLORINE
RESERVE TANK
pHANALYZER
TRANSMITTER
A
INLINE
MIXER
CHLORINE
RAIL CAR,
AIR
AIR COMPRESSORDRYER
WATER
FLOW
METER
CAUSTICFLOW
METER
FREE Cl2 RESIDUAll
AREAKPOIRT
CONTROL ANALYZER
-h.-.
CAUSTIC
CONTROL
TOTAL Cl2 RESIDUAL
BREAKPOINT
MONITOR ANALY,IIII
0
CAUSTIC
STORAGE
C12 DISINFECTION
SPARSER
MOBILE ACTIVATED CARBON
VENTILATION UNIT
C7t_-IP PO- ST AERATION CHANNEL -Om
.O
BREAKPOINT
MIXER
WATER PI)/0
SPEED CONTID,L
TOTAL Cl2
RESIDUAL
DISINFECTION
P-- -% CONTROL
0
VARIABLE
SPEED
DRIVE
DISINFECTION
MIXER
CHLORINArt0
EFFLUENT
433
A
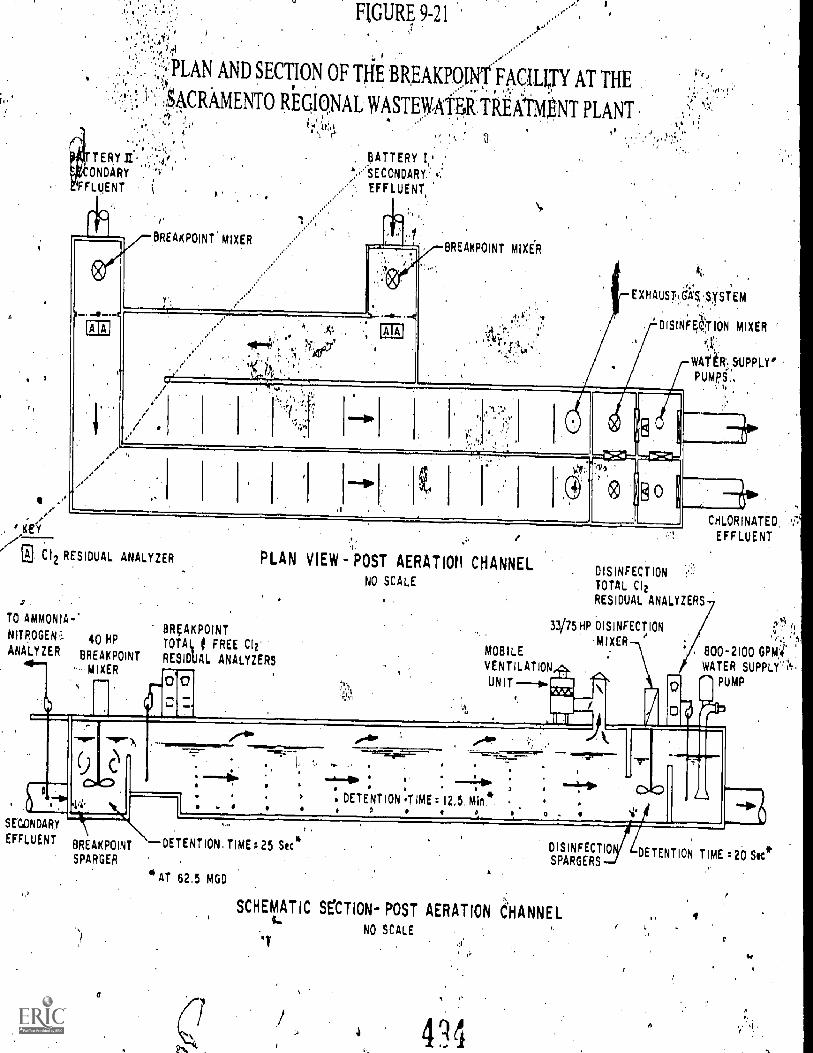
FIGURE 9-21
....',PLAN AND SECTION OF TOE BREAKPOINT FAcILI,TY AT THE
ACRAMENTO REGIONAL WASTEWATEiTkEkM,NT PLANT41:44
TERY
ONDARY
..
0
FFLUENT
A
BREAKPOINT MIXER
BATTERY I,'',SSECONDARY
EFFLUENT,
C12 RESIDUAL ANALYZER
TO AMMONIA-'
NITROGEN 40 HPANALYZER BREAKPOINT4-
MIXER
(')
15
CoC)1
SECONDARY \EFFLUENT
BREAKPOINT
SPARGER
11-.
BREAKPOINT MIXER
EXHAUST4S:,SySTEM
DIS1NFOTION MIXER '
WATER', WPPLY°PUMPS.,
PLAN VIEW POST AERATIOtI CHANNELNO SCALE
BREAKPOINTTOTA1, t FREE C12'
RESIDUAL ANALYZERS
Q
DISINFECTIONTOTAL Cl2
RESIDUAL ANALYZERS
33/75 HP DISINFECTION
MIXERMOBILE
VENT1LATION
UNIT --v.
IC 11 1.)
DETENTION. TIME 25 Sec*
. DETENT ION .T IME = 12.5. Min*
CHLORINATED,
EFFLUENT
6
800-2100WATER SUPPLY tgr.
PUMP
DISINFECTIOSPARGERS
*AT 62.5 MOD
SCHEMATIC SECTION- POST AERATION CHANNELNO SCALE
4 4
DETENTION TIME :20 Ste
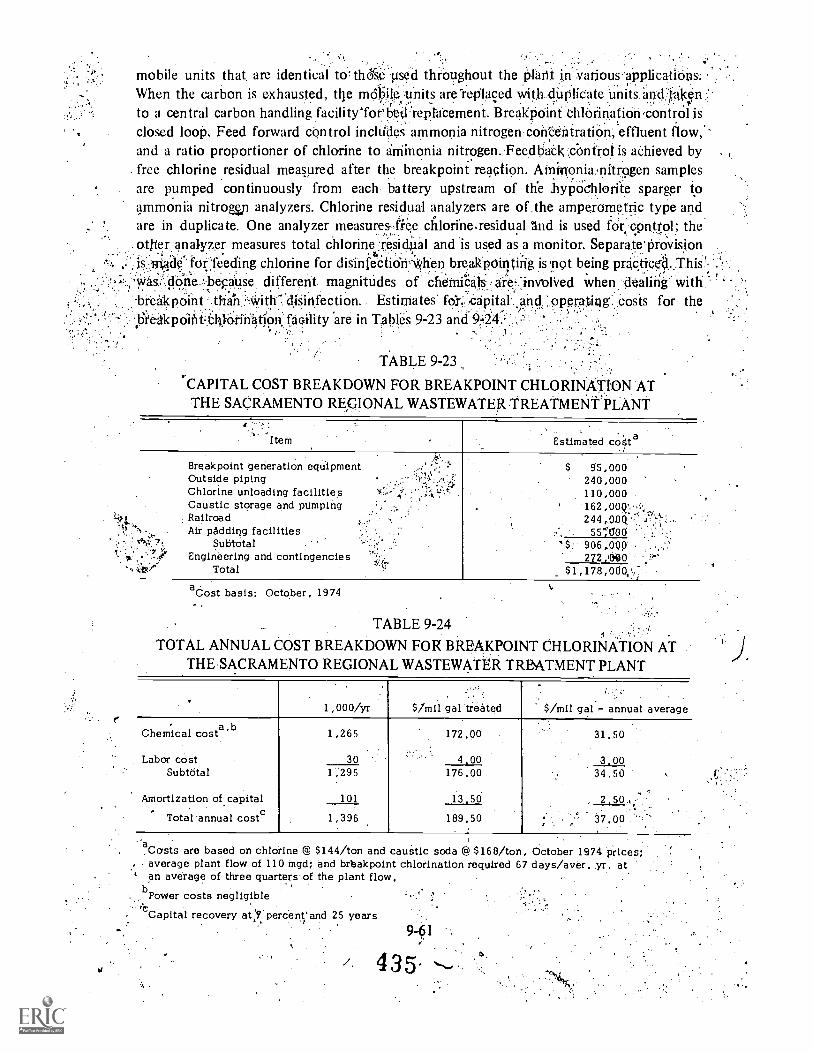
mobile units that are identical to thdse used throughout the Plinii in' VariousWhen the carbon is exhausted, die matille, units are-replaced with dUplicate units andjakiento a central carbon handling facility'for bp(1..repiacement. BreakPoint Chlorination control isclosed loop. Feed forward control inclildes ammonia nitrogen con'entratiOn, effluent flow,and a ratio proportioner of chlorine to ammonia nitrogen.-Feedbaek .cbntrot is achieved byfree chlorine residual measured after the breakpoint reaction. Ainitioniauitrogen samplesare pumped continuously from each battery upstream of the hypOchlorite sparger toammonia nitroan analyzers. Chlorine residual analyzers are of the amperoimettic type andare in duplicate. One analyzer measures,fiee cfilorine.residual 1.nd is used for control; theotjter analyzer measures total chlorine :residUal and is used as a monitor. Separate' provisionas r4ade' forfeeding chlorine for disinfection when breakpOinting is ,not being practicedAra.S.::diane.'besause. different magnitudes of chemicals are-;'involved when dealihg with'-brealspoint than :-.Vvith disinfection. Estimates foh:.,capital ,and ,gperatiqg costs for theabr'eakpoifit chlorination faeility are in Tables 9-23 and 924
., .
TABLE 9-23
CAPITAL COST BREAKDOWN FOR BREAKPOINT CHLORINATION ATTHE SACRAMENTO REGIONAL WASTEWATER TREATMENT.PLANT
Item
Breakpoint generation equipmentOutside pipingChlorine unloading facilitiesCaustic storage and pumping
101 RailroadAir padding facilities
SubtotalEngineering and contingencies
Total
Estimated cost a
$ 55,000240,000110,000162 00Q..299,00Q, j`,.
55;'1100'$ 906,,OQP
272 000$1 178 000 '
aCost basis: October, 1979
TABLE 9-24
TOTAL ANNUAL COST BREAKDOWN FOR BREAKPOINT CHLORINATION ATTHE SACRAMENTO REGIONAL WASTEWATER TRIMTMENT PLANT
1,000/yr $/mil gal treated $/mil gal- annual averager
Chemical costae 1,265 172.00 31.50
Labor cost 30 9.00 3.00Subtotal 1 ;295 176.00 39.50
Amortization of capital 101 13.50
Total annual costc 1,396 189.50 37.00
aCosts are based on chlorine @ $144/ton and caustic soda @ $168 /ton, October 1974 prices;average plant flow of 110 mgd; and breakpoint chlorination required 67 days/aver..yr. atan average of three quarters of the plant flow.
b Power costs negligible
Capital recovery at'fipercent'and 25 year9.61
4 3 5.
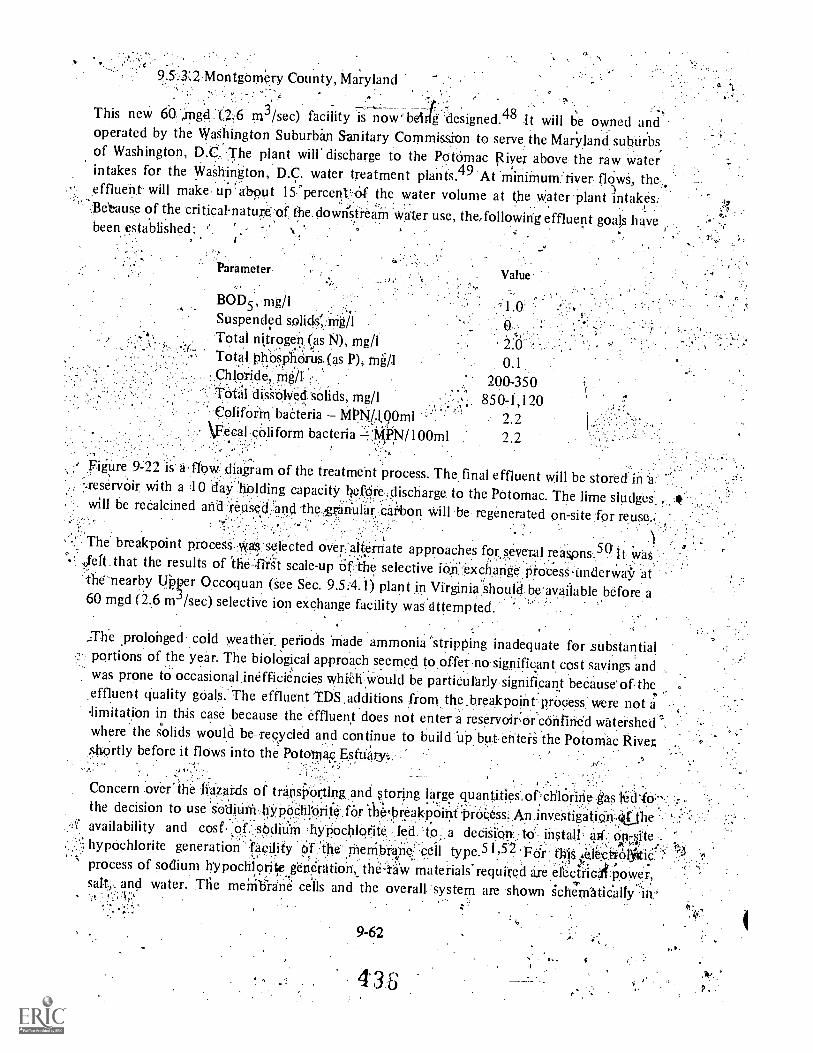
9.5:3:.2 Montgomery County, Maryland
This new 6.0 ,,mgd (2 6 m3/sec) facility is now` being designed.48 It will be owned andoperated by the Washington Suburban Sanitary Commission to serve the Maryland suburbsof Washington, D.C. The plant will discharge to the Potomac River above the raw waterintakes for the WaShington, D.C. water treatment plants.49 At minimum: river flows, theeffluent will make up' about 15'percenit Of the water volume at the water plant intakes:Betause of the criticalnature'of the downstream water use, the following effluent goals havebeen established:
Parameter
BOD5, mg/1Suspended sag
*Os,
Total nitrogen (as N), mg/1 2:0Total, phosphorus (as P), mg /.1 0.1
200-350TOtal dis-sblved solids, mg/1 850-1,120Coliforin bacteria MIN.I90m1 2.2
\Fecal coliform bacteria :.-.,;101/100m1 2.2
Figure 9.22 is a .fitm: diagram of the treatment process. The final effluent will be stored in .1.1..reservoir with a .10 do./ 'lidding capacity befOre,discharge to the Potomac. The lime sludges,will be recalcined and reused and the granular carbon will be regenerated on-site for reuse,.
The breakpoint process .WaS selected over alternate approaches for. several reaspns.5° It "was.felt that the results of the first scale-up the selective ion exchange.procesS.underwaj/ atthe nearby Upper Occoquan (See Sec. 9.5.4.1) plant in Virginia Should be'ayailablebefore a60 mgd (2.6 m33 /sec) selective ion exchange facility was attempted:
..The prolonged cold weather, periods made ammonia '.stripping inadequate for substantialportions of the year The biological approach seemed to offer no.significant cost savings andwas prone to occasional inefficiencies whieh would be particularly significant because of theeffluent quality goals. The effluent 'EDS additions from. prOcess were not aIimitation in this case because the effluent does not enter a reservoir:or'corifiried watershed .where the solids would be recycled and continue to build Up but entes the Potomac Rivetshortly before it flows into the Pototriae Estuary
;
Concern .over' the hazards of transporting and storing large quantities, of,chlorinethe decision to use 'Sodiurn,11YpOClitOrife for i*PrFakpOitif.PrOe.ess:An investigation;;Oie 'availability and cost of sbdaum hyPochigfit to a decisiap.:t6.. install. aFi. op-bitehypochlorite generation facility of the membrane 'cell type.51?52 For this te1.cirofitti6process of sodium hypochlorite gene'ration, the:faW materials-required are efecitic4powet,salt, and water. The meirib`rne cells and the overall system are shown i'chernaticalfy
9-62
436
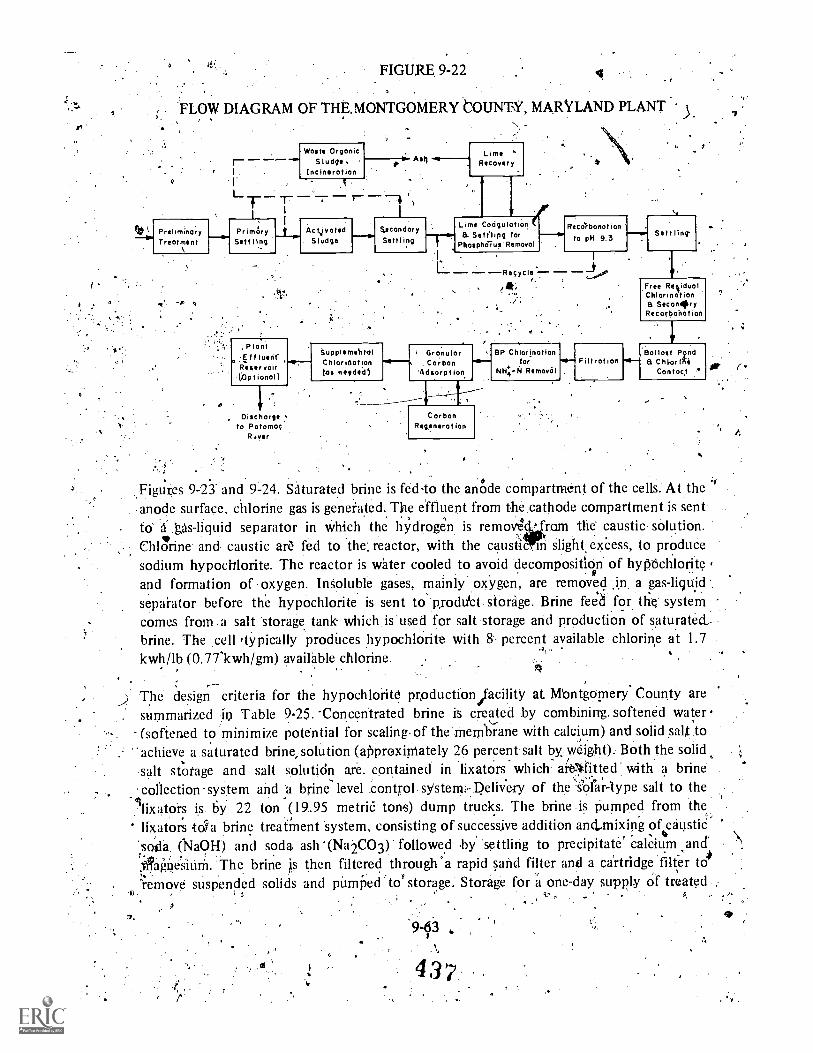
FIGURE 9-22
FLOW DIAGRAM OF THE.MONTGOMERY tOUNT\Y, MARYLAND PLANT
. .
PreliminaryTreatment
-# q
Figures 9-21 and 9L24. Saturated brine is fed-to the anode compartment of the cells: At theanode surface, chlorine gas is generated. The effluent from the.cathode compartment is sentto tas-liquid separator in Which the hydrogen is remov4rom the caustic solution.Chlorine and caustic an?, fed to the reactor, with the caustilrrii Slight excess, to producesodium hypochlorite. The reactor is water cooled to avoid decompositiovn of hyptichloriteand formation of oxygen. InSoluble gaSes, mainly oxygen, are removed in a gas - liquidseparator before the hypochlorite is sent to 'produ'ct storage. Brine feed for the, system
. _
comes from a salt storage tank which is used for salt storage and production of saturated:-brine. The cell typically produces hypochlorite with 8- percent available chlorine at 1.7
,
kwh/lb (0.77'kwh/gm) available chlorine.
r.1.
PrimarySett ling
Waste OrganicSludge.
Incineration
, PlantE f f luonT
Reservoir'(;op t ional)
, Dischargeto Potomac
River
Ash
Actoated SecondarySludge Settling
Supple moil tatChlorination(as needed)
LimeRecover y
Lime Codgul tier!B. Settling ar
Phaspho7us'Removal
.1
L - -- Recycle.P e
GranularCarbon
'Adsorption
CarbonRegenerot ion
BP Chlorinationtar
Removal
Reca'bonat ion
to pH 9.3
Filtration .111
ti
Settling
Free ResidualChlori at ionB Secon4ry
Recarhohotian
astP
gndB h LorINe
Contact
The design criteria for the hypochlorite production facility at Montgomery :County are,summarized in Table 9-25. 'Concentrated brine is created by combining. softened water(softened to minimize potential for scaling of the Membrane with calcium) and solid sal/ toachieve a saturated brine, solution (afiproxirriately 26 percent salt by weight). Both the solidsalt senrage and salt solution are contained in .1ixatOrs ai-e,.,:fitted with a brinecollection -system and a brine level control. system,- Delivery of the solar-type salt to the
°lixators is by 22 ton (19.95 metric tons) dump trucks. The brine is pumped from thelixators to,l'a brine treatment system, consisting of successive-addition and snixing of caustic
.
'soda (NaOH) and soda ash '(NaCO3) followed bywttling to precipitate' calcium and*Taiqesiurn. The brine s then filtered through a rapid sand filter and a cartridge filter to
.'remove suspended solids and pumped to storage. Storage for a one-day supply of treated ,
II . I 5A,
7.9-13 ,
43 7
ti.

FIGURE 9:23
MEMBRANE CELL USED FOR HYPOCHLORITE PRODUCTION
C:HLORINE4-SPENT BRINE
I
CAUSTIC+HYDROGEN
ANODE
MEN.MBRANE-1
I
I
CATHODE
I
N
9 s-
I °
WATER ORBRINEDILUTE BRINE
,,,brine. is provided,, Theffiect current source required by the membrane :cells,.is provided-1)y a
solid state rectifier, with side-mounted controls. Safe y features in the control paiiiel includeptjautomatic .shUtdown in case of high reactor tem tore, high DC voltages, bloWer failure, .
lig high or low D( current. The hydrogen from the electrolytic cells can .be either (1)diluted With air as:lit is formed to maintain a hydrogen concentration of lei's than 0.25percent by ,volume, the explosive limitlor (2) :compivssed- and piped. to the solids processingbuilding for use as a fuel. Sodium hypochlorite leaves the re actors by.gravity flow to pumpsfrom,which it is sent.to storage.
The breakpoint 'reaction is.iiccOMplished by adding a sodium hypochlorite,solution to thewastewater at a dosage slightly. in excess of the stoichiometric requirementfor oxidation ofthe ammonia nitrogen to gpeous nitxbgen. Figure 9-25 illustrates the design of the systemand Table 9 -26 presents the design criteria. Filter effluent flows by gravity to the breakpointchlorination reactors.:
9-64
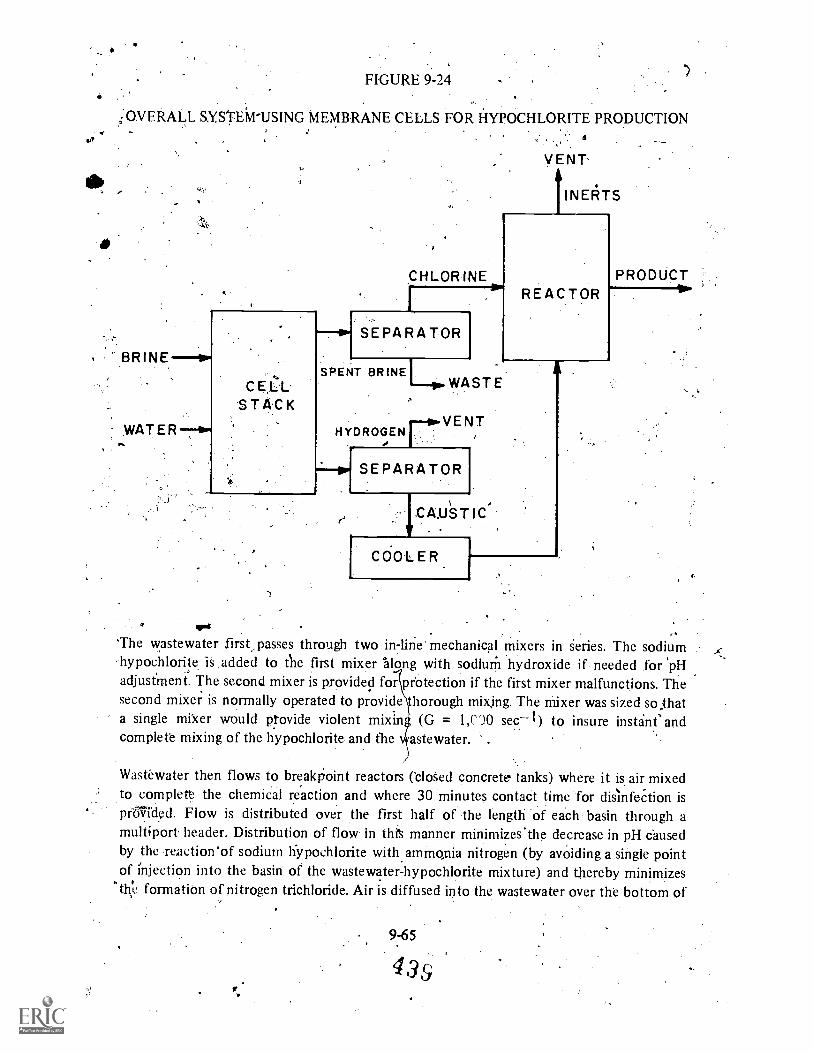
FIGURE 9-24
OVERALL S.Y,STEM-USING MEMBRANE CELLS FOR HYPOCHLORITE PRODUCTION
ti
CE1:t.STACK
WATERIP.
VENT
tINEliTS
CHLORINE
SEPARATOR
SPENT BRINE Lo.WASTE
VENTHYDROGENr ,
SEPARATOR
CA.U\STIC'
COOLER
REACTORPRODUCT
The wastewater first,, passes through two in-line mechanical mixers in series. The sodium-hypochlorite is added to tile first mixer along with sodium hydroxide if needed for 'pHadjustment. The second mixer is provided for protection if the first mixer malfunctions. Thesecond mixer is normally operated to provide thorough mixing. The mixer was sized so;thata single mixer would provide violent mixin (G = 1,n0 sec-1) to insure instant andcomplete mixing of the hypochlorite and the astewater.
Wastewater then flows to breakpoint reactors ('closed concrete tanks) where it is air mixedto complete the chemical reaction and where 30 minutes contact time for disinfection isprolnded. Flow is distributed over the first half of the length of each basin through amultipor header. Distribution of flow in this manner minimizes'the decrease in pH causedby the reaction'of sodium hypochlorite with ammonia nitrogen (by avoiding a single pointof injection into the basin of the wastewater-hypochlorite mixture) and thereby minimizes
"tlie formation of nitrogen trichloride. Air is diffused into the wastewater over the bottom of

TABLE 9-25
DESIGN C.IITERIA FORsHYPOCHLORITE PRODUCTION ,FACILItY AT THE MONTGOMERY COUNTY FACILITY
-Azerage dry weather flowodium chloride storage and treatmentI. NaC1 required @ t,0 ton/day Ci2 productiona2. Salt storage
Liquid level1 Storage capacity
Maximum saturated brine productionType of salt used
4. Brine treatment systemA. Soda ash requirements
3 minute rapid mixB. NaOH requirements
3 minute rapid mix, 3 hour settlingC. Rabid sand filters and cartridge filtration
follows settling5. Treated brine storage, fiberglass tanksb.
6. Truck delivery7 trucks/day/5 day week
Sodium hypochlorite generators1., Generating capacity2. Modules required @ 3.3 tons
On lineRedundant
3. Rectifiers required4. Power required5 Building required
Builder provides for housing, modules, and rectifiers.Monorail with 5 ton capacity provided for` cell stack
maintenance.Rectifiers separated from modules by a glass wall to
prevent corrosion.6. Generator module dimensions7. Rectifier dimensions
4Sodium hypochlorite storage1. Storage sized to provide 1 day storage for power ckutage
plus storage for 7 days @ 90 mgd (3.94 m3/sec)2: Storage capacity
A
each
60 mgd (2.63 m3/sec)
105 tons/day (95.2 metric tons /day)
4 @ 22 ft x 33 ft x 18 ft (6.7 m x 10.1 m x 5.5 in)1,470 tons (1333 metric tons)
60 gpm (3.8 1 /sec) each (min.)Solar
450 lb/day (204 Kg /day) --3 ft x 3 ft x 3 ft swd (0.91 m x 0.91 m x 0.91 m)
360 14 /day (163 Kg /day)3 ft x 3 ft x 3 ft swd (0.91 m x 0:91 m x 0.91 irn)
6 @ 12 ft x 12 ft (3.66 m x 3.66 m)16,000 gal each (60,560 1)
22 tons/load (-19.95 metric tons)
60 tons/day (54.4 metric tons)2018
2
7
10,000 KVA87 ft x 96 ft x 20 ft (26.5 m x 39.2 m x 6.1 m)
4 ft x 16 ft x 8 ft (1.2 m x 4.9 m x 2.4 m)4'ft x 6 ft x 8 ft (1.2 m x 1.8 m x 2.4 m)
700,000 gal (2650 m3)230 tons equivalent (209 metric tons)
6-117,000 gal ground level tanks (443 m3)6-30 ft x 22 ft tanks (9.1 m x 6.7 m)
aAtsumes 90percent utilization
Each tank will provide 4 hours storage at full production
the second half of the basin.to strip any nitrogen trichloride from solution. Additional airmay be introduced in the space betweon the liquid surface and.the basin cover to furtherdilute any nitrogen trichloride that might be prestnt to prevent the 'development of anexplosive concentration that occurs at 0.5.percent by volume. The diffusion of air into thebreakpoint reactor contents also strips gaseous nitrogen and carbpn dioxide from solution.The latter will result in a Ae4if/able increase in pH. °-,
Exhaust gaseS from the readtoff...are recirculated to provide mixing with some off' the gas bledoff 46 the recaleining ftirnace,for thermal decomposition of the nitrogen trichloride: Thealkaline., environment in the recalcining 'furnace will avoid discharge of hydrochloric acid(HCl) to the atmosphere t at might otherwise occur.
9-66
440

NaOH
STORAGE
Na2CI
STORAGE
ISOLATION VALVE-42
METER 0BALL VALVE
FROM
FILTERS
(Opt Of) Six
11;es shown
MIXER
FIGURE 9.25
SCHEMATIC OF.MONTGOMERY-COUNTY, MARYLAND
BREAKPOINT CHLORINATION PROCESS
BLOWERS
GAS GASTO
CIRCULATION.
INLET DIFFUSER
MIXER-0 ALTERNATE
INLET GATES
AIR HEADERS
ISOLATION
GATE
RECALCINERS
EXHAUST
07EFFLUENT
WEIR
One of Six Basins -shown
441
t
I
I-
TO
IL CA fiBON
wLL
PUMP
STATION
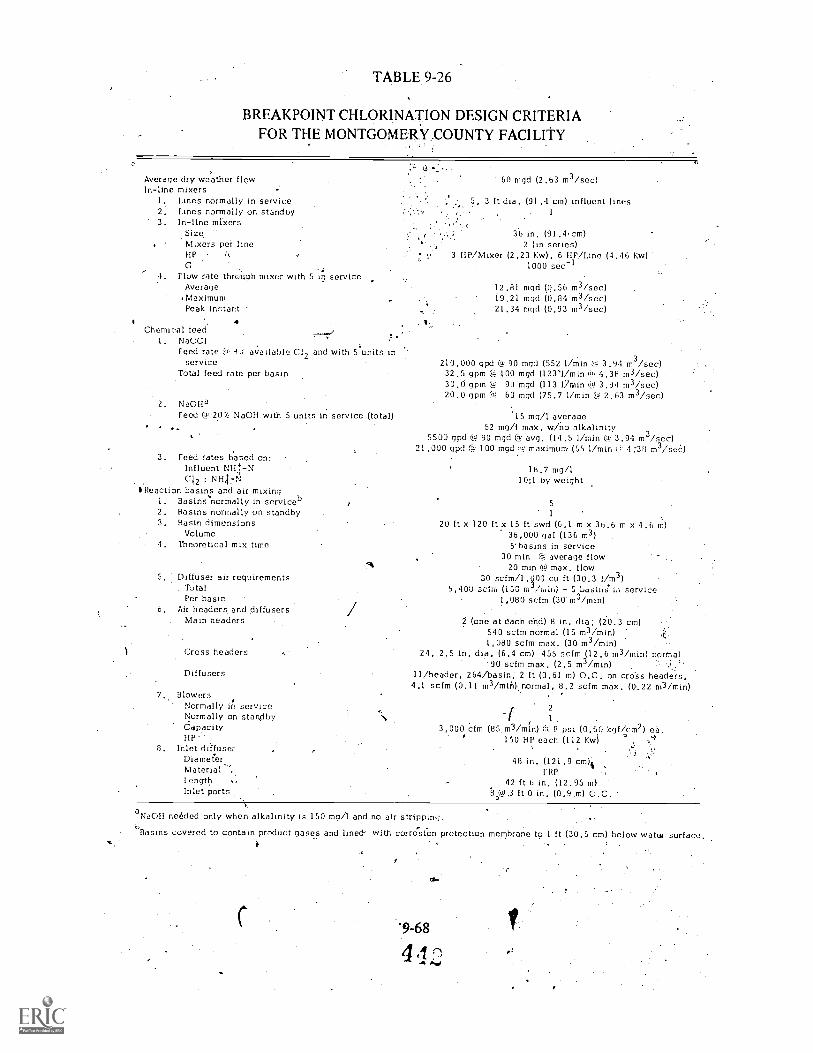
TABLE 9-26
BREAKPOINT CHLORINATION DESIGN CRITERIAFOR THE MONTGOMERY .COUNTY FACILITY
Average dry weather flowIn-line mixers
I. Lines normally in service2. Lines normally on standby3. In-line mixers
SizeMixers pei line111'
GFlow rate through mixer with 5 in service
Average.MaximumPeak instant
Chemical feed.1. NaOC!
Feed rate @' H available C,12 and with 5 Units inservice
Total feed rate per basin
2. Na0Ha.Feed NaOH with 5 units in service (total)
3. Feed rates Cased on:Influent NII,I-1\1C12 : N.H,t7N
IReaction basin.s. and air mixing1. Basins normally in serviceb2. Basins normally on standby3. Basin dimensions
VolumeTheoretical mix time
5. Diffuser air requirementsTotalPer basin .
Air headers. and diffusers. Main headers
Cross headers
Diffusers
7, BlowersNormally serviceNormally on standbyCapacityHP'
8. Inlet diffuserDiameter
LengthInlet ports
60 mgd (2.63 m3/sec)
5, 3 ft dia. (91.4 cm) influent lines1
3.6 in. (91.4,cm)2 (in series)
3 HP/Mixer (2.23 Kw), 6 HP /Line (4..16 Kw)1000 sec-1
12.81 mgd (0.56 m3 /sec)19.21 mg(' (0.84 m3/sec)21.34 nig(' (0.93 m3/sec)
210,000 gpd 90 mgd (552 1/min 3.94 m 3/sec)32.5 gpm 100 mgd (1231/min (a 4.3H m3 /sec)30.0 gprn (Li). 90 mgd (113 bruin t 3.94 m3/sec)20.0 gpm (9) 60 mgd (75.7 1 /min @4 2.63 m3/sec)
'15 mg/1 average52 mg/I max. w/no alkalinity
5500 gpd (i). 90 mgd Q..' avg. (14.5 1 /min (9.! 3.94 m3/sec)21 .000 WO. C".,;" 100 ingd ('i," maximum (55 1/min 4.'38 m3/Se)
18.7 mg/I10:1 by weight
5
I
20 ft x 120 ft x 15 ft swd (6.1 m x 36.6 m x 4.6 m)36,000 gaI (136 m3)5'basins in service
30 min (8.2 average flow20 min (4). max. flow
30 scfm/1,00 cu ft (30.3 1/m3)5,400 scfin (150 UdSilts.ilo service
1,080 scfm (30' m3/min)
2 (one at each end) 8 in. dia. (20.3 cm)540 scfm normal (15 m3/min)1,080 scfm max. (30.m3/min)
24, 2.5 in. dia. (6.4 cm) 455 scfm (12.6 m3/min) normal90 scfm max. (2.5 m3/min)
11/header, 264/basin,' 2 ft (0.61 m) O.C. on cross headers,4.1 scfm (0.11 m37mifi) .normal, 8.2 scfm max. (0..22 m3/min)
i2
1
3 000 cfm (85 m3 /min) C',..:, 8 psi (0.60 kgf/cm2) ea.150. HP each (112 Kw) .,4
't..48 in. (121.9 cm)%
rap42 ft () in. (12.95 m)
8.,S.3 ft 0 in. (0.9.m) O.C.
aNaOH ne6cled only when alkalinity is 150 mg/1 and no air stripping.
Basins covered to contain product gases and lined with corrosion protection membrane to 1 ft (30.5 cm) below wator surface.
'9-68
412

The breakpoint process is controlled by pacing the sodium hypochlorite feed rate to theinfluent flow and influent ammonia nitrogen concentration. The pH is also monitored and
controls the addition, when necessary, of sodium hydroxide to maintain an optimum pH for
the breakpoint reaction.
Ammonia nitrogen in t4e breakritiint effluent is monitored to determine efficiency of the
. pr9cess. Free and combined chlorine residuals and pH are also continuously monitored in
,'breakpoint reactor effluent.
f .
e etirnatca costs Of the Montgomery County facility are shown in Table 9-27. Thehypochlbrife,:.ieneration facility will also provide hypochlorite for uses other thanbiellkpoinetattliotikifitS: entire cost has been shown for the breakpoint process. As noted in
.Tal)160:17, the hYdrggen liberated in the breakpoint .pf&ess has a potential value, of
S10.140Prrii1,0,00:0026trte) if it is-collected and u$ed.asa'fuel.. ,
r
TABLE 9-27
ESTIMATED COSTS OF BREAKPOINT CHLORINATION/yr THE MONTGOMERY COUNTY PLANT
Capital a ,b.
Breakpoint reaction basinsOperations building (including offgas
treatment and blowers)Hypochlorite plant
StorageGenerationSalt dissolution
Total °
$2,300,000
565,000
817,0003,780,000
705,000
$8,167,000
Operation and rOinfenancebPower 2
Hypochlortte production: $ 26.20/mil galMixing, stripping 18.00
Salt 25.20Labor 12.60
Subtotal $ 82.00 ($0.022/m3)
Amortized capital, $'8,167,000, 20 years@ 77. @ 60 mgd 35.20 ($0.0.09/m3)
$ 177.20 ($0.031/m3)
a Not including contingencies and engineeringbDecember, 1974 cost level
9-69
44
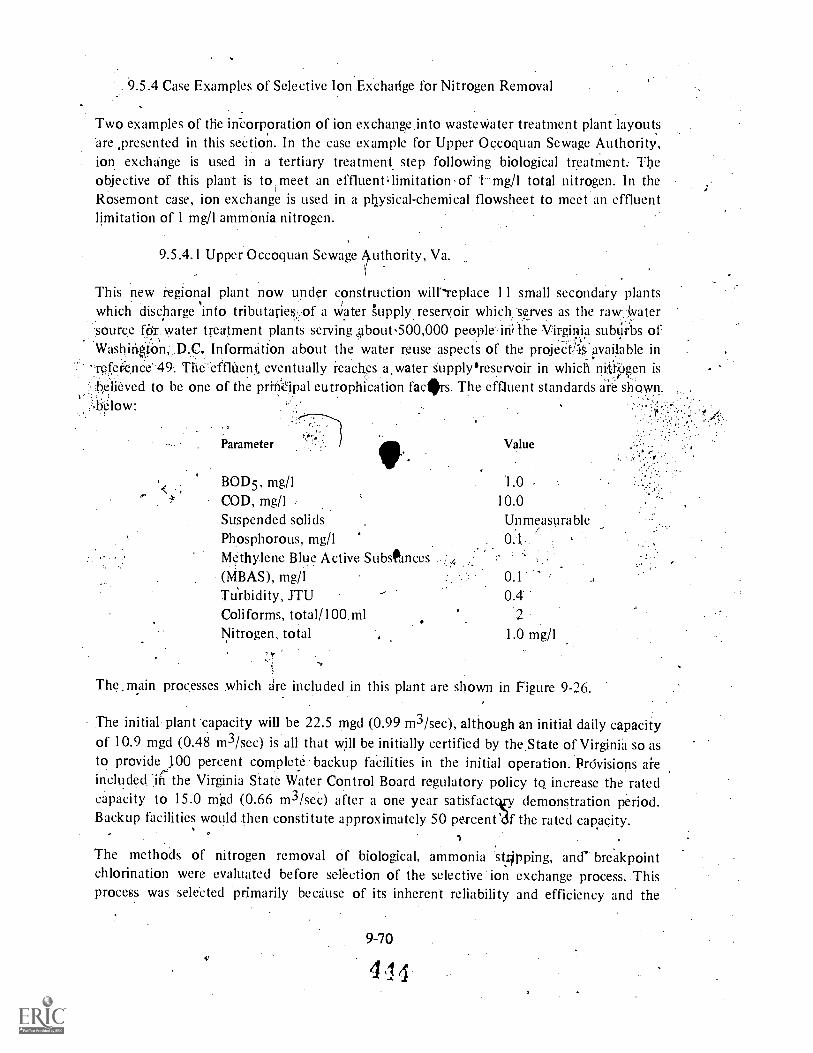
9.5.4 Case Examples of Selective Ion Exchange for Nitrogen Removal
Two examples of the in-corporation of ion exchange.into wastewater treatment plant layoutsare .presented in this section.. In the case example for Upper Occoquan Sewage Authority,ion exchange is used in a tertiary treatment step following biological treatment. Theobjective of this plant is to meet an effluenFlimitationof I mg/1 total nitrogen. In theRosemont case, ion exchange is used in a physical- chemical flowsheet to meet an effluentlimitation of 1 mg/1 ammonia nitrogen.
9.5.4.1 Upper Occoquan Sewage Authority, Va.
This new regional plant now under construction will'"replace 1 1 small secondary plantswhich discharge into tributaries..of a water t.ipply.reseryoir which serves as the raw..vatersource air. water treatment plants serving jabout.500,000 people.iri't the Virginia subtitbs ofWashitigtbn,',D.C Information about the water reuse aspeCts of the projeCtl'available in
.
'refeienCe'49 The'effInent, eventually reacIrsa.water supply'reservoir in which niirbgen is..:believed to be one of the prinOpal eutrophication faclirs. The effluent standards are shQw.n..
.
Parameter
IPValue
BOD5, mg/1 1.0<
COD, mg/1 . 10.0Suspended solids UnmeasurablePhosphorous, mg/1 0.1Methylene Blue Active Substances(MBAS), mg/1 0.1
Turbidity, JTU 0.4Coliforms, total /100 ml 2
Nitrogen, total 1.0 mg/1
ro
The, main processes which are included in this plant are shown in Figure 9-26.
The initial plant capacity will be 22.5 mgd (0.99 m3/sec), although an initial daily capacityof 10.9 mgd (0.48 m3/sec) is all that will be initially certified by the. State of Virginia so asto provide 100 percent complete backup facilities in the initial operation. Provisions areincluded, in the Virginia State Water Control Board regulatory policy tq increase the ratedcapacity to 15.0 mgd (0.66 m3/sec) after a one year satisfactv demonstration period.Backup facilities would then constitute approximately 50 percent oif the rated capacity.
The methods of nitrogen removal of biological, ammonia stripping, and breakpointchlorination were evaluated before selection of the selective ion exchange process. Thisprocess was selected primarily because of its inherent reliability and efficiency and the
9-70

FIGURE 9-26
FLOW DIAGRAM UPPER OCCOQUAN SEWAGE AUTHORITY PLANT (VIRGINIA)
Preliminar/.Treatment
1
L17:
Settling
..:Plana'.A,tfluent'Resermie
Land Application
SludgeDigestion
Recycle
ActivatedSludge
Discharge toBull Run
SecondarySettlinra
Chlorination;tar TraceNH4 'Removal
4
Lime Coagulationr. a Settling forPhosphorus Removal
I
2LRecycle
Two StageRecarbariation
Selectiveion
Exchange
I
RegeeerantReaoloery
Granular.Carbon
Adsorption
Carbon'...'Regeneration'
BallastPond
Filtration
minimal effect, on total dissolved, wilds (TDS/: The selective ion exchange process was
located afterthe carbon columns t9 ",take', adv,antage of the available head remaining after
pumping through the pressure carbon. columns, Also, as an incidental benefit of this process'
sequence, the clinoptilolite will serve as a final polishing filter to remove the small amount
of carbon fines or other suspended solids which may' be Present in the carbon 'cblumn
effluent.
Carbon fines and other solids trapped in the clinoptilolite bed are removed by backwashing40
before the regeneration cycle. These backwash wastes will be returned to the treatment
process, typically .to the chemical coagulation process where these solids will be removed in
the precipitationprocess and be trapped in the chemical sludge. fj
The selective ion exchange regenerant recovery ,was initially plannedto be accomplished by
breakpoint chlorination of the ammonium using electrolytic cells (see Chapter 7). A delay in
the project of about one year occurred following final design while awaiting the project
funding to develop. During this period, the ammonia removal and recovery process (ARRP)
described in Sections 7.3.3.2 anU 8.4.1 was developed by the design engineers. Based on
pilot plant results, it was concluded that the annual operating cost for the plant could be
9-71
445
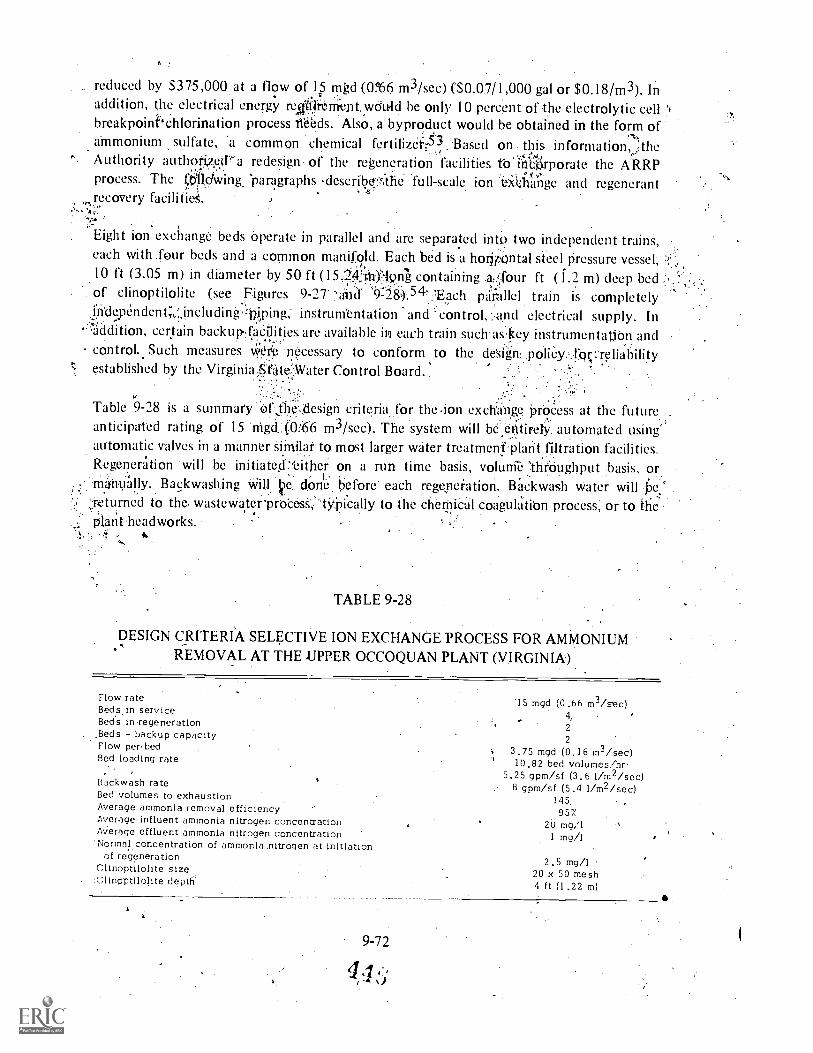
reduced by $375,000 at a flow of 15 mgd (0%6 m3./sec) ($0..07/1,000 gal or $0.18/m3). Inaddition, the electrical energy rekiYettient,wbuld be only 10 percent of the electrolytic cell'breakpoinf'chlorination process Weeds. Also, a'byproduct would be obtained in the form ofammonium sulfate, 'a common chemical fertilizet:43 Based on this information,t'Jthe'Authority itithoti,z.e(1.,°".a redesign of the. regeneration facilities to labrporate the ARRP,.- .process. The ctIllo'wing 'paragraphs .describ0::F:the full-scale ion i,,x4hange and regenerant1.
recovery facilitik,
Eight ion exchange beds operate in parallel and are separated into two independent trains,each with .four beds and a common manifold. Each bed is a horjrontal steel pressure vessel,10 ft (3.05 m) in diameter by 50 ft (15,2:4:J012n-A containing ,a,,! four ft (1.2 m) deep bedof clinoptilolite (see Figures 9-27 s'abil 9.:28)`. 4. ,-Each paiallel train is completelyfkley6ndent,-.,;sincluding .1piping;. instrumentation 'and control, ;.1t,nd electrical supply. Inaddition, certain backup4adities, are available in each train such askey instrumentation andcontrol. Such measures iii0't.n4essary to conform to the design, .polic.y.,f.or,:.-rOiabilityestablished by the Virginki.,Oratel.:Water Control Board.,
Table 9-28 is a summary' Of thy,..design criterhi for the .ion exchange.prOcess at the future .
anticipated rating of 15 .nigdj0:66 m3/sec). The system will be. e6tiretY. automated using'automatic valves in a manner similar to most larger water treatmenfplarit'filtration facilities.Regeneration will be initiate!either on a run time basis, volunfe Ihrkiughput basis, or
.
Backwashing Willie. done before` each regeneration. Backwash Water will .be:..:i.etunted to the wastewater' probesS.;',tYPically to the chetniCal coagulation process, or to theptantheadworks.
TABLE 9-28
DESIGN CRITERIA SELECTIVE ION EXCHANGE PROCESS FOR AMMONIUMREMOVAL AT THE UPPER OCCOQUAN PLANT (VIRGINIA)
Flow rateBeds in serviceBed s in regeneration.Beds backup capacityFlow perbedBed loading rate
Backwash rateBed volumes to exhaustionAverage ammonia removal efficiencyAverage influent ammonia nitrogen concentrationAierage effluent ammonia nitrogen concentration'Normal concentration of ammonia'. nitrogen at initiation
of regenerationClinoptilolite sizeClinoptilolite depth
9-72
15 mgd (0.66 m3 /soc)4,
2
2
3.75 mgd (0.16 m3/sec)10.82 bed volumes/hr
5.25 gpm/sf (3.6 l/m2/sec)8 gpm/sf (5.4 1/m2/sec)
145957
20 mg/11 mg/1
2.5 mg/120 x 50 mesh4 ft (1.22 m)

FIGURE 9-27
PLAN AND SECTION OF ION EXCHANGE BEDS AT UPPER OCCOQUAN PLANT
SURFACE WASH
HEADER SUPPORT
50
CLINO,SURFACE WASH NOZZLES
QUICK OPENING, MANHOLE
I r-
I ,,t, y,
11'.-
PVC. SURF,ii WASH
HEADER.
11
I I I
LATERAL
PLAN
r
SUPPORTS
TYPICAL LATERAL -.49. REQID
PER CLING BED
COMBINATIONAIR VAII,VE
WSP INFLUENT HEADER
SECTIONti

FIGURE 9-28
ADDED DETAI S ION EXCIIANdE BEDS ,AT,LIFTER*4
3 ° PVC, 311 PVCTHREADED TEE
172.-- 3. EXTRA HEAVY.se) 4 STEEL PIPE
,8 HOLES -7 SPACES 51/2"
8- HOLES IN LATERALFACING DIRECTLY DOWNWARD
18" WSP
SYMMETRICAL ABOUT t.
'TYPICAL UNDERQRAIN .LATERAL
ROWS OF 11/2ThIA: HOLES
g 6 Vi" Q.C. FOR INFLUENT
DISTRIByTIO, EACH ROW 30°.:;OFF VEFOICAL , 86 HOLES EACH
, 172 HOLE'S TOTAL
SUPPORTING HIGH.DENSITY GRAVE L
it QUICK OPENINGMAN,HOLES
10' DIA", STEELCLING BED
UNDEPDRA1N LATERAL
)
6RADED, GRAVEL CONCRETE FILL
9-74
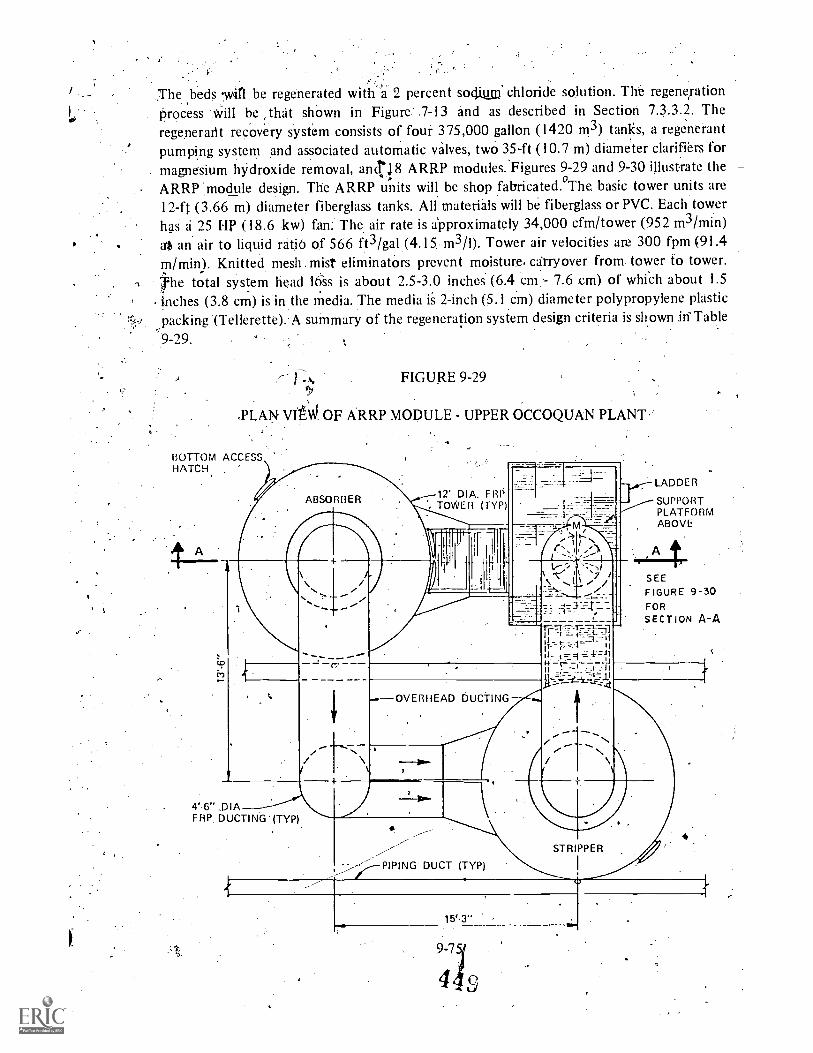
The beds win be regenerated with-a 2 percent sodium' chloride solution. The regenerationProcess 1WilI be ,that shown in Figure' 7-13 and as described in Section 7.3.3.2. Theregenerant recovery system consists of four 375,000 gallon (1420 m3) tanks, a regenerantpumping system and associated automatic valves, two 35 -ft (10.7 m) diameter clarifiers formagnesium hydroxide removal, anct,I8 ARRP modules. Figures 9-29 and 9-30 illustrate theARRP:,module design. The ARRP units will be shop fabricated.°The basic tower units are12-ft (3.66 m) diameter fiberglass tanks. All materials will be fiberglass or PVC. Each towerhas a. 25 HP (18.6 kw) fan: The air rate is approximately 34,000 cfm/tower (952 m3/min)at an air to liquid ratiti of 566 ft3/gal (4.15 m3/1). Tower air velocities are 300 fpm (91.4m/min). Knitted mesh. mist eliminators prevent moisture. carryover from tower to tower., -The total system head 16ss is about 2.5-3.0 inches (6.4 cm - 7.6 em) of which about 1.5inches (3.8 cm) is in the media. The media is 2-inch (5. I cm) diameter polypropylene plasticpacking .(Tellerette)..A summary of the regeneration system design criteria is shown in-Table
9-29.
FIGURE 9-29
.PLAN. VIEW OF ARRP MODULE - UPPER OCCOQUAN PLANT.
BOTTOM ACCESSHATCH ,
ABSORBER 17 DIA. FBI'TOWER (TYP)
\
4%6"FRP DUCTING (TYP)
11
r.---OVERHEAD DUCTING
PIPING DUCT (TYP)
LADDER
SUPPORTPLATFORMABOVE
SEEFIGURE 9-30FORSECTION A-A
STRIPPER
15'3"
y.
j
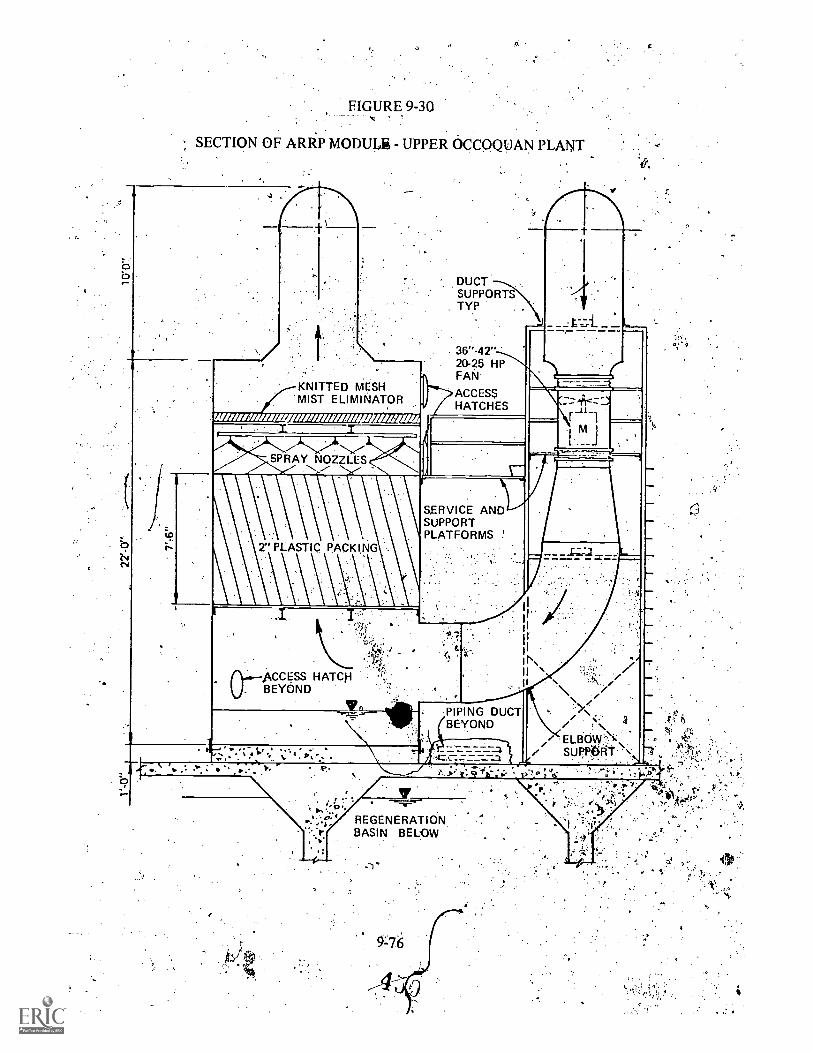
if
FIGURE 9-30
SECTION OF ARRP MODULE - UPPER OCCOQUAN PLANT
KNITTED MESH'MIST ELIMINATOR
MAWN///// NNW /MN/ / /as IF
SPRAY NOZZLES
rPLASTIC PACKING
DUCTSUPPORTSTYP
36"-42"20-25 HPFAN
ACCESSHATCHES
ACCESS HATC]-1BEYOND
SERVICE ANDSUPPORTPLATFORMS '
99:1/4 0". ,W V.
IK.
PIPING DUCTBEYOND
_-) R 4 Ph- 1;*
REGENERATIONBASIN BELOW
9 -76
ELBOW"-\SU PPOOT
Is'
Zec,
;' .,;
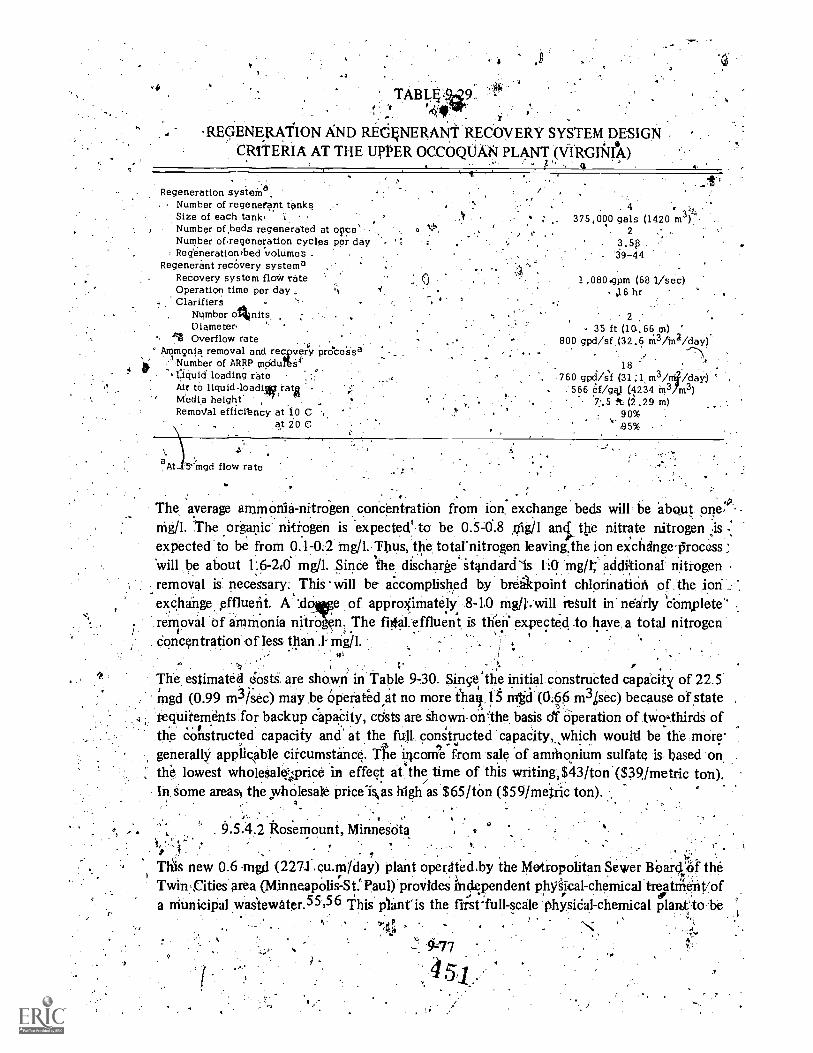
TABL,4'410
REGENERAIION AND REdkNERANT RECOVERY SYSTEM DESIGNCRITERIA AT THE UPPER OCCOQUAN PLANT (VIRGINIA)
' 6
Regeneration sysienia.. Number of regenerant tanks
Size of each tankNumber of ,beds re.generated at once' -
Number of,regeneration cycles per day -: Regbnerationrbed volumes .
Regenerant recovery systemaRecovery system flo* rateOperation time per dayClarifiers
Number omits,Diameter
III Overflow rate12Aramynia, removal and rec,pvery processa
2'1 Number of ARRP mOdurU4'Liquid loading rateAir to liquid-loadiggataMedia height'RemoVal efficibncy at 10 C
. at 20 C
375,000 gals (1920 m2
3.5,939-49
aAt -S%-bigcl flow rate
1,080.gpm (68 1/sec).16 hr
35 ft (10.66 m)800 gpd/sf (32.6 n13/0/day)
18 .
760 gp4/ssf (31:1 m3/ny/day)566 ef/gq). 0239 m3 m3)
'7%5 ft (2.29 m)90%
.4.95%
The average ammonia-nitrogen concentration from ion: exchange beds will be about one:°nig/1. The organic. nitrogen is expected to be 0.54.8 nigll aryls the nitrate nitrogen isexpected to be from 0.1-0:2 mg/1. Thus, the total leaving.the ion exchange processWill be about 1:6-10 mg/l. Since the discharge Standard 1:0 mg /t; additional nitrogenremoval is necessary: This will be accomplished by breakpoint chlorination of .the ionexchange effluent. A Aloe of approXimately 8-10 me..will_regult in nearly 'complete'' .
removal of ammonia nitro n. The fixtal.effluent is then* expected to have a total nitrogenConcentration of less than .1.; nig/1.
The. estimated cftisti, are shown in Table 9-30. Since'the initial constructed capicity of 22.5rngd (0.99 m3 /sec) may be operated at no more flint 15 inta (0,66 m31sec) because of .stateIcluirements for backup CapaCity, costs are shown- on basis of Operation of tWo,,thirds ofthe ,constructed capacity and at the full constructed capaCity,,which would be the more-generally applicable circumstance. Tie iricom% from sale of amihonium sulfate is based onthe lowest wholesale:vrice in effect at the time of this writing) $43 /ton ($39 /metric ton).In some areas the yholesale pricelsos high as $65/tOn ($59 /metric ton).
, . . 9.5.4.2 Rosemount, Minnesdta.
Thi-s new 0.6 -mg,d (2271 cu.rn/day) plant operated.by the Metropolitan Sewer 13dard',61- theTwinsCities area (Minneapolis -St. Paul) provides arldependent phyiical-chernical treatment/ofa municipal wastewater. 55,56 This pant the first-full -scale physical- chemical rlant:to be
kr
0-17
4,51.r.

TABLE 9-30
ESTIMATED COSTS OF SELECTIVE ION EXCHANGEAT THE UPPER OCCOQUAN PLAT (VIRGINIA)
tib' Item
Estimated costs, $/mil gal
at 15 mgd(0.66 m3/sec)
at 22,5 mgd(0.99 m3/sec)
Operasting and maintenancea
Chemicals
NaOH $ 26.80 $ 26.80N4W1 7.10 7.10H2SO4 9.80 9,80
$ 43.70 $ 43.70
Income from sale of (N14)2 SO4 $43/ton $(12.60) $ (12.60)'
Net chemical cost 31,10 31.10
Power, 18 HP/mil gal @ $00192/kWh 6,90 6.90
Labor 17,70 17,70
Total, O& M $ 55.70 5.70Capita la
$4,470,000, 20 years @ rYe $ 77.22 $ 51,59
Total annual costa $132.92 $107.29($0.035/m3) ($0.027/m3)
aAugust, 1974 costs
placed in operation. in the U.S. A schematic of the process is shown in Figure 9-31. Theentire plant is enclOsed in ja single 14,500 sq ft (1347 m2) steel building. Final effluentstandards are as follows: Il
.
Parameter Value
II BOD5, mg/I 10, a'S'pended solids, mg/I 10COD, mg. /l 10Ammonia Nitrogen, mg /1 I.Phosphorus, total (P), mg/I I
pI I 8.5
9-78
4

FIGURE 9-31-
taiEMATIC OF ROSEMOUNT, MINNESOTA PLANT
RAWWASTOIWAAT ER
1
BARSCREEN
SLUDGEDISPOSAL
SOLIDSCONTACT
CLARIFIER DUALMEDIAFILTER
SETTLED *SOLIDS
stu G E
CONCENTRAOR
DUMEDF IL
(I1L
IATER.
0Z.
1.- 0
>"1-
U
AMMONIAEXCHANGE
SPENTCARBON, FURNACE
REGENER-ATE&CARBONSTORAGE
z0
.
z
U)
CHLORINE
CONDENSER
SPENTREGENER-ANT
',
WATER
RECOVERED
AMMONIA
REGE NER-ANT
z
aa
z
Selective km exchange is atcomplited by clirioptOolite fl, 2 of003 doinflow coluMns inseries, each containing a 6-ft (1.82 pi) depth of ciinoptilolite. When the ammonia-nitrogen
reaches I mg/1 in the effluent from the polishing column, the lead column is removed from
rvice and regenerated (upflow) and the third column placed on line. Thl steam process
disckssed in Section 7.3.3.3 is used for clinoptilolipte regeneration and ammonia recovery.
Brine is stored at 77 C and is cooled to 27 C while passing thrbugh a heat exchanger on the.
9-79
45i
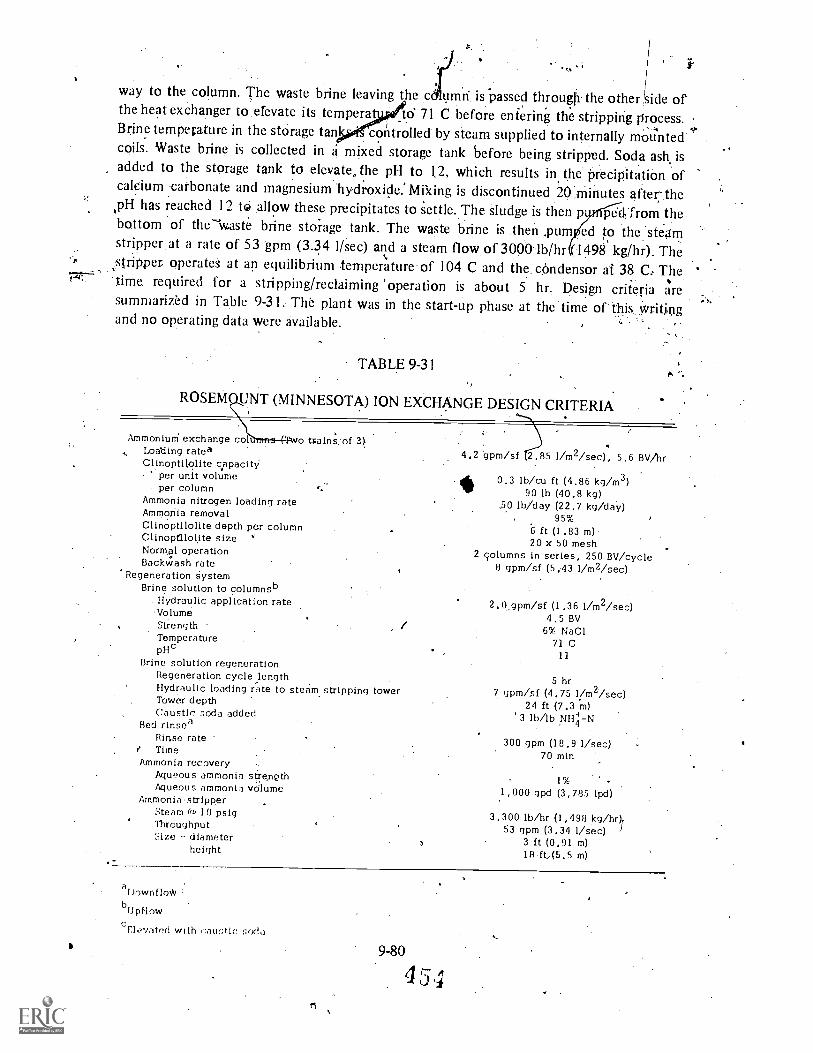
way to the column. The waste brine leaving the ceit mri is passed througfi the other side ofthe heat exchanger to elevate its tempera to 71 C before entering the stripping Process.Brine temperature in the storage tan controlled by steam supplied to internally mountedcoils. Waste brine is collected in a mixed storage tank before being stripped. Soda ash isadded to the storage tank to elevate,the pH to 1,2, which results in the precipitation ofcalcium carbonate and magnesium hydroxide.' Miking is discontinued 20 :minutes after the,pH has reached 12 t6 allow these precipitates to settle. The sludge is then p pedfrom thebottom of the waste brine storage tank. The waste brine is then Turn ed to the steamstripper. at a rate of 53 gpm (3.34 l/sec) and a steam flow of 3000" lb/hr 1498 kg/hr). The
"timeoperate at an equilibrium temperature of 104 C and the. cOndensor at 38 C: The '
time required for a stripping/reclaiming operation is about 5 hr. Design criteria aresummarized in Table 9-31. The plant was in the start-up phase at the' time of this Writingand no operating data were available.
TABLE 9-31
ROSEM UNT (MINNESOTA) ION EXCHANGE DESIGN CRITERIA
Ammoniuni exchange col o Uains.'ofLoading ratedClinoptilolite capacity
per unit volumeper column
Ammonia nitrogen loading rateAmmonia removalClinoptilolite depth per columnClinoptilolite sizeNormal operationBackWash rate
'Regeneration systemBrine solution to columnsb
Hydraulic application rate'VolumeStrengthTemperaturepHc
Brine solution regenerationRegeneration cycle lengthHydraulic loading rate to steam stripping towerTower depthCaustic soda added
Bed rinseRinse rate
.' TimeAmmon ia recovery
Aqueous ammonia strengthAqueous ammonia vdlume
Ammonia stripperSteam (a) 10 psigThroughputSize - diameter
height
4.2 gpm/sf t 2.85 1/m2/sec) , 5.6 BV/hr
4 0.3 lb/cu ft (4.86 kg/m3)90 lb (40.8 kg)
5.0 lb/day (22.7 kg /day)95%
f t (1.83 m),20 x 50 mesh
2 columns in series, 250 BV/cycle8 gpm/sf (5.43 1/m2/sec)
2.0 gpm/sf (1.36 1/m2/sec)4.5 BV6% NaCI
71 C11
5 hr7 gpm/sf (4.75 1/m2/sec)
24 ft (7.3 m)'3 lb/lb \111.4F-N
300 gpm (18.9 1/sec)70 min
1%
1,000 gpd (3,785 1pd)
3,300 lb/hr (1,498 kg /hr)153 gpm (3.34 1/sec)
3 ft (0.91 rn)18 ft,(5.5 m)
aDownfloWbUpflow
eclovated with ,-:austic soda
9-80
,5 4

9.5.5 Case Examples of Air Shipping for Nitrogen Removal
Two plants which utilize air stripping for nitrogen removal are described in this section.Both of these, South Lake Tahoe and Orange County, use the biological-tertiary approach inwhich ammonia stripping is used after biological treatment. At Tahoe,, nitrogen removal isincorporated on an experimental basis, as no nitrogen removal requirement exists. At the'Orange County Water District plant, nitrogen is removed to permit recharge of groundwater.
9.5.5.1 South Lake Tahoe, California
At South Tahoe an experimental full-scale ammonia stripping tower built to handle half ofthe total plant design flow of 7.5 mgd (0.33 m3/sec) lisleen operated on an intermittentbasis since 1969)3,57,58,59 The plant flow sheet is shown in Figure 9-3. The'strippingprocess was installed at South Lake Tahoe as an EPA research and demonstrationinstallation and not as the result of any requirement to remove nitrogen from the planteffluent. In the absence of any need for full time operation, the purposes of this strippingtower have included: (1) demonstration of full-scale tower efficiencies as compared to pilotplant test results; (2) determination of cold weather operating limitations and otheroperating problems with investigation of solutions to these problems and (3) collection ofdata for design purposes for future expansion of this process to full plant design capacity aswell as for use in planning similar facilities at other locations. The large tower capability toremove amMonia almost exactly duplicates the results of pilot plant operation, reaching 95percent removal in warm weather. The cold weather operating limitations and recommendedtower design improvements have been determined as discussed in Chapter 8. The new designcriteria obtained from operating the tower have already been used to prepare plans forstripping towers to treat wastewaters at Orange County, California60 and the operatingexperience has also provided the direction and the basis .for expansion of the Tahoe nitrogenremoval facilities'to meet anticipated future requirements for nitrogen removal. As discussedlater this section and in Section 8.5, the original packed tower system has recently beenmodified to provide year round, full-scale nitrogen removal..
The design data for the original packed tower are gign iVtable 9 -32. It is a crossflowcooling type tower modified for ammonia stripping. The$vegill 4Uneu§ions of the towefore32 ft (9.75 m) x 64 ft (19.5 m) x 4741 (14.3 m) high. Later, at 011'1, was pumped to thetop of the tower by either or bo s` .fpf two constant-speed Oumps. These pumps werebackflushed two or three times daily, minimize buildup.of calcium carbonate scale in thepump units. Wh7n the plant infloOlgas ess than the rate at` which the pumps were deliveringwater to the tower, some water waljecycled from the tower 'effluent back to the pumpsuction well. This avoided the need rot'variable speed pump control, and at the same timeprovided some .recirculation through the tower, which improved ammonia removal. At thetop of the tower, the influent water entered a covered distribution box and overflowed to adistribution basin. The distribution basin is a flat deck with a series of ,holes fitted withplastic nozzles. Further distributicin of the inflow was provided by, diffusion decks
9-81
455
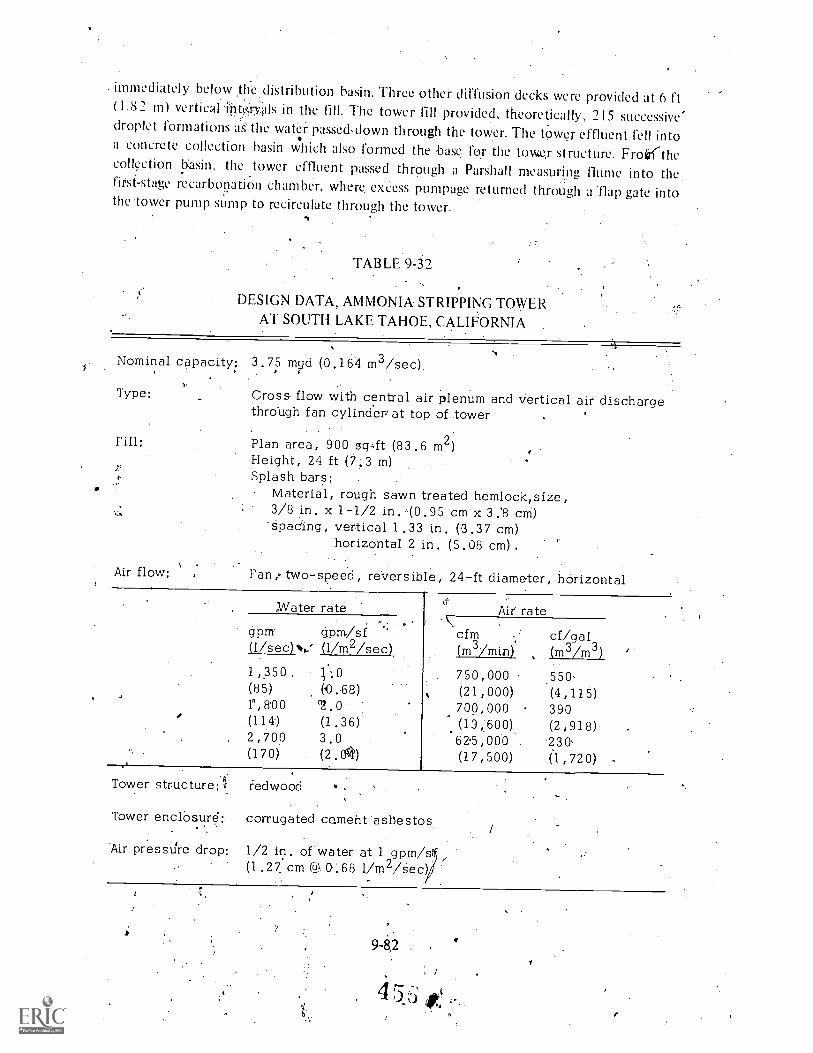
. immediately below the distribution basin. Three other diffusion decks were provided at 6 ft(1.82 m) verticilibtr,yals in the fill. The tower fill provided, theoretically, 215 successive'droplet formations as the water passed down through the tower. The tower effluent fell into.
a concrete collection basin which also formed the base for the tov;ce,r structure. Froirrthecollection basin, the tower effluent passed through a Parshall measuring flume into thefirst -stage recarbohation chamber, where, excess pumpage returned through a flap gate intothe tower pump sump to recirculate through the tower.
TABLE 9-32
DESIGN DATA, AMMONIA STRIPPING TOWERAT SOUTH LAKE TAHOE, CALIFORNIA
Nominal capacity: 3.75 mgd (0.164 m3/sec)
Type: Cross- flow with central air plenum and vertical air dischargethrdugh fan cylinders at top of tower
Fill;
Air flow:
Plan area, 900 sq...ft (83.6 m2)Height, 24 ft (7;3 m)Splash bars:
Material, rough sawn treated hemlock size,3/8 in. x 1-1/2 in. '(0.95 cm x 3.'8 cm)
-Spaciing, vertical 1 .33 in. (3.37 cm)horizontal 2 in. (5.08 cm) *
Fan,- two-speed, reversible, 24-ft diameter, horizontal
Water rate Air rategpm gpm/si(1/sec)1.,.' (1/m2/sec),
cfm(m3/min)
cf/gal(m3/m3)
1,350, 750,000 .550(85') (.0.68) (21,000) (4,115)r,aoo 700,000 390(114') (1.36) (13,600) (2,918)2,700 3.0 62'5,000 '230.(170) (2.A) (17,500) (1,720) -
Tower strUcture:1
Tower enclosure:
'Air pressure drop:
redwood
corrugated cement asbestos
1/2 in, of water at 1 gpm/s(1 .27 cm (,) 0.68 1 /m2/sec)
9 -82 , .
Air entered the tower'through side louvers passed horizontally through the tower fill anddrift eliminators (or airflow equalizers), and entered a central plenum. At the top center of i;
the plenum is a 24 ft (7.3 m) diameter, six:bladed, horizontal fan. Fan blades.and fancylinder are both' made of glass-reinforced polyester. The fax takes suction from the 'plenum,)
and discharges to the atmosphere through the fan cylinder.,Thb,fati ills 4 maleimum capacity.'
of abOut 750,000 cfm (21,000 m3/min). It is equipped with'a two-speed reversible 75 HP(56 kw) motor.
The limitations of the packed -tower at Tahoe are caused by the cold winter temperaturesand the scaling 'Of the tower packing. Because the scaling problem was not anticipated fromthe pilot studies, the access to the tower packing needed to remove the scale with voter jetswas not 'provided. As a result, portions of the original hemlock packing became hopelesslyfouled with_calcium carbonate scale, thereby decreaSing effective tower packing area.
The costs of the operation of the packed tower at Tahoe at.a 2 gpm/sq ft (1.36 1/m2/sec)rate as estimated for a 7.5 mgd (0.33 m3/sec) scale for continuous operation are listed inTable. 9-33. Operating labor included backflushing of tower pumps and cleaning thedistribution deck to remove CaCO3 precipitation ocess inspection,iubrication,,and dailydetermination of tower ammonia removal efficicleaning tower fill.
Because of the cold weather limitations ofthe reduced efficiency of the existing towerprogram was initiated at. the South Laketechniques which could be applied to the fulfacilities as ,posible. Although there are nnitrogen removal for exported wastes, future
anceests reflect the cost of
hereht to the Tahoe location andof the tower packing, a researchto develorf alternate, low-costile using as much of the existi
gulatory agency requirements ,fents for effluent reuse or dip
the. Lake Tahoe basin will probably include gen .removal. At the current, littiStates of California and Nevada iequire that all usteyfaiers, regardless of the detreatment be exported from the LterTahoe basin: The South Tahoe effluent is expAlpine County, California where it isiused toloc, the 1 billiongallon (3.785 hip()Indiarreitek Reservoir.59 An excellent Trout fishery has been established in thisecreatioireservoir anti it is necessary to control pH and ammonia concentrations t tAl t fish.
toxicity. Thus, anticipated future Agulatory tvgency requirements and current reusepractices required that a system for full-scale pitrogen removal be devetoped ,South
Lake Tahoe plant.
A .
IriAljteckbyi observations of ammonia releast from holding ponds in Israe1,61 research wasunhertaken atTppe to improve the release of ammonia from the hi pH effluent. Thergivits led .to thii following three steps being applied to a full - scaler jdification of theTahoeksteip :62
Holding in high pH ponds (with surface agitation in one pa
9-83
4 5 ';`-'
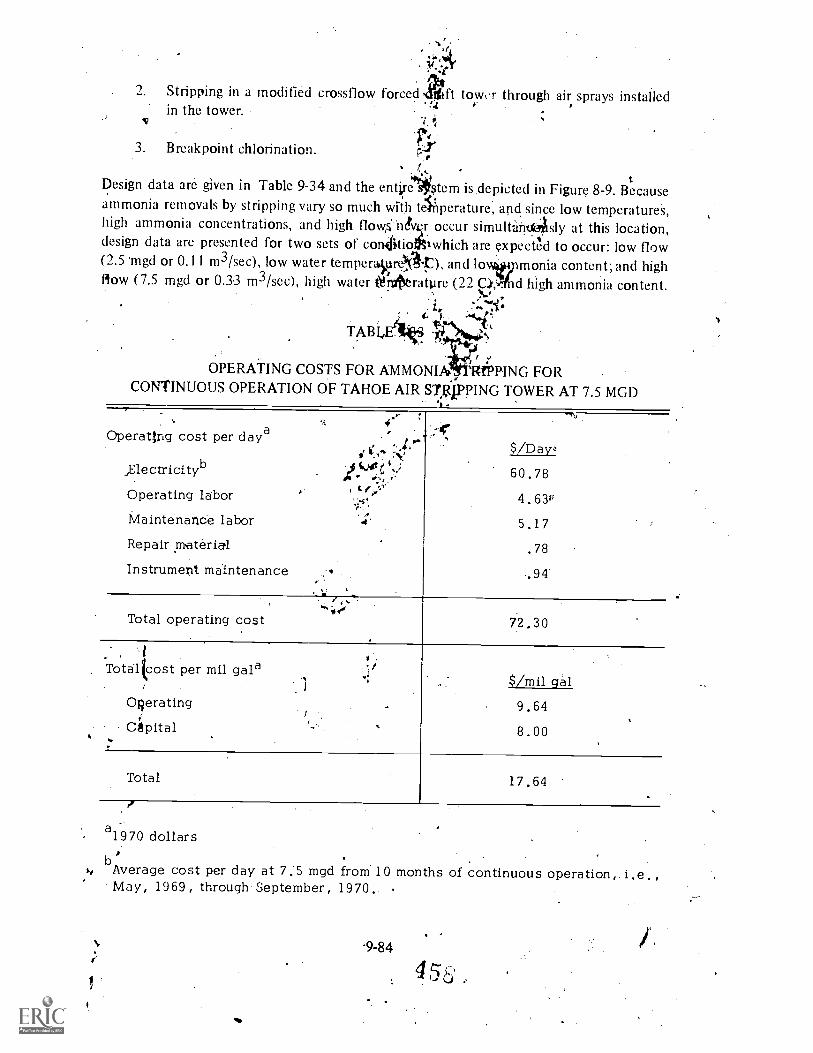
, .
.zir
Stripping in a modified crossflow forced Pitift tower through air sprays installedin the tower.
r43. Breakpoint chlorination.
410,A#Design data are given in Table 9-34 and the entire Mtem is depicted in Figure 8-9. Becauseammonia removals by stripping vary so much with temperature, and since low temperature's,high ammonia concentrations, and high flow,S never occur simultand4sly at this location,design data arc presented for two sets of conifitiodg%which are expected to occur: low flow(2.5 'mgd or 0.11 m3/sec), low water tempera5ure::(1.), and loww-imonia content; and highPlow (7.5 mgd or 0.33 m3/sec), high water Onititrature (22 Ci,7:frid high ammonia content.
rN10.0
OPERATING COSTS FOR AMMONIA?, RfPRING FORCONTINUOUS OPERATION OF TAHOE AIR ST,4PPING TOWER AT 7.5 MGD
Operat/rig cost per daya
,Electricityb
Operating labor
Maintenance labor
Repair material
Instrument maintenance
4,6/Day,
60.78
4.630
5.17
.78
.94
r ,Total operating cost 72.30
I
Totalicost per mil gala
Operating
CApital
$/mil gal
9.64
8.00
Total 17.64
a 1970 dollars
4 bAverage cost per day at 7.5 mgd from 10 months of continuous operation, i.e.,May, 1969, through September, 1970.
-9-84
4 56'
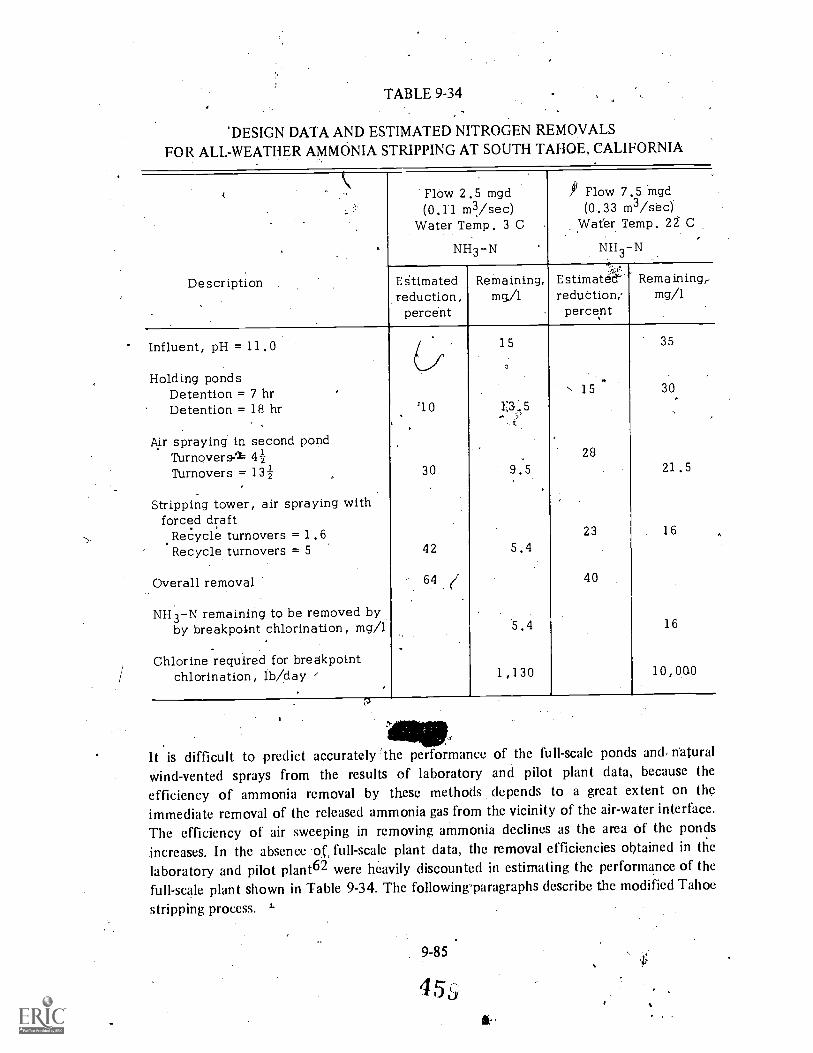
TABLE 9-34
'DESIGN DATA AND ESTIMATED NITROGEN REMOVALSFOR ALL-WEATHER AMMONIA STRIPPING AT SOUTH TAHOE, CALIFORNIA
Description
Flow 2.5 mgd(0.11 m3 /sec)
Water Temp, 3 C
NH3-N
Es.timatedreduction,
percent
Remaining,mg,/1
Flow 7.5 mgd(0..33 m3 /sec)
Water Temp. 22 C
NH 3-N
Estimatacreduction;
percept
Remaining,mg/1
Influent, pH = 11.0
Holding pondsDetention = 7 hrDetention = 18 hr
Air spraying in second pondTurnoversTurnovers = 13-1
Stripping tower, air spraying withforced draft
Recycle turnovers =1.6Recycle turnovers = 5
Overall removal
NH3-N remaining to be removed byby breakpoint chlorination, mg/1
Chlorine required for breakpointchlorination, lb/day
'10
30
42
64
15
9.5
5.4
5.4
1,130
N 15
28
23
40
35
30
21 .5
16
16
10,000
It is difficult to predict accurately the performance of the full-scale ponds and natural
wind-vented sprays from the results of laboratory and pilot plant data, because theefficiency of ammonia removal by these methods depends to a great extent on theimmediate removal of the released ammonia gas from the vicinity of the air-water interface.
The efficiency of air sweeping in removing ammonia declines as the area of the pondsincreases. In the absence of, full-scale plant data, the removal efficiencies obtained in the
laboratory and pilot plant62 were heavily discounted in estimating the performance of the
full-scale plant shown in Table 9-34. The following'paragraphs describe the modified Tahoe
stripping process. '1-
9-85
45S

The two high TH ponds also serve to equalize flow to the modified stripping tower andbreakpoint facilities. This reduces &sign capacity requirements for these two processes andimprove' their operating characteristics. The total surface area of 'these. ponds is about64,.000 sq ft (5946 m2). The water depth. varies from 3.0 to 7.25 'ft (0.9 in 2.2 m).Detention time ranges from 7 hr, at 7.5 mgd (0.33 m3/secYto:18 hr at 2.5. mgd (0.1-1'm3/sec)..The second pOnd in the series is provided with surface agitation in order to increasethe ammonia removal. The system of surface agitation consists of sprinkling with 34 mgd(1.5 m3 /sec) of recycled pond water through 2 pumps and a spray system consisting ofabout 75 vertical nozzles each delivering about 320 g. pm (20.1 liseb). At the 2.5 mgd (0,11M3/sec) plant flow, the spray system recycles the pond water 13 times; and at the 7.5 mgd(0.33 m3/sec) flow, 4 recycles occur. The spray nozzlop are 4 in. x 21/2 in. (10.2 cm xcm) female pipe reducers each fitted with a 21/2 in. x 11/2 in. (6.35 cm x 3.8 cm) bushing.Each spray oroflce is about 1-7/8 in. (4:8 cm) in diameter: Nozzles having interval vanes orother obstructions introduce air containing carbon dioxide'to the water in the nozzle, Thiscauses deposition and rapid buildup of calcium carbonate within the nozzle. Such nozzlesare unszitisfactory because of the resulting plugging and flow restriction problems.Onlynozzles with unobstructed clear opening, and without, internal vanes, should he used.
tA major modification has been made to theexistilig stripping tower. The existing packinghas been removed. and the entire area of the tower equipped with water sprays. The existing-trays at the top of the tower distribute part of the flow, and 4 nozzle equipped headers inthe bottom of the tower spray water upward into the tower. The pump capacity to thetower. is 11.8 mgd (0.52 m3/sec). At cold weather plant flow rates of 2.5 ma (0.11m3/sec), this flow will provide a recycle rate of 5 through the sprays in the tower. Thecapacity and type of nozzle used in the tower is similar to the nozzles-used in the ponck'.Based on plant scab tests of this spray system, with the induced draft. fan operating at highspeed. it is algicipated that at least 42 percent of the ammonia in the pond effluent will beremoved in the tower under cold weather operating conditions.
Chlorine may he added at two points in the process (Figure 8-9). The first point ofapplication is in the primary recarbonation chamber at a pH of 11.0. Only enough chlorineis added to reduce the pH to about 9.6, thus eliminating the need for addition of carbondioxide (C0-1) at this point. About 65 mg/1 is required to reduce the pH from 11.0 to 9.6.The balance of the chlorine needed TO reach' the breakpoint for complete ammonia removalis added in a chamber inimediately downstream from the secondary recarbonation chamber.At times sufficient chlorine is added at this point to reduce the pH to 7.0 or less, so that noCO-) will be required. A dose of approximately 160 mg/1 of chlorine is required to reducethe.pH from 11.0 Co 7.0. When the breakpoint is reached withr..a lesser dose of chlorine, thensome CO2 must be added in the secondary stage of recarbtiiation to produce a pH of 7.0.About 10 nig/1 of chlorine is required for each mg/1 of N14 N toreach bitakpoint. Afterbreakpoint chlorination treatment, water from thei)allast pondispumped to the existingfilters and carbon columns. The carbon columns remove any excess chlorine. The modifiedTahoe process was being placed in dpeetttionklt the time of this writing an full-scale dataare not yi.q available.
9-86'.
41;0
9.5.5.2 Orange County Water District, California
The Orange County Water District (OCWD) at Santa Ana, California has under constructiona 15 mgd (0.66 m3/sec),wastewaterreclamation plant and 3 mgd (0.13 m3/sec) seawaterdesalting: plant at ,,the same site.6° Ve water from the tv.,7641ants will be blended andpumped into d,line.,of injection wells which are locate,c1 on the land side of a line of seawaterpumping ,wells.' to, form a barrier against seawater, intrusion into the fresh water aquifer.63The injection system also serves to replenish the supply of'groundwater available for use:The OCWD %Vater reclamaliitk plant will take 15 mgd (0.66 m3/sec). of trickling filtereffluent from the:Secondary treatment' plant of the Orange ,County Sanitation District. Itwill be subjected to high lime treatment at pH of .11.0 andclarification iri a basin equippedwith settling ttibes.The clarified high pH water will he pumped to two countercurrentammonia strippingliowers. lb the climat at this location, freezing temperatures are notexperienced,: and waste heat froni the de alting plant operation will 'be used to heat the inletair to the striping towers for. increased 'mmonia -removal efficiency. The design also fullyrealizes' scaling problems encountered e sewhere and incorpOrates provisions for scalecontrol even though. scaling was not a problem in pilot tests 'arthis.site..
The is 'designed with two ammonia stripping /cooling towers each equipped with six 18'ft (5.49, m) diameter fans. An end section view of a tower is shown in Figure 9-32 and anoverall view is shown in Figure 9-33. The stripping .sections -are designed for a hydraulicloading of 1.0 grim/ft2. (0.68 1/m2/sec) and ah air flaw of 400 cuTt/gal (2,990 m3/m3). Thecooling sections are designed to cool the desalting process water and brines from 46-49 C to27-29 C and/wilt raise .the air temperature to the stripping section to 31-33C. Splash -barpacking will be used for ammonia stripping and a film packing located in the'airiplet plenumwill be used for cooling.
A prime, design criterion was that the ammonia stripping Tacking be accessible andremovable for cleaning because scaling of the packing might reduce air flow and ammoniaremoval efficiency. Provisions have been made to feed a scale inhibiting polymer, if needed.
.
to the tower influent. The .warm saturated air exhausted from the cooling sectionstheoretically would permit the tower packing to be less than the design height of 25 ft (7.6m). Because during the first few years.of operations the desidting plant will operate on an_intermittent basis. it was not considered prudent to reduce the packing depth.
The tower 'fill of packing, is made from rah in. (1:27 cm) diameter Sthedule slo pvc pipe at 3in. (7.6 cm)' centers horizontally and with alternate'layers placed at right angles and all2 in.(5.1 cm):c&nters verticallmp(see Figure 9-34). The fill was factory prefabricated it moduleswhich are about ft (1.82 m) by 6 ft (1.82 m)- by 4 ft.(1.22 m) high. Each module N`
'supported witliin its,own steel. or fiberglaSs frame, so that it is easily removable if, necessaryfor cleaning. An.overlicad hoist and moveable.dolly are provided to 'assist in packing removalfor cleaning. However, the access corridors and the removable air baffle'panels in the towershould make it possible to reach all of the fill in its normal operating position within thetower for hosing doWn to remove any excessive .calcium carbonate scale which may form.
0 9-87
46.E
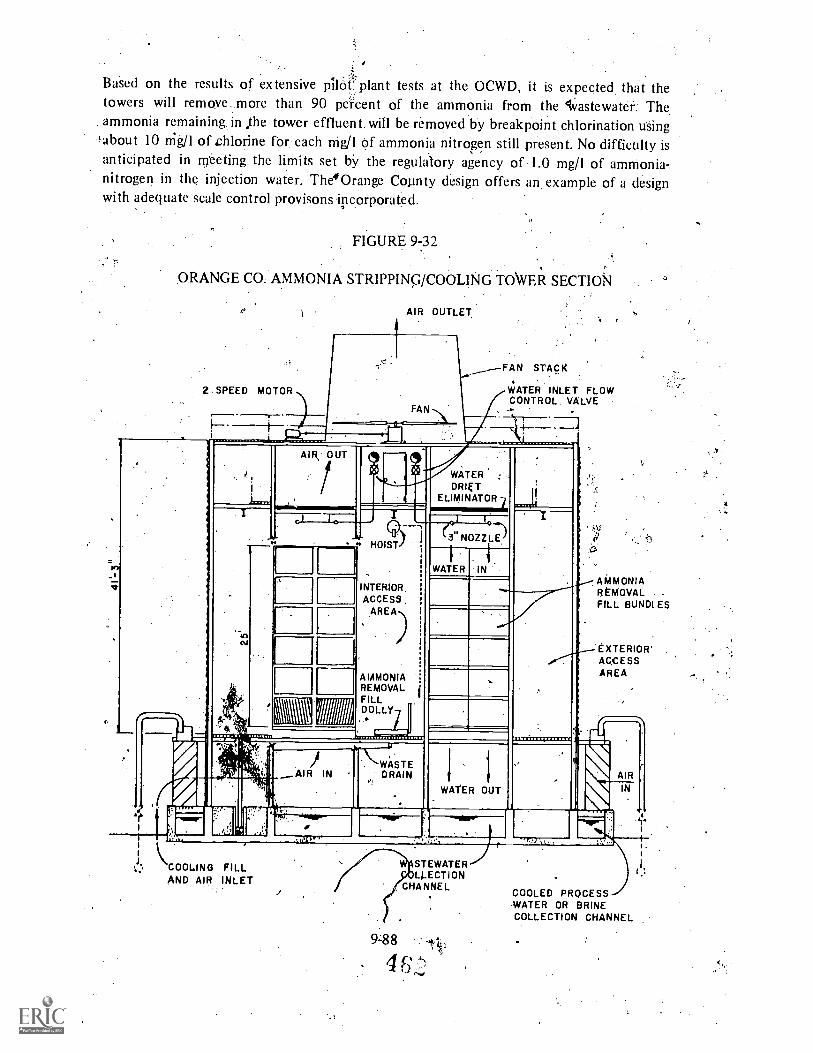
BaSed on the results of extensive pilOC plant tests at the OCWD, it is expected that the;y.towers will remove. .more than 90 percent of the ammonia from the .wastewater. The
ammonia remaining. in the tower effluent will be removed by breakpoint chlorination using'about 10 trio of chlorine for each nig/1 qf ammonia nitrogen still present. No diffictilty isanticipated in rri'eeting the limits set by the regulatory agency of 1.0 mg/1 of ammonia-nitrogen in the injection water, The4Orange County design offers an, example of a designwith adequate scale control provisons incorporated.
FIGURE 9:32
ORANGE CO. AMMONIA STRIPPING/COOLING TOWER SECTION
AIR OUTLET
FAN STACK
WATER INLET FLOWCONTROL. VALVE
2 SPEED MOTOR
AMMONIAREMOVAL -
FILL BUNDLES
EXTERIOR'ACCESSAREA
r1
COOLING FILLAND AIR INLET
STEWATERLLECT ION
CHANNEL
9-88
COOLED PROCESS }WATER OR BRINECOLLECTION CHANNEL
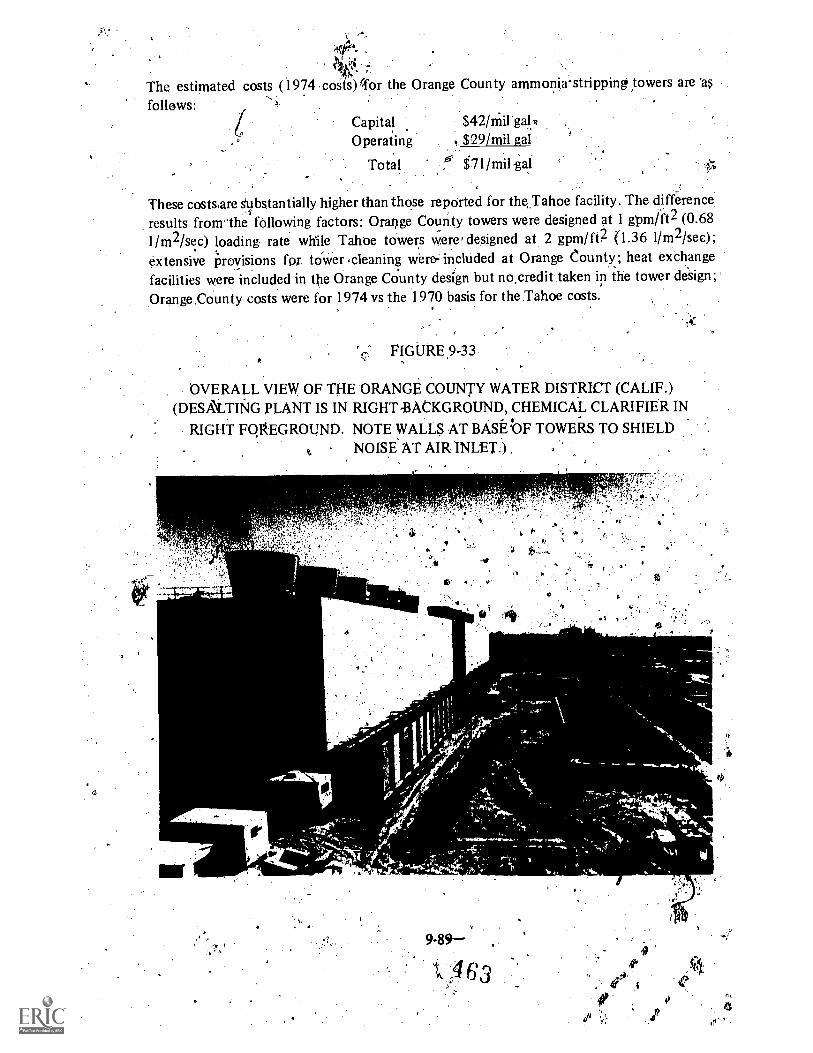
The estimated costs (1974 cots) or the Orange County ammonia-stripping towers are as
follows:
( Capital $42/niirgalvOperating , $29/mil gal
Total :' 7l/milgal
These costs-are substantially higher than those reported for the Tahoe facility. The difference
results fromIhe following factors: Orange County towers were designed at 1 gpm/ft2 (0.6811m2/sec) loading rate while Tahoe towers were, designed at 2 gpm/ft2 (1.36 1/m2/sec);extensive Provisions for tower -cleaning were, included at Orange County; heat exchangefacilities were included in the Orange County design but no,credit taken in the tower deign;Orange County costs were for 1974 vs the 1970 basis for the Tahoe costs.
FIGURE,9-33.
OVERALL VIEW. OF THE ORANGE COUNTY WATER DISTRICT (CALIF.)(DESATING PLANT IS IN RIGHT-BACKGROUND, CHEMICAL CLARIFIER IN
RIGHT FOREGROUND. NOTE WALLS AT BASE OF TOWERS TO SHIELDNOISE AT AIR INLET.)
tlje:
.
v..
eor .
4".0
. ,t
40) .
3**. .,
.#.414 4,
.7 9:6 .Re feren °es;...
,' ;"
,, . Horkkotte, G.A., Niles, D,G.; Parker, D,S., and P.p. CaldWelftyll-Scale Testing'of a -
Writer Reclamation System. IWPCF,..46,, No. '1, lip.18 1-19? (1974)..- , 4
"2, : Mulbarger,./.M.C., The Three $ludge%.SYstem for Nitrogen and Phosphorus Removal. -
Presented at the 44Ith Annuaftorifeacce of. the Water Pollution Control Federation,!.
.
'San- Francesco, California,,October, '1971., . , i. ,. ..
D,?gritidd'ir of the . El ilLago,; Texas, ..Advanced Wastewater Treatment Plant. Harris .
... CO.U,"?ItY- Water, Contni,l'and ImProyement Distriek Number 5 Seabrook, texas,. Mardi;. Ar. 1974 '.4:;;, '' ' ! '..
:' ....
1 . ,e...I., . ,, ..,
.,
4; BlishoP4 D.F.,' O'Farrellz,T.P., Cassel, .A.F.,Iliarid A.P. Pinto, PhySieal-ChemicalTreatment, of Raiv Municipal. Wastewater. RepotC rireliared for the EnvironmentalPrOteclionAgency, Contract Number 14-12, 18, FOrtiaty; 1973.
... ,.
Koon, .J.H., and'W.J..Kauffnan4; Optimization o monia Removal ,by Ion Exchange'. Using ClinOptilolite...: Environnwntal Protectiori. Agency Water Pollution Control .
.Research Series N6..17080.09/7 U, '19712 c
a
4Bishop, D.F., Sclitik, W., Yarrington,, R., E.D. and H.W. Treupel,
.Wastewater Treatment' Under Direct Digital Contr61. Presented at .
the International Workshop: Instrumentation, Control and Automation for Wastevaler.Trktm' °Plants, London, SeptembeT 15720,
-",
.1,,
nes,: .R.A., Atkins, U.,. P., and D.A. Sclierger,- Ammonia. Remo Pul".
Physic 1-Clienacal Wastewater Treatment Process' Prepared for the EPA, Report o;:.%
.R2-72-123, November, 1.972.
. .. . ,. Brown and CaIdwei44./itpoil "Oil .Ter,tiari,- Treat-40i- Pilot.. Plant Sillies..Prp4.ed. for
, ,. ,,..,the City'of Sunnyvale,- California, Februaly,,4975, ", -. . `
9.~V
A . ' * 9.
9. ProCess .Design 'Many' 1. for PhOspiiorus geinoyal. U.S. 4tA, -dffice of TechnOlogy \,.:
. . ,
Transfer, Washingtonp:a. (.1974t. .. , -" " .
..: ..,..,) 4 '4 , .
N....sk".,; ' ''' '''' . -.. '' ,'. ' . '
IG. Process 'Design Itilanuatfor!!Carbon A6Uorption. 'U.S. EPA: OffiCe of Technology..3
Transfer, Washington, .b..c: (197.3); .'' ,. 4,,,
. 44, . '. .: . .. et:,#.11. Brown and.CAlwell, Con.11ting Engineers, Lime !Ik.:in.Wa.'s:tewater Treatment. Repot.
submitted to the U:S. Environmental, ProtectionAgericy:, '1975. '
;4 '
Ctilp, Wesner,16.M., and 'R,C Cull); 19.74 Lake Taksie Advanced WasteivaterTreatment Seminar Manual. ClearipWater" Dorado
.1974. ,'.".
13, South Tahoe Public Utility Districtildranced Waste Treatment as'Practiced at South.4,
Tahoe. EPA WPCRS I70 I OELQ8/71, August, 1971. ..?:', t;
14. ..,i. ,,"Brown and Caldwell, Linn' Sludge. Recycli4 Study. Report to the Centrral Contra.,,
Costa Sanitary. District, June, 1'974.
P15. Battelle Memorial. Instituter;" acifie Northwest Laboratories, Evaluation .of Municipal
$e Cage Treatment IternatiPes. Prepared for the Council on Environmental Qualityand-the Environmental Protection Agency, Contract EQC 316, February, 1974.,
, .
16. Greene, R.A., ('omp/cte :Vitrification hi Si igle Stage Activated Sludge. Presented itthe 46th Annual Conference' of the Water Pollution Control Federation, _Cleveland;Ohio, October, 1973; g,
17. McNameIs, Porter' and Seeley, Ccinsulting Engineers, Plaits Jor Sewage Treatment PlantAdditiqns, City of Jackson, Michig an. Submitted to the Michigan Water ResourcesCommission, October, 1979.
18. Greene, R.A., Personal Cone, unication to Parker, D.S., City of Jackson, Michigan,September, 1974.
1 9. Brown and Caldwell, Project Report JOr the Wastewater Treatment Plant- StageImprorewents. Valley Community Se.iiices District, September, 1972.
20. Valley Community Services District, Wastewater Treatment Plant Operating Reports.
21. ?Anson, James . L., Personal Communication to G.A. Carthew. Valley Community,Services District, November, 1'974.
22. Environmental Quality. Analysts, Inc., Letter Report to Valley Commtiflity Services.District. March, 1974.
23. Brown and Caldwell, Contract for Treatment Plant Enlargementthe City of Livermore. December, 1965.
/965. Prepared for
24. City of Livermore, California, Water Reekunation Plant Operating Reports, 1971.
25. John Carolto Engineers. Contract DoCuMents jor San Pablo Sanitary DistrictWastewater Treatment Plants'. 1070 Additions. 1970.
26. Kennedy. Bill, personal commtmication with Parker. San Pablo Sanitary District.November. 1974'.,
2.7. San Patel° Safittary District, California. Wastewater Treatment Plant.Operating Reports.June:197.3 to July, 1974.
9-92
4
28. Weddle, C.L., Personal communication to D.S. Parker, Bechtel, Corp. October, 1974.
29. Fisenhatier, D.L., Sieger, R.B. and D.S. Parker, Design of an Integrated Approach toNutrient Removal-Presented at the EED-ASCE Specialty Conference, Penn: State .
University, Pa., July, 1974.
30. Leary, R.D., et al, Effect of Oxygen-Transfer Capabilities on Wastewater TreatmentPlant Performance. Journal of the Water Pollution Control Federation, 40, p 1978(1968).
31. Leary, R.D., et al. Full Scale Oxygen. Transfer Studies of Seven -DiffUser Systems.Journal of the Water Pollution Control Federation, 41, p 459 (1969).
32. Aberley, R.C., Rattray,;G.B. andR.P. Dougas; Air Diffusion Unit: JWPCF; 46, No. 5,pp 895-910 (1974).
33. Parker, D.S., Carthew, G.A. and G.A. Horstkotte, Lime Recovery and Reuse in PrimaryTreatment. EED of the ASCE, in pieSS.
34.. Flanagan, MI., Direct Digital Control of Central Contra Costa Sanitary District WaterReclamation Plant. Presented at IAWPR Specialized-Conference, London, England,September, 1973.
35. Caldwell Connell Engineers, Design Report, Lower Molonglo Water Quality ControlCc.'ntre. [report to the National.Capital Developinent Commission, April, 1971.
36. Caldwell Connell Engineers; Revisions to Design Report, Lower Maio, lo WaterQuality Control Centre. Report to the National Capital Development Commission,May, 1972:
37. Process. Design Manual for Upgrading Existing Wastewater Treatment Plants. U.S. EPA,Office of Technology Transfer, Washington, D.C. (1974):
38. Schwinn, D.E., Design Features of the District of Columbia's WaterPollution Control.Plant. Presented at the.,Sanitary Engineering Specialty Conference, ASCE, SanitaryEngineering Divisibn, Rochester, New York, June, 1972.
39. Schwjnn, D.E., and G.K. Tozer,largest Advanced Waste Treatment Plant in the U.S.and in the World. Environmental Science and Technology, 8, NO. 10, (1974).
. 40. Sawyer, C.N., Supplementary Comments.on Nitrification and Denitrification Facilities.Pre*.pared for the EPA Technology TransferSeminar, Denver, Colorado, November ,13,1974:
9-93
46;

41. EPA Postpones. Denitrification. Reporter, Interstate Commerce CommissiotivOn. thePotomac RivetiBasin, 32, No. 2, February, 1975.
ir?
42. Harris County Water Control and Improvethent District No. 50, Monthly ProgressReport jOiVctoher 1974, on Project 11010 GNM, prepared for the EPA.
43. Bast EPA Technology Transfer Design Seminar on Nitrogen Control Tech-.?
nolo tesented at Denver, Colorado, November'13, 1974.
44. Brown4nd Caldwell/Dewante and Stowell, Feasibility Snub' for the Northeust-CentralSewage Service Area. Prepared for the County ofSacramento, NOvember, 1974.
45. Sacramento Area Consultants, Outfall Project and t.nvironmental Impact Report.Prepa. red for the Sacramento Regional County Sanitation District, December, 1974.
46. Sacramento Area Consultants, :1:ernical .Report, Sacramento Regional WastewaterTreatment Plant. Jzinnty,
47. White. G.C., PLtsolalCvnual,tnicatinn to T. Appel, June, 1974.
48. CH2M/Hill, OeSts;1 Y M,./.!zome?y -Cninty. Maryland Plant for the WashingtonSuhurbail Suitt fir) C,')-urissiori I 9 iS
49. Culp, G. L. k L. ar,d C. L. Hiviani.t,:11'ater Resource Preservation by PlannedRecycling of Treated Nastewat,'.. JAWW A, 65, No. 19, pp ..41-647 (1973).
50. -CH2M/Hill; Wastewater Treatment Study,. Montgomery County, Maryland. November,
51. Cloromut. Ionics, Inc. Brochure
52. Michalek, S.A., and F.B. Leitz, On-Site Generation o[Hypochloriii. JWPCF, 44, No. 9,pp 1697-'1712 (1972).
53. Suhr. L.G.; and L. Kepple, Design's a Selective Ion Exchange System for AmmoniaRemoval. Presented at the ,ASCE Environmental Engineering Division Conference,Pennsylvania State University, July 1974..
54. CH2M/Hill, Design of the Upper OccoquanSewage Authority. (1974).
55. Physical - Chemical Plant Treats .Sewage Near the Twin Cities. Water and Sewage Works,p. 86, September, 1973:
-9-94
56. Larkman; D., Physical-Chemical Tfeatmento87, June 18, 193. f
cal Engineering, DeskbolIsstie, p.
5.7. Culp; R.L., Nitrogen Removal by Air Stripping. iiroceedings, Wastewater Reclamationand Reuse Workshop, SERL, Univ. of California, Lake Tahoe, Ca., June 25-27; p. 128,1970.
58. Culp, R.L. and G.L. Culp, Advanced Wastewater Treatmont. 'Van Nostrand ReinholdCo., New York,,p. 51, 1971.
59. Culp, R.L., and H.E. Moyer, Wastewater Reclamation and Export at soli: Tahoe.'CivilEngineering, p. 38,.June, 1969.
.fd1
I 60. Wesner, and R.L. Cuip, Vistewater ReclamatiOn iffid Seawater Desalination,JWPCF, No. 10, pp 1932-1939 (1972). ..
.12,,
61. Folkman, V., and A.MeWachs, Nitrogen Removal Through Anurjnia.Releae FromHolding Punch.. Proceedings, 6th Annual International Water Pollution -ResearchConference Tel Aviv, Israel, June 18-23: 19.72.
62. Gonzales, JOhn G., and FOL. dulp, New Developments in Ammonia Stripping, PublicWorkts, 104.-No. p. 78 (1973) and No. 6, p. 82 (1973).
63. -Apsner, G.M., and D.C. Baier, Injection of Reclaimed Wastewater Int9AijuiJers. JAWWA, 62, No. 3,' pp 203-210 (1970).
Confined

Symbol
A
ADWF
(a)
B
BHP
C
Cl
C13.
Cm
Cs
Do
D1
Do
a.
APPENDIX A
GLOSSARY OF SYMBOLS l .
as
airP.cu
numbs
,
unit of tankper 1000
act .stabilizatt
t'er flow ,7,,;
.7)
fraction Of Iiitigiil-tabifization tanIctitygenrequired, fpf., carbana,ceous dicidatiOri,v
brake horsepoWer:..*
4ractiOn' ofrle Iczkal sludge irf contget tank
,concentration of nitrate nit ogen, mg h axialdispersion coefficient, sq
influent;NO-N, mg/I`3
effluent NO3
-N, mg/I
mass average influent NO3-N le f.,mg /1
1)
vex

Symbol
DO
eo
F/M
f
HT
KD
d :
M
KN
L
M
Mc-
Definition
mass,perage effluent NO3-N level over 24 hr,mg/1
dissolved oxygen, ing/1
aerator rated oxygen. transfer efficiency at N
standard conditions, percent
:sc,i food to microorganism ratio
nitrifier fraction of the mixed liqb.orIgolids;fanning friction factor
4
hydrelic 'clitfeittiOn time ,
,inventorytof VSS under aeration, It
selectivity coeffiert fofk, n exchange equilibrig., ; ./
half` saturallaQ con5tati for nitrifi mg /1
NO .
310 4 i
"decay" coefficient* day-4...,.
ahalf saturatiw, catstalp for methanol, mg/1of methanol 0..1'
half saturation constant for oxidation ofammonia riiiirogh, mg/1
half saturation crstant for1`
half saturation constant = subs*tion'; mg/1 at half the maximum
tank length, ft
methanol concentration, mg/I
Jrias of heterotrophs gown through oxidationltif organic carbon
A-2
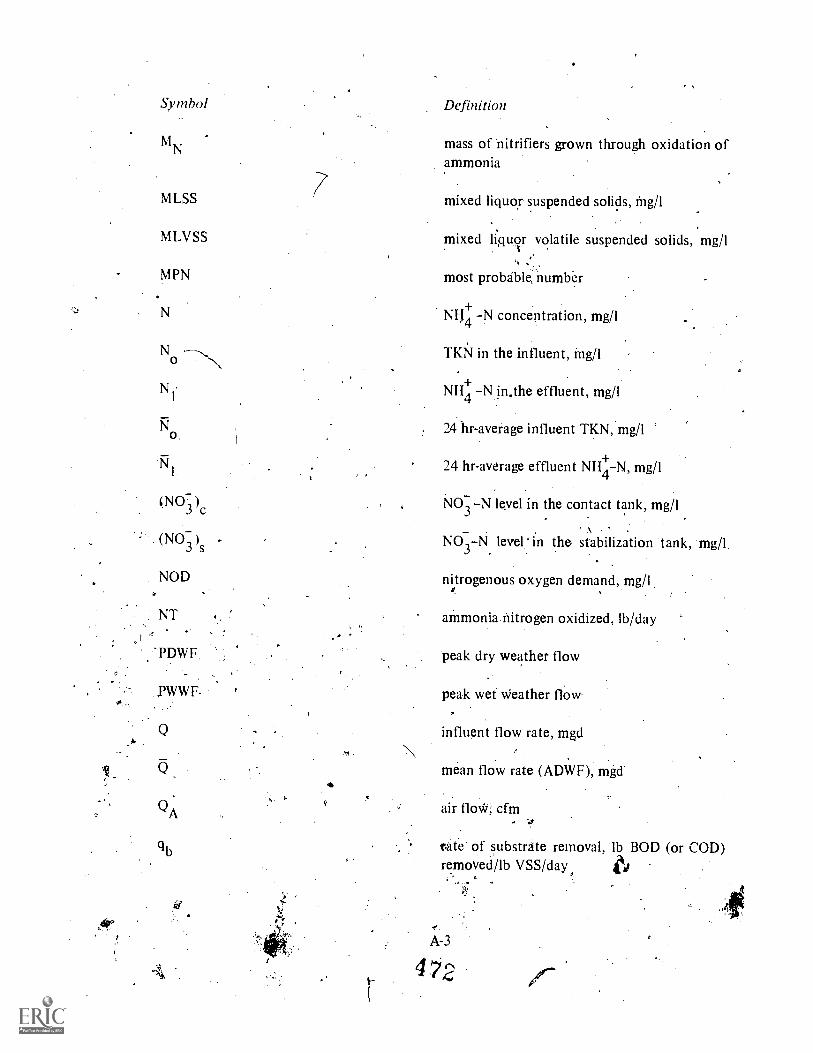
Symbol Definition
MN.
MLSS
MLVSS
MPN
N
No
NI
No.
mass of nitrifiers grown through oxidation ofammonia
mixed liquor suspended solids, fng /1
mixed liquor volatile suspended solids, mg/1
most probable number
NI-J4 -N concentration, mg/1
TKN in the influent, mg/1
NH4-N in.the effluent, mg/I
24 hr-average influent TKN, mg/1
N1 24 hr-average effluent NH4-N, mg/1
(NO3 )c NO3 -N level in the contact tank, mg/1
(NO3 )s NO3-N level in the stabilization tank, g/1
nitrogenous oxygen demand, mg/1
ammonia nitrogen oxidized, lb/day
peak dry weather flow
peak wet weather flow.
NOD
NT
-PDWF
,PWW F.
Q influent flow rate, mgd
mean flow rate (ADWF), mgd
air flow; cfm
rate of substrate removal, lb BOD (or COD)removed /lb VSS/day, 6
.
A-3
4'72

Symbol
(ID
cID
rN
Ar
N
S
SCFM
S0
SF
SS
SVI
T
TKN
At
,
*
.4
a
Definition
nitrate removal rate, lb NO3N rem./lb VSS/'day
peak nitrate removal rate, lb. NO3N rem. /lb-VSS/day
ammonia oxidation rate, lb NFI+4N oxidized/lb VSS/day
peak ammonia oxidation rate, lb' NH+4Noxidized/lb VSS/day
nitrification rate, lb NH -N oxidized/lbMLVSS/day
peak nitrification rate, lb NH4N oxidized/lb MLVSS/dajr
recycle flow rate, mgd
growth limiting substrate concentration, mg/I;total sltidge wa#ted4ii lb/day
standard cubic t per
irilluent total B D), mg/1
effluent soluble l4OD (or COD)4 lig/1
safe.ty factor
suspended solids., mg/1
sludge volume index, nl/g
temperature, degrees C
Total Kjeldahl.Nitiogen
I -v., time increment
A-4
9
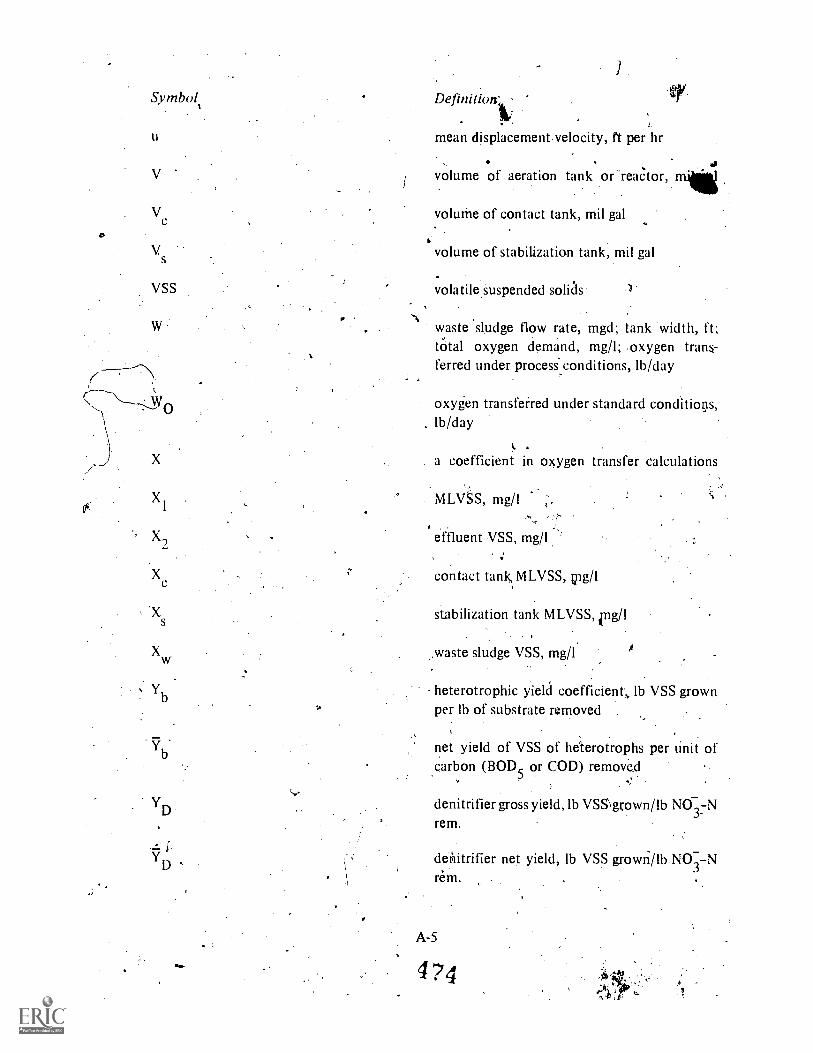
Symbol, Definitiorrl
u mean displacement velocity, Pt per hr
V volume of aeration tank or-reactor, nig
V voluthe of contact tank, mil gal
Vs volume of stabilization tank, mil gal
VSS volatile suspended solids
X
Xc
Xs
waste sludge Clow rate, mgd; tank width, ft;total oxygen demand, mg/l; oxygen trans-ferred under process conditions, lb/day
oxygen transfeired under standard conditiops,lb/day
a coefficient in oxygen transfer calculations
MLVSS, mg/I
effluent VSS, mg/I
contact tank MLVSS,
stabilization tank MLVSS,ing/1
X w .waste sludge VSS, mg/1
Yb
D
D
heterotrophic yielClcoefficient., lb VSS grownper lb of substrate removed
net yield of VSS of heterotrophs per unit ofcarbon (BOD
5or COD) removed
denitrifier gross yield, lb VSS\ gown/lb NO3 :-Nrem.
dehitrifier net yield, lb VSS grown/lb NO3-Nrem.
A-5
474

Symbol
YN
Oc
Oc
Pc
,PD
A
D
AP.
Definition
organism yield coefficient, lb Nitrosomonctsgrown (VSS) per lb N1-1+4-1\removed
selectivity coefficient for ion exchange equili-,bria .
solids retention' time, days
solids retention time of design, days
iminimum 'solids retention time, days, for.nitrification at given p1-1, T and DO
, .-1growth rate of microorganism, day
maximum growth rate of microorganism,-1
net growth rate of heterotrophic,population
growth rate of nitrifiers in contact tank, day 1-
denitrifier growth rate, day-1
maximum denitrifier growth rate, day 1
_design denitrifier growth rate, day
1
Nitrosomon growth rate, day-1
peak Nitrosomonas growth rate, day-1
maximum possible nitrifier growth rate underenvironmental conditions' or T, 'pH and DO,and N KN
growth rate of nitrifiers in stabilization tank,'
day
A-6
.

APPENDIX BMETRIC EQUIVALENTS
METRIC CONVERSION TABLES
Recommended /'nips Recommended l'nits
Description . Unit Symbol Comments
Length meter m Path .S1 'trot
kilometer' kmmillimeter mmcentimeter cmmicrometer . gm
Area square meter m2 10 744 sq ft' 1 196 sq Yd
square kilometer ' km2 6.384 sq nu247 acres
square millimeter mm2 0.00155 sq in, )square centimeter cm2 0.155 sq in.
hectare ha , The hectare (10,000 2.471 acresm2) is a recognized 7 'multiple unit and . _will Imam in biter Viscosityrational use.
olurne ..cubic metre m3 35 314 cu lt ' - KZ:r1.3079 cu yd ; Pressure ' newton per N/m2 The newton is not 0,00014 psi
Cubic centimeter cm3 if 0 061 cu in. square meter yet well known asthe unit ol force
hut I The liter 'is now 1 057 qt ' 0.264 gal kdonewton per kN /m2 ' and kill cm? will 0 145 pp..
recognised as the . 0.81 X 10.4 acie square meter clearly be used forspecial name for It ` some time In Ibisthe cubic decimeter kilogram (force) kgf/crn7 held the hydraulic 14 223 psi
per square head expressed inMass kilockern kg Bash SI 'trot 2 2051E centimeter - meters7 an accept ,.gram
gram gmg0.035 or . 15.43 gr able alternative.0 01543 gr.
tonne t 1 tonne = 1,000 kg ,0984 ton (longl , Temperature degree Kelvin Haiti SI unit 5F1.1023 ton (shoril r degree Celsius The Kelvin and
90 Celsius degrees'Time- second s Mu.' .W :mit are identical_
day ' day Neither the day nor The use of thethe year is an unit Celsius scale is
s. year yr or but both are moor recommended as
1.,a rant it is the former
centigrade scale.'Force newton N The newton is'that 0.22481 lb (weight/ .
force that produces I . 7.t posindals Work, energy, route i 1 pule 0 1 N rn ilk 2 778X 10 7an acceleration of quantity ol heat y kw hr '1 rrt/s2 in a mass / 3.725 X 10'7of 1 kg hp hr 0 0.73156
ft ha 0 9 48 X10-° Btu
knOtoule kJ 2 778 kw hr
Power watt W 1 watt = I J/s
EnglishEquivalents
39 37 in 3 28 11 =' 1.09 Yd0.62 mi0.03937 in.0 3937 in3.937 X 103` 103A
EnglishDescu,tion Unit Symbol . Comments Equivalents
Velocitylinear meter per m/s 3.28 fps.
secondmillimeter mm/s 0 00328 Upiper secondkilometers kmls 2 230 mphper second
angular radians per rad/s .
second
cubic meter m3/s Commonly called 15.850 gpmper second the cumec ' 2 120 cfm
liter per second I/s 15.85 gpm
poise poise 0 0672 '11). sec It
, Flow Iirolumotric7
L.
kilowatt kWpule per second As
4pp/ice/lion of Unit: Application of
Description Unit Symbol. Comments
Precipitation, rnillimetei mm For meteorologicalrun off, purposes it may bereaporation convenient to meal
ore precipitation interms of mass/unitarea (kg/m3)1 mm of rain '1 kg/sq m Hydraulic load cubic meter . m3, m' day. II this is con
per unit area, per square meter vetted to aRiver flow cubic meter mills Commonly caller 314 cfs e.g filtration per day velocity, itper second the cumec ' rates 'should be ex
,a pressed in'rnmlsFlow in pipes, cubic meter per 'm.3/s
'''. (1 mm/s . 86 4conduits,chan second 'm3/m2 day),nvls,over weirs,
pumping liter per second Us 15 85 gpM . Hydraulic load ' cubic meter m3/m3 dayper unit volume, per cubic meter
Discharges or cubic meter m3/day 1 l/s 86.4 m3/day .1.83 X 10.-Igpm 'e g biological per dayabstractions, per day filters, lagoonsyields ,
m3/yr Air supply cubic meter or m3/sliter of free air
Ilperson ,.:,
per second I/s .
day Pipesdiameter millimeter mm
kg/m3 The density of 0.0624 Iblcu It length meter mwater under standan conditions is1,000 kg /mJ or Optical units lumen per lumen /m21.000 g'l square,meter
EnglishEquivalents
EnglishDescription Unit Sy rubor Comments Equivalents
Concentration milligram per, mg/I I PMliter e
BOO loading kilogram per kg/m3 day . 0 0624 lb /cultcubic meter
,
per day
Usage of water
Density'
cubic meterper year
liter per personPer day
kilogram.percubic meter
0.264 gcpd
3 28 cu ft/sq It
0.03937 in;39.37 ir3.28 ft
0.09'2 tcandle/sq It
4
- 3-468 ,