eoct review may 7 th 2010. 3 domains… 1) algebra 1) algebra 2) geometry 2) geometry 3) data...
TRANSCRIPT

EOCT ReviewEOCT Review
May 7May 7thth 2010 2010

3 Domains…3 Domains…
1) ALGEBRA1) ALGEBRA
2) GEOMETRY2) GEOMETRY
3) DATA ANALYSIS3) DATA ANALYSIS

I.) ALGEBRAI.) ALGEBRA
Complex Numbers Complex Numbers –– Sections 1.1 – 1.3Sections 1.1 – 1.3 Piecewise FunctionsPiecewise Functions – Section 2.5 – Section 2.5 Absolute Value FunctionsAbsolute Value Functions – Section 2.2 – Section 2.2 Exponential Functions Exponential Functions – Sections 4.4 – – Sections 4.4 –
4.64.6 Quadratic Functions Quadratic Functions – Sections 3.1 – 3.3– Sections 3.1 – 3.3 Solve QuadraticsSolve Quadratics – Sections 3.4 – 3.9 – Sections 3.4 – 3.9 Inverse of FunctionsInverse of Functions – Section 4.3 – Section 4.3

Imaginary Numbers…Imaginary Numbers…
Standard form of Complex Numbers…Standard form of Complex Numbers…
2 1i 1i
a bi
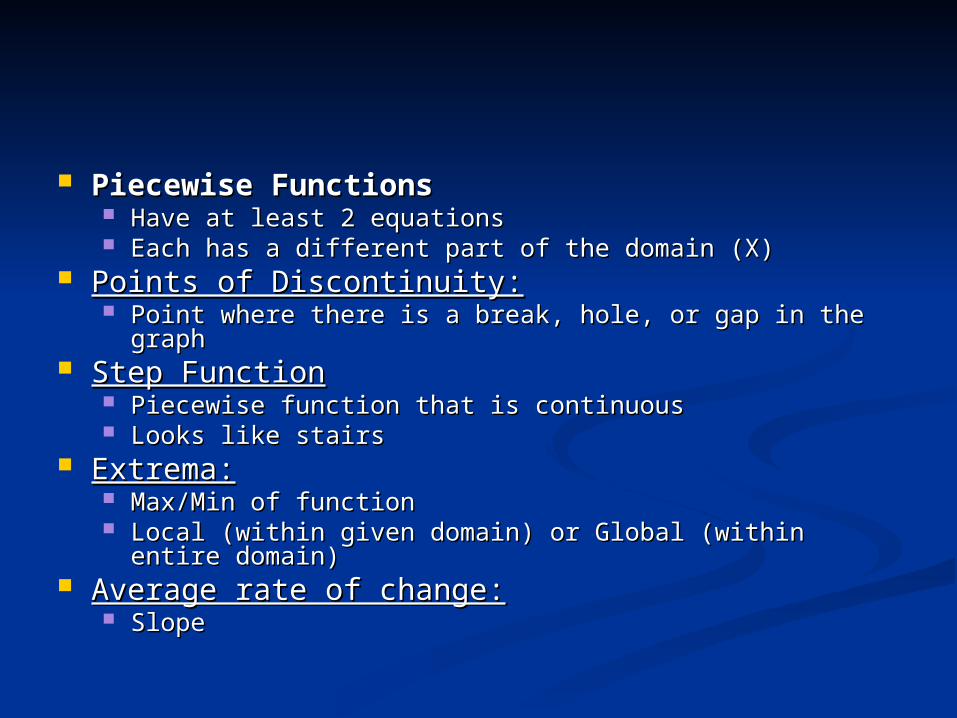
Piecewise Functions Piecewise Functions Have at least 2 equationsHave at least 2 equations Each has a different part of the domain (X)Each has a different part of the domain (X)
Points of Discontinuity:Points of Discontinuity: Point where there is a break, hole, or gap in the graphPoint where there is a break, hole, or gap in the graph
Step FunctionStep Function Piecewise function that is continuousPiecewise function that is continuous Looks like stairsLooks like stairs
Extrema:Extrema: Max/Min of functionMax/Min of function Local (within given domain) or Global (within entire Local (within given domain) or Global (within entire
domain)domain) Average rate of change:Average rate of change:
SlopeSlope

Here’s what a piecewise function Here’s what a piecewise function looks likelooks like

Absolute Value FunctionsAbsolute Value Functions
The vertex is ( h , k ) – that moves the vertexThe vertex is ( h , k ) – that moves the vertex
Plot 2 other points (use symmetry)Plot 2 other points (use symmetry)
a – makes the graph wider / narrower (slope)a – makes the graph wider / narrower (slope)
Intervals – on either side of the vertexIntervals – on either side of the vertex
y a x h k

3 examples of graphs of absolute value functions. How have they been transformed?

Exponential FunctionsExponential Functions
xy ab
22 3 1xy
Translates the graph
left 2 units
Translates the graph
down 1 unit

Standard form of a Quadratic…Standard form of a Quadratic…
Vertex form of a Quadratic…Vertex form of a Quadratic…
2y ax bx c
2y a x h k

When graphing a Quadratic, can you When graphing a Quadratic, can you find…find… Domain & RangeDomain & Range VertexVertex Axis of SymmetryAxis of Symmetry Zeros (x-intercepts)Zeros (x-intercepts) Y-interceptsY-intercepts Max & Min ValuesMax & Min Values Intervals of Increase & DecreaseIntervals of Increase & Decrease

Solving a Quadratic Equation…Solving a Quadratic Equation… By FactoringBy Factoring
By Completing the SquareBy Completing the Square
By GraphingBy Graphing
By Quadratic FormulaBy Quadratic Formula2 4
2
b b acx
a

The DiscriminantThe Discriminant – tells you the number – tells you the number of solutionsof solutions Positive – 2 real solutionsPositive – 2 real solutions Zero – 1 real solutionZero – 1 real solution Negative – 0 real solutions (2 imaginary)Negative – 0 real solutions (2 imaginary)
2 4b ac

Functions vs RelationsFunctions vs Relations
In a function, X cannot repeat! If x In a function, X cannot repeat! If x does repeat, it’s a relation. does repeat, it’s a relation.
If neither x or y repeat, it’s a 1-TO-1 If neither x or y repeat, it’s a 1-TO-1 FunctionFunction

By the By the vertical line testvertical line test, a relation , a relation is is a functiona function if and only if no vertical if and only if no vertical line intersects the graph of the line intersects the graph of the relation at more than one point.relation at more than one point.

InverseInverse
Switch the x’s and the y’sSwitch the x’s and the y’s
For an inverse to be a function, it For an inverse to be a function, it must pass the HORIZONTAL LINE must pass the HORIZONTAL LINE TESTTEST

II.) GEOMETRYII.) GEOMETRY
Special Right Triangles Special Right Triangles – Section 5.1– Section 5.1 Sine, Cosine and Tangent Sine, Cosine and Tangent - Sections - Sections
5.2 – 5.45.2 – 5.4 Properties of Circles Properties of Circles – Sections 6.1 – – Sections 6.1 –
6.86.8 Includes segments, angles, arcs, etcIncludes segments, angles, arcs, etc
SpheresSpheres – Section 6.9 – Section 6.9

45-45-90 Triangle45-45-90 Triangle
2
X
X
45
45
If you know one of the legs…If you know one of the legs… Multiply by to find the Multiply by to find the
hypotenusehypotenuse
If you know the hypotenuse…If you know the hypotenuse… Divide by to find the legsDivide by to find the legs
2

30-60-90 Triangle30-60-90 Triangle
2X
X
60
30
If you know the shorter leg…If you know the shorter leg… Multiply by 2 to find the Multiply by 2 to find the
hypotenusehypotenuse Multiply by to find the longer Multiply by to find the longer
legleg
If you know the longer leg…If you know the longer leg… Divide by to find the shorter Divide by to find the shorter
legleg
If you know the hypotenuse…If you know the hypotenuse… Divide by 2 to find the shorter legDivide by 2 to find the shorter leg

Sine, Cosine and Tangent (Trig Sine, Cosine and Tangent (Trig Ratios)Ratios)
S C S C T T
a
h
o
ao
h
Circles…Circles…
36036000 total total
Semicircle = 180Semicircle = 18000

CIRCLES (ANGLE / ARC RULES)CIRCLES (ANGLE / ARC RULES)
Central Angle = Intercepted ArcCentral Angle = Intercepted Arc
C
A
B 100

CIRCLES (ANGLE / ARC RULES)CIRCLES (ANGLE / ARC RULES)
Inscribed Angle = ½ Intercepted ArcInscribed Angle = ½ Intercepted Arc
60D
C
A
B
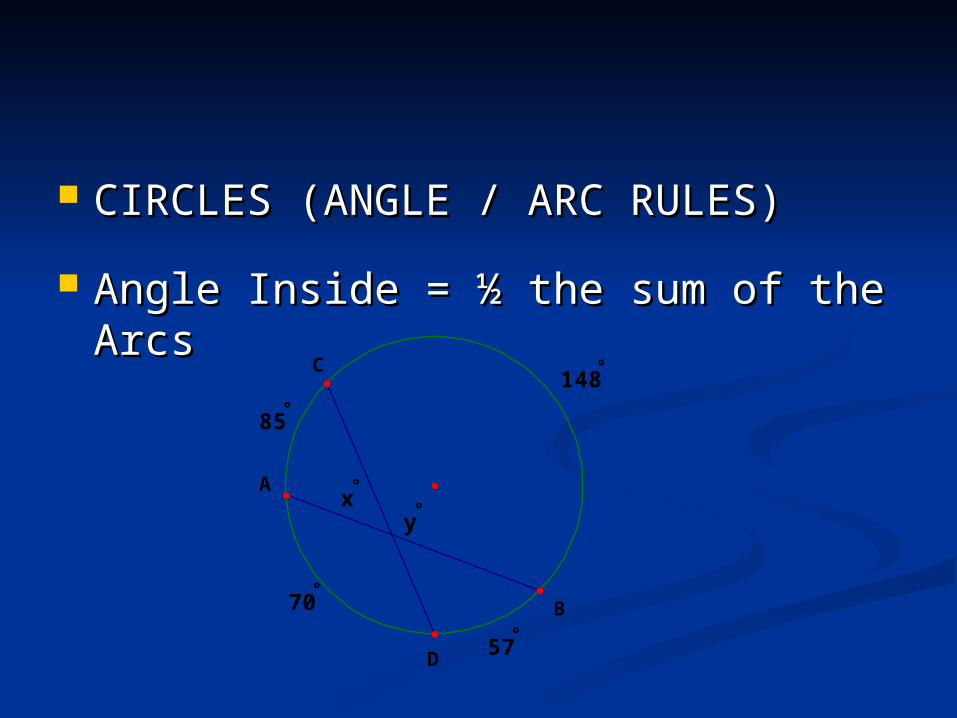
CIRCLES (ANGLE / ARC RULES)CIRCLES (ANGLE / ARC RULES)
Angle Inside = ½ the sum of the ArcsAngle Inside = ½ the sum of the Arcs
57
70
85
148
y
D
C
A
B
x

CIRCLES (ANGLE / ARC RULES)CIRCLES (ANGLE / ARC RULES)
Angle Outside = ½ the difference of Angle Outside = ½ the difference of the Arcsthe Arcs
E
30
120
D
C
A
B
x

Circle / Sphere Formulas…Circle / Sphere Formulas…2A r
2C r or d 24S r34
3
rV

III.) DATA ANALYSISIII.) DATA ANALYSIS
Use sample data to make inferences Use sample data to make inferences using population means & standard using population means & standard deviation deviation Sections 7.3 – 7.6Sections 7.3 – 7.6
Determine algebraic models to Determine algebraic models to quantify the association between 2 quantify the association between 2 quantitative variablesquantitative variables Sections 7.1, Sections 7.1, 7.2, 7.77.2, 7.7

Measure of central tendency: Measure of central tendency: number used to represent the number used to represent the center or middle set of datacenter or middle set of dataMeanMean - the average - the averageMedianMedian – the middle number – the middle numberModeMode – number that occurs – number that occurs
mostmost

2 2 2
1 2 ... nx X x X x X
n
Measure of Dispersion: statistic that Measure of Dispersion: statistic that tells you how spread out the values tells you how spread out the values areare
RangeRange – biggest - smallest – biggest - smallestStandard DeviationStandard Deviation: “sigma” : “sigma”
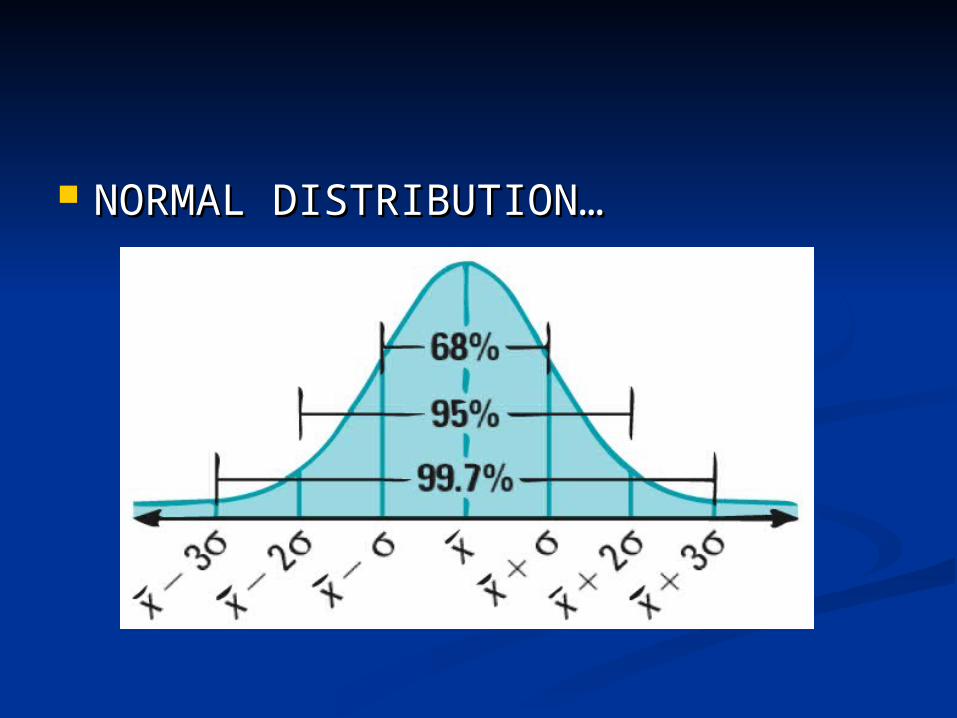
NORMAL DISTRIBUTION…NORMAL DISTRIBUTION…

Sample: part / subset of populationSample: part / subset of population Self-selected sample: Self-selected sample: people volunteer people volunteer
responsesresponses Systematic sample: Systematic sample: rule selects membersrule selects members
Ex: every other personEx: every other person Convenience sample: Convenience sample: easy-to-reach easy-to-reach
membersmembers Random sample: Random sample: every member has an every member has an
equal chance of being selectedequal chance of being selected

Unbiased sample: represents the Unbiased sample: represents the populationpopulation
Biased sample: over or Biased sample: over or underestimates the populationunderestimates the population

Margin of ErrorMargin of Error
1
n
How much it differs from populationHow much it differs from population smaller margin of error = more like smaller margin of error = more like
populationpopulation == (where n is sample size)(where n is sample size)
To find range of possibility, take To find range of possibility, take percent and then add/subtract your percent and then add/subtract your margin of error.margin of error.
1p
n