environmental water applications notebook
TRANSCRIPT

Environmental Water Applications Notebook
Pesticides • Herbicides • Emerging Contaminants

2 Table of Contents
Table of Contents
Introduction to Environmental Water Analysis ......................................................................................................................... 3
Analysis of Pesticides and Herbicides .................................................................................................................................... 6
Rapid Determination of Persistent Organic Pollutants (POPs) Using Accelerated Solvent Extraction (ASE) ....................... 7
Rapid Determination of Organochlorine Pesticides in Animal Feed Using Accelerated Solvent Extraction (ASE) ............ 15
Extraction of Chlorinated Pesticides Using Accelerated Solvent Extraction (ASE) .............................................................. 18
Extraction of Chlorinated Herbicides Using Accelerated Solvent Extraction (ASE) ............................................................. 21
Determination of Aniline and Nitroanilines in Environmental and Drinking Waters by On-Line SPE ................................ 24
Sensitive On-Line SPE–HPLC Determination of Paraquat and Diquat in Drinking and Environmental Waters ................. 32
Quantitative Analysis of Nitrogen Mustard Hydrolysis Products as Ethanolamines ............................................................. 41
Sensitive and Fast Determination of Endothall in Water Samples by IC-MS/MS ................................................................. 48
Improved Separation of Diquat and Paraquat Using the Acclaim Mixed-Mode HILIC-1 Column ...................................... 54
Determination of Glyphosate by Cation-Exchange Chromatography with Postcolumn Derivatization ............................... 56
Determination of N-Methylcarbamates by Reversed-Phase High-Performance Liquid Chromatography ........................... 61
Analysis of Emerging Contaminants ................................................................................................................................... 68
Determination of Linear Alkylbenzene Sulphonate in Treatment Plant Wastewater Streams Using On-Line Solid-Phase Extraction Followed by HPLC with Fluorescence Detection ............................................ 69
Sensitive Determination of Microcystins in Drinking and Environmental Waters ................................................................ 79
Column Selection Guide ........................................................................................................................................................ 90
Column Selection Guide and Specifications............................................................................................................................ 91
Transferring HPLC Methods to UHPLC ............................................................................................................................ 97
Easy Method Transfer from HPLC to RSLC with the Dionex Method Speed-Up Calculator .............................................. 98

3 Introduction
Introduction to Environmental Water Analysis
Everyone in the global community is impacted by the quality of water resources. The water we drink must be free from harmful chemicals to ensure good health. The purity of ground and surface waters in our environment is critical to ensuring sustainable use. The water discharged by municipal wastewater treatment plants and industrial facilities must be monitored to ensure strict compliance with environmental guidelines. Process waters must be kept clean from contaminants to ensure product quality and acceptable exposure levels.
Thermo Fisher Scientific is committed to enhancing the quality of our global water resources. As innovation leaders in ion and liquid chromatography, our analytical instruments are used by government and industry to provide solutions for environmental water testing for a wide range of regulated and emerging inorganic elements and organic compounds.
As pioneers of suppression technology, we started a revolution in ion chromatography (IC) that increased the sensitivity and accuracy of ion determination. As constant innovators, we developed Reagent-Free™ (RFIC™) systems that set a new benchmark for ion analysis. Today, RFIC systems with eluent generation and eluent regeneration provide the ultimate in sensitivity and ease of use.
We also have a full high-performance liquid chromatography (HPLC) product line for the analysis of organic contaminants, from nano- to preparative-scale separation capabilities, including ultra HPLC (UHPLC).
In fact, we are the only separations science company that provides instrumentation, columns, and applications perfectly suited for both inorganic and organic contaminants.
THERMO SCIENTIFIC AND DIONEX INTEGRATED SYSTEMS
Dionex Products are now a part of the Thermo Scientific brand, creating exciting new possibilities for scientific analysis. Now, leading capabilities in LC, IC, and sample preparation are together in one portfolio with those in mass spectrometry (MS). Combining Dionex’s leadership in chromatography with Thermo Scientific’s leadership position in mass spec, a new range of powerful and simplified workflow solutions now becomes possible.
For more information on how the new line-up of Thermo Scientific products can expand your capabilities and provide the tools for new possibilities, choose one of our integrated solutions:• Ion Chromatography and Mass Spectrometry• Liquid Chromatography and Mass Spectrometry• Sample Preparation and Mass Spectrometry

4 Introduction
GROUND AND SURFACE WATERSurface water is the largest source of fresh water used
for human consumption. The U.S. Geological Survey implemented the National Water-Quality Assessment (NAWQA) Program in 1991 to develop long-term data on streams, rivers, groundwater, and aquatic systems. The data support national, regional, state, and local policies and decisions related to water-quality management. The NAWQA program is designed to answer the following questions:• What is the condition of our nation’s streams, rivers,
and groundwater?• How are these conditions changing over time?• How do natural features and human activities affect
these conditions, and where are those effects most pronounced?Thermo Scientific has codeveloped several methods
with the U.S. EPA Office of Ground Water and Drinking Water. This collaboration has strengthened with the development of unique technology, including electrolytic suppression and RFIC with eluent generation or regeneration.
DRINKING AND BOTTLED WATERCurrently, less than 1% of the planet’s water is
available for human consumption—making this valuable resource even more important. With surface water contamination and groundwater resources overexploited, the need for effective water analysis and monitoring has never been higher.
Regulatory agencies around the world have developed standards for water analysis and have provided guidance on water disinfection to assure drinking water quality. Thermo Scientific provides a variety of solutions for inorganic and organic drinking water contaminants.
WASTEWATERWastewater includes liquid waste from residences,
industry, and agriculture, comprising a wide range of potential contaminants and concentrations. Industries discharge a variety of pollutants in their wastewater, including heavy metals, organic toxins, oils, nutrients, and solids, all of which endanger ecosystems and pose a threat to human health. In some areas, treated wastewater is recycled for irrigation purposes and even as drinking water. This reuse of water is gaining closer scrutiny as demand increases for water resources.
Treating and recycling wastewater requires careful analysis and monitoring, including the determination of low-level contaminants such as pharmaceuticals and personal care products (PCPs). Dionex HPLC and IC instruments are well suited to determine a wide range of nonpolar, polar, and ionic contaminants.
FAST WATER ANALYSISHigh-Throughput Solutions for Inorganic and Organic Contaminant AnalysesThe Challenge:
Emerging contaminants, stricter regulations, growing municipalities and industries—all increase analytical laboratories’ workloads, requiring processing of more samples and performing more tests in less and less time.
We have developed new technologies and methods to help labs and businesses increase their productivity and throughput for the analysis of inorganic and organic contaminants in a variety of water matrices.
ColumnsThermo Scientific Dionex IonPac Fast IC columns
for anions, organic acids, oxyhalides, cations, and amines use the same proven chemistry in shorter column formats, decreasing run times by as much as three times while still retaining sufficient resolution.

5 Introduction
Thermo Scientific Acclaim columns for organic contaminants use smaller particles that allow higher flow rates at standard pressures and compatibility with higher pressure systems. When used with the Thermo Scientific Dionex UltiMate 3000 rapid separation LC (RSLC) systems, these columns provide separation times as much as 30 times faster than standard columns and systems.
Inorganic ContaminantsThe Thermo Scientific Dionex ICS-5000 capillary
RFIC system provides IC on demand, reducing equilibration times and calibration requirements that save labor and increase throughput. The innovative Thermo Scientific Dionex IC Cube module, with half the connections of a standard IC configuration, makes plumbing and reconfiguring the system easier. Capillary Fast IC and monolith columns combine the speed of Fast IC with the convenience of IC whenever you need it—on demand. The simultaneous injection, sample, and standard preparation features of the Thermo Scientific Dionex AS-AP Autosampler, along with its AutoDilution capability, increase throughput, reduce manual labor, and decrease delays from out-of-range samples.
Organic ContaminantsUltiMate™ 3000 HPLC and RSLC systems are all
UHPLC+ focused, enabling faster separations at standard HPLC system prices. From the economical Basic Automated system to the ×2 Dual RSLC system for high throughput, automated sample preparation, sample concentration, and matrix elimination, Thermo Scientific has the system to fit your needs and budget.
Thermo Scientific Dionex Chromeleon Chromatography Data System software version 7.1 streamlines your path from samples to results. eWorkflows guide the operator through a minimal number of choices needed to run that workflow, making configuration of even the most complex multidimensional analysis easy. Data analysis tools help users process chromatograms with minimal effort, report templates and audit trails, and help ensure regulatory compliance, and System Wellness tools increase up time.
Thermo Scientific is committed to enhancing the quality of our global water resources. Our analytical instruments are used by government and industry labs globally to provide services for environmental water testing for a wide range of regulated and emerging inorganic elements and organic compounds.

Analysis of Pesticides and HerbicidesEnvironmental Water Applications Notebook
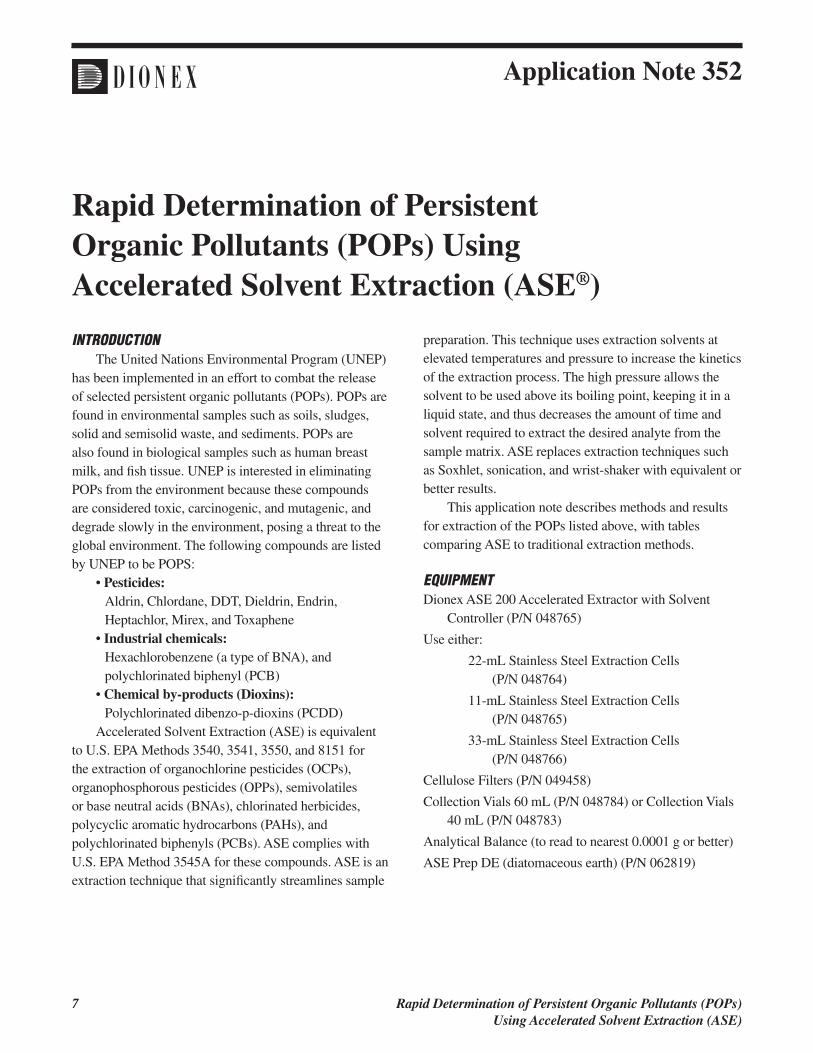
7 Rapid Determination of Persistent Organic Pollutants (POPs) Using Accelerated Solvent Extraction (ASE)
Application Note 352
Rapid Determination of Persistent Organic Pollutants (POPs) Using Accelerated Solvent Extraction (ASE®)
INTRODUCTIONThe United Nations Environmental Program (UNEP)
has been implemented in an effort to combat the release of selected persistent organic pollutants (POPs). POPs are found in environmental samples such as soils, sludges, solid and semisolid waste, and sediments. POPs are also found in biological samples such as human breast milk, and fish tissue. UNEP is interested in eliminating POPs from the environment because these compounds are considered toxic, carcinogenic, and mutagenic, and degrade slowly in the environment, posing a threat to the global environment. The following compounds are listed by UNEP to be POPS:
• Pesticides:Aldrin, Chlordane, DDT, Dieldrin, Endrin, Heptachlor, Mirex, and Toxaphene
• Industrial chemicals:Hexachlorobenzene (a type of BNA), and polychlorinated biphenyl (PCB)
• Chemical by-products (Dioxins):Polychlorinated dibenzo-p-dioxins (PCDD)
Accelerated Solvent Extraction (ASE) is equivalent to U.S. EPA Methods 3540, 3541, 3550, and 8151 for the extraction of organochlorine pesticides (OCPs), organophosphorous pesticides (OPPs), semivolatiles or base neutral acids (BNAs), chlorinated herbicides, polycyclic aromatic hydrocarbons (PAHs), and polychlorinated biphenyls (PCBs). ASE complies with U.S. EPA Method 3545A for these compounds. ASE is an extraction technique that significantly streamlines sample
preparation. This technique uses extraction solvents at elevated temperatures and pressure to increase the kinetics of the extraction process. The high pressure allows the solvent to be used above its boiling point, keeping it in a liquid state, and thus decreases the amount of time and solvent required to extract the desired analyte from the sample matrix. ASE replaces extraction techniques such as Soxhlet, sonication, and wrist-shaker with equivalent or better results.
This application note describes methods and results for extraction of the POPs listed above, with tables comparing ASE to traditional extraction methods.
EQUIPMENTDionex ASE 200 Accelerated Extractor with Solvent
Controller (P/N 048765)
Use either:
22-mL Stainless Steel Extraction Cells (P/N 048764)
11-mL Stainless Steel Extraction Cells (P/N 048765)
33-mL Stainless Steel Extraction Cells (P/N 048766)
Cellulose Filters (P/N 049458)
Collection Vials 60 mL (P/N 048784) or Collection Vials 40 mL (P/N 048783)
Analytical Balance (to read to nearest 0.0001 g or better)
ASE Prep DE (diatomaceous earth) (P/N 062819)

8 Rapid Determination of Persistent Organic Pollutants (POPs) Using Accelerated Solvent Extraction (ASE)
SAMPLE INFORMATION AND EXTRACTION PROCEDURESPesticide Sample Information
Spiking concentrations ranged from 5 to 250 µg/kg. All spiked soils were prepared and certified by ERA (Environmental Resource Associates, Arvada, Colorado, USA). Spiked samples were extracted both by the ASE 200 system and by a Soxtec™ system (automated Soxhlet). Matrix blanks, spikes, and spike duplicates were included for the low-level spikes; matrix spikes were included for all other concentrations. Collected extracts from the ASE 200 were approximately 13–15 mL from the 11-mL extraction cells and approximately 26–30 mL from the 22-mL cells. Extracts can be further cleaned up or directly analyzed depending on the extent of interfering coextractables. For the examples shown in the application note, extracts were analyzed by SW-846 Method 8080. All extractions and analytical work were performed by an independent testing laboratory, Mountain States Analytical, Inc. (Salt Lake City, Utah, USA.)
Pesticide Extraction ProcedureMix sample thoroughly, especially composite
samples. Dried sediment, soil, and dry waste samples should be ground or otherwise subdivided to pass through a 1-mm sieve. Introduce sufficient sample into the grinding apparatus to yield at least 10–20 g after grinding. Air-dry the sample at room temperature for 48 h in a glass tray or on hexane-cleaned aluminum foil, or dry the sample by mixing with ASE Prep DE until a free-flowing powder is obtained. Air-drying is not appropriate for the analysis of the more volatile organochlorine pesticides (e.g., the BHCs), because of losses during the drying process. For sediment and soils (especially gummy clay) that are moist and cannot be air-dried because of loss of volatile analytes, mix 5–10 g of sample with an equal amount of ASE Prep DE in a small beaker using a spatula. Use this approach for any solid sample that requires dispersion of the sample particles to ensure greater solvent contact throughout the sample mass.
Gummy, fibrous, or oily materials not amenable to grinding should be cut, shredded, or otherwise separated to allow mixing and maximum exposure of the sample surfaces for the extraction. If grinding of these materials is preferred, the addition and mixing of ASE Prep DE with the sample (1:1, w/w) may improve grinding efficiency. The professional judgment of the analyst is required for handling such difficult matrices.
SOLVENTSHexane
Dichloromethane
Acetone
Toluene
(All solvents are pesticide-grade or equivalent and available from Fisher Scientific.)
EXTRACTION CONDITIONSPesticides and PCBs (8081/8082)
Solvent: Hexane/acetone (1:1), (v/v)
Temperature: 100 °C
Pressure: 1500 psi
Static Time: 5 min
Static Cycles: 1–2
Flush: 60%
Purge: 60–120s
Hexachlorobenzene (8270)
Solvent: Dichloromethane/acetone (1:1), (v/v)
Temperature: 100 °C
Pressure: 1500 psi
Static Time: 5 min
Static Cycles: 1–2
Flush: 60%
Purge: 60–120 s
Dioxins (PCDD) (8290)
Solvent: Toluene (100%) or toluene/acetic acid (5%, v/v) if HCl pretreatment currently used
Temperature: 175–200 °C
Pressure: 1500 psi
Static time: 5–15 min
Static cycles: 2–3
Flush: 60–70%
Purge: 60–120 s

9 Rapid Determination of Persistent Organic Pollutants (POPs) Using Accelerated Solvent Extraction (ASE)
Place a cellulose disk at the outlet end of the extraction cell. Weigh approximately 10 g of each sample into 11-mL extraction cells, or approximately 20 g into 22-mL cells. For samples mixed with ASE Prep DE, transfer the entire contents of the beaker to the extraction cell. Surrogate spikes and matrix spikes may be added to the appropriate sample cells.
Place extraction cells into the autosampler tray and load the collection tray with the appropriate number (up to 24) of 60-mL, precleaned, capped vials with septa. Set the method conditions on the ASE 200 system and initiate the run.
PCB Sample InformationSewage sludge was obtained from the Fresenius
Institute (Taunusstein, Germany). Oyster tissue samples were obtained from the National Oceanographic and Atmospheric Administration (NOAA) Laboratory (Seattle, Washington, USA). The river sediment is a standard reference material, SRM 1939 (National Institute of Science and Technology, Gaithersburg, Maryland, USA). Contaminated soil used in this study was a certified reference material (CRM911-050) purchased from Resource Technology Corporation (Laramie, Wyoming, USA).
PCB Extraction ProcedureSamples should be dried and ground. Before filling
the cell, a cellulose disk should be placed in the outlet end of the cell. Samples that contain water (greater than 10%) should be mixed in equal proportions with ASE Prep DE.
Quantification of Sewage Sludge, Oyster Tissue, and River Sediment
Sample extracts from ASE were prepared for analysis by passing through silver nitrate/sulfuric acid loaded silica gel and alumina columns, followed by concentration to 1 mL for GC analysis. PCB analyses were performed by gas chromatography with ECD using a 30-m × 0.25-mm i.d., Rtx-5 (Restek, Bellefonte, Pennsylvania, USA) or equivalent column. Injector and detector were maintained at 300 °C. The GC oven was programmed from 100–300 °C at 10 °C/min following a 5-min hold. External standards were used for calibration.
Quantification of Soil (CRM911-050)PCB analyses of the soil extracts were performed
according to U.S. EPA SW-846 Method 8080. The ASE 200 extracts were diluted to 25 mL prior to analysis by GC. Injection was through a split/splitless injector in a GC with dual-electron capture detectors. Two capillary columns, a 30-m × 0.53-mm i.d. DB-608 and a 30-m × 0.53-mm i.d. DB-1701 (J&W Scientific, Folsom, California, USA) provided primary and confirmation data, respectively. Both columns were joined with a fused-silica “Y” connector (Restek). The remaining part of the “Y” was connected to a 5-m section of deactivated 0.53-mm i.d. fused-silica capillary tubing that acted as a guard column. The end of this guard column was inserted into the GC injector. Dual confirmation of the analytes was achieved with a single 5-µL injection. The injector was maintained at 220 °C and both detectors were operated at 320 °C. The oven was programmed from 60–200 °C at 28 °C/min after a 1-min hold, then 265 °C at 10 °C/min with a hold of 20.5 min. Helium was used as the carrier gas at a linear velocity of approximately 30 cm/s.
Hexachlorobenzene Sample InformationSpiking concentrations ranged from 250 to
12,500 µg/kg for the semivolatiles (BNA compounds). All spiked soils were prepared and certified by ERA (Environmental Resource Associates). Samples were ground to 100–200 mesh (150–75 µm). Wet samples were mixed with either ASE Prep DE (10-g sample to 10-g ASE Prep DE), or air-dried. After grinding, a weighed sample was transferred to either a 11- or 22-mL extraction cell.
Spiked samples were extracted both by the ASE 200 system and by a Perstorp Environmental Soxtec (automated Soxhlet). Extracts were analyzed by SW-846 Method 8270A.
Note: All extractions and analytical work were performed by Mountain States Analytical, Inc. (Salt Lake City, Utah, USA). Matrix blanks, spikes, and spike duplicates were included for the low-level spikes; matrix spikes were included for all other concentrations.

10 Rapid Determination of Persistent Organic Pollutants (POPs) Using Accelerated Solvent Extraction (ASE)
Hexachlorobenzene Extraction ProcedureThe procedure used in this application note follows
the detailed method as described under the U.S. EPA SW-846 Method 3545A.
Mix sample thoroughly, especially composite samples. Dried sediment, soil, and dry waste samples should be ground or otherwise subdivided to pass through a 1-mm sieve. Introduce a sufficient amount of sample into the grinding apparatus to yield at least 10–20 g after grinding. Air-dry the sample at room temperature for 48 h in a glass tray or on hexane-cleaned aluminum foil, or dry the sample by mixing with ASE Prep DE until a free-flowing powder is obtained. Air-drying is not appropriate for the analysis of the more volatile organochlorine pesticides (e.g., the BHCs), or the more volatile of the semivolatile organics because of losses during the drying process.
Gummy, fibrous, or oily materials not amenable to grinding should be cut, shredded, or otherwise separated to allow for mixing and maximum exposure of the sample surfaces for extraction. If grinding of these materials is preferred, the addition and mixing of ASE Prep DE with the sample (1:1, w/w) may improve grinding efficiency.
For sediment and soils (especially gummy clay) that are moist and cannot be air-dried because of loss of volatile analytes, mix 5–10 g of sample with an equal amount of ASE Prep DE in a small beaker using a spatula. Use this approach for any solid sample that requires dispersion of the sample particles to ensure greater solvent contact throughout the sample mass.
Place a cellulose disk into the extraction cell. Weigh approximately 10 g of each sample into an 11-mL extraction cell or approximately 20 g into a 22-mL extraction cell. Transfer the entire contents of the beaker to the extraction cell. Surrogate spikes and matrix spikes may be added to the appropriate sample cells.
Place extraction cells into the autosampler tray and load the collection tray with the appropriate number (up to 24) of 40-mL, precleaned, capped vials with septa. Set the method conditions on the ASE 200 system and initiate the run.
Collected extracts will be approximately 13–15 mL from the 11-mL extraction cells and 26–30 mL from the 22-mL size cells. The extract is now ready for cleanup or analysis depending on the extent of interfering coextractables.
Dioxins (PCDD) Sample InformationTwo different sample sets were investigated: one
from Germany that included chimney brick, urban dust, and fly ash, and a second from Canada that included four sediment samples. A sediment sample (EC-2) containing high ng/kg levels (ppt) of PCDDs and PCDFs was obtained from the National Water Research Institute (867 Lakeshore Road, P.O. Box 5050, Burlington, Ontario, L7R 4A6, Canada). A low-level sediment sample (HS-2) was obtained from the National Research Council Institute for Marine Biosciences (1411 Oxford Street, Halifax, Nova Scotia, B3H 3Z1, Canada). Both samples are being investigated as potential standard reference materials and were used as received. Two other sediment samples, Parrots Bay and Hamilton Harbor, were extracted. Both of these samples have high levels of coextractable materials.
Dioxins (PCDD) Extraction ProcedureTable 1 lists the conditions used for the extraction
of the chimney brick and urban dust by Soxhlet and ASE.The procedure for the extraction of fly ash was
slightly different than the procedure for the other matrices. Before solvent extraction, the samples were treated with 6 M HCl for 30 min and then rinsed thoroughly with distilled water. The extractions by both Soxhlet and ASE were then performed as listed in Table 1. One additional set of extractions was performed on fresh fly ash samples. Instead of pretreatment with HCl, 5% (v/v) glacial acetic acid was added to the toluene for the ASE extraction. All other conditions were held constant.
Table 1. Extraction Conditions for Chimney Brick and Urban Dust
Condition Soxhlet ASE
Sample Size 4–10 g 4–10 g
Solvent Toluene, 250 mL Toluene 15 mL
Temperature <111 °C 150 °C
Pressure Atmospheric 1500 psi
Time 18 h 5-min heatup
Cycles 5-min static, 2 or 3 cycles
Analytical GC/MS GC/MS

11 Rapid Determination of Persistent Organic Pollutants (POPs) Using Accelerated Solvent Extraction (ASE)
Quantitation and Sample CleanupCleanup on the chimney brick, urban dust, and
fly ash sample extracts was performed by using a chromatographic column packed with multiple layers of silica gel and alumina, in accordance with the German method VDI 3499.
Extracts from the sediment samples were cleaned up using a dual-stage open column chromatography procedure consisting of modified silica and alumina stationary phases.
Samples were further cleaned up using an automated HPLC carbon-based method to remove diphenylether interferences. Complete details of the analytical procedure are available in reference 1.
Analysis by GC/MS and GC/MS/MSExtracts of the chimney dust, urban dust, and fly ash
samples were analyzed by GC-LRMS with an HP 5890 Series II GC, HP MSD 5972. The column used for the chromatography was a 60-m × 0.25-mm i.d. × 0.15-µm film thickness J&W DB-Dioxin column.
Sediment sample extracts were analyzed by GC/MS/MS (Varian 3400 GC, Finnigan MAT TSQ® 70 triple-stage quadrapole mass spectrometer, and ICIS II data system) or GC/HRMS (HP 5890 Series II GC, VG Autospec at 10000 resolution, and OPUS data system). All extracts were separated using a 60-m × 0.25-mm i.d. × 0.25-µm film thickness J&W DB-5 fused-silica capillary column.
StandardsAn internal standard solution containing 10 reference
compounds, including 13C12
-2,3,7,8-T4CDD was used for
the chimney dust, urban dust, and fly ash samples. No cleanup standard was used. Samples were reconstituted with a recovery standard solution (100 µL) containing 13C
12-1,2,3,4-T
4CDD at 25 ng/mL.
For the sediment samples, standard PCDD/PCDF mixtures were prepared from stock solutions obtained from either Cambridge Isotope Laboratories, Inc. or Wellington Laboratories. The internal quantitation standard contained 15 13C
12-2,3,7,8-substituted PCDDs
and PCDFs. The compounds used are those congeners listed in the data tables. Following extraction, the
samples were spiked with a cleanup standard (37Cl
4-2,3,7,8-T
4CDD) to differentiate between losses
occurring at the extraction and cleanup stages. Prior to injection, the samples were reconstituted with a recovery standard solution (10 µL) containing 13C
12-1,2,3,4-T
4CDD and 13C
12-1,2,3,7,8,9-H
6CDD at
100 pg/µL in nonane.
RESULTS AND DISCUSSIONPesticides
Tables 2 and 3 shows examples of extraction of selected environmental samples, including both spiked and incurred samples, are shown. These examples illustrate the effectiveness of the ASE technique in obtaining recoveries of analytes equivalent to Soxtec. Tables 2 and 3 summarize the results of this study for chlorinated pesticides spiked at three different levels, in three different soil types.
Table 2. Average Recovery of Pesticides from Three Soil Typesa — ASE Compared to Automated Soxhlet
Pesticide Average Recovery (% of Soxhlet)
Heptachlor 88.0
Aldrin 94.9
Gamma Chlordane 99.5
Alpha Chlordane 102.0
Dieldrin 101.2
Endrin 97.2
p,p’-DDT 74.9
Table 3. Average RSD (%) for Chlorinated PesticidesMatrix ASE Automated Soxhlet
Clay 5.0 9.7
Loam 7.8 6.2
Sand 12.0 10.1
a Averages from extraction of sand, loan, and clay soils.

12 Rapid Determination of Persistent Organic Pollutants (POPs) Using Accelerated Solvent Extraction (ASE)
PCBsResults from extractions of sewage sludge, oyster
tissue, river sediment, and soil are shown in Tables 4 through 7. These tables show the average recoveries and RSDs (%) for PCB congener content of these matrices. Recoveries for all compounds with the exception of one (PCB 153 from the river sediment) are above 77% of the certified or Soxhlet comparison values. Interferences in the river sediment extract prevented quantification of two low-molecular-weight PCB congeners (PCB 28 and PCB 52).
The results demonstrate the effectiveness of ASE as a sample preparation method. ASE provides extracts with minimal solvent usage and significant time reduction compared to other extraction methods. Results are comparable to the traditional Soxhlet extraction method. ASE meets the requirements for PCB analysis as described in U.S. EPA SW-846 Method 3545A.
HexachlorobenzeneThis application note shows the effectiveness
of the ASE technique in obtaining recoveries of Hexachlorobenzene equivalent to Soxtec. Tables 8 and 9 summarize the results for Hexachlorobenzene at three different spiking levels, in three different soil types, that were extracted according to the method presented. ASE recoveries and RSD (%) values were all within the range expected from Soxhlet extractions.
Table 4. PCB Recoveries from Sewage Sludgea
PCB Congener Average Recovery, n = 6 (as % of Soxhlet)
RSD (%)
PCB 28 118.1 2.5
PCB 52 114.0 4.7
PCB 101 142.9 7.4
PCB 153 109.5 5.8
PCB 138 109.6 3.9
PCB 180 160.4 7.5
Table 6. PCB Recovery from River Sediment (SRM 1939)a
PCB Congener Average Recovery, n = 6 (as % of Soxhlet)
RSD (%)
PCB 101 89.2 3.7
PCB 153 62.3 4.1
PCB 138 122.1 2.3
PCB 180 111.5 5.9
Table 7. Recovery of Arochlor 1254 from Soil (CRM911-050)
Run Number Arochlor Found (µg/kg)
1 1290.0
2 1365.8
3 1283.4
4 1368.6
Average 1327.0 (99.0%)
RSD 3.51%
a Analyte concentration range: 160–200 µg/kg per component
Table 5. PCB Recoveries from Oyster Tissuea
PCB Congener Average Recovery, n = 6 (as % of Soxhlet)
RSD (%)
PCB 28 90.0 7.8
PCB 52 86.9 4.0
PCB 101 83.3 1.5
PCB 153 84.5 3.5
PCB 138 76.9 3.0
PCB 180 87.0 4.3
a Analyte concentration range: 50–150 µg/kg per component
a Analyte concentration range: 170–800 µg/kg per component

13 Rapid Determination of Persistent Organic Pollutants (POPs) Using Accelerated Solvent Extraction (ASE)
Dioxins (PCDD)Ground Chimney Brick and Urban Dust
Table 10 shows the results from the ground chimney brick and urban dust as selected congeners and as the total of the isomers. The toxicity equivalent is calculated by adding the weighted factors of each isomer’s toxicity. One is calculated according to a formula from the North Atlantic Treaty Organization (NATO) and the other is from the German health organization BgVV. The results show that ASE is equivalent to the Soxhlet method with respect to recovery of these compounds.
Fly AshTable 10 lists the results from the extractions of the
fly ash. The units for this sample are µg/kg because the sample was so highly contaminated. ASE results are equivalent to those from Soxhlet extractions when the HCl/water pretreatment was used.
High-Level Sediment SamplesTable 10 presents a comparison of average results for
the Soxhlet and ASE methods for the high-level sediment sample (EC-2). The data compare very favorably.
The data for sample HS-2 also shows a favorable comparison trend (Table 10).
Table 8. Average Recovery of Hexachlorobenzene from Three Soil Typesa—ASE Compared
to Automated SoxhletBNA Target Compound Average Recovery (% of Soxhlet)
Hexachlorobenzene 93.7
Table 9. Average RSD (%) for BNA for Three Soil Types
Matrix ASE Automated Soxhlet
Clay 9.1 9.6
Loam 16.1 15.2
Sand 13.4 17.1 Highly Contaminated Sediment SamplesThe ASE technique was also evaluated with two
sediment samples containing high levels of coextractables and oil (Table 10). Aliquots of these samples were taken from a larger container as quantitatively as possible, but were not nearly as homogeneous as the rigorously prepared reference materials. Generally, the data compare favorably between ASE and Soxhlet for the recovery of PCDDs from these heavily contaminated sediments.
CONCLUSIONThe data shows that ASE is essentially equivalent
to classical extraction procedures such as Soxhlet for the extraction of POPs from environmental matrices. In addition to being equivalent to Soxhlet, ASE can perform the extractions in a fraction of the time and with much less solvent.
Table 10. Comparison of Soxhlet vs ASE—Totala Polychlorinated Dibenzo-p-dioxins
Sample Matrix Soxhlet (ng/kg) ASE (ng/kg)
Chimney Brick 8040 8170
Urban Dust 1110 1159
Fly Ash (µg/kg) 93,200 107,900
Sediment (EC-2) 6750 6840
Sediment (HS-2) 11,731 12,783
Hamilton Harbor Sediment 4283 4119
Parrots Bay Sediment 2836 2444
a Averages from extraction of sand, loam, and clay soils
aTotal of tetra, penta, hexa, hepta, and octachlorodibenzo-p-dioxins

14 Rapid Determination of Persistent Organic Pollutants (POPs) Using Accelerated Solvent Extraction (ASE)
SUPPLIERSAgilent Technologies, 395 Page Mill Rd., Palo Alto, CA
94306 USA, Tel: 877-424-4536, www.agilent.com.Fisher Scientific, 2000 Park Lane, Pittsburgh, PA 15275-
1126 USA, Tel: 800-766-7000, www.fishersci.com.National Water Research Institute, 867 Lakeshore Road,
Burlington, Ontario L7R 4A6 Canada.National Research Council Institute for Marine Biosci-
ences, 1411 Oxford Street, Halifax Nova Scotia, B3H 3Z1 Canada.
Sigma-Aldrich Chemical Company, 3050 Spruce St., St. Louis, MO 63103 USA, Tel: 800-325-3010, www.sigmaaldrich.com.
ACKNOWLEDGMENTSWe would like to thank David S. Waddell, Tereza
Gobran, and Vin Khurana from the Ontario Ministry of Environment and Energy, Ontario, Canada, and of Dr. Scheutwinkel and Dr. Mattulat from Dr. Scheutwinkel GmbH, Berlin, Germany, for their contributions.
REFERENCES1. “The Determination of Polychlorinated Dibenzo-
p-dioxins and Dibenzofurans in Soil and Sediment by GC-MS”; Method E3151B; Ontario Ministry of Environment and Energy, 1993.
2. U.S. Environmental Protection Agency. “Interim Methods for the Sampling and Analysis of Priority Pollutants in Sediments and Fish Tissue.” Section 3.1.3; U.S. EPA Method 600/4-81-055; Cincinnatti, OH, 1981.
3. Richter, B.; Ezzell, J.; Felix, D. “Single Laboratory Method Validation Report: Extraction of TCL/PPL (Target Compound List/Priority Pollutant List) BNAs and Pesticides Using Accelerated Solvent Extraction (ASE) with Analytical Validation by GC/MS and GC/ECD” Document 116064.A; Dionex Corporation, June 16, 1994.
4. Dionex Corporation. Application Note 323; Sunnyvale, CA.
5. Preud’homme, H., Potin-Gautier, M., “Optimization of Accelerated Solvent Extraction for Polyhalogenated Dibenzo-p-Dioxins and Benzo-p-furans in Mineral and Environmental Matrixes Using Experimental Designs”, Anal. Chem. 2003, 75, 6109–6118.
6. Saito, K., et al. “Extraction and Cleanup Methods of Dioxins in House Dust from Two Cities in Japan Using Accelerated Solvent Extraction and a Disposable Multi-Layer Silica-Gel Cartridge.” Chemosphere, 2003, 53, 137–142.

15 Rapid Determination of Organochlorine Pesticides in Animal Feed Using Accelerated Solvent Extraction (ASE)
Application Note 349
Rapid Determination of Organochlorine Pesticides in Animal Feed Using Accelerated Solvent Extraction (ASE®)
INTRODUCTIONAnimal feed contaminated with organochlorine
pesticides (OCPs) has begun to attract worldwide attention. When ingested, the OCPs from animal feed tend to accumulate in certain animal products, especially those rich in fat, such as meat, milk, and butter. Because these types of animal products are widely consumed by humans, methods are needed that quickly extract and determine OCPs in the feeds of animals used to produce products for human consumption.
Traditional methods used to extract OCPs from animal feed require large amounts of organic solvents and take from one to several hours per extraction. Also, many of the traditional methods are very labor intensive and require constant analyst attention.
ASE was introduced in 1995 and is a proven, valuable technique for environmental laboratories. ASE is EPA approved under method 3545A. This technique uses high temperatures and pressures to increase the kinetics of the extraction process, thus decreasing the extraction time and solvent consumption. Also, because ASE is automated, it allows unattended extraction of up to 24 samples. In this application note, OCPs are extracted from certified reference material (CRM) BCR 115 (Institute for Reference Materials and Measurement, Geel Belgium), an animal feed containing certified levels of organochlorine pesticides.
EQUIPMENTDionex ASE 200 Accelerated Extractor with Solvent
Controller (P/N 048765)
11-mL stainless steel extraction cells (P/N 055422)
Dionex cellulose filters (P/N 049458)
Dionex collection vials 40 mL (P/N 048783)
Analytical balance (accurate to the nearest 0.0001 g or better)
Laboratory grinder
Sand (Ottawa Standard, Fisher Scientific, Cat. No. S23-3 20-30 mesh)
Dichloromethane silica gel, 0.063–0.200 mm, water content 2.62% (Merck, Darmstadt, Germany)
S-X3 Bio-Beads (Bio Rad Laboratories)
REAGENTSFor reagents, use either:
Bulk Isolute Sorbent (International Sorbent Technology Ltd., UK)
Hydromatrix™ (Varian Associates)
STANDARD REFERENCE MATERIALCRM BCR 115 (Institute for Reference Materials and
Measurement, Geel Belgium)*
*Similar standard reference materials may be substituted.
SolventsHexane
Acetone
(All solvents are pesticide-grade or equivalent and available from Fisher Scientific.)

16 Rapid Determination of Organochlorine Pesticides in Animal Feed Using Accelerated Solvent Extraction (ASE)
EXTRACTION CONDITIONSSolvent: Hexane: acetone (3:2)
Temperature: 100 °C
Pressure: 1500 psi
Static time: 9 min
Static cycles: 1
Flush: 60%
Purge: 60 s
SAMPLE PREPARATIONEach animal feed sample should be ground to a
powder using a laboratory grinder. Weigh approximately 1.0 g of the powder and blend with 0.5 g of the Bulk Isolute Sorbent using a mortar and pestle. Transfer the mixture to an 11-mL stainless steel extraction cell containing a cellulose filter. Top off any void volume in the cell with Ottawa sand.
EXTRACTION PROCEDUREPlace the extraction cells onto the ASE 200. Label the
appropriate number of collection vials and place these into the vial carousel. Set up the method suggested above and begin the extraction sequence. When the extractions are complete, the extracts can then be cleaned using silica gel adsorption followed by gel permeation chromatography (GPC) with n-hexane:dichloromethane (1:1) as the elution solvent.1
A two-step cleanup procedure based on silica gel adsorption followed by gel permeation chromatography (GPC) was optimized for the present determinations. An open glass cartridge (8-mm i.d., 6 mL) with a polyethylene frit at its bottom was packed with 1.5-g fresh dichloromethane silica gel and 1-g Na
2SO
4. The column
bed was preconditioned with 50 mL n-hexane and compressed by a stream of N
2 (200 kPa). Thereafter, the
concentrated raw extract was added onto the top of the silica gel column. The sample flask was rinsed with two 0.5-mL portions fo n-hexane-CH
2Cl (7+3, v/v) and this
was added to the column bed. The analytes were eluted with 19 mL n-hexane-dichloromethane (7+3, v/v). The eluate was collected in a 50-mL pear-shaped flask and concentrated to 0.5 mL by means of a rotary evaporator.
The GPC column was prepared by weighting 6 g S-X3 bio-beads that were swelled in n-hexane-dichlorometrane (1 + 1, v/v) overnight, into a chromatographic column (15-mm i.d., 30 cm, 100 mL) with a reservoir, fused-in fritted disk, and Teflon® stopcock. The concentrated extract from the silica gel cleanup was applied onto the GPC column. The sample flask was rinsed twice with 0.5-µL elution solvent and
* Present but not certified.
Table 1. Concentration Values (ng g–1) and RSD (%) for the Extraction of CRM BCR 115
Compounds Certified Value ASE (n = 3)
C (ng g–1) RSD (%) C (ng g–1) RSD (%)
α-HCH * * 21.5 ± 0.5 2.5
HCB 19.4 ± 1.4 7.2 20.6 ± 0.4 1.8
β-HCH 23 ± 3 13.0 26.0 ± 2.3 8.7
γ-HCH 21.8 ± 2 9.2 27.1 ± 1.4 5.3
Heptachlor 19 ± 1.5 7.9 20.0 ± 0.5 2.7
Aldrin * * 56.0 ± 3.1 5.5
p,p′–DDE 47 ± 4 8.5 54.6 ± 2.6 4.7
Dieldrin 18 ± 3 16.7 22.0 ± 0.6 2.6
Endrin 46 ± 6 13.0 52.1 ± 1.9 3.6
p,p′ –DDD * * 91.8 ± 2.6 2.8
o,p′ -DDT 46 ± 5 10.9 49.8 ± 0.5 1.1
p,p′ -DDT * * 59.4 ± 1.8 3.1
Figure 1. Graph of results from Table 1.
HCB b-HCH g-HCH Heptachlor p.p'-DDE Dieldrin Endrin o.p'DDT
Certified ValueASE
Ng g–1
0
10
20
30
40
50
60
19884

17 Rapid Determination of Organochlorine Pesticides in Animal Feed Using Accelerated Solvent Extraction (ASE)
also applied on the GPC column. After permeation of the sample into the column bed, the separation was performed with an additional 35-mL n-hexane-dichloromethane 1 + 1 (v/v). The first 18.5 mL were discarded while the volume of 18.5–26.0 mL containing the analytes was collected. This eluate was concentrated to 1 mL by a rotary evaporator, blown to dryness under a gentle stream of N
2, dissolved in 250-µL cyclohexane, and transferred
into a GC autosampler microvial for measurement. Any efficient cleanup procedure may be substituted.
RESULTS AND DISCUSSIONSample preparation is critical to good recoveries.
Grind the samples to a uniform particle size to ensure proper permeation of the solvent into the matrix. It is important to remove the fat and lipids from the extracts so they are ready for GC-MS analysis.
The results of three extractions using ASE are compared to the certified values and listed in Table 1. Figure 1 shows these results graphically. The ASE results are in general agreement with the certified values, with the values of g-HCH and p,p –DDE slightly above the certified values. This slight difference is attributed to the higher temperatures and pressures of ASE, which increases the desorption of highly bound pesticides.
CONCLUSIONSThe extraction efficiency and reproducibility of ASE
for extracting OCPs from animal feed was tested using an optimized method to extract a certified reference material (BCR 115). ASE provides a faster way to extract OCPs from animal feed than traditional techniques, such as Soxhlet, and ASE can accomplish these results using far less solvent.
ACKNOWLEDGEMENTSWe would like to acknowledge the work of S. Chen,
M. Gfrerer, E. Lankmayr, X. Quan, and F. Yang at the University of Technology, Austria.
REFERENCES1. Chen, S.; Gfrerer, M; Lankmayr, E.; Quan, X.; Yang,
F. Optimization of Accelerated Solvent Extraction for the Determination of Chlorinated Pesticides from Animal Feed. Chromatographia 2003, 58, 631–636.

18 Extraction of Chlorinated Pesticides Using Accelerated Solvent Extraction (ASE)
Application Note 320
Extraction of Chlorinated Pesticides UsingAccelerated Solvent Extraction (ASE®)
INTRODUCTIONAccelerated Solvent Extraction (ASE) is a new
extraction method that significantly streamlines samplepreparation. A commonly used solvent is pumped intoan extraction cell containing the sample, which is thenbrought to an elevated temperature and pressure. Min-utes later, the extract is transferred from the heated cellto a standard collection vial for cleanup or analysis.The entire extraction process is fully automated andperformed in minutes for fast and easy extraction withlow solvent consumption.
Previously, the extraction of chlorinated pesticidesfrom soils, sludge, and other solid wastes consumed largeamounts of solvents. Soxhlet, for example, can use from250 to 500 mL of solvent for most environmentalsamples. Recent and anticipated changes in environmen-tal regulations will cause severe restrictions on theamount of solvent usage in laboratories worldwide. ASEwas developed to meet the new requirements for reducingsolvent usage in the preparation of solid waste samples.
ASE provides a more convenient, faster, and lesssolvent intensive method than previously available forthe extraction of chlorinated pesticides from environ-mentally important samples. Recoveries of theseanalytes by ASE are equivalent to or better than othermore solvent intense methods such as Soxhlet. ASE alsoavoids the problem of multiple washing proceduresassociated with sonication. ASE can extract a 10-gsample of a typical soil in about 12 min with a totalsolvent consumption of approximately 15 mL.
The procedures described in this application notemeet the requirements for sample extraction as pre-scribed by EPA Method 3545. This methodis applicable to the extraction of water-insoluble orslightly water-soluble volatiles and semivolatiles inpreparation for gas chromatographic or GC/MS meas-urement. The method is applicable to the extraction ofchlorinated pesticides from soils, clays, wastes, andsediments containing from 5 to 250 µg/kg of the targetcompounds.
EQUIPMENTASE 200 Accelerated Solvent Extractor with 11- or
22-mL stainless steel extraction cells
GC or GC/MS
Dionex vials for collection of extracts(40 mL P/N 49465; 60 mL P/N 49466)
SOLVENTSAcetone (pesticide quality or equivalent)
Hexane (pesticide quality or equivalent)
ASE 200 CONDITIONSOven Temperature: 100 °C
Pressure: 10 MPa (1500 psi)
Oven Heatup Time: 5 min
Static Time: 5 min
Flush Volume: 60% of extraction cell volume
Solvent: Acetone/hexane (1:1 v/v)
Meets the requirements of U.S. EPA Method 3545

19 Extraction of Chlorinated Pesticides Using Accelerated Solvent Extraction (ASE)
SAMPLE INFORMATIONSpiking concentrations ranged from 5 to 250 µg/kg.
All spiked soils were prepared and certified by ERA(Environmental Resource Associates, Arvada, Colorado,USA). Spiked samples were extracted both bythe ASE 200 system and by a Perstorp EnvironmentalSoxtec® (automated Soxhlet). Matrix blanks, spikes,and spike duplicates were included for the low-levelspikes; matrix spikes were included for all other con-centrations. Collected extracts from ASE 200 wereapproximately 13–15 mL from the 11-mL extractioncells and approximately 26–30 mL from the 22-mLcells. Extracts can be further cleaned up or directlyanalyzed depending on the extent of interfering co-extractives. For the examples shown in this applicationnote, extracts were analyzed by SW-846 Method 8080.
Note: All extractions and analytical work wereperformed by Mountain States Analytical, Inc.(Salt Lake City, Utah, USA).
SAMPLE PREPARATIONThe sample is ground to 100–200 mesh (150–
75 µm). Wet samples are mixed with either ASE PrepDE (diatomaceous earth), P/N 062819 (1:1, w/w), or airdried.1 After grinding, a weighed sample is transferredto either a 11- or 22-mL extraction cell.
PROCEDUREMix sample thoroughly, especially composite
samples. Dried sediment, soil, and dry waste samplesshould be ground or otherwise subdivided so that itpasses through a 1-mm sieve. Introduce sufficientsample into the grinding apparatus to yield at least10–20 g after grinding. Air dry the sample at roomtemperature for 48 h in a glass tray or on hexanecleaned aluminum foil, or dry the sample by mixingwith ASE Prep DE until a free-flowing powder isobtained. Air drying is not appropriate for the analysisof the more volatile organochlorine pesticides (e.g., theBHCs), because of losses during the drying process. Forsediment and soils (especially gummy clay) that aremoist and cannot be air-dried because of loss of volatileanalytes, mix 5–10 g of sample with an equal amount ofASE Prep DE in a small beaker using a spatula. Use thisapproach for any solid sample that requires dispersionof the sample particles to ensure greater solvent contactthroughout the sample mass.
Gummy, fibrous, or oily materials not amenable togrinding should be cut, shredded, or otherwise separatedto allow mixing and maximum exposure of the samplesurfaces for the extraction. If grinding of these materialsis preferred, the addition and mixing of ASE Prep DEwith the sample (1:1, w/w) may improve grindingefficiency. The professional judgment of the analyst isrequired for handling such difficult matrices.
Place a cellulose disk at the outlet end of the extrac-tion cell. Weigh approximately 10 g of each sampleinto 11-mL extraction cells, or approximately 20 g into22-mL cells. For samples mixed with ASE Prep DE,transfer the entire contents of the beaker to the extrac-tion cell. Surrogate spikes and matrix spikes may beadded to the appropriate sample cells.
Place extraction cells into the autosampler tray andload the collection tray with the appropriate number (upto 24) of 40-mL, precleaned, capped vials with septa.Set the method conditions on the ASE 200 system andinitiate the run.
DISCUSSION AND RESULTSExamples of extraction of selected environmental
samples including both spiked and incurred samples areshown. These examples illustrate the effectiveness ofthe ASE technique in obtaining recoveries of analytesequivalent to Soxtec.2 Results of this study are summa-rized in Tables 1 and 2 for chlorinated pesticides spikedat three different levels in three different soil types.
REFERENCES1. U.S. Environmental Protection Agency. U.S. EPA
Method 600/4-81-055, “Interim Methods for theSampling and Analysis of Priority Pollutants inSediments and Fish Tissue,” Section 3.1.3.
2. Richter, B.; Ezzell, J.; Felix, D. “Single LaboratoryMethod Validation Report: Extraction of TCL/PPL(Target Compound List/Priority Pollutant List)BNAs and Pesticides Using Accelerated SolventExtraction (ASE) with Analytical Validation by GC/MS and GC/ECD” Document 116064.A, DionexCorporation, June 16, 1994.

20 Extraction of Chlorinated Pesticides Using Accelerated Solvent Extraction (ASE)
Pesticide Average Recovery (% of Soxhlet)
3.39CHB ahplAGamma BHC - Lindane 95.6
6.89CHB ateB0.88rolhcatpeH5.99CHB atleD9.49nirdlA
Heptachlor Epoxide 100.7Gamma Chlordane 99.5Alpha Chlordane 102.0
3.0011 naflusodnE6.89EDD-’p,p2.101nirdleiD2.79nirdnE6.401DDD-p,p6.501II naflusodnE9.47TDD-’p,p
Endrin Aldehyde 104.0Endosulfan Sulfate 105.2
6.97rolhcycohteM9.201enoteK nirdnE
Matrix ASE AutomatedSoxhlet
Clay 5.0 9.7Loam 7.8 6.2Sand 12.0 10.1
Table 2. Average RSD (%) for Chlorinated PesticidesTable 1. Average Recovery of Pesticidesfrom Three Soil Typesa—ASE Compared
to Automated Soxhlet
a Averages from extraction of sand, loam, and clay soils.

21 Extraction of Chlorinated Herbicides Using Accelerated Solvent Extraction (ASE)
Application Note 318
Extraction of Chlorinated Herbicides UsingAccelerated Solvent Extraction (ASE®)Meets the requirements of U.S. EPA Method 3545
INTRODUCTIONAccelerated Solvent Extraction (ASE) is a new
extraction method that significantly streamlines samplepreparation. A commonly used solvent is pumped intoan extraction cell containing the sample, which is thenbrought to an elevated temperature and pressure.Minutes later, the extract is transferred from the heatedcell to a standard collection vial for cleanup or analysis.The entire extraction process is fully automated andperformed in minutes for fast and easy extraction withlow solvent consumption.
Analysis of soils, sludge, and other solid wastes forchlorinated herbicides first requires extraction of theanalytes from the matrix. Previously, this step usuallyrequired large amounts of solvents. Recent and antici-pated changes in environmental regulations will causesevere restrictions on the amount of solvent usage inlaboratories worldwide. For example, in the UnitedStates a recent executive order calls for a 50–90%reduction of solvent usage in all federal laboratories.ASE was developed by Dionex to meet the new require-ments for reducing solvent usage in the preparation ofsolid waste samples.
The use of ASE in the extraction of chlorinatedherbicides from solid wastes is more convenient,faster, and less solvent-intensive than previous methods.U.S. EPA Method 8150A for the analysis of chlorinatedherbicides uses a wrist-shaking technique that requires300 mL of acetone and diethyl ether following acidifica-tion to pH 2 with HCl. In the method reported in thisapplication note, chlorinated herbicide recoveries by ASEare equivalent to recoveries from the wrist-shaking methodrecommended in Method 8150A. ASE can extract a 10-gsample of a typical soil in about 12 min with a total solventconsumption of approximately 15 mL.
The procedures described in this application notemeet the requirements for sample extraction as prescribedby U.S. EPA Method 3545. This method is applicable tothe extraction of water-insoluble or slightly water-solublechlorinated herbicides in preparation for gas chromato-graphic measurements.
EQUIPMENTASE 200 Accelerated Solvent Extractor, with 11- or
22-mL stainless steel extraction cells
Gas chromatograph (GC) with ECD
Dionex vials for collection of extracts(40 mL P/N 49465; 60 mL P/N 49466)
SOLVENTSDichloromethane
Acetone
Phosphoric acid
ASE 200 CONDITIONSOven Temperature: 100 °C
Pressure: 14 MPa (2000 psi)
Oven
Heatup Time: 5 min
Static Time: 5 min
Flush Volume: 60% of extraction cell volume
Nitrogen Purge: 1 MPa (150 psi) for 60 s
Solvent: Dichloromethane/acetone (1:2, v/v),with 4% (v/v) H
3PO
4/H
2O (1:1)

22 Extraction of Chlorinated Herbicides Using Accelerated Solvent Extraction (ASE)
SAMPLE INFORMATIONAll spiked soils were prepared and certified by ERA
(Environmental Resource Associates). Spiked sampleswere extracted both by the ASE 200 system and by thewrist-shaking technique. The extract was treated usingthe postextraction steps as outlined in U.S. EPA Method8150A. These steps include treatment with acidicNa
2SO
4, base hydrolysis, concentration, and esterifica-
tion with diazomethane. Extracts were analyzed by SW-846 Method 8150A using GC/ECD.
Note: All extractions and analytical work wereperformed by DataChem Laboratories (Salt Lake City,Utah, USA). Matrix blanks, spikes, and spike duplicateswere included for each matrix.
SAMPLE PREPARATIONThe sample is ground to 100–200 mesh (150–75 µm).
Wet samples either are mixed with ASE Prep DE(diatomaceous earth), P/N 062819 (1:1, w/w) or are airdried.1 After grinding, a weighed sample is transferred toeither an 11- or 22-mL extraction cell.
PROCEDUREThe procedure used in this application note follows
the detailed method as described under the U.S. EPASW-846 Method 3545.
Dried sediment, soil, and dry waste samples shouldbe ground or otherwise subdivided to pass through a1-mm sieve. Wet samples are mixed with ASE Prep DEuntil a free-flowing powder is obtained. Introduce asufficient amount of sample into the grinding apparatusto yield 10–20 g after grinding. Dry the sample or mix.Air drying is not appropriate for the analysis of themore volatile chlorinated herbicides.
Place a cellulose disk at the outlet end of the ex-traction cell. Weigh 10 g of each sample into 11-mLextraction cells or 20 g into 22-mL cells. For samplesmixed with ASE Prep DE, transfer the entire contentsof the beaker to the extraction cell. Surrogate spikesand matrix spikes may be added to the appropriatesample cells.
Place extraction cells into the autosampler trayand load the collection tray with the appropriate number(up to 24) of 40-mL, precleaned, capped vials withsepta. Set the method conditions on the ASE 200 systemand initiate the run.
DISCUSSION AND RESULTSResults from the extraction of two spiking levels
in three different soil types are summarized in Tables1 and 2. These results illustrate that the ASE techniqueobtains analyte recoveries equivalent to the Method8150A wrist-shaking procedure for the extraction ofchlorinated herbicides from solid waste.2
REFERENCES1. “Interim Methods for the Sampling and Analysis of
Priority Pollutants in Sediments and Fish Tissue”;U.S. EPA Method 600/4-81-055, Section 3.1.3.
2. Richter, B.; Ezzell, J.; Felix, D. “Single LaboratoryMethod Validation Report: Extraction of Organo-phosphorous Pesticides, Chlorinated Herbicides,and Polychlorinated Biphenyls Using AcceleratedSolvent Extraction (ASE) with Analytical Valida-tion by GC/NPD and GC/ECD”; Document 101124;Dionex Corporation: December 2, 1994.

23 Extraction of Chlorinated Herbicides Using Accelerated Solvent Extraction (ASE)
Matrixa ASE ASEb Shaking Shakingb ASE as(% of (RSD,%) (% of (RSD,%) % ofSpike) Spike) Shaking
Clay (low) 36.1 54.5 42.2 25.2 89.8Clay (high) 71.1 15.0 61.6 21.6 112.8Loam (low) 56.7 11.2 36.9 78.7 126.6Loam (high) 59.9 14.1 43.9 14.7 132.8Sand (low) 51.1 12.6 49.7 13.3 111.2Sand (high) 69.2 39.5 66.3 35.5 104.4
Chlorinated Herbicide Average RecoveryTarget Compound (% of Shaking Method)
2.611D-4,29.211BD-4,26.601T-5,4,24.711PT-5,4,28.101nopalaD1.801abmaciD
Dichlorprop 107.74.811besoniD
Table 1. Average Recovery of ChlorinatedHerbicides from Three Soil Typesa—ASE
Compared to Wrist-Shaking Method
Table 2. Average Recovery and Precisionfor Extraction of Chlorinated Herbicides
from Three Soil Types by ASE
a Low spiking levels ranged from 50 to 500 µg/kg. High spiking levels ranged from 500 to5000 µg/kg.
b Each precision (RSD,%) value is the average of seven replicate measurements for eachcompound, then averaged for all compounds.
a Averages from extraction of sand, loam, and clay soils.

24 Determination of Aniline and Nitroanilines in Environmental and Drinking Waters by On-Line SPE
Application Note 292
Determination of Aniline and Nitroanilines in Environmental and Drinking Waters by On-Line SPE
INTRODUCTIONAniline is an organic compound widely used in the
polymer, rubber, pharmaceutical, and dye industries. Aniline and its derivatives (e.g., nitroanilines) are suspected carcinogens and are highly toxic to aquatic life. Therefore, it is necessary to establish sensitive, efficient, and simple methods for the determination of aniline and its derivatives in drinking and environmental waters.
The most common techniques for the determination of aniline and its derivatives in environmental and drinking waters are gas chromatography (GC)1,2 and high-performance liquid chromatography (HPLC).3–5 Capillary zone electrophoresis (CZE)6 and spectrophotometric methods7 have been reported as well. Because these compounds are thermolabile and polar, a derivatization step prior to GC analysis is often required, and most of these procedures are time consuming and complicated. Therefore, HPLC analysis is a good alternative to GC analysis because derivatization is not needed.
Normally, extraction processes for aniline and its derivatives from environmental and drinking water samples prior to HPLC analysis are required due to the limited sensitivity of direct injection for these samples, which have low concentrations of anilines. The typical extraction techniques are liquid-liquid extraction8 and
solid-phase extraction (SPE),9 with SPE gaining favor either in the on-line or off-line mode. Compared to off-line SPE, on-line SPE offers the advantages of full automation, absence of operator influence, time savings, and strict process control.10–12
Here, an on-line SPE HPLC system is used to fulfill the simple and sensitive determination of aniline and four nitroanilines—o-nitroaniline, m-nitroaniline, p-nitroaniline, and o,p-dinitroaniline—in tap and pond water. The analyte structures are shown in Figure 1.
29046
Aniline o-Nitroaniline
p-Nitroaniline o,p-Dinitroaniline
m-Nitroaniline
NH2 NH2 NH2
NH2
NO2
NO2
NO2
NO2
NH2
O2N
Figure 1. Structures of aniline and nitroanilines.

25 Determination of Aniline and Nitroanilines in Environmental and Drinking Waters by On-Line SPE
This on-line SPE HPLC system uses a Thermo Scientific Dionex SolEx™ HRP cartridge for the enrichment and a Thermo Scientific Acclaim™ 120 C18 column for the separation. The Thermo Scientific Dionex UltiMate™ 3000 Dual HPLC system provides an efficient platform to fulfill the on-line SPE and separation, and the system operates under automatic control of Thermo Scientific Dionex Chromeleon™ Chromatography Data System (CDS) software. The complete analysis requires only 15 min, and method detection limits (MDL) for these compounds are all less than 0.2 μg/L, which meets the requirement of United States Environmental Protection Agency (EPA) Method 8131 (GC method, MDLs range from 1.0 to 11 μg/L).13
EQUIPMENTDionex UltiMate 3000 HPLC system including:
DGP-3600A pump with SRD-3600 solvent rack with degasser
WPS-3000TSL semiprep autosampler with 2500 μL sample loop*
TCC-3200 thermostatted column compartment equipped with one 2p–6p valve
DAD-3000RS UV-vis detector
Chromeleon CDS software, Version 6.80, SR9
Orion 420A+ pH meter, Thermo Scientific
*The analytical version of the WPS-3000TSL autosampler can also be converted to the semipreparative version by installing the Semipreparative Conversion Kit (P/N 6822.2450) for large-volume injections for on-line SPE.
REAGENTS Deionized water, Milli-Q® Gradient A10,
Millipore Corporation
Methanol (CH3OH), HPLC grade (Cat.# AC610090040)
Fisher Chemical
Acetonitrile (CH3CN), HPLC grade (Cat.#AC610010040)
Fisher Chemical
Phosphoric acid (H3PO
4), analytical grade, SCRC, China
Dipotassium hydrogen phosphate (K2HPO
4), analytical
grade, SCRC, China
STANDARDSAniline, analytical standard, Fluka
o-Nitroaniline, 98%, Aldrich
m-Nitroaniline, 98%, Aldrich
p-Nitroaniline, 99%, Aldrich
o,p-Dinitroaniline, 98%, Aldrich
Accurately weigh ~50 mg of a standard and dilute in a 50 mL volumetric flask with methanol. The concentration of the standard is 1000 mg/L (stock standard solution 1). Pipet 50 μL of stock standard 1 into a 50 mL volumetric flask and dilute to the mark with methanol. The concentration of the standard is 1000 μg/L (stock standard solution 2). Prepare four working standard solutions for the calibration with 1, 10, 50, and 100 μg/mL concentrations by adding the proper amount of stock standard solution 2 and making dilutions with methanol.
Note: The concentration of the stock standard solution 1 is not 1000 mg/L because of the < 100% purity for the standards. So, the actual volume taken for the preparation of stock standard solution 2 must be, for example, 51 μL for o-nitroaniline with 98% purity.
SAMPLESTap water samples were collected at the Dionex
Shanghai Applications Lab. Pond water samples were collected at Zhangjiang High-Tech Park located in the Pudong District of Shanghai, China.
These samples were filtered through a 0.45 μm membrane (Millex®-HN) prior to injection.
CHROMATOGRAPHIC CONDITIONSSPE Cartridge: Dionex SolEx HRP Cartridge, 12–14 μm, 2.1 × 20 mm (P/N 074400) Use V-3 Holder (P/N 074403)*
Analytical Column: Acclaim 120 C18, 3 μm, 4.6 × 150 mm (P/N 059133)
Mobile Phase: For on-line SPE: A: 10 mM phosphate buffer (pH 6.5) B: CH
3OH
In gradient (Table 1)
For Separation: A: H2O
B: CH3CN
In gradient (Table 1)
Valve-Switching: Table 1
Flow Rate: 2.0 and 0.5 mL/min for on-line SPE 1.0 mL/min for separation
Inj. Volume: 5000 μL on the on-line SPE cartridge*
Column Temp.: 30 °C
UV Detection: Absorbance at 230 nm
*Two consecutive injections of 2500 μL using the User Defined Program (UDP) injection mode controlled by Chromeleon CDS software

26 Determination of Aniline and Nitroanilines in Environmental and Drinking Waters by On-Line SPE
RESULTS AND DISCUSSIONSelection of SPE Column
Considering the tolerance to large-volume injection of water samples, and the relative ease or difficulty of retention/elution of aniline and nitroanilines by SPE, two types of silica-based stationary phases (the Acclaim Mixed-Mode WCX-1 Guard and the Acclaim PA2 Guard) and two types of polymeric sorbents (the Dionex SolEx HRP Cartridge and the Thermo Scientific Dionex IonPac™ NG1 Guard) were evaluated as SPE columns. This evaluation followed the typical on-line SPE flow schematic shown in Figure 2. The chromatograms of aniline, p-nitroaniline, m-nitroaniline, o-nitroaniline, and o,p-dinitroaniline are shown in Figure 3.
Table 1. Elution and Valve Switching for On-Line SPE and Separation
Time (min)
Left Pump (for On-Line SPE) Right Pump (for Separation)Valve
SwitchingFlow Rate (mL/min)
Solvent A 10 mM Phosphate Buffer (pH 6.5)
(%)
Solvent B Methanol
(%)
Flow Rate (mL/min)
Solvent A H2O(%)
Solvent B Acetonitrile
(%)
02
90 10
1.0
70 30 1–2
2 90 10 70 30 6–1
30.5
30 70 — — 1–2
10 30 70 45 55 —
11 2 90 10 30 70 —
13 — — — 30 70 —
15 — — — 70 30 —
29047
Dual-Gradient Pump
SPE Column
From Left Pump
From Right Pump
Waste
1
2
Anal
ytic
alCo
lum
n
DetectorAutosampler
6
5
43
Figure 2. Flow schematic of on-line SPE.

27 Determination of Aniline and Nitroanilines in Environmental and Drinking Waters by On-Line SPE
As shown in Figure 3 A and B, severe band spreading for aniline (peak 1) was observed when using the Dionex IonPac NG1 Guard and the Acclaim PolarAdvantage II (PA2) Guard. This can be attributed to aniline’s weak retention on these stationary phases, even using water as the mobile phase. During its enrichment in on-line SPE, aniline diffused on these SPE columns, resulting in severe band spreading on the analytical column even if using a reversed flush with organic mobile phase. Meanwhile, the weak retention of aniline on these stationary phases may result in its loss during the course of enrichment. Poor extraction efficiency, low to about 50%, was estimated by comparing the peak area obtained with on-line SPE to that obtained without SPE.
Although the peak shape improved using the Acclaim Mixed-Mode WCX-1 Guard (Figure 3C), a stationary phase that combines cation-exchange and RP properties, there was not a significant improvement in extraction efficiency. The Dionex SolEx HRP cartridge, packed with a divinylbenzene polymer with a hydrophilic bonded layer,14 was thus selected based on its excellent retention properties of the analytes with different polarities. As shown in Figure 3D, good peak shape of aniline was observed; and the estimated extraction efficiency was > 95%. The peak shape and efficiency of p-nitroaniline were also improved using the Dionex SolEx HRP cartridge.
Table 2. Chromatographic Conditions for Figure 3On-Line SPE Stationary Phase
Dionex IonPac NG1 Guard (10 µm, 4 × 35 mm) and Acclaim PA2 Guard (5 µm, 4.6 × 10 mm)
Acclaim Mixed-Mode WCX-1 Guard (5 µm, 4.6 × 10 mm) and Dionex SolEx HRP Cartridge (12–14 µm, 2.1 × 20 mm)
Analytical Column Acclaim 120 C18 (3 µm, 3.0 × 150 mm) Acclaim 120 C18 (3 µm, 4.6 × 150 mm)
Mobile Phase
For on- line SPE50 mM NH4 Ac-HAc (pH 4.6)/CH3OH Gradient: CH3OH, 0~2 min, 1%; 6~11 min, 70%; 11~17 min, 1.0%
10 mM phosphate buffer (pH 6.5/CH3OH Gradient: CH3OH, 0~3 min, 0%; 7~14.5 min, 70%; 15.1~18 min, 0%
10 mM phosphate buffer (pH 6.5/CH3OH Gradient: CH3OH, 0~2 min, 10%; 3~10 min, 70%; 11~15 min, 10%
For separationH2O/CH3OH Gradient: CH3OH, 0~4 min, 5%; 10~17 min, 60%
H2O/CH3OH Gradient: CH3OH, 0 min,10%; 2.5 min, 10%; 13~18 min, 70%; 23 min, 10%
H2O/CH3CN Gradient: CH3CN, 0~2 min, 30%; 10 min, 55%; 11~13 min, 70%; 15 min, 30%
Flow RateFor on- line SPE
0~2 min, 1.5 mL/min; 2.1~15 min, 0.5 mL/min; 17 min, 1.5 mL/min
0~3 min, 0.5 mL/min; 7~18 min, 1.0 mL/min; 18.1 min, 0.5 mL/min
0~2 min, 2.0 mL/min; 3~10 min, 0.5 mL/min; 11~15 min, 2 mL/min
For separation 0.5 mL/min 1.0 mL/min
Inj. Volume 5000 µL on the on-line SPE cartridge (two consecutive injections of 2500 µL using UDP injection mode)
Column Temp. 30 °C 30 °C
UV Detection 285 nm 230 nm
Sample Tap water spiked with anilines standards (100 µg/L each)
Peaks 1) Aniline, 2) p-nitroaniline, 3) m-nitroaniline, 4) o-nitroaniline, 5) o,p-dinitroaniline
Figure 3. Chromatograms of aniline and nitroanilines (100 µg/L each) using different on-line SPE stationary phases (A) Dionex IonPac NG1 Guard, (B) Acclaim PA2 Guard, (C) Acclaim Mixed-Mode WCX-1 Guard, and (D) Dionex SolEx HRP Cartridge. See Table 2 for conditions.
–10
70
mAU
–20
180
mAU
–20
200
mAU
0 2 4 6 8 10 12 14 17–100
600
mAU
Minutes
1 2
5
1
1
1
2
2
2
3
3
3
3
4
4
4
4
5
5
5
A
B
C
D
29048
28 Determination of Aniline and Nitroanilines in Environmental and Drinking Waters by On-Line SPE
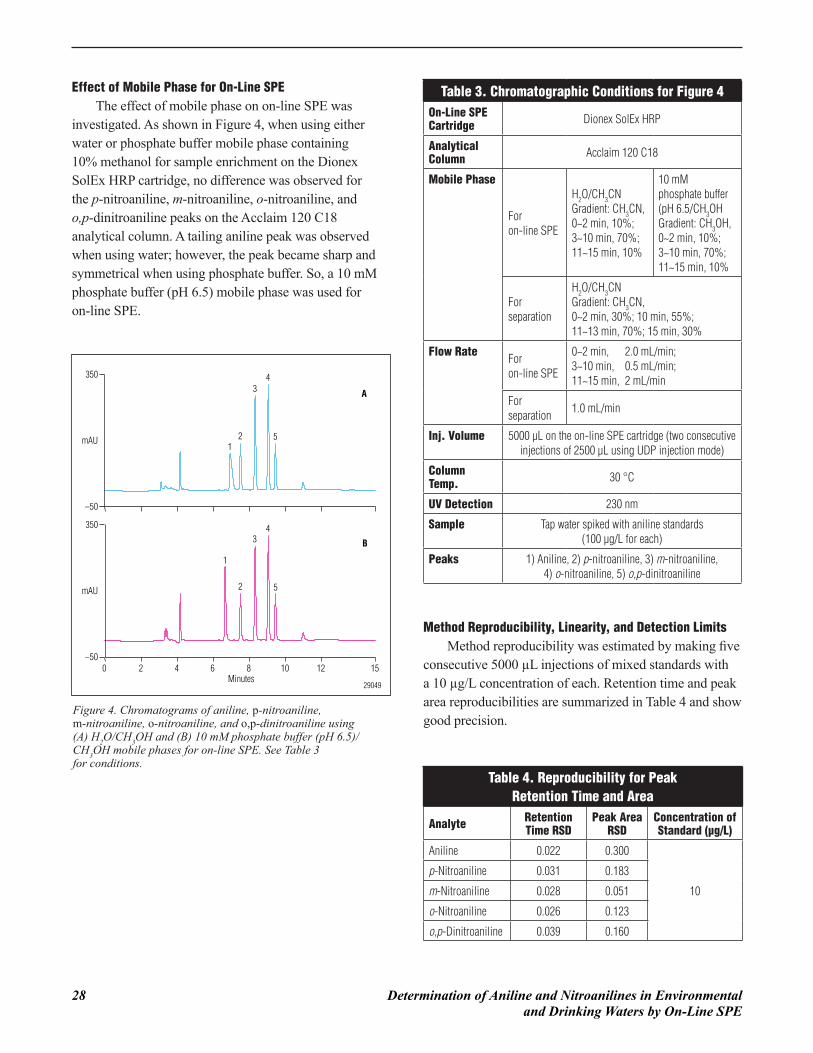
Effect of Mobile Phase for On-Line SPEThe effect of mobile phase on on-line SPE was
investigated. As shown in Figure 4, when using either water or phosphate buffer mobile phase containing 10% methanol for sample enrichment on the Dionex SolEx HRP cartridge, no difference was observed for the p-nitroaniline, m-nitroaniline, o-nitroaniline, and o,p-dinitroaniline peaks on the Acclaim 120 C18 analytical column. A tailing aniline peak was observed when using water; however, the peak became sharp and symmetrical when using phosphate buffer. So, a 10 mM phosphate buffer (pH 6.5) mobile phase was used for on-line SPE.
Method Reproducibility, Linearity, and Detection LimitsMethod reproducibility was estimated by making five
consecutive 5000 μL injections of mixed standards with a 10 μg/L concentration of each. Retention time and peak area reproducibilities are summarized in Table 4 and show good precision.
–50
350
mAU
A
0 2 4 6 8 10 12 15–50
350
mAU
Minutes
B
1
1
2
2
3
34
4
5
5
29049
Figure 4. Chromatograms of aniline, p-nitroaniline, m-nitroaniline, o-nitroaniline, and o,p-dinitroaniline using (A) H
2O/CH
3OH and (B) 10 mM phosphate buffer (pH 6.5)/
CH3OH mobile phases for on-line SPE. See Table 3
for conditions.
Table 3. Chromatographic Conditions for Figure 4On-Line SPE Cartridge Dionex SolEx HRP
Analytical Column Acclaim 120 C18
Mobile Phase
For on-line SPE
H2O/CH3CN Gradient: CH3CN, 0~2 min, 10%; 3~10 min, 70%; 11~15 min, 10%
10 mM phosphate buffer (pH 6.5/CH3OH Gradient: CH3OH, 0~2 min, 10%; 3~10 min, 70%; 11~15 min, 10%
For separation
H2O/CH3CN Gradient: CH3CN, 0~2 min, 30%; 10 min, 55%; 11~13 min, 70%; 15 min, 30%
Flow Rate For on-line SPE
0~2 min, 2.0 mL/min; 3~10 min, 0.5 mL/min; 11~15 min, 2 mL/min
For separation 1.0 mL/min
Inj. Volume 5000 µL on the on-line SPE cartridge (two consecutive injections of 2500 µL using UDP injection mode)
Column Temp. 30 °C
UV Detection 230 nm
Sample Tap water spiked with aniline standards (100 µg/L for each)
Peaks 1) Aniline, 2) p-nitroaniline, 3) m-nitroaniline, 4) o-nitroaniline, 5) o,p-dinitroaniline
Table 4. Reproducibility for Peak Retention Time and Area
Analyte Retention Time RSD
Peak Area RSD
Concentration of Standard (µg/L)
Aniline 0.022 0.300
10
p-Nitroaniline 0.031 0.183
m-Nitroaniline 0.028 0.051
o-Nitroaniline 0.026 0.123
o,p-Dinitroaniline 0.039 0.160

29 Determination of Aniline and Nitroanilines in Environmental and Drinking Waters by On-Line SPE
Calibration linearity for aniline and nitroanilines was investigated by making three consecutive injections of a mixed standard prepared at four different concentrations. The external standard method was used to establish the calibration curve and to quantify these compounds in samples. Excellent linearity was observed from 1 to 100 μg/L when plotting concentration versus peak area, and the correlation coefficient was ≥ 0.9999 for each plot. The MDLs of each compound for UV detection were calculated using S/N = 3 (signal to noise), and all were ≤ 0.2 μg/L. Table 5 summarizes the method linearity and MDL data, which show excellent method linearity and sensitivity, with detection limits well below those defined in the EPA method.13
Sample AnalysisChromatograms of tap and pond water samples, as
well as the same samples spiked with aniline and related standards (1.0 μg/L each and 10 μg/L each, respectively), are shown in Figures 5 and 6, and the related data are summarized in Table 6. Recoveries for each standard in both sample sets ranged from 98 to 108% for the 10 μg/L standard spiked samples, and ranged from 93 to 147% for the 1 μg/L standard spiked samples. None of the samples had detectable aniline or nitroanilines.
The real samples may sometimes yield a false positive for aniline and/or one of the nitroanilines. An efficient and convenient way to determine if the peak is a target analyte is to compare the peak’s UV spectrum to that of standards. Therefore, using a photodiode array detector for this analysis will help reduce the possibility of false positives.
When the pond water sample was analyzed, a small peak with retention time near that of aniline was found and labeled as aniline with a concentration 0.3 μg/L, similar to the estimated MDL of aniline (0.2 μg/L).
Table 5. Method Linearity Data and Method Detection Limits (MDL)
Analyte Regression Equation r Range of Standards (µg/L)
MDL, µg/L
Current Data Data Reported in EPA Method 8131
Aniline A = 0.3686 c - 0.1530 0.9999
1–100
0.2 2.3
p-Nitroaniline A = 0.2290 c - 0.0830 1.0000 0.2 1.0
m-Nitroaniline A = 0.4770 c + 0.0302 1.0000 0.1 3.3
o-Nitroaniline A = 0.5286 c - 0.0194 1.0000 0.1 11.0
o,p-Dinitroaniline A = 0.2432 c - 0.0252 1.0000 0.2 8.9
0 2 4 6 8 10 12 15–20
80
mAU
Minutes
CBA
1
2
34
5
SPE Cartridge: Dionex SolEx HRP (12–14 µm, 2.1 × 20 mm)Analytical Column: Acclaim 120 C18 (3 µm, 4.6 × 150 mm)Mobile Phase: For on-line SPE: 10 mM phosphate buffer (pH 6.5)/CH3OH, In gradient: CH3OH, 0~2 min, 10%; 3~10 min, 70%; 11~15 min, 10% For separation: H2O/CH3CN In gradient: CH3CN, 0~2 min, 30%; 10 min, 55%; 11~13 min, 70%; 15 min, 30%Flow Rate: For on-line SPE: 0~2 min, 2.0 mL/min; 3~10 min, 0.5 mL/min; 11~15 min, 2 mL/min For separation: 1.0 mL/minInj. Volume: 5000 µL on the on-line SPE cartridge (two consecutive injections of 2500 µL using UDP injection mode)Column Temp.: 30 °CUV Detection: Absorbance at 230 nm
Chromatograms: A) Tap water sample B) Spiked with standards 1.0 µg/L each C) Spiked with standards 10 µg/L each
Peaks: 1. Aniline 2. p-Nitroaniline 3. m-Nitroaniline 4. o-Nitroaniline 5. o,p-Dinitroaniline.
29050
Figure 5. Chromatograms of (A) tap water sample, (B) the same sample spiked with 1.0 µg/L aniline and nitroanilines standard, and (C) spiked with 10 µg/L.
Comparison of the UV spectra shown in Figure 7 revealed that the peak was not aniline. The spike-recovery of aniline at 1.0 μg/L level in pond water, 147%, also suggests that there is interference.

30 Determination of Aniline and Nitroanilines in Environmental and Drinking Waters by On-Line SPE
0 2 4 6 8 10 12 15–20
80
mAU
Minutes
BA
1
2
34
5
SPE Cartridge: Dionex SolEx HRP (12–14 µm, 2.1 × 20 mm)Analytical Column: Acclaim 120 C18 (3 µm, 4.6 × 150 mm)Mobile Phase: For on-line SPE: 10 mM phosphate buffer (pH 6.5)/CH3OH, In gradient: CH3OH, 0~2 min, 10%; 3~10 min, 70%; 11~15 min, 10% For separation: H2O/CH3CN In gradient: CH3CN, 0~2 min, 30%; 10 min, 55%; 11~13 min, 70%; 15 min, 30%Flow Rate: For on-line SPE: 0~2 min, 2.0 mL/min; 3~10 min, 0.5 mL/min; 11~15 min, 2 mL/min For separation: 1.0 mL/minInj. Volume: 5000 µL on the on-line SPE cartridge (two consecutive injections of 2500 µL using UDP injection mode)Column Temp.: 30 °CUV Detection: Absorbance at 230 nm
Chromatograms: A) Pond water sample B) Spiked with standards 1.0 µg/L each C) Spiked with standards 10 µg/L each
Peaks: 1. Aniline 2. p-Nitroaniline 3. m-Nitroaniline 4. o-Nitroaniline 5. o,p-Dinitroaniline.
29051
C
Figure 6. Chromatograms of (A) pond water sample, (B) the same sample spiked with 1.0 µg/L aniline and nitroanilines standard, and (C) spiked with 10 µg/L.
Table 6. Analysis Results of Anilines in Water SamplesSample Pond Water
Analyte Detected (µg/L)
Added (µg/L)
Recovery (%)
Added (µg/L)
Recovery (%)
Aniline ND
1.0
147
10
104
p-Nitroaniline ND 140 101
m-Nitroaniline ND 94.2 99.7
o-Nitroaniline ND 105 101
o,p-Dinitroaniline ND 101 98.8
Sample Tap Water
Analyte Detected (µg/L)
Added (µg/L)
Recovery (%)
Added (µg/L)
Recovery (%)
Aniline ND
1.0
103
10
100
p-Nitroaniline ND 127 108
m-Nitroaniline ND 93.1 100
o-Nitroaniline ND 109 102
o,p-Dinitroaniline ND 103 100
–10
60
%
234.2
284.3
–50
300
220 240 260 280 300 320 340 360 380 400
%
nm
272.1
A
B
29052
Figure 7. UV spectra of (A) aniline standard and (B) the putative aniline peak in a pond water sample.
In addition, as shown in Figures 5 and 6, interference with retention time near that of p-nitroaniline (peak 2) was found. Although it was not labeled as p-nitroaniline, its presence affects the spike-recoveries of p-nitroaniline at the 1.0 μg/L level in both pond and tap waters samples (140% and 127%, respectively). This demonstrates that the limits of detection are often set by matrix interference instead of instrumental uncertainties in the analysis of environmental samples.

31 Determination of Aniline and Nitroanilines in Environmental and Drinking Waters by On-Line SPE
CONCLUSIONThis work describes an on-line SPE system using
the Dionex SolEx HRP cartridge to enrich aniline and nitroanilines followed by HPLC with UV detection. The enrichment of aniline and nitroanilines in tap and pond water is sufficient, and baseline separation on the Acclaim 120 C18 column is achieved. The Dionex UltiMate 3000 Dual HPLC system provides an efficient platform to fulfill this on-line SPE, and the system operates under automatic control of Chromeleon CDS software. The determination of aniline and nitroanilines in tap and pond water is simple, rapid, and sensitive, and meets the MDL requirement of the EPA Method 8131. Although this work cannot be a substitute for the EPA method, it does demonstrate that these analytes can be determined by on-line SPE-HPLC while meeting the performance criteria of the EPA method.
REFERENCES1. Brede, C.; Skjevrak, I.; Herikstad, H. Determination
of Primary Aromatic Amines in Water Food Simulant Using Solid-Phase Analytical Derivatization Followed by Gas Chromatography Coupled with Mass Spectrometry J. Chromatogr., A 2003, 983, 35.
2. Chiang, J. S.; Huang, S. D. Simultaneous Derivatization and Extraction of Anilines in Waste Water with Dispersive Liquid–Liquid Microextraction Followed by Gas Chromatography–Mass Spectrometric Detection Talanta 2008, 75, 70.
3. Jen, J. F.; Chang, C. T.; Yang, T. C. On-Line Microdialysis–High-Performance Liquid Chromatographic Determination of Aniline and 2-Chloroaniline in Polymer Industrial Wastewater J. Chromatogr., A 2001, 930, 119.
4. Sarafraz-Yazdi, A.; Es’haghi, Z. Liquid–Liquid–Liquid Phase Microextraction of Aromatic Amines in Water Using Crown Ethers by High-Performance Liquid Chromatography with Monolithic Column Talanta 2005, 66, 664.
5. Zhao, L. M.; Zhu, L. Y.; Lee, H. K. Analysis of Aromatic Amines in Water Samples by Liquid–Liquid–Liquid Microextraction with Hollow Fibers and High-Performance Liquid Chromatography J. Chromatogr., A 2002, 963, 239.
6. Li, J.; Yuan, Z. B. Separation of Aniline Derivatives by Micellar Electrokinetic Capillary Chromatography Chin. Chem. Lett. 2004, 15, 947.
7. Gu, X. X.; Li, C. Y.; Qi, X.; Zhou, T. Z. Determination of Trace Aniline in Water by a Spectrophotometric Method After Preconcentration on an Organic Solvent-Soluble Membrane Filter Anal. Lett. 1997, 30, 259.
8. Wu, X. H.; Lei, Z. G.; Li, Q. S.; Zhu J. Q.; Chen, B. H. Liquid-Liquid Extraction of Low-Concentration Aniline from Aqueous Solutions with Salts Ind. Eng. Chem. Res. 2010, 49, 2581.
9. Patsias, J.; Papadopoulou-Mourkidou, E. Development of an Automated On-Line Solid-Phase Extraction–High Performance Liquid Chromatographic Method for the Analysis of Aniline, Phenol, Caffeine and Various Selected Substituted Aniline and Phenol Compounds in Aqueous Matrices J. Chromatogr., A 2000, 904, 171.
10. Thermo Fisher Scientific. Determination of Phenols in Drinking and Bottled Mineral Waters Using Online Solid-Phase Extraction Followed by HPLC with UV Detection. Dionex Application Note 191, LPN 1949, 2007, Sunnyvale, CA.
11. Thermo Fisher Scientific. Determination of Polycyclic Aromatic Hydrocarbons (PAHs) in Edible Oils by Donor-Acceptor Complex Chromatography (DACC)-HPLC with Fluorescence Detection. Dionex Application Note 196, LPN 1998, 2008, Sunnyvale, CA.
12. Thermo Fisher Scientific. Determination of Polycyclic Aromatic Hydrocarbons (PAHs) in Tap Water Using On-Line Solid-Phase Extraction Followed by HPLC with UV and Fluorescence Detections. Dionex Application Note 213, LPN 2126, 2009, Sunnyvale, CA.
13. niline and Selected Derivatives by Gas Chromatography; U.S. EPA Method 8131, U.S. Environmental Protection Agency: Cincinnati, OH, 1996.
14. Thermo Fisher Scientific. SolEx HRP On-Line Sample SPE Concentration Cartridges. LPN 2565, 2010, Sunnyvale, CA.

32 Sensitive On-Line SPE–HPLC Determination of Paraquat and Diquat in Drinking and Environmental Waters
N+ N+CH3
2Br–
2Cl–
N+H3C+N
ParaquatDiquat
28135
Application Note 274
Sensitive On-Line SPE–HPLC Determination of Paraquat and Diquat in Drinking and Environmental Waters
INTRODUCTIONMixtures of paraquat (1,1′-dimethyl-4,4′-dipyridylium
dichloride) and diquat (1,1′-ethylene-2,2′-dipyridylium dibromide), quaternary ammonium herbicides, are widely used to control crop and aquatic weeds. Their structures are shown in Figure 1. Contamination of drinking water with paraquat and diquat is considered a risk factor for liver, heart, lungs, and kidney illnesses.
High-performance liquid chromatography (HPLC) is one commonly used method for the separation of diquat and paraquat. Their baseline separation is difficult on conventional reversed-phase (RP) columns (C18 or C8) due to their weak retention on those columns. Therefore, ion-pairing reagents are added to the mobile phase. This addition may also improve peak shape.3–11
The U.S. EPA published EPA Method 549.2 for monitoring diquat and paraquat in aqueous samples.3 This method uses a C18 stationary phase with an ion- pairing reagent in the mobile phase and photodiode array detection.
Recently, a stationary phase that may be used in the hydrophilic interaction liquid chromatography (HILIC) mode was reported for the separation in the absence of an ion-pairing reagent.12 An improved separation with resolution (R
s) of 3.2 was achieved using
the Acclaim® Mixed-Mode HILIC-1 column.13 Solid phase extraction (SPE) is the typical method
for sample extraction and enrichment in the analysis of diquat and paraquat in water samples by HPLC. Off-line SPE14–16 is usually used, and EPA Method 549.2 also describes off-line SPE for water sample preparation, which is improved compared to Method 549.1, but still complex.3 Compared to off-line SPE, on-line SPE offers the advantages of full automation, the absence of operator influence, time savings, and strict process control.17–19 Several applications of on-line SPE to the determination of diquat and paraquat in water samples by HPLC have been reported.20–22
Figure 1. Structures of diquat and paraquat specified in the U.S. EPA Method 549.2.
The United States Environmental Protection Agency (U.S. EPA) specified a Maximum Contaminant Level Goal (MCLG) for diquat in drinking water of 20 μg/L1 and the European Union (EU) published a general rule for pesticides in drinking water (98/83/EC).2 This rule states that the maximum admissible concentration of each individual pesticide component is 0.1 μg/L, and the total concentration is not to exceed 0.5 μg/L. Therefore, simple and effective sample preparation and sensitive analytical methods are necessary for determining diquat and paraquat in environmental waters.

33 Sensitive On-Line SPE–HPLC Determination of Paraquat and Diquat in Drinking and Environmental Waters
REAGENTS Deionized water, Milli-Q® Gradient A10, Millipore
Corporation
Methanol (CH3OH), Fisher
Acetonitrile (CH3CN), Fisher
Acetic acid (CH3COOH), analytical grade, SCRC, China
Ammonium acetate (CH3COONH
4), analytical grade,
SCRC, China
Ammonium sulfate ((NH4)
2SO
4), analytical grade,
SCRC, China
Dimethyldichlorosilane (DMCO), analytical grade, SCRC, China
STANDARDSUse the M-549.1 Diquat and Paraquat standard
(1.0 mg/mL each, AccuStandard [Lot No. 6120096-1A]) for preparing a stock standard solution with 1.0 μg/mL each by dilution with deionized water. Prepare five working standard solutions for the calibration by adding the proper amount of stock standard solution and making dilutions with 25 mM ammonium acetate (pH 5.2, adjust with acetic acid).
Note: All glassware used for diquat and paraquat standards and in sample preparation should be soaked at least eight hours in a mixture of CH
3CN and DMCO
(9:1, v/v) to avoid loss of diquat and paraquat.
SAMPLESTap water samples were collected at the Dionex
Shanghai Applications Lab. Pond water samples were collected at Zhangjiang High-Science and Technology Park located in the Pudong District of Shanghai, China.
Add 0.77 g of ammonium acetate to 1 L of water sample, then adjust to pH 5.2 with acetic acid. Filter these samples through a 0.45 μm membrane (Millex-HN) prior to injection.
In the work shown here, an on-line SPE system is used to eliminate interferences sufficiently and fulfill the simple and sensitive determination of diquat and paraquat in tap and pond water. This on-line SPE system uses two SPE cartridges. One is the Acclaim Mixed-Mode WAX-1 cartridge for the elimination of anionic interferences; the other one is the Acclaim Mixed-Mode WCX-1 cartridge for the enrichment of diquat and paraquat, and the elimination of co-enriched cationic interferences.
The analysis is completed by baseline separation of diquat and paraquat on the Acclaim Trinity™ P1 column. The UltiMate® 3000 Dual HPLC system provides an efficient platform to fulfill the on-line SPE and separation, and the system operates under automatic control of Chromeleon® Chromatography Data System (CDS) software. The complete analysis only requires 16 min, and method detection limits (MDL) are 0.12 μg/L for diquat and 0.10 μg/L for paraquat, which meets the requirement of EPA Method 549.2 (0.72 μg/L for diquat and 0.68 μg/L for paraquat).
EQUIPMENT Dionex UltiMate 3000 HPLC system including:
DGP-3600A pump with SRD-3600 solvent rack with degasser
WPS-3000TSL semiprep autosampler with 2500 μL sample loop*
TCC-3200 thermostatted column compartment equipped with one 2p–6p valve
DAD-3000RS UV-vis detector
Chromeleon CDS software, Version 6.80 SR9
Orion 420A+ pH meter, Thermo Scientific
*The analytical version of the WPS-3000TSL autosampler can also be converted to the semipreparative version by installing the Semipreparative Conversion Kit (P/N 6822.2450) for large-volume injections for on-line SPE.

34 Sensitive On-Line SPE–HPLC Determination of Paraquat and Diquat in Drinking and Environmental Waters
CONDITIONSSPE Cartridge 1*: Acclaim Mixed-Mode WAX-1 (guard), 5 μm, 4.6 × 10 mm (P/N 069704)
SPE Cartridge 2*: Acclaim Mixed-Mode WCX-1 (guard), 5 μm, 4.6 × 10 mm (P/N 069705)
Analytical Column: Acclaim Trinity P1, 3 μm, 3.0 × 50 mm (P/N 071388)
Column Temp.: 25 °C
Mobile Phase: For on-line SPE:
A: 250 mM ammonium acetate (pH 5.2, adjust with acetic acid)
B: CH3OH
C: Water
In gradient (Table 1)
For separation: 500 mM ammonium sulfate–CH
3OH–water,
60:15:25, (v/v)
Valve Switching: Table 1
Flow Rate: 0.7 mL/min for on-line SPE 0.6 mL/min for separation
Inj. Volume: 2500 μL on the on-line SPE cartridge 1
UV Detection: Absorbance at 260 nm for paraquat and 311 nm for diquat
*Use the Acclaim Guard cartridge as the SPE cartridge, and use the V-2 Holder (P/N 069580).
RESULTS AND DISCUSSIONColumn Selection
Diquat and paraquat are permanent cations.23 This results in weak retention of diquat and paraquat on C18 or C8 stationary phases without using an ion-paring reagent in the mobile phase. The Acclaim Mixed-Mode HILIC-1 column has been reported for a baseline separation of diquat and paraquat.13 The silica-based Acclaim Trinity P1 column—which provides multiple retention mechanisms including reversed-phase, anion-exchange, and cation-exchange24—has potential for the separation of diquat and paraquat. Therefore, these two columns were evaluated for use as the analytical column.
As for the selection of SPE cartridge, because diquat and paraquat are cations, the Trinity P1 cartridge and Mixed-Mode WCX-1 cartridges, with their cation-exchange and reversed-phase retention mechanisms, were evaluated for on-line SPE.
Table 1. Elution and Valve Switching for Target-Cut On-Line SPE and Separation
Time (min)
Left Pump (for SPE) Right Pump (for separation) Valve Switching
Flow Rate (mL/min)
Solvent A Buffer
(%)
Solvent B Methanol
(%)
Solvent C Water
(%)
Flow Rate (mL/min)
Solvent A Buffer
(%)
Solvent B Methanol
(%)
Solvent C Water
(%)Right
0.00
0.7
10 5 85
0.6 60 15 25
1-2
6.00 10 5 85 6-1
6.10 55 45 0 —
6.80 — — — 1-2
9.50 55 45 0 —
9.60 10 5 85 —
16.00 10 5 85 —

35 Sensitive On-Line SPE–HPLC Determination of Paraquat and Diquat in Drinking and Environmental Waters
Figure 2 shows the chromatograms of diquat and paraquat standards using the Mixed-Mode WCX-1 as the SPE cartridge and the Mixed-Mode HILIC-1 as the analytical column. The flow schematic is shown in Figure 3A, which is a typical on-line SPE configuration. Although there was good separation of diquat and paraquat, both were subject to interferences even in the mixed diquat and paraquat standard.
Longer retention of diquat and paraquat would be beneficial to avoid interference from highly polar compounds. Experiments showed that the retention of diquat and paraquat on the Trinity P1 column was longer than that on the Mixed-Mode HILIC-1, which may reduce interferences from highly polar compounds. Therefore, a short Trinity P1 column was used as an on-line SPE cartridge and a longer Trinity P1 column was used as the analytical column.
Figure 4 shows the chromatograms of diquat and paraquat in a standard and in spiked tap and pond waters. Baseline separation and good peak asymmetry were observed when diquat and paraquat standards were injected (Figure 4A), but their determinations in real water samples were subject to interference (Figures 4B and C).
From the experiments shown in Figures 2 and 4, it was concluded that just using one SPE cartridge did not efficiently eliminate the interference caused by large concentrations of polar substances. Therefore, an Acclaim Mixed-Mode WAX-1 cartridge with anion-exchange and reversed-phase mechanisms was added following the autosampler (Figure 3B). This addition may retain anions and some non-polar substances to eliminate interferences.
Figure 2. Chromatograms of a mixed diquat and paraquat standard detected at (A) 257 nm and (B) 308 nm using the traditional on-line SPE mode.
28137
Autosampler
Waste
Left Pump
DGP3600A
Right Pump
Analy
tical
Colu
mn
SPE Cartridge SPE Cartridge
DGP3600A
UV
Analy
tical
Colu
mn
Accla
im Tr
inity
P1
SPE CartridgeAcclaim Mixed-Mode WAX-1
Autosampler
Waste
Left Pump
Right Pump
UV
BA
Figure 3. Flow schematic of on-line SPE in (A) traditional mode and (B) improved mode.
12
–2
15
mAU
A
4 6 8 10–2
15
mAU
Minutes
B
SPE Cartridge: Acclaim Mixed-Mode WCX-1 (guard, 5 µm, 4.6 × 10 mm)Analytical Column: Acclaim Mixed-Mode HILIC-1 (3 µm, 3.0 × 150 mm)Column Temp.: 25 ºC Mobile Phase: For on-line SPE: 500 mM ammonium sulfate – CH3OH– Water, 2.5 : 13 : 84.5, (v/v) For separation: 250 mM ammonium acetate (pH 5.2, adjust with acetic acid) – CH3OH – water, 72 : 13 : 15, (v/v)Flow Rate: 0.45 mL/min for on-line SPE, 1.0 mL/min for separationInjection Volume: 2500 µL on the on-line SPE cartridgeChromatograms: Detected at (A) 257 nm, (B) 308 nmUV Detection: 257 nm for paraquat, 308 nm for diquat
Peaks: 1. Diquat 2. Paraquat
28136
1
2
1

36 Sensitive On-Line SPE–HPLC Determination of Paraquat and Diquat in Drinking and Environmental Waters
Although the Trinity P1 cartridge and Mixed-Mode WCX-1 both can be used as SPE cartridges for the enrichment of diquat and paraquat, the latter was selected due to the observation that less co-enriched compounds enable easier elution of diquat and paraquat.
For the separation column, the Trinity P1 column was selected due to its longer retention for diquat and paraquat. As shown in Figure 5, using the improved on-line SPE mode (Figure 3B), baseline separation with good peak symmetry was observed not only when diquat and paraquat standards were injected (Figure 5A) but also in
the analysis of tap and pond water samples (Figures 5B and C). This demonstrated an efficient and simple on-line SPE HPLC method for the determination of diquat and paraquat in real water samples.
Figure 4. Chromatograms of (A) diquat and paraquat standards (20 µg/L each); (B) pond water and (C) tap water samples, both spiked with diquat and paraquat standards (5 µg/L each), using traditional on-line SPE mode. The (a) trace shows detection at 257 nm and the (b) trace at 308 nm.
Figure 5. Chromatograms of (A) diquat and paraquat standards (2 µg/L each); (B) tap water and (C) pond water samples, both spiked with diquat and paraquat standards (2.5 µg/L each), using the improved on-line SPE mode. The (a) trace shows detection at 260 nm and the (b) trace at 311 nm.
30
6.0 6.5 7.0 7.5 8.0 8.5 9.0 9.5 10.0–20
140
mAU
ba
A
6 7 8 9 10 11–10
60
mAU b
a
B
6 7 8 9 10 11–5
mAU
Minutes
b
a
C
28138
SPE Cartridge: Acclaim Trinity P1 (guard, 5 µm, 4.6 × 10 mm)Analytical Column: Acclaim Trinity P1 (3 µm, 3.0 × 150 mm)Column Temp.: 25 ºC Mobile Phase: For on-line SPE: 500 mM ammonium sulfate – CH3OH– Water, 55 : 10 : 35, (v/v) For separation: 250 mM ammonium acetate (pH 5.2, adjust with acetic acid) – CH3OH – water, 60 : 40, (v/v)Flow Rate: 0.6 mL/min for on-line SPEInjection Volume: 2500 µL on the on-line SPE cartridgeUV Detection: 257 nm for paraquat, 308 nm for diquatPanels: (A) Diquat and paraquat standards (20 µg/L each) (B) Pond water spiked with diquat and paraquat standards (5 µg/L each) (C) Tap water spiked with diquat and paraquat standards (5 µg/L each
Peaks: 1. Diquat 2. Paraquat
1
2
1
2
1
2
-3
20
mAU b
a
-3
20
mAU b
a
B
6.0 6.5 7.0 7.5 8.0 8.5 9.0 9.5 10.0-3
20
mAU
Minutes
b
a
A
C
SPE Cartridge 1: Acclaim Mixed-Mode WAX-1 (guard), 5 µm, 4.6 × 10 mmSPE Cartridge 2: Acclaim Mixed-Mode WCX-1 (guard), 5 µm, 4.6 × 10 mmAnal. Column: Acclaim Trinity P1, 3 µm, 3.0 × 50 mmMobile Phase: For on-line SPE, A: 250 mM CH3COONH4 (pH 5.2) B: MeOH C: WaterGradient: 0.0 – 6.0 min, A: 10%, B 5%; 6.1 – 9.5 min, A: 55%, B: 45%; 9.6 – 16 min, A: 10%, B: 5% For separation, 500 mM (NH4)2SO4 – CH3OH –Water, 60 : 15 : 25, (v/v)Column Temp.: 25 ºCFlow Rate: 0.7 mL/min for on-line SPE; 0.6 mL/min for separationInj. Volume: 2500 µL onto SPE cartridge 1Detection: At 260 nm for paraquat, 311 nm for diquatPanels: (A) Diquat and paraquat standards (2 µg/L each) (B) Tap water spiked with diquat and paraquat standards (2.5 µg/L each) (C) Pond water spiked with diquat and paraquat standards (2.5 µg/L each)
Peaks: 1. Diquat 2. Paraquat
28139
-10
50
190 300 400
259.7
197.2
372.4
-10
50
190 400nm
198.9310.8
216.7
259.8197.3
388.4
198.3310.8
217.2
259.3196.8
369.7
198.7 311.2217.3
Diquat
Paraquat
Paraquat
Paraquat
Diquat
Diquat
300
12
1
2
12
% %
nm
-10
50
190 300 400
%
nm
-10
50
190 300 400
%
nm
-10
50
190 300 400
%
nm
-10
50
190 300 400
%
nm

37 Sensitive On-Line SPE–HPLC Determination of Paraquat and Diquat in Drinking and Environmental Waters
Configuration of the Improved On-Line SPE MethodAs shown in the flow schematic in Figure 3B, the
filtered sample was injected directly onto the system and delivered to SPE cartridge 1 (Mixed-Mode WAX-1) (1-2 position of the valve) using the left pump. This was for the elimination of anionic interferences. The cationic compounds—including diquat and paraquat—passed through, while anionic compounds and some non-polar interferences were retained. The compounds that passed through SPE cartridge 1 were delivered to SPE cartridge 2 (Mixed-Mode WCX-1) for enrichment of diquat and paraquat.
The analytical column was simultaneously equilibrated using the right pump. After the analytes were bound to SPE cartridge 2, the cartridge switched into the analytical flow path (6-1 position of the valve), and the enriched diquat and paraquat were separated on the analytical Acclaim Trinity P1 column.
The SPE cartridge 1 was simultaneously eluted in a gradient using the left pump to send the retained interferences to waste. After diquat and paraquat were completely eluted from SPE cartridge 2, the SPE cartridge 2 switched out of the analytical flow path and back to the SPE flow path (1-2 position of the valve), and those cationic compounds that were still retained were eluted to waste. Afterwards, both SPE cartridges 1 and 2 were re-equilibrated for the next injection.
Method Reproducibility, Linearity, and Detection LimitsMethod reproducibility was estimated by making
nine consecutive 2500 μL injections of a pond water sample spiked with a 2.5 μg/L of diquat and paraquat standard. Retention time and peak area reproducibilities are summarized in Table 2 and show good precision.
Calibration linearity for diquat and paraquat was investigated by making three consecutive injections of a mixed standard prepared at five different concentrations. The external standard method was used to establish the calibration curve and to quantify these herbicides in samples. Excellent linearity was observed from 1.0 to 20 μg/L when plotting concentration vs peak area.
Detection limits were calculated using the equation:
Detection limit = St(n – 1, 1 - α = 0.99)
Where S represents Standard Deviation (SD) of replicate analyses, n represents number of replicates, and t
(n – 1, 1 - α = 0.99) represents Student’s value for the
99% confidence level with n – 1 degrees of freedom. Method detection limits (MDL) were estimated using six consecutive injections of a drinking water sample spiked with 2.5 μg/L of each diquat and paraquat standard to determine S. Table 3 summarizes the method linearity and MDL data, which show excellent method linearity and sensitivity with detection limits well below those defined in the EPA method.
Table 2. Reproducibility of Peak Retention Time and Area
Analyte Retention Time RSD
Peak Area RSD
Concentration of Standard (µg/L)
Diquat 0.020 2.41 2.5
Paraquat 0.024 3.70 2.5
Table 3. Method Linearity Data and Method Detection Limits (MDL)
Analyte Regression Equation r2 Concentration Range of Standards (µg/L)
MDL, µg/L
Current Data Data reported in EPA Method 549.2
Diquat A = 0.3582 c - 0.0195 0.99971.0–20.0
0.10 0.72
Paraquat A = 0.4755 c - 0.2741 0.9989 0.12 0.68

38 Sensitive On-Line SPE–HPLC Determination of Paraquat and Diquat in Drinking and Environmental Waters
Sample AnalysisChromatograms of tap and pond water samples,
as well as the same samples spiked with a diquat and paraquat standard (2.5 μg/L each), are shown in Figures 6 and 7; the related data are summarized in Table 4. None of the samples had detectable diquat and paraquat. Recoveries for each standard in both samples ranged from 94 to 98%, thus indicating that the analysis method is accurate.
Figure 7. Determination of diquat and paraquat in pond water using the improved on-line SPE mode. Chromatograms: (a) pond water and (b) the same sample spiked with diquat and paraquat standards (2.5 µg/L each) with Panel A showing detection at 260 nm and Panel B at 311 nm. Other conditions are the same as in Figure 5.
Figure 6. Determination of diquat and paraquat in tap water using the improved on-line SPE mode. Chromatograms: (a) tap water and (b) the same sample spiked with diquat and paraquat standards (2.5 µg/L each) with Panel A showing detection at 260 nm and Panel B at 311 nm. Other conditions are the same as in Figure 5.
CONCLUSIONThis work describes an on-line SPE system using
two SPE cartridges to eliminate anionic interferences and enrich diquat and paraquat. The elimination of interferences in tap and pond water is sufficient, and baseline separation of diquat and paraquat on the Acclaim Trinity P1 column is achieved.
Efficient and sensitive analyses are achieved with the UltiMate 3000 Dual HPLC with on-line SPE configuration controlled by Chromeleon CDS software. The determination of diquat and paraquat in tap and pond water is simple, rapid, and sensitive.
Table 4. Analysis Results of Diquat and Paraquat in Water SamplesSample Tap Water Lake Water
Analyte Detected (µg/L)
Added (µg/L)
Found (µg/L)
Recovery (%)
Detected (µg/L)
Added (µg/L)
Found (µg/L)
Recovery (%)
Diquat ND 2.5 2.45 98 ND 2.5 2.40 96
Paraquat ND 2.5 2.40 96 ND 2.5 2.36 94
–2
10
mAU
ba
A
6.0 6.5 7.0 7.5 8.0 8.5 9.0 9.5 10.0–2
10
mAU
Minutes
b
B
a
28140
1
2
2
Peaks: 1. Diquat 2. Paraquat
ba
B
b
a
A
28141
–2
10
mAU
6.0 6.5 7.0 7.5 8.0 8.5 9.0 9.5 10.0–2
10
mAU
Minutes
1
2
Peaks: 1. Diquat 2. Paraquat
1

39 Sensitive On-Line SPE–HPLC Determination of Paraquat and Diquat in Drinking and Environmental Waters
REFERENCES1. Basic Information about Regulated Drinking Water
Contaminants; U.S. Environmental Protection Agency: Cincinnati, OH, 1997. http://water.epa.gov/drink/contaminants/basicinformation/diquat.cfm.
2. Quality of Water Intended for Human Consumption, L 330/42, Official Journal of the European Council Directive 98/83/EC (En), European Communities, November 1998.
3. Determination of Diquat and Paraquat in Drinking Water by Liquid-Solid Extraction and High-Performance Liquid Chromatography with Ultraviolet Detection; U.S. EPA Method 549.2, Revision 1.0; U.S. Environmental Protection Agency: Cincinnati, OH, 1997.
4. Waters Corporation, Paraquat/Diquat. Waters Column, Applications Notes, 1996, 4 (1), Milford, MA.
5. Agilent Technologies, Analysis of Paraquat and Diquat by HPLC. Publication Number 5966-1875E, 1997, Palo Alto, CA.
6. Hara, S.; Saski, N.; Takasa, D.; Shiotsuka, S.; Ogata, K.; Futagami, K.; Tamura, K. Rapid and Sensitive HPLC Method for the Simultaneous Determination of Paraquat and Diquat in Human Serum. Anal. Sci. 2007, 23, 523.
7. Lee, X.P.; Kumazawa, T.; Fujishiro, M.; Hasegawa, C.; Arinobu, T.; Seno, H.; Ishii, A.; Sato, K. Determination of Paraquat and Diquat in Human Body Fluids by High-Performance Liquid Chromatography/Tandem Mass Spectrometry. J. Mass Spectrom. 2004, 39, 1147.
8. Ito, M.; Hori, Y.; Fujisawa, M.; Oda, A.; Katsuyama, S.; Hirose, Y.; Yoshioka, T. Rapid Analysis Method for Paraquat and Diquat in the Serum Using Ion-Pair High-Performance Liquid Chromatography. Biol. Pharm. Bull. 2005, 28, 725.
9. Aramendía, M.A.; Borau, V.; Lafont, F.; Marinas, A.; Marinas, J.M.; Moreno, J.M.; Porras, J.M; Urbano, F.J. Determination of Diquat and Paraquat in Olive Oil by Ion-Pair Liquid Chromatography–Electrospray Ionization Mass Spectrometry (MRM). Food Chem. 2006, 97, 181.
10. Lee, H.S.; Kim, K.; Kim, J.H.; Do, K.S.; Lee, S.K. On-Line Sample Preparation of Paraquat in Human Serum Samples Using High-Performance Liquid Chromatography with Column Switching. J. Chromatogr., B 1998, 716, 371.
11. Castro, R.; Moyano, E.; Galceran, M. T. On-Line Ion-Pair Solid-Phase Extraction–Liquid Chromatography–Mass Spectrometry for the Analysis of Quaternary Ammonium Herbicides. J. Chromatogr., A 2000, 869, 441.
12. Waters Corporation, Determination of Diquat and Paraquat in Drinking Water by Liquid-Solid Extraction and High Performance Liquid Chromatography with Ultraviolet Detection (EPA Method 549.2). 2008, Milford, MA.
13. Dionex Corporation, Improved Separation of Diquat and Paraquat Using the Acclaim Mixed-Mode HILIC-1 Column. Application Brief 114, LPN 2577, 2010, Sunnyvale, CA.
14. Raquel, R.O.; Beatriz, C.G.; Concepcion, P.L.; Jesús, S.G.; Manuel, A.E. Simultaneous Determination of the Herbicides Diquat and Paraquat in Water. J. Chromatogr. Sci. 2006, 44, 539.
15. Tuzimski, T. Determination of Pesticides in Water Samples from the Wieprz-Krzna Canal in the Leczynsko-Wlodawskie Lake District of Southeastern Poland by Thin-Layer Chromatography with Diode Array Scanning and High-Performance Column Liquid Chromatography with Diode Array Detection. J. AOAC Int. 2008, 91, 1203.
16. Taguchi, V.Y.; Jenkins, S.W.D.; Crozie, P.W.; Wang, D.T. Determination of Diquat and Paraquat in Water by Liquid Chromatography-(Electrospray Ionization) Mass Spectrometry. J. Am. Soc. Mass Spectrom. 1998, 9, 830.
17. Dionex Corporation, Determination of Phenols in Drinking and Bottled Mineral Waters Using Online Solid-Phase Extraction Followed by HPLC with UV Detection. Application Note 191, LPN 1949, 2007, Sunnyvale, CA.

40 Sensitive On-Line SPE–HPLC Determination of Paraquat and Diquat in Drinking and Environmental Waters
18. Dionex Corporation, Determination of Polycyclic Aromatic Hydrocarbons (PAHs) in Edible Oils by Donor-Acceptor Complex Chromatography (DACC)-HPLC with Fluorescence Detection. Application Note 196, LPN 1998, 2008, Sunnyvale, CA.
19. Dionex Corporation, Determination of Polycyclic Aromatic Hydrocarbons (PAHs) in Tap Water Using On-Line Solid-Phase Extraction Followed by HPLC with UV and Fluorescence Detections. Application Note 213, LPN 2126, 2009, Sunnyvale, CA.
20. Ibáñez, M.; Picó, Y.; Mañes, J. On-Line Liquid Chromatographic Trace Enrichment and High-Performance Liquid Chromatographic Determination of Diquat, Paraquat and Difenzoquat in Water. J. Chromatogr., A 1996, 728, 325.
21. Ren, J.; Huang, C.L.; Zhao, G.D.; Jiang, K. Determination of Herbicides in Drinking Water by Solid Phase Extraction-Liquid Chromatography-Mass Spectrometry. Chin. Anal. Chem. 2001, 29, 876
22. Chen, Z.L.; Megharaj, M.; Naidu, R. On-Line Solid Phase Extraction of Pesticide Residues in Natural Water, Coupled with Liquid Chromatography and UV Detection, Using Various Sorbents. J. Liquid Chromatogr. & Rel. Tech. 2002, 25, 1779. http://www.informaworld.com/smpp/title~db=all~content=t713597273~tab=issueslist~branches=25 - v25.
23. Li, H.M.; Sun, S.W.; Shi, X.F. Analysis of Diquat and Paraquat by High Performance Liquid Chromatography. Chin. J. Anal. Chem. 2007, 35, 1499.
24. Dionex Corporation, Acclaim Trinity P1 LC Column, Sunnyvale, CA. http://www.dionex.com/en-us/products/columns/lc/specialty/acclaim-trinity/lp-81754.html (accessed Jan 15, 2011).
41 Quantitative Analysis of Nitrogen Mustard Hydrolysis Products as Ethanolamines
Application Note 271
Quantitative Analysis of Nitrogen Mustard Hydrolysis Products as Ethanolamines
INTRODUCTIONEthanolamines have been used as bio- and
environmental markers for nitrogen mustards (HN1, HN2, and HN3), which are listed on the Chemical Weapons Convention Schedule of Chemicals1 to monitor potential exposures. Direct quantification of exposure to HN1, HN2, and HN3 is difficult due to their reactivity, extent of metabolism, and short half-life.2 Nitrogen mustards readily react with biomolecules and are found in urine as the hydrolysis products: N-methyldiethanolamine (MDEA), N-ethyldiethanolamine (EDEA), and triethanolamine (TEA).3
Over half a million tons of ethanolamines are produced annually and used as emulsifying agents, detergents, ingredients in bactericides and cosmetics, and also in the pesticide manufacturing process.4 Inefficient removal and/or inappropriate disposal of ethanolamimes may cause adverse effects to the environment.
To monitor human and environmental exposure to nitrogen mustard, and also the removal of ethanolamines from industrial discharged waste, a quantitative analytical method is desired.
Reported methods for ethanolamines analysis include GC or LC separation with MS detection.8 The GC-MS methods involve labor-intensive derivatization which limits throughput, and reported LC methods usually suffer from poor retention and chromatographic separation with reversed-phase (RP) columns. A fast LC-MS/MS method reported the total separation of MDEA, EDEA, and TEA.6 However, the estimated retention factor (k) for the first-eluted TEA was less than one, making the method subject to possible interference from sample matrices, which was confirmed in the same report.
This study reports a rapid separation liquid chromatography (RSLC) tandem mass spectrometric (MS/MS) method for quantitative analysis of ethanolamines in environmental water samples. An Acclaim® Trinity™ P1 Mixed-Mode column featuring reversed-phase, anion-exchange, and cation-exchange retention mechanisms was used to provide retention and resolution for all analytes within 5 min. The MS detector was operated in multiple reaction monitoring (MRM) mode, and an isotope labeled internal standard (IStd) was used to provide selective and sensitive detection and to ensure quantification accuracy.

42 Quantitative Analysis of Nitrogen Mustard Hydrolysis Products as Ethanolamines
EQUIPMENTDionex UltiMate® 3000 RSLC system including:
DGP-3600RS dual gradient pump
WPS-3000TRS autosampler
TCC-3200RS column oven
CONDITIONSColumn: Acclaim Trinity P1 (2.1 × 100 mm, 3 μm, P/N 071389)
Mobile Phase: Isocratic, 90% Acetonitrile; 5% DI water; 5% Ammonium formate 100 mM, pH 3.7
Flow Rate: 0.6 mL/min
Temperature: 20 °C
Inj. Volume: 20 μL
MASS SPECTROMETRIC CONDITIONSSystem: AB SCIEX 4000 QTRAP® mass spectrometer
Interface: TurboV™ source with ESI
Curtain Gas (CUR): 15 psi
Collision Gas (CAD): Medium
IonSpray Voltage (IS): 4500 V
Temperature (TEM): 700 °C
Ion Source Gas 1 (GS1): 50 psi
Ion Source Gas 2 (GS2): 20 psi
Ihe: On
Acquisition Mode: Multiple reaction monitoring (MRM); refer to Table 1 for details on MRM scan parameters
Software: Analyst® 1.5 with DCMSLink™ 2.7.0 for Analyst. DCMSLink is a Chromeleon®- based software module providing the interface for controlling a wide range of Dionex chromatography instruments from different mass spectrometer software platforms.
Table 1. MRM Scan Parameters of Studied Analytes
Peak No. Analyte IDQ1
(m/z)Q3
(m/z)Time (ms)
DP (V)
CE (V)
CXP (V)
tR (min)
1 N-ethyldiethanolamineEDEA-1 134.1 116.0 75 51 21 8
1.8EDEA-2 134.1 72.0 25 51 25 4
2 N-methyldiethanolamineMDEA-1 120.1 102.0 75 46 19 8
2.3MDEA-2 120.1 58.0 25 46 27 4
3 TriethanolamineTEA-1 150.0 132.0 75 61 19 10
2.7TEA-2 150.0 88.0 25 61 23 6
4 DiethanolamineDEA-1 106.1 88.0 350 66 19 6
3.6DEA-2 106.1 70.0 50 66 21 4
5 Diethanolamine-d8 DEA-IS 114.1 78.0 100 53 24 6 3.6
6 EthanolamineEA-1 62.0 44.1 350 46 15 6
4.0EA-2 62.0 45.0 50 46 19 6
The 1st MRM of each analyte was used for quantiation, and the 2nd MRM was used for confirmation only.

43 Quantitative Analysis of Nitrogen Mustard Hydrolysis Products as Ethanolamines
Figure 1. Chemical structures of studied compounds.
OH
H2N
Ethanolamine (EA)CAS: 141-43-5Chemical Formula: C2H7NOExact Mass: 61.05Molecular Weight: 61.08
OHNH
HO
Diethanolamine (DEA)CAS: 111-42-2Chemical Formula: C4H11NO2
Exact Mass: 105.08Molecular Weight: 105.14
OHHO D DD DD
DD
D
Diethanolamine-d8 (DEA-IS)CAS: 103691-51-6Chemical Formula: C4H3D8NO2
Exact Mass: 113.13Molecular Weight: 113.18
OH
N
HO
N-Methyldiethanolamine (MDEA)CAS: 105-59-9Chemical Formula: C5H13NO2
Exact Mass: 119.09Molecular Weight: 119.16
OH
N
HO
N-Ethyldiethanolamine (EDEA)CAS: 139-87-7Chemical Formula: C6H15NO2
Exact Mass: 133.11Molecular Weight: 133.19
OH
N
HO
OH
Triethanolamine (TEA)CAS: 102-71-6Chemical Formula: C6H15NO3
Exact Mass: 149.11Molecular Weight: 149.19
27914
NH
PREPARATION OF SOLUTIONS AND REAGENTSChemical and Reagents
Standards of studied analytes were purchased from Sigma-Aldrich: ethanolamine (EA, CAS: 141-43-5, Aldrich: 411000), diethanolamine (DEA, CAS: 111-42-2, Fluka: 31589), N-methyldiethanolamine (MDEA, CAS: 105-59-9, Aldrich: 471828), N-ethyldiethanolamine (EDEA, CAS: 139-87-7 Aldrich: 112062), triethanolamine (TEA, CAS: 102-71-6, Fluka: 90279). Isotope labeled internal standard (IStd) diethanolamine-d
8 (DEA-IS)
was purchased from C/D/N Isotopes (CAS: 103691-51-6, D-5308). Figure 1 shows the chemical structures and related information.
Ammonium formate was purchased from Aldrich (516961). Acetonitrile was obtained from Burdick & Jackson (HPLC grade, AH015-4). Deionized water (18.2 MΩ-cm resistance) used in this study was obtained from a Millipore water station.
All chemicals were dissolved in deionized (DI) water to prepare individual primary stock solutions at 1000 μg/mL (ppm). Working stock solutions were prepared for each analyte by diluting primary stock solutions in DI water to 1 ppm, 100 ppb, 10 ppb, and 1 ppb to prepare calibration standards. A working stock solution for the internal standard was prepared at 100 ppb in deionized water for the preparation of calibration standards and to spike unknown samples. Calibration standards were prepared in DI water at 8 levels: 0.05 ppb, 0.1 ppb, 0.5 ppb, 1 ppb, 2 ppb, 5 ppb, 10 ppb, and 20 ppb. Each level contains all five target analytes with internal standard spiked at 1 ppb.
Sample PreparationSurface water samples were collected in HDPE
plastic bottles and stored under refrigeration at 4 °C until analysis. An aliquot of each water sample was spiked with internal standard at 1 ppb in a 1.5 mL autosampler vial and analyzed directly (filter the surface water samples when necessary, e.g., if suspended particles are observed).

44 Quantitative Analysis of Nitrogen Mustard Hydrolysis Products as Ethanolamines
RESULTS AND DISCUSSIONChromatography
As shown in Figure 2, all five target analytes were separated to baseline within 4.5 min. A retention factor (k') of 3.3 for the first-eluted EDEA indicated sufficient retention for all analytes and thus ensured the separation of targeted analytes from early eluting species. Different from general RP columns, the Acclaim Trinity P1 Mixed-Mode column features RP and ion exchange mechanisms, thus providing unique selectivity for ionizable organics. For the mixed-mode column, eluent strength is affected by organic modifier composition, buffer type, buffer pH, and buffer concentration. Refer to the column manual for more information on method development and modification. The conditions described in the experimental section were developed to achieve sufficient retention and total resolution for all target analytes with consideration of method throughput. Although the separation was completed within 4.5 min, the total run time was set at 8 min to elute any possible strongly retained species and thus improve method ruggedness.
Mass SpectrometryThe aim of this study was to develop a selective
and sensitive method for the direct analysis of trace level ethanolamines in environmental water samples, therefore, MS/MS instrumentation was selected for its sensitivity and ability to provide trace level detection. In addition, the selectivity of MS/MS instrumentation allows minimal sample preparation and cleanups. The MS/MS instrument was tuned and run in MRM mode. With continuous infusing of individual standards, each target analyte showed a strong protonated molecular ion [M+H]+ in positive ESI mode, and was used as the Q1MS precursor ion for MRM experiments. Product ions were selected using the Compound Optimization option from the instrument operating software. The three most intense MRM transitions were selected as MRM candidates for further selectivity evaluation. The MRM selectivity was evaluated by analyzing individual standards with respect to chromatographic separation and MS/MS detection with MRM candidate transitions.
Figure 2. MRM chromatograms of five ethanolamines by RSLC-MS/MS on an Acclaim Trinity P1 column with 0.5 ppb of each analyte.
The two final MRM transitions were selected that showed specific MS peaks with better intensity. It is worth noting that interference was observed for both DEA MRM channels from TEA and EDEA; and this can be explained by the source region fragmentation of TEA and EDEA: [M-C
2H
3OH+H]+, and [M-C
2H
4+H]+, respectively, which
have the identical m/z as the precursor ion of DEA at 106 m/z. This observation also indicated that chromatographic separation for EDEA, TEA, and DEA are crucial for quantification accuracy. The scan time for MRM scans was optimized to focus on quantitative MRMs and MRMs with less intensity in order to achieve better signal-to-noise ratio (S/N) for those mentioned MRMs, thus providing balanced overall method performance. The detailed MRM scan parameters are listed in Table 1. The TurboV with ESI ionization source parameters were optimized by a series of runs with varying parameter settings, and the optimum settings are listed in the experimental section.
4.2e4
1 2 3 4 5 8
Minutes
07 60
Quantitative MRM EDEA
MDEA TEA
DEA DEA-IS
EA
9.7e2 EA
- Noise -
S/N = 42
5.8e3 DEA
- Noise -
S/N = 178
1.5e4 DEA-IS
- Noise -
S/N = 491
2.9e4 MDEA
- Noise -
S/N = 353
2.9e4 TEA
0.48 - Noise -
S/N = 204
3.4e4 EDEA
- Noise -
S/N = 598
134 116
120 102
150 132
114 78
106 88
62 44
Intensity, cps
Intensity, cps
Intensity, cps
Intensity, cps
Intensity, cps
Intensity, cps
Intensity, cps
27915

45 Quantitative Analysis of Nitrogen Mustard Hydrolysis Products as Ethanolamines
Figure 4. Calibration curve of DEA (106.1→88.0 m/z) from 0.05 to 20 ppb using isotope labeled DEA-d8 as internal standard.
Method PerformanceAs mentioned earlier, the selectivity for this method
was evaluated by observing the specific MRM peaks at the specific retention times for each analyte. Although interference was observed in both MRM channels for DEA, ([M-C
2H
3OH+H]+ from TEA, and [M-C
2H
4+H]+
from EDEA), as seen in Figure 3, these interference peaks were chromatographically separated and thus did not affect the method selectivity for the accurate quantification of DEA. Carryover was evaluated by injecting a reagent blank (DI water) after the highest calibration standard at 20 ppb. No quantifiable peak was observed at the specific retention time for each analyte thus indicating no observed carryover for this method.
Linearity was evaluated and calibration curves were generated with duplicate assays of eight calibration standards from 0.05 ppb to 20 ppb using isotope labeled DEA-d
8 as the internal standard. Linear regression was
used to fit all experimental data with 1/x weighting factor. Excellent linearity was achieved from 0.05 ppb (except EA from 0.2 ppb) to 20 ppb with correlation of determination (r) greater than 0.999 for each analyte.
Figure 4 shows the calibration curve for DEA as an example. Run-to-run precision and accuracy was evaluated by seven replicate assays of the 0.5 ppb standard and measured by RSD and %Accuracy (calculated by Observed Amount/Specified Amount × 100%). Method detection limit (MDL) was statistically calculated for each analyte using the standard deviation obtained from the seven replicate analysis of a 0.5 ppb standard following this equation: MDL = s × t where s is the standard deviation and t is the Student’s t at 99% confidence interval. Excellent precision was observed with RSDs ranging from 3.26% (MDEA) to 5.49% (TEA). The calculated MDL ranged from 0.050 ppb (MDEA) to 0.092 ppb (TEA).
Figure 3. Chromatographically separated MRM interferences for DEA.
Max. 2.4e5 cps.
10 2 3 4 5 6 7Minutes
0
2.1e4
Inten
sity,
cps
Interferencefrom TEA
Interferencefrom EDEA
DEA
8
27916
DEA-1: 106.1 Linear Regression 1/x weighting y = 0.703 x + 0.00759 (r = 0.9999)
0 2 4 6 8 10 12 14 16 18 20
Analyte Conc. [ng/mL=ppb]
0
14.4
Analy
te Ar
ea/IS
Are
a
27917
88 m/z

46 Quantitative Analysis of Nitrogen Mustard Hydrolysis Products as Ethanolamines
Figure 5. MRM chromatograms of five ethanolamines at LLOQ.
The lower limit of quantification (LLOQ) was determined as the lowest calibration standard consistently showing S/N greater than 10. The LLOQ for all analytes were reported as 0.05 ppb, except EA, which was 0.2 ppb. Figure 5 shows the MRM chromatograms of each analyte at LLOQ. The lowest reporting limit (LRL) for each analyte is the lowest concentration that can be reported by this method and was determined as the higher concentration between MDL and LLOQ. The results for method performance evaluations are summarized in Table 2.
Analysis of Water SamplesThis method was used to analyze local municipal
water samples, a local creek water sample, and a Nevada lake water sample. Following the procedures in the Experimental section, these samples were spiked with the internal standard and analyzed directly. None of the tested samples showed concentrations of target analytes above the lowest reporting limit, and thus the local creek water and the Nevada lake water were used as blank matrices to evaluate the method recovery. Each matrix was spiked with ethanolamines at three levels: 0.5 ppb, 5 ppb, and 20 ppb with three replicates at each level, and the internal standard was spiked at 1 ppb.
Table 2. Calibration, RSD, Detection, and Reporting Limits
Analytes Calibration r Meana Accuracya (%) RSDa MDLa LLOQ (ppb) S/N at LLOQ LRLb
EDEA y = 4.64x + 0.00242 0.9993 0.463 97.57 3.58 0.052 0.05 106.8 0.052
MDEA y = 4.73x - 0.0109 0.9996 0.484 96.77 3.26 0.050 0.05 54.5 0.050
TEA y = 4.22x + 0.169 0.9994 0.530 106.0 5.49 0.092 0.05 26 0.092
DEA y = 0.703x + 0.00759 0.9999 0.508 101.5 3.85 0.061 0.05 24.9 0.061
EA y = 0.217x - 0.00756 0.9990 0.510 101.9 5.34 0.085 0.20 13.1 0.20
All concentrations were in the unit of ppb.a Calculated based on seven replicate assays of a standard at 0.5 ppb.b LRL, Lowest reporting limit: the lowest concentration can be reported by this method, and is the higher concentration between MDL and LLOQ.
EA
- Noise -
S/N = 13 5.0e2
EA @ 0.2 ppb
1.3e3DEA
- Noise -
S/N = 25 DEA @ 0.05 ppb
- Noise -
S/N = 55 MDEA3.8e3
MDEA @ 0.05 ppb
3.8e3
- Noise -
S/N = 107EDEA
EDEA @ 0.05 ppb
2 3 4 5Minutes
6.5e3
Intensity, cps
TEA
- Noise -
S/N = 26
TEA @ 0.05 ppb
Intensity, cps
Intensity, cps
Intensity, cps
Intensity, cps
27918

47 Quantitative Analysis of Nitrogen Mustard Hydrolysis Products as Ethanolamines
As summarized in Table 3, consistent recoveries were observed for most analytes at different levels in two different matrices. However, differences in concentration and matrices showed significant effects on the recovery of EA: 37.8% for 0.5 ppb vs 61.9% for 5 ppb and 70.0% for 20 ppb in Matrix A; not detected for 0.5 ppb vs 20.2% for 5 ppb and 22.8% for 20 ppb in Matrix B.
Higher recovery was observed for samples spiked at higher levels, and prepared in Matrix A. It is worth noting that the recovery for DEA was observed near 100%, indicating the benefit of using isotope labeled analogues as an internal standard correcting the matrix effect on that specific analyte. The deviation of recoveries from 100% indicates the different extents of matrix effects on each analyte, i.e., significant relative signal enhancement for EDEA and MDEA.
It was also noticed that EA exhibited short-term instability, although the samples were placed in the thermally controlled autosampler at 10 °C and sheltered from light. The duplicate assays of a batch of samples run on the following day of the sample preparation showed no detectable EA, suggesting immediate analysis after sample preparation is required. The stability of prepared sample in target matrices should also be evaluated to avoid degradation.
CONCLUSIONAn RSLC-MS/MS method for quantitative analysis
of five ethanolamines was developed and described. By using a mixed-mode analytical column and selective MRM MS/MS detection, this method showed significant improvements over previously reported methods with minimum sample preparation, total chromatographic
resolution, capability of sub-ppb level quantification, and high throughput. Application of this method to the analysis of surface waters was demonstrated and showed no quantifiable amounts above the LRLs. Matrix effects and recovery were evaluated using two surface water matrices and the results indicated better quantitation accuracy for DEA by using an isotope labeled analogue as an internal standard.
REFERENCES1. Conference on Disarmament. The Convention on
the Prohibition of the Development, Production, Stockpiling and Use of Chemical Weapons and on their Destruction. United Nations Document CD/ 1170, Geneva, Switzerland, 1992.
2. Black, R.M.; Read, R.W., J. Chromatogr., A 1998, 449, 261–270.
3. Opresko, D.M.; Young, R.A.; Faust, R.A.; Talmage, S.S.; Watson, A.P.; Ross, R.H.; Davidson, K.A.; King, J., In Reviews of Environmental Contamination and Toxicology, Vol. 156, G.W. Ware, Ed. Springer, New York, NY, 1998, 127–133.
4. Edser, C., Focus on Surfactants 2004, 7, 1–2.5. Ohsawa, I.; Seto, Y.; J. Chromatogr., A 2006, 1122,
242–248.6. Lemire, S.W.; Barr, J.R.; Ashley, D.L.; Olson, C.;
Hayes, Y., J. Anal. Toxicol. 2004, 28, 320–326.7. Campo, P.; Suidan, M.; Chai, Y.; Davis, J. Talanta
2010, 80, 1110–1115.8. Peru, K.; Headley, J.; Doucette, W.; Rapid Commun.
Mass Spectrom. 2004, 18, 1629–1634.9. Dionex Document No. 065306-01, Product Manual
for Acclaim Trinity P1 Columns, available online at http://www.dionex.com/en-us/webdocs/75675-Man-065306-01-ACCLAIM-TRINITY-P1-Feb09.pdf
Table 3. Recoveries of Ethanolamines in Two Water Matrices
Analyte
Matrix A: Local Creek Water Matrix B: Nevada Lake Water
0.5 ppb 5 ppb 20 ppb 0.5 ppb 5 ppb 20 ppb
% RVYa
% RSD
% RVYa
% RSD
% RVYa
% RSD
% RVYa
% RSD
% RVYa
% RSD
% RVYa
% RSD
EDEA 136.0 0.78 135.6 1.81 131.3 1.34 133.8 1.76 123.9 1.03 118.3 1.71
MDEA 145.9 1.87 137.2 1.83 142.2 2.34 140.7 0.70 127.5 1.97 127.8 2.01
TEA 83.9 2.08 86.8 1.83 95.0 1.58 79.3 4.92 85.4 0.81 93.7 0.82
DEA 98.5 1.54 101.8 0.52 100.2 0.29 103.3 3.89 100.5 0.83 101.8 0.28
EA 37.8 1.83 61.9 1.66 70.0 0.71 N/A N/A 20.2 8.65 22.8 1.08 aRecovery, mean of three replicate recoveries calculated by Observed Amount /Specified Amount × 100%.

48 Sensitive and Fast Determination of Endothall in Water Samples by IC-MS/MS
Application Note 263
Sensitive and Fast Determination of Endothall in Water Samples by IC-MS/MS
INTRODUCTIONEndothall is a widely used herbicide for both
terrestrial and aquatic weeds. Major uses of endothall include defoliation of cotton, the control of aquatic weeds and algae, and as a dessicating agent for lucerne and potatoes. Human exposure to endothall in excess of the maximum contamination level (MCL) may cause gastrointestinal problems. Endothall is regulated by the United States Environmental Protection Agency (EPA) with an MCL at 0.1 mg/L or 100 ppb for drinking water;1 and the California EPA developed the Public Health Goal (PHG) of 0.58 mg/L or 580 ppb for this compound.2
Current analytical methods for quantitation of endothall in water samples are described in EPA method 548.13 as gas chromatography with mass spectrometry or flame ionization detection (GC-MS or GC-FID). These methods involve ion-exchange solid phase extraction, sample enrichment, and dimethyl ester derivatization, followed by a 20 min GC separation and MS or FID detection.
This study describes the direct analysis of trace-level endothall in water samples by ion chromatography mass spectrometry (IC-MS). Water samples were directly injected without labor-intensive sample preparation and chromatographic separation was achieved in 10 min, thus significantly improving method throughput. An MS/MS instrument was operated in selected reaction monitoring (SRM) mode requiring minimal sample cleanup and ensuring highly sensitive (low ppb) and selective quantitation. Isotope labeled glutaric acid (glutaric acid–d
6) was used as an internal standard to ensure
quantitation accuracy. This method has been successfully used for quantification of endothall in various water matrices including fresh creek water, lake water, and high salt content lake water. Method performance parameters such as linearity, calibration range, precision, accuracy, detection limits, and recovery were evaluated and will be presented in this application note.

49 Sensitive and Fast Determination of Endothall in Water Samples by IC-MS/MS
MASS SPECTROMETRIC CONDITIONSInterface: Negative Electrospray Ionization (ESI)
Spray Voltage: 3500 V
Sheath Gas: 50 Arbitrary units
Auxiliary Gas: 30 Arbitrary units
Capillary Temp.: 350 °C
Collision Gas: Argon at 1.5 mTorr
SRM Acquisition: 4.2 to 6 min
Operating Mode: Selected Reaction Monitoring (SRM)
Analyte Parent Ion Product Ion Collision Energy (m/z) (m/z) (V)
Endothall-1 185 141 17
Endothall-2 185 123 19
Glutaric Acid-d6 137 74 21
REAGENTS AND STANDARDSEndothall standard solution, 1 mg/mL in methanol
(AccuStandard P/N P-183S-10XT)
Isotope labeled internal standard (IStd) glutaric acid-d6
(C/D/N Isotopes P/N D-5227)
Seven anion standard solution with various concentrations from 20 ppm (fluoride) to 150 ppm (sulfate and phosphate) (Dionex P/N 056933)
Acetonitrile (HPLC grade, Burdick & Jackson)
Deionized (DI) water with 18.2 MΩ-cm resistance (Millipore Coporation)
The chemical structures of endothall and isotope labeled internal standard glutaric acid-d
6 are shown in Figure 1.
OH
OHO
O
O
HO OH
OO
D
DD
D DD
EndothallChemical Formula: C8H10O5Exact Mass: 186.05Molecular Weight: 186.16
Glutaric Acid - d6Chemical Formula: C5H2D6O4Exact Mass: 138.08Molecular Weight: 138.15
28088
Figure 1. Chemical structures of studied compounds.
EQUIPMENTDionex ICS-2000 or ICS-2100 Reagent-Free™ Ion
Chromatography (RFIC™) system
TSQ Quantum Access™ triple quadrupole mass spectrometer
XCalibur® 2.1 with integrated Dionex Chromatography Mass Spectrometry Link (DCMSLink ™) 2.8 for instrument control, data acquisition and processing, and report generation
Two Dionex AXP-MS auxiliary pumps
CHROMATOGRAPHIC CONDITIONS
Column: IonPac® AS16 and AG16 hydroxide selective anion-exchange columns (2 mm)
Column Temp.: 30 °C
Flow Rate: 400 μL/min
Eluent Source: EGC II KOH with Continuously- Regenerated Anion Trap Column (CR-ATC), 2 mm
Eluent: Hydroxide gradient
Time/min Conc./mM –4.0 15
0.0 15
5.0 15
6.0 80
9.0 80
9.5 15
10.0 5
Solvent: 200 μL/min acetonitrile delivered by an AXP-MS pumpDetection: 1st detector: Suppressed Conductivity with Anion Self-Regenerating Suppressor® (ASRS®), 2 mm (external water at 0.5 mL/min delivered by an AXP-MS pump) 2nd detector: TSQ Quantum Access
Mass Spectrometer

50 Sensitive and Fast Determination of Endothall in Water Samples by IC-MS/MS
STANDARD PREPARATIONDilute endothall standard in DI water to 10 ppm and
1 ppm as the two working standards to prepare calibration standards. Dilute the internal standard stock solution (1000 ppm) to 10 ppm for calibration standard preparation and for spiking unknown samples.
Prepare calibration standards by serial dilution from the working standards at 10 concentrations: 1 ppb, 2 ppb, 5 ppb, 10 ppb, 20 ppb, 50 ppb, 100 ppb, 200 ppb, 500 ppb, and 1000 ppb with the IStd spiked at 100 ppb for each concentration with the presence of diluted (100× dilution) seven common anions (fluoride 0.2 ppm, chloride 0.3 ppm, nitrite 1 ppm, bromide 1 ppm, nitrate 1 ppm, phosphate 1.5 ppm, and sulfate 1.5 ppm).
SAMPLE PREPARATIONGround water samples were collected from a local
creek and Lake Tahoe west shore. A lake water sample with a high salt content was kindly provided by a customer. These samples were spiked with IStd at 100 ppb and injected directly for ion chromatography tandem mass spectrometry (IC-MS/MS) quantification. (For samples with observed particulates, filtration is required prior to injection.) The salty water sample was diluted with DI water at a 1 to 10 ratio (v/v) due to the observed high concentration of ionic species.
RESULTS AND DISCUSSIONChromatography
As shown in Figure 1, endothall is a dicarboxylic acid. IC is the preferred separation technique for ionic or ionizable compounds; therefore, it was selected in this study for the separation of endothall from inter-ferences. For IC-MS analysis, the major interferences are inorganic matrix ions such as chloride and sulfate, and other ionizable organics at high concentration. The goals of chromatographic separation were to achieve sufficient chromatographic resolution for endothall from common anions, and to have a short run time to improve method throughput.
In this study, several high-capacity anion-exchange columns were evaluated for their selectivity; namely, the IonPac AS20, AS19, and AS16 columns. The IonPac AS16 column exhibited the best performance by: 1) providing a wide elution window for endothall between chloride and sulfate, and 2) requiring substantially less chromatographic run time than the IonPac AS19 column. Note that the IonPac AS19 column would be a better choice for simultaneous quantification of endothall and seven anion profiling, as it provided complete chromatographic resolution for all analytes (Figure 2).
Endothall + 7Anions
1.0IonPac AS19
EndothallCarbonate
Sulfate
0 5 10 15 20
0.8
Minutes
IonPac AS16
Endothall
Carbonate
Sulfate
0.9
µS
IonPac AS20Endothall +Carbonate Sulfate
µS
µS
28089
Figure 2. Column selection for endothall separation.

51 Sensitive and Fast Determination of Endothall in Water Samples by IC-MS/MS
Figure 3. Conductivity and SRM chromatograms of endothall spiked in different samples. Left, 5 ppb endothall spiked in Lake Tahoe water; right, 50 ppb endothall in salty lake water with 10-fold dilution.
Matrix: Lake Tahoe Water
100
0
Relat
ive A
bund
ance
5.38Glutaric Acid - d6
6.84E4
3.06
0 1 2 3 4 5 6 7 8 90
60
6.31
3.87 5.512.555.24
Conductivity
0
1005.51
1.08E5 Endothall
0 1 2 3 4 5 6 7 8 9
Minutes Minutes
0
5503.16
5.89
3.872.54 5.51
Conductivity
0
100 5.366.69E4
0
100 5.429.23E4 Endothall
Matrix: Highly Salty Lake Water (10× dilution)
28090
µSµS
Relat
ive A
bund
ance
Re
lative
Abu
ndan
ce
Relat
ive A
bund
ance
SRM: 185 141 m/z
SRM: 137 74 m/z
SRM: 185 141 m/z
SRM: 137 74 m/z
Glutaric Acid - d6
MASS SPECTROMETRIC CONDITIONSSystem: TSQ Quantum Access triple quadrupole mass spectrometerInterface: Negative Electrospray Ionization (ESI) Spray Voltage: 3500 VSheath Gas: 50 Arbitrary unitsAuxiliary Gas: 30 Arbitrary unitsCapillary Temp.: 350 °CCollision Gas: Argon at 1.5 mTorrSRM Acquisition: 4.2 to 6 minOperating Mode: Selected Reaction Monitoring (SRM)Analyte Parent Ion Product Ion Collision Energy (m/z) (m/z) (V)Endothall-1 185 141 17Endothall-2 185 123 19Glutaric Acid-d6 137 74 21
CHROMATOGRAPHIC CONDITIONS System: ICS-2000 or ICS-2100 RFIC systemColumn: IonPac AS16 and AG16 (2 mm)Column Temp.: 30 °CFlow Rate: 400 µL/minEluent Source: EGC II KOH with CR-ATC (2 mm)Eluent: Hydroxide gradient Time/min Conc./mM –4.0 15 0.0 15 5.0 15 6.0 80 9.0 80 9.5 15 10.0 5Solvent: 200 µL/min acetonitrile delivered by an AXP-MS pumpDetection: 1st detector: Suppressed Conductivity using ASRS 300 (2 mm) (external water at 0.5 mL/min delivered by an AXP-MS pump) 2nd detector: TSQ Quantum Access Mass Spectrometer

52 Sensitive and Fast Determination of Endothall in Water Samples by IC-MS/MS
Mass SpectrometryA TSQ Quantum Access triple quadrupole mass
spectrometer was selected in this study for sensitivity and selectivity, which allowed minimum sample preparation such as cleanup and enrichment. A matrix diversion valve was used to divert high concentrations of inorganic anions to waste to prevent MS entrance fouling and to maintain long-term system stability. It is important to adjust the diversion window for specific matrices to ensure the analyte signal is collected by the MS and inorganic salts are diverted to waste.
As seen in Figure 3, two different matrices, Lake Tahoe water (LTW) and highly salty lake water (HSW), were spiked with endothall at 5 ppb and analyzed by this method. The HSW is a highly salty water sample (~1000 ppm sulfate, estimated by conductivity peak area), and the retention time of endothall in this 10× diluted matrix was slightly shifted (0.09 min earlier than in the LTW matrix). In addition, the retention time for sulfate shifted significantly earlier by 0.42 min; thus, the diversion window had to be adjusted accordingly to avoid MS entrance contamination. In rare situations where dilution of the original sample is not applicable, such as when endothall is present in very low concentration in a high salt matrix, the gradient program will have to be adjusted, i.e. decrease the gradient slope from 5 to 9 min, in order to increase the resolution of endothall from sulfate (as seen in Figure 2).
The quantitation of endothall was carried out in SRM mode, the precursor ion was observed as the deprotonated molecular ion [M-H]– at 185 m/z, and the predominant product ion was observed as [M-H-CO
2]–
at 141 m/z and used as the quantitative SRM transition; another characteristic product ion was also observed as [M-H-CO
2-H
2O]– at 123 m/z with less intensity and was
used as a confirmative SRM transition. Isotope labeled glutaric acid-d
6 was used as the internal standard due to
its similarity in chemical structure and chromatographic retention to endothall.
Because the IC eluent is 100% aqueous post-suppression, acetonitrile was introduced as the desolvation solvent to assist desolvation/ionization and was delivered by an auxiliary pump at 0.2 mL/min.
Figure 4. Calibration curve of endothall using glutaric acid-d6 as
an internal standard.
Method PerformanceTypical conductivity and SRM chromatograms are
shown in Figure 3. Sulfate, chloride, and nitrate were observed as the main anionic species in tested ground water, and were chromatographically separated from the target analyte, endothall, and the internal standard, glutarate-d
6. The MS/MS instrument operated in
SRM mode provided sensitive and selective detection: each target analyte was observed as a single peak in each SRM channel with excellent intensity.
This method was used to determine endothall in various water samples mentioned in the Sample Preparation section, and no quantifiable level of target analyte was observed in any of the tested samples. Thus, these three matrices were used to evaluate the recovery from matrices.
Method performance was evaluated against quality parameters such as linearity, reproducibility, precision, accuracy, detection limits, and recovery from matrix. Calibration was performed by analyzing calibration standards at 10 concentrations from 1 to 1000 ppb using internal calibration with IStd at 100 ppb in each standard. Excellent linearity was achieved through three orders of magnitude with the coefficient of determination (r2) at 0.9996. The calibration curve is shown in Figure 4, and the insert shows the calibration curve at lower concentrations.
Endothall
y = 0.113724+0.298745*x r2 = 0.9996Weighting factor: 1/x1–1000 ppb
0 200 400 600 800 1000Concentration (ppb)
0
50
100
150
200
250
300
Area
Rati
o
0 10 20 30 40 500
4
8
12
16
28091

53 Sensitive and Fast Determination of Endothall in Water Samples by IC-MS/MS
Precision and accuracy were evaluated by seven replicate assays of a standard at 5 ppb, with the calculated mean at 4.89 ppb (97.8% accuracy) with standard deviation at 0.18 (3.63% RSD). The method detection limit (MDL) was calculated following the equation MDL= s × t, where s is the standard deviation and t is the Student’s t at 99% confidence interval. The calculated MDL is 0.56 ppb in DI water (n =7).
Recovery was evaluated by spiking three samples (Creek Water, LTW, and a HSW [10-fold dilution])at two levels: 5 ppb and 500 ppb with IStd spiked at 100 ppb. The results are summarized in Table 1.
CONCLUSIONA fast and sensitive IC-MS/MS method was
presented for the quantitative determination of trace level endothall in environmental water samples. The detection limit was estimated at 0.56 ppb, and linear response was observed from 1 ppb to 1000 ppb. The significantly improved sensitivity enables direct analysis of water samples without labor intensive sample enrichment and derivatization. The total chromatographic run time was halved from the 20 min GC run in EPA Method 548.1.
REFERENCES1. United States Environmental Protection Agency,
Basic Information about Endothall in Drinking Water. http://water.epa.gov/drink/contaminants/basicinformation/endothall.cfm (accessed September, 2010).
2. Pesticide and Environmental Toxicology Section, Office of Environmental Health Hazard Assessment, California Environmental Protection Agency, Public Health Goal for ENDOTHALL in Drinking Water, December 1997.
3. United States Environmental Protection Agency, Method 548.1: Determination of Endothall in Drinking Water by Ion-Exchange Extraction, Acidic Methanol Methylation and Gas Chromatography/Mass Spectrometry. Available from http://www.epa.gov/waterscience/methods/method/files/548_1.pdf (accessed January 31, 2011).
Table 1. Recovery of Endothall from Three MatricesSample 5 ppb 500 ppb
Mean Standard Deviation % Recovery Mean Standard Deviation % Recovery
Creek Water 5.00 0.15 100 551 31.6 110
LTW 5.20 0.08 104 540 7.32 108
HSW 4.76 0.06 95.1 535 50.3 107

54 Improved Separation of Diquat and Paraquat Using the Acclaim Mixed-Mode HILIC-1 Column
INTRODUCTIONMixtures of diquat and paraquat–quaternary
ammonium herbicides–are widely used to control crop and aquatic weeds. The structures of these herbicides are shown below. High-performance liquid chromatography (HPLC) is one commonly used method for the determination of diquat and paraquat. The U.S. Environmental Protection Agency (EPA) has published EPA Method 549.2, a method for the analysis of these herbicides in aqueous samples.1
The separation of diquat and paraquat is difficult due to their very weak retention on a conventional reversed-phase (RP) C18 column; therefore, ion-pairing reagents are added to the mobile phase.1-4 These reagents are also added to improve peak shape.5 A stationary phase that may be used in the hydrophilic interaction liquid chromatography (HILIC) mode can be used for this separation in the absence of an ion-pairing reagent.6 However, the only separation that shows a baseline separation of diquat and paraquat is the one reported in reference 5 that uses a special column and a commercial buffer.
Br-
Br-N+
N+ H3C–+N
2Cl-
Paraquat
N+–CH3
Improved Separation of Diquat and Paraquat Using the Acclaim Mixed-Mode HILIC-1 Column
Application Brief 114
The Acclaim® Mixed-Mode HILIC-1 column, based on high-purity spherical silica functionalized with a silyl ligand containing both hydrophilic and hydrophobic functionalities, may be used either in HILIC mode (high organic conditions) or RP mode (high aqueous conditions). In HILIC mode, this column has been used for the determination of urea and allantoin in cosmetics.7
The work shown here describes an efficient method for the baseline separation of diquat and paraquat with improved peak shape. Experiments performed on an Acclaim Mixed-Mode HILIC-1 column (3.0 × 150 mm, 3 μm) show that when increasing the pH value of mobile phase buffer from 3.5 to 5.5 or decreasing the proportion of organic mobile phase (methanol), both retention time (t
R) and peak resolution (R
s) increase,
whereas peak symmetry (As) decreases. This method
uses the column in RP mode with an ammonium formate (160 mM, pH 4.7)–methanol (87:13, v/v) mobile phase to separate diquat and paraquat. Figure 1 shows the chromatogram with baseline separation (R
s = 3.2).
EQUIPMENT Dionex UltiMate® 3000 RSLC system, including:
HPG 3400RS Pump
WPS 3000RS Autosampler
TCC-3000RS Thermostatted Column Compartment
DAD-3000RS UV-vis Detector
Chromeleon® Chromatography Data System (CDS) software Version 6.80 SR9

55 Improved Separation of Diquat and Paraquat Using the Acclaim Mixed-Mode HILIC-1 Column
Restek Corporation, Simple, Sensitive HPLC/UV Analysis for Paraquat and Diquat, Using High-Recovery Solid Phase Extraction and an Ultra Quat HPLC Column. Applications Note 580006, 2006, Bellefonte, PA.
Waters Corporation, Determination of Diquat and Paraquat in Drinking Water by Liquid-Solid Extraction and High Performance Liquid Chromatography with Ultraviolet Detection (EPA Method 549.2). 2008, Milford, MA.
Dionex Corporation, Determination of Urea and Allantoin in Cosmetics Using the Acclaim Mixed-Mode HILIC Column. Application Note, LPN 2098, 2008, Sunnyvale, CA.
REFERENCESEnvironmental Protection Agency Determination of
Diquat and Paraquat in Drinking Water by Liquid-Solid Extraction and High Performance Liquid Chromatography with Ultraviolet Detection; U.S. EPA Method 549.2, Revision 1.0; U.S. Environmental Protection Agency: Cincinnati, OH, 1997.
Waters Corporation, Paraquat/Diquat. Waters Column, Applications Notes, 1996, 4 (1), Milford, MA.
Agilent Technologies, Analysis of Paraquat and Diquat by HPLC. Publication Number 5966-1875E, 1997, Palo Alto, CA.
Hara, S.; Saski, N.; Takasa, D.; Shiotsuka, S.; Ogata, K.; Futagami, K.; Tamura, K. Rapid and Sensitive HPLC Method for the Simultaneous Determination of Paraquat and Diquat in Human Serum. Anal. Sci., 2007, 23, p 523.
Column: Acclaim Mixed-Mode HILIC-1, 3.0 × 150 mm, 3 µm (P/N 070090)Temperature: 25 °CMobile Phase: 160 mM HCOONH4 (adjusted to pH 4.7 with HCOOH)–methanol (87:13, v/v)Flow Rate: 0.425 mL/minInj. Volume: 10 µLUV Detection: 257 nm for paraquat and 308 nm for diquat
27653
0 1 2 3 4 5-2
0
12
Minutes
mAU
12
Wav
eleng
th C
hang
e
Diquat
-10
60
210 300 400
%
nm
310.8
220.1 Paraquat
-10
60
210 300 400
%
nm
258.9 212.5
Figure 1. Chromatogram of diquat (peak 1) and paraquat (peak 2) (1.0 µg/mL each) with the UV spectrum for each.

56 Determination of Glyphosate by Cation-Exchange Chromatography with Postcolumn Derivatization
Application Note 109
After direct injection of the sample onto the col-umn, glyphosate and AMPA are separated with apotassium phosphate buffer. After separation, theanalytes pass through a postcolumn reaction systemwhere they are reacted to form fluorescent derivatives,which are then quantified using fluorescence detection.
The analytical column specified in this applicationnote is quality controlled by the vendor to ensurereliable glyphosate analysis. The reagents specified arealso quality controlled to ensure freedom from back-ground interferences. When analyzing a 50 µL drinkingwater sample, as shown in Figure 1, method detectionlimits meet or exceed those cited in U.S. EPA Method547. See the Results section for method performancedata.
EQUIPMENTDionex DX 500 HPLC system consisting of:
GP40 Gradient PumpPostcolumn Derivatization Module (Pickering
PCX-5100, Pickering Laboratories)Jasco® FP-920 Fluorescence Detector (Jasco)Jasco Y-46 Emission Filter (Jasco)Eluent Organizer
PeakNet Chromatography Workstation withUI20 Universal Interface
Determination of Glyphosate by Cation-ExchangeChromatography with Postcolumn Derivatization
INTRODUCTIONGlyphosate is a broad-spectrum herbicide with low
mammalian toxicity. The herbicide’s widespread usemakes it a possible contaminant in ground water andeventually drinking water. The U.S. EPA has estab-lished Method 547 to monitor glyphosate in drinkingwater.1
Alternative chromatographic methods for theanalysis of glyphosate, whether gas or liquid chromatog-raphy, usually require precolumn derivatization of theglyphosate.2–6 Precolumn derivatization is tedious andcan be subject to interferences. Nonchromatographicmethods, such as differential pulse polarography,demonstrate poor recoveries and inadequate detectionlimits.7
This application note details a convenient chroma-tographic method for the analysis of glyphosate and itsprimary metabolite, aminomethylphosphonic acid(AMPA). Since glyphosate has been shown to rapidlydecompose in chlorinated water, AMPA is the speciesmost likely to be found in drinking water matrices.
Sample Preparation and PreservationDrinking water samples should be collected in clean
glass bottles and sealed using caps with PTFE-facedsilicone septa. Samples should be filtered prior to injec-tion and can be analyzed without any further treatment.
Summary of Chromatographic MethodThe method achieves a high degree of sensitivity
and selectivity by combining postcolumn derivatizationwith fluorescence detection. It is designed to be consis-tent with U.S. EPA Method 547.

57 Determination of Glyphosate by Cation-Exchange Chromatography with Postcolumn Derivatization
Figure 1 Drinking water fortified with glyphosate andAMPA. Injection volume = 50 µL.
Figure 2 10-µL injection of glyphosate and AMPA standards.
11427 114280 5 10 15 20
Minutes
0.002
RFU
0.000
12
0 5 10Minutes
15 20
0.015
RFU
0.000
1
2
Peaks: 1. Glyphosate 2.5 mg/L2. AMPA 2.5
Peaks: 1. Glyphosate 43.8 µg/L2. AMPA 38.0
adjustment as follows to optimize detector response:after the chromatographic system is fully equilibrated,inject 10 µL of glyphosate test mixture (Pickering P/N1700-0080), as shown in Figure 2. If area counts forAMPA and glyphosate differ significantly, add 5%sodium hypochlorite solution to the oxidizing reagentin 20-µL increments until the peak areas areapproximately equal.
OPA Reagent (Reagent 2):Pour the contents of the OPA diluent into a clean
reagent bottle that has been rinsed with methanol.Sparge the diluent for approximately 10 minutes toremove any oxygen.
The remaining steps should be accomplishedquickly since the prepared reagents are sensitive tooxygen and light: weigh approximately 100 mg ofo-phthalaldehyde into a small beaker, dissolve in10 mL of methanol, and add to the OPA diluent. Rinsethe beaker with 1 or 2 mL of methanol and add therinsate to the diluent. Add 2 g of Thiofluor to thereagent bottle, replace the cap, and sparge for 1 or 2additional minutes. Swirl the bottle gently to ensurecomplete mixing.
REAGENTS5 mM Potassium phosphate, pH 2.0 (Glyphosate Eluent,
Pickering P/N K200)
5 mM Potassium hydroxide (Glyphosate ColumnRegenerant, Pickering P/N RG019)
Hypochlorite diluent (Pickering P/N GA116)
5% Sodium hypochlorite solution
Sodium borate buffer diluent (Pickeringo-Phthalaldehyde Diluent, P/N GA104)
OPA, Chromatographic grade (Pickeringo-Phthalaldehyde, P/N O120)
Methanol, Optima™ grade or equivalent(Fisher Scientific)
Mercaptan reagent (Thiofluor™, PickeringP/N 3700-2000)
PREPARATION OF REAGENTS AND STANDARDSOxidizing Reagent (Reagent 1):
Pour one bottle of the pre-prepared hypochloritediluent into a clean reagent reservoir that has beenrinsed with methanol. Add 100 µL of the 5% hypochlo-rite solution (household bleach has been found to besuitable) and swirl to mix. This amount may require

58 Determination of Glyphosate by Cation-Exchange Chromatography with Postcolumn Derivatization
Figure 3 A 1/2500 dilution of Roundup. Injectionvolume = 10 µL.
Figure 4 Glyphosate in a milkweed sample. Total concentra-tion of glyphosate = 23 µg/g of plant material. Injectionvolume = 50 µL.
10Minutes
0 2 4 6 8 12 14 16 18
0.02
RFU
0.00
1
100Minutes
2 4 6 8 12 14 16 18 20
0.04
RFU
0.00
1
1143011429
CONDITIONSColumn: Glyphosate Column, cation
exchange, 4 mm x 150 mm x 8 µm(Pickering P/N 1954150)
Guard: Glyphosate Guard Column, cationexchange, 3 mm x 20 mm x 8 µm(Pickering P/N 1953020)
Column Temp.: 55 ˚C
Eluents: (A) Potassium phosphate(P/N K200)
(B) Potassium hydroxide(P/N RG019)
Gradient: Time A B
(min) (%) (%)
0 100 0
15 100 0
15.01 0 100
17 100 0
25 100 0
Flow Rate: 0.4 mL/minPostcolumnReagent 1: Oxidizing reagent at 36 ˚C
Flow Rate: 0.3 mL/min
Reagent 2: OPA reagent, ambient
Flow Rate: 0.3 mL/min
Fluorescence: Excitation: 330 nm
Emission: >460 nm (cut-off filter)
DISCUSSION AND RESULTSFigure 3 shows the analysis of glyphosate in
Roundup®, a commercially available herbicide. TheRoundup was diluted 1/2500 in deionized water and50 µL was injected directly onto the column. Theconcentration of glyphosate in this formulationwas found to be about 0.8%.
Roundup was then applied to a milkweed plant.After approximately 6 hours, a 7.2-g sample of themilkweed was homogenized with 200 mL of thepotassium phosphate eluent in a blender. The samplewas centrifuged at 5000 rpm for 15 minutes, and thesupernatant filtered through a 0.45-µm filter (GelmanAcro™ LC13, P/N 4453). A sample size of 50 µL wasinjected into the system and the results are shownin Figure 4.
Postcolumn Chemistry8
The postcolumn system features two reagentpumps, two reactors (one heated), and a column oven.A built-in pressure switch shuts down the reagentpumps if it senses that the analytical pump pressure hasdropped below 3.4 MPa (500 psi). This feature preventsback-flow of postcolumn reagents onto the analyticalcolumn. A schematic diagram of the system hardwareis shown in Figure 5.
After it is eluted from the column, the glyphosateis oxidized by hypochlorite at 36 ˚C to form glycine.The glycine is then derivatized with o-phthalaldehydeand N,N-dimethyl-2-mercaptoethylamine hydrochloride
L/gm 48.0etasohpylG.1:skaePL/gm 1.3etasohpylG.1:skaeP

59 Determination of Glyphosate by Cation-Exchange Chromatography with Postcolumn Derivatization
(Thiofluor) to form a highly fluorescent isoindolecompound. AMPA reacts directly with the OPA reagentto form a similar isoindole, as shown in Figure 6.
The Thiofluor reagent is a solid that may be sub-stituted for the liquid 2-mercaptoethanol that is tradi-tionally used for this application. The advantage ofThiofluor is that it is much more stable in solution andis relatively odorless.
Method Detection LimitsThe method detection limit for a 50-µL injection of
glyphosate in reagent water is 1.8 µg/L, which is lessthan the 6.0 µg/L MDL for a 200-µL injection volumecited in U.S. EPA Method 547. Dionex recommends
an injection of <50 µL to preserve peak shapesfor all possible matrices; however, 200-µL injectionvolumes can be used if the pH of the sampleis adjusted to <2.
LinearityGlyphosate and AMPA standards of 0.05, 0.5, 2, 4,
6, 8, and 10 mg/L were injected in duplicate for thisstudy. The method was found to be linear for glyphosateover the range tested.
AMPA is not linear over this range (r2 = 0.9983),but a quadratic fit of the data gave an r2 value of0.99999. For more accurate work, a quadratic fit shouldbe employed.
Figure 5 Schematic of glyphosate analysis system. The chromatography column and postcolumn reactor are represented by theportion of the diagram inside the dotted line.
11431
Bypass 2
Restrictor 2
Anti-siphonvalve
Anti-siphonvalve
MixingTee
FluorescenceDetector
AmbientReactor100 µL
Mixing Tee
0.69 MPa(100 psi B.P.)
GP40
Waste
Potassium Phosphateand
Potassium Hydroxide
Injector
Thermostatted Column3.45 MPa(500 psi)
Pressure Switch
HeatedReactor500 µL
1 2 NaOCl OPA
PrecolumnFilter
4.1 MPa(600 psi)
Over-pressurerelief
Reagent Pump
PostcolumnPress. Gauge
Reagent 1Pressure Gauge
Reagent 2Pressure Gauge
Bypass 1
Restrictor 1
}

60 Determination of Glyphosate by Cation-Exchange Chromatography with Postcolumn Derivatization
Reagent StorageOxidizing Reagent, when kept under helium, can
be used for about three days. After this period, freshreagent should be prepared.
OPA reagent is oxygen sensitive. If stored underhelium, it is stable for up to one week.
Aqueous samples and standards should be keptrefrigerated until they are ready to use.
REFERENCES1. U.S. EPA Method 547, “Analysis of Glyphosate
in Drinking Water by Direct Aqueous InjectionHPLC with Postcolumn Derivatization,” Cincinnati,OH, 1990.
2. Tsunoda, N. J. Chromatogr. 1993, 637, 167–173.3. Eberbach, P.L.; Douglas, L.A. J. Agric. Food
Chem. 1991, 39, 1776–1780.4. Tomita, M.; Okuyama, T.; Nigo, Y.; Uno, B.;
Kawai, S. J. Chromatogr. 1991, 571, 324–330.5. Kataoka, H.; Horii, K.; Makita, M. Biosci. Biotech.
Biochem. 1991, 55, 195–198.6. Tomita, M.; Okuyama, T.; Watanabe, S.; Uno, B.;
Kawai, S. J. Chromatogr. 1991, 566, 239-243.7. Friestad, H.; Bronstad, J. J. Assoc. Off. Anal. Chem.
1985, 68, 76–79.8. PCX 5100 Postcolumn Derivatization Instrument
User’s Manual, Pickering Laboratories,Mountain View, CA, 1993.
LIST OF SUPPLIERSFisher Scientific, 711 Forbes Ave., Pittsburgh,
Pennsylvania, 15219-4785, USA, 1-800-766-7000.Jasco, 8649 Commerce Drive, Easton, Maryland,
21601-9903, USA, 1-800-333-5272.Pickering Laboratories, 1951 Colony Street,
Suite S, Mountain View, California, 94043,USA, 1-800-654-3330.
Figure 6 Postcolumn reaction chemistry of glyphosate andAMPA.
PRECAUTIONSContamination
This method is sensitive to amines from fingerprintsand other sources of contamination. We recommendusing gloves while preparing reagents and rinsingreagent bottles and eluent lines with methanol beforeuse.
The U.S. EPA method calls for the use ofcalcium hypochlorite in the oxidizing reagent. Thesubstitution of sodium hypochlorite, however, isequally effective and reduces the chance of pluggingthe postcolumn reactor.
Reagent CompatibilityThe cation-exchange column is not solvent compat-
ible and care should be taken to ensure that methanolfrom the postcolumn system does not back up into theanalytical column.
The column regenerant (Eluent B) is strongly alka-line and all system components should be compatiblewith high pH. Many standard injection valve rotor sealsare made of Vespel® or other incompatible polymers.For this application, the seal should be made of Tefzel®.
11432
–02C PO32– OCI–+
Glyphosate
OPA
SCH2CH2N(CH3)2CHO
CHON —R
(CH3)2NCH2CH2SH
R–NH2 pH ≥ 9
+
Fluorescent Isoindole
CO2–
Glycine
Thiofluor
Where R = –CH2–COO– for glycine
R = –CH2–PO32– for AMPA
H2NNH1.
2.

61 Determination of N-Methylcarbamates by Reversed-Phased HPLC
Application Note 96
Determination of N-Methylcarbamatesby Reversed-Phase HPLC
INTRODUCTIONN-methylcarbamates and N-methylcarbamoylox-
imes are among the most widely used pesticides in the world. U.S. EPA method 531.2 provides guidelines for monitoring these compounds in ground and surface waters as well as drinking water.1 Reversed-Phase High Performance Liquid Chromatography (RP-HPLC) is the preferred method for separating carbamates. Most alternate methods for analysis have significant limita-tions. Gas chromatographic analysis has proven unsuc-cessful due to degradation of the analyte compounds during vaporization. HPLC with UV detection does not offer the sensitivity or specificity required for the sample matrices of interest. HPLC with positive mode electro-spray ionization mass spectrometry has been shown to be a promising alternative, but it increases the expense and expertise required for the analysis.
Postcolumn derivatization with fluorescence detec-tion after a reversed-phase HPLC separation is consis-tent with U.S. EPA Method 531.2. This method delivers highly sensitive determinations of carbamate com-pounds.
SUMMARY OF CHROMATOGRAPHIC METHODAfter direct injection of the sample onto the HPLC
column, carbamates are separated using a water/ methanol/acetonitrile gradient. After separation, they pass through a postcolumn reaction system where they are derivatized with a fluorescent reagent, then quantified us-ing fluorescence detection. The Acclaim® 120 C18 column provides reliable separation of the analyte compounds. The reagents specified are quality controlled by the manufac-turer to ensure minimal background interference.
INSTRUMENTATION
Dionex Summit® HPLC system* consisting of: DPG-680 Dual Pump ASI-100 Automated Sample Injector TCC-100 Thermostatted Column Compartment RF-2000 Fluorescence Detector Chromeleon® 6.80 Chromatography Workstation Pickering PCX 5200 Derivatization Instrument
*This application can also be performed on an UltiMate® 3000 HPLC with the following components: DPG 3600A Dual Pump SRD 3600 WPS-3000TSL Automated sample injector TCC-3200 Thermostatted Column Compartment RF-2000 Fluorescence Detector

62 Determination of N-Methylcarbamates by Reversed-Phased HPLC
REAGENTS AND STANDARDSWater, Milli-Q water from Milli-Q Gradient A10 Methanol (CH
3OH), Fisher, HPLC grade
Acetonitrile (CH3CN), Fisher, HPLC grade
Potassium dihydrogen citrate (KC6H
7O
7), Fluka, ≥ 98%
Sodium thiosulfate (Na2S
2O
3), Fluka, ≥ 98%
Hydrolysis Reagent (0.2% NaOH), Pickering, chromatographic grade (P/N CB130) o-Phthalaldehyde (OPA, C
8H
6O
2), Pickering,
chromatographic grade, (P/N O120) OPA Diluent (0.4% sodium borate solution), Pickering, chromatographic grade (P/N CB910) Mercaptan Reagent, (Thiofluor™(CH
3)
2NCH
2CH
2SH•HCl),
Pickering, chromatographic grade (P/N 3700-2000) 531.2 Carbamate Pesticide Calibration Mixture, Restek, 100 µg/mL (P/N 257974) 4-Bromo-3, 5-dimethylphenyl-N-methylcarbamate standard, Restek, 100 µg/mL (P/N 32274)
PREPARATION OF REAGENTS AND STANDARDSReagent WaterStock Standard Solutions
Deionized water, Type I reagent grade, 18 MΩ-cm resistivity or better
Preserved Reagent WaterDissolve 4.7 g potassium dihydrogen citrate and
160 mg Na2S
2O
3 in a 50 mL beaker with reagent water,
transfer this solution to a 500 mL volumetric flask and bring to volume with reagent water. Prior to use, filter the solution through a 0.45-µm filter.
Stock Standard Solutions of Carbamate PesticideCalibration Mixture
Pipet 10 µL and 100 µL 531.2 carbamate pesticide calibration mixture (100 µg/mL) into two 1 mL vials, add 990 µL to vial one and 900 µL methanol to vial two. The concentrations of stock standard solutions of the calibra-tion mixture are 1.0 µg/mL and 10 µg/mL, respectively.
Stock Standard Solution of 4-Bromo-3,5-dimethyl- phenyl-N-methylcarbamate Standard (Surrogate Analyte, SUR)
Pipet 100 µL 4-bromo-3, 5-dimethylphenyl-N-meth-ylcarbamate standard (100 µg/mL) into a 1 mL vial, and add 900 µL methanol. The concentration of the stock standard solution of the standard is 10 µg/mL.
Working Standard Solutions
Prepare six working standard solutions by adding the quantities of carbamate mixture stock standard solutions listed in Table 1 to separate 25 mL volumetric flasks. Add 5 µL of the stock standard solution of 4-bromo-3, 5-dimethylphenyl-N-methylcarbamate into each flask. Bring to volume with preserved reagent water.
Sodium Hydroxide Hydrolysis Reagent (Post Column Reagent 1)
Decant the hydrolysis reagent into a clean reagent reservoir that has been rinsed with methanol. Because high-purity sodium hydroxide is difficult to purchase as well as prepare, we strongly recommend the use of this reagent for optimum system performance. This reagent also contains an antifouling additive to prevent mineral buildup inside the reactor.
OPA Reagent (Postcolumn Reagent 2)Decant the contents of the OPA diluent into a clean
reagent bottle that has been rinsed with methanol. Sparge the diluent for approximately 10 min to remove oxygen.
Note: The remaining steps should be accomplished quickly because the prepared reagents are sensitive to oxygen and light. Weigh approximately 100 mg of o-phthalaldehyde into a small beaker, dissolve in 10 mL methanol, and add to the OPA diluent. Rinse the beaker with 1 to 2 mL of methanol and add this to the diluent. Add 2 g of Thiofluor to the reagent bottle, replace the cap, and sparge for 1 to 2 min. Swirl the bottle gently to ensure complete mixing.
Tap Water Sample PreparationThe tap water sample was obtained at the Dionex
(Shanghai) Application Lab located in the Pudong District, Shanghai, China.
Table 1: Preparation of calibration curve standards
Final conc.of SUR(µg/L)
Stock std.of carbamatecal. mixture
(µg/mL)
Vol. of stockstd. of
carbamatecal. mixture
(µL)
Vol. of 10µg/mL stockstd. of SUR
(µL)
Final vol.of cal.
std. (mL)
Final conc.of cal. std.
(µg/L)
1.0 5.0 5.0 25 0.20 2.00
1.0 12.5 5.0 25 0.50 2.00
1.0 25.0 5.0 25 1.00 2.00
10.0 5.0 5.0 25 2.00 2.00
10.0 12.5 5.0 25 5.00 2.00
10.0 25.0 5.0 25 10.0 2.00

63 Determination of N-Methylcarbamates by Reversed-Phased HPLC
Place 2.32 g potassium dihydrogen citrate and 80 mg Na
2S
2O
3 in a 500 mL beaker, then add approximately
250 mL tap water and mix. The treated tap water sample should be stored in the dark at -10°C until analyzed. Prior to use, filter through a 0.45-µm filter.
CONDITIONSColumn: Acclaim® 120 C18, 3 µm,
4.6 × 150 mm (P/N 059133)
Column temperature: 42 °C
Mobile phase: A: water, B: acetonitrile, C: methanol
Gradient:
Time (min) A (%) B (%) C (%) Curve
0.0 85 0 15
3.0 85 0 15 5
14.0 60 20 20 1
15.3 40 30 30 5
21.0 40 30 30 5
22.0 85 0 15 5 30.0 85 0 15 5
Flow rate: 1.0 mL/minInjection volume: 250 µLPost column reagent 1: 0.2% sodium hydroxide, first reaction coil at 100 °CFlow rate of reagent 1: 0.3 mL/minPost column reagent 2: OPA reagent, second reaction coil at ambient temperatureFlow rate of reagent 2: 0.3 mL/minFluorescence: Excitation: 330 nm Emission: 465 nm Response: 2 (0.5 s) Sensitivity: 2 (medium) Gain: 1 (×1)
RESULTS AND DISCUSSIONPostcolumn Chemistry
The postcolumn system features two reagent pumps, two reactors (one heated), and a column oven. A built-in pressure switch will shut down the reagent pumps when it senses that the analytical pump pressure has dropped below 3.4 Mpa (500 Psi). This feature prevents backflow of sodium hydroxide onto the analytical column when the analytical pump fails to pump or deliver mobile
phase. A schematic diagram of the system hardware is shown in Figure 1.
Bypass 2
Restrictor 2
Anti-siphonvalve
Anti-siphonvalve
MixingTee
RF2000
AmbientReactor100 µL
Mixing Tee
0.69 MPa(100 psi B.P.)
P680
Waste
Water/Methanol/MeCN
Injector
Thermostatted Column3.45 MPa(500 psi)
Pressure Switch
HeatedReactor500 µL
1 2 NaOH OPA
Pre-ColumnFilter
4.1 MPa(600 psi)
Over-pressurerelief
Reagent Pump
Post-ColumnPress. Gauge
Reagent 1Pressure Gauge
Reagent 2Pressure Gauge
Bypass 1
Restrictor 1
}24083
Figure 1. Schematic of carbamate analysis system setup. The chromatography column and postcolumn reactor system are represented by the portion of diagram inside the dotted line.

64 Determination of N-Methylcarbamates by Reversed-Phased HPLC
After separation on the C18 column, carbamates are hydrolyzed by sodium hydroxide at 100° C. The result-ing methylamines are then reacted with o-phthalaldehyde and N, N’-dimethyl-2-mercaptoethylamine hydrochloride (Thiofluor) to form a fluorescent isoindole compound. The details of this chemistry are shown in Figure 2.
Note: The Thiofluor reagent replaces 2-mercapto-ethanol, a reagent sometimes used for this application. The advantage of using Thiofluor is that it is more stable and relatively odorless.
To assist in troubleshooting postcolumn chemistry issues, 1-naphthol is included in some standard carbamate mixtures, as shown in Figure 3 (peak 10). This compound is naturally fluorescent; therefore it will be the only peak present in a chromatogram when the postcolumn system is not functioning properly.
Resolution and Reproducibility Figure 3 illustrates good separation of the carba-
mates listed in U. S. EPA Method 531.2 using the Acclaim 120 C18. Resolution for all peaks is much bet-ter than the values required in the EPA Method (≥ 1.0).
Reproducibility was estimated by making 7 replicate injections of a calibration standard with concentration of 1.0 µg/L. The values of relative standard deviation (RSD) of each carbamate for retention time and for peak area are listed in Table 2.
Table 2: Reproducibility of retention time and peak areas for ten carbamates and two reference components
Carbamates
Aldicarb sulfoxide
Aldicarb sulfone
Oxamyl
Methomyl
3-Hydroxycarbofuran
Aldicarb
Propoxur
Carbofuran
Carbaryl
1-Naphthol
Methiocarb
Retention Time RSD (%) Peak Area RSD (%)
0.11 3.09
0.08 1.39
0.08 1.04
0.06 0.99
0.06 1.39
0.05 1.06
0.07 2.04
0.08 2.98
0.04 0.83
0.03 0.79
0.03 2.78
5.4 7.5 10 12.5 15 17.5 20 22.5 25 27.2–14.9
35.4
mV
Minutes
20
30
0
20
30
15
24085
Column: Acclaim 120 C18, 4.6 mm x 150 mmEluent: CH3CN/CH3OH/ H2O: Gradient Temperature: 42 °CFlow Rate: 1.0 mL/minInj. Volume: 250 µLDetection: RF-2000 Excitation: 330 nm; Emission: 465 nm
Peaks: 1. Aldicarb sulfoxide 2 µg/L 2. Aldicarb sulfone 2 3. Oxamyl 2 4. Methomyl 2 5. 3-Hydroxy carbofuran 2 6. Aldicarb 2 7. Propoxur 2 8. Carbofuran 2 9. Carbaryl 2 10. 1-Naphthol 2 11. Methiocarb 2 12. BDMC 2
23
4
5 6
7 8
9
10
1112
1
Figure 3. Standard mixture of 10 carbamates (2 µg/L) plus two reference compounds (peaks 10 and 12) with 250 µL injection.
RO N H
CH 3 H 2 O +
O
Carbamate
OH -
100 ° C CH 3 NH 2 + R – OH + CO 3
2 -
OPA
SCH 2 CH 2 N(CH 3 ) 2
CHO
CHO
N — CH 3
(CH 3 ) 2 NCH 2 CH 2 SH
CH 3 NH 2 pH ≥ 9
+
Fluorescent isoindole
24084
Figure 2. Postcolumn reaction chemistry of carbamate.

65 Determination of N-Methylcarbamates by Reversed-Phased HPLC
–14.3
mV
Column: Acclaim 120 C18, 4.6 mm x 150 mmEluent: CH3CN/CH3OH/ H2O: Gradient Temperature: 42 °CFlow Rate: 1.0 mL/minInj. Volume: 250 µL Detection: RF-2000 Excitation: 330 nm; Emission: 465 nm
Peaks: 1. Aldicarb sulfoxide 2. Aldicarb sulfone 3. Oxamyl 4. Methomyl 5. 3-Hydroxy carbofuran 6. Aldicarb 7. Propoxur 8. Carbofuran 9. Carbaryl 10. 1-Naphthol 11. Methiocarb
24086
4 6 8 10 12 14 16 18 20 22 24
22.3
Minutes
–51
mV
3.3 6 8 10 12 14 16 18 20 22 24
140
1.0 µg/L0.5 µg/L0.2 µg/L
1110
9
8765
432
1
123
4
5 6
7 8
9
10
11
10 µg/L5 µg/L2 µg/L
A
B
Figure 4. An overlay of chromatograpms of carbamates with concentrations of (A) 0.2, 0.5 and 1.0 µg/L, respectively; and (B) 2.0, 5.0 and 10 µg/L.
0.9992 2.0 0.59 0.018
0.9995 2.0 1.00 0.046
0.9994 2.0 0.86 0.035
0.9995 0.5 0.29 0.028
0.9994 2.0 1.90 0.036
0.9995 1.0 0.22 0.032
0.9994 1.0 1.00 0.031
0.9993 1.5 0.52 0.059
0.9995 2.0 1.30 0.026
0.9993 4.0 1.90 0.041
Table 3: Method linearity data and method detection limits (MDL)
Carbamates
Aldicarb sulfoxide
Aldicarb sulfone
Oxamyl
Methomyl
3-Hydroxycarbofuran
Aldicarb
Propoxur
Carbofuran
Carbaryl
Methiocarb
Correlation coefficient (R)
Method 531.1 MDL
requirements (µg/L)
Method531.1 MDL
(µg/L)
Dionex Method
MDL (µg/L)
* When n = 10, t (n – 1, 1 - α = 0.99)
= 3.17
Linearity and Detection LimitsFigure 4 shows an overlay of chromatograms of
the serial standard solutions of carbamates. Calibration linearity for the determination of carbamates by this method was investigated by making replicate injections (n = 7) of serial standard solutions of carbamates at six different concentrations. Detection limits of carbamates were calculated by using the equation found in EPA 531.1 and 531.2:
Detection limit = St (n – 1, 1 - α = 0.99)
Where: S = standard deviation of replicate analyses t
(n – 1, 1 - α = 0.99) = Student’s value for the 99%
confidence level with n -1 degrees of freedom, n = number of replicates
0.0 0.20 0.20 6.25 102 10.00 10.66 4.14 107
0.0 0.20 0.21 8.42 103 10.00 10.65 4.60 107
0.0 0.20 0.19 13.4 93 10.00 10.60 4.52 106
0.0 0.20 0.18 5.11 92 10.00 10.88 4.61 109
0.0 0.20 0.19 4.25 94 10.00 10.46 4.43 105
0.0 0.20 0.18 6.16 88 10.00 10.88 4.30 109
0.0 0.20 0.19 6.92 92 10.00 10.56 4.67 106
0.0 0.20 0.21 8.11 103 10.00 10.60 4.78 106
0.0 0.20 0.17 6.28 87 10.00 10.54 4.85 105
0.0 0.20 0.20 4.47 99 10.00 10.22 4.52 102
0.0 0.20 0.20 4.82 100 10.00 10.46 4.80 105
Table 4: Tap water sample analysis
Carbamates
Aldicarb sulfoxide
Aldicarb sulfone
Oxamyl
Methomyl
3-Hydroxycarbofuran
Aldicarb
Propoxur
Carbofuran
Carbaryl
1-Naphthol
Methiocarb
Detected(µg/L)
Added 1(µg/L)
Found(µg/L)
RSD(%)
Recovery(%)
RSD(%)
Recovery(%)
Added 2(µg/L)
Found(µg/L)
Ten replicate injections of reagent water forti-fied with 0.2 µg/L carbamate standard were used in this method. Table 3 summarizes the data, which show excellent method linearity and sensitivity, with detection limits well below those defined in the EPA method. (The improved detection limits are largely due to im-provements in fluorescence detector sensitivity and reversed-phase column technology since the original EPA work was completed. The EPA method used a 5 µm 4.6 x 250 mm column while this method used a 3 µm 4.6 x 150 mm column to yield more efficient peaks.) These improved limits easily allow the analyst to reach the minimum reporting limits (3-5 times the MDL) of the original method.

66 Determination of N-Methylcarbamates by Reversed-Phased HPLC
Tap Water Sample AnalysisFigure 5 compares the chromatograms of an unadul-
terated tap water sample with two samples spiked with 0.2 µg/L and 10 µg/L carbamate standards. No detectable levels of carbamates were found in the tap water. The related data are summarized in Table 4. This data shows excellent spike recovery for each carbamate compound.
-10
mV
Column: Acclaim 120 C18, 4.6 mm x 150 mmEluent: CH3CN/CH3OH/ H2O: Gradient Temperature: 42 °CFlow Rate: 1.0 mL/minInj. Volume: 250 µL (A) 100 µL (B)Detection: RF-2000 Excitation: 330 nm; Emission: 465 nm
Peaks: 1. Aldicarb sulfoxide 10 µg/L 2. Aldicarb sulfone 10 3. Oxamyl 10 4. Methomyl 10 5. 3-Hydroxy carbofuran 10 6. Aldicarb 10 7. Propoxur 10 8. Carbofuran 10 9. Carbaryl 10 10. 1-Naphthol 10 11. Methiocarb 10 12. BDMC 10
24088
5 6.3 7.5 8.8 10 11.3 12.5 14 15 16.3 17.5 18.8 20 21.3 22.5 23.8
100
Minutes
-5.9
mV
5 6.3 7.5 8.8 10 11.3 12.5 14 15 16.3 17.5 18.8 20 21.3 22.5 23.8
60
0
20
20
30
30 15
B
A
12
11
10
9
87
65
4
32
1
1
2 3
4
5 67 8
910
11 12
Figure 6. Chromatograms of a standard mixture of 10 carbam-ates (2.5 µg/mL) plus two reference compounds (peaks 10 and 12) on (A) Summit and (B) UltiMate Systems, respectively, under the same chromatographic condition except for injection volume, (A) 250 µL and (B) 100 µL.
Chromatography with the UltiMate 3000 HPLC systemThis application can also be performed on the
UltiMate 3000 HPLC system. Figure 6 shows the chromatograms of a 10 µg/L carbamate standard on the Summit and UltiMate 3000 systems, respectively, using the same chromatographic conditions except for injection volume. (The UltiMate 3000 used a 100 µL sample loop while the Summit used a 250 µL sample loop.) The UltiMate 3000 can be equipped with a 250 µL sample loop (P/N 6820.2422) and 250 µL syringe (P/N 6822.0003). Good separation of carbamates is achieved on both HPLC systems.
–8.5
mV
Column: Acclaim 120 C18, 4.6 mm x 150 mmEluent: CH3CN/CH3OH/ H2O: Gradient Temperature: 42 °CFlow Rate: 1.0 mL/minInj. Volume: 250 µL Detection: RF-2000 Excitation: 330 nm; Emission: 465 nm
Peaks: 1. Aldicarb sulfoxide 0 0.2 10 µg/L 2. Aldicarb sulfone 0 0.2 10 3. Oxamyl 0 0.2 10 4. Methomyl 0 0.2 10 5. 3-Hydroxy carbofuran 0 0.2 10 6. Aldicarb 0 0.2 10 7. Propoxur 0 0.2 10 8. Carbofuran 0 0.2 10 9. Carbaryl 0 0.2 10 10. 1-Naphthol 0 0.2 10 11. Methiocarb 0 0.2 10 12. BDMC
24087
5.5
–6.6
mV
8.8
–20
mV
180
Minutes
A
B
C
0 2 4 6 8 10 12 14 16 18 20 22 24 26 28 30
123
4
5 687
9
1011
12
1234
5 6 879
10 11
12
A B C
Figure 5. Chromatograms (A) a tap water sample, (B) tap water (A) + 0.2 µg/L carbamate standard mix (C) tap water (A) + 10 µg/L carbamate standard mix.

67 Determination of N-Methylcarbamates by Reversed-Phased HPLC
CONCLUSIONThis application note describes an optimized method
for determining carbamates on a Dionex HPLC system with an Acclaim 120 C18 column (3µm). The method meets or exceeds the chromatographic requirements of the U. S. EPA 531.2 monograph method for carbamates, demonstrating that it is ideally suited for determining these compounds in drinking water.
PRECAUTIONS Mobile Phase Precautions• Avoid touching the interior of the mobile phase
reservoirs and the dip tubes; the amino acids present in fingerprints will cause contamination. Gloves are suggested.
• Do not leave caps and lines exposed to the atmosphere. To fill the reservoir, transfer caps and lines into a spare bottle or an Erlenmeyer flask filled with deionized water.
• Change the water in the solvent reservoir every 3 to 4 days to prevent possible bacterial growth.
• Do not purge the system with 100% acetonitrile as this reagent can promote precipitation of borate salt in the reactor.
Column Maintenance and Precautions• If the column backpressure is high, isolate the
source—guard, analytical column, or the 0.5-µm in-line filter. Replace items causing the increased pressure.
• At shutdown, flush the column with pure methanol; do not store the column in water.
• Organic contaminants may be removed from the column by first washing with methanol, followed by dichloromethane, followed with a final methanol rinse.
• Never disconnect any fitting between the HPLC pump and the column until the postcolumn system has been shut down and depressurized by loosening the fitting at the “To Detector” port.
• Replace any fittings that leak between the HPLC pump and the column in order to prevent backflow in the event of an unattended shutdown.
• When removing the column, disconnect the outlet fitting first.
Reagent, Sample and Standard Precautions• Always wear gloves when preparing reagents. Both
the hydrolysis reagent and Thiofluor cause skin irritation. Fingerprints also contaminate reagents.
• The hydrolysis reagent is stable and can be replaced as it is used. The OPA reagent is sensitive to oxida-tion, and degrades over time. It should be prepared fresh for optimum sensitivity.
• Thiofluor is extremely hygroscopic. Store in a tightly closed container.
• Filter all samples through a 0.45 µm membrane filter. Some samples may require even more thorough filtra-tion, e.g. 0.2 µm, especially if colloids are present.
• Aqueous samples must always be properly buffered. Consult EPA Method 531.2 for details.
REFERENCES1. Measurement of N-methylcarbamoyloximes and
N-methylcarbamates in Water by Direct Aqueous In-jection HPLC with Postcolumn Derivatization” U.S. EPA Method 531.2, Revision 1.0, U.S. Environmen-tal Protection Agency: Cincinnati, OH, 2001.
2. PCX 5200 Postcolumn Analysis of Carbamate, Application Manual, Version 3.0, Pickering Laborato-ries: Mountain View, CA, 2003.

Analysis of Emerging ContaminantsEnvironmental Water Applications Notebook

69 Determination of Linear Alkybenzene Sulphonate in Treatment Plant Wastewater Streams Using On-Line Solid-Phase Extraction Followed by HPLC with Fluorescence Detection
26182
HCCH3 (CH2)m (CH2)n CH3
m+n=10
SO3Na
Application Note 219
Determination of Linear Alkylbenzene Sulphonate in Treatment Plant Wastewater Streams Using On-Line Solid-Phase Extraction Followed by HPLC with Fluorescence Detection
INTRODUCTIONSurfactants are the major active ingredients of
laundry detergents. During the washing process, they lower the surface tension of water and loosen and release stains from fabric. Historically, the first surfactant used in laundry cleaning was soap (mixture of animal fat and ashes). Soap is not stable in hard or acid waters. It readily precipitates with divalent metal ions and is, thus, soluble in alkaline soft waters. Other surfactants, including anionic, cationic, non-ionic, and amphoteric surfactants have been developed to improve cleaning performance. Linear alkylbenzene sulphonate (LAS, CAS 68411-30-3) is an anionic surfactant. It was introduced in 1964 as the readily biodegradable replacement for highly-branched alkylbenzene sulphonate (ABS). The commercial product, the subject of this application note (AN), is a mixture of closely-related isomers and homologues, each containing an aromatic ring sulphonated at the para position and attached to a linear alkyl chain (Figure 1).
Figure 1. LAS chemical structure (C13 homologue).

70 Determination of Linear Alkybenzene Sulphonate in Treatment Plant Wastewater Streams Using On-Line Solid-Phase Extraction Followed by HPLC with Fluorescence Detection
surfactants not reacting with colorimetric methods (MBAS for anionic, BiAS for non-ionic, and BBAS for cation surfactants) “if it seems more appropriate for reasons of efficiency or precision, appropriate specific instrumental analyses such as high performance liquid chromatography (HPLC) or gas chromatography (GC) are to be applied.” This is the first statement in favor of the introduction of chromatographic methods for surfactant determination. The LAS surfactants are very diffuse in discharges because they replace alkylphenolethoxylates in domestic detergents which have have been banned for many years.
In 2000, the European Union published the third draft of a future sludge directive entitled Working Document on Sludge (Third Draft, 27 April, 2000) adopted in the Italian regional legislation (Regione Emilai Romagna, Determinazione del Direttore generale ambiente, difesa del suolo e della costa n. 11046 del 29/0//2005), where more restricted concentration limit values of some organic compounds are included for the first time.15 Some of the organic compounds included are LAS surfactants. According to the directive draft, the concentration of LAS has to be lower than 2600 mg/kg SS (Suspended Solids) for land application of sludge. The control of final concentration of LAS in sludges in the wastewater treatment plants (WWTPs) needs continuous monitoring in the effluents in each step of the depuration process. This monitoring can be accomplished by developing an automated chromatographic system for LAS analysis that should not require a manual concentration step.
The linear alkyl chain typically consists of: 10–13 carbon units, approximately in the mole ratio C10:C11:C12:C13 = 13:30:33:24; an average carbon number near 11.6; and a content of the most hydrophobic 2-phenyl isomers in the 18–29% range.1 Thus, commercial LAS consists of more than 20 individual components. The ratio of the various homologues and isomers representing different alkyl chain lengths and aromatic ring positions along the linear alkyl chains is relatively constant across the various household applications. The global production of LAS is 2.2 x 10⁶ t/yr1. The present risk assessment is based on recent environmental safety data and updates the previous LAS terrestrial risk assessments in the literature.1-9
LAS surfactants have a strong affinity for sorption to sediments. However, data regarding the fate and effects in sediments following release into the environment have not been reported in great detail.10 The concentration range of LAS in wastewater treatment plant effluent is 19,000–71,000 ng/L while the total removal in wastewater treatment plants for LAS is 95–99%.11,12 Approximately a 20% loss over a 4.3 min residence time in stream surface water has been observed. Hence, the half-life (DT50) of LAS in river water is conservatively set to <12 h.1,13 However, in some situations, continuous inputs to the environment (for example, via wastewater treatment plants effluent, other known and unknown point sources, runoff etc.) of compounds that biodegrade rapidly may replace dissipated material resulting in chronic low exposures.
Sanderson et al. (2005) demonstrated the adapted analytical method for the AS/AES homologues and low likelihood of risks.10 However, it was also concluded that additional monitoring with more sampling locations, in combination with both biota and habitat up- and downstream of wastewater treatment plants, was needed to better elucidate the potential risks. Figure 2 shows the movement of LAS in the environment.
According to the Italian official methods, the determination of surfactants in industrial discharges or surface waters must be carried out by colorimetric methods. Recently, the European Community introduced a new regulation on detergents (Regulation EC No. 648/2004 of the European Parliament and the Council of 31 March, 2004) which establishes standard methods for detergents.14 This regulation states that for those
Figure 2. Fate of LAS in the environment.
26183
W aste W ater T reatment Plant
(WWTP) Aquatic
environment
Production
Household use
Indirect human exposure
Uptake by cattle
Uptake by plants
Leaching to groundwater
Sludge-amended soil
Sewer
Sludge
E f fluent W ater Sediment
Terrestrial effects
Above-ground community
Soil community
Groundwater community

71 Determination of Linear Alkybenzene Sulphonate in Treatment Plant Wastewater Streams Using On-Line Solid-Phase Extraction Followed by HPLC with Fluorescence Detection
The determination of LAS can be used as an indicator of the effectiveness of the depuration process. The importance of monitoring the LAS concentration is mainly due to the agricultural destination of resulting sludge, which is regulated for LAS content in some nations.16 Using sewage sludges for agricultural purposes is an economical pathway for disposal. If the LAS limit is exceeded, the sludge must be delivered to an incinerator to burn at 10 times the cost.
In the recent past, several analytical methods have been described in the literature for the determination of LAS in environmental samples, mainly in agricultural soils and sediments.17 Most of these methods are based on determination by liquid chromatography with ultraviolet diode array (UV-DAD), fluorescence (FLD), or mass spectrometric detectors.18-21 The method detection limits (MDLs) of LC techniques employing direct injection of samples are too high for the detection of the low levels allowed in natural waters. Therefore, water samples require preconcentration before analysis. Solid-phase extraction (SPE) is one of the most important techniques for sample enrichment because it overcomes many of the disadvantages of liquid-liquid extraction. Unfortunately, preparing individual samples is time consuming and a new SPE cartridge must be used for each sample. The expense of using multiple SPE cartridges and the associated manual labor can be eliminated with on-line SPE combined with HPLC. This technique delivers a simple, rapid, and accurate means for determining phenols at low concentrations in real samples.22
The Dionex UltiMate® 3000 system was designed to easily execute more advanced HPLC methods, such as parallel LC, 2D-LC, and on-line SPE/HPLC. An UltiMate 3000 system, together with an autosampler capable of injecting large volumes, can be used to execute an on-line SPE method to determine LAS in water streams. This AN details an on-line SPE method, followed by HPLC with fluorescence detection, for determining LAS at the concentrations required by world regulatory agencies.
The LAS from river and water streams of a depuration plant are trapped on an IonPac® NG1, a small polymeric reversed-phase column, and then separated on a speciality polar-embedded reversed-phase column, the Acclaim® Surfactant column. This automated method is a cost-effective way to determine LAS in river and water stream samples and follow their fate after water treatments. The integrated on-line SPE solution proposed uses an easy instrumentation setup through Chromeleon® software. This combination represents a simple and economically convenient analytical solution, even for routine laboratory operators. Compared to any alternative system, a Dionex dual pump system will save money and reduce maintenance costs. Also, the elimination of the disposable cartridge in the off-line SPE procedure will save money, solvents, and workload. The same system can be easily configured to perform other common, direct, or SPE-based HPLC applications, such as the determination of phenols or polycyclic aromatic hydrocarbons (PAHs).
26184
DGP-3600A Pump RightPump Left DGP-3600A Pump RightPump Left
WPS-3000TSL WPS-3000TSL
Waste WasteWasteWaste
Loading SPE
SPE Column SPE Column
Fluorescence Detector
Analytical Column
Sample Analysis
Analytical Column
Fluorescence Detector
7
6
4352
110
89
7
6
4352
110
89
Figure 3. Schematic of devices for determination of LAS using on-line SPE followed by HPLC with fluorescence detection.

72 Determination of Linear Alkybenzene Sulphonate in Treatment Plant Wastewater Streams Using On-Line Solid-Phase Extraction Followed by HPLC with Fluorescence Detection
EQUIPMENTDionex UltiMate 3000 HPLC system consisting:
DGP-3600A dual gradient pump
SRD-3600 solvent rack with integrated vacuum degasser
WPS-3000 TSL equipped with 500 μL loop
TCC-3200 Thermostatted Column Compartment with one two-port, ten-position (2P–10P) valve
RF 2000 Fluorescence Detector
Chromeleon Chromatography Data System, 6.80 SP4
REAGENTS AND STANDARDSUse only ACS reagent grade chemicals for all reagents
and standards.
Deionized (DI) water ASTM grade I (18.2 MΩ-cm) from a Barnstad or other water purification system
Acetonitrile (CH3CN), HPLC grade (Merck, Darmstadt)
Ammonium acetate (CH3COONH
4), analytical reagent
grade
The starting standard solution contains 1463 mg/L of C10-13
LAS (Sigma-Aldrich) in methanol. To this standard solution, bisphenol A, nonyphenol, nonyphenol-1-ethoxylated, and nonyphenol-2-ethoxylated were added for determination of additional information not considered in this paper. This information does not interfere with the LAS determination.
CONDITIONSSolid-Phase ExtractionColumn: IonPac NG1, 5 μm, 4 × 250 mm (P/N 039567)
Mobile Phases for SPE (Left Pump): A. Water
Flow Rate: Rinse/Loading 2 mL/min with 100% A
Temperature: 30 °C
Inj. Volume: 0.5–5 mL
For the detailed program see Tables 1A-C.
AnalyticalColumn: Acclaim Surfactant, 5 μm, 4.6 × 250 mm (P/N 063203) Acclaim Surfactant Guard 4.3 × 10 mm (P/N 063215)
Mobile Phases for Analysis (Right Pump): A. CH
3CN
B. 100 mM CH3COONH
4
(pH 5 with HCl)
Gradient: 50 to 15% B in 20 min
Flow Rate: 1 mL/min
Temperature: 30 °C
Detection: Fluorescence, 0 min: Ex 230 nm Em 302 nm; 18 min: Ex 221 nm Em 284 nm
Total analysis time is 45 min. For the detailed program see Table 1B.
Table 1A. List of Default Conditions for SPE and Analytical Separation
Default Conditions
Sampler.TempCtrl = OnSampler.Temperature.Nominal = 10.0 [°C]ColumnOven.TempCtrl = OnColumnOven.Temperature.Nominal = 30.0 [°C]PumpLeft.%A.Equate = WaterPumpRight.%A.Equate = ACNPumpRight.%B.Equate = NH4AcOH 100 mM pH5PumpRight.%C.Equate = "%C"InjectMode = UserProgSyncWithPump = OnEmission.ExWavelength = 230 [nm]Emission.EmWavelength = 302 [nm]Emission.Sensitivity = MedPumpLeft.Flow = 2.000 [ml/min]PumpLeft.%B = 0.0 [%]PumpLeft.%C = 0.0 [%]ValveRight = 10_1WashVolume = 1000.000 [µl]WashSpeed = 30.000 [µl/s]PrepVial= Position+1

73 Determination of Linear Alkybenzene Sulphonate in Treatment Plant Wastewater Streams Using On-Line Solid-Phase Extraction Followed by HPLC with Fluorescence Detection
Table 1B. List of Analytical Conditions for LAS Determination
–10.000Sampler.TempCtrl = OnSampler.Temperature.Nominal = 10.0 [°C]ColumnOven.TempCtrl = On
Begin to equilibrate the analytical column using initial condi-tions for 10 min Injections at 0 min.
0.000
UV.AutozeroWait AZ_DoneEmission.AutozeroPumpRight.Flow = 1.000 [mL/min]PumpRight.%B = 50.0 [%]PumpRight.%C = 0.0 [%]Wait ColumnOven.Ready and Sampler.ReadyInjectEmission.AcqOnPumpRight.Flow = 1.000 [mL/min]ValveRight = 1_2PumpRight.%B = 50.0 [%]PumpRight.%C = 0.0 [%]
Starts SPE column rinse
5.200 ValveRight = 10_1 Start SPE column rinse
18.000 Emission.ExWavelength = 221 [nm]Emission.EmWavelength = 284 [nm] Wavelengths optimized for LAS
20.000PumpRight.Flow = 1.000 [mL/min]PumpRight.%B = 15.0 [%]PumpRight.%C = 0.0 [%]
Gradient end
30.000
PumpRight.Flow = 1.000 [mL/min]PumpRight.%B = 15.0 [%]PumpRight.%C = 0.0 [%]Emission.AcqOffReleaseExclusiveAccessEnd
Isocratic step
Table 1C. Program for Multiple Sample Loading Onto SPE Column Using a WPS-3000 Autosampler Equipped with 500 µL Loop
500 µL
UdpDraw From=SampleVial, Volume=500.000, SyringeSpeed=12.000,SampleHeight=2.000
Single step for 500 µL sample loading onto SPE columnUdpMixWait Duration=5
UdpInjectValve Position=Inject
UdpMoveSyringe Unload=500.000, SyringeSpeed=12.000
UdpInjectValve Position=Load
To be repeated according to the final desired volume
5000 µL
UdpDraw From=SampleVial, Volume=500.000, SyringeSpeed=12.000,SampleHeight=2.000
10th step for 5000 µL of sample loaded onto SPE columnUdpMixWait Duration=5
UdpInjectValve Position=Inject
UdpMoveSyringe Unload=500.000, SyringeSpeed=12.000
UdpInjectValve Position=Load
Final step UdpInjectMarker Placed at the end of any repetitive sequence last step

74 Determination of Linear Alkybenzene Sulphonate in Treatment Plant Wastewater Streams Using On-Line Solid-Phase Extraction Followed by HPLC with Fluorescence Detection
RESULTS AND DISCUSSIONOptimization of the On-line SPE Method
The linearity of the on-line SPE procedure for the determination of C
10-13 LAS was investigated by loading
the SPE cartridge with different volumes of the C10-13
LAS standard prepared at the same concentration. The resulting chromatograms are shown in Figure 4. Linearity results are summarized in Table 3.
Table 2. Range and Determined Homologues Average Distribution of LAS in Working Standard (n=5)
C10 C11 C12 C13
Range % 5–15 30–40 20–40 15–30
Average found % 13 33 31 23
Reproducibility, Detection Limits, and LinearityThe wide range of LAS concentrations in the
analyzed samples collected in the inlet and outlet of the WWTP and the limited dynamic range of fluorescence detection, require the use of two different loading volumes for the SPE device, 0.5 and 5 mL respectively, and subsequent use of two calibration curves for 0.5 and 5 mL volumes. The reproducibility was estimated by making five replicate injections of an inlet sample and three replicates of a low concentration sample. Table 4 summarizes the retention time and peak area precision data for both samples. The method detection limits (MDLs) of the C
10-13 LAS using the on-line SPE-HPLC
are listed in Table 5. The calibration linearity for the determination of C
10-13 LAS was investigated by making
replicate injections of C10-13
LAS prepared at five different concentrations. The external standard method is used to calculate the calibration curve and for sample analysis. Table 3 lists the data from the calibration as reported by the Chromeleon software.
Sample AnalysisTo achieve satisfactory chromatography of C
10-13 LAS
in water samples, the samples should be filtered prior to analysis, and analyzed in a short time to avoid degradation processes due to the dissolved organic matter.
Figure 5 shows an example of an inlet stream of an urban and industrial wastewater treatment plant. The concentration of the total C
10-13 LAS in the sample was
8689 μg/L. The chromatogram of the effluent stream of the same plant is shown in Figure 6. The C
10-13 LAS
concentration in the sample was reduced to 740 μg/L. Another example of an urban waste depuration plant effluent analysis is shown in Figure 7. This situation is far above the quantification limit and the C
10-13 LAS
concentration in the sample was as low as 37.1 μg/L.
Figure 4. An overlay of chromatograms of different volumes of the same C
10-13.
26185
0
edcba
10 20 300
300
mRFU
Minutes
LAS
C 10
LAS
C 11
LAS
C 12
LAS
C 13
SPE Column: IonPac NG1, 5 µm, 4 × 250 mmMobile Phases for SPE (Left Pump): A. WaterFlow Rate: Rinse/Loading 2 mL/min with 100% ATemperature: 30 °CInj. Volume: LAS standard (58.5 µg/L) loaded onto SPE column a) 0.5 mL b) 1.0 mL c) 2.0 mL d) 3.0 mL e) 5.0 mL AnalyticalColumn: Acclaim Surfactant 5 µm, 4.6 × 250 mm Acclaim Surfactant guard 4.3 × 10 mmMobile Phases for Analysis(Right Pump): A. CH3CN B. 100 mM CH3COONH4 (pH 5 with HCl)Gradient: 50 to 15% B in 20 minFlow Rate: 1 mL/minTemperature: 30 °CDetection: Fluorescence, 0 min: Ex 230 nm Em 302 nm; 18 min: Ex 221 nm Em 284 nm

75 Determination of Linear Alkybenzene Sulphonate in Treatment Plant Wastewater Streams Using On-Line Solid-Phase Extraction Followed by HPLC with Fluorescence Detection
Table 4. Retention Time and Peak Area Precisions for C10-13 LAS at Two Different SPE Loading
SPE Loaded VolumeC10 C11 C12 C13
RT RSD Area RSD RT RSD Area RSD RT RSD Area RSD RT RSD Area RSD
0.5 mL (n=5) 0.24 1.72 0.22 1.33 0.16 1.39 0.12 3.25
5 mL (n=3) 0.95 11.1 0.03 9.9 0.04 15.1 0.03 15.4
Table 3. LAS Calibration at Two Different SPE Volumes and Five Different Concentrations Each
SPE Loaded VolumeC10 C11 C12 C13
r2 Offset Slope r2 Offset Slope r2 Offset Slope r2 Offset Slope
0.5 mL 0.9967 -0.3170 0.1343 0.9964 0.5495 0.1137 0.9962 0.6692 0.1117 0.9935 0.6836 0.1108
5 mL 0.9996 1.2408 1.1660 0.9988 4.2647 0.9655 0.9988 4.4579 0.8101 0.9975 3.3943 0.6974
Figure 5. Chromatogram of the inlet stream of an urban and industrial wastewater treatment plant. The total LAS concentra-tion is 8689 µg/L.
Figure 6. Chromatogram of the outlet stream of an urban and industrial wastewater treatment plant of Figure 5. The total LAS concentration is 740 µg/L.
26186
0 10 20 300
1000
mRFU
Minutes
LAS
C 10
LAS
C 11
LAS
C 12
LAS
C 13
SPE Column: IonPac NG1, 5 µm, 4 × 250 mmMobile Phases for SPE (Left Pump): A. WaterFlow Rate: Rinse/Loading 2 mL/min with 100% ATemperature: 30 °CInj. Volume: LAS standard (58.5 µg/L) loaded onto SPE column 0.5 mLAnalyticalColumn: Acclaim Surfactant, 5 µm, 4.6 × 250 mm Acclaim Surfactant guard 4.3 × 10 mmMobile Phases for Analysis(Right Pump): A. CH3CN B. 100 mM CH3COONH4 (pH 5 with HCl)Gradient: 50 to 15% B in 20 minFlow Rate: 1 mL/minTemperature: 30 °CDetection: Fluorescence, 0 min: Ex 230 nm Em 302 nm; 18 min: Ex 221 nm Em 284 nm
26188
0 10 20 300
1000
mRFU
Minutes
LAS
C 10
LAS
C 11
LAS
C 12
LAS
C 13
SPE Column: IonPac NG1, 5 µm, 4 × 250 mmMobile Phases for SPE (Left Pump): A. WaterFlow Rate: Rinse/Loading 2 mL/min with 100% ATemperature: 30 °CInj. Volume: LAS standard (58.5 µg/L) loaded onto SPE column 5.0 mL AnalyticalColumn: Acclaim Surfactant, 5 µm, 4.6 × 250 mm Acclaim Surfactant guard 4.3 × 10 mmMobile Phases for Analysis(Right Pump): A. CH3CN B. 100 mM CH3COONH4 (pH 5 with HCl)Gradient: 50 to 15% B in 20 minFlow Rate: 1 mL/minTemperature: 30 °CDetection: Fluorescence, 0 min: Ex 230 nm Em 302 nm; 18 min: Ex 221 nm Em 284 nm

76 Determination of Linear Alkybenzene Sulphonate in Treatment Plant Wastewater Streams Using On-Line Solid-Phase Extraction Followed by HPLC with Fluorescence Detection
Table 5. Detection Limits for C10-13 LAS at Two Different SPE Loading Volumes
SPE Loaded VolumeC10 C11 C12 C13
LOD (µg/L) RSD LOD (µg/L) RSD LOD (µg/L) RSD LOD (µg/L) RSD
0.5 mL (n=5) 5.1 3.29 14.2 3.89 15.4 1.1 12.3 3.86
5 mL (n=3) 0.19 11.4 0.51 12.1 0.46 12.4 0.31 15.3
Figure 7. Chromatogram of the outlet stream of an urban waste-water treatment plant. The total LAS concentration is 37.1 µg/L.
Figure 8. Chromatograms of the outlet stream of an urban waste-water treatment plant at low C
10-13 LAS concentration and same
sample spiked with 117 µg/L of C10-13
LAS.
26189
0 10 20 300
1000
mRFU
Minutes
LAS
C 10
LAS
C 11
LAS
C 12
LAS
C 13
SPE Column: IonPac NG1, 5 µm, 4 × 250 mmMobile Phases for SPE (Left Pump): A. WaterFlow Rate: Rinse/Loading 2 mL/min with 100% ATemperature: 30 °CInj. Volume: LAS standard (58.5 µg/L) loaded onto SPE column 5.0 mL AnalyticalColumn: Acclaim Surfactant, 5 µm, 4.6 × 250 mm Acclaim Surfactant guard 4.3 × 10 mmMobile Phases for Analysis(Right Pump): A. CH3CN B. 100 mM CH3COONH4 (pH 5 with HCl)Gradient: 50 to 15% B in 20 minFlow Rate: 1 mL/minTemperature: 30 °CDetection: Fluorescence, 0 min: Ex 230 nm Em 302 nm; 18 min: Ex 221 nm Em 284 nm
26190
0 10 20 300
1000
mRFU
Minutes
SPE Column: IonPac NG1, 5 µm, 4 × 250 mmMobile Phases for SPE (Left Pump): A. WaterFlow Rate: Rinse/Loading 2 mL/min with 100% ATemperature: 30 °CInj. Volume: LAS standard (58.5 µg/L) loaded onto SPE column 5.0 mL AnalyticalColumn: Acclaim Surfactant, 5 µm, 4.6 × 250 mm Acclaim Surfactant guard 4.3 × 10 mmMobile Phases for Analysis(Right Pump): A. CH3CN B. 100 mM CH3COONH4 (pH 5 with HCl)Gradient: 50 to 15% B in 20 minFlow Rate: 1 mL/minTemperature: 30 °CDetection: Fluorescence, 0 min: Ex 230 nm Em 302 nm; 18 min: Ex 221 nm Em 284 nm
LAS
C 10 LAS
C 11
LAS
C 12
LAS
C 13

77 Determination of Linear Alkybenzene Sulphonate in Treatment Plant Wastewater Streams Using On-Line Solid-Phase Extraction Followed by HPLC with Fluorescence Detection
RecoveryA recovery study was performed by spiking a low
concentration sample with 117 μg/L of C10-13
LAS and doing replicate analyses. Figure 8 shows the comparison between a low concentration sample (Figure 7) and the same sample spiked with 117 μg/L of C
10-13 LAS. The
average recovery was better that 104% with a RSD of 14% (n=3).
CONCLUSIONThe successful analysis of all the water samples
above demonstrates that on-line SPE with a dual UltiMate system can determine the LAS without laborious off-line sample preparation. The on-line SPE method with fluorescence detection has very good reproducibility and selectivity with detection limits of 0.9 μg/L for total C
10-13
LAS using a 5 mL sample loaded onto the SPE column.
PRECAUTIONSMethod interferences may be caused by surfactants in
solvents, reagents, glassware, and other sample processing hardware. Clean and rinse all glassware scrupulously with high-purity water and use high-purity reagents and solvents to minimize interference problems. Samples must be filtered and analyzed in a short time to avoid degradation due to dissolved organic matter.
REFERENCES
1. HERA, 2004. Human and Environmental Risk As-sessment of Ingredients of Household Cleaning Products: Report for LAS. http://www.heraproject.com.
2. Mieure, J.P.; Waters, J.; Holt, M.S.; Matthijs, E. Terrestrial Safety Assessment of Linear Alkylben-zene Sulphonate Chemosphere 1990, 21, 251–262.
3. Kloepper-Sams, P.; Torfs, F.; Feijtel, T.C.J.F.; Gooch, J. Effects Assessment for Surfactants in Sludge-Amended Soils: a Literature Review and Perspective for Terrestrial Risk Assessment. Sci. Tot. Environ. 1996, 185, 171–175.
4. De Wolf, W.; Feijtel, T.C.J.F. Terrestrial Risk Assessment for Linear Alkylbenzene Sulfonate (LAS) in Sludge-Amended Soils. Chemosphere 1998, 36 (6), 1319–1343.
5. Jensen, J. Fate and Effects of Linear Alkylbenzene Sulphonates (LAS) in the Terrestrial Environment- A Review Sci. Tot. Environ. 1990, 226, 93–111.
6. Jensen, J.; Lokke, H.; Holmstrup, M.; Krogh, P.H.; Elsgaard, L. Effects and Risk Assessment of Linear Alkylbenzene Sulfonates in Agricultural Soil. 5. Probabilistic Risk Assessment of Linear Alkylbenzene Sulfonates in Sludge-Manded Soils. Environ. Toxicol. Chem. 2001, 20 (8), 1690–1697.
7. Fendinger, N.J.; Versteeg, D.J.; Weeg, E.; Dyer, S.; Rapaport, R.A. Environmental Behavior and Fate of Anionic Surfactants. In: Baker LA, editor. Environmental Chemistry of Lakes and Reservoirs. ACS Advances in Chemistry Series American Chemical Society 1994, 528–57.
8. Versteeg, D.J.; Rawlings, J.M. Bioconcentration and Toxicity of Dodecylbenzene Sulfonate (C12LAS) to Aquatic Organisms Exposed in Experimental Streams. Arch. Environ. Contam. Toxicol. 2003, 44, 237–46.
9. Temara, A.; Carr, G.; Webb, S.; Versteeg, D.J.; Feijtel, T. Marine Risk Assesment: Linear Alkylbenzensulphonates (LAS) in North Sea. Marine Pollution Bulletin 2001 42(8), 635–42.
10. Sanderson, H.; Price, B.B.; Dyer, S.D.; DeCarvalho, A.J.; Robaugh, D.; Waite, S.W. et al. Occurrence and Impact Screening of Alkyl Sulfates and Alkyl Ethoxysulfates in River Sediments. Sci. Total Environ. 2005.
11. DK-EPA. Environmental Project 615: Environ-mental and health assessment of substances in household detergents and cosmetic detergent products 2001. http://www.mst.dk/udgiv/Publica-tions/2001/87-7944-596-9/html/helepubl_eng.htm.
12. Matthijs, E.; Holt, M.S.; Kiewiet, A.; Rijs, G.B.J. Environmental monitoring for Linear Alkylbenzene Sulfonate, Alcohol Ethoxylate, Alcohol Ethoxy Sulfate and Soap. Environ. Toxicol. Chem. 1999, 18, 2634–44.

78 Determination of Linear Alkybenzene Sulphonate in Treatment Plant Wastewater Streams Using On-Line Solid-Phase Extraction Followed by HPLC with Fluorescence Detection
13. Guckert, J.B.; Walker, D.D.; Belanger, S.E. Environmental Chemistry for a Surfactant Ecotoxicology Study Supports Rapid Degradation of C12 Alkyl Sulfate in a Continuous-Flow Stream Mesocosm. Environ. Chem. Toxicol. 1996, 15, 262–9.
14. http://ec.europa.eu/enterprise/chemicals/legisla-tion/detergents/docs/faq_detergent_regulation_march2009.pdf
15. http://ec.europa.eu/environment/waste/sludge/pdf/sludge_en.pdf
16. Schowanek, D.; David, H. et al. Probabilistic Risk Assessment for Linear Alkylbenzene Sulfonate (LAS) in Sewage Sludge Used on Agricultural Soil Regulatory Toxicology and Pharmacology 2007, 49, 245–259
17. Nimer M.; Ballesteros, O.; Navalón, A.; Crovetto, G.; Verge, C.; López, I.; Berna, J.L. Vílchez, J.L. Anal. Bioanal. Chem. 2007, 387, 2175.
18. Comellas L.; Portillo, J.L.; Vaquero, M.T. J. Chromatogr. A 1993, 657, 25.
19. Morales-Muñoz S.; Luque-García, J.L.; Luque de Castro, M.D. J. Chromatogr. A 2004, 1026, 41.
20. Lara-Martín P.A.; Gómez-Parra, A.; González-Mazo, E. J. Chromatogr. A 2006, 1114, 205.
21. Helaleh, M.I.H.; Al-Omair, A.; Nisar, A.; Gevao, B.; J. Chromatogr. A 2005, 1083, 153.
22. Dionex Corporation. Determination of Phenols in Drinking and Bottled Mineral Waters Using Online Solid-Phase Extraction Followed by HPLC with UV Detection. Application Note 191, LPN 1949-02, Sunnyvale, CA, 2008.

79 Sensitive Determination of Microcystins in Drinking and Environmental Waters
INTRODUCTIONWaterblooms of cyanobacteria (blue-green algae) can
produce potent toxins that have become a severe problem for eutrophic aquatic environments. Hepatotoxins are among the primary toxins produced by these species growing in lakes, ponds, and rivers used as drinking water sources. Microcystins (structures shown in Figure 1) are hepatotoxins that exhibit tumor-promoting activity and are among the most commonly found cyanobacteria toxins. Microcystin contamination of drinking water at low nanomolar concentrations is considered a risk factor for cancer, and microcystin-LR has been associated with most of the incidents of toxicity involving microcystins. Therefore, the World Health Organization (WHO) has proposed a provisional guideline concentration of 1.0 μg/L for microcystin-LR in drinking water.1
The analytical approaches commonly used for microcystins include bioassay, chemical, and biochemical methods. Bioassays have been used in screening but were found to be non-specific and/or more time consuming. Biochemical methods, such as enzyme-linked immunosorbent assay (ELISA) and protein phosphatase inhibition assay (PPIA), are advantageous as screening methods due to their high sensitivity and ability to quickly treat a large number of samples; the disadvantage of these methods, however, is that they provide poor identification and have the potential for false positives. Reversed-phase high-performance liquid chromatography (HPLC) with UV detection, liquid chromatography mass spectrometry (LC-MS), and capillary electrophoresis are chemical methods that have been used for the identification and quantification of microcystins.2
The control of microcystins at 1.0 μg/L levels requires sensitive analytical methods and HPLC methods have been widely used for this purpose. Solid-phase extraction (SPE) is one of the main methods for sample extraction and preconcentration; however, the authors of Reference 3 suggest that the typically used SPE stationary phase (C18) does not supply good selectivity for trace analysis.3 Immunoaffinity columns (IAC) modified with anti-microcystin-LR monoclonal antibodies on polypropylene stationary phases have been used for
Sensitive Determination of Microcystins in Drinking and Environmental Waters
Application Note 261
27806
Microcystin-YR
Microcystin-RR
Microcystin-LR
R =
OH
R = H2N
NH
NH
CH2–
–CR =CH3
CH3H
O
OO
O
O
OO
OO
R CH3
CH3
CH3
CH3
CH3
CH3
NH
NH
NH2
NH
HN
HN
OH
OH
OCH3
HN
NH
NH
CH2
N
Figure 1. Structures of microcystins.

80 Sensitive Determination of Microcystins in Drinking and Environmental Waters
The UltiMate 3000 ×2 Dual HPLC system provides an efficient platform to fulfill the requirements of these designs. Sub-μg/L concentrations of microcystins-LR, -RR, and -YR spiked in water samples were determined, which exceeds the WHO requirement.
EQUIPMENTDionex UltiMate 3000 HPLC system including:
DGP-3600A pump with SRD 3600 solvent rack with degasser
WPS-3000TSL semiprep autosampler (with 2500 μL sample loop)*
TCC-3200 Thermostatted Column Compartment equipped with two 2p–6p valves
VWD-3400RS UV-vis detector
Chromeleon software
Orion 420A+ pH meter, Thermo Scientific*The analytical version of the WPS-3000TSL Autosampler can also be converted and used for large-volume injection for on-line SPE. The procedure is the same as specified in Reference 6.
REAGENTSDeionized water, Milli-Q® Gradient A10,
Millipore Corporation
Acetonitrile (CH3CN) and methanol (CH
3OH),
HPLC grade, Fisher
Potassium dihydrogen phosphate (KH2PO
4), dipotassium
hydrogen phosphate (K2HPO
4), and phosphoric acid
(H3PO
4), 85% (analytical grade), SCRC, China
STANDARDS100 μg of microcystins-LR (CAS 101043-37-2),
-RR (CAS 111755-37-4), and -YR (CAS 101064-48-6), respectively, ≥ 95% (HPLC), Alexis Corporation
Prepare stock standard solutions with 50 μg/mL concentrations by dissolving the standards with 2000 μL of methanol. Prepare the standard solutions used for the calibration curve by making appropriate dilutions of the stock standard solutions with water.
SAMPLESTap water samples were collected at the Dionex
Shanghai Applications Lab. The lake water sample was collected at Zhangjiang High-Science and Technology Park located in the Pudong District of Shanghai, China. Bottled spring water samples were purchased from a supermarket in Shanghai. These samples were filtered through a 0.45 μm membrane (Millex-HN) prior to injection.
extraction with good selectivity for the HPLC analysis of microcystins,3-5 but extensive use of this method is limited because an IAC is not commercially available for this application.
The authors have reported a simple, fast, and effective target-cut on-line SPE method followed by HPLC with UV detection on an UltiMate® 3000 HPLC system consisting of a dual gradient pump, autosampler, and column oven equipped with one 2p–6p valve for the determination of trace amounts of vitamin B
12 added
to beverages.6, 7 This on-line SPE method is different from the typical one. The bound analyte on the SPE column is selectively eluted from the SPE column using a mobile phase gradient, just like the first dimension of a two-dimensional chromatography system. This reduces the number of interferences for sample analysis. While the SPE process is running, the analytical column is equilibrating. Just before the front portion of the analyte peak elutes from the SPE column, the SPE column is switched into the analytical flow path. As soon as the analyte is completely eluted from the SPE column, the SPE column is switched out of the analytical flow path and back to the SPE flow path. Therefore, only those interferences co-eluting with the analytes will enter the analytical column; thus, more interferences are removed. The volume of analyte cut from the SPE column is separated on the analytical column and detected by the UV detector. This target-cut on-line SPE method with dual function (analyte capture and partial separation) operates under automatic control of Chromeleon® Chromatography Data System (CDS) software and offers full automation, absence of operator influence, and strict process control, compared to a typical off-line SPE method.8
Here, the target-cut on-line SPE method followed by HPLC with UV detection was applied to the determina-tion of three microcystins (-LR, -RR, and -YR) in drinking, tap, and lake water. The three target analytes were co-eluted from the first column using chromato-graphic conditions that eliminated as many interferences as possible; then the analytes were sent to the analytical flow path and separated on the second column using the same type of stationary phase under different chromato-graphic conditions. This design takes advantage of the separation power of both columns and may eliminate interferences more efficiently than typical on- and off-line SPE methods. An additional dual-valve design is easy to use and convenient for method development.

81 Sensitive Determination of Microcystins in Drinking and Environmental Waters
CHROMATOGRAPHIC CONDITIONS On-Line SPE Column: Acclaim® PA2, 3 μm, 3.0 × 33 mm
(P/N 066276)
Analytical Column: Acclaim PA2, 3 μm, 3.0 × 150 mm
(P/N 063705)
Column Temp.: 40 °C
Mobile Phase: For SPE: A: 22.5 mM KH
2PO
4–2.5 mM K
2HPO
4
buffer (dissolve ~ 3.1 g of KH2PO
4 and
0.44 g of K2HPO
4 in 1 L of water)
B: CH3CN
In gradient (Table 1)
Table 1. Gradients and Valve Switching for Target-Cut On-Line SPE and SeparationTime (min)
Right Pump (for Separation) Left Pump (for On-Line SPE) Valve Switching
Flow Rate
(mL/min)
Solvent A Buffer
(%)
Solvent B CH3CN
(%)
Flow Rate
(mL/min)
Solvent A Buffer
(%)
Solvent B CH3CN
(%)
Left Right
0.00
0.7
85 15
0.7
80 20
6-1
1-2
5.00 — — 80 20 —
6.95 — — — — 6-1
7.00 85 15 65 35 —
7.35 — — — — 1-2
7.50 — — 20 80 —
8.50 — — 20 80 —
8.60 — — 80 20 —
12.0 41 59 — — —
12.1 85 15 — — —
15.0 85 15 80 20 —
Table 2. Gradient and Valve Switching for Traditional On-Line SPE and SeparationTime (min) Right Pump (for Separation) Left Pump (for On-Line SPE) Valve
SwitchingFlow Rate (mL/min)
Solvent A Buffer
(%)
Solvent B CH3CN
(%)
Flow Rate (mL/min)
Solvent A Buffer
(%)
Solvent B CH3CN
(%)
0.00
0.7
80 20
0.7 80 20
1-2
5.00 80 20 6-1
6.00 — — 1-2
9.00 50 50
9.10 25 75
11.0 25 75
11.1 80 20
12.0 80 20
For separation: A: 0.05% (v/v) H
3PO
4 (dilute 0.6 mL
of 85% H3PO
4 to 1 L with water)
B: CH3CN
In gradient (Table 1)
Valve-Switching: Table 1
Flow Rate: 0.7 mL/min for both SPE and separation
Injection Vol.: 2500 μL on the SPE column
UV Detection: Absorbance at 240 nm

82 Sensitive Determination of Microcystins in Drinking and Environmental Waters
RESULTS AND DISCUSSIONRetention Behavior of Microcystins-RR, -YR, and -LR on the Acclaim PA2 Column
The Acclaim Polar Advantage II (PA2) is a polar-embedded column designed for enhanced hydrolytic stability within a wide range of pH values (pH 1.5 to 10), and compatibility with 100% aqueous mobile phases, overcoming the limitations of conventional C8 and C18 reversed-phase columns.
Effect of Buffer pH Value The pH value of the mobile phase buffer may affect
the retention of microcystins-RR, -YR, and -LR. Changes in their retention behavior on the Acclaim PA2 stationary phase were investigated. Experiments showed that when the buffer pH value decreased from pH 6.5 to 2.7, the retention time of microcystins-YR and -LR increased and the resolution between them improved, whereas the retention time of microcystin-RR did not change. The three microcystins were separated at a pH value lower than 2.5. They co-eluted at approximately pH 6.0.
Thus, for the requirements addressed here, the PA2 column is a good choice as an SPE column for concentrating the three microcystins from large-volume water samples (tap water and beverages) and co-eluting them using mobile phase buffer with a high pH value (~ 6.0). The PA2 column is also a good choice as an analytical column for the separation using a mobile phase buffer with a low pH value.
27807
Figure 2. Flow schematics for A) traditional and B) target-cut on-line SPE methods equipped with one 2p–6p valve for sample preparation and analysis.
Effect of Column TemperatureThe effect of column temperature on the retention
of microcystins-RR, -YR, and -LR on the Acclaim PA2 stationary phase was investigated. Increasing column temperature may shorten the retention time, and is a benefit to the separation of microcystins-YR and -LR, which have close retention times. For example, resolution (R
s) between the two compounds increased from
0.50 to 1.94 when the column temperature increased from 25 to 40 ºC.
Comparison of Traditional and Target-Cut On-Line SPE Methods
The commonly used on-line SPE flow scheme (Figure 2A) couples the SPE column directly with the analytical HPLC column using one six-port (2p–6p) column valve. The filtered sample is injected directly onto the system and delivered to the SPE column for enrichment (1-2 position) using the left pump; the analytical column is equilibrated with the right pump at the same time. After the analytes are bound to the SPE column and impurities are washed out, the SPE column is switched into the analytical flow path to elute the bound analytes (6-1 position), then the analytes are separated on the analytical column and detected by the UV detector.
For the target-cut on-line SPE method, a small change in the flow scheme of the traditional on-line SPE mode reverses the flush direction on the SPE column (Figure 2B) and creates an on-line SPE system that can have a dual function to eliminate interferences more efficiently. The SPE process in this mode is different from that described in the traditional method. The bound analyte on the SPE column is selectively eluted from the SPE column using a mobile phase gradient, just like the first dimension of a two-dimensional chromatography system. As the SPE process (position 1-2) is running, the analytical column is equilibrating. Just before the front portion of the analyte peak elutes from the SPE column, the SPE column is switched into the analytical flow path (position 6-1). As soon as the analyte is completely eluted from the SPE column, the SPE column is switched out of the analytical flow path and back to SPE flow path (position 1-2). Therefore, only those interferences co-eluting with the analytes will enter the analytical column; thus, more interferences are removed.

83 Sensitive Determination of Microcystins in Drinking and Environmental Waters
In practice, an additional 2p–6p valve may be used to construct a two-valve (2p–6p) system for convenient method development. The flow schematic of the two-valve configuration is shown in Figure 4. The left valve can be used to switch the SPE column or separation column into the flow path of the detector.
Evaluation of Microcystins Extraction Using the Target-Cut On-Line SPE Method Configuration of Target-Cut Method
This newly developed on-line SPE method with dual function (analyte capture and partial separation) automatically controlled by Chromeleon software was used for analysis of vitamin B
12.6, 7 In that application, it
was easy to configure the instrument and set the method parameters for target-cut mode because there was only a single target analyte and the same mobile phases were used for SPE and separation.
For samples containing more than one target analyte, the choice of target-cut method parameters is important for the success of the on-line SPE method. In theory, the ideal approach would be to cut the analytes one by one from the first stationary phase (SPE column) to the second stationary phase (analytical column), thereby minimizing the interferences entering the analytical flow path. This approach is not recommended, however, because it may result in a complicated valve-switching process and affect the separation on the analytical column.
Figure 3 shows chromatograms of three types of water samples spiked with 1.0 μg/L each of microcystin-RR, -YR, and -LR standard using the traditional and target-cut on-line SPE methods, respectively. Tables 1 and 2 list the gradients and valve-switching times. Comparison of the two on-line SPE methods for analysis of different water samples demonstrates that the target-cut method may flush far fewer interferences to the analytical flow path, which is more efficient for analysis of the three microcystins in different water samples, whereas the traditional on-line SPE method is merely acceptable for the water samples.
SPE Column: Acclaim PA2, 3 µm, 3.0 × 33 mmAnal. Column: Acclaim PA2, 3 µm, 3.0 × 150 mmColumn Temp.: 40 °CEluent for SPE: CH3CN–phosphate buffer (22.5 mM KH2PO4–2.5 mM K2HPO4) A. Isocratic: 20% CH3CN: 80% phosphate buffer (v/v) B. In gradient: CH3CN, 0–5 min, 20%; 7.0 min, 35%; 7.5–8.5 min, 80%; 8.6–15 min, 20%Eluent for Separation: CH3CN–0.05% (v/v) H3PO4, in gradient A. CH3CN, 0–5.0 min, 20%; 9.0 min, 50%; 9.1–11 min, 75%; 11.1–12 min, 20% B. CH3CN, 0–7.0 min, 15%; 12 min, 59%; 12.1–15 min, 15%Flow Rates: 0.7 mL/min for SPE and separationInjection Vol.: 2500 µL on SPE columnDetection: UV at 240 nm
27808
6.5 13-6
0
10
8 10 12Minutes
mAU
6.5 12-6
0
20
8 10
mAU c
b
Micr
ocys
tin-R
R
Micr
ocys
tin-Y
RM
icroc
ystin
-LR
a
A
a
Micr
ocys
tin-R
R
Micr
ocys
tin-Y
RM
icroc
ystin
-LR
c
b
B
Figure 3. Chromatograms of a) bottled spring water, b) tap water, and c) lake water spiked with 1 µg/L each of microcystin-RR, -YR, and -LR standard using A) traditional and B) target-cut on-line SPE methods.
Figure 4. Flow schematic for the target-cut on-line SPE method equipped with two 2p–6p valves.
27809
Position of Left Valve
Position of Right Valve
Description
1-2 1-2 Determine switching time of right valve during method development
6-1 1-2 Load sample and analysis
6-1 6-1 Transfer analytes from SPE column to analytical column

84 Sensitive Determination of Microcystins in Drinking and Environmental Waters
volume of cut analytes separated on the analytical column (Acclaim PA2 column) was large. As shown in Figure 5A, with the target-cut method, a large amount of interferences were still cut to the analytical flow path, which resulted in interference with the determination of microcystins at sub-μg/L concentrations.
The appropriate target-cut method for a sample containing several target analytes is to use a mobile phase that will elute the analytes together (as one chromatographic peak) from the SPE column and then send them to the analytical flow path. Because the volume of cut target analytes is much smaller than that obtained by the alternate method, the co-eluted interferences may be much less; if so, the elimination of interferences will be more efficient.
Using the same determination of microcystins-RR, -YR, and -LR in a spiked tap water sample, Figure 5B shows the target-cut method with a CH
3CN–phosphate
buffer (pH 6.0) mobile phase to elute analytes from the SPE column, and the analytical column using CH
3CN–0.05% H
3PO
4 (v/v, pH 2.2) mobile phase.
Figure 5B shows that this approach does, in fact, have fewer interferences. Note that if the valve-switching times are inaccurate, the difference between the two mobile phases may affect separation of the three microcystins. Therefore, correctly setting valve-switching times is key to success of the target-cut on-line SPE method.
Determination of Valve-Switching TimesBased on the target-cut method in which all three
analytes are eluted from the SPE column together, the valve-switching times for the extraction of microcystins-RR, -YR, and -LR can be estimated using the following equation, which was applied to vitamin B
12 analysis.6
tvalve-switching 2
= tvalve-switching 1
+ (v1/v
2) × w
h
Where tvalve-switching 1
represents the first valve-switching time when the front shoulder of the analyte peak is just eluting from the SPE column at the flow rate for SPE; tvalve-switching 2
represents the second valve-switching time when the SPE column is switched out of the analytical flow path; v
1 and v
2 represent the flow rates for SPE and
separation, respectively; and wh represents baseline peak
width (min) of analytes on the SPE column.
A simpler approach is to start the target-cut when the front shoulder of the first analyte peak is just eluting from the SPE column, then end when the tail of the last analyte peak elutes from the SPE column. This target-cut method is suitable for analytes with similar retention on the SPE column. For example, on the Acclaim PA2 SPE column, the retention times of microcystins-YR and -LR are similar but significantly different from that of microcystin-RR. For the determination of microcystins-RR, -YR, and -LR in a spiked tap water sample, the
SPE Column: Acclaim PA2, 3 µm, 3.0 × 33 mmAnal. Column: Acclaim PA2, 3 µm, 3.0 × 150 mmColumn Temp.: 40 °CEluent for SPE: CH3CN–phosphate buffer (22.5 mM KH2PO4–2.5 mM K2HPO4) In gradient: CH3CN, 0–5 min, 20%; 7.0 min, 35%; 7.5–8.5 min, 80%; 8.6–15 min, 20%Eluent for Separation: CH3CN–0.05% (v/v) H3PO4 In gradient: CH3CN, 0–7.0 min, 15%; 9.0 min, 50%; 12 min, 59%; 12.1–15 min, 15%Flow Rates: 0.7 mL/min for SPE and separationInjection Vol.: 2500 µL on SPE columnDetection: UV at 240 nm
27810
6.5 15-2
0
8
8 10 1412Minutes
mAU
6.5 20-20
0
30
10 15
mAU
2
Micr
ocys
tin-R
R
Micr
ocys
tin-Y
RM
icroc
ystin
-LR
B
1
Micr
ocys
tin-R
R
Micr
ocys
tin-Y
RM
icroc
ystin
-LRA
Figure 5. Chromatograms of a tap water sample spiked with 0.5 µg/L each of microcystin-RR, -YR, and -LR standard using different target-cut modes. A) Valve-switching starts from microcystin-RR and ends at microcystin-LR when they are eluted from the SPE column. B) The three microcystins elute together from the SPE column.

85 Sensitive Determination of Microcystins in Drinking and Environmental Waters
As shown in Figure 7, when tvalve-switching 1
= 7.00 min, all three microcystins were well retained; with 0.10 min earlier (t
valve-switching 1 = 6.90 min), a small part of
microcystin-RR was lost; and with just 0.20 min earlier (t
valve-switching 1 = 6.80 min), microcystin-RR was lost
completely, and more than half of microcystin-LR was lost as well. The authors hypothesize that this analyte loss was due to the cut volume obtained by using the slightly earlier time (0.2 min), which brought mobile phase of higher pH value (pH 6.0) and higher proportion of organic solvent (CH
3CN) to the analytical flow path before
the analytes; this resulted in a change of the intrinsic equilibrium of the analytical column that significantly affected analyte retention. Therefore, the control of valve-switching time t
valve-switching 1 must be accurate.
Figure 6 shows the chromatogram of co-eluted microcystins-RR, -YR, and -LR on the SPE column. The front shoulder of the peak eluting from the SPE column at 0.7 mL/min (v
1) appears at 7.00 min (t
valve-switching 1). The
peak is detected by the UV detector and the baseline peak width on the SPE column is 0.45 min (w
h). When the flow
rate for the separation on the analytical column is also 0.7 mL/min (v
2), the second valve-switching time
(tvalve-switching 2
) calculated using the equation is 7.45 min. The authors tried to have a slightly earlier t
valve-switching 1
and a delay in tvalve-switching 2
(0.10 min) to avoid losing microcystins when using different mobile phases for SPE and separation. Experiments showed that a 0.10 min delay in t
valve-switching 2 had no obvious effect, but 0.10 min earlier
in tvalve-switching 1
resulted in the loss of microcystin-RR.
27811
SPE Column: Acclaim PA2, 3 µm, 3.0 × 33 mmColumn Temp.: 40 °CEluent for SPE: CH3CN–phosphate buffer (22.5 mM KH2PO4–2.5 mM K2HPO4) In gradient: CH3CN, 0–5 min, 20%; 7.0 min, 35%; 7.5–8.5 min, 80%; 8.6–15 min, 20%Flow Rates: 0.7 mL/min for SPE and separationInjection Vol.: 2500 µL on SPE columnDetection: UV at 240 nm Sample: A tap water sample spiked with 2.5 µg/L of each microcystin standard
6.5 8-10
0
50
7.276.8 7.4 7.6 7.8Minutes
mAU
Micr
ocys
tins -
RR, Y
R an
d LR
0.45 min
7.00 min 7.45 minWh
tvalve-switching 1 tvalve-switching 2
Figure 6. Chromatography to determine valve-switching time for the target-cut on-line SPE method based on the configuration showed in Figure 4. 27812
SPE Column: Acclaim PA2, 3 µm, 3.0 × 33 mmAnal. Column: Acclaim PA2, 3 µm, 3.0 × 150 mmColumn Temp.: 40 °CEluent for SPE: CH3CN–phosphate buffer (22.5 mM KH2PO4–2.5 mM K2HPO4) In gradient: CH3CN, 0–5 min, 20%; 7.0 min, 35%; 7.5–8.5 min, 80%; 8.6–15 min, 20%Eluent for Separation: CH3CN–0.05% (v/v) H3PO4 In gradient: CH3CN, 0–7.0 min, 15%; 9.0 min, 50%; 12 min, 59%; 12.1–15 min, 15%Flow Rates: 0.7 mL/min for SPE and separationInjection Vol.: 2500 µL on SPE columnDetection: UV at 240 nm
Minutes 6.5 8 9 10 11 12.5
-5
50
mAU
6.5 8 9 10 11 12.5-5
50
mAU
6.5 8 9 10 11 12.5-5
50
mAU
3
Micr
ocys
tin-Y
R
Micr
ocys
tin-L
R C
Micr
ocys
tin-R
R
Micr
ocys
tin-Y
R
Micr
ocys
tin-L
R
B
2
1
Micr
ocys
tin-R
R
Micr
ocys
tin-Y
R
Micr
ocys
tin-L
RA
Figure 7. Chromatograms of a mixture of microcystin-RR, -YR, and -LR standards with concentration 1.0 µg/L for each extracted at different valve-switching times: A) t
valve-switching 1 = 7.00 min, B) t
valve-switching 1 = 6.90 min, and
C) tvalve-switching 1
= 6.80 min.

86 Sensitive Determination of Microcystins in Drinking and Environmental Waters
cut from SPE to the analytical flow path, which resulted in poor peak shape and less detection sensitivity for microcystins-YR and -LR. Therefore, the 3.0 × 33 mm Acclaim PA2 column was selected as the SPE column for this application.
Method Reproducibility, Linearity, and Detection LimitsMethod reproducibility was estimated by making
six consecutive 2500 μL injections of a drinking water sample spiked with 0.5 μg/L of each microcystin standard. Retention time and peak area reproducibilities are summarized in Table 3 and show good precision. Figure 9 shows an overlay of chromatograms for the six consecutive injections.
Selection of SPE Column FormatThe effect of SPE column size on elimination of
impurities using the target-cut on-line SPE method was investigated. Two Acclaim PA2 columns with different sizes, 4.6 × 50 mm and 3.0 × 33 mm, were used for SPE. As shown in Figure 8, interference elimination was slightly better on the larger column, which can be attributed to separation on the larger column being more efficient than that on the smaller one; therefore, fewer impurities enter the analytical flow path. However, the larger column did have a significant effect on separation on the analytical column due to more mobile phase being
SPE Column: Acclaim PA2, 3 µm, 3.0 × 33 mm Acclaim PA2, 3 µm, 4.6 × 50 mmAnal. Column: Acclaim PA2, 3 µm, 3.0 × 150 mmColumn Temp.: 40 °CEluent for SPE: CH3CN–phosphate buffer (22.5 mM KH2PO4–2.5 mM K2HPO4) In gradient: CH3CN, 0–5 min, 20%; 7.0 min, 35%; 7.5–8.5 min, 80%; 8.6–15 min, 20%Eluent for Separation: CH3CN–0.05% (v/v) H3PO4 In gradient: CH3CN, 0–7.0 min, 15%; 12 min, 59%; 12.1–15 min, 15%Flow Rates: 0.7 mL/min for SPE and separationInjection Vol.: 2500 µL on SPE columnDetection: UV at 240 nm
27813
5.5 13-2
0
8
7 8 9 141110Minutes
mAU
7.5 15-20
0
6
9 10 11 12 13 14
mAU
2
Micr
ocys
tin-R
R
Micr
ocys
tin-Y
RM
icroc
ystin
-LR
B
1
Micr
ocys
tin-R
R
Micr
ocys
tin-Y
R
Micr
ocys
tin-L
R A
Figure 8. Chromatograms of a lake water sample spiked with 1.0 µg/L each of microcystin-RR, -YR, and -LR standard using different size SPE columns: A) Acclaim PA2, 3 µm, 3.0 × 33 mm column, and B) Acclaim PA2, 3 µm, 4.6 × 50 mm column with the target-cut on-line SPE method in Table 1.
SPE Column: Acclaim PA2, 3 µm, 3.0 × 33 mmAnal. Column: Acclaim PA2, 3 µm, 3.0 × 150 mmColumn Temp.: 40 °CEluent for SPE: CH3CN–phosphate buffer (22.5 mM KH2PO4–2.5 mM K2HPO4) Eluent for Separation: CH3CN–0.05% (v/v) H3PO4, in gradient CH3CN, 0–7.0 min, 15%; 12 min, 59%; 12.1–15 min, 15%Flow Rates: 0.7 mL/min for SPE and separationInjection Vol.: 2500 µL on SPE columnDetection: UV at 240 nm
27814
6.5 15-1
0
10
8 10 1412Minutes
mAU
654321
MC-
RR MC-
YR M
C-LR
Figure 9. Overlay of chromatograms of six consecutive injec-tions of a drinking water sample spiked with 0.5 µg/L each of microcystin-RR, -YR, and -LR standard using the target-cut on-line SPE method in Table 1.
Table 3. Reproducibility for Peak Retention Time and Area
Microcystins Retention Time RSD
Peak Area RSD
Concentration of standard
(µg/L)
RR 0.037 1.53 0.5
YR 0.028 1.59 0.5
LR 0.029 1.13 0.5

87 Sensitive Determination of Microcystins in Drinking and Environmental Waters
Calibration linearity for microcystins-RR, -YR, and -LR was investigated by making three consecutive injections of a mixed standard prepared at five different concentrations. The external standard method was used to establish the calibration curve and to quantify these microcystins in samples. Excellent linearity was observed from 0.1 to 10 μg/L when plotting concentration versus peak area. Figure 10 shows a chromatogram of the three microcystins with concentrations of 0.1 μg/L each. Table 4 reports the data from the calibration as calculated by Chromeleon software.
Detection limits were calculated using the equation: Detection limit = S
t(n – 1, 1 - α = 0.99)
Where S represents Standard Deviation (SD) of replicate analyses, n represents number of replicates, t(n – 1, 1 - α= 0.99)
represents Student’s value for the 99% confidence level with n – 1 degrees of freedom.
Method detection limits (MDL) were estimated using six consecutive injections of drinking water sample spiked with 0.5 μg/L of each microcystin standard to determine S (Table 4).
Table 4. Calibration Data and MDLs for Microcystins-RR, -YR, and -LR
Microcystin Regression Equations
r (%) Range of Standards
µg/L
RSD for Calibration
Curve
MDL* (µg/L)
RR A = 0.0844 c - 0.0027 99.997
0.1–10
0.91 0.028
YR A = 0.1054 c - 0.0022 99.994 1.25 0.028
LR A = 0.0942 c + 0.0030 99.994 1.21 0.019
Note. * The single-sided Student’s test method (at the 99% confidence limit) was used for determining MDL, where the standard deviation (SD) of the peak area of six injections is multiplied by 4.03 to yield the MDL.
SPE Column: Acclaim PA2, 3 µm, 3.0 × 33 mmAnal. Column: Acclaim PA2, 3 µm, 3.0 × 150 mmColumn Temp.: 40 °CEluent for SPE: CH3CN–phosphate buffer (22.5 mM KH2PO4–2.5 mM K2HPO4) In gradient: CH3CN, 0–5 min, 20%; 7.0 min, 35%; 7.5–8.5 min, 80%; 8.6–15 min, 20%Eluent for Separation: CH3CN–0.05% (v/v) H3PO4, in gradient CH3CN, 0–7.0 min, 15%; 12 min, 59%; 12.1–15 min, 15%Flow Rates: 0.7 mL/min for SPE and separationInjection Vol.: 2500 µL on SPE columnDetection: UV at 240 nm
27815
10 12.5-0.5
3
10.2 10.4 10.6 10.8 11.2 11.4 11.6 11.811 12.212Minutes
mAU
Micr
ocys
tin-R
R
Micr
ocys
tin-Y
R
Micr
ocys
tin-L
R
Figure 10. Chromatogram of a mixed solution with concentrations of 0.1 µg/L each of microcystin-RR, -YR, and -LR standard using the target-cut on-line SPE method in Table 1.

88 Sensitive Determination of Microcystins in Drinking and Environmental Waters
Sample AnalysisFigure 11 shows chromatograms of tap water, lake
water, and bottled spring water samples, as well as the same samples spiked with 0.5 μg/L of each microcystin standard. None of the three samples had detectable microcystins. Recoveries for each standard in all three samples ranged from 92 to 100%, thus indicating that the analysis method is accurate (Table 5).
CONCLUSIONThis work describes a target-cut on-line SPE method
that can fully recover low concentrations (< 1 μg/L) of three microcystins (-RR, -YR, and -LR) when added to three different water samples. These concentrations are less than the maximum concentrations recommended by WHO. This method is fully automated and easily configured on an UltiMate 3000 ×2 Dual HPLC system.
Table 5. Analysis Results of Microcystins-RR, -YR, and -LR in the SamplesSample Tap Water Lake Water Bottled Spring Water
Microcystin Detected (µg/L)
Added (µg/L)
Found (µg/L)
Recovery (%)
Detected (µg/L)
Added (µg/L)
Found (µg/L)
Recovery (%)
Detected (µg/L)
Added (µg/L)
Found (µg/L)
Recovery (%)
RR ND 0.50 0.48 96 ND 0.50 0.55 110 ND 0.50 0.49 98
YR ND 0.50 0.46 92 ND 0.50 0.51 102 ND 0.50 0.48 96
LR ND 0.50 0.48 96 ND 0.50 0.51 102 ND 0.50 0.49 98
Note: * ND = not detected
27816
SPE Column: Acclaim PA2, 3 µm, 3.0 × 33 mmAnal. Column: Acclaim PA2, 3 µm, 3.0 × 150 mmColumn Temp.: 40 °CEluent for SPE: CH3CN–phosphate buffer (22.5 mM KH2PO4–2.5 mM K2HPO4) In gradient: CH3CN, 0–5 min, 20%; 7.0 min, 35%; 12min, 59%; 12.1–15 min, 15%Eluent for Separation: CH3CN–0.05% (v/v) H3PO4 In gradient: CH3CN, 0–7.0 min, 15%; 7.5–8.5 min, 80%; 8.6–15 min, 20%Flow Rates: 0.7 mL/min for SPE and separationInjection Vol.: 2500 µL on SPE columnDetection: UV at 240 nmSamples: A. Tap water B. Lake water C. Bottled spring water
Minutes 6.5 8 10 12 14 15
-1
8
mAU
6.5 8 10 12 14 15-1
8
mAU
6.5 8 10 12 14 15-1
8
mAU
Micr
ocys
tin-R
R M
icroc
ystin
-YR
Micr
ocys
tin-L
R C
ab
Micr
ocys
tin-R
R M
icroc
ystin
-YR
Micr
ocys
tin-Y
R
b
B
a
A
Micr
ocys
tin-R
R M
icroc
ystin
-YR
Micr
ocys
tin-Y
R
ba
Figure 11. Overlay of chromatograms for a) water sample and b) the same sample spiked with 0.5 µg/L each of microcystin-RR, -YR, and -LR standard using the target-cut on-line SPE method in Table 1.

89 Sensitive Determination of Microcystins in Drinking and Environmental Waters
REFERENCESCyanobacterial Toxins: Microcystin-LR in Drinking-
Water; Background Document for Development of WHO Guidelines for Drinking-Water Quality: World Health Organization, 2003.
Lee, H.S.; Jeong, C.K.; Lee, H.M.;Choi, S.J.; Do, K.S.; Kim, K.; Kim, Y.H. On-Line Trace Enrichment for the Simultaneous Determination of Microcystins in Aqueous Samples Using High-Performance Liquid Chromatography with Diode-Array Detection. J. Chromatogr. A 1999, 848, 179.
Aguete, E.C.; Gago-Martínez, A.; Leão, J.M.; Rodríguez-Vázquez, J.A.; Menàrd, C.; Lawrence, J.F. HPLC and HPCE Analysis of Microcystins RR, LR, and YR Present in Cyanobacteria and Water by Using Immunoaffinity Extraction. Talanta, 2003, 59, 697.
Kondo, F.; Matsumoto, H.; Yamada, S.; Tsuji, K.; Ueno, Y.; Harada, K. Immunoaffinity Purification Method for Detection and Quantification of Microcystins in Lake Water. Toxicon. 2000, 38, 813.
Tsutsumi, T.; Nagata, S.; Hasegawa, A.; Ueno, Y. Immunoaffinity Column as Clean-Up Tool for Determination of Trace Amounts of Microcystins in Tap Water. Food Chem. Toxicol. 2000, 38, 593.
Dionex Corporation, Determination of Vitamin B12
in Beverages Using On-Line SPE Followed by HPLC with UV Detection. Application Note 256, LPN 2574, 2010, Sunnyvale, CA.
Dionex Corporation, Determination of Water- and Fat-Soluble Vitamins by HPLC. Technical Note 89, LPN 2598, 2010, Sunnyvale, CA.
Sun, Q.L; Zhuang, S.Q. Determination of Vitamin B12
Using UPLC; Application Summary for Waters Corporation: Milford, MA, 2010.

Column Selection GuideEnvironmental Water Applications Notebook

Column Selection Guide and Specificatiotns 91
Column Selection Guide
Silica Columns Reversed-Phase (RP) Mixed-Mode HILIC Application-Specific
Example Applications
Accla
im 1
20 C
18
Accla
im 1
20 C
8
Accla
im 3
00 C
18
Accla
im P
olar
Adv
anta
ge (P
A)
Accla
im P
olar
Adv
anta
ge II
(PA2
)
Accla
im P
heny
l-1
Accla
im Tr
inity
P1
Accla
im M
ixed-
Mod
e W
AX-1
Accla
im M
ixed-
Mod
e W
CX-1
Accla
im M
ixed-
Mod
e HI
LIC-1
Accla
im H
ILIC-
10
Accla
im O
rgan
ic Ac
id
Accla
im S
urfa
ctan
t
Accla
im E
xplo
sives
E1
Accla
im E
xplo
sives
E2
Accla
im C
arba
mat
e
Gene
ral A
pplic
atio
ns
Neutral Molecules
High hydrophobicity √ √ √ √ √ √ √ √ √ √ √ Fat-soluble vitamins, PAHs, glycerides
Intermediate hydrophobicity √ √ √ √ √ √ √ √ √ √ Steroids, phthalates, phenolics
Low hydrophobicity √ √ √ √ √ Acetaminophen, urea, polyethylene glycols
Anionic Molecules
High hydrophobicity √ √ √ √ √ √ √ √ √ √ NSAIDs, phospholipids
Intermediate hydrophobicity √ √ √ √ √ √ √ √ √ Asprin, alkyl acids, aromatic acids
Low hydrophobicity √ √ √ √ √ Small organic acids, e.g. acetic acids
Cationic Molecules
High hydrophobicity √ √ √ √ √ √ √ √ √ Antidepressants
Intermediate hydrophobicity √ √ √ √ √ √ √ √ √ Beta blockers, benzidines, alkaloids
Low hydrophobicity √ √ √ √ √ √ Antacids, pseudoephedrine, amino sugars
Amphoteric/ Zwitterionic Molecules
High hydrophobicity √ √ √ √ √ √ √ √ √ √ Phospholipids
Intermediate hydrophobicity √ √ √ √ √ √ √ Amphoteric surfactants, peptides
Low hydrophobicity √ √ √ √ √ √ √ Amino acids, aspartame, small peptides
Mixtures of Neutral, Anionic,
Cationic Molecules
Neutrals and acids √ √ √ √ √ Artificial sweeteners
Neutrals and bases √ √ √ √ √ Cough syrup
Acids and bases √ √ Drug active ingredient with counterion
Neutrals, acids, and bases √ √ Combination pain relievers
Spec
ific
Appl
icat
ions
Surfactants
Anionic √ √ √ √ √ √ SDS, LAS, laureth sulfates
Cationic √ Quats, benzylalkonium in medicines
Nonionic √ √ √ √ √ √ √ Triton X-100 in washing tank
Amphoteric √ √ √ √ √ √ Cocoamidopropyl betaine
Hydrotropes √ Xylenesulfonates in handsoap
Surfactant blends √ Noionic and anionic surfactants
Organic AcidsHydrophobic √ √ √ Aromatic acids, fatty acids
Hydrophilic √ √ √ Organic acids in soft drinks, pharmaceuticals
Environmental Contaminants
Explosives √ √ U.S. EPA Method 8330, 8330B
Carbonyl compounds √ U.S. EPA 1667, 555, OT-11; CA CARB 1004
Phenols √ √ Compounds regulated by U.S. EPA 604
Chlorinated/Phenoxy acids √ U.S. EPA Method 555
Triazines √ √ Compounds regulated by U.S. EPA 619
Nitrosamines √ Compounds regulated by U.S. EPA 8270
Benzidines √ √ U.S. EPA Method 605
Perfluorinated acids √ Dionex TN73
Microcystins √ ISO 20179
Isocyanates √ √ U.S. OSHA Methods 42, 47
Carbamate insecticides √ U.S. EPA Method 531.2
VitaminsWater-soluble vitamins √ √ √ Vitamins in dietary supplements
Fat-soluble vitamins √ √ √ √ √ √ √ Vitamin pills
Pharmacutical Counterions
Anions √ √ Inorgaic anions and organic acids in drugs
Cations √ √ Inorgaic cations and organic bases in drugs
Mixture of Anions and Cations √ Screening of pharmaceutical counterions
API and counterions √ Naproxen Na+ salt, metformin Cl-salt, etc.

92 Column Selection Guide and Specifications Column Selection Guide and Specificatiotns 93
Polymer Columns
IonP
ac A
S23
IonP
ac A
S22
IonP
ac A
S22-
Fast
IonP
ac A
S14/
A
IonP
ac A
S12A
IonP
ac A
S9/H
C/SC
IonP
ac A
S4A/
SC
IonS
wift
MAX
-100
IonP
ac A
S24
IonP
ac A
S21
IonP
ac A
S20
IonP
ac A
S19
IonP
ac A
S18
IonP
ac A
S18-
Fast
IonP
ac A
S17-
C
IonP
ac A
S16
IonP
ac A
S15
IonP
ac A
S11(
-HC)
IonP
ac A
S10
IonP
ac A
S7
IonP
ac A
S5
IonP
ac
Fast
Ani
on II
IA
Omni
Pac
PAX-
100
Omni
Pac
PAX-
500
ANIO
NS
Inorganic Anions √ √ √ √ √ √ √ √ √ √ √ √ √ √ √ √ √
Oxyhalides √ √ √ √ √
Bromate √ √ √ √
Perchlorate √ √ √
Organic Acids √ √ √ √ √
Phosphoric/Citric Acids √
Poly/High-Valence Anions √ √ √ √ √ √
Hydrophobic Anions √ √ √ √
Hydrophobic/Halogenated Anions √ √ √ √
Anionic Neutral Molecules √ √ √ √ √
CATI
ONS
Inorganic Cations
Sodium/Ammonium
Amines/Polyvalent Amines
Aliphatic/Aromatic Amines
Alkanol/Ethhanolamines
Biogenic Amines
Transition/Lanthanide Metals
Hydrophobic Cations
Cationic Neutral Molecules
BIO-
MOL
ECUL
ES
Amino Acids
Phosphorylated Amino Acids
Amino Sugars
Oligosccharides
Mono-/Di-Saccharides
Glycoproteins
Alditols/Aldoses mono/di Saccharides
ds Nucleic Acids
Single-Stranded Oligonucleotides
Peptides
Proteins
Metal-binding Proteins
Monoclonal antibodies
ORGA
NIC
MOL
ECUL
ES
Aliphatic Organic Acids
Alcohols
Borate
Large Molecules, Anions
Small Molecules
Small Molecules/LC-MS
Polar/Non-Polar Small Molecules
Hydrophobic/Aliphatic Organic Acids
Surfactant Formulations
Explosives/EPA 8330
MOD
E
Anion Exchange / Carbonate √ √ √ √ √ √ √
Anion Exchange / Hydroxide √ √ √ √ √ √ √ √ √ √ √ √ √ √ √
Cation Exchange
Multi-Mode √ √
Affinity
Ion Exclusion
Reversed Phase
Anion Exchange/Other
IonP
ac C
S18
IonP
ac C
S17
IonP
ac C
S16
IonP
ac C
S15
IonP
ac C
S14
IonP
ac C
S12A
IonP
ac C
S11
IonP
ac C
S10
IonP
ac C
S5A
Omni
Pac
PCX-
100
Omni
Pac
PCX-
500
Amin
oPac
PA1
0
Amin
oPac
PA1
Carb
oPac
PA2
00
Carb
oPac
PA1
00
Carb
oPac
PA2
0
Carb
oPac
PA1
0
Carb
oPac
PA1
Carb
oPac
MA1
DNAP
ac P
A200
DNAP
ac P
A100
ProP
ac W
AX/S
AX
ProP
ac W
CX/S
CX
ProP
ac IM
AC
ProP
ac H
IC
ProP
ac P
A1
ProS
wift
IonP
ac IC
E-AS
6
IonP
ac IC
E-AS
1
IonP
ac IC
E-Bo
rate
IonP
ac N
S1
√ √ √ √ √ √ √ √
√ √ √
√ √
√ √ √
√ √ √
√ √
√
√ √ √ √
√
√ √
√
√ √ √ √ √
√ √ √ √
√ √ √ √
√ √ √ √
√ √ √ √
√ √
√ √ √
√ √ √ √
√ √ √ √ √ √
√
√ √ √ √ √ √ √ √ √ √ √
√ √ √
√ √
√
√
√
√ √ √ √ √ √
√ √ √ √ √ √ √ √ √ √ √ √
√ √
√
√ √ √
√ √ √ √
√ √ √ √ √ √ √

94 Column Selection Guide and Specifications Column Selection Guide and Specificatiotns 95
IC Anion Columns
Column FormatPrimary
Eluent Application
Parti
cle
Diam
eter
Subs
trate
Cros
slin
king
Late
x Di
amet
er
Late
x
Cros
slin
king
Capa
city
(per
col
umn)
Func
tiona
l
Grou
p
Hydr
opho
bici
ty
IonPac AS12A
2 × 200 mm
4 × 200 mm
Carbonate Moderate capacity for analysis of inorganic anions and oxyhalides. Trace chloride and sulfate in high carbonate matrices.
9 µm 55% 140 nm
0.20% 13 µeq 52 µeq
Alkyl quaternary ammonium
Medium
IonPac AS11-HC
2 × 250 mm
4 × 250 mm
Hydroxide High capacity for the determination of organic acids and inorganic anions in uncharacterized samples.
9 µm 55% 70 nm
6% 72.5 µeq 290 µeq
Alkanol quaternary ammonium
Medium-Low
IonPac AS11
2 × 250 mm
4 × 250 mm
Hydroxide Low capacity for fast profiling of organic acids and inorganic anions in well-characterized samples.
13 µm 55% 85 nm
6% 11 µeq 45 µeq
Alkanol quaternary ammonium
Very Low
IonPac AS10
2 × 250 mm
4 × 250 mm
Hydroxide High capacity for the analysis of inorganic anions and organic acids in high nitrate samples.
8.5 µm 55% 65 nm
5% 42.5 µeq 170 µeq
Alkyl quaternary ammonium
Low
IonPac AS9-HC
2 × 250 mm
4 × 250 mm
Carbonate High-capacity column for inorganic anions and oxyhalides. Trace bromate in drinking water.
9 µm 55% 90 nm
18% 48 µeq 190 µeq
Alkyl quaternary ammonium
Medium-Low
IonPac AS9-SC
4 × 250 mm Carbonate Low capacity for fast analysis of inorganic anions and oxyhalides. Specified column in US EPA Method 300.0 (B).
13 µm 55% 110 nm
20% 30-35 µeq Alkyl quaternary ammonium
Medium-Low
IonPac AS4A-SC
2 × 250 mm
4 × 250 mm
Carbonate Low capacity for fast analysis of common inorganic anions. Specified column in U.S. EPA Method 300.0 (A).
13 µm 55% 160 nm
0.50% 5 µeq
20 µeq
Alkanol quaternary ammonium
Medium-Low
IonPac Fast Anion IIIA
3 × 250 mm Hydroxide Recommended column for phosphoric and citric acids in cola soft drinks.
7.5 µm 55% - - 55 µeq Alkanol quaternary ammonium
Ultralow
IonPac AS7
4 × 250 mm Specialty Eluents
Polyvalent anions including chelating agents, polyphosphates and polyphosphonates. Cyanide, sulfide, hexavalent chromium, and arsenic speciation.
10 µm 2% 530 nm
5% 100 µeq Alkyl quaternary ammonium
Medium-High
IonPac AS5A
4 × 150 mm Hydroxide Low capacity for fast profiling of organic acids and inorganic anions in well-characterized samples.
5 µm 2% 60 nm
4% 35 µeq Alkanol quaternary ammonium
Low
IonPac AS5
4 × 250 mm Hydroxide Metal-EDTA complexes, metal-cyanide complexes, and oxyanions.
15 µm 2% 120 nm
1% 20 µeq Alkanol quaternary ammonium
Low
Column SpecificationsColumn Specifications
Column Specifications
IC Anion Columns
Column FormatPrimary
Eluent Application
Parti
cle
Diam
eter
Subs
trate
Cros
slin
king
Late
x Di
amet
er
Late
x
Cros
slin
king
Capa
city
(per
col
umn)
Func
tiona
l
Grou
p
Hydr
opho
bici
ty
IonPac AS24
2 × 250 mm Hydroxide Recommended column for haloacetic acids prior to MS or MS/MS detection
7 µm 55% - - 140 µeq Alkanol quaternary ammonium
Ultralow
IonPac AS23
2 × 250 mm
4 × 250 mm
Carbonate Recommended column for inorganic anions and oxyhalides. Trace bromate in drinking water.
6 µm 55% - - 80 µeq
320 µeq
Alkyl quaternary ammonium
Ultralow
IonPac AS22
2 × 250 mm
4 × 250 mm
Carbonate Recommended column for fast analysis of common inorganic anions.
6.5 µm 55% - - 52.5 µeq
210 µeq
Alkyl quaternary ammonium
Ultralow
IonPac AS21
2 × 250 mm Hydroxide Recommended column for trace perchlorate prior to MS or MS/MS detection
7.0 µm 55% - - 45 µeq Alkanol quaternary ammonium
Ultralow
IonPac AS20
2 × 250 mm
4 × 250 mm
Hydroxide Recommended column for trace perchlorate prior to suppressed conductivity detection.
7.5 µm 55% - - 77.5 µeq
310 µeq
Alkanol quaternary ammonium
Ultralow
IonPac AS19
2 × 250 mm
4 × 250 mm
Hydroxide Recommended column for inorganic anions and oxyhalides. Trace bromate in drinking water.
7.5 µm 55% - - 60 µeq
350 µeq
Alkanol quaternary ammonium
Low
IonPac AS18
2 × 250 mm
4 × 250 mm
Hydroxide Recommended column for the analysis of common inorganic anions.
7.5 µm 55% 65 nm
8% 75 µeq
285 µeq
Alkanol quaternary ammonium
Low
IonPac AS17-C
2 × 250 mm
4 × 250 mm
Hydroxide Trace anions in HPW matrices. Carboxylated resin, no sulfate blank. Low capacity for fast analysis of common inorganic anions using gradient elution with the Eluent Generator.
10.5 µm
55% 75 nm
6% 7.5 µeq
30 µeq
Alkanol quaternary ammonium
Low
IonPac AS16
2 × 250 mm
4 × 250 mm
Hydroxide High capacity for hydrophobic anions including iodide, thiocyanate, thiosulfate, and perchlorate. Polyvalent anions including: polyphosphates and polycarboxylates
9 µm 55% 80 nm
1% 42.5 µeq 170 µeq
Alkanol quaternary ammonium
Ultralow
IonPac AS15
2 × 250 mm
4 × 250 mm
Hydroxide High capacity for trace analysis of inorganic anions and low molecular weight organic acids in high purity water matrices.
9 µm 55% - - 56.25 µeq 225 µeq
Alkanol quaternary ammonium
Medium-High
IonPac AS15- 5mm
3 × 150 mm Hydroxide Fast run, high capacity for trace analysis of inorganic anions and low molecular weight organic acids in high purity water matrices.
5 µm 55% - - 70 µeq Alkanol quaternary ammonium
Medium-High
IonPac AS14A- 5 µm
3 × 150 mm Carbonate Recommended column for fast analysis of common inorganic anions.
5 µm 55% - - 40 ueq Alkyl quaternary ammonium
Medium
IonPac AS14A
4 × 250 mm Carbonate For analysis of common inorganic anions.
7 µm 55% - - 120 µeq Alkyl quaternary ammonium
Medium
IonPac AS14
2 × 250 mm
4 × 250 mm
Carbonate Moderate capacity for fast analysis of common inorganic anions.
9 µm 55% - - 16 µeq
65 µeq
Alkyl quaternary ammonium
Medium-High

96 Column Selection Guide and Specifications
Column Specifications
IC Cation Columns
Column FormatPrimary
Eluent Application
Parti
cle
Diam
eter
Subs
trate
Cros
slin
king
Late
x Di
amet
er
Late
x
Cros
slin
king
Capa
city
(per
col
umn)
Func
tiona
l Gro
up
Hydr
opho
bici
ty
IonPac CS18
2 × 250 mm MSA Recommended column for polar amines (alkanolamines and methylamines) and moderately hydrophobic and polyvalent amines (biogenic and diamines). Nonsuppressed mode when extended calibration linearity for ammonium and weak bases is required
6 µm 55% - - 0.29 µeq Carboxylic acid
Medium
IonPac CS17
2 × 250 mm
4 × 250 mm
MSA Recommended column for hydrophobic and polyvalent amines (biogenic amines and diamines)
7 µm 55% - - 0.363 µeq 1.45 µeq
Carboxylic acid
Very Low
IonPac CS16
3 × 250 mm
5 × 250 mm
MSA Recommended column for disparate concentration ratios of adjacent-eluting cations such as sodium and ammonium. Can be used for alkylamines and alkanolamines.
5 µm 55% - - 3.0 µeq 8.4 µeq
Carboxylic acid
Medium
IonPac CS15
2 × 250 mm
4 × 250 mm
MSA Disparate concentration ratios of ammonium and sodium. Trace ethanolamine in high-ammonium or high- potassium concentrations. Alkanolamines.
8.5 µm 55% - - 0.7 µeq 2.8 µeq
Carboxylic acid/ phosphonic acid/ crown ether
Medium
IonPac CS14
2 × 250 mm
4 × 250 mm
MSA Aliphatic amines, aromatic amines, and polyamines plus mono- and divalent cations.
8.5 µm 55% - - 0.325 µeq 1.3 µeq
Carboxylic acid
Low
IonPac CS12A-MS
2 × 100 mm MSA IC-MS screening column for fast elution and low flow rates required for interfacing with IC-MS
8.5 µm 55% - - 0.28 µeq Carboxylic acid/ phosphonic acid
Medium
IonPac CS12A- 5 µm
3 × 150 mm MSA Recommended column for high efficiency and fast analysis (3 min) of mono- and divalent cations.
5 µm 55% - - 0.94 µeq Carboxylic acid/ phosphonic acid
Medium
IonPac CS12A
2 × 250 mm
4 × 250 mm
MSA Recommended column for the separation of mono- and divalent cations. Manganese morpholine, alkylamines, and aromatic amines.
8.5 µm 55% - - 0.7 µeq 2.8 µeq
Carboxylic acid/ phosphonic acid
Medium
IonPac CS11
2 × 250 mm HCl + DAP Separation of mono- and divalent cations. Ethanolamines if divalent cations are not present.
8 µm 55% 200 nm 5% 0.035 µeq Sulfonic acid Medium
IonPac CS10
4 × 250 mm HCl + DAP Separation of mono- and divalent cations.
8.5 µm 55% 200 nm 5% 0.08 µeq Sulfonic acid Medium
IonPac CS5A
2 × 250 mm
4 × 250 mm
Pyridine dicarboxylic acid
Recommended column for transition and lanthanide metals analysis. Aluminum analysis.
9 µm 55% 140 nm
75 nm
10%
20%
0.02 µeq/ 0.005 µeq
0.04 µeq/ 0.01 µeq
Sulfonic acid/ alkanol quaternary ammonium
-

Transferring HPLC Methods to UHPLCEnvironmental Water Applications Notebook

98 Easy Method Transfer from HPLC to RSLC with the Dionex Method Speed-Up Calculator
Technical Note 75
Easy Method Transfer from HPLC to RSLC with the Dionex Method Speed-Up Calculator
INTRODUCTIONThe goal of every chromatographic optimization is
a method that sufficiently resolves all peaks of interest in as short a time as possible. The evolution of packing materials and instrument performance has extended chromatographic separations to new limits: ultrahigh-performance liquid chromatography (UHPLC).
The new Dionex UltiMate® 3000 Rapid Separation LC (RSLC) system is ideal for ultrafast, high-resolution LC. The RSLC system was designed for ultrafast separations with flow rates up to 5 mL/min at pressures up to 800 bar (11,600 psi) for the entire flow-rate range. This industry-leading flow-pressure footprint ensures the highest flexibility possible; from conventional to ultrahigh-resolution to ultrahigh-speed methods. The RSLC system, with autosampler cycle times of only 15 seconds, oven temperatures up to 110 °C, and data
collection rates up to 100 Hz (even when acquiring UV-Vis spectra), sets the standard for UHPLC performance. Acclaim® RSLC columns with a 2.2 µm particle size complete the RSLC dimension.
A successful transfer from an HPLC method to an RSLC method requires recalculation of the chromatographic parameters. Underlying chromatographic principles have to be considered to find the appropriate parameters for a method transfer. With the Method Speed-up Calculator, Dionex offers an electronic tool that streamlines the process of optimum method transfer. This technical note describes the theory behind the Method Speed-Up Calculator and the application of this interactive, multi-language tool, illustrated with an exemplary method transfer from a conventional LC separation to an RSLC separation. You may obtain a copy of this calculator from your Dionex representative.

99 Easy Method Transfer from HPLC to RSLC with the Dionex Method Speed-Up Calculator
in determining the optimum mobile phase flow rate for highest column efficiency with lowest plate heights. A simplification of the Van Deemter equation, according to Halász1 (Formula 3), describes the relationship between column efficiency (expressed in plate height H), particle size d
p (in µm) and velocity of mobile phase u (in mm/s):
The plots of plate height H against velocity u depending on the particle sizes dp of the stationary phase (see Figure 1, top) demonstrate visually the key function of small particle sizes in the method speed-up strategy: The smaller the particles, the smaller the plate height and therefore the better the separation efficiency. An efficiency equivalent to larger particle columns can be achieved by using shorter columns and therefore shorter run times.
Another benefit with use of smaller particles is shown for the 2 µm particles in Figure 1: Due to improved mass transfer with small particle packings, further acceleration of mobile phases beyond the optimal flow rate with minimal change in the plate height is possible.
Optimum flow rates and minimum achievable plate heights can be calculated by setting the first derivative of the Halász equation to zero. The optimal linear velocity (in mm/s) is then calculated by Formula 4.
The minimum achievable plate height as a function of particle size is calculated by insertion of Formula 4 in Formula 3, resulting in Formula 5.
Chromatographers typically prefer resolution over theoretical plates as a measure of the separation quality. The achievable resolution R of a method is directly proportional to the square root of the theoretical plate number as can be seen in Formula 6. k is the retention factor of the analyte and k the selectivity.
H
LN =
uCu
BAH ⋅++=
20
62
2 ud
udH
p
p
⋅++⋅=
pdH ⋅� 3min
αα 1
14
1
2
2 −⋅+
⋅⋅=k
kNR
Formula 1:
Formula 2:
Formula 3:
popt dC
Bu
10.95==Formula 4:
Formula 5:
Formula 6:
METHOD SPEED-UP STRATEGYThe purpose of method speed-up is to achieve
sufficient resolution in the shortest possible time. The strategy is to maintain the resolving power of the application by using shorter columns packed with smaller particles. The theory for this approach is based on chromatographic mechanisms, found in almost every chromatography text book. The following fundamental chromatographic equations are applied by the Method Speed-Up Calculator for the method transfer from conventional to ultrafast methods.
The separation efficiency of a method is stated by the peak capacity P, which describes the number of peaks that can be resolved in a given time period. The peak capacity is defined by the run time divided by the average peak width. Hence, a small peak width is essential for a fast method with high separation efficiency. The peak width is proportional to the inverse square root of the number of theoretical plates N generated by the column. Taking into account the length of the column, its efficiency can also be expressed by the height equivalent to a theoretical plate H. The relationship between plate height H and plate number N of a column with the length L is given by Formula 1.
Low height equivalents will therefore generate a high number of theoretical plates, and hence small peak width for high peak capacity is gained. Which factors define H? For an answer, the processes inside the column have to be considered, which are expressed by the Van Deemter equation (Formula 2).
The Eddy diffusion A describes the mobile phase movement along different random paths through the stationary phase, resulting in broadening of the analyte band. The longitudinal diffusion of the analyte against the flow rate is expressed by the term B. Term C describes the resistance of the analyte to mass transfer into the pores of the stationary phase. This results in higher band broadening with increasing velocity of the mobile phase. The well-known Van Deemter plots of plate height H against the linear velocity of the mobile phase are useful

100 Easy Method Transfer from HPLC to RSLC with the Dionex Method Speed-Up Calculator
If the column length is kept constant and the particle size is decreased, the resolution of the analytes improves. Figure 1, bottom, demonstrates this effect using 5 µm and 2 µm particles.
When transferring a gradient method, the scaling of the gradient profile to the new column format and flow rate has to be considered to maintain the separation performance. The theoretical background was introduced by L. Snyder2 and is known as the gradient volume principle. The gradient volume is defined as the mobile phase volume that flows through the column at a defined gradient time t
G. Analytes are considered to elute at
constant eluent composition. Keeping the ratio between the gradient volume and the column volume constant therefore results in a correct gradient transfer to a different column format.
Taking into account the changed flow rates F and column volume (with diameter d
c and length L),
the gradient time intervals tG of the new methods are
calculated with Formula 7.
1.7 2.0 Minutes 3.00
mAU
700
0 105Linear Velocity u [mm/s]
0
100
H [µ
m]
Separation on 5 µm material
1.7 2.0 Minutes 3.00
mAU
700
Separation on 2 µm material
10 µm particles
5 µm particles
3 µm particles
2 µm particles
Hmin. 5 µm
uopt. 2 µmuopt. 5 µm
Hmin. 2 µm
25716
Figure 1. Smaller particles provide more theoretical plates and more resolution, demonstrated by the improved separation of three peaks (bottom) and smaller minimum plate heights H in the Van Deemter plot (top). At linear velocities higher than uopt, H increases more slowly when using smaller particles, allowing higher flow rates and therefore faster separations while keeping separation efficiency almost constant. The speed-up potential of small particles is revealed by the Van Deemter plots (top) of plate height H against linear velocity u of mobile phase: Reduc-ing the particle size allows higher flow rates and shorter columns because of the decreased minimum plate height and increased optimum velocity. Consequently, smaller peak width and improved resolution are the result (bottom).
An easy transfer of method parameters can be achieved by using the Dionex Method Speed-Up Calculator (Figure 2), which incorporates all the overwhelming theory and makes manual calculations unnecessary. This technical note describes the easy method transfer of an example separation applying the calculator. Just some prerequisites described in the following section have to be taken into account.
PREREQUISITES The Method Speed-Up Calculator is a universal
tool and not specific for Dionex products. Nevertheless, some prerequisites have to be considered for a successful method transfer, which is demonstrated in this technical note by the separation of seven soft drink additives.
2
,
,,, •=
oldc
newc
old
new
new
oldoldGnewG d
dLL
FFtt • • ( (Formula 7:

101 Easy Method Transfer from HPLC to RSLC with the Dionex Method Speed-Up Calculator
Column DimensionFirst, the transfer of a conventional method to an
RSLC method requires the selection of an adequate column filled with smaller particles. The RSLC method is predicted best if the selectivity of the stationary phase is maintained. Therefore, a column from the same manufacturer and with nominally identical surface modification is favoured for an exact method transfer. If this is not possible, a column with the same nominal stationary phase is the best choice. The separation is made faster by using shorter columns, but the column should still offer sufficient column efficiency to allow at least a baseline separation of analytes. Table 1 gives an overview of the theoretical plates expected by different column length and particle diameter size combinations using Dionex Acclaim column particle sizes. Note that column manufacturers typically fill columns designated 5 µm with particle sizes 4–5 µm. Dionex Acclaim 5 µm columns are actually filled with 4.5 µm particles. This is reflected in the table.
If the resolution of the original separation is higher than required, columns can be shortened. Keeping the column length constant while using smaller particles improves the resolution. Reducing the column diameter does not shorten the analysis time but decreases mobile phase consumption and sample volume. Taking into account an elevated temperature, smaller column inner diameters reduce the risk of thermal mismatch.
Figure 2. The Dionex Method Speed-Up Calculator transfers a conventional (current) HPLC method to a new (planned) RSLC method.
Table 1. Theoretical Plates Depending on Column Length and Particle Diameter
(Calculated Using Formula 5)Theoretical Plates N
Particle size 4.5 µm 3 µm 2.2 µm
Column length: 250 mm 18518 27778 37879
150 mm 11111 16667 22727
100 mm 7407 11111 15152
75 mm 5555 8333 11364
50 mm 3703 5556 7576

102 Easy Method Transfer from HPLC to RSLC with the Dionex Method Speed-Up Calculator
System RequirementsSmaller particles generate higher backpressure. The
linear velocity of the mobile phase has to be increased while decreasing the particle size to work within the Van Deemter optimum. The UltiMate 3000 RSLC system perfectly supports this approach with its high maximum operation pressure of 800 bar (11,600 psi). This maximum pressure is constant over the entire flow rate range of up to 5 mL/min, providing additional potential to speed up applications even further by increasing the flow rate. bypass mode. The GDV of a standard sample loop of the
RSLC autosampler is 150 µL, the micro injection loop has a 50 µL GDV.
Besides the gradient delay volume, the extra column volume is an important parameter for fast LC methods. The extra column volume is the volume in the system through which the sample passes and hence contributes to the band broadening of the analyte peak (Figure 3). The extra column volume of an optimized LC system should be below 1/
10th of the peak volume. Therefore
the length and inner diameter of the tubing connections from injector to column and column to detector should be as small as possible. Special care has to be taken while installing the fittings to avoid dead volumes. In addition, the volume of the flow cell has to be adapted to the peak volumes eluting from the RSLC column. If possible, the flow cell detection volume should not exceed 1/
10th of the
peak volume.
Detector SettingsWhen transferring a conventional method to an RSLC
method, the detector settings have a significant impact on the detector performance. The data collection rate and time constant have to be adapted to the narrower peak shapes. In general, each peak should be defined by at least 30 data points. The data collection rate and time constant settings are typically interrelated to optimize the amount of data points per peak and reduce short-term noise while still maintaining peak height, symmetry, and resolution.
The Chromeleon® Chromatography Management Software has a wizard to automatically calculate the best settings, based on the input of the minimum peak width at half height of the chromatogram. This width is best determined by running the application once at maximum data rate and shortest time constant. The obtained peak width may then be entered into the wizard for optimization of the detection settings. Refer to the detector operation manual for further details.
For fast gradient methods, the gradient delay volume (GDV) plays a crucial role. The GDV is defined as the volume between the first point of mixing and the head of the column. The GDV becomes increasingly important with fast, steep gradients and low flow rate applications as it affects the time taken for the gradient to reach the head of the column. The larger the GDV, the longer the initial isocratic hold at the beginning of the separation. Typically, this leads to later peak elution times than calculated. Early eluting peaks are affected most. In addition, the GDV increases the time needed for the equilibration time at the end of a sample and therefore increases the total cycle time. A general rule is to keep the gradient steepness and the ratio of GDV to column volume constant when transferring a standard method into a fast LC method. This will maintain the selectivity of the original method.3
The GDV can be adjusted to the column volume by installing appropriate mixer kits to the RSLC pump (see Table 2), which contributes most to the GDV. Typically, 100 µL or 200 µL mixers are good starting points when operating a small volume column in an RSLC system.
Another option is to switch the sample loop of the split-loop autosampler out of the flow path. The GDV is then reduced by the sample loop volume in the so-called
Pump
AutosamplerDetector
Gradient Delay Volume
ExtraColumnVolume
ExtraColumnVolume
Column
25717
Table 2. Mixer Kits Available for UltiMate 3000 RSLC System to Adapt GDV of Pump
Mixer Kit GDV pump
Mixer kit 6040.5000 35 µL
Static mixer kit 6040.5100 100 µL
Static mixer kit 6040.5150 200 µL
Figure 3. Gradient delay volume and extra column volume of an HPLC system. Both play an important role in method speed-up.

103 Easy Method Transfer from HPLC to RSLC with the Dionex Method Speed-Up Calculator
METHOD SPEED-UP USING THE CALCULATORSeparation Example
Separation was performed on an UltiMate 3000 RSLC system consisting of a HPG-3200RS Binary Rapid Separation Pump, a WPS-3000RS Rapid Separation Well Plate Sampler with analytical sample loop (100 µL), a TCC-3000RS Rapid Separation Thermostatted Column Compartment with precolumn heater (2 µL), and a VWD-3400RS Variable Wavelength Detector with semi-micro flow cell (2.5 µL). Chromeleon Chromatography Management Software (version 6.80, SR5) was used for both controlling the instrument and reporting the data. The modules were connected with stainless steel micro capillaries, 0.01” ID, 1/
16" OD when applying the
conventional LC method, 0.007” and 0.005” ID, 1/16
" OD when applying the RSLC methods. A standard mixture of seven common soft drink additives was separated by gradient elution at 45 °C on two different columns:
• Conventional HPLC Column: Acclaim 120, C18, 5 µm, 4.6 × 150 mm column, (P/N 059148)
• Rapid Separation Column: Acclaim RSLC 120, C18, 2.2 µm, 2.1 × 50 mm column (P/N 068981).
The UV absorbance wavelength at 210 nm was recorded at 5 Hz using the 4.6 × 150 mm column and at 25 Hz and 50 Hz using the 2.1 × 50 mm column. Further method details such as flow rate, injection volume, and gradient table of conventional and RSLC methods are described in the following section. The parameters for the method transfer were calculated with the Dionex Method Speed-Up Calculator (version 1.14i).
The conventional separation of seven soft drink additives is shown in Figure 4A. With the Method Speed-Up Calculator, the method was transferred successfully to RSLC methods (Figure 4B and C) at two different flow rates. The easy method transfer with this universal tool is described below.
Column Selection for Appropriate ResolutionThe column for method speed-up must provide
sufficient efficiency to resolve the most critical pairs. In this example, separating peaks 5 and 6 is most challenging. A first selection of the planned column dimensions can be made by considering the theoretical plates according to Table 1. The 4.6 × 150 mm, 5 µm column is actually filled with 4.5 µm particles. Therefore, it provides 11,111 theoretical plates. On this column, the
–200
1800
mAU
12 3
56
7
–100
1000
mAU 12
3
4
56
7
0 2 4 6 8 10–100
1000
mAU
Minutes
123
4
56
7
4.6 × 150 mm, 4.5 µm1.5 mL/min
2.1 × 50 mm, 2.2 µm0.639 mL/min
2.1 × 50 mm, 2.2 µm1.599 mL/min
Peaks: 1. Acesulfame K 2. Saccharin 3. Caffeine 4. Aspartame
4
5. Benzoate6. Sorbate7. Benzaldehyde
C
B
A
25718
Figure 4. Method transfer with the Method Speed-Up Calcula-tor from A) a conventional LC separation on an Acclaim 5 µm particle column, to B) and C) RSLC separations on an Acclaim 2.2 µm particle column.
resolution is R(5,6)
=3.48. This resolution is sufficiently high to select a fast LC column with fewer theoretical plates for the speed up. Therefore, a 2.1 × 50 mm, 2.2 µm column with 7579 plates was selected.
The first values to be entered into the yellow field of the Method Speed-Up Calculator are the current column dimension, planned column dimension, and the resolution of the critical pair. To obtain the most accurate method transfer, use the particle sizes listed in the manufacturer's column specifications sheet instead of the nominal size, which may be different. Dionex Acclaim columns with a nominal particle size of 5 µm are actually filled with 4.5 µm particles, and this value should be used to achieve a precise method transfer calculation. This has a positive impact on the performance and pressure predictions for the planned column. Based on the assumption of unchanged stationary phase chemistry, the calculator then predicts the resolution provided by the new method (Figure 5).

104 Easy Method Transfer from HPLC to RSLC with the Dionex Method Speed-Up Calculator
In the example in Figure 5, the predicted resolution between benzoate and sorbate is 2.87. With a resolution of R ≥1.5, the message “Baseline resolution achieved” pops up. This indicates that a successful method transfer with enough resolution is possible with the planned column. If R is smaller than 1.5, the red warning “Baseline is not resolved” appears. Note that the resolution calculation is performed only if the boost factor BF is 1, otherwise it is disabled. The function of the boost factor is described in the Adjust Flow Rate section.
Instrument Settings The next section of the Method Speed-Up Calculator
considers basic instrument settings. These are flow rate, injection volume, and system backpressure of the current method (Figure 6). In addition to these values, the detector settings have to be considered as described in the earlier section “Detector Settings”. Furthermore, the throughput gain with the new method can be calculated if the number of samples to be run is entered.
Adjust Flow RateAs explained by Van Deemter theory, smaller particle
phases need higher linear velocities to provide optimal separation efficiency. Consequently, the Dionex Method Speed-Up Calculator automatically optimizes the linear velocity by the ratio of particle sizes of the current and
planned method. In addition, the new flow rate is scaled to the change of column cross section if the column inner diameter changed. This keeps the linear velocity of the mobile phase constant. A boost factor (BF) can be entered to multiply the flow rate for a further decrease in separation time. If the calculated resolution with BF=1 predicts sufficient separation, the method can be accelerated by increasing the boost factor and therefore increasing the flow rate. Figure 1 shows that applying linear velocities beyond the optimum is no problem with smaller particle phases, as they do not significantly loose plates in this region. Note that the resolution calculation of the Method Speed-Up Calculator is disabled for BF≠1.
For the separation at hand, the flow rate is scaled from 1.5 mL/min to 0.639 mL/min when changing from an Acclaim 4.6 × 150 mm, 4.5 µm column to a 2.1 × 50 mm, 2.2 µm column (see Figure 6), adapting the linear velocity to the column dimensions and the particle size. The predicted resolution between peak 5 and 6 for the planned column is R=2.87. The actual resolution achieved is R=2.91, almost as calculated (chromatogram B in Figure 4).
A Boost Factor of 2.5 was entered for further acceleration of the method (Figure 7). The method was then performed with a flow rate of 1.599 mL/min, and resolution of the critical pair was still sufficient at R=2.56 (see zoom in chromatogram C in Figure 4).
Figure 6. The flow rate, injection volume and backpressure of the current method are scaled to the new column dimension.
Figure 5. Column selection considering the resolution of the critical pair.

105 Easy Method Transfer from HPLC to RSLC with the Dionex Method Speed-Up Calculator
Scale Injection VolumeThe injection volume has to be adapted to the new
column dimension to achieve similar peak heights by equivalent mass loading. Therefore the injection plug has to be scaled to the change of column cross section. In addition, shorter columns with smaller particles cause a reduced zone dilution. Consequently, sharper peaks compared to longer columns are expected. The new injection volume V
inj,new is then calculated by Formula 8,
taking a changed cross section and reduced band broadening by changed particle diameter into account.
Generally, it is recommended that a smaller flow cell be used with the RSLC method to minimize the extra column volume. Also, the difference in path length of different flow cell sizes has to be taken into account while scaling the injection volume. In the example of the soft drink analysis, the injection volume is scaled from 25 µL to 2.1 µL when replacing the Acclaim 4.6 × 150 mm, 4.5 µm column with a 2.1 × 50 mm, 2.2 µm column (see Figure 6).
Predicted BackpressureSpeeding-up the current method by decreasing
particle size and column diameter and increasing flow rate means elevating the maximum generated backpressure. The pressure drop across a column can be approximated by the Kozeny-Carman formula.4 The pressure drop of the new method is predicted by the calculator considering changes in column cross section, flow rate, and particle size and is multiplied by the boost factor. The viscosity
of mobile phase is considered constant during method transfer. The calculated pressure is only an approximation and does not take into account nominal and actual particle size distribution depending on column manufacturer. If the predicted maximum pressure is above 800 bar (11,600 psi) the warning “Exceeds pressure limit RSLC” is shown, indicating the upper pressure limit of the UltiMate 3000 RSLC system. However, in the case the method is transferred to a third party system, its pressure specification has to be considered.
In the example of the soft drink analysis, the actual pressure increases from 92 bar to 182 bar with BF=1 on the 2.1 × 50 mm column, and to 460 bar for the RSLC method with BF=2.5. The pressures predicted by the Method Speed-Up Calculator are 262 bar and 656 bar, respectively. The pressure calculation takes into account the change of the size of the column packing material. In a speed up situation, the pressure is also influenced by other factors such as particle size distribution, system fluidics pressure, change of flow cell, etc. When multiplication factors such as the boost factor are used, the difference between calculated and real pressure is pronounced. The pressure calculation is meant to give an orientation, what flow rates might be feasible on the planned column. However, it should be confirmed by applying the flow on the column.
Adapt Gradient TableThe gradient profile has to be adapted to the changed
column dimensions and flow rate following the gradient-volume principle. The gradient steps of the current method are entered into the yellow fields of the gradient table. The calculator then scales the gradient step intervals appropriately and creates the gradient table of the new method.
Figure 7. The new flow rate is further accelerated by applying the Boost Factor of 2.5.
oldpold
newpnew
oldc
newcoldinjnewinj dL
dLdd
VV,
,2
,
,,, ⋅
⋅⋅⋅= ( (Formula 8:

106 Easy Method Transfer from HPLC to RSLC with the Dionex Method Speed-Up Calculator
The adapted gradient table for the soft drink analysis while using a boost factor BF=1 is shown in Figure 8. According to the gradient-volume principle, the total run time is reduced from 29.0 min to 4.95 min by taking into account the changed column volume from a 4.6 × 150 mm, 5 µm (4.5 µm particles entered) to a 2.1 × 50 mm, 2.2 µm column and the flow rate reduction from 1.5 mL/min to 0.639 mL/min. The separation time was further reduced to 1.89 min by using boost factor BF=2.5. Gradient time steps were adapted accordingly. The comparison of the peak elution order displayed in Figure 4 shows that the separation performance of the gradient was maintained during method transfer.
Consumption and SavingsWhy speed-up methods? To separate analyte peaks
faster and at the same time reduce the mobile phase and sample volume consumption. Those three advantages of a method speed-up are indicated in the Method Speed-Up Calculator sheet right below the gradient table. The absolute values for the time, eluent, and sample usage are calculated taking the numbers of samples entered into the current instrument settings section of the calculation sheet into account (see Figure 6).
Regarding the soft drink analysis example, geometrical scaling of the method from the conventional column to the RSLC method means saving 93% of eluent and 92% of sample. The sample throughput increases 6.1-fold using BF=1. The higher flow rate at BF=2.5 results in a 15.3-fold increased throughput compared to the conventional LC method (Figure 9).
Figure 8. The gradient table of the current method (A) is adapted to the boosted method (B) according to the gradient-vol-ume principle.
Figure 9. The absolute values for analysis time, eluent usage, and sample usage of the current (purple) and planned (green) method are calculated by the Method Speed-Up Calculator. The savings of eluent, sample, and time due to the method transfer are highlighted.

107 Easy Method Transfer from HPLC to RSLC with the Dionex Method Speed-Up Calculator
CONCLUSIONFast method development or increased sample
throughput are major challenges of most analytical laboratories. A systematic method speed-up is accomplished by reducing the particle size, shortening the column length, and increasing the linear velocity of the mobile phase. The Dionex Method Speed-Up Calculator automatically applies these rules and scales the conventional LC parameters to the conditions of the RSLC method. The interactive electronic tool is universally applicable. New instrument settings are predicted and gradient tables are adapted for optimum performance for the new method. The benefit of the method transfer is summarized by the integrated calculation of savings in time, eluent and sample. In addition, users can benefit from getting results earlier and thereby reducing the time to market. The Dionex Method Speed-Up Calculator is part of Dionex’s total RSLC solution, which further consists of the industry leading UltiMate 3000 RSLC system, powerful Chromeleon Chromatography Management Software, and high-efficiency Acclaim RSLC columns.
REFERENCES1. Halász, I.; Endele, R.; Asshauer, J. J. Chromatogr., A
1975, 112, 37–60.2. Snyder, L.R.; Dolan, J.W.; Grant, J.R.
J. Chromatogr., A 1979, 165, 3–30.3. Schellinger, A.P.; Carr, P.W. J. Chromatogr., A 2005,
1077, 110-119.4. Bear, J. Dynamics of Fluids in Porous Media; Dover:
Mineola, NY, 1988.

Analyst is a registered trademark of Applied Biosystems. Hydromatrix is a trademark of Varian Associates, Inc.
Jasco is a registered trademark of Jasco, Inc.Milli-Q and Millex are registered trademarks of Millipore Corporation.
QTRAP is a registered trademark and TurboV is a trademark of AB SCIEX. Roundup is a registered trademark of Monsanto Company.
Soxtec is a trademark of FOSS.Thiofluor is a trademark of Pickering Laboratories, Inc.
Vespel and Tefzel are registered trademarks of E. I. du Pont de Nemours & Co.
All other trademarks are the property of Thermo Fisher Scientific Inc. and its subsidiaries.
Dionex Products: 1228 Titan Way, PO Box 3603, Sunnyvale, CA 94088-3603, (408) 737-0700North America: U.S./Canada (847) 295-7500South America: Brazil (55) 11 3731 5140Europe: Austria (43) 616 51 25, Benelux (31) 20 683 9768 (32) 3 353 4294 Denmark (45) 36 36 90 90, France (33) 1 39 30 01 10, Germany (49) 61125 991 0 Ireland (353) 644 0064, Italy (39) 02 51 62 1267, Sweden (46) 8 473 3380, Switzerland (41) 62 205 9966, United Kingdom (44) 1276 691722Asia Pacific: Australia (61) 2 9420 5233, China (852) 2428 3282, India (91) 22 2764 2735, Japan (81) 6885 1213, Korea (82) 2 2653 2580, Singapore (65) 6289 1190, Taiwan (886) 2 875 6655
www.thermoscientific.com/dionex
©2012 Thermo Fisher Scientific, Inc. All rights reserved. This information is not intended to encourage use of these products in any manners that might infringe the intellectual property rights of others.
AN70051_E 04/12S