environmental sustainability assessment for...
TRANSCRIPT

CSIRO WEALTH FROM OCEANS FLAGSHIP
Environmental sustainability assessment update for habitats, assemblages and bycatch species in the Torres Strait Prawn Fishery
C. Roland Pitcher February 2013 Australian Fisheries Management Authority

CSIRO Wealth from Oceans Flagship
Citation
Pitcher, C.R. (2013) Environmental sustainability assessment update for habitats, assemblages and bycatch species in the Torres Strait Prawn Fishery. Scientific Technical Report. CSIRO, Australia.
Copyright and disclaimer
© 2013 CSIRO To the extent permitted by law, all rights are reserved and no part of this publication covered by copyright may be reproduced or copied in any form or by any means except with the written permission of CSIRO.
Important disclaimer
CSIRO advises that the information contained in this publication comprises general statements based on scientific research. The reader is advised and needs to be aware that such information may be incomplete or unable to be used in any specific situation. No reliance or actions must therefore be made on that information without seeking prior expert professional, scientific and technical advice. To the extent permitted by law, CSIRO (including its employees and consultants) excludes all liability to any person for any consequences, including but not limited to all losses, damages, costs, expenses and any other compensation, arising directly or indirectly from using this publication (in part or in whole) and any information or material contained in it.

Environmental sustainability assessment update for habitats, assemblages and bycatch species in the Torres Strait Prawn Fishery | i
Contents
Acknowledgments ............................................................................................................................................. iii
Summary ............................................................................................................................................................. 4
Background ......................................................................................................................................................... 5
Objectives ........................................................................................................................................................... 5
Methods ............................................................................................................................................................. 6
Quantitative indicators: ........................................................................................................................ 6
Results ............................................................................................................................................................... 8
Habitat indicators:................................................................................................................................. 9
Assemblage indicators: ....................................................................................................................... 10
Species indicators: ............................................................................................................................... 11
Other species of interest: .................................................................................................................... 14
Discussion ......................................................................................................................................................... 15
References ........................................................................................................................................................ 17
Appendix 1 ........................................................................................................................................................ 18
Appendix 2 ........................................................................................................................................................ 19
Appendix 3 ........................................................................................................................................................ 20
Appendix 4 ........................................................................................................................................................ 22
Appendix 5 ........................................................................................................................................................ 23

Environmental sustainability assessment update for habitats, assemblages and bycatch species in the Torres Strait Prawn Fishery | ii
Figures Figure 1. Annual effort of the Torres Strait Prawn Fishery, highlighting effort in 2011 (the year of the current assessment) and 2005 when the previous assessment was conducted. Effort data for 2012 were incomplete. Also shown are: (—) the effort cap at MSY estimated by the last target species stock assessment, (—) the Australian share of the effort cap, (- -) the effort level corresponding to Trigger 1a of the harvest strategy when formal stock assessments would be re-instated, and (····) the effort level corresponding to the proxy (1.2 BMSY) for maximum economic yield (this proxy is used when an accurate MEY estimate is not known). ...................................................... 8
Figure 2. Spatial pattern of total annual effort of the Torres Strait Prawn Fishery in 2005 (left) and 2011 (right). Closed areas are shown in purple, Australian jurisdiction in blue(s) and PNG jurisdiction in yellow(s). ........................... 8
Figure 3. Map of broad seabed habitat types in the Torres Strait (see Appendix 4 for descriptions of habitat compositions, and Pitcher et al 2007 for more details). .............................................................................................. 9
Figure 4. Map of seabed species-assemblages in the Torres Strait (see Appendix 5 for descriptions of assemblage compositions, and Pitcher et al 2007 for more details). ............................................................................................ 10
Figure 5. Predicted biomass distribution map of the small fish species Priacanthus tayenus (Purple-spotted bigeye) in the Torres Strait (see Pitcher et al 2007 for more details). ....................................................................................... 12
Tables Table 1. Estimates of area (km²) of habitat types mapped in Figure 2 and their exposure to trawling: by area open/closed to trawling indicating percent protected; by area trawled indicating percent area potentially exposed; by effort intensity indicating swept-area and percent area directly exposed to effort — for 2005 and 2011 (see Appendix 4 for descriptions of habitat compositions). ............................................................................................................... 9
Table 2. Estimates of area (km²) of species-assemblages mapped in Figure 4 and their exposure to trawling: by area open/closed to trawling indicating percent protected; by area trawled indicating percent area potentially exposed; by effort intensity indicating swept-area and percent area directly exposed to effort — for 2005 and 2011 (see Appendix 5 for descriptions of assemblage compositions). ..................................................................................................... 11
Table 3. Estimates of species biomass (kg) exposure to trawling for the top 38 of 256 species ranked by Pitcher et al (2007), for 2005 and 2011: biomass open/closed to trawling indicating percent protected; biomass exposed to trawl grounds; biomass swept by effort intensity; and also showing estimated relative catchability; estimate of potential percentage of population caught annually (including BRD effect); natural mortality estimates (M) where available; and a sustainability indicator as proportion Caught/M (where C/M=1 ≈ MSY). .................................................................. 13
Table 4. Estimates of exposure to trawling of additional species sampled by Pitcher et al (2007); number of sites where sampled; sampled biomass (g) in sites open/closed to trawling indicating percent protected; sample exposed to trawl grounds; sample swept by effort intensity; for 2005 and 2011. ...................................................................... 14
Table 5. 2005 assessment of exposure to trawling and sustainability risk for all available congeneric fish species (Class Actinopterygii), related to the additional species of interest: indicating percent exposed to trawl grounds; percent swept by effort intensity; relative catch rate; BRD effect; percent caught; natural mortality rate; C/M sustainability indicator (Pitcher et al 2007). ............................................................................................................. 15
Table 6. 2005 assessment of exposure to trawling and potential risk for all available holothurians (Class Holothuroidea), related to the additional species of interest: indicating percent exposed to trawl grounds; percent swept by effort intensity; relative catch rate; BRD effect; percent caught; natural mortality rate; C/M sustainability indicator (Pitcher et al 2007). ................................................................................................................................ 15

Environmental sustainability assessment update for habitats, assemblages and bycatch species in the Torres Strait Prawn Fishery | iii
Acknowledgments
This work was supported by CSIRO with funding from the Australian Fisheries Management Authority (AFMA).
Data used by this project was sourced from the Torres Strait Seabed Biodiversity Mapping & Characterisation Project, a collaboration between the Commonwealth Scientific and Industrial Research Organisation (CSIRO), Queensland Department of Primary Industries & Fisheries (QDPIF), and the Queensland Museum (QM); funded by the CRC Torres Strait and the National Oceans Office; and led by R. Pitcher (Principal Investigator, CSIRO), J. Hooper (QM) and R. Coles (QDPIF). The field teams and crews of the RV James Kirby (JCU) and FRV Gwendoline May (QDPIF) collected the sled samples.
Torres Strait Prawn Fishery logbook summary data was provided by Clive Turnbull Queensland Department of Agriculture, Fisheries and Forestry (QDAFF) via AFMA, and vessel monitoring system (VMS) data was processed and provided by Alex Campbell (QDAFF).
Lisa Cocking and Fiona Hill (AFMA) provided helpful discussions and review of the draft report, as did Wayne Rochester (CSIRO) and Michael O'Neill (QDAFF).

Environmental sustainability assessment update for habitats, assemblages and bycatch species in the Torres Strait Prawn Fishery | 4
Summary
A comprehensive sustainability assessment previously conducted in the Torres Strait for 2005 was updated using 2011 Vessel Monitoring System (VMS) annual effort data. This aimed to provide information on the potential environmental impact that the Torres Strait Prawn Fishery (TSPF) may have, considering the current effort levels and patterns, and to inform the decision making process about a possible trial of larger boats and gear in the fishery. The update showed that environmental risks were substantially reduced from 2005 to what could be considered negligible levels in 2011 due to reduced areal footprint of trawling and substantially lower effort. In 2005, two of nine habitat types had moderate to high exposure, whereas in 2011 exposure of all habitats to trawling was low. Trawling was not a statistically significant modifier of seabed habitat state in the TSPZ. In 2005, four of 12 species-assemblages had moderate to very high exposure to trawl grounds and three had moderate to extreme exposure to trawl effort swept-coverage — one assemblage differed statistically by ~1% in high trawl effort areas — whereas in 2011, two assemblages had moderate to high exposure to trawl grounds and one had moderate exposure to effort coverage. In 2005, more than 50 species of the total 256 assessed had moderate to extreme exposure to trawl grounds and/or effort coverage, and of these, 19 had moderate to high estimates of annual catch of which two were extreme. In 2005, one species exceeded a limit reference point (Maximum Sustainable Yield) and three species exceeded sustainability reference points. In 2011, 12 species had moderate to high exposure to trawl grounds and only three had moderate exposure to effort coverage. Just one species had moderate annual catch and no species exceeded any reference points. This suggests that there are no sustainability concerns for bycatch or benthic species at the levels of trawl effort observed in 2011. For several additional species of interest to the traditional inhabitant sector limited available information permitted simpler assessments suggesting that risk was low in each case.
While all assessed risks were negligible or minimal in 2011, it should be noted that effort has been at historically low levels since 2009. Effort levels peaked through the 1990s and have been declining since. The 2005 assessment was conducted when effort was about half of peak levels, but more than four-times greater than in 2011. Effort in 2005 was close to the Australian effort cap and to the estimated effort at Maximum Economic Yield cap if that target was adopted in future. Hence, the 2005 environmental assessment is reasonably indicative of the potential environmental risks if the fishery recovers to these levels. At such levels, exposures would be higher than in 2011, and a few species were at risk in 2005. Consequently, should the fishery recover in future, it is likely that some management action may be required to ensure sustainability of all bycatch and benthos.
Environmental sustainability assessment update for habitats, assemblages and bycatch species in the Torres Strait Prawn Fishery | 5
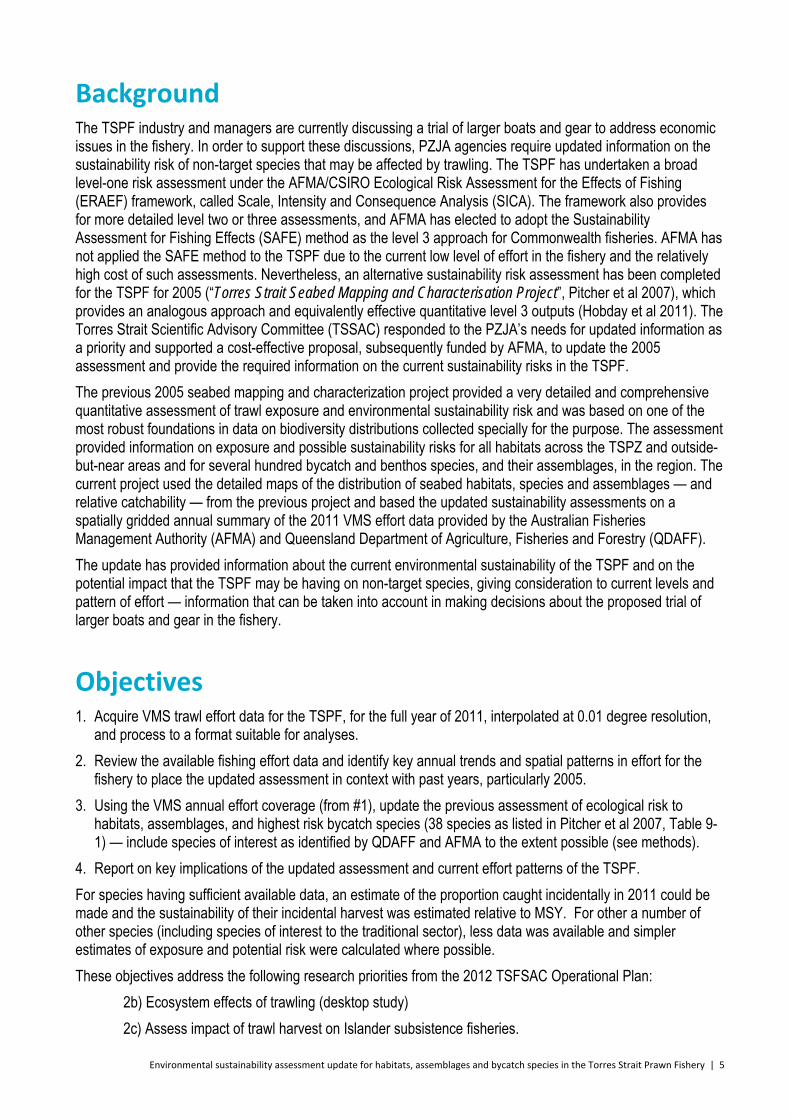
Background The TSPF industry and managers are currently discussing a trial of larger boats and gear to address economic issues in the fishery. In order to support these discussions, PZJA agencies require updated information on the sustainability risk of non-target species that may be affected by trawling. The TSPF has undertaken a broad level-one risk assessment under the AFMA/CSIRO Ecological Risk Assessment for the Effects of Fishing (ERAEF) framework, called Scale, Intensity and Consequence Analysis (SICA). The framework also provides for more detailed level two or three assessments, and AFMA has elected to adopt the Sustainability Assessment for Fishing Effects (SAFE) method as the level 3 approach for Commonwealth fisheries. AFMA has not applied the SAFE method to the TSPF due to the current low level of effort in the fishery and the relatively high cost of such assessments. Nevertheless, an alternative sustainability risk assessment has been completed for the TSPF for 2005 (“Torres Strait Seabed Mapping and Characterisation Project”, Pitcher et al 2007), which provides an analogous approach and equivalently effective quantitative level 3 outputs (Hobday et al 2011). The Torres Strait Scientific Advisory Committee (TSSAC) responded to the PZJA’s needs for updated information as a priority and supported a cost-effective proposal, subsequently funded by AFMA, to update the 2005 assessment and provide the required information on the current sustainability risks in the TSPF.
The previous 2005 seabed mapping and characterization project provided a very detailed and comprehensive quantitative assessment of trawl exposure and environmental sustainability risk and was based on one of the most robust foundations in data on biodiversity distributions collected specially for the purpose. The assessment provided information on exposure and possible sustainability risks for all habitats across the TSPZ and outside-but-near areas and for several hundred bycatch and benthos species, and their assemblages, in the region. The current project used the detailed maps of the distribution of seabed habitats, species and assemblages — and relative catchability — from the previous project and based the updated sustainability assessments on a spatially gridded annual summary of the 2011 VMS effort data provided by the Australian Fisheries Management Authority (AFMA) and Queensland Department of Agriculture, Fisheries and Forestry (QDAFF).
The update has provided information about the current environmental sustainability of the TSPF and on the potential impact that the TSPF may be having on non-target species, giving consideration to current levels and pattern of effort — information that can be taken into account in making decisions about the proposed trial of larger boats and gear in the fishery.
Objectives 1. Acquire VMS trawl effort data for the TSPF, for the full year of 2011, interpolated at 0.01 degree resolution,
and process to a format suitable for analyses.
2. Review the available fishing effort data and identify key annual trends and spatial patterns in effort for the fishery to place the updated assessment in context with past years, particularly 2005.
3. Using the VMS annual effort coverage (from #1), update the previous assessment of ecological risk to habitats, assemblages, and highest risk bycatch species (38 species as listed in Pitcher et al 2007, Table 9-1) — include species of interest as identified by QDAFF and AFMA to the extent possible (see methods).
4. Report on key implications of the updated assessment and current effort patterns of the TSPF.
For species having sufficient available data, an estimate of the proportion caught incidentally in 2011 could be made and the sustainability of their incidental harvest was estimated relative to MSY. For other a number of other species (including species of interest to the traditional sector), less data was available and simpler estimates of exposure and potential risk were calculated where possible.
These objectives address the following research priorities from the 2012 TSFSAC Operational Plan:
2b) Ecosystem effects of trawling (desktop study)
2c) Assess impact of trawl harvest on Islander subsistence fisheries.

Environmental sustainability assessment update for habitats, assemblages and bycatch species in the Torres Strait Prawn Fishery | 6
Methods This assessment update built on a previous study that surveyed and mapped biodiversity distributions on the shelf seabed of the 50,195 km² Torres Strait study area (Pitcher et al 2007). The survey sampled 1,549 bycatch species from 148 sites, using a research trawl; 1,551 benthic species from 166 sites, using an epibenthic sled; and 114 habitat elements at 173 sites, providing information and samples for detailed distribution and abundance data about habitats and species of plants, invertebrates and fishes on the seabed. Once the samples were sorted and identified, these data were analysed with environmental variables as predictors to produce distribution maps of species, assemblages and habitats at each of 41,285 grid cells (of size 0.01 degrees, ~1.11 km²) (see Pitcher et al 2007 for details).
Of 2,372 species sampled, ~256 occurred sufficiently frequently for analyses, prediction and mapping of distributions. These distributions were subsequently used to characterise and map 12 species-assemblages, each representing similar species composition within, and differing compositions between. Habitat types were characterised from data recorded from towed video, into 9 classes representing areas of seabed having similar mixtures of habitat elements within and different mixtures between. These predicted distribution maps underpinned several ecological assessments of the trawl fishery in the region.
The approach to this environmental sustainability assessment was to examine exposure of species and habitat distributions to the footprint of the trawl fishery, using a series of indicators of increasing sensitivity — successively accounting for spatial management zones, distribution of trawling, intensity of trawl effort, relative catchability of species in trawls, and in most cases species productivity potential. Details of these approaches are described below.
These quantitative methods were the same as used in the previous (2005) assessment, which also used several qualitative indicators (Pitcher et al 2007). While only one bycatch species was previously found to be caught in excess of an analogue of MSY, another four were close to MSY. Further, there was acknowledged uncertainty in the assessment, hence the top 20 species for each of five indicators (including qualitative indicators) were listed and recommended for management attention. Many species occurred in several lists and in total the final list comprised 38 species (Table 9-1 in Pitcher et al 2007). These 38 species were the focus of this updated assessment. In addition, several other species of interest to traditional sector were provided by QDAFF and AFMA and, where possible, were included in the current assessment. These additional species included: Mugil cephalus, Siganus lineatus, Choerodon schoenleinii, Epinephelus quoyanus, Plectorhinchus chrysotaenia, Diagramma labiosum, Cephalopholis sonnerati, Acanthurus dussumieri, Naso unicornis, Panulirus ornatus, white teetfish (Holothuria fuscogilva), seasnakes, turtles and dugong. Where these species were not included in the previous assessment, their exposure to trawling could be estimated only simply, according to the proportion of sites where these species were sampled and the intensity of trawling at these sites. For species not sampled previously, we can only report that such species were not caught as bycatch in survey data that we have available. In some cases, the current assessment could draw on other information in reports from other previous projects in Torres Strait.
Quantitative indicators: A progressive series of indicators of exposure to trawling were estimated for habitat types, seabed assemblages and selected individual species. For habitats and assemblages the assessment was based on mapped area; for species, predicted biomass distributions had been mapped and biomass related indices were estimated. This series included:
1. estimates of the percentage of the distribution of each habitat, assemblage, and individual species, located in areas open to trawling under spatial management arrangements — without account of the distribution of trawl effort.
2. estimates of the percentage of the distribution of each habitat, assemblage, and individual species, located in areas where trawl effort is present — without account of the intensity of trawl effort.
Environmental sustainability assessment update for habitats, assemblages and bycatch species in the Torres Strait Prawn Fishery | 7
3. estimates of the percentage of the distribution of each habitat, assemblage, and individual species, located in areas where trawl effort is present taking account of the intensity of trawl effort.
The intensity of trawl effort was taken into account as a coverage of the 0.01 degree grid cells. Given the typical swept width of gear and speed of trawling for prawns in the region, approximately eight hours of trawling would be required to cover a grid cell once, if trawling were conducted uniformly. Similarly, 4 hours would have 0.5 coverage and 16 hours would have 2 coverage. A given grid cell’s contribution to the risk indicator was the estimated proportion by area or biomass of the respective biological attribute, multiplied by the estimated effort coverage. These estimates for all grid cells were summed to provide the overall indicator for the Torres Strait Protected Zone region. The effort intensity information for each grid cell was calculated by spatial processing of the 2011 fishery VMS data, provided by QDAFF & AFMA, to produce an estimate of average annual hours of trawl effort for each 0.01 degree grid cell.
Exposure to trawl effort may present varying levels of risk for different species depending on how effectively the trawl net catches any given species (catchability), or how much mortality is caused as a result of contact with the net. For example, a species that lives well down in the sediment, or one that moves up into the water column during the night, is unlikely to be directly affected by the pass of a trawl net. On the other hand, a slow moving species that lives less a metre from the seabed may be very effectively caught by a prawn trawl net. For species estimated to have higher levels of exposure, information on relative catchability was sought wherever possible. The previous study (Pitcher et al., 2007) was able to provide relative catch rate information between the research trawl and the epibenthic sled. Wherever the sampling rate of the research trawl was less than the epibenthic sled, the prawn trawl was considered to catch that fraction (0-1) of the population present during a pass of the net. Wherever the trawl had a higher catch rate, the prawn trawl was considered to a relative catch rate of one. Similar information available from the Great Barrier Reef (GBR) Effects of Trawling Study (Poiner et al., 1998), including prawn trawl catch rates relative to those of a fish trawl, was also used. If evidence was available that could demonstrate that catchability or mortality was <1, this information could reduce the estimated percentage of the biomass of a species exposed in indicator three above — i.e. an estimate of the proportion of the total population caught.
Further, the TSPF is required to have turtle excluder devices (TEDs) and bycatch reduction devices (BRDs) installed in the nets. TEDs are very effective in allowing larger animals such as turtles, rays and sharks to pass out of the trawl net, greatly reducing mortality (Robins-Troeger et al. 1995, Robins & McGilvray 1999). BRDs provide escape opportunities for smaller fish and reduce the catch rate of non-target species (bycatch) by varying amounts depending on the species. In the Queensland trawl fishery, over all species and different sectors, the average reduction achieved by BRDs is about 8% (Courtney et al. FRDC 2000/170 Report 2006), though greater reductions are possible (Courtney et al. 2006). As above, if evidence (from these or other sources) was available that demonstrated that TEDs and/or BRDs further reduce catchability or mortality, this information further reduced the estimated percentage of the biomass of a species exposed in indicator three above — again, reducing the estimate of the proportion of the total population caught.
Exposure to trawling, leading to estimates of the potential proportion of species populations caught annually is only one axis of vulnerability to trawling. The second axis is the ability of the species to recover from any reductions in population size. A species with a high recovery rate can sustain higher levels of incidental catch than a species with a low recovery rate. In this analysis — following the approach typical of many target species stock assessments — the natural mortality rate of species was used to indicate population recovery potential. Thus, a sustainability indicator was estimated by dividing the estimated proportion of total population caught by natural mortality, where available as estimated by Brewer et al. (2007) and other published sources (see in Pitcher et al 2007). This is analogous to the approach of Zhou & Griffiths (2008), but with the benefit of more detailed distribution maps, and both were based on the Schaffer surplus production model, where for a population at MSY, fishing mortality (F) is equal to natural mortality (M), that is F/M=1. This is regarded as a limit reference point and should not be exceeded. Zhou & Griffiths (2008) consider reviews of exploited species that suggest F=0.8M ( F/M=0.8) is a more conservation reference point. In addition, Gulland (1983) suggested a conservative MSY of 0.3MB0 in data limited situations, which (as BMSY = 0.5B0) corresponds to F/M=0.6. These three reference points are considered in this assessment. Where exploitation is low, F is approximately equal to

Environmental sustainability assessment update for habitats, assemblages and bycatch species in the Torres Strait Prawn Fishery | 8
exploitation — the estimated proportion of the total population caught — thus, the indicator calculated herein is exploitation divided by natural mortality. Note that this method is a ‘discrete time’ approximation only, it is not an ‘instantaneous time’ stock assessment, and becomes increasingly uncertain with higher levels of exploitation and/or natural mortality (Hilborn & Walters 1992).
Results The level of recorded effort in 2011 was the lowest since the fishery started in the 1980s (Figure 1), and less than 25% of the level in 2005 when the previous environmental assessment was conducted. The lower effort also corresponded to smaller total annual swept-area at fishery scale: in 2005, the estimated total swept area was 8,097 km² compared with 2001 at 2,033 km²; and the effective swept-area taking into account expected overlap of trawls due to aggregated effort was about halved (2005: 3,065 km² vs 2011: 1,425 km²). Thus a small fraction of the ~50,200 km² assessment area was exposed to trawling, and environmental risks in 2011 were expected to be lower than in 2005. Consistent with the much lower total effort and smaller total swept-areas, maps of the spatial patterns of total annual effort show substantial contraction of effort in 2011 compared with 2005, with few areas of intense effort (Figure 2).
Figure 1. Annual logbook effort of the Torres Strait Prawn Fishery, highlighting effort in 2011 (the year of the current assessment) and 2005 when the previous assessment was conducted. Effort data for 2012 were incomplete. Also shown are: (—) the effort cap at MSY estimated by the last target species stock assessment, (—) the Australian share of the effort cap, (- -) the effort level corresponding to Trigger 1a of the harvest strategy when formal stock assessments would be re-instated, and (····) the effort level corresponding to the proxy (1.2 BMSY) for maximum economic yield (this proxy is used when an accurate MEY estimate is not known) (AFMA 2010).
Figure 2. Spatial pattern of total annual effort of the Torres Strait Prawn Fishery in 2005 (left) and 2011 (right). Closed areas are shown in purple, Australian jurisdiction in blue(s) and PNG jurisdiction in yellow(s).
63,300
14,699
0
10,000
20,000
30,000
40,000
50,000
60,000
70,000
80,000
90,000
100,000
110,000
120,000
130,000
1989 1990 1991 1992 1993 1994 1995 1996 1997 1998 1999 2000 2001 2002 2003 2004 2005 2006 2007 2008 2009 2010 2011 2012
Hours
Year
Hours Trawled
Effort MSY
Effort Australia
Effort MEY
Effort Trigger 1a

Environmental sustainability assessment update for habitats, assemblages and bycatch species in the Torres Strait Prawn Fishery | 9
Habitat indicators: Based on the previous characterisation and mapping of habitats from video data (Figure 3), the area-based exposure indicators were greatly reduced in 2011 compared with 2005 (Table 1). The first indicator was the area of each habitat type located in grid cells open or closed to trawling and the percentage protected from trawling by the closures. Two habitat types had less than 25% of their area in closures whereas other habitat clusters had moderate to moderate-high protection. The closures are unchanged between the two time periods.
Figure 3. Map of broad seabed habitat types in the Torres Strait (see Appendix 4 for descriptions of habitat compositions, and Pitcher et al 2007 for more details).
Table 1. Estimates of area (km²) of habitat types mapped in Figure 2 and their exposure to trawling: by area open/closed to trawling indicating percent protected; by area trawled indicating percent area potentially exposed; by effort intensity indicating swept-area and percent area directly exposed to effort — for 2005 and 2011 (see Appendix 4 for descriptions of habitat compositions).
Habitat Total Open Closed %
Protected
2005
Trawled
2005 %
Exposed
2005 Effort exp.
2005 Effort
exp. %
2011
Trawled
2011 %
Exposed
2011 Effort exp.
2011 Effort
exp. % 1 4626 2727 1899 41 0 0 0 0 0 0 0 0 2 20368 14873 5495 27 5695 28 7075 35 3240 16 1704 8 3 1932 1602 329 17 565 29 1017 53 423 22 327 17 4 2807 816 1992 71 0 0 0 0 0 0 0 0 5 3838 3174 664 17 0 0 0 0 0 0 0 0 6 4388 1916 2472 56 81 2 4 0 18 0 1 0 7 1827 778 1049 57 17 1 1 0 4 0 0 0 8 3905 2505 1401 36 6 0 0 0 0 0 0 0 9 6502 3098 3404 52 0 0 0 0 0 0 0 0
The second indicator was the percentage of area of each habitat type located in grid cells where trawl effort was present — irrespective of the intensity of effort in the grid cells (Table 1, % Exposed). In 2005, two video habitat clusters had more than 25% of their area in grid cells with trawl effort (pale orange) and the other habitat clusters had very low exposure of 2% to 0%. In 2011, exposure to trawled areas was reduced.
Environmental sustainability assessment update for habitats, assemblages and bycatch species in the Torres Strait Prawn Fishery | 10
The third indicator was the percentage of area of each habitat type directly exposed to trawl effort taking into account the intensity of trawl effort as a swept-coverage (Table 1, Effort exposed %). In 2005, again, two of the 9 clusters had more than 25% of their area swept by trawl effort. For habitat type #3, the exposed 29% by area was trawled almost twice that year on average leading to a moderate-high swept-area effort exposure of 53%. This habitat type comprised primarily bare sand or muddy-sand with very little biological habitat in the form of vegetation or epibenthos gardens (e.g. see Appendix 1, photo a), distributed over most of eastern TSPZ — including the trawl grounds — and open areas of southern central TSPZ (Figure 3). The next highest exposure in 2005 was habitat type #2, where the exposed 28% by area was trawled 1.25× that year on average leading to a moderate swept-area effort exposure of 35%. This habitat type comprised primarily bare or bioturbated sandy-mud or sand with almost no cover of structural biological habitats (e.g. see Appendix 1, photo b), distributed across and along the Great Northeast Channel in eastern TSPZ (Figure 3) — also spanning part of the trawl grounds. The remaining habitats had zero exposure, or close to, and included the vast majority of the seagrass and algal beds, epibenthic gardens and harder substrata (e.g. see other photos Appendix 1). In 2011, the effort exposure of habitat types 2 & 3 was reduced by 3-4 times (Table 1).
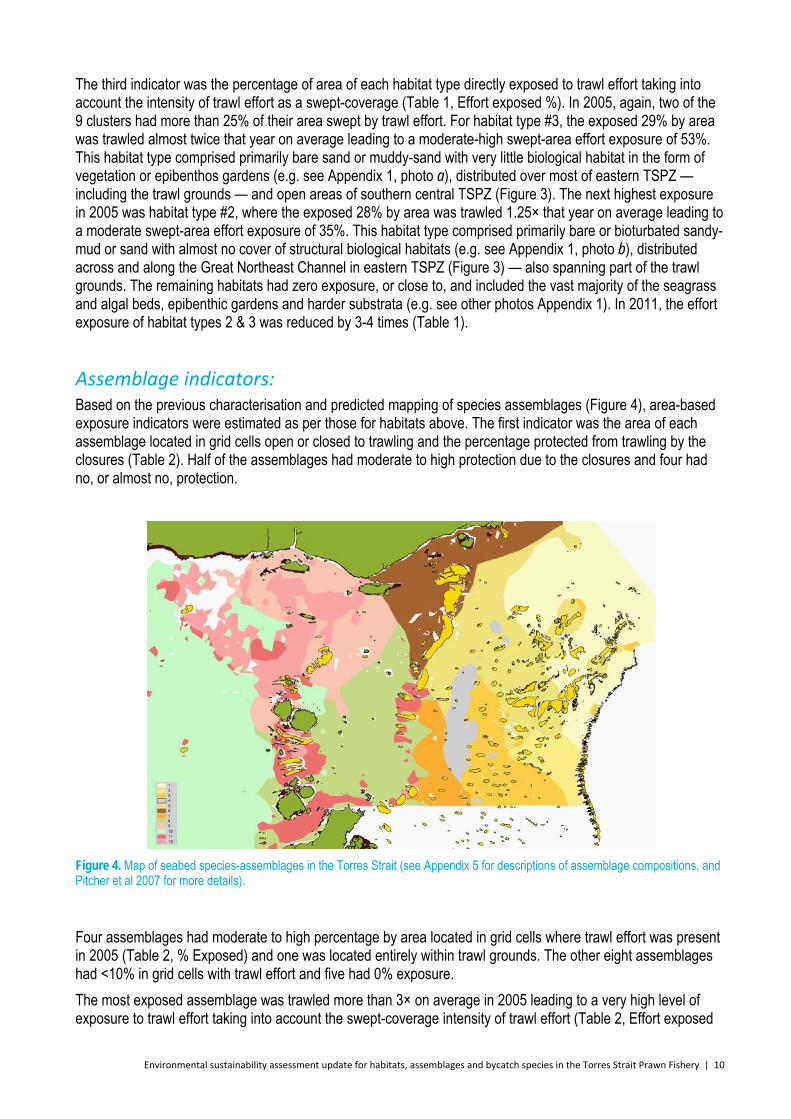
Assemblage indicators: Based on the previous characterisation and predicted mapping of species assemblages (Figure 4), area-based exposure indicators were estimated as per those for habitats above. The first indicator was the area of each assemblage located in grid cells open or closed to trawling and the percentage protected from trawling by the closures (Table 2). Half of the assemblages had moderate to high protection due to the closures and four had no, or almost no, protection.
Figure 4. Map of seabed species-assemblages in the Torres Strait (see Appendix 5 for descriptions of assemblage compositions, and Pitcher et al 2007 for more details).
Four assemblages had moderate to high percentage by area located in grid cells where trawl effort was present in 2005 (Table 2, % Exposed) and one was located entirely within trawl grounds. The other eight assemblages had <10% in grid cells with trawl effort and five had 0% exposure.
The most exposed assemblage was trawled more than 3× on average in 2005 leading to a very high level of exposure to trawl effort taking into account the swept-coverage intensity of trawl effort (Table 2, Effort exposed

Environmental sustainability assessment update for habitats, assemblages and bycatch species in the Torres Strait Prawn Fishery | 11
%). Two assemblages had moderate to high effort exposure, and most assemblages had very low to 0% exposure. The highest exposure in 2005, at 332% indicating very high potential risk, was Assemblage #4 which was characterised by bycatch species including Scolopsis taeniopterus, Paramonacanthus choiro/otisensis, Priacanthus tayenus, Cynoglossus maculipinnis, and Euristhmus nudiceps (see Pitcher et al 2007 for detailed descriptions). Two of these species were considered a potential sustainability risk in 2005 (see Species indicators section below). Assemblage #4 was distributed central to much of the trawl grounds, primarily in southern central-eastern TSPZ (Figure 4) — and was defined in part by the distribution of trawl effort >7.5 hours per grid-cell per year historically. The two other exposed assemblages were also characterised by common bycatch species, but represented a lower potential risk in 2005.
In 2011, the overlap of trawling with these assemblages was reduced and the swept-coverage effort exposure was substantially lower. In 2011, only Assemblage #4 remained substantively exposed, but at much lower levels than in 2005.
Table 2. Estimates of area (km²) of species-assemblages mapped in Figure 4 and their exposure to trawling: by area open/closed to trawling indicating percent protected; by area trawled indicating percent area potentially exposed; by effort intensity indicating swept-area and percent area directly exposed to effort — for 2005 and 2011 (see Appendix 5 for descriptions of assemblage compositions).
Assemblage Total Open Closed %
Protected
2005
Trawled
2005 %
Exposed
2005 Effort exp.
2005 Effort
exp. %
2011
Trawled
2011 %
Exposed
2011 Effort exp.
2011 Effort
exp. % 1 6730 4678 2051 30 570 8 325 5 338 5 135 2 2 1159 1111 47 4 2 0 0 0 0 0 0 0 3 2682 2630 52 2 1239 46 142 5 310 12 38 1 4 1194 1194 0 0 1194 100 3962 332 1070 90 871 73 5 5592 4847 744 13 2384 43 3155 56 1689 30 959 17 6 3570 2909 660 18 0 0 0 0 0 0 0 0 7 1376 1376 0 0 867 63 485 35 263 19 26 2 8 5685 2052 3633 64 80 1 25 0 10 0 0 0 9 4173 902 3271 78 0 0 0 0 0 0 0 0 10 11739 7498 4241 36 0 0 0 0 0 0 0 0 11 2501 897 1604 64 22 1 0 0 2 0 0 0 12 3796 1393 2402 63 6 0 0 0 4 0 0 0
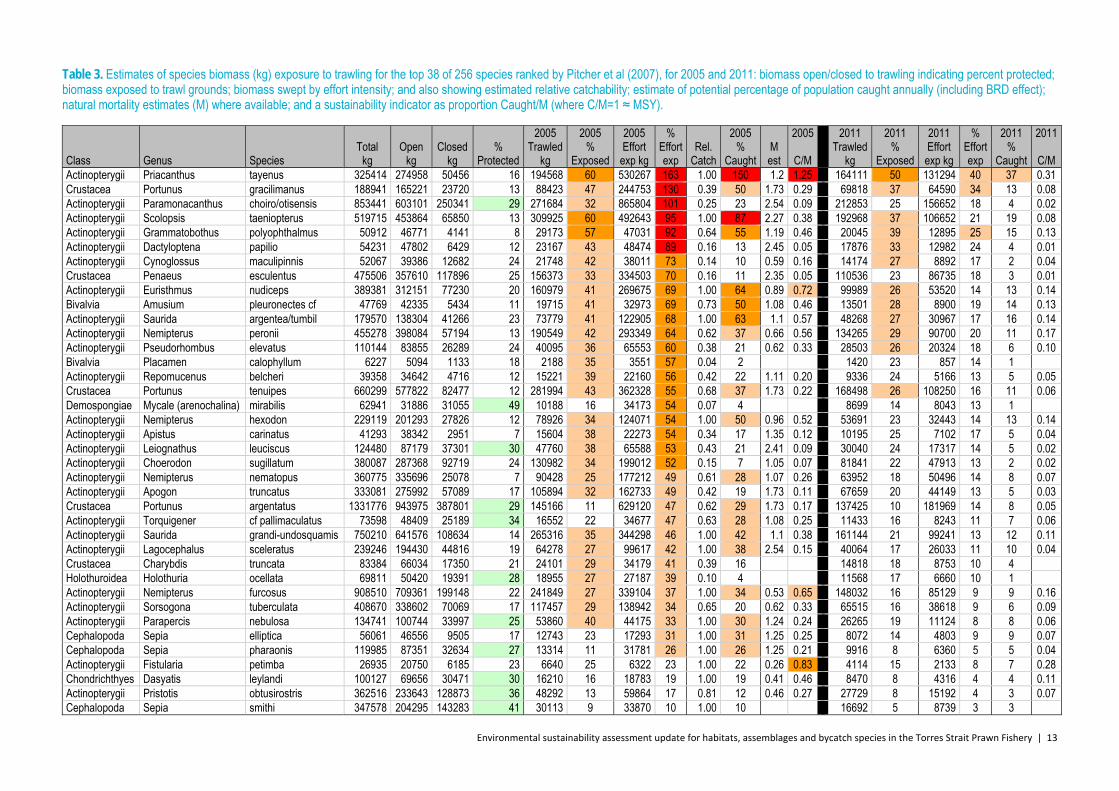
Species indicators: Trawl exposure indicators and sustainability risk indicators were updated for 38 individual species that were ranked at highest potential risk by up to five indicators in 2005 (Pitcher et al 2007), based on predicted biomass distribution maps (e.g. Figure 5). The results for these species are shown in Table 3. Due to the selection of species with higher trawl exposure, most of these 38 had relatively small proportions of their biomass distributed in trawl closure areas (Table 3). The lowest level of protection was 7% of biomass for a number of bycatch species and the highest level of protection was 49% of biomass for a species of sponge.
In 2005, most of these 38 species had moderate to high overlap with trawl grounds; the percentage of species biomass located in grid cells with recorded trawling was >50% for three species, between 25–50% for 26 species and <25% for only nine species. Most of these species also had high proportions of their exposed biomass in areas of high effort, so that their total trawl effort swept-coverage biomass was greater than their biomass in trawl grounds. Several species appeared to have very high levels of exposure. Three species had more than 100% of their standing biomass swept by trawl effort in 2005. The highest exposure was for a Priacanthid fish Priacanthus tayenus (the Purplespotted Bigeye), with 60% of its biomass in cells with recorded effort that was trawled an average of ~2.7 times giving a total of 163% exposure to trawling (Figure 5). The second most exposed species was a crustacean Portunus gracilimanus (a swimmer crab), with 47% of its biomass in cells with recorded effort that was trawled an average of ~2.8 times giving a total of 130% exposure

Environmental sustainability assessment update for habitats, assemblages and bycatch species in the Torres Strait Prawn Fishery | 12
to trawling. And third most exposed was a Monacanthid fish Paramonacanthus choiro/otisensis (a Leatherjacket), with 32% of its biomass in cells with recorded effort that was trawled an average of ~3.2 times giving a total of ~101% total direct exposure to trawling. Another three species had high exposure (89-95%), 15 species had between 75%–50% exposure and 13 species had between 50%–25% exposure in 2005.
Figure 5. Predicted biomass distribution map of the small fish species Priacanthus tayenus (Purple-spotted bigeye) in the Torres Strait (see Pitcher et al 2007 for more details).
These quantitative trawl exposure estimates were developed further, with additional information from the previous project, by multiplying the trawl effort swept-coverage exposure by the relative catch rate and BRD effect, where appropriate, to estimate of the percentage of species populations caught annually (Table 3). While there was considerable uncertainty in relative catch rate among sources (see Pitcher et al 2007), the estimated relative catch rate usually was less than 1 and the estimated percentage of populations caught annually usually was less than the estimated percentage exposed to trawl effort. The large differences in relative catch rate among species substantially altered the ranking of species potentially at risk in terms of estimated percentage caught. At this point, the highest ranked species remained the Priacanthid (bigeye) fish Priacanthus tayenus (~150% caught), but most other highly exposed species had much lower estimates of proportion caught. The subsequent highest species were other small fishes Scolopsis taeniopterus (87%), Euristhmus nudiceps (64%), Saurida argentea/tumbil (63%), Grammatobothus polyophthalmus (55%) and the scallop Amusium pleuronectes cf (50%). Thirteen species had 50%–25% and 19 had 25%–2% caught. While these estimates of potential relative incidental (or in some cases target) catch make a critical contribution to understanding potential environmental risk, they do not provide a definitive indication of sustainability risk — for this, some indication of population recovery (the propensity for the population to replenish) is required.
Environmental sustainability assessment update for habitats, assemblages and bycatch species in the Torres Strait Prawn Fishery | 13
Table 3. Estimates of species biomass (kg) exposure to trawling for the top 38 of 256 species ranked by Pitcher et al (2007), for 2005 and 2011: biomass open/closed to trawling indicating percent protected; biomass exposed to trawl grounds; biomass swept by effort intensity; and also showing estimated relative catchability; estimate of potential percentage of population caught annually (including BRD effect); natural mortality estimates (M) where available; and a sustainability indicator as proportion Caught/M (where C/M=1 ≈ MSY).
Class Genus Species Total
kg Open
kg Closed
kg %
Protected
2005 Trawled
kg
2005 %
Exposed
2005 Effort exp kg
% Effort exp
Rel. Catch
2005 %
Caught M est
2005
C/M
2011 Trawled
kg
2011 %
Exposed
2011 Effort exp kg
% Effort exp
2011 %
Caught
2011
C/M Actinopterygii Priacanthus tayenus 325414 274958 50456 16 194568 60 530267 163 1.00 150 1.2 1.25 164111 50 131294 40 37 0.31 Crustacea Portunus gracilimanus 188941 165221 23720 13 88423 47 244753 130 0.39 50 1.73 0.29 69818 37 64590 34 13 0.08 Actinopterygii Paramonacanthus choiro/otisensis 853441 603101 250341 29 271684 32 865804 101 0.25 23 2.54 0.09 212853 25 156652 18 4 0.02 Actinopterygii Scolopsis taeniopterus 519715 453864 65850 13 309925 60 492643 95 1.00 87 2.27 0.38 192968 37 106652 21 19 0.08 Actinopterygii Grammatobothus polyophthalmus 50912 46771 4141 8 29173 57 47031 92 0.64 55 1.19 0.46 20045 39 12895 25 15 0.13 Actinopterygii Dactyloptena papilio 54231 47802 6429 12 23167 43 48474 89 0.16 13 2.45 0.05 17876 33 12982 24 4 0.01 Actinopterygii Cynoglossus maculipinnis 52067 39386 12682 24 21748 42 38011 73 0.14 10 0.59 0.16 14174 27 8892 17 2 0.04 Crustacea Penaeus esculentus 475506 357610 117896 25 156373 33 334503 70 0.16 11 2.35 0.05 110536 23 86735 18 3 0.01 Actinopterygii Euristhmus nudiceps 389381 312151 77230 20 160979 41 269675 69 1.00 64 0.89 0.72 99989 26 53520 14 13 0.14 Bivalvia Amusium pleuronectes cf 47769 42335 5434 11 19715 41 32973 69 0.73 50 1.08 0.46 13501 28 8900 19 14 0.13 Actinopterygii Saurida argentea/tumbil 179570 138304 41266 23 73779 41 122905 68 1.00 63 1.1 0.57 48268 27 30967 17 16 0.14 Actinopterygii Nemipterus peronii 455278 398084 57194 13 190549 42 293349 64 0.62 37 0.66 0.56 134265 29 90700 20 11 0.17 Actinopterygii Pseudorhombus elevatus 110144 83855 26289 24 40095 36 65553 60 0.38 21 0.62 0.33 28503 26 20324 18 6 0.10 Bivalvia Placamen calophyllum 6227 5094 1133 18 2188 35 3551 57 0.04 2 1420 23 857 14 1 Actinopterygii Repomucenus belcheri 39358 34642 4716 12 15221 39 22160 56 0.42 22 1.11 0.20 9336 24 5166 13 5 0.05 Crustacea Portunus tenuipes 660299 577822 82477 12 281994 43 362328 55 0.68 37 1.73 0.22 168498 26 108250 16 11 0.06 Demospongiae Mycale (arenochalina) mirabilis 62941 31886 31055 49 10188 16 34173 54 0.07 4 8699 14 8043 13 1 Actinopterygii Nemipterus hexodon 229119 201293 27826 12 78926 34 124071 54 1.00 50 0.96 0.52 53691 23 32443 14 13 0.14 Actinopterygii Apistus carinatus 41293 38342 2951 7 15604 38 22273 54 0.34 17 1.35 0.12 10195 25 7102 17 5 0.04 Actinopterygii Leiognathus leuciscus 124480 87179 37301 30 47760 38 65588 53 0.43 21 2.41 0.09 30040 24 17317 14 5 0.02 Actinopterygii Choerodon sugillatum 380087 287368 92719 24 130982 34 199012 52 0.15 7 1.05 0.07 81841 22 47913 13 2 0.02 Actinopterygii Nemipterus nematopus 360775 335696 25078 7 90428 25 177212 49 0.61 28 1.07 0.26 63952 18 50496 14 8 0.07 Actinopterygii Apogon truncatus 333081 275992 57089 17 105894 32 162733 49 0.42 19 1.73 0.11 67659 20 44149 13 5 0.03 Crustacea Portunus argentatus 1331776 943975 387801 29 145166 11 629120 47 0.62 29 1.73 0.17 137425 10 181969 14 8 0.05 Actinopterygii Torquigener cf pallimaculatus 73598 48409 25189 34 16552 22 34677 47 0.63 28 1.08 0.25 11433 16 8243 11 7 0.06 Actinopterygii Saurida grandi-undosquamis 750210 641576 108634 14 265316 35 344298 46 1.00 42 1.1 0.38 161144 21 99241 13 12 0.11 Actinopterygii Lagocephalus sceleratus 239246 194430 44816 19 64278 27 99617 42 1.00 38 2.54 0.15 40064 17 26033 11 10 0.04 Crustacea Charybdis truncata 83384 66034 17350 21 24101 29 34179 41 0.39 16 14818 18 8753 10 4 Holothuroidea Holothuria ocellata 69811 50420 19391 28 18955 27 27187 39 0.10 4 11568 17 6660 10 1 Actinopterygii Nemipterus furcosus 908510 709361 199148 22 241849 27 339104 37 1.00 34 0.53 0.65 148032 16 85129 9 9 0.16 Actinopterygii Sorsogona tuberculata 408670 338602 70069 17 117457 29 138942 34 0.65 20 0.62 0.33 65515 16 38618 9 6 0.09 Actinopterygii Parapercis nebulosa 134741 100744 33997 25 53860 40 44175 33 1.00 30 1.24 0.24 26265 19 11124 8 8 0.06 Cephalopoda Sepia elliptica 56061 46556 9505 17 12743 23 17293 31 1.00 31 1.25 0.25 8072 14 4803 9 9 0.07 Cephalopoda Sepia pharaonis 119985 87351 32634 27 13314 11 31781 26 1.00 26 1.25 0.21 9916 8 6360 5 5 0.04 Actinopterygii Fistularia petimba 26935 20750 6185 23 6640 25 6322 23 1.00 22 0.26 0.83 4114 15 2133 8 7 0.28 Chondrichthyes Dasyatis leylandi 100127 69656 30471 30 16210 16 18783 19 1.00 19 0.41 0.46 8470 8 4316 4 4 0.11 Actinopterygii Pristotis obtusirostris 362516 233643 128873 36 48292 13 59864 17 0.81 12 0.46 0.27 27729 8 15192 4 3 0.07 Cephalopoda Sepia smithi 347578 204295 143283 41 30113 9 33870 10 1.00 10 16692 5 8739 3 3

Environmental sustainability assessment update for habitats, assemblages and bycatch species in the Torres Strait Prawn Fishery | 14
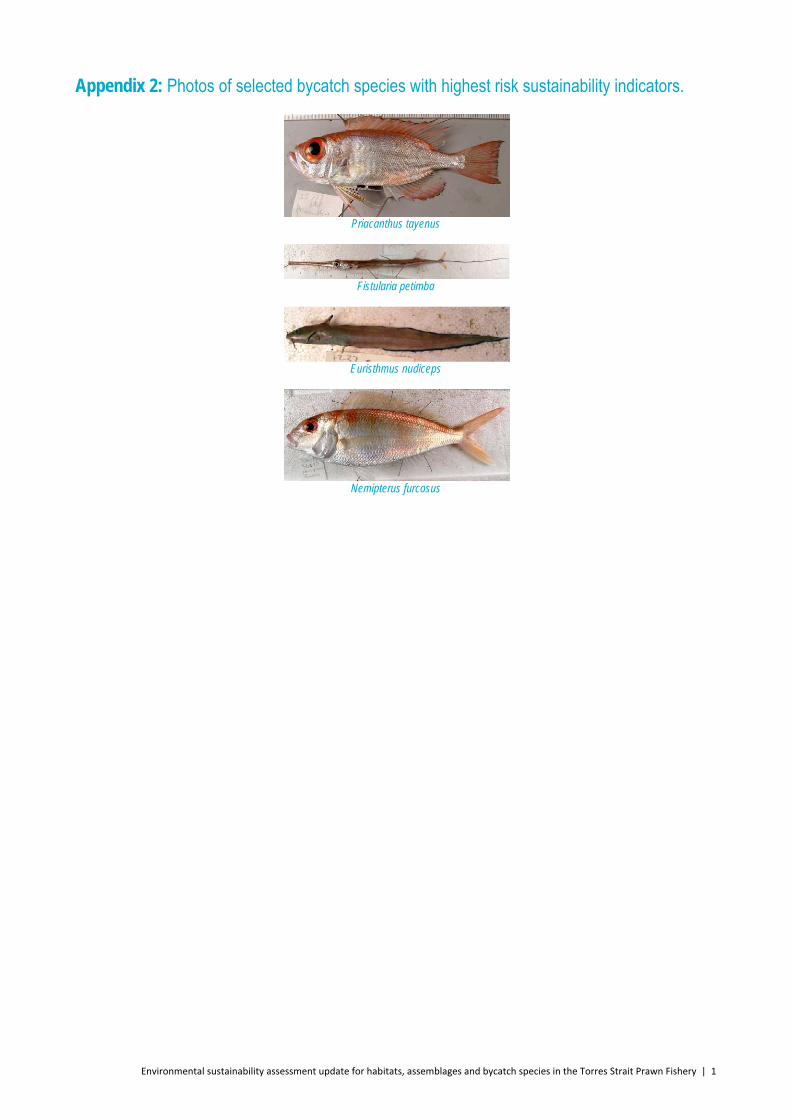
In this assessment, the natural mortality rates of species were used to indicate population recovery potential and to calculate a sustainability indicator estimated as the proportion of population caught divided by natural mortality (C/M, Table 3). Where this indicator exceeded the reference points 0.6 and 0.8, and the limit reference point 1.0 (≈MSY), the indicator is highlighted (pale, orange, and red — respectively). In 2005, one species exceeded the limit reference point: Priacanthus tayenus, the Purplespotted Bigeye (at 1.25); one species exceeded the first conservative reference point: Fistularia petimba, the Rough Flutemouth (at 0.83); and two species exceeded the second conservative reference point: Euristhmus nudiceps, the Nakedhead Catfish (at 0.72) and Nemipterus furcosus, the Rosy Threadfin Bream (at 0.65). Images of these species are presented in Appendix 2.
In the 2011 update of the species assessment, the relative order of species exposure to trawling and sustainability risk was similar, but the levels were substantially reduced (Table 3) consistent with the reduced areal footprint of the fishery and amount of effort. Only one species had moderate high exposure to 2011 trawl grounds (Priacanthus tayenus, 50%); 11 species had 50–25% exposure and 26 species had exposure <25%. Exposure to effort as swept-coverage was even more markedly reduced (by about 4-fold), and as a consequence, estimates of proportions of populations caught were also substantially reduced, with no species having high levels of exposure or catch. Finally, in 2011, no species exceeded any of the sustainability reference points; the highest value (again for Priacanthus tayenus, at 0.31) was well below the second conservative reference point (0.6).
Other species of interest: None of the additional listed species of interest to the traditional sector have predicted distribution maps available from the previous Torres Strait Seabed Project. Further, of these species, only three were sampled with sufficient frequency to compare with trawl effort (Table 4). Two of these species were sampled at sites with no record of trawling in 2005 or 2011, indicating no exposure in either year. Tropical rock lobster was sampled at one site with recorded trawling in both 2005 and 2011, indicating low exposure. The absence or low occurrence of these other species in the Seabed surveys is not because they are truly rare per se, as many are caught commonly by the traditional sector, but because they occur in other habitats and/or are not well sampled by sleds or trawls.
Table 4. Estimates of exposure to trawling of additional species sampled by Pitcher et al (2007); number of sites where sampled; sampled biomass (g) in sites open/closed to trawling indicating percent protected; sample exposed to trawl grounds; sample swept by effort intensity; for 2005 and 2011.
Genus species
# Sites
Open g
Closed g
% Protected
2005 Trawled
g
2005 %
Exposed
2005 Effort exp. g
2005 Effort
exp. %
2011 Trawled
g
2011 %
Exposed
2011 Effort exp. g
2011 Effort
exp. % Choerodon schoenleinii 14 1408 6853 83 0 0 0 0 0 0 0 0 Epinephelus quoyanus 8 3451 1462 30 0 0 0 0 0 0 0 0 Panulirus ornatus 13 7390 4421 37 259 2 315 3 259 2 461 4
The QDPI Torres Strait Bycatch Surveys 2004-2006 (Turnbull & Rose, 2006) sampled only one of the additional listed species, Epinephelus quoyanus, at 1 site in the East Warrior Closure in 2006. None were sampled in 2005 or 2004.
Regarding tropical rock lobster, it is well known from other lobster research that most of the lobster population is distributed in central Torres Strait, primarily in areas closed to trawling (Appendix 3, Fig. A3(a)). Also, it is known that lobsters emigrate from their central Torres Strait habitat to breeding grounds in eastern Torres Strait and elsewhere, their path crossing the trawl grounds. In the past, migrating lobsters have been targeted by trawlers; however, this activity was banned in 1984 and there have not been any reported breaches for many years (Qld

Environmental sustainability assessment update for habitats, assemblages and bycatch species in the Torres Strait Prawn Fishery | 15
Fishing & Boating Patrol).
The previous Torres Strait Seabed Project sampled only one snake (Aipysurus duboisii) and one Flatback turtle, both in open but untrawled sites; one Green turtle was sampled at a site closed to trawl. The QDPI Bycatch Surveys from the same time period included no snakes and no turtles. The additional listed species of interest appear to be rare on trawl grounds and/or in bycatch. Prior to the introduction of TEDs there were records of significant catches of turtles in trawl nets (Appendix 3, Fig.A3(b), as well as by communities in the vicinity of trawl grounds, Fig.A3(c)). However, since the introduction of TEDs in the TSPF there have been no significant catches of turtles in trawl nets and any caught are generally released alive. Further, overseas studies and studies in the Northern Prawn Fishery (NPF) indicated that the majority of turtles that interact with TEDs escape alive.
Regarding dugong, the aerial surveys show their distribution to the northwest in Torres Strait with essentially no overlap with the trawl grounds (Fig.A3(d)). The primary food source for dugong, the seagrass Halophila spinulosa, is also distributed in northwest Torres Strait and the 2005 assessment showed no exposure to trawl effort.
For completeness, the 2005 exposure of species related to the additional species was also examined. The assessment for all available congeneric fish species is shown in Table 5, and that for all available holothurians in Table 6. While some of these species had moderate exposure to trawl grounds and trawl effort in 2005, the estimates of percentage caught did not exceed any sustainability reference points, at least for fishes — and while natural mortality rates were not available for these holothurians their percentage caught was very low and unlikely to be unsustainable. In 2011, exposures and risk levels would have been substantively lower.
Table 5. 2005 assessment of exposure to trawling and sustainability risk for all available congeneric fish species (Class Actinopterygii), related to the additional species of interest: indicating percent exposed to trawl grounds; percent swept by effort intensity; relative catch rate; BRD effect; percent caught; natural mortality rate; C/M sustainability indicator (Pitcher et al 2007).
Genus Species %
Exposed Effort exp %
Rel. Catch BRD
% Caught
M est C/M
Choerodon sugillatum 34 52 0.15 0.92 7 1.05 0.07 Choerodon monostigma 20 26 0.34 0.92 8 1.05 0.08 Diagramma pictum 19 25 0.15 0.92 4 0.35 0.10 Siganus canaliculatus 7 13 0.16 0.92 2 2.96 0.01 Choerodon cephalotes 9 12 0.23 0.92 2 1.05 0.02
Table 6. 2005 assessment of exposure to trawling and potential risk for all available holothurians (Class Holothuroidea), related to the additional species of interest: indicating percent exposed to trawl grounds; percent swept by effort intensity; relative catch rate; BRD effect; percent caught; natural mortality rate; C/M sustainability indicator (Pitcher et al 2007).
Genus Species %
Exposed Effort exp %
Rel. Catch BRD
% Caught
M est C/M
Holothuria ocellata 27 39 0.10 4 n/a - Pseudocolochirus violaceus 18 24 0.23 5 n/a - Stichopus horrens 10 9 0.07 1 n/a - Cercodemas anceps 7 9 0.06 1 n/a -
Discussion Updated quantitative trawl exposure indicators were estimated for nine seabed habitat types, 12 species-assemblages, and 38 individual species assessed as higher exposure and/or risk in 2005. The update was based on distribution maps from a previous project (Pitcher et al 2007) and 2011 VMS effort data provided by QDAFF & AFMA. The area of trawl footprint was reduced and total effort much lower in 2011 than in 2005. The

Environmental sustainability assessment update for habitats, assemblages and bycatch species in the Torres Strait Prawn Fishery | 16
2011 updated assessment was compared with the 2005 assessment and in all cases the levels of trawl exposure and potential environmental risk were substantively reduced.
For the nine seabed habitat types, area-based trawl exposure indicators were estimated. In 2005, two habitat types had moderate to high exposures; the other seven had very low exposures. The highest exposures were for the two most barren habitat types, characterised by mostly bare or bioturbated muddy–sandy habitats with little biological structure, having negligible vulnerability to trawl impact. The remaining habitat types, including structural habitats, such as seagrass and algal beds and epibenthos, were virtually unexposed, so that their level of risk would be negligible. There was no habitat type uniquely associated with trawled areas and trawl effort was not statistically significant determinant of habitat, suggesting that trawling has not been a dramatic modifier of seabed habitat state in the TSPZ. The negligible risks in 2005 were substantively reduced in 2011 when no habitats had high exposure to trawling.
Area-based trawl exposure indicators were also estimated for 12 species-assemblages representing characteristic compositions of species that were sampled sufficiently frequently for mapping. In 2005, most of these assemblages had very low to zero exposures to trawl effort. However, three had exposures >25%, of which one had an exposure of 35%, one at 56% and the highest was 332% due to being trawled more than 3 times on average in 2005. Species having highest affinity for these exposed assemblages were identified and a number of species were observed to occur repeatedly across the more exposed assemblages; these species were addressed in the individual species assessments. The species composition of the most exposed assemblage differed subtly from neighbouring assemblages and the previous statistical analysis implicated historical trawl effort at levels greater than ~1× coverage/cell/year. This suggested that trawling may have been responsible for modifying the composition of seabed species. In 2011, assemblage exposures were substantively reduced and only the trawl modified assemblage remained significantly exposed albeit at much lower levels than in 2005.
Biomass-based trawl exposure indicators were estimated for 38 individual species assessed as higher exposure and/or risk in 2005. In 2005, 38 species had moderate to high exposure to trawled grounds and 56 had moderate to high exposure to trawl effort coverage. Six species had very high exposure to effort, of which three had estimated exposure greater than their estimated standing stock. The majority of highly exposed species were smaller fishes typical of bycatch. After taking into account relative catch rate information, the potential risks were much reduced for the majority of species. Only 19 species had moderate to high estimates of annual catch and two were very high. To understand the potential for species to sustain these catch rates, they were compared with estimates of natural mortality rates. This enabled calculation of a sustainability indicator (catch/mortality), which could be compared against reference points, based on stock assessment approaches, and allowed further differentiation of species risk in relation to their recovery potential. The benefit was provision of an absolute estimate of as well as biological reference points. In 2005, one species exceeded the limit reference point (MSY), and three other species exceeded one or both conservative sustainability reference points. In 2011, species exposures were substantively reduced; only 12 species had moderate to high exposure to trawled grounds and only three had moderate exposure to trawl effort coverage. Just one species had moderate percentage of its population caught and no species exceeded any reference points. This suggests that there were no bycatch species or benthic species sustainability concerns at the levels of trawl effort in 2011.
For the additional species of interest to the traditional sector, the available information allowed only simpler assessments of potential risk. Nevertheless, for those species for which information was available, the evidence suggested that risk was low in each case.
While all assessed risks were negligible or minimal in 2011, it should be noted that the 2011 effort was at historically low levels. In comparison, the 2005 assessment was conducted when effort was close to the Australian effort cap and to the approximation for effort-at-MEY cap if such a target was adopted in future. Hence, the 2005 environmental assessment is reasonably indicative of the potential environmental risks if the fishery recovers to these levels. At such levels, exposures would be much higher than in 2011, and a few species were at risk in 2005. Consequently, it is likely that some management action may be required to ensure bycatch sustainability should the fishery recover in future.
Environmental sustainability assessment update for habitats, assemblages and bycatch species in the Torres Strait Prawn Fishery | 17
References
AFMA (2010) Harvest Strategy for the Torres Strait Prawn Fishery, Australian Fisheries Management Authority, Canberra. 22 pages.
Brewer, D.T., Griffiths, S., Heales, D.S., Zhou, S., Tonks, M., Dell, Q., Taylor, B.T., Miller, M., Kuhnert, P., Keys, S., Whitelaw, W., Burke, A., Raudzens, E.. (2007). Design, trial and implementation of an integrated, long-term bycatch monitoring program, road tested in the Northern Prawn Fishery. Final Report on FRDC Project 2004/024. CSIRO Cleveland. pp. 416.
Courtney, A.J., Haddy, J.A., Campbell, M.J., Roy, D.P., Tonks, M.L., Gaddes, S.W., Chilcott, K.E., O’Neill, M.F., Brown, I.W., McLennan, M., Jebreen, J.E., Van Der Geest, C., Rose, C., Kistle, S., Turnbull, C.T., Kyne, P.M., Bennett, M.B., Taylor, J. (2006). Bycatch weight, composition and preliminary estimates of the impact of bycatch reduction devices in Queensland's trawl fishery. FRDC Project #2000/170 Final Report 353p.
Courtney, A.J., Tonks, M.L., Campbell, M.J., Roy, D.P., Gaddes, S.W., Kyne, P.M., O’Neill, M.F. (2006) Quantifying the effects of bycatch reduction devices in Queensland’s (Australia) shallow water eastern king prawn (Penaeus plebejus) trawl fishery. Fisheries Research 80:136–147
Gulland, J.A. (1983). Fish Stock Assessment: a manual of basic methods. FAO/Wiley Inter-Science, New York, 223 pp.
Hilborn, R., Walters, C.J. (1992) Quantitative fisheries stock assessment : choice, dynamics and uncertainty. Chapman & Hall, London. 570p.
Hobday A.J., Smith, A.D.M., Stobutzki, I.C., et al. (2011) Ecological Risk Assessment for the Effects of Fishing. Fisheries Research 108: 372-384
Pitcher, C.R., Haywood, M., Hooper, J., Coles, R., Bartlett, C., Browne, M., Cannard, T., Carini, G., Carter, A., Cheers, S., Chetwynd, D., Colefax, A., Cook, S., Davie, P., Ellis, N., Fellegara, I., Forcey, K., Furey, M., Gledhill, D., Hendriks, P., Jacobsen, I., Johnson, J., Jones, M., Last, P., Marks, S., McLeod, I., Sheils, J., Sheppard, J., Smith, G., Strickland, C., Van der Geest, C., Venables, W., Wassenberg, T., Yearsley, G. (2007). Mapping and Characterisation of Key Biotic & Physical Attributes of the Torres Strait Ecosystem. CSIRO/QM/QDPI Task Final Report to CRC Torres Strait. 142pp. ISBN 978-1-921232-89-3. http://www.cmar.csiro.au/e-print/open/2007/pitchercr_a.pdf
Poiner, I.R., Glaister, J., Pitcher C.R., Burridge, C., Wassenberg, T., Gribble N., Hill B., Blaber, S.J.M., Milton, D.A., Brewer D., Ellis, N., (1998) The environmental effects of prawn trawling in the far northern section of the Great Barrier Reef Marine Park: 1991–1996. Final Report to GBRMPA and FRDC. CSIRO Division of Marine Research – Queensland Department of Primary Industries Report, 554 pp. ISBN 0 643 06176 2
Robins, J.B., McGilvray, J.G. 1999. The AusTED II, an improved trawl efficiency device 2. Commercial performance. Fisheries Research 40: 29-41.
Robins-Troeger, J.B., Buckworth, R.C. & Dredge, M.C.L. 1995. Development of a trawl efficiency device (TED) for Australian prawn fisheries II. Field evaluations of the AusTED. Fisheries Research 22: 107-117.
Turnbull, C.T., Rose, C.L (2006) Towards Ecologically Sustainable Management of the Torres Strait Prawn Fishery. Department of Primary Industries and Fisheries, Queensland.
Zhou, S., Griffiths, S.P. (2008) Sustainability Assessment for Fishing Effects (SAFE): A new quantitative ecological risk assessment method and its application to elasmobranch bycatch in an Australian trawl fishery. Fisheries Research 91: 56–68

Environmental sustainability assessment update for habitats, assemblages and bycatch species in the Torres Strait Prawn Fishery | 18
Appendix 1: Photos of some example habitat types observed by towed video camera.
a) Soft muddy seabed. b) Bioturbated sandy-mud seabed c) Mobile sand waves deposited by tidal currents d) Coarse rubbly seabed
e) Caulerpa algae on sand f) Sargassum and other bushy brown algae g) Halimeda algae h) Ulva growing on coralline algae in SE TSPZ
i) Sea whip garden, with other benthos j) Gorgonian garden (sparse) k) Sponge garden (Ianthella) l) Hard coral (Turbinaria) garden
m) Seagrass (Halophila spinulosa) bed n) Crinoids on sand in strong current area o) Shoal reef with live coral p) Rock outcrop in SE TSPZ
Environmental sustainability assessment update for habitats, assemblages and bycatch species in the Torres Strait Prawn Fishery | 1
Appendix 2: Photos of selected bycatch species with highest risk sustainability indicators.
Priacanthus tayenus
Fistularia petimba
Euristhmus nudiceps
Nemipterus furcosus

Environmental sustainability assessment update for habitats, assemblages and bycatch species in the Torres Strait Prawn Fishery | 2
Appendix 3: Supplementary figures from other sources.
Figure A3(a). Distribution of Tropical Rock Lobster from research dive surveys (Source: Torres Strait GIS Metadata Inventory 1998).
Figure A3(b). Distribution of trawl effort and pre-TED turtle catch (Source: Torres Strait GIS Metadata Inventory 1998).

Environmental sustainability assessment update for habitats, assemblages and bycatch species in the Torres Strait Prawn Fishery | 3
Figure A3(c). Catch of Island Communities 1983-1989 (Source: Torres Strait GIS Metadata Inventory 1998).
Figure A3(d). Aerial survey sightings of dugongs 1991 & 1992 (Source: Torres Strait GIS Metadata Inventory 1998).

Environmental sustainability assessment update for habitats, assemblages and bycatch species in the Torres Strait Prawn Fishery | 4
Appendix 4: Descriptions of habitat type compositions from Pitcher et al (2007). Habitat Type 1 was among the most barren seabed types, almost entirely bare and/or bioturbated with very little biohabitat — distributed in low current stress, low salinity, muddy–sandy areas adjacent to the PNG coast and extending south behind the Warrior Reefs.
Habitat Type 2 was somewhat similar to habitat types 1 & 3, being also very barren with little epibenthos or algae, though sandier and much less bioturbated — distributed in low current stress, high salinity, low phosphate, low silicate variability, sandy areas located over most of eastern TSPZ including the trawl grounds and open areas of southern central TSPZ.
Habitat Type 3 was very similar to habitat type 1, being also very barren with very little epibenthos or algae, though sandier with less bioturbation — distributed in low current stress, high salinity, low phosphate, high silicate variability, muddy-sand areas located across and along the Great Northeast Channel in north-eastern TSPZ and spanning part of the northern trawl grounds.
Habitat Type 4 was sandy with coarse sand and ~20% cover of each of seagrass, Halimeda, other algae, various epibenthos gardens, and bare areas — distributed in low current stress, high salinity, high phosphate, low silicate, coarse sandy areas located in open seabed of central western TSPZ.
Habitat Type 5 was mostly coarse sand with 25–30% cover of each of seagrass, mixed algae, and bare areas, and ~15% of various epibenthos gardens — distributed in low current stress, high salinity, high phosphate, high silicate, coarse sandy areas located in open seabed of south-western TSPZ.
Habitat Type 6 was mostly rubbly with ~30% cover of sponge and other epibenthos gardens interspersed with ~15% cover of mixed algae and ~45% bare areas — distributed in high current stress, low phosphate, low sand, rubbly areas located along the western and Warrior lines of reefs and islands, and some inter-reef area of eastern TSPZ.
Habitat Type 7 was similar to 6 though sandier with coarse sand and with ~45% cover of sponge and other epibenthos gardens interspersed with ~15% cover of mixed algae and ~40% bare areas — distributed in high current stress, low phosphate, high sand areas located along the western and Warrior lines of reefs and islands, and some inter-reef area of eastern TSPZ.
Habitat Type 8 was sandy with coarse sand and ~30% cover of algae, ~20% seagrass and ~40% various epibenthos gardens — distributed in high current stress, high phosphate, low oxygen variability, sandy areas located primarily in north-western TSPZ.
Habitat Type 9 was mostly coarse sandy with rubble and stones, and ~25% cover of algae, ~10% seagrass and ~30% various epibenthos gardens — distributed in high current stress, high phosphate, high oxygen variability, coarse sandy areas located in north-western TSPZ and extending south adjacent to the western line of reefs and islands.
Environmental sustainability assessment update for habitats, assemblages and bycatch species in the Torres Strait Prawn Fishery | 5
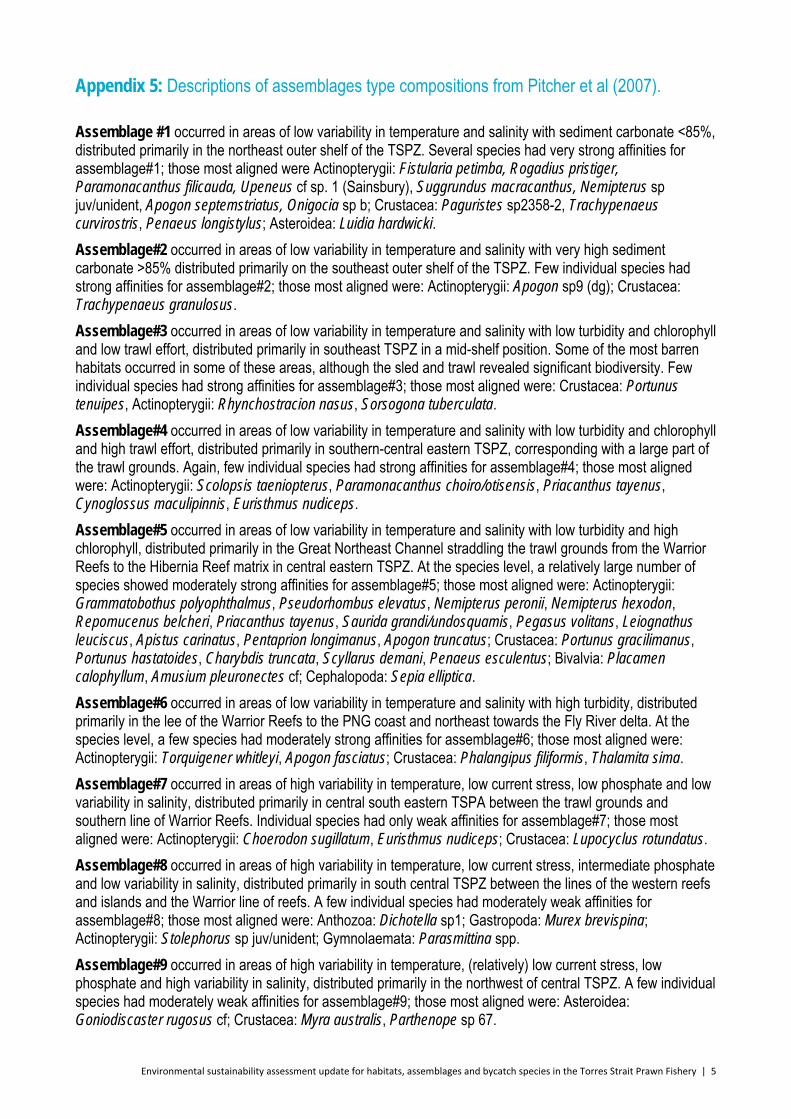
Appendix 5: Descriptions of assemblages type compositions from Pitcher et al (2007). Assemblage #1 occurred in areas of low variability in temperature and salinity with sediment carbonate <85%, distributed primarily in the northeast outer shelf of the TSPZ. Several species had very strong affinities for assemblage#1; those most aligned were Actinopterygii: Fistularia petimba, Rogadius pristiger, Paramonacanthus filicauda, Upeneus cf sp. 1 (Sainsbury), Suggrundus macracanthus, Nemipterus sp juv/unident, Apogon septemstriatus, Onigocia sp b; Crustacea: Paguristes sp2358-2, Trachypenaeus curvirostris, Penaeus longistylus; Asteroidea: Luidia hardwicki.
Assemblage#2 occurred in areas of low variability in temperature and salinity with very high sediment carbonate >85% distributed primarily on the southeast outer shelf of the TSPZ. Few individual species had strong affinities for assemblage#2; those most aligned were: Actinopterygii: Apogon sp9 (dg); Crustacea: Trachypenaeus granulosus.
Assemblage#3 occurred in areas of low variability in temperature and salinity with low turbidity and chlorophyll and low trawl effort, distributed primarily in southeast TSPZ in a mid-shelf position. Some of the most barren habitats occurred in some of these areas, although the sled and trawl revealed significant biodiversity. Few individual species had strong affinities for assemblage#3; those most aligned were: Crustacea: Portunus tenuipes, Actinopterygii: Rhynchostracion nasus, Sorsogona tuberculata.
Assemblage#4 occurred in areas of low variability in temperature and salinity with low turbidity and chlorophyll and high trawl effort, distributed primarily in southern-central eastern TSPZ, corresponding with a large part of the trawl grounds. Again, few individual species had strong affinities for assemblage#4; those most aligned were: Actinopterygii: Scolopsis taeniopterus, Paramonacanthus choiro/otisensis, Priacanthus tayenus, Cynoglossus maculipinnis, Euristhmus nudiceps.
Assemblage#5 occurred in areas of low variability in temperature and salinity with low turbidity and high chlorophyll, distributed primarily in the Great Northeast Channel straddling the trawl grounds from the Warrior Reefs to the Hibernia Reef matrix in central eastern TSPZ. At the species level, a relatively large number of species showed moderately strong affinities for assemblage#5; those most aligned were: Actinopterygii: Grammatobothus polyophthalmus, Pseudorhombus elevatus, Nemipterus peronii, Nemipterus hexodon, Repomucenus belcheri, Priacanthus tayenus, Saurida grandi/undosquamis, Pegasus volitans, Leiognathus leuciscus, Apistus carinatus, Pentaprion longimanus, Apogon truncatus; Crustacea: Portunus gracilimanus, Portunus hastatoides, Charybdis truncata, Scyllarus demani, Penaeus esculentus; Bivalvia: Placamen calophyllum, Amusium pleuronectes cf; Cephalopoda: Sepia elliptica.
Assemblage#6 occurred in areas of low variability in temperature and salinity with high turbidity, distributed primarily in the lee of the Warrior Reefs to the PNG coast and northeast towards the Fly River delta. At the species level, a few species had moderately strong affinities for assemblage#6; those most aligned were: Actinopterygii: Torquigener whitleyi, Apogon fasciatus; Crustacea: Phalangipus filiformis, Thalamita sima.
Assemblage#7 occurred in areas of high variability in temperature, low current stress, low phosphate and low variability in salinity, distributed primarily in central south eastern TSPA between the trawl grounds and southern line of Warrior Reefs. Individual species had only weak affinities for assemblage#7; those most aligned were: Actinopterygii: Choerodon sugillatum, Euristhmus nudiceps; Crustacea: Lupocyclus rotundatus.
Assemblage#8 occurred in areas of high variability in temperature, low current stress, intermediate phosphate and low variability in salinity, distributed primarily in south central TSPZ between the lines of the western reefs and islands and the Warrior line of reefs. A few individual species had moderately weak affinities for assemblage#8; those most aligned were: Anthozoa: Dichotella sp1; Gastropoda: Murex brevispina; Actinopterygii: Stolephorus sp juv/unident; Gymnolaemata: Parasmittina spp.
Assemblage#9 occurred in areas of high variability in temperature, (relatively) low current stress, low phosphate and high variability in salinity, distributed primarily in the northwest of central TSPZ. A few individual species had moderately weak affinities for assemblage#9; those most aligned were: Asteroidea: Goniodiscaster rugosus cf; Crustacea: Myra australis, Parthenope sp 67.

Environmental sustainability assessment update for habitats, assemblages and bycatch species in the Torres Strait Prawn Fishery | 6
Assemblage#10 occurred in areas of high variability in temperature, (relatively) low current stress and high phosphate, distributed primarily over most of western TSPZ. Some of the most extensive seagrass and algal beds occurred in some of these areas. At the species level, a relatively large number of species showed strong to moderate affinities for assemblage#10; those most aligned were: Liliopsida: Cymodocea serrulata, Halophila spinulosa, Halophila ovalis, Syringodium isoetifolium, Seagrass sp2: Bryopsidophyceae: Caulerpa racemosa, Caulerpa sp1, Green sp7, Halimeda cylindracea, Caulerpa taxifolia, Rhipilia sp1; Demospongiae: Stelletta clavosa, Dysidea arenaria, Dysidea sp3; Actinopterygii: Sillago ingenuua, Lethrinus genivittatus, Haliichthys taeniophorus, Hippocampus grandiceps, Selaroides leptolepis, Synodus sageneus, Bivalvia: Pinctada fucata, Spondylus wrightianus, Arca navicularis, Crustacea: Izanami (matuta) inermis, Myra australis; Echinoidea: Temnotrema bothryoides; Phaeophyceae: Sargassum decurrens; Gymnolaemata: Adeonella sp2; Cephalopoda: Sepiadariidae sp2; Holothuroidea: Cercodemas anceps; Gastropoda: Philine angasi.
Assemblage#11 occurred in areas of high variability in temperature, very high current stress and relatively low oxygen, distributed primarily in and adjacent to the passages between reefs and islands of the southern parts of the western and Warrior lines of reefs and islands. Some of the most extensive epibenthic faunal gardens occurred in some of these areas. At the species level, a number of species showed strong to moderate affinities for assemblage#11; those most aligned were: Demospongiae: Demospongiae conglomerate, Hyattella sp2, Reniochalina stalagmitis, Oceanapia tubes, Ianthella flabelliformis, Mycale (arenochalina) mirabilis, Ianthella quadrangulata; Florideophyceae: Lithophyllum kotschyanum; Anthozoa: Turbinaria spp, Dendronephthya spp, Cyphastrea spp; Ophiuroidea: Ophiolepis superba; Actinopterygii: Monacanthus chinensis, Phaeophyceae: Stypopodium sp.
Assemblage#12 occurred in areas of high variability in temperature, very high current stress and high oxygen, located primarily in northwest TSPZ and some passages between reefs. Again, some significant epibenthic faunal gardens occurred in some of these areas. At the species level, a few species showed moderately strong affinities for assemblage#11; those most aligned were: Echinoidea: Prionocidaris bispinosa, Nudechinus spp; Phaeophyceae: Sargassum sp12; Asteroidea: Euretaster insignis, Goniasteridae sp5; Actinopterygii: Apogon melanopus; Demospongiae: Hyattella sp2.

Environmental sustainability assessment update for habitats, assemblages and bycatch species in the Torres Strait Prawn Fishery | 7
CONTACT US
t 1300 363 400 +61 3 9545 2176 e [email protected] w www.csiro.au
YOUR CSIRO
Australia is founding its future on science and innovation. Its national science agency, CSIRO, is a powerhouse of ideas, technologies and skills for building prosperity, growth, health and sustainability. It serves governments, industries, business and communities across the nation.
FOR FURTHER INFORMATION
Dr C. Roland Pitcher Principal Research Scientist CSIRO Marine & Atmospheric Research EcoSciences Precinct 41 Boggo Road, DUTTON PARK, Qld. 4102 Australia (GPO Box 2583, Brisbane, QLD 4001) t: +61(7)38335954 f:+61(7)38335502 m: 0418 195 955 e: [email protected]