environmental statement for the year 2018-19
TRANSCRIPT

Page | 1
ENVIRONMENTAL STATEMENTFOR THE YEAR 2018-19
6 MTPA STEEL PLANT OF TATA STEEL AT
KLAINGANAGAR INDUSTRIAL COMPLEX, ODISHA
ENVIRONMENTAL DEPARTMENTTATA STEEL KALINGANAGAR
Kalinga Nagar Industrial Complex,Duburi- 755026, Dist- Jajpur, Odisha

Page | 2
ENVIRONMENTAL STATEMENT FORM-V(See rule 14)
Environmental Statement for the financial year 2018-19 ending with 31st March
Tata Steel Limited6.0 MTPA Steel Plant at Kalinganagar Industrial Complex, Odisha
PART-A
i) Name and address of the owner/occupier of the industry, operation orprocess
: Rajiv KumarVP, OperationsTata Steel Limited,Block-2, General Admin officeKalinga Nagar Industrial ComplexDuburi-755026 Orissa
ii) Industry CategoryPrimary/(STC code)Secondary (STC code)
: Large Metallurgical Industry__
iii) Production Capacity : 6.0 MTPA Crude Steeliv) Year of Establishment : 2016v) Date of Last Environmental /Audit
Report submitted: 27.09.2018
PART-B
WATER AND RAW MATERIAL CONSUMPTION
i) Water Consumption in m3/dayProcess : 19075Cooling : 17349Domestic : 3021
Name of the products
Process water consumption per unit of productsDuring the previous
Financial Year2017-2018
During the CurrentFinancial Year
2018-2019Crude Steel 4.75 cum/ MT 4.27 cum/MT
ii) Raw material consumption:
Name of RawMaterial
Name of theProducts
Consumption of raw material per unit ofoutput (MT/ TCS)
During theprevious Financial
Year2017-2018
During the CurrentFinancial Year
2018-2019
Coal
Crude Steel
0.83 0.43Iron Ore 1.44 1.59Lime stone 0.13 0.43Dolomite 0.10 0.18Metal & Ferro Alloys 0.01 0.01

Page | 3
PART-C
POLLUTION DISCHARGED TO ENVIRONMENT/ UNIT OF OUTPUT(PARAMETERS AS SPECIFIED IN THE CONSENT ISSUED)
PollutantsQuantity of pollutantsdischarged (mass/day)
Concentrations ofpollutants in discharges
(mass/volume)
Percentage ofvariation from
prescribedstandards with
reasons*Kg/day mg/Nm3
a) Water No discharge of Process waste water. CETP is in operation.b) Air
1 Coke Oven Battery No.1PM 295.1 40.9 -18.172 Coke Oven Battery No. 1 De-dusting Chimney
PM 52.0 7.9 -84.203 Coke Oven Battery No. 2
PM 269.7 39.2 -21.534 Coke Oven Battery No. 2 De-dusting Chimney
PM 67.6 10.5 -79.085 CPP Boiler-1
PM 103.3 7.2 -85.586 CPP Boiler-2
PM 125.9 8.8 -82.387 BF Cast House-1
PM 660.0 32.3 -35.338 BF Cast House-2
PM 649.3 34.5 -31.059 BF Stock House
PM 527.1 28.9 -42.2810 Blast Furnace StovePM 277.2 20.5 -59.0711 Lime Calcination Kiln-1PM 26.4 7.7 -94.8512 Lime Calcination Kiln-2PM 29.9 8.8 -94.1113 Sinter Plant Waste gas ChimneyPM 2087.9 41.6 -16.7814 Sinter Plant De-dustingPM 632.0 33.2 -33.6215 Stack attached to CDQPM 153.8 25.2 -49.6816 Stack attached to HSM Recuperator 1PM 55.3 8.2 -91.7617 Stack attached to HSM Recuperator 2PM 65.8 9.6 -90.4018 SMSPM 2449.0 34.8 -30.42

Page | 4
PART-D
HAZARDOUS WASTES
(AS SPECIFIED UNDER HAZARDOUS WASTES (MANAGEMENT,HANDLING AND TRANS BOUNDARY MOVEMENT RULES, 2016)
Hazardous Wastes
Total Quantity (Kg)During the previous
Financial Year2017-2018
During the CurrentFinancial Year
2018-20191. From ProcessSludge and filters Contaminated with Oil(Schedules-I Stream-3.3)
Nil Nil
Used or spent oil(Schedules-I Stream-5.1)
60300 99550
Wastes / Residues containing oil(Schedules-I Stream-5.2)
20590 _
Used grease / Greased sludge(Schedules-I Stream-5.2)
60360 68930
Oil soaked jute / cotton(Schedules-I Stream-5.2)
10760 Approx. 8000
Acid from used Batteries(Schedules-I Stream-9.3)
Nil Nil
Acid & Alkaline residues, spent acid andAlkali(Schedules-I Stream-12.1 & 12.2)
Nil Nil
Coal Tar sludge(Schedules-I Stream-13.4)
206770 213000
Tar tank, Storage sludge / residues(Schedules-I Stream-13.5)
Nil Nil
CO gas pipe line waste & residue from COgas tap(Schedules-I Stream-13.6)
Nil Nil
Cleaning solvent sludge(Schedules-I Stream-20.4)
Nil Nil
Empty containers of hazardous chemical(Schedules-I Stream-33.1)
#648 Nos. #787 Nos.
Exhaust air or gas cleaning residue(Schedules-I Stream-35.1)
Nil Nil
Spent lon exchange resins(Schedules-I Stream-35.2)
Nil Nil
2.From Pollution control facilitiessludge from waste water treatment(Schedules-I Stream-35.3)
204180 316590
Oil and grease skimming residueSchedules-I Stream-35.4
2480 Nil
Waste cartridge from CETP, WWTPSchedules-I Stream-36.2
Nil Nil
Evaporation residue from CETP(Schedules-I Stream-37.3)
Nil Nil
# Containers of oil/ grease - were used for storage of same material and the hazardous wastes (usedoil/used grease/ waste oil etc.) were sold to authorised recyclers along with the containers.

Page | 5
PART-ESOLID WASTE
PART-FPlease specify the characteristics (in terms of concentration and quantum)
of hazardous as well as solid wastes and indicate disposal practiceadopted for both these categories of wastes.
Sl.No.
Solid wasteTotal Quantity (Kg)
During the previousfinancial year 2017-18
During the currentfinancial year 2018-19
a. From process 1035333 MT of BF Slag 1237826 MT of BF Slag621001 MT of LD Slag
b.From Pollution
Control facilities26969 MT of Flue dust 31720 MT Flue dust
c.
1)Quantity
recycled/reutilised
within the unit
206.77 MT of Coal tar
sludge utilised in house
213 MT of Coal tar
sludge utilised in house
28693 MT of
Flue Dusts utilised in
house
29958 MT ofFlue Dusts utilised inhouse.488635 MT of LD Slagused within.
2) Sold 920255 MT of BF Slag1086818 MT of BF slag132366 MT of LD Slagsold outside.
3) Disposed Nil Nil
Hazardous/ Solid Wastes Characteristics Method of disposalWastes / Residues containing oil
(Hazardous Waste)Oily Sold to authorised recycler/
Disposed throughCHWTSDF Sukinda
Used grease / Greased sludge(Hazardous Waste)
Oily Sold to authorised recycler/Disposed throughCHWTSDF Sukinda
Waste Water Sludge / Filter cakefrom CETP
Solid Disposed throughCHWTSDF Sukinda
BF Slag(Solid Waste)
Solid Sold to cement industries

Page | 6
PART-G
Impact of the pollution control measures taken on conservation of naturalresources and consequently on the cost of production.
Pollution control equipment are effective and efficiently operated at all units. By-product gases generated in Coke plant, Blast Furnace and Steel melting
are recovered and clean gas is used as fuel in power generation and otherunits, thus reducing coal consumption.
For collection of surface runs off during monsoon through different drains andrecovery of water through pumps, a reservoir of 39,000 m3 capacity has beenconstructed.
Centralised effluent treatment Plant (CETP) in operation to maximize reuseand recovery of treated waste water from different plant units.
Mechanised road sweeping machine engaged to maintain housekeeping ofplant roads.
Water sprinkling through mobile water tankers to suppress fugitive dusts onroads and other areas.
Tree plantation is being undertaken in & around site. Till Financial Year 2018-19, 3.75 Lakh of trees planted in and around the site
Investment of more than Rs. 1500 Crores has been made for pollution controlequipment and other environmental protection measures
PART-H
Additional measures/investment proposal for environmental protection includingabatement of pollution.
Environmental Laboratory facilities being upgraded. Investment for remote calibration system of OCEMS for gaseous pollutants Greenery development programme will continue in the year 2019-20.

Page | 7
PART-I
MISCELLANEOUS:Any other particulars in respect of environmental protection and abatement of
pollution.
Tree plantation is undertaken in and around the site. Details of tree saplingsplanted: -
FY Plantation (Nos.) FY Plantation (Nos.)2009-10: 792 2014-15: 354372010-11: 1130 2015-16: 787302011-12: 4800 2016-17: 773352012-13: 12622 2017-18: 1007012013-14: 29888 2018-19: 33116
Avenue plantation is being taken up at Jajpur town, Kalinganagar and Bhubaneswar
To maintain housekeeping of plant roads mechanised road sweeping system is
operated.
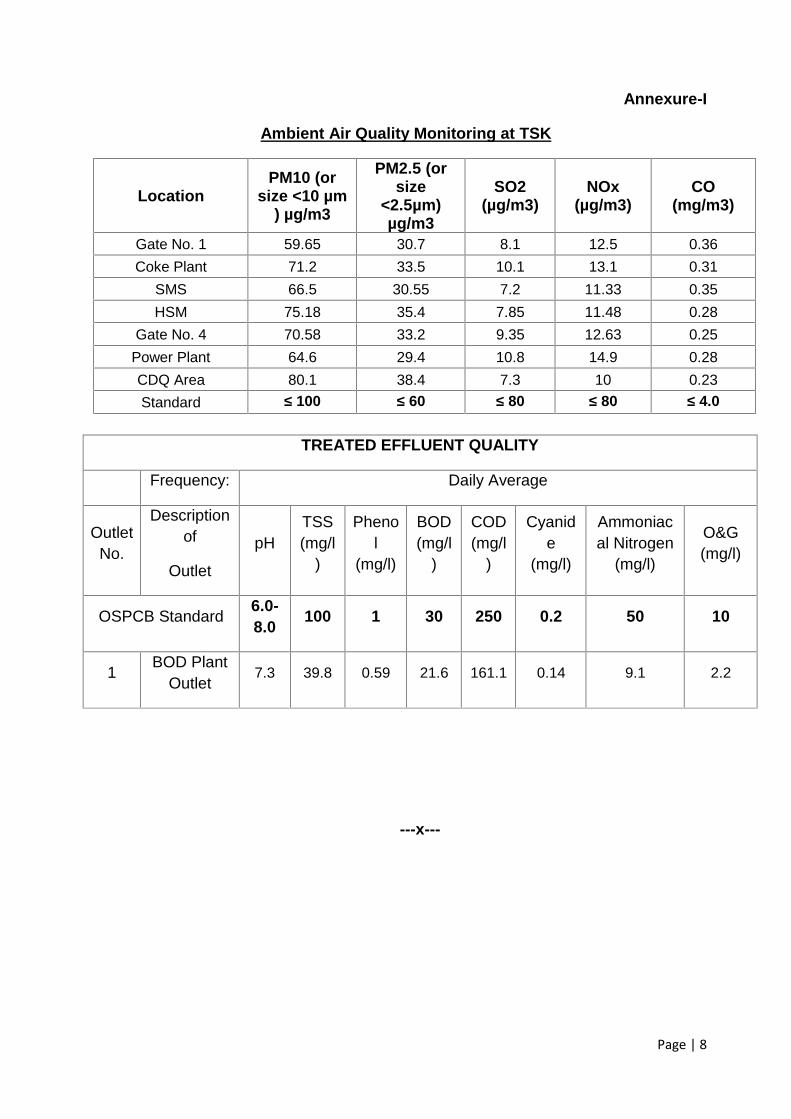
Regular Environmental Monitoring is carried out. Please refer to Annexure-I.
Seven Nos. of Online AAQM stations commissioned along with Environmental
Display Board and data linkage provided for continuous display of data.
17 nos. of CEMS, 7 nos. of CAAQMS and 2 nos. of WQMS have been installed
and connected to the server of the OSPC Board.
Consent to Operate (CTO) for integrated steel plant granted by OSPCB on
21.03.2017, which is valid till 31.03.2020.
About 30539 Sq. meter of Garden has been developed in FY 19.
1.5 Lakh sq. meter of garden landscape are being maintained in & around KLNR
In FY 2019, 740 Kgs of plastic wastes collected, segregated and disposed through
Co-processing in cement kiln of ACC, Bargarh.
In FY 2019, Total 7110 Nos. of e- wastes (6892 Nos. of Category CEEW5, 110
Nos. of Category ITEW6 and 108 Nos. of category ITEW12) were collected and
deposited to authorised e- waste collection centre of M/s Sani clean Pvt ltd.,
Bhubaneswar.
In FY 2019, 16.35 Kgs of Biomedical wastes generated in plant’s First Aid centre
were segregated, collected and disposed through Authorised Biomedical waste
disposal facility of M/s Sani clean Pvt Ltd, Bhubaneswar.
---x---
Page | 8
Annexure-I
Ambient Air Quality Monitoring at TSK
LocationPM10 (or
size <10 µm) µg/m3
PM2.5 (orsize
<2.5µm)µg/m3
SO2(µg/m3)
NOx(µg/m3)
CO(mg/m3)
Gate No. 1 59.65 30.7 8.1 12.5 0.36Coke Plant 71.2 33.5 10.1 13.1 0.31
SMS 66.5 30.55 7.2 11.33 0.35HSM 75.18 35.4 7.85 11.48 0.28
Gate No. 4 70.58 33.2 9.35 12.63 0.25Power Plant 64.6 29.4 10.8 14.9 0.28CDQ Area 80.1 38.4 7.3 10 0.23Standard ≤ 100 ≤ 60 ≤ 80 ≤ 80 ≤ 4.0
TREATED EFFLUENT QUALITY
Frequency: Daily Average
OutletNo.
Descriptionof
Outlet
pHTSS(mg/l
)
Phenol
(mg/l)
BOD(mg/l
)
COD(mg/l
)
Cyanide
(mg/l)
Ammoniacal Nitrogen
(mg/l)
O&G(mg/l)
OSPCB Standard 6.0-8.0 100 1 30 250 0.2 50 10
1 BOD PlantOutlet 7.3 39.8 0.59 21.6 161.1 0.14 9.1 2.2
---x---

Page | 9
Some Photographs of Tata Steel Kalinganagar
First Slab casted in TSK First Coil rolled in TSK
Concrete road and road side plantation Road sweeping with mechanised sweeping machine
Garden development in plant area Landscaping in Office area
--X--