environmental science water research & technology · suspended by recirculation to effectively...
TRANSCRIPT
EnvironmentalScienceWater Research & Technology
PAPER
Cite this: Environ. Sci.: Water Res.
Technol., 2016, 2, 994
Received 8th August 2016,Accepted 20th September 2016
DOI: 10.1039/c6ew00203j
rsc.li/es-water
An aerated and fluidized bed membranebioreactor for effective wastewater treatment withlow membrane fouling†
Yaoli Ye,a Nicole LaBarge,a Hiroyuki Kashima,a Kyoung-Yeol Kim,a Pei-Ying Hong,b
Pascal E. Saikalyb and Bruce E. Logan*a
Anaerobic fluidized bed membrane bioreactors (AFMBRs) use granular activated carbon (GAC) particles
suspended by recirculation to effectively treat low strength wastewaters (∼100–200 mg L−1, chemical oxy-
gen demand, COD), but the effluent can contain dissolved methane. An aerobic fluidized bed membrane
bioreactor (AOFMBR) was developed to avoid methane production and the need for wastewater
recirculation by using rising air bubbles to suspend GAC particles. The performance of the AOFMBR was
compared to an AFMBR and a conventional aerobic membrane bioreactor (AeMBR) for domestic wastewa-
ter treatment over 130 d at ambient temperatures (fixed hydraulic retention time of 1.3 h). The effluent of
the AOFMBR had a COD of 20 ± 8 mg L−1, and a turbidity of <0.2 NTU, for low-COD influent (153 ± 19
and 214 ± 27 mg L−1), similar to the AeMBR and AFMBR. For the high-COD influent (299 ± 24 mg L−1),
higher effluent CODs were obtained for the AeMBR (38 ± 9 mg L−1) and AFMBR (51 ± 11 mg L−1) than the
AOFMBR (26 ± 6 mg L−1). Transmembrane pressure of the AOFMBR increased at 0.04 kPa d−1, which was
20% less than the AeMBR and 57% less than the AFMBR, at the low influent COD. Scanning electron
microscopy (SEM) analysis indicated a more uniform biofilm on the membrane in AOFMBR than that from
the AeMBR biofilm, and no evidence of membrane damage. High similarity was found between communi-
ties in the suspended sludge in the AOFMBR and AeMBR (square-root transformed Bray–Curtis similarity,
SRBCS, 0.69). Communities on the GAC and suspended sludge were dissimilar in the AOFMBR (SRBCS,
0.52), but clustered in the AFMBR (SRBCS, 0.63).
1. Introduction
Aerated membrane bioreactors (AeMBRs) are effective alter-natives to conventional processes for wastewater treatmentbecause of the combination of good biochemical oxygen de-mand (BOD) removal and the lack of a need for a secondaryclarifier. Other advantages of AeMBRs include the ability toobtain a high mixed liquor suspended solids (MLSS) concen-
tration in the reactor,1 stability of performance during fluctu-ations in flow and organic loading, low excess sludge produc-tion, and relatively short hydraulic retention times (HRTs).2,3
However, a major disadvantage of AeMBRs and other mem-brane bioreactors (MBRs) is the need for frequent membranechemical cleaning to avoid excessive membrane fouling.4 Theenergy demands of all aeration systems, including AeMBRsand activated sludge, are also high compared to those neededfor anaerobic treatment techniques.5
Anaerobic membrane bioreactors (AnMBRs) are being de-veloped as alternatives to activated sludge and aerated mem-brane bioreactors in order to reduce energy demands neededfor wastewater treatment6 because AnMBRs do not requireaeration, and to reduce treatment plant operating costs as an-aerobic processes can produce less sludge than aerobic
994 | Environ. Sci.: Water Res. Technol., 2016, 2, 994–1003 This journal is © The Royal Society of Chemistry 2016
aDepartment of Civil and Environmental Engineering, The Pennsylvania State
University, University Park, PA, 16802, USA. E-mail: [email protected] Biological and Environmental Sciences and Engineering Division, King Abdullah
University of Science and Technology (KAUST), 4700 King Abdullah Boulevard,
Thuwal 23955-6900, Saudi Arabia
† Electronic supplementary information (ESI) available. See DOI: 10.1039/c6ew00203j
Water impact
A new type of membrane reactor was developed that combined aerobic conditions and a fluidized bed of granular activated carbon (GAC) to better controlmembrane fouling and enable effective wastewater treatment without the generation of methane gas. Aerobic conditions led to different microbialcommunities on the GAC and in suspension compared to similar communities in the completely anaerobic reactor.
Environ. Sci.: Water Res. Technol., 2016, 2, 994–1003 | 995This journal is © The Royal Society of Chemistry 2016
systems. AnMBRs have been tested with many types of waste-waters, including municipal, synthetic, food processing, andindustrial, at both laboratory and pilot scales, and have pro-duced good effluent quality.6,7 However, membrane fouling isalso challenging for AnMBR operation. Various strategieshave been developed to reduce fouling, such as biogasrecirculation and sparging,8 addition of granular or powderedactivated carbon (PAC) as an absorbent9 in a submergedmembrane operation, ultrasonic irradiation,10 and high crossflow velocity11 for the external cross-flow operation.
A new approach to reduce membrane fouling for low-strength wastewaters was recently developed based on usingfluidized granular activated carbon (GAC), in a process calledan anaerobic fluidized bed membrane bioreactor (AFMBR).The AFMBR has primarily been used as the secondary treat-ment reactor to treat the effluent from several different typesof reactors. In tests using effluent from an anaerobic fluid-ized bed bioreactor (AFBR) treating synthetic wastewater, theAFMBR achieved 87% removal of the chemical oxygen de-mand (COD) (influent of 59 mg COD L−1) and nearly 100%solids removal, at an HRT of 2–3 h. Membrane fouling waswell controlled as the reactor was operated for 120 days, andrequired only two chemical cleanings. The energy consump-tion of the AFMBR was estimated to be only 0.058 kW hm−3.12 An AFMBR was also used as a secondary treatment pro-cess to treat effluent from a microbial fuel cell (MFC) treatingdomestic wastewater. At an HRT of only 1 h, the AFMBR re-moved 85% of the COD and 99.6% the TSS, with an estimatedenergy demand of 0.0186 kW h m−3.13 An AFMBR treating theeffluent from an anaerobic baffled reactor (ABR), showed 87%COD removal using a complex synthetic wastewater at an HRTof ∼1 h, with an energy demand of 0.0087 kW h m−3.14 A sin-gle AFMBR was compared to staged anaerobic fluidized mem-brane bioreactors (SAF-MBR) for treating synthetic wastewater(∼200 mg COD L−1), with no significant differences found be-tween the processes in terms of COD removal efficiency,transmembrane pressure (TMP), bulk liquid suspendedsolids, extracellular polymer substances (EPS) production,and soluble microbial products (SMP).15
One of the main disadvantages of AnMBRs or AFMBRs isthat the effluent can contain high concentrations of dissolvedmethane which must be removed prior to discharge to avoidthe release of this greenhouse gas to the atmosphere.16,17 Inthis study, an aerobic fluidized bed membrane bioreactor(AOFMBR), containing 92 g L−1 fluidized GAC particles asscouring media, was examined to simultaneously avoid pro-duction of dissolved methane, as well as eliminate the needfor water (AFMBR) or biogas recirculation (AnMBR) used inanaerobic membrane reactors. The performance of theAOFMBR was compared in side-by-side tests with two otherprocesses as controls: an AFMBR and an AeMBR. Domesticwastewater was used at three different COD concentrations(∼150, 200, and 300 mg L−1) to study the impact of organicloading on COD removal and membrane fouling. It was hy-pothesized that AOFMBR could achieve better organics re-moval and have less membrane fouling, as well as avoid gen-
eration of dissolve methane due to the aerobic conditionscompared to the AFMBR. Treatment was evaluated in termsof COD and soluble COD (SCOD) removal and effluent tur-bidity, and TMP was monitored to assess membrane fouling.Scanning electron microscopy (SEM) was conducted to exam-ine the morphology of biofilms on the membrane and mem-brane integrity. Analysis of microbial communities by 16SrRNA gene sequencing was done by sampling the solutions,and when present, the GAC, in the different reactors.
2. Materials and methods2.1. Reactor design
All three reactors (AFMBR, AOFMBR, and AeMBR) wereconstructed from polyvinyl chloride (PVC) tubes (30 cm longand 1.6 cm in diameter) with fittings and connectors as previ-ously described.13 Each reactor had a volume of 65 mL, withslightly different configurations for aeration versusrecirculation (Fig. S1†). A thick butyl rubber stopper (20 mmdiameter, Chemglass Inc., Vineland, NJ) was placed on thetop of the AFMBR tube to keep it sealed. Biogas produced bythe AFMBR was collected for analysis in a gas bag to the topof the reactor using a needle to pierce the rubber stopper.Each reactor contained a membrane module made by bun-dling eight polyvinylidene fluoride (PVDF) hollow fiber mem-branes (24 cm long, 2.0 mm in outer diameter, 0.8 mm in in-ner diameter, 0.1 μm pore size, Kolon Inc., South Korea)together for a total exposed membrane area of 0.0048 m2 perreactor. Epoxy was applied as the sealant. The module wasplaced in the middle of the reactor body, with the effluentpulled through the membrane by suction generated using aperistaltic pump (model no. 7523-90, Masterflex, VernonHills, IL). GAC (DARCO MRX, 10 × 30 mesh, Norit ActivatedCarbon) was rinsed with deionized water several times, andadded into the AFMBR (10 g wet weight, 153 g GAC L−1) andAOFMBR (6 g wet weight, 92 g GAC L−1). High concentrationsof GAC were used to control membrane fouling by scouringin both the AFMBR and AOFMBR reactors, at concentrationssimilar to those used in previous AFMBR studies.13,18 LessGAC was added into AOFMBR in order to keep it better fluid-ized by rising air bubbles. AeMBR and AOFMBR had thesame reactor configuration except no GAC was added intoAeMBR. Mechanical scouring of GAC (AFMBR and AOFMBR)or shear generated by air bubbles (AeMBR) were the onlystrategies to control membrane fouling during the study.There was no chemical cleaning of the membranes.
2.2. Reactor operation
All three reactors were operated at an overall HRT of 1.3 h(11.6 L m−2-membrane-h), with pumps operating for 10 minon at 0.93 mL min−1, and 1 min off for relaxation of themembranes. Fluid was recirculated by pumping (model no.7523-90, Masterflex, Vernon Hills, IL) at a flowrate of 250 ±30 mL min−1 (upflow velocity of 2.4 cm s−1) to fluidize theGAC in the AFMBR. An air flow of 240 ± 20 mL min−1 (3.0 m3
m−2-membrane surface-h) was used for both the AOFMBR
Environmental Science: Water Research & Technology Paper
996 | Environ. Sci.: Water Res. Technol., 2016, 2, 994–1003 This journal is © The Royal Society of Chemistry 2016
and AeMBR, by placing a gas diffusor (gas dispersion tubes,Medium Frit, Chemglass, US) at the bottom of the reactor(Fig. S1†). The effluent tubing was cleaned with hydrochloricacid two times (day 41 and 89) in response to spikes in efflu-ent turbidity, to remove accumulated biomass growing in thetubing.
In order to acclimate the microorganisms for growth onthe GAC, the AFMBR and AOFMBR were inoculated using di-luted municipal wastewater (primary clarifier of the Pennsyl-vania State University Wastewater Treatment Plant) with aCOD of 150 mg L−1, for one month, using the operationmode described above. The AeMBR was fed with the same di-luted wastewater for one month. To begin the experiments,the membrane modules were replaced by new ones (desig-nated day 1).
In order to study the effect of wastewater strength onmembrane fouling and effluent quality, the study conditionswere separated into 4 phases: phase 1 (1–45 days), influentCOD of 153 mg L−1; phase 2 (45–73 days), influent COD of214 mg L−1; phase 3 (73–103 days), influent COD of 299 mgL−1; phase 4 (103–131 days), influent COD of 329 mg L−1, andusing a new membrane module. Operational details are sum-marized in Table 1. The replacement of the membrane mod-ule for phase 4 was needed due to the TMP drop in theAFMBR and AeMBR, which might have been caused by thefailure of the membrane at some time in phase 3. The waste-water strength was controlled by dilution of domestic waste-water using distilled water to obtain the targeted COD. Con-sistent pH and solution conductivity were obtained by addingsodium bicarbonate and sodium chloride as needed to eachdiluted wastewater sample (pH of ∼7.6 and conductivity of1.2 mS cm−1). Effluent samples were taken from the effluenttubing every two days. All reactors were operated at ambienttemperature (22 ± 10 °C).
2.3. Measurement and analysis
COD was measured using a DR3900 Spectrophotometer(HACH, Company, Loveland, CO). Samples for SCOD analysiswere filtered using 0.45 μm pore size syringe filters (PVDF, 25mm size, Restek Corporation). Differences in effluent CODsand SCODs between the reactors were assessed using the Stu-dent's t-test. The difference in results was considered to be sig-nificant here when the P value was less than 0.03. Conductivityand pH were measured using probes and meters (Seven-Multi, Mettler-Toledo International Inc.). Biogas productionrates were calculated from the change in biogas composition
(measured using gas chromatographs; SRI Instruments) andvolume of gas in the collection bag. Turbidity was measured(2100P, HACH Company, Loveland, CO) as an indicator ofsolids removal. Pressure in the effluent tubing was monitoredas the TMP of the membrane module using a pressure trans-ducer (TDH 31, Transducer Direct, US). Suction pressure wasreported as a positive value. TMP and turbidity data were col-lected starting on day 7.
Membranes from the reactors were examined with SEM atthe end of phase 3 to evaluate biofilm formation due to thethree different reactor operational conditions. Small pieces ofmembrane were cut from the middle of the fiber, and pre-pared by: fixation in 2.5% glutaraldehyde in a 0.1 M phos-phate buffer solution (PBS) at a pH of 7.2 for 30 minutes;rinsing with PBS for 3 × 5 min; successive dehydration usingethanol solutions of 5%, 50%, 70%, 85%, 95%, 3 × 100%,each for 5 min; critical point drying; sample mounting onaluminum stubs with conductive tabs; and coating with 10nm Au/Pd. SEM images were viewed at 125× and 10 000×magnifications.
The microbial communities were analyzed using genomic DNAextracted from the suspended biomass and biomass on the GAC(0.25 g, if present) in the AOFMBR, AFMBR, and AeMBR at the endof phase 4. For suspended biomass samples, liquid (13 mL) fromthe reactor was centrifuged at 4500 × g (Eppendorf 5804) for 1 hand the supernatant was decanted. For the AOFMBR and AeMBRsuspended biomass analysis, 0.25 g of pellet was used for DNA ex-traction, but less was used for the AFMBR due to less solids col-lected. DNA was extracted from suspended biomass samples andGAC following the power soil DNA isolation kit protocol (Mo BioLaboratories, Inc) with modifications: 0.1 um diameter glass beadswere used instead of garnet beads; samples were centrifuged for 1min instead of 0.5 min; and the incubation time was increased for10 min instead of 5 min. The 16S rRNA genes in the extractedDNA samples were amplified by polymerase chain reaction (PCR)according to a previous study.19 Briefly, thermal cycling wasconducted with the barcoded forward primer of 515F (5′-Illuminaoverhang -GTGYCAGCMGCCGCGGTA-3′) and reverse primer 805R(5′-Illumina overhang-GACTACHVGGGTATCTAATCC-3′), followedby the purification of amplicons. Equimolar 16S rRNA geneamplicons were mixed and submitted for high-throughputamplicon sequencing on an Illumina MiSeq platform (IlluminaInc, San Diego, CA, USA) in the KAUST Genomics Core Lab. TheDNA sequences were processed for its quality and analyzed by thesame approach as specified in previous study.20 Briefly, the relativeabundances of various microbial genera and unclassified groupswere square-root transformed and calculated for Bray-Curtis simi-larities (SRBCS) and metric multi-dimensional scaling (mMDS).Microbial groups that exhibited more than 0.95 Pearson's correla-tion to the spatial distribution of samples were overlaid onto themMDS plot, and represented as vectors accounting for the spatialpositions of samples. The microbial relative abundance was plottedin phylum level, with the predominant genus (>1%) shown sepa-rated. All high-throughput sequencing files were deposited in theshort read archive (SRA) of the European Nucleotide Archive (ENA)under study accession number PRJEB13756.
Table 1 Wastewater characteristics (influent) and membrane condition
Phase 1 2 3 4
COD (mg L−1) 153 ± 19 214 ± 27 299 ± 24 329 ± 37SCOD (mg L−1) 87 ± 18 115 ± 19 185 ± 26 179 ± 28pH 7.7 ± 0.1 7.7 ± 0.1 7.5 ± 0.3 7.7 ± 0.2Conductivity (mS cm−1) 1.2 ± 0.1 1.2 ± 0.1 1.3 ± 0.1 1.2 ± 0.1Membrane New Continued Continued New
Environmental Science: Water Research & TechnologyPaper
Environ. Sci.: Water Res. Technol., 2016, 2, 994–1003 | 997This journal is © The Royal Society of Chemistry 2016
3. Results3.1. Effluent quality and COD removal
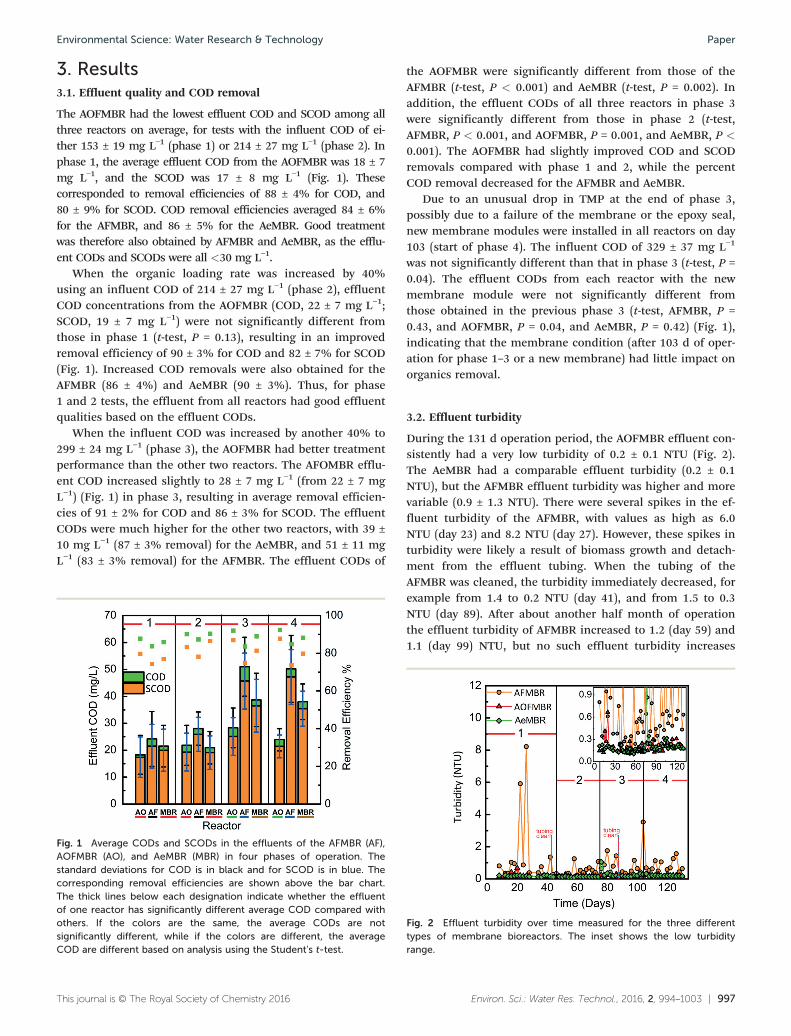
The AOFMBR had the lowest effluent COD and SCOD among allthree reactors on average, for tests with the influent COD of ei-ther 153 ± 19 mg L−1 (phase 1) or 214 ± 27 mg L−1 (phase 2). Inphase 1, the average effluent COD from the AOFMBR was 18 ± 7mg L−1, and the SCOD was 17 ± 8 mg L−1 (Fig. 1). Thesecorresponded to removal efficiencies of 88 ± 4% for COD, and80 ± 9% for SCOD. COD removal efficiencies averaged 84 ± 6%for the AFMBR, and 86 ± 5% for the AeMBR. Good treatmentwas therefore also obtained by AFMBR and AeMBR, as the efflu-ent CODs and SCODs were all <30 mg L−1.
When the organic loading rate was increased by 40%using an influent COD of 214 ± 27 mg L−1 (phase 2), effluentCOD concentrations from the AOFMBR (COD, 22 ± 7 mg L−1;SCOD, 19 ± 7 mg L−1) were not significantly different fromthose in phase 1 (t-test, P = 0.13), resulting in an improvedremoval efficiency of 90 ± 3% for COD and 82 ± 7% for SCOD(Fig. 1). Increased COD removals were also obtained for theAFMBR (86 ± 4%) and AeMBR (90 ± 3%). Thus, for phase1 and 2 tests, the effluent from all reactors had good effluentqualities based on the effluent CODs.
When the influent COD was increased by another 40% to299 ± 24 mg L−1 (phase 3), the AOFMBR had better treatmentperformance than the other two reactors. The AFOMBR efflu-ent COD increased slightly to 28 ± 7 mg L−1 (from 22 ± 7 mgL−1) (Fig. 1) in phase 3, resulting in average removal efficien-cies of 91 ± 2% for COD and 86 ± 3% for SCOD. The effluentCODs were much higher for the other two reactors, with 39 ±10 mg L−1 (87 ± 3% removal) for the AeMBR, and 51 ± 11 mgL−1 (83 ± 3% removal) for the AFMBR. The effluent CODs of
the AOFMBR were significantly different from those of theAFMBR (t-test, P < 0.001) and AeMBR (t-test, P = 0.002). Inaddition, the effluent CODs of all three reactors in phase 3were significantly different from those in phase 2 (t-test,AFMBR, P < 0.001, and AOFMBR, P = 0.001, and AeMBR, P <
0.001). The AOFMBR had slightly improved COD and SCODremovals compared with phase 1 and 2, while the percentCOD removal decreased for the AFMBR and AeMBR.
Due to an unusual drop in TMP at the end of phase 3,possibly due to a failure of the membrane or the epoxy seal,new membrane modules were installed in all reactors on day103 (start of phase 4). The influent COD of 329 ± 37 mg L−1
was not significantly different than that in phase 3 (t-test, P =0.04). The effluent CODs from each reactor with the newmembrane module were not significantly different fromthose obtained in the previous phase 3 (t-test, AFMBR, P =0.43, and AOFMBR, P = 0.04, and AeMBR, P = 0.42) (Fig. 1),indicating that the membrane condition (after 103 d of oper-ation for phase 1–3 or a new membrane) had little impact onorganics removal.
3.2. Effluent turbidity
During the 131 d operation period, the AOFMBR effluent con-sistently had a very low turbidity of 0.2 ± 0.1 NTU (Fig. 2).The AeMBR had a comparable effluent turbidity (0.2 ± 0.1NTU), but the AFMBR effluent turbidity was higher and morevariable (0.9 ± 1.3 NTU). There were several spikes in the ef-fluent turbidity of the AFMBR, with values as high as 6.0NTU (day 23) and 8.2 NTU (day 27). However, these spikes inturbidity were likely a result of biomass growth and detach-ment from the effluent tubing. When the tubing of theAFMBR was cleaned, the turbidity immediately decreased, forexample from 1.4 to 0.2 NTU (day 41), and from 1.5 to 0.3NTU (day 89). After about another half month of operationthe effluent turbidity of AFMBR increased to 1.2 (day 59) and1.1 (day 99) NTU, but no such effluent turbidity increases
Fig. 2 Effluent turbidity over time measured for the three differenttypes of membrane bioreactors. The inset shows the low turbidityrange.
Fig. 1 Average CODs and SCODs in the effluents of the AFMBR (AF),AOFMBR (AO), and AeMBR (MBR) in four phases of operation. Thestandard deviations for COD is in black and for SCOD is in blue. Thecorresponding removal efficiencies are shown above the bar chart.The thick lines below each designation indicate whether the effluentof one reactor has significantly different average COD compared withothers. If the colors are the same, the average CODs are notsignificantly different, while if the colors are different, the averageCOD are different based on analysis using the Student's t-test.
Environmental Science: Water Research & Technology Paper
998 | Environ. Sci.: Water Res. Technol., 2016, 2, 994–1003 This journal is © The Royal Society of Chemistry 2016
were measured for effluent samples from the AOFMBR andAeMBR. Even when the very high turbidity spikes (>2 NTU)were removed from the analysis, the average turbidity ofAFMBR was 0.6 ± 0.4 NTU (Fig. 2), which was 300% as highas the other two aerobic reactors. This suggests that effluentquality in terms of turbidity was better in the aerated reactors(AOFMBR and AeMBR) than the anaerobic reactor (AFMBR).
3.3. Transmembrane pressures
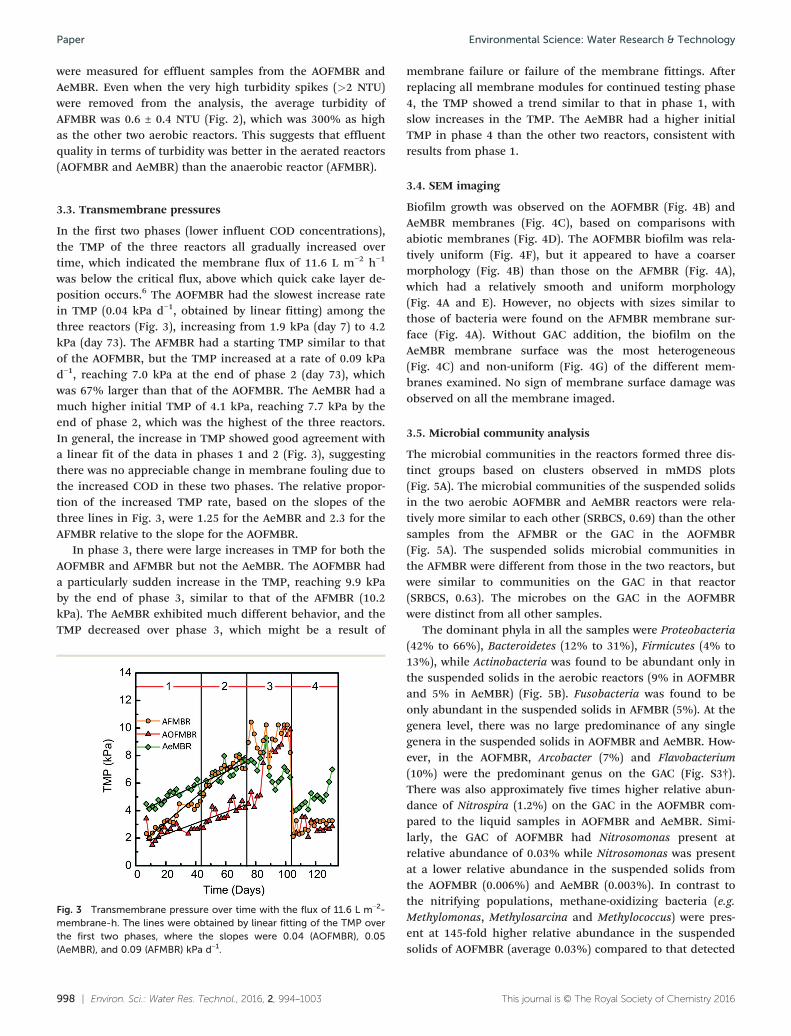
In the first two phases (lower influent COD concentrations),the TMP of the three reactors all gradually increased overtime, which indicated the membrane flux of 11.6 L m−2 h−1
was below the critical flux, above which quick cake layer de-position occurs.6 The AOFMBR had the slowest increase ratein TMP (0.04 kPa d−1, obtained by linear fitting) among thethree reactors (Fig. 3), increasing from 1.9 kPa (day 7) to 4.2kPa (day 73). The AFMBR had a starting TMP similar to thatof the AOFMBR, but the TMP increased at a rate of 0.09 kPad−1, reaching 7.0 kPa at the end of phase 2 (day 73), whichwas 67% larger than that of the AOFMBR. The AeMBR had amuch higher initial TMP of 4.1 kPa, reaching 7.7 kPa by theend of phase 2, which was the highest of the three reactors.In general, the increase in TMP showed good agreement witha linear fit of the data in phases 1 and 2 (Fig. 3), suggestingthere was no appreciable change in membrane fouling due tothe increased COD in these two phases. The relative propor-tion of the increased TMP rate, based on the slopes of thethree lines in Fig. 3, were 1.25 for the AeMBR and 2.3 for theAFMBR relative to the slope for the AOFMBR.
In phase 3, there were large increases in TMP for both theAOFMBR and AFMBR but not the AeMBR. The AOFMBR hada particularly sudden increase in the TMP, reaching 9.9 kPaby the end of phase 3, similar to that of the AFMBR (10.2kPa). The AeMBR exhibited much different behavior, and theTMP decreased over phase 3, which might be a result of
membrane failure or failure of the membrane fittings. Afterreplacing all membrane modules for continued testing phase4, the TMP showed a trend similar to that in phase 1, withslow increases in the TMP. The AeMBR had a higher initialTMP in phase 4 than the other two reactors, consistent withresults from phase 1.
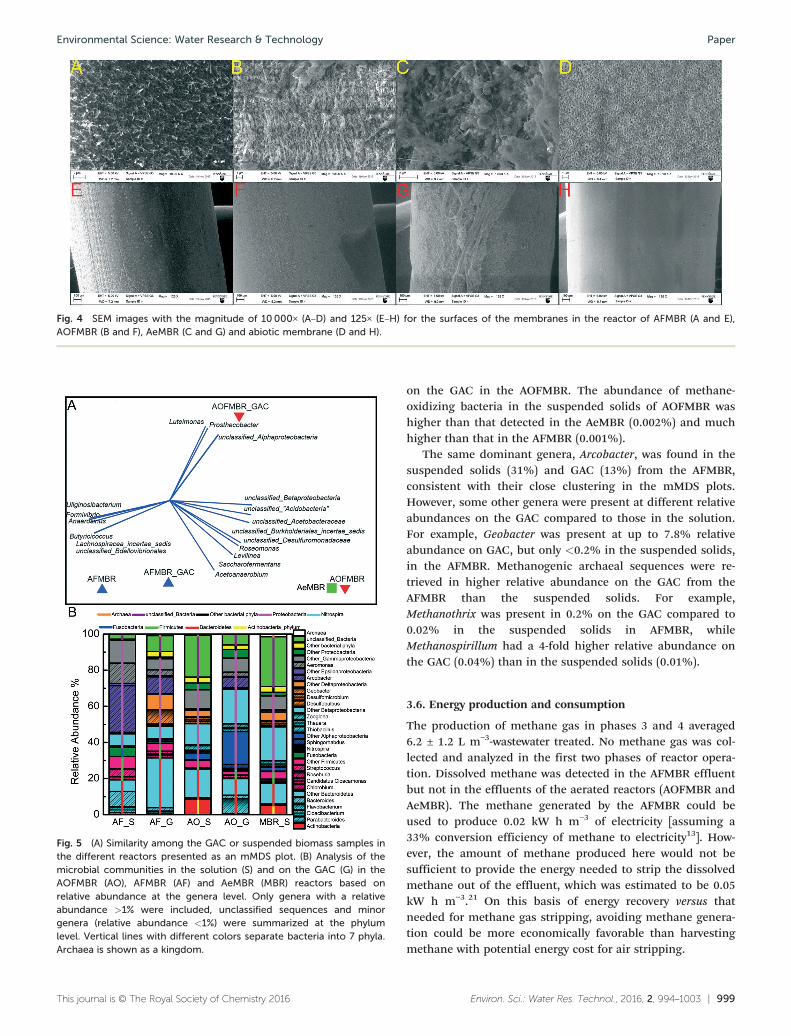
3.4. SEM imaging
Biofilm growth was observed on the AOFMBR (Fig. 4B) andAeMBR membranes (Fig. 4C), based on comparisons withabiotic membranes (Fig. 4D). The AOFMBR biofilm was rela-tively uniform (Fig. 4F), but it appeared to have a coarsermorphology (Fig. 4B) than those on the AFMBR (Fig. 4A),which had a relatively smooth and uniform morphology(Fig. 4A and E). However, no objects with sizes similar tothose of bacteria were found on the AFMBR membrane sur-face (Fig. 4A). Without GAC addition, the biofilm on theAeMBR membrane surface was the most heterogeneous(Fig. 4C) and non-uniform (Fig. 4G) of the different mem-branes examined. No sign of membrane surface damage wasobserved on all the membrane imaged.
3.5. Microbial community analysis
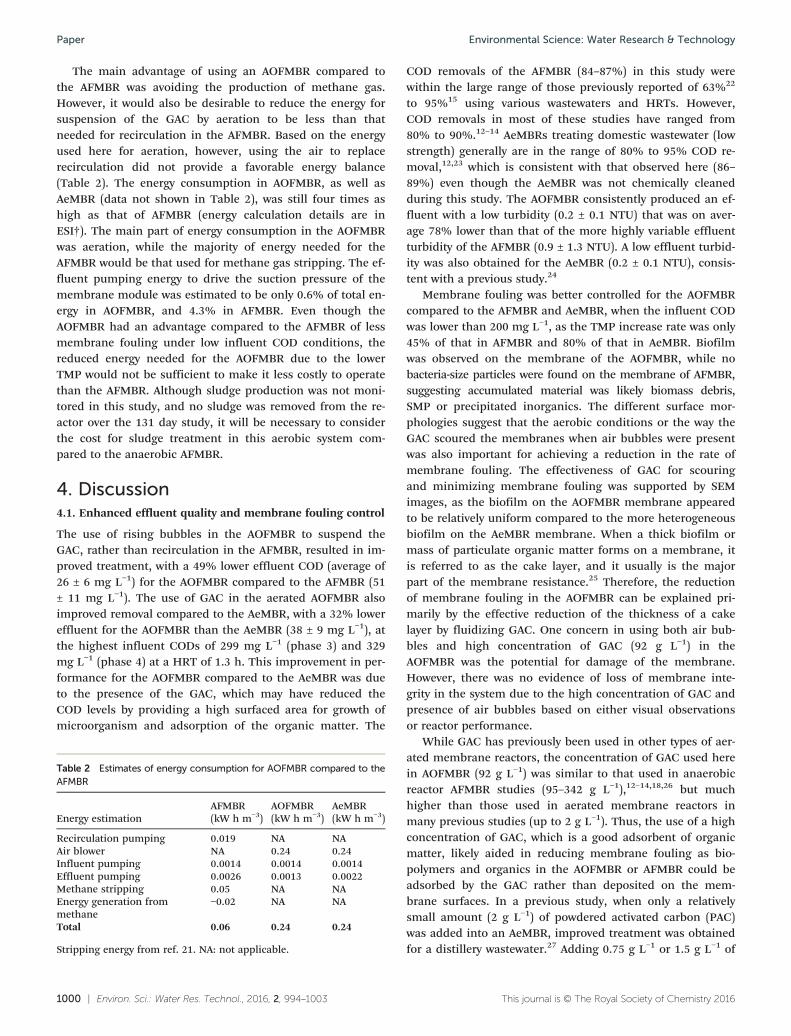
The microbial communities in the reactors formed three dis-tinct groups based on clusters observed in mMDS plots(Fig. 5A). The microbial communities of the suspended solidsin the two aerobic AOFMBR and AeMBR reactors were rela-tively more similar to each other (SRBCS, 0.69) than the othersamples from the AFMBR or the GAC in the AOFMBR(Fig. 5A). The suspended solids microbial communities inthe AFMBR were different from those in the two reactors, butwere similar to communities on the GAC in that reactor(SRBCS, 0.63). The microbes on the GAC in the AOFMBRwere distinct from all other samples.
The dominant phyla in all the samples were Proteobacteria(42% to 66%), Bacteroidetes (12% to 31%), Firmicutes (4% to13%), while Actinobacteria was found to be abundant only inthe suspended solids in the aerobic reactors (9% in AOFMBRand 5% in AeMBR) (Fig. 5B). Fusobacteria was found to beonly abundant in the suspended solids in AFMBR (5%). At thegenera level, there was no large predominance of any singlegenera in the suspended solids in AOFMBR and AeMBR. How-ever, in the AOFMBR, Arcobacter (7%) and Flavobacterium(10%) were the predominant genus on the GAC (Fig. S3†).There was also approximately five times higher relative abun-dance of Nitrospira (1.2%) on the GAC in the AOFMBR com-pared to the liquid samples in AOFMBR and AeMBR. Simi-larly, the GAC of AOFMBR had Nitrosomonas present atrelative abundance of 0.03% while Nitrosomonas was presentat a lower relative abundance in the suspended solids fromthe AOFMBR (0.006%) and AeMBR (0.003%). In contrast tothe nitrifying populations, methane-oxidizing bacteria (e.g.Methylomonas, Methylosarcina and Methylococcus) were pres-ent at 145-fold higher relative abundance in the suspendedsolids of AOFMBR (average 0.03%) compared to that detected
Fig. 3 Transmembrane pressure over time with the flux of 11.6 L m−2-membrane-h. The lines were obtained by linear fitting of the TMP overthe first two phases, where the slopes were 0.04 (AOFMBR), 0.05(AeMBR), and 0.09 (AFMBR) kPa d−1.
Environmental Science: Water Research & TechnologyPaper
Environ. Sci.: Water Res. Technol., 2016, 2, 994–1003 | 999This journal is © The Royal Society of Chemistry 2016
on the GAC in the AOFMBR. The abundance of methane-oxidizing bacteria in the suspended solids of AOFMBR washigher than that detected in the AeMBR (0.002%) and muchhigher than that in the AFMBR (0.001%).
The same dominant genera, Arcobacter, was found in thesuspended solids (31%) and GAC (13%) from the AFMBR,consistent with their close clustering in the mMDS plots.However, some other genera were present at different relativeabundances on the GAC compared to those in the solution.For example, Geobacter was present at up to 7.8% relativeabundance on GAC, but only <0.2% in the suspended solids,in the AFMBR. Methanogenic archaeal sequences were re-trieved in higher relative abundance on the GAC from theAFMBR than the suspended solids. For example,Methanothrix was present in 0.2% on the GAC compared to0.02% in the suspended solids in AFMBR, whileMethanospirillum had a 4-fold higher relative abundance onthe GAC (0.04%) than in the suspended solids (0.01%).
3.6. Energy production and consumption
The production of methane gas in phases 3 and 4 averaged6.2 ± 1.2 L m−3-wastewater treated. No methane gas was col-lected and analyzed in the first two phases of reactor opera-tion. Dissolved methane was detected in the AFMBR effluentbut not in the effluents of the aerated reactors (AOFMBR andAeMBR). The methane generated by the AFMBR could beused to produce 0.02 kW h m−3 of electricity [assuming a33% conversion efficiency of methane to electricity13]. How-ever, the amount of methane produced here would not besufficient to provide the energy needed to strip the dissolvedmethane out of the effluent, which was estimated to be 0.05kW h m−3.21 On this basis of energy recovery versus thatneeded for methane gas stripping, avoiding methane genera-tion could be more economically favorable than harvestingmethane with potential energy cost for air stripping.
Fig. 4 SEM images with the magnitude of 10000× (A–D) and 125× (E–H) for the surfaces of the membranes in the reactor of AFMBR (A and E),AOFMBR (B and F), AeMBR (C and G) and abiotic membrane (D and H).
Fig. 5 (A) Similarity among the GAC or suspended biomass samples inthe different reactors presented as an mMDS plot. (B) Analysis of themicrobial communities in the solution (S) and on the GAC (G) in theAOFMBR (AO), AFMBR (AF) and AeMBR (MBR) reactors based onrelative abundance at the genera level. Only genera with a relativeabundance >1% were included, unclassified sequences and minorgenera (relative abundance <1%) were summarized at the phylumlevel. Vertical lines with different colors separate bacteria into 7 phyla.Archaea is shown as a kingdom.
Environmental Science: Water Research & Technology Paper
1000 | Environ. Sci.: Water Res. Technol., 2016, 2, 994–1003 This journal is © The Royal Society of Chemistry 2016
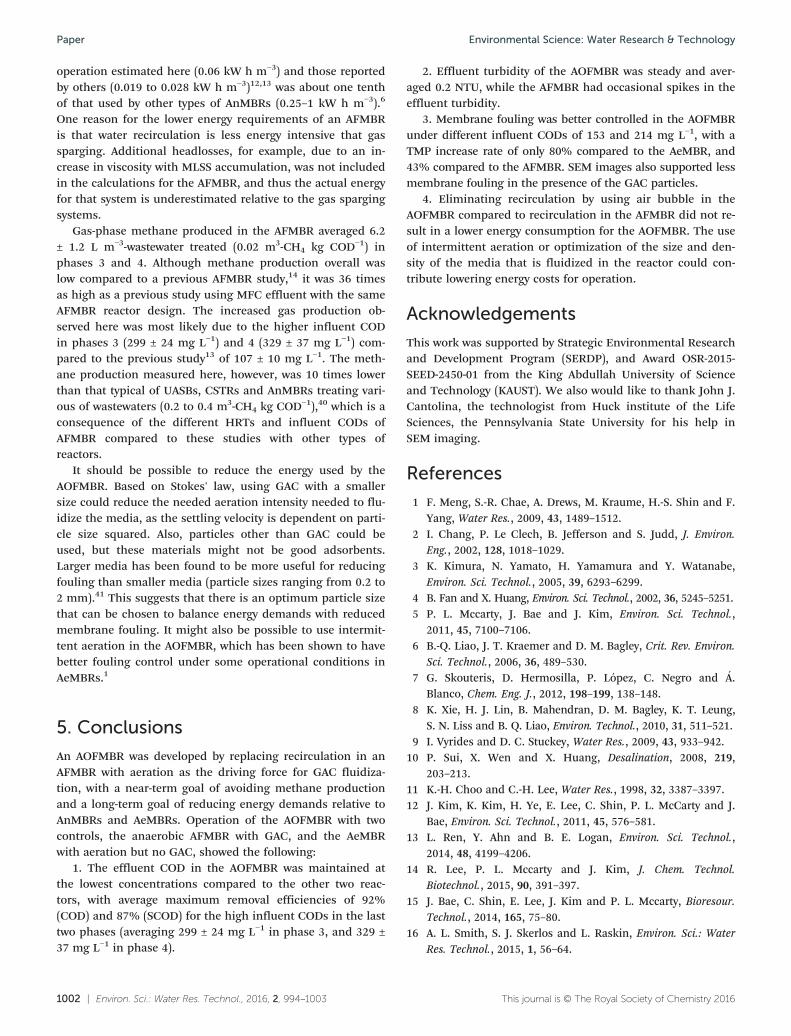
The main advantage of using an AOFMBR compared tothe AFMBR was avoiding the production of methane gas.However, it would also be desirable to reduce the energy forsuspension of the GAC by aeration to be less than thatneeded for recirculation in the AFMBR. Based on the energyused here for aeration, however, using the air to replacerecirculation did not provide a favorable energy balance(Table 2). The energy consumption in AOFMBR, as well asAeMBR (data not shown in Table 2), was still four times ashigh as that of AFMBR (energy calculation details are inESI†). The main part of energy consumption in the AOFMBRwas aeration, while the majority of energy needed for theAFMBR would be that used for methane gas stripping. The ef-fluent pumping energy to drive the suction pressure of themembrane module was estimated to be only 0.6% of total en-ergy in AOFMBR, and 4.3% in AFMBR. Even though theAOFMBR had an advantage compared to the AFMBR of lessmembrane fouling under low influent COD conditions, thereduced energy needed for the AOFMBR due to the lowerTMP would not be sufficient to make it less costly to operatethan the AFMBR. Although sludge production was not moni-tored in this study, and no sludge was removed from the re-actor over the 131 day study, it will be necessary to considerthe cost for sludge treatment in this aerobic system com-pared to the anaerobic AFMBR.
4. Discussion4.1. Enhanced effluent quality and membrane fouling control
The use of rising bubbles in the AOFMBR to suspend theGAC, rather than recirculation in the AFMBR, resulted in im-proved treatment, with a 49% lower effluent COD (average of26 ± 6 mg L−1) for the AOFMBR compared to the AFMBR (51± 11 mg L−1). The use of GAC in the aerated AOFMBR alsoimproved removal compared to the AeMBR, with a 32% lowereffluent for the AOFMBR than the AeMBR (38 ± 9 mg L−1), atthe highest influent CODs of 299 mg L−1 (phase 3) and 329mg L−1 (phase 4) at a HRT of 1.3 h. This improvement in per-formance for the AOFMBR compared to the AeMBR was dueto the presence of the GAC, which may have reduced theCOD levels by providing a high surfaced area for growth ofmicroorganism and adsorption of the organic matter. The
COD removals of the AFMBR (84–87%) in this study werewithin the large range of those previously reported of 63%22
to 95%15 using various wastewaters and HRTs. However,COD removals in most of these studies have ranged from80% to 90%.12–14 AeMBRs treating domestic wastewater (lowstrength) generally are in the range of 80% to 95% COD re-moval,12,23 which is consistent with that observed here (86–89%) even though the AeMBR was not chemically cleanedduring this study. The AOFMBR consistently produced an ef-fluent with a low turbidity (0.2 ± 0.1 NTU) that was on aver-age 78% lower than that of the more highly variable effluentturbidity of the AFMBR (0.9 ± 1.3 NTU). A low effluent turbid-ity was also obtained for the AeMBR (0.2 ± 0.1 NTU), consis-tent with a previous study.24
Membrane fouling was better controlled for the AOFMBRcompared to the AFMBR and AeMBR, when the influent CODwas lower than 200 mg L−1, as the TMP increase rate was only45% of that in AFMBR and 80% of that in AeMBR. Biofilmwas observed on the membrane of the AOFMBR, while nobacteria-size particles were found on the membrane of AFMBR,suggesting accumulated material was likely biomass debris,SMP or precipitated inorganics. The different surface mor-phologies suggest that the aerobic conditions or the way theGAC scoured the membranes when air bubbles were presentwas also important for achieving a reduction in the rate ofmembrane fouling. The effectiveness of GAC for scouringand minimizing membrane fouling was supported by SEMimages, as the biofilm on the AOFMBR membrane appearedto be relatively uniform compared to the more heterogeneousbiofilm on the AeMBR membrane. When a thick biofilm ormass of particulate organic matter forms on a membrane, itis referred to as the cake layer, and it usually is the majorpart of the membrane resistance.25 Therefore, the reductionof membrane fouling in the AOFMBR can be explained pri-marily by the effective reduction of the thickness of a cakelayer by fluidizing GAC. One concern in using both air bub-bles and high concentration of GAC (92 g L−1) in theAOFMBR was the potential for damage of the membrane.However, there was no evidence of loss of membrane inte-grity in the system due to the high concentration of GAC andpresence of air bubbles based on either visual observationsor reactor performance.
While GAC has previously been used in other types of aer-ated membrane reactors, the concentration of GAC used herein AOFMBR (92 g L−1) was similar to that used in anaerobicreactor AFMBR studies (95–342 g L−1),12–14,18,26 but muchhigher than those used in aerated membrane reactors inmany previous studies (up to 2 g L−1). Thus, the use of a highconcentration of GAC, which is a good adsorbent of organicmatter, likely aided in reducing membrane fouling as bio-polymers and organics in the AOFMBR or AFMBR could beadsorbed by the GAC rather than deposited on the mem-brane surfaces. In a previous study, when only a relativelysmall amount (2 g L−1) of powdered activated carbon (PAC)was added into an AeMBR, improved treatment was obtainedfor a distillery wastewater.27 Adding 0.75 g L−1 or 1.5 g L−1 of
Table 2 Estimates of energy consumption for AOFMBR compared to theAFMBR
Energy estimationAFMBR(kW h m−3)
AOFMBR(kW h m−3)
AeMBR(kW h m−3)
Recirculation pumping 0.019 NA NAAir blower NA 0.24 0.24Influent pumping 0.0014 0.0014 0.0014Effluent pumping 0.0026 0.0013 0.0022Methane stripping 0.05 NA NAEnergy generation frommethane
−0.02 NA NA
Total 0.06 0.24 0.24
Stripping energy from ref. 21. NA: not applicable.
Environmental Science: Water Research & TechnologyPaper

Environ. Sci.: Water Res. Technol., 2016, 2, 994–1003 | 1001This journal is © The Royal Society of Chemistry 2016
PAC into an AeMBR was also previously shown to reducemembrane fouling.24 GAC addition of 0.5 to 2 g L−1 was alsofound in another study to minimize sudden increases inmembrane resistance, and organic removal was improved.28
It was concluded in all these other studies that the reductionin fouling was mainly due to adsorption of foulants onto theactivated carbon, although scouring may have also been im-portant. In the AOFMBR conditions examined here, the sub-stantially higher GAC concentration compared to these previ-ous studies made it possible that organic matter adsorptionto the GAC was a factor, in addition to membrane scouring,in minimizing membrane fouling. The GAC in both theAFMBR (10 g) and the AOFMBR (6 g) was not replaced duringthis study (more than 200 days, including the acclimationand test periods), and there was no sign of reduced perfor-mance at the end of phase 4 due to the age of the carbon.While carbon replacement might be needed for operationover longer periods of time, the rate that carbon might needto be replaced cannot be estimated based on the results ofthis current study.
The TMP of 10.2 kPa that developed in the AFMBR iswithin the range of 5 kPa to 20 kPa used by others over a 100d operation period without cleaning.15,26 A rapid increase inthe TMP in the AOFMBR was observed in phase 3, which usu-ally would indicate sudden changes in the biofilm or cakelayer structure.29 Sudden changes in TMP appear to occurmore frequently in lab-scale membrane bioreactors thanlarger reactors.1,30 Even with this rapid TMP increase, theTMP of AOFMBR was still comparable to that of AFMBR. Theinitial TMP for AeMBR were higher than that of AFMBR andAOFMBR in both phase 1 and 4, when the membrane was re-placed by fresh one. The reason for this difference was likelydue to the absence of the GAC for membrane scouring in theAeMBR, compared to the other two reactors. The membraneflux of 11.6 L m−2-membrane-h in this study was close to thatused in previous AFMBR studies (8–16 L m−2-membrane-h),and the TMP increase of the AFMBR in phases 1 and 2 wasalso consistent with previous reports.12–14,31 The membraneflux set here was within a range typical of AnMBRs (10–40 Lm−2-membrane-h)6 and AeMBRs (4–36 L m−2-membrane-h).32
4.2. Microbial community analysis
Phylum-level microbial community analyses in the AFMBRshave not been previously reported, and therefore compari-sons cannot be made to previous studies for this reactor orthe new AOFMBR. However, comparisons are possible tocommunities in conventional treatment systems. At phylumlevel, the dominant four phyla, Proteobacteria, Bacteroidetes,Firmicutes, and Actinobacteria, in the suspended biomass inthe AOFMBR and AeMBR were the same four phyla as thoseidentified in a previous study of 15 activated sludge samplescollected from 14 treatment plants.33 The phyla with relativeabundance above 5% in the suspended biomass of theAFMBR, Proteobacteria, Bacteroidetes, Firmicutes, andFusobacteria, were also found dominant in an anaerobic mov-
ing bed biofilm reactor treating municipal wastewater.34 Thissuggests that the microbial communities in suspension atthe genera level, resembled those communities from otheraerobic and aerobic/anaerobic (moving bed) systems.
The GAC in the AFMBR and AOFMBR provides a moreunique growth environment compared to the suspended cells.We observed a selective enrichment of Geobacter and certainmethanogens (e.g. Methanothrix and Methanospirillum) in theGAC communities in the AFMBR. The abundance of these twogroups on the GAC may be important, as Geobacter wasshown to colonize GAC and conduct extracellular electrontransfer to methanogens under anaerobic growth condi-tions.35,36 The transfer of extracellular electrons is particularlybeneficial for acetoclastic methanogens as acetate has to beactivated first at the expense of adenosine triphosphate (ATP)in order to generate methane and carbon dioxide.37 This bene-fit could help explain the higher relative abundance ofMethanothrix, an acetoclastic methanogen, on the GAC in theAFMBR.
The biofilm on the GAC in the AOFMBR, had a greaterabundance of Nitrospira and Nitrosomonas compared to thesuspended microbial communities in either the AOFMBR orthe AeMBR. This suggests that nitrifying bacterialpopulations may have benefited from growth conditions onthe GAC. Unfortunately, the enriched abundance of thesemicroorganisms was not determined until the completion ofthe study, and nitrogen balances were not conducted as apart of this study. The comparatively higher relative abun-dance of Nitrosomonas and Nitrospira on the GAC in theAOFMBR, as well as the low concentrations of COD in the re-actor effluent, suggest that having GAC in this system mightproduce conditions favorable for nitrification.
The suspended microbial communities in the AOFMBRalso had a higher relative abundance of methane-oxidizingbacteria (e.g. Methylomonas, Methylosarcina and Methyl-ococcus) compared to those in the AFMBR. The presence ofthe methane-oxidizing bacteria in the AOFMBR could indi-cate that methanogenesis may have occurred in this system,or they could just reflect growth of cells on dissolved meth-ane present in the influent wastewater. The possibility ofmethane oxidation in this system may be an interesting areafor further study.
4.3. Energy consumption
Although methane gas production was avoided in theAOFMBR, energy consumption was 4 times greater than thatof the AFMBR. However, the presence of the GAC in theAOFMBR resulted in better membrane fouling control andbetter COD removal than the AeMBR. The minimum aerationintensity needed to effectively fluidize the GAC (6 g, 92 g L−1)was 0.005 m3 m−2-cross section area-s, which is comparableto some AeMBRs.28,38,39 The energy consumed by theAOFMBR and AeMBR was therefore similar to that of anAeMBR (0.3–0.6 kW h m−3)6 and activated sludge process(0.3–0.6 kW h m−3).17 However, the energy needed for AFMBR
Environmental Science: Water Research & Technology Paper
1002 | Environ. Sci.: Water Res. Technol., 2016, 2, 994–1003 This journal is © The Royal Society of Chemistry 2016
operation estimated here (0.06 kW h m−3) and those reportedby others (0.019 to 0.028 kW h m−3)12,13 was about one tenthof that used by other types of AnMBRs (0.25–1 kW h m−3).6
One reason for the lower energy requirements of an AFMBRis that water recirculation is less energy intensive that gassparging. Additional headlosses, for example, due to an in-crease in viscosity with MLSS accumulation, was not includedin the calculations for the AFMBR, and thus the actual energyfor that system is underestimated relative to the gas spargingsystems.
Gas-phase methane produced in the AFMBR averaged 6.2± 1.2 L m−3-wastewater treated (0.02 m3-CH4 kg COD−1) inphases 3 and 4. Although methane production overall waslow compared to a previous AFMBR study,14 it was 36 timesas high as a previous study using MFC effluent with the sameAFMBR reactor design. The increased gas production ob-served here was most likely due to the higher influent CODin phases 3 (299 ± 24 mg L−1) and 4 (329 ± 37 mg L−1) com-pared to the previous study13 of 107 ± 10 mg L−1. The meth-ane production measured here, however, was 10 times lowerthan that typical of UASBs, CSTRs and AnMBRs treating vari-ous of wastewaters (0.2 to 0.4 m3-CH4 kg COD−1),40 which is aconsequence of the different HRTs and influent CODs ofAFMBR compared to these studies with other types ofreactors.
It should be possible to reduce the energy used by theAOFMBR. Based on Stokes' law, using GAC with a smallersize could reduce the needed aeration intensity needed to flu-idize the media, as the settling velocity is dependent on parti-cle size squared. Also, particles other than GAC could beused, but these materials might not be good adsorbents.Larger media has been found to be more useful for reducingfouling than smaller media (particle sizes ranging from 0.2 to2 mm).41 This suggests that there is an optimum particle sizethat can be chosen to balance energy demands with reducedmembrane fouling. It might also be possible to use intermit-tent aeration in the AOFMBR, which has been shown to havebetter fouling control under some operational conditions inAeMBRs.1
5. Conclusions
An AOFMBR was developed by replacing recirculation in anAFMBR with aeration as the driving force for GAC fluidiza-tion, with a near-term goal of avoiding methane productionand a long-term goal of reducing energy demands relative toAnMBRs and AeMBRs. Operation of the AOFMBR with twocontrols, the anaerobic AFMBR with GAC, and the AeMBRwith aeration but no GAC, showed the following:
1. The effluent COD in the AOFMBR was maintained atthe lowest concentrations compared to the other two reac-tors, with average maximum removal efficiencies of 92%(COD) and 87% (SCOD) for the high influent CODs in the lasttwo phases (averaging 299 ± 24 mg L−1 in phase 3, and 329 ±37 mg L−1 in phase 4).
2. Effluent turbidity of the AOFMBR was steady and aver-aged 0.2 NTU, while the AFMBR had occasional spikes in theeffluent turbidity.
3. Membrane fouling was better controlled in the AOFMBRunder different influent CODs of 153 and 214 mg L−1, with aTMP increase rate of only 80% compared to the AeMBR, and43% compared to the AFMBR. SEM images also supported lessmembrane fouling in the presence of the GAC particles.
4. Eliminating recirculation by using air bubble in theAOFMBR compared to recirculation in the AFMBR did not re-sult in a lower energy consumption for the AOFMBR. The useof intermittent aeration or optimization of the size and den-sity of the media that is fluidized in the reactor could con-tribute lowering energy costs for operation.
Acknowledgements
This work was supported by Strategic Environmental Researchand Development Program (SERDP), and Award OSR-2015-SEED-2450-01 from the King Abdullah University of Scienceand Technology (KAUST). We also would like to thank John J.Cantolina, the technologist from Huck institute of the LifeSciences, the Pennsylvania State University for his help inSEM imaging.
References
1 F. Meng, S.-R. Chae, A. Drews, M. Kraume, H.-S. Shin and F.Yang, Water Res., 2009, 43, 1489–1512.
2 I. Chang, P. Le Clech, B. Jefferson and S. Judd, J. Environ.Eng., 2002, 128, 1018–1029.
3 K. Kimura, N. Yamato, H. Yamamura and Y. Watanabe,Environ. Sci. Technol., 2005, 39, 6293–6299.
4 B. Fan and X. Huang, Environ. Sci. Technol., 2002, 36, 5245–5251.5 P. L. Mccarty, J. Bae and J. Kim, Environ. Sci. Technol.,
2011, 45, 7100–7106.6 B.-Q. Liao, J. T. Kraemer and D. M. Bagley, Crit. Rev. Environ.
Sci. Technol., 2006, 36, 489–530.7 G. Skouteris, D. Hermosilla, P. López, C. Negro and Á.
Blanco, Chem. Eng. J., 2012, 198–199, 138–148.8 K. Xie, H. J. Lin, B. Mahendran, D. M. Bagley, K. T. Leung,
S. N. Liss and B. Q. Liao, Environ. Technol., 2010, 31, 511–521.9 I. Vyrides and D. C. Stuckey, Water Res., 2009, 43, 933–942.
10 P. Sui, X. Wen and X. Huang, Desalination, 2008, 219,203–213.
11 K.-H. Choo and C.-H. Lee, Water Res., 1998, 32, 3387–3397.12 J. Kim, K. Kim, H. Ye, E. Lee, C. Shin, P. L. McCarty and J.
Bae, Environ. Sci. Technol., 2011, 45, 576–581.13 L. Ren, Y. Ahn and B. E. Logan, Environ. Sci. Technol.,
2014, 48, 4199–4206.14 R. Lee, P. L. Mccarty and J. Kim, J. Chem. Technol.
Biotechnol., 2015, 90, 391–397.15 J. Bae, C. Shin, E. Lee, J. Kim and P. L. Mccarty, Bioresour.
Technol., 2014, 165, 75–80.16 A. L. Smith, S. J. Skerlos and L. Raskin, Environ. Sci.: Water
Res. Technol., 2015, 1, 56–64.
Environmental Science: Water Research & TechnologyPaper
Environ. Sci.: Water Res. Technol., 2016, 2, 994–1003 | 1003This journal is © The Royal Society of Chemistry 2016
17 M. D. Seib, K. J. Berg and D. H. Zitomer, Environ. Sci.: WaterRes. Technol., 2016, 2, 290–297.
18 K.-Y. Kim, W. Yang, Y. Ye, N. LaBarge and B. E. Logan,Bioresour. Technol., 2016, 208, 58–63.
19 H. Cheng, Y. Xie, L. F. Villalobos, L. Song, K.-V. Peinemann,S. Nunes and P.-Y. Hong, Sci. Rep., 2016, 6, 24289.
20 M. Harb, Y. Xiong, J. Guest, G. Amy and P.-Y. Hong, Environ.Sci.: Water Res. Technol., 2015, 1, 800–813.
21 A. L. Smith, L. B. Stadler, N. G. Love, S. J. Skerlos and L.Raskin, Bioresour. Technol., 2012, 122, 149–159.
22 J. Bae, R. Yoo, E. Lee and P. L. McCarty, Water Sci. Technol.,2013, 68, 394–399.
23 K. Brindle and T. Stephenson, Biotechnol. Bioeng., 1996, 49,601–610.
24 Z. Ying and G. Ping, Sep. Purif. Technol., 2006, 52, 154–160.25 K.-H. Choo and C.-H. Lee, Water Res., 1996, 30, 1771–1780.26 C. Shin, P. L. Mccarty, J. Kim and J. Bae, Bioresour. Technol.,
2014, 159, 95–103.27 Y. Satyawali and M. Balakrishnan, J. Hazard. Mater.,
2009, 170, 457–465.28 M. A. H. Johir, R. Aryal, S. Vigneswaran, J. Kandasamy and
A. Grasmick, J. Membr. Sci., 2011, 374, 121–128.29 J. Zhang, H. C. Chua, J. Zhou and A. G. Fane, J. Membr. Sci.,
2006, 284, 54–66.
30 L. Xu, G. Zhang, G. Yuan, H. Liu, J. Liu and F. Yang, RSCAdv., 2015, 5, 22533–22543.
31 R. Yoo, J. Kim, P. L. McCarty and J. Bae, Bioresour. Technol.,2012, 120, 133–139.
32 M. Gander, B. Jefferson and S. Judd, Sep. Purif. Technol.,2000, 18, 119–130.
33 T. Zhang, M.-F. Shao and L. Ye, ISME J., 2012, 6, 1137–1147.34 K. Biswas, M. W. Taylor and S. J. Turner, Appl. Microbiol.
Biotechnol., 2014, 98, 1429–1440.35 F. Liu, A.-E. Rotaru, P. M. Shrestha, N. S. Malvankar, K. P.
Nevin and D. R. Lovley, Energy Environ. Sci., 2012, 5, 8982.36 A.-E. Rotaru, P. M. Shrestha, F. Liu, M. Shrestha, D.
Shrestha, M. Embree, K. Zengler, C. Wardman, K. P. Nevinand D. R. Lovley, Energy Environ. Sci., 2014, 7, 408.
37 M. S. M. Jetten, A. J. M. Stams and A. J. B. Zehnder,J. Bacteriol., 1989, 171, 5430–5435.
38 R. Liu, X. Huang, Y. F. Sun and Y. Qian, Process Biochem.,2003, 39, 157–163.
39 T. Ueda, K. Hata, Y. Kikuoka and O. Seino, Water Res.,1997, 31, 489–494.
40 C. Visvanathan and A. Abeynayaka, Membrane WaterTreatment, 2012, 3, 1–23.
41 M. Aslam, P. L. McCarty, J. Bae and J. Kim, Sep. Purif.Technol., 2014, 132, 10–15.
Environmental Science: Water Research & Technology Paper