environmental regulation, foreign direct investment and pollution
TRANSCRIPT
HAL Id: tel-00608641https://tel.archives-ouvertes.fr/tel-00608641
Submitted on 13 Jul 2011
HAL is a multi-disciplinary open accessarchive for the deposit and dissemination of sci-entific research documents, whether they are pub-lished or not. The documents may come fromteaching and research institutions in France orabroad, or from public or private research centers.
L’archive ouverte pluridisciplinaire HAL, estdestinée au dépôt et à la diffusion de documentsscientifiques de niveau recherche, publiés ou non,émanant des établissements d’enseignement et derecherche français ou étrangers, des laboratoirespublics ou privés.
Environmental regulation, foreign direct investment andpollution
Sonia Ben Kheder
To cite this version:Sonia Ben Kheder. Environmental regulation, foreign direct investment and pollution. Economiesand finances. Université Panthéon-Sorbonne - Paris I, 2010. English. <tel-00608641>

UNIVERSITÉ PARIS 1 �PANTHÉON �SORBONNE
U.F.R. de SCIENCES ÉCONOMIQUES
Année 2009-2010 Numéro attribué par la bibliothèquej2j0j1j0jPjAj0j1j0j0j2j1j
THESE
Pour l�obtention du grade deDocteur de l�Université de Paris 1 Panthéon-Sorbonne
Présentée et soutenue publiquement par
Sonia BEN KHEDERle 18 juin 2010
Environmental Regulation, Foreign Direct Investmentand Pollution
Directrice de thèse : Mme Mireille CHIROLEU-ASSOULINEProfesseur à l�Université Paris 1 Panthéon-Sorbonne
JURY :
Alain AYONG LE KAMA Professeur à l�Université de Lille 1
Joel BRUNEAU Assistant Professor à l�Université de Saskatchewan, Canada
Mireille CHIROLEU-ASSOULINE Professeur à l�Université Paris 1 Panthéon-SorbonneMouez FODHA Maître de Conférences à l�Université Paris 1 Panthéon-
Sorbonne
Lionel FONTAGNÉ Professeur à l�Université Paris 1 Panthéon-Sorbonne
El Mouhoub MOUHOUD Professeur à l�Université de Paris Dauphine

L�UNIVERSITE PARIS 1 �PANTHEON �SORBONNE n�entend donner aucuneapprobation ni improbation aux opinions émises dans les thèses; ces opinions doiventêtre considérées comme propres à leurs auteurs.

À mes chers parents

Remerciements
C�est avec une joie non dissimulée que je m�apprête à rédiger mes remerciements.
En e¤et, durant ces années de thèse, le seul fait d�y penser me mettait du baume
au c�ur, car cela évoquait en moi un sentiment de satisfaction lié au travail bien
accompli.
Mes premiers remerciements vont tout naturellement, mais surtout très sincère-
ment, à ma directrice de thèse, Mireille Chiroleu-Assouline. Mireille m�a fait béné-
�cier de ses conseils avisés, de ses remarques judicieuses, et nos échanges ont tou-
jours été fructueux. J�ai apprécié son sens de la rigueur qui a fortement contribué à
l�amélioration de mon travail. Elle m�a de plus accompagnée avec bienveillance, et
j�ai pu compter sur elle scienti�quement et humainement aux moments où j�en avais
le plus besoin. Merci pour tout Mireille.
Je remercie Alain Ayong Le Kama, Joel Bruneau, Mouez Fodha, Lionel Fontagné
et El Mouhoub Mouhoud d�avoir accepté sans hésiter de faire partie de mon jury de
thèse, et ce malgré leurs nombreuses occupations. J�ai ainsi eu la chance de béné�cier
de leurs observations et de leurs suggestions. Leurs commentaires ont apporté une
autre dimension à certains aspects de mon travail et m�ont considérablement enrichie
intellectuellement.
La version �nale de ma thèse s�est perfectionnée aux relectures de Nada Ab-
delkader, Nesrine Bentemessek, Katrin Millock, Chahir Zaki. Zeineb Ben Sedrine
i

Remerciements ii
et Tim Ho¤er n�ont pas hésité à intervenir sur la qualité de mon anglais dans un
laps de temps très court. Je les remercie tous de leur aide amicale. Les précieux
commentaires de Ann E. Harrison, Thierry Mayer, Daniel Mirza et Habib Zitouna
avaient précédemment contribué à l�amélioration des mes travaux.
J�ai eu le privilège de préparer ma thèse au sein du Centre d�Économie de la
Sorbonne (CES). Je remercie Jean-Olivier Hairault pour m�avoir accueillie au sein
de l�ex-laboratoire EUREQua et de l�actuelle UG3. Il m�a ainsi donné l�opportunité
d�évoluer dans un environnement bien stimulant et de discuter de divers sujets avec
des personnes très intéressantes et multiculturelles. En particulier, je veux citer les
membres du Séminaire Environnement : Mireille Chiroleu-Assouline, Mouez Fodha,
Katrin Millock et Katheline Schubert. J�ai aussi rencontré au CES Natalia Zugravu
avec qui j�ai co-écrit un article que j�espère prometteur, ainsi que plusieurs camarades
avec lesquels j�ai partagé des moments de rires, d�amitié, d�impatience parfois. Parmi
eux, je tiens à remercier Boni, qui m�a accompagnée depuis notre DEA d�Économie
Internationale. Les longs samedis de travail à la Maison des Sciences Economiques
(MSE) et nos prises de bec récurrentes resteront malgré tout un bon souvenir. Fahmi,
Leila, Nada et Nesrine sont devenus de véritables amis pour moi. Tout au long
de ces années de thèse, j�ai également eu le plaisir de croiser le chemin d�Audrey
Desbonnet, Basak Bayramoglu, Chahnez Boudaya, Olfa Jaballi, Lucie Ménager,
Nicolas Million, Florent Pratlong, et plus récemment Antoine, Chantal, Dramane,
Ekrame, Fida, Julien, Luke, les deux Matthieu, Natacha. Je tiens également à
souligner la coopération de l�ensemble du personnel administratif de la Maison des
Sciences Economiques, en particulier Elda André et Viviane Makougni, toujours très
aimables, Joël Faron, très serviable, Tonia, bien e¢ cace, et toute l�équipe du centre
de documentation. Par de petites attentions ou de grands coups de mains, toutes

Remerciements iii
les personnes que je viens de citer ont participé à faire de cette expérience doctorale
une période inoubliable.
Bien que j�aie sans conteste passé la plupart de mon temps à la MSE, j�ai tenté
tant bien que mal de rester proche de mes autres amis, ceux à qui la thèse semblait
un mystère qu�ils n�ont cessé de vouloir élucider. Ma plus fervente supportrice
durant ces années a été Nadia, dont le coup de �l quotidien m�emmenait bien loin
de mes estimations économétriques aux résultats parfois rageants. Je pro�te de cette
occasion pour la remercier, ainsi que son mari Karim. Elle est suivie de près par
ma chère Valé qui, quelle que soit la situation, me trouvait toujours rayonnante et
me remontait le moral, et Sophie et Dal avec qui je me suis beaucoup amusée lors
de nos sympathiques virées au ski. J�ai aussi partagé d�agréables moments sportifs
avec Imène et récréatifs avec Mouna. Je n�oublie évidemment pas les autres amis
pour lesquels j�ai une chaleureuse pensée.
Mes derniers, mais non moindres, remerciements, s�adressent à ma famille. En
France, feu mon grand-père, ma grand-mère, ma tante, mes cousins et mes petits-
cousins m�ont apporté un sentiment de réconfort quand le manque du reste de la
famille devenait pesant. Mamie surtout a bien veillé sur sa petite Sonia. En Tunisie,
je remercie tous ceux qui ont souhaité mon succès, à savoir mes oncles, mes tantes,
mes cousins, mes cousines, mon beau-frère et mon tout jeune neveu. Je remercie
particulièrement Maher pour ses égards et sa grande générosité, et sa famille pour
sa gentillesse.
En�n, je voudrais exprimer ma gratitude à mes parents et à ma s�ur, pour leur
soutien indéfectible, leurs encouragements permanents, leur a¤ection sans bornes,
leur amour, tout simplement. J�espère qu�Inès est �ère de sa petite s�ur. J�espère
surtout que ce travail récompensera mes parents de tous leurs e¤orts, et compensera

Remerciements iv
un peu leur peine, parfois, de me voir loin d�eux. Je leur dédie ce travail. Puissent-ils
être aussi heureux que moi en y percevant toute la motivation, l�enthousiasme et le
plaisir que j�y ai mis.

Résumé en français
"[...] Les pays les moins développés qui choisiraient de ne pas imposer de con-
traintes sur leur pollution locale, et ce dans le but d�améliorer leur compétitivité
internationale, deviendraient volontairement les entrepôts des industries polluantes
du monde entier ". Baumol et Oates, 1988, p 265.
Cette a¢ rmation correspond à l�une des conclusions essentielles du travail ma-
jeur de Baumol et Oates relatif à l�examen des implications internationales de la
protection environnementale. Toutefois, après plus de vingt années d�études, les
choses se sont révélées être plus complexes.
L�un des principaux sujets de discorde entre partisans et adversaires de la mon-
dialisation porte sur les questions environnementales. Ainsi, les implications in-
ternationales de la protection environnementale et l�impact environnemental de la
libéralisation accrue des échanges ont suscité et continuent de soulever des protesta-
tions de la part des divers acteurs concernés. Selon l�intérêt des parties impliquées,
les protestations sont respectivement d�ordre commercial ou bien environnemental,
et dans ce travail nous étudions les deux aspects du problème.
Récemment, de nombreux exemples ont contribué à alimenter le débat houleux
entre les parties prenantes. En France, dix organisations non gouvernementales,
dont Greenpeace, le WWF et Les amis de la Terre, ont adressé une lettre de protes-
tation au président Nicolas Sarkozy quand il décida en mars 2010 d�abandonner la
v

Résumé vi
taxe carbone. La Secrétaire d�État chargée de l�écologie, ainsi que le parti écologiste
des Verts initialement opposé à la réforme car la jugeant écologiquement ine¢ cace
et socialement injuste, ont également été très critiques envers le président français.
Cependant, pour justi�er sa décision, Nicolas Sarkozy déclara: "Nous n�imposerons
pas à nos industriels des contraintes si, dans le même temps, on autorise les importa-
tions venant de pays qui ne respectent aucune des règles environnementales à inonder
nos marchés"1. Cet argument illustre parfaitement un aspect stratégique du débat, à
savoir l�interdépendance entre les politiques environnementale et commerciale. Ceci
n�est pas sans nous rappeler des discussions antérieures tenues à un moment où la
pollution était en forte hausse et où le débat entre commerce et environnement était
attisé par les négociations relatives à l�Accord de Libre-Échange Nord-Américain
(ALENA) et par une série de di¤érends commerciaux liés à l�environnement et
portés devant le General Agreement on Tari¤s and Trade (GATT)2. Cet argument
nous remémore également la réaction des écologistes protestant contre les e¤ets en-
vironnementaux d�un accroissement du commerce mondial lors de la création de
l�Organisation Mondiale du Commerce (OMC).
L�exemple de l�ALENA est très signi�catif ; en e¤et, la principale crainte du
moment était que les normes environnementales moins strictes du Mexique lui con-
fèrent un avantage comparatif dans les biens à forte intensité polluante et engendrent
une catastrophe environnementale dans le pays suite à l�arrivée massive d�industries
polluantes. Ainsi, la préoccupation était triple et concernait :
- la disparité entre les régulations environnementales
- l�impact de ces dernières sur la spécialisation internationale et la localisation
1Le Figaro Magazine, 12 mars 2010.2Un exemple bien connu est celui de l�embargo décidé par les États-Unis en 1988 sur
l�importation du thon pêché par les pays de la zone orientale de l�océan Paci�que oriental qui nerespectaient pas les normes imposées aux pêcheurs des États-Unis en vue de protéger les dauphins.

Résumé vii
des industries polluantes
- l�impact environnemental de la migration des industries polluantes
Cet exemple résume les principales questions relatives à la relation entre la
libéralisation du commerce et des investissements et l�environnement dans les écono-
mies ouvertes. Dans ce travail, nous examinons ces trois questions. Cependant,
pour le troisième aspect de la relation entre commerce et environnement, à savoir
l�impact environnemental des mécanismes en jeu, nous focaliserons notre analyse sur
le problème de la pollution. D�autres graves problèmes environnementaux tels que
la déforestation au Brésil ou encore l�épuisement des ressources naturelles ne sont
pas étudiés ici car ils nécessiteraient de faire l�objet d�une analyse séparée.
La régulation environnementale a évolué di¤éremment selon les pays, et ces dif-
férences sont particulièrement prononcées entre les pays développés et les pays en
voie de développement. Tandis que les États-Unis et l�Europe ont adopté leurs prin-
cipales lois au début des années soixante-dix, le reste du monde n�a commencé à se
préoccuper des questions environnementales qu�à partir des années quatre-vingt-dix.
Ainsi, au milieu des années soixante-dix, Pethig (1976), Siebert (1977) et McGuire
(1982) ont été parmi les premiers chercheurs à étudier les conséquences de telles
di¤érences de rigueur de la régulation environnementale, en se concentrant sur la
théorie de l�avantage comparatif. Ces auteurs ont démontré à l�aide de modèles
standards de commerce international (modèle de Ricardo ou Heckscher-Ohlin), que
les pays dont la régulation environnementale était relativement faible tendaient à ex-
porter les biens dont la production était intensive en ressources environnementales,
tandis que les pays les plus stricts tendaient à exporter les biens dont la produc-
tion était relativement moins intensive en ressources environnementales. Cependant,
malgré ces résultats quelque peu déconcertants, l�intérêt porté par l�opinion publique

Résumé viii
et les chercheurs à ces questions a décliné dans les années quatre-vingt. Il ne s�est
ravivé que dix ans plus tard, lorsque le véritable débat entre commerce et environ-
nement s�est relancé avec la signature de l�ALENA et la création de l�OMC. Tel
que suggéré précédemment, un des aspects les plus importants de ce débat con-
cerne l�impact de la régulation environnementale sur la compétitivité internationale
et sur la localisation des industries polluantes. La crainte est que les régulations
environnementales a¤ectent la localisation des industries, et que les di¤érences de
régulation entre les pays du Nord plus stricts, et les pays du Sud moins sévères, im-
pliquent non seulement une spécialisation du Sud dans les productions polluantes,
mais très probablement le déplacement des industries les plus polluantes des pays
du Nord vers le Sud. Ce raisonnement correspond dans la littérature économique à
l�Hypothèse de Pollution Haven, qui est au c�ur de notre travail.
Régulations environnementales inégales
Ainsi, la phrase de Nicolas Sarkozy citée plus haut, et prononcée quinze ans après
la reprise du débat, laisse à penser que les choses n�ont pas changé et que ce débat est
toujours d�actualité, voire même s�est intensi�é. Malgré les progrès réalisés à travers
le monde ces dix dernières années, les écarts entre les pays demeurent encore bien
larges et entretiennent le débat. Dans certains pays en voie de développement par
exemple, les industries très polluantes béné�cient souvent de conditions spéciales et
ne sont de ce fait pas a¤ectées par les régulations (exemple de l�industrie minière
en Indonésie et au Zimbabwe). Dans d�autres pays, les lois sont adoptées mais
ne sont pas appliquées. L�existence de di¤érents niveaux de régulations à travers
le monde est donc une réalité commune aux années mille neuf cent quatre-vingt
dix et à celles d�aujourd�hui. Cette thèse montre que de nos jours, les régulations
environnementales revêtent plusieurs formes, et qu�une distinction trop schématique

Résumé ix
entre les pays du Nord et les pays du Sud n�est plus appropriée pour di¤érencier les
pays les plus régulés des pays les plus laxistes. De plus, nous démontrerons qu�au
sein même d�un seul pays, la rigueur des régulations di¤ère en fonction du risque
environnemental envisagé.
Firmes multinationales et investissement direct à l�étranger
En réalité, un phénomène nouveau est tout de même apparu et ne cesse de
s�intensi�er depuis les premières protestations et la mise en place de l�ALENA: la
mobilité internationale des �rmes. Ce phénomène grandissant se mesure à tra-
vers la croissance des activités des �rmes multinationales (FMNs). Par dé�ni-
tion, les �rmes multinationales opèrent dans plusieurs pays à travers leurs �liales
étrangères3. La meilleure façon d�appréhender leur activité serait d�utiliser des
données individuelles d�entreprises indiquant le nombre d�employés des �liales ou
encore le montant de leurs ventes. Cependant, ces données d�entreprises n�étant
pas di¤usées à grande échelle, les chercheurs ont souvent recours aux données de
�ux d�investissements directs à l�étranger (IDE) pour mesurer l�internationalisation
des activités des �rmes multinationales. Selon les dé�nitions du Fonds Moné-
taire International (FMI) et de l�Organisation de Coopération et de Développement
Économiques (OCDE), l�investissement direct à l�étranger est l�investissement d�une
compagnie dans une entreprise résidente dans un autre pays que le sien, à travers
lequel l�investisseur étranger détiendrait au moins 10% du capital ou des droits de
vote de l�entreprise investie, de manière à établir un intérêt durable et exercer une
in�uence signi�cative dans la gestion de l�entreprise. Ainsi, les �ux d�IDE se dis-
tinguent des investissements de portefeuille, ces derniers n�impliquant ni la notion
3Selon les recommandations du Fonds Monétaire International et de l�Organisation de Coopéra-tion et de Développement Économiques, une �rme étrangère peut être considérée comme une �lialeétrangère si l�investisseur étranger détient plus de la moitié des droits de vote.

Résumé x
de propriété ni celle du pouvoir de décision de l�investisseur étranger.
Depuis les années quatre-vingt, les pays ont cherché à attirer les IDE en rendant
leurs politiques plus favorables aux investisseurs étrangers. Cette tendance s�est ac-
centuée dans les années mille neuf cent quatre-vingt dix. La Conférence des Nations
Unies sur le Commerce et le Développement (CNUCED) a reporté, pour la péri-
ode 1991-1999, mille trente cinq modi�cations de lois à travers le monde, dont 94%
étaient en faveur des investisseurs étrangers. En 1999, les pays en voie de développe-
ment et les pays en transition ont libéralisé les opérations d�industries jusque là
inaccessibles ou du moins restreintes pour les IDE. Parmi ces industries �guraient
l�industrie pétrolière, l�industrie minière, l�industrie énergétique et l�industrie phar-
maceutique. De nos jours, l�investissement direct à l�étranger joue un rôle croissant
dans l�économie mondiale4. En 2007, le montant global des IDE entrants a dépassé
le dernier record enregistré en 2000, et a été estimé à 1,5 milliard de dollars5. De
même, le nombre de �liales étrangères dans le monde a considérablement augmenté.
Les ventes de ces �liales sont passées de 3 milliards de dollars en 1980 à 14 milliards
de dollars en 1999, représentant environ le double du montant des exportations to-
tales en 1999. En 2004, les ventes totales des �liales ont presque atteint les 19
milliards de dollars6.
Les deux situations que nous venons d�exposer, à savoir d�une part des régula-
tions environnementales inégales entre les pays, d�autre part une augmentation des
activités des �rmes multinationales mesurée à travers la croissance du nombre de
�liales et des IDE, sont propices à l�étude de l�hypothèse de pollution haven. Dans
ce travail, nous examinons ainsi l�hypothèse de pollution haven en nous intéressant
4Source : UNCTAD, 2001.5Source : UNCTAD, 2008.6Source : UNCTAD, 2005.

Résumé xi
tour à tour à la localisation des �liales à l�étranger et au montant des IDE7.
Régulation environnementale et localisation des �rmes
Une des principales justi�cations de l�hypothèse de pollution haven réside dans
le fait qu�en imposant des équipements spéci�ques, en limitant l�usage de certaines
ressources, ou encore en appliquant des sanctions en cas de non-conformité, des
régulations environnementales rigoureuses augmentent les coûts de production des
entreprises, réduisant ainsi leur compétitivité. La littérature sur les IDE et sur la lo-
calisation des �rmes multinationales considère la recherche du moindre coût comme
un des premiers déterminants des IDE et de la multinationalisation des �rmes. Dans
le cadre de l�hypothèse de pollution haven et dans une logique d�avantage compara-
tif, il paraît ainsi évident qu�une entreprise qui a la possibilité de se déplacer choisira
de se localiser dans les pays dont les régulations environnementales sont les moins
strictes a�n de réduire ses coûts de production et d�être plus compétitive. Cette hy-
pothèse a été démontrée théoriquement dans des analyses en équilibre général menées
par Pethig (1976), Siebert (1977), McGuire (1982) et Baumol et Oates (1988), dans
lesquelles la di¤érence de coûts environnementaux était l�unique déterminant des
IDE et su¢ sait donc à inciter les �rmes à se délocaliser. Toutefois, certaines études
stipulent que les coûts environnementaux ne représentent qu�un faible pourcentage
des coûts de production totaux, et ne su¢ sent donc pas à entraîner le déplacement
des �rmes. De plus, cette hypothèse est contredite par une hypothèse alternative
énoncée par Porter (1991) et Porter et van der Linde (1995) : l�hypothèse de Porter.
Celle-ci stipule au contraire que des régulations environnementales plus strictes sont
béné�ques à l�environnement et favorables à la compétitivité des �rmes car elles
7Une seconde approche de l�hypothèse de pollution haven, non abordée dans ce travail, consisteà observer les données du commerce international. Néanmoins, nous passerons en revue certainsexemples de cette approche dans le Chapitre 2 (Tobey, 1990 ; Levinson et Taylor, 2008).
Résumé xii
sont une incitation à l�innovation, contribuant ainsi à l�amélioration de la qualité
des produits ou à la réduction des coûts de production d�une �rme. Il découle de
l�hypothèse de Porter que les �rmes ne seraient pas incitées à migrer suite à un
renforcement des régulations environnementales. Une autre alternative théorique
qui s�oppose à l�hypothèse de pollution haven est l�hypothèse des dotations facto-
rielles (Factor Endowment Hypothesis). Cette hypothèse suppose que la structure
des échanges et la spécialisation des pays sont plus susceptibles de résulter des avan-
tages comparatifs traditionnels. L�hypothèse stipule que les industries polluantes
étant également les industries les plus intensives en capital, elles sont plus à même
de se localiser dans les pays relativement plus abondants en capital, à savoir les
pays développés et régulés, tandis que les industries les moins polluantes et donc les
moins intensives en capital ont tendance à se localiser dans les pays relativement
moins abondants en capital, c�est à dire les pays en voie de développement dont les
régulations environnementales sont les plus faibles. Par conséquent, les prédictions
de l�hypothèse des dotations factorielles contrastent avec celles de l�hypothèse de
pollution haven en suggérant que la régulation environnementale ne pourrait avoir
tout au plus qu�une faible in�uence sur les structures des IDE ou du commerce. Ces
di¤érentes hypothèses théoriques aboutissant à des prédictions opposées, il appa-
raît clairement qu�une étude minutieuse de l�hypothèse de pollution haven requière
d�une part une analyse théorique rigoureuse, d�autre part une évaluation empirique
robuste. Dans cette thèse, a�n de répondre à ces deux exigences, nous développons
tout d�abord un modèle théorique adéquat de l�hypothèse de pollution haven, puis
nous le testons empiriquement.
Le cadre théorique de l�hypothèse de pollution haven est celui de l�analyse des
déterminants de la localisation des �rmes et des déterminants des investissements

Résumé xiii
directs à l�étranger. Plusieurs explications de l�internationalisation et des investisse-
ments directs à l�étranger ont été analysées dans la théorie des IDE. Les premiers
travaux ayant introduit les mouvements de capitaux en économie internationale ne
di¤érenciaient pas les IDE des autres formes de mobilité internationale des capitaux.
Les mouvements internationaux de capitaux étaient justi�és par des di¤érences de
taux d�intérêts entre les pays qui résultaient des di¤érences de dotations factorielles
(Mundell, 1957). Cette approche fondée sur la théorie des avantages comparatifs a
réussi à expliquer les investissements directs des pays développés dans les pays en
voie de développement jusque dans les années soixante-dix. Cependant, depuis les
années quatre-vingt, la part des IDE entre pays développés s�est considérablement
accrue, et cette nouvelle structure des IDE ne peut plus s�expliquer par la seule
théorie classique du commerce international et des IDE. Une des raisons est que de
nos jours, le capital étant largement disponible au niveau international, l�exploitation
d�un di¤érentiel de coût des facteurs ne peut plus constituer l�explication centrale
de la multinationalisation des �rmes et de la structure des IDE. D�ailleurs, les sta-
tistiques d�investissements directs provenant des balances de paiement des pays re-
censent l�ensemble des opérations �nancières transfrontières au sein des groupes
multinationaux (�nancement de nouveaux investissements, prêts inter-�rmes, béné-
�ces réinvestis, fusions-acquisitions)8. L�apport de capital associé à ces investisse-
ments n�est donc pas très important. En conséquence, il est plus juste de considérer
que l�IDE est davantage un vecteur de transfert de connaissances et de savoir-faire
qu�un simple mouvement international de capital. C�est plutôt la détention d�un
avantage spéci�que qui incite les entreprises multinationales à s�internationaliser.
Ce facteur a été mis en évidence par l�approche éclectique développée par John
8L�investissement direct en balance des paiements est, pour cette raison, de plus en plus con-sidéré comme un mauvais indicateur de l�activité des �rmes multinationales. Cf. Chapitre 4.
Résumé xiv
Dunning (1977). Cette analyse globale des conditions d�existence des �rmes multina-
tionales, également appelée paradigme OLI, fait référence à trois facteurs explicatifs
de l�investissement direct d�une entreprise : l�avantage spéci�que de la �rme (Own-
ership advantage), son avantage à la localisation à l�étranger (Localisation advan-
tage), son avantage à l�internalisation (Internalization advantage). L�avantage spé-
ci�que correspond ainsi aux actifs spéci�ques à la �rme tels que la possession d�une
technologie ou de compétences qui lui sont propres et qui lui permettent de com-
penser son désavantage lié au maintien de son activité à l�étranger9. Les explications
théoriques de l�IDE renvoient souvent au paradigme OLI (Krugman, 1983; Helpman,
1984; Markusen, 1984) qui est resté central dans la théorie de l�investissement direct
moderne. Par ailleurs, un arbitrage fondamental entre proximité géographique des
clients et concentration des activités (et donc réalisation d�économies d�échelle) inter-
vient dans l�explication des di¤érentes stratégies d�expansion des �rmes à l�étranger
(exporter ou bien produire à l�étranger). Selon Brainard (1993), le résultat de cet ar-
bitrage dépend du niveau des coûts de transport, et plus généralement des barrières
à l�échange.
D�un point de vue empirique, une vision d�ensemble de la production inter-
nationale indique une concentration de la production dans les pays développés et
dans certains pays en voie de développement, et une forte proportion d�IDE intra-
industriel. Les approches en concurrence pure et parfaite ne parvenant pas à expli-
quer de telles structures, une analyse en concurrence imparfaite s�avère nécessaire.
9Selon le paradigme OLI, entreprendre un investissement direct ne peut pro�ter à une entrepriseque si elle dispose d�un certain avantage spéci�que (tel que le savoir-faire) qui lui conférerait unavantage par rapport aux entreprises locales, et qui compenserait les inconvénients de produire àl�étranger. De plus, la localisation choisie doit présenter un avantage de localisation non seulementpar rapport au pays d�origine de l�entreprise désirant investir, mais aussi par rapport à toutes lesautres localisations possibles. En�n, il doit être plus pro�table à l�entreprise d�internaliser sonavantage spéci�que plutôt que d�octroyer des licences pour l�exploitation d�une technologie parexemple.

Résumé xv
De plus, on observe que ces mouvements internationaux concernent en grande partie
les industries de biens di¤érenciés. En�n, tel que mentionné ci-dessus et con�rmé par
des tests menés par Brainard (1997), l�arbitrage proximité-concentration est une ex-
plication adaptée à la structure observée du commerce et des IDE. Tous ces éléments,
ainsi que la distance qui joue un rôle majeur dans l�explication de la distribution
spatiale des �rmes, sont pris en compte par la Nouvelle Économie Géographique.
Dans cette thèse, nous recourons donc à la Nouvelle Économie Géographique a�n
de fournir une modélisation théorique de l�hypothèse de pollution haven.
Impact des IDE sur les niveaux de pollution
L�exemple de l�ALENA mentionné plus haut dépeint les inquiétudes que cet ac-
cord a suscitées quant à ses e¤ets potentiels sur la qualité de l�environnement au
Mexique, inquiétudes dues à l�appréhension de voir migrer les industries polluantes
des États-Unis vers le Mexique en réponse à la di¤érence de rigueur environnemen-
tale entre les deux pays. Cette crainte relative aux dommages environnementaux
constitue le troisième aspect fondamental de l�hypothèse de pollution haven. Pour
autant, ce volet n�a été que peu étudié dans la littérature relative à l�hypothèse
de pollution haven. Exception faite de He (2006) qui examine les impacts envi-
ronnementaux des IDE dans les provinces chinoises, la plupart des travaux se sont
plutôt évertués à tenter de trouver une solide preuve empirique de l�hypothèse. Plus
récemment, les études se sont plutôt tournées vers la mise en évidence de l�E¤et de
Pollution Haven (Pollution Haven E¤ect). Contrairement à l�hypothèse de pollution
haven qui stipule qu�une élévation des coûts environnementaux résultant d�un ren-
forcement des régulations est l�unique motif du commerce et des IDE, et l�emporte
sur tous les autres déterminants, l�e¤et de pollution haven prédit plus modestement
un e¤et de dissuasion exercé par le durcissement des régulations environnementales

Résumé xvi
sur le commerce et les IDE. En d�autres termes, l�hypothèse de pollution haven
suppose un impact plus important des régulations environnementales sur les �ux
internationaux que l�e¤et de pollution haven. Les implications économiques et poli-
tiques de l�hypothèse de pollution haven sont donc plus fortes que celles énoncées par
l�e¤et de pollution haven. C�est pour cette raison que dans ce travail de recherche,
nous nous sommes surtout attachés à tester l�hypothèse de pollution haven plutôt
que l�e¤et de pollution haven. Nous utiliserons de ce fait plus fréquemment le terme
d�hypothèse de pollution haven que nous envisageons comme un cadre d�analyse
général englobant l�e¤et de pollution haven.
L�IDE répondant à des motivations de pollution haven peut avoir une incidence
sur la qualité de l�environnement, et plus précisément sur les niveaux de pollution,
à travers di¤érents modes de transmission. Trois principaux déterminants de la
pollution résultant de la libéralisation du commerce et des IDE ont été identi�és
dans la littérature et sont désignés par l�e¤et d�échelle, l�e¤et de composition et l�e¤et
technique. L�e¤et d�échelle fait référence à l�augmentation du niveau de production
qui à son tour accroît la pollution. L�e¤et de composition désigne les changements
de la structure de production d�une économie suite à sa spécialisation, et son impact
sur les niveaux de pollution dépend donc de l�avantage comparatif du pays concerné.
L�e¤et technique se rapporte à l�usage de technologies de production plus propres
qui résultent de l�augmentation du revenu. L�e¤et global de la libéralisation du
commerce et des IDE sur le niveau de pollution dépend �nalement de l�interaction
entre ces trois e¤ets.
L�investissement direct à l�étranger peut être un vecteur de nouvelles technologies
plus propres à même de réduire la pollution. Lorsqu�elles font face à des régulations
strictes dans leur pays d�origine, les entreprises multinationales ont des incitations

Résumé xvii
fortes à innover a�n d�améliorer leur e¢ cacité ou de réduire leurs émissions pol-
luantes. Il est rentable pour ces entreprises d�utiliser les mêmes technologies dans
di¤érents pays, y compris les pays où les lois sont plus faibles, a�n d�augmenter leurs
économies d�échelle. Si nous considérons la pollution globale, celle-ci n�est pas af-
fectée par ces IDE puisque quelque soit l�endroit où l�investissement a lieu, l�impact
est le même sur la pollution globale. En revanche, si nous considérons une pollution
locale, les émissions polluantes, suite à l�accroissement d�activité induit par l�IDE,
sont supposées augmenter à l�endroit où l�investissement se produit. Toutefois, si
l�IDE dans le pays d�accueil se substitue à des installations de production locales
plus polluantes et moins compétitives, la pollution globale tout comme la pollution
locale dans le pays d�accueil s�en verront réduites.
De plus, par le biais de l�IDE, de nouvelles idées, technologies et pratiques de
travail peuvent être transférées à des entreprises nationales, améliorant ainsi leur
e¢ cacité. Cette meilleure e¢ cacité des entreprises locales provenant de spillover
e¤ects se traduirait ainsi par une réduction de la pollution locale et globale.
En revanche, si l�IDE est motivé par la recherche de normes environnementales
moins contraignantes tel que suggéré par l�hypothèse de pollution haven, le comporte-
ment des multinationales dans les pays étrangers pourrait s�avérer moins vertueux
et annihiler les impacts positifs décrits ci-dessus. Les exemples de dommages envi-
ronnementaux provoqués par des �rmes multinationales ne manquent pas. À titre
d�illustration, les résultats préliminaires d�un rapport des Nations Unies à paraître
(été 2010) relatif aux activités des 3000 plus grandes compagnies en 2008 prévoit
que leurs pro�ts diminueraient d�un tiers si ces �rmes devaient payer pour les pertes
et les dommages environnementaux qu�elles engendraient. L�étude estime ainsi que
le dommage global s�était élevé à 2,2 milliards de dollars en 200810.
10The Guardian, 18 février 2010.

Résumé xviii
Finalement, a�n d�être exhaustifs dans notre analyse des mécanismes de trans-
mission de la pollution à travers l�IDE, et bien que cette question dépasse le cadre de
ce travail, nous devons rappeler l�impact des activités de transport liées aux IDE sur
les niveaux de pollution. Si l�IDE est réalisé pour des motifs d�accès au marché, cela
peut entraîner une réduction des émissions de pollution résultant de la diminution
des activités de transport. En revanche, dans le cas d�IDE verticaux où la produc-
tion serait réexportée vers le pays d�origine, la pollution augmenterait en raison de
ces transports supplémentaires de biens.
En résumé, les e¤ets de l�IDE sur les niveaux de pollution sont complexes et
l�impact global est incertain. La détermination de cet impact est en dé�nitive une
question empirique. Dans ce travail, nous examinons donc empiriquement l�impact
des IDE sur les émissions de pollution dans les pays d�accueil. La pollution glo-
bale, qui contribue au changement climatique, est un problème environnemental et
économique majeur auquel l�hypothèse de pollution haven est intimement liée. En
e¤et, la crainte majeure inhérente à l�hypothèse de pollution haven est que les progrès
accomplis dans les pays les plus stricts soient plus que compensés par l�augmentation
de la pollution dans les pays les moins régulés. Cependant, l�examen empirique
de la pollution globale est di¢ cilement réalisable dans le cadre de cette thèse et
nécessiterait des données dont nous ne disposons pas actuellement. La pollution
locale est, quant à elle, une autre préoccupation majeure en raison des problèmes
d�ordre environnemental, sanitaire et économique qu�elle pose dans les pays qui en
sou¤rent. L�hypothèse de pollution haven a donc également suscité des craintes en
matière de pollution locale, et c�est ce dernier aspect que nous approfondissons dans
notre travail.
Résumé xix
L�objectif de cette thèse est de participer au débat entre commerce et environ-
nement en étudiant en profondeur les questions relatives à l�hypothèse de pollution
haven. Nous examinons l�e¤et des régulations environnementales sur le choix de
localisation des �rmes d�un point de vue théorique et empirique. Nous explorons
également l�impact des investissements directs à l�étranger sur les émissions de pol-
lution.
Structure de la thèse
Avant de procéder à l�examen proprement dit de l�hypothèse de pollution haven
dans les chapitres qui le suivent, dans le Chapitre 1 nous considérons l�évolution
des politiques environnementales des pays. En e¤et, dans le cadre d�analyse de
l�hypothèse de pollution haven, l�hétérogénéité des politiques environnementales est
une condition nécessaire à la délocalisation des �rmes et à l�émergence de l�hypothèse.
Par conséquent, nous séparons les pays en quatre groupes en fonction de leur niveau
de développement, et au sein de chaque groupe nous menons une analyse plus dé-
taillée en examinant les politiques environnementales par type de pollution et en
insistant sur certaines caractéristiques individuelles. Notre objectif est d�ajuster et
a¢ ner l�idée communément admise selon laquelle les pays développés du Nord ont
les régulations environnementales les plus strictes, tandis que les pays en voie de
développement du Sud sont beaucoup plus permissifs. Cet exercice con�rme glob-
alement la pertinence de la distinction habituelle faite entre pays développés et pays
en voie de développement en l�établissant de manière plus concrète. De plus, il révèle
que les pays émergents et les Pays d�Europe Centrale et Orientale (PECO) se trou-
vent dans une position intermédiaire. En e¤et, ces pays ont en général entrepris la
réforme de leurs institutions et de leurs politiques environnementales depuis les an-
nées quatre-vingt-dix, mais les mesures décidées restent insu¢ samment appliquées.

Résumé xx
Ces résultats précis vont ainsi nous guider dans la suite de notre analyse et nous
aider pour nos interprétations.
Le Chapitre 2 permet au lecteur de se familiariser avec le débat sur le commerce
et l�environnement, puis propose une modélisation théorique de l�hypothèse de pol-
lution haven. Nous présentons dans un premier temps les arguments théoriques en
faveur de l�hypothèse de pollution haven puis nous exposons les questions et les
craintes qu�elle suscite. Nous dressons ensuite une revue des analyses théoriques qui
ont étudié cette hypothèse. Cet exercice met en évidence le manque de fondements
théoriques dans la littérature a¤érente. En e¤et, bien que la littérature existante
soit riche d�enseignements et ait apporté des éléments utiles à l�analyse, elle s�est
essentiellement concentrée sur les di¤érences de régulations environnementales entre
les pays. Parmi les principales études de cette catégorie, nous avions cité précédem-
ment les contributions majeures de Pethig (1976), McGuire (1982), Baumol et Oates
(1988) qui ont utilisé des modèles standard de commerce international. Ce chapitre
montre que ces modèles étaient trop restrictifs pour pouvoir appréhender toutes les
questions liées à l�hypothèse de pollution haven, et qu�ils n�aboutissaient pas à une
relation structurelle estimable entre la régulation environnementale et les structures
de spécialisation. La revue des études empiriques menées à ce sujet souligne les
progrès majeurs réalisés dans l�analyse empirique de l�hypothèse de pollution haven,
mais révèle également des lacunes importantes. Ainsi, le Chapitre 2 met en exergue
les raisons pour lesquelles après plus de trente années d�investigations et malgré les
progrès réalisés tant au niveau théorique qu�empirique, les chercheurs ne sont tou-
jours pas parvenus à apporter une preuve empirique claire de l�e¤et des régulations
environnementales sur la décision de localisation des �rmes.
Le manque de fondement théorique étant l�un des principaux problèmes rencon-

Résumé xxi
trés, nous proposons dans la suite du Chapitre 2 une modélisation théorique formelle
de l�hypothèse de pollution haven. Nous utilisons à cet e¤et un modèle de Nouvelle
Économie Géographique tel que développé par Krugman (1980), dans lequel nous
introduisons l�aspect environnemental. En e¤et, le principal intérêt de l�économie
géographique est d�étudier l�attractivité relative de di¤érentes localisations sur les
entreprises, en voulant établir les principes auxquels la répartition spatiale des �rmes
obéit. L�économie géographique cherche ainsi à déterminer les caractéristiques des
localisations qui sont les plus attrayantes pour les �rmes, et elle repose aussi sur
des hypothèses bien adaptées à notre travail (concurrence monopolistique avec ren-
dements d�échelle croissants). Par ailleurs, nous nous inspirons de Head et Mayer
(2004) a�n de dériver de notre modèle d�économie géographique une spéci�cation
du choix de localisation des �rmes. Nous prolongeons le travail de Head et Mayer
(2004) en considérant la pollution comme un facteur de production et en dérivant un
coût marginal qui est a¤ecté par des distorsions du marché re�étant des défaillances
institutionnelles. Cette méthodologie nous permet ainsi de considérer l�ensemble
des déterminants du choix de localisation indispensables à une analyse exhaustive
de l�hypothèse de pollution haven. Le modèle obtenu conduit �nalement à une équa-
tion estimable qui prédit que la pro�tabilité pour une �rme de se localiser dans un
pays est une fonction croissante du marché potentiel et de la productivité globale
des facteurs dans ce pays, et une relation décroissante des défaillances du marché et
des coûts de production, parmi lesquels �gure le coût environnemental.
L�objectif du Chapitre 3 est de fournir un test empirique de l�hypothèse de pollu-
tion haven. Ce chapitre établit une relation étroite entre les prédictions théoriques
du modèle de choix de localisation dérivé dans le Chapitre 2 et la validation em-
pirique de l�hypothèse. L�estimation de l�hypothèse de pollution haven, fondée sur

Résumé xxii
une spéci�cation directement tirée d�un modèle théorique approprié, est une contri-
bution majeure à la littérature existante. En e¤et, très peu d�analyses empiriques
de l�hypothèse de pollution haven se sont appuyées sur un modèle théorique, et ce
manque de fondements théoriques a souvent donné lieu à des erreurs de spéci�cation.
Alors que la majeure partie de la littérature empirique a examiné l�hypothèse
de pollution haven en observant l�e¤et dissuasif exercé par des régulations environ-
nementales strictes sur la répartition des �rmes au sein d�un même pays, le véritable
débat consiste à déterminer si des di¤érences internationales entre les régulations
environnementales provoquent la délocalisation des industries polluantes des pays
les plus stricts vers les pays les moins régulés, qui sont également souvent les plus
pauvres. En e¤et, la première approche correspondrait davantage à la recherche
de l�e¤et de pollution haven, tandis que la recherche d�une preuve empirique de
l�hypothèse de pollution haven devrait s�appuyer sur des données internationales.
Par conséquent, dans ce troisième chapitre, nous étudions les choix de localisa-
tion des �rmes françaises du secteur manufacturier dans tous les pays d�accueil et
analysons les déterminants de ces choix.
En particulier, nous insistons dans notre analyse sur l�impact que peuvent avoir
des régulations environnementales renforcées sur la probabilité qu�une �rme française
de l�industrie manufacturière investisse dans un pays. A cet e¤et, nous construisons
pour chaque pays d�accueil un indice traduisant le niveau de rigueur et le degré
d�application de la politique environnementale locale. L�objectif est d�obtenir un
indice qui capte les di¤érents aspects d�une politique environnementale a�n d�être
en mesure de classer les pays selon la sévérité de leur politique environnementale
globale. Les valeurs de l�indice environnemental ainsi construit sont en adéquation
avec les conclusions de l�analyse des politiques environnementales menée dans le

Résumé xxiii
Chapitre 1. De plus, en introduisant dans notre travail des variables-clés qui ont
été fréquemment négligées dans les analyses empiriques de l�hypothèse de pollution
haven, nous limitons le problème de biais de variable omise souvent rencontré dans
la littérature. Nous considérons tout particulièrement les facteurs de gouvernance,
en suivant les recommandations d�auteurs tels que Smarzynska et Wei (2004) qui ont
souligné l�importance de leur prise en compte. En e¤et, les pays les plus laxistes en
matière d�environnement étant souvent ceux qui sou¤rent d�un taux de corruption
relativement élevé, l�e¤et positif que pourraient avoir des régulations faibles sur les
IDE risque d�être occulté par l�e¤et négatif d�une corruption exacerbée, entraînant
ainsi des interprétations erronées. De même, tel que cela a été mentionné par Keller
et Levinson (2002) et Levinson et Taylor (2008), l�omission de caractéristiques in-
observables des industries ou des localisations a été à l�origine de la faiblesse des
résultats empiriques trouvés dans la littérature. Nous tentons de remédier à ce
problème d�hétérogénéité inobservable en ayant recours à des données désagrégées
sectorielles, en contrôlant pour di¤érents groupes de pays, et en utilisant des méth-
odes d�estimation qui contrôlent aussi pour les e¤ets spéci�ques des �rmes et des
industries. Dans le modèle de base, nous utilisons un logit conditionnel qui est un
modèle empirique particulièrement bien adapté à l�analyse des choix discrets, tan-
dis que dans nos analyses complémentaires et nos tests de robustesse nous utilisons
di¤érentes méthodes d�estimation.
Les résultats font ressortir un impact négatif des régulations environnementales
sur la probabilité du choix de localisation des �rmes manufacturières françaises, in-
dépendamment de l�intensité polluante du secteur manufacturier auquel elles appar-
tiennent. Une analyse par groupes de pays révèle une relation non-linéaire indiquant
que dans les pays les moins stricts, la corrélation entre la rigueur environnementale

Résumé xxiv
et le choix de localisation est positive. Par ailleurs, les résultats d�une estimation
contrôlant pour le mode d�entrée des �rmes suggèrent qu�une régulation plus stricte
décourage aussi bien les investissements green�eld que les fusions-acquisitions.
Les déterminants des choix de localisation ayant été étudiés dans le Chapitre 3,
l�objet du Chapitre 4 est d�évaluer les conséquences de telles décisions sur le pays
d�accueil. Plus précisément, après avoir prouvé empiriquement l�hypothèse de pol-
lution haven dans le Chapitre 3 en démontrant que les industries fuient les pays
aux régulations environnementales rigoureuses et préfèrent se localiser dans les pays
moins stricts, dans le Chapitre 4 nous franchissons une étape supplémentaire dans
l�analyse de cette problématique par l�examen de ses implications en termes de pol-
lution. En e¤et, une fois l�hypothèse de pollution haven con�rmée, la question est
de savoir quelles sont ses implications environnementales. Notamment, de quelle
façon un tel comportement des �rmes a¤ecte-t-il les émissions de pollution dans les
pays d�accueil ? Malgré la pertinence de cette question, celle-ci a été largement
négligée dans la littérature sur l�hypothèse de pollution haven. En e¤et, la plupart
des études dans ce domaine se sont essentiellement focalisées sur la recherche d�une
preuve empirique de l�hypothèse, et lorsqu�elles y parvenaient, ces études en dédui-
saient simplement que l�environnement était altéré. Pourtant, si nous nous référons
à la littérature sur les �rmes multinationales, celle-ci suggère une conclusion inverse
puisqu�elle suppose que les IDE contribuent à l�amélioration des techniques utilisées
dans les pays d�accueil. Dans ce cas, l�IDE répondant à des motivations de pollution
haven nuit-il nécessairement à l�environnement ? Ou encore, lorsque les IDE sont
principalement attirés par de faibles régulations environnementales, demeurent-ils
béné�ques aux pays d�accueil ? À supposer que les �liales étrangères des multina-
tionales utilisent des techniques moins polluantes que les entreprises locales, cela

Résumé xxv
signi�e-t-il nécessairement que les IDE réduisent les émissions de pollution dans les
pays d�accueil ?
Le Chapitre 4 tente de répondre à ces questions en explorant la relation entre
les IDE français et les niveaux de pollution dans les pays d�accueil. Cela consiste
en l�estimation d�un système d�équations qui capte simultanément l�attractivité des
pays moins régulés sur les IDE et l�impact des IDE sur les émissions de pollution
des pays d�accueil.
En plus des problèmes de variables omises et d�hétérogénéité inobservable traités
dans le Chapitre 3, les travaux récents ont relevé un autre problème majeur compli-
quant l�analyse de l�hypothèse de pollution haven, à savoir l�endogénéité de la régu-
lation environnementale (Cole et al., 2006; Levinson et Taylor, 2008). L�existence
d�un lien de causalité fonctionnant dans les deux sens peut avoir empêché la détec-
tion d�un impact signi�catif de la régulation environnementale sur les IDE. Cette
question, abordée dans le Chapitre 3 à travers l�usage de la méthode des variables
instrumentales, est traitée dans le Chapitre 4 de manière plus spéci�que à travers
l�estimation d�équations simultanées.
Cela nous amène à considérer un système de trois équations où l�IDE, la régula-
tion environnementale et les émissions de pollution sont déterminées simultanément.
Le modèle de base est estimé en utilisant des données d�IDE français manufacturiers
et d�émissions de CO2 émises par le secteur manufacturier. L�estimation du système
d�équations est supposée capturer l�e¤et direct des IDE motivés par la recherche de
pollution haven sur les émissions de pollution, tout en tenant compte du caractère
endogène de la régulation environnementale. Ainsi, nous aspirons à répondre aux
principales préoccupations exprimées au sujet de l�hypothèse de pollution haven. Les
résultats obtenus mettent en évidence un impact négatif signi�catif des régulations

Résumé xxvi
environnementales sur les IDE, con�rmant ainsi les résultats du Chapitre 3. Ils
font également ressortir une corrélation négative entre l�élaboration de la régulation
environnementale dans les pays d�accueil et les IDE. En ce qui concerne la détermi-
nation de la pollution, les résultats montrent un impact positif signi�catif, bien que
de faible amplitude, des IDE sur les émissions de pollution. Cependant, dans une
analyse complémentaire, il apparait que les IDE réduisent l�intensité polluante dans
les pays d�accueil.

Contents
Remerciements i
Résumé en français v
General Introduction 1
1 Comparative Analysis of Environmental Policies 19
Introduction . . . . . . . . . . . . . . . . . . . . . . . . . . . . . . . . . . . 19
1 Environmental policy instruments . . . . . . . . . . . . . . . . . . . . 22
1.1 Command and Control instruments . . . . . . . . . . . . . . . 23
1.1.1 Standards . . . . . . . . . . . . . . . . . . . . . . . . 23
1.2 Market-based instruments . . . . . . . . . . . . . . . . . . . . 24
1.2.1 Taxes and subsidies . . . . . . . . . . . . . . . . . . 24
1.2.2 Emissions trading . . . . . . . . . . . . . . . . . . . . 27
1.3 Dynamic e¢ ciency of instruments . . . . . . . . . . . . . . . . 28
1.4 Choice and coordination between the di¤erent systems . . . . 29
2 Stylized facts on the development of environmental polices and regu-
lations . . . . . . . . . . . . . . . . . . . . . . . . . . . . . . . . . . . 33
2.1 Local pollution . . . . . . . . . . . . . . . . . . . . . . . . . . 33
2.1.1 Air pollution . . . . . . . . . . . . . . . . . . . . . . 33
2.1.2 Water pollution . . . . . . . . . . . . . . . . . . . . . 42

Table of contents
2.1.3 Other regulations . . . . . . . . . . . . . . . . . . . . 48
2.2 Global pollution and the prevention of climate change . . . . . 49
2.2.1 De�nitions . . . . . . . . . . . . . . . . . . . . . . . 49
2.2.2 The Kyoto Protocol . . . . . . . . . . . . . . . . . . 50
Conclusion . . . . . . . . . . . . . . . . . . . . . . . . . . . . . . . . . . . . 55
Appendix 1 . . . . . . . . . . . . . . . . . . . . . . . . . . . . . . . . . . . 58
1.A Kyoto Protocol�s Annex B . . . . . . . . . . . . . . . . . . . . . . . . 58
2 Environmental Regulation and International Issues: the Impact on
Location Choices 61
Introduction . . . . . . . . . . . . . . . . . . . . . . . . . . . . . . . . . . . 61
1 Trade and environmental policies . . . . . . . . . . . . . . . . . . . . 64
1.1 A controversial relationship . . . . . . . . . . . . . . . . . . . 64
1.2 Theoretical assessment . . . . . . . . . . . . . . . . . . . . . . 67
2 The pollution haven hypothesis . . . . . . . . . . . . . . . . . . . . . 69
2.1 The underlying reasons . . . . . . . . . . . . . . . . . . . . . . 69
2.2 A distinction between pollution haven hypothesis and pollu-
tion haven e¤ect . . . . . . . . . . . . . . . . . . . . . . . . . 71
3 Theoretical foundations and empirical results . . . . . . . . . . . . . . 74
3.1 Theoretical foundations of the pollution haven hypothesis in
literature . . . . . . . . . . . . . . . . . . . . . . . . . . . . . 74
3.2 Reviewing the empirical studies of the pollution haven hy-
pothesis . . . . . . . . . . . . . . . . . . . . . . . . . . . . . . 80
3.2.1 Pollution haven hypothesis and the patterns of trade 80
3.2.2 Pollution haven hypothesis and investment . . . . . . 82
3.3 Summary . . . . . . . . . . . . . . . . . . . . . . . . . . . . . 86

Table of contents
4 An economic geography model of the pollution haven hypothesis . . 87
4.1 Introducing economic geography models . . . . . . . . . . . . 87
4.2 The model . . . . . . . . . . . . . . . . . . . . . . . . . . . . . 89
Conclusion . . . . . . . . . . . . . . . . . . . . . . . . . . . . . . . . . . . . 94
Appendix 2 . . . . . . . . . . . . . . . . . . . . . . . . . . . . . . . . . . . 96
2.A Deriving the demand function for varieties in an economic geography
model . . . . . . . . . . . . . . . . . . . . . . . . . . . . . . . . . . . 96
3 Environmental Regulation and French Firms Location Abroad: an
International Comparative Study11 99
Introduction . . . . . . . . . . . . . . . . . . . . . . . . . . . . . . . . . . . 99
1 Empirical methodology . . . . . . . . . . . . . . . . . . . . . . . . . . 104
1.1 A location choice model: the conditional logit . . . . . . . . . 105
1.2 Data description . . . . . . . . . . . . . . . . . . . . . . . . . 108
1.2.1 Dependent variable: the location choice . . . . . . . 108
1.2.2 Explanatory variables . . . . . . . . . . . . . . . . . 109
2 Empirical results . . . . . . . . . . . . . . . . . . . . . . . . . . . . . 121
2.1 Overall analysis . . . . . . . . . . . . . . . . . . . . . . . . . . 122
2.2 Country-group analysis . . . . . . . . . . . . . . . . . . . . . . 126
2.2.1 Basic results . . . . . . . . . . . . . . . . . . . . . . 127
2.2.2 Norton et al. methodology for interaction e¤ects . . 129
2.2.3 A non-linear e¤ect of environmental regulation? . . . 131
2.3 FDI mode of entry analysis . . . . . . . . . . . . . . . . . . . 135
3 Robustness checks . . . . . . . . . . . . . . . . . . . . . . . . . . . . 138
Conclusion . . . . . . . . . . . . . . . . . . . . . . . . . . . . . . . . . . . . 144
11This chapter has been in part written with Natalia Zugravu.

Table of contents
Appendix 3 . . . . . . . . . . . . . . . . . . . . . . . . . . . . . . . . . . . 146
3.A Market Potential estimation . . . . . . . . . . . . . . . . . . . . . . . 146
3.B List of countries and detailed statistics about FDI, ER index and
Market Potential . . . . . . . . . . . . . . . . . . . . . . . . . . . . . 148
3.C Interaction e¤ects in clustered logit estimations . . . . . . . . . . . . 154
3.D IV �rst stage estimation . . . . . . . . . . . . . . . . . . . . . . . . . 157
3.E Data summary . . . . . . . . . . . . . . . . . . . . . . . . . . . . . . 158
4 French FDI and Pollution Emissions: an Empirical Investigation 161
Introduction . . . . . . . . . . . . . . . . . . . . . . . . . . . . . . . . . . . 161
1 Theoretical background . . . . . . . . . . . . . . . . . . . . . . . . . . 166
1.1 Trade, FDI and environmental regulation . . . . . . . . . . . . 166
1.2 Trade, FDI and the environment . . . . . . . . . . . . . . . . 168
2 Empirical work . . . . . . . . . . . . . . . . . . . . . . . . . . . . . . 170
2.1 FDI speci�cation . . . . . . . . . . . . . . . . . . . . . . . . . 171
2.2 Environmental regulation speci�cation . . . . . . . . . . . . . 174
2.3 Pollution speci�cation . . . . . . . . . . . . . . . . . . . . . . 176
2.4 Estimation . . . . . . . . . . . . . . . . . . . . . . . . . . . . . 179
3 Extended analysis . . . . . . . . . . . . . . . . . . . . . . . . . . . . . 187
4 Robustness tests . . . . . . . . . . . . . . . . . . . . . . . . . . . . . 192
Conclusion . . . . . . . . . . . . . . . . . . . . . . . . . . . . . . . . . . . . 194
Appendix 4 . . . . . . . . . . . . . . . . . . . . . . . . . . . . . . . . . . . 197
4.A Data summary . . . . . . . . . . . . . . . . . . . . . . . . . . . . . . 197
4.B Countries in the sample . . . . . . . . . . . . . . . . . . . . . . . . . 199
4.C Robustness tables . . . . . . . . . . . . . . . . . . . . . . . . . . . . . 200
General Conclusion 203

Table of contents
Bibliography 209
List of Tables 223
List of Figures 225

Table of contents

General Introduction
"[...] Less-developed countries that choose uncontrolled domestic pollution as a
means to improve their economic position will voluntarily become the repository of
the world�s dirty industries". Baumol and Oates, 1988, p 265.
This assertion was one of the conclusions of the seminal work of Baumol and
Oates as they examined international issues of environmental protection. However,
after more than twenty years of investigation, things have proven to be not quite so
simple.
One of the most striking discord between advocates and critics of globalization
was, and still is, over the international implications of environmental protection,
or on the environmental implications of trade liberalization. The perception of the
causality between environment and trade depends on the perspective of the analysis,
and we can already announce that in this work, we will be interested in both issues.
Recent illustrations that have contributed to fuel the heated debate between
stakeholders are not lacking. In France, ten Non Governmental Organizations, in-
cluding Greenpeace, WWF and Friends of the Earth addressed a complaining letter
to the president Nicolas Sarkozy when he decided in March 2010 to abandon the
tax carbon. The junior ecology minister, and the ecologist party (the Green) which
was initially opposed to the reform because it judged it ecologically ine¤ective and
socially unfair, have also been very critical towards the French President. How-
1

General Introduction 2
ever, to justify his decision, Nicolas Sarkozy said "We will not impose constraints
on our industry if, in the meantime, we allow imports from countries which do not
respect environmental norms to �ood our markets"12. This argument illustrates one
strategic aspect of the debate, namely the interdependency between environmental
and trade policies. It is reminiscent of former discussions, when the debate between
trade and environment, at a time where pollution was rising, was prompted by a
series of contentious environmentally-related trade disputes13 and by the negotia-
tions over the North American Free Trade Agreement (NAFTA). And it also recalls
the protests of environmentalists at the creation of the World Trade Organization
(WTO), as they were concerned with the environmental e¤ects of increased world
trade.
The example of NAFTA is highly descriptive: concern has focused on the idea
that the less stringent environmental standards in Mexico would imply a comparative
advantage in pollution-intensive goods and would result in an environmental disaster
in Mexico as polluting industries migrate to the country. Therefore, the concern was
threefold and referred to:
- The disparity in environmental regulations
- Their impact on the international specialization and the location of polluting
industries
- The environmental impact of the polluting industries migration
This example illustrates the major issues related to the links between economic
growth, liberalized trade, and the environment in open economies. Thus in this work
we will investigate the interaction between these three components of the trade and
12The Figaro Magazine, 12 mars 2010.13One well-cited example is the umbargo decided by the United States in 1988 on the tuna
harvested in the Eastern Tropical Paci�c Ocean that did not satisfy the standards for the protectionof dolphins applied to US �shermen.

General Introduction 3
environment relationship. However, regarding the third component, i.e. the environ-
mental impact, we will focus on the particular aspect of pollution. The deforestation
in the Brazil Amazon and the depletion of natural resources are environmental disas-
ters not investigated in our dissertation, since they probably require to be examined
separately.
Environmental regulation has progressed at di¤erent paces in di¤erent coun-
tries of the world, these di¤erences being particularly pronounced between devel-
oped and developing countries. Whereas the United-States and Europe passed their
major laws in the beginning of the seventies, the rest of the world started to ad-
dress environmental issues during the nineties. Therefore, in the mid-seventies,
early research investigated the consequences of such di¤erent levels of stringency
in environmental policies. Pethig (1976), Siebert (1977), and McGuire (1982) were
important contributions to the early literature focusing on the theory of compara-
tive advantage. They demonstrated through standard models of international trade
(Ricardian or Heckscher-Ohlin), that countries with relatively lax environmental
policies tend to export environmentally intensive production commodities, whereas
more stringent countries tend to export less environmentally intensive production
commodities. However, despite these puzzling �ndings, the interest of public and
researchers about these questions declined in the eighties, until the e¤ective debate
between trade and environment renewed about ten years later with NAFTA and the
WTO as described above. One important aspect of the debate was the impact of
environmental regulation on international competitiveness and the location of pol-
luting industries. It was pretended that environmental regulations a¤ect industrial
location, and that di¤erential regulations between the more regulated North, (e.g.,
the United States), and the less regulated South, (e.g. Mexico), will induce spe-

General Introduction 4
cialization of the South in polluting production, and probably the shifting of more
polluting industries from the North to the South. This assumption has been called
the Pollution Haven Hypothesis, and is central to our work.
Di¤erent levels of environmental regulations across the world
Thereby, �fteen years after the revival of the debate, Nicolas Sarkozy�s sentence
that we have quoted above suggests that things have not changed and that the
debate is still relevant, or even intensi�ed. In the 2000s, despite the improvements
made worldwide, the gap between countries is still important, which partly explains
the persistence of the debate. For instance, in some developing countries, highly
polluting industries often bene�t from special conditions and are not a¤ected by
regulations (e.g., mining in Indonesia and Zimbabwe). In other countries, laws
are passed but are not e¤ective. The existence of di¤erent levels of environmental
regulations across the world is therefore common to the nineties and nowadays. This
dissertation emphasizes that nowadays, environmental regulations take many forms,
and a too simplistic distinction between North and South countries is no longer
su¢ cient to di¤erentiate regulated countries from those which are less stringent.
Besides, we will show that even within a country, the stringency of regulations may
di¤er with regard to the environmental risk.
Multinational �rms and foreign direct investment
But something important has actually changed and spread out since the �rst
protests and the establishment of the NAFTA: the international mobility of �rms.
This increasing international mobility of �rms is re�ected through the growth of
multinational �rms (MNFs) activities. Indeed, multinational �rms, by de�nition,
operate in many countries through their foreign a¢ liates14. The activities of MNFs
14According to the International Monetary Fund (IMF) and the Organisation for Economic Co-

General Introduction 5
would be best measured by �rm-level data, such as the number of employees and the
size of the sales. Since these �rm-level data are not widely available, researchers often
rely on data regarding �ows of foreign direct investment (FDI). According to the
International Monetary Fund (IMF) and the Organisation for Economic Cooperation
and Development (OECD) de�nitions, FDI is an investment in a foreign company
where the foreign investor owns at least 10% of the ordinary shares, the objective of
which is to establish a lasting interest in the country, a long-term relationship and
a signi�cant in�uence on the management of the �rm. Thus, FDI �ows are di¤erent
from portfolio investments which do not result in foreign management, ownership,
or legal control.
Since the eighties, countries have been seeking to attract FDI making their poli-
cies more favorable to investors. This tendency intensi�ed in the nineties, and
the United Nations Conference on Trade and Development (UNCTAD) reported,
over the period 1991-1999, 1035 regulatory changes all over the world, whose 94%
favoured investors. In 1999, developing and transition economies liberalized opera-
tions in industries which in the past were closed or restricted to FDI. Among them
are petroleum, mining, energy, and pharmaceuticals. Nowadays, FDI is still playing
an increasing role in the world economy15. In 2007, global FDI in�ows surpassed
the previous record set in the year 2000, and grew to an estimated US$1.5 trillion16.
Similarly, the number of foreign a¢ liates in the world has considerably expanded.
Sales of foreign a¢ liates worldwide increased from $3 trillion in 1980 to $14 trillion
in 1999, representing nearly twice the amount of global exports in 1999. In 2004,
total sales by foreign a¢ liates amounted to almost $19 trillion17.
operation and Development (OECD) recommendations, a foreign �rm can be de�ned as a foreigna¢ liate (subsidiary) if the foreign investor controls more than 50% of the voting stock.
15Source: UNCTAD, 2001.16Source: UNCTAD, 2008.17Source: UNCTAD, 2005.

General Introduction 6
These two conditions, i.e. a di¤erential of environmental regulations between
countries and increased MNFs activities with an increasing number of foreign a¢ l-
iates and growing FDI, are promising to the study of the so-called pollution haven
hypothesis. In this work, we investigate the pollution haven hypothesis by examining
location as well as amounts of FDI18.
Environmental regulation and �rms location
A primary justi�cation of the pollution haven hypothesis is that either by impos-
ing speci�c equipment, limiting the use of certain resources, or applying sanctions
for non-compliance, strong environmental regulations increase production costs and
reduce �rms competitiveness. In the literature on FDI and on location choice of
MNFs, the search of cost advantage was one of the �rst determinants of FDI. In the
context of pollution haven hypothesis and in a logic of comparative advantage, it is
therefore obvious that a �rm which has the possibility of moving will locate in less
stringent countries to reduce its costs and be more competitive. Such a hypothesis,
as it has been theoretically demonstrated through a general equilibrium framework
by Pethig (1976), Siebert (1977), McGuire (1982), and Baumol and Oates (1988),
considers the di¤erence of environmental costs as the unique determinant of FDI
and su¢ cient to incite �rms relocation. However, some studies argue that environ-
mental costs do not represent a su¢ cient share of production costs to cause such
a displacement. Moreover, an opposite hypothesis as regards to environmental reg-
ulations and competitiveness has been developed by Porter (1991) and Porter and
van der Linde (1995), and is therefore called the Porter Hypothesis. It stipulates
that stricter environmental regulations are good for the environment and promote
18A second approach of the pollution haven hypothesis, not addressed here, is to consider tradedata. We will nevertheless review some examples of this approach in Chapter 2 (e.g., Tobey, 1990;Levinson and Taylor, 2008).

General Introduction 7
competitiveness because they encourage innovation, improving thus the quality of
the products or lowering a �rm�s costs of production. Therefore, �rms would not
be incited to migrate in response to strengthened regulations. Another theoretical
alternative that plays against pollution haven hypothesis predictions is commonly
called the Factor Endowment Hypothesis. This hypothesis assumes that special-
ization patterns are more likely to be driven by more conventional comparative
advantages. Since highly polluting production is at the same time capital intensive,
polluting industries tend to relocate to capital-abundant countries, i.e. developed
and regulated ones, while less pollution-intensive and therefore less capital intensive
industries locate in capital-scarce developing and under-regulated countries. There-
fore, the predictions of the Factor Endowment Hypothesis contrast with those of the
pollution haven hypothesis and suggest that environmental regulations have no or
small e¤ect on trade and FDI patterns. Given these various theoretical hypotheses
that lead to di¤erent predictions, it seems clear that the study of the pollution haven
hypothesis requires on one hand a comprehensive theoretical framework, and on the
other hand a robust empirical assessment. This dissertation develops an adequate
theoretical model of the pollution haven hypothesis, and proceeds then to empirical
tests of this model.
The analytical framework of the pollution haven hypothesis is the one related to
the investigation of the determinants of �rms location choice and FDI. Therefore,
several explanations of internalization and FDI have been analyzed in the theory of
FDI. Earlier works that introduced capital movements in international economics do
not distinguish FDI from other kinds of cross-border capital �ows. Capital �ows are
seen to be motivated by di¤erences in interest rates between countries which result
from di¤erences in relative factor endowments and time preferences between coun-

General Introduction 8
tries (Mundell, 1957). This approach managed to explain FDI of advanced countries
in developing countries on the basis of comparative advantage until the seventies.
However, since the eighties, new patterns of FDI from developed countries towards
developed countries have become dominant, and the classical theory of trade and
FDI fails to explain them. One reason is that capital is largely abundant nowadays,
and therefore exploitation of factor cost di¤erentials might not be the central ex-
planation of FDI patterns. This is emphasized by the missing correlation between
FDI �ows and capital account balances of a country. Because of this same missing
correlation, it is often argued that the investment from the balance of payment is
not a fully relevant indicator of the international activity of MNFs. Therefore, it
seems that FDI can be considered as a vehicle of knowledge more than a move-
ment of capital. It is rather the ownership of a speci�c advantage that drives �rms�
international activities. This factor has been highlighted in the eclectic approach
(Dunning, 1977), also known as OLI framework, and points to three motivations
of foreign investment: Ownership advantage, Location advantage and Internation-
alization advantage19. Theoretical formulations of FDI are largely built on the OLI
paradigm (Krugman, 1983; Helpman, 1984; Markusen, 1984). Moreover, a trade-
o¤ between proximity and concentration is often taken into account to explain the
di¤erent strategies of overseas expansion (exports or production abroad) (Brainard,
1993). The proximity describes the advantage of being close to customers, while
concentration describes the advantage of using economies of scale by producing at
only one location.
19According to OLI paradigm, FDI can only be pro�table if the investing company has somekind of ownership advantage (e.g., knowledge) which gives the company an advantage over domesticcompanies to make up for the disadvantages the company has by producing in a foreign country.Therefore, FDI is bound to market imperfections. Second, the chosen location must have a locationadvantage, not only compared to the home country of the MNF undertaking the FDI, but also to allother possible locations. Finally, it must be pro�table to internalize the ownership advantage in thecompany; licensing to foreign companies, for example, must be less pro�table than internalization.

General Introduction 9
From an empirical point of view, the overview of international production demon-
strates the concentration of production in developed and some developing countries,
and high intra-industry shares in FDI. Therefore, perfect competition approaches
fail in explaining such patterns, and an imperfect competition framework is needed.
Moreover, it has been demonstrated that proximity-concentration approach is suit-
able to explain the observed pattern of trade and FDI, and that overseas activities
are particularly dominant in di¤erentiated-goods industries. All these elements are
taken into account in the New Economic Geography framework, as well as falling
distances that play a major role in explaining the spatial distribution of �rms. In this
thesis, we use such a framework to provide a theoretical modelling of the pollution
haven hypothesis.
FDI impact on pollution levels
The example of NAFTA previously mentioned refers to the concern raised by
the agreement regarding its potential e¤ects on the environmental quality in Mex-
ico, given that the migration of polluting industries from the United States to Mexico
was predicted due to di¤erential environmental regulations between the two coun-
tries. This fear about the environmental damages corresponds to the third major
aspect of the pollution haven hypothesis. However, this issue has been little stud-
ied in the pollution haven hypothesis literature. He (2006) is one exception and
investigates the environmental impacts of FDI in Chinese provinces. Much of the
related literature focused on trying to �nd a clear empirical evidence for the hy-
pothesis. More recently, it concentrated rather on �nding evidence for a Pollution
Haven E¤ect. Unlike the pollution haven hypothesis which stipulates that higher
environmental costs induced by strengthened regulations are the unique motive for
trade and FDI, thus outweighing all other determinants, the pollution haven e¤ect

General Introduction 10
only predicts that trade and FDI may be deterred by tighten regulations. In other
words, the assumed impact of environmental regulations on international �ows is
much stronger in case of pollution haven hypothesis than in case of pollution haven
e¤ect. Thus, implications of the former hypothesis are larger. For this reason, in
this research we mostly attempt to test the hypothesis rather than the e¤ect, and
therefore mostly use the term pollution haven hypothesis which we consider as a
general framework comprising the pollution haven e¤ect.
FDI driven by pollution haven hypothesis motivations may a¤ect environmen-
tal quality and especially pollution levels through di¤erent channels. Three major
channels resulting from trade and FDI liberalization are identi�ed in literature as
scale e¤ect, composition e¤ect and technique e¤ect. The scale e¤ect refers to the
increase of overall production which in turn increases pollution. The composition
e¤ect stems from changes in production of an economy caused by specialization, and
its impact on pollution levels depends on the comparative advantage of countries.
The technique e¤ect relates to the use of cleaner production technology resulting
from increase in income. The global e¤ect depends on the interplay between these
three e¤ects.
Foreign investment may be a vehicle of new and cleaner technologies that can
reduce pollution. When they face strict regulations in their source country, multina-
tional companies have strong incentives to innovate in order to improve the e¢ ciency
of resource use or reduce pollution emissions. It is cost-e¤ective for them to use the
same technologies in di¤erent countries and increase economies of scale, even where
environmental laws are weaker. If we consider global pollution, it is not a¤ected
by such FDI since whether investment takes place in the source country or in a
foreign country it does not modify the global pollution emissions. If we consider
General Introduction 11
local pollution, due to an increase of activity, polluting emissions are expected to
increase where the investment takes place. However, if FDI replaces in host coun-
tries domestic production facilities, which are more polluting and less competitive,
global pollution as well as local pollution in host country will be reduced.
FDI can also act as a vehicle through which new ideas, technologies, and working
practices can be transferred to domestic �rms and improve their e¢ ciency. This
would result in a reduction of both local and global pollutions.
However, if FDI is motivated by the search of less environmental standards as
suggested by the pollution haven hypothesis, the behavior of MNFs in foreign coun-
tries could be less virtuous and o¤set the above mentioned bene�cial impacts regard-
ing global and local pollutions. Examples of pollution damages caused by multina-
tional �rms are not lacking. For illustration, preliminary �ndings of a forthcoming
report (Summer 2010) for the United Nations into the activities of the world�s 3,000
biggest companies in 2008 estimates one-third of pro�ts would be lost if �rms were
forced to pay for use, loss and damage of environment. The study found the esti-
mated combined damage was worth US$2.2 trillion in 200820.
Finally, with the aim of being exhaustive in the analysis of the several FDI-
pollution transmission channels, we remind here the role on pollution levels of in-
ternational shipping activities tied to FDI, despite the fact this issue is beyond the
scope of this work. If FDI is driven by market access motivations, it will be consis-
tent with a reduction of pollution emissions resulting from the reduction of shipping
activities. In contrast, in case of vertical FDI, production is re-exported to the
source country, therefore pollution will increase due to the additional shipping of
goods.
To sum up, theoretical views presume that the e¤ect of FDI on pollution lev-
20The Guardian, February 18th, 2010.

General Introduction 12
els operates via several channels. Therefore, the global e¤ect of FDI on pollution
is ultimately an empirical issue. In this work, we will empirically investigate the
impact of FDI on host countries pollution emissions. Global pollution is a major
environmental and economical issue due to the well-known climate change problem.
Regarding the pollution haven hypothesis, it is intimately tied to global pollution
problems since the fear is that the improvements made in strict countries are more
than o¤set by the increase of pollution in less regulated countries. However, the
empirical investigation of global pollution is hardly feasible and would require un-
available data. Local pollution is also a critical issue with environmental, health
and development impacts in a¤ected countries, and concerns about the impact of
the pollution haven hypothesis on local pollutions were also expressed.
The objective of this dissertation is to contribute to the existing literature on
the trade and environment debate, by investigating in depth the issues related to
the pollution haven hypothesis. We examine theoretically as well as empirically the
e¤ect of strengthened environmental regulations on �rms location choice. We also
focus on the impact of foreign direct investment on the pollution emissions.
Structure of the dissertation
Prior to the direct investigation of the pollution haven hypothesis in the following
chapters, we examine in Chapter 1 the evolution of countries�environmental policies.
Indeed, a necessary condition for �rms to be incited to migrate is that there are in-
terjurisdictional di¤erences in regulatory stringency. Therefore, we group countries
according to four levels of development, and within each group we carry on a more
detailed analysis by examining the environmental policies by types of pollution, and
by focusing on certain individual characteristics. The objective is to adjust and re-
�ne the common representation de�ning the developed North as regulated and the

General Introduction 13
developing South as lax. Firstly, this useful essay broadly con�rms and concretely
establishes the relevance of the common distinction between developed and develop-
ing countries. Furthermore, it brings out that emerging economies and Central and
Eastern European Countries (CEEC) are in an intermediate position. They have
undertaken the reform of their institutions and their environmental policies from
the nineties, but the environmental measures are not su¢ ciently enforced. These
results will guide us in our analysis of the pollution haven hypothesis and help us
in our interpretations.
Chapter 2 helps the reader to become familiar with the debate on trade and
environment, and then proposes a theoretical modelling of the pollution haven hy-
pothesis. We �rstly introduce and explain the theoretical foundations of the hypoth-
esis and present the controversial issues related to its emergence. We then review
the existing theoretical analyses that highlighted the pollution haven hypothesis.
This exercise emphasizes the lack of theoretical foundations in literature. Indeed,
while the existing literature contains many useful insights, it largely focused on one
assumption, the di¤erence of environmental regulations. Seminal works in this �eld
are Pethig (1976), McGuire (1982), Baumol and Oates (1988) using standard in-
ternational models. The chapter shows that these models were too restrictive to
capture all issues related to the pollution haven hypothesis, and did not manage
to yield an estimable structural relationship between environmental regulations and
patterns of specialization. The review of the empirical studies conducted on the
subject underlines major progresses made in the empirical investigation of the pol-
lution haven hypothesis and also reveals drawbacks encountered in this �eld. Thus,
Chapter 2 stresses the reasons for which, although over the last thirty years, many
researchers have investigated the pollution haven hypothesis and contributed to pro-

General Introduction 14
vide theoretical as well as empirical foundations, they did not manage to bring out a
clear empirical evidence of the e¤ect of environmental regulations on �rms location
decision.
Since one major shortcoming is the lack of theoretical foundation, we �nally pro-
pose a formal theoretical modelling of the pollution haven hypothesis. We use a New
Economic Geography model as developed by Krugman (1980) in which we incorpo-
rate the environmental aspect. Indeed, the economic geography primary interest is
to study the relative attractiveness of various locations for �rms, and to clarify the
causes behind the di¤erences in spatial patterns of �rms. It seeks to determine the
characteristics of locations that are the most attractive to �rms, and it relies on as-
sumptions well-adapted to our work (i.e., monopolistic competition with increasing
returns to scale). Moreover, we follow Head and Mayer (2004) to derive from this
economic geography model our speci�cation of �rms location choice. We extend the
methodology adopted by Head and Mayer (2004) by considering pollution as a pro-
duction factor and by deriving a marginal cost that is a¤ected by market distortions
which capture institutional failures. This enables us to consider the complexity of
the location choice determinants appropriate to an exhaustive investigation of the
pollution haven hypothesis. The model �nally leads to an estimable equation pre-
dicting a positive relationship between the pro�tability of a �rm location and the
market potential and the global productivity of factors, and a negative one between
this pro�tability and the production factor costs including the pollution cost, as well
as market failures.
The objective of Chapter 3 is to provide an empirical test of the pollution haven
hypothesis. It establishes a close link between the theoretical predictions of the
location choice model derived in Chapter 2 and the empirical estimation of the

General Introduction 15
pollution haven hypothesis. The estimation of the pollution haven hypothesis based
on a speci�cation directly derived from an appropriate theoretical model represents
an improvement over existing literature. Indeed, the integration of theory with
empirical work is rare in related literature, and the lack of theoretical foundations
of the equations tested often entails speci�cation errors.
While a large body of the empirical literature investigates the pollution haven
hypothesis by examining the deterrent e¤ect of strengthened environmental regu-
lations on �rms location within a country, the real debate is whether international
di¤erences in environmental regulations stringency cause the relocation of polluting
industries from regulated countries to the less regulated, and often poor, ones. In-
deed, the �rst approach would better correspond to the search for a pollution haven
e¤ect, while seeking for a pollution haven hypothesis evidence must rely on interna-
tional data. Therefore, in this chapter, we examine the location choices of French
�rms in all host countries, and we analyze their determinants.
In particular, we dwell on the e¤ect of tightened environmental regulations in
a country on the probability that a French �rm invests in this country. To this
end, we construct an index trying to capture the overall strictness and e¤ectiveness
of the environmental policy of each host country. The objective of such a global
index is to capture the di¤erent aspects of an environmental policy, in order to
rank countries. The values of the environmental index con�rm the conclusions en-
suing from the analysis of the environmental policies in Chapter 1. Furthermore,
the introduction of key variables in a study of the pollution haven hypothesis, and
yet often neglected in other empirical studies on the question, helps to limit the
problems of omitted variable bias often observed in literature. In particular, gov-
ernance factors are considered in this thesis, as recommended by authors such as

General Introduction 16
Smarzynska and Wei (2004) who stressed the importance of taking them into ac-
count. Indeed, the least regulated countries being often the most corrupted ones,
the positive e¤ect of weaken environmental regulations on FDI may be occulted by
the likely negative e¤ect of increased corruption, resulting in misled interpretations.
Similarly, as mentioned by Keller and Levinson (2002) and Levinson and Taylor
(2008), the omission of unobservable characteristics of industries and locations has
been a major source of the inconsistency of results in empirical investigations of the
pollution haven hypothesis. We also attempt to control for unobserved heterogene-
ity, by using disaggregate data on �rms�sectors, by controlling for di¤erent groups
of countries, and by using estimations methods that control for �rms and industry
speci�c e¤ects. In the base model, we use a conditional logit which is an empirical
model particularly well-adapted to the analysis of discrete choices, while in extended
analyses and robustness checks we use di¤erent estimations methods.
The results show a negative impact of strict environmental regulations on the
probability of location choice, regardless of the pollution intensity of the manufac-
turing sectors. The analysis by groups of countries reveals a nonlinear relationship,
indicating that in least regulated countries, the correlation between environmental
stringency and the location choice is positive. Moreover, an estimate controlling for
the mode of entry of �rms suggests that a stricter regulation deters both green�eld
entry and mergers and acquisitions.
The determinants of location choices having been studied in Chapter 3, the
purpose of Chapter 4 is to assess the outcomes of such decisions on the host country.
More precisely, since Chapter 3 provides an empirical evidence of the pollution haven
hypothesis, establishing that industries avoid strict environmental regulations and
preferably locate in less stringent countries, in Chapter 4 we move one step forward

General Introduction 17
in the analysis of this issue by examining its impacts on pollution levels. Indeed,
once the pollution haven hypothesis was con�rmed, the question is what impact
such a behavior of �rms has on environmental issues, and especially on host country
pollution levels? Despite the relevance of this question, it has been neglected in the
literature on the pollution haven hypothesis, which essentially focuses on looking
for empirical evidence for pollution havens; and if such evidence is found, studies
simply conclude that environment is harmed. However, a contradictory conclusion
is more likely to emerge if we refer to the literature on multinational �rms, which
often argues that FDI improves the techniques used in production by host countries.
Therefore, is FDI necessarily harming environment if it is driven by pollution haven
motivations? Conversely, is still FDI bene�cial to host countries when one of its
essential determinants is a lax environmental policy? Even if multinationals�foreign
a¢ liates do use cleaner techniques than their local counterpart, does this necessarily
mean that FDI reduces pollution emissions in host countries?
Chapter 4 explores the relationship between French FDI and pollution levels in
the host country. This consists in estimating a system of equations that simultane-
ously captures the attractiveness of less regulated countries on FDI and the impact
of FDI on host countries pollution emissions.
Moreover, in addition to the problems of omitted variables and unobserved het-
erogeneity that have been dealt with in Chapter 3, another major issue complicating
the analyses of the pollution haven hypothesis has been highlighted in recent works,
i.e. the endogeneity of environmental regulation (Cole et al., 2006; Levinson and
Taylor, 2008). The existence of a causal relationship running in both directions
may have hampered the detection of a large impact of environmental regulation on
FDI patterns. This issue has been treated in Chapter 3 through an instrumental
General Introduction 18
estimation. In Chapter 4, it is addressed more speci�cally through the estimation
of simultaneous equations.
Considered together, the three issues lead to a system of three equations where
FDI, environmental regulation and pollution emissions are simultaneously deter-
mined. The base model is estimated using data on French manufacturing FDI and
CO2 emissions. The estimation of the system of equations is expected to capture
the direct e¤ect of FDI driven by PHH motivations on pollution emissions, while
taking into account the endogeneity of environmental regulation. Therefore, it is
supposed to address the main concerns expressed about the pollution haven hy-
pothesis. Results emphasize a strong negative e¤ect of tightened regulations on
FDI, thus con�rming results of Chapter 3. They also bring out a negative correla-
tion between environmental regulation design in host countries and FDI. Regarding
the pollution determination, results show a signi�cant, even weak, positive impact of
FDI on the pollution emissions in host countries. However, in an extended analysis,
it appears that FDI reduces pollution intensity.

Chapter 1
Comparative Analysis ofEnvironmental Policies
Introduction
Since the seventies, the Western Europe and the United States have become increas-
ingly concerned with environmental quality. As a result, their �rst major environ-
mental laws were introduced (Table 1.1). This was not the case in the rest of the
world, as the African countries were more concerned with the �ght against poverty
and famine, while the communist ones were pursuing a policy of heavy industrial-
ization. Thus, the �rst de�nitions of the pollution haven hypothesis stipulated that,
facing stringent environmental policies in the developed countries in the North, pol-
luting �rms should relocate from these countries to the less regulated ones in the
South. This de�nition focuses on two points: �rst, the northern countries pursue
stricter environmental policies than those of the South; second, this disparity causes
the relocation of �rms. Indeed, the idea is that if a stringent environmental policy
increases the production costs of �rms, they will be encouraged to set up in locations
where they minimize these costs. In this chapter, we will focus on the �rst element,
namely the di¤erent levels of stringency in environmental policies, while its impact
19
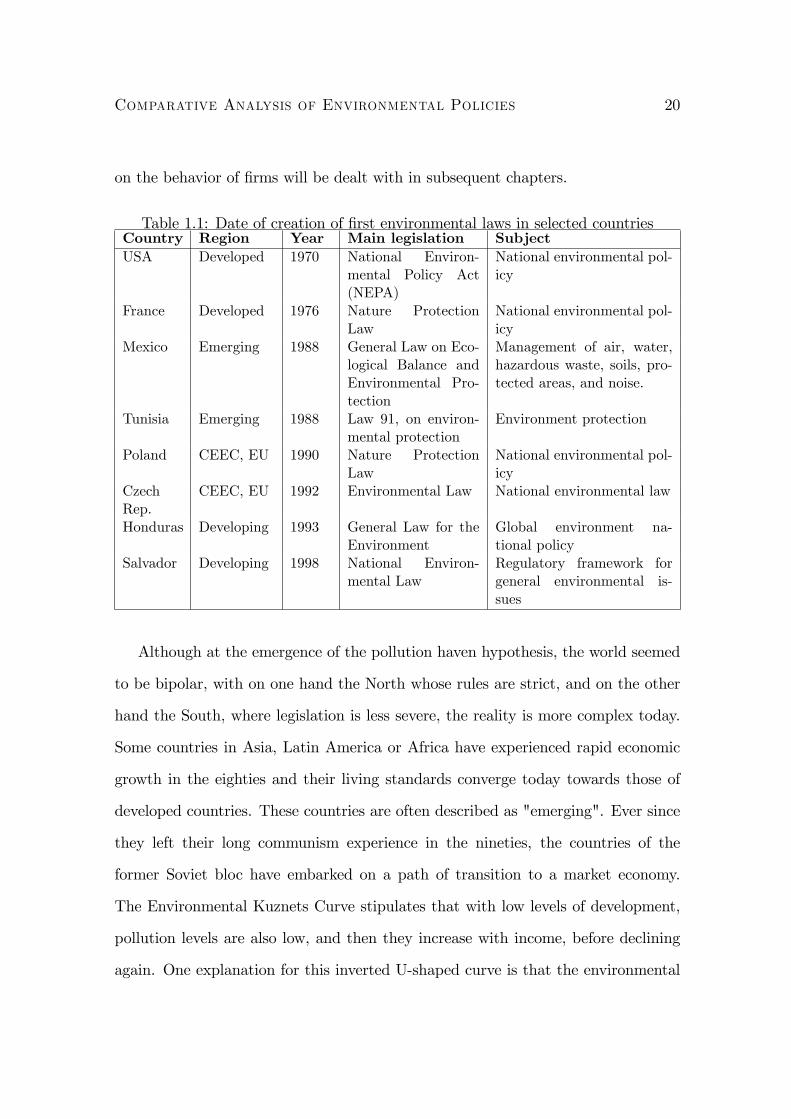
Comparative Analysis of Environmental Policies 20
on the behavior of �rms will be dealt with in subsequent chapters.
Table 1.1: Date of creation of �rst environmental laws in selected countriesCountry Region Year Main legislation SubjectUSA Developed 1970 National Environ-
mental Policy Act(NEPA)
National environmental pol-icy
France Developed 1976 Nature ProtectionLaw
National environmental pol-icy
Mexico Emerging 1988 General Law on Eco-logical Balance andEnvironmental Pro-tection
Management of air, water,hazardous waste, soils, pro-tected areas, and noise.
Tunisia Emerging 1988 Law 91, on environ-mental protection
Environment protection
Poland CEEC, EU 1990 Nature ProtectionLaw
National environmental pol-icy
CzechRep.
CEEC, EU 1992 Environmental Law National environmental law
Honduras Developing 1993 General Law for theEnvironment
Global environment na-tional policy
Salvador Developing 1998 National Environ-mental Law
Regulatory framework forgeneral environmental is-sues
Although at the emergence of the pollution haven hypothesis, the world seemed
to be bipolar, with on one hand the North whose rules are strict, and on the other
hand the South, where legislation is less severe, the reality is more complex today.
Some countries in Asia, Latin America or Africa have experienced rapid economic
growth in the eighties and their living standards converge today towards those of
developed countries. These countries are often described as "emerging". Ever since
they left their long communism experience in the nineties, the countries of the
former Soviet bloc have embarked on a path of transition to a market economy.
The Environmental Kuznets Curve stipulates that with low levels of development,
pollution levels are also low, and then they increase with income, before declining
again. One explanation for this inverted U-shaped curve is that the environmental

Comparative Analysis of Environmental Policies 21
requirements of populations and governments increase along with rising income.
Di¤erent levels of income imply di¤erent environmental policies. Thus, a too sharp
North/South or developed/developing countries distinction must be overcome, to
avoid a biased analysis of the pollution haven hypothesis. Since the pollution haven
hypothesis ensues from the heterogeneity of environmental policies, our objective
in this chapter is to examine in detail the environmental policies of countries with
regard to di¤erent levels of development, in order to draw an accurate and precise
picture of the current state of environmental regulation in the world.
Moreover, given that the strength of environmental measures within a country
may vary in function of the environmental risks and the incentives of governments,
it seems more relevant to examine the policies implemented for speci�c problems
rather than attempt a general comparison of environmental policies between coun-
tries or groups of countries. Indeed, all countries do not face the same pressures on
their environment. Some witness the deterioration of their atmosphere and others
observe the depletion of their marine resources. Depending on the risk involved, the
strictness of the environmental policy of a country may di¤er as to the management
of various resources. In addition, it may also be in�uenced by speci�c industries.
Thus, we will compare the policies implemented to reduce local pollution and then
those implemented in the case of global pollution. Regarding local pollution, we
will focus on measures related to air and water pollution, since these are often reg-
ulated as a priority and are closely related to industry. In terms of global pollution,
we will examine the fundamental issue of the prevention of global climate change.
Moreover, we will conduct our comparative analysis on four groups of countries
corresponding to four levels of development: developed, emerging, transition and
developing countries, for each type of pollution. Within these groups, we will also

Comparative Analysis of Environmental Policies 22
take a few examples of speci�c countries, as all countries in a group are not perfectly
homogeneous. Finally, we will focus on measures a¤ecting industry. For example,
we will not detail the measures implemented to manage air pollution resulting from
road tra¢ c.
This chapter is divided into two parts. To be able to assess the e¤ectiveness of
the policies implemented and to compare them, we will �rst present the instruments
available for governments to establish their environmental policies, highlighting the
advantages and weaknesses of these instruments and their coordination. Then in the
second section of this chapter, we will examine the environmental policies that are
actually implemented in di¤erent countries, in order to emphasize the heterogeneity
of these policies.
1 Environmental policy instruments
In the neoclassical approach of environmental economics, pollution is considered as
a negative externality. In fact, there is an externality when the well-being of an
agent (the utility of a consumer or the pro�t of a �rm) is directly a¤ected by the
actions of another agent and does not result in any market transaction between the
two agents.
Positive externalities a¤ect positively the other agents, while negative externali-
ties deteriorate their situation. Sulfur dioxide (SO2) emissions released by industry
during the production process, thus causing respiratory problems in humans, meet
perfectly the concept of externality. The same thing applies to all the other known
forms of pollution (emissions of carbon dioxide CO2, particulate matter etc.)
The producer causing the pollution imposes on the other members of the society
a damage cost which is not taken into account when deciding the quantities to be
Comparative Analysis of Environmental Policies 23
produced. Thus, the private cost of the producer is lower than the total cost incurred
by the society, i.e. social cost. The market equilibrium price, which does not take
into account the social cost but the private one which is inferior, is too low, and
therefore results in a sub-optimal production.
Externalities are one example of market failures - (public goods are another
one) - since the competitive equilibrium does not achieve a Pareto optimal solution.
More speci�cally, the presence of externalities questions the �rst theorem of welfare
economics as agents�welfare depends on priceless commodities, while obtaining an
e¢ cient allocation requires that agents are confronted with the fair price of these
commodities. To address this market failure, government intervention is often nec-
essary1. The government intervention to achieve the Pareto optimum in presence
of externalities is to internalize them. For this purpose the government has various
means grouped into two categories: the command and control instruments and the
market-based instruments.
1.1 Command and Control instruments
1.1.1 Standards
Command and control instruments, namely standards or quotas, are a simple way
in theory to ensure that the optimal level of pollution is reached. Indeed, these
instruments specify a maximum level of pollution to comply with, under threat of
penalties. For example, to reduce car pollution emissions, the EU has set since 1998
the maximum amount of lead allowed in fuels. These standards are theoretically
de�ned to achieve the optimum, but to reach this goal they must be properly es-
tablished. This requires an accurate assessment that is possible only with perfect
1Other solutions such as bilateral negotiations would also be possible in some cases, accordingto the Coase Theorem.

Comparative Analysis of Environmental Policies 24
information on the damage su¤ered by the victims and the costs incurred by the
polluter. The regulator must then ensure compliance with these standards through
strict and frequent controls.
If standards are not set correctly, for example being set at a very lax level, the
pollution level will be too high, while agents have no economic incentive to reduce
it further. This is the main drawback of standards, namely their inability to incite
agents to further reduce their pollution and innovate to this end. Conversely, if
standards are set at a too rigorous level, the pollution level is below the optimal
one, but from a strictly economic point of view this level will be ine¢ cient because
it will impose an excessive abatement cost on polluters, implying a loss of social
welfare. In general, standards are proven to be costly and less e¢ cient than the
second category of instruments: the market-based instruments.
1.2 Market-based instruments
Insofar as non-optimal production in the presence of externalities is due to a dif-
ference between the social cost and the private cost of an activity, market-based
instruments have to �ll this gap through the internalization of the external cost.
They aim to a¤ect the polluters�costs to encourage the voluntary adoption of less
polluting behaviors. Market-based instruments a¤ect prices (taxes, subsidies), or
quantities (emissions permits).
1.2.1 Taxes and subsidies
Taxes
A.C. Pigou was the �rst in 1920 to propose the application of a tax to internalize
negative externalities. This tax, which is called Pigovian tax since then, consists in
imposing on the polluting �rm an amount to pay per unit produced, i.e., to impose

Comparative Analysis of Environmental Policies 25
on the �rm a marginal cost of emissions (the tax t) equal to the marginal damage
Dm (t = Dm), so that the polluting �rm has an incentive to emit exactly the optimal
level of pollution by equalizing its marginal abatement cost Cdm to its marginal cost
of emission. The Pigovian tax thus makes the additional costs supported by the
agent that creates the externality, in accordance with the polluter pays principle.
The implementation of the Pigovian tax requires the assessment of environmental
damage, which poses many methodological problems. It also requires the collection
of information on marginal abatement costs, which faces problems of asymmetric
information, as the polluters have an incentive to cheat to encourage the regulator
to establish a lower and therefore suboptimal tax. Therefore, the introduction of
a Pigovian tax seems to be hardly feasible, and it is not in force in most countries
having opted for a taxation system.
However, the adoption of a second-best tax di¤erent from the optimal one, but
that aims to reach a certain emissions control objectives, has certain advantages.
In comparison with standards, it contributes to the achievement of the same goals
but at a lower total cost, and is therefore more economically e¢ cient in a context
without uncertainty on abatement costs. Indeed, while standards apply uniformly to
all aggregate polluters regardless of their characteristics of production, taxes make
more e¢ cient agents reduce their pollution more than the least e¢ cient ones, which
results in a minimization of pollution abatement costs. Moreover, the considerable
advantage of the tax resides in the incentive it exerts on �rms to innovate and the
improvement of environmental quality that follows: when the marginal pollution
abatement cost decreases, emissions of agents also decline; they derive a double
bene�t by reducing their pollution abatement costs while reducing the amount of
the tax to pay (see Section 1.3). But to meet these expectations, the tax rate which

Comparative Analysis of Environmental Policies 26
is chosen must not be too low because in this case it does not provide incentives
to innovate. This task is even more complicated during a period of in�ation which
signi�cantly weakens the incentive power of the tax and requires the tax to be
frequently raised.
In summary, as for the standards, the establishment of an e¢ cient tax requires
good information and knowledge of the marginal damage imposed by the polluter
on society. However, this system does not require knowledge of marginal pollution
abatement costs of �rms. In addition, it encourages innovation.
Subsidies
Sometimes, governments also resort to subsidies to reduce pollution (Example:
subsidies paid to industries to support them in their e¤ort to control pollutant re-
leases). In the short run, from a strict viewpoint of the level of pollution reached,
a subsidy system for abatement activities is equivalent to that of taxation. Indeed,
if the polluter receives a subsidy amount per unit of pollution below the level of
pollution of reference (the one he would have chosen in the absence of constraint),
he has an incentive to clean up as long as his marginal abatement cost Cdm is inferior
to the subsidy rate s. The optimal subsidy rate is then equal to the optimal tax rate.
However, in the long run, these two systems will have di¤erent consequences. The
introduction of the tax leads to the elimination of poorly performing �rms (because
the tax increases both the marginal cost and the average cost of production), while
a subsidy helps to further maintain unpro�table �rms (because it increases the mar-
ginal cost of production but decreases the average cost of production), challenging
even the entry of new �rms. Thus, with a subsidy, even if each company reduces its
individual pollution volume, the aggregate level of pollution will exceed the desired
level. The subsidy system is also contrary to the polluter pays principle, and its

Comparative Analysis of Environmental Policies 27
�nancing increases the public de�cit.
1.2.2 Emissions trading
Emissions trading, also called tradable pollution quotas, are the market instrument
that acts directly on the amount of pollution emitted. An emissions trading system
was proposed in Kyoto in 1997 as a market instrument to regulate emissions of
greenhouse gases. Indeed, the problem with externalities may arise in the absence
of markets, leading to an imperfect allocation of resources. The intervention of the
government consists in creating an originally non-existent market, and then de�ning
property rights, while leaving market forces to restore the optimum. Thus, after the
maximum allowed level of pollution has been established by public authorities, each
�rm is allocated a certain amount of pollution rights, the total amount of permits to
match the prede�ned maximum level. These quotas are then traded on the pollution
rights market at a price determined by the balance between supplied and demanded
quantities. The agents who are most likely to reduce their emissions continue to
sell their quotas as long as the selling price will remain above their marginal cost
of abatement, while the least e¤ective agents will purchase these rights as long as
the permit price is below their marginal cost of pollution abatement. In order for
a market to exist, this requires that �rms are heterogeneous in terms of pollution
abatement costs so that the ones who initially have a marginal abatement cost below
the market price of permits can sell to others whose abatement costs are higher than
the market price of permits. At equilibrium, the price of permits will be equal to
the marginal pollution abatement cost for all �rms.
The great advantage of emissions trading systems comes from their �exibility.
Indeed, these systems are more �exible than that of an emissions taxes because the
permit price results from the balance between supply and demand. It adapts to

Comparative Analysis of Environmental Policies 28
the economic conditions and is not a¤ected by in�ation. Moreover, as for taxes,
this �exibility is a source of innovation because the agents are free to use a more
e¢ cient and less polluting production method to capitalize on the opportunity to
trade unused permits (Section 1.3).
Beside, in the same way as the establishment of standards enables the regulator
to achieve the maximum level of pollution set, the predetermination of the desired
level of pollution and the distribution of the number of allowed pre-requisite permits
for achieving this level ensure the realization of the quanti�ed objective ex ante.
Conversely, the tax system does not systematically lead to a given level of pollution
since it sets the price but has a less direct impact on the quantity.
Thus, the permit system combines advantages of standards and taxes, while
�lling at the same time some weaknesses of these two systems. However, this system
also has its limits. For example, an error on the amount of rights resulting in
high prices may lead to the unjusti�ed closure of some companies. Above all, the
performance of this system assumes that the permits market structure is competitive,
which, ultimately, is rarely the case. The most polluting �rms are often large �rms
enjoying a strong market power that they can use to manipulate prices as on the
goods market.
1.3 Dynamic e¢ ciency of instruments
We have seen that, in addition to the criteria of environmental e¢ ciency (ability of
the instrument to achieve the �xed environmental objective) and economic e¢ ciency
(in accordance with Pareto e¢ ciency: achieving the target at lower cost), another
criterion of comparison of di¤erent instruments is the evaluation of their dynamic
e¢ ciency, i.e., their ability to exercise a continuous incentive to innovate in order to
exceed the target set by maximizing social welfare. According to this criterion, the

Comparative Analysis of Environmental Policies 29
economic instruments are preferable to uniform standards, but their e¤ectiveness
depends however on the market structure of the polluting sector.
In cases where the polluting sector is perfectly competitive, the imposition of
a standard creates no incentives for polluters to reduce their emissions to a level
below that required by the standard. On the contrary, in the presence of a tax,
the polluter is continuously encouraged to innovate in order to lower its marginal
abatement costs, which allows him to reduce emissions, and consequently the amount
of the tax to pay. This dynamic e¤ect bene�ts not only the polluter, but yields also
an environmental gain. Similarly, the possibility of gains resulting from the sale
of unused permits acts as a permanent stimulus to innovating and consequently
exceeding the objectives. However, this incentive to innovate is in�uenced by the
initial permit allocation method. In addition, as far as �rms are able to in�uence,
through their behavior, the permit price but not the tax rate, the adoption of a tax
is more e¢ cient.
However, in imperfect competition, the incentive to innovate may reduce welfare
if the obtained cost reduction allows �rms to increase production while reducing
their emission rates, resulting in a higher emission level than what would have been
reached in the absence of innovation. In this case, the damage may be greater than
the bene�t derived from increased output. Finally, with regard to emissions trading,
strategic behavior of �rms on the market for goods and on the permits market may
reduce their incentive to innovate in order to prevent their competitors from taking
advantage of lower permits prices.
1.4 Choice and coordination between the di¤erent systems
This analysis shows that standards appear to be costly environmental policy instru-
ments and are the most di¢ cult to use e¢ ciently because of their rigidity. Under

Comparative Analysis of Environmental Policies 30
certain conditions, taxes and further emission permits do constitute the advantage
of being more �exible and more incentive for innovation. Thus, market instruments
are recognized to be more e¢ cient than command and control instruments (Table
1.2).
Table 1.2: Comparison of the regulatory instruments, according to the criteria ofe¢ ciency
Environmental e¢ ciency Economic e¢ ciencyStatic Dynamic
- Standards - Taxes, Subsidies - Taxes- Permits - Permits - Permits
However, among these market instruments, the choice between taxes and per-
mits is an increasingly discussed issue at the establishment of environmental poli-
cies, both internationally, regionally and nationally. Theoretically, in the absence
of uncertainty, taxes and permit systems are equivalent in terms of environmental
e¢ ciency and economic e¢ ciency, so the choice of one or the other is accompanied
by the minimization of the cost for achieving the environmental objective. However,
under uncertainty, these instruments are no longer equivalent. Indeed, Weitzman
(1974) shows, using a model with an additive error, that the choice of the instru-
ment depends on the relative slope of the aggregate marginal damage and marginal
abatement curves: when the slope of the marginal damage curve is lower (higher)
than the marginal abatement curve, the tax (permit) is preferable. Speci�cally, in
the case of climate change for example, if concentrations of greenhouse gases in-
crease less (more) rapidly than the emissions reduction costs, taxes (permits) are
preferable to permits (taxes) because they minimize the expected loss of welfare if
there is an error in the estimation of the abatement cost curve (Figure 1.1).
Roberts and Spence (1976) were the �rst to suggest that hybrid solutions, which
consist for example in limiting the transactions volume while establishing a trigger

Comparative Analysis of Environmental Policies 31
Figure 1.1: Loss of welfare with taxes and permits under uncertainty
price and a price-�oor (Safety Valve), would be preferable to the use of a unique
instrument. These systems, while based on a market permit, would overcome their
major �aw, namely the volatility of price which is the counterpart of the assurance
of achieving the target. Indeed, an over-allocation of quotas or a too lax goal drives
the price of a ton of carbon down. This volatility (and a too low price) decreases the
incentive provided by permits, thus depriving the system of its main advantage, and
leads to uncertainty about the cost of the program. The setting of the trigger price
and the �oor limits this uncertainty, the trigger price serving as an insurance against
an improper assessment of emissions reduction costs and the �oor price guaranteeing
that a minimum amount of emissions reductions will occur.
The introduction of a tax would compensate the price volatility, since it is not
subject to the vagaries of market. But the fear here is the coexistence of two di¤erent
carbon prices within a given economy (if the tax is not equal to the permit price),

Comparative Analysis of Environmental Policies 32
thereby preventing emissions to be reduced at a lower cost. This particular problem
arose in France in 2009 during debates on the introduction of a carbon tax and its
mix with the existing European Union Emissions Trading Scheme (EU ETS), the
permit price valuing a ton of carbon at about 13 Euros, and the tax rate initially
considered around 32 Euros. Another question was whether a company already
subject to a quota should be subject to a tax. Indeed, the current ETS covers
about 40% of polluting emissions (30% of French emissions), corresponding to those
emitted by major industries which are also the largest consumers of energy. Although
a carbon tax was considered for complementarity with the European system, to limit
the remaining 70% of French CO2 emissions related to transport and housing, there
remains a hazard for companies that would straddle the two systems. More generally,
problems of distortions between the two systems are still feared. This was the case
during the implementation of the ETS, whose compatibility with the IPPC directive
in Europe and the classi�ed installations for the environment protection directive in
France, based on the use of the best available techniques, was also raised and led to
reform these measures.
The mix between several instruments always raises problems of compatibility.
Just as systems based on a single instrument, the systems known as "hybrid" raise
questions about their advantages and drawbacks. Moreover, besides the three crite-
ria of e¢ ciency, a criterion of acceptability by polluters also comes into account in
the choice of the instruments and the establishment of environmental policies. All
these reasons explain why in practice, governments have imposed regulatory mea-
sures that have taken di¤erent forms in di¤erent countries and periods, which we
will examine in the next section.

Comparative Analysis of Environmental Policies 33
2 Stylized facts on the development of environ-mental polices and regulations
For the preparation of this part, we used di¤erent sources of documentation. We
have been mainly helped by reports from various international organizations ana-
lyzing the economic and environmental conditions of countries or regions. Thus,
the Environmental Performance Reviews by country, published by the Organization
for Economic Cooperation and Development (OECD), outline the main achieve-
ments and remaining challenges in OECD countries (developed countries and some
emerging countries) in environmental management and sustainable development.
The United Nations Economic Commission for Europe has undertaken last decade
similar studies on transition countries. These reports, entitled Environmental Per-
formance Review, review for each country the evolution of the environmental policy
and the management of pollution and natural resources. For developing countries,
our research has mainly been developed from the Country Environmental Analyses,
published by the World Bank, studying the institutional framework for countries�
environmental management and their natural resource management. Besides these
periodic reports, we have completed and re�ned our research using speci�c studies
on certain topics or areas.
2.1 Local pollution
2.1.1 Air pollution
Air pollution results from the release of air pollutants such as dust, sulfur dioxide
(SO2), nitrogen dioxide (NOx), carbon monoxide (CO) and volatile organic com-
pounds (VOCs). It may be anthropogenic or natural, and the main anthropogenic
sources are transport, energy production and industry. Because of its impact on

Comparative Analysis of Environmental Policies 34
ecosystems and health, air pollution has historically been one of the �rst areas of
the environment to be regulated.
Developed countries
The United States The �rst law dealing with the problem of air pollution in
the United States was the "Air Pollution Act�, enacted in 1955 by the U.S. Congress.
This law denounced the dangers of air pollution but contained no national measure
of repression against potential polluters, leaving that task to the care of each state.
This law was replaced in 1963 by the Clean Air Act, but the �rst major advances
were made in 1970 with the amendment of the Clean Air Act. This amendment
was required by the newly created EPA, following an increase in observed rates of
nitrogen dioxide (NO2), ozone (O3), sulphur dioxide, suspended particles and car-
bon monoxide in the atmosphere, and a growing popular demand. The Clean Air
Act of 1970 is thus the �rst federal law governing the regulation of the environment
at a national level for health and environmental reasons. The NAAQS Standards
(National Ambient Air Quality Standards) regulating the emission of these pollu-
tants were then de�ned. Their implementation required a commitment on the part of
States which set action plans for submission to EPA. As far as they were not feasible
with the techniques of that period, they also had an incentive e¤ect on innovation.
For example, the standards of the Clean Air Act prompted the car industry to de-
velop catalysts that have contributed to a signi�cant reduction in emissions from
cars. The amendment of the Clean Air Act in 1990 introduced an emission trading
system of sulfur dioxide emissions to �ght acid rain, by encouraging �rms to reduce
their pollution abatement costs, and a control program against leakage of volatile
organic compounds. The United States was the �rst country to use tradable permit

Comparative Analysis of Environmental Policies 35
systems for air emissions of sulfur oxides (SOx) and oxides of nitrogen (as well as for
management of water resources). This system creates signi�cant additional costs for
industry. But it has allowed the reduction of emissions at a lower cost than other
types of regulations. Overall, SO2 emissions dropped by 50% between 1980 and
2007.
The United States use standards, economic instruments and voluntary measures
to manage air quality, but recently the emphasis has been placed on �exible ap-
proaches, market-based programs such as Cap and Trade. Since the late nineties,
emissions of air pollutants have decreased as well. Despite this progress, the inten-
sity of air pollution (emissions per unit of GDP) is rather high compared to the
rest of the OECD countries (Figure 1.2). Inspection activities of compliance rates
with regulations as well as better inter-regional cooperation lack sometimes. For in-
dustry, this policy is rather restrictive and sometimes leads to high additional costs
(Greenstone, 2002).
Europe Most ambitious laws were decided in the late nineties at the Euro-
pean Union (EU) level, especially for long-term management of air pollution, water
pollution and industrial pollution. As regards air pollution, generally, the law es-
tablished upper limits for various air pollutants to ensure that ambient air quality
was in line with the recommendations of the World Health Organization. Thus,
the Framework Directive on air quality in 1996 set out general principles, while its
four Daughter Directives of 1999, 2000, 2002 and 2004 set threshold values for each
concerned pollutant, by adopting an approach based on the estimated (or observed)
e¤ects of pollution on health and/or environment. However, the Large Combustion
Plant Directive (LCPD) of 2001 on Large Combustion Plants which aims to reduce
sulfur dioxide emissions and nitrogen oxides from existing combustion plants and

Comparative Analysis of Environmental Policies 36
Figure 1.2: Changes in air pollutants emissions for OECD countries (kg / GDP atconstant 2000 prices).
the 2001/81/EC Directive on the National Emission Ceilings (NEC), which aims to
limit emissions of acidifying and eutrophic pollutants and ozone precursors (SO2,
NOx, VOC (Volatile Organic Compounds) and NH3 (ammonia)), set emission stan-
dards taking into account their technological and economic feasibility, in order to
achieve the quality standards of ambient air established by the Framework Directive
and its four Daughter Directives.
From an operational point of view, since the nineties, national and European
policy makers have opted for more �exible instruments such as environmental taxes
or tradable permits. The particular objective is to reduce the costs imposed by
regulatory instruments, and in this way �ght the problems related to the imple-
mentation of EU environmental policy that lasted until the late nineties. Thus,
during these years, a signi�cant gap has subsisted between regulation in theory and
Comparative Analysis of Environmental Policies 37
in practice, mainly because of the technical di¢ culties encountered in the decision
making at the supranational level and the application of laws within each country.
Indeed, the European environmental policy is often done in two stages. Initially,
the Council and the European Parliament jointly adopt environmental laws in the
form of directives, while in the second phase the governments are responsible for the
formal transposition of these laws and their implementation at national levels, and
the choice of methods to achieve the objectives set at the European level. Under the
Daughter Directives for example, the European policy gives member countries the
ability to choose the method and the possibility of setting more stringent standards
or even to apply them to other pollutants apparently not concerned. Although the
directives apply to all Member States, involving a long-run convergence of their
environmental policies, some countries such as the Scandinavian ones for example,
sometimes implement even more stringent measures, thus leading to a somewhat
heterogeneity of regulations within the European Union2.
France In France, while amending the Act of 19 December 1917 on classi�ed
installations, Law No. 61-842 of 2 August 1961 on the prevention of air pollution
and odors is the starting point of the legislative framework of the air regulation in
France before its repeal by Law No. 2006-686 of 13 June 2006. Law No. 61-842
establishes the reduction of pollutant emissions from stationary sources. But it was
especially in 1976 that was adopted the law which would become at the core of the
legal provision of prevention of risks and pollution generated by industrial activities.
Thus, this law No. 76-663 of July 19 on the Classi�ed Installations for the Protection
of the Environment aims to limit damages from installations which are a major
source of air pollutants (sulfur dioxide, nitrogen oxides, hydrocarbons...), through
2Sweden, for example, banned the use of TCE (Trichloroethylene), while the EU did not.

Comparative Analysis of Environmental Policies 38
a system of prescription of emission limit values and a system of monitoring of the
e¤ects on ambient air quality. Later, this law also in�uenced the European IPPC
Directive (see below). More recently, the Framework Law on Air and Rational Use
of Energy from 30 December 1996 (LAURE law) sets new qualitative objectives,
new monitoring requirements and implements three types of plans to reduce air
pollution. In 1999, the General Tax on Polluting activities (TGAP) was created to
replace former environmental taxes. Especially, it replaced the Para�scal Tax on
Air Pollution (TPPA), and aims to apply the polluter pays principle. However, the
rates are low and below the environmental damages the tax aims at internalizing.
The implementation of measures now bene�ts from the use of a set of regula-
tory instruments (classi�ed installations), economic instruments (taxes on polluting
activities), planning and voluntary approaches, and is subject to enhanced inspec-
tions. Controls on classi�ed installations are frequent and sanctions are dissuasive.
Consequently, air pollutant emissions per unit of GDP in France are well below the
average of OECD countries and re�ect not only the country�s economic structure,
but also the e¢ ciency of the environmental policy (Figure 1.2).
Emerging Countries
Among emerging countries, we focus on the management of air pollution in three
countries from di¤erent regions: Mexico, China and Tunisia.
Mexico Articles 110 to 116 of the General Law on Ecological Balance and
Environmental Protection constitute the legal basis for the management of air pol-
lution in Mexico. This law de�nes the powers of the various economic agents in the
prevention of pollution. Thus, the Ministry of Environment and Natural Resources
(SEMARNAT) publishes regional or local standards and veri�es the compatibility

Comparative Analysis of Environmental Policies 39
of the measures taken by states and municipalities with federal standards. A na-
tional monitoring program of air quality has been established in the largest cities in
the mid nineties. The use of economic instruments is encouraged to accompany the
system of standards already established. On the whole, these measures which have
been strengthened since the early 2000s resulted in a substantial reduction of air
pollution. However, ambient air quality standards are still too frequently exceeded.
Several industrial sectors are not subject to any regulations and inspections are fo-
cused on heavily polluting industries. As an illustration, between 1998 and 2002,
75% of inspected companies did not comply with air emission standards.
Tunisia The main sources of air pollution are energy production, industry and
transportation. However, air pollution levels were not very high in the early 2000s,
and key actions could be summarized by the introduction in the mid-nineties of three
standards de�ning the limits for some pollutants, emission limits of pollutants from
cement plants, and standards for pipe gas emissions from transport vehicles. But
without a comprehensive monitoring network, the real impact of these measures
is di¢ cult to estimate. In 2001, air pollution from industry accounted for 23.1%
of CO2 and 42.1% of SO2 emissions (Source: UNFCCC). A framework law on air
quality was adopted in 2007, which �xes emission limits to be respected by industry.
China In China, air pollution mainly comes from the coal industry (about
70-80% of SO2 emissions). Five main laws determine the legal framework for regu-
lating air pollution, and since 1996 three classes of national ambient air quality and
emission standards were established. More speci�c, national numerical objectives
for reducing emissions (e.g. -20% for industrial dust) are set. But the problem is
that the objectives of ambient air quality and emissions reduction do not coincide,

Comparative Analysis of Environmental Policies 40
because the reduction targets are insu¢ cient. The �ve-year plans also incorporate
energy policy objectives focused on energy e¢ ciency. The fact remains that emis-
sions of major air pollutants remain above the average of OECD countries (2.9 times
for SO2), and that China�s energy intensity per unit of GDP is 20% higher than the
OECD average (but close to that of the United States). Charges, in use since 1979,
have not provided incentives for industry, as they were too low, but they were modi-
�ed in 2003. The establishment of an emission trading system, mainly in the case of
SO2, has been studied since the late nineties. Finally, laws are not enforced strictly
enough.
Transition Countries3
In the Central and Eastern Europe countries (CEECs) members or candidates
to the European Union, since 1995, e¤orts in economic policy in general and envi-
ronmental policy in particular have been largely guided by the requirements of the
accession process4. Thus, these countries had to harmonize their legislation with
that of the EU at a high cost price. Regarding air pollution, the introduction of
technological innovations and a more e¢ cient management have contributed to an
improvement of air quality. In the countries of the Commonwealth of Independent
States, the various instruments used for the management of air pollution are not
e¢ cient5. Legislation is inadequate, the fees are too low to induce a change in com-
3According to several commonly accepted de�nitions, the term "transition countries" refersin our work to the countries where a planned socialist economic system prevailed until 1990, andwhich prompted a subsequent transition to democracy and a market economy.
4CEECs include the ten countries of Eastern Europe (Bulgaria, Estonia, Hungary, Latvia,Lithuania, Poland, Romania, Slovakia, Slovenia, Czech Republic) now members of the Euro-pean Union, and six countries of South Eastern Europe candidates for entry into the EU (Alba-nia, Bosnia-Herzegovina, Croatia, Former Yugoslav Republic of Macedonia, Montenegro, Serbia).While Croatia and Macedonia are o¢ cial candidates respectively since June 2004 and Decem-ber 2005, Albania, Bosnia-Herzegovina and the Former Yugoslav Republic of Macedonia are stillconsidered as potential candidates in 2009.
5Armenia, Azerbaijan, Belarus, Georgia, Kazakhstan, Kyrgyzstan, Moldova, Uzbekistan, Rus-

Comparative Analysis of Environmental Policies 41
panies�behavior, and standards are too stringent to be met. Thus, industry does
not face real constraints.
Developing Countries
Finally, in African, Asian and Latin American developing countries, environmen-
tal policies have begun to soar since the nineties. In Africa, during the late nineties,
laws and standards to govern the air quality are enacted, and many African countries
are trying to apply the polluter pays principle. But the vision is too sectoral and
source of inconsistencies. Moreover, countries face a technical, human and �nancial
failure to enforce regulations or to implement sanctions against violators. Natural
resources continue to be exploited without e¤ective control, no penalty being set
against polluters and polluting industries bene�tting only from very weak �nancial
and �scal incentives to make them comply with de�ned standards. In Senegal, for
example, measures to control air emissions date from 2003, and they are still not
properly implemented. For other legal texts, no decrees have been issued yet to
implement them.
Most developing countries in Asia also established environmental legislation in
the early nineties. For some (Pakistan, Philippines), it was relatively sophisticated,
while for others (Bhutan and other South Paci�c countries) it remained rudimen-
tary. The conventional environmental problems such as air quality were fairly well
understood, but the laws remained theoretical and were not re�ected in regulations
or decrees detailing the implementation of environmental protection.
In the developing countries of Latin America, mainly countries of Central Amer-
ica, environment legislative and regulatory frameworks have been established in the
second half of the nineties. But, like other developing countries, those of Latin
sia, Tajikistan, Turkmenistan, Ukraine.

Comparative Analysis of Environmental Policies 42
America su¤er from multiple inconsistencies and inadequacies of the laws and the
di¢ culty of establishing measures. In Honduras, for example, there is no real regula-
tion on air pollutants emissions. In Guatemala also, major de�ciencies are observed
about the air regulation.
2.1.2 Water pollution
Water pollution is mainly due to human activities, basically agricultural (fertilizers,
pesticides), industrial and urban ones. According to the United Nations Program for
Environment (UNEP), about two billion tons of polluted water-comprising waste-
water and water contaminated by industrial wastes and pesticides are discharged
every day, worldwide. They contribute to the spread of disease and destruction of
ecosystems. Like the �ght against air pollution, the prevention of water pollution
has been a major concern of countries�environmental policies.
Developed countries
The United States The general awareness about the need to control this
resource led to the enactment of the Federal Water Pollution Control Act Amend-
ments in 1972, which, since its amendment in 1977, has been commonly called the
Clean Water Act. This Act also marked a signi�cant change in the history of en-
vironmental policy in the United States by going much further than the previously
existing laws. It regulates the discharge of pollutants into the United States waters
by establishing standards and control programs established by the EPA. Since then,
any discharge into navigable waters coming from industrial plants, agricultural and
even governmental requires prior possession of a permit granted by the EPA or by
some states administrations. The Act thus imposes new standards, a tradable per-
mit system to ensure its enforcement as well as heavy penalties. It also creates a

Comparative Analysis of Environmental Policies 43
system of subsidies for the construction of wastewater treatment plants. Discharges
from industrial point sources are regulated under the Law on Water Quality. In-
creasingly, the application of the polluter pays principle is reinforced. Despite these
stringent measures, the intensity of water use (per unit of GDP) is higher by almost
70% above the average of OECD countries, and several cases of non-compliance with
the polluter pays principle are listed.
Europe European water legislation was also set early, in the mid-seventies.
For thirty years, the EU has adopted legislation to �ght comprehensively the dump-
ing of polluting substances in water, but also more precisely by de�ning standards
for certain areas and speci�c uses. This profusion of texts which made the Euro-
pean Water Policy inconspicuous after all, �nally gave rise in October 2000 to the
2000/60/EC Directive. This Framework Directive will thus complete the thirty Eu-
ropean directives already in force in the �eld of water, establishing a clearer and
more e¤ective water framework for Community. Following the French law 64-1245,
this directive establishes a management and a protection of water resources based
on large hydraulics river basins6. It includes in particular the gradual phasing out
of discharges of some dangerous pollutants within a period of twenty years and has
the ultimate goal of restoring a good level of ecological status in 2015. Industries
must comply with emission limits and are required to treat their sewage.
France The �rst important text on the management of water resources in
France has been the Law 64-1245 of December 16, 1964. Although this law has un-
dergone several amendments, it has been the main basis for water policy in France
for nearly forty years, until its abrogation by Article 2 of Decree No. 2007-1357 of
6See Section 2.1.2 below.

Comparative Analysis of Environmental Policies 44
14 September 2007. It has also organized water management in six hydrographic
river basins following the natural watershed and created river basin agencies (which
became water agencies by the 1992 law) whose particular mission is to �ght against
industrial water pollution by charging water users fees under the polluter pays princi-
ple. Moreover, it introduces an important criminal element against polluters. Thus,
this law organizes a comprehensive water management in France by implementing
a preventive, incentive and punitive regulation. As noted above, it inspired the Eu-
ropean Framework Directive of 2000. Two other laws have marked the legislative
framework of water policy in France and also a¤ected industries:
- Law No. 92-3 of January 3, 1992: called "water law", this law, conceived
under the 1991 EU Directive on urban waste water revives the water policy by
generalizing the puri�cation of this resource. It establishes the overall planning
of water by creating new water management instruments, the Water Management
and Development Top Scheme (SDAGE) and Water Management and Development
Scheme (SAGE). Finally, it establishes a system of declarations and permits for all
facilities and activities having impact on water, and strengthens the role of the water
police.
- Law No. 2006-1772 on water and aquatic environments, enacted December 30,
2006: after a phase of consultation and debate for almost two years, the targets set
by the European Framework Directive of October 2000 concerning water regulation
made this act necessary7. Its primary mission is to provide all water stakeholders
the tools to achieve the objectives of good ecological status set by the European
Framework Directive. This law has introduced the fee for nonpoint source pollu-
tion perceived by Water Agencies as of 1st January 2008, replacing the TGAP on
7As for the rest of the European Union countries, the environmental policy of France is stronglytied to that of the European Union. Today, some 70% of French environmental legislation is of EUorigin.

Comparative Analysis of Environmental Policies 45
pesticides.
Thus, integrated river basin management in France is e¤ective, especially for
treating problems of industrial pollution. The measures implemented in application
of the polluter pays principle, are strict and reinforced, and thus lead to a continuous
decrease of industrial pollution in rivers, despite an occasional dubious e¢ cacy of
the water police.
Emerging countries
Mexico Since 1995, Mexico has greatly improved its water policy, and in 2000
it achieved the objectives set by the National Water Plan 1995-2000 on access to
water distribution, sanitation services and treatment of wastewater. In the early
2000s, the decentralization of water management has encouraged 27 states to pass
their own state water law, and the most important federal water programs have
been increasingly devolved to the states. Industries must meet discharge limits and
implement the treatment of their discharges. But these limits are less stringent
than those applied in most other OECD countries for example, and are not always
respected, while industrial discharges are largely untreated. Moreover, in case of non
compliance, very high �nes are not recovered. E¤orts have been made to internalize
environmental externalities through the use of market instruments. Mexico has
established a system of water abstraction charges and water pollution charges. The
industry must also deal with water rates, higher than those for households. The law,
concessions and permits enforcement as well as the collection of water abstraction
and pollution charges have been strengthened over the various plans; the number
of inspections having increased in most sectors of the industry. Thus, for the �rst
time in 2002, the decision was made to close down one of Mexico�s largest paper

Comparative Analysis of Environmental Policies 46
industries for not complying with pollutant limits in its wastewater discharges. But
in order to make these measures fully e¤ective and profoundly alter the behavior of
industry, they should be more respected and strengthened.
Tunisia In Tunisia, the sanitation and the prevention of water pollution has
long been a priority of environmental policy, because of the vulnerability of water
resources of the country. Thus, the �rst water master plan was implemented in 1970.
Since then, the standards regulating industrial water pollution are well developed,
but the use of economic and �nancial instruments is still very brief. The polluter
pays principle is not �rmly established, the polluting sectors do not internalize the
costs they generate and therefore do not change their production habits. Similarly,
penalties are too weak to induce behavioral change. As for air pollution manage-
ment, the private sector and industries show lack of involvement in the process of
water resources management.
China Water management holds a major position in China�s overall environ-
mental priorities. The legal framework for water in China is therefore complete,
including the 2002 law which opens the way for integrated water management and
stakeholder participation and initiates the use of market instruments. The laws are
implemented together with regulatory provisions and supplemented by decrees. But
their implementation at the provincial level can result in regional disparities. Re-
garding industry, the emissions are a major cause of watercourse pollution. Since
the early years of 2000, China has focused its e¤orts on major polluting industries,
and considerable progress has been made. But as for air, compliance monitoring is
not coordinated between the di¤erent environmental authorities and therefore lacks
e¤ectiveness. Furthermore, the levy system which applies only to pollution from

Comparative Analysis of Environmental Policies 47
industrial sources is a way to implement the polluter pays principle.
Since 1993, these fees cover all discharges, but they are relatively ine¤ective and
not binding for the industry as their rate is much lower than the abatement cost. In
addition, small companies can overlook these charges because they are not pursued
by Local Environmental Protection Bureaus, although they are generally more pol-
lution intensive. The water price for industrial use is relatively high; however the
e¢ ciency of water use by industry is very low. Finally, the issuance of discharge
permits on the basis of national concentration standards and a total load allowance
opens the way for trading of pollution allowances.
Transition countries
In most CEE countries, water legislation has been revised in accordance with the
requirements of EU directives and improvements have been observed in the early
2000s. The countries apply emissions standards and have included royalties in line
with the polluter pays principle, and control systems are put in place. In the CIS
countries, water policy was ine¤ective until the year 2003. It then improved with
the introduction of better institutional and legislative framework, but it remains
low, with inappropriate actions and very little reinforcement.
Developing countries
In developing countries, drawbacks in water management policies are similar to
those of air pollution management policies. Water resources management su¤ers
from legislative, �nancial and institutional de�ciencies. In Senegal, the 2001 mea-
sures relating to e uents are not yet implemented. Industrial activity remains an
important source of marine pollution. It is the same in Nigeria, where the industrial
water pollution is inadequately controlled because of outdated regulation. This is

Comparative Analysis of Environmental Policies 48
exacerbated both by the low penalties applied to polluters as well as by the lack
of incentives to pollute less. In Asian developing countries, water pollution is a
major problem that persists because of poor governance and weak regulation. In
most countries, industrial wastewater for example is not treated. In the developing
countries of Latin America too, water regulations are as inadequate as those for air.
In Honduras, e.g., industrial e uents are almost untreated.
2.1.3 Other regulations
As we have just seen, air and water management policies all contain provisions that
directly a¤ect industries. In many countries, industries are moreover the subject of
speci�c measures. In Europe, they have been regulated by 96/61/EC Directive on
the integrated prevention and reduction of pollution (Integrated Pollution Preven-
tion and Control), which was adopted in 1996 to reduce the impact of industries on
the environment, as a signi�cant portion of the pollution observed in Europe was
assigned to them. This directive establishes a framework for integrated control of
emissions of certain industrial activities in the air, water and soil, through a licensing
system based on the use of best available techniques (BAT). The European IPPC
Directive thus provides a common framework for the delivery of permits to the po-
tentially highly polluting plants and for their control throughout the EU. It initially
concerned some 50 000 plants, especially in the chemicals, energy, metallurgy, waste
management and intensive farming sectors. Having undergone several changes, the
IPPC Directive 96/61/EC was replaced by Directive 2008/1/EC, but due to the high
pressure that it imposes on the industry sector, some Member States must redouble
their e¤orts to enforce it. Thus, to manage the problem of industrial emissions,
the EU has applied a dual approach, on the one hand adopting sectoral directives
such as LCPD Directive and the Directive on the incineration of waste that set

Comparative Analysis of Environmental Policies 49
standards and obligations for speci�c sectors, and on the other hand the IPPC Di-
rective which is a transversal instrument controlling emissions from most industrial
activities. In some emerging countries, voluntary approaches are encouraged in the
industry and cover all types of industrial pollution. In Mexico for instance, clean
industry certi�cates are issued on the basis of voluntary audits.
Other more recent laws also a¤ect industries, such as measures against indus-
trial waste. These measures appeared in the U.S. and Europe in the late seventies,
while in most developing countries the issue treatment of hazardous waste is critical
due to the lack of resources. Finally, it is worth noting that alongside all these
local rules, countries often entered international commitments by participating in
global environmental agreements or multilateral agreements consistent with their lo-
cal pollution management policies. In contrast, the decisions are mainly multilateral
as regards global pollution.
2.2 Global pollution and the prevention of climate change
2.2.1 De�nitions
Climate change and global warming is the major phenomenon of global pollution
since the end of the last century. It corresponds to the increase in worldwide average
temperature of oceans and air, observed over several years, and mainly attributed
to the intensi�cation of the greenhouse e¤ect.
The greenhouse e¤ect is "a natural phenomenon through which the earth�s at-
mosphere holds the heat emitted by our planet which is heated by the sun: the
average temperature of the Earth results from the balance between the radiation
�ux that comes from the sun and the infrared radiation �ux sent back in space�
(Beaumais and Chiroleu-Assouline, 2002). Greenhouse gases (GHG), mainly wa-
ter vapor, carbon dioxide (CO2), methane (CH4), and nitrous oxide (N2O) absorb

Comparative Analysis of Environmental Policies 50
the radiation emitted by the Earth, thus warming the atmosphere. Without these
greenhouse gases, the average temperature on Earth would be about -18�C. But
it is the increase in atmospheric concentrations of greenhouse gases from human
activities which is incriminated in the phenomenon of global warming. The latest
report of the Intergovernmental Panel on climate change (IPCC) published in 2007,
shows that 49 billion tons of CO2 are emitted annually by human activities, of which
25.9% are emitted by energy sector, 19.4% by industry, 17.4% by forestry, 13.5%
by agriculture and 13.1% by transport. According to these experts, the probability
that global warming is due to human activity is greater than 90%.
If not controlled, the dreaded consequences of this mechanism are the loss of some
coastal areas due to the melting of ice and the warming of oceans causing the rise of
seas level, or the risk of famine and the spread of disease. To �ght the greenhouse
e¤ect and prevent the climate change, an international action was initiated since the
nineties, which was realized in particular through the implementation of the Kyoto
Protocol.
2.2.2 The Kyoto Protocol
During the Earth Summit in Rio in June 1992, the Framework Convention on Cli-
mate Change was signed by 178 States and the European Union. Its main objective,
as de�ned in Article 2, is to stabilize greenhouse gas emissions, by putting the de-
veloped countries under the obligation to bring back individually or jointly their
carbon dioxide emissions and other greenhouse gases to their 1990 level. The frame-
work agreement also provides that its executive organ, namely the Conference of the
Parties, shall consider whether the decided commitments are appropriate in view of
the state of scienti�c knowledge, and that it shall �x new commitments through
amendments or protocols. Thus, in 1995, the Conference of the Parties considered
Comparative Analysis of Environmental Policies 51
that the Rio commitments were insu¢ cient, and began to prepare for the adoption
of a more ambitious and binding protocol. After more than two years of negotia-
tions, the Kyoto Protocol was adopted on December 11, 1997. It entered into force
on February 16, 2005, after the rati�cation of Russia.
Annex I Parties
The objectives of the Kyoto Protocol are quanti�ed and legally binding for the
Annex I developed and transition countries (these objectives are listed in Appendix
B of the Kyoto Protocol. See Table 3). They consist in a reduction of six greenhouse
gases emissions (CO2, CH4, N2O, HFCs, PFCs and SF6, Appendix A of the Protocol)
of at least 5% compared to 1990 levels during the 2008-2012 commitment period.
Thus, the European Union and most of the countries of Central and Eastern Europe
have committed to reduce their greenhouse gas emissions by 8%, U.S. by 7%, Japan
6%, while Norway, Iceland and Australia have won the right to raise them. The EU
then proceeded to the sharing of the load of this target among the �fteen member
countries according to their 1990 emission levels and also according to demographic
and economic criteria. Finally, Germany target is for a 21% reduction, while France
must stabilize its emissions (0%). However, Parties are free to implement national
policies and adopt measures that will enable them to reach these thresholds.
United States In 2010, the United States are the only Annex I country which
has not yet rati�ed the Kyoto Protocol, under the pressure of some industrial sec-
tors invoking the impact on the competitiveness of U.S. companies. However, they
remain attached to the United Nations Framework Conference on Climate Change.
But since the measures taken were not stringent enough, in 2000 the target of re-
ducing their emissions to 1990 levels was not reached. The new US target was

Comparative Analysis of Environmental Policies 52
an 18% reduction of greenhouse gas emissions intensity by 2012, and to do so the
United States implemented a series of voluntary programs and incentives, mainly
focused on the search for technological innovations. Companies therefore encounter
no strong incentives to reduce their emissions, and have no real obligations. How-
ever, some states such as California, the Connecticut and the Massachusetts, have
taken the initiative to have a stricter policy than that imposed by Federal law, and
thus introduce an intra-national heterogeneity.
European Union The European Union launched in 2000 its European pro-
gram on Climate Change (CCAP), which established the European Union Emission
Trading System. Entered in force in 2005, it aims to reduce emissions of greenhouse
gases of speci�c industrial sectors (ferrous metals, mineral industry, paper and card-
board), thus covering approximately 40% of European CO2 emissions. In principle,
the system encourages concerned �rms to be less polluting and to produce more
e¢ ciently (see sections 1.2.2. and 1.3), but it has been criticized for its too generous
permits allocation method, which ultimately did not involve substantial behavioral
changes nor emissions reductions. Indeed, these quotas being freely allocated to
companies, and their level most often based on optimistic forecasts of economic
growth, industry did not have to provide much e¤ort. The European Union rein-
forced these measures in 2008 through the Energy-Climate Plan Package. Within
the EU, other countries had already taken their own initiatives, some have adopted
national systems of emissions permits (Denmark in 2001, the United Kingdom in
2002), and others put in place tax systems (Sweden in 1991, the United Kingdom
in 2001).

Comparative Analysis of Environmental Policies 53
France In order to honor its international commitments, France set up in 2000
the National Program to Combat Climate Change (PNLCC) containing measures
related to the construction, industry and transport sectors. In 2004, the Climate
Plan included measures a¤ecting all sectors of the economy. Following the Grenelle
Environment Forum in 2007, the introduction of a carbon tax in France in addition
to the European Emission Trading System was discussed at some length, and in
March 2010 this project was postponed inde�nitely because of the fear that French
industries become less competitive than imports from countries that do not bear a
similar tax. In other countries where a tax is applied, the e¢ ciency of this instrument
is often altered by exemptions and refunds.
Transition countries The limits imposed by the Kyoto Protocol for the tran-
sition countries of Annex I, although theoretically binding, may not have much
impact on the industries in these countries. Indeed, these limits were set in rela-
tion to the 1990 year baseline, after which countries such as Russia and Ukraine
have experienced a sharp decline in their economic and industrial activity due to
the collapse of the Soviet regime. Industrial emissions dropped considerably with-
out having the industries being encouraged to do so, which suggests they have not
changed their behavior. Moreover, these countries may not need the total amount of
quotas that has been allocated to them. They will try to sell them, thereby weighing
down the international price of permits. Thus, the intensity of the constraint faced
by a country and its industry through an emission trading system is strongly linked
to the operating conditions of the permit market.
Non-Annex I Parties
Non-Annex I countries (CEEC non-Annex I, CIS countries, emerging and devel-
Comparative Analysis of Environmental Policies 54
oping countries) have not committed to quanti�ed reduction targets. This is the
second reason given by the United States to justify their refusal to ratify the Kyoto
Protocol, especially referring to emerging countries such as India, Brazil or China.
Some of these countries have nevertheless implemented measures to control their
emissions. However, they remain more lenient than those of Annex I Parties. The
conference in Copenhagen in December 2009, which should have been an opportu-
nity for countries that had rati�ed the Convention to renegotiate a new international
climate agreement replacing the Kyoto Protocol, resulted in an agreement designed
to limit and reduce greenhouse gases for keeping temperature rises to no more than
2�C. This agreement was quali�ed as "the �rst global agreement," because for the
�rst time, it involved all major polluting countries, both industrialized and emerg-
ing. Although the agreement is not legally binding and does not set deadlines or
quantitative targets, countries such as Brazil and South Africa have adopted a proac-
tive approach in providing a reduction of emissions by about 40% and 34% by 2020,
respectively.
We should note that in addition to their national policies, the Parties may also
use three �exibility mechanisms that have been de�ned under the Kyoto Protocol,
to reduce emissions at a lower cost:
- Emission permits: provide opportunities for industrialized countries to buy or
sell emission rights.
- Joint Implementation: this mechanism allows Annex I Parties to earn emission
reduction units by investing in projects in other Annex I Parties, most of which
happen to be countries of Central and Eastern Europe.
- The Clean Development Mechanism: is similar to the Joint Implementation but
only concerns projects undertaken by Annex I countries in Non-Annex I countries.

Comparative Analysis of Environmental Policies 55
Conclusion
In this chapter, we attempted to examine the heterogeneity of environmental policies
around the world, since it is a necessary condition for the emergence of the pollution
haven hypothesis. This analysis was conducted in the light of the previous theoreti-
cal study of environmental policy instruments. Given that the environmental policy
of a country is not necessarily homogeneous and depends on the environmental risk
involved, we focused on air and water policies. The management of air and water
pollution was the �rst top priority of environmental policies and remains essential
today in most countries. For some countries, our detailed analysis has indeed re-
vealed small disparities between air and water regulations. In Tunisia, for example,
priority is given to water policy which is more developed and more restricting for
companies. However, in most cases, the implementation of measures, much tied to
the institutional level of countries, is rather homogeneous within the same country
for all types of pollutions. The results of our analysis thus show clear di¤erences
between countries at di¤erent levels of development, as well as similar but distinct
characteristics in countries belonging to the same group. As a whole, the developed
countries have implemented their policies since the seventies and strengthened them
in the nineties, culminating today in strong policies, illustrated by the adoption of
stricter but consistent laws and by the use of various and e¢ cient instruments. E¤ec-
tive implementation of strict measures, especially through market-based instruments
which encourage innovation, can thus provide a technological advance to �rms from
these countries and confer them a comparative advantage. But they must also face
environmental costs that may a¤ect their competitiveness. In contrast, emerging
and transition countries have begun to address environmental issues in the nineties,
and have been successfully since then have been able to develop legislative and insti-

Comparative Analysis of Environmental Policies 56
tutional frameworks promising a satisfactory environmental management. However,
in emerging countries, the use of market instruments remains insu¢ cient, while the
heavy use of subsidies tends to attract polluting industries. In transition countries,
the Central and Eastern Europe countries have had an accelerated pace of reform
since the early nineties, whereas the CIS countries have started reforms much later
in the middle of the decade. Progress in CEEC is much higher than that in CIS
countries. In emerging countries as well as in transition ones, �rms are likely to
encounter stricter regulations soon. But now, they bene�t from some �exibility. Fi-
nally, developing countries have begun to worry about the environment in the early
nineties, and most of them have undertaken reform measures in the second half of
the decade. However, because of the lack of technical, human and �nancial means
still preventing the implementation of these measures, �rms in these countries are
not subject to constraints and are not limited in the amount of pollution emitted.
These disparities in the management of local pollution remain valid if one con-
siders the management of a global pollution problem such as the global warming.
The developed countries and some CEE countries have quanti�ed targets, and have,
to some extent, taken measures consistent with these objectives. Having not binding
targets, the emerging and developing countries have undertaken much less stringent
actions.
This analysis has thus highlighted the emergence of di¤erentiated environmental
policies between groups of countries over time, in addition to the individual charac-
teristics of each country. In developed countries, the regulation provides elements of
�exibility but is relatively strict for industries. Theoretically, the increased produc-
tion costs can lead to reduced exports, increased imports and a shift of industries
to the less regulated countries. Emerging countries and CEE countries are not com-

Comparative Analysis of Environmental Policies 57
pletely homogeneous regions, but in spite of their speci�city, these countries face
common challenges such as ambitious but insu¢ ciently enforced regulations, there-
fore not excessively burdensome for industry. Developing countries, in their turn,
still su¤er from a real lack of environmental policies. This heterogeneous develop-
ment between countries and the impact of the compliance costs of environmental
reforms have provoked intense debate, and still give rise to protests during interna-
tional trade negotiations, as we shall develop in the next chapter.

Comparative Analysis of Environmental Policies 58
Appendix 1
1.A Kyoto Protocol�s Annex B
Table 1.3: Annex B to the Kyoto Protocol: Emission Limi-tation or Reduction Commitments
Country Pourcentage ofBase Year
Australia 108Austria 92Belgium 92Bulgaria 92Canada 94Croatia 95Czech Republic 92Denmark 92Estonia 92European Community 92Finland 92France 92Germany 92Greece 92Hungary 94Iceland 110Ireland 92Italy 92Japan 94Latvia 92Liechtenstein 92Lithuania 92Luxemborg 92Monaco 92Netherlands 92New Zealand 100Norway 101Poland 94Portugal 92Romania 92Russian Federation 100Slovakia 92Slovenia 92Spain 92

Comparative Analysis of Environmental Policies 59
Sweden 92Switzerland 92Ukraine 100United Kingdom 92USA 92

Comparative Analysis of Environmental Policies 60

Chapter 2
Environmental Regulation andInternational Issues: the Impacton Location Choices
Introduction
The environment was considered as an international issue for the �rst time at the
United Nations Conference on Human Environment held in Stockholm in 1972. The
objective of this innovative conference was to initiate international cooperation for
the improvement of living conditions, by boldly trying to link development and
environment. This conference thus marked the beginning of a dialogue between
industrialized and developing countries, and gave birth to the United Nations Envi-
ronment Programme (UNEP). After the conference, the environment was integrated
as a political priority by many governments, culminating in the creation of hundreds
of environmental ministries throughout the world, particularly in the most devel-
oped countries1. While Stockholm conference has been considered retrospectively as
the �rst Earth Summit, the United Nations Conference on Environment and Devel-
opment, held in Rio in June 1992, constitutes the real starting point of international
1Cf Chapitre 1.
61

Environmental Regulation and Location Choice 62
awareness about environmental problems. Indeed, during the twenty years separat-
ing these two international events, the environment has been subjected to strong
pressures, exacerbated by global catastrophes such as Bhopal chemical disaster in
India (1984), the explosion of the Chernobyl Nuclear Power Plant in Ukraine (1986),
and the grounding of the tanker Exxon Valdez on the coast of Alaska in 1989. The
interdependence between development and environment thus became evident, and
the Rio Summit helped to establish the concept of sustainable development which
was de�ned in the Brundtland report (prepared in 1987 by the World Commis-
sion on Environment and Development) as follows: " Sustainable development is
development that meets the needs of the present without compromising the abil-
ity of future generations to meet their own needs". Besides this breakthrough, the
main achievements of the summit were the adoption of the Convention on Climate
Change, ultimately coming out with the famous Kyoto Protocol and the adoption
of the Convention on Biological Diversity.
This global awareness gave rise to environmental questions during international
trade negotiations. This trend was initiated in 1992 with the rati�cation of the North
American Free Trade Agreement (NAFTA) between the United States, Canada and
Mexico. It was intensi�ed by the creation of the World Trade Organization (WTO)
in 1995 and its decision to prepare reports over trade and the environment. From
that time, a close relationship was established between environment and interna-
tional trade, rapidly raising the question of the environmental consequences of trade
liberalization, which still remains a controversial issue.
The main participants involved in this debate are advocates of free trade, envi-
ronmentalists, and industrialists, each alleging some kind of distortion caused by the
trade-environment relationship. In fact, all concerns are directly linked to the as-
Environmental Regulation and Location Choice 63
sumption that interjurisdictional di¤erences in environmental regulatory stringency
a¤ect industries. This assumption, which is referred to as the pollution heaven hy-
pothesis, has been at the heart of a large amount of theoretical as well as empirical
literature. Theoretical investigations of this hypothesis have been conducted by
Pethig (1976), Baumol and Oates (1988), Copeland and Taylor (1994), who all �nd
theoretical support to a negative impact of environmental stringency on the pattern
of trade. In spite of these strong theoretical foundations, early empirical analyses
attempting to assess the pollution haven hypothesis concluded that environmental
regulations do not really matter (Kalt, 1988; Tobey, 1990, Ja¤e et al., 1995). More
recently, some researchers have demonstrated that environmental policy has a more
signi�cant e¤ect on trade and investment �ows (Ederington and Minier, 2003; Cole
et al., 2006). This discrepancy between theoretical results and empirical evidence
may be due to a poor theoretical framework, or incorrect empirical implementation.
Our objective in this chapter is to explore the theoretical side, while empiri-
cal issues will be examined in the following chapters. Indeed, most of theoretical
papers in related literature use a traditional Heckscher-Ohlin framework based on
perfect competition and focusing on the heterogeneity of environmental regulations
between countries. Di¤erent market structures that may be more adapted to real
conditions have not been su¢ ciently investigated, while other determining factors
like market potential or corruption have been neglected. We attempt to overcome
these shortcomings by developing an economic geography model that takes into
account industrial agglomeration and in which environmental aspect is introduced
in addition to other con�icting factors. We wish to depict more robust theoretical
predictions this way, and to derive a clear speci�cation that would be easily testable.
The chapter is organized as follows. In Section 1 we explain the concerns related

Environmental Regulation and Location Choice 64
to the growing interdependence of trade and environmental policies, and give a
review of the major papers in this �eld. Section 2 will be devoted to a detailed
presentation of the pollution haven hypothesis. Section 3 surveys and discusses
theoretical foundations and empirical works in related literature. Finally, in Section
4 we derive a theoretical model highlighting the pollution haven hypothesis.
1 Trade and environmental policies
1.1 A controversial relationship
As trade agreements were signed, the e¤ects of increasing world trade on the environ-
ment were feared and raised protests. The interdependence of trade and environment
has thus given rise to diverging opinions between the various parties. While industri-
alists worry that stricter regulation a¤ects their competitiveness, environmentalists
fear that freer trade leads to an increase in pollution, particularly in developing
countries, following from an increase in the scale of economic activity or a change in
the economic structure of the country. They also fear that trade considerations pre-
vent countries from setting adequate regulations or, worse, that they lead developed
countries to voluntarily weaken their standards in order to attract foreign �rms, as
predicted by the race to the bottom hypothesis (see Box 1). Therefore, environ-
mentalists have called for expanding international trade agreements such as WTO
or NAFTA to include cooperation over domestic policies, especially to harmonize
domestic environmental policies. Environmentalists�protests were shared by free
trade advocates who worry that countries use environmental regulation as a barrier
to trade, in order to limit imports. Indeed, the argument is that as trade agreements
commit the signatory countries to their trade policy, countries that pursue protec-
tionism objectives, to o¤er their local industries a competitive advantage over foreign
Environmental Regulation and Location Choice 65
�rms, to protect a particular sector and defend the interests of pressure groups, or
to maintain and improve their terms of trade, would use a more lax environmental
policy in order to circumvent these trade agreements. These objections led the
United States to require, through a Presidential Executive Order, in 1999, that U.S.
agencies conduct quantitative assessments of the environmental e¤ects of free trade
agreements. Coughlin (2002) notes that at the same time, an opinion survey showed
that 67% of respondents thought that the absence of environmental regulatory har-
monization would incite U.S. �rms to relocate in less strict countries, threatening
U.S. jobs as well as environmental quality in developing countries. Fontagné et
al. (2005) note that up to 2004, nine environmentally-related trade disputes were
recorded under the General Agreement on Tari¤s and Trade (GATT) and thereafter
the WTO. One of the most famous is the import ban on tuna from Mexico intro-
duced by U.S. government, arguing that the practice of Mexican �shermen did not
comply with U.S. Marine Mammal Protection Act.

Environmental Regulation and Location Choice 66
Box 1: The race to the bottom hypothesisThe race to the bottom hypothesis was initially developed in federal systems
like the United States where environmental responsibilities were originally de-
centralized to confer federal states �exibility to adapt to local conditions. The
failure of this system to prevent the spread of pollution from one state to an-
other, and the inability of governments to manage �rms relocation within the
country, gave rise to the hypothesis. In the late sixties, along with the race
to the bottom hypothesis, the federal agencies and laws described in Chapter
1 were created, making the shift of environmental initiative and regulatory
authority from the local level to the federal level. With the occurrence of
transboundary pollution problems and the increasing international mobility of
capital, the race to the bottom hypothesis has been applied to the supranational
level.
It stipulates that, in the face of falling tari¤ barriers with weakly regulated
countries, it is feared that industrialized countries will relax their environ-
mental regulations or even be hampered from enacting new legislation in the
name of international competitiveness. The latter case, namely preventing
environmental standards from being raised to appropriate levels because of
competitiveness concerns, is also called regulatory chill. For illustration, the
refusal to ratify the Kyoto Protocol by the United States can be considered as
an example of regulatory chill. Finally, the race to the bottom hypothesis warns
against regulatory harmonization at a suboptimal level. It has been demon-
strated by some theoretical studies, but it lacks empirical validation, and has
mostly been illustrated in literature by a few examples of laws that have never
been adopted.
Discussions on the European Union position on the genetically modi�ed organ-
isms (GMOs) issue are another illustration of this controversial debate. In 2003,
the United States, Canada and Argentina have complained to the World Trade Or-
ganization about the European moratorium on GMO approvals between 1998 and
2004. These three countries, which apply a less restrictive regulation than that of
the European Union, considered that the moratorium was a non-tari¤ protection-

Environmental Regulation and Location Choice 67
ist measure, designed to protect European agricultural sectors. After reviewing, in
2006 the WTO required the EU to lift the safeguard clauses prohibiting the import
of GMOs. In contrast, the EU justi�es its position by invoking the risks to human
health and environmental toxicity. France invoked impacts on fauna and �ora when
it decided in January 2008 to activate the safeguard clause with the European Com-
mission, on behalf of the "precautionary principle". This decision is embodied in
the suspension of the cultivation of MON810 maize in February 20082. The hostility
of public opinion to GMOs and the pressure of farmers have also played a decisive
role in the position of France and the European Union.
1.2 Theoretical assessment
Copeland (1990), by dividing protecting instruments into two classes (negotiable
and non-negotiable), shows through a two-stage game that trade liberalization in-
duces, in countries motivated to maintain trade protection, substitution toward the
less e¢ cient, non-negotiable instrument (e.g., environmental policy). The use of
environmental policy as a substitute for trade policy to protect local �rms is con-
sidered as a second best policy, the �rst best consisting of the direct manipulation
of tari¤. The work of Copeland (1990) demonstrates that in the presence of multi-
ple policy instruments, a free trade agreement that would only restrict trade policy
would be incomplete, as it is easily circumvented by governments that substitute
other instruments to trade barriers. More recently, Bagwell and Staiger (2001) and
Ederington (2001, 2002) have also been interested in this mechanism. For example,
2The concept of precautionary principle emerged for the �rst time in Germany in the latesixties. This principle was introduced into Community law by the Maastricht Treaty in 1992. It isinvoked for decision-making and action in case of uncertainty about the potential risks to humansand environment. Initially restricted to the environment, it is now extended to health. It allowspolicy makers to stop the distribution and to decide on the removal from the market of productsthat may be hazardous to the environment or to health.

Environmental Regulation and Location Choice 68
Ederington (2001) extended the work of Copeland (1990) by considering both trade
and domestic policies under symmetric limitations on cooperation, i.e. by investi-
gating cooperation in an international trade agreement when these policies are seen
both as negotiable but imperfectly substitutable instruments of protection. She ar-
gues that when limited enforcement power prevents countries from implementing an
e¢ cient set of trade and domestic policies, countries should cooperate fully over do-
mestic policy and relax trade policy to maintain the viability of the agreement. This
relationship between trade liberalization and environmental policy will be further
tested and empirically con�rmed for the �rst time by Ederington, in collaboration
with Minier (Ederington and Minier, 2003).
In addition, the use of trade policy as a substitute for environmental policy
has been investigated in some works. A �rst reason for such a manipulation is
that since trade may increase pollution, restrictions on trade can reduce pollution.
Harmonization of environmental regulations constitutes a second motive for using
trade interventions to achieve environmental goals. Strict countries should impose
restrictions on the imports of foreign goods from less restrictive countries. A good
illustration of this action is, in 2010, as French President Nicolas Sarkozy planned to
introduce a carbon tax in France, he suggested applying a carbon tax at the borders
of the European Union on goods imported from countries with less stringent laws.
A third argument is that people may want to in�uence the environmental policy
in another country. This occurs when pollution is transboundary or global, but it
can also be guided by personal beliefs or sel�sh reasons such as being in favor of
wildlife conservation in foreign countries in anticipation of a future visit. The �rst
best policy in these situations typically involves negotiations plus mechanisms of
transfers. Alternatives to negotiation are unilateral attempts to in�uence foreign

Environmental Regulation and Location Choice 69
environmental policy. Thus, a country that is large enough can use its trade policy
to in�uence the world price of a dirty good. However, such a policy would be e¤ective
only if countries coordinate their trade policies to avoid leakage issues (Copeland
and Taylor, 2004).
2 The pollution haven hypothesis
2.1 The underlying reasons
The various fears of industrialists, environmentalists and advocates of free trade
described above all stem from the same assumption: the environmental regulation
a¤ects trade and direct investment abroad. Intuitively, this statement is easily
understandable. The environmental regulation a¤ects the production costs both
directly and indirectly. Direct costs correspond, for instance, to expenses incurred
for the acquisition of a new technology or new skills, as well as to additional costs
of labor (Sterner, 1996). Indirect costs are more related to practical problems, for
example when the waste disposal sites are reduced or when the use of raw materials
is limited or prohibited. Similarly, more complex administrative procedures, such
as those required by the IPPC Directive in Europe from industrial plants for ob-
taining permits, complicate the establishment of �rms. Initial studies conducted in
the nineties on U.S. data and published by the Census Bureau, showed low indus-
try abatement costs, representing less than 2% of the value of production. These
additional costs were often claimed to be too small to a¤ect the competitiveness of
U.S. �rms. At the same time, a study by the Organization for Economic Coopera-
tion and Development (OECD, 1997) estimated that they represented between 1%
and 5% of the production costs of OECD countries, which was more signi�cant and

Environmental Regulation and Location Choice 70
cannot be neglected in situations of �erce competition between �rms and countries.
In France, a study conducted by Raspiller and Riedinger (2005) shows that sectoral
costs of environmental protection represent about 0.03% to 6.54% of the value added
by the sector. Furthermore, not only the strength but also the type of regulations is
important (Ja¤e, 1995, Nordstrom and Vaughan, 1999; Bruneau, 2004). According
to Ja¤e (1995), the impact of regulation depends on its shape (market-based in-
struments or standards). He stipulates that the regulation always raises production
costs, but, in the countries where it rather takes the form of exacting standards,
it tends to discourage more investment from foreign �rms which fear that too am-
bitious standards would leave them with just a little �exibility. Finally, it appears
that whatever the form taken by the regulation (tax, standard, requirement to use
cleaner but more expensive processes, or pollution control equipment), it generates
additional costs that may a¤ect the competitiveness of �rms and countries in a
particular sector.
However, as we have seen in the previous chapter, environmental policies have
evolved di¤erently in di¤erent periods and countries, and these di¤erences are par-
ticularly pronounced between industrialized countries and other less developed coun-
tries, mainly the developing ones. This feeds the debate on the relationship between
regulation and economic growth in an open economy, where one of the most impor-
tant aspects is the impact of environmental policy on international competitiveness
and �rms location. Indeed, under the assumption that stricter regulations raise
the costs of production, it is more pro�table for �rms to locate and produce where
regulation is the weakest, all other things being equal. In a context of regulations
heterogeneity and suppression of trade barriers, it was feared that polluting �rms
relocate from the most developed and restrictive countries to the least developed
Environmental Regulation and Location Choice 71
and least regulated ones. These arguments correspond in the economic literature to
the pollution haven hypothesis, which is central to our work.
De�nition 1 : According to the pollution haven hypothesis, it is optimal for
polluting industries to move their production capacities to countries with more lax
environmental regulation, called "pollution havens". The latter will therefore tend
to specialize in those industries for which they enjoy a comparative advantage.
Thus, the main distinction between the race to the bottom hypothesis and the
pollution haven hypothesis is that the former predicts a generalized weakening of
environmental policies worldwide, leading to a harmonization at a low level, while
the second considers heterogeneous policies, with some countries adopting relatively
strict measures but importing pollutant products from less rigorous countries.
2.2 A distinction between pollution haven hypothesis and
pollution haven e¤ect
It is noteworthy that in the literature on the pollution haven hypothesis, a distinc-
tion/confusion is sometimes made between the pollution haven hypothesis (PHH)
de�ned above, and the pollution haven e¤ect (PHE). Copeland and Taylor (2004)
expose in their work what distinction they make between these two statements.
They suggest that the PHH is a stricter version of the PHE. According to them,
the PHE stipulates that more stringent regulations marginally a¤ect trade �ows
and direct investments abroad, while PHH states that trade liberalization leads to a
shift of polluting industries from the strictest countries to the least regulated ones,
in other words from the developed countries to developing ones. Thus, according to
them, the pollution haven hypothesis is con�rmed when the pollution haven e¤ect

Environmental Regulation and Location Choice 72
is so strong that a severe regulation annihilates all other motives for trade, leading
to the relocation of polluting industries. We note here that while the PHE a¤ects
both trade �ows and FDI �ows, the PHH is intimately linked to �rms� location,
and therefore to investment �ows. This distinction made by Copeland and Taylor
was taken by some authors from the same period, using the expression of PHE to
explain that a strict environmental regulation increases the production costs of pol-
luting �rms and thus in�uences trade �ows, but that it does not change the source of
comparative advantage or the specialization of the country as it would be required
by the PHH (Ederington, 2007). Recently, some works refer solely to PHE, others
use only the term PHH while others use both terms interchangeably (Levinson and
Taylor, 2008). In the Brunnermeier and Levinson article (2004) that provides a
review of the literature on the pollution haven hypothesis, the use of both terms
suggests that the PHE is the measured e¤ect resulting from PHH. This use is also
applied by Eskeland and Harrison (2003) and He (2006), who rarely use the term
pollution haven e¤ect, which they use only to point out to the supposed e¤ect of the
pollution haven hypothesis. The same use is made by Levinson and Taylor (2008)
who, conversely, almost exclusively use the term PHE (except once) to denote the
e¤ect that results from testing the PHH, without mentioning the di¤erence between
the two terms. Finally, other studies deal with the problem of the impact of envi-
ronmental policy on FDI without using the words "e¤ect" or "hypothesis" (Keller
and Levinson, 2002; Cole et al., 2006), but only speak of pollution havens.
We understand from this analysis that the concept of pollution haven hypothesis
has evolved over time. In the nineties, at the revival of the problems generated by
the signing of free trade agreements, most studies have investigated the impact of
environmental regulations on industry without reference to any "hypothesis" (Ja¤e
Environmental Regulation and Location Choice 73
et al, 1995; Levinson, 1996; List and Co, 2000). One reason is probably that most
studies at that time were conducted on the U.S. Then, as the phenomenon has
gradually become internationalized, a growing number of studies have focused on
the environmental impact of heterogeneous policies between countries, speci�cally
between the North and the South. The Pollution Haven Hypothesis concept then
spread (Antweiler et al., 2001; Eskeland and Harrison, 2003; Smarzynska and Wei,
2004), and after that the distinction between Pollution Haven Hypothesis and Pollu-
tion Haven E¤ect appeared in the literature. This distinction probably arose because
and as a consequence of mixed results found when testing the pollution haven hy-
pothesis. Furthermore, with the exception of Grether, Mathys and de Melo (2006)
which, as far as we know, is the only reference de�ning the PHE in terms of foreign
investments and relocation of industries from North to South, a consensus seems es-
tablished to refer to the PHH when it comes to studying investment �ows3. Finally,
it seems that the fundamental hypothesis in the literature remains the pollution
haven hypothesis. Ultimately, we consider that the PHE is a nuance of the PHH
and that the PHH is the generic term to describe general issues associated with the
impact of heterogeneous environmental policies on trade and FDI in the context of
trade liberalization.
3In this case, the term industrial �ight hypothesis is also used in the literature to describe therelocation of polluting industries from the most regulated to the least regulated countries(Ja¤e etal., 1995; Dean, 2002; Brunnermeier and Levinson, 2004).

Environmental Regulation and Location Choice 74
3 Theoretical foundations and empirical results
3.1 Theoretical foundations of the pollution haven hypoth-
esis in literature
First attempts to take into account the interdependence of international trade and
environmental policy by modelling the pollution haven hypothesis occurred in the
seventies. They were based on traditional theories of international trade and as-
sumed that countries were identical except for their exogenous environmental poli-
cies. Thus, Pethig (1976) demonstrated, through the use of a Ricardian model
where pollution was taken into account, that if two countries were identical ex-
cept for their exogenous emissions standards, the country whose standards were less
stringent would export the polluting good. Later on, McGuire (1982) extended this
analysis by considering two factors of production and pollution as an input, and
demonstrated through a Heckscher-Ohlin international trade standard model that
when the production factors are mobile between countries, regulated industries re-
locate to the least regulated country4. Chichilnisky (1994) used a model with two
countries, two goods, two factors, where the environment, considered as one of the
two factors of production, is a private property in the North, while its ownership
is not regulated in the South. She therefore considered that countries only di¤ered
in their property rights regime over natural resources, and demonstrated that this
caused international trade of pollution-intensive goods from poorest countries (the
South), which are supposed to have no property rights, towards the more industrial-
ized countries that were relatively more endowed with natural resources, but whose
property rights were better de�ned. As for Copeland and Taylor (1994), they devel-
4See Box 2 for a quick overview of Ricardian and Heckscher-Ohlin models.

Environmental Regulation and Location Choice 75
oped a general equilibrium model with two countries (North and South), in which
only the heterogeneous environmental policies, arising from di¤erences in income
between the two countries, were the source of international trade5. They showed
that when the pollution tax was introduced exogenously and supposed to be higher
in Northern countries, the latter produced less pollution-intensive goods, while the
Southern countries were producing the more pollution-intensive goods. Copeland
and Taylor (1994) also made the contribution of considering the case when tax was
endogenous and chosen by the government to maximize consumers�welfare. They
found the same result as when income di¤erences were su¢ cient for the North to
establish a higher pollution tax than the South.
Box 2: Classical and neoclassical international trade theories
The Ricardian model (1817, Principles of Political Economy andTaxation):The Ricardian model is the simplest model of international trade that shows
how di¤erences between countries give rise to international trade and gains
from trade. Labor is the only primary input to production, and countries are
identical except for the productivity of labor between industries and across
countries.
Hypotheses:
1) Two countries
2) Two goods
3) A single input, labor, perfectly mobile among sectors but not internationally
4) Constant returns to scale
5) No barriers to trade
6) Preferences are identical and homothetic
5However, in the last section of their paper, Copeland and Taylor (1994) examined the potentialimpact of other factors such as population density, labor and physical carrying capacity of theenvironment on trade �ows.

Environmental Regulation and Location Choice 76
Box 2 (cont.)
7) Technological di¤erences between countries, summarized by di¤erences in
the opportunity cost of the production of goods
8) Identical factor endowments
Ricardo developed the principle of comparative advantage: each country can
bene�t from free trade, provided that it specializes in the good it can produce
at a lower opportunity cost than the other country.
The basic idea is that the comparative advantage results from technological
di¤erences. In these circumstances, countries will export goods that they pro-
duce relatively e¢ ciently and will import goods that they produce relatively
less e¢ ciently.
The Hecksher-Ohlin model:In the Ricardian model, since labor is the unique input, comparative advantage
can only result from international di¤erences in labor productivity. But in the
real world, trade is not only partly explained by these di¤erences in productiv-
ity, but it also depends on the relative factor endowments of countries. This
last point is central to the Heckscher-Ohlin theory.
Hypotheses:
1) Two countries
2) Two goods
3) Two factors of production, capital K and labor L, perfectly immobile across
countries
4) Constant returns to scale
5) No barriers to trade
6) Preferences are identical and homothetic
7) Identical production technology
8) Countries di¤er in their relative factor endowments
In the Heckscher-Ohlin model, comparative advantages and trade are deter-
mined by international di¤erences in factor endowments. A country will export
the commodity that intensively uses its relatively abundant factor.

Environmental Regulation and Location Choice 77
These early theoretical models of the pollution haven hypothesis, by considering
that countries were similar except for their environmental policies, showed that trade
liberalization would lead the less stringent country to export the most polluting
goods because of the comparative advantage it held for their production. Thus,
polluting goods would be produced in the South, i.e. in the unregulated country,
while less-polluting goods would be produced in the North, i.e. in the more regulated
country.
Due to the increasing international mobility of capital, a few standard models of
international factor mobility including environmental aspects have also been devel-
oped in the late eighties and in the nineties (Baumol and Oates, 1988; Oates and
Schwab, 1988; Rauscher, 1997). The analytical framework of most of these models
was the standard model of international factor mobility developed by Jasay (1960),
MacDougall (1960) and Kemp (1964), where the environment was introduced as
an additional variable. These models produced results that were closely related to
those derived in the Hecksher-Ohlin trade framework, factor movement and inter-
national trade being substitutes under the assumptions of perfect competition and
absence of market interventions. The model developed by Baumol and Oates (1988)
highlights the main mechanisms behind this outcome. In this two-country model,
each country produces a commodity; there are two techniques of production, one
being less polluting but more expensive than the other one. The developed coun-
try uses the less polluting production process, while developing country uses the
most polluting but less expensive one. With the introduction of a free trade system
between the two countries, the use of the polluting production process in the de-
veloping country keeps down the world price of the commodity, and thus increases
its demand. This higher world demand of the commodity, as well as the increase of

Environmental Regulation and Location Choice 78
its production in the developing country because of its use of the polluting and less
expensive method, generates an increase in polluting emissions. In the long run, the
developing country will enhance its comparative advantage in the production of the
commodity, while the developed country will specialize in the production of other
outputs. These results led Baumol and Oates (1988) to write that if some countries
do not adopt environmental regulations while others do adopt them, the �rst ones
"[...] will voluntarily become the repository of the world�s dirty industries".
The main interest of these models is that they provided the �rst theoretical an-
swers to the various questions dealing with the relationship between trade and en-
vironment, thus constituting rigorous foundations for subsequent discussions. But
their major weakness is assuming that the di¤erences in regulations are the only
motive for trade. Indeed, international trade could not only be in�uenced by en-
vironmental considerations, such as highlighted by the pollution haven hypothesis,
but by many other con�icting factors. A major improvement in these models was
the inclusion of these other determinants. The factor endowment hypothesis is the
main alternative to the pollution haven hypothesis, involving another factor than
environmental regulation. This hypothesis suggests that factor endowments a¤ect
production and trade patterns. Copeland and Taylor (2004) showed theoretically
each of the two hypotheses. Taken separately, these assumptions lead to contra-
dictory results: the pollution haven hypothesis, in accordance with results above,
predicts the production of polluting goods in the less regulated South, and the
production of clean goods in the North. Conversely, when countries only di¤er in
their relative factor endowments, the factor endowments hypothesis predicts the
production of the polluting capital-intensive goods in the capital-abundant country
(the North), and the production of the clean and less capital-intensive goods in the

Environmental Regulation and Location Choice 79
capital-scarce country (the South). When both assumptions are taken together, the
direction of trade will ultimately depend on the prevailing assumption. The work of
Copeland and Taylor (2004) is in line with previous theoretical models of pollution
haven based on traditional theories of trade. Copeland and Taylor (2004) review
some of these models, and also extend them. The authors come to a more gen-
eral model incorporating environmental regulation and other factors such as factor
endowments as the determinants of international trade.
Thus, the theoretical starting point for most of the empirical work on the pol-
lution haven hypothesis is the Heckscher-Ohlin model of international trade, which
shows that countries tend to export goods whose production intensively uses locally
abundant factors of production. But, as mentioned by Brunnermeier and Levinson
(2004), since these models do not yield an estimable structural equation relating
environmental policy to trade, most of empirical works rely on simple reduced-
form estimation of the impact of the severity of the environmental policy and other
country characteristics on trade �ows. These equations take the following form:
Yi = �Pi + �Fi + "i, where the dependent variable Y is a speci�c measure of eco-
nomic activity in a country, P is the stringency of the environmental policy, F is a
vector of characteristics, and " is a random error term. Regarding the dependent
variable Y , it can represent net exports or direct investment, remaining consistent
with Heckscher-Ohlin intuitions. We therefore carry out below the review of the
empirical works studying the pollution haven hypothesis when approached through
trade �ows, or through capital �ows.
Environmental Regulation and Location Choice 80
3.2 Reviewing the empirical studies of the pollution haven
hypothesis
3.2.1 Pollution haven hypothesis and the patterns of trade
This category of studies examines the e¤ect of environmental regulation on output
measures such as production, net exports and emissions. These empirical studies
started in the late eighties, with the aim of testing the above-described theoretical
predictions, developed in the seventies. Kalt (1988) conducted one of the earliest
studies in this �eld, using a cross-sectional analysis on the United States like most of
the studies of the same period. Indeed, Kalt used a cross-sectional Heckscher-Ohlin
model to investigate whether domestic environmental policy a¤ects the competi-
tiveness of U.S. industries. He thus linked cross-sectional variation in trade �ows
to industry characteristics, by estimating the impact of industry i speci�c measure
of environmental stringency, such as pollution abatement costsi, on trade �ows of
i. As in similar studies, pollution abatement costs did not appear to impact the
cross-sectional pattern of trade. On the contrary, the �ndings were counterintuitive,
with a positive coe¢ cient on abatement costs. The main explanation for these re-
sults in this type of studies was that pollution abatement costs only represent a
small fraction of total costs. However, the endogeneity of pollution abatement costs
combined with unobserved industry heterogeneity are consistent explanations too.
Tobey (1990) also used a cross-sectional Heckscher-Ohlin model. He studied the
impact of environmental stringency and other factor endowment variables on trade
patterns of �ve highly polluting sectors, in 1977. In all regressions, (one for each
commodity group), he found that environmental regulation was not a signi�cant
determinant of net exports. Although the study has the merit of considering not
only the United States but was conducted on 23 countries, 13 of which industrialized

Environmental Regulation and Location Choice 81
and 10 developing, its �ndings are open to criticism. For instance, they rely on a
weak index representing the environmental variable, since it is based on subjective
surveys and does not take into account the degree of enforcement of regulations. In
addition, regressions have small degrees of freedom, which explains the insigni�cant
impact of the environmental index as well as of the other country characteristics.
Grossman and Krueger (1993) is another widely cited example of this approach,
in their attempt to assess the environmental impacts of the North American Free
Trade Agreement. The authors argue that trade liberalization a¤ects the environ-
ment by expanding the scale of economic activity and changing the technique of
production and the composition of economic activity. When comparative advantage
is derived from di¤erences in environmental stringency, then the composition e¤ect
of trade would exacerbate existing environmental problems in the countries with
relatively lax regulations. In a section examining the impact of American indus-
tries�pollution abatement costs on the pattern of trade and investment between the
United States and Mexico, Grossman and Krueger tested whether dirtier U.S. indus-
tries relied more heavily on imports from Mexico, as it would be expected if Mexico
was functioning as a pollution haven relative to the U.S. Traditional economic de-
terminants of trade and investment, such as factor prices and tari¤s, were found
to be very important, while cross-industry di¤erences in pollution abatement costs
on U.S. imports from Mexico appeared to be small and statistically insigni�cant.
The authors conclude that di¤erences in abatement costs do not play a signi�cant
role, due to the weak weight of environmental costs compared to more considerable
production costs.
Since then, articles on pollution haven hypothesis followed, without a consensus
being established, while concerns abound over the e¤ects of environmental stan-

Environmental Regulation and Location Choice 82
dards on trade �ows and FDI. Early scienti�c research did not manage to validate
the assumption that environmental regulation a¤ects trade patterns (e.g., Ja¤e et
al., 1995; Wheeler, 2001). In another attempt to search for the pollution haven
hypothesis, Kahn (2003) tests whether the greatest dirty U.S. trade growth has
taken place with poorer non-democratic countries. The author shows that poor
nations and non-democratic nations are not major exporters of pollution intensive
goods to the United States. In addition to the endogeneity of pollution abatement
costs and the unobserved characteristics, Ederington et al. (2005) explain partially
why previous studies did not con�rm the pollution haven hypothesis. They re-
call that international trade is essentially made between developed countries, whose
regulation is quite similar. Nevertheless, if one examines only the �ows between
industrial nations and developing countries, the environmental standards have more
pronounced e¤ects on the trade structure: with the strengthening of the environ-
mental regulation of the United States, imports from developing countries decrease.
Moreover, Ederington et al. (2005) notice that on one hand, pollution abatement
costs represent a small fraction of total costs on average; on the other hand, pol-
luting industries, whose pollution abatement costs are the largest, are generally the
least geographically mobile.
3.2.2 Pollution haven hypothesis and investment
Plant location studies Another strand of the literature examines pollution
haven hypothesis using data on direct investment. Studies could either consider
plant locations or capital �ows. As regards to earliest studies examining plant loca-
tion decisions, given the lack of data, they have mostly explored the impact of di¤er-
ences in environmental policy across U.S states on plant locations within the United
States. They have found similar results as studies on trade �ows. For instance,

Environmental Regulation and Location Choice 83
Bartik (1988), examining the plant location of Fortune 500 companies between 1972
and 1978, concludes that environmental variables have only small e¤ects on location
choice. McConnell and Schwab (1990) found a similar insigni�cant relationship be-
tween compliance of states with federal ambient ozone standards and the location of
plants from the vehicle assembly sector. Though these studies use di¤erent samples
of location choices and di¤erent measures of environmental stringency and other in-
dependent variables, all their results may be biased by unobserved heterogeneity and
endogeneity problems. Levinson (1996) makes an attempt to distinguish his study
by not focusing on particular industries nor on measures of environmental regula-
tory stringency. His main contribution was to use adjusted abatement costs also,
in order not to overestimate abatement costs in states where polluting plants are
more present, controlling thus for states�industrial composition. However, he con-
cludes that strict environmental regulations weakly a¤ect location choices of most
manufacturing plants. List and Co (2000) also detect a weak relationship between
stringent regulations and manufacturing plant locations. Employing a conditional
logit model and using four measures of regulatory stringency, they �nd evidence that
heterogeneous environmental policies across states a¤ected foreign multinational cor-
porations�new plant location decisions from 1986 to 1993. However, the e¤ect is of
a relatively small magnitude compared to the e¤ect of states�other characteristics.
In response to the problems raised by these cross-section analyses, Becker and Hen-
derson (2000) examine e¤ects of air quality regulation on U.S plant locations, using
panel data for 1963-1992. They address problems of earlier plan location literature
by using disaggregated state-level data and alternative measures of environmen-
tal regulation, as well as controlling for unobserved heterogeneity across locations.
Their results indicate a signi�cant negative e¤ect of air regulation on plant births

Environmental Regulation and Location Choice 84
of polluting industries. Works of Greenstone (2002) and List et al. (2003) con-
�rm this negative e¤ect of stringent environmental regulation on plant location. In
this literature on plant location, two additional studies should be mentioned be-
cause they do not concern the United States. Smarzynska and Wei (2004) look
at foreign investment decisions in 25 economies in Eastern Europe and the former
Soviet Union. They �nd some weak evidence for pollution havens when stringency
of environmental policy is measured by participation in international environmen-
tal treaties, while results were not supported by robustness checks. Recently, in a
study on China, Dean et al. (2009), demonstrate, through a conditional and nested
logit analysis, that only equity joint ventures in highly polluting industries and from
ethnically Chinese source countries (Hong-Kong, Macao, Taiwan) are attracted by
weak environmental standards, whereas projects from industrial nations are not,
regardless of their pollution industry. Dean et al. suggest that these �ndings could
be explained by technological di¤erences since developed countries may adopt newer
and cleaner technologies regardless of the local standards.
Foreign direct investment �ows studies Among the studies that have con-
sidered capital �ows, we can cite the seminal work of Keller and Levinson (2002).
What distinguished their work was its use of, on the one hand, panel data on inward
FDI �ows in the United States over a long period of time and, on the other hand, an
innovative measure of the relative abatement costs across states that were adjusted
to take into account industrial composition e¤ects within the state. Regressing for-
eign direct investment on the index of abatement costs through a pooled OLS and
without including state �xed e¤ects, they show a positive or insigni�cant correlation
between the two variables. Inversely, when including state �xed e¤ects, the authors
�nd a robust result indicating that abatement costs have dissuasive e¤ects on for-

Environmental Regulation and Location Choice 85
eign investments. This result suggests biases due to unobserved state level variables
that correlate with abatement costs and investments in earlier literature. However,
Henderson and Millimet (2007) attempt to evaluate the sensibility of these results
to changes in the parametric hypotheses. Applying to Keller and Levinson (2002)
data recently developed non parametric techniques, they reveal that some of the
parametric results are not robust, and that the impact of relative abatement costs
is not uniform across states and is generally of a smaller magnitude than suggested
in the work of Keller and Levinson (2002).
These works on capital �ows focus on United States, and thus constitute spe-
ci�c cases of pollution haven hypothesis investigation. However, they do not allow
accounting for a greater heterogeneity of environmental regulations and other fac-
tors in�uencing foreign direct investment between di¤erent countries. Some studies
depart from this methodology and examine di¤erent countries in the early 2000�s.
Xing and Kolstad (2002) examine U.S. FDI from six manufacturing sectors with
di¤erent pollution intensity, in 22 di¤erent countries (7 developing), for 1985-1990.
Using an instrumented regulatory stringency, they conclude that U.S. FDI in sectors
with high environmental control costs, namely chemicals and primary metals, has a
signi�cant negative relationship with the stringency of environmental regulations in
the host country, while it is insigni�cant for less polluting sectors. They also stress
the importance of accounting for measurement error problems due to the unobserved
regulatory stringency. Eskeland and Harrison (2003) study the e¤ect of sectoral U.S.
abatement cost and pollution intensity on FDI originating from France to Morocco
and Ivory Coast, and from United States to Venezuela and Mexico. They detect
essentially no empirical support for the pollution haven hypothesis in either cases.
However, their sample was restricted, and they did not use consistent data on host

Environmental Regulation and Location Choice 86
country environmental policy.
Finally, we should mention that more recent studies account for endogeneity
issues and tend to detect more robust evidence of pollution haven e¤ect, whether
they consider trade �ows or direct investment (e.g., Ederington and Minier, 2003;
Cole et al., 2006). However, they often use instrumental variable analyses which are
sensitive to the instruments used, and the e¤ect is of a small magnitude. We will
more deeply discuss the endogenity issues and related literature in Chapter 4.
3.3 Summary
In light of the results of key existing studies, we observe that empirical evidence
about pollution haven hypothesis remains unclear. While some authors use a general
equilibrium and provide theoretical foundations for this hypothesis, its empirical
investigations have failed in clearly supporting the theoretical claims that stringent
environmental policy leads to specialization in relatively clean production and deters
polluting investment. Since the various empirical attempts often led to di¤erent
results, they did not contribute to mitigate questions raised by the hypothesis. One
reason is that theoretical predictions are not directly estimable. Moreover, the
latter often focus so far on a few determinants of international trade. The search
for pollution havens focusing on data has overlooked the importance of other factors
in determining trade or capital �ows. By relying more heavily on theory which
suggests alternative hypotheses, we should identify those factors more explicitly.
We have seen above that theoretical foundations of pollution haven hypothesis often
ensued from Hechsher-Ohlin model of international trade, whether their empirical
investigation involved trade �ows or capital �ows. Inversely, we propose in the
following section a theoretical model that involves capital �ows and would be directly

Environmental Regulation and Location Choice 87
estimable since it highlights the whole set of factors that in�uence location decision.
Our objective is to put in evidence, through an adjusted theoretical model, the
impact of environmental regulations on the location of manufacturing activities, in
order to contribute to the clari�cation of the pollution haven hypothesis.
4 An economic geography model of the pollution
haven hypothesis
4.1 Introducing economic geography models
For our theoretical framework, we depart from earlier international trade-based the-
oretical studies of pollution haven hypothesis and adopt a modern economic ge-
ography model. Economic geography has been neglected in economic theorizing
for a long time, until Paul Krugman reintroduced it by publishing his monograph
"Geography and Trade" in 1991. Economic geography models seem particularly
appropriate in our period where capital is more and more mobile, to explain the
international or interregional spatial distribution of economic activities. Whereas
traditional models of pollution haven hypothesis mostly assume perfect competition
and constant returns to scale, economic geography models enable us to introduce
more appropriate market structures such as monopolistic competition with increas-
ing returns to scale. The existence of a trade-o¤ between increasing returns to scale
due to �xed costs of production that spurs the concentration of production, and
transport costs that incite industries to produce close to demand, determines in a
comprehensive way the centripetal and centrifugal forces that a¤ect the allocation
of economic activity in geographical space. Indeed, in the absence of �xed costs of
production, one plant would be built in each consumption place in order to avoid the

Environmental Regulation and Location Choice 88
shipment of goods. Conversely, in the presence of �xed production costs, it would be
more pro�table to minimize the �xed costs by building one plant in a single location
and ship the goods to the other locations. However, this decision depends on the
variable transport costs. In the absence of transport costs, a single plant would be
enough to satisfy the entire demand since the shipment of goods from that plant
to all other locations is costless; conversely, with an increase of transport costs in
function of distance, it is better to build a plant close to each consumption place.
Thus, the optimal solution depends on the transport cost, the level of the �xed costs
and the quantity of goods produced, i.e. the returns of scale. This framework seems
particularly well-adapted to the study of manufacturing industries and the explana-
tion of the industrial agglomeration observed in some regions of the European Union
and in emerging countries (e.g., Bangalore in India). It is all the more well-adapted
for polluting industries, which are generally characterized by imperfect competition,
increasing returns to scale and large transportation costs, for instance, chemicals,
steel and other metals, pulp. Moreover, the relationship between geographical space
and environmental economics is undeniable, especially in the case of local pollution
since environmental harm is directly linked to the location of activities.
Despite these arguments, only a few recent papers have examined the role of the
environment in a framework of economic geography. VanMarrewijk (2005) investi-
gates a core-periphery model, Rauscher (2007) examines a variety of New Economic
Geography models and derives optimal environmental policies, while Rieber et al.
(2008) and Rauscher (2009) look at issues of economic geography and environment
through a footloose-capital model. Although these works constitute a major step
in addressing environmental issues, they often su¤er from a lack of tractability that
hampers them from deriving clear analytical results.

Environmental Regulation and Location Choice 89
4.2 The model
We adopt the standard model of economic geography developed by Krugman (1980)6,
that we extend to take into account the environmental aspect, thus connecting the
economic geography literature to environmental economics. Moreover, following
Head and Mayer (2004), we aim to derive a �rm�s location choice speci�cation.
However, we extend the model of Head and Mayer (2004) by considering pollution
as a third production factor, together with labor and capital. We further depart
from Head and Mayer (2004) by deriving a marginal cost that is a¤ected by market
distortions.
The theoretical frame of our model is based on the classic hypotheses of the New
Economic Geography, i.e. an open economy model with increasing returns to scale,
monopolistic competition and trade costs. Monopolistic competition is a common
market structure in our economies nowadays, whose basic concept is the product
di¤erentiation. Monopolistic competition is characterized by an important number
of sellers and consumers. Sellers provide di¤erentiated products, which confers to
them some degree of control over price, whereas consumers have clearly de�ned
preferences. Moreover, there are few barriers to entry and exit.
In our model, the world consists of i = 1; :::N open economies. In each country
there are two sectors - industry and agriculture. Given the interest of this paper
in the industry�s location, we model the traditional sector, denoted sector T , as
simply as possible. Sector T is supposed to produce a homogeneous good under
Walrasian conditions (constant returns to scale and perfect competition), which is
freely traded. The manufacturing sector M produces a continuum of di¤erentiated
6The standard model of economic geography has been developed by Krugman (1980, 1991),who incorporates transport costs to the model of Dixit and Stiglitz in an open economy. It has beenextended by Fujita et al. (1999), whose speci�cation has become very common in internationaltrade theory.

Environmental Regulation and Location Choice 90
goods, called varieties v, under increasing returns to scale in an environment of mo-
nopolistic competition à la Dixit and Stiglitz (1977). Each �rm produces a distinct
variety, while the elasticity of substitution between two varieties is denoted �, and
� > 1. The shipping of these varieties towards another country implies "iceberg"
transport costs: � > 1 units must be sent so that a unity arrives at destination; the
rest, � � 1, is melt in transit. Obviously, the transport of goods generates pollu-
tion. However, goods whose production is relatively polluting in a country could be
imported from countries using more e¢ cient techniques, which would be consistent
with a global reduction of pollution. The mechanisms depicting the relationship be-
tween transport and pollution will be detailed to a greater degree in Chapter 4, but
at this stage of our work it is su¢ cient to consider the private cost of transport, since
�rm�s pro�t maximization is not a¤ected by the pollution resulting from transport.
The consumers spend a part � of their income E on the purchase of the composite
good M , with 0 < � < 1, and the rest is spent on the good T . They have constant
elasticity of substitution (CES) sub-utility functions for the composite good. Under
constraints of income and each variety�s price, the maximization of this sub-utility
results in the following demand function of the country j consumers for a speci�c
variety h produced in a country i (see details in Appendix 2.A):
qij (h) =[pi (h) � ij]
��Pi
Rni[pi (v) � ij]
1�� dv�Ej (2.1)
where pi is the price of the variety h, h 2 [1:::ni], in the exporting country i; ni
is the mass of varieties in any country i, i 2 N ; and � ij is the trade cost supported
by the consumer in the importing country j. The trade cost includes all transaction
costs related to the shipment of goods.
Each �rm aims to maximize its gross pro�t on every market. We can write the

Environmental Regulation and Location Choice 91
gross pro�t realized in each destination country j by a �rm h implanted in a country
i:
�ij (h) = [pi(h)� ci(h)] � ijqij(h) (2.2)
with ci(h) the marginal production cost of the �rm h in country i.
In this model à la Dixit and Stiglitz (1977) and Krugman (1980), the production
price is a simple mark-up on the marginal cost: p = c �(��1) . By substituting it in
the Equation (2.1), we obtain the following expression for the quantity that a �rm
h produces in country i and would ship to any destination j:
qij (h) =� � 1�
[ci (h) � ij]��P
i
Rni[ci (v) � ij]
1�� dv�Ej (2.3)
Replacing the expression (2.3) and the price expression in the Equation (2.2),
summing the gross pro�ts realized by a �rm h located in country i while shipping
its goods to any market j (Equation 2.2), and deducting the �rm�s �xed cost Fi (h),
we obtain the total net pro�t earned by a �rm h:
�i (h) =ci (h)
1��
�
Xj�ij�EjGj
� Fi (h) =ci (h)
1��
�MPi � Fi (h) (2.4)
with �ij = �1��ij , Gj =
Pi
Rni[ci (v) � ij]
1�� dv and MPi =P
j �ij�EjGj.
The pro�t equation (2.4) shows that the pro�tability of a country i depends
essentially on two factors, namely its real market potential (represented by MPi,
an abbreviation of Market Potential which is a measure of demand representing
the accessibility to overall markets from country i. This concept is more deeply
developed in the next Chapter), and the prevailing marginal production cost. This
is a quite intuitive result, nevertheless these determinants should be made more
explicit and expressed in a more predictable way. To this end, we follow Head and
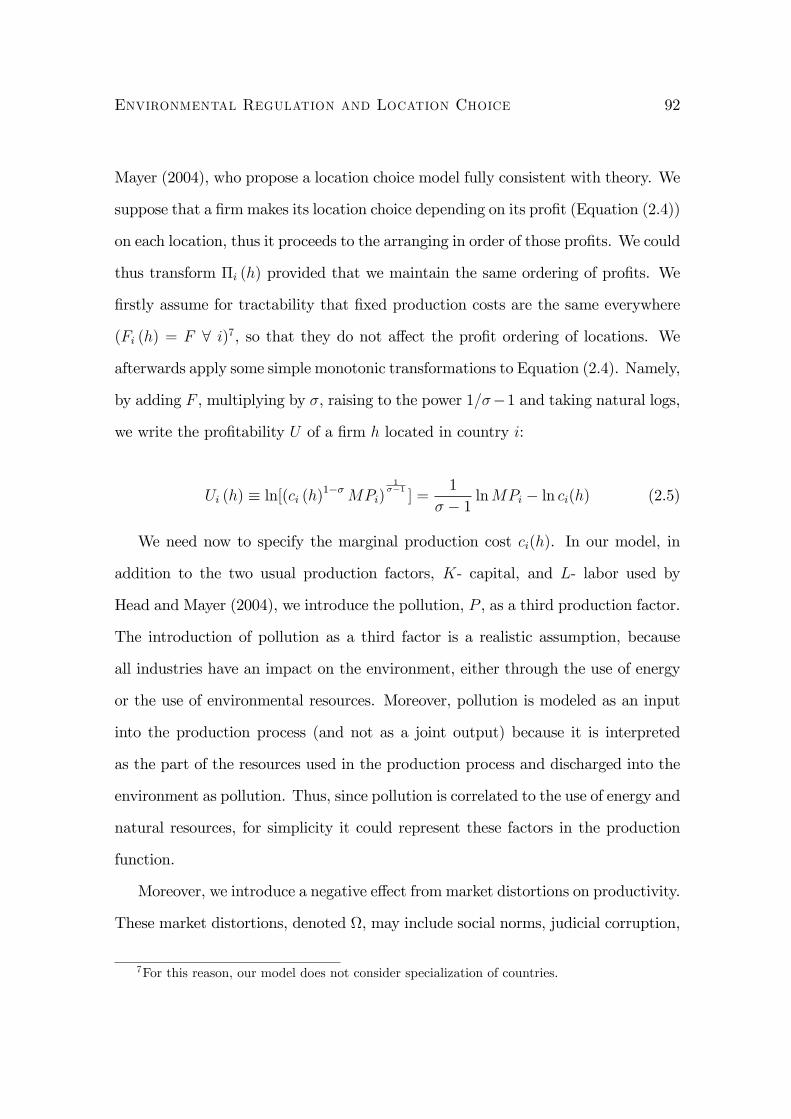
Environmental Regulation and Location Choice 92
Mayer (2004), who propose a location choice model fully consistent with theory. We
suppose that a �rmmakes its location choice depending on its pro�t (Equation (2.4))
on each location, thus it proceeds to the arranging in order of those pro�ts. We could
thus transform �i (h) provided that we maintain the same ordering of pro�ts. We
�rstly assume for tractability that �xed production costs are the same everywhere
(Fi (h) = F 8 i)7, so that they do not a¤ect the pro�t ordering of locations. We
afterwards apply some simple monotonic transformations to Equation (2.4). Namely,
by adding F , multiplying by �, raising to the power 1=��1 and taking natural logs,
we write the pro�tability U of a �rm h located in country i:
Ui (h) � ln[(ci (h)1��MPi)1
��1] =
1
� � 1 lnMPi � ln ci(h) (2.5)
We need now to specify the marginal production cost ci(h). In our model, in
addition to the two usual production factors, K- capital, and L- labor used by
Head and Mayer (2004), we introduce the pollution, P , as a third production factor.
The introduction of pollution as a third factor is a realistic assumption, because
all industries have an impact on the environment, either through the use of energy
or the use of environmental resources. Moreover, pollution is modeled as an input
into the production process (and not as a joint output) because it is interpreted
as the part of the resources used in the production process and discharged into the
environment as pollution. Thus, since pollution is correlated to the use of energy and
natural resources, for simplicity it could represent these factors in the production
function.
Moreover, we introduce a negative e¤ect from market distortions on productivity.
These market distortions, denoted , may include social norms, judicial corruption,
7For this reason, our model does not consider specialization of countries.

Environmental Regulation and Location Choice 93
information asymmetries and other market failures that impose a negative external
productivity e¤ect. Some authors underline the necessity of taking into account
market distortions resulting from corruption or weak institutions on FDI, while try-
ing to test the pollution haven hypothesis (Smarzynska and Wei, 2004). Indeed, less
regulated countries have often more severe institutional problems. Since corruption
and laxity of environmental regulation may have opposite e¤ects on location choice
decision, it is essential to well specify both of them.
We then represent the production function as a common Cobb-Douglas with
constant returns: Q = AK�L�P �� , and the associated marginal cost:
c =1
Ar�w�t� (2.6)
where � = 1�(�+ �), � 0, and r, w and t, are costs of capital K, labor L, and
pollution P , respectively. The output elasticities of capital, labor and pollution are
denoted �, � and �, respectively, whereas A represents the total factor productivity.
With these last assumptions, we can rewrite Equation (2.5) in the following way:
Ui (h) � 1
� � 1 lnMPi + lnAi � �(h) ln ri � �(h) lnwi �
�(h) ln ti � lni (2.7)
Equation (2.7) predicts that the pro�tability of a �rm h settled in a country i is
an increasing function with regard to the market potential and the global factor pro-
ductivity in country i, and is decreasing with regard to production factor costs and
market failures. Particularly, as regards the production factor costs, this equation
shows that, in addition to the usual costs of capital and labor, the cost of pollution

Environmental Regulation and Location Choice 94
also reduces the pro�tability of a �rm h when it increases. Thus, unlike results
following from traditional Heckscher-Ohlin models which solely highlight particular
comparative advantages, this equation derived from an economic geography model
captures explicitly the full scope of location choice determinants. Moreover, it is
directly estimable, which is particularly valuable given that the main shortcoming
in this literature is the lack of reconciliation between theory and empirical evidence.
However, since Equation (2.7) expresses the pro�tability of a location in function of
its absolute costs, one can suppose that it is not appropriate to indicate the location
choice of a �rm since a �rm�s decision to invest in a particular country is tied to
relative costs across countries. In fact, as we do not observe the potential pro�tabil-
ity of each location, we assume that �rms choose the country providing the highest
pro�t. We will see in the next chapter that Equation (2.7) is perfectly suitable to a
conditional logit implementation which relies on the comparison of pro�ts between
several alternatives.
Conclusion
In this chapter, we aimed to introduce the pollution haven hypothesis debate and
contribute to it by providing a theoretical model. We �rst exposed the historical and
factual emergence of environmental issues on the international stage and especially
during international trade negotiations. As we saw in the previous chapter that
the �rst developed countries began to worry about their environment in the early
seventies, in this chapter we showed that the environment held an increasing role
worldwide and became a major issue of trade negotiations in the early nineties.
Since then, the pollution haven hypothesis has been explicitly expressed, de�ned,
and has become a topic of research of special interest ... still relevant in light of

Environmental Regulation and Location Choice 95
doubts and challenges that it continues to inspire. After an analysis of key studies in
related literature, we conclude that empirical evidence of pollution haven hypothesis
still requires further investigation. Since one of the main failures of the previous
studies is the lack of theoretical foundation, we developed in the last section of
this chapter a theoretical model of economic geography, in which we introduced
the environmental aspect. Our model of economic geography introduces several
determinants of location choice, among them the market potential, the pollution
cost and market failures. The model supplied us with a log-linearized speci�cation
for the determinants of �rms� location choice, among which we distinguished the
impact of the environmental policy. Thus, the use of such an economic geography
model has enabled us to derive a rigorous econometric speci�cation, that we will
use in next chapters to conduct an extended empirical investigation of the pollution
haven hypothesis.

Environmental Regulation and Location Choice 96
Appendix 2
2.A Deriving the demand function for varieties in
an economic geography model
The consumer�s behavior described in Section 4 results from the maximization of
the following utility function:
Uj = C1��Tj C
�Mj (A. 1)
where 0 < � < 1, CT represents the consumption of the traditional good T , and
CM is the consumption of the manufacturing composite good M .
If pt denotes the price of the agricultural good, and PM the price index of the
manufactured good, the budget constraint of a consumer whose income is E is
written PMCM + ptCT � E. In this case, it is well-known that the aggregate
demand functions take the form CM = �EPM
and CTj =(1��)Ept
= Etpt, with 0 < � < 1,
and �E and Et are the expenditures on the composite manufactured good and the
traditional good, respectively.
Consumers have constant elasticity of substitution (CES) sub-utility functions
for the manufacturing composite good M . CES preferences are at the heart of the
Dixit-Stiglitz monopolistic competition model (Dixit and Stiglitz, 1977). In our
case, they are expressed in terms of a continuum of varieties:
CMj =
NXi
Zni
qij (v)1�1=� dv
! 11�1=�
; with 1 < � (A. 2)
ni is the mass of varieties produced in a country i, i 2 N ; N is the number of
countries in the world; qij (v) the consumption of the v th variety in the country j,
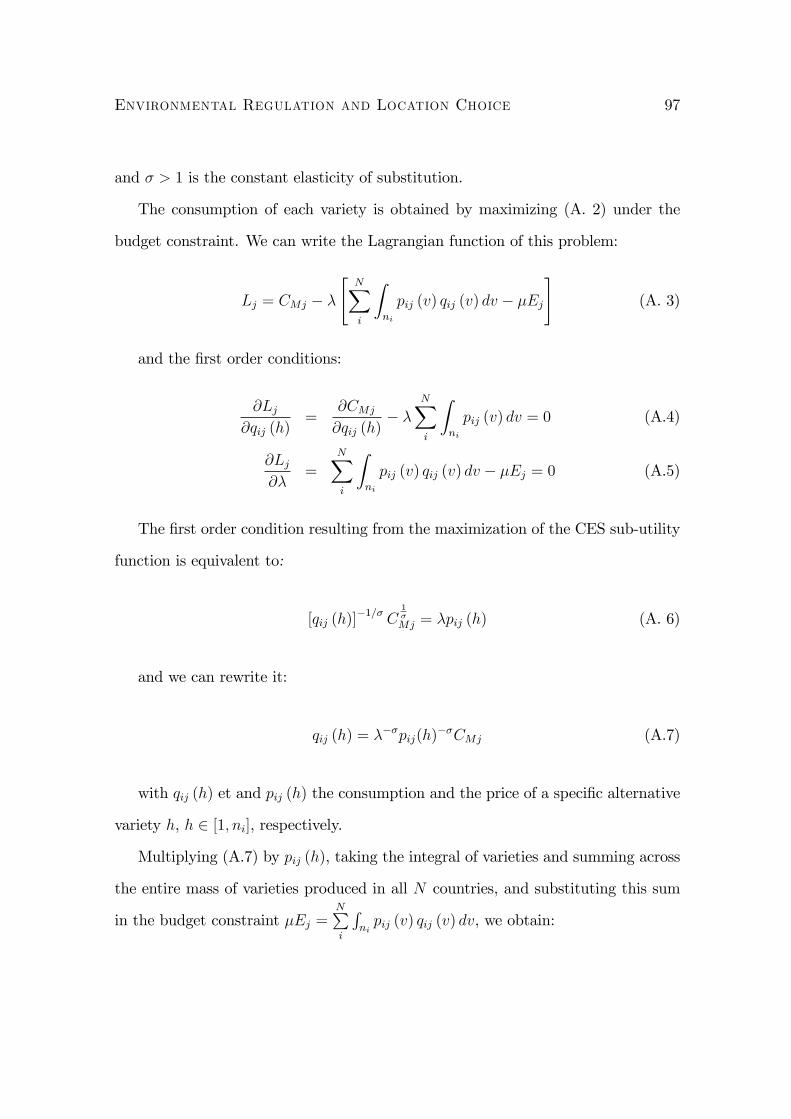
Environmental Regulation and Location Choice 97
and � > 1 is the constant elasticity of substitution.
The consumption of each variety is obtained by maximizing (A. 2) under the
budget constraint. We can write the Lagrangian function of this problem:
Lj = CMj � �"NXi
Zni
pij (v) qij (v) dv � �Ej
#(A. 3)
and the �rst order conditions:
@Lj@qij (h)
=@CMj
@qij (h)� �
NXi
Zni
pij (v) dv = 0 (A.4)
@Lj@�
=NXi
Zni
pij (v) qij (v) dv � �Ej = 0 (A.5)
The �rst order condition resulting from the maximization of the CES sub-utility
function is equivalent to:
[qij (h)]�1=� C
1�Mj = �pij (h) (A. 6)
and we can rewrite it:
qij (h) = ���pij(h)
��CMj (A.7)
with qij (h) et and pij (h) the consumption and the price of a speci�c alternative
variety h, h 2 [1; ni], respectively.
Multiplying (A.7) by pij (h), taking the integral of varieties and summing across
the entire mass of varieties produced in all N countries, and substituting this sum
in the budget constraint �Ej =NPi
Rnipij (v) qij (v) dv, we obtain:

Environmental Regulation and Location Choice 98
CMj��� =
�EjNPi
Rnipij (v)
1�� dv
Replacing in (A.7), we obtain the indirect demand function of a consumer from
a country j for a speci�c variety h produced in a country i:
qij (h) =[pij (h)]
��Pi
Rni[pij (v)]
1�� dv�Ej (A. 8)
and the inverse demand function:
pij (h) =[qij (h)]
�1=�Pi
Rni[qij (v)]
1�1=� dv�Ej (A. 9)

Chapter 3
Environmental Regulation andFrench Firms Location Abroad: anInternational Comparative Study1
Introduction
There is, by now, quite an extensive literature on the factors that in�uence �rms�
location decisions abroad. Among these factors, the most studied are the cost of
production factors such as labor and capital, and the market access. Additional
determinants of foreign direct investment (FDI) such as taxation or agglomeration
e¤ects have also been studied. In the late seventies, a new factor appeared as a
potential determinant of �rms�location abroad: environmental regulation.
Environmental regulation has notably been put in evidence by Copeland and
Taylor (2004) through a simple model of specialization and trade, according to which
the rich countries that protect their environment, should abandon their polluting ac-
tivities to developing countries, whose environmental legislation and enforcement are
not severe. The relatively less severe environmental regulation in developing coun-
1This chapter has been in part written with Natalia Zugravu.
99

Environmental Regulation and French Firms Location Abroad 100
tries can create a comparative advantage in pollution-intensive production. This
statement commonly illustrates the pollution haven hypothesis that we presented
in previous chapter. As a reminder, the pollution haven hypothesis assumes that
countries are identical except for exogenous di¤erences in their environmental poli-
cies. Thus, it is cheaper to produce pollution-intensive goods in developing countries
with a weaker environmental regulation. Trade openness and foreign direct invest-
ment could then damage the environment of developing countries. However, from
another theoretical point of view, researchers proposed an alternative hypothesis to
explain the relationship between trade and FDI openness and the environment: the
"factor endowment hypothesis". This alternative approach is based on the classic
theory of endowments and would yield an opposite conclusion: polluting activities
are generally capital-intensive and should thus locate in rich countries where capital
is abundant. Indeed, the factor endowment hypothesis suggests that trade is de-
termined by countries�relative abundance of production factors (labor and capital
in most models). Thus, if pollution-intensive goods are generally capital intensive,
they should be produced in relatively capital-abundant countries. The underlying
ambiguity is that developed countries are supposed at the same time to be abundant
in capital and to have a stricter environmental policy, unlike poor countries. These
opposite theoretical views can explain the lack of robust empirical proof for pollu-
tion havens reality. The stringency of the environmental standards is only one factor
determining the comparative advantages between countries, while the endowments
of factors such as skilled human capital and physical capital could also largely deter-
mine industrial location and the products that a country will export. As far as the
strongly polluting industries tend also to be intensive in capital, the relative lack of
capital in the developing countries can prevail over the advantage of low abatement

Environmental Regulation and French Firms Location Abroad 101
costs (e.g., Antweiler et al., 2001; Cole and Elliott, 2005). This narrow connection
between both pollution haven hypothesis and factor endowment hypothesis should
be taken into account while testing anyone of them.
The debate on the pollution haven hypothesis produced a political challenge by
trying to �nd clear empirical evidence in order to answer what is really a com-
plex and dynamic issue: how does environmental regulation interact with more and
more mobile production? The increasing relocation of industries towards developing
countries raises many questions in the �eld of employment and with regard to the en-
vironment. Nevertheless, as mentioned in previous chapter, empirical research often
fails to prove this hypothesis. Generally, statistical studies prove that the pollution
haven hypothesis cannot be clearly identi�ed. Four potential problems in this liter-
ature require more empirical tests. First of all, most studies are lacking theoretical
foundations for the construction of the equations to be tested, which often entails
speci�cation errors. Secondly, the studies of Zhang and Markusen (1999) and Cheng
and Kwan (2000) demonstrate the importance of relative endowments of production
factors in the explanation of FDI. The absence of this determinant can lead to omit-
ted variable bias. Next, as noted by Smarzynska and Wei (2004), several studies
use very aggregated data on FDI, and proxies of the severity of the environmental
policy that depart from the real variable to be taken into account, which generally
results in bias induced from measurement-error. Finally, Keller and Levinson (2002)
and Levinson and Taylor (2008) emphasize the empirical importance of controlling
for the unobservable characteristics of industries and locations. The laxness of the
environmental policy, supposed to attract polluting �rms, may be associated with
other characteristics that, in their turn, generally discourage the establishment of
foreign �rms. It is notably the case of weak institutions, expressed through high

Environmental Regulation and French Firms Location Abroad 102
corruption level, lack of civil freedoms�and property rights�protection, etc. That is
why, as Smarzynska and Wei (2004) underline, it is necessary to take into account
the e¤ect of institutions on FDI, while trying to test the pollution haven hypothesis.
Our objective in this chapter is to empirically reexamine the pollution haven hy-
pothesis, by attempting to take into account these various limits by di¤erent means.
Consequently, we rely on the classic theoretical model of New Economic Geogra-
phy developed in Chapter 2, which provided us a log-linearized speci�cation for the
determinants of �rms�location choice, among which we distinguish the impact of
the environmental regulation. As far as we know, despite the ability of economic
geography models in explaining the localization of manufacturing industries2, at
the moment there is broadly no empirical study on the pollution haven hypothesis
based on a theoretical model of New Economic Geography. One exception is Jug
and Mirza (2005), where authors derive a structural gravity equation and manage
to show that environmental regulation is a determinant of trade �ows. Otherwise,
economic geography models have been used in purely theoretical studies (e.g., Con-
rad, 2005; Rauscher, 2007; Van Marrewijk, 2005; Rieber et al., 2008), while studies
on pollution haven hypothesis are most often strictly empirical studies or based on
standard international trade models. In previous chapter, we took use of such a
model with the aim of deriving a rigorous econometric speci�cation on which we
can base an empirical investigation of the pollution haven hypothesis. Thus, for our
empirical work we use �rm-level data on French �rms, and we analyze FDI determi-
nants in heterogeneous countries. We should pay particular attention to transition
and emerging economies, since these countries became very popular destinations for
French �rms at the beginning of the 21th century. Concerning the speci�c case of
transition countries, between 1992 and 2002 the French multinationals multiplied
2Cf. Chapter 2 for more justi�cations about the economic geography models.

Environmental Regulation and French Firms Location Abroad 103
by six the number of their subsidiaries in Central and Eastern European Countries
(CEEC) and countries of the Commonwealth of Independent States (CIS), this re-
gion representing thus 11% of the total of the French �rms abroad in 2002 (3 %
in 1992)3. Regarding emerging countries, while they counted about 25% of the
French establishments in 1992, in 2002 they counted about 35%. This reorientation
of French FDI towards countries that we have identi�ed in Chapter 1 as relatively
lenient, constitutes a strong incentive for an investigation of the pollution haven
hypothesis.
Furthermore, to represent the environmental regulation�s stringency in a com-
plete way, we create a complex and dynamic index which assesses the relative severity
of the environmental policy across countries, based on a diverse set of variables.
Finally, in order to take into account the speci�c characteristics of countries and
industries, the empirical estimations are performed controlling for di¤erent country-
groups (high-income Developed countries, Emerging countries4, Transition CEEC,
Transition countries of CIS, and Developing countries5), while the estimation meth-
ods used control for �rms and industry speci�c e¤ects. An additional test would
be conducted to take into account the heterogeneity of FDI, controlling for the FDI
3Source: Subsidiaries-Survey 2002, managed by the Directorate of Treasury and EconomicPolicy on 2002.
4An emerging country is a country, up to there under developed, which undertook measuresand accumulated means, in particular legal and cultural, in order to begin a phase of fast growthof the production and social welfare. According to the Morgan Stanley Emerging Markets Indexpublished by Morgan Stanley Capital International (MSCI), in July 2006, the status of emergingcountry was awarded to the following countries: Argentina, Brazil, Chile, China, Colombia, Egypt,India, Indonesia, Iran, Israel, Jordan, Malaysia, Mexico, Morocco, Pakistan, Peru, the Philippines,South Africa, South Korea, Taiwan, Thailand, Tunisia, Turkey, and Vietnam. Czech Republic,Hungary, Poland, and Russia are also classi�ed by MCSI as emerging economies, but we includethese countries in their respective transition country-group.
5According to the World Bank classi�cation, countries with per capita GNI superior to $11,456are considered as high-income countries. We use this classi�cation excluding from this list countriesconsidered in our study as transition or emerging economies. All other countries, not included inour Transition, Emerging, or Developed (high-income) country-groups, have been included in theDeveloping country-group (see Appendix 3.B for the list of countries included in our sample).
Environmental Regulation and French Firms Location Abroad 104
mode of entry.
The novelty of this study lies on using a speci�cation derived from an economic
geography model that integrates pollution as an additional production factor, and
employing appropriate econometric techniques to well-exploit a �rm-level database
on worldwide location of French manufacturing subsidiaries. We use the conditional
logit model, which is a proven estimation method in the literature on location choice,
providing high precision on estimated e¤ects, since performed on thousands of �rm-
level data observations. As we have seen in the literature review in Chapter 2, most
existing studies estimate the impact of cross-regional di¤erences in environmental
regulation on foreign �rms� location inside a single country, a large part of them
focusing on the United States. Only a few attempted to examine this hypothesis for
other countries (Smarzynska and Wei, 2004; Dean et al., 2009). However, the actual
debate on the reality of pollution havens mainly concerns international issues: the
fear that less regulated, poorer countries become pollution havens for polluting �rms
from more regulated, developed countries. Hence, our study is more relevant in the
actual international debate regarding pollution havens, since it assesses the impact
of environmental regulation on FDI in di¤erent countries.
Our chapter is structured as following: Section 1 describes the empirical model
and data used; in Section 2, we examine main empirical results and provide an
extended analysis, while in the third section we present some robustness tests.
1 Empirical methodology
Our objective in this chapter is to empirically estimate the model that we developed
in Chapter 2, so as to examine the determinants of �rms location and the role
played by the environmental regulation in the location decision. In Chapter 2, we
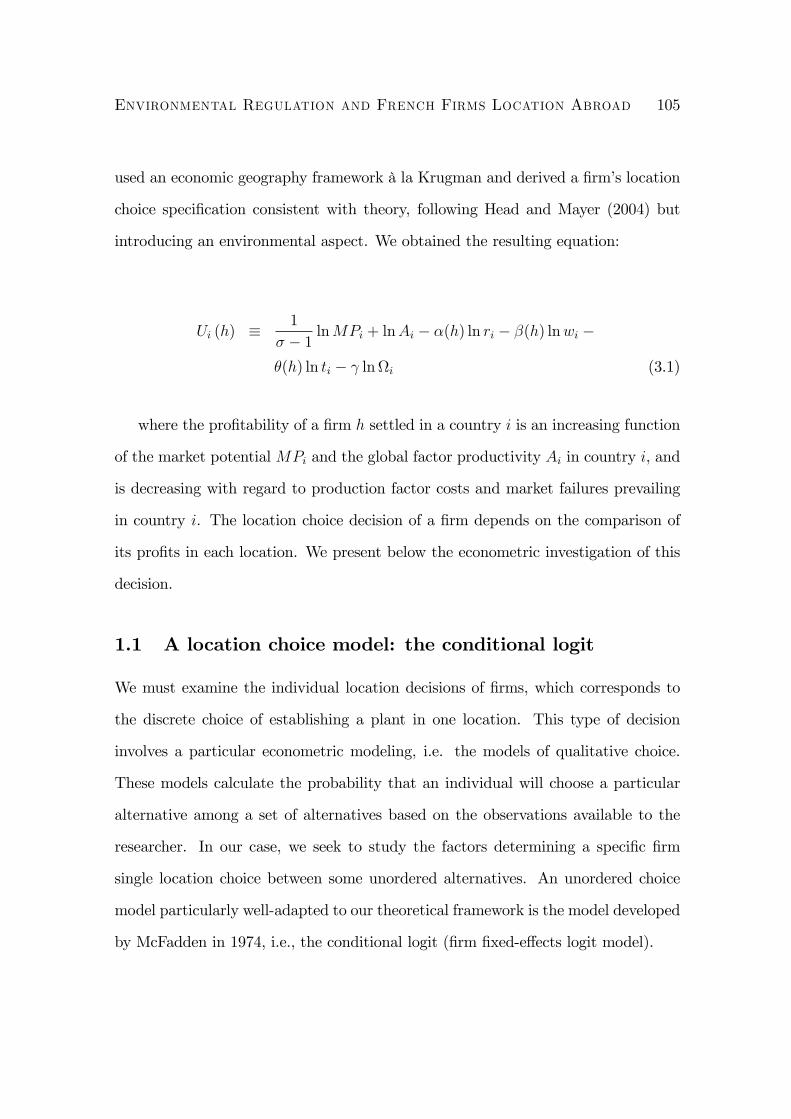
Environmental Regulation and French Firms Location Abroad 105
used an economic geography framework à la Krugman and derived a �rm�s location
choice speci�cation consistent with theory, following Head and Mayer (2004) but
introducing an environmental aspect. We obtained the resulting equation:
Ui (h) � 1
� � 1 lnMPi + lnAi � �(h) ln ri � �(h) lnwi �
�(h) ln ti � lni (3.1)
where the pro�tability of a �rm h settled in a country i is an increasing function
of the market potential MPi and the global factor productivity Ai in country i, and
is decreasing with regard to production factor costs and market failures prevailing
in country i. The location choice decision of a �rm depends on the comparison of
its pro�ts in each location. We present below the econometric investigation of this
decision.
1.1 A location choice model: the conditional logit
We must examine the individual location decisions of �rms, which corresponds to
the discrete choice of establishing a plant in one location. This type of decision
involves a particular econometric modeling, i.e. the models of qualitative choice.
These models calculate the probability that an individual will choose a particular
alternative among a set of alternatives based on the observations available to the
researcher. In our case, we seek to study the factors determining a speci�c �rm
single location choice between some unordered alternatives. An unordered choice
model particularly well-adapted to our theoretical framework is the model developed
by McFadden in 1974, i.e., the conditional logit (�rm �xed-e¤ects logit model).
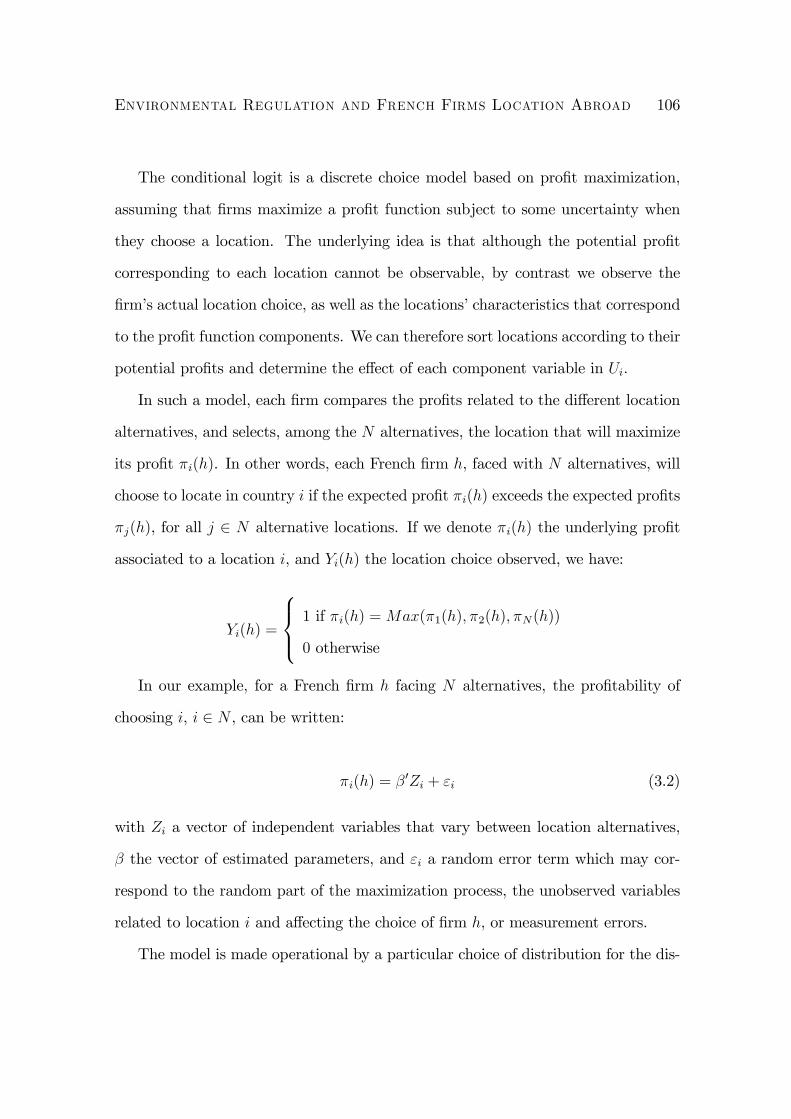
Environmental Regulation and French Firms Location Abroad 106
The conditional logit is a discrete choice model based on pro�t maximization,
assuming that �rms maximize a pro�t function subject to some uncertainty when
they choose a location. The underlying idea is that although the potential pro�t
corresponding to each location cannot be observable, by contrast we observe the
�rm�s actual location choice, as well as the locations�characteristics that correspond
to the pro�t function components. We can therefore sort locations according to their
potential pro�ts and determine the e¤ect of each component variable in Ui.
In such a model, each �rm compares the pro�ts related to the di¤erent location
alternatives, and selects, among the N alternatives, the location that will maximize
its pro�t �i(h). In other words, each French �rm h, faced with N alternatives, will
choose to locate in country i if the expected pro�t �i(h) exceeds the expected pro�ts
�j(h), for all j 2 N alternative locations. If we denote �i(h) the underlying pro�t
associated to a location i, and Yi(h) the location choice observed, we have:
Yi(h) =
8><>: 1 if �i(h) =Max(�1(h); �2(h); �N(h))
0 otherwise
In our example, for a French �rm h facing N alternatives, the pro�tability of
choosing i, i 2 N , can be written:
�i(h) = �0Zi + "i (3.2)
with Zi a vector of independent variables that vary between location alternatives,
� the vector of estimated parameters, and "i a random error term which may cor-
respond to the random part of the maximization process, the unobserved variables
related to location i and a¤ecting the choice of �rm h, or measurement errors.
The model is made operational by a particular choice of distribution for the dis-
Environmental Regulation and French Firms Location Abroad 107
turbances. With Yi(h) the random variable that indicates the choice made, McFad-
den showed that, if and only if the N disturbances are independent and identically
distributed with Weibull distribution, the probability that �rm h chooses location i
is given by:
Pr(Yi(h) = 1) = exp(�0Zi)=
NPj=1
exp(�0Zj) (3.3)
Our purpose here is the estimation of � for each explanatory variable Z for
location choice (i.e. for the underlying pro�tability function of each location). These
coe¢ cients will be estimated by the maximum likelihood technique, which consists
in �nding the values of the parameters that maximize the probability of observing
a given sample. In our case, the maximum likelihood technique will provide the
values of the parameters that maximize the probability of observing the particular
location choices made by the �rms of our sample.
This intuitive formulation of the conditional logit model presents nevertheless
some limits due to the assumption concerning the disturbances, which implies the
property of Independence from Irrelevant Alternatives (IIA). According to the IIA
property, the likelihood of making a choice is independent of the other alternatives.
In practice, this assumption could be problematic. In order to mitigate this problem,
in our econometric speci�cation we introduce in addition to the explanatory vari-
ables, dummy variables representing the �ve di¤erent groups of countries forming
our sample. With the assumption that the error terms are correlated only within
the groups of countries and not across the groups, the dummy variables (de�ned in
Section 2) should capture this correlation and reduce the IIA problem (see Head,
Ries and Swenson, 1995, for a similar technique).

Environmental Regulation and French Firms Location Abroad 108
1.2 Data description
1.2.1 Dependent variable: the location choice
Data concerning French �rms location choice have been gathered from the Subsidiaries-
Survey, conducted by the Directorate of Treasury and Economic Policy (DGTPE in
French) in 2002. This Department collects from French Economic Missions abroad
the census of French subsidiaries, de�ned as units whose capital is owned by a French
parent company by at least 10%. The best records in this survey, with no missing
points, concern for each subsidiary three variables used in our study: the French
classi�cation NAF93 code of the subsidiary�s sector, the host country and the year
the location choice was undertaken. Since we estimate our location model through
a conditional logit, other characteristics of �rms (e.g. size, age, etc.) for which we
do not have su¢ cient information will be captured by the �rm-�xed e¤ect implied
by such kind of models. Despite some potential imperfections in this database, due
to the missing observations, its use is of considerable interest for the study of FDI
determinants in general and the pollution haven hypothesis in particular, because
it allows to control for �rm-level and sectoral characteristics. Those characteristics,
such as the importance of economies of scale, holding speci�c advantages, explain
in a large part the �rms location abroad. In the case of the pollution haven hypoth-
esis, the sector of the �rm is of a prime importance. To assess how representative
is this database, the DGTPE notes that for 83% of the countries covered by the
survey, the NAF sector was �lled for more than 75% of the French subsidiaries (for
each country). Moreover, a quick analysis of the balance of payments indicates that
in 2000, 80% of the stocks of French investments concerned 12 countries (381 bil-
lions e out of 465 billions. Source: French Central Bank). A comparison with the
DGTPE database shows that these countries host 60% of the French international

Environmental Regulation and French Firms Location Abroad 109
subsidiaries present in the database.
From the host country point of view, each country may receive several or none
French FDI in a given year. However, we construct our database in a suitable
manner for performing conditional logit estimations. For each subsidiary, which
appears a single year in our database, i.e. when the investment decision occurred,
the dependent variable takes the value 1 for the chosen country and 0 for the other
countries in the sample. Thus, the total number of observations corresponds to the
number of �rms multiplied by the number of alternatives (countries in the sample).
We concentrate on the manufacturing industry, excluding the two-level NAF93
code DF "Coke, Petroleum Re�ning and Nuclear Industry" which corresponds to
speci�c sectors whose location determinants are beyond the scope of this study.
Since a monopolistic competition is assumed by the theoretical model, we remind
here that French manufacturing industries considered in this empirical work match
the characteristics involved by such a frame (important number of sellers who provide
di¤erentiated products).
Finally, our empirical sample covers 1374 French investments in 74 countries
from 1996 to 20026.
1.2.2 Explanatory variables
As we have seen through our base theoretical model developed in Chapter 2, the
pro�tability of a location for a �rm depends on the market potential of the location
and the �rm�s marginal cost of production, the latter being a function of the total
factor productivity, the production factor costs and market failures.
6See Appendix 3.B.

Environmental Regulation and French Firms Location Abroad 110
The market potential
The market potential is a general concept regarding the impact of demand on
�rms�location. Gross domestic product of the host country or its population are
the most commonly used proxies for demand variables, but they are very partial.
Indeed, measuring the local demand through these variables presents the major in-
convenience to not take into account the demands emanating from nearby countries
and the facility or di¢ culty to reach them. In this study we exceed these limits by
using the concept of market potential of a location. Here, market potential (MP )
means "demand accessibility". This concept was introduced by Harris (1954) who
proposed, as a measure of the potential demand that a �rm faces, the sum of eco-
nomic sizes of surrounding markets weighted over distances: MPHi =PN
j=1GDPjdistij
.
Harris�s (1954) idea is that producers tend to locate in the regions that guarantee
them a signi�cant degree of accessibility to various markets. The concept was then
validated by its deduction from the standard model of the new trade theory, such
as presented in Equation 4 in Chapter 2 (Krugman, 1992; Head and Mayer, 2004).
However, the presentation of the market potential à la Harris is insu¢ cient because
of the omission of the price index which allows to take into account the e¤ect of
competition. Besides, this simpli�cation supposes that the simple distance includes
all costs, while the literature on the border e¤ects on trade between countries re-
futes this hypothesis by underlining the importance of obstacles bound to borders
(McCallum, 1995; Head and Mayer, 2000).
The Market Potential we use in our work is derived from theory (See Section
3 in Chapter 2) and is given by the following expression: MPi =Pj
h�ij�EjGj
i, with
�ij = � 1��ij , Gj =P
i
Rni[ci (v) � ij]
1�� dv, � denotes the elasticity of substitution
between two varieties, ci is the marginal production cost in country i; � ij is the trade

Environmental Regulation and French Firms Location Abroad 111
cost, and �E is the share of the income spent on the purchase of manufactured goods
(See 3.A). Moreover, it is essential to consider, besides the distance, additional trade
costs induced by crossing borders and sharing or not a common language, while
estimating the market potential of all possible destinations. Following Redding and
Venables (2004) and Head and Mayer (2004), we build a measure of market potential
that aggregates the local demand and the demands emanating from nearby markets,
while taking into account the e¤ect of demand�s depreciation due to obstacles related
to shipping goods in space and across borders. The estimation technique is presented
in Appendix 3.A.
Moreover, given that market potential values have been calculated using estima-
tors of trade regression, the standard-errors of Equation 3.3 may be biased as they
include also trade equation�s errors. We use the bootstrap technique in order to
obtain correct standard-errors7.
Total factor productivity (TFP )
Since there is no available data on total factor productivity, we use here two prox-
ies: per capita GDP (GDPcap), which is a commonly used variable for productivity
approximation, and the estimated TFP growth (TFP_growth), capturing hence
simultaneously cross country di¤erences in TFP levels and growth, respectively.
For TFP_growth construction, we apply a "Growth Accounting" calculation
method, following the technique developed by Robert Solow (1956) to calculate
7The bootstrap is a computer-intensive statistical technique that plays an increasingly impor-tant role in modern statistical analysis and applications. Introduced �rstly by Efron (1979), thismethod is essentially a form of a larger class of methods that resample from the original data set,and thus, are called re-sampling procedures. Its �rst application was in estimating parameters ofcomplex distributions and its accuracy (standard error) and determining their con�dence intervals.Because of the bootstrap�s generality, it now has been applied to a much wider class of problems,including error rate estimation in discriminated analysis, subset selection in regression, logisticregression and classi�cation problems, and many others (Chernick, 1999).

Environmental Regulation and French Firms Location Abroad 112
the rate of technological progress. According to this technique and our theoreti-
cal model�s assumptions, the sources of output growth are: contribution of capital
growth ��KK; labor growth ��L
L, pollution growth ��Poll
Poll, and contribution of total
factor productivity growth �TFPTFP
. Thus, the technological progress in our study
(TFP_growth) equals output growth which is not explained by factors growth
(TFP_growth = �TFPTFP
= �GDPGDP
� ��KK� ��L
L� ��Poll
Poll)8.
Production factor costs
Following the theoretical model, the marginal cost of production faced by a �rm
is function of capital, labor and pollution costs.
Capital and labor costs In our study, we capture capital and labor costs
through the often used "countries�relative endowments in production factors" proxy,
represented by the variable KL. KL is the ratio K/L, with K the capital stock, and
L the total labor force9. Labor-abundant countries that have a weaker K/L ratio
are supposed to have lower wages than capital-abundant countries10. Conversely,
capital-abundant countries with a higher K/L ratio are supposed to have lower
capital costs than labor-abundant countries. Thus, a negative relationship between
KL and the probability of attracting FDI would imply attractiveness for a less costly
labor force. K/L controls for the di¤erences in relative factor endowments, referring
to the comparative advantage in the standard Heckscher-Ohlin international trade
8The coe¢ cients �, � and � are obtained by running regression: lnGDP = � lnK + � lnL +� lnPoll + ", for each country-group, separately, assuming for accuracy that countries from thesame group have similar factor shares.
9The capital stock is calculated by using the following formula: Kt= gross �xed capitalformationt + 0.95 capital stockt�1. Due to data availability (particularly concerning transitioncountries), the initial stock is represented by the gross �xed capital formation in 1990.
10This is valid when the same commodities are produced and when preferences are identical. Fortwo countries with identical demand patterns, relative factor prices should re�ect relative factorscarcities.

Environmental Regulation and French Firms Location Abroad 113
model.
Regarding the potential endogeneity between KL and our dependent variable,
we recall that capital is available worldwide, as highlighted in a recent report from
the French Board of Economical Analysis (Fontagné and Toubal, 2010). What en-
courages the investment in a country by a foreign company rather than a local and
better informed one, is that the former holds a speci�c advantage (in terms of tech-
nical know-how, organizational capacities. . . ) as compared to the local �rm, rather
than the mere opportunity of a movement of capital as suggested by Mundell (1957).
This �rm speci�c advantage has been evolved by Dunning (1977), under the OLI
paradigm (Ownership-Localisation-Internalisation). Therefore, the transfer of cap-
ital associated with the establishment of a subsidiary is not necessarily signi�cant,
and the risk of endogeneity of KL variable is weak.
Pollution cost The most complex cost to be represented is the environmental
regulation, for which there is no available precise measure. Thus, it is necessary to
have recourse to proxies in order to represent it in the best way. This task is even
harder in our case since the extent of our sample forces us to resort to dynamic
measures of the environmental regulation for a panel of various countries. To ad-
dress this problem, some studies have undertaken the construction of environmental
indexes with the aim of representing countries �environmental policy as correctly as
possible. But these works that have used or developed environmental indexes were
conducted on a few years and countries. For illustration, we can cite the complex
index created by Dasgupta et al. (2001), which evaluates the environmental perfor-
mance of 31 countries in 1990 using UNCTAD reports and focusing on the state of
regulations, existing laws, controls and enforcement measures, for air, water, land
and vital resources. This index, which was also used by Eliste and Fredriksson
Environmental Regulation and French Firms Location Abroad 114
(2002) who expanded it to 62 countries, presents the advantage of being available
for heterogeneous countries, but has the disadvantage that it only relates to one year.
Another index much more general since it takes into account 68 variables grouped
into 20 indicators, The Environment Sustainability Index, was used by Smarzynska
and Wei (2004), but it was only created in 2001. Thus, we had recourse to di¤erent
proxies that allowed us to compute a global and quite exhaustive Environmental
Regulation index for each country in our sample (see Appendix 3.B). This index
has initially been computed following two di¤erent techniques: Z-score method (Box
3) and Principal Component Analysis (PCA)11. Since the Z-score method is com-
monly used for computing aggregate indexes, while PCA analysis is rather used in
data description and for a reduction of data dimensionality, we retain Z-score ER
index (ER) for our core analysis, and use PCA ER index in a robustness test. The
obtained values of the index, which are presented in Appendix 3.B, con�rm in a
large extent the results of our analysis of the environmental policies in Chapter 1.
European developed countries have the highest values, while CIS and developing
countries have the worst ranks. In the middle, we mostly �nd emerging and CEE
countries.
11In statistics, principal components analysis is a technique that can be used to simplify adataset. Indeed, scoring principal components through PCA allows identifying speci�c trends byweighting components following their contribution to the global variance in the dataset. Moreformally it is a transform that chooses a new coordinate system for the data set such that thegreatest variance by any projection of the data set comes to lie on the �rst axis (then called the�rst principal component), the second greatest variance on the second axis, and so on. PCA canbe used for reducing dimensionality in a dataset while retaining those characteristics of the datasetthat contribute most to its variance.

Environmental Regulation and French Firms Location Abroad 115
Box 3: The Z-score methodThe Z-score method is a common statistical way of standardizing data on one
scale so a comparison can take place. We �rst calculate for each variable and
year, the distance between each country�s value and the mean of the group
expressed in standard-errors, following the formula: z =�Xjt �X t
�=�t. We
thus obtain values that allow to classify the countries below or above the mean.
Then, we calculate the unweighted average of all variables�z-scores. Finally,
we apply the standard normal percentile technique which gives the value 0 to
the least average Z-score and 100 to the highest.
Our ER index integrates four variables, which have the advantage of permitting
cross national comparisons in a systematic and quantitative fashion.
Multilateral Environmental Agreements (MEAs rati�ed):
This variable distinguishes countries having rati�ed several international envi-
ronmental agreements, proving this way their governments�concern about environ-
mental protection. We add up for each year the number of agreements rati�ed by a
country, since it is the rati�cation rather than the signature that imposes compliance
to international environmental treaties (see Smarzynska and Wei, 2004, for the use
of international treaties as a proxy for environmental regulation stringency). We
consider here nine major multilateral environmental agreements which have been
adopted before or during our period of study12. Thus, for each country in a given
year, the MEAs measure takes value "0" if no rati�cation occurred, "1" for a single
MEA rati�ed previous to or during that year, and so on, until taking value "9" for
countries that have rati�ed all the MEAs considered in our study.
12Multilateral Environmental Agreements included: the Ramsar Convention, the Conventionon Migratory species, the Vienna Convention, the Basel Convention on hazardous waste trade,the Convention on Biological Diversity, the United Nations Framework on Convention for ClimateChange, the Kyoto Protocol, the Biosafety Protocol and the Stockholm Convention on PersistentOrganic Pollutant.

Environmental Regulation and French Firms Location Abroad 116
International NGOs (INGOs�members/million of population):
This variable represents the density of international non-governmental organiza-
tions with membership. As mentioned by Dasgupta et al. (2001) and Smarzynska
and Wei (2004), international NGOs make local population sensitive to environ-
mental problems, and also put pressure on governments to respect laws. Thus, a
more important presence of international NGOs in a country would imply a more
stringent environmental regulation.
ISO 14001 (ISO 14001 certi�cations/billion US$ GDP):
We have integrated for each country the number of ISO 14001 certi�cations nor-
malized by the country�s GDP13. Even if ISO certi�cation is a private and voluntary
initiative, this variable manages to express a global state of mind prevailing in a
country. For instance, in the environmental approach adopted in Mexico at the
beginning of this century, these voluntary initiatives were encouraged by federal
institutions. For illustration, this variable is also used in the construction of the
Environment Sustainability Index jointly initiated by the Yale Center for Environ-
mental Law and Policy and Columbia University. One can suppose that a higher
number of 14001 ISO certi�ed �rms is the consequence of strict standards and con-
trols imposed by the government. Moreover, countries where this variable is the
most important should be considered as countries where population is the most
sensitive to environmental quality, implying thus a greater concern of �rms about
environmental issues.
GDP per unit of energy use:
This variable actually represents the inverse of energy intensity. The idea is
that regulatory restrictions tend to raise the GDP per unit of energy used, or in
13ISO 14001 standard is the widespread standard related to the environmental management.ISO 14001 environmental management standards help organizations to minimize the negative e¤ectof their operations on environment, and to comply with applicable laws and regulations.

Environmental Regulation and French Firms Location Abroad 117
other words to reduce energy-intensive production14. The interest of using such an
output-oriented quantitative indicator is that it provides an assessment of the e¤ec-
tiveness of preceding variables (see Cagatay and Mihci, 2003, for similar quantitative
indicators). This allows to distinguish countries that apply concrete environmental
measures from the ones that adopt a "theoretical" environmental policy not really
restrictive to �rms. We control for latitude when constructing this variable, since
relative energy use may be in�uenced by cross-country di¤erences in average tem-
peratures, rather than expressing real energy e¢ ciency. Thus, the obtained variable,
GDP/unit of energy used*latitude, is assumed to be netted out of the climate impact
and to capture therefore the environmental regulation e¤ect.
Our approach di¤ers from previous studies using a single proxy for stringency
of environmental regulation, since grouping all the above mentioned variables in a
single index allows us to encompass the general environmental regulation of coun-
tries according to di¤erent more speci�c environmental aspects. For instance, some
countries may have a small number of ISO 14001 certi�ed �rms, but high energy
e¢ ciency. The use of one variable rather than the other in the regression would
then give an incomplete vision of the local environmental regulation. For example,
Smarzynska and Wei (2004), using several proxies related to a particular dimension
of the environmental policy and taken separately in successive estimations, did not
manage to capture the general aspect of the environmental regulation, which may
have prevented them from proving explicitly pollution havens. Moreover, introduc-
ing a single and speci�c proxy for environmental regulation stringency can lead to
biased results. For example, if we only use the MEAs variable as the environmental
proxy without controlling for other aspects of the environmental policy climate, it
could capture in this case the state�s willingness to keep reliable relationships on in-
14However, this variable may also capture some e¤ects of technical progress.

Environmental Regulation and French Firms Location Abroad 118
ternational arena, which is usually favorable for FDI, rather than its direct concern
to international, and much less to domestic environmental compliance. Similarly, if
variables are not grouped, even their simultaneous introduction in a same regression
could conduct to misled interpretations, due to the speci�c meaning of each one.
Table 3.1 presents the correlations between the four variables components of the
ER index, the ER index and the per capita GDP. Some component variables are
well correlated, e.g. INGOs and Energy e¢ ciency variables (0.5214), or INGOs and
ISO 14001 variables (0.4580), while others, e.g. INGOs and MEAs, have a smaller
correlation coe¢ cient (0.2459). This lends support to our argument that these
variables measure each one a distinct aspect of environmental regulation, and that
taken together they represent the overall environmental policy stringency. Moreover,
the correlation between per capita GDP and the ER index indicates that the two
variables are correlated, but not in such a way that would prevent ER index of
capturing the proper e¤ect of the environmental regulation stringency.
Table 3.1: Cross correlation table for GDP per capita, ER index and its componentsVariables GDPcap ER index MEAs ISO14001 INGOs Energy
intensityGDPcap 1.0000
ER index 0.7372 1.0000(0.0000)
MEAs 0.3020 0.5893 1.00000.0000) (0.0000)
ISO14001 0.4118 0.5519 0.2900 1.0000(0.0000) (0.0000) (0.0000)
INGOs 0.6192 0.6920 0.2459 0.4580 1.0000(0.0000) (0.0000) (0.0000) (0.0000)
Energy intensity 0.6762 0.8099 0.4962 0.3325 0.5214 1.0000(0.0000) (0.0000) (0.0000) (0.0000) (0.0000)
The introduction of per capita GDP as a proxy for TFP enables us also control-
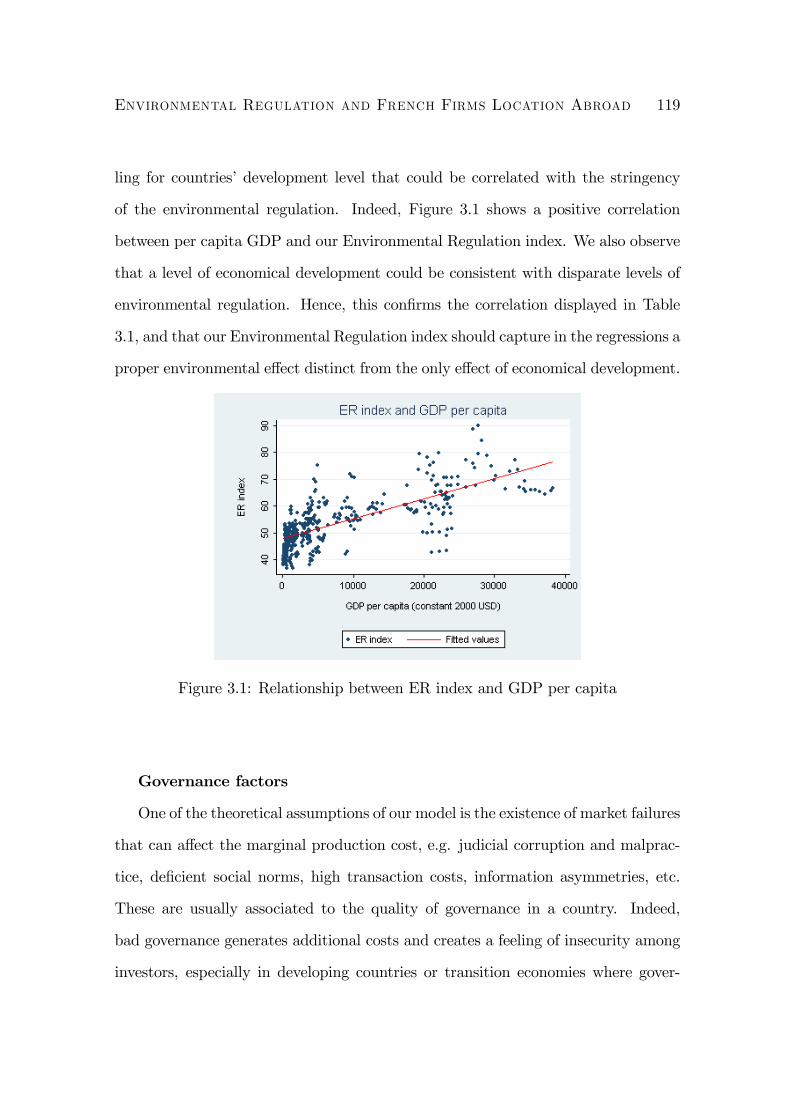
Environmental Regulation and French Firms Location Abroad 119
ling for countries�development level that could be correlated with the stringency
of the environmental regulation. Indeed, Figure 3.1 shows a positive correlation
between per capita GDP and our Environmental Regulation index. We also observe
that a level of economical development could be consistent with disparate levels of
environmental regulation. Hence, this con�rms the correlation displayed in Table
3.1, and that our Environmental Regulation index should capture in the regressions a
proper environmental e¤ect distinct from the only e¤ect of economical development.
Figure 3.1: Relationship between ER index and GDP per capita
Governance factors
One of the theoretical assumptions of our model is the existence of market failures
that can a¤ect the marginal production cost, e.g. judicial corruption and malprac-
tice, de�cient social norms, high transaction costs, information asymmetries, etc.
These are usually associated to the quality of governance in a country. Indeed,
bad governance generates additional costs and creates a feeling of insecurity among
investors, especially in developing countries or transition economies where gover-

Environmental Regulation and French Firms Location Abroad 120
nance failings are rather frequent. In this work, we use two governance indicators
developed by Kaufmann et al. (2005): the corruption level (CORRUP ) and the
government regulatory quality (REGULQUAL). CORRUP is the inverse of the
original Kaufmann index which re�ects the control of corruption in states, with a
higher value meaning a better governance outcome. Our corruption variable should
then have a negative e¤ect on location decisions as a result of greater corruption that
may be one reason for excessive deregulation harming economic e¢ ciency. At the
opposite, we expect the attractiveness of a location to increase with the government
ability to implement promoting regulations (REGULQUAL). Moreover, we include
a third variable capturing quality of doing business in a country, a dummy variable
FREE taking value "1" for countries considered by the Freedom House Organiza-
tion as to be free according to their political rights and civil liberties of citizens.
Recently, several studies have analyzed the relationship between fundamental de-
mocratic rights and FDI (Harms and Ursprung, 2002; Jensen, 2003; Li and Resnick,
2003; Busse, 2004), and found that multinational corporations are more likely to be
attracted by countries in which democracy is respected. Greater checks that exist
under democratic institutions prevent the state from predatory rent-seeking, making
the government�s commitment to private property credible, reducing expropriation
risks for foreign investors and thus attracting more FDI to democratic societies.
Democracy can also diminish information asymmetry by encouraging participation.
The in�uence that producers, consumers, trade unions, environmental organizations,
and other societal organizations exert on the process of setting standards provides
these parties with more knowledge about the production methods.
Preferential Trade Agreements (PTA) and colonial relationships
In order to control for any potential e¤ect on location choice of trade openness

Environmental Regulation and French Firms Location Abroad 121
between host countries and France, we add to the base variables de�ned by the
theoretical model the variable PTA. Variable PTA takes value "1" if a country is
a EU-member or has contracted a preferential trade agreement with the European
Union, consequently with France, and 0 otherwise.
Finally, we include a dummy (COL45) controlling for ex-colonial relationships
between France and potential FDI locations, which takes value "1" for countries in
colonial relationship with France post 1945, and 0 otherwise.
Appendix 3.E presents descriptive statistics for the independent variables and
information about the data.
2 Empirical results
Column (1) of Table 3.2 shows results from conditional logit estimations for our
global sample of countries. Besides variables presented in the preceding section, our
estimations include also dummy variables that we have created by grouping countries
in �ve homogeneous clusters: Developed for high-income countries, Emerging for
emerging countries, TrCEEC for transition CEEC, TrCIS for transition countries
of CIS, and Developing for other developing (low and middle income) countries.
Variables are log-linearized, and KL and ER variables have been lagged one-year
to avoid any possible endogeneity with the dependent variable15.
15In order to test the exogeneity status of some explanatory variables, we based our approachon the propositions of Grogger (1990), who discussed testing for exogeneity of the regressors andproposed the use of a Hausman speci�cation test after estimation of the model by IV. Taking theER index for example, we suppose that policy creation in year t may be function of the number offoreign �rms established that year or before, with no certitude for the next years. Hence, we runtwo regressions: one including ER index in t, and another with ER in t� 1. The statistic (chi2=12.68; Prob>chi2 = 0.4724) of the Hausman speci�cation test does not allow us to reject the nullhypothesis, indicating that model with one-year lagged ER index performs better, i.e. coe¢ cientsare consistent and e¢ cient.
Environmental Regulation and French Firms Location Abroad 122
2.1 Overall analysis
We observe that results are consistent with theory and our predictions. Concerning
our core variable, environmental regulation, it seems to be an important factor for
French manufacturing �rms�location decision. The estimated coe¢ cient of the en-
vironmental regulation index is negative and consistently signi�cant at the 1% level,
indicating that a more stringent environmental regulation deters French manufac-
turing investments. Also market potential, total factor productivity, existence of a
preferential trade agreement and ex-colonial relationships appear to be important
attractive factors for French direct investments abroad. Moreover, French �rms seem
to be attracted by labor-abundant countries, an increase in the K/L ratio having
a negative and signi�cant e¤ect on the location decision. Finally, host countries�
governance and democracy in�uence French �rms� decision to settle or not in a
country, since CORRUP and FREE variables have signi�cant coe¢ cients with the
expected signs. Thus, democratic societies attract French FDIs, while a high level
of corruption discourages them. REGULQUAL is not signi�cant, which may be
due to the high correlation between Kaufmann�s variables. The dummy variables
Emerging and Developing are signi�cant and indicate that between 1996 and 2002,
French �rms preferred to establish predominantly in emerging economies compared
to transition and developed countries, but with much less preference for developing
countries.
To go further in our analysis, we run separate regressions on two sub-samples:
high-polluting �rms (HPoll, Model (2)), and less-polluting �rms (LPoll, Model
(3)). HPoll point out to the common most polluting sectors: Basic metal industries
(NAF 3-digit codes 27.1-27.5), Chemical and parachemical industry (NAF codes
24.1�24.3 and 24.5�24.7), and Manufacture of pulp, paper and paperboard (NAF

Environmental Regulation and French Firms Location Abroad 123
Table 3.2: Conditional logit estimates (coe¢ cients)(1) (2) (3) (4)All HPoll LPoll Chow-type test
lnMP 0.604*** 0.867*** 0.571*** 0.606***(0.045) (0.183) (0.053) (0.046)
lnGDPcap 0.440*** 0.638* 0.417*** 0.327***(0.122) (0.381) (0.156) (0.107)
TFP_growth 0.012*** 0.008 0.013*** 0.013***(0.004) (0.012) (0.003) (0.004)
lnKLt�1 -0.578*** -0.836*** -0.548*** -0.464***(0.117) (0.327) (0.143) (0.100)
lnERt�1 -1.667*** -2.332*** -1.577*** -1.725***(0.240) (0.710) (0.222) (0.251)
lnERt�1 �HPoll -0.926**(0.422)
HPoll 3.680**(1.680)
lnCORRUP -1.077*** -1.812** -0.984*** -1.048***(0.202) (0.810) (0.286) (0.203)
lnREGULQUAL -0.404 -0.024 -0.431 -0.336(0.254) (0.892) (0.282) (0.254)
FREE 0.316*** 0.176 0.344*** 0.348***(0.095) (0.345) (0.089) (0.096)
PTA 0.421*** 0.067 0.457*** 0.486***(0.144) (0.673) (0.130) (0.136)
COL45 0.788*** -0.564 0.905*** 0.776***(0.104) (3.194) (0.128) (0.107)
Emerging 0.984*** 1.687*** 0.899*** 1.010***(0.193) (0.748) (0.184) (0.192)
TrCEEC 0.279 0.380 0.267 0.331*(0.183) (0.753) (0.171) (0.177)
TrCIS 0.462* 1.167 0.396 0.407(0.279) (0.911) (0.285) (0.281)
Developing -0.855*** -0.603 -0.900*** -0.858***(0.227) (0.928) (0.271) (0.224)
LR chi2 (H0: lnERt�1 �HPoll = 0 and HPoll = 0) 5.78Prob > chi2 0.0556Pseudo R2 0.0650 0.1005 0.0630 0.0540N. of obs. 96054 10740 85314 96054
Bootstrap standard errors in parentheses.* p<0.1, ** p<0.05, *** p<0.01
Environmental Regulation and French Firms Location Abroad 124
code 21.1); and LPoll refer to the other less-polluting �rms. By de�nition, the most
polluting �rms should be more a¤ected by a stricter environmental regulation.
Examining estimation results of the two models, we �rst notice that a high num-
ber of coe¢ cients keep sign and signi�cance, which attests to the robustness of our
main results. Nevertheless, parameters estimates reveal some particular characteris-
tics speci�c to most polluting �rms. TFP growth, existence of a democratic society,
preferential trade agreements and ex-colonial relationships do no longer have a sig-
ni�cant impact on location choice of high-polluting �rms in column (2), whilst they
still do for the less-polluting ones in column (3). Regarding the estimated coe¢ -
cient of environmental regulation index, it remains negative and signi�cant in both
models, implying that environmental regulation in�uences both high-polluting and
less-polluting �rms. Moreover, the e¤ect of the environmental regulation on the lo-
cation decision of the most polluting �rms appears to be stronger than the one found
for the less polluting �rms. However, as we cannot directly compare coe¢ cients for
our two sub-samples, we perform a Chow-type test in order to check for statistical
di¤erence between ER coe¢ cients (Model 4). Thus, the last column of Table 3.2
shows an e¤ect of ER index for high-polluting �rms (interaction termERt�1�HPoll)
statistically di¤erent from the e¤ect reported for less-polluting �rms. We then test
for the null hypothesis H0 : �LPoll = �HPoll. The Chi2 value of 5.78 allows us to
reject the null hypothesis of an identical behavior between most polluting and less
polluting sectors at the 5.6% level. Everything else equal, all industries have interest
to avoid additional costs induced by stricter environmental regulation since there is
generally no totally "clean" manufacturing sector, but this e¤ect is even stronger
for the most polluting sectors. Moreover, the environmental regulation seems to be
a more decisive factor for the most polluting �rms, since as above mentioned, four

Environmental Regulation and French Firms Location Abroad 125
variables become non signi�cant in Model (2). On the contrary, those variables keep
signi�cant e¤ects on location choice of less-polluting �rms, and are thus more likely
to o¤set the ER e¤ect. Hence, our empirical results highlight evidence of pollution
haven hypothesis for the most polluting �rms.
To draw more precise conclusions, we aim to interpret the magnitude of the en-
vironmental regulation�s e¤ect on French �rms�location. If one needs a regression
coe¢ cient expressing e¤ects of units of X on the probability of Y, the "elasticity" is
suggested. Nevertheless, conditional logit estimates allow only calculation of indi-
vidual elasticities for each alternative and we cannot have a uniformed e¤ect for all
of them. However, we can �rst calculate the predicted probability P1 of getting FDI
when ER value is �xed at its sample mean. Then, we change ER variable by one
standard deviation, and recalculate the probability P2 of getting FDI. The di¤erence
in the predicted probabilities (P 2=P 1 = [1 + (st:dev(ER)=mean(ER))]^� ) can be
interpreted as the e¤ect of a one-standard deviation change in ER on the probability
of attracting FDI, when all other variables are held constant at sample mean values.
Thus, we �nd for the global sample in Model (1) that a 1-standard deviation shock
on ER index would decrease the attractiveness of the "average country" (in terms
of ER value) by 24.6%. For illustration, following ER values reported in Table 3.9,
Chile (�average country�) has 24.6% less chances than Uruguay to receive French
FDI, and as much more chances than Ecuador. For the most and the less polluting
�rms this e¤ect represents 32.7% and 23.5%, respectively. Consequently, this way of
evaluating the magnitude of ER e¤ect is of a big interest as it permits to examine
the e¤ect on every alternative, not only on the average country.
This strongly deterrent e¤ect of strict environmental regulations on �rms location
choice con�rms the importance of the use of �rm-level data when seeking for the

Environmental Regulation and French Firms Location Abroad 126
pollution haven hypothesis. Indeed, our results corroborate those suggested by
the location choice studies that detect a weak relationship between environmental
stringency and manufacturing plant locations (Levinson, 1996; List and Co, 2000).
However, unlike these two studies, our analysis explores international di¤erences
in environmental policy that are more exacerbate across countries, and this may
partly explain why the negative relationship is emphasized in our work. Comparing
our �ndings with those of Raspiller and Riedinger (2005), who also examine French
industries but �nd that pollution intensive goods are more likely to be imported
from stringent countries, we suggest some explanations for our divergent results.
Firstly, the study of Raspiller et Riedinger (2005) considers imports of 1999, while
the index of environmental stringency of Esty and Porter that they use is related
to the year 2001. However, the relative stringency of countries changed between
1999 and 2001, and countries that were relatively less stringent in 1999 may have
strengthened their environmental policy (see Table 3.9), making the use of their
variable of interest inappropriate. This is con�rmed in their robustness test using
the prior index of Eliste and Fredriksson, whose coe¢ cient turns to be insigni�cant.
Moreover, the main result of this study comes from a regression incorporating only
the environmental severity index and dummy variables for countries. When the
authors incorporate other explanatory variables, such as factor costs, the negative
coe¢ cient on the environmental severity of originating countries loses signi�cance.
More generally, their speci�cation su¤ers from omitted variable bias.
2.2 Country-group analysis
Given that a signi�cant ER e¤ect was found for all, high-polluting and less-polluting
�rms, we conduct our extended empirical analysis on the full sample of French �rms

Environmental Regulation and French Firms Location Abroad 127
locating abroad, in order to assess the behavior of all manufacturing sector �rms
and consider the largest number of observations. Based on the previous results,
which provide evidence of a strong pollution haven e¤ect, we intend to distinguish
which countries are the most likely to constitute pollution havens. To this goal, we
need to introduce interaction terms between the environmental regulation index and
country-group dummies. However, as noted by Ai and Norton (2003) and Norton et
al. (2004), the marginal impact of an interaction e¤ect in a non-linear model is not
simply the coe¢ cient for this interaction. Because there are two additive terms and
each can be positive or negative, the interaction e¤ect may have di¤erent signs for
di¤erent values of covariates. In order to deal with this complication, we will apply
a procedure developed by Norton et al. (2004) that computes correct magnitudes
and standard errors of the interaction e¤ect (Section 2.2.2).
2.2.1 Basic results
Table 3.3 displays marginal e¤ects of Model (1) variables as well as ER interaction
terms with Developed, Emerging, CEEC, CIS, and Developing dummies in the
respective columns. All explanatory variables maintain their sign and signi�cance
across all country-group models, as compared to Model (1). Concerning the e¤ect
of the environmental regulation for speci�c country groups, only looking at Table
3.3 results, we observe positive and signi�cant interaction terms which seem to
o¤set the negative ER variable�s marginal e¤ect for CIS and Developing countries
in columns (8) and (9), meaning that more stringent environmental regulation in
these countries attracts FDI. On the contrary, the smaller magnitude of the positive
interaction term for CEEC (not o¤setting the ER variable�s marginal e¤ect), the
insigni�cant interaction term for the emerging economies and the negative strongly
signi�cant interaction term for developed countries con�rm a pollution haven e¤ect
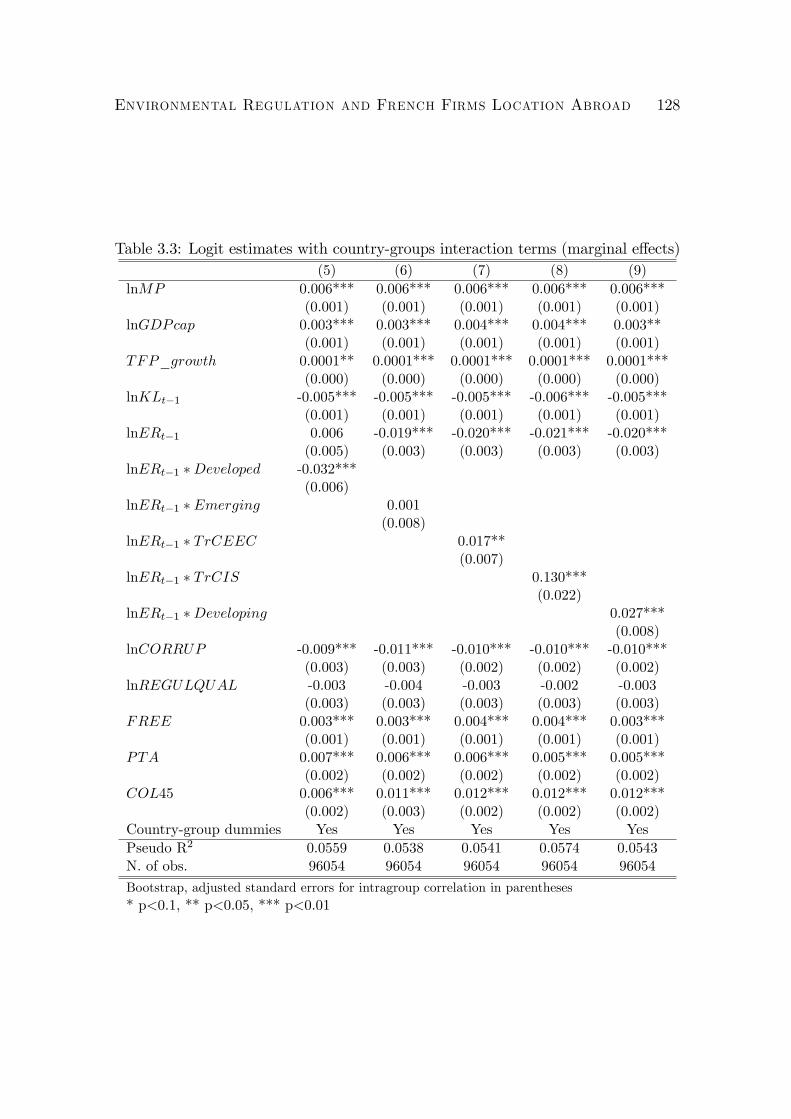
Environmental Regulation and French Firms Location Abroad 128
Table 3.3: Logit estimates with country-groups interaction terms (marginal e¤ects)(5) (6) (7) (8) (9)
lnMP 0.006*** 0.006*** 0.006*** 0.006*** 0.006***(0.001) (0.001) (0.001) (0.001) (0.001)
lnGDPcap 0.003*** 0.003*** 0.004*** 0.004*** 0.003**(0.001) (0.001) (0.001) (0.001) (0.001)
TFP_growth 0.0001** 0.0001*** 0.0001*** 0.0001*** 0.0001***(0.000) (0.000) (0.000) (0.000) (0.000)
lnKLt�1 -0.005*** -0.005*** -0.005*** -0.006*** -0.005***(0.001) (0.001) (0.001) (0.001) (0.001)
lnERt�1 0.006 -0.019*** -0.020*** -0.021*** -0.020***(0.005) (0.003) (0.003) (0.003) (0.003)
lnERt�1 �Developed -0.032***(0.006)
lnERt�1 � Emerging 0.001(0.008)
lnERt�1 � TrCEEC 0.017**(0.007)
lnERt�1 � TrCIS 0.130***(0.022)
lnERt�1 �Developing 0.027***(0.008)
lnCORRUP -0.009*** -0.011*** -0.010*** -0.010*** -0.010***(0.003) (0.003) (0.002) (0.002) (0.002)
lnREGULQUAL -0.003 -0.004 -0.003 -0.002 -0.003(0.003) (0.003) (0.003) (0.003) (0.003)
FREE 0.003*** 0.003*** 0.004*** 0.004*** 0.003***(0.001) (0.001) (0.001) (0.001) (0.001)
PTA 0.007*** 0.006*** 0.006*** 0.005*** 0.005***(0.002) (0.002) (0.002) (0.002) (0.002)
COL45 0.006*** 0.011*** 0.012*** 0.012*** 0.012***(0.002) (0.003) (0.002) (0.002) (0.002)
Country-group dummies Yes Yes Yes Yes YesPseudo R2 0.0559 0.0538 0.0541 0.0574 0.0543N. of obs. 96054 96054 96054 96054 96054
Bootstrap, adjusted standard errors for intragroup correlation in parentheses* p<0.1, ** p<0.05, *** p<0.01

Environmental Regulation and French Firms Location Abroad 129
for these country-groups. However, as previously mentioned, the interaction e¤ect�s
magnitude and signi�cance may vary across the range of predicted values, and these
early conclusions can be misleading.
2.2.2 Norton et al. methodology for interaction e¤ects
To facilitate the computation and the interpretation of interaction e¤ects in non lin-
ear models, the procedure developed by Norton et al. (2004) has been implemented
in Stata software through the inte¤ module, and is suitable for logit and probit
models. With the aim of adapting this methodology to our conditional logit model,
we �rst run estimation of Model (1) through a logit model with adjusted standard-
errors for intragroup correlation16. Since the results are consistent with those found
with the conditional logit, we can then use them and apply the methodology recom-
mended by Norton�s et al. (2004). The methodology allows us to visualize for each
country-group the correct interaction e¤ect through two �gures: the �rst stands for
the amplitude of the interaction term�s marginal e¤ect, and the second for its sta-
tistical signi�cance. The respective �gures for our �ve country-groups are displayed
in the Appendix 3.C.
First, for Developed countries in Figure 3.2, we notice on the Y-axis of the �rst
graph a negative interaction e¤ect lying between -0.38 and -0.003. Moreover, it is
strongly signi�cant since the z-statistics on the Y-axis of the second graph are below
the bottom horizontal line representing the critical value of -1.96, and corresponding
to the 5% signi�cance level. Therefore, since ER is not signi�cant in Table 3.3, its
marginal e¤ect for Developed countries lies between -0.38 and -0.003.
Second, we observe that Figure 3.3 regarding Emerging economies shows a neg-
ative interaction term, but not signi�cant, since observations have z-statistics lying
16Estimation results available upon request.

Environmental Regulation and French Firms Location Abroad 130
between the critical values (-1.96; +1.96) (the latter being represented by the up-
per horizontal line on the Y-axis). Therefore, the ER marginal e¤ect for Emerging
economies is negative, and corresponds to the ER marginal e¤ect of - 0.019 in Model
(6).
Next, we examine Figure 3.4 corresponding to CEEC, and we observe that the
interaction e¤ect is positive across all observations, but statistically insigni�cant
across practically the entire range of predicted probabilities of choosing a CEE
country (X-axis). Moreover, the few observations for which this interaction term
is statistically signi�cant, namely those having the smallest predicted probabilities
(below 0.02), have also the lowest marginal e¤ects that don�t o¤set the ER variable�s
marginal e¤ect from Model (7). Hence, the environmental regulation�s e¤ect for
CEEC corresponds globally to the ER variable�s marginal e¤ect reported in Model
(7) of Table 3.3, i.e. - 0.020.
As regards Figure 3.5 for CIS countries in Appendix 3.C, we observe a positive
interaction e¤ect, statistically signi�cant for almost all the observations, and taking
values that generally o¤set the negative ER marginal e¤ect of -0.021 in Model (8).
However, a negative e¤ect of ER index does still exist for a minor part of CIS
observations for which this positive interaction term is not statistically signi�cant,
implying thus the negative ER marginal e¤ect of -0.021 which was obscured in Table
3.3.
Finally, the opposite of the pollution haven e¤ect is found for nearly the entire
group of Developing countries. Examining Figure 3.6, we underline a highly signi�-
cant positive marginal e¤ect for the interaction term ERt�1 �Developing, o¤setting
the negative ER marginal e¤ect of -0.020 in Model (9) until reaching positive values
up to 0.26. That means French �rms are attracted by a more rigorous environmental
Environmental Regulation and French Firms Location Abroad 131
regulation in this country-group.
To sum up, our country-group analysis highlights evidence of pollution haven
e¤ects for Developed countries, Emerging economies, and CEEC, i.e. a more strin-
gent environmental regulation in these countries deters French FDI. At the opposite,
except for a minor part of CIS observations for which a pollution haven e¤ect was
found, this country group and Developing countries tend to attract French �rms
when their environmental regulation becomes more severe. These �ndings indicate
that as well as they are dissuaded from investing in strongly regulated countries,
French �rms�are reluctant to locate in countries where the environmental policy
is considered to be too lenient. Thus, the decision to invest seems to be bounded
between a minimum and a maximum of ER levels. In this interval, the French �rms
invest, otherwise they do not.
2.2.3 A non-linear e¤ect of environmental regulation?
In order to test for this potential nonlinearity in the ER e¤ect on French �rms�
location, we run three complementary regressions, including �rstly ER squared,
and then interaction terms between ER and dummies ranging countries according
the median and the quartiles of ER index. These results are reported in Table 3.4.
Results from the estimation of Model (10) con�rm our assumption of a nonlinear
e¤ect of the environmental regulation, since the ER coe¢ cient is positive while ER
squared turns out to be signi�cantly negative. At lower ER values, environmental
regulation has a positive e¤ect on French FDI, whilst it has a negative e¤ect on
�rms�location decision at higher values of ER index17.
17In a di¤erent context, involving inward FDI in the United States, Fredriksson et al. (2003)also �nd a nonlinear impact of environmental regulation on FDI in some speci�cations. However,they report a U-shaped relationship, and suggest that US states with relatively strict regulationsmay attempt to attract foreign �rms by overcompensate them.

Environmental Regulation and French Firms Location Abroad 132
Table 3.4: Testing for non linearity in ER index (marginal e¤ects)(10) (11) (12)
lnMP 0.006*** 0.005*** 0.007***(0.000) (0.001) (0.000)
lnGDPcap 0.004*** 0.004*** 0.004***(0.001) (0.001) (0.001)
TFP_growth 0.0001** 0.0001** 0.0001**(0.000) (0.000) (0.000)
lnKLt�1 -0.006*** -0.005*** -0.006***(0.001) (0.001) (0.001)
lnERt�1 0.750*** 0.077*** -0.049***(0.108) (0.011) (0.006)
(lnERt�1)2 -0.094***(0.013)
lnERt�1 � ERup50 -0.103***(0.011)
lnERt�1 � ERto75 0.058***(0.008)
lnCORRUP -0.009*** -0.007*** -0.011***(0.003) (0.003) (0.002)
lnREGULQUAL -0.003 -0.001 -0.006**(0.003) (0.002) (0.002)
FREE 0.002** 0.003*** 0.002**(0.001) (0.001) (0.001)
PTA 0.005*** 0.004** 0.006***(0.002) (0.002) (0.002)
COL45 0.008*** 0.012*** 0.005***(0.002) (0.002) (0.002)
ERup50 1.000***(0.000)
ERto75 -1.000***(0.000)
Country-group dummies Yes Yes YesPseudo R2 0.0589 0.0598 0.0589N. of obs. 96054 96054 96054
Bootstrap, adjusted standard errors for intragroup correlation in parentheses* p<0.1, ** p<0.05, *** p<0.01

Environmental Regulation and French Firms Location Abroad 133
Further, we wonder about the range of ER values where the switch from a pos-
itive to a negative e¤ect of the ER index takes place. First, we run Model (11)
including an interaction term between ER and a dummy ERup50 taking value "1"
for more regulated countries (ER superior to the median), 0 otherwise. Hence, the
separate ER variable captures the environmental e¤ect for less regulated countries
(ER inferior to the median). The estimation results con�rm the �ndings of Model
(10): stringency of environmental regulation deters FDIs at higher values of ER, and
attracts them at lower values. Apart from most of observations for which we �nd
strongly negative and statistically signi�cant values, our Figure 3.7 for the respec-
tive interaction term (ERt�1 � ERup50) in Appendix 3.C shows some insigni�cant
observations, positively signi�cant values, and negatively signi�cant values that do
not o¤set the positive e¤ect of ER variable. Therefore, amongst countries with
an ER superior to the median, some of them still have a positive impact of their
environmental regulation on FDI. Consequently, we add a quartile to the median
and reclassify countries depending on whether their ER is situated below or above
the third quartile. Model (12) includes thus an interaction term between ER and
a dummy taking value "1" for countries with their ER included in the �rst three
quartiles, (ERt�1 �ERto75). The separate ER variable captures the environmental
e¤ect on FDI for countries with their ER in the last quartile, i.e. the most regulated
ones. We �nally �nd a strong pollution haven e¤ect for the latter. Concerning the
interaction term, we observe in Figure 3.8 that it is positive and signi�cant for nearly
all the observations, generally o¤setting the ER negative marginal e¤ect of -0.049
in Model (12). However, we should note some discrepancies: a few observations are
negative, some are not signi�cant, and for other ones the positive interaction e¤ect
doesn�t o¤set the negative ER variable�s e¤ect. In all cases, the ER marginal e¤ect
Environmental Regulation and French Firms Location Abroad 134
for these few observations is therefore negative. Hence, we have a negative ER e¤ect
on FDI in the up quartile of ER index, a positive e¤ect below ER median, and an
ambiguous e¤ect in the third quartile of ER index. The turn-over is thus expected
to be in the observed range of data, and more precisely in the third quartile.
Explanations for this nonlinear relationship, and especially for the positive e¤ect
of ER in the less developed countries, are closely related to international compet-
itiveness, since exports must often meet product standards higher than those of
the producing developing country18. Many of the factors shaping the competitive-
ness at the foreign subsidiary level, despite its own "clean" and highly performing
technologies, are, in fact, determined at the level of the hosting national economy.
Among these factors one could mention the provision of environmental infrastruc-
ture, such as water pipes, wastewater treatment facilities and land�lls for waste,
etc.. Similarly, �rms from speci�c sectors could use natural resources in their pro-
duction process, and then need the inputs to be relatively clean in order to be able
to produce an acceptable output (manufacture of food and beverages, wood, etc.).
Another argument would be that multinational �rms should respect a minimum of
environmental standards requested by their internal global policy, meeting generally
well international standards. Indeed, there are numerous examples of corporate cul-
ture and concern about brand image a¤ecting business preferences over regulatory
standards. By the late nineties, more than 80 multinational enterprises had estab-
lished social codes of conduct, with an overwhelming majority of these codes applied
to all of a �rm�s units and sub-contractors (Kolk, van Tulder and Welters, 1999).
Thus, when creating a new subsidiary or searching for domestic partners, since they
18Investors from developed countries often undertake business in the developing countries inorder to bene�t from production costs, reexporting then their products to other developed or de-veloping countries (vertical multinationals). This is unlikely to occur with investments in developedcountries which are often driven to supply the local market demand (horizontal multinational).

Environmental Regulation and French Firms Location Abroad 135
should adopt standards that are consistent with their corporate culture and with
their brand image, multinational corporations would prefer to be ensured that a
minimum compliance to international environmental standards is already in place,
in order to facilitate investments and technology transfers. Similarly, as �rms try to
develop globally identi�able brands, they will be sensitive to anywhere big regula-
tory violations that could harm the brand image (Spar, 1998). Finally, the decisions
of investing abroad are often long-term decisions that commit �rms for the future.
Faced with alternatives that all actually give opportunity to lower environmental
costs, multinational �rms should then favor countries with a policy design providing
more �exibility for meeting future more stringent environmental standards.
2.3 FDI mode of entry analysis
Multinationals may enter a host market by di¤erent modes of FDI, e.g. green�eld
investments, joint ventures, mergers and acquisitions (M&A). Given the explosion
of cross-borders M&A in the nineties, questions arose about the characteristics and
the impacts of each mode, and some studies recently attempt to respond to these
interrogations (UNCTAD, 2000; Mattoo et al., 2004; Ra¤ et al., 2009). However,
this heterogeneity of FDI has not been well documented in the context of the pol-
lution haven hypothesis. One reason may be the lack of information. Moreover, as
mentioned by Basile (2004), location analyses generally examine either aggregate
investments or green�eld investments, and rarely contrast green�eld and acquisition
entry. Luckily, in our database, this information about the FDI mode of entry is
available for some �rms, for which we know if the location choice takes the form of
an acquisition of a local �rm (M&A) or a creation of a new �rm (green�eld invest-
ment). Since this information is not exhaustive as it would be required for a strong

Environmental Regulation and French Firms Location Abroad 136
analysis of each mode of FDI, our ambition in this section is just to exploit data
that is of great interest, and to assess the sensitivity of our results to the FDI mode
of entry. Thus, this attempt consists in providing some early results.
Thus, we run two separate regressions, one on the sub-sample of acquired �rms
in Model (13), and in Model (14) on the sub-sample of created �rms. Results are
reported in Table 3.5 below.
We observe that results are similar for both kinds of FDI, and that they look like
those of Model (1) despite some changes in magnitudes for M&A. Comparing the
two types of FDI, we only notice small di¤erences in the magnitudes of the market
potential, the environmental regulation, and the FREE variables. However, these
small changes do not contribute to mitigate previous results. The larger coe¢ cient
on the market potential variable in Model (14) is consistent with a higher incen-
tive for green�eld investments to capture a new market share. However, we rather
expected a higher sensitivity of green�elds investments to governance factors, i.e.
FREE, since those investments are disadvantaged by lack of information about
business "habits". As regards the environmental regulation, its larger negative coef-
�cient on the creation of �rms suggests that in our sample, green�eld investments are
more attracted by a decrease in environmental stringency, which could mention that
they are less likely to use modern and cleaner technologies than M&A. Although
generally, green�eld investments are expected to bring more advanced techniques,
this opposite case can occur if investors want to bene�t from the independence pro-
vided by the green�eld form to take advantage of weak regulations and use costless
and more polluting techniques. If this is true, it would partly explain the strong
negative e¤ect of environmental regulation on location choice found above. It would
underline a speci�city of green�eld investments driven by pollution haven motives.
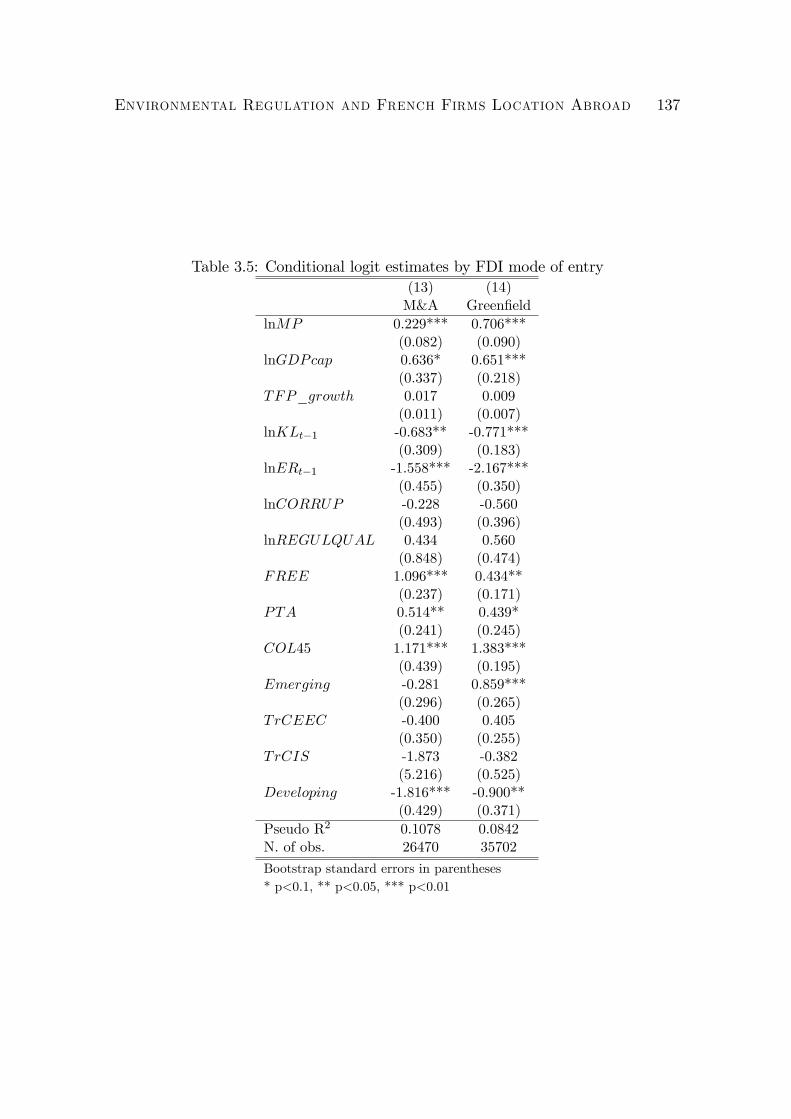
Environmental Regulation and French Firms Location Abroad 137
Table 3.5: Conditional logit estimates by FDI mode of entry(13) (14)M&A Green�eld
lnMP 0.229*** 0.706***(0.082) (0.090)
lnGDPcap 0.636* 0.651***(0.337) (0.218)
TFP_growth 0.017 0.009(0.011) (0.007)
lnKLt�1 -0.683** -0.771***(0.309) (0.183)
lnERt�1 -1.558*** -2.167***(0.455) (0.350)
lnCORRUP -0.228 -0.560(0.493) (0.396)
lnREGULQUAL 0.434 0.560(0.848) (0.474)
FREE 1.096*** 0.434**(0.237) (0.171)
PTA 0.514** 0.439*(0.241) (0.245)
COL45 1.171*** 1.383***(0.439) (0.195)
Emerging -0.281 0.859***(0.296) (0.265)
TrCEEC -0.400 0.405(0.350) (0.255)
TrCIS -1.873 -0.382(5.216) (0.525)
Developing -1.816*** -0.900**(0.429) (0.371)
Pseudo R2 0.1078 0.0842N. of obs. 26470 35702
Bootstrap standard errors in parentheses* p<0.1, ** p<0.05, *** p<0.01

Environmental Regulation and French Firms Location Abroad 138
Since the investigation of M&A and green�eld investments is beyond the scope
of this actual work, our analysis should be extended to draw general conclusions
about the determinants of each mode of FDI. However, it contributes to take into
account some heterogeneity of FDI. Results mention that in a framework of pollu-
tion haven hypothesis, the impact of the environmental regulation on FDI does not
substantially di¤er with the FDI mode of entry. Nevertheless, we should be cautious
in interpreting this result which requires to be con�rmed through the use of more
reliable data. This will be undoubtedly the subject of further extended analysis.
3 Robustness checks
Tables 3.6 and 3.7 present results from some robustness checks. Table 3.6 reports
results of regressions testing alternative proxies for our core model variables, while
Table 3.7 presents robustness checks of our main results obtained through alternative
estimation methods.
In Models (15), (16) and (17) of Table 3.6, we assess the sensitivity of Model (1)
results to the environmental regulation variable used. We successively replace ER by
three alternative environmental regulation variables: ER(PCA), GASUNLEAD
and ENV TAX. ER(PCA) is an environmental regulation index including the
same component variables as ER (Z-score), but computed through the PCAmethod.
GASUNLEAD variable represents the market share of unleaded versus leaded gaso-
line. Damania et al. (2003) have previously used the lead content in gasoline to
represent the stringency of environmental policy, and they recall that this variable
had also been used by Deacon (1999) and Hilton and Levinson (1998) to proxy the
environmental regulation in other kinds of studies. Indeed, since lead constitutes a
harmful air pollutant, relatively strict countries should allow a lower lead content

Environmental Regulation and French Firms Location Abroad 139
Table 3.6: Robustness tests with alternative variables (coe¢ cients)(15) (16) (17) (18) (19)ER ER ER KL MP
lnMP 0.608*** 0.437*** 0.540*** 0.395**(0.045) (0.070) (0.115) (0.056)
lnGDPdist 0.882***(0.091)
Adjacency 0.336**(0.131)
LangEthn 0.199*(0.117)
lnGDPcap 0.537*** 0.584*** -0.054 -0.209*** 0.486(0.117) (0.216) (0.323) (0 .063) (0.135)
TFP_growth 0.012*** 0.007 0.035*** 0 .022*** 0.014***(0.004) (0.005) (0.013) (0 .003) (0.004)
lnKLt�1 -0.685*** -0.347* -0.409 -0.665***(0.111) (0.209) (0.300) (0.130)
lnRER -1.846***(0.382)
lnRIR 0.877***(0.411)
lnERt�1(PCA) -1.880***(0.317)
GASUNLEADt�1 -0.005***(0.002)
lnENV TAX -1.367***(0.244)
lnERt�1 -1.917*** -2.593***(0.300) (0.326)
lnCORRUP -0.908*** 0.545 -1.807** -1.454*** -1.799***(0.208) (0.401) (0.805) (0.399) (0.192)
lnREGULQUAL -0.457* 0.253 -3.352*** -1.561** -0.170(0.253) (0.548) (1.038) (0.706) (0 .244)
FREE 0.324*** 0.659*** -0.033 -0.151 0.143(0.093) (0.156) (0.660) (0.108) (0.093)
PTA 0.408*** -0.434** 0.428*** -0.110 -0.059(0.121) (0.197) (0.119) (0.215) (0.219)
COL45 0.887*** 1.033*** 0.335** 0.604***(0.110) (0.226) (0.161) (0.179)
Emerging 0.982*** -0.122 0.372* 1.198***(0.198) (0.287) (0.202) (0.180)
TrCEEC 0.276 -0.534* -0.128 0.748***(0.185) (0.292) (0.218) (0.173)
TrCIS 0.468* 0.500 -0.503 0.679***(0.284) (0.450) (0.335) (0.258)
Developing -0.899*** -1.418** -1.773*** -0.650***(0.237) (0.556) (0.249) (0.226)
Pseudo R2 0.0637 0.0354 0.0355 0.0785 0.0676N. of obs. 96054 37698 9642 39443 96054
Bootstrap standard errors in parentheses* p<0.1, ** p<0.05, *** p<0.01

Environmental Regulation and French Firms Location Abroad 140
in gasoline. Data concerning lead contents being not available for all countries and
years in our sample, we rather include in our analysis the market share of unleaded
gasoline which is a closely related measure: in relatively strict countries, unleaded
gasoline should be promoted against leaded gasoline (Model 16). Finally, in Model
(17), ENV TAX represents the total environmental tax revenues in the European
countries, expressed as a share of their GDP. Although our sample is restricted to
European countries in this case, this variable has the twofold advantage of being
directly observed in those countries, as well as to be the most close to our base the-
oretical model. In all of these models, the environmental regulation variable keeps
its negative and signi�cant e¤ect on �rms�location choice, even if Models (16) and
(17) show some di¤erent results for the other explanatory variables, that could be
explained by the di¤erent sample composition and size as compared with Model (1).
The common use of the KL variable, that is proportional to the ratio of wages
to capital cost under the assumption that all countries have a common production
function, could be too restrictive. Errors in this variable may be correlated with
environmental regulation, which would result in bias. To check the potential bias
induced, we decide to perform a robustness test by introducing two alternative
variables, i.e. the real exchange rate RER and the real interest rate RIR (Model
18, Table 3.6). RER is used as a proxy for di¤erences in real wage levels and
RIR is a proxy for capital cost di¤erences. Our empirical results show that RER
is signi�cantly negative and RIR is signi�cantly positive. The negative impact of
RER is consistent with the fact that French investors are seeking for a cheaper
workforce. As regards RIR, we could explain its positive sign (opposite to the
one predicted by the theoretical model), following two judgments. First, French
investors, originates from a developed country (capital abundant), are more likely

Environmental Regulation and French Firms Location Abroad 141
to seek for another comparative advantage than the capital cost, i.e. a cheap labor
force. Given that these two variables are interdependent, as labor force is cheaper
in labor abundant countries which have usually higher capital costs, it seems that
the seeking for a cheaper labor force prevails on the seeking for a cheaper capital in
our case, since French investors could come with their own capital (much cheaper).
Second, since access to capital is an important factor for per capita GDP, there may
also be multicollinearity between these two variables. Indeed, our results indicate for
such a bias, as GDPcap e¤ect turns to be negative. Nevertheless, all other variables
are rather robust, and especially the ER e¤ect that keeps a close magnitude.
Next, we test for the robustness of our Market Potential variable in Model (19),
where we introduce more common measures of market size and its accessibility,
namely the variables GDPdist (GDP of host country normalized by its distance
from France), Adjacency (sharing a common border), and LangEthn (sharing a
common, ethnic groups� language). Since all variables keep sign and signi�cance,
our results are robust to di¤erent market size variables used.
In Table 3.7 we report alternative estimations to Model (1). First, we look to test
our empirical results by controlling for industry �xed e¤ects. Model (20) corresponds
to a logit estimation including dummies for each 4-digit NAF Codes of subsidiaries�
sectors, controlling thus for industry �xed-e¤ects. Results are strongly similar to
those of Model (1), since in our study the conditional logit is by construction a �rm
�xed-e¤ects model.
In Models (21) and (22), we control for time-invariant factors and present esti-
mation results of regressions including countries �xed-e¤ects. Moreover, following
Train (1986), we are supposed to correct the biases induced by the IIA while inte-
grating country �xed e¤ects. Model (19) shows the ER turning to be insigni�cant,

Environmental Regulation and French Firms Location Abroad 142
Table 3.7: Robustness tests with alternative speci�cations (coe¢ cients)(20) (21) (22) (23)FElogit FEclogit FEclogit IVclogit
lnMP 0.609*** 1.645** 1.905** 0.481***(0.052) (0.798) (0.840) (0.054)
lnGDPcap 0.347** -0.226 -0.230 0.378***(0.117) (0.805) (0.819) (0.113)
TFP_g row th 0.013*** 0.006 0.008* 0.008**(0.004) (0.005) (0.005) (0.004)
lnKLt�1 -0.484*** -2.010*** -1.981*** -0.831***(0.104) (0.465) (0.449) (0.103)
lnERt�1 -1.797*** 0.258(0.272) (0.768)
lnMEAt�1 -1.134**(0.470)
lnER_predicted -51.813***(6.221)
lnCORRUP -1.063*** 0.266 0.306 -18.830***(0.256) (0.565) (0.576) (2.187)
lnREGULQUAL -0.366 1.966*** 2.196*** -1.158**(0.330) (0.672) (0 .696) (0.396)
FREE 0.344*** 0.140 0.122 4.738***(0.098) (0.176) (0.175) (0.487)
PTA 0.477*** -0.109 -0.078 0.091(0.118) (0.201) (0.206) (0.158)
COL45 0.769*** -3.229 -2.892 0.686***(0.140) (8.583) (8.610) (0.208)
Emerging 1.013*** 0.156 -0.604 0.746***(0.164) (1.508) (2.146) (0.169)
TrCEEC 0.324** -3.355*** -4.716*** -0.038(0.160) (0.723) (1.129) (0.170)
TrCIS 0.422* -5.520 -6.527 0.940***(0.244) (8.019) (8.290) (0.206)
Developing -0.859*** -3.581 -4.654 -1.291***(0.217) (7.307) (7.314) (0.267)
Industry �xed-e¤ects Yes No No NoCountry �xed-e¤ects No Yes Yes NoPseudo R2 0.0543 0.1394 0.1397 0.0643N. of obs. 95981 96054 96054 70477
Standard errors in parentheses* p<0.1, ** p<0.05, *** p<0.01
Environmental Regulation and French Firms Location Abroad 143
probably because of its small variation during the period of study. The use ofMEA
variable, a commonly used proxy for environmental regulation with relatively more
important time-variance than our ER index, con�rms in Model (22) the signi�cant
and negative e¤ect of environmental regulation on �rms�location choice, while con-
trolling for all other country speci�c-e¤ects19.
As a last robustness check, we analyze the most important and debatable issue,
namely, the environmental regulation endogeneity with regard to foreign invest-
ments. Indeed, as suggested by some political economy models (e.g. Cole et al.,
2006), countries could be conducted to reduce their environmental standards in
order to attract FDI. To deal with this problem and check the robustness of our pre-
vious results, we need to run an instrumental variable estimation. Our methodology
consists in applying an instrumental estimation, running two independent regres-
sions. In the �rst step, we regress the assumed endogenous ER variable on a new
variable FDI representing the total number of French �rms locating in each country
yearly, and on four exogenous variables: CORRUP , FREE, GNIcap (per capita
income) and UNEMPL (unemployment)20. The UNEMPL and GNIcap variables
are supposed to act as exclusion restrictions, since consumers�preference for envi-
ronment (represented by their wellbeing: unemployment rate and income 21) should
have an e¤ect on FDI through their impact on the stringency of the environmental
regulation. In the second step, we run our base model by using the predicted ER
variable. Second step estimation results are presented in Model (23). IV results
19We also made an attempt to test a nested logit speci�cation, considering thus that the locationdecision is decided at two levels. Since results are very similar to those of clogit, we do not presentthis test as an additional robustness check.
20See Table 3.11 in Appendix for the empirical results of the �rst step estimation.21The higher the income, the higher the willingness to pay for the normal good - the envi-
ronment. As for the unemployment rate, there would be an opposite relation, the preferencesfor environmental quality passing onto a second level compared to the economic and �nancialuncertainty.

Environmental Regulation and French Firms Location Abroad 144
indicate that, after controlling for endogeneity, the ER variable (as the most of our
variables) keeps sign and signi�cance.
Conclusion
In this chapter we have tested the pollution haven hypothesis through an analysis of
the impact of the environmental regulation on French manufacturing �rms�location
choice. Basing this empirical work on an economic geography model that has the
advantage of considering a complete set of location choice determinants like market
potential, production factors and governance quality, we use �rm-level data related
to French �rms�locations in the world to test this hypothesis. We �rst tested it on
a pooled sample of countries, and then made a distinction between �ve groups of
countries: Developed countries, Emerging economies, Transition CEEC, Transition
countries of CIS, and Developing countries. By further developing a complex index
encompassing di¤erent aspects of the environmental regulation, we have succeeded
in expressing the stringency of environmental regulation in a satisfying way and then
in revealing the existence of a strong pollution haven e¤ect.
Empirical results of the base model show that in presence of heterogeneous coun-
tries, French manufacturing industries prefer to locate in countries with more lenient
environmental regulations, thus con�rming an essential role played by environmen-
tal policy in determining �rms�location. Moreover, this e¤ect is reinforced for the
most polluting �rms. In order to go further into our analysis, we attempt to identify
countries that are the most likely to constitute pollution havens. Estimations includ-
ing interaction terms between environmental regulation and country groups validate
existence of pollution haven e¤ects for developed countries, emerging economies and
CEEC. On the contrary, concerning most CIS and developing countries included in

Environmental Regulation and French Firms Location Abroad 145
our sample, which are supposed to be less regulated, a more stringent regulation
seems rather to attract investments. This suggests a nonlinear e¤ect of the environ-
mental regulation stringency on French �rms� location choice, which is con�rmed
in complementary regressions that highlight existence of a threshold situated in the
third quartile of the ER index, from which the e¤ect of ER index on FDI switches
from a positive impact to a negative one. Thus, manufacturing French �rms lo-
cate preferably in locations with less stringent environmental policy, provided that
regulation is not more lenient than an accepted level guarantying wealthy business
environment. Otherwise, under those last circumstances, French �rms prefer desti-
nations with improving quality of the environmental policy. An estimation involving
the mode of FDI entry suggests that though green�eld investments are more sensi-
tive to environmental regulations, results are con�rmed whatever the type of FDI
considered. Robustness tests �nally con�rm the stability of our results across di¤er-
ent speci�cations, including alternative proxies for our core variables and alternative
estimation methods.
Nevertheless, the only approval or rejection of the pollution haven hypothesis is
not su¢ cient to respond to fears related to the impact on �rm location of hetero-
geneous environmental regulations across countries. Researches analyzing to which
extent pollution havens imply a real threat to the environment would be of a great
interest. This would be the purpose of the next chapter.

Environmental Regulation and French Firms Location Abroad 146
Appendix 3
3.A Market Potential estimation
As seen in Chapter 2, the quantity of a composite good M that a �rm h produces
in country i and would ship to any destination country j in a model à la Dixit and
Stiglitz and Krugman is given by the following expression:
qij (h) =� � 1�
[ci (h) � ij]��P
i
Rni[ci (v) � ij]
1�� dv�Ej (A.1)
and the total net pro�t that a �rm h could earn in any potential location i:
�i (h) =ci (h)
1��
�
Xj�ij�EjGj
� Fi (h) (A.2)
with � denotes the elasticity of substitution between two varieties, and � > 1;
ci(h) is the marginal production cost of the �rm h in country i; � ij is the trade cost
supported by the consumer in the importing country j; � is the share of their income
E that consumers spend on the purchase of the composite good M ; and Fi (h) is
the �rm�s �xed cost.
Krugman�s market potential has the advantage of being deduced strictly from
theory, and we write it:
MPi =Xj
��ij�Ej
Gj
�(A.3)
where �ij = �1��ij , Gj =
Pi
Rni[ci (v) � ij]
1�� dv. Nevertheless, compared to the form
proposed by Harris (1954), its calculation needs estimators for the unknown 'ij
and Gj parameters. In this study we apply the same strategy as Head and Mayer
(2004) and estimate these parameters using information about international trade

Environmental Regulation and French Firms Location Abroad 147
�ows. The aggregate value of exports of country i towards country j, denoted Xij,
results from the multiplying of the mass of varieties produced in country i and sent
to country j by each variety�s export price pij (including trade costs):
Xij =
Zni
pij (v) qij (v) dv =
Zni
ci(v)1���ij�Ej
Gjdv (A.4)
By grouping the terms according to the indexes and then transforming them in
logarithm, we obtain:
lnXij = ln
�Zni
ci(v)1��dv
�+ ln (�Ej=Gj) + ln'ij (A.5)
Following Redding and Venables (2004), we estimate the �rst two terms by using
exporter and importer �xed e¤ects, denoted here EXi and IMj, respectively. The
bilateral access to the market ('ij) is considered, similarly to Head and Mayer
(2004), to be a function of distance (dij), contiguity (Bij = 1 if countries i and j
share a common border and 0 otherwise), common language ( Lij = 1 if i and j
share a language and 0 otherwise) and an error term, �ij. The trade equation to be
estimated is then:
lnXij = EXi + IMj � � ln dij + �Bij + �Lij + �ij (A.6)
This equation is regressed on the bilateral trade �ows of 168 countries over
the period 1990-2000 (Feenstra�s database on world trade �ows, NBER) and 79
countries over the period 2001-2004 (Chelem database). The variables necessary to
the calculation of �ij are taken from CEPII Distances database.
Using the speci�cations^�ij = d
�^�
ij exp
�^�Bij +
^�Lij
�and �Ej=Gj = exp (IMj),
we calculate the market potential.

Environmental Regulation and French Firms Location Abroad 148
3.B List of countries and detailed statistics about
FDI, ER index and Market Potential
Table 3.8: FDI occurences
Country FDITotal HPoll 1996 1997 1998 1999 2000 2001 2002
Algeria 35 1 1 6 5 1 8 5 9Argentina 42 9 8 7 10 14 2 1 0Australia 34 8 4 6 6 5 8 4 1Austria 13 1 3 4 2 2 0 2 0Azerbaijan 3 0 1 0 1 0 1 0 0Bangladesh 1 1 0 0 0 1 0 0 0Bolivia 1 0 0 0 0 0 0 0 1Brazil 1 1 0 0 1 0 0 0 0Bulgaria 9 2 4 2 3 0 0 0 0Cameroon 3 1 0 0 1 2 0 0 0Canada 67 8 5 11 10 14 16 6 5Chile 21 4 0 4 4 3 6 3 1China 124 31 35 26 28 20 15 0 0Croatia 12 2 1 3 3 1 4 0 0Czech Rep. 40 9 8 6 10 9 7 0 0Denmark 9 2 0 2 3 1 2 1 0Dom. Rep. 1 0 0 0 0 1 0 0 0Ecuador 2 0 0 0 0 1 1 0 0Egypt 8 3 0 0 1 2 2 1 2Estonia 3 1 0 0 1 0 2 0 0Ethiopia 2 0 0 0 2 0 0 0 0Finland 28 3 2 3 3 5 5 6 4Gabon 3 0 1 0 0 2 0 0 0Germany 88 17 18 24 11 15 10 7 3Ghana 3 0 1 1 1 0 0 0 0Greece 7 2 1 0 1 0 1 1 3Guatemala 3 2 1 0 1 0 1 0 0Honduras 1 1 0 0 1 0 0 0 0Hungary 23 3 4 4 6 1 5 2 1India 54 11 12 14 10 7 6 4 1Indonesia 2 1 0 2 0 0 0 0 0Iran 3 0 0 0 1 1 1 0 0Ireland 11 1 1 2 1 3 4 0 0Italy 23 2 5 5 8 3 2 0 0
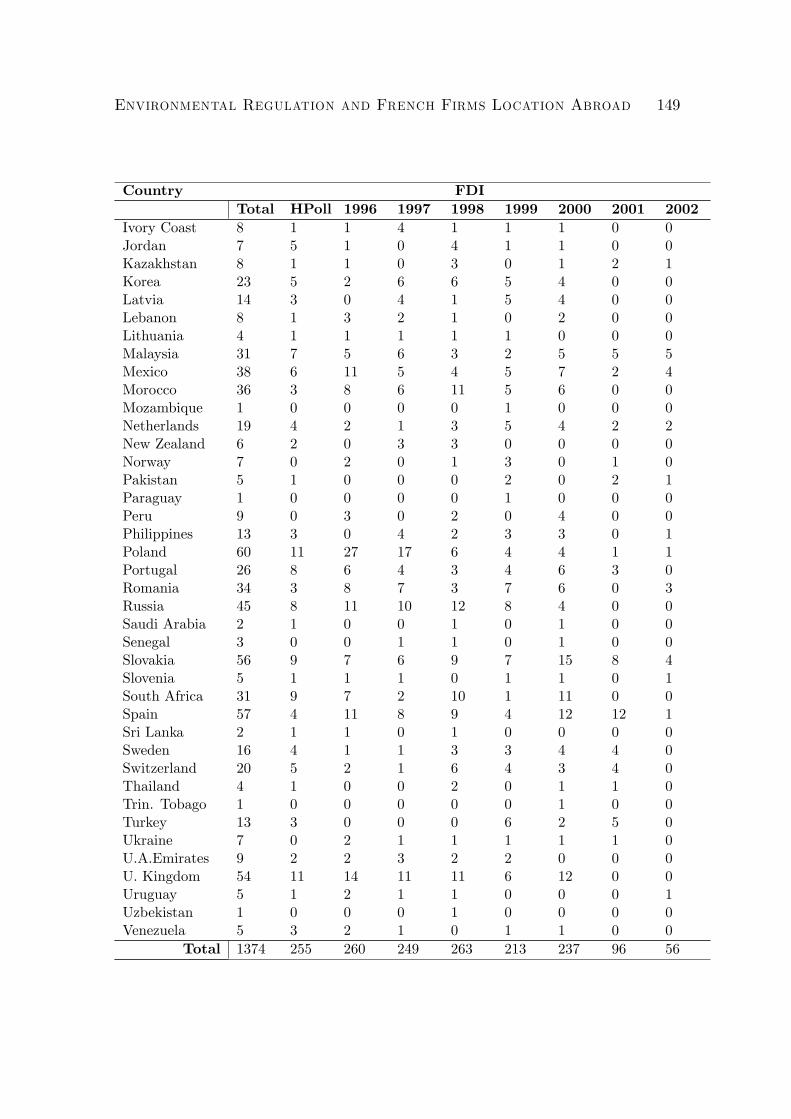
Environmental Regulation and French Firms Location Abroad 149
Country FDITotal HPoll 1996 1997 1998 1999 2000 2001 2002
Ivory Coast 8 1 1 4 1 1 1 0 0Jordan 7 5 1 0 4 1 1 0 0Kazakhstan 8 1 1 0 3 0 1 2 1Korea 23 5 2 6 6 5 4 0 0Latvia 14 3 0 4 1 5 4 0 0Lebanon 8 1 3 2 1 0 2 0 0Lithuania 4 1 1 1 1 1 0 0 0Malaysia 31 7 5 6 3 2 5 5 5Mexico 38 6 11 5 4 5 7 2 4Morocco 36 3 8 6 11 5 6 0 0Mozambique 1 0 0 0 0 1 0 0 0Netherlands 19 4 2 1 3 5 4 2 2New Zealand 6 2 0 3 3 0 0 0 0Norway 7 0 2 0 1 3 0 1 0Pakistan 5 1 0 0 0 2 0 2 1Paraguay 1 0 0 0 0 1 0 0 0Peru 9 0 3 0 2 0 4 0 0Philippines 13 3 0 4 2 3 3 0 1Poland 60 11 27 17 6 4 4 1 1Portugal 26 8 6 4 3 4 6 3 0Romania 34 3 8 7 3 7 6 0 3Russia 45 8 11 10 12 8 4 0 0Saudi Arabia 2 1 0 0 1 0 1 0 0Senegal 3 0 0 1 1 0 1 0 0Slovakia 56 9 7 6 9 7 15 8 4Slovenia 5 1 1 1 0 1 1 0 1South Africa 31 9 7 2 10 1 11 0 0Spain 57 4 11 8 9 4 12 12 1Sri Lanka 2 1 1 0 1 0 0 0 0Sweden 16 4 1 1 3 3 4 4 0Switzerland 20 5 2 1 6 4 3 4 0Thailand 4 1 0 0 2 0 1 1 0Trin. Tobago 1 0 0 0 0 0 1 0 0Turkey 13 3 0 0 0 6 2 5 0Ukraine 7 0 2 1 1 1 1 1 0U.A.Emirates 9 2 2 3 2 2 0 0 0U. Kingdom 54 11 14 11 11 6 12 0 0Uruguay 5 1 2 1 1 0 0 0 1Uzbekistan 1 0 0 0 1 0 0 0 0Venezuela 5 3 2 1 0 1 1 0 0
Total 1374 255 260 249 263 213 237 96 56
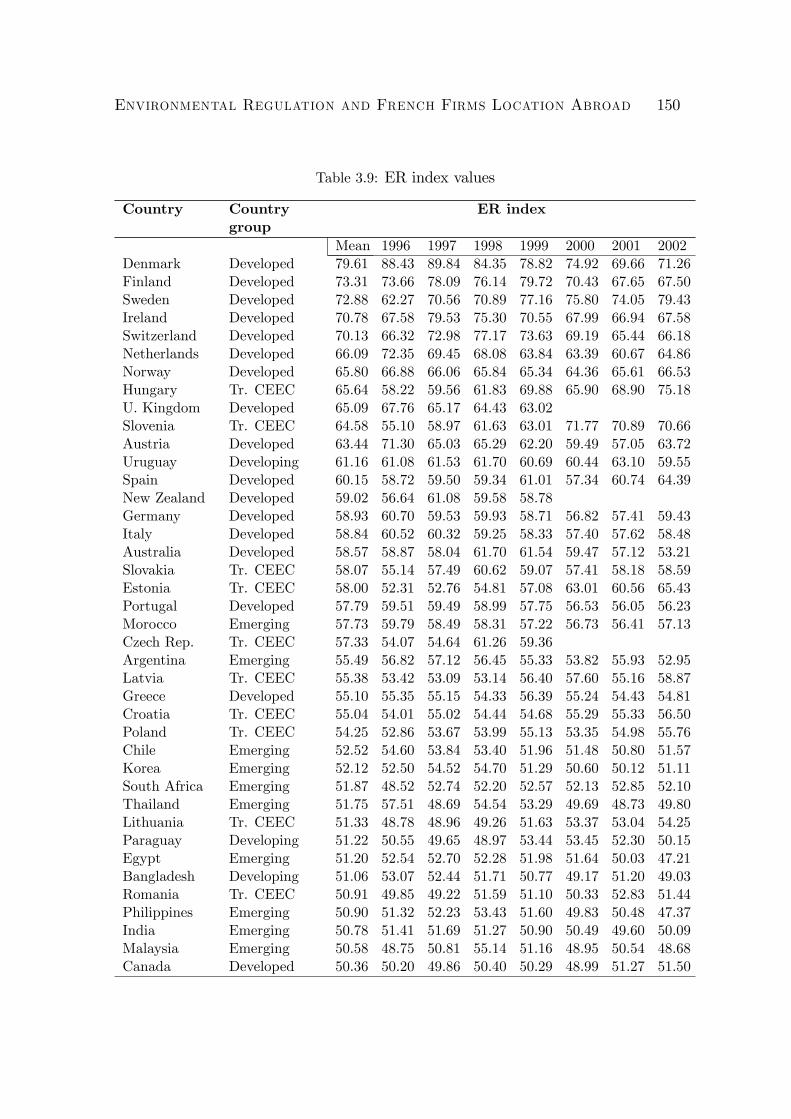
Environmental Regulation and French Firms Location Abroad 150
Table 3.9: ER index values
Country Countrygroup
ER index
Mean 1996 1997 1998 1999 2000 2001 2002Denmark Developed 79.61 88.43 89.84 84.35 78.82 74.92 69.66 71.26Finland Developed 73.31 73.66 78.09 76.14 79.72 70.43 67.65 67.50Sweden Developed 72.88 62.27 70.56 70.89 77.16 75.80 74.05 79.43Ireland Developed 70.78 67.58 79.53 75.30 70.55 67.99 66.94 67.58Switzerland Developed 70.13 66.32 72.98 77.17 73.63 69.19 65.44 66.18Netherlands Developed 66.09 72.35 69.45 68.08 63.84 63.39 60.67 64.86Norway Developed 65.80 66.88 66.06 65.84 65.34 64.36 65.61 66.53Hungary Tr. CEEC 65.64 58.22 59.56 61.83 69.88 65.90 68.90 75.18U. Kingdom Developed 65.09 67.76 65.17 64.43 63.02Slovenia Tr. CEEC 64.58 55.10 58.97 61.63 63.01 71.77 70.89 70.66Austria Developed 63.44 71.30 65.03 65.29 62.20 59.49 57.05 63.72Uruguay Developing 61.16 61.08 61.53 61.70 60.69 60.44 63.10 59.55Spain Developed 60.15 58.72 59.50 59.34 61.01 57.34 60.74 64.39New Zealand Developed 59.02 56.64 61.08 59.58 58.78Germany Developed 58.93 60.70 59.53 59.93 58.71 56.82 57.41 59.43Italy Developed 58.84 60.52 60.32 59.25 58.33 57.40 57.62 58.48Australia Developed 58.57 58.87 58.04 61.70 61.54 59.47 57.12 53.21Slovakia Tr. CEEC 58.07 55.14 57.49 60.62 59.07 57.41 58.18 58.59Estonia Tr. CEEC 58.00 52.31 52.76 54.81 57.08 63.01 60.56 65.43Portugal Developed 57.79 59.51 59.49 58.99 57.75 56.53 56.05 56.23Morocco Emerging 57.73 59.79 58.49 58.31 57.22 56.73 56.41 57.13Czech Rep. Tr. CEEC 57.33 54.07 54.64 61.26 59.36Argentina Emerging 55.49 56.82 57.12 56.45 55.33 53.82 55.93 52.95Latvia Tr. CEEC 55.38 53.42 53.09 53.14 56.40 57.60 55.16 58.87Greece Developed 55.10 55.35 55.15 54.33 56.39 55.24 54.43 54.81Croatia Tr. CEEC 55.04 54.01 55.02 54.44 54.68 55.29 55.33 56.50Poland Tr. CEEC 54.25 52.86 53.67 53.99 55.13 53.35 54.98 55.76Chile Emerging 52.52 54.60 53.84 53.40 51.96 51.48 50.80 51.57Korea Emerging 52.12 52.50 54.52 54.70 51.29 50.60 50.12 51.11South Africa Emerging 51.87 48.52 52.74 52.20 52.57 52.13 52.85 52.10Thailand Emerging 51.75 57.51 48.69 54.54 53.29 49.69 48.73 49.80Lithuania Tr. CEEC 51.33 48.78 48.96 49.26 51.63 53.37 53.04 54.25Paraguay Developing 51.22 50.55 49.65 48.97 53.44 53.45 52.30 50.15Egypt Emerging 51.20 52.54 52.70 52.28 51.98 51.64 50.03 47.21Bangladesh Developing 51.06 53.07 52.44 51.71 50.77 49.17 51.20 49.03Romania Tr. CEEC 50.91 49.85 49.22 51.59 51.10 50.33 52.83 51.44Philippines Emerging 50.90 51.32 52.23 53.43 51.60 49.83 50.48 47.37India Emerging 50.78 51.41 51.69 51.27 50.90 50.49 49.60 50.09Malaysia Emerging 50.58 48.75 50.81 55.14 51.16 48.95 50.54 48.68Canada Developed 50.36 50.20 49.86 50.40 50.29 48.99 51.27 51.50

Environmental Regulation and French Firms Location Abroad 151
Country Countrygroup
ER index
Mean 1996 1997 1998 1999 2000 2001 2002Jordan Emerging 50.35 49.39 48.72 50.52 52.68 52.22 50.53 48.35Bulgaria Tr. CEEC 49.97 48.56 48.10 47.65 49.74 51.74 51.87 52.16Pakistan Emerging 49.64 52.26 51.50 50.83 49.71 48.93 48.08 46.14Peru Emerging 49.52 48.85 51.01 51.01 49.88 49.15 48.07 48.66Algeria Developing 49.06 52.20 50.63 50.61 49.51 48.03 47.09 45.32Turkey Emerging 48.91 49.34 53.07 51.47 49.85 47.40 46.17 45.08China Emerging 48.73 49.35 49.00 49.30 48.93 48.50 47.90 48.10Brazil Emerging 48.47 49.77 50.22 49.35 48.42 47.54 46.04 47.92Senegal Developing 48.29 49.69 49.12 48.66 47.78 46.93 48.84 46.99Sri Lanka Developing 48.20 49.03 48.53 48.08 47.16Iran Emerging 48.17 48.84 48.69 48.14 47.02Trin. Tobago Developing 48.02 48.24 47.65 46.94 49.26Mexico Emerging 48.00 48.39 47.98 47.73 46.83 48.95 47.96 48.19Bolivia Developing 47.42 47.69 47.13 46.38 48.12 47.61 47.31 47.67Guatemala Developing 47.38 48.42 47.75 47.54 48.77 47.93 46.78 44.48Lebanon Developing 46.87 47.79 46.82 46.57 48.94 47.55 46.02 44.37Honduras Developing 46.58 47.72 46.94 46.16 45.51 48.40 46.87 44.46Russia Tr. CIS 45.68 47.43 46.97 46.27 45.47 44.83 44.14 44.63Indonesia Emerging 45.67 46.22 48.51 47.75 45.30 44.60 43.20 44.10Ukraine Tr. CIS 45.26 42.27 43.97 43.28 47.57 46.89 46.16 46.68Uzbekistan Tr. CIS 44.36 43.24 42.62 44.29 46.02 45.33 44.36 44.66Ecuador Developing 44.01 45.04 44.44 44.42 43.32 45.03 44.07 41.76Ivory Coast Developing 43.87 45.67 45.06 44.47 43.51 42.92 42.36 43.10Saudi Arabia Developing 43.30 44.43 43.76 42.94 42.06Ghana Developing 43.25 45.71 45.09 44.44 43.58 42.52 41.54 39.88Venezuela Developing 43.15 43.43 42.86 44.62 44.00 42.78 41.76 42.60U.A.Emirates Developed 43.03 43.42 43.12 42.55Dom. Rep. Developing 41.94 42.10 41.13 42.58 41.96Cameroon Developing 41.59 43.05 42.37 41.60 40.77 39.37 41.74 42.20Mozambique Developing 41.45 41.48 43.27 42.67 41.92 40.41 39.62 40.79Azerbaijan Tr. CIS 40.62 39.31 38.64 37.66 36.88 40.93 45.99 44.92Gabon Developing 40.56 39.71 41.27 42.89 42.02 40.52 39.41 38.09Ethiopia Developing 39.33 40.56 39.83 38.86 38.06Kazakhstan Tr. CIS 38.89 39.67 39.19 40.62 40.13 38.32 37.49 36.79

Environmental Regulation and French Firms Location Abroad 152
Table 3.10: Market potential values
Country Countrygroup
MP
Mean 1996 1997 1998 1999 2000 2001 2002Algeria Developing 11.10 11.20 11.36 11.26 11.29 11.31 10.64 10.64Argentina Emerging 3.90 3.95 3.95 3.95 3.95 3.94 3.79 3.79Australia Developed 2.47 2.61 2.61 2.61 2.61 2.57 2.12 2.12Austria Developed 29.60 30.07 30.07 30.08 30.07 30.03 28.43 28.43Azerbaijan Tr. CIS 4.81 4.11 5.11 4.78 5.01 5.05Bangladesh Developing 3.81 3.92 3.92 3.94 3.96 3.19 3.88 3.88Bolivia Developing 3.90 3.90 3.88 3.85 3.87 3.92 3.95 3.95Brazil Emerging 2.29 2.35 2.35 2.35 2.34 2.32 2.17 2.17Bulgaria Tr. CEEC 11.20 11.35 11.35 11.34 11.34 11.30 10.85 10.85Cameroon Developing 4.36 4.41 4.39 4.36 4.39 4.28 4.35 4.35Canada Developed 48.68 48.78 48.78 48.78 48.78 48.75 48.43 48.43Chile Emerging 3.18 3.22 3.21 3.22 3.22 3.21 3.07 3.07China Emerging 12.52 15.55 15.65 15.47 15.58 15.31 5.06 5.06Croatia Tr. CEEC 14.54 14.63 14.60 14.68 14.67 14.66 14.28 14.28Czech Rep. Tr. CEEC 22.73 23.06 23.07 23.04 23.04 23.03 21.94 21.94Denmark Developed 20.78 21.71 21.71 21.71 21.71 21.67 18.50 18.50Dom. Rep. Developing 6.44 6.60 6.63 6.39 6.37 6.37 6.38 6.35Ecuador Developing 4.64 4.75 4.72 4.73 4.73 4.72 4.41 4.41Egypt Emerging 6.94 6.91 6.98 6.96 7.04 6.85 6.93 6.93Estonia Tr. CEEC 10.87 10.80 10.88 10.90 11.01 10.96 10.76 10.76Ethiopia Developing 2.76 2.84 2.79 2.80 2.90 2.79 2.62 2.58Finland Developed 9.73 9.87 9.88 9.88 9.91 9.88 9.35 9.35Gabon Developing 3.06 3.01 2.93 2.99 3.02 3.07 3.21 3.21Germany Developed 41.48 46.21 46.21 46.21 46.21 46.17 29.68 29.68Ghana Developing 4.25 4.28 4.22 4.23 4.33 4.24 4.20 4.25Greece Developed 8.08 8.22 8.23 8.26 8.26 8.22 7.69 7.69Guatemala Developing 5.83 5.87 5.82 5.81 5.81 5.81 5.82 5.84Honduras Developing 5.14 5.21 5.16 5.15 5.08 5.18 5.12 5.10Hungary Tr. CEEC 14.57 14.79 14.76 14.77 14.77 14.73 14.10 14.10India Emerging 4.80 5.00 5.00 5.00 5.00 4.58 4.49 4.49Indonesia Emerging 4.27 4.41 4.48 4.48 4.48 4.44 3.80 3.80Iran Emerging 4.43 3.90 4.56 4.59 4.59 4.49Ireland Developed 24.92 25.24 25.24 25.24 25.23 25.15 24.18 24.18Italy Developed 12.03 12.26 12.26 12.26 12.26 12.22 11.50 11.50Ivory Coast Developing 3.59 3.64 3.60 3.63 3.63 3.61 3.51 3.51Jordan Emerging 9.16 9.27 8.80 9.25 9.40 9.10Kazakhstan Tr. CIS 4.28 4.39 4.37 4.40 4.39 4.23 4.08 4.08Korea Emerging 6.28 6.47 6.47 6.47 6.48 6.38 5.83 5.83
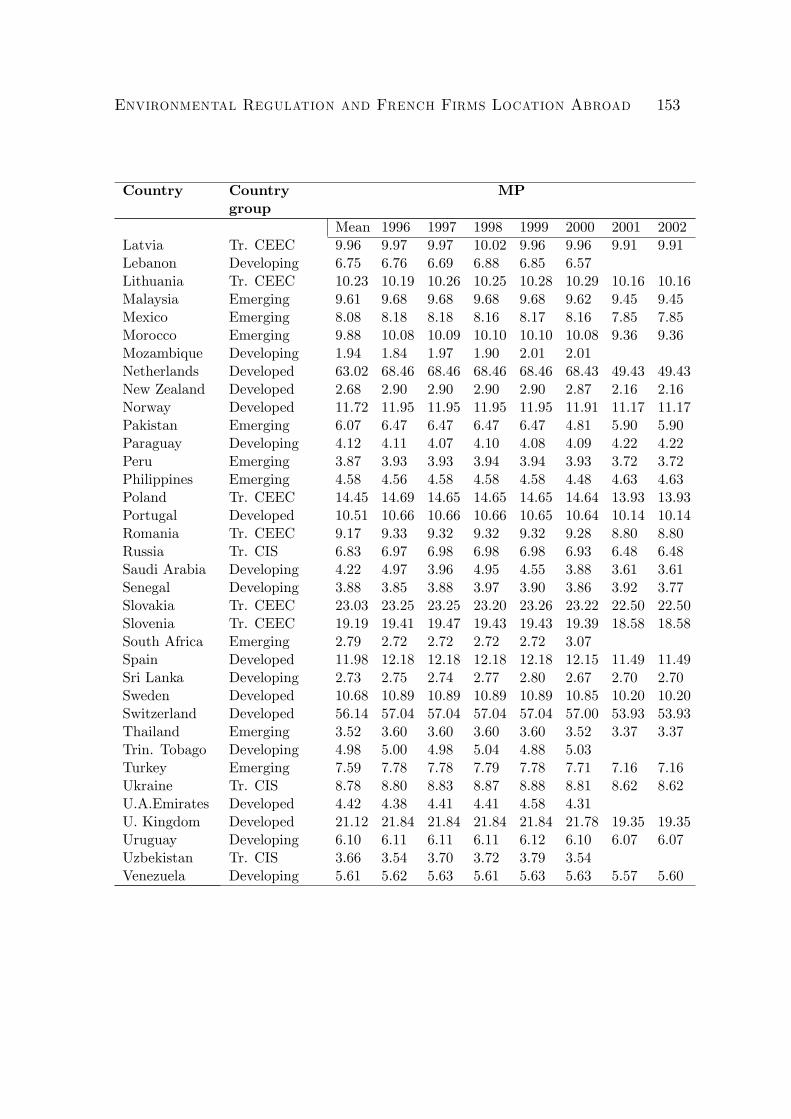
Environmental Regulation and French Firms Location Abroad 153
Country Countrygroup
MP
Mean 1996 1997 1998 1999 2000 2001 2002Latvia Tr. CEEC 9.96 9.97 9.97 10.02 9.96 9.96 9.91 9.91Lebanon Developing 6.75 6.76 6.69 6.88 6.85 6.57Lithuania Tr. CEEC 10.23 10.19 10.26 10.25 10.28 10.29 10.16 10.16Malaysia Emerging 9.61 9.68 9.68 9.68 9.68 9.62 9.45 9.45Mexico Emerging 8.08 8.18 8.18 8.16 8.17 8.16 7.85 7.85Morocco Emerging 9.88 10.08 10.09 10.10 10.10 10.08 9.36 9.36Mozambique Developing 1.94 1.84 1.97 1.90 2.01 2.01Netherlands Developed 63.02 68.46 68.46 68.46 68.46 68.43 49.43 49.43New Zealand Developed 2.68 2.90 2.90 2.90 2.90 2.87 2.16 2.16Norway Developed 11.72 11.95 11.95 11.95 11.95 11.91 11.17 11.17Pakistan Emerging 6.07 6.47 6.47 6.47 6.47 4.81 5.90 5.90Paraguay Developing 4.12 4.11 4.07 4.10 4.08 4.09 4.22 4.22Peru Emerging 3.87 3.93 3.93 3.94 3.94 3.93 3.72 3.72Philippines Emerging 4.58 4.56 4.58 4.58 4.58 4.48 4.63 4.63Poland Tr. CEEC 14.45 14.69 14.65 14.65 14.65 14.64 13.93 13.93Portugal Developed 10.51 10.66 10.66 10.66 10.65 10.64 10.14 10.14Romania Tr. CEEC 9.17 9.33 9.32 9.32 9.32 9.28 8.80 8.80Russia Tr. CIS 6.83 6.97 6.98 6.98 6.98 6.93 6.48 6.48Saudi Arabia Developing 4.22 4.97 3.96 4.95 4.55 3.88 3.61 3.61Senegal Developing 3.88 3.85 3.88 3.97 3.90 3.86 3.92 3.77Slovakia Tr. CEEC 23.03 23.25 23.25 23.20 23.26 23.22 22.50 22.50Slovenia Tr. CEEC 19.19 19.41 19.47 19.43 19.43 19.39 18.58 18.58South Africa Emerging 2.79 2.72 2.72 2.72 2.72 3.07Spain Developed 11.98 12.18 12.18 12.18 12.18 12.15 11.49 11.49Sri Lanka Developing 2.73 2.75 2.74 2.77 2.80 2.67 2.70 2.70Sweden Developed 10.68 10.89 10.89 10.89 10.89 10.85 10.20 10.20Switzerland Developed 56.14 57.04 57.04 57.04 57.04 57.00 53.93 53.93Thailand Emerging 3.52 3.60 3.60 3.60 3.60 3.52 3.37 3.37Trin. Tobago Developing 4.98 5.00 4.98 5.04 4.88 5.03Turkey Emerging 7.59 7.78 7.78 7.79 7.78 7.71 7.16 7.16Ukraine Tr. CIS 8.78 8.80 8.83 8.87 8.88 8.81 8.62 8.62U.A.Emirates Developed 4.42 4.38 4.41 4.41 4.58 4.31U. Kingdom Developed 21.12 21.84 21.84 21.84 21.84 21.78 19.35 19.35Uruguay Developing 6.10 6.11 6.11 6.11 6.12 6.10 6.07 6.07Uzbekistan Tr. CIS 3.66 3.54 3.70 3.72 3.79 3.54Venezuela Developing 5.61 5.62 5.63 5.61 5.63 5.63 5.57 5.60

Environmental Regulation and French Firms Location Abroad 154
3.C Interaction e¤ects in clustered logit estima-tions
Figure 3.2: Interaction e¤ect for Developed countries
Figure 3.3: Interaction e¤ect for Emerging economies
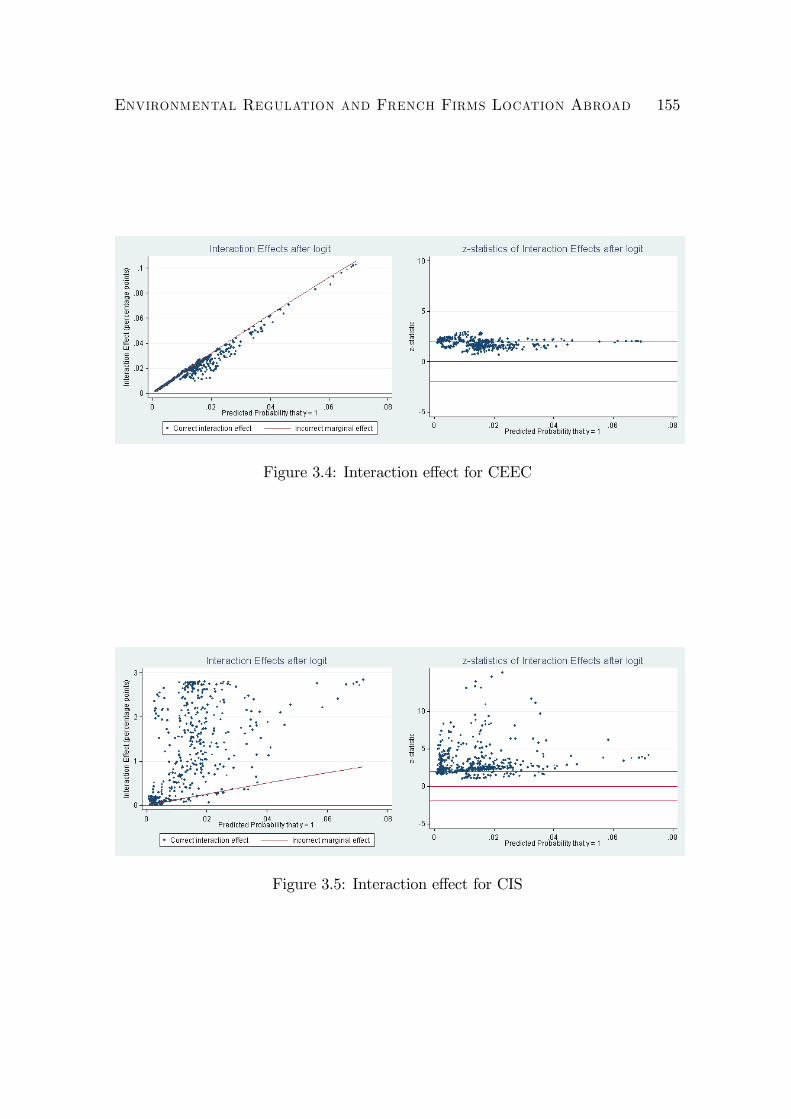
Environmental Regulation and French Firms Location Abroad 155
Figure 3.4: Interaction e¤ect for CEEC
Figure 3.5: Interaction e¤ect for CIS

Environmental Regulation and French Firms Location Abroad 156
Figure 3.6: Interaction e¤ect for Developing countries
Figure 3.7: Interaction e¤ect for the high median of ER index

Environmental Regulation and French Firms Location Abroad 157
Figure 3.8: Interaction e¤ect for the �rst three low quartiles of ER index
3.D IV �rst stage estimation
Table 3.11: First stage estimation for ER endogeneity testDependent variable lnER IV �rst stage estimation
clogitlnFDI -0.0006
(0.001)lnCORRUP -0.342***
(0.034)FREE 0.081***
(0.014)lnUNEMPL -0.008
(0.009)lnGNIcap -0.006
(0.011)Constant 5.1492***
(0.206)R2 0.5804N. of obs. 416
Standard errors in parentheses* p<0.1, ** p<0.05, *** p<0.01

Environmental Regulation and French Firms Location Abroad 158
3.E Data summary
Table 3.12: Descriptive statisticsVariable Mean Std. Dev. Min. Max. N
MP 11.1613 12.3426 1.8357 68.4638 96054GDPcap 7289.2386 9013.7306 95.4479 38302.6094 96054TFP_growth -2.0331 9.9872 -95.3050 28.888 96054KLt�1 22334.8144 28264.9816 224.6915 150149.625 96054RER 103.9347 12.1902 53.46917 159.2242 53281RIR 109.788 14.1108 17.54 184.05 53281ERt�1(Zscore) 53.1217 9.3336 36.8798 93.5585 96054ERt�1(PCA) 51.7485 6.2833 38.4950 67.9619 96054GASUNLEADt�1 65.3025 34.7952 0 100 55884ENV TAX 2.8921 0.8439 1.47 5.39 23271FDI 3.2550 4.6799 0 35 96054UNEMPL 8.9979 4.7715 0.9 27.3 75338GNIcap 10255.01 9165.321 330 41060 96054MEAt�1 6.0815 1.1019 2 8 96054CORRUP 33.4696 9.7613 17.9116 56.7732 96054REGULQUAL 4.4413 0.7789 2.1764 5.9688 96054FREE 0.5408 0.4983 0 1 96054PTA 0.2604 0.4389 0 1 96054COL45 0.0811 0.273 0 1 96054GDP=dist 1.80E+08 6.68E+08 3.59E+05 4.37E+09 96054Adjacency 0.0572 0.2323 0 1 96054LangEthn 0.1224 0.3278 0 1 96054

Environmental Regulation and French Firms Location Abroad 159
Table3.13:Datade�nitionandsources
Variable
De�nition
Sources
Dependent
variable
Locationchoice
Subsidiaries-Survey2002,FrenchDirectorateofTreasuryandEconomicPolicy
MP
Marketpotential
Dataoninternationaltrade:R.FeenstraandR.Lipsey,NBER1990-2000;
Chelem,CEPII,2000-2004;Geographicdata:CEPII
Adjacency
and
LangEthn
Dummyvariablesforsharingcommonborder
andlanguage,respectively
CEPII,2000-2004;Geographicdata:CEPII
GDPdist
GrossDomesticProduct(ofthehostcoun-
try)dividedbythedistancebetweenFrance
andthehostcountry
GDP:WorldDevelopmentIndicators,WorldBank;Distance:DISTANCES
databaseofCEPII
GDPcap
PercapitaGrossDomesticProductatcon-
stant2000prices
WorldDevelopmentIndicators,WorldBank
TFP_growth
Totalfactorproductivitygrowth
Authorscalculation;WorldBank&InternationalEnergyAgencydata
KL
Countryrelativeendowmentsinproduction
WorldDevelopmentIndicators,WorldBank+authorscalculation
factors(capitalversuslabor)
ER
Environmentalregulationindex
Authorscalculation
MultilateralEnvironmentalAgreements
Earthtrends,WorldResourcesInstitute
ISO14001
InternationalOrganizationforStandardization
InternationalNGOs
CenterfortheStudyofGlobalGovernance
GDPperunitofenergyuse,controlledfor
latitude
WorldBank;DISTANCES(GEO)databaseofCEPII(forlatitude)
GASUNLEAD
Marketshareofunleadedversusleadedgaso-
line
UnitedNationsEnvironmentProgramme(UNEP)
ENVTAX
Totalenvironmentaltaxrevenues,%GDP.
EUROSTAT.
CORRUP
Corruption
GovernanceIndicators1996-2004,D.Kaufmann,A.KrayandM.Mastruzzi
REGULQUAL
Regulations
improving�rms�generalenvi-
ronment
GovernanceIndicators1996-2004,D.Kaufmann,A.KrayandM.Mastruzzi
PTA
PreferentialtradeagreementswithEU,hence
withFrance
Preferentialtradeagreementsdatabase(PTAs)
COL45
ColonialrelationshipwithFrancepost1945
DISTANCESdatabaseofCEPII
FREE
Dummytakingvalue1ifthecountryiscon-
sidereddemocratic
FreedomHouse.
(averageofPoliticalRightsandCivilLiber-
tieslyingbetween1.0and2.5)
Developed
High-incomecountries
WorldBankCountryClassi�cation,excludingTrCEEC,TrCISandEMERG
economies
Emerging
Emergingcountries
MorganStanleyCapitalInternational(MSCI)classi�cation
TrCEEC
CentralandEasternEuropeanCountries
Multiplesources
TrCIS
CommonwealthofIndependentStates
Multiplesources
Developing
Otherdeveloping
(low
andmiddleincome)
countries
WorldBankCountryClassi�cation,excludingsomeCEEC,CISandEMERG
ERup50;ERto75
Dummiestakingvalue1forcountrieswithER
indexabovethemedianvalueandinthe�rst
(lower)threequartiles,respectively
FDI
TotalannualnumberofFrenchmanufactur-
inglocationdecisionsinacountry.
Subsidiaries-Survey2002,FrenchDirectorateofTreasuryandEconomicPolicy
+authorscalculation.
UNEMPL
Unemployment,%laborforce.
WorldDevelopmentIndicators,WorldBank
GNIcap
Grossnationalincomepercapita,basedon
purchasingpowerparity
WorldDevelopmentIndicators,WorldBank

Environmental Regulation and French Firms Location Abroad 160
Chapter 4
French FDI and PollutionEmissions: an EmpiricalInvestigation
Introduction
The strong version of the pollution haven hypothesis states that free international
trade leads to the relocation of dirty-good production from stringent regulation
countries (the North), to lax regulation countries (the South) (Copeland and Taylor,
2004). Although the common fear related to this statement is that while these
mechanisms lower pollution in the developed countries, it is to the detriment of the
developing world where pollution rises and probably causes an increase of overall
pollution, only a few studies tried to empirically estimate the direct e¤ect of trade
or pollution haven-driven capital relocation on pollution emissions (Grossman and
Krueger, 1993; Antweiler et al., 2001; Dean, 2002; He, 2006).
Most studies consist of searching for pollution havens by evaluating trends in
dirty-good production, consumption or trade, focusing on the loss of competitiveness
at the international level and the fear that environmental regulation may reduce net
161

French FDI and Pollution Emissions 162
exports in the manufacturing sector (Tobey, 1990). Another strand of the literature
focuses rather on trends in plant locations and the loss (gain) of attractiveness of
regulated (less-regulated) countries (Xing and Kolstad, 2002; List and Co, 2000;
Keller and Levinson, 2002). In both cases, these studies are conducted without
concern for the environment, or more precisely to pollution levels. In our view,
these analyses remain incomplete because a fundamental related issue consists of
determining if such pollution havens represent a threat by increasing pollution levels,
or at the contrary contribute to the reduction of emissions levels.
As mentioned by Copeland and Taylor (2004), some studies measuring trends
in dirty-industry output rather than pollution levels implicitly assume that changes
in the composition of a country�s output correspond to changes in environmental
quality. This is a strong and even incorrect assumption since it does not account
for the possibility that a better environmental quality could be consistent with an
increased dirty-good production, because the techniques of production may change
and become cleaner due to trade, income growth or technological progress. Regard-
ing studies focusing on foreign direct investment (FDI), they suggest two potential
exclusive impacts of FDI on pollution. If multinational �rms (MNFs) from devel-
oped and regulated countries do not intend to take advantage of lax regulations in
developing countries, and adopt the same production methods in both source and
host country, more FDI in developing countries should make them cleaner. The
second alternative works in opposite direction and suggests that if multinationals
locate in some countries because of their lax environmental regulation, FDI should
be positively correlated with pollution in host countries. Our point of view is slightly
di¤erent as regards to the impact of each alternative. We think that each alternative
could prevail, but its e¤ect on the pollution levels in host country is ambiguous. In

French FDI and Pollution Emissions 163
other words, �rms may adopt the same production methods in source country and
abroad but still increase pollution in host countries. Alternatively, they may take
advantage from lax regulations and nevertheless improve environment quality by
reducing pollution.
Indeed, FDI impact on pollution is complex. As mentioned above, it is often
argued that Multinational �rms (MNFs) are likely to use modern and less pollut-
ing techniques in foreign subsidiaries. It is cost-e¤ective for them to use the same
technology in di¤erent countries, even where environmental laws are weaker. More-
over, as suggested in Chapter 3, reputation is important to MNFs, and the largest
ones often have to respect corporation�s code of conduct comprising environmental
principles. If we consider global pollution, in this case whether the �rm produces
at home or abroad may not change anything. Nevertheless, we frequently see ex-
amples of MNFs breaking environmental or safety laws. We can cite the example
of former Texaco, which merged with the energy company Chevron in 2001. While
drilling in the Ecuadorian Amazon from 1964 to 1990, Texaco was accused of de-
liberately hampering environmental regulations by dumping toxic wastewater and
spilling crude oil. Ecuadorians claimed that to save money, the �rm had chosen to
use environmental practices that were obsolete and did not meet industry standards
in the United States. Thus, if MNFs enter a country to bene�t from weaker en-
vironmental regulations and produce at lower costs, FDI will hamper environment
quality and increase global as well as local pollution.
Another argument is that, all other things being equal, if pollution abatement
systems are more e¢ cient in developed countries, it would be better that MNFs
produce and pollute there, rather than producing in developing countries. In the
latter case, pollution would increase at the global level.
French FDI and Pollution Emissions 164
If we examine local pollution, one additional plant in the host country is sup-
posed to increase local pollution levels. However, the entry of the MNF may crowd
out ine¢ cient local �rms, reducing thus pollution emissions. Furthermore, envi-
ronmental bene�ts from FDI can arise from spillover e¤ects that might raise the
productivity of local �rms, making their production more environmentally-friendly,
�nally resulting in a decrease of total pollution emitted.
Even if not investigated in this work, we should discuss another channel through
which FDI may a¤ect pollution levels, i.e. the shipment of goods. Indeed, transport
may have two opposite e¤ects on pollution. On one hand, if FDI takes place for
a motive of markets supply, it would be less damaging that a �rm produces in the
foreign country rather than shipping goods from its country of origin. On another
hand, if FDI is motivated by a reduction of costs and production is reexported to
the country of origin, this would increase pollution emissions.
While there are many ways in which FDI can impact the environment and par-
ticularly the pollution levels, there is no theoretical presumption that a particular
e¤ect dominates. The relationship between FDI and pollution is thus an empirical
issue. Of major concern is the impact of FDI on global pollution, but empirical
investigation of this issue is di¢ cult. Indeed, considering the overall impact of FDI
on global pollution would require taking into account all the mechanisms mentioned
above, using data for the country of origin as well as for host countries, and integrat-
ing pollution resulting from transportation. This exercise, though very interesting,
is not possible in the scope of this work. Therefore, in this chapter we will look
at one of the channels described above, namely the contribution of FDI to local
pollution, and more precisely to air and water pollution. Examining local pollution
is essential. Indeed, threats to ecosystems, health problems, and pollution-related

French FDI and Pollution Emissions 165
economic ine¢ ciency are often exacerbated at local levels. Moreover, as demon-
strated above, local pollution is intimately tied to global pollution, and a worsening
of local pollution due to FDI is consistent with a global pollution augmentation
if pollution management in home country was initially more e¢ cient than the one
in host country. The relationship between FDI, environmental regulation and local
pollution levels taking various and opposite shapes, �nally resulting in an indetermi-
nate theoretical outcome, it should be investigated by robust empirical tests, which
is the purpose of this chapter.
We consider in our work that searching for pollution havens constitutes only the
�rst step in responding to fears related to the existence of heterogeneous environ-
mental regulations between economies, and we intend to clearly identify the impact
of such pollution havens on host countries�pollution emissions. We refer to the most
recent literature on pollution havens to examine the related hypothesis. Indeed,
while much of the earlier literature has focused on the pollution haven hypothesis
and the impact of the environmental regulation on trade or plants location, recently
some authors (e.g. Ederington and Minier, 2003; Cole et al., 2006; Levinson and
Taylor, 2008) examine the opposite relationship, i.e. the e¤ect of trade (plant lo-
cation decision or foreign investment �ows) on environmental policy. They often
refer to political economy literature to argue that industries put pressure on local
governments to under-regulate environment, which implies the endogeneity of the
environmental regulation. In the literature on plant location, only the studies of
Cole et al. (2006) and He (2006) account for the in�uence of FDI on environmental
regulations, which deserves to be improved.
The objective of this chapter is to determine the real interactions between foreign
direct investment, environmental regulation and pollution emissions. We attempt

French FDI and Pollution Emissions 166
to provide an exhaustive empirical analysis to clearly disentangle each relationship
between the three variables of interest, and to shed new light on the environmental
impact of pollution havens that we demonstrated in previous chapter. Since this
chapter is a continuation of the previous one, we carry on this further investigation
of the pollution haven hypothesis on France. Moreover, as a major investing country,
not only in terms of foreign a¢ liates but also as regards the level of its outward
FDI, examining France and the impact of its signi�cant FDI on the pollution of
hosting countries is worthwhile1. Thereby, we use a consistent data set on French
investment �ows at a disaggregate sector-level, in a mix of developed, emerging,
developing and transition countries for years 1999-2003; and we estimate a system
of three simultaneous equations to model the determination of FDI, taking into
account the endogeneity of environmental policy and considering the impact of FDI
and regulation on pollution.
This chapter is organized as follows. In Section 1 we present and discuss domi-
nant works that previously examined the relationship between FDI and the environ-
ment. In Section 2 we expose the empirical methodology and the estimates results.
In Section 3 we present an extending analysis, and in Section 4 we report some
robustness tests.
1 Theoretical background
1.1 Trade, FDI and environmental regulation
Most past researchers who have been interested in the relationship between the en-
vironment and the international trade have focused on the impact of environmental
1France is often ranked as the third largest investing country. In 2009, it was the second one,with an amount of FDI of $220 billion (Source: UNCTAD).

French FDI and Pollution Emissions 167
regulation on international trade or foreign direct investment �ows, according to the
pollution haven hypothesis. Indeed, the problem consisted of evaluating if exoge-
nous environmental regulation was a deterrent to international �ows. As mentioned
in Chapter 2, the �rst results from these studies were quite ambiguous and did not
converge to a global conclusion concerning this issue. Some authors found no em-
pirical proof of the pollution haven hypothesis, (Grossman and Krueger, 1993; Ja¤e
et al.,1995; Wheeler, 2001; Eskeland and Harrison, 2003), others showed weak evi-
dence (List and Co, 2000; Smarzynska and Wei, 2004), and a few detected stronger
empirical evidence (Keller and Levinson, 2002). In all these works, environmen-
tal regulation was considered as exogenous. More recently, some authors consider
that the environmental regulation is endogenous. Examining trade �ows, Edering-
ton and Minier (2003) argue that the environmental regulation could be used as a
secondary trade barrier to protect domestic industries. Their estimates of a system
of two simultaneous equations provide support for modelling pollution abatement
costs endogenously while studying their impact on net imports, and show that this
impact is stronger than in previous estimates with environmental regulation treated
exogenously. Levinson and Taylor (2008) use a simple theoretical model to describe
mechanisms like terms of trade e¤ects or unobserved heterogeneity among industries,
by which the endogeneity of pollution abatement costs that are often used to repre-
sent environmental stringency constituted a source of bias in previous empirical work
and may have led to an e¤ect opposite to the pollution haven one. Results of their
estimations with no correction for endogeneity show a weak relationship between net
exports and pollution abatement expenditures, while they emphasize a signi�cant
negative relationship when the authors instrument for pollution abatement costs.
In the literature on plant location or capital �ows, still fewer studies explicitly

French FDI and Pollution Emissions 168
account for endogeneity of environmental policy. Cole et al. (2006) address the
question of the endogeneity of environmental regulation to �ll the gap in the lit-
erature which has, according to them, largely studied the impact of environmental
policies on FDI, and too rarely the opposite relationship. They show through a po-
litical economy model of local environmental policymaking, that in an imperfectly
competitive local market where �rms join a lobby group, the FDI�s e¤ect on en-
vironmental policy is conditional on the government�s degree of corruptibility, and
they con�rm the predictions of the model by their empirical investigation.
In their work, Cole et al. (2006) concentrate on the impact of FDI on environ-
mental policy, with a lesser attention paid to the inverse relationship predicted by the
pollution haven hypothesis between the two variables. Nevertheless they instrument
FDI to take account of that opposite causality. In this chapter, we are interested
in both relationships, thus we consider simultaneously the reciprocal e¤ects of FDI
and environmental regulation in two distinct equations.
1.2 Trade, FDI and the environment
In the past century, researchers concerned with the environmental quality have
rapidly established a link between pollution levels and income per capita, giving
rise in the nineties to a large empirical literature about the relationship between the
environment and the income per capita. The seminal work of Grossman and Krueger
in 1993 has depicted a hump-shaped relation between some measures of air quality
and income per capita, implying that pollution may �rst increase with income per
capita and then falls with higher income. This work constituted the starting point
of what is called the Environmental Kuznets Curve literature in reference to the
Simon Kuznets�(1955) �nding of a hump-shaped relation between inequality and
French FDI and Pollution Emissions 169
per-capita income. Moreover, although the notions of scale, technique and compo-
sition e¤ects had already been referred to, Grossman and Krueger (1993) were the
�rst who explicitly introduced these three concepts to give an empirical evidence of
the environmental impacts of trade. Their study �rst evaluates the relative magni-
tudes of the scale and technique e¤ects on three air pollutants concentrations, but it
mostly investigates the compositional e¤ect of further trade liberalization between
the United States and Mexico, using results from a computable general equilibrium
model. On the one hand, their results show that air pollution increases with per
capita GDP at low income levels but decreases with GDP at higher levels of income;
on the other hand, they show that di¤erences in environmental regulations between
Mexico and USA do not play a major role in determining intersectoral resource al-
locations. Combining the evidence on the three e¤ects, their �ndings suggest that
NAFTA (North-America Free Trade Agreement) should be bene�cial to Mexico�s
environment.
Antweiler et al. (2001) brought a substantial improvement to the work of Gross-
man and Krueger (1993). They develop a theoretical model to decompose the impact
of trade on pollution into scale, technique and composition e¤ects, and use a con-
sistent dataset on sulfur dioxide concentrations to estimate jointly the three e¤ects
using a single-equation reduced-form model. They �nd that when openness is con-
ditioned on country characteristics, its impact on pollution concentrations resulting
from the composition e¤ect is highly signi�cant but relatively small. At the oppo-
site, estimates of the trade-induced scale and technique e¤ect imply a net reduction
in pollution. Finally, the authors �nd that combining the estimates of the three
e¤ects, trade liberalization appears to be bene�cial to the environment. Besides,
in an alternative speci�cation, Antweiler et al. (2001) introduce FDI to test for a
French FDI and Pollution Emissions 170
potential impact of FDI on their results. Although their results were much miti-
gated, their exercise represents broadly the unique direct investigation of the FDI
consequences on environment quality in the literature.
Dean (2002) also estimates the impact of trade and growth on water pollution in
Chinese provinces through scale, composition and technique e¤ects. But, according
to her, these few econometric studies that test for a relationship between trade open-
ness and environmental damage found some counter-intuitive results because they
lie on single-equation models that include a single variable representing the e¤ects
of trade openness, which is insu¢ cient to capture the opposite and simultaneous
e¤ects of trade on environment. In her work, Dean (2002) uses a Heckscher-Ohlin
model with endogenous factor supply, which leads to a two-equation-system that
captures the impact of trade liberalization on environment through its direct e¤ect
on the composition of output, and its indirect e¤ect via income growth. The model
thus disentangles the two e¤ects, but its estimates using Chinese provincial data
on water pollution show that these e¤ects work in opposite directions and did not
achieve to bring out a clear overall impact on emissions in China.
2 Empirical work
In this empirical study we are concerned with three closely related issues. First,
the extent to which environmental regulation a¤ects FDI �ows. Second, that envi-
ronmental regulation should be a¤ected in turn by foreign investment. The third
issue follows from the two preceding, and consists in determining the impact of such
interactions on the environment. An appropriate way to model our issues is to con-
sider them through three simultaneous equations: the �rst modelling the impact of
environmental regulation on FDI; the second equation modelling the impact of FDI

French FDI and Pollution Emissions 171
on environmental regulation; and the third equation modelling the overall impact
on pollution level.
2.1 FDI speci�cation
To estimate the impact of environmental regulation on FDI �ows, we rely on the
methodology that we adopted in Chapters 2 and 3, as well as referring to the large
literature on FDI determinants and pollution havens. We showed in Chapter 2 that
the pro�tability of a location for a �rm depends on the market potential of the
location and its total factor productivity, the �rm�s production costs (capital, labor,
and environmental costs), and some market failures. Since the factors determining
a �rm�s location choice also prevail in the determination of FDI �ows, we model the
FDI �ows in a country as a function of these factors.
FDImanit = �1ERit + �nDnit + "it (4.1)
While in Chapter 3 we examined plant location decisions, in this chapter the de-
pendent variable FDImanit is a quantitative measure representing the gross French
foreign direct investment manufacturing �ows2 in host country i at time t, with t =
years 1999-2003. Indeed, given that our present purpose is to evaluate the impact
on pollution levels, the �ows of investments seem to be a more appropriate measure
than location decisions since emissions levels are directly a¤ected by the amount of
�ows. The period of study is particularly well-adapted to our purpose since it follows
years of FDI deregulation across the world. Especially in developing and transition
countries, in 1999, highly polluting sectors which were previously restricted to FDI
have been liberalized, notable among them is the pharmaceutical industry. This
2NAF 1993, section D except subsection DF related to coke and petroleum re�neries.

French FDI and Pollution Emissions 172
creates an incentive to assess if such liberalizations have been accompanied by pol-
lution levels increases. As regards the data related to FDIman variable, they have
been made available for us from the Department of the Balance of Payments of the
French Central Bank. The supplied database provides the level of French invest-
ments by sector (NAF 1993 three-digit codes) and host country. As far as we know,
this data had not been used in a previous work, which gives a special interest to this
study. However, FDI �ows recorded from the balance-of-payment statistics include
not only equity capital, but also reinvested earnings and inter-�rms loans. In other
words, they comprise the �nancing of new investments, cross-border mergers and
acquisitions, retained earnings of subsidiaries and inter-�rm loans. Therefore, the
amount recorded can be exaggerated by �nancial �ows that are not correlated with
the creation, the acquisition or the expansion of foreign subsidiaries, and this may
a¤ect our results since the impact of FDI on pollution may be under-estimated.
Nevertheless, the share of �nancial �ows was not predominant during our period of
study, and it has been increasing from the year 20033.
To measure the stringency of environmental regulation ERit, we construct an
index of environmental regulation similar to our Environmental Regulation index
in Chapter 3, compound of the same four complementary environmental variables:
the number of multilateral environmental agreements rati�ed, the number of ISO
14001 certi�cations, the number of INGOs�members and the energy e¢ ciency4.
Nevertheless, in this chapter we do not incorporate the same multilateral agreements
and we focus rather on those directly related to international trade and industrial
pollution5.
3France is the �rst country that has recently adjusted its FDI �ows data from 2002, by sepa-rating data on equity capital and other capitals �ows.
4We also use the Z-score method to compute this index. This method has been developed inChapter 3.
5Multilateral Environmental Agreements included in our index are: the Vienna Convention;

French FDI and Pollution Emissions 173
As related to explanatory variables in vector Dnit, we also mostly follow the same
methodology than in Chapter 3. We calculate market potentialMPit, and total fac-
tor productivity growth TFP_growthit in country i at time t following commonly
used methods. We also capture capital and labor costs through the countries�relative
endowments in production factors, represented by the variable KL. KL is the ratio
K/L, with K the capital stock6 and L the total labor force. The market failures that
a¤ect a �rm�s location abroad being usually associated to the quality of governance
in a country, they are proxied by three institutional quality variables: the corruption
level (CORRUP ) and the government regulatory quality (REGULQUAL) devel-
oped by Kaufmann (2005)7, and the dummy variable FREE taking "1" for countries
considered by the Freedom House Organization as to be free according to their po-
litical rights and civil liberties of citizens, 0 otherwise. Moreover, dummy variable
PTA is introduced to control for a potential e¤ect on investments of trade openness
between host countries and France, and dummy (COL45) is introduced to control
for ex-colonial relationships between France and host countries. PTA takes value
"1" if a country is a EU-member or has contracted a preferential trade agreement
with the European Union, consequently with France, and 0 otherwise; while COL45
takes value "1" for countries in colonial relationship with France post 1945, and 0
otherwise8.
On the other hand, in addition to these factors we further explicitly include
the Basel Convention on hazardous waste trade, the Biosafety Protocol, the United Nations Frame-work on Convention for Climate Change, the Kyoto Protocol and the Stockholm Convention onPersistent Organic Pollutant.
6The capital stock is calculated by using the following formula: Kt= gross �xed capitalformationt + 0.95 capital stockt�1. Due to data availability (particularly concerning transitioncountries), the initial stock is represented by the gross �xed capital formation in 1990.
7CORRUP is the inverse of the original Kaufmann index which re�ects the control of cor-ruption in states (a higher value meaning a better governance outcome). It should then have anegative e¤ect on investments as a result of a greater corruption.
8See Chapter 3 for more detailed explanations concerning these variables.

French FDI and Pollution Emissions 174
in this chapter standard control for agglomeration e¤ects that have been largely
discussed in the literature on determinants of foreign direct investment, and we use
the stock of total inward FDI in host country (FDIstock).
While Equation (4.1) is consistent with the pollution haven literature and ex-
presses the FDI as a function of determinants, including environmental regulation,
new theories suggest a certain impact of FDI on environmental regulations. To allow
for this opposite causality and potential endogeneity of environmental regulation,
we model the latter as a function of FDI �ows and other exogenous variables that
we present below.
2.2 Environmental regulation speci�cation
According to political economy models which suggest that the environmental regu-
lation should be a¤ected by trade or FDI �ows, we consider in the speci�cation of
the environmental regulation the e¤ect of French direct investment. Principally, we
introduce the variable FDImanit of Equation (4.1) that represents the investments
from French manufacturing industries. Since it would be unlikely that marginal in-
vestments would have an impact on domestic policies, we have to focus on countries
where France represents a major investing country. We thus calculate for all coun-
tries the share of the net French investment in the total net foreign investment. Data
on net outward French investment is published by the French Central Bank, while
those on total net foreign investment come from the World Bank. We also comple-
mented this information by referring to o¢ cial documents from the French Minister
of Economy, Industry and Employment, that give detailed analyses of French FDI.
Finally, we keep in our sample the countries where the net French investment rep-
resents more than 10% of total net foreign investment and/or where France is at

French FDI and Pollution Emissions 175
worst the �fth most important investing country.
Moreover, unlike Cole et al. (2006) who considered the e¤ect of global FDI, we
suggest that only manufacturing industries should negatively in�uence environmen-
tal regulation. We thus also include in our speci�cation the FDI from French non
manufacturing sectors (FDInonmanit) to test this assumption9. The environmental
regulation could thus be expressed as following:
ERit = �1FDImanit + �2FDInonmanit + �nVnit + �it (4.2)
V nit includes a number of supplementary control variables. We take into account
the corruption (CORRUP ); which usually is expected to have a negative e¤ect on
environmental regulation. Indeed, bad governance and weak institutional quality
a¤ect the e¢ ciency of policies, and they may hamper the adoption and the enforce-
ment of environmental policies. For this reason, many less regulated countries also
su¤er from corruption, e.g. poorer African countries. However, some countries may
strengthen their regulation so as it gives them a bargaining power to extort payments
from �rms. Therefore, a positive relationship between corruption and environmen-
tal regulation is also likely to occur. The gross national income per capita GNIcap
and the rate of unemployment UNEMPL are explanatory variables re�ecting the
preferences for a good environment. The demand for a better environmental pro-
tection is expected to increase with the national income. Inversely, it is expected to
decrease with unemployment, since environmental issues become preoccupations of
secondary importance when unemployment prevails in an economy. We also intro-
duce the share of the manufacturing sector in the economy, MANUFempl; which
represents the labor intensity of manufacturing industries. Unlike Cole et al. (2006)
9NAF 1993, all sections except section D related to manufacturing industries.

French FDI and Pollution Emissions 176
who express this industrialization measure in terms of output in the speci�cation
of the environmental policy, we use here a measure in terms of input. We consider
that the measure in terms of outputs would be more appropriate in the pollution
equation, as described below. MANUFempl should be negatively correlated to en-
vironmental regulation. Thus, a greater part of workers in the manufacturing sector
put pressure to protect their industry from foreign competition, which is consistent
with a weakening of environmental regulations. Alternatively,MANUFempl should
be positively correlated to environmental regulation if it re�ects the share of non
pollution-intensive manufacturing in the economy. Finally, we introduce the level of
industrial pollution CO2manit to represent the marginal bene�t of environmental
regulation.
2.3 Pollution speci�cation
To estimate the e¤ect of FDI on environmental quality, we observe its impact on
carbon dioxide (CO2) emissions from manufacturing industries. We choose the CO2
for many reasons. First, CO2 is produced at important levels by manufacturing
industries10. During the last decade, CO2 emissions from manufacturing industries
represented more than 20% of total CO2 emissions in France. Second, CO2 is cur-
rently (and for about 15 years) the most "popular" pollutant since it is the main
greenhouse gas that is behind the principal concern of environmentalists and politi-
cians, namely global warming. For this same reason, carbon dioxide is the subject
of strengthening regulations at local levels as well as at the international level, as
seen with the launching of the Kyoto Protocol in 1997 and its enforcement in 2005.
10Nonetheless, CO2 it is not the main pollutant emitted by industries. For exemple, SO2 isemitted in higher quantities and had often been used in literature as a measure of local pollution.But data on SO2 emissions from manufacturing industries only exist for particular countries andyears that do not match to our study.

French FDI and Pollution Emissions 177
However, as described in Chapter 1, its regulation remains heterogenous among de-
veloped and developing countries11. Moreover, despite CO2 contributes to global
pollution, it is fairly to consider that it is a local pollution indicator, jointly emitted
with other local pollutants, i.e. NOx, CO. As an illustration, the correlation be-
tween CO2 emissions from manufacturing industries and water pollution resulting
from industrial activities, measured by the Biological Demand in Oxygen, is 0.90 in
our database (See Section 3). Finally, CO2 has available detailed data of its emis-
sions by activity, for a large panel of developed, emerging, transition and developing
countries from 1960 to today. With all these characteristics, CO2 as a proxy of
environmental pollution, is particularly well-adapted to our study.
Since our purpose in this chapter is to determine if foreign direct investment
from French manufactures contributes to an increase of pollution emissions due to
manufacturing activities, we use CO2 emissions from fuel combustion in manufac-
turing industries (CO2man) as the dependent variable in the pollution Equation
(4.3).
CO2manit = 1FDImanit + 2ERit + nFnit + �it (4.3)
The standard approach consists in analyzing the impact of trade liberalization
on environment by decomposing its environmental impact into scale, technique and
composition e¤ects12. Scale e¤ects refer to the increase in the size of an economy
11Actually, CO2 is a measure of global pollution, with large policy implications. While the directimplication of pollution haven hypothesis is the shifting of pollution from developed to developingcountries, which raises some ethical and local questions, another fear is that the improvementof environment quality in developed countries is more than compensated by the deterioration ofnatural resources in developing countries. This issue is emphasized in the case of transboundarypollution, because the e¤orts conceded by some countries in terms of environmental policy andpollution reduction would be annihilated if polluting production moves to less regulated countries,�nally leading in an increase of global emissions. In literature, this mechanism is called "carbonleakage" when it concerns the CO2 emissions.
12Studies focusing on the determinants of various pollutants detect some di¤erences depending

French FDI and Pollution Emissions 178
that results from liberalization and, ceteris paribus, is likely to increase pollution.
The technique e¤ect refers to the positive environmental consequences of changes
in production methods that accompany trade liberalization and income growth. In-
deed, liberalization-induced higher income causes people to increase their demand
for a cleaner environment and stricter environmental regulations, encouraging �rms
in adopting cleaner production processes and reducing emissions. Finally, the com-
position e¤ect represents the change in the industrial structure of an economy, as
with trade liberalization each country specializes in those activities in which it has
a comparative advantage. The impact of the composition e¤ect on pollution emis-
sions depends therefore upon the determinants of a country�s comparative advan-
tage. Since these three e¤ects should play in opposite directions, empirical studies
often attempted to assess the overall e¤ect of trade liberalization on pollution.
We measure the scale e¤ect through the gross domestic product (GDP ) of the
country. Since GDP represents the economic activity inside a country�s borders, it
is the economic variable the most likely to capture the e¤ect of the local economic
activity on pollution. The composition e¤ect had often been captured through the
ratio (K/L) in literature (e.g., Antweiler et al., 2001). However, high KL ratios in
an economy could be consistent with an increased share of high-tech services that
are not energy intensive (e.g., telecommunications). We use here a more accurate
measure expressing the share of the manufacturing sector in terms of outputs, i.e.
the share of the manufacturing sector value added in GDP (MANUFsh). This
variable is more likely to capture the share of the manufacturing sector compared
with the primary and the secondary sectors than KL ratio. Though capturing the
on the pollutant considered. For instance, Cole et al. (2005) and Bruneau and Renzetti (2009)show that CO2 emissions seem to be particularly a¤ected by the composition e¤ect in UnitedKingdom and France, respectively. We will see below that this e¤ect would be captured by thevariable MANUFsh, while we also introduce variables controlling for the scale e¤ect and thetechnique e¤ect which are generally common to other pollutants.

French FDI and Pollution Emissions 179
intra-manufacturing sector composition would have been still more informative, we
can suppose that an economy where the manufacturing sector prevails should have a
higher level of CO2 emissions, thus we expect a positive estimate coe¢ cient for this
variable. Moreover, we distinguish our work in two other ways. First, the technique
e¤ect is captured through a consistent index representing environmental regulation
(ER), which is a much more precise and direct measure of technique e¤ect than
income levels or other proxies often used. Second, we investigate here the impact of
FDI on pollution emissions while most of studies consider only trade liberalization
e¤ects. More precisely, we are interested in studying the impact of French FDI of
Equation (4.1) on the environmental quality of host countries, in order to say if
pollution havens �if they are veri�ed in Equation (4.1)�, are really threatening to
the environment. To do this, we introduce in Equation (4.3) the dependent variable
FDImanit of Equation (4.1) to capture its direct e¤ect on pollution emissions. In
this way, we isolate the e¤ect of French FDI, while the e¤ect of FDI from other
countries and that of local �rms are already captured by the scale, the technique
and the composition e¤ects.
2.4 Estimation
Simultaneous estimation of Equations (4.1), (4.2) et (4.3) allows us to treat both the
environmental regulation and the level of FDI as endogenous variables and should
reveal their e¤ect on pollution levels. Regarding the estimation method, three-stage
least squares (3SLS) are more e¢ cient than two-stage least squares (2SLS) under the
assumption that the equations in the system are well identi�ed, while two-stage least
squares are more robust to speci�cation error. Results of a Hausman speci�cation
test indicate that we can accept the null hypothesis that the coe¢ cients do not

French FDI and Pollution Emissions 180
systematically di¤er between 2SLS and 3SLS estimates.
The model being correctly identi�ed, Table 4.1 reports 3SLS estimates of Equa-
tions (4.1), (4.2) and (4.3) for French FDI from manufacturing industries (FDIman)
in Model (1), French FDI from most polluting industries (FDImanMP ) in Model
(2), and those on less polluting industries (FDImanLP ) in Model (3)13. In all mod-
els, variables are log-linearized (apart from the total factor productivity growth, the
unemployment rate and the share of the manufacturing sector value added in GDP,
yet expressed in percentage, and the three dummy variables representing the po-
litical and civil rights, the preferential trade agreements and the former colonial
relationship). Variables capturing the relative endowments in production factors,
the share of the manufacturing sector in the economy and the stock of total FDI
have been lagged one-year to avoid any possible endogeneity with the dependent
variable.
13Manufacturing industries correspond to all sectors from the Division D of NAF 1993 classi�ca-tion. The subsection DF (Manufacture of coke, re�ned petroleum products and nuclear fuel) is ex-cluded from our sample on account of special characteristics. We remain consistent with literatureand general view by considering as polluting industries those belonging to sectors of Manufactureof pulp, paper and paperboard (21.1 three-digit NAF codes), Chemical and parachemical industry(24.1-24.3 and 24.5-24.7), Manufacture of rubber and plastics (25.1-25.2), Manufacture of othernon-metallic mineral products (26.1-26.8), Basic metal industries (27.1-27.5). Remaining sectorsare considered as less polluting sectors.

French FDI and Pollution Emissions 181
Table 4.1: Regressions estimates
(1) (2) (3)lnFDIman lnFDImanMP lnFDImanLP
TFP_growth -0.015 -0.037 -0.019(0.018) (0.036) (0.023)
lnMP 0.687** 1.369*** 0.849***(0.286) (0.511) (0.328)
lnKLt�1 0.981*** 1.507** 0.819**(0.334) (0.594) (0.409)
lnER -7.511*** -9.281*** -6.720***(1.285) (2.071) (1.543)
lnREGULQUAL -3.735 1.790 -4.724(3.887) (6.201) (4.093)
FREE 1.985** 1.540 3.823***(0.906) (1.338) (1.161)
lnCORRUP -3.858 1.063 -3.139(2.438) (3.910) (2.865)
PTA 0.446 -0.227 1.473**(0.562) (1.069) (0.750)
COL45 0.754 1.588 1.620(0.958) (1.698) (1.182)
lnFDIStockt�1 0.371 0.599 0.219(0.229) (0.443) (0.286)lnER lnER lnER
lnFDIman -0.060*(0.032)
lnFDInonman 0.002 0.016 0.010(0.017) (0.015) (0.012)
lnCORRUP -0.601*** -0.386*** -0.540***(0.184) (0.146) (0.158)
lnGNIcap 0.237*** 0.225*** 0.254***(0.062) (0.048) (0.053)
MANUFemplt�1 0.010** 0.015*** 0.013***(0.005) (0.003) (0.003)
UNEMPL 0.000 -0.006 -0.002(0.005) (0.004) (0.004)
lnCO2man -0.091** -0.142*** -0.137***(0.042) (0.027) (0.025)
lnFDImanMP -0.024* 0.001(0.014) (0.004)
lnFDImanLP 0.000 -0.043***(0.006) (0.016)
lnCO2man lnCO2man lnCO2man

French FDI and Pollution Emissions 182
lnFDIman 0.094***(0.035)
lnGDP 0.522*** 0.490*** 0.546***(0.053) (0.049) (0.047)
MANUFsh 0.056*** 0.058*** 0.055***(0.011) (0.011) (0.011)
lnER -1.028*** -1.012*** -1.130***(0.141) (0.146) (0.136)
lnFDImanMP 0.090*** 0.022(0.025) (0.014)
lnFDImanLP 0.015 0.046*(0.017) (0.027)
R-squared 0.28 0.20 0.28N. of obs. 106 106 106
Standard errors in parentheses. * p<0.1, ** p<0.05, *** p<0.01.Constant terms not reported.
Model (1) reports results for all manufacturing industries. The estimate of Equa-
tion (4.1) shows a coe¢ cient of environmental regulation negative and statistically
signi�cant at the 1% level, as expected by the pollution haven hypothesis. This
�nding con�rms the fact that the French FDI is attracted by lax environmental reg-
ulations. A 1% decrease of environmental regulation would increase FDI by more
than 7.5%, representing an important deterrent e¤ect. This result refutes previous
empirical studies which, by treating the level of environmental regulation as exoge-
nous, did not identify an impact of environmental policy on FDI; and it con�rms
the few previous works that found a signi�cant but quite small impact.
The market potential, the relative endowments in production factors and variable
FREE are also signi�cant in the speci�cation of FDI. The market potential has a
positive and signi�cant impact on FDI referring to the demand motivation of FDI.
The coe¢ cient on KL is also positive and signi�cant at the 1% level, implying that
in our sample, French FDI is attracted by countries that are relatively-abundant in
capital. Variable FREE shows that democracy attracts French manufacturing FDI.

French FDI and Pollution Emissions 183
In order to express more precisely the impact of the environmental regulation
on French FDI, we try an analysis evaluating what would occur if a lax country
adopted a stricter environmental policy. As an illustration, we compare the im-
pact on French FDI �ows in Morocco if Morocco had adopted the environmental
regulation of Germany in 2000. We �nd that every thing else equal, replacing the
ER index value of Morocco by the value of Germany would lead to about a 80%
decrease of FDI �ow in Morocco in 2000. This result highlights the strong e¤ect of
the environmental regulation. We try the same analysis with the market potential,
and we �nd that if Morocco had have the market potential of Germany in 2000, the
total manufacturing FDI would have increased by more than 100%. Therefore, the
market potential also seems to be an important determinant of French FDI.
The estimate of Equation (4.2) shows that French manufacturing FDI is nega-
tively correlated to the environmental regulation of host countries, while FDInonman
is insigni�cant, con�rming our hypothesis that only manufacturing industries should
have an impact on environmental regulation. These results are consistent with pre-
dictions of political economy models suggesting that �rms may lobby to under-
regulate corrupted host countries. Apart from the UNEMPL variable that is in-
signi�cant, other control variables included in V n are all highly signi�cant. Consis-
tent with previous theoretical and empirical results in literature (Damania, Fredriks-
son and List, 2003; Fredriksson and Svensson, 2003), we observe that corruption pre-
vents countries from setting up an e¢ cient environmental policy. Inversely, in richer
countries where the income per capita is higher, the environmental regulation is
stricter, in accordance with population and governments preferences. MANUFempl
displays a positive relationship with ER. Since less-polluting industries are those
likely to be more-intensive in labor, the positive coe¢ cient on MANUFempl indi-

French FDI and Pollution Emissions 184
cates that the greater the share of less-polluting industries in economy, the stricter
the environmental regulation. Reciprocally, the greater the share of most-polluting
industries in economy the less-strict the environmental regulation. The signi�cant
and negative coe¢ cient on CO2man seems to assert the latter statement: an econ-
omy that has a larger part of its manufacturing polluting, which is consistent with a
higher level of pollution, sees its environmental regulation lowered. In this case, the
level of pollution does not re�ect the marginal bene�t of increasing environmental
regulation but the pressure from polluting industries to lessen regulation.
The results of the pollution equation regression in Model (1) represent the third
concern of this chapter, as it regards the impact of FDI on CO2 emissions. Every-
thing else being equal, more French manufacturing FDI increases the pollution emit-
ted in host countries. Empirical �ndings related to scale, technique and composition
e¤ects are consistent with theory: the scale and composition e¤ects raise pollution
emissions, while the technique e¤ect drops it. The technique e¤ect is captured by
the environmental index representing environmental stringency. Thus, the negative
relationship between pollution emissions and ER should refer to a reduction of pol-
lution emissions due to the adoption of cleaner technologies following strengthened
regulations.
While estimations resulting from regressions on all manufacturing sectors in
Model (1) are of a great interest since they enable us to draw general conclusions
about the manufacturing French FDI, we expect that more detailed analyses focus-
ing on highly polluting industries in Model (2) and less polluting ones in Model (3)
would bring out additional explanations. Indeed, examining the estimate of Equa-
tion (4.1) for both models, we �rst observe that the environmental regulation ER
has a negative impact on polluting FDI (FDImanMP , Model (2)) as well as on less
French FDI and Pollution Emissions 185
polluting one (FDImanLP , Model (3)), with a coherent higher elasticity of pollut-
ing FDI. Also the market potential and the relative capital endowment variables
keep their signi�cantly positive impact through both models. The variable FREE
that was signi�cant in Model (1) remains signi�cant in Model (3) regarding less-
polluting industries, but lose signi�cance in explaining polluting FDI. This suggests
that the environmental regulation could be the main determining factor of French
polluting FDI.
The estimates of Equations (4.2) and (4.3) while decomposing manufacturing
industries into polluting and less-polluting bring out complementary information to
our previous preliminary conclusions. First, examining the estimate of Equation
(4.2), we observe that FDImanMP and FDImanLP variables are negative and
signi�cant in Models (2) and (3), respectively. This shows that the negative impact
of FDI on the environmental regulation in Model (1) results from polluting as well as
less polluting French FDI. Second, the estimate of Equation (4.3) emphasizes results
from Model (1), since both FDI from polluting and less-polluting industries increase
the level of CO2 emissions from manufacturing, with an expected more signi�cant
impact of polluting FDI. Moreover, the impacts of FDImanMP and FDImanLP
in the Equations (4.2) and (4.3) highlight the interest of considering separately each
variable as endogenous, since their impact appears in each respective model while
it is occulted in other speci�cation. Finally, other coe¢ cients in the estimates of
Equations (4.2) and (4.3) are close to those depicted in Model (1) and lead to the
same conclusions.
It is worth discussing here the di¤erent modes of FDI, principally green�eld
investments and mergers and acquisitions (M&A). Indeed, it is often hoped that
spillover e¤ects exist and that FDI acts as a vehicle through which new ideas, tech-
French FDI and Pollution Emissions 186
nologies, and working practices can be transferred to domestic �rms (Wang and
Blomström, 1992). Furthermore, it is expected that the impact of FDI on pollution
levels di¤ers with regard to the mode of entry. FDI through green�elds seems to be
more likely to transfer new, better and cleaner technology than M&A, at least at
the time of entry. Indeed, cross-border M&A can be followed of better technology
especially when acquired �rms are restructured to increase the e¢ ciency of their
operations. Moreover, with greater linkages in the case of M&A, there is greater
potential for spillovers of FDI to be larger than in the case of green�eld investment.
Therefore, even if M&A investment does not transfer newer equipment and technol-
ogy at inception, it is expected to have a more positive impact on the local economy,
especially through vertical linkages, whereas green�eld investment takes time and
e¤orts to develop such linkages. This is due to the fact that M&A have a more
developed network of local and regional suppliers, whereas green�elds enterprises
are more likely to rely on imported supplies. We do not have information about the
mode of entry of FDI in our database. However, annual reports of the French Cen-
tral Bank shows that for our period of study (1999-2003), the share of M&A in the
equity capital of FDI represented about 71%, 77%, 68%, 36% and 45%, respectively.
Therefore, during our period of study, the share of M&A was on average larger
than the share of green�eld investment. Since as described above, bene�cial e¤ects
of M&A are enhanced in the long term, the reduction of pollution emissions that
would result from M&A undertaken in years 1999-2003 is more likely to be captured
in subsequent years. This may be one explanation of the positive relationship found
between French FDI and pollution emissions. Moreover, these results are consistent
with the �ndings of Chapter 3, which suggest that green�eld investment between
1996 and 2002 were not necessarily a vehicle of cleaner technologies.

French FDI and Pollution Emissions 187
3 Extended analysis
To assess the sensitivity of our results to the choice of instruments, and to extend
our analysis, in this section we test several alternative speci�cations of base Mod-
els (1), (2) and (3). Since one principal concern in this study is to check for the
impact of French FDI on pollution, in order to be more exhaustive, the primary at-
tempt is to run estimates on another pollutant that would di¤er from CO2 for some
characteristics. For instance, this pollutant would be preferably related to another
medium. The Biological Demand in Oxygen (BOD), whose data are published by
the World Bank, is an appropriate pollutant, since it represents emissions of organic
water pollution resulting from industrial activities, is a measure of local pollution,
and is available for a panel of years and countries. Table 4.2 reports estimates of
base models using BOD (BOD) in Models (4) to (6) and Table 4.3 reports esti-
mates using BOD per worker (BODw) in Models (7) to (9). The use of each of
these two variables is of a particular interest. The use of BOD is a direct robustness
test of our regressions on CO2 emissions, and both have the advantage of estimating
the impact on total emissions which are the ultimate concern of the environmental
policies implemented to reduce pollution. However, intensive approaches are often
adopted by governments that attempt to control emissions intensities rather than
total emissions (e.g., carbon tax), the objective being to make pollution intensity
fall even if total emissions rise (this negative relationship has been demonstrated by
Bruneau and Echevarria, 2009). In such cases, environmental regulation would more
directly a¤ect pollution intensity like the BOD per worker than total emissions. Sim-
ilarly, Models (4) and (7) concern total French manufacturing FDI, whereas Models
(5) and (8) examine with more details polluting FDI and Models (6) and (9) less
polluting one.

French FDI and Pollution Emissions 188
Table 4.2: Robustness tests (BOD)
(4) (5) (6)lnFDIman lnFDImanMP lnFDImanLP
TFP_growth -0.017 -0.017 -0.017(0.021) (0.031) (0.020)
lnMP 0.642* 0.985* 0.631(0.388) (0.555) (0.388)
lnKLt�1 1.269*** 1.363** 1.224***(0.416) (0.585) (0.414)
lnER -7.747*** -11.341*** -7.223***(1.347) (1.869) (1.344)
lnREGULQUAL-5.662 -5.627 -6.296(5.227) (7.487) (5.043)
FREE 1.394 1.578 1.636(1.056) (1.537) (1.079)
lnCORRUP -2.957 -1.704 -3.353(2.808) (3.915) (2.815)
PTA -0.318 -1.126 0.039(0.798) (1.163) (0.815)
COL45 0.635 1.730 0.441(1.128) (1.652) (1.127)
lnFDIStockt�1 0.732** 1.288*** 0.594**(0.297) (0.434) (0.296)lnER lnER lnER
lnFDIman -0.102***(0.022)
lnFDInonman 0.015 0.022 0.014(0.014) (0.015) (0.014)
lnCORRUP -0.467** -0.329* -0.518**(0.200) (0.188) (0.203)
lnGNIcap 0.207*** 0.136** 0.230***(0.067) (0.064) (0.069)
MANUFemplt�10.013*** 0.012** 0.014***(0.005) (0.005) (0.005)
UNEMPL 0.001 0.006 0.000(0.005) (0.005) (0.006)
lnBOD 0.009 0.037 -0.019(0.039) (0.037) (0.038)
lnFDImanMP -0.084***(0.018)
lnFDImanLP 0.003 -0.098***(0.010) (0.025)
lnBODw

French FDI and Pollution Emissions 189
lnBOD lnBOD lnBODlnFDIman 0.197***
(0.049)lnGDP 0.397*** 0.380*** 0.437***
(0.072) (0.060) (0.063)MANUFsh 0.048** 0.058*** 0.052***
(0.019) (0.018) (0.017)lnER -0.060 0.585** -0.115
(0.253) (0.276) (0.231)lnFDImanMP 0.217***
(0.039)lnFDImanLP -0.027 0.102**
(0.032) (0.052)R-squared 0.42 0.37 0.41N. of obs. 67 67 67
Standard errors in parentheses. * p<0.1, ** p<0.05, *** p<0.01.Constant terms not reported.
Globally, results of Models (4)-(6) related to BOD are similar to those in Table
4.1, and con�rm the sign and signi�cance of our variables of interest. Thus, the
environmental regulation deters manufacturing FDI, manufacturing FDI lowers the
strictness of environmental policy and increases the emissions of water pollution.
These conclusions are valid whether we examine global manufacturing FDI (Model
(4)), polluting FDI (Model (5)) and less polluting FDI (Model (6)). More partic-
ularly, in the estimate of Equation (4.2), we observe that polluting as well as less
polluting FDI negatively in�uence the environmental policy in relative Models (5)
and (6). In the estimate of Equation (4.3), they increase the emissions of water
pollution.
In Table 4.3 below, results of Models (7)-(9) using BOD per worker are roughly
similar as regards to estimates of Equations (4.1) and (4.2). A one-percent in-
crease in environmental policy discourages global manufacturing by more than 7%,
and discourages polluting manufacturing FDI and less polluting manufacturing FDI

French FDI and Pollution Emissions 190
by about 10.4% and 6.4%, respectively. The estimate of Equation (4.2) displays also
negative and strongly signi�cant impact of FDIman, FDImanMP and FDImanLP
on environmental policy in Models (7), (8) and (9), respectively. Moreover, we no-
tice interesting opposite e¤ects of FDI on BODw for Equation (4.3) estimate. Thus,
in Model (7), the impact of total manufacturing FDI on BODw is signi�cantly neg-
ative, which means that an increase of French manufacturing FDI decreases the
water pollution emitted by worker in host country. Moreover, while FDImanMP
becomes insigni�cant in related Model (8), FDImanLP variable becomes signi�-
cantly negative in Models (8) and (9). These results �rst suggest that the decreasing
impact of French manufacturing FDI on BODw in Model (7) re�ects mainly the
decreasing impact of FDImanLP . Secondly, comparing Models (4)-(6) to (7)-(9),
on one hand, results on the Biological Demand in Oxygen indicate that an increase
of French manufacturing FDI increases pollution whether the sector is highly pol-
luting or less polluting. On the other hand, examining the Biological Demand in
Oxygen per worker which re�ects the pollution intensity, we observe that the less
polluting French manufacturing FDI seems to improve the local environmental ef-
�ciency. This result should refer to the "pollution halo hypothesis". According to
this hypothesis, multinational �rms are less pollution intensive than their domestic
counterparts, thus trade liberalization facilitates transfers of technology that would
be bene�cial to the environment. Moreover, this suggestion captured through the
BOD per worker is consistent with the fact that the transfer of technology is gen-
erally admitted to take place through the training of local workers. It emphasizes
positive impacts of M&A through vertical linkages, which happens more rapidly
than the above mentioned positive impacts resulting from restructuring. Therefore,
it seems that when we examine simultaneously FDI and pollution emissions, bene�ts
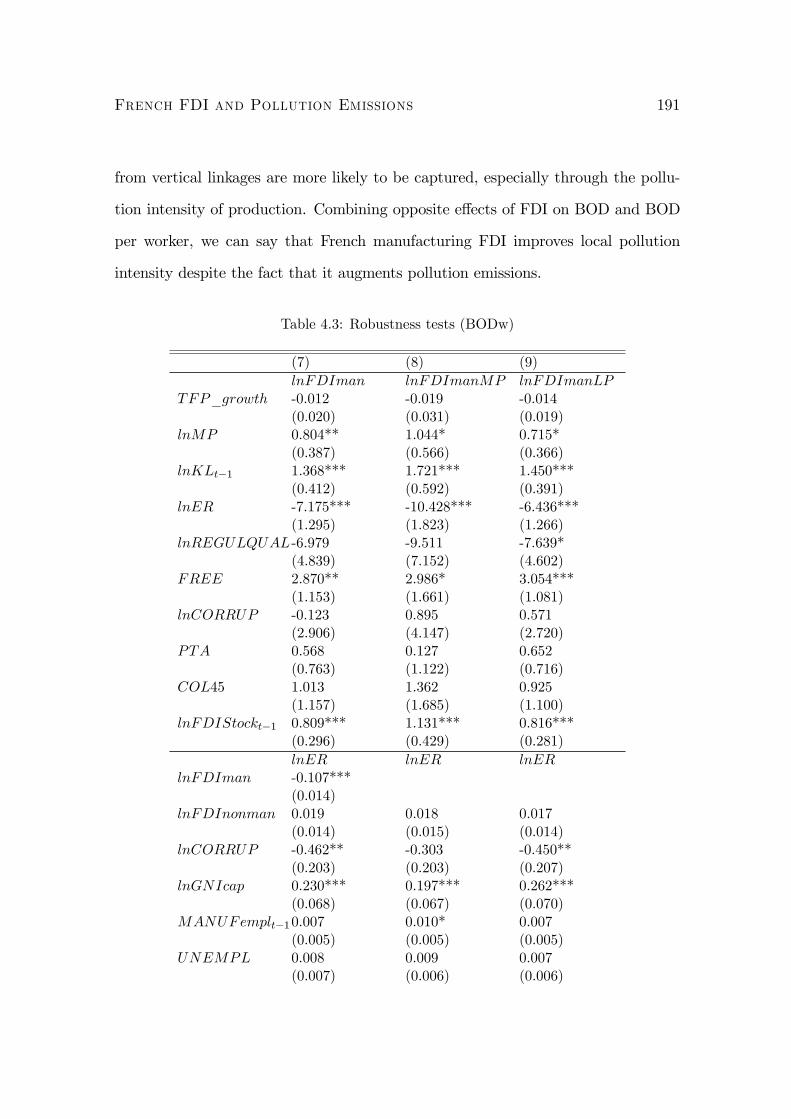
French FDI and Pollution Emissions 191
from vertical linkages are more likely to be captured, especially through the pollu-
tion intensity of production. Combining opposite e¤ects of FDI on BOD and BOD
per worker, we can say that French manufacturing FDI improves local pollution
intensity despite the fact that it augments pollution emissions.
Table 4.3: Robustness tests (BODw)
(7) (8) (9)lnFDIman lnFDImanMP lnFDImanLP
TFP_growth -0.012 -0.019 -0.014(0.020) (0.031) (0.019)
lnMP 0.804** 1.044* 0.715*(0.387) (0.566) (0.366)
lnKLt�1 1.368*** 1.721*** 1.450***(0.412) (0.592) (0.391)
lnER -7.175*** -10.428*** -6.436***(1.295) (1.823) (1.266)
lnREGULQUAL-6.979 -9.511 -7.639*(4.839) (7.152) (4.602)
FREE 2.870** 2.986* 3.054***(1.153) (1.661) (1.081)
lnCORRUP -0.123 0.895 0.571(2.906) (4.147) (2.720)
PTA 0.568 0.127 0.652(0.763) (1.122) (0.716)
COL45 1.013 1.362 0.925(1.157) (1.685) (1.100)
lnFDIStockt�1 0.809*** 1.131*** 0.816***(0.296) (0.429) (0.281)lnER lnER lnER
lnFDIman -0.107***(0.014)
lnFDInonman 0.019 0.018 0.017(0.014) (0.015) (0.014)
lnCORRUP -0.462** -0.303 -0.450**(0.203) (0.203) (0.207)
lnGNIcap 0.230*** 0.197*** 0.262***(0.068) (0.067) (0.070)
MANUFemplt�10.007 0.010* 0.007(0.005) (0.005) (0.005)
UNEMPL 0.008 0.009 0.007(0.007) (0.006) (0.006)

French FDI and Pollution Emissions 192
lnBOD
lnFDImanMP -0.070*** 0.016*(0.013) (0.009)
lnFDImanLP -0.002 -0.138***(0.012) (0.021)
lnBODw -0.322** -0.117 -0.414***(0.149) (0.152) (0.150)lnBODw lnBODw lnBODw
lnFDIman -0.084***(0.026)
lnGDP 0.066* -0.000 0.072**(0.038) (0.031) (0.034)
MANUFsh -0.013 -0.008 -0.008(0.010) (0.009) (0.009)
lnER -0.402*** -0.117 -0.282**(0.133) (0.142) (0.128)
lnFDImanMP 0.033 0.041***(0.020) (0.013)
lnFDImanLP -0.064*** -0.141***(0.017) (0.027)
R-squared 0.43 0.39 0.43N. of obs. 67 67 67
Standard errors in parentheses. * p<0.1, ** p<0.05, *** p<0.01.Constant terms not reported.
4 Robustness tests
We run two additional robustness tests of our results (Table 4.5 in Appendix 4.C).
In Models (10) to (12), we introduce as an additional control the GDP per capita
(GDPcap), which is a commonly used variable for productivity approximation. In
Models (13) to (15), we incorporate in the three equations, four regional dummies
grouping countries into four homogeneous clusters, to take into account �xed e¤ects
for countries of a same region14; and we also incorporate time speci�c-e¤ects. Results
of Models (10)-(12) with GDPcap are broadly similar in sign and signi�cance to14High-income, Emerging, Transition CEEC, and Developing countries.
French FDI and Pollution Emissions 193
those of Table 4.1 and con�rm previous results, while GDPcap is not signi�cant.
Models incorporating �xed e¤ects also display very similar results. However, in the
estimate of Equation (4.3), we note that only FDI from less polluting industries has
an impact on pollution, and this impact is negative.
Finally, in order to enlarge our scope of study, we relax the assumption that
French FDI could in�uence environmental regulation in host countries. We are thus
allowed to consider the total sample of countries present in our database. Countries
are listed in Appendix 4, and results appear in Table 4.6 in Appendix 4.C. For most
of variables, we draw the same conclusions as suggested by our previous results,
especially in Model (16) which is related to all manufacturing industries: a stricter
environmental regulation deters French FDI, and an increase in French FDI raises
pollution emissions. However, the impact of French FDI on environmental regulation
in Equation (4.2) deserves a particular attention. Surprisingly, the relationship
between the two variables remains signi�cant in the three models. But in the present
case, it is a positive relationship. In other words, the higher the French FDI in
host countries, the stricter the environmental regulation. This may refer to the
"welfare e¤ect" mentioned by Cole et al (2006). They argued that an increase
in the investments intensi�es the level of competition in a country, and therefore
reduces the government�s incentive to lower the pollution tax for stimulating output
and raising consumer welfare. Moreover, this situation is more likely to occur when
the corruptibility of governments is lower. This statement remains consistent with
the actual situation since we are considering all hosting countries of French FDI, and
not only those where French investors have in�uence. Thus, when French investors
do not have a su¢ cient power for lobbying to under-regulate host countries, French
FDI would rather positively a¤ect environmental regulation. Moreover, results from
French FDI and Pollution Emissions 194
Models (17) and (18) suggest that the environmental regulation only deters most
polluting FDI, while it is the FDI from less polluting �rms that raises pollution.
A potential explanation is that when we do not concentrate on signi�cant host
countries for French investors, French polluting FDI becomes probably marginal,
while FDI from less polluting sectors is more determined by other factors than a
lenient environmental regulation since it could not lower it.
Conclusion
Whereas previous empirical literature has investigated the impact of environmental
regulations on foreign direct investment, fearing the emergence of pollution havens,
two important but largely ignored empirical issues behind this topic are whether
foreign direct investment in�uences environmental regulations and whether such
pollution havens increase pollution. In this chapter, we consider mutual relationships
between the FDI, the environmental regulation and the pollution, as to con�rm
the pollution havens hypothesis in the case of France and determine its impact on
pollution in host countries. We use detailed manufacturing French investments data
to estimate a system of three equations where FDI, environmental regulation and
pollution are modeled endogenously. This essay is thus interesting since it represents,
to our knowledge, the �rst attempt to empirically estimate how French FDI a¤ects
pollution levels in host countries. Our results consolidate our �ndings of Chapter
3 proving the pollution haven hypothesis in the case of French FDI. They further
con�rm recent works detecting a negative impact of environmental regulation on FDI
location, while we take into account the endogeneity of environmental regulation.
The endogeneity of FDI is besides re�ected by a decreasing impact on environmental
policy. We further improve our interpretations by conducting separate regressions

French FDI and Pollution Emissions 195
for FDI from most polluting and FDI from less polluting sectors. Those regressions
show that environmental regulation exerts a negative impact on more polluting FDI
as well as on less polluting FDI, with an expected stronger e¤ect on more polluting
one. They also demonstrate the negative correlation between both kinds of French
FDI and the environmental policy of host countries. However, in a speci�cation
including all countries and not only those where French investment is of a prime
importance, it appears that French FDI is positively related to the host country�s
environmental regulation.
Regarding the environmental impact of FDI, we observe a positive relation-
ship between French manufacturing FDI and pollution emissions in host countries,
whether we examine CO2 air pollution or a more local water pollution. This dam-
aging impact is more signi�cant from most polluting FDI. Looking at the speci�c
case of increasing emissions of CO2, even if in our study we do not particularly focus
on transboundary pollution, our results could be compatible with the existence of
a carbon leakage. This is consistent with the latest annual study from the Global
Carbon Project, published on 17th of November 2008 in the Nature Geoscience re-
view, which mentions that CO2 emissions reached a record of about 10 billion GtC
in 2008. Researchers besides specify that emissions from developing countries not
under the Kyoto Protocol became larger than those of developed countries four years
ago, but they warn against too hasty conclusions since they recall that a large part
of those emissions are in fact due to production from �rms originating in developed
countries but relocated in developing ones. They illustrate their remarks with the
example of the United Kingdom, whose CO2 emissions dropped by 5 % between
1992 and 2004, while its emissions based on consumed goods, mostly produced in
the South, rose by 12%. Implications from our results have been observed through

French FDI and Pollution Emissions 196
the recent climate change conference of Copenhagen, in December 2009. It seems
that this issue of carbon leakage was the stake of huge negotiations, from which at
last it followed a larger implication from emerging and South countries for reducing
CO2 emissions, and probably strengthening environmental regulation.
Finally, a few di¤erent speci�cations measuring the impact of FDI on water
emissions by worker exhibit an opposite relationship: greater FDI from less pol-
luting sectors is consistent with a reduction of pollution intensity. Such a result
indirectly refers to the use of cleaner technologies by French �rms than done by
their local counterparts and to a small transfer of technologies. Thus, on account of
this result, while in this work we have been mainly interested in the e¤ect of foreign
direct investment on total emissions, a further investigation of its impact on pollu-
tion intensity is worthwhile. Combining opposite e¤ects of FDI on BOD and BOD
per worker, we can say that French manufacturing FDI improves local environmen-
tal e¢ ciency despite the fact it augments pollution emissions. Or we can say that
French manufacturing FDI augments pollution emissions, even if it improves local
environmental e¢ ciency. The challenge would be to reach a situation where the ex-
tent to which French �rms improve local environmental e¢ ciency causes a reduction
of pollution. If this goal is achieved, we would have a fresh look on the pollution
haven debate. Further investigation should concentrate on examining the conditions
or the characteristics from both source and host countries that may facilitate the
assimilation of a better environmental management promoted by FDI.

French FDI and Pollution Emissions 197
Appendix 4
4.A Data summary
Table 4.4: Data de�nitions and sources
Variable De�nition SourcesFDIman Flows of French foreign direct in-
vestment. NAF 1993 classi�cation,Section D "Manufacturing indus-tries", except subsection DF "cokeand petroleum re�neries".
French Central Bank, Departmentof the Balance of Payments.
FDImanMP Division D 3-digit NAF 1993 codes21.1, 24.1-24.3, 24.5-24.7, 25.1-25.2,26.1-26.8, 27.1-27.5.
French Central Bank, Departmentof the Balance of Payments.
FDImanLP Division D 3-digit NAF 1993 codes,excluding those corresponding toFDImanMP and those belongingto DF subsection (23.2 and 23.3).
French Central Bank, Departmentof the Balance of Payments.
MP Market potential Data on international trade:R.Feenstra and R.Lipsey, NBER1990-2000.Chelem, CEPII, 2000-2004.Geographic data: CEPII.
TFP_growth Total factor productivity growth Authors calculation using datafrom World Development Indica-tors, World Bank.
GDPcap GDP per capita (constant 2000US$).
World Development Indicators,World Bank.
KL Country relative endowments inproduction factors,
World Development Indicators,World Bank.
(capital versus labor).ER Environmental regulation index Authors calculation
Multilateral Environmental Agree-ments
Earthtrends, World Resources Insti-tute
ISO 14001 International Organization for Stan-dardization
International NGOs Center for the Study of Global Gov-ernance

French FDI and Pollution Emissions 198
Energy e¢ ciency (GDP/unit of en-ergy used)
World Bank
CORRUP Institutional quality variable of cor-ruption.
Governance Indicators 1996-2004,D. Kaufmann, A. Kray and M. Mas-truzzi.
REGULQUAL Regulations improving �rm�s gen-eral business environment.
Governance Indicators 1996-2004,D. Kaufmann, A. Kray and M. Mas-truzzi.
FREE Dummy taking value 1 if a countryis considered democratic.
Freedom House Organization.
PTA Dummy taking value 1 if a countryhas a preferential trade agreementwith EU.
Preferential trade agreements data-bse (PTAs).
COL45 Dummy taking value 1 if a coun-try had a colonial relationship withFrance post 1945.
DISTANCES database from CEPII.
FDIstock Stocks of FDI. UNCTAD FDI statistics database.FDInonman Flows of French foreign direct in-
vestments. NAF 1993 classi�cation,French Central Bank, Departmentof the Balance of Payments.
all sections except section D "Man-ufacturing industries".
GNIcap Gross national income per capita. World Development Indicators,World Bank.
MANUFempl Number of employees in manufac-turing industries/total employment.
ILO Laborsta database.
CO2man CO2 emissions (kt) from manufac-turing industries, ISIC 15-37 except23 "Manufacture of coke, re�ned pe-troleum products and nuclear fuel".
IAE database, Source OCDE.
BOD Biochemical oxygen demand(kg/day).
World Development Indicators,World Bank.
BODw Biochemical oxygen demand(kg/day/worker).
World Development Indicators,World Bank.
GDP Gross domestic product World Development Indicators,World Bank.
MANUFsh Manufacturing value added as ashare of GDP.
World Development Indicators,World Bank.

French FDI and Pollution Emissions 199
4.B Countries in the sample
Main analysis: Argentina, Austria, Belgium, Canada, Czech Republic, Germany,
Egypt, Greece, Hungary, Italy, Japan, Republic of Korea, Morocco, Netherlands,
Poland, Romania, Slovakia, Slovenia, Switzerland, Turkey, United Kingdom, Uruguay,
Venezuela.
Robustness test: Albania, Argentina, Australia, Austria, Belgium, Bulgaria, Bo-
livia, Brazil, Canada, Switzerland, Chile, China, Costa Rica, Czech Republic, Ger-
many, Denmark, Dominican Republic, Ecuador, Egypt, Spain, Estonia, Finland,
Great Britain, Greece, Honduras, Indonesia, Ireland, Iceland, Italy, Japan, Kaza-
khstan, Korea, Sri Lanka, Lithuania, Latvia, Morocco, Moldova, Mexico, Macedo-
nia, Malaysia, Nicaragua, Netherlands, Norway, New Zealand, Pakistan, Panama,
Peru, Philippines, Poland, Portugal, Romania, Russia, Saudi Arabia, El Salvador,
Slovakia, Slovenia, Sweden, Thailand, Trinidad and Tobago, Turkey, Ukraine, Uruguay,
USA, Venezuela, Vietnam.

French FDI and Pollution Emissions 200
4.C Robustness tables
Table 4.5: Sensitivity analysis
(10) (11) (12) (13) (14) (15)lnFDIman lnFDImanMP lnFDImanLP lnFDIman lnFDImanMP lnFDImanLP
TFP_growth -0.022 -0.028 -0.031 -0.005 -0.032 -0.008(0.021) (0.034) (0.027) (0.020) (0.041) (0.021)
lnGDPcap -1.018 1.741 -2.208(1.310) (1.945) (1.593)
lnMP 0.869*** 1.298*** 0.920** 0.632* 1.548** -0.017(0.315) (0.487) (0.390) (0.331) (0.651) (0.350)
lnKLt�1 1.691* 0.226 2.258* 0.810* 1.421* 1.295***(1.011) (1.486) (1.209) (0.428) (0.741) (0.447)
lnER -7.887*** -9.001*** -7.469*** -7.558*** -7.980*** -7.196***(1.326) (2.017) (1.588) (1.371) (2.340) (1.514)
lnREGULQUAL -3.627 1.241 -4.477 -5.448 7.674 -10.056***(4.151) (5.653) (4.660) (3.785) (6.867) (3.826)
FREE 2.496*** 1.223 4.992*** 1.748** -1.465 3.907***(0.944) (1.293) (1.175) (0.857) (1.606) (1.009)
lnCORRUP -3.660 2.034 -4.240 -3.484 7.068 -6.648**(3.044) (4.589) (3.552) (2.744) (4.780) (2.914)
PTA 0.231 0.009 1.104 0.348 -2.834** 3.061***(0.644) (1.005) (0.828) (0.747) (1.445) (0.853)
COL45 0.455 2.140 1.032 0.825 3.113* 1.365(1.115) (1.800) (1.416) (0.997) (1.881) (1.029)
lnFDIStockt�1 0.587** 0.456 0.621* 0.539** 0.986* 0.370(0.276) (0.426) (0.340) (0.265) (0.505) (0.272)lnER lnER lnER lnER lnER lnER
lnFDIman -0.033 -0.035*(0.025) (0.019)
lnFDInonman 0.003 0.023 0.007 0.001 -0.002 0.001(0.014) (0.015) (0.012) (0.011) (0.016) (0.010)
lnCORRUP -0.527*** -0.386** -0.499*** -0.533*** -0.535*** -0.511***(0.157) (0.162) (0.144) (0.160) (0.169) (0.151)
lnGNIcap 0.227*** 0.229*** 0.230*** 0.206*** 0.216*** 0.219***(0.052) (0.054) (0.049) (0.050) (0.044) (0.047)
MANUFemplt�1 0.014*** 0.014*** 0.016*** 0.010** 0.010*** 0.013***(0.004) (0.003) (0.003) (0.005) (0.004) (0.004)
UNEMPL -0.002 -0.005 -0.003 -0.001 -0.005 -0.002(0.004) (0.004) (0.004) (0.004) (0.004) (0.003)
lnCO2man -0.127*** -0.105*** -0.156*** -0.107*** -0.160*** -0.121***(0.034) (0.027) (0.023) (0.027) (0.025) (0.022)
lnFDImanMP -0.043*** 0.000 0.012 0.003(0.014) (0.005) (0.015) (0.004)
lnFDImanLP -0.001 -0.018 -0.005 -0.036***(0.006) (0.014) (0.006) (0.013)
lnCO2man lnCO2man lnCO2man lnCO2man lnCO2man lnCO2manlnFDIman 0.141*** -0.039
(0.034) (0.025)lnGDP 0.473*** 0.507*** 0.509*** 0.741*** 0.663*** 0.729***
(0.053) (0.048) (0.047) (0.041) (0.043) (0.041)MANUFsh 0.056*** 0.060*** 0.056*** 0.029*** 0.034*** 0.035***
(0.011) (0.011) (0.011) (0.008) (0.008) (0.008)lnER -0.927*** -0.940*** -1.118*** -1.901*** -1.746*** -1.960***
(0.143) (0.144) (0.139) (0.155) (0.137) (0.142)lnFDImanMP 0.081*** 0.021 0.040** 0.015*
(0.025) (0.014) (0.017) (0.008)lnFDImanLP 0.016 0.084*** -0.014 -0.080***
(0.017) (0.027) (0.011) (0.020)

French FDI and Pollution Emissions 201
R-squared 0.29 0.20 0.31 0.42 0.35 0.41N. of obs. 106 106 106 106 106 106
Standard errors in parentheses. * p<0.1, ** p<0.05, *** p<0.01.Models (13), (14) and (15) include regional and time �xed-e¤ects. Constant terms not reported.
Table 4.6: Sensitivity analysis on a global sample
(16) (17) (18)lnFDIman lnFDImanMP lnFDImanLP
TFP_growth 0.012 -0.003 0.0005(0.030) (0.031) (0.029)
lnMP 1.173*** 0.946** 1.138***(0.403) (0.410) (0.391)
lnKLt�1 1.328*** 1.391*** 1.284***(0.392) (0.403) (0.383)
lnER -3.176* -3.664** -2.075(1.847) (1.849) (1.757)
lnREGULQUAL -6.614* -1.087 -6.100*(3.527) (3.606) (3.442)
FREE 1.939** 0.399 2.514***(0.797) (0.815) (0.778)
lnCORRUP -2.927 -0.081 -1.536(2.457) (2.505) (2.72)
PTA -0.420 -0.434 -0.383(0.591) (0.606) (0.579)
COL45 2.549* 1.364 3.497***(1.339) (1.377) (1.314)
lnFDIStockt�1 2.089*** 2.018*** 2.304***(0.441) (0.447) (0.425)lnER lnER lnER
lnFDIman 0.136***(0.022)
lnFDInonman -0.024* -0.010 -0.010(0.013) (0.011) (0.009)
lnCORRUP -0.260* -0.526*** -0.357***(0.140) (0.119) (0.122)
lnGNIcap 0.078* 0.140*** 0.071*(0.043) (0.040) (0.040)
MANUFemplt�1 0.013*** 0.019*** 0.010***(0.003) (0.003) (0.003)
UNEMPL -0.015*** -0.020*** -0.011***(0.004) (0.004) (0.003)
lnCO2man -0.373*** -0.269*** -0.319***

French FDI and Pollution Emissions 202
(0.033) (0.030) (0.025)lnFDImanMP 0.065*** 0.002
(0.025) (0.007)lnFDImanLP -0.0001 0.100***
(0.008) (0.018)lnCO2man lnCO2man lnCO2man
lnFDIman 0.106***(0.028)
lnGDP 0.506*** 0.676*** 0.493***(0.054) (0.045) (0.056)
MANUFsh 0.024*** 0.028*** 0.022***(0.005) (0.006) (0.005)
lnER -1.365*** -1.227*** -1.426***(0.090) (0.084) (0.110)
lnFDImanMP -0.006 0.014(0.033) (0.013)
lnFDImanLP 0.013 0.102***(0.016) (0.034)
R-squared 0.40 0.28 0.45N. of obs. 275 275 275
Standard errors in parentheses. * p<0.1, ** p<0.05, *** p<0.01.Constant terms not reported.

General Conclusion
Environmental questions have become more and more crucial at both national and
international levels. Internationalization of environmental issues started in the sev-
enties when developed countries undertook the strengthening of their environmen-
tal policies, thus leading to interjurisdictional di¤erences in regulatory stringency
feared to a¤ect the international location of �rms. Environmental disasters such as
the Bhopal catastrophe in 1984 intensi�ed the internationalization of environmental
problems. Finally, the liberalization of trade and foreign direct investment in the
nineties gave rise to concerns about their environmental e¤ects. With the emergence
of di¤erent levels of development and an increasing mobility of �rms, the trade and
environment debate has taken a particularly heated form for the last two decades.
Recently, this debate resumed when France considered the introduction of a carbon
tax, and then decided to abandon it. At the European level, the allocation of free
permits for highly polluting industries, e.g., cement and steel production, because
they have been judged to be internationally exposed, also raised questions. Thus,
the objective of this research was to contribute to the existing literature on trade
and environment, by integrating new theoretical elements and conducting more ex-
haustive empirical tests. We further investigate the aspect related to the impact of
FDI on pollution that has been often ignored.
When determinants of foreign investment are examined, discussions focus on
203

General Conclusion 204
two key issues: �rstly the determinants of the mobility of �rms, and secondly the
consequences of such a mobility on both source and host countries. The study of
the pollution haven hypothesis does not depart from this rule, but di¤ers somewhat
from the traditional approaches of FDI with emphasis on a novel and crucial aspect:
the environmental aspect. Therefore, in this dissertation, we explore both key issues,
by examining if lax environmental regulations are a determinant of �rms location
decision (i.e. the strict pollution haven hypothesis), and then, investigating the
consequences of these decisions in host countries in terms of pollution harming.
Do international di¤erences in environmental regulations lead to the relocation of
�rms from regulated and developed countries to less regulated and poorer ones? As
argued by Bhagwati (1993), there should be little cause for concern from an e¢ ciency
point of view if individual countries adopt di¤erent environmental policies, as long as
these policies are set optimally. However, concern should raise if countries competing
to attract �rms set suboptimal standards. A number of earlier works addressed the
normative question of what is an optimal environmental policy (e.g., Oates and
Schwab, 1988; Levinson, 1997). However, a test of this question is hardly feasible
since one would need to know the e¢ cient level of regulation in countries. Keeping
this in mind, we examine in Chapter 1 the environmental policies implemented in
di¤erent groups of countries to compare their relative stringency. We show that
as expected, developed countries are relatively stringent and developing and CIS
countries relatively lenient. In addition, we emphasize the fact that transition and
emerging countries have an intermediate position.
The �rst focus of this dissertation is the positive issue related to the environ-
mental regulation impact on �rms location decision and FDI. Actually, whether
multinational �rms respond to international variation in environmental regulations

General Conclusion 205
has important implications in both a positive and a normative sense, for trade as
well as environmental policies. Despite fairly intuitive and theoretical justi�cations,
this question did not �nd a clear answer in the empirical literature. One reason
is a misspeci�cation bias in former theoretical attempts, most of them relying on
Heckscher-Ohlin frameworks considering that exogenous environmental regulations
are the only motive for trade. Therefore, in Chapter 2, we propose an exhaustive
theoretical modelling of the pollution haven hypothesis. We use an economic geog-
raphy model that is well-adapted to study the recent spatial distribution of �rms,
in which we further highlight the impact of environmental regulation and market
failures on �rms�location decision. This theoretical model presumes that the prof-
itability of a �rm in locating in a country increases with the market potential and
the global factor productivity in that country, and decreases with production factor
costs and market failures. Speci�cally, since pollution is considered as a production
factor in the model, its negative e¤ect on the pro�tability of a �rm is emphasized.
We empirically examine the implications of the model in Chapter 3, using French
�rm-level data from manufacturing industries over the period 1996-2002. The test of
a pollution haven hypothesis based on a theoretical speci�cation was rare in litera-
ture. We further attempt to pay attention to the sources of bias in previous empirical
works, i.e. omitted variables bias and unobserved heterogeneity. Empirical results
show evidence that environmental regulation plays a signi�cant role in determining
the international spatial allocation of French �rms. This result improves earlier �nd-
ings in the sense that it enhances the former small, even insigni�cant e¤ect found
in studies on plant location choice within a single country (Bartik, 1989; Levinson,
1996). Moreover, it is in line with more recent studies that control for unobserved
attributes of industries or countries (Keller and Levinson, 2002; Levinson and Tay-
General Conclusion 206
lor, 2008). In addition, the estimated e¤ect is found to be non-linear, and does
not depend on the type of FDI mode of entry. One explanation for the non-linear
relationship is that too bad environmental conditions a¤ect �rms competitiveness.
We investigate the second key issue related to the study of the determinants of
�rms location in Chapter 4. We analyze the impact of location decisions driven by
pollution haven-seeking on the pollution levels in host countries. Indeed, although
this issue is crucial, it has been rarely examined in literature. Some works study the
determinants of pollution levels (Cole et al., 2005), but only a very few explore the
role played by FDI (one exception is He, 2006). However, FDI should alter pollution
emissions through manifold mechanisms (e.g., pollution havens seeking or techno-
logical spillovers), and the overall outcome is worth being empirically analyzed on
account of the fears related to the pollution haven hypothesis on one hand and the
well-documented FDI bene�cial e¤ects on the other hand. Using French manufac-
turing FDI data and manufacturing CO2 emissions in major recipient countries, we
estimate in Chapter 4 a system of three equations to capture FDI e¤ects on pollu-
tion levels, beside considering environmental regulation endogenously determined.
The endogeneity of the environmental regulation has been suggested recently as a
major shortcoming that prevented previous works from detecting a strong pollu-
tion haven e¤ect (Cole et al, 2006; Levinson and Taylor, 2008). Results con�rm
the �ndings of Chapter 3 regarding the deterrent environmental regulation e¤ect on
�rms location, and mention that the environmental regulation weakens with growing
FDI. Moreover, our results suggest that pollution emissions rise with the increases
of FDI, whereas pollution intensity decreases. The increase of pollution emissions
suggests that FDI is less virtuous than expected and that multinational �rms use
less cleaner techniques abroad than at home. However, this �nding is consistent

General Conclusion 207
with large anecdotal evidence. For illustration, in 2009, an investigation by the
government in Liberia has concluded that the Firestone Rubber Plantation Com-
pany has polluted local water sources. The Firestone Tire and Rubber Company
has been accused of contaminating the water in the town where it runs a rubber
plantation, and it has been blamed for causing harms ranging from skin diseases to
birth defects. An important precision is that all rubber produced in Liberia is sent
to the United States for processing into tires and no processing or manufacturing is
done in Liberia, which strongly alludes to the pollution haven hypothesis... Turning
to our results, the pollution intensity decrease may nevertheless refer to somewhat
technological spillovers of FDI.
Finally, in Chapter 4 as well as in Chapter 3, we con�rm the robustness of our
results through several tests.
We wish the present work has at least partially contributed to the trade and
environment debate, by tackling major issues and trying to improve some of the
shortcomings in the related literature. Nevertheless, this work obviously should be
improved in many ways. An interesting new aspect to incorporate in pollution haven
hypothesis investigation is the �rms heterogeneity which has been recently stressed
by the modern theory of multinational �rms. Indeed, examining which �rms are
more likely to seek for pollution havens would have large implications, especially
regarding FDI environmental impacts. Further apparent extensions of our results
would rely on qualitative �rm-level or environmental data internationally available.
For example, this would improve empirical results of Chapter 3 by enabling to go
further into the investigation of the role of the FDI mode of entry. In Chapter 4
also the distinction of FDI environmental impact with regard to the mode of entry
is worth being considered. Moreover, we will be soon able to rely on data from the

General Conclusion 208
recent European Union Emission Trading Scheme which imposes a homogeneous
regulation to the European countries. It would be an interesting topic of future
work to examine the behavior of �rms in function of the permit allocation method.
Conducting a similar work to the present one would constitute an appropriate as-
sessment of the e¢ ciency of the EU ETS. Finally, investigating the impact of FDI
on global pollution and incorporating the transport cost in the analysis would be a
fruitful area for further research.

Bibliography
[1] Ai, C., Norton, E.C., 2003. Interaction Terms in Logit and Probit Models.
Economics Letters 80(1), 123-129.
[2] Antweiler, W., Copeland, B.R., Taylor, M.S., 2001. Is Free Trade Good for
the Environment? American Economic Review 91(4), 877-908.
[3] Bagwell, K., Staiger, R.W., 2001. Domestic Policies, National Sovereignty and
International Economic Institutions. Quarterly Journal of Economics.116(2),
519-562.
[4] Bartik, T.J., 1988. The e¤ects of Environmental Regulations on Business Lo-
cation in the United States. Growth and Change 19(3), 22-44.
[5] � � � � , 1989. Small Business Start-Ups in the United States: Estimates
of the E¤ects of Characteristics of States. Southern Economic Journal 55(4),
1004-1018.
[6] Basile, R., 2004. Acquisition Versus Green�eld Investment: the Location of
Foreign Manufacturers in Italy. Regional Science and Urban Economics 34(1),
3-25.
[7] Baumol, W.J., Oates, W.E., 1988. The Theory of Environmental Policy. Cam-
bridge University Press, Cambridge.
209

Bibliography 210
[8] Beaumais, O., Chiroleu-Assouline, M., 2002. Economie de l�Environnement.
Amphi Breal Collection, Paris.
[9] Becker, R., Handerson, V., 2000. E¤ects of Air Quality Regulations on Pol-
luting Industries. Journal of Political Economy 108(2), 379-421.
[10] Bhagwati, J., 1993. The Case for Free Trade. Scienti�c American 269(5), 42-
49.
[11] Brainard, L., 1993. A Simple Theory of Multinational Corporations and Trade
with a Trade-o¤ Between Proximity and Concentration, National Bureau of
Economic Research 4269.
[12] Brainard, L., 1997. An Empirical Assessment of the Proximity-Concentration
Trade-o¤between Multinational Sales and Trade. American Economic Review
(87(4), 520-544.
[13] Bruneau, J.F., Echevarria, C., 2009.Too poor to be green? Journal of Inter-
national Cooperation Studies 16(3), 1-22.
[14] Bruneau , J.F. Renzetti, S.J., 2009. Greenhouse Gas Intensity in Canada: A
Look at Historical Trends. Canadian Public Policy, 23(1), 1-20.
[15] Bruneau, J.F., 2004. A note on Permits, Standards, and Technological Inno-
vation. Journal of Environmental Economics and Management 48(3), 1192-
1199.
[16] Brunnermeier, S.B., Levinson, A., 2004. Examining the Evidence on Envi-
ronmental Regulations and Industry Location. Journal of Environment and
Development 13(1), 6-41.

Bibliography 211
[17] Busse, M., 2004. Transnational Corporations and Repression of Political
Rights and Civil Liberties: An Empirical Analysis. Kyklos 57(1), 45-66.
[18] Cagatay S., Mihci, H., 2003. Industrial Pollution, Environmental Su¤ering and
Policy Measures: An Index of Environmental Sensitivity Performance (IESP).
Journal of Environmental Assessment Policy and Management 5(2), 205-245.
[19] Cheng, L. K., Kwan, Y. K., 2000. What are the determinants of the location of
foreign direct investment? The Chinese experience. Journal of International
Economics 51(2), 379-400.
[20] Chernick, M.R., 1999. Bootstrap Methods: a Practitioner�s Guide. John Wiley
& Sons, New York.
[21] Chichilnisky, G., 1994. Global Environment and North-South Trade. American
Economic Review 84(4), 851-874.
[22] Cole, M.A., Elliott, R.J.R, Shimamoto, K., 2005. Inustrial Characteristics, En-
vironmental Regulations and Air Pollution: An analysis of the UK Manufac-
turing Sector. Journal of Environmental Economics and Management, 50(1),
121-143.
[23] Cole, M.A., Elliott, R.J.R., 2005. FDI and the Capital Intensity of "Dirty"
Sectors: A missing Piece of the Pollution Haven Puzzle. Review of Develop-
ment Economics 9(4), 530-548.
[24] Cole, M.A., Elliott, R.J.R., Fredriksson, P.G., 2006. Endogenous Pollution
havens: Does FDI In�uence Environmental Regulations? Scandinavian Jour-
nal of Economics 108(1), 157-178.

Bibliography 212
[25] Cole, M.A., Elliott, R.J.R., Shimamoto, K., 2005. Industrial Characteris-
tics, Environmental Regulations and Air Pollution: an Analysis of the UK
Manufacturing Sector. Journal of Environmental Economics and Management
50(1), 121-143.
[26] Conrad, K., 2005. Locational Competition Under Environmental Regulation
when Input Prices and Productivity Di¤er. The Annals of Regional Science,
39(2), 273-295.
[27] Copeland, B.R., 1990. Strategic Interaction Among Nations: Negotiable and
Non-Negotiable Trade Barriers. Canadian Journal of Economics 23(1), 84-108.
[28] Copeland, B.R., Taylor, M.S., 2004. Trade, Growth and the Environment.
Journal of Economic Literature 42(1), 7-71.
[29] Coughlin, C.C., 2002. The Controversy over Free Trade: The Gap between
Economists and the General Public. Journal Review, 1-21. St Louis, MO:
Federal Reserve Bank.
[30] Damania R., Fredriksson P.G., List, J., 2003. Trade Liberalization, Corrup-
tion, and Environmental Policy Formation: Theory and Evidence. Journal of
Environmental Economics and Management 46(3), 490-512.
[31] Dasgupta, S., Mody, A., Roy, S., Wheeler, D., 2001. Environmental Regulation
and Development: A Cross-country Empirical Analysis. Oxford Development
Studies, 29(2), 173-187.
[32] Deacon, R., 1999. The political Economy of Environment-development Rela-
tionships: a Preliminary Framework. Mimeo, University of California, Santa
Barbara.

Bibliography 213
[33] Dean, J., 2002. Does Trade Liberalization Harm the Environment? A New
Test. Canadian Journal of Economics 35(4), 819-842.
[34] Dean, J.M., Lovely, M.E., Wang, H., 2009. Are Foreign Investors Attracted
to Weak Environmental Regulations? Evaluating the Evidence from China.
Journal of Development Economics 90(1), 1-13.
[35] Dixit, A.K., Stiglitz, J.E., 1977. Monopolistic Competition and Optimum
Product Diversity. American Economic Review 67 (3), 297-308.
[36] Dunning, J.H., 1977. Trade, Location of Economic Activity and MNE: A
Search for an Eclectic Approach. In Ohlin, B., Hesselborn, P.O., Wijkman,
P. M. (Eds), The International Allocation of Economic Activity, Macmillan,
London, 395-418.
[37] Ederington, J., 2001. International Coordination of Trade and Domestic Poli-
cies. American Economic Review 91(5), 1580-1593.
[38] � � � � � � , 2002. Trade and Domestic Policy Linkage in International
Agreements. International Economic Review 43(4), 1341-1368.
[39] � � � � � � , 2007. NAFTA and the Pollution Haven Hypothesis. Policy
Studies Journal 35(2), 239-244.
[40] Ederington, J., Levinson, A., Minier, J., 2005. Footloose and Pollution-free.
Review of Economics and Statistics 87(1), 92-99.
[41] Ederington, J., Minier, J., 2003. Is Environmental Policy a Secondary Trade
Barrier? An Empirical Analysis. Canadian Journal of Economics 36(1), 137-
154.

Bibliography 214
[42] Efron, B., 1979. Bootstrap Methods: Another Look at the Jackknife. The
Annals Of Statistics, 7, 1-26.
[43] Eliste, P., Fredriksson, P., 2002. Environmental Regulations, Transfers and
Trade: Theory and Evidence. Journal of Environmental Economics and Man-
agement 43, 234-250.
[44] Eskeland, G.S., Harrison, A.E., 2003. Moving to Greener Pastures Multina-
tionals and the Pollution Haven Hypothesis. Journal of Development Eco-
nomics 70(1), 1-23.
[45] Esty, D., Porter, M., 2001. Ranking National Environmental Regulation and
Performance: A Leading Indicator of Future Competitiveness? The Global
Competitiveness Report 2000-2001. Oxford University Press, 78-100.
[46] Fontagné, L., Toubal, F., 2010. Investissement Direct à l�étranger et Perfor-
mances des Entreprises, Rapport du Conseil d�Analyse Economique (89).
[47] Fontagné, L., von Kirchbach, F., Mimouni, M., 2005. An Assessment of
Environmentally-Related Non-Tari¤ Measures. The World Economy, 28(10),
1417-1439.
[48] Fredriksson, P. G., Svensson, J., 2003. Political instability, Corruption and
Policy Formation: the Case of Environmental Policy. Journal of Public Eco-
nomics 87(7-8), 1383-1405.
[49] Fredriksson, P.G., List, J.A., Millimet, D.L., 2003. Bureaucratic corruption,
environmental policy and inbound US FDI: Theory and Evidence. Journal of
Public Economics, 87(7-8), 1407-1430.

Bibliography 215
[50] Fujita, M., Krugman, P.R., Venables, A., 1999. The Spatial Economy: Cities,
Regions, and International Trade. MIT Press, Cambridge.
[51] Greenstone, M., 2002. The impacts of Environmental Regulations on Industry
Activity: Evidence from the 1970 and the 1977 Clean Air Act ammendments
and the Census of Manufactures. Journal of Political Economy 110(6), 1175-
1219.
[52] Grether, J.M., Mathys, N.A., de Melo, J., 2006. Unravelling the World-Wide
Pollution Haven E¤ect. CEPR Discussion Paper Series 5815.
[53] Grogger, J., 1990. A Simple Test for Exogeneity in Probit, Logit, and Poisson
Regression Models. Economics Letters 33, 329-332.
[54] Grossman, G.M., Krueger, A.B., 1993. Environmental Impacts of a North
American Free Trade Agreement,.In Garber, P.M. (Ed), The Mexico-U.S. Free
Trade Agreement, MIT Press, Cambridge.
[55] Harms, P., Ursprung, H.W., 2002. Do Civil and Political Repression Really
Boost Foreign Direct Investments? Economic Inquiry 40, 651-663.
[56] He, J., 2006. Pollution Haven Hypothesis and Environmental Impacts of For-
eign Direct Investment: The Case of Industrial Emissions of Sulphur Dioxide
(SO2) in Chinese Provinces. Ecological Economics(60), 228 - 245.
[57] Head, K., Mayer, T., 2000. Non-Europe: The Magnitude and Causes of Market
Fragmentation in the EU. Weltwirtschaftliches Archiv 136(2), 284-314.
[58] � � � � � � � � -, 2004. Market Potential and the Location of Japanese �rms
in the European Union. Review of Economics and Statistics 86(4), 959-972.

Bibliography 216
[59] Head, K., Ries, J., Swenson, D, 1995. Agglomeration Bene�ts and Location
Choice: Evidence from Japanese Manufacturing Investments in the United
States, Journal of International Economics, 38(3-4), p. 223-247.
[60] Helpman, E., 1984. A Simple Theory of International Trade With Multina-
tional Corporations. Journal of Political Economy 92(3), 451-471.
[61] Henderson, D.J., Millimet, D.L., 2007. Pollution Abatement Costs and Foreign
Direct Investment In�ows to U.S. States: A Nonparametric Reassessment.
Review of Economics and Statistics 89(1), 178-183.
[62] Hilton, F., Levinson, A., 1998. Factoring the Environmental Kuznets Curve:
Evidence from Automotive Lead Emissions. Journal of Environmental Eco-
nomics and Management 35(2), 126-141.
[63] Ja¤e, A. B., Peterson, S. R., Portney, P. R., Stavins, R. N., 1995. Environ-
mental Regulations and the Competitiveness of U.S. Manufacturing: What
does the Evidence Tell us? Journal of Economic Literature 33(1), 132-163.
[64] Jasay, A.E., 1960. The Social Choice between home and Overseas Investments.
Economic Journal 70, 105-113.
[65] Jensen, N.M., 2003. Democratic Governance and Multinational Corporations:
Political Regimes and In�ows of Foreign Direct Investment. International Or-
ganization 57: 587-616.
[66] Jug, J., Mirza, D., 2005. Environmental Regulations in Gravity Equations:
Evidence from Europe. The World Economy, 28(11), 1591-1615.
[67] Kahn, M.E., 2003. The Geography of U.S. Pollution Intensive Trade: Evidence
from 1959 to 1994. Regional Science and Urban Economics 33(4), 383-400.

Bibliography 217
[68] Kalt, J.P., 1988. The Impact of Domestic Environmental Regulatory Poli-
cies on U.S. International Competitiveness. In A.M. Spence and H.A. Hazard
(Eds), International Competitiveness, Harper and Row, Ballinger,Cambridge,
221-262.
[69] Kaufmann, D., Kraay, A., Mastruzzi, M., 2005. Governance Matters IV: Gov-
ernance Indicators for 1996-2004,World Bank Policy Research Working Paper
Series, vol. 3630.
[70] Keller, W., Levinson, A., 2002. Pollution Abatement Costs and Foreign Direct
Investment In�ows to U.S. States. Review of Economics and Statistics 84(4),
691-703.
[71] Kemp, M.C., 1964. The Pure Theory of International Trade. Prentice-Hall,
Englewood Cli¤s.
[72] Krugman, P.R., 1983. The New Theories of International Trade and the Multi-
national Enterprise. In D.Audretsch and C. Kindleberger (Eds), The Multina-
tional Corporation in the 1980s, Cambridge, MIT Press.
[73] Krugman, P.R., 1980. Scale Economies, Product Di¤erentiation, and the Pat-
tern of Trade. American Economic Review 70(5), 950-959.
[74] Krugman, P.R., 1991. Geography and trade. MIT-Press, Cambridge.
[75] Levinson, A., 1996. Environmental Regulations and Manufacturers�Location
Choices: Evidence from the Census of Manufacturers. Journal of Public Eco-
nomics 62, 5-29.
[76] Levinson, A., Taylor, M.S., 2008. Unmasking the Pollution Haven E¤ect. In-
ternational Economic Review 49(1), 223-254.
Bibliography 218
[77] Li, Q., Resnick A., 2003. Reversal of Fortunes: Democratic Institutions and
Foreign Direct Investment In�ows to Developing Countries. International Or-
ganization 57: 175-211.
[78] List, J.A., Co, C., 2000. The E¤ects of Environmental Regulations on For-
eign Direct Investment. Journal of Environmental Economics and Manage-
ment 40(1), 1-20.
[79] List, J.A., McHone, W.W., Millimet, D.L., Fredriksson, P.G., 2003. E¤ects
of Environmental Regulations on Manufacturing Plant Births: Evidence from
a Propensity Score Matching Estimator, Review of Economics and Statistics
85(4), 944-952.
[80] MacDougall, G.D.A., 1960. The Bene�ts and Costs of Investment from
Abroad: A theoretical approach. Economic Record 36, 13-35.
[81] Markusen, J.R., 1984. Multinationals, Multi-plant Economies and the Gain
from Trade. Journal of International Economics 16(3-4), 205-226.
[82] Mattoo, A., Olarreaga, M., Saggi, K., 2004. Mode of Foreign Entry, Technology
Transfer, and FDI policy. Journal of Development Economics 75, 95-111.
[83] McCallum, J., 1995. National borders matter: Canada-US Regional Trade
Patterns. American Economic Review 85(3), 615-623.
[84] McConnell, V.D, Schwab, R.M., 1990. The Impact of Environmental Reg-
ulation on Industry Location Decisions: The Motor Vehicle Industry. Land
Economics 66, 67-81.

Bibliography 219
[85] McFadden, D., 1974. Conditional Logit Analysis of Qualitative Choice Be-
havior, In: Zarembka, P. (Ed.), Frontiers in Econometrics. Academic Press,
New-York, pp. 105-142.
[86] McGuire, M.C., 1982. Regulation Factor Rewards, and International Trade.
Journal of Public Economics 17(3), 335-354.
[87] Mundell, R.A., 1957. International Trade and Factor Mobility. American Eco-
nomic Review 47(3), 321-335.
[88] Norton, E.C., Wang, H., Ai, C., 2004. Computing Interaction E¤ects and
Standard Errors in Logit and Probit Models. The Stata Joumal 4(2) 154-167.
[89] Oates, W., Schwab, R., 1988. Economic Competition among Jurisdictions: Ef-
�ciency Enhancing or Distortion inducing. Journal of Public Economics 35(3),
333-354.
[90] OECD, 1997. The E¤ects of Government Environmental Policy on Costs and
Competitiveness: Iron and Steel sector. DSTI/SI/SC(97)46, OECD, Paris.
[91] OECD, 2003. Environmental Performance Reviews, Mexico.
[92] OECD, 2004. Environmental Management in Eastern Europe, Caucasus and
Central Asia.
[93] OECD, 2005. Environmental Performance Reviews, France.
[94] OECD, 2007. Environmental Performance Reviews, China.
[95] OECD. Envionmental Performance Reviews, (various editions).

Bibliography 220
[96] Pethig, R., 1976. Pollution, Welfare, and Environmental Policy in the Theory
of Comparative Advantage. Journal of Environmental Economics and Man-
agement 2(3), 160-169.
[97] Porter, M.E., 1991. America�s Green Strategy. Scienti�c American 264(4),
4-96.
[98] Porter, M.E., van der Linde, C., 1995. Toward a New Conception of the
Environment-competitiveness Relationship. Journal of Economic Perspectives
9(4), 97-118.
[99] Ra¤, H., Ryan, M., Stähler, F., 2009. The Choice of Market Entry Mode:
Green�eld Investment, M&A and Joint Venture. International Review of Eco-
nomics and Finance 18, 3-10.
[100] Raspiller, S., Riedinger, N., 2005. Les Di¤érences de Sévérité Environnemen-
tale Entre Pays In�uencent-elles les Comportements de Localisation des
Groupes Français? Economie et Prévision (169), 197-210.
[101] Rauscher, M., 1997. International Trade, Factor Movements, and the Envi-
ronment. Clarendon Press, Oxford.
[102] � � � � � , 2007. Hot Spots, High smokestacks, and the Geography of Pollu-
tion. Mimeo.
[103] � � � � � , 2009. Concentration, Separation, and Dispersion: Economic Ge-
ography and the Environment. Thuenen-Series of Applied Economic Theory
109.
[104] Redding, S., Venables, A.J., 2004. Economic Geography and International
Inequality. Journal of International Economics 62(1), 53-82.

Bibliography 221
[105] Rieber, A., Tran, T.A-D, 2008. Dumping Environnemental et Délocalisation
des Activités Industrielles: le Sud Face à la Mondialisation. Revue d�économie
du développement 22(2), 5-35.
[106] Roberts, M.J., Spence, M., 1976. Uncertainty and the Choice of Pollution
Control Instruments. Journal of Public Economics, 5.
[107] Siebert, H., 1977. Environmental Quality and the Gains from Trade. Kyklos
30(4), 657-673.
[108] Smarzynska Javorcik, B., Wei, S. J., 2004. Pollution Havens and Foreign Di-
rect Investment: Dirty Secret or Popular Myth? Contributions to Economic
Analysis and Policy 3(2), 1-32.
[109] Solow, R.M., 1956. A contribution to the Theory of Economic Growth. Quar-
terly Journal of Economics 70 1), 65-94.
[110] Spar, D., 1998. The Spotlight and the Bottom Line, Foreign A¤airs 77
(March/April 1998).
[111] Tobey, J. A., 1990. The Impact of Domestic Environmental Policies on Pat-
terns of World Trade: an Empirical Test. Kyklos 43, 191-209.
[112] Train, K. (1986). Qualitative Choice Analysis: Theory, Econometrics, and an
Application to Automobile Demand. MIT Press, Cambridge, MA.
[113] UNCTAD, 2000. World Investment Report: Cross border Mergers and Acqui-
sitions and Development. United Nations, New-York and Geneva.
[114] � � � � , 2001. World Investment Report. United Nations Conference on
Trade and Development, Geneva.

Bibliography 222
[115] � � � � , 2005. World Investment Report. United Nations Conference on
Trade and Development, Geneva.
[116] � � � � , 2008. World Investment Report. United Nations Conference on
Trade and Development, Geneva.
[117] � � � � , 2009. World Investment Report.
[118] UNECE, Environmental Performance Review, (various editions).
[119] Van Marrewijk, C., 2005. Geographical Economics and the Role of Pollution
on Location. Tinbergen Institute Discussion Papers, vol. 05-018/2.
[120] Wang, J.E., Blomström, M., 1992. Foreign Investment and Technology Trans-
fer. European Economic Review 36, 137-155.
[121] Weitzman, M.L., 1974. Prices vs.. Quantities. Review of Economic Studies,
41.
[122] Wheeler, D., 2001. Racing to the Bottom? Foreign Investment and Air Quality
in Developing Countries. Journal of Environment and Development 10( 3),
225-245.
[123] World Bank, 2004. Country Environnmental Analysis, Tunisia.
[124] World Bank, 2007. Country Environnmental Analysis, Honduras.
[125] Xing, Y., Kolstad, C. , 2002. Do Lax Environmental Regulations Attract For-
eign Investment ? Environmental and Resource Economics 21(1), 1-22.
[126] Zhang, K.H., Markusen, J. R., 1999. Vertical Multinationals and Host-Country
Characteristics. Journal of Development Economics 59 (2), 233-252.
List of Tables
1.1 Date of creation of �rst environmental laws in selected countries . . . 20
1.2 Comparison of the regulatory instruments, according to the criteria
of e¢ ciency . . . . . . . . . . . . . . . . . . . . . . . . . . . . . . . . 30
1.3 Annex B to the Kyoto Protocol: Emission Limitation or Reduction Com-
mitments . . . . . . . . . . . . . . . . . . . . . . . . . . . . . . . . . . 58
3.1 Cross correlation table for GDP per capita, ER index and its compo-
nents . . . . . . . . . . . . . . . . . . . . . . . . . . . . . . . . . . . . 118
3.2 Conditional logit estimates (coe¢ cients) . . . . . . . . . . . . . . . . 123
3.3 Logit estimates with country-groups interaction terms (marginal e¤ects)128
3.4 Testing for non linearity in ER index (marginal e¤ects) . . . . . . . . 132
3.5 Conditional logit estimates by FDI mode of entry . . . . . . . . . . . 137
3.6 Robustness tests with alternative variables (coe¢ cients) . . . . . . . . 139
3.7 Robustness tests with alternative speci�cations (coe¢ cients) . . . . . 142
3.8 FDI occurences . . . . . . . . . . . . . . . . . . . . . . . . . . . . . . 148
3.9 ER index values . . . . . . . . . . . . . . . . . . . . . . . . . . . . . . 150
3.10 Market potential values . . . . . . . . . . . . . . . . . . . . . . . . . . 152
3.11 First stage estimation for ER endogeneity test . . . . . . . . . . . . . 157
3.12 Descriptive statistics . . . . . . . . . . . . . . . . . . . . . . . . . . . 158
223

List of Tables 224
3.13 Data de�nition and sources . . . . . . . . . . . . . . . . . . . . . . . 159
4.1 Regressions estimates . . . . . . . . . . . . . . . . . . . . . . . . . . . 181
4.2 Robustness tests (BOD) . . . . . . . . . . . . . . . . . . . . . . . . . 188
4.3 Robustness tests (BODw) . . . . . . . . . . . . . . . . . . . . . . . . 191
4.4 Data de�nitions and sources . . . . . . . . . . . . . . . . . . . . . . . 197
4.5 Sensitivity analysis . . . . . . . . . . . . . . . . . . . . . . . . . . . . . 200
4.6 Sensitivity analysis on a global sample . . . . . . . . . . . . . . . . . 201

List of Figures
1.1 Loss of welfare with taxes and permits under uncertainty . . . . . . . 31
1.2 Changes in air pollutants emissions for OECD countries (kg / GDP
at constant 2000 prices). . . . . . . . . . . . . . . . . . . . . . . . . . 36
3.1 Relationship between ER index and GDP per capita . . . . . . . . . 119
3.2 Interaction e¤ect for Developed countries . . . . . . . . . . . . . . . . 154
3.3 Interaction e¤ect for Emerging economies . . . . . . . . . . . . . . . . 154
3.4 Interaction e¤ect for CEEC . . . . . . . . . . . . . . . . . . . . . . . 155
3.5 Interaction e¤ect for CIS . . . . . . . . . . . . . . . . . . . . . . . . . 155
3.6 Interaction e¤ect for Developing countries . . . . . . . . . . . . . . . 156
3.7 Interaction e¤ect for the high median of ER index . . . . . . . . . . . 156
3.8 Interaction e¤ect for the �rst three low quartiles of ER index . . . . . 157
225