environmental radioactive background survey for … environmental radioactive background survey for...
TRANSCRIPT

AFFDL-TR-eS-ISS
ENVIRONMENTAL RADIOACTIVE BACKGROUND SURVEY FOR THE AIR FORCE NUCLEAR ENGINEERING
TEST FACILITY
DAVID O. l.ISTZ
Tl'ICHMCAL HKI'Oin AFFDL'1H-65-1.S5
DECEMBER 1965
i s-c'r. /
AIR FORCE FLICaiT DYNAMICS LABORATORY RESEARCH AND TFCHNOLOCY DIVISION
AIR FORCE SYSTEMS COMMAND WRICHT-PATTERSON AIR FORCE BASE. OHIO
Distribution of This Document Is Unlimited

NOTICES
When Government drawings, specifications, or other data are ased for any purpose other than in connection with a definitely related Government procure- ment operation, the United States Government thereby incurs no responsibility nor any obligation whatsoever; and the fact that the Government may have formulated, furnished, or in any way suppliedthe said drawings, specifications, or other data, is not to be regarded by implication or otherwise as in any manner licensing the holder or any other person or corporation, or conveying any rights or permission to manufacture, use, or sell any patented invention that may in any way be related thereto.
Copies of this report should not be returned to the Research and Tech- nology Division unless return is required by security considerations, contractual obligations, or notice on a specific document.
200 - February 1966 - 773-32-659
-X '
p
BLANK PAGE
i
AFFDL-TR-65-185
ENVIRONMENTAL RADIOACTIVE BACKGROUND SURVEY FOR THE AIR FORCE NUCLEAR ENGINEERING
TEST FACILITY
DAVID O. LINTZ
Distribution of This Document Is Unlimited
AFFDL-TR-65-185
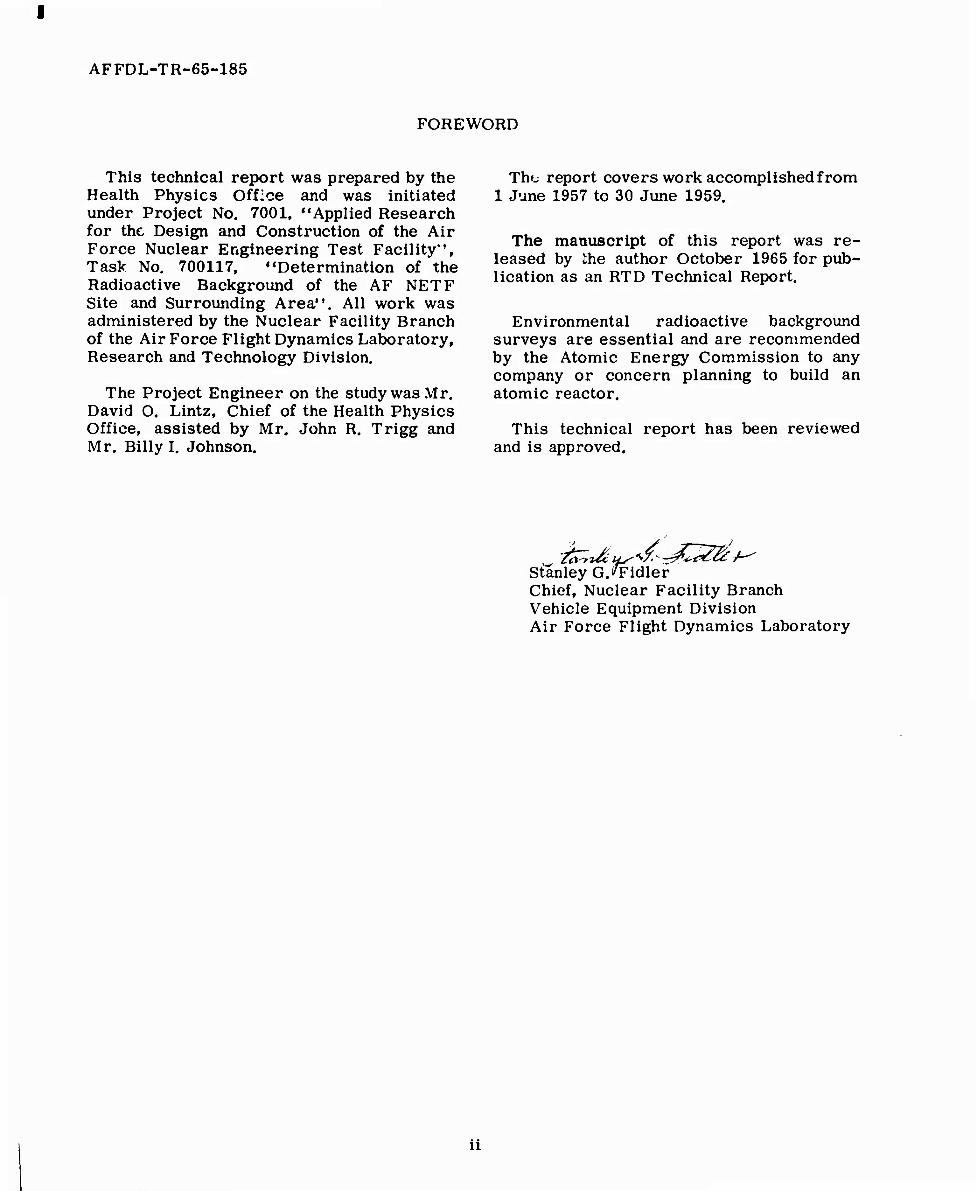
FOREWORD
This technical report was prepared by the Health Physics Office and was initiated under Project No. 7001, "Applied Research for the Design and Construction of the Air Force Nuclear Engineering Test Facility", Task No. 700117, "Determination of the Radioactive Background of the AF NETF Site and Surrounding Area". All work was administered by the Nuclear Facility Branch of the Air Force Flight Dynamics Laboratory, Research and Technology Division.
The Project Engineer on the study was Mr. David O. Lintz, Chief of the Health Physics Office, assisted by Mr. John R. Trigg and Mr. Billy I. Johnson.
The report covers work accomplished from 1 June 1957 to 30 June 1959.
The manuscript of this report was re- leased by the author October 1965 for pub- lication as an RTD Technical Report.
Environmental radioactive background surveys are essential and are recommended by the Atomic Energy Commission to any company or concern planning to build an atomic reactor.
This technical report has been reviewed and is approved.
Stanley G.Midler Chief, Nuclear Facility Branch Vehicle Equipment Division Air Force Flight Dynamics Laboratory
ii

AFFDL-TR-65-185
ABSTRACT
This environmental radioactive background survey was an attempt to establish a base line of the normally occurring radioactivity in the fauna and flora of a particular area subsequent to the operation of a reactor which will release additional radioactivity to the environment. The Health Physics Office of the AF NETF has collected samples of water, soil, air, sewage, milk, biological life and vegetation in a 20 mile radius of the AF NETF site and analyzed the samples for alpha, beta and gamma activity. The re- sults of the analyses over the period of the report are given in graphic forni to facilitate making comparison of the fluctuations in the normal background. The wide variations were due to the atom bomb testing not only in the United States but throughout the
world. The tests especially noticeable are the result of the last half quarter of 1958 when the atom bomb testing was at a peak.
Future samples taken from the same areas will be analyzed when the reactor becomes operational. Comparison then can be made to determine any increased activity which may be attributable to the Air Force Nuclear Reactor Operation.
In order to obtain certain quantitative analyses of the radioactive content of the various samples collected a contract was awarded the Nuclear Science and Engineering Corporation of Pittsburgh, Pennsylvania. The result of their work will be found in Ap- pendix II of the report.
iii
AFFDL-TR-65-185
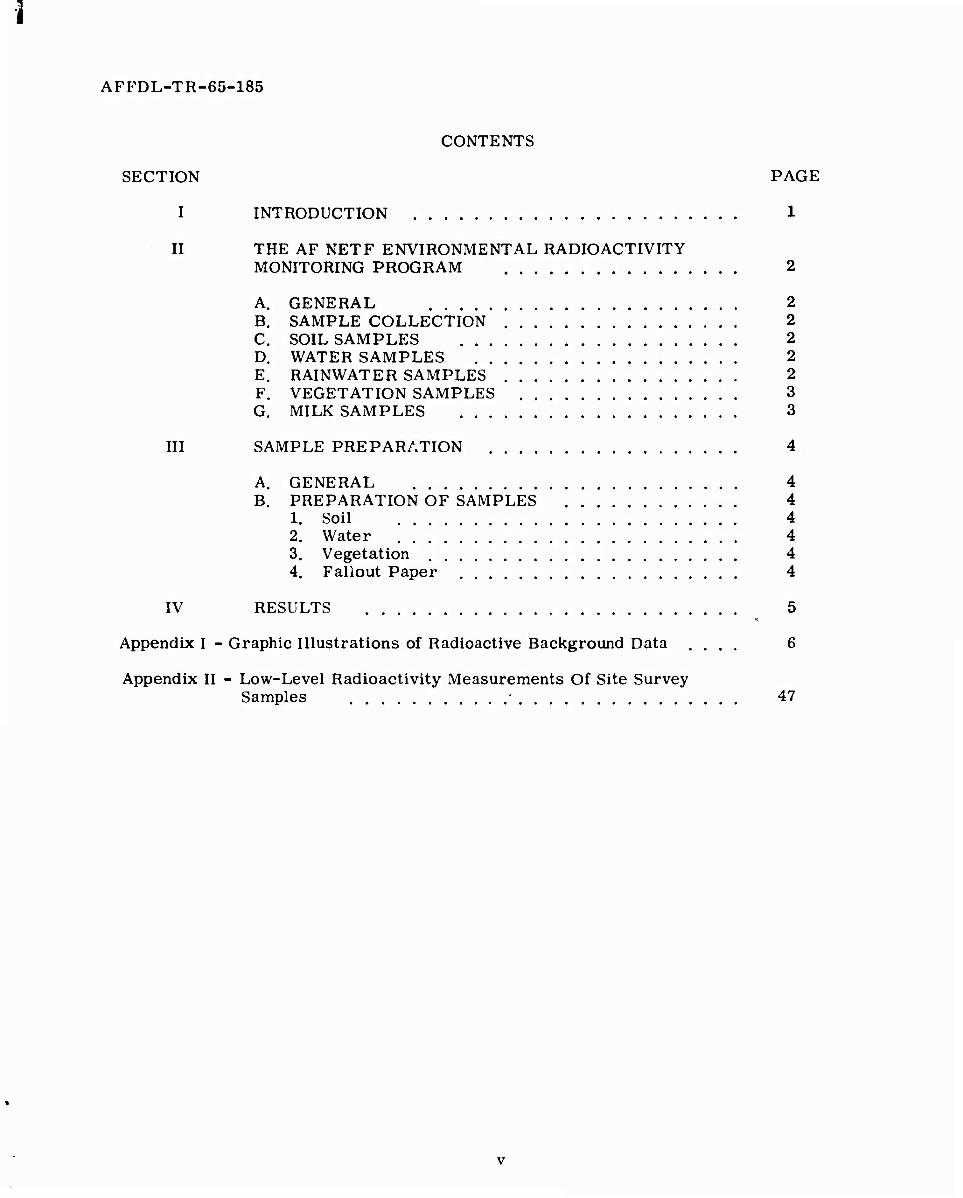
CONTENTS
SECTION PAGE
I INTRODUCTION 1
II THE AF NETF ENVIRONMENTAL RADIOACTIVITY MONITORING PROGRAM 2
A. GENERAL 2 B. SAMPLE COLLECTION 2 C. SOIL SAMPLES 2 D. WATER SAMPLES 2 E. RAINWATER SAMPLES 2 F. VEGETATION SAMPLES 3 G. MILK SAMPLES 3
III SAMPLE PREPARATION 4
A. GENERAL 4 B. PREPARATION OF SAMPLES 4
1. Soil 4 2. Water 4 3. Vegetation 4 4. Fallout Paper 4
IV RESULTS 5
Appendix I - Graphic Illustrations of Radioactive Background Data .... 6
Appendix II - Low-Level Radioactivity Measurements Of Site Survey Samples • 47

AFFDL-TR-65-185
SECTION I
INTRODUCTION
At the suggestion of the Atomic Energy Commission, the Health Physics Office of the Air Force Nuclear Engineering Test Facility has conducted an area radioactivity background survey for naturally occurring radioactive materials in the environs of the facility at Wright-Patterson Air Force Base, Ohio. This survey was conducted primarily to obtain a base line of naturally occurring radioactivity prior to start up of the nuclear reactor being constructed at the Wright-Patterson Air Force Base.
The naturally occurring background activ- ity is gradually increasing because of the many nuclear bombs detonated by Russia, England and the United States. It is esti- mated that several hundred atomic and hydrogen bombs have been detonated to date. This survey covers the gross beta gamma activity occurring in air, water, soil, vegetation, milk and sewage.
The original plans for the area background survey were formulated in September 1956.
At that time instruments were not available to conduct the planned survey. Immediate steps were taken to secure the necessary instrumentatior. By February 1957 a limited number of radiation detection instruments had been procured along with a panel truck for collection of samples. A preliminary sampling schedule was arranged and pick up of samples was begun. The panel truck was used for collection of samples within a twenty mile radius of the reactor site.
In general the determination of the back- ground radiation follows the pattern es- tablished for environmental monitoring at other reactor sites. Since the background measurements are for gross alpha, beta and gamma activity, it was felt that a quantitative analysis should be performed by an outside agency under contract. Such a contract was awarded the Nuclear Science and Engineering Corporation of Pittsburgh, Pennsylvania.
AFFDL-TR-65-185
SECTION II
THE AF NETF ENVIRONMENTAL RADIOACTIVITY MONITORING PROGRAM
A. GENERAL
The personnel of the Health Physics Office, Air ^orce Nuclear Engineering Test Facility collects, prepares, analyzes, interprets, records and reports the radioactive content of samples of soil, water, sewage, milk, vegetation and biological life of the AF NETF site and the surrounding cities of Springfield, Xenia» Yellow Springs, Fairborn and Dayton, Ohio. The Springfield sampling sites are 23 miles from the reactor site in the down wind direction.
Collection preparation and analysis pro- cedures in effect as of 30 June 1959, to- gether with data results and interpretation from all samples collected from 1 June 1957 through 30 June 1959 ?.re presented on the following pages.
B. SAMPLE COLLECTION
All environmental samples were collected at weekly intervals from the sites chosen in or near the cities listed above.
These samples include tap water, river water, top soil, air, milk, and vegetation.
C. SOIL SAMPLES
Soil samples were chosen from the first 1/4 to 1/2 inches of soil being careful not to include stones or other coarse materials. Approximately 100 gram samples were col- lected and placed into small manila enve- lopes, sealed and marked as to location collected. Soil sample collection sites were chosen in areas which have not been culti- vated for at least twenty years. This was
40 done in order to avoid the additional K activity contributed through the use of com- mercial fertilizers.
Surface soil samples were taken to pro- vide an estimate of possible radioactivity from natural and acquired emitters. Samples were analyzed for gross beta and alpha emitters by the Health Physics Office. These
determinations were conducted over a period of two years- from June 1957 through June 1959.
Specific isotopic determinations of the re-
90 lative 95
abundance of Strontium Zirconi- 130 137 um , Ruthenium*"", Cs"', and for total
potassium content in soil samples were concurrently performed under the provisions of Contract No. 3r'616)-5909 by the Nuclear Science and Engineering Corporation of Pittsburgh, Pennsylvania*.
D. WATER SAMPLES
All water samples were collected in two liter polyethylene bottles marked as to loca- tion of sample site. In all cases, the drinking water samples were taken directly from a tap usually at some gasoline service station located within the city limits since all city water supplies originate from drilled wells rather than being pumped from some stream. However, three samples were obtained from streams, one each from Beavercreek, Mad River and the Miami River. Other water samples were obtained from three wells on Wright Field. The Wright Field samples were analyzed by the Ohio State Health Department and a report of the findings supplied to the Health Physics Office.
E. RAINWATER SAMPLES
Samples of rainwater were obtained from four fallout stations, each equipped with an aluminum tray 2 feet x 2 feet x 3 inches deep. A five gallon polyethylene bottle was located inside the station house ^o receive the rain water samples. Samples were marked as to location when picked up from the fall- out station. During the winter period all snow samples collected in the fallout station trays were melted down, concentrated and counted as other water samples.
♦See Appendix II
AFFDL-TR-65-185
F. VEGETATION SAMPLES
Sampling of vegetation proved somewhat of a problem in choosing the proper specimen which has a fairly long growing season and at the same time grows rather rapidly. The plant finally chosen, which is wide spread in this area, was common dock. Collections were made from areas which had not been cultivated for many years. This was done in order to avoid the activity that might result from application of high content phosphate fertilizers.
east, west, north and south of Dayton as possible and analyzed for radioactivity. The samples were obtained from the Miami Valley Milk Producers Association. Two liter quantities were obtained weekly for a period of six months covering the grazing period and a portion of the dry feeding period. This was done in order to detect any change that might occur as a result of the cows eating growing vegetation as opposed to the eating of dry foods.
MILK SAMPLES
As a matter of interest milk samples were obtained from farms located as near
AFFDL-TR-65-185
SECTION III
SAMPLE PREPARATION
A. GENERAL
Samples submitted in connection with the environmental monitoring program will con- sist of routine soil, water, vegetation and fallout samples and occasionally an animal, fowl or fish indigent to the area. The chemical laboratory will prepare these samples for counting according to accepted and recommended procedures used at various atomic energy installations.
B. PREPARATION OF SAMPLES
1. Soil
Free soil samples of any visible foreign matter such as leaves, sticks and stones. Then dry, screen and pulverize the soil in a mortar and transfer a portion of the pulverized soil to a planchet and mark. Dampen the soil with distilled water, if necessary, and dry again in an oven at 110oC or with a heat lamp and submit for counting.
2. Water
Measure out 500 ml of water into a large beaker or bottle and transfer a portion to a 250 ml beaker. Add 2 drops of methyl purple indicator. Add concentrated HNOo
dropwise until the color of the solution turns purple. Evaporate on a hot plate to a small volume, add more water from the original 500 ml and more acid as necessary to keep the solution acidic. Continue to evaporate in this manner until the water reaches a small volume (15-20 ml). Transfer the solu- tion to a 50 ml beaker, wash the 250 ml beaker with a small portion of distilled water and transfer this to the small beaker.
Carefully evaporate to a very small volume (2-5 ml) then remove the beaker from the hot plate. Using a clean dropper, transfer a small portion of the liquid to a planchet and evaporate to almost dryness under an infra-red lamp. Add more liquid and con- tinue the evaporation. Finally rinse the beaker with a few ml of distilled water and transfer to the planchet. Evaporate to dry- ness and submit for counting.
3. Vegetation
Cut off the leafy portions of the plant, place in a large beaker and dry in an oven at 110oCf preferably overnight. Put the leaves into a large mortar and crush to a powder. Transfer a portion of the powder to a small evaporating dish, place under a hood and ignite by heating with a bunsen burner. After ignition and burning, place the dish in a muffle furnace and heat at 600oC until the contents are thoroughly ashed. Allow the ash to cool then powder with a spatula or pestle. Transfer a portion to a weighed planchet, then reweigh to determine the weight of ash submitted for counting.
4. Fallout Paper
Fold the paper a few times then cut into small pieces into a 100 ml evaporating dish. Place the dish in a ring on a ring stand or tripod under a hood and carefully heat with a bunsen burner so that the paper ignites and burns within the dish. When burning has ceased, transfer the dish to a muffle furnace and heat to 600oC until ashing is complete. Remove from the furnace and allow to cool. Crush the cooled ash into a powder with a spatula or pestle and transfer to a weighed planchet for re- weighing and counting.

AFFDL-TR-65-185
SECTION IV
RESULTS
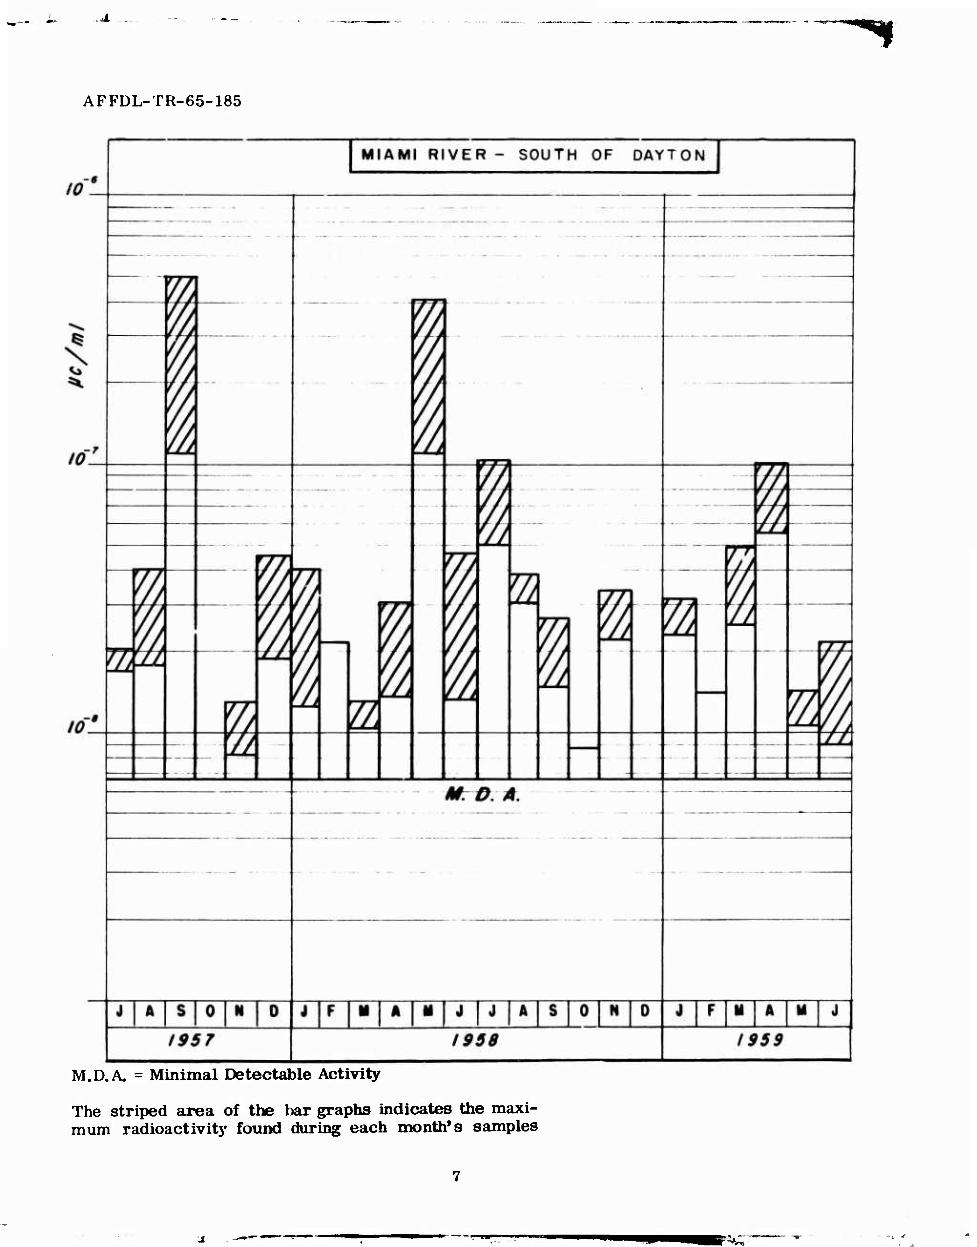
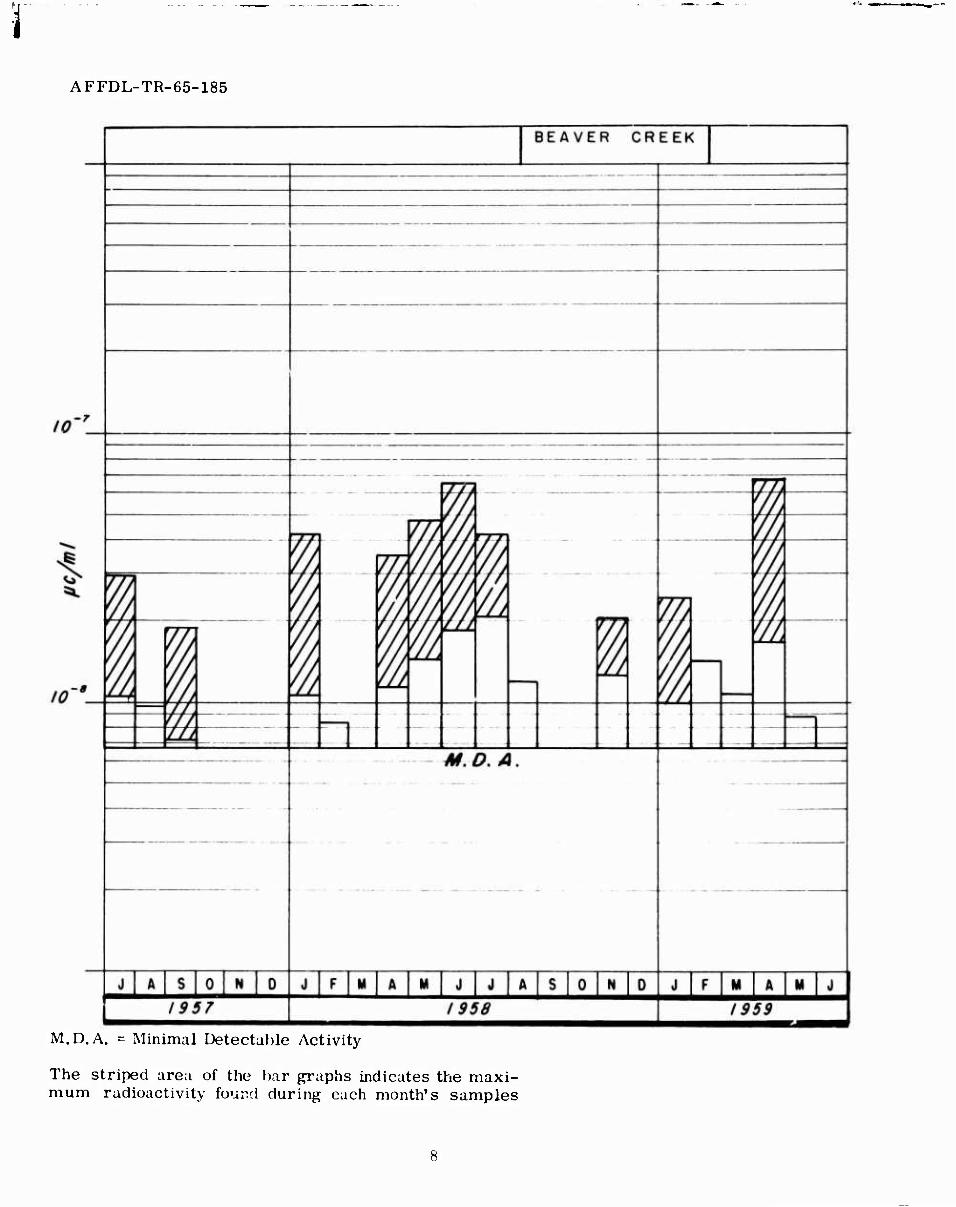
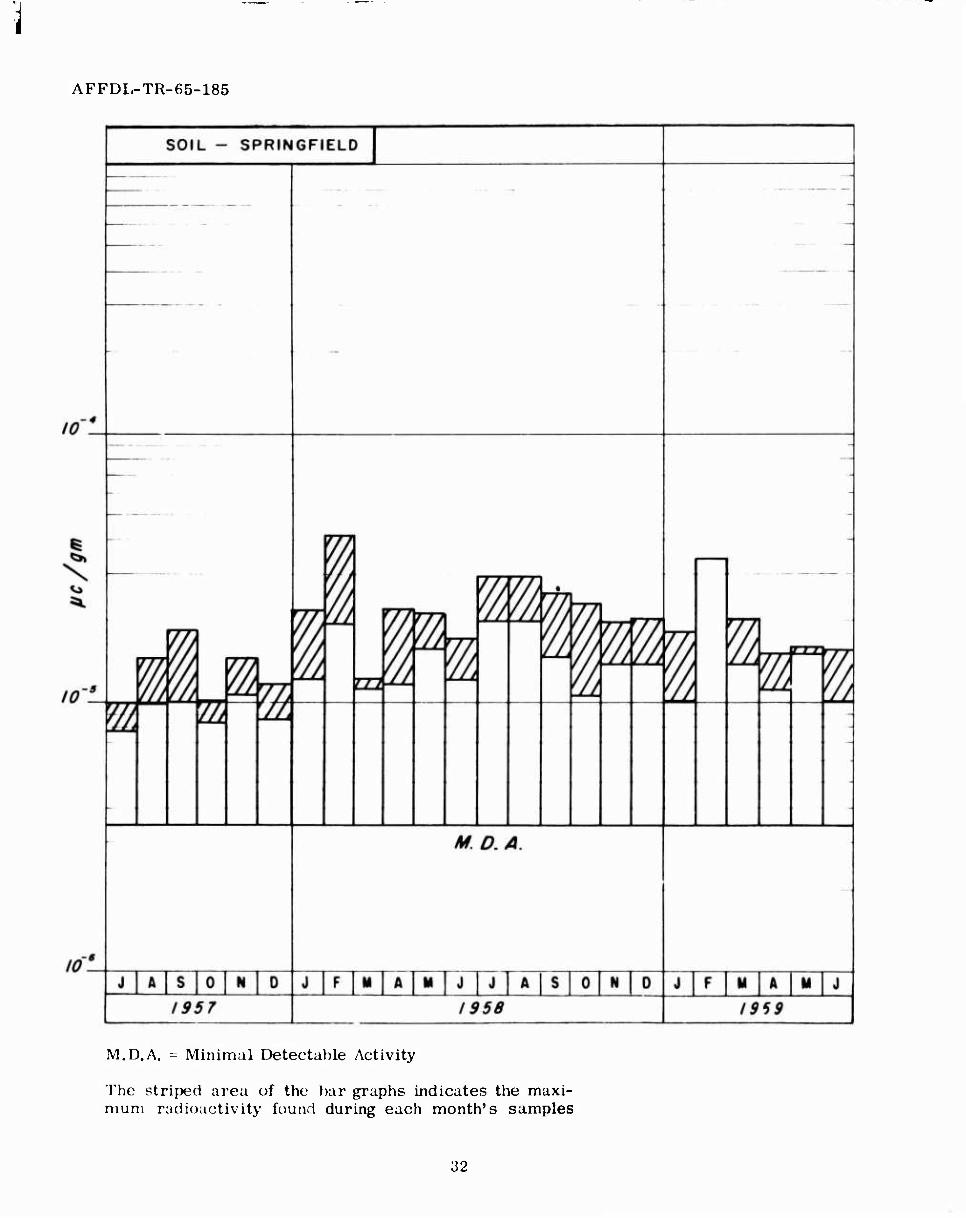
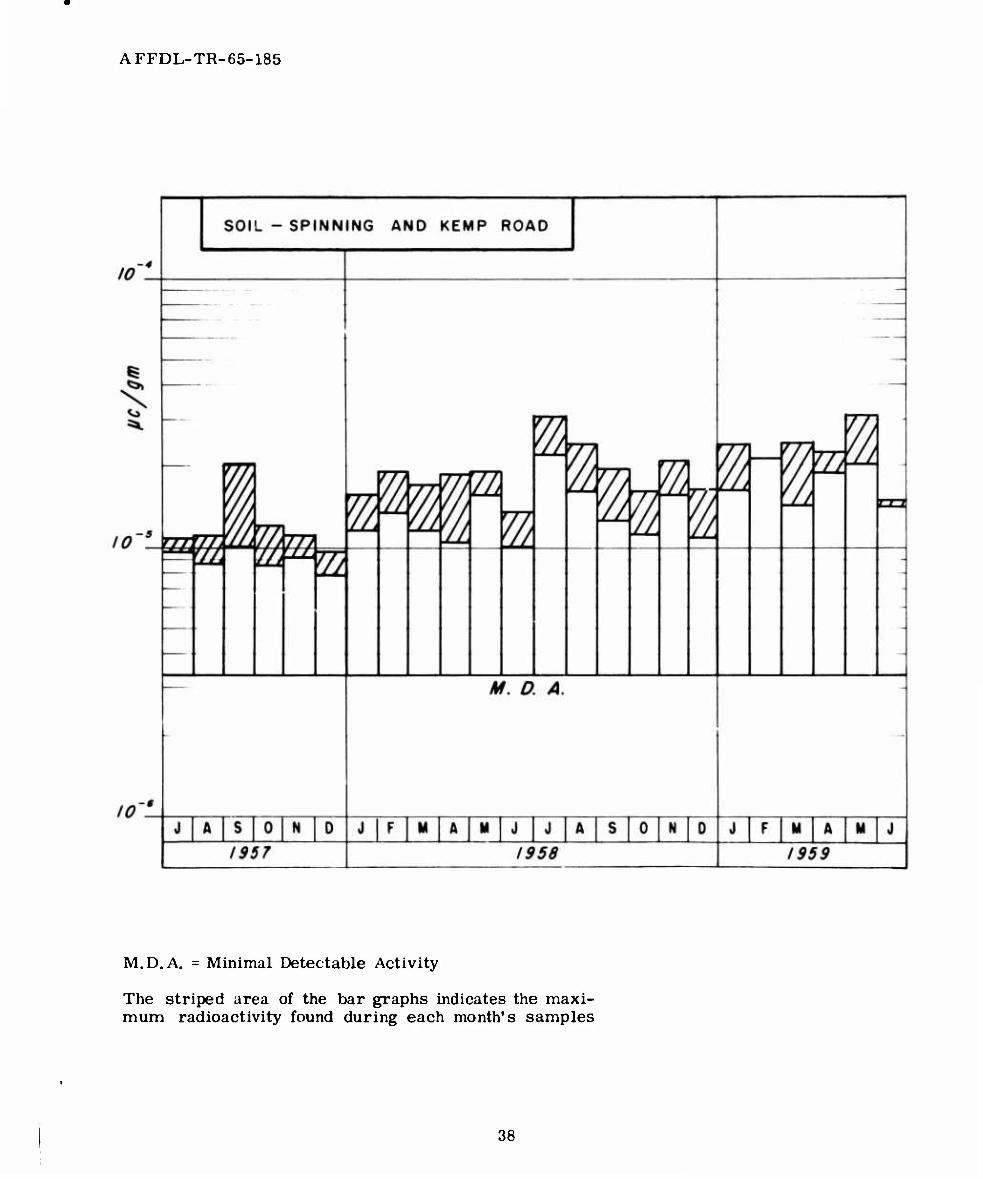
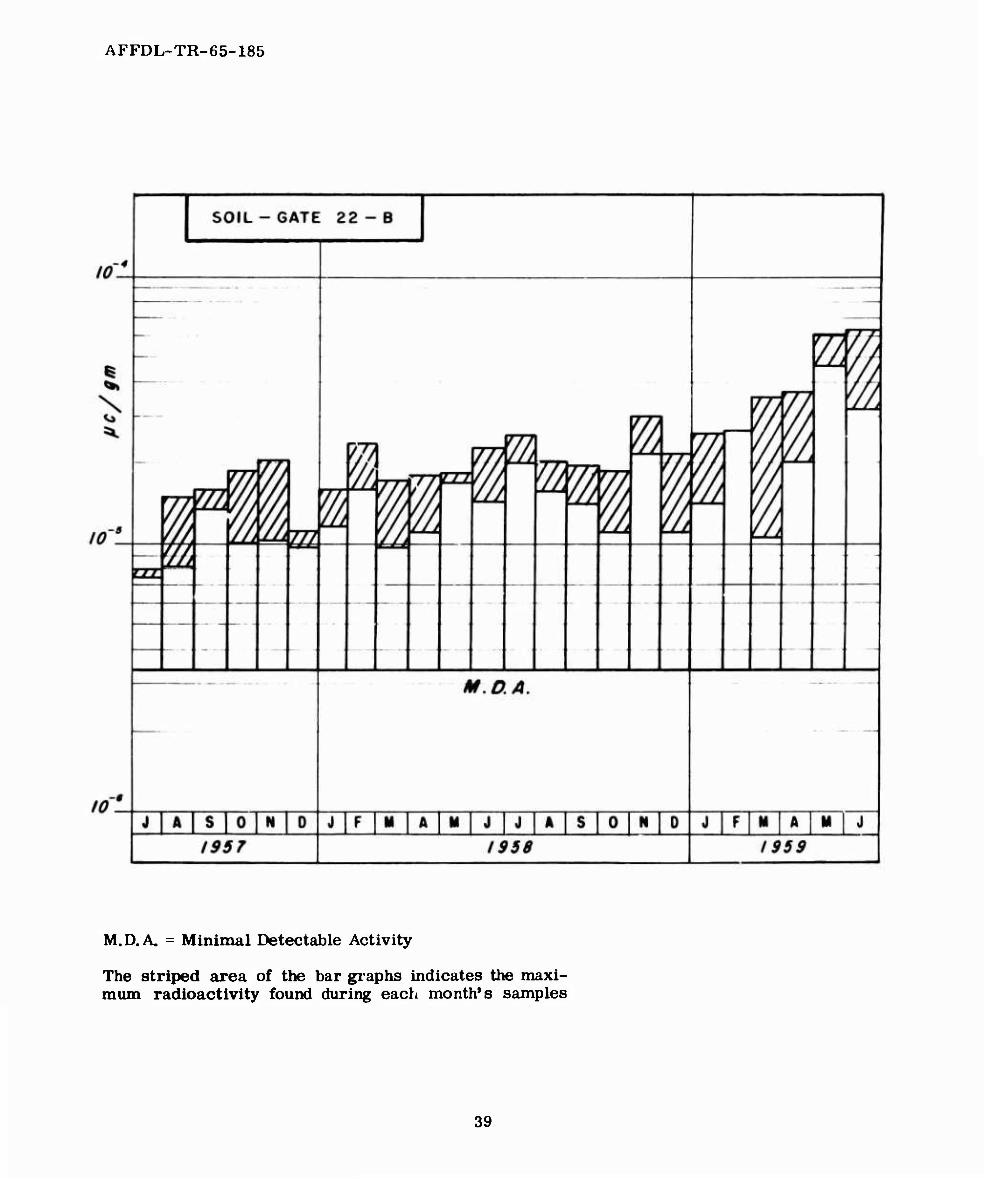
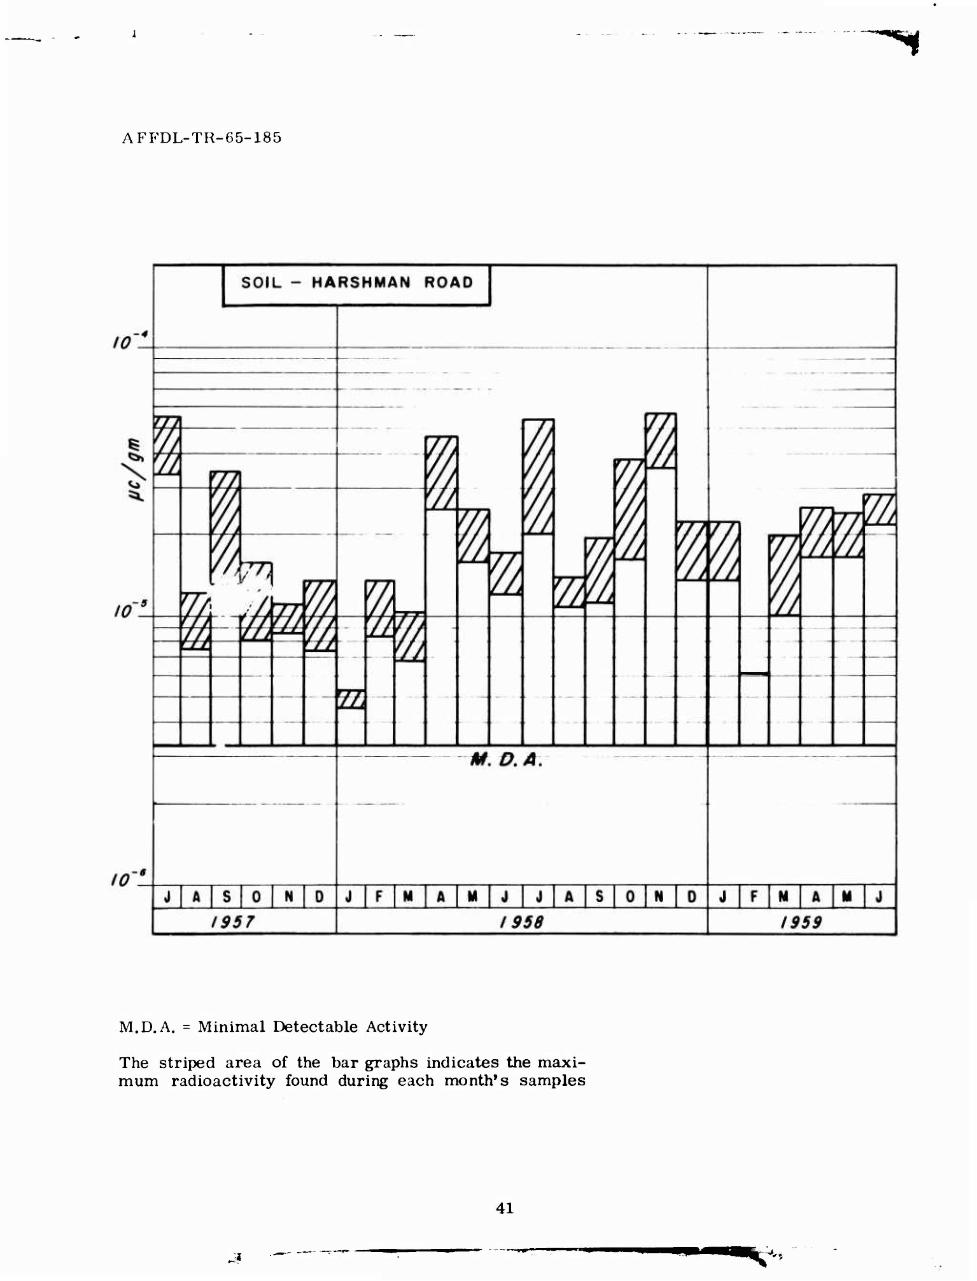
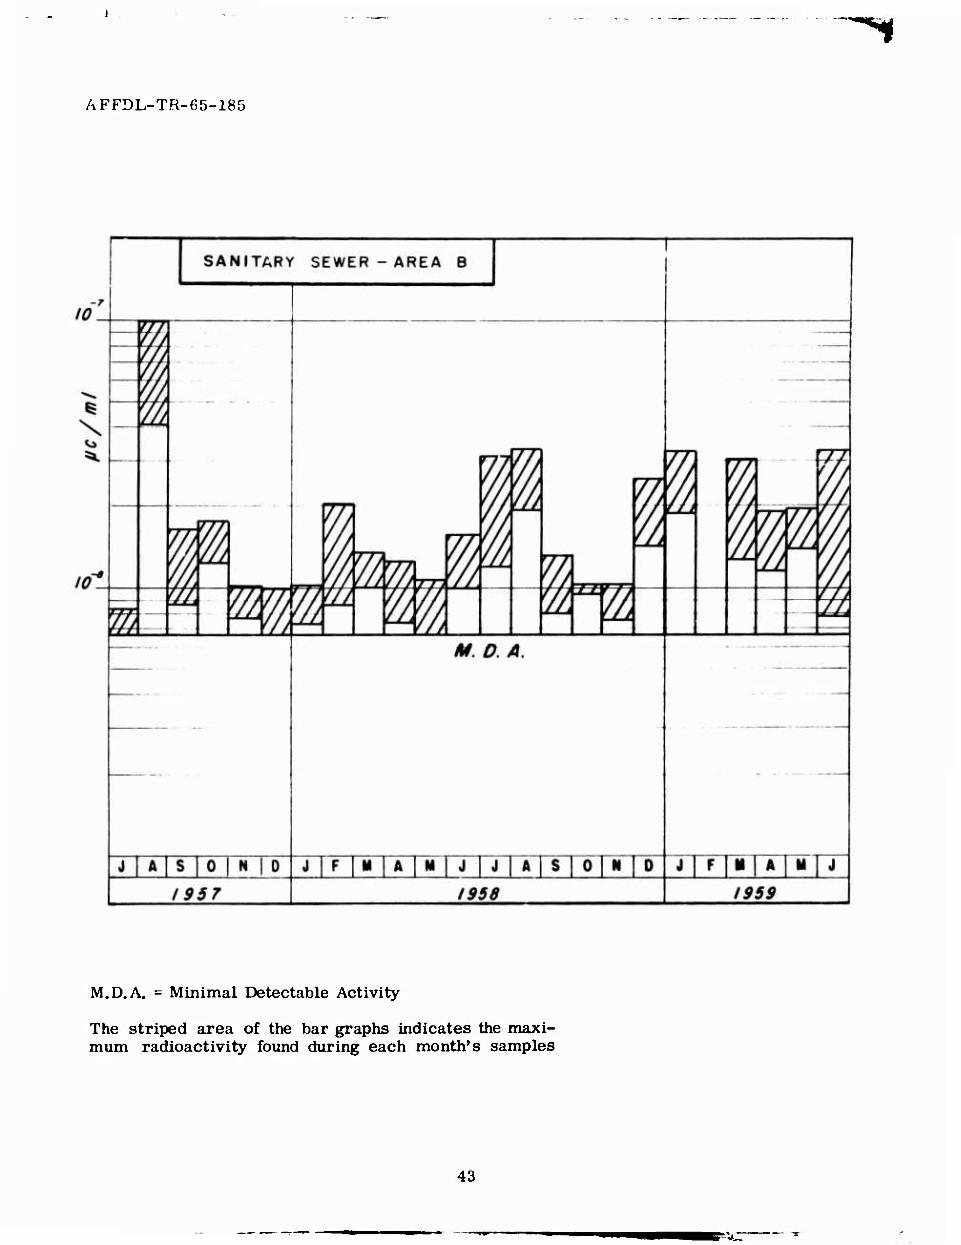
Rather than list the results in tabular form season to season. See Appendix I for a a bar graph was drawn to show the variation in graphic presentation of the results, activity from month to month and from
1 AFFDL-TR-65-185
APPENDIX I
GRAPHIC ILLUSTRATION OF RADIOACTIVE BACKGROUND DATA
AFFDL-TR-65-185
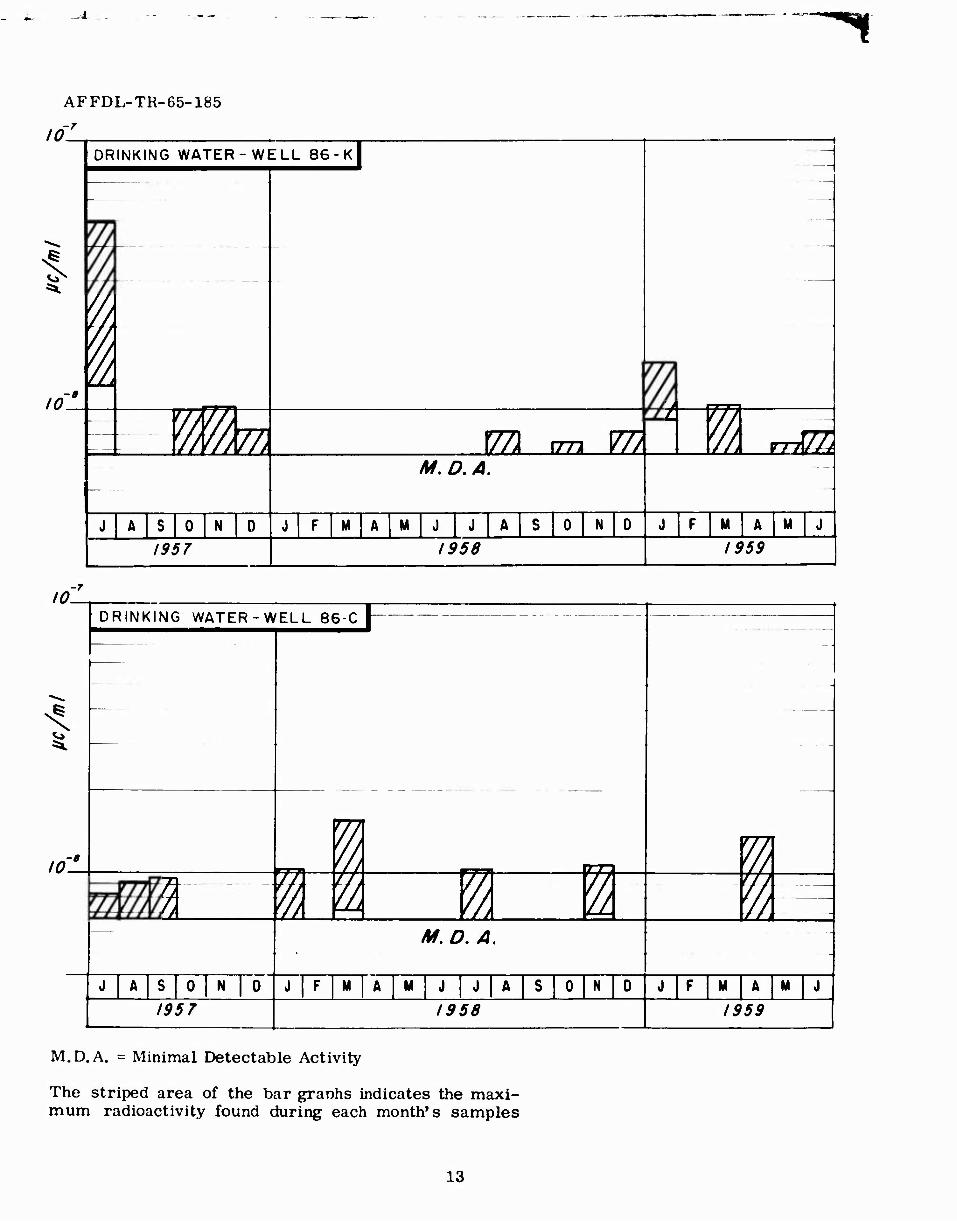
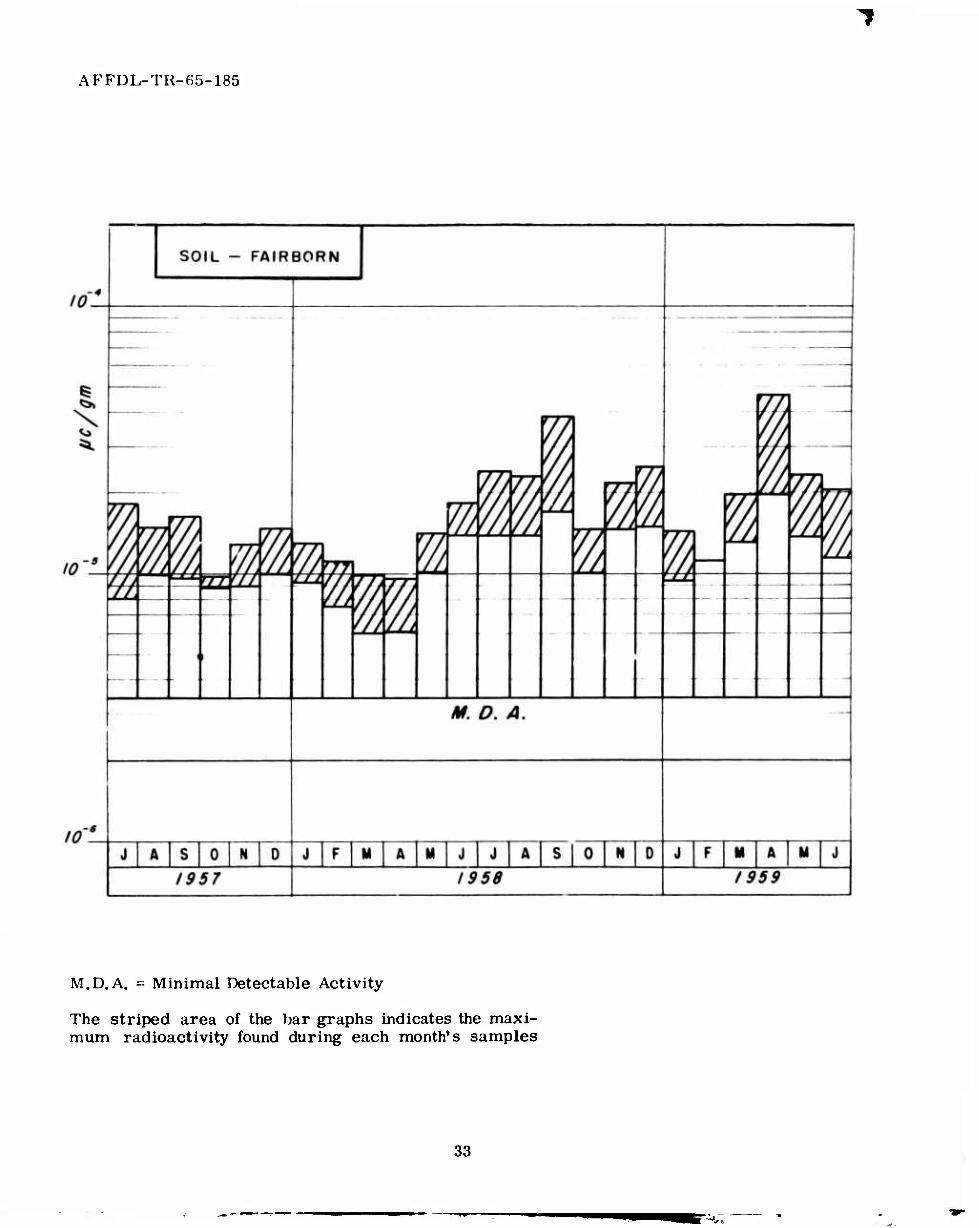
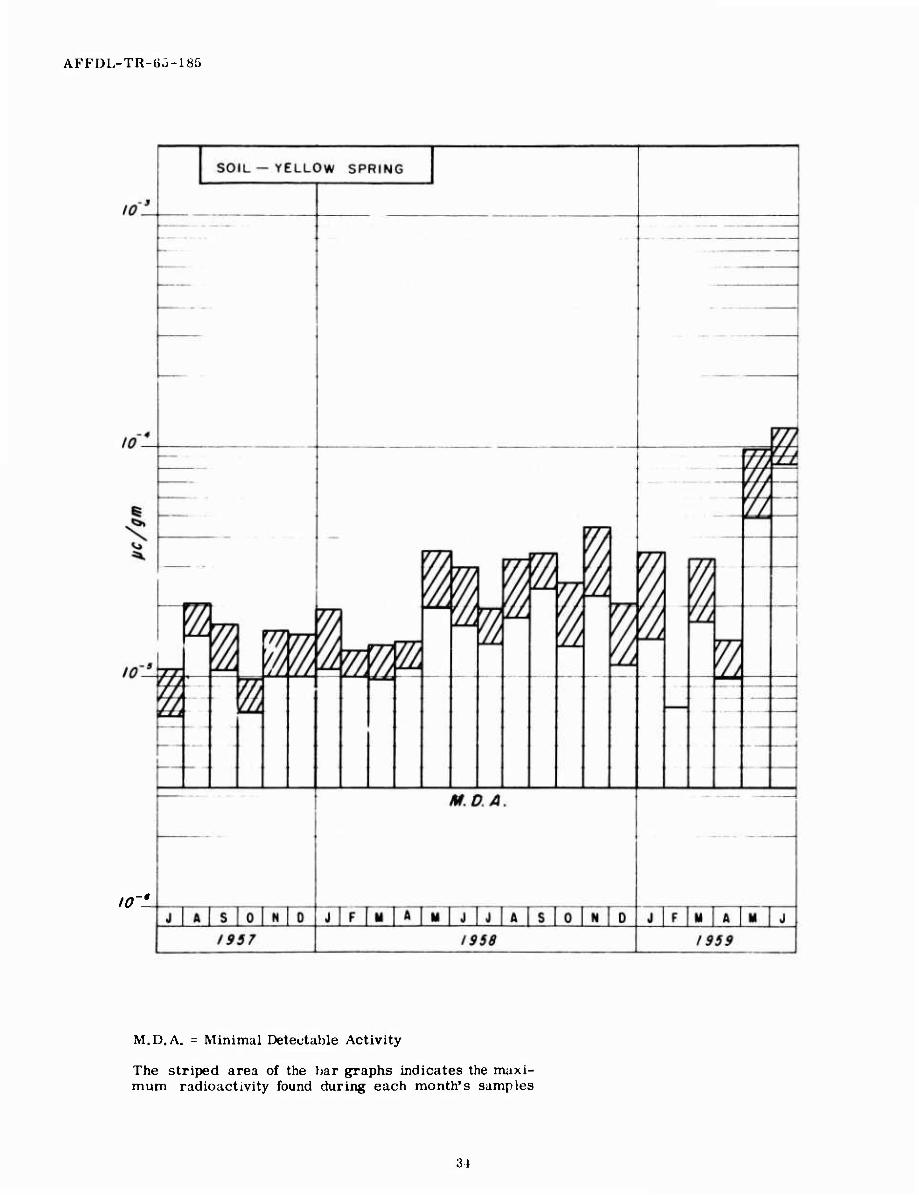
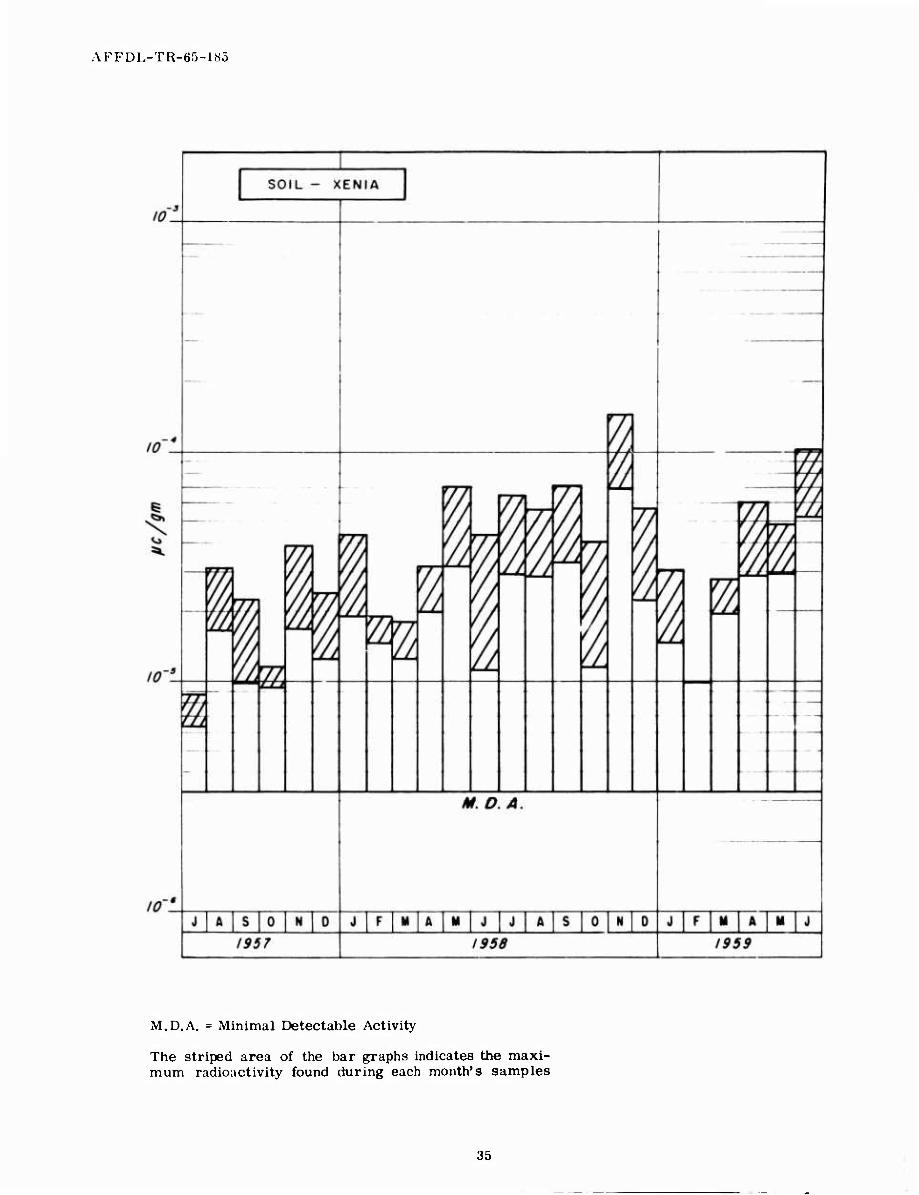
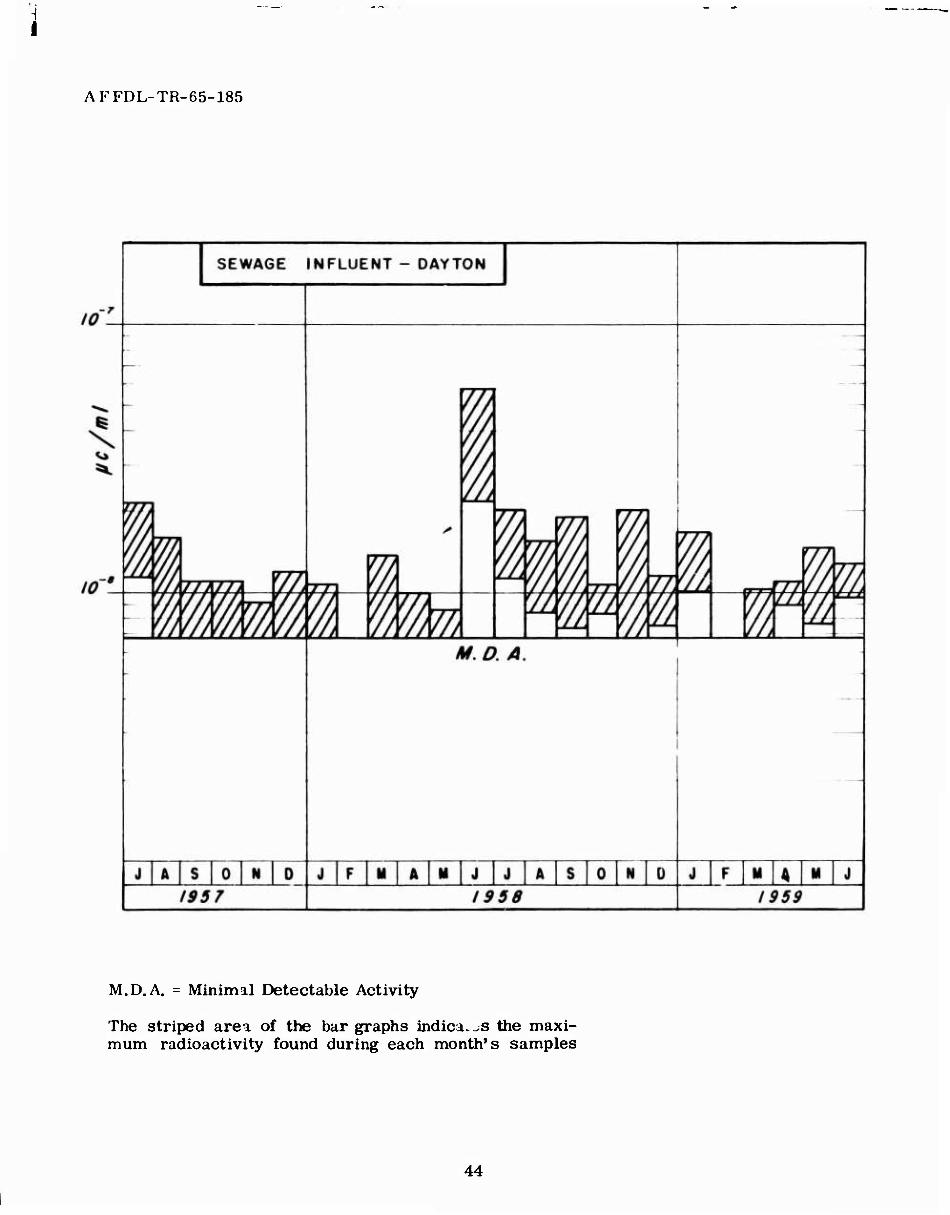
M.D.A. = Minimal Detectable Activity
The striped area of the bar graphs indicates the maxi- mum radioactivity found during each month's samples
«■»^^HPi
AFFDL-TR-65-185
M.D.A. = Minimal Detectable Activity
The striped urea of the bar graphs indicates the maxi- mum radioactivity found during each month's samples
AFFDL-TR-65-185
10 -7
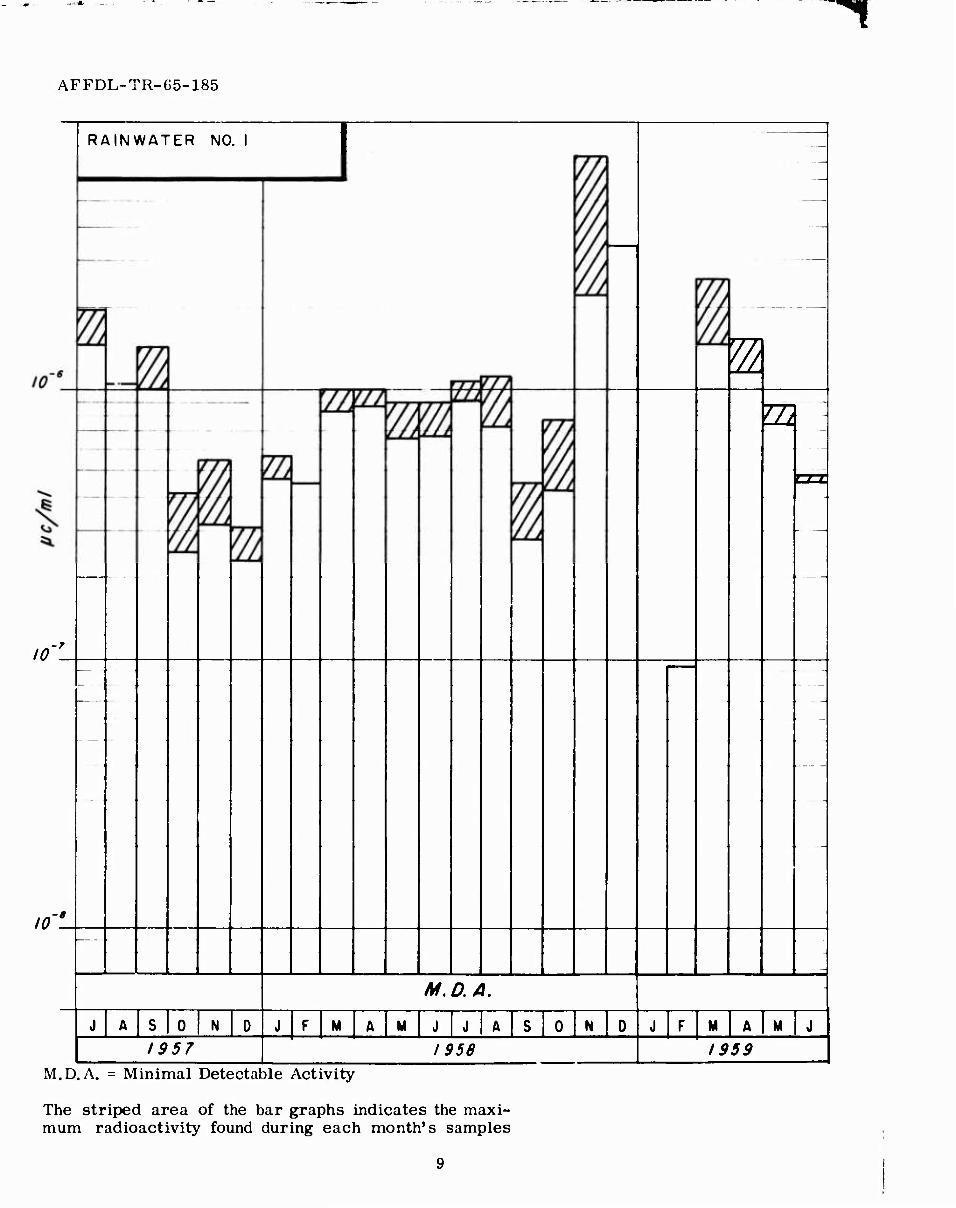
RAINWATER NO. I
m m
m
10 -B
M.D.A.
J A S 0 N D F M A M JASON M A M J
1957 I 956 1959 M.D.A. = Minimal Detectable Activity
The striped area of the bar graphs indicates the maxi- mum radioactivity found during each month's samples

AFFDL-TR-65-185
RAINWATER NO. 2
i 10
Vi
10 -7
w
m m
TL üim
fi
K m -am 'T,
10
M.D.A
J A S 0 N D JFMAMJJASONOJFMAMJ
1957 1958 1959
M.D.A. = Minimal Detectable Activity
The striped area of the bar graphs indicates the maxi- mum radioactivity found during each month's samples
10
AFFDL-TR-165-185
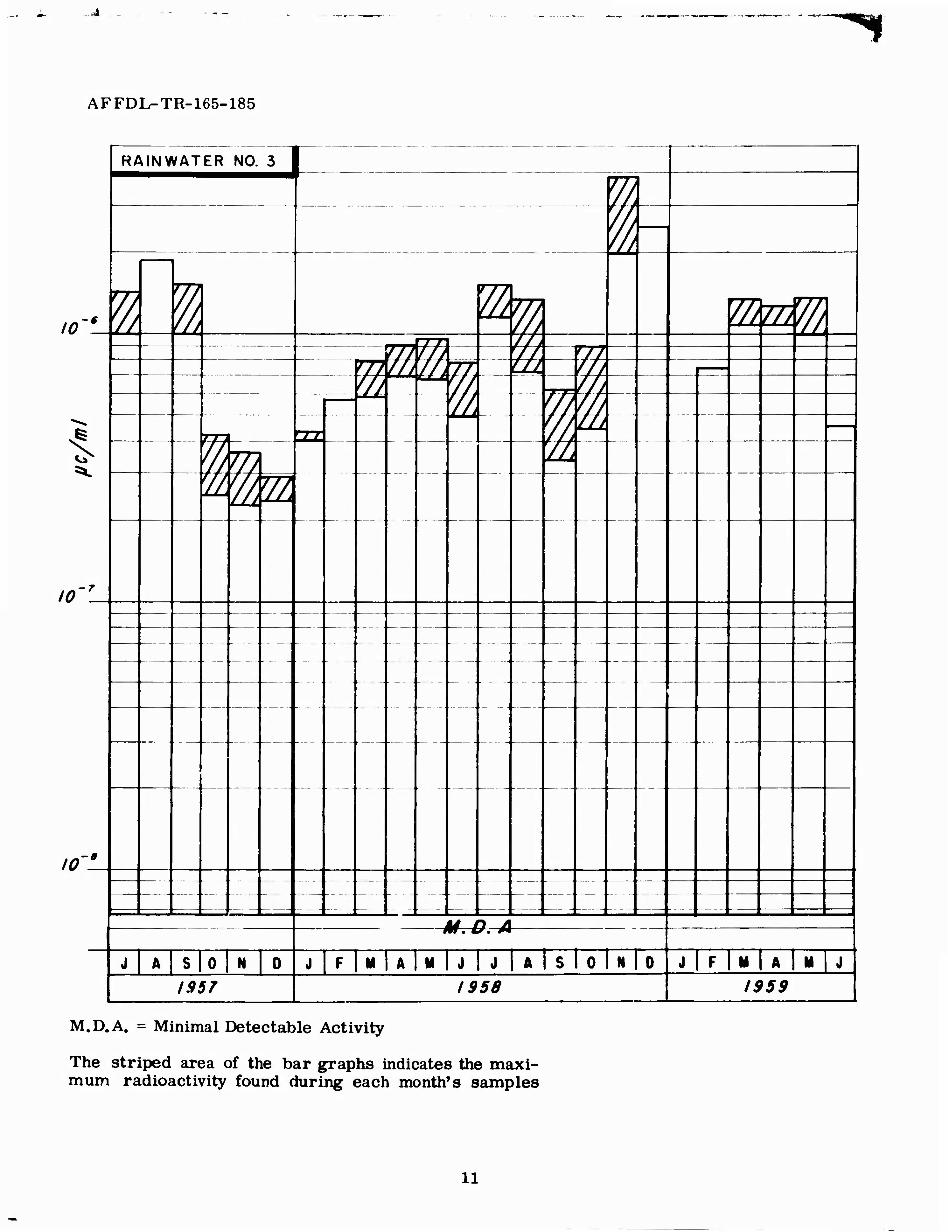
RAINWATER NO. 3 1 » V/f
i 10- d
_r7-r
'H, % _—^__
m Vn. 1
\ i
^ ^ 1 —
Wi m _._r—' //J
i
,
- — i % —,.
—
— —.
J ̂
^ ^ p VA
—
.___ —
■ — — — —J
IO'7
, : 1 •— —
—
— 1 ■— ,—
- - \
—
--
— —
—
—i
—
■—
—
—
i
io-B
-_. - _._ J —' — —i 1 — — i
--- —
-M^e,-A
J| A|S 0 N 1 0 J | F | M | A | M | J |j | A | S 1 0 1 N | 0 J|F|M|A|M|J
I3ST 1958 | 1959 \
M.D.A. = Minimal Detectable Activity
The striped area of the bar graphs indicates the maxi- mum radioactivity found during each month's samples
11

i AFFDL-TR-65-185
10
RAINWATER NO. 4
cz: m m TA
72m za
i 54.
10 -7
mwA
l i
lO-L
M.D.A
J J A M
1957 1958 1959
M.D.A. = Minimal Detectable Activity
The striped area of the bar graphs indicates the maxi- mum radioactivity found during each month's samples
12
10
AFFDL-TR-65-185 7
5*
10.
DRINKING WATER-WELL 86 - KJ
i WB msm-M
±-^7. m nMt M. D. A.
0 J M M J N D M A M J
1957 1958 1959
10. DRINKING WATER-WELL 86-C |—
^ v» ^
10. i % i M, D. A.
0 N D J F M A J J A M
195 7 1958 1959
M.D.A. = Minimal Detectable Activity
The striped area of the bar granhs indicates the maxi- mum radioactivity found during each month's samples
13
'j
AFFDL-TR-65-185
iO -7
5». i
10.
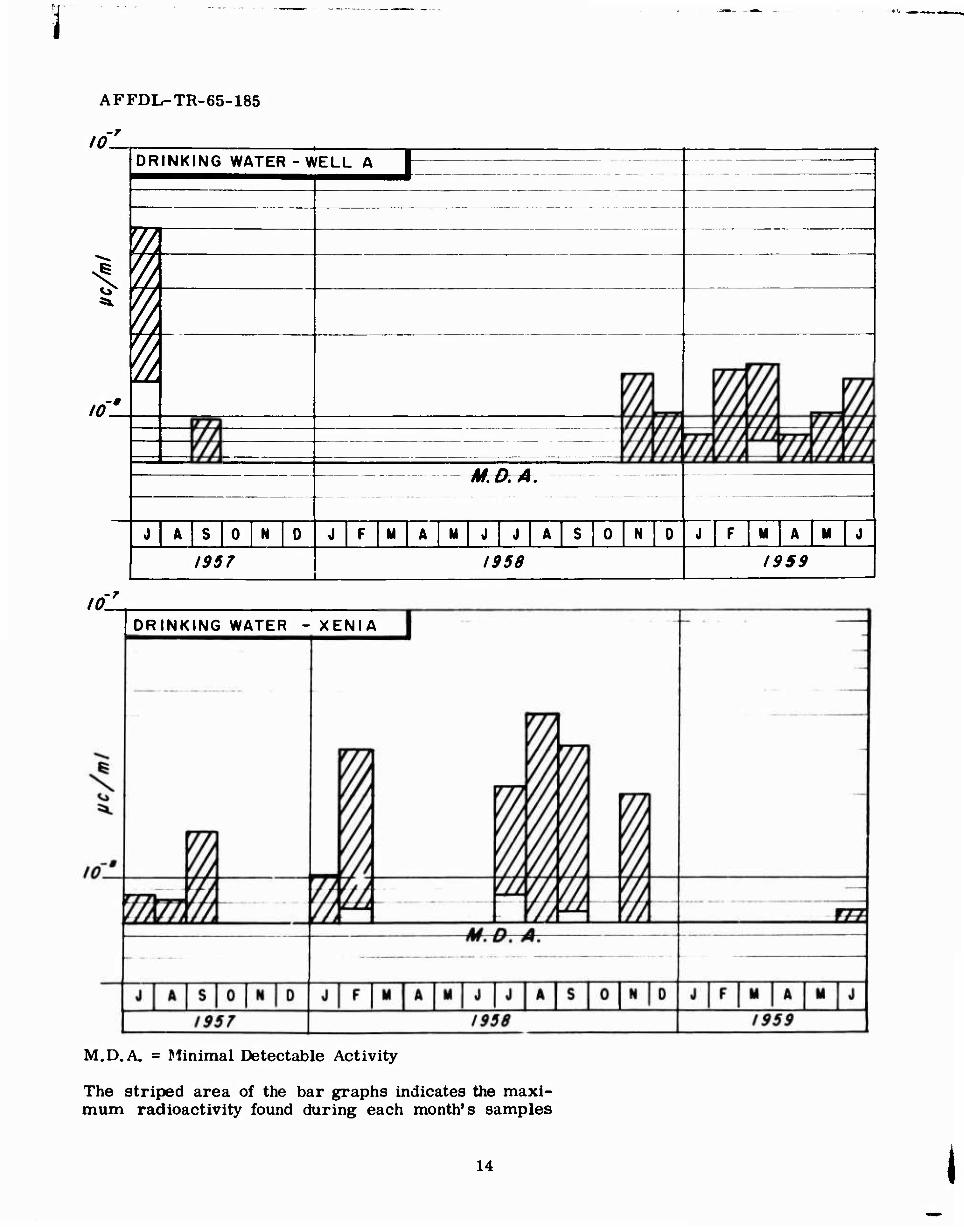
DRINKING WATER-WELL A
2
SE
MM, A.
N M M N
1957 1958 1959
10. -7
DRINKING WATER - XENIA
M.D.A, = Jlinimal Detectable Activity
The striped area of the bar graphs indicates the maxi- mum radioactivity found during each month's samples
14
AFFDL-TR-65-185 -7
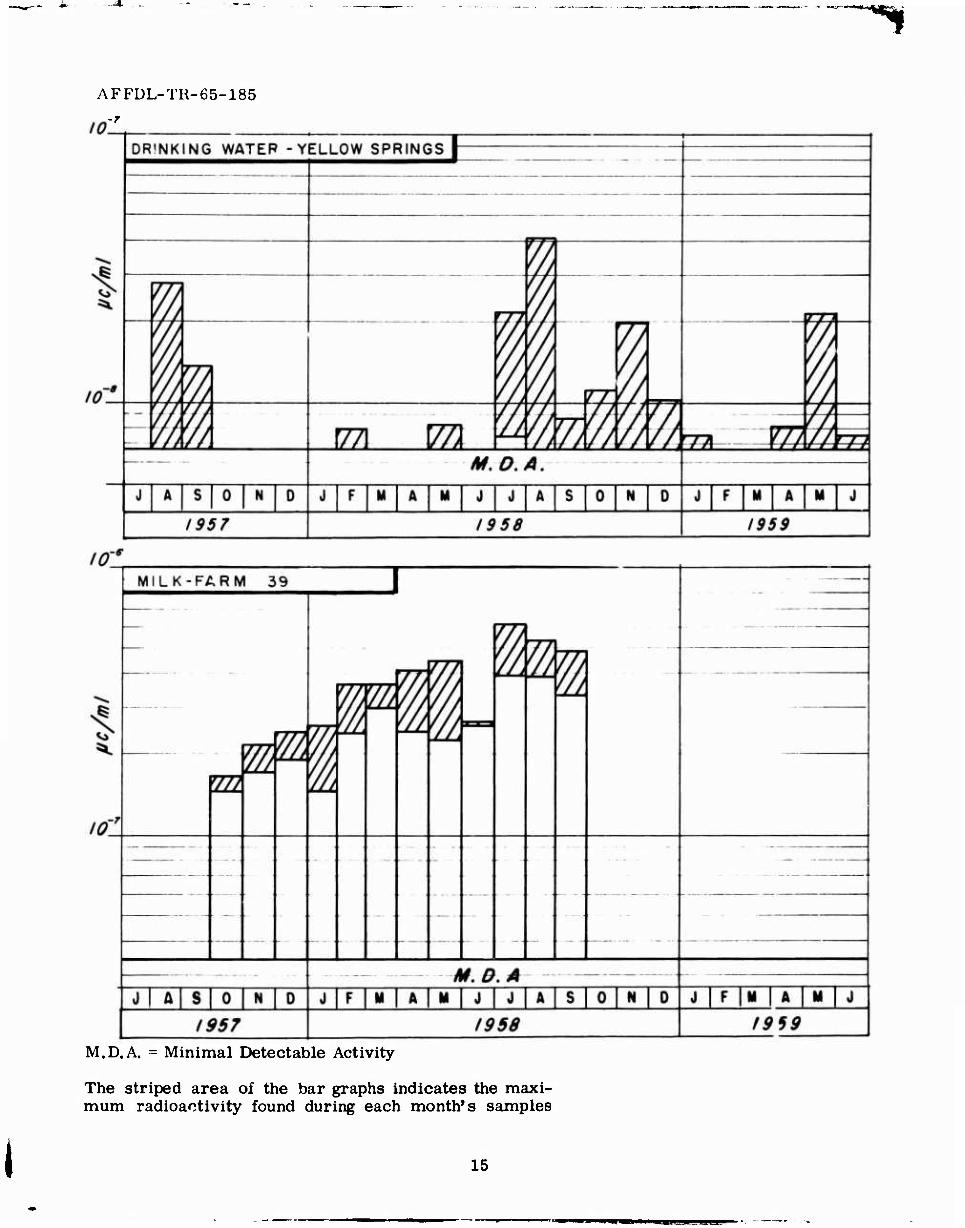
M.D.A. = Minimal Detectable Activity
The striped area of the bar graphs indicates the maxi- mum radioactivity found during each month's samples
15
;j
10
AFFDL-TR-65-185 s
i
10.
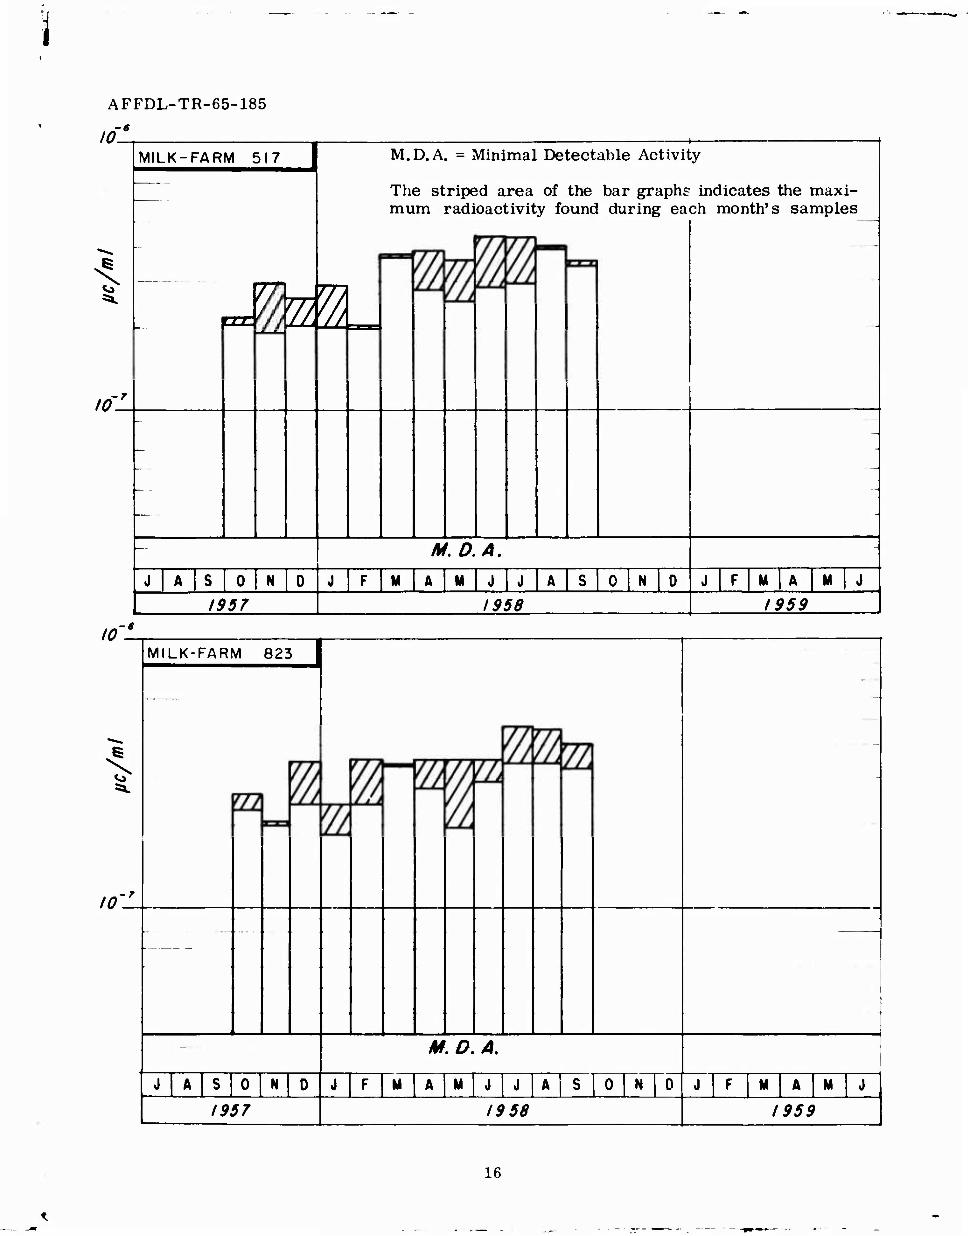
MILK-FARM 517
JMA
M.D.A. = Minimal Detectable Activity
The striped area of the bar graphs indicates the maxi- mum radioactivity found during each month's samples
M.D.A.
J A S 0 N 0 J FMAMJJASONO J F M A M J
1957 1958 1959
10 -6
10 -7
MILK-FARM 823
1957
¥. D. A.
M J J F M M
19 58 1959
16
AFFDL-TR-65-185
10.
10 -7
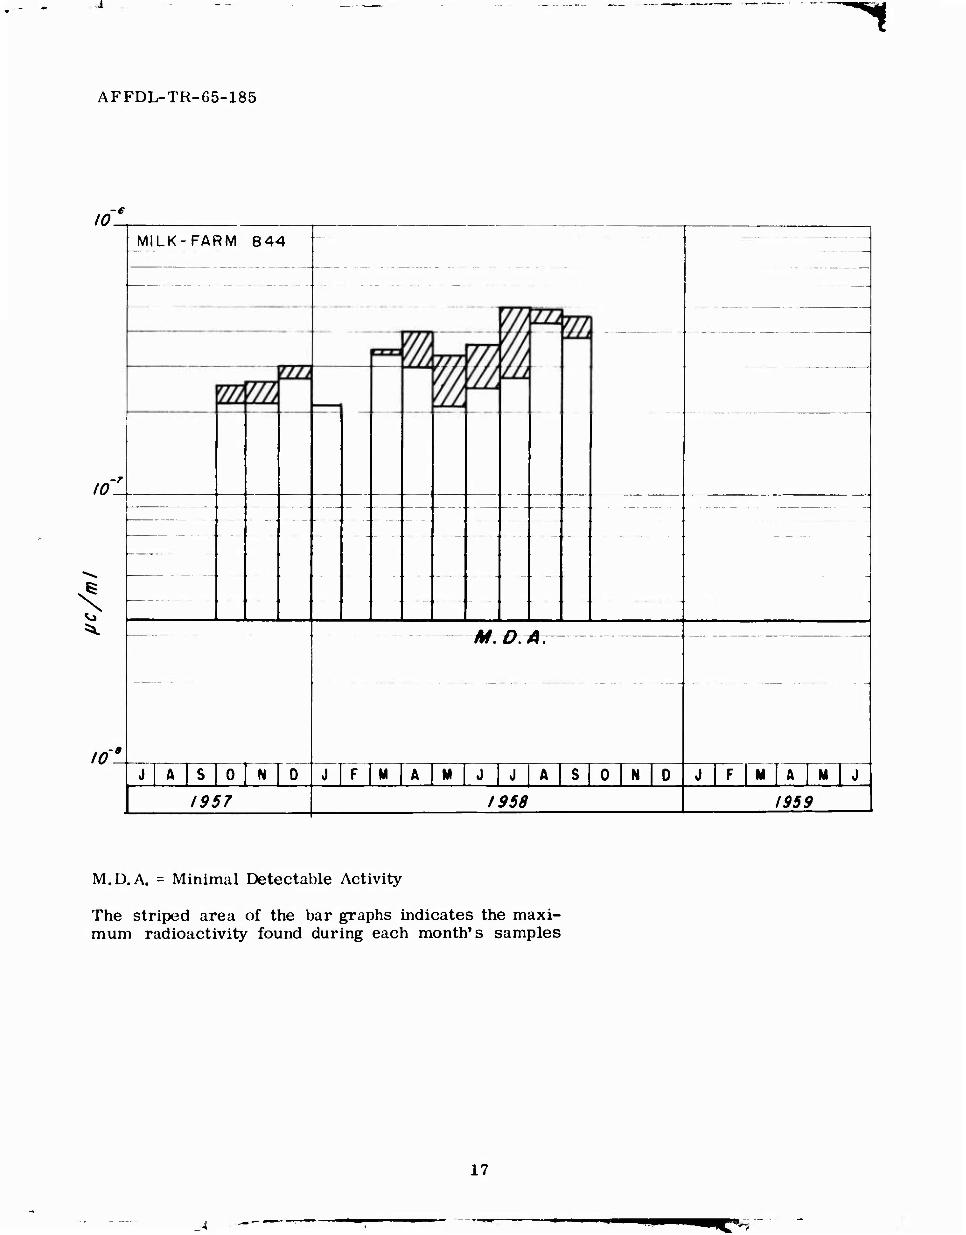
MILK-FARM 844
M, &*
10 -»
J A S 0 N D J F M A M A S 0 N 0 F M A
1957 t958 1959
M.D.A. = Minimal Detectable Activity
The striped area of the bar graphs indicates the maxi- mum radioactivity found during each month's samples
17
A ■—
AFFDL-TR-65-185
10
10'
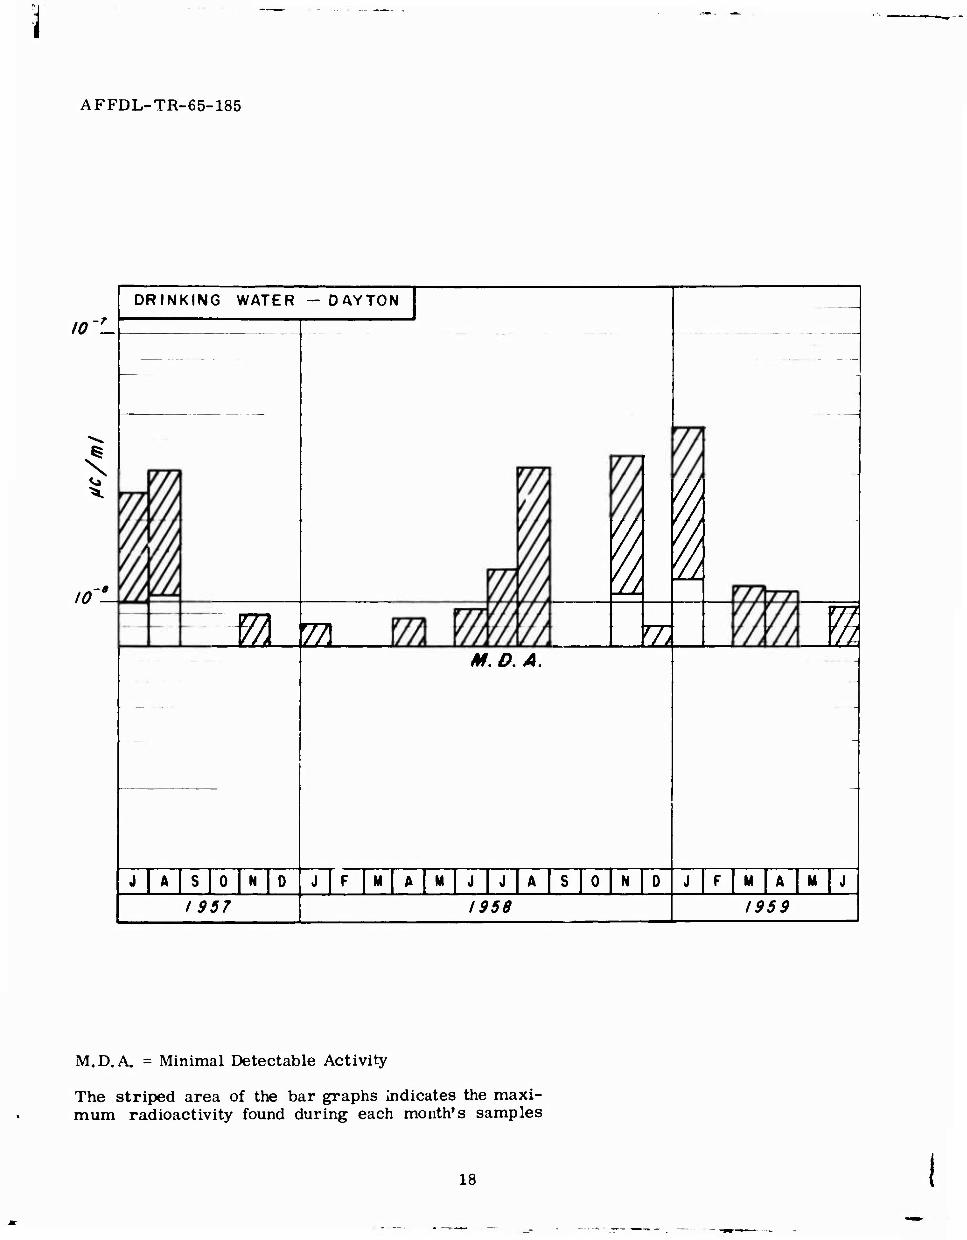
DRINKING WATER - DAYTON
a za. XL M m, D. A.
M M
I 957 1958 1959
M.D.A. = Minimal Detectable Activity
The striped area of the bar graphs Indicates the maxi- mum radioactivity found during each month's samples
18
AFFDL-TR-65-185
10.
10.
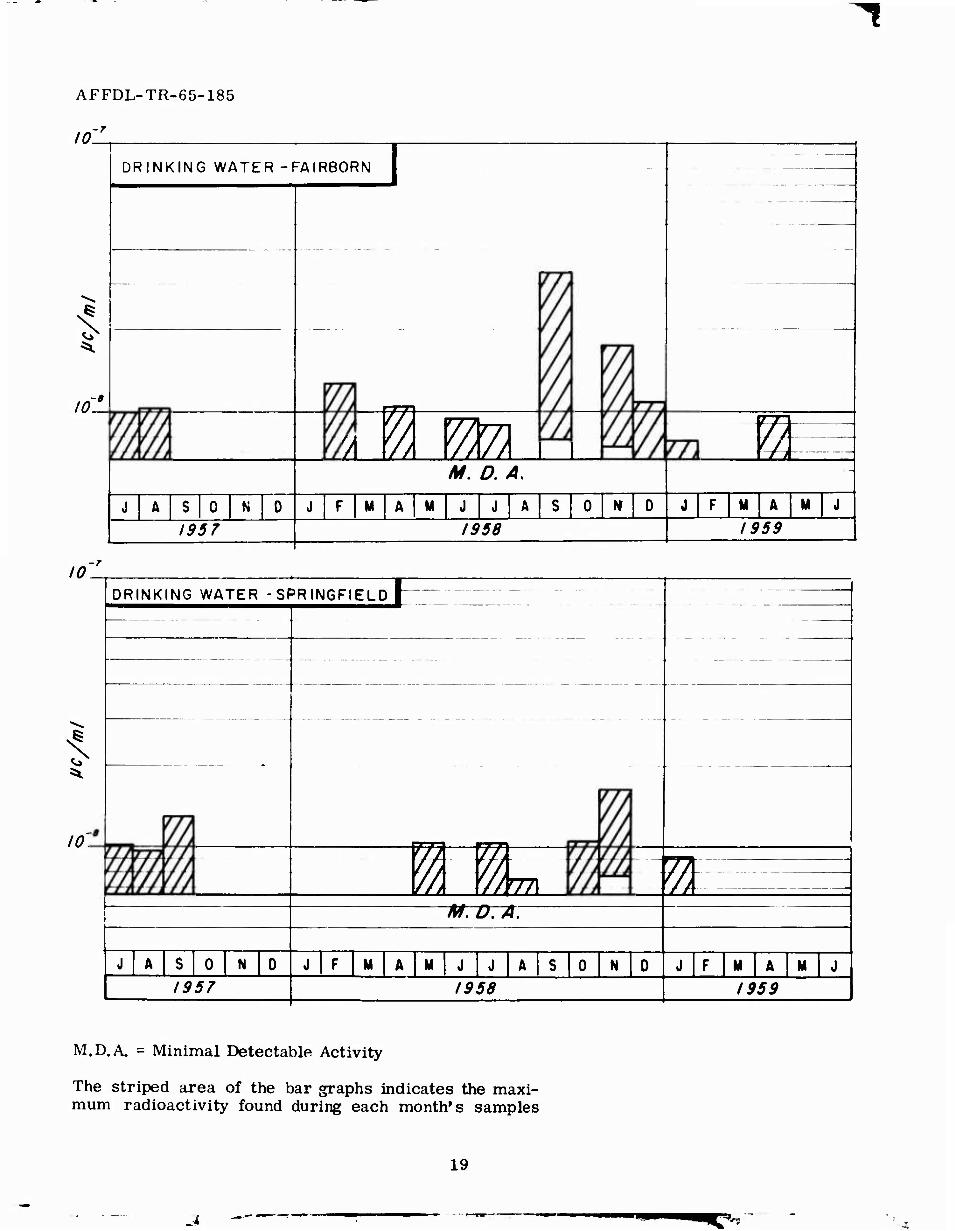
DRINKING WATER -FAIRBORN
m 'A. m a
M. D. A.
SON F M A M J S 0 M 0 J F
1957 1958 1959
10 DRINKING WATER -SPRINGFIELD
10'. wm. m. M. D. A7
J A S 0 N 0 J F M A J F M A M J
1957 1958 1959
M.D.A. = Minimal Detectable Activity
The striped area of the bar graphs indicates the maxi- mum radioactivity found during each month's samples
19
^ —' •^mwmm^mrmm mm

AFFDL-TR-65-185
10. -3
5^
10.
10 -s
ALGAE - YELLOW SPRINGS
m TT7
M.D.A
J A N M J
1957 1956 1959
M.D.A. = Minimal Detectable Activity
The striped area of the bar graphs indicates the maxi- mum radioactivity found during each month's samples
20

AFFDL-TR-65-185
VEG. WRIGHT- PATTERSON
10
5^
10 -4
10 -3
SON
M. D. A.
JFMAMJJ ASONO J F M A
1957 1958 1959
M.D.A. = Minimal Detectable Activity
The striped area of the bar graphs indicates the maxi- mum radioactivity found during each month's samples
21
AFFDL-TR-65-185
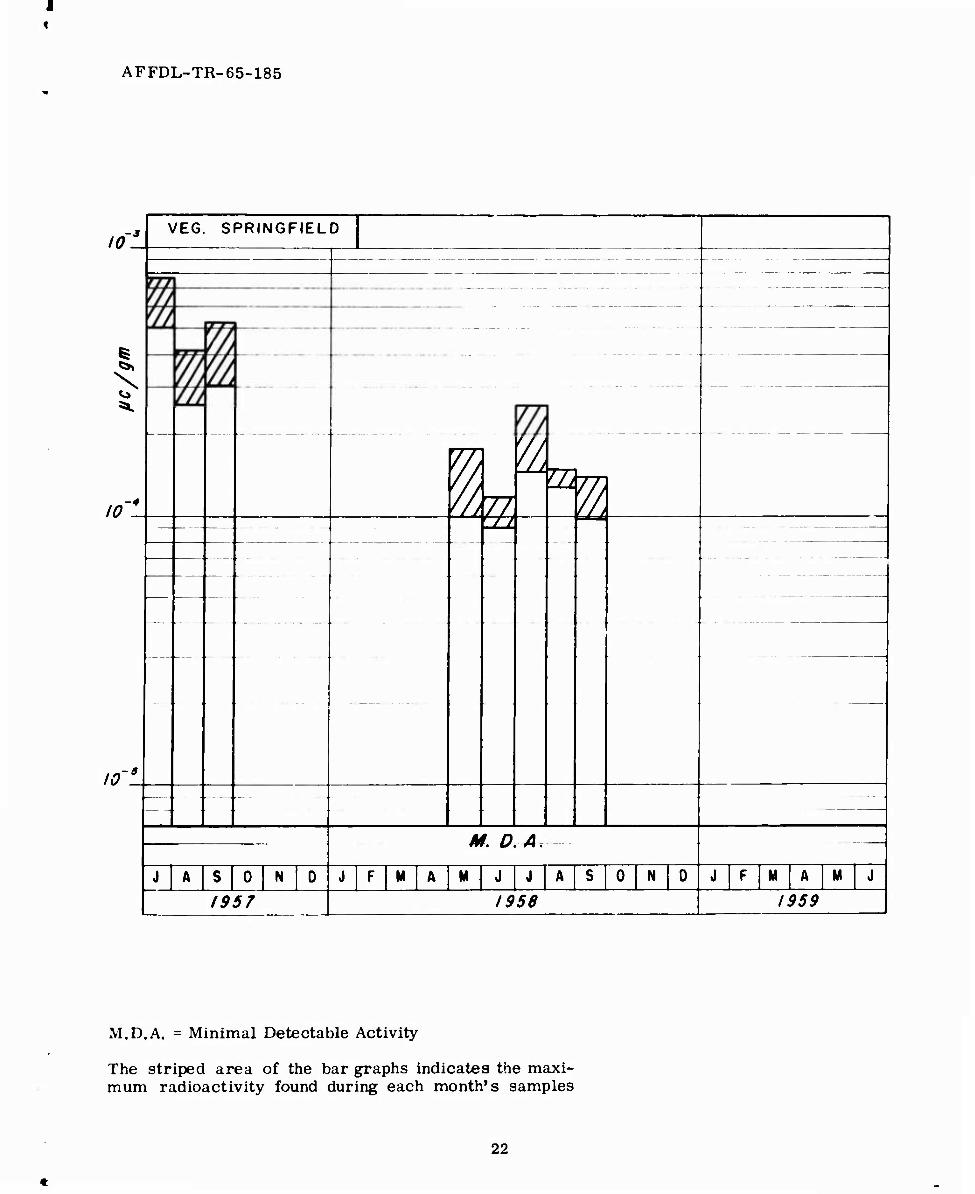
10 -3 VEG. SPRINGFIELD
10
10 -5
7/
^S (L ^
M, D,A
N M N M M
1957 1958 1959
M.D.A. = Minimal Detectable Activity
The striped area of the bar graphs indicates the maxi- mum radioactivity found during each month's samples
22
AFFDL-TR-65-185
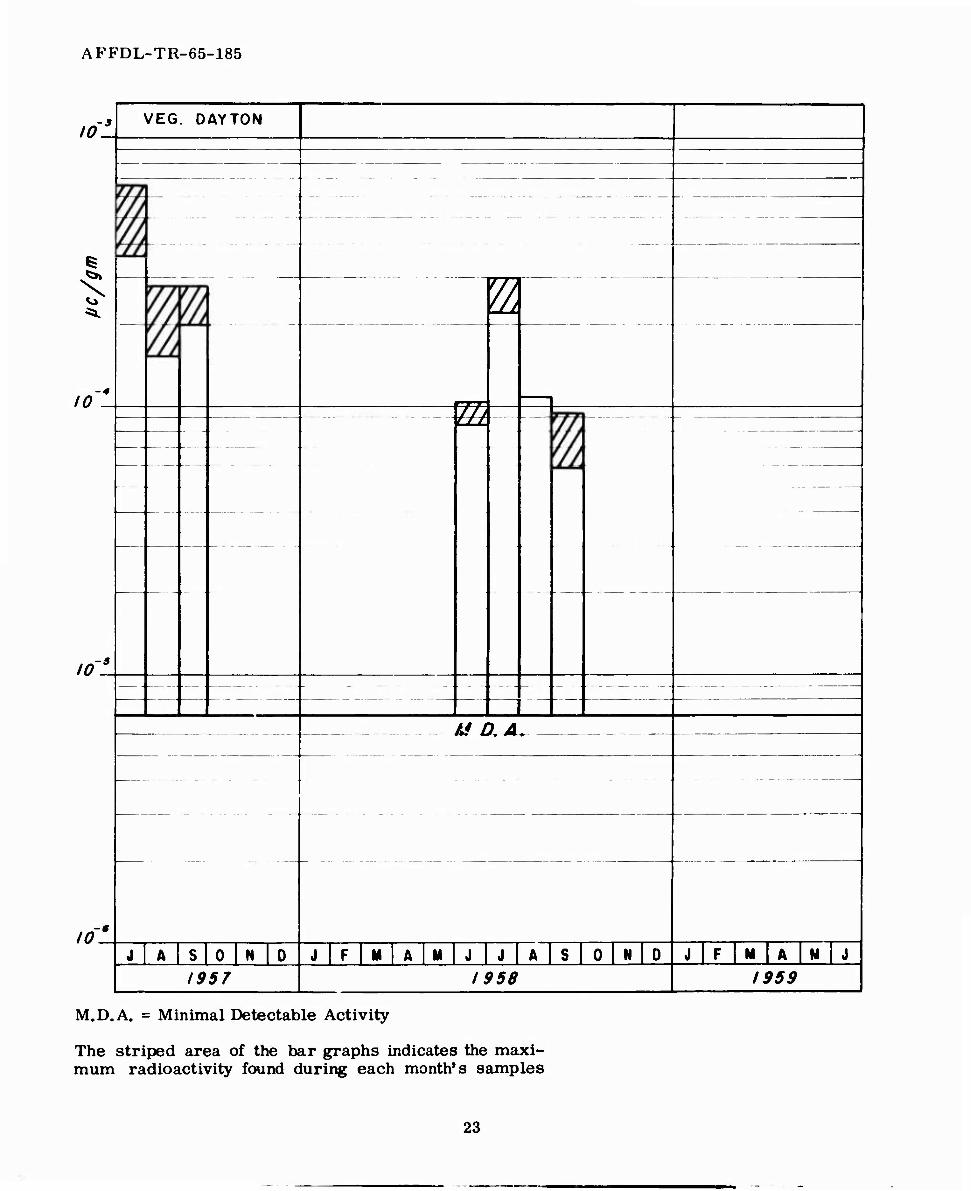
10 -s VEG. DAYTON
^
S ^
10
m
m
10'
U D, A^
10 .-«
S 0 N D JFMAMJ JASOND J F M A M J
1957 I 956 1959
M.D.A. = Minimal Detectable Activity
The striped area of the bar graphs indicates the maxi- mum radioactivity found during each month's samples
23

AFFDL-TR-65-185
10. VEG. YELLOW SPRINGS
2
5^
10 -4
10'
M, D. A,
M N J F M A M
1957 1958 1959
M.D. A, = Minimal Detectable Activity
The striped area of the bar graphs indicates the maxi- mum radioactivity found during each month's samples
24

AFFDL-TR-65-185
10'. VEG. BEAVER CREEK
m zzz
10 -4
m
to'
M. O. A,
A S N J F M A M J JAS J F M M J
1957 1958 1959
M.D.A. = Minimal Detectable Activity
The striped area of the bar graphs indicates the maxi- mum radioactivity found during each month's samples
25
AFFDL-TR-65-185
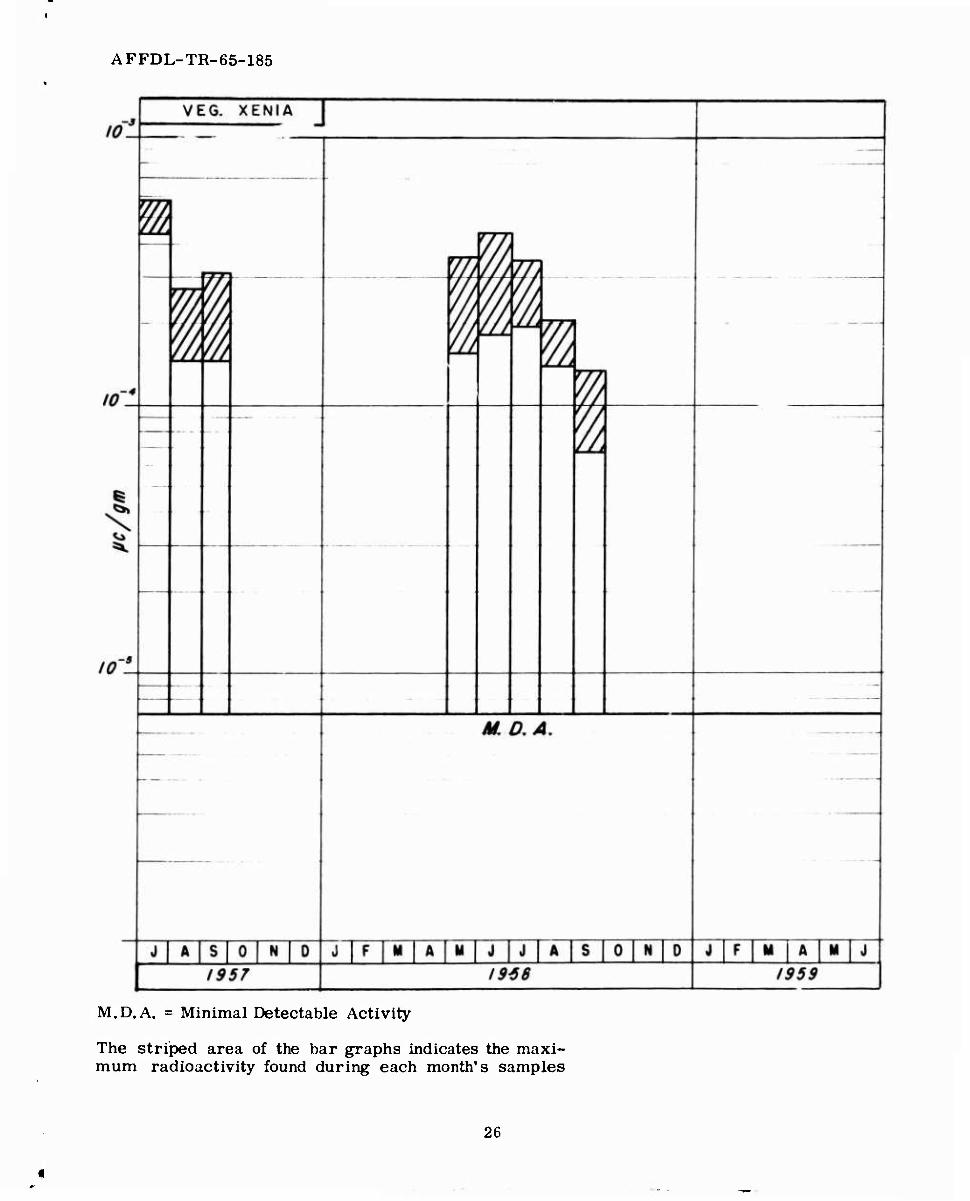
M.D.A. = Minimal Detectable Activity
The striped area of the bar graphs indicates the maxi- mum radioactivity found during each month's samples
26
AFFDL-TR-65-185
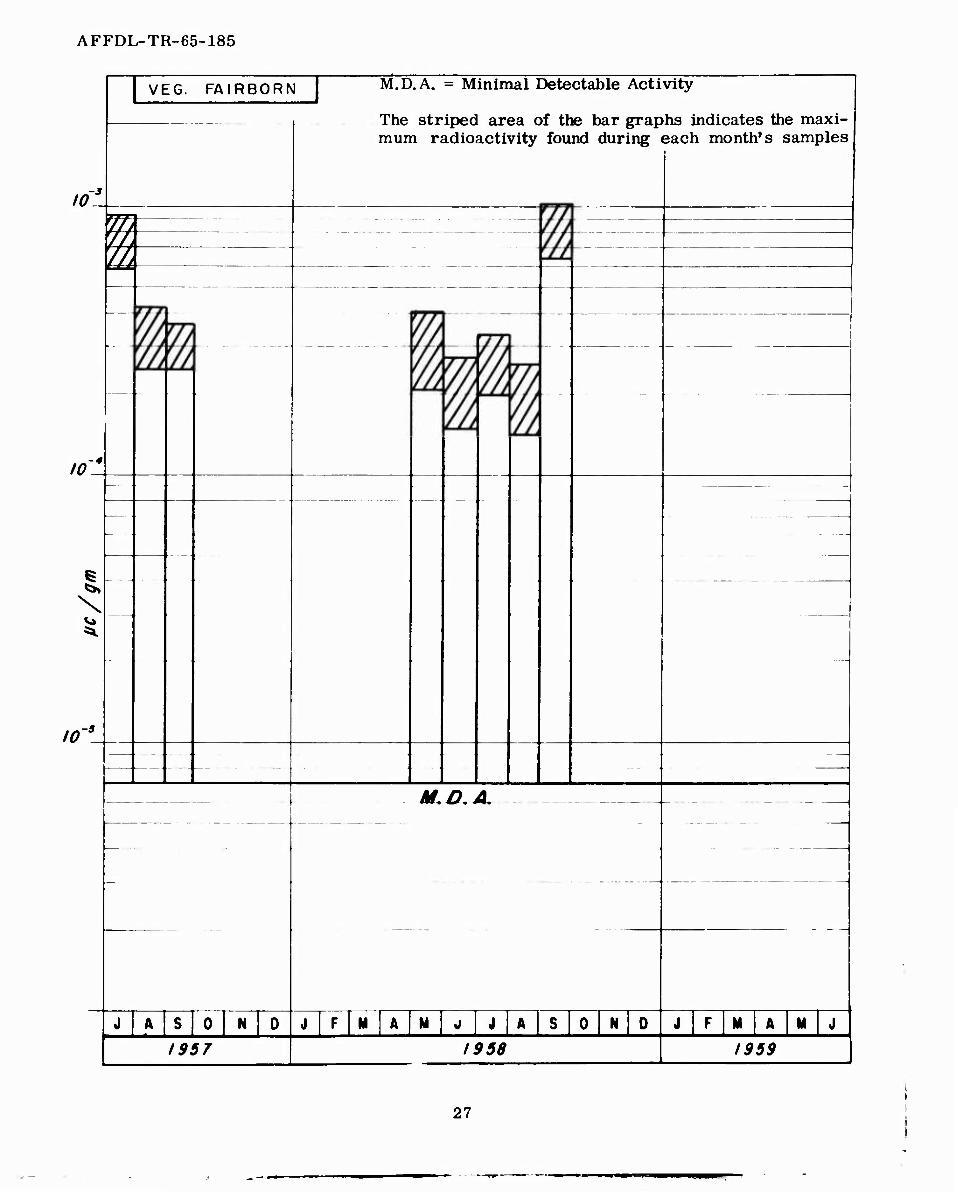
10 -3
VEG. FAIRBORN M.D.A. = Minimal Detectable Activity
The striped area of the bar graphs indicates the maxi- mum radioactivity found during each month's samples
10
10 -5
N
1957
H,0,A
M
1958 1959
27
^ ■ M ^ ■^■^m

AFFDL-TR-65-185
10
«si
10
fo-'x
FALL OUT PAPER NO. I
m
m ''A
zz TL i
ID "j"[ft Ts I o fNI o
M. D. A.
jJjF [ M | A [M [ j] J J A7s] 0 [N [p M'J ftJJXi 1957 1958 1959
M.D.A. - Minimal Detectable Activity
The striped area of the bar graphs indicates the maxi- mum radioactivity found during each mo.-v-h's samples
28

AFFDL-TR-65-185
X
M.I).A. = Minimal Detectable Activity
The striped area of the bar graphs indicates the maxi- mum radioactivity found during each month's samples
2'J
AFFDL-TR-65-185
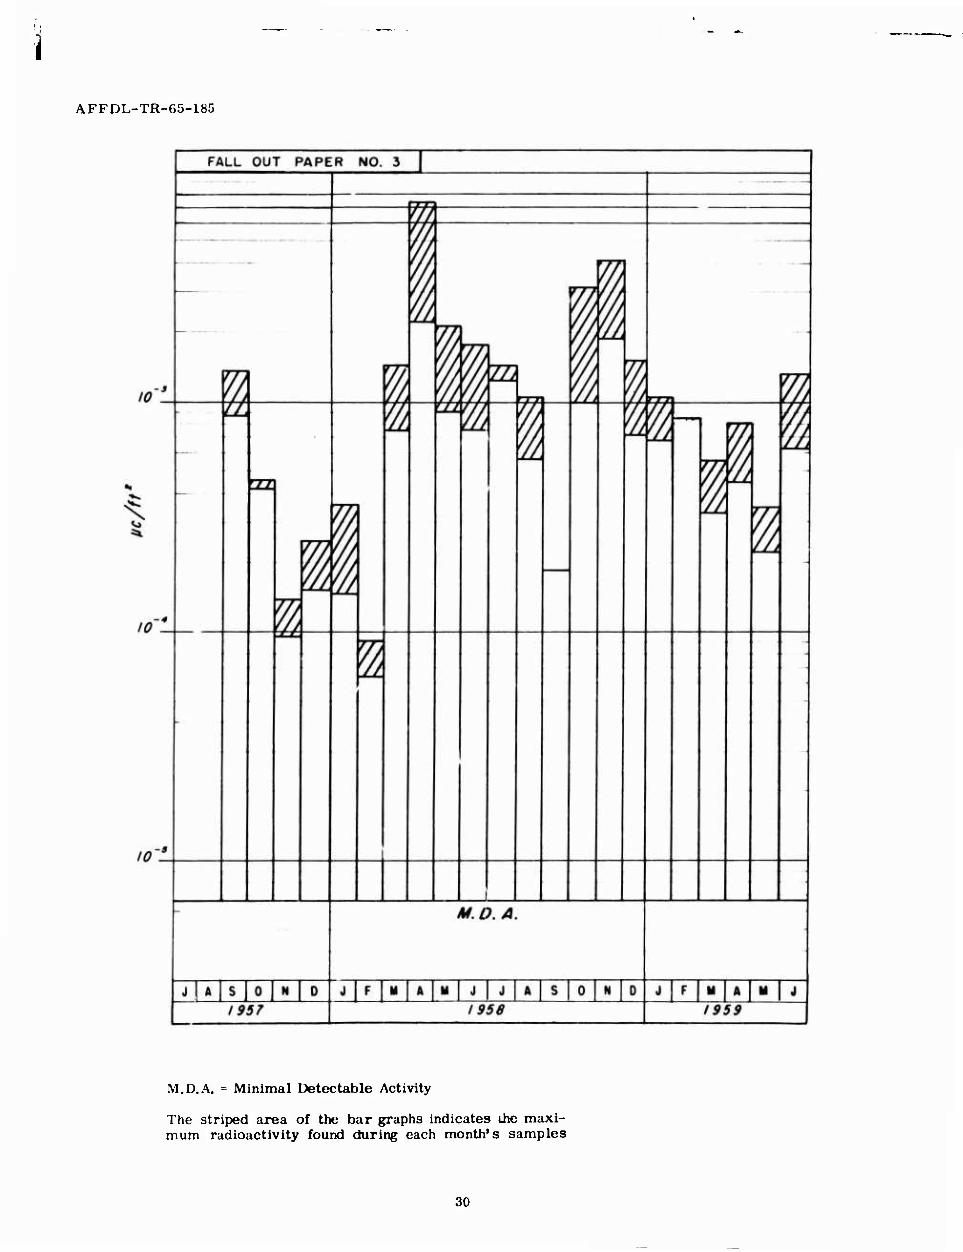
M.D.A. = Minimal Detectable Activity
The striped area of the bar graphs indicates ihe maxi- mum radioactivity found during each month's samples
30

'"-S|
AFFDL-TR-65-185
M.D.A. = Minimal Detectable Activity
The striped area of the bar graphs indicates the maxi- mum radioactivity found during each month's samples
31
* ' iwr
AFFDL-TR-65-185
M.D.A. = Minimal Detectable Activity
The striped area of the bar graphs indicates the maxi- mum radioactivity found during each month's samples
32
AFFDL-TR-65-185
M.D. A. = Minimal Detectable Activity
The striped area of the bar graphs indicates the maxi- mum radioactivity found during each month's samples
33
AFFDL-TR-63-185
lo-L
M.D. A. = Minimal Detectable Activity
The striped area of the bar graphs indicates the maxi- mum radioactivity found during each month's samples
31
AFFDL-TR-65-i85
M.D.A. = Minimal Detectable Activity
The striped area of the bar graphs indicates the maxi- mum radioactivity found during each month's samples
35

i AFFDL-TR-65-185
M.D.A. - Minimal Detectable Activity
The striped area of the bar graphs indicates the maxi- mum radioactivity found during each month's samples
36

AFFDL-TR-65-185
M.D.A. = Minimal Detectable Activity
The striped area of the bar graphs indicates the maxi- mum radioactivity found during each month's samples
37
AFFDL-TR-65-185
M.D. A. = Minimal Detectable Activity
The striped area of the bar graphs indicates the maxi- mum radioactivity found during each month's samples
38
AFFDL-TR-65-185
M.D.A. = Minimal Etetectable Activity
The striped area of the bar graphs indicates the maxi- mum radioactivity found during each month's samples
39

AFFDL-TR-65-185
M.D.A. = Minimal Detectable Activity
The striped area of the bar graphs indicates the maxi- mum radioactivity found during each month's samples
40
AFFDL-TR-65-185
M.D.A, = Minimal Detectable Activity
The striped area of the bar graphs indicates the maxi- mum radioactivity found during each month's samples
41
JI

AFFDL-TR-65-185
M.D.A. - Minimal Detectable Activity
The striped area of the bar graphs indicates the maxi- mum radioactivity found during each month's samples
42
-^
AFFDL-TR-65-185
M.D.A. = Minimal Detectable Activity
The striped area of the bar graphs indicates the maxi- mum radioactivity found during each month's samples
43
•^*>*>*mmmm ms"j.'
AFFDL-TR-65-185
M.D.A. = Minimal Detectable Activity
The striped area of the bar graphs indiciv^s the maxi- mum radioactivity found during each month's samples
44

AFFDL-TR-65-185
10
SEWAGE EFFLUENT - DAYTON
V/
wunm '/A
sm u im
M. D. A.
M J 1957 I 958 1959
M.D.A. = Minimal Detectable Activity
The striped area of the bar graphs indicates the maxi- mum radioactivity found during each month's samples
45

BLANK PAGE

AFFDL-TR-65-185
APPENDIX II
LOW-LEVEL RADIOACTIVITY MEASUREMENTS OF SITE SURVEY SAMPLES
Symbols
The following is a key to the code used for samples in the report from Nurlear Science and Engineering Corporation on Low-Level Radioactivity Measurements of Site Survey Samples, presented as Appendix IL
SAMPLE CODE
Soil S-l
S-7
S-8
S-9
S-10
S-ll
Water W-3
W-10
W-ll
W-12
W-13
W-16
W-17
Vegetation D
F
S
W
X
Y
SAMPLE AREA
Wright-Patterson Air Force Base
Fairborn
Springfield
Xenia
Yellow Springs
Dayton
Rohers Island (river)
Dayton Drinking Water
Fairborn Drinking Water
Springfield Drinking Water
Wright-Patterson Air Force Base
Xenia Drinking Water
Yellow Springs Drinking Water
Dayton Area
Fairborn Area
Springfield Area
Wright-Patterson Air Force Base
Xenia Area
Yellow Springs Area
47
AFFDL-TR-65-185
Symbols (Cont'd)
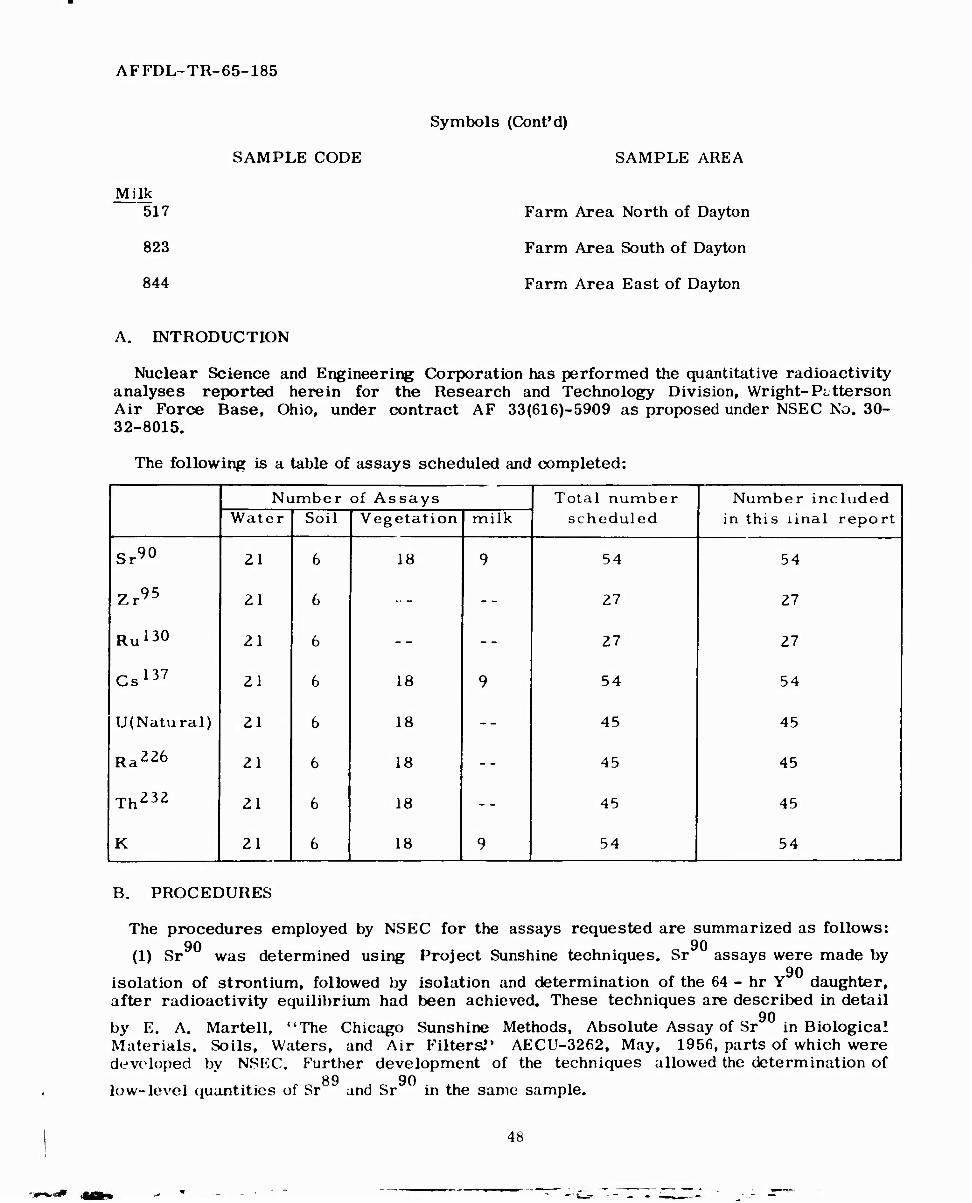
SAMPLE CODE SAMPLE AREA
Milk 517
823
844
Farm Area North of Dayton
Farm Area South of Dayton
Farm Area East of Dayton
A. INTRODUCTION
Nuclear Science and Engineering Corporation has performed the quantitative radioactivity analyses reported herein for the Research and Technology Division, Wright-Patterson Air Force Base, Ohio, under contract AF 33(616)-5909 as proposed under NSEC No. 30- 32-8015.
The following is a table of assays scheduled and completed:
Number of Assays Total number scheduled
Number included j in this linal report Water Soil I Vegetation milk
Sr^O 21 6 18 9 54 54
Zr^ 21 6 27 27 |
Rul30 j 21 6 27 27 |
Cs137 21 6 18 9 54 54 j
lU(Natural) 21 6 18 45 45 i
Ra"6 21 6 18 45 45 |
Th"2 21 6 18 45 45 j
K 21 6 i ,
18 1 9 54 l 54 j
B. PROCEDURES
The procedures employed by NSEC for the assays requested are summarized as follows: 90 90
(1) Sr was determined using Project Sunshine techniques. Sr assays were made by 90
isolation of strontium, followed by isolation and determination of the 64 - hr Y daughter, after radioactivity equilibrium had been achieved. These techniques are described in detail
90 by E. A. Martell, "The Chicago Sunshine Methods, Absolute Assay of Sr in Biological Materials, Soils, Waters, and Air Filters.'* AECU-3262, May, 1956, parts of which were developed by NSEC. Further development of the techniques allowed the determination of
89 90 low-level quantities of Sr and Sr in the same sample.
48
»

AFFDL-TR-65-185
137 137 (2) Cs was determined by isolation of cesium and measurement of Cs activity by
thick sample /3-counting.
95 95 (3) Zr was determined by isolation of zirconium and measurement of Zr activity, 95
free of Nb , by thick sample p-counting.
103 (4) Ru Was measured by thick sample /3-counting after chemical isolation of ruthenium i m i nfi i nfi
using RuO. distillation. The assay for Ru was corrected for the Ru - Rh present
in the sample from measurements of the Rh , maximum beta energy of 3.5 Mev, counted 103 thru an absorber thick to the Ru , maximum energy of 80 percent abudant beta of 0.22
Mev.
(5) Total potassium was determined by flame photometric methods with a Beckman flame-photometer.
(6) The weight concentration of uranium was determined by fluormetric techniques. The isotopic abundances for natural urarftum and their appropriate decay constants were used to convert to radioactivity concentrations.
(7) Radium was determined after chemical separations using barium as a carrier. Ra and its disintegration products in non-emanating Ba SO. were counted in NSEC's low back-
ground a -scintillation counter, specially designed for this work.
233 (8) Thorium was determined by isolating and measuring the Pa resulting from the activation of part of the samples in the Brookhaven National Laboratory Reactor.
49
J - ' -i. ■f-

AFFDL-TR-65-185
C. RESULTS
Seven Water Samples assayed in triplicate for radium, uranium, thorium and potassium.
Sample Aliquot Radium fjc/cm
Uranium pc/cm
Thorium (jr / c m
Potas smm |
mg/cm-' \
W3 - 1 <0.7 x lj"9 i.7 ± 0. 3 x 10' C ' < 1 x 10"9 3 . 18 d- 0 . 1 2 x io-3
1 < 0. 4 :, 3 ± 0. 3 < i 3.03 ± 0. 16 3 < 0. 8 1. 7 ± 0 3 < 1 2.77 ± 0. 20
W10 1 < 0. 3 < 0. 4 < 1 3. 05 ± 0. 12
Z < 0. 4 < 0. 3 < 1 3.12 ± 0. 12
3 ^ 1. 2 < 0. 3 < 1 3. 00 ± 0. 15
Wll 1 < 0.6 0.4 ± 0.2 < 1 2. 38 ± 0. 12 2 < 0. 5 < 0 4 < 1 2 20 ± 0. IS
3 < 0. 3 0.4 ± 0.2 | < 1 2.48 ± 0 12
W12 1 < 1.5 1.6 ± 0. 3 i < 1 1,89 ± 0 12 2 < 2.0 1.6 ± 0. 3 | < 1 1,65 ± U, 12 3 < 1. 5 2. 3 ± 0.4 < 1 1.83 ± 0. 12
W13 1 < 2.5 < 0. ^ < 1 1. 45 ± 0. 10 2 < 2.5 0.4 ± 0.2 < 1 1.6 3 ± 0. 10 3 < 4 < 0. 3 < 1 1 63 ± 0. 10
W16 I < 1.5 < 0. 3 < z 1. 34 ± 0. 10 2 < 4 < 0.4 < 2 1.78 ± 0. 10 3 < 1.5 < 0. 3 < 2 1.80 ± 0. 10
W17 1 < 1.0 2.7 ± 0.4 < 2 1. 77 ± 0. 10 2 < 1. 0 2. 1 ± 0.4 < 2 1. 63 ± 0. 10 i
3 < 0. 6 2. 3 ± 0.4 < 2 1.89 ± 0. 12 !
50
w
AFFDL-TR-65-185
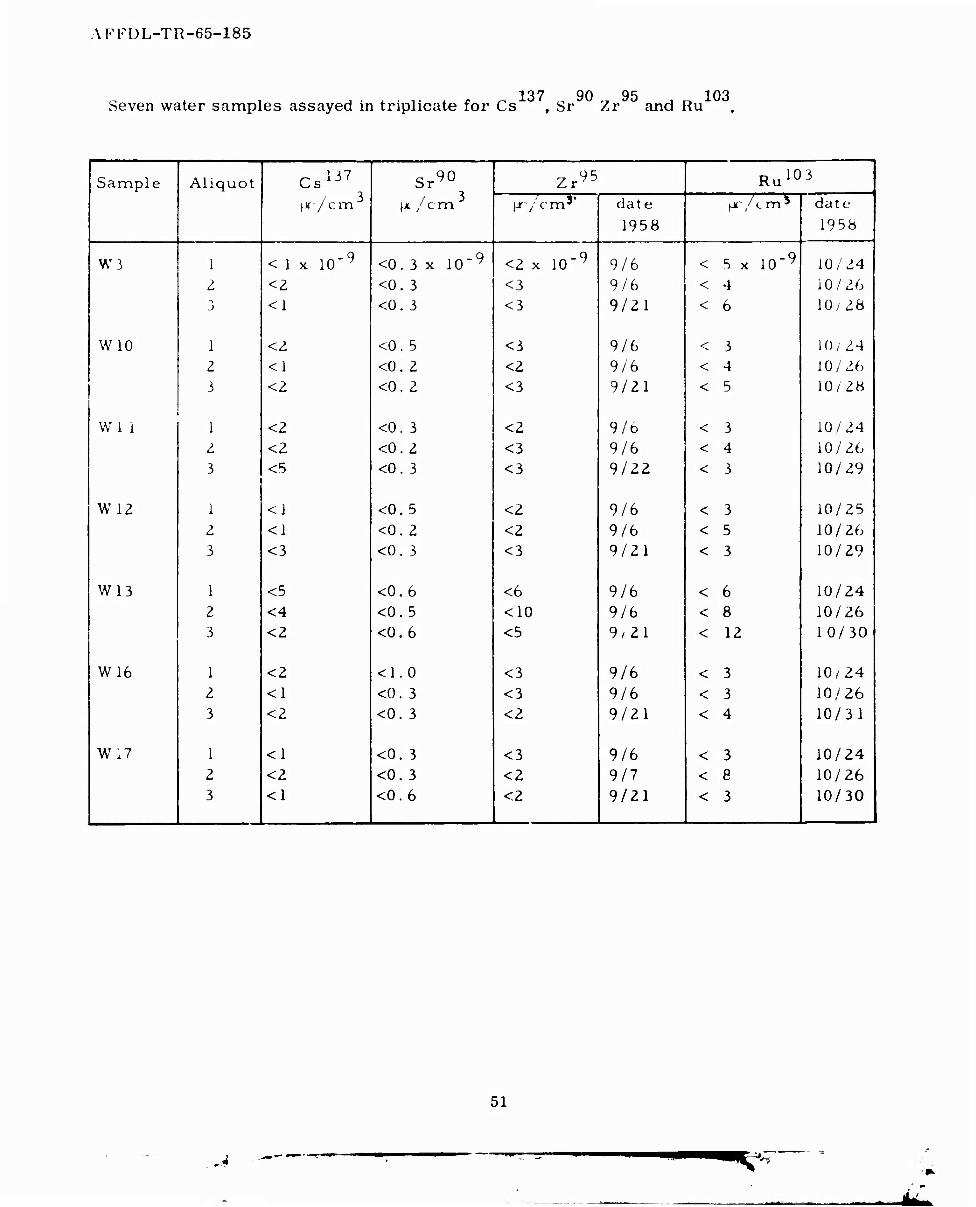
137 90 95 103 Seven water samples assayed in triplicate for Cs , Sr Zr and Ru
Sample Aliquot Cs137
pr/cm
Sr^O He/cm
Zr95 Ru103 1 3' \x / cm* date pr / c m ^ date 1
1958 1958
W3 1 < 1 x ID"9 <0.3 x IG'9 <2 x 10'9 9/6 < 5 x 10'9 10/24 2 <2 <0. 3 <3 9/6 < 4 10/26 S <1 <0. 3 <3 9/21 < 6 10/28
WIG 1 <2 <0. 5 <3 9/6 < 3 10/24 I <1 <0. 2 <2 9/6 < 4 10/26 3 <2 <0.2 <3 9/21 < 5 10/28
Wl i 1 <2 <0. 3 <2 9/6 < 3 10/24 I <2 <0.2 <3 9/6 < 4 10/26 3 <5 <0. 3 <3 9/22 < 3 10/29
W12 1 <1 <0.5 <2 9/6 < 3 10/25 Z <1 <0. 2 <2 9/6 < 5 10/26 3 <3 <0. 3 <3 9/21 < 3 10/29
W13 1 <5 <0.6 <6 9/6 < 6 10/24 2 <4 <0.5 <10 9/6 < 8 10/26 3 <2 <0.6 <5 9/21 < 12 10/30
W16 1 <2 <1.0 <3 9/6 < 3 10/24 2 <1 <0. 3 <3 9/6 < 3 10/26 3 <2 <0. 3 <2 9/21 < 4 10/31
WI7 1 <1 <0. 3 <3 9/6 < 3 10/24 2 <2 <0. 3 <2 9/7 < 8 10/26 3 <1 <0.6 <2 9/21 < 3 10/30
51
.* -—
AFFDL-TR-65-185
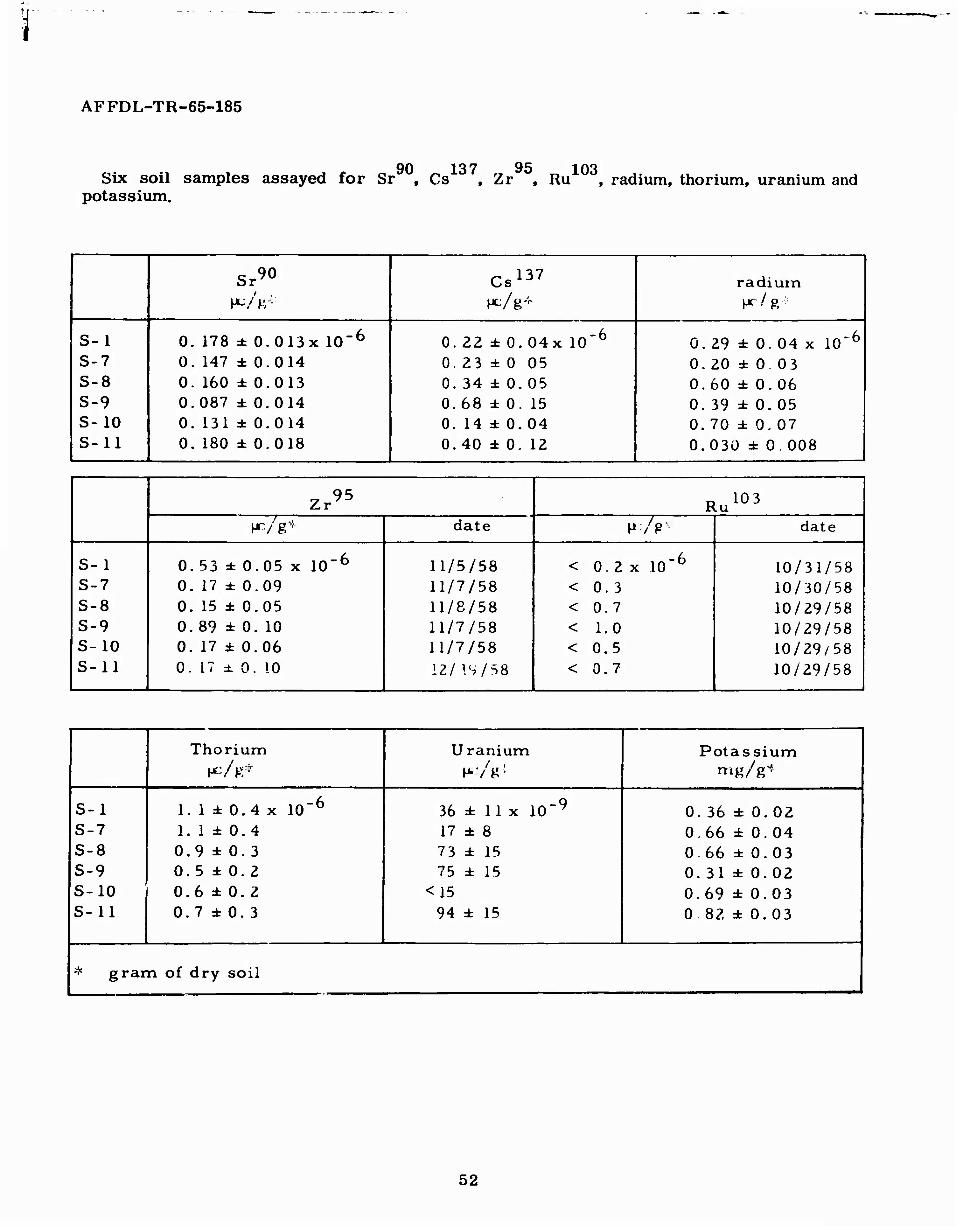
90 137 95 Six soil samples assayed for Sr , Cs , Zr , Ru , radium, thorium, uranium and potassium.
Sr«** Cs137 radium M^/ K ■ Hc/g* Hr/g
S-1 0. 178 ± 0.013x 10'6 0. 22 ± 0.04x 10"6 0. 29 ± 0. 04 x 10' 6
S-7 0. 147 ± 0.014 0. 23 ± 0 05 0.20 ± 0 03 S-8 0. 160 ±0.013 0. 34 ± 0.05 0.60 ± 0. 06 S-9 0.087 ± 0.014 0.68 ± 0. 15 0.39 ± 0.05 S- 10 0. 131 ±0.014 0. 14 ± 0.04 0.70 ± 0. 07 S-11 0. 180 ± 0.018 0.40 ± 0. 12 0.030 ± 0 008
Zr95 B 103 i .u
H^/g^ date M-/V' date 1
S-1 0.53 ± 0.05 x 10~6 11/5/58 < 0.2 x 10"6 10/31/58 S-7 0. 17 ± 0.09 11/7/58 < 0. 3 10/30/58 S-8 0. 15 ± 0.05 11/8/58 < 0.7 10/29/58 S-9 0.89 ± 0. 10 11/7/58 < 1.0 10/29/58 S-10 0. 17 ± 0.06 11/7/58 < 0.5 10/29/58 S-11 0. 17 ± 0. 10 12/ IS/38 < 0.7 10/29/58
Thorium U ranium Potassium [ K;/g* M-'/g1 mg/g-*
S-1 1. 1 ± 0.4 x 10"6 36 ± 11 x 10"9 0.36 ±0.02 | S-7 1. 1 ± 0.4 17 ± 8 0.66 ±0.04 S-8 0.9 ± 0.3 73 ± 15 0.66 ± 0.03 | S-9 0.5 ± 0.2 75 ± 15 0.31 ±0.02 S-10 0.6 ± 0.2 <15 0.69 ±0.03 S-11 0.7 ± 0.3 94 ± 15 0 82 ± 0.03
* grar n of dry soil
52
AFFDL-TR-65-185
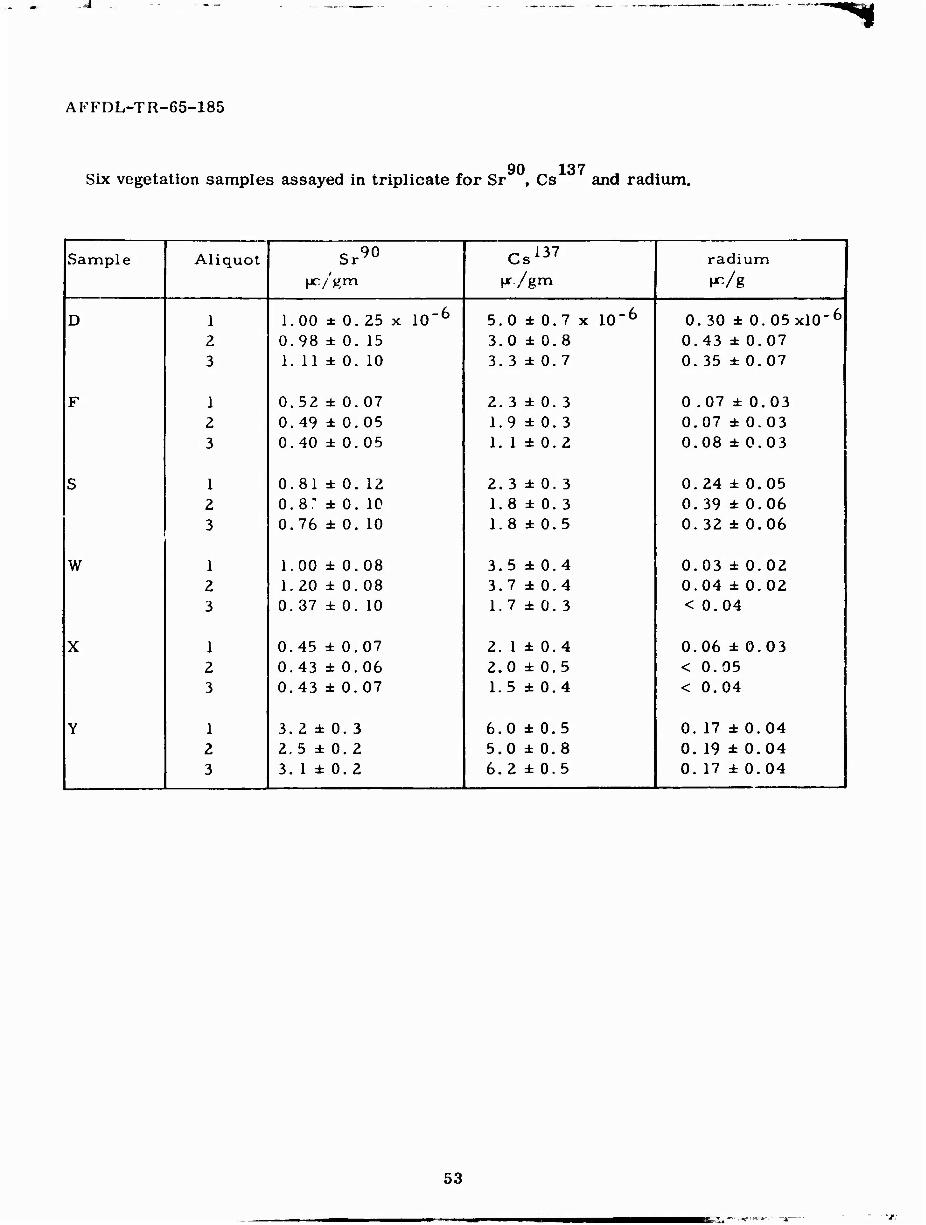
90 137 Six vegetation samples assayed in triplicate for Sr , Cs ^ and radium.
Sample Aliquot Sr90 Cs137 radium | [jc/gm Hr/gm H^/g
P 1 1.00 ± 0. 25 x ID-6 5.0 ± 0.7 x IG-6 0.30 ± 0.05xl0-6
2 0.98 ± 0. 15 3.0 ±0.8 0.43 ±0.07 3 1. 11 ± 0. 10 3. 3 ± 0.7 0. 35 ±0.07
F 1 0.52 ± 0.07 2.3 ± 0. 3 0 .07 ± 0.03 1 2 0.49 ± 0.05 1.9 ±0.3 0.07 ±0.03 I 3 0.40 ± 0.05 1. 1 ± 0.2 0.08 ±0.03 1
S 1 0.81 ± 0. 12 2.3 ± 0. 3 0.24 ±0.05 j 2 0.8: ±0. 10 1.8 ± 0. 3 0.39 ±0.06 ! 3 0.76 ± 0. 10 1.8 ± 0.5 0. 32 ±0.06 |
W 1 1.00 ± 0.08 3.5 ±0.4 0.03 ±0.02 j 2 1.20 ± 0.08 3.7 ±0.4 0.04 ±0.02 j 3 0.37 ± 0. 10 1.7 ±0.3 <0.04
X 1 0.45 ± 0.07 2. 1 ± 0.4 0.06 ±0.03 1 2 0.43 ± 0.06 2.0 ±0.5 < 0.05 | 3 0.43 ± 0.07 1.5 ±0.4 < 0.04 |
Y 1 3.2 dt 0. 3 6.0 ± 0.5 0. 17 ±0.04 | 2 2.5 ± 0. 2 5.0 ±0.8 0. 19 ±0.04 3 3. 1 ± 0.2 6.2 ± 0.5 0. 17 ± 0.04
53
■i."..
AFFDL-TR-65-185
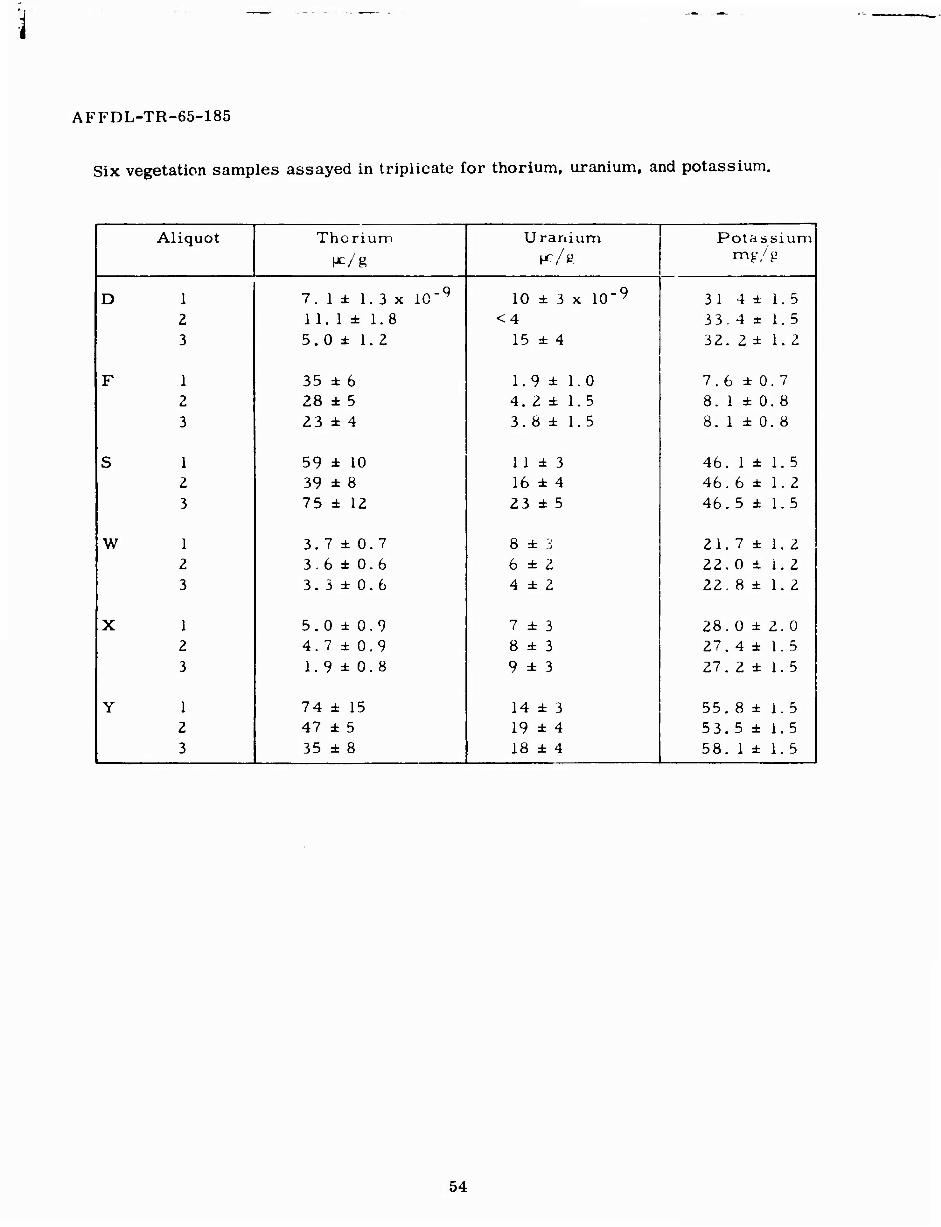
Six vegetation samples assayed in triplicate for thorium, uranium, and potassium.
! Aliquot Thorium Uranium Potassium mg/g |
P 1 2 3
7. 1 ± 1. 3 x 10⁻⁹
11. 1 ± 1.8 5.0 ± 1.2
10 ± 3 x 10~9
<4 15 ± 4
31 4 ± 1. 5 1 33. 4 ± 1. 5 ! 32. 2 ± 1.2 j
F 1 2 3
35 ± 6 28 ± 5 23 ± 4
1.9 ± 1.0 4. 2 ± 1.5 3.8 ± 1.5
7.6 ± 0. 7 8. 1 ± 0.8 | 8. 1 ± 0. 8
S 1 2 3
59 ± 10 39 ± 8 75 ± 12
11 i 3 16 ± 4 23 ± 5
46. 1 ± 1.5 46.6 ± 1. 2 46. 5 ± 1.5 !
W 1 2 3
3.7 ± 0.7 3.6 ± 0.6 3.3 ± 0.6
8 ± 3 6 ± 2 4 ± 2
21. 7 ± 1. 2 | 22. 0 ± i. 2 ! 22. 8 ± 1. 2 I
X 1 2 3
5.0 ± 0.9 4.7 ± 0.9 1. 9 ± 0.8
7 ± 3 8 ± 3 9 ± 3
28.0 ± 2. 0 27.4 ± 1. 5 27. 2 ± 1. 5
Y 1 2 3
74 ± 15 47 ± 5 35 ± 8
14 ± 3 19 ± 4 18 ± 4
55.8 ± 1.5 53. 5 ± 1.5 I 58. 1 ± 1.5
54

AFFDL-TR-65-185
90 137 Three milk sample assayed in triplicate for Sr , Cs and potassium.
Sample Aliquot Potassium % ash WC Sr90/ß Ca
137, I4JC Cs /rn^: K
517 1 18 ± 2 5. 1 ± 0.5 11 ± 3 i 2 18 i 2 3.5 ± 0.6 11 ± 3 3 19 ± 2 5.0 ± 0.6 <15
823 1 18 ± 2 7.0 ± 0.7 59 ± 10 2 17 ± 2 5. 2 ± 0.9 59 ± 10 i 3 17 ± 2 6. 3 ± 0.8 77 ± 8 |
844 1 16 ± 2 4.0 ± 0.7 37 ± 7 2 17 ± 2 2.7 ± 0.7 <60 3 17 ±2 3.7 ± 0.5 43 ± 13 |
D. Discussion of errors
The errors given in the tables of results are the standard deviations of the final result for a single determination.
90 95 103 137 For Sr , Zr , Ru , Cs , radium and thorium, this error consists of:
(1) counting error; varies from ± 3 to 50 percent as a function of the quantity of species to be determined in the original sample.
(2) chemical yield determination; estimated ± 3 percent
(3) calibration error used in correcting counting rate of counted sample to disintegration rate; ± 3 to 8 percent, depending on species.
For uranium and total potassium this error is a measure of the precision of replicate concentration measurements by direct comparison with a standard concentration.
Where a result is listed as less than a given value, this value represents the upper limit at the 2<T(95%) confidence level. Assays with a counting error of greater than ± 50 percent are reported in this manner.
55

-•
i
BLANK PAGE
n
k *Z-JStBmmmi*mtmmmmmmamaÜaii

UnnlasHified Security Classification
DOCUMENT CONTROL DATA • R&D (Security clatmilicallon ol Hit», body ol abmtract and indexing annotation muat ba entered when the overall report ia ctaaeilied)
I OmniNATIN G ACTIVITY (Corporate author)
FDFN
2a REPORT SECURITY CLASSIFICATION
Unclassified 2b CROUP
3 REPORT TITLE
Environmental Radioactive Background Survey for the Air Force Nuclea. Engineering Test Facility
4 DESCRIPTIVE NOTES (Type ol report and Incluaive datea)
Final 1 June 1957 to 30 June 1959. 5 AUTHORCS; rZ.a«r name, lirat name. Initial)
Lintz, David O.
6 REPORT DATE
December 1965 la. TOTAL NO. OF PASES
55 7b. NO. OF REFS
8« CONTRACT OR GRANT NO.
b. PROJECT NO. 7001
c Task 700117
9a. ORIGINATOR** REPORT NUMBERfS.)
AFFDL-TR-65-185
9b. OTHER NKPORT uo(S) (Any other number» Html may ba maalgnad Oil» report)
10 A VAIL ABILITY/LIMITATION NOTICES
Distribution of this document is unlimited.
11 SUPPLEMENTARY NOTES 12 SPONSORING MILITARY ACTIVITY
13 ABSTRACT
This environmental radioactive background survey was an attempt to establish a base line of the normally occurring radioactivity in the fauna and flora of a particular area sub- sequent to the operation of a reactor which will release additional radioactivity to the environment. The Health Physics Office of the AF NETF has collected samples of water, soil, air, sewage, milk, biological life and vegetation in a 20 mile radius of the AF NETF site and analyzed the samples for alpha, beta and gamma activity. The results of the analyses over the period of the report are given in graphic form to facilitate making comparison of the fluctuations in the normal background. The wide variations were due to the atom bomb testing not onlj in the United States but throughout the world. The tests especially noticeable are the result of the last half quarter of 1958 when the atom oomb testing was at a peak.
Future samples taken from the same areas will be analyzed when the reactor becomes operational. Comparison then can be made to determine any increased activity which may be attributable to the AF Nuclear Reactor operation.
In order to obtain certain quantitative analyses of the radioactive content of the various samples collected a contract was awarded the Nuclear Science and Engineering Corpora- tion of Pittsburgh, Pennsylvania. The result of their work will be found in Appendix II of the report.
.
DD /^ 1473 Unclassified Security Classification

Unclassified Security Classification
u KEY «ORDJ
LINK A LINK B LINK C
ROLE WT
Background Radioactivity of E nvi ronmental
INSTRUCTIONS 1. ORIGINATING ACTIVITY: Enter the name and address of the contractor, subcontractor, grantee, Department of De- fense activity or other organization (corporate author) issuing the report. 2a. REPORT SECUHTY CLASSIFICATION: Enter the over- all security classification of the report. Indicate whether "Restricted Data" is included. Marking is to be in accord- ance with appropriate security regulations. 2h. GROUP: Automatic downgrading is specified in DoD Di- rective 5200.10 and Ar.ned Forces Industrial Manual. Enter the group number. Also, when applicable, show that optional markings have been used for G'oup 3 and Group 4 as author- ized.
3. REPORT TITLE: Enter the complete report title in all capital letters. Titles in all cases should be unclassified. If a meaningful title cannot be selected without classifica- tion, show title classification in all capitals in parenthesis immediately following the title. 4. DESCRIPTIVE NOTES: If appropriate, epter the type of report, e.g.. interim, progress, summary, annual, or final. Give the inclusive dates when a specific reporting period is covered. 5. AUTHOR(S): Enter the naine<s) of authoKs) as shown on or in the report. Enter last name, first name, middle initial. If n-.ilitary, show rank and branch of service. The name of the principal outhor is an absolute minimum requirement. 6. REPORT DATE; Enter the date of the report as day, month, year, or month, year. If more than one date appears on the report, use date of publication. 7a. TOTAL NUMBER OF PAGES: The total page count should follow normal pagination procedures, i.e., enter the number of pages containing information. 7b. NUMBER OF REFERENCES: Enter the total number of references cited in the report. Sa. CONTRACT OR GRANT NUMBER: If appropriate, enter the applicable number of the contract or grant under which the report was written. 8b, 8c, & 8cf. PROJECT NUMBER: Enter the appropriate military department identification, such as project number, subproject number, system numbers, task number, etc 9a. ORIGINATOR'S REPORT NUMBER(S): Enter the offi- cial report number by which the document will be identified and controlled by the originating activity. This number must be unique to this report. Ob. OTHER REPORT NUMBER(S): If the report has been assigned any other report numbers (either by the originator or by the sponsor), also enter this numbers). 10. AVAILABILITY/LIMITATION NOTICES: Enter any lim- itations on further dissemination of the report, other than those
imposed by security classification, using standard statements such as:
(1) "Qualified requesters may obtain copies of this report from DDC"
(2) "Foreign announcement and dissemination of this report by DDC is not authorized."
(3) "U. S. Government agencies may obtain copies of this report directly from DDC. Other qualified DDC users shall request through
(4) "U. S. military agencies may obtain copies of this report directly from DDC. Other qualified users shall request through
(5) "All distribution of this report is controlled. Qual- ified DDC users shal' request through
If the report has been furnished to the Office of Technical Services, Department of Commerce, for sale to the public, indi- cate this fact and enter the price, if known. 11. SUPPLEMENTARY NOTES: Use for additional explana- tory notes. 12. SPONSORING MILITARY ACTIVITY: Enter the name of the departmental project office or laboratory sponsoring (pay- ing for) the research and development. Include address. 13. ABSTRACT: Enter an abstract giving a brief and factual summary of the document indicative of the report, even though it may also appear elsewhere in the body of the technical re- port. If additional space is required, u continuation sheet shall be attached.
It is highly desirable that the abstract of classified reports be unclassified. Each paragraph of the abstract shall end with an indication of the military security classification of the in- formation in the paragraph, represented as (TS). (S), (C). or (U\.
There is no limitation on the length of the abstract. How- ever, the suggested length is from ISO to 225 words.
14. KEY WORDS: Key words are technically meaningful terms or short phrases that characterize a report and may be used as index entries for cataloging the report. Key words most be selected so that no security classification is required. Identi- fiers, such as equipment model designation, trade name, military project code name, geographic location, may be used as key words but will be followed by an indication of technical con- text. The assignment of links, rules, and weights is optional.
Unclassified Security Classification