environmental protection and energy conservation639882/fulltext01.pdf · “environmental...
TRANSCRIPT

BACHELOR THESIS
Spring 2013
Environmental protection and
energy conservation Hybrid vehicles and combustion
vehicles
Authors
Cao Yue
Lin Bin
Liang Li
Scientific Supervisor
Christer Nilsson
Language Supervisor
Pernilla Carlsson
Examiner
Christer Nilsson
2
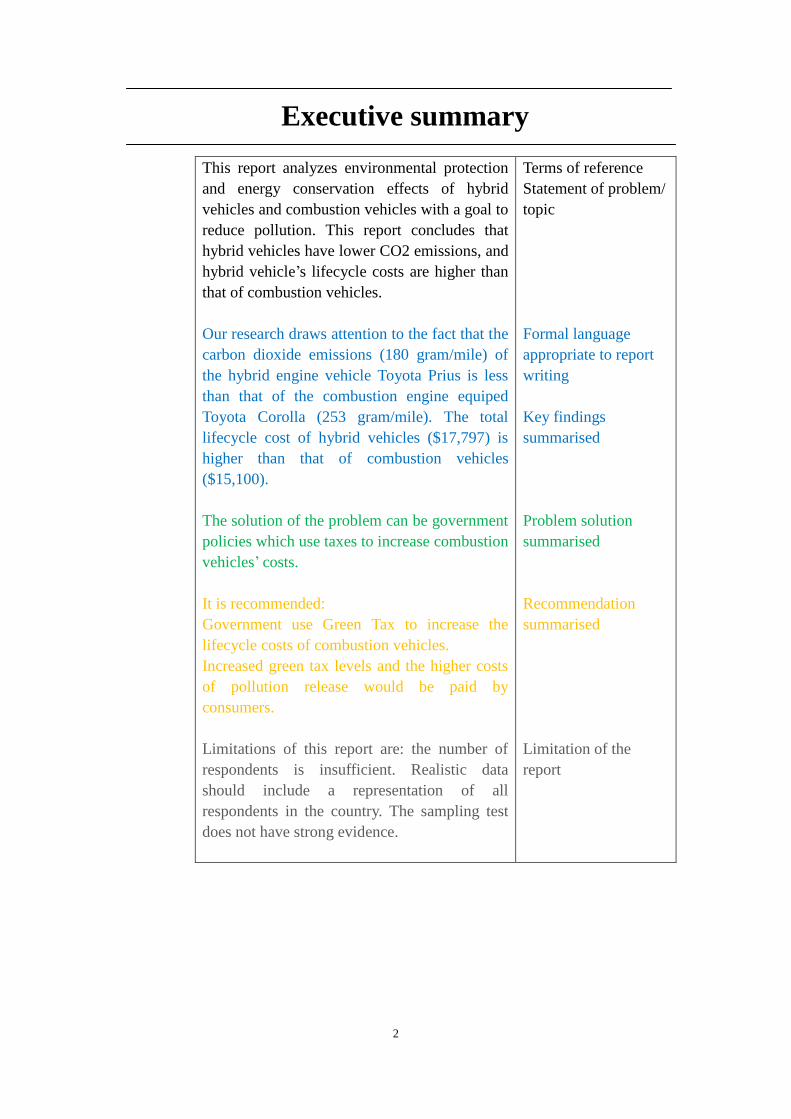
Executive summary
This report analyzes environmental protection
and energy conservation effects of hybrid
vehicles and combustion vehicles with a goal to
reduce pollution. This report concludes that
hybrid vehicles have lower CO2 emissions, and
hybrid vehicle’s lifecycle costs are higher than
that of combustion vehicles.
Our research draws attention to the fact that the
carbon dioxide emissions (180 gram/mile) of
the hybrid engine vehicle Toyota Prius is less
than that of the combustion engine equiped
Toyota Corolla (253 gram/mile). The total
lifecycle cost of hybrid vehicles ($17,797) is
higher than that of combustion vehicles
($15,100).
The solution of the problem can be government
policies which use taxes to increase combustion
vehicles’ costs.
It is recommended:
Government use Green Tax to increase the
lifecycle costs of combustion vehicles.
Increased green tax levels and the higher costs
of pollution release would be paid by
consumers.
Limitations of this report are: the number of
respondents is insufficient. Realistic data
should include a representation of all
respondents in the country. The sampling test
does not have strong evidence.
Terms of reference
Statement of problem/
topic
Formal language
appropriate to report
writing
Key findings
summarised
Problem solution
summarised
Recommendation
summarised
Limitation of the
report

3
Abstract
Purpose/aim This study is about environmental protection and energy conservation in
the China vehicle market. Based on that, we focus on and comparison of combustion
vehicles with hybrid vehicles.
Design/method/approach Data was collected through questionnaire. The analysis
includes a description of the sample and chi-square tests. We analyze two different
particular engines (combustion engine vehicles and hybrid electric vehicles) and our
single environment. We compare these two engine vehicles, and analyze the trends of
the market. We use scientific data and existing theories to analyze the vehicles,
including “lifecycle costs” “CO2 emissions”, “Greenhouse gas”, “Consumers
perception”, “Full Costing”, “PPC (Production Possibilities Curve)”, “Supply
Demand Curve”, and “Green Taxes”.
Findings We conclude that hybrid engine vehicles are environmentally friendly and
energy conserving, but they have higher lifecycle costs. The analysis also shows that
different ages, education levels and regions affect the customers’ preferences for these
two kinds of vehicles.
Originality/value Our original idea is the problems of hybrid vehicles and how to
support and popularize hybrid vehicles depends on the exact national conditions and
policies implemented. However, consumers might not be able to accept the
“environmental protection and energy conservation” concept immediately, because
it’s difficult to change the consumption concept of a generation or culture. Therefore,
the government should carry out policies that are suitable for their local region to
update the consumption concepts of the consumers and promote the new energy
vehicles. Thus, the goal of environmental protection and energy conservation can be
reached.
Key words: Environmental protection, energy conservation, combustion vehicles,
hybrid vehicles, new energy and greenhouse gas emission.

4
Table of Contents
Ch.1 Introduction .......................................................................................................................... 7
Ch.2 Background ............................................................................................................................ 9
2.1 Problem .............................................................................................................................................. 10
2.2 Problem description ..................................................................................................................... 10
2.3 Research purpose ........................................................................................................................... 11
2.4 Limitation .......................................................................................................................................... 11
2.5 Outline ................................................................................................................................................ 12
2.6 Research question .......................................................................................................................... 12
Ch.3 Literary Review .................................................................................................................. 13
3.1 Lifecycle cost of hybrid vehicles ............................................................................................... 13
3.2 The supply and future price trend of oil ............................................................................... 14
3.3 Polluting gas emissions................................................................................................................ 14
3.4 Greenhouse gas emissions ......................................................................................................... 15
3.5 The trend of CO2 and N2O emissions .................................................................................... 16
3.6 Consumers’ perceptions .............................................................................................................. 16
Ch.4 General Hypothesis .......................................................................................................... 17
Ch.5 Research Method .............................................................................................................. 19
5.1 Introduction ..................................................................................................................................... 19
5.2 Research philosophy ..................................................................................................................... 19
5.3 Research approaches .................................................................................................................... 20
5.4 Research strategies ........................................................................................................................ 20
5.5 Time horizons .................................................................................................................................. 20
5.6 Data collection method and calculation method ............................................................... 20
5.7 Sampling ............................................................................................................................................ 21
Ch.6 Theory .................................................................................................................................... 23
6.1 The distribution of the market ................................................................................................. 23
6.2 Full Costing ....................................................................................................................................... 23
6.3 PPC (Production Possibility Curve) ........................................................................................ 25
6.4 Green Taxes ....................................................................................................................................... 26
6.5 Supply Demand Curve .................................................................................................................. 27
Ch.7 Empirics ................................................................................................................................. 29
7.1 Hypothesis of different age of consumers ........................................................................... 29
7.2 Hypothesis of different education of consumers .............................................................. 31
7.3 Hypothesis of different location of consumers .................................................................. 33
Ch.8 Results .................................................................................................................................... 36
Ch.9 Analysis .................................................................................................................................. 42

5
Ch.10 Discussion .......................................................................................................................... 45
Ch.11 Conclusion ......................................................................................................................... 46
References ....................................................................................................................................... 48
Appendices ..................................................................................................................................... 50

6
List of Tables
Table 3.1 Example manufacturing cost and retail price ........................................................ 13
Table 3.2 Vehicle attributes and exhaust emission .................................................................. 15
Table 7.1 Data (different ages and cars) in survey .................................................................. 29
Table 7.2 Data (different educations and cars) in survey ..................................................... 32
Table 7.3 Data (different locations and cars) in survey ......................................................... 34
Table 9.1 Statistics of ages in survey ............................................................................................. 42
Table 9.2 Age of Statistics in survey ............................................................................................... 43
Table 9.3 Education of Statistics in survey .................................................................................. 43
Table 9.4 Education of Statistics in survey .................................................................................. 43
Table 9.5 Region of Statistics in survey ........................................................................................ 44
Table 9.6 Region of Statistics in survey ........................................................................................ 44
List of Figures
Figure 3.1 Greenhouse Gas emissions .......................................................................................... 16
Figure 5.1 Research process onion ................................................................................................. 19
Figure 6.1 The distribution of the market ................................................................................... 23
Figure 6.2 Full Costing ......................................................................................................................... 24
Figure 6.3 Production Possibility Curve ....................................................................................... 25
Figure 6.4 Optimal (Pigovian) pollution tax ............................................................................... 26
Figure 6.5 Supply Demand Curve .................................................................................................... 27
Figure 8.1 The distribution of age group ..................................................................................... 36
Figure 8.2 The distribution of respondents (map) .................................................................. 37
Figure 8.3 The distribution of respondents (bar graph) ....................................................... 38
Figure 8.4 The distribution of education levels (bar graph)................................................ 39
Figure 8.5 The distribution of education levels (line graph) ............................................... 40
Figure 8.6 Illustration of the combined surveyed data .......................................................... 41

7
Ch.1 Introduction
In this part of the dissertation, we present the situation of air pollution and hybrid
electric vehicles in China.
The majority of vehicles on the road in 2010 were conventional vehicles based on
internal-combustion engines. The biggest advantage of the conventional vehicles is
that the oil based fuels can enable them to achieve high performance over a long
range. However, their excessive dependence on oil and their low efficiency bring
serious greenhouse gas emissions, has led to increasing concern over their negative
environmental and economic impacts (Doucette, & McCulloch, 2011). CO2 emissions
of vehicles result in air pollution which is a serious environmental problem in the
world, especially in the developing countries like China. In China most cities suffer
from poor air quality, which has received increasing attention in the past decade. The
growth of the number of cars in the world is expected to increase more than fourfold
by 2050 to 3 billion, and more efficient and less oil-dependent means of transportation
are being increasingly investigated (Montzka, Dlugokencky, & Butler, 2011).Due to
the number of vehicles increasing, many governments promote adoption of hybrid and
electric vehicles as an important part of the combination of technologies required for
reducing greenhouse gas emissions and energy use. Recent interest in climate policy
has resulted in many of the biggest automobile producers increasing production of
hybrid vehicles such as the Honda Civic and Insight Hybrids, Chevrolet Malibu
Hybrid, and the Mercedes-Benz S400 Hybrid. Toyota Prius and Ford Fusion Hybrid
are full hybrids (Hawkings, Gausen, & Stromman, 2010) Efficiency in the use of the
modern hybrid electric vehicles is increasing. Compared to a conventional internal
combustion engine vehicle, hybrid electric vehicles can improve fuel economy and
lower greenhouse gas and tailpipe emissions. In a world of limited resources and
many petroleum users and emissions sources, the policy question is whether the best
use of resources is to build hybrids, to improve the fuel economy and environmental
emissions from other mobile sources, or to devote the resources to other

8
environmental projects (Lavea, & MacLeanb, 2002). Our study is about lifecycle cost
of vehicles and consumers’ perceptions. However, as a result of the high total costs of
maintenance, battery, CO2 emissions, fuel economy, the price of the hybrid vehicles is
higher than that of combustion vehicles. Due to this situation we try to find out how
the Chinese government could solve the high cost problem through subsidies and
taxes, in order to control the production and popularize hybrid vehicles.

9
Ch.2 Background
We present the basic background of hybrid vehicles and combustion vehicles, Problem,
Problem description, General hypothesis, Research purpose, Limitation, Outline, and
research.
Currently, the vehicle market is mainly divided into two parts which are hybrid
vehicles and combustion vehicles. In our study, we categorize a hybrid vehicle is a car
that through the rational use of technology and natural resources consumes a
minimum of energy and prevents environmental pollution and destruction. A
combustion vehicle is a car that uses some kind of fuel oil as the only energy power.
Hybrid vehicles include electric vehicles, natural gas vehicles, hybrid electric vehicles,
where the vehicle can use a mix of electric, gas, ethanol so that is not exclusively
powered by combustion. Hybrid vehicles are characterized by decreases in pollution.
For example, electric vehicles discharge almost zero exhaust gas, exhaust emissions
from natural gas vehicles are much lower than that of gasoline cars, and hybrid
vehicles can reduce the air pollution in urban areas. Combustion vehicles mainly use
internal-combustion engines, such as gasoline engines or diesel engines, as their
motor. As with heat engines, their energy source is generated by the combustion of
fuels, such as diesel oil, petrol and so forth. In other words, the substance that
contains chemical energy is converted into thermal energy first and then transformed
to mechanical energy. After the thermal expansion and the pressure increases, the
combustion gas generated by the mixture of fuel with air will work through
mechanical means. The motor draws in fresh gases and emits combustion gases.
However, combustion vehicles will reduce energy consumption but will lead to higher
CO2 emissions. The present issues of vehicles are environmental protection, energy
conservation and safety (Yee & San, 2011). Because nowadays the pollution of the
environment and the limitation of energy conservation is becoming a big issue, hybrid
vehicles have become popular. Due to the low costs of maintenance and fuel economy,
combustion vehicles can meet the needs of the low income family. To help hybrid

10
vehicles enter the market you need reasonable price adjustments to attract more
consumers, in order to reach the final goal, which is to reduce limited energy
consumption. That energy-saving vehicles protect the environment, as defined by Yi,
Hao, & Tang (2006) is relevant. The release of CO2 is reduced, thus hybrids attain
environmental protection. Hybrid electric vehicles are better for environmental
protection and energy sustainable development, but the costs are high. (Lipman &
Delucchi, 2006). With this background information, we will analyze the occurring
problems with methods that are “Full Costing”, “Production Possibilities Curve”,
“Green tax”, “supply demand curve” and “Questionnaire by statistics and theories”.
Besides, we will also recommend hybrid vehicles to the Chinese government to
support the environmental protection of the air.
2.1 Problem
Because hybrid vehicles are using electric, gas, hybrid and ethanol, they effectively
reduce CO2 emissions and support sustainable energy. Combustion vehicles only use
fuel oil and release CO2 and consume non-renewable energy. It is well supported (Yee
& San, 2011) that hybrid vehicles are better for environmental protection and energy
conservation. Efficiency in the use of the modern hybrid electric vehicles is increasing.
“However, they are inherently more complicated and expensive” (Lave, Hendrickson
& McMichael, 1995, p.993.).
2.2 Problem description
Due to different technologies and operation principles, hybrid vehicles and
combustion vehicles have different lifecycle costs. The problem of these costs argues
against economic growth and environmental sustainability. Compared to a
conventional internal combustion engine vehicle, hybrid electric vehicles can improve
fuel economy and lower greenhouse gas and tailpipe emissions. Hybrid vehicles
reduce the release of carbon dioxide and noise, thus in the area that they are used
hybrid vehicles contribute more to environmental protection than combustion vehicles.
There are not enough fuel resources. In the future the fuel will be used up. Hybrid

11
vehicles are not only dependent on fuel oil as their only energy power. The number of
cars worldwide may increase by four times. More transportation relies on fuel oil as a
nonrenewable energy (Doucette & McCulloch, 2011). But hybrid vehicles use
renewable energy. Thus hybrid vehicles reach energy conservation. Hybrids require
larger batteries than conventional combustion engine vehicles. Besides, hybrid
vehicles transfer society costs (air pollution, noise, and limited energy consumption)
to private costs (costs of production and sales price). Hybrid vehicles are better for
environmental protection and energy conservation, but the costs are higher (Lipman &
Delucchi, 2006). However, different consumers’ perceptions decide their consumption
(Yee & San, 2010).
2.3 Research purpose
In this thesis we talk about the current vehicles market and fuel oil source. From
scientific data, we found that the lifecycle costs of hybrid vehicles have higher market
prices than combustion vehicles. However, the gaseous emissions prove that hybrid
vehicles are better for environmental protection. In addition, the supply and future
trend of oil argue that hybrid vehicles are good for energy conservation. On the other
hand, combustion vehicles have higher emissions and energy consumption. Based on
this, we collect data from different consumers through a questionnaire and use
statistical methods to figure out the connections between products and consumers. We
also study what the government would do to fix the problems and control the market.
2.4 Limitation
Exhaust gas emissions of vehicles include CO, CO2, NO and NMOG. Greenhouse
gas includes CO2, N2O, and some non-CO2 GHGs, CH4, ODSs and HFCs. We
primarily discuss CO2 emissions. Lifecycle costs of these two different vehicles
include vehicle’s cost, division costs, total manufacturing cost, fuel costs, insurance
cost, repair cost, engine oil cost, tires lifecycle cost, register cost, fuel oil tax, and
emissions cost. In these costs, our discussion is based on their emission cost and
compares their full costing. The third hypothesis of our empirics shows the
12
differences between locations. We divide China into east, west, south and north.
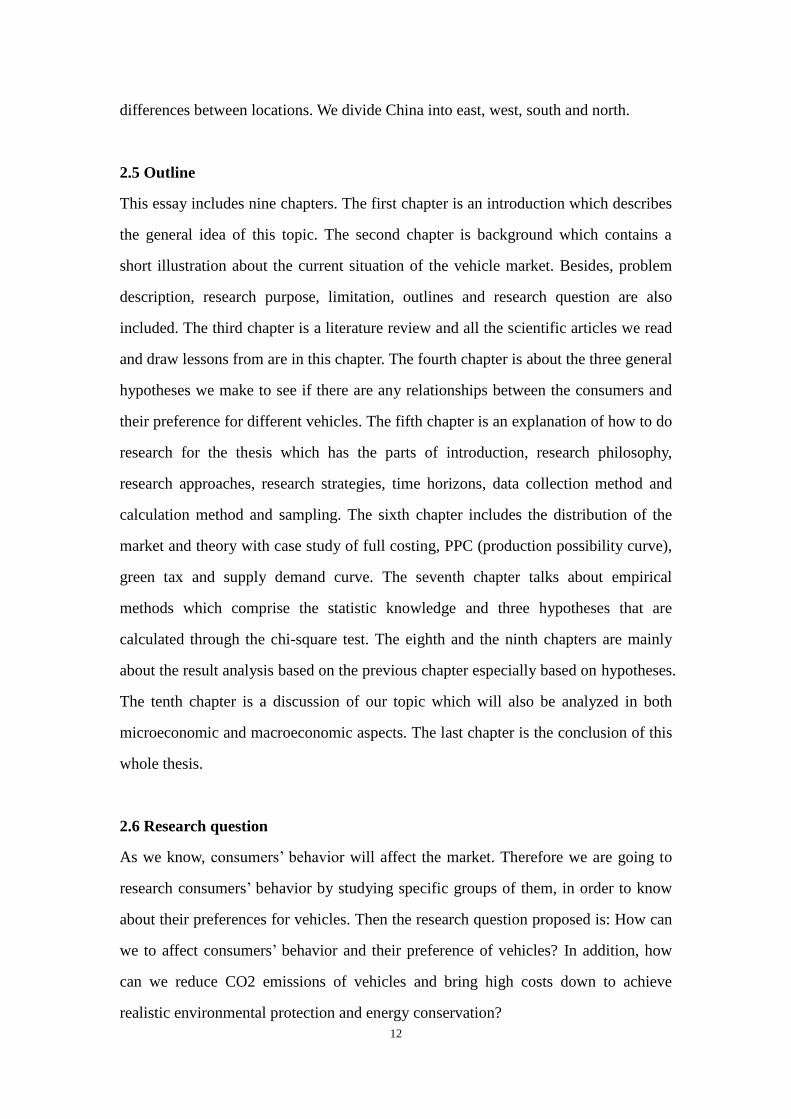
2.5 Outline
This essay includes nine chapters. The first chapter is an introduction which describes
the general idea of this topic. The second chapter is background which contains a
short illustration about the current situation of the vehicle market. Besides, problem
description, research purpose, limitation, outlines and research question are also
included. The third chapter is a literature review and all the scientific articles we read
and draw lessons from are in this chapter. The fourth chapter is about the three general
hypotheses we make to see if there are any relationships between the consumers and
their preference for different vehicles. The fifth chapter is an explanation of how to do
research for the thesis which has the parts of introduction, research philosophy,
research approaches, research strategies, time horizons, data collection method and
calculation method and sampling. The sixth chapter includes the distribution of the
market and theory with case study of full costing, PPC (production possibility curve),
green tax and supply demand curve. The seventh chapter talks about empirical
methods which comprise the statistic knowledge and three hypotheses that are
calculated through the chi-square test. The eighth and the ninth chapters are mainly
about the result analysis based on the previous chapter especially based on hypotheses.
The tenth chapter is a discussion of our topic which will also be analyzed in both
microeconomic and macroeconomic aspects. The last chapter is the conclusion of this
whole thesis.
2.6 Research question
As we know, consumers’ behavior will affect the market. Therefore we are going to
research consumers’ behavior by studying specific groups of them, in order to know
about their preferences for vehicles. Then the research question proposed is: How can
we to affect consumers’ behavior and their preference of vehicles? In addition, how
can we reduce CO2 emissions of vehicles and bring high costs down to achieve
realistic environmental protection and energy conservation?

13
Ch.3 Literature Review
In this part we show the literature review of the dissertation. Lifecycle cost of hybrid
vehicles, the supply and future price trend of oil, polluting gas emissions, the trend of
CO2 and N2O emissions, greenhouse gas emissions, and consumers’ perception.
The following literature review shows the topics for the purpose of this thesis. As we
know, the function of the literature review is to reflect the historical background,
research status and development trend of the certain subjects. In addition, it has a high
reference value. Through the literature review, we are not only analyze and learn from
others' research, but also indicate the degree of understanding and learning about our
subject before we start to work on it.
3.1 Lifecycle costs of hybrid vehicles
Table 3.1 Example manufacturing cost and retail price
Source: (Lipman & Delucchi, 2006, p.120.)
Cost Category ICEV HEV
Total manufacturing cost $5741 $7587
Division costs (engineering, testing, advertising) $3761 $4124
Corporate costs (executives, capital, research and development) $2222 $2300
Corporate cost of money $172 $206
Corporate true profit (taken as fraction of factory invoice) $368 $440
Factory invoice (price to dealer) $12,265 $14,656
Dealer costs $2031 $2246
Manufacturer’s suggested retail price (MSRP) $14,295 $16,902
Shipping cost (destination charge) $365 $377
Retail cost to consumer (includes shipping cost and 3% tax) $15,100 $17,797
According to Lipman & Delucchi, (2006), the lifecycle costs of hybrid vehicle
include vehicles’ cost, battery cost, maintenance cost, fuels’ costs, insurance cost,

14
repair cost, engine oil cost, tires lifecycle cost, register cost, fuel oil tax, and
emissions cost. This total lifetime cost is higher than that of combustion engine
vehicles (as table 3.1 shows). Because hybrid vehicles move society benefits (external
costs of noise, air pollution, greenhouse gases, use of limited source of oil and
gasoline) into private costs (battery cost, higher technology cost), they give producers
or consumers a higher cost. But hybrid vehicles do not have society costs such as
pollution costs. “The external cost plus the private cost equals the social cost”
(Lipman & Delucchi, 2006, p.116.)
3.2 The supply and future price trend of oil
Alsahlawi, (2010) indicates that the future prospects of world oil supply will be an
increasing depletion of resources. The production of oil has an annual average growth
of 6 per cent, the proven reserves have average annual growth of 7 per cent and the
trend of oil supplies forecast (2007-2015s). The estimate price of oil and reserves will
increase, and then oil production will be inelastic. High price of oil will make the
demand of regions market less. Low price of oil will cause supplies to decline quickly.
Apparently, the future prospect of oil supply is mainly depending on the price trend.
The supplies of oil will rise, and then decline. Unless there is more investment on
exploration and more renewable energy is developed.
3.3 Polluting gas emissions
The data of gas emissions compares vehicles with two different engines. The carbon
dioxide emissions (180 gram/mile) of the hybrid engine vehicles Toyota Prius is less
than the combustion engine vehicles Toyota Corolla (253 gram/mile). Thus, the
hybrid engine vehicle is better at gaseous emission for environmental protection. The
fuel consumption of the hybrid engine of the Toyota Prius (43.7 miles per gallon) is
lower than the combustion engine of the Toyota Corolla (65.6 miles per gallon). Thus,
the hybrid engine vehicles have high energy consumption. The CO emissions and NO
emissions of hybrid engine vehicle are lower than that of the combustion engine
vehicle (Lavea & MacLeanb, 2002).

15
Table 3.2 Vehicle attributes and exhaust emission
Source: (Lave & MacLean, 2002, p.60.)
Vehicle Car
class
Test
wt(Ib)
NMOG
(g/mi)
CO
(g/mi)
NO
(g/mi)
CO2
(g/mi)
Fuel
(mpg)
Accel.0-60
Mph(sec)
Suzuki
Metro
Sub-
compact
2125 0.04 0.3 0.04 158 43.7 15.3
Fuelcycle 0.04 0.04 0.07 49
Toyota
Prius
Compact 2728 0.003 0.04 0.001 180 48.8 12.7
Fuelcycle 0.05 0.06 0.10 69
Per-Prius 0.003 0.04 0.001 201 43.7 10.3
Fuelcycle 0.06 0.07 0.11 77
Toyota
Corolla
Compact 2520 0.04 1.3 0.2 253 34.8 10.3
Fuelcycle 0.07 0.09 0.13 96
AHEV Compact 0.003 0.04 0.001 102 65.6 10.3
Fuelcycle 0.04 0.05 0.07 51
3.4 Greenhouse gas emissions
Transport is the main source of greenhouse gas emissions. Recent options of transport
almost entirely rely on fossil resource and petroleum which accounts for 95 per cent
of the total energy of the transport of the world. “In 2004, transport accounted for 23%
of the world’s energy-related greenhouse gas emissions, with about three quarters
coming from road vehicles” (Cao et al., 2010, pp.270.). The quantity of cars in China
will increase, from 12.9 million in 2005 to around 193 million in 2035. Due to growth
in motorization, it is estimated that transportation would contribute 9 per cent of the
total CO2 emissions in China. The development of China’s transportation will lead to
a typical increase in Greenhouse Gas emissions (Cao, & Xu, 2010).

16
3.5 The trend of CO2 and N2O emissions
As Figure 3.4 below show, we know that CO2 and N2O emissions are the main
factors which are increasing in the next 40 years.
Figure 3.1 Greenhouse Gas emissions.
Source: (Montzka, Dlugokencky, & Butler, 2011, p.46.)
3.6 Consumers’ perceptions
Competition in the vehicles market is increasing. Companies need to know what kind
of factors influence consumers’ decisions on purchasing a vehicle. Therefore, vehicles
producers should understand consumers’ insights, and then promote vehicle products
marketing. The research relates to consumers’ perceptions on quality, perceived value
and perceived risk. The companies conduct a questionnaire on a sample of consumers.
Scientific proof on consumers’ perceptions is related to their purchase decisions (Yee,
& San, 2010).

17
Ch.4 General Hypothesis
In this chapter of the dissertation, we show the hypothesis depend on our research
questions.
According to what we have learnt, hypothesis is envisaged of one or several possible
conclusions of the research subject. Besides, it uses existing materials and scientific
principles as the basis. Therefore, based on the study of the previous literature review,
we have come up with following three hypotheses in the interest of investigate our
research questions. These three hypotheses will be tested in the empirics chapter.
Different consumers’ perceptions are relevantly related with their purchase decisions
on consumption. (Yee, & San, 2010). Different ages influence the customers’
preferences for vehicles. Hervé, & Mullet, (2009) claim that age is important.
Categorizing consumers by age reveals that this factor is related with their purchase
decisions. Thus, our first hypothesis is:
H1: There will be no differences depending on the age of consumers
and their preference of hybrid and combustion vehicles.
In addition, different education levels influence the customers’ preferences for
vehicles. Consumer education programs educate students to act as wise consumers.
Consumers have their rights and responsibilities such as social concern, safety and a
healthy environment. (Makela, & Peters, 2004). Different consumers have different
ages and education levels. Their different ages and educations affect their purchase
decisions indirectly. Thus, our second hypothesis is:
H2: There will be no differences depending on the education level
of consumers and their preference of hybrid and combustion
vehicles.
18
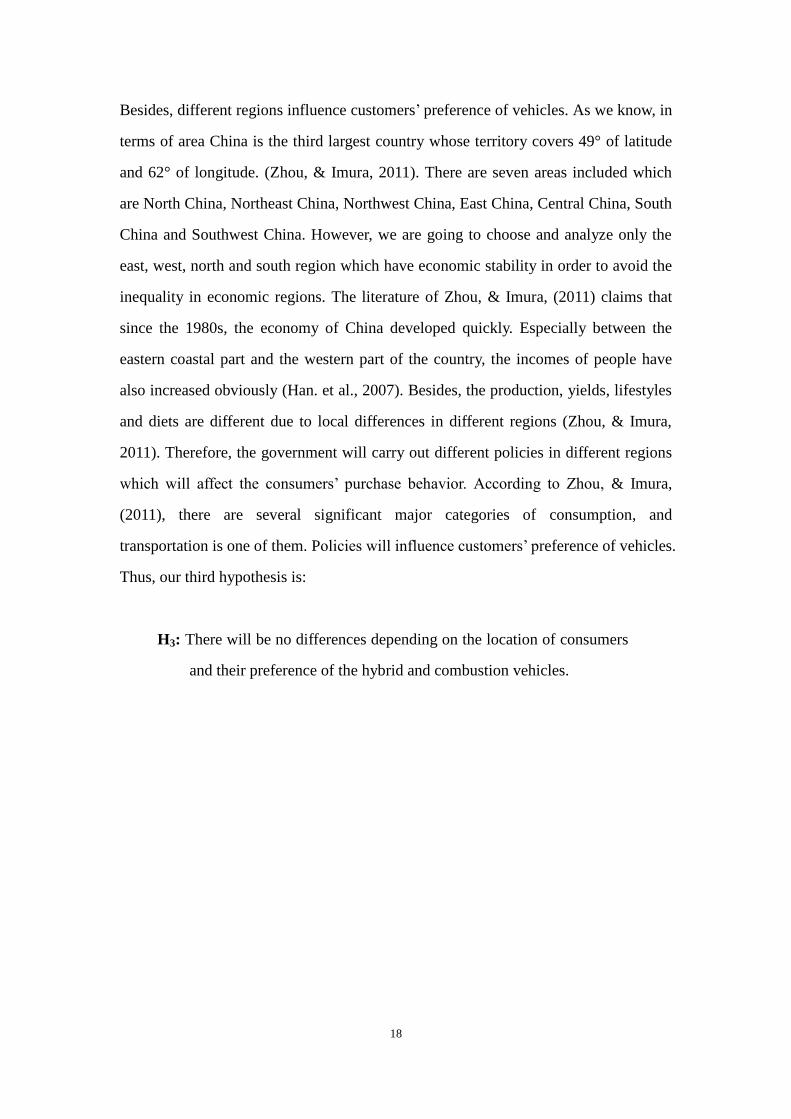
Besides, different regions influence customers’ preference of vehicles. As we know, in
terms of area China is the third largest country whose territory covers 49° of latitude
and 62° of longitude. (Zhou, & Imura, 2011). There are seven areas included which
are North China, Northeast China, Northwest China, East China, Central China, South
China and Southwest China. However, we are going to choose and analyze only the
east, west, north and south region which have economic stability in order to avoid the
inequality in economic regions. The literature of Zhou, & Imura, (2011) claims that
since the 1980s, the economy of China developed quickly. Especially between the
eastern coastal part and the western part of the country, the incomes of people have
also increased obviously (Han. et al., 2007). Besides, the production, yields, lifestyles
and diets are different due to local differences in different regions (Zhou, & Imura,
2011). Therefore, the government will carry out different policies in different regions
which will affect the consumers’ purchase behavior. According to Zhou, & Imura,
(2011), there are several significant major categories of consumption, and
transportation is one of them. Policies will influence customers’ preference of vehicles.
Thus, our third hypothesis is:
H3: There will be no differences depending on the location of consumers
and their preference of the hybrid and combustion vehicles.

19
Ch.5 Research Method
In this chapter of the dissertation, we show the method of our thesis. The introduction,
research philosophy, research approaches, research strategies, time horizons, data
collection method, calculation method, and Sampling are presented.
Figure 5.1 Research process “onion”
(Available at: http://www.doc88.com/p-582676638377.html)
5.1 Introduction
As figure 5.1 shows, the model contains five different layers. These layers are
different serial steps in the research process. The steps of the research process begin at
the outside and move to the center meaning that every layer can be peeled off step by
step. The steps are research philosophy, research approaches, research strategies, and
then time horizons, the final step is data collection methods.
5.2 Research philosophy
Saunders et al. (2009) claims that there are four different philosophies (positivism,
realism, interpretivism, and pragmatism) in research philosophy. We research these
two vehicles’ backgrounds and similar problems in scientific journal articles (costs,
gas emission, and the trend of fuel oil) through the website of the school library.
These journal articles are credible and scientific. Our study refers to some scientific
journal articles where we collect data on present issues and future trends. Our
20
dissertation uses Positivism means to apply some existing theories to refute or
confirm hypothesizes whose means have been tested.
5.3 Research approaches
According to Saunders et al. (2009) that there are two different approaches, deductive
and inductive. The deductive approach means the research involves testing by some
particular research strategy design, or uses some existing theories to argue. The
inductive approach involves use of a theory to observe empirical data. We used
investigation by questionnaire, and collect data from a sample of consumers. After
that, we use statistics to confirm our hypothesis. Our study uses existing theories for
the hypothesis research. Our dissertation employs the deductive approach.
5.4 Research strategies
The research strategies are including experiment, survey, case study, grounded theory,
ethnography, and action research. In our dissertation, we use questionnaires to ask
consumers’ perceptions in this investigation. Thus we use a survey as research
strategy in this dissertation.
5.5 Time horizons
Time horizons include cross sectional and longitudinal. In our investigation, we
distributed the questionnaire to different people on the internet and got almost all
responses very quickly. Therefore, our time horizon is longitudinal.
5.6 Data collection method and calculation method
The data collection methods are relevantly connected with our hypothesis and
calculation. The Chi-square test is the determination of the measured value and the
theoretical value in line with the sampling degree of statistical method. When the two
values differ, we can discover and determine if the difference is caused by random
sampling errors or improper theoretical assumptions. In this chapter, three groups of
different variables are set which are the different ages, education levels, and regions

21
of consumers are compared with their preferences and attitudes on different kinds of
vehicles. In addition, our data is obtained through a questionnaire survey. This survey
methodology is to use a questionnaire which is designed to understand the situation or
seek advice from the selected population and it is a means of data collection. The
questionnaire we designed is self-administered and composed mainly of
multiple-choice questions. Besides, chi-square tests will be used to find out if the
assumptions we suppose are correct and if there are any connections between the
variables we choose.
5.7 Sampling
The population is the total set of subjects of interest in a study. A sample is the subset
of the population on which the study collects data (Agresti, & Finlay, 2009). As we
know, due to the restriction of money and time, it is impossible to collect all the data
from the population. Therefore, the use of a sample survey is crucial and essential.
The sample survey is a non-comprehensive survey which selects part of the units from
the entire research object to investigate. In addition, it is also a survey method to
estimate the research object. According to the technique of sample selection, the
sample survey can be divided into two categories which are non-probability sampling
and probability sampling. Non-probability sampling indicates that investigators take
samples according to their own convenience or judgment. Probability sampling is in
accordance with the principles of probability theory and mathematical statistics from
the totality of data collection, and draws the sample on a random basis. Besides, it
makes estimates inferred from some characteristics of the population to control the
possible errors. In this thesis, we conduct our sampling by designing a questionnaire
survey probability sampling method. Specifically, it is also called stratified sampling
which divides the ensemble units into several types or layers according to their
attribute property, and then selects sample units randomly in one type or layer. In this
case, we separate the stratification variables into ages, education levels and regions
which are the first 3 questions in the questionnaire. Based on this, we designed the
rest of the questions and start to calculate points from question 5 and there are 18

22
choices in total. In specific, 6 As= 6 points, 3 Ds +3 Bs=18 points. That is to say,
choose A add 1 point, choose B add 2 points, choose C add 3 points, and choose D
add 4 points. The lowest point is not 0, the maximum point are the people who choose
all Ds or Bs which is 18, and the lowest point is the people who choose all A which is
6 points in total. Based on every respondent’s final total points, we can see their
preference of either combustion vehicles or hybrid vehicles, or in neutral. In addition,
if the respondents have 6,7,8,9 points, then that means they support combustion
vehicles. If they have total points of 10, 11, 12, 13, 14 they are in the middle. If they
have 15,16,17,18 points it means they support hybrid vehicles. This is the way to
calculate the points in our questionnaire. After that, we send out our questionnaires
according to the three stratification variables and collect respondents as our sample.

23
Ch.6 Theory
In this chapter of the dissertation, we show the theories of our thesis, including the
distribution of the market, full costing, PPC, green taxes, and Supply Demand Curve.
In this section, we use the learned economic knowledge as background to support and
analyze our research subject. By using this method, we can examine whether we can
make use of the theories in real life.
6.1 The distribution of the market
Figure 6.1 shows the connection between different characters. Hybrid engine and
combustion engine have different lifecycle costs. Government can use tax or subsidies
to influence these costs. Consumers’ income would also influence consumers’
purchase decision.
Figure 6.1 The distribution of the market
In the dissertation we use “Full Costing”, “PPC” (Production Possibility Curve),
“Supply Demand Curve”,“Green Taxes” and “Statistic Method” to analyze the market
of hybrid vehicles and combustion vehicles.
6.2 Full Costing
Full costing means when we calculate production cost and inventory cost, the
materials which are consumed are included in direct materials, direct labor, variable
Hybrid engine
Lifecycle costs:
Maintenances costs,
CO2 emissions costs,
Fuel economy,
Battery costs, etc
Consumers Production Government
Combustion engine
Environmental protection and energy conservation
Tax
Subsidy
Income

24
overhead and fixed manufacturing overhead cost during the production process in a
certain period. If we include non-production cost, we can then use traditional
increases and decreases to determine the procedures for measuring the profit and loss.
We could calculate the difference in total costs between hybrid vehicles and
combustion vehicles (Atrill & McLaney, 2008).
Figure 6.2 Full Costing
HEV: Hybrid engine vehicle CEV: Combustion engine vehicle
The costs of hybrid engine vehicles are higher than those of combustion engine
vehicles in every cost category, including total manufacturing cost, division costs
(engineering, testing, and advertising), corporate costs (executives, capital, research
and development), corporate cost of money, corporate true profit (taken as fraction of
factory invoice), factory invoice (price to dealer), dealer costs, manufacturer’s
suggested retail price, shipping cost (destination charge), and retail cost to consumer
(includes shipping cost and 3% tax). According to full costing, hybrid vehicles have
higher price than combustion vehicles. But Lipman & Delucchi, (2006) conclude that
these two different vehicles have balance cost in their lifecycle. Hybrid vehicles have
higher market price than combustion vehicles. Because hybrid engine vehicles
transfer the society cost (external costs of noise, air pollution, greenhouse gases, use
limited source of oil and gasoline.) to its private costs (battery cost, higher technology
cost). Thus the costs of hybrid vehicles are higher than combustion vehicles. All
combustion vehicles can only use fuel oil as power source. Therefore, consumers
should consider the price of fuel oil before they buy the vehicle.

25
6.3 PPC (Production Possibility Curve)
PPC is used to indicate with the established resources and in certain technical
conditions the maximum number of combinations of production of various
commodities. It has economic characteristics. We suppose different conditions in the
same production with the same amount of capital (Perloff, 2012). PPC can also be
used to illustrate the potential trend. If there are points within PPC, it explains there is
production potential which means the resources have not been fully utilized. If there
are points outside the curve, it indicates under the existing technical conditions the
needed resources cannot be reached. Only points on the curve are the most efficient
allocation of resources. In addition, if PPC is concave to the origin point, the
opportunity cost will increase with the increase of a product. The increasing
opportunity cost is due to some certain resources which are suitable for some certain
production. However, the efficiency will be decreased when it is used to produce
other unsuitable products. That is to say, the amount of output per unit of resources
will decrease. This phenomenon is common in the real economy.
Figure 6.3 Production Possibility Curve (PPC)
Hybrid electric vehicles are higher quality products, but not lower costs. The higher
quality assurance includes investing in higher technology meanwhile keeping lower
costs. In an economic situation both combustion engine vehicles and hybrid electric
vehicles are produced. According to the production possibilities curve (PPC), with
combustion engine vehicles and hybrid electric vehicles in which the best one will be
accepted (Perloff. 2012). That is to say the one witch has lower cost, lower price,
higher technology, and quality will be accepted instead of other one. The low costs of

26
one will affect consumers’ desire. We assume there is a regular capital of ten million
RMB in the same production of hybrid vehicles and combustion vehicles. Every
single hybrid vehicle costs 250 thousand RMB, and Every single combustion vehicle
is cost 300 thousand RMB. Then this regular capital of ten million RMB can produce
100 combustion engine vehicles, or 90 combustion engine vehicles with 12 hybrid
engine vehicles. When the the cost of hybrid vehicles has decreased to 200 thousand
RMB, the production follows the change of the quantity. The production of point A1
decrease to point A, when the costs of hybrid engine vehicles decrease.
6.4 Green Taxes
The establishment of green tax is for the purpose of the protection of the environment,
rational development, utilization of natural resources, promotion of green production
and consumption. Accordingly it protects the environment and maintains sustainable
human development. Besides, it is also known as environmental tax which means that
it gives tax relief for taxpayers who invest in the prevention of pollution or
environmental protection. Another way is to levy tax on polluting industries. We
analyze the relations including government, consumers, production and environment
(Turner, Pearce, & Bateman, 1993).
Figure 6.4 Optimal (Pigovian) pollution tax
As figure 6.4 shows, we suppose two different supplies of vehicles in the same
demand. Beside government is setting up of a tax on the vehicles’ market. With these
two different supplies different amounts of pollution tax is paid. Supply A produces
Quantity 2 which is only paid by producers. Opposite, Supply B produces Quantity 1

27
(Quantity 1 is smaller than Quantity 2) which has a higher price and must be paid by
customers and producers. In the same situation, Supply A produces less pollution than
Supply B. Thus the Supply B has to pay more tax than Supply A. Tax costs is one part
of the lifecycle costs of the vehicles. Combustion vehicles which release more
pollution would be required to pay more tax. The government can use “Green Tax” to
increase the cost of pollution.
6.5 Supply Demand Curve
The demand curve indicates the relationship between price and demand. It refers to,
under the same condition the amount of commodities that buyers are willing to buy at
each price level. The demand curve usually has designated prices on the longitudinal
axis (y-axis) and demand on the horizontal axis (x-axis). In accordance with the law
of the demand curve, the curve should be downward sloping. Besides, at the central
point the price elasticity of demand is equal to one. Above the central point the price
elasticity of demand is greater than one, and below the central point the price
elasticity of demand is less than one. The so-called supply means under certain
conditions and within a certain time, the willingness of individual firms to produce a
kind of commodity and the number of goods sold. The supply curve is expressed in a
geometric figure and shows the functional relationship between the price of the
product and the supply amount. In general, the quantity of output and the price will be
positively correlated. The factors which will affect supply include: the price of the
goods, the prices of production, production technology, and the future price
expectations.
Figure 6.5 Supply Demand Curve
Price
Supply B
Demand
Q2 Q1
Supply A
Quantity

28
When governement policies affect costs, the market price of products will be changed.
From the particular policy of “green tax”, the government finds an excuse in pollution
to increase the price of combustion vehicles and require consumers pay this extra cost.
Vehicles factories should consider the relationship between regular capital and those
increasing costs. Because consumers perceive the selling price, quality and service in
their purchase decision. Thus the demand of consumers might be decreased as Supply
A. Anyhow, the quantity would be decreased from Q1 to Q2 as Figure 6.5 shows.

29
Ch.7 Empirics
In this chapter of the dissertation, we calculate the hypotheses (different ages,
education levels and locations).
Based on the three general hypotheses, a questionnaire has been made to collect the
data we need. According to the respondents answer, we calculated the data by using
Chi-square test in order to see if there are any connections between the variables.
Detailed result will be analyzed in the following chapters.
7.1 Hypothesis of different ages of consumers
H0: There will be no differences depending on the age of consumers and their
preference of hybrid and combustion vehicles.
H1: There will be differences.
Table 7.1 Data (different ages and cars) in survey
Car Age 20-29 30-39 40-49 50-59 ∑
Combustion 30 (19.3) 18 (18.3) 15 (23.6) 24 (25.8) 87
Middle 12 (16) 18(15.1) 24 (19.6) 18 (21.3) 72
Hybrid 12 (18.7) 15 (17.6) 27 (22.8) 30 (24.9) 84
∑ 54 51 66 72 243
Explanation:
ⅰ. Null hypothesis. H0: There are no differences, which
means there is no difference or there are small differences
between the observation and expectation. H1: there are
differences between the observation and expectation, which
means the gap is quite huge.
ⅱ. Statistical test. Since there are more than two categorical
variables and they are independent random sampling, the

30
chi-square test is appropriate.
ⅲ. Significance level. Let α = 5% and N is the number of total
volume that is sold =81.
ⅳ. Sampling distribution, the sampling distribution of the
test statistic indicates how large must be before strong
evidence exists that H0 is false. For large sizes, the sampling
distribution is the chi-squared probability distribution. The
name of the test and the symbol for the test statistic refers to
the name of the sampling distribution. Besides, we need df
=(r-1)(c-1) and the table C to find the final result.
ⅴ. The set of values of the test statistic for which we fail to
reject the null hypothesis when H0 is true is less than or α
=5%.
Decision: Table 7.1 presents that the preference of either
hybrid vehicles or combustion vehicles correspond with
consumers’ ages. The numbers in the brackets indicates the
expected number of people when H1 is true. Such as in age
groups extending 20-29 years, the consumers prefer
combustion vehicles.
When H1 is true we would expect (54×87)÷243 =19.3 in the
consumers number. In age range 40-49 years, the consumers
who are standing in the middle, when H1 is true we would
expect (72×66)÷243 =19.6 in consumers’ number. Of the 87
total numbers of consumers in all age ranges, the consumers
between ages 20-29 who prefer combustion vehicles exceed
the expectation goal.

31
=19.3,
=18.3,
=23.6,
=25.8,
=16,
=15.1,
=19.6,
=21.3,
=18.7,
=17.6,
=22.8 ,
=24.9 ;
= 5.93 +0.005 + 3.13+ 0.13+ 1 +0.56 +0.99 +0.51 +2.4+0.38 +0.77 + 1.04
= 16.845
df = (3-1)(4-1) = 6
Figure 7.1 Data (different ages and cars) in survey
=> Reject H0
P-value < 1%
Greater than the significance level
Reference to Appendix table C of Statistical Methods
(Agresti, & Finlay, 2009) that such a value of is
significant beyond the 01 level. (the critical value for
α= 01 and df = 6 is 16.81). Therefore, there is no
support for Ho. We conclude that there are
differences depending on the ages of consumers and
their preferences of the hybrid and combustion
vehicles.
7.2 Hypothesis of different education levels of consumers
H0: There will be no differences depending on the education levels of consumers and

32
their preferences of hybrid and combustion vehicles.
H1: There will be differences.
Table 7.2 Data (different educations and cars) in survey.
Education
Car
junior
high
school
senior
high
school
junior
college
Undergr-
aduates
∑
Combustion 30(20.9) 27(24.5) 20(22.3) 12(21.2) 89
Middle 12(9.9) 13(11.6) 9(10.5) 8(10.0) 42
Hybrid 15(26.3) 27(30.9) 32(28.1) 38(26.8) 112
∑ 57 67 61 58 243
Decision: Table 7.2 presents that the preference of either
hybrid vehicles or combustion vehicles correspond with
their education levels. The numbers in the brackets
indicate the expected number. Such as in education
extending junior high school, the consumers prefer
combustion vehicles.
When H1 is true we would expect (57×89)÷243 =20.9 in
the consumers number. In undergraduates, the consumers
who prefer hybrid vehicles, when H1 is true we would
expect (112×67)÷243 =30.9. Of the 89 total number of
consumers in all education ranges, the consumers who
are undergraduate prefer hybrid vehicles exceed the
expectation goal.
=20.9,
=24.5 ,
=22.3 ,
=21.2,
=9.9
=11.6,
=10.5,
=10.0,
=26.3,
=30.9,
=28.1,
=26.8;

33
=3.96+ 0.26 + 0.24 + 3.99 + 0.45 +0.17+ 0.21
+0.4+ 4.85+ 0.49 + 0.54 + 4.6
= 20.24
df = (3-1)(4-1) = 6
Figure 7.2 Data (different educations and cars) in survey
=> Reject H0
P-value < 0.5 %
Greater than the significance level
Reference to Appendix table C of Statistical Methods
(Agresti, & Finlay, 2009) that such a value of is
significant beyond the 05 level. (the critical value for
α= 05 and df = 6 is 18.55). Therefore, our decisions is
to reject Ho. We conclude that there are differences
depending on the education levels of consumers and
their preferences of hybrid and combustion vehicles.
7.3Hypothesis of different regions of consumers
H0: There will be no differences depending on the location of consumers and their
preferences of hybrid and combustion vehicles.
H1: There will be differences.

34
Table 7.3 Data (different locations and cars) in survey
Location
Car
East West South North ∑
Combustion 33(19.7) 24(19.7) 18(21.8) 9(22.8) 84
Middle 9(8.4) 15(8.4) 9(9.3) 3(9.8) 36
Hybrid 15 (28.9) 18(28.9) 36(31.9) 54(33.4) 123
∑ 57 57 63 66 243
Decision: Table 7.3 presents that the preference of either
hybrid vehicles or combustion vehicles corresponding with
their location. The numbers in the brackets indicate the
expected number of consumers. For example, in the east, the
consumers prefer combustion vehicles.
When H1 is true we would expect (84×57)÷243 =19.7 in sales
volume. And in the north, with hybrid vehicles, when H1 is
true we would expect (123×66)÷243 =33.4 in sales volume.
Of the 84 total numbers of consumers in all locations, North
consumers who prefer combustion vehicles highly exceed the
expectation goal.
=19.7 ,
=19.7 ,
=21.8 ,
=22.8,
=8.4 ,
=8.4 ,
=9.3,
=9.8,
=28.9 ,
=28.9,
=31.9,
=33.4,
= 8.98 +0.94 + 0.66+ 8.35+ 0.04+5.19 + 0.009
+ 4.72 +6.69 + 4.11 + 0.53 + 12.71
= 52.929
df = (3-1)(4-1) = 6

35
Figure 7.3 Data (different locations and cars) in survey
=> Reject H0
P-value < 0.1 %
Greater than the significance level
Reference to Appendix table C of Statistical Methods
(Agresti, & Finlay, 2009) that such a value of is
significant beyond the 01 level. (the critical value for α=
01 and df = 6 is 22.46). Therefore, Ho is rejected. We
conclude that there are differences depending on
locations of consumers and their preferences of hybrid
and combustion vehicles.
36
Ch.8 Results
We present the results of questionnaire, including age groups, regional groups, and
education groups.
Primary data collection was completed through a survey with 243 people participating.
Survey participants were asked questions regarding their preference for combustion or
hybrid vehicles. Positive answers were summed up to produce an indication of
preferences, which were used to categorize respondents into three categories:
preferring combustion, no preference, and preferring hybrid. These three categories
could then be analyzed for correlation with other variables that were surveyed during
the same data collection period: age, region and education. Survey results indicate that
survey participants with higher education levels prefer hybrid vehicles. We found that
older people who took our survey more strongly support hybrid vehicles than young
people, which is most apparent in the 50 to 59 age group. We also found that survey
respondents who live in the north prefer hybrid vehicles.
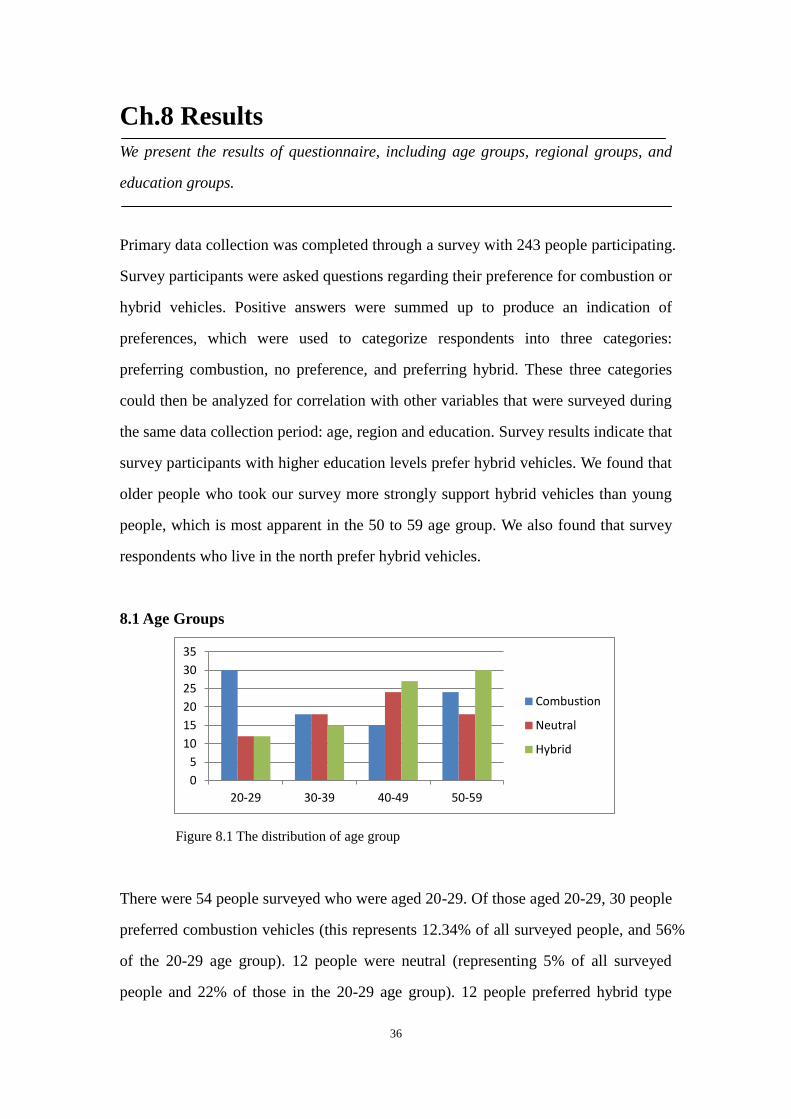
8.1 Age Groups
Figure 8.1 The distribution of age group
There were 54 people surveyed who were aged 20-29. Of those aged 20-29, 30 people
preferred combustion vehicles (this represents 12.34% of all surveyed people, and 56%
of the 20-29 age group). 12 people were neutral (representing 5% of all surveyed
people and 22% of those in the 20-29 age group). 12 people preferred hybrid type
0
5
10
15
20
25
30
35
20-29 30-39 40-49 50-59
Combustion
Neutral
Hybrid

37
vehicles (this represents 5% of all those surveyed and 22% of those in the 20-29 age
group).There were 51 people surveyed who were aged 30-39. Of those aged 30-39, 18
people preferred combustion vehicles (this represents 7.4% of all surveyed people,
and 35% of the 30-39 age group). 18 people were neutral (representing 7.4% of all
surveyed people and 35% of those in the 30-39 age group). 15 people preferred hybrid
type vehicles (this represents 6% of all those surveyed and 29% of those in the 30-39
age group). There were 66 people surveyed who were aged 40-49. Of those aged
40-49, 15 people preferred combustion vehicles (this represents 6.1% of all surveyed
people, and 23% of the 40-49 age group). 24 people were neutral (representing 10%
of all surveyed people and 36% of those in the 40-49 age group). 27 people preferred
hybrid type vehicles (this represents 11% of all those surveyed and 41% of those in
the 40-49 age group). There were 72 people surveyed who were aged 50-59. Of those
aged 50-59, 24 people preferred combustion vehicles (this represents 10% of all
surveyed people, and 33% of the 50-59 age group). 18 people were neutral
(representing 7.4% of all surveyed people and 25% of those in the 50-59 age group).
30 people preferred hybrid type vehicles (this represents 12.34% of all those surveyed
and 42% of those in the 50-59 age group).
8.2 Regional Groups
Figure 8.2 The distribution of respondents (map)

38
The country in which the survey was conducted was divided into four areas and
respondents were asked to identify the area in which they live. The regions are large
general areas of China where the survey was conducted. They are identified as east,
west, north and south, and their geographical area is indicated on the map above.
Geographical analysis shows that the north and south groups prefer hybrid vehicles,
while the east and west groups prefer combustion vehicles. The north quite
overwhelmingly prefers hybrid vehicles, while the west has no overwhelmingly large
preference.
Figure 8.3 The distribution of respondents (bar graph)
The east group contained 57 survey respondents. In the East area, 33 people (58% of
the East group) preferred combustion vehicles which represent 13.58% of all survey
respondents. 9 people were neutral which represented 3.7% of all respondents and
15.78% of respondents in the east area. 15 people preferred hybrid vehicles which
represent 6.17% of all respondents and 26.31% of respondents in the east area. The
west group contained 57 survey respondents. In the West area, 24 people (42% of the
West group) preferred combustion vehicles which represent 9.9% of all survey
respondents. 15 people were neutral which represent 6.2% of all respondents and 26%
of respondents in the West area. 18 people preferred hybrid vehicles which represent
7.4% of all respondents and 32% of respondents in the West area. The North group
contained 66 survey respondents. In the North area, 9 people (13.63% of the North
group) preferred combustion vehicles which represent 3.7% of all survey respondents.
3 people were neutral which represent 1.23% of all respondents and 4.5% of
0
20
40
60
East West North South
Combustion
Neutral
Hybrid

39
respondents in the North area. 54 people preferred hybrid vehicles which represent
22.22% of all respondents and 81.81% of respondents in the North area.
The South group contained 63 survey respondents. In the South area, 18 people (28.6%
of the South group) preferred combustion vehicles which represented 7.4% of all
survey respondents. 9 people were neutral which represent 3.7% of all respondents
and 14.3% of respondents in the South area. 36 people preferred hybrid vehicles
which represent 15% of all respondents and 57% of respondents in the south area.
8.3 Education Groups
Survey respondents were categorized into four groups based on education: Junior
High School (“JHS”), Senior High School (“SHS”), Junior College (“JC”), and
Undergraduate College Education (“UCE”). For ease of expression and to avoid
overly long names we describe the groups by their abbreviations: JHS, SHS, JC, and
UCE.
Figure 8.4The distribution of education levels (bar graph)
The group of people who completed Junior High School (“JHS”) contained 57 people.
Of these, 30 preferred combustion vehicles, this represents 12.34% of all survey
respondents, and 52.63% of JHS respondents. 12 people had no preference,
representing 4.39% of all survey respondents, and 21% of JHS respondents. 15 people
preferred hybrid vehicles, representing 6.17% of all respondents and 26.31% of JHS
respondents. The group of people who completed Senior High School (“SHS”)
contained 57 people. Of these, 27 preferred combustion vehicles, this represents 11.11%
0
5
10
15
20
25
30
35
40
JHS SHS JC UCE
Combustion
Neutral
Hybrid

40
of all survey respondents, and 40% of SHS respondents. 13 people had no preference,
representing 5.34% of all survey respondents, and 20% of SHS respondents. 27
people preferred hybrid vehicles, representing 11% of all respondents and 40% of
SHS respondents.
Figure 8.5 The distribution of education levels (line graph)
A clear trend is revealed in the progression of education level (from left to right in the
above graph), lower education to higher education level shows a correlated increase in
preference for hybrid vehicles and a decrease in preference for combustion vehicles.
The group of people who completed Junior College (“JC”) was made up of 60 people.
This is smaller than the original total of surveyed people because the respondent later
changed his answer on the survey form, so we threw out this respondent’s answer. Of
the JC group, 20 preferred combustion vehicles, this represents 8.23% of all survey
respondents, and 33.33% of JC respondents. 9 people had no preference, representing
3.7% of all survey respondents, and 15% of JC respondents. 31 people preferred
hybrid vehicles, representing 24.69% of all respondents and 51.66% of JC
respondents. The group of people who completed Undergraduate College Education
(“UCE”) contained 57 people. Of these, 12 preferred combustion vehicles, this
represents 5% of all survey respondents, and 21% of UCE respondents. 8 people had
no preference, representing 3.29% of all survey respondents, and 13.79% of UCE
respondents. 38 people preferred hybrid vehicles, representing 15.63% of all
respondents and 66% of UCE respondents.
0
10
20
30
40
JHS SHS JC UCE
Combustion
Neutral
Hybrid

41
Figure 8.6 Illustration of the combined surveyed data
We conclude that differences in the ages of consumers, their locations, and their
education levels all individually correlate with their preference for hybrid or
combustion vehicles. Specifically, we find that individuals who are highly educated,
older, and living in the North or South areas would be more likely to prefer hybrid
vehicles.
0
20
40
60
Combustion Neutral Hybrid
JHS
SHS
JC
42
Ch. 9 Analysis
In this part of the dissertation we present the analysis of hybrid electric vehicles in
China from aspects of the age, region, and education level.
Through the comparison of these three sets of variables, we conclude that different
ages, education levels and regions of consumers are related to their preferences and
attitude toward these two different vehicles. Firstly, the ages of the consumers have
great influence on their choices. From the survey we found that the elderly have
stronger support for hybrid vehicles than young people. In the age range of 50 to 59
years for example, the actual value greatly exceeds the expected value. On the
contrary, the expected value is higher than the actual one between the ages from 20 to
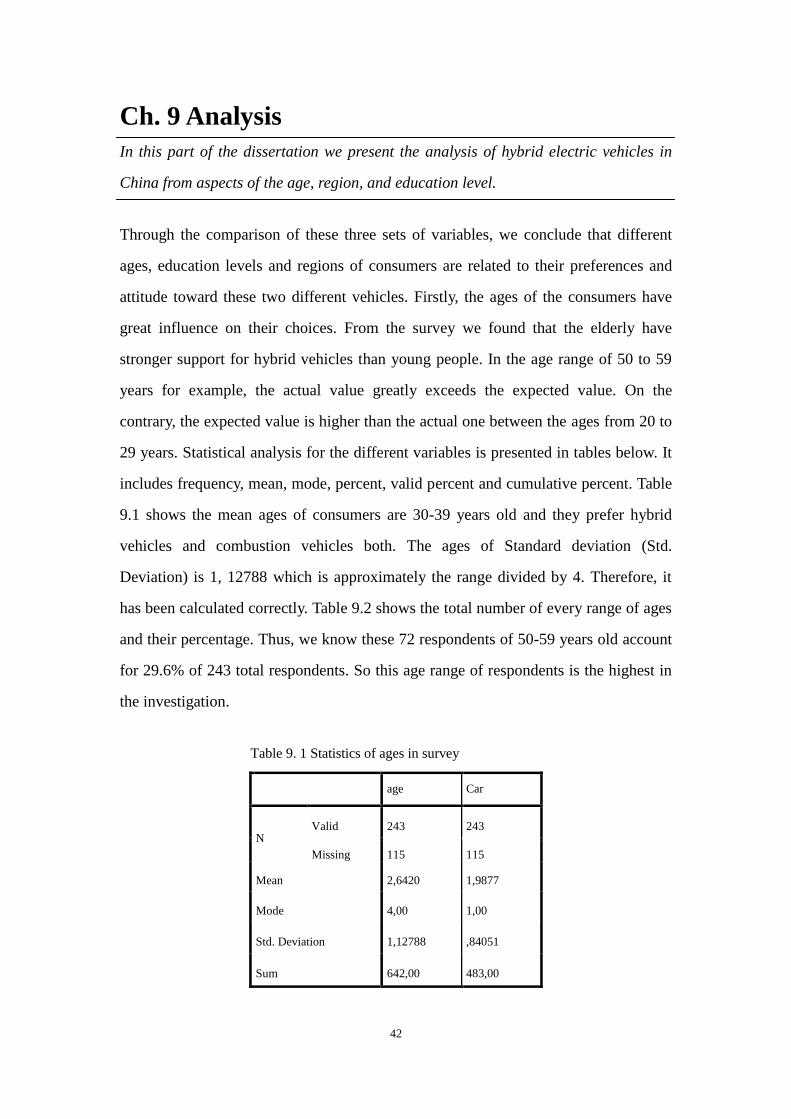
29 years. Statistical analysis for the different variables is presented in tables below. It
includes frequency, mean, mode, percent, valid percent and cumulative percent. Table
9.1 shows the mean ages of consumers are 30-39 years old and they prefer hybrid
vehicles and combustion vehicles both. The ages of Standard deviation (Std.
Deviation) is 1, 12788 which is approximately the range divided by 4. Therefore, it
has been calculated correctly. Table 9.2 shows the total number of every range of ages
and their percentage. Thus, we know these 72 respondents of 50-59 years old account
for 29.6% of 243 total respondents. So this age range of respondents is the highest in
the investigation.
Table 9. 1 Statistics of ages in survey
age Car
N Valid 243 243
Missing 115 115
Mean 2,6420 1,9877
Mode 4,00 1,00
Std. Deviation 1,12788 ,84051
Sum 642,00 483,00

43
Table 9.2 Age of Statistic in survey
Frequency Percent Valid Percent Cumulative
Percent
Valid
20-29 54 15,1 22,2 22,2
30-39 51 14,2 21,0 43,2
40-49 66 18,4 27,2 70,4
50-59 72 20,1 29,6 100,0
Total 243 67,9 100,0
Missing System 115 32,1
Total 358 100,0
Table 9. 3 shows the mean education levels of consumers are from senior high school.
They prefer hybrid vehicles and combustion vehicles both. The ages of Standard
deviation (Std. Deviation) is 1, 09609 which is approximately the range divided by 4.
Therefore, it has been calculated correctly. Table 9.4 shows the total number of every
education and their percentage. Thus, we know these 67 respondents who are
undergraduates account for 27.6% of 243 total respondents. So this education level of
respondents is the highest in the investigation.
Table 9.3 Education of Statistics in survey
education Car
N Valid 243 243
Missing 0 0
Mean 2,4938 2,0947
Mode 2,00 3,00
Std. Deviation 1,09609 ,90641
Sum 606,00 509,00
Table 9.4 Education of Statistics in survey
Frequency Percent Valid Percent Cumulative
Percent
Valid
junior high school 57 23,5 23,5 23,5
senior high school 58 23.9 23.9 51,0
junior college 61 25,1 25,1 76,1
undergraduates 67 27.6 27.6 100,0
Total 243 100,0 100,0

44
Table 9.5 shows the mean locations of consumers are west. They prefer hybrid
vehicles and combustion vehicles both. The ages of Standard deviation (Std.
Deviation) is 1, 12380 which is approximately the range divided by 4. Therefore, it
has been calculated correctly. Table 9.6 shows the total number of every location and
their percentage. Thus, we know these 66 respondents of north account for 27.2% of
243 total respondents. So this location of respondents is the highest in the
investigation.
Table 9.5 Region of Statistics in survey
Region Car
N Valid 243 243
Missing 0 0
Mean 2,5679 2,1193
Mode 4,00 3,00
Std. Deviation 1,12380 ,91710
Sum 624,00 515,00
Table 9.6 Region of Statistics in survey
Frequency Percent Valid Percent Cumulative
Percent
Valid
East 57 23,5 23,5 23,5
West 57 23,5 23,5 46,9
South 63 25,9 25,9 72,8
North 66 27,2 27,2 100,0
Total 243 100,0 100,0
Other than that, consumers who prefer hybrid vehicles and their education levels are
positively correlated, because their awareness of environmental issues is higher than
the lower level educated consumers. Besides, there are different policies carried out
by the governments in different regions. Such as in Beijing, the government has more
stringent controls on environmental issues and environment quality. Therefore, some
policies such as green tax are implemented and environmentally friendly products like
hybrid vehicles are strongly spread. This will apparently affect the attitude of
consumers with regard to the hybrid vehicles in this region.

45
Ch.10 Discussion
In this part of the dissertation we present the discussion of hybrid electric vehicles in
China, the situations, problems, and solutions.
Nowadays, personal transportation mainly relies on vehicles. The number of vehicles
is still increasing. In China, it is estimated nine percent of the CO2 emissions are from
transport. We know that the main gases of greenhouse gas are CO2 and N2O. How to
reduce CO2 emissions in transport becomes a current issue. From our research we
know hybrid vehicles contribute to environmental protection and energy conservation.
They use renewable energy to reduce CO2 emissions which is better than combustion
vehicles. Although the crude oil reserve of the world still increases through human
exploration, it is non-renewable energy which will be consumed one day. People
should strive to seek new alternatives and break this cycle of oil dependence.
Otherwise, consumers’ perceptions are relevant to their purchase decisions. They care
about the product’s price, the quality and the service. Different ages of consumers
have different education levels, and different locations have different consumption
policies. From our statistics, we conclude that consumption is different depending on
different consumers. From the total vehicles’ lifecycle cost, we know hybrid vehicles
are more expensive than combustion vehicles. Because of environmental protection
and energy conservation, hybrid vehicles transfer society costs to private costs which
are supposed to be paid by the environment. Government could use green taxes to
increase the price of combustion vehicles and decrease the price of hybrid vehicles.
Thus it would support “environmental protection and energy conservation” and
punish “pollution”. Government can control the production price through policies.
Besides, consumption also depends on consumers’ consumption concept. The
government’s attitude toward the environment and consumers’ environmental ethics
both are important. If a country decreases the high costs of hybrid vehicles and
reaches toward “environmental protection and energy conservation” it cannot do it
without government policies and consumers’ support.

46
Ch.11 Conclusion
In this part we present the conclusion, validity, reliability and future research.
In this dissertation we have presented the total costs of hybrid vehicles and
combustion vehicles. However, hybrid vehicles’ costs are higher than that of
combustion vehicles. The reason why combustion vehicles have lower total cost is
due to hybrid vehicles transfer society benefits (external costs of noise, air pollution,
greenhouse gases, use limited source of oil and gasoline.) into private costs (battery
cost, higher technology cost). But hybrid vehicles have lower CO2 emissions, and use
renewable energy. Therefore, hybrid vehicles are better for environmental protection
and energy conservation. Many organizations are exploring for reserves of crude oil,
which is increasing supply. But crude oil will be used up, because it is a limited
source. People should strive to seek new alternatives. According to scientific data of
greenhouse effect, CO2 emissions are one of major issues. The main emissions of
CO2 are from vehicles and factories. Therefore, people indirectly choose hybrid
vehicles to support environmental protection and energy conservation is necessary.
Consumers’ perceptions are relevant to their purchase decision. Before consumers
make a purchase decision, they would value the vehicle’s price, the quality, and the
service. Different consumers have their own particular backgrounds such as different
ages, education levels and locations which influence their consumption concept.
Therefore, consumers’ consumption concepts of environmental protection and energy
conservation are very important. There are several literature reviews of scientific
journal articles which support the background and the current issue. We conclude that
different purchase decisions will depend on different consumers (different ages,
education levels, and locations), and the consumers’ behavior will affect the market.
In consideration that the government can influence the consumers’ consumption
concepts, the government may carry out policies such as green tax and subsidies to
support and popularize hybrid vehicles. Besides, higher lifecycle costs of hybrid
vehicles should also be solved by government policies.

47
Validity
As we know, it’s almost never possible that we are the first people who try to study
this subject and fine answer to these research questions. Therefore, we use a number
of literature review, such as text books and published scientific journals as
background to give strong evidence to support our own research. Moreover, based on
correct general hypotheses we carried out a validity based questionnaire survey, and
the respondents gave us their clear view situations. However, due to geographical
restrictions which has been mentioned in chapter 2, there will be some flawed
measurement of the data. In other words, the results are not 100% generalizable.
Reliability
In this dissertation, we used a questionnaire as a method of data collection and we
used website to carry them out. That is to say, we can avoid the respondents’ bias,
which means they would not just say what we want to hear. Other than that, we can
also prevent the observer bias occur which refers to the questions might interpreted
differently, due to it was not interview method. Besides, the reliability of a
questionnaire survey can be tested through internal consistency. Due to the questions
in our questionnaire are correlating with each other, we can measure the respondents’
consistency and test the reliability of the data.
Future research
Nowadays, the environmental and energy issues become more and more popular and
get more attention from the whole world. People are realizing the importance of
saving our own planet. In the future, more helpful and environmentally friendly
policies will be carried out to support environmental protection and energy
conservation, and that is the priority studies which need further research.

48
References
Agresti, A., & Finlay, B. (2009), Chi-Squared Distribution Values for Various
Right-Tail Probabilities, Statistical Methods for the Social Sciences, Pearson
Education Limited, London. ,
Alsahlawi, M.A. (2010), The future prospect of world oil supply: depletion of
resources or price trend, OPEC Energy Review, Vol.34, Iss.2, pp.73-81.
Atrill, P., & McLaney, E. (2008), Full Costing, Accounting and Finance for
Non-Specialists, Pearson Education Limited, London, pp. 267-302.
Ayres, R.U., Turton, H., & Casten, T. (2007), Energy efficiency sustainability and
economic growth, Energy, Vol.32, Iss.5, pp.634-648.
Cao, M., & Xu, Y.X. (2010), Climate protection and motor vehicle regulations:
Evaluation of motor vehicle regulations in China in the context of greenhouse
gas management, A United Nations Sustainable Development Journal, Vol.34,
Iss.4, pp.266-274.
Doucette, R.T., & McCulloch, M.D. (2011), Modeling the prospects of plug-in hybrid
electric vehicles to reduce CO2 emissions, Applied Energy, Vol.88, Iss.7, pp.
2315-2323.
Galinato, G.I., & Yoder, J.K. (2010), An integrated tax-subsidy policy for carbon
emission reduction, Resource and Energy Economics, Vol.32, Iss.3, pp.310-326.
Hawkins,T.R. Gausen, O. M. & Stromman, A. H. (2012), Environmental impacts
of hybrid and electric vehicles a review, Life Cycle Assessment, Springer-Verlag
Berlin , Heidelberg, May 31.
Han, J., Zhou, X., & Imura, H.,(2007), A disparity analysis of regional GDP and CO2
emissions in China based on Theil and shift-share method, Environmental
Science, Vol.20, Iss.6, pp.449-460.
Hervé, C., & Mullet, E., (2009), Age and factors influencing consumer behaviour,
Consumer Studies, Vol.33, Iss.4, pp.302-308.
Lave, L.B., Hendrickson, C.T., & McMichael, F.C. (1995), Environmental
implications of electric cars, Science, Vol.268, Iss.5213, pp.993-995.
Lavea, L.B., & MacLeanb, H.L. (2002), An environmental-economic evaluation of
hybrid electric vehicles: Toyota's Prius vs. its conventional internal combustion
engine Corolla, Transport and Environment, Vol.7, Iss.2, pp.155-162.
Lipman, T.E., & Delucchi, M.A. (2006), A retail and lifecycle cost analysis of hybrid
electric vehicles, Transport and Environment, Vol.11, Iss.2, pp.115-132.
MacDonald, W. (1999), Faces of the future: what will drive the cars of the next
millennium? The Chronicle-Herald The Mail-Star, Halifax, Canada, October 21.
Matson, R.J., & Carasso, M. (1999), Sustainability, energy technologies, and ethics,
Renewable Energy, Vol.16, Iss.1-4, pp.1200-1203.

49
Montzka, S. A., Dlugokencky, E. J., & Butler, J. H., (2011) Non-CO2 greenhouse
gases and climate change, Nature, pp. 43-50.
Makela, C.J., & Peters, S., (2004), Consumer education: creating consumer awareness
among adolescents in Botswana, Consumer Studies, Vol.28, Iss.4, pp.379-387.
Perloff, J.M. (2012), Production possibilities curve, Microeconomics, Pearson
Education Limited, London, pp.354-360.
Pruis, E. (2011), The five key principles for talent development, Industrial and
Commercial Training, Vol.43, Iss.4, pp.206-216.
Saunders et al. (2009), Research process onion, Chapter 5 Formulating the research
design, Available at: http://www.doc88.com/p-582676638377.html, Access at:
24/June/2013/ 15:14:49
Turner,K., Pearce, D., & Bateman, I. (1993), Green Taxes, Environmental Economics,
The Johns Hopkins University Press, Baltimore.
Woolf, S.H., & Johnson, R.E. (2005), The Break-Even Point: When Medical
Advances Are Less Important Than Improving the Fidelity With Which They Are
Delivered, Family Medicine, Vol.6, Iss.3, pp.545-552.
Yee, J., & San, N.C. (2011), Consumers' Perceived Quality, Perceived Value and
Perceived Risk Towards Purchase Decision on Automobile, Economics and
Business Administration, Vol.3, Iss.1, pp.47-57.
Yi, H.H., Hao, J., & Tang, X.L. (2006), Atmospheric environmental protection in
China: Current status, developmental trend and research emphasis, Energy
Policy,Vol. 35, Iss.2, pp.907-915.
Zhou, X., & Imura, H., (2011), How does consumer behavior influence regional
ecological footprints? An empirical analysis for Chinese regions based on the
multi-region input–output model, Ecological Economics, Vol.71, pp. 171-179.
Zhang, Z.X. (1995), Energy conservation in China, Energy Policy, Vol.23, Iss.2,
pp.159-166.

50
Appendix
Appendix.1 Questionnaire:
We designed the questions and start to calculate points from question 5 and there are
18 choices in total. In specific, 6 As= 6 points, 3 Ds +3 Bs=18 points. That is to say, if
you choose A add 1 point, if you choose B add 2 points, if you choose C add 3 points,
and if you choose D add 4 points. The lowest point is not 0, the maximum point are
the people who choose all Ds or Bs which is 18, and the lowest points is the people
who choose all As which is 6 points in total. Based on every respondent’s final total
points, we can see their preferences of either combustion vehicles or hybrid vehicles,
or in neutral. In addition, if the respondents have 6,7,8,9 points, then that means they
support combustion vehicles. If the people have total points of 10, 11, 12, 13, 14 they
are in the middle. If the people have 15,16,17,18 points that means they support
hybrid vehicles.
Male Female
1. What is your age? _____
A. 20-29
B. 30-39
C. 40-49
D. 50-59
2. Degree of education? _____
A. junior high school
B. senior high school
C. junior college
D. undergraduates
3. Where are you from? _____
A. East
B. West
C. South
D. North
4. How much is your monthly consumption? _____

51
A. Less than 3999 RMB
B. 4000-5999 RMB
C. 6000-7999 RMB
D. more than 8000 RMB
5. How much do you know about hybrid electric vehicles regarding fuel
consumption, energy conservation, emissions reduction? _____
A. no idea
B. a little
C. much
D. very much
6. Do you know any companies selling hybrid electric vehicles? _____
A. No
B. Yes
7. How much do you know about combustion vehicles regarding fuel consumption,
energy conservation, and emissions reduction?
A. no idea
B. a little
C. much
D. very much
8. Do you support environmental protection? _____
A. no support
B. in middle
C. support
D. support very much
9. Do you consider environmental protection when you plan to buy a car? _____
A. No
B. Yes
10. If you want to buy a car which one would you choose? _____
A. combustion vehicle
B. hybrid electric vehicle