environmental pollution resulting from the use of depleted uranium weaponry against iraq during 1991...
TRANSCRIPT

Environmental Pollution Resulting Environmental Pollution Resulting from the Use of Depleted Uranium from the Use of Depleted Uranium
Weaponry Against Iraq During Weaponry Against Iraq During 19911991
Dr. Souad Naji Al-AzzawiAssistant Prof. Environmental Eng. Dept
University of Baghdad - Iraq

During the aggression of 1991, the United States and its allies used a new generation of radiological weapons on Iraq…
Airforce A-10 aircraft fired about 940,000 30 mm rounds of DU during the war.
The weight of each penetrator is 272 gm- hence, about 256 tons of DU were fired.
M1A1 tanks fired 120 mm rounds of 4.1 Kg each.
M1 and M60 tanks fired 105 mm rounds of 3.4 Kg each.
14,000 DU tank rounds were fired.
7,000 DU rounds were fired during training in Saudi Arabia.
4,000 DU rounds were fired during combat.
3,000 DU rounds were lost in fires and accidents.
A total of 600 – 800 tons of DU expenditures lay within Iraqi territory.

Table (1) shows the types of DU-related weaponry used in the 1991 aggression against Iraq:
CartridgeCaliber (mm)
Type of Weapon DU Weight
GAU-8 30 Air Force A- 10A Thunder bolt II 300 gm
PGU-14 30 Navy Version 300 gm
M735A1 105 US Army – Tanks M1 and M60 equipped with an M68 2.2 kg
M774 105 US Army 3.4 kg
M827 120US Army – Tanks M1 , M60 and Tanks MIA1, MIA2,
“Abrams”3.1 kg
M829 (E1&E2) 120US Army – Tanks M1 , M60 and Tanks MIA1, MIA2,
“Abrams”4.0 kg
M829 (A1&A2) 120US Army – Tanks M1 , M60 and Tanks MIA1, MIA2,
“Abrams”4.9 kg
M833 105 US Army – Tanks M1 , M60 equipped by EX35-105 mm 3.7 kg
XM919 25 US Army – Bradley Fighting Vehicle 85 g
XM900E1 105 US Army – Tanks M1,M60 10 kg
ADAM & PDMLand Mines
US Army –155 mm howitzer 0.1 gm

Figure (1) Shows the different parts of a DU penetrator

Objectives of the Study…
This research is part of a series of researches conducted to define environmental pollution and damage resulting from the use of DU weaponry in Iraq. The following measurements were conducted during 1995 – 1996 in southern Iraq, where DU weapons were heavily used:
1- Measuring the increase in radioactivity through field investigation and detection.
2- Environmental sampling of soil, surface and ground water, plants and animal tissues related to the food chain.
3- Laboratory testing and analysis.
4- Modeling radiological contamination through environmental pathways to the human body and population in the study area.
5- Defining the whole body dose the people of Al-Basrah and the troops were exposed to during 1991 and the following years.
This lecture will deal with points 1, 2 and 3 only…

Primary Areas of D.U. Expenditure

The Study Area…
The study areas are mainly suburbs of Al-Basrah city, where depleted uranium weapons were used extensively. The selected study areas were:
Jabal Sanam
Safwan
Al-Zubair
Northern Rumaila Oil Fields
Southern Rumaila Oil Fields

Field and Laboratory Work…
Six researchers and 14 assistants conducted the following research:
1- Full investigation to define geology, topography, hydrology and hydrogeology, geomorphology, soil condition, climatology, vegetation cover, and wild life status in the area.
2- Radiological detection to define the gamma radiation exposure using portable scintillation counters.
3- Soil sampling from high exposure rate areas. Samples from areas where 13 destroyed tanks and four armored vehicles were also collected. Six to eight soil samples were reclaimed from and around each destroyed target at different depths.
4- Surface water samples from waterways and wadies were reclaimed and also groundwater samples from existing deep wells in the area. Bottom sediments from nearby channels were also collected.
5- Biotic samples of wild plants, vegetables and different kinds of meat (fish, sheep, cows) were also collected.

Frequency and Wind Speed of Study Area
Movement and Direction of Sandstormsin the Study Area

Sample Sample Depth (cm)Depth (cm)
X1 0 – 5
X21 0 – 5
X22 5 – 15
X23 15 – 30
X3 0 – 5
X4 0 – 5
Sampling Scheme from Areas of Destroyed Targets by DU Weapons

Samples Location at Safwan – Jabal Sanam Areas

Samples Location in Northern Rumaila Oil Fields

Sample Location in Southern Rumaila Oil FieldSample Location in Southern Rumaila Oil Field

Sample Location in Basrah – Zubair AreaSample Location in Basrah – Zubair Area

Table (2) shows the number and types of samples that were collected from the area:
Types of measure or sample No.
Exposure Rate Samples 124
Soil Samples 124
Ground and Surface Water Samples 58
Biosphere Samples 154
Important Notes:
Exposure measurements and environmental sampling were all done according to IAEA standard methods.
Laboratory tests were done using a high purity Germanium analyzer from the Iraqi Atomic Energy Organization’s environmental laboratories.
The following tables show the results of the soil, water and biotic sampling program…

Sample No. Exposure Rate µ R/h
Sample No. Exposure Rate µ R/h
Sample No. Exposure Rate µ R/h
S-2-3 28.3 S-5-1 16.9 RK-1-1 80.8 SN-1-3 36.9 S-6-1 14.3 RK-2-1 51.3 SN-2-3 17.1 R-1-3 51.7 RK-3-1 42.0 S-2-9 30.2 R-3-2 58.6 RK-4-1 43.0 S-4-3 15.2 R-4-2 46.1 S-7-1 49.5 S-2-4 79.3 S-5-2 17.1 RK-1-2 78.3
SN-1-4 184.5 S-6-2 14.5 RK-2-2 51.9 SN-2-4 89.4 R-1-4 51.1 RK-3-2 43.1 S-2-10 82.4 R-3-3 59.0 RK-4-2 43.3 S-4-4 83.2 R-4-3 43.2 S-7-2 48.1
SN-1-1 36.9 S-5-3 16.3 RK-1-3 79.8 SN-2-1 17.0 S-6-3 14.4 RK-2-3 51.3 S-2-1 28.0 S-1-5 50.9 RK-3-3 42.8 S-4-1 15.1 R-3-5 80.6 RK-4-3 43.3 S-7-4 101.7 R-4-4 78.2 S-7-3 48.9
SN-1-2 36.8 S-5-4 92.1 RK-1-4 152.3 S-2-2 28.6 R-1-1 81.7 RK-3-4 92.1
SN-2-2 17.1 S-6-5 75.4 RK-2-5 98.3 S-4-2 15.3 R-4-1 45.3 RK-4-5 87.2 S-2-7 30.1 R-1-6 75.3 RK-3-6 9.8 S-2-8 30.5 R-3-1 59.6 RK-3-7 9.3
Selected Air Rate Exposure ReadingsSelected Air Rate Exposure Readings

Radionuclide Concentration Bq/Kg Radionuclide Concentration Bq/Kg Symbol U-235 Th-234 U235/
U238 Bi-214 Pb-214 Symbol U-235 Th-234 U235/
U238 Bi-214 Pb-214
S-5-1 170 12150 0.0139 81.1 80.7 SN-2-2 23.8 2170 0.0196 82.9 89.3 S-5-2 102 10910 0.0093 60.3 65.1 SN-2-3 47.3 2550 0.0185 97.4 111 S-5-3 79 7310 0.010 59.1 59.8 SN-2-6 118 6810 0.0173 124 129 S-5-5 12 1812 0.0066 45.1 45.7 S-4-1 65 4100 0.0158 51.1 60.0 S-6-1 70 3325 0.020 60.9 58.1 S-4-2 30.9 3408 0.009 41.7 49.5 S-6-2 36.3 2019 0.017 60.1 57.2 S-4-3 31.8 3115 0.0064 42.1 42.3 S-6-3 36.9 2100 0.0175 57.3 50.3 R-4-3 70.3 9700 0.0072 45.9 43.1 R-1-3 198 12700 0.0155 40.3 39.1 RK-1-1 901 55700 0.0161 50.8 53.4 R-1-4 83.1 3000 0.027 47 46.2 RK-1-2 937 42100 0.022 52.7 50.4 R-1-5 78.1 4950 0.0157 52.6 40.6 RK-1-3 488 21100 0.023 36.7 34.9 R-1-6 375 27800 0.0138 ND 41.6 RK-1-6 10.23 633 0.016 30.2 39.7 R-3-1 1050 63700 0.016 41.7 48.9 RK-2-1 531 40900 0.013 60.1 51.9 R-3-2 119 7940 0.014 44.9 42.8 RK-2-2 212 23300 0.009 58.0 55.3 R-3-3 1079 65200 0.016 54.9 60.2 RK-2-3 81 11800 0.006 49.3 50.1 R-3-5 43 3170 0.0135 35.4 44.9 RK-3-1 412 37350 0.011 58.3 57.3 R-4-1 202 14660 0.0137 54.9 53.6 RK-3-2 198 21700 0.009 56.1 51.5 R-4-2 112 10300 0.0108 51.3 52.9 RK-3-3 73 9125 0.008 50.0 52.1 S-2-1 78.3 5210 0.0149 65.1 62.3 RK-4-1 229 31600 0.007 62.3 61.5 S-2-2 41.9 3918 0.0106 57.3 59.8 RK-4-2 115 23010 0.0049 50.1 50.3 S-2-3 30.3 2720 0.011 49.5 51.7 RK-4-3 60 13200 0.0043 50.7 47.3 S-2-7 109 9340 0.0116 89.3 90.7 S-7-1 86.3 6010 0.0143 44.9 47.1 S-2-8 88 7516 0.0117 77.8 81.2 S-7-2 25.1 3120 0.008 41.3 40.0 S-2-9 57.1 4401 0.0129 59.6 62.1 SN-1-1 60 1830 0.0327 44.3 35.9
SN-1-2 183 11400 0.167 56.3 49.3 SN-1-3 169 856 0.197 34.5 36.4
Selected Higher Lab Results of Soil Sample TestingSelected Higher Lab Results of Soil Sample Testing

SYMBOL Ra-226 Bi-214 Pb-21481.6 175 62.5
S190.2 160 60.1102 207 62.7
S298 198 59.3
70.6 158 148S3
81.3 142 13732.5 12.4 30.2
S440.1 18.3 33.148 114 37.7
W137 108 35.223 47 39
W228 52 43ND 36 21.3
W3ND 33 17.5ND 21 ND
W4ND 18 ND
Selected Higher Concentration of Radionuclides in Water and Water Sediments
Bq/Kg Symbol Sample type Wt. (gms) Location
Distance from target
Th-234
Ra-226
Bi-214
Pb-214
T2 HS HS HS
196 200 182
Under the hit area By tank
Between tank and tower
5-2 1 5
ND ND ND
114 ND 96
54 52 56
34 31.3 38
T4 RE SS
189 162
Beside tank Beside tank
2 1.5
ND ND
ND ND
42.5 25.1
48 19.3
T13 RE HS
200 197
Beside tank In front of tank
2 2
ND ND
ND ND
23.3 61.1
19.5 44.6
T5 RE HS
180 157
Beside tank Beside tank
1 1.2
ND ND
ND ND
59.6 45.1
48.1 43.2
T6 RE HS
177 161
In front of tank Behind tank
2 1.5
ND ND
ND ND
48.2 55.5
44.3 46
A3 SC HS
220 192
Near hit area Beside shell
5-1 1
ND ND
78.3 ND
44.5 35.1
44.6 30.5
A4 HS SC
180 196
Beside shell Around shell
1.3 2
ND ND
ND ND
55.1 50.3
40.6 55.6
T7
SC
258 241 246
Beside tank Beside tank Around tank
0.75 2 2
ND ND ND
ND ND ND
59 58.3 60.1
19.7 21.8 33.3
T9
SP SC RE SC
107 185 201 150
Behind tank Near hit area
In front of tank Near hit area
1 5-1 2
5-1
ND ND ND 249
ND 119 ND 275
57 62
51.5 48.5
41 29
47.1 48.6
T10 SC SP PS
195 102 155
Around tank In front of tank
Beside tank
2 2.2 3
ND ND ND
ND ND ND
47 57 48
33.1 41.1 19
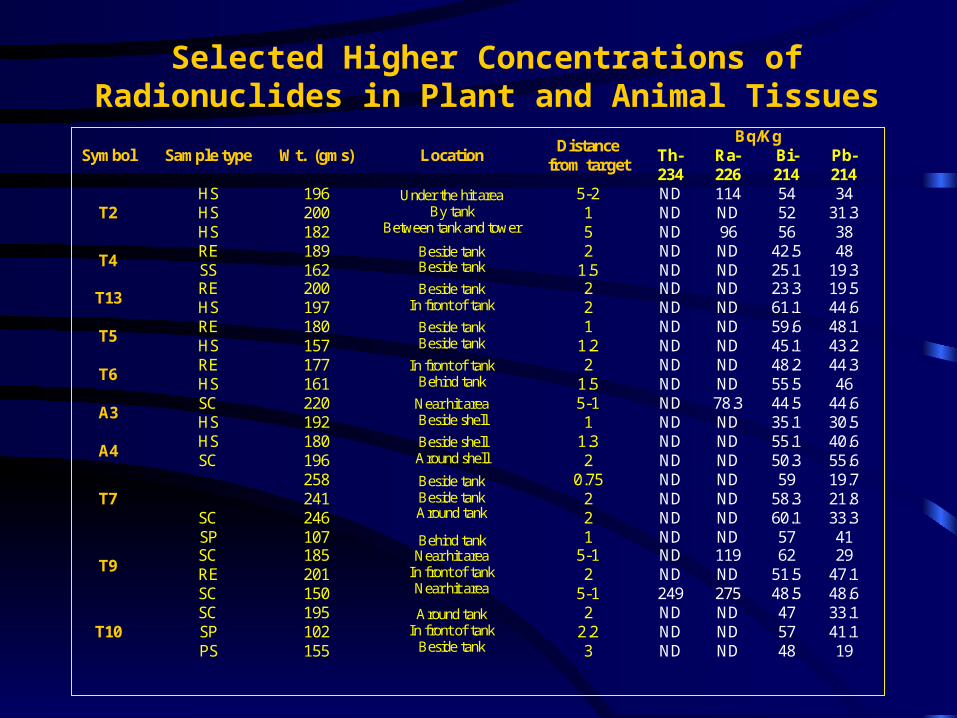
Selected Higher Concentrations of Radionuclides in Plant and Animal Tissues

Air (6-7)μ R/h
Soil Th-234 U -235 Ra-226
undetectable undetectable 55 Bq/kg
Water Ra-226 50 Bq/kg Water Sediments Ra-226 20-40 Bq/kg
Results and Conclusions…Results and Conclusions…
The following table shows the natural radiation background levels of the measured radioisotopes in the study area from the previous studies.

• High exposure rates of gamma radiation were detected in the areas of destroyed tanks and armored vehicles. The increase in the exposure rates ranged between 8 – 184 μR/hr. The background exposure level in the study area is 6 – 7 μR/hr.
• The highest exposure rates were recorded in the Jabal Sanam area, Southern Rumaila Oil Fields and Northern Rumaila Oil Fields in that order. Safwan and Al-Zubair measurements indicated slight increases of exposure in correlation to background levels. Destroyed artilleries were removed from these areas without any signs or indicators of where they had been. The limited exploration and sampling program is the major cause of poor detection in these areas.

• Soil sample laboratory tests proved high activity concentrations of U-235 and U-238 measured as Th-234. Activity concentration measurements of U-235 in soil samples from contaminated areas of destroyed tanks and vehicles ranged from 60 – 1050 Bq/Kg. For Th-234, the range was 237 – 65,200 Bq/Kg.
• The highest activity concentrations were measured from soil samples 0.1 m away from the targets. Surface soil recorded higher U-235, U-238 activity levels than samples from 5 – 15, or 15 – 30 cm deep. High activity levels were also recorded for soil or dust reclaimed from inside the tanks.

• The activity concentration ratios of U-235/U-238 range between 0.003 – 0.0327 which are less than 0.046. This proves that this activity results from DU radioisotopes and not from natural radiation activity.
• Since dominant wind and sandstorm direction is north-west south-east most of the contaminants were transported back to Kuwait and Saudi Arabia.
• No radiological activity could be detected in surface and ground water samples collected from the area. Sediments from channels and wadies in the area showed 2 – 3 fold increase in radioactivity.
• High Th-234 activity concentrations were detected in four samples of wild plants (Haloxylon Salicornicum and Stippa Capenisis) that were close to one of the destroyed tanks in Jabal Sanam and the Southern Rumaila Oil Fields.

Conceptual Model of the Radioactive Mass Distribution in Conceptual Model of the Radioactive Mass Distribution in Environ. Pathways from One Destroyed Tank by D.U.Environ. Pathways from One Destroyed Tank by D.U.

In phase 2 of this research, the following was done: In phase 2 of this research, the following was done:
1- Modeling of DU-related radioisotopes transport and spreading from 5,724 contaminated destroyed target to the surrounding areas, and the definition of their concentrations in: air, water, soil, vegetation cover of the previous figure.
2- Use of reverse analysis to define DU radionuclides concentrations in 1991 and the following years instead of 1996 only.
3- The prediction of total contaminated soil areas, water and water sediments, vegetation cover for the period of 1991 – 1996. The areas were categorized as either high, medium or low contamination. Results of DU contamination modeling is shown in the table…
Environmental Environmental ElementElement
Measuring Measuring UnitUnit
Level of Contamination Total
High Medium Low
Soil Km² 4.295 8.590 1705.1 1718
Water m³ 423,318 490,591 972,194 1,886,103
Channel Deposits m² --- --- --- 140,000
Vegetation Cover Ton --- --- --- 845,100

