environmental noise modeling-final report-updated.pdf
TRANSCRIPT

Environmental Noise Modeling Using Soundplan 7.2 Software
1
Chapter-1
INTRODUCTION
The worldwide development in urbanization presents a common factor, i.e., the
worsening of environmental pollution through gas emissions, water pollution and noise
pollution.
Amongst all of these types of pollution’s, environmental noise is a worldwide
problem. However, the way the problem is dealt with differs vastly from country to
country and is very much dependent on culture, economy and politics. But the problem
continues even in areas where extensive resources have been used for regulating,
assessing and damping noise sources or for creation of noise barriers. For example, the
noise that spreads urban populations is produced by various sources, whose nature may
be simple or complex, comprising noise generated by industries (e.g., from the metal
mechanical and construction sectors), transportation systems (roads, railroads, aircraft),
by neighbours, and by a wide variety of leisure activities such as cultural and sports
events, etc. Many sectors of society are affected by noise pollution. In response to urban
and industrial noise pollution, many studies have focused on environments intended for
activities that involve a high degree of cognitive and intellectual activity, such as
educational and working environments.
In recent years, noise and urban planning have been studied extensively based on
noise mapping.
Management of the risks associated with using noise mapping predictions requires
clear communication of the relevant issues between practitioners and the end users of the
information. Therefore it is necessary for all parties involved to have some appreciation
of what is involved when producing environmental noise models and the range of
approaches that can be adopted. In particular, what it is that a noise model will represent,
for which types of applications do models offer useful information, and what are the
relative benefits and limitations of modelling compared to other types of objective
assessment?

Environmental Noise Modeling Using Soundplan 7.2 Software
2
In the preceding sections, environmental noise modelling overview has been
discussed to address these types of questions, and thus provide a basis on which non-
technical parties can engage with practitioners.
1.1 Why Environmental Noise Modelling
This thesis has been prepared for all parties who commission, undertake or use
environmental noise predictions for commercial or industrial operations, of whatever type
or scale, for which an environmental noise assessment may be required.
The guidance is directly pertinent to predictive studies carried out in support of
the following types of assessment:
Pollution Prevention and Control (PPC) permitting
BS 4142 and BS 9142 based investigations
ADNOC Code of Practice on Environmental Impact Assessment Planning
condition compliance
Development of site specific noise mitigation methodologies
The guide is intended to:
Raise awareness of the usefulness of environmental noise prediction studies
Raise awareness of the intrinsic inconsistency of environmental noise fields, and
the subsequent risk of incorrect assessment outcome that may result when
attempting to utilise any objective rating method
Provide an understanding of the types of possibly significant risks involved in
using environmental noise predictions to inform decision making processes
Promote the management of such risks from the outset of an investigation by
adopting a organized approach to the design of prediction studies that recognises
the relationship between variability, uncertainty and risk
Raise awareness of the inevitable practical, technical, and commercial limitations
that succeed in all methods of noise assessment, and of the conclusion that limited
assessment resources are best focused on decrease of risk rather than of
uncertainty

Environmental Noise Modeling Using Soundplan 7.2 Software
3
Assist users to balance the risks arising from a restricted predictive study against
other constraints and considerations, and thus identify instances where alternative
assessment methods may need to be considered
1.2 Environmental Noise Modelling
Environmental noise modelling describes the procedure of theoretically
estimating noise levels within a region of interest under a precise set of conditions.
The precise set of conditions for which the noise is being estimated will be a fixed
representation or 'snapshot' of a physical environment of interest. However, in practice
the physical environment around us will usually not be fixed, but will be characterized by
continually varying conditions. These variations in real world conditions will then cause
the actual sound field to differ in time and space. Thus it is important to identify that the
output of an environmental noise model(s) will only signify an estimate for a ‘snapshot’
of the range of actual environmental noise levels that could occur in time and space.
Knowing that noise modelling is a means of estimating noise for a specific set of
conditions, then the questions arises what these conditions are. The key conditions that a
noise model relates to are:
An estimation of the noise source, or sources, for which associated environmental
noise levels are of interest
An approximation of the physical environment through which noise will spread in
to surrounding from the noise source(s) to the location or area of interest. This
includes the ground terrain, the built environment, and weather conditions (e.g.
wind, temperature, humidity)
An approximation of the way in which sound will travel from the input noise
source(s) via the input physical environment, to the receiver location or area of
interest.
Thus, creating an environmental noise model involves defining a series of noise
sources to be scrutinized, describing acoustically important features of the
environment through which sound will propagate to the receiver, and then
applying a calculation method that accounts for these descriptions to produce an
Environmental Noise Modeling Using Soundplan 7.2 Software
4
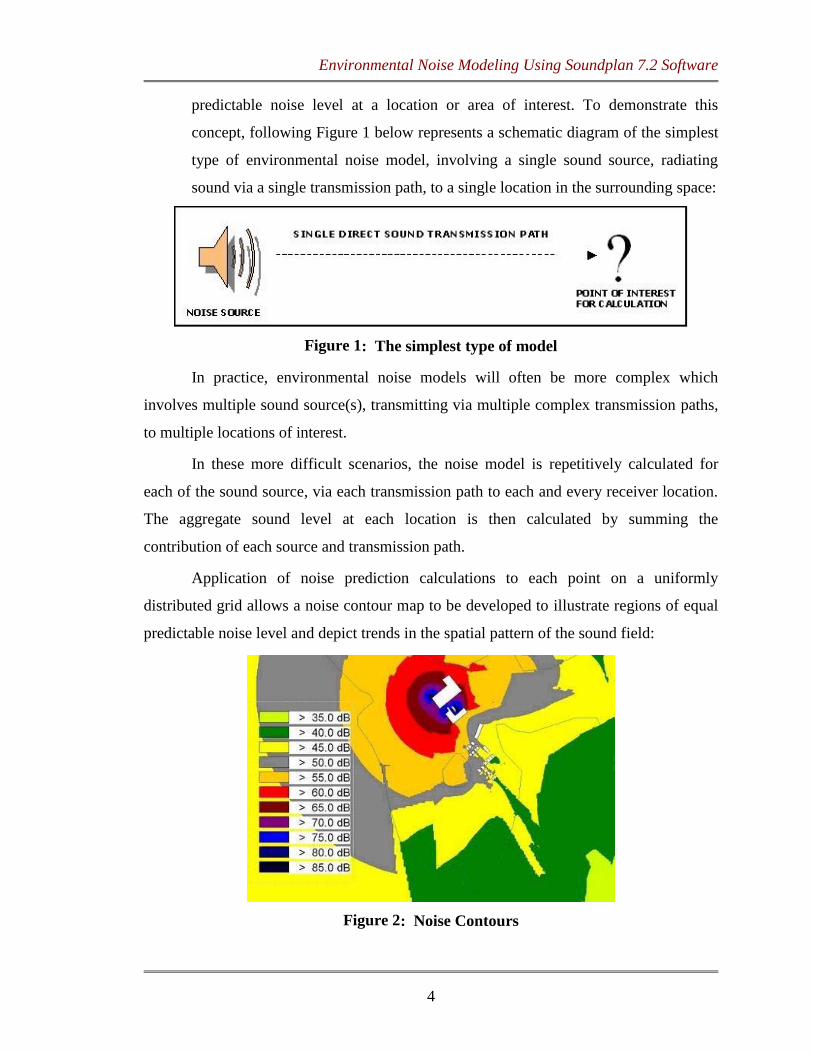
predictable noise level at a location or area of interest. To demonstrate this
concept, following Figure 1 below represents a schematic diagram of the simplest
type of environmental noise model, involving a single sound source, radiating
sound via a single transmission path, to a single location in the surrounding space:
Figure 1: The simplest type of model
In practice, environmental noise models will often be more complex which
involves multiple sound source(s), transmitting via multiple complex transmission paths,
to multiple locations of interest.
In these more difficult scenarios, the noise model is repetitively calculated for
each of the sound source, via each transmission path to each and every receiver location.
The aggregate sound level at each location is then calculated by summing the
contribution of each source and transmission path.
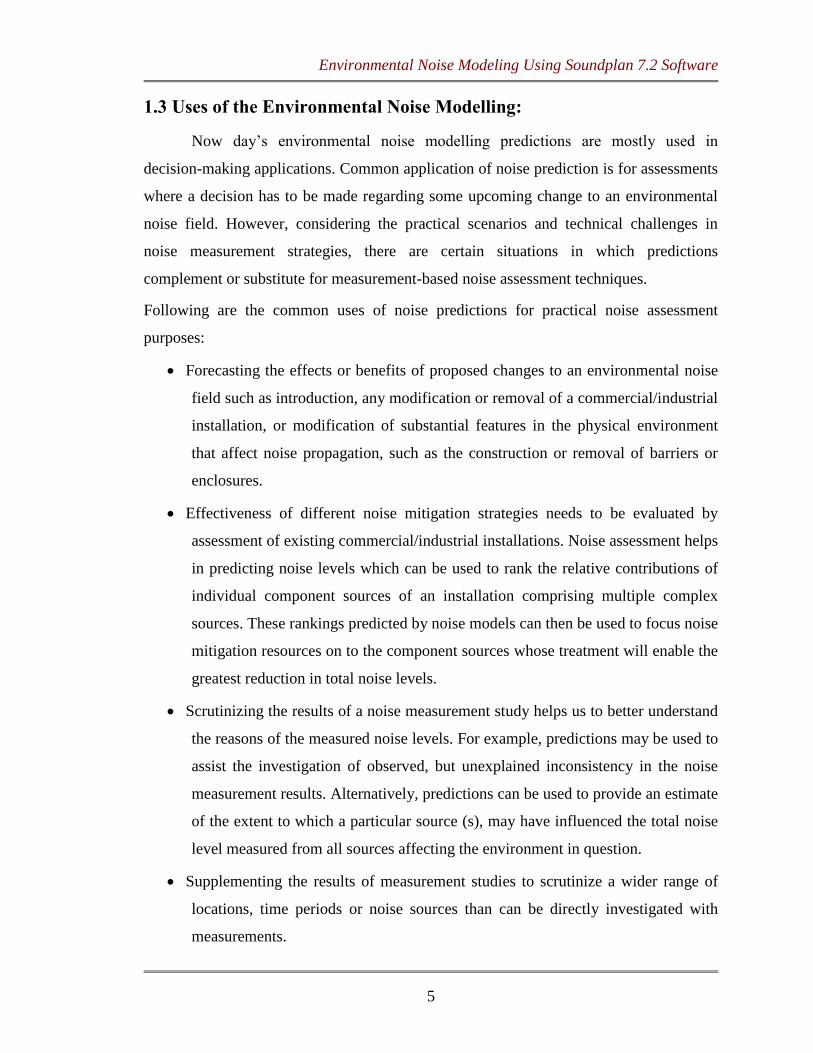
Application of noise prediction calculations to each point on a uniformly
distributed grid allows a noise contour map to be developed to illustrate regions of equal
predictable noise level and depict trends in the spatial pattern of the sound field:
Figure 2: Noise Contours
Environmental Noise Modeling Using Soundplan 7.2 Software
5
1.3 Uses of the Environmental Noise Modelling:
Now day’s environmental noise modelling predictions are mostly used in
decision-making applications. Common application of noise prediction is for assessments
where a decision has to be made regarding some upcoming change to an environmental
noise field. However, considering the practical scenarios and technical challenges in
noise measurement strategies, there are certain situations in which predictions
complement or substitute for measurement-based noise assessment techniques.
Following are the common uses of noise predictions for practical noise assessment
purposes:
Forecasting the effects or benefits of proposed changes to an environmental noise
field such as introduction, any modification or removal of a commercial/industrial
installation, or modification of substantial features in the physical environment
that affect noise propagation, such as the construction or removal of barriers or
enclosures.
Effectiveness of different noise mitigation strategies needs to be evaluated by
assessment of existing commercial/industrial installations. Noise assessment helps
in predicting noise levels which can be used to rank the relative contributions of
individual component sources of an installation comprising multiple complex
sources. These rankings predicted by noise models can then be used to focus noise
mitigation resources on to the component sources whose treatment will enable the
greatest reduction in total noise levels.
Scrutinizing the results of a noise measurement study helps us to better understand
the reasons of the measured noise levels. For example, predictions may be used to
assist the investigation of observed, but unexplained inconsistency in the noise
measurement results. Alternatively, predictions can be used to provide an estimate
of the extent to which a particular source (s), may have influenced the total noise
level measured from all sources affecting the environment in question.
Supplementing the results of measurement studies to scrutinize a wider range of
locations, time periods or noise sources than can be directly investigated with
measurements.

Environmental Noise Modeling Using Soundplan 7.2 Software
6
Supporting the design of measurement studies by using noise predictions to
understand the possible criticality of the situation before obligating to expensive
measurement studies. The noise predictions results can be used to identify
situations that are most serious to the assessment outcome, such as locations
where noise levels might be anticipated to be similar to some threshold value
where the assessment outcome considerably differs.
This knowledge can then be used to design the measurement study in a way that
focuses the available resources on the most effective strategy. A further benefit of
noise model predictions used in this way is the reference it provides when
conducting post measurement analysis to judge the validity of a set of
measurements, and whether there are any aspects of the results that differ from
original expectations and then permit specific explanation or further analysis.
1.4 Information Needed to Construct a Noise Model
There are many approaches to environmental noise modelling which varies in
terms of the complexity with which each element of the model is described and analysed.
However, regardless of the chosen approach in noise modelling, the important
information to all noise prediction studies is the systematic representation of the noise
sources to be investigated and the physical environment (surroundings) through which
noise will transmit to the receivers. Once these are important information defined
properly, an estimate in which noise will travel from the noise sources to the receivers is
also required. Following Table 1 shows the necessities for specifying a noisy
environment:
Environmental Noise Modeling Using Soundplan 7.2 Software
7
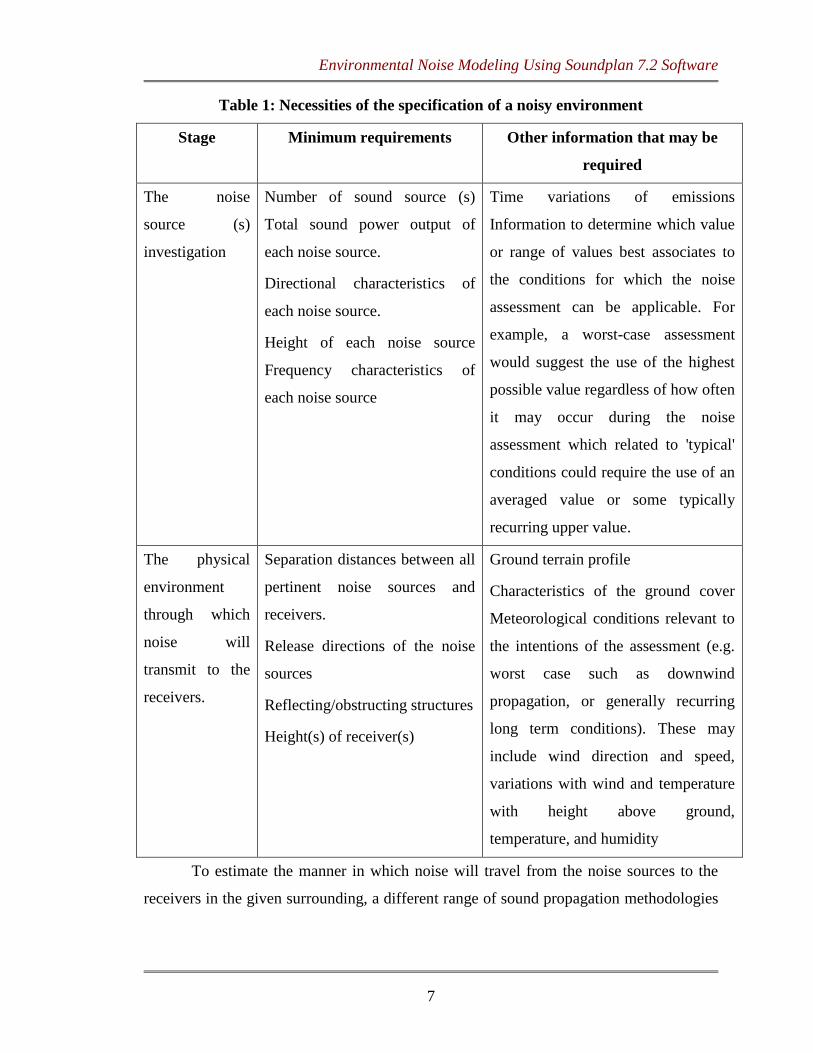
Table 1: Necessities of the specification of a noisy environment
Stage Minimum requirements Other information that may be
required
The noise
source (s)
investigation
Number of sound source (s)
Total sound power output of
each noise source.
Directional characteristics of
each noise source.
Height of each noise source
Frequency characteristics of
each noise source
Time variations of emissions
Information to determine which value
or range of values best associates to
the conditions for which the noise
assessment can be applicable. For
example, a worst-case assessment
would suggest the use of the highest
possible value regardless of how often
it may occur during the noise
assessment which related to 'typical'
conditions could require the use of an
averaged value or some typically
recurring upper value.
The physical
environment
through which
noise will
transmit to the
receivers.
Separation distances between all
pertinent noise sources and
receivers.
Release directions of the noise
sources
Reflecting/obstructing structures
Height(s) of receiver(s)
Ground terrain profile
Characteristics of the ground cover
Meteorological conditions relevant to
the intentions of the assessment (e.g.
worst case such as downwind
propagation, or generally recurring
long term conditions). These may
include wind direction and speed,
variations with wind and temperature
with height above ground,
temperature, and humidity
To estimate the manner in which noise will travel from the noise sources to the
receivers in the given surrounding, a different range of sound propagation methodologies
Environmental Noise Modeling Using Soundplan 7.2 Software
8
can be employed. Sound propagation methods vary extensively in their complexity and
the scope of applications for which they can offer significant predictions.
The most basic form of noise propagation methodology is described as 'spherical'
or 'hemi- spherical' spreading. This noise propagation method simply accounts for the
discount in sound intensity as a sound wave front propagates over a larger area.
For common types of noise sources in relatively simple environments, where
separating distances are relatively lesser and there are no superseding structures to
obstruct noise propagation, this type of method is often sufficient for estimation purposes.
In instances where the noise sources are more multifaceted and/or account must
be made of the effect of significant features of the physical environment, more robust and
thorough information is needed to describe the propagation of noise in the surroundings.
In most types of practical applications, engineering methods used to provide the most
feasible basis for predicting environmental noise levels. These methods rely on a
combination of acoustic principles and empirical knowledge to provide a means of
estimating the influence of a range of phenomena, including:
The absorption associated with the passage of noise through the surroundings
The change in noise level that occurs as a result of interactions between the sound
wave travelling directly to the receiver and those reflected from the ground,
accounting for influence of the ground cover type
The weakening of the noise level offered by barriers that fully or partly obstruct
line of sight between a source and a receiver location
The influence of atmospheric conditions that can change the direction of an
advancing sound wave front by refracting the wave at points where there are
significant changes in wind speed and/or temperature
The influence of reflecting surfaces that re-direct an advancing sound wave front
Engineering methods to determine noise levels can therefore take account of a
wide range of features that influence noise transmission, and their use for multi-source
industrial/commercial applications can become difficult when all pertinent paths of sound
transmission are taken into consideration. Whilst these noise prediction methods provide
a robust way of describing sound transmission in many general applications, it must be

Environmental Noise Modeling Using Soundplan 7.2 Software
9
recognised that there will be more difficult situations where their explanation does not
properly account for what will actually happen in reality. Example situations include
assessments linking to noise sources with very distinct frequency characteristics and, in
particular, situations where the influence of different aspects of the physical environment
cannot be considered in isolation.
Hence it is important that noise modelling methods are used with proper regard to their
limitations. It means that their explanations are only relied upon for very comprehensive
value estimates of the noise where practicable to do so (e.g. in several instances where
you might have seen about large margin between the predicted value and the decision
threshold). Instead, it can be a case of modifying the predicted values where the
limitations can be quantified. In few of the instances though, it is necessary to abandon
the results provided by noise modelling methods, and to refer more advanced analytical
methods or pursue an alternative to predictions as a basis for informing the assessments.
The limitations of the noise modelling methods, and possible alternative methods, are
discussed further in subsequent sections.
1.5 Models in general use and their intrinsic limitations and risks
1.5.1 Practical Engineering Methods:
The method adopted by these noise models includes the calculation of noise levels
by adding the individual contributions that each sound attenuation factor has on noise
transmission. The common factor in all these models is that they are mainly based on
experimental results. In general, they are simple, user-friendly and easy-to-use.
1.5.2 Semi-Analytical Methods:
Semi Analytical methods maintain the same practical structure as engineering
methods discussed in the previous method, but these methods are based on simplified
analytical solutions of the acoustic wave equation rather than experimental results. The
practical engineering methods takes into account only averaged meteorological effects,
whereas these methods allow a better tracking of the influence of specific atmospheric
conditions on noise levels, such as upwind or downwind situations. The ray tracing
models methods amongst Semi-Analytical methods are the most popular method used for
noise modelling.

Environmental Noise Modeling Using Soundplan 7.2 Software
10
1.5.3 Numerical Methods:
Numerical method group includes methods such as the Fast Field Program (FFP),
the Parabolic Equation (PE) and the Boundary Element Method (BEM). These methods
are constructed on the numerical solution of the wave equation. The Fast Field Program
(FFP) and Boundary Element Method (BEM) permits the calculation of sound
propagation over non-complex level terrain with any user-specified atmospheric
conditions. The Boundary Element Method (BEM) includes the effects of sound
diffraction due to large obstructions and more complex terrains. Possibly the most
influential current outdoor sound propagation numerical models are Euler-type finite-
difference time- domain models (see, e.g., D Heimann, “A linearized Euler finite-
difference time- domain sound propagation model with terrain-following coordinates”,
Journal of the Acoustical Society of America, vol. 119, issue 6, p. 3813, 2006).
The Fast Field Program (FFP) or "wave number integration method" provides the
full wave solution for the field in a horizontally stratified medium. The FFP method
provides an accurate solution of the Helmholtz equation, except within a wavelength or
so of the source, but is limited to systems with a layered atmosphere and a homogeneous
ground surface. Therefore, systems with a range-dependent terrain (either in terms of
ground impedance or terrain shape), or with a range-dependent atmospheric environment
(variable sound speed profile with range) cannot be modelled with the Fast Field Program
(FFP) method. This makes the model unsuitable for use over large distances or with
mixed ground conditions. Additionally, the computing time is often significant. Fast Field
Program (FFP) is not so proficient since the ground has to be uniform (flat) and
consistent (homogeneous), and the atmosphere is described by a succession of horizontal
layers (no range-dependency).
In comparison to the Fast Field Program (FFP) method, the Parabolic Equation
(PE) method (based on an approximate form of the wave-equation) is not restricted to
systems with a layered atmosphere and a homogeneous ground surface. The Parabolic
Equation (PE) method, Euler-type finite- difference time-domain models and the
Lagrangian sound particle model are the only present-day technique that can handle
environmental range-dependent variations.

Environmental Noise Modeling Using Soundplan 7.2 Software
11
There are three boundaries to the Parabolic Equation (PE) method: PE algorithms
only give precise results in a region limited by a maximum elevation angle, ranging from
10° to 70° or even higher depending on the angle approximation used in the derivation of
the parabolic equation; the calculation time for a complete spectrum is often significant,
particularly for to the calculation of frequencies more than 600 Hz; scattering by sound
speed gradients in the direction back to the source is ignored. In simple words, a
parabolic equation (PE) is a one-way wave equation, taking into account only sound
waves travelling in the direction from the source to the receiver. As the sound speed is
usually a smooth function of position in the atmosphere, the one-way wave transmission
approximation is usually a good one, but, when turbulence is to be taken into account,
this limitation must be considered.
These hybrid methods can provide highly precise images of propagation effects
for distinct frequencies in certain conditions, they provide the basis for the 'reference
model' used to authenticate the engineering method produced by HARMONOISE, an EU
project which has produced methods for the prediction of environmental noise levels
caused by road and railway traffic. These methods are envisioned to become the
harmonized methods for noise mapping in all EU Member States. These methods have
been developed to predict the noise levels in terms of Lden and Lnight, which are the
harmonized noise indicators according to the Environmental Noise Directive
2002/49/EC. Since the techniques are computationally intense they are most usually
employed for 2D noise prediction. Additionally, these methods are not extensively
available within the common commercial software available for noise modelling.
In summary, numerical methods have much strength, mainly in correctness, and
weaknesses, mainly in practical application. None of these methods are capable on its
own of handling all possible environmental conditions (wind speed and/or temperature),
frequencies and transmission ranges of interest in practical applications. One method will
be more suitable than another for a specific problematic scenario, and thus selection of
the best numerical method must be situation specific. [31]
These numerical methods are enormously useful for analyzing the propagation
under specific meteorological conditions. The problem is that these numerical methods
yield results for only those precise conditions and give little sign of statistical mean

Environmental Noise Modeling Using Soundplan 7.2 Software
12
values of sound levels. Furthermore, the user must provide considerable amounts of
information which sometimes difficult to generate, such as complete profiles of wind and
temperature.
Environmental Noise Modeling Using Soundplan 7.2 Software
13
1.5.4 Hybrid Models:
Hybrid model methods are used for complex situations. The general principle of
using the hybrid methods is to solve the wave equation or Helmholtz equation to presume
the sound field. The method for solving the wave equation is generally tough to
implement due to the complication of the atmospheric-acoustic environment. In fact,
except for the very modest boundary conditions and uniform media (which rarely occur
in reality), it is not likely to get a complete analytic solution for either the wave or
Helmholtz equation, consequently it is essential to use numerical methods. Several
different types of solution for the sound field have developed over the past few decades:
ray tracing provides a pictorial representation of the field, the Fast Field Program (FFP) is
precise but computationally rigorous and the Parabolic Equation (PE) is an
approximation to the wave equation that has been solved using explicit and implicit finite
different schemes.
1.5.5 Ray-Tracing Models
Ray –tracing models are quick to calculate and providing a pictographic
representation, in the form of ray diagrams, of the sound field. Additional advantages of
ray tracing are that the directionality of the source and receiver can be easily
accommodated, by introducing appropriate launch- and arrival-angle weighting factors;
and rays can be traced through range-dependent sound speed profiles.
Ray-tracing models are limited in capability only as a consequence of the
approximation leading to the ional equation. This enforces restrictions on the physics,
which in turn limit the applicability of ray theory. Two major irregularities can arise from
these limitations: predictions of infinite intensity in regions around caustics, and
predictions of zero intensity in shadow areas (where in reality sound energy will be
present through diffraction and scattering). Such difficulties can be overcome by
introducing different modifications, accounting to some extent for caustics and
diffraction. However, this technique presents problems when applied to propagation over
an irregular terrain in an inhomogeneous atmosphere.
The Lagrangian sound particle model is another method which reflects complex
terrain and meteorological fields which are regular with that terrain.

Environmental Noise Modeling Using Soundplan 7.2 Software
14
Following Table 2 summarises and complements the above. For comparison
purposes the practical engineering method ISO 9613 has also been included.
Table 2: Features of commonly used environmental noise modelling methods
Characteristic
Engineering Hybrid modelling methods
ISO 9613 Ray
tracing FFP
Crank– Nicholson
Parabolic Equation
(CNPE)
Generalised
Fokker- Planck
Equation (GFPE)
Computing time Fast Fast Slow Slow Medium
Accuracy Poor Medium Exact Very good Good
Optimum
frequency range All High Low Low Low and Middle
Meteorological
conditions? No No No Yes Yes
Shadows and
caustics? Yes Yes Yes Yes Yes
Elevated sources No Yes Yes No Yes
Environmental Noise Modeling Using Soundplan 7.2 Software
15
1.6 Reliability of the Environmental Noise Modelling
The reliability of environmental noise modelling is a very important question, but
one that is all too often addressed by potentially misleading statements about 'accuracy' in
the sense of the closeness between measured and predicted values.
A noise model represents an estimate of a 'snapshot' in time. As will be discussed
further in the following section, environmental noise fields tend to be inherently variable
in both time and space. This variability introduces a difficulty in defining the accuracy of
a model, as it is a function of the relationship between a constant predicted value and a
potentially widely varying noise level that could be measured in practice.
The value of a model cannot be measured by accuracy per se, but rather on a
judgment of its reliability as a tool in decision making, and this judgment should be made
according to the specific application and situation under consideration.
Providing that modelling studies are used with an awareness of the relative
benefits and limitations of predictions when compared to other possible bases upon which
a decision could be made, such studies can provide a reliable basis for decision making
purposes. In other words, a reliable model is one that is fit for purpose.
It is the purpose of this guide to assist all parties involved in these types of studies
to identify those situations where predictions can offer a reliable decision making tool,
and subsequently design case specific approaches to modelling that is focused on
producing reliable information that is fit for the purpose of the decision making exercise.
The requirement of fit for purpose information establishes an onus on practitioners to
deliver the outputs of predictive studies with accompanying contextual information that
enables decision makers to understand how such information can be used.
Environmental Noise Modeling Using Soundplan 7.2 Software
16
Chapter 2
LITERATURE REVIEW
1) Traffic Noise In Small Urban Areas, M. Hadzi-Nikolova, D. Mirakovski , Z.
Despodov , N. Doneva (Faculty Of Natural And Technical Science Stip,
Macedonia, University) [1]
suggested that Traffic noise is often perceived as one of
the biggest environmental problems. In order to implement effective measures against
the traffic noise the information about its distribution – noise maps - is imperative.
Current regulations as much as scientific efforts focuses large metropolitan
agglomerations, although two-years (2010-12) research study in Stip (about 50.000
inhabitants) implicate excessive noise levels in the major part of city. Directed
monitoring and mapping using SoundPLAN 7.1 Noise and Air Pollution Modeling
Software, point to traffic as the principal community noise source, directly linked
with measured noise levels. The paper presents road traffic noise measurement and
mapping results in small but dynamic city of Stip, pointing to growing concern about
noise levels in similar environments all over South Eastern Europe.
2) Modeling and Mapping of Urban Noise Pollution with Soundplan Software, Ass.
Hadzi-Nikolova M, Ass. Prof. Mirakovski D, Ass. Ristova E, Ass. Ceravolo S. Lj,
(Faculty of Natural and Technical Science Stip, Macedonia, University) [2]
suggested that Noise maps are used to assess and monitor the influence of the noise
effects. Thus, the number of citizens who are annoyed can be determined. Noise map
scan be helpful in the planning and decision making processes for reducing the noise
pollution. In this paper, the noise map for parts of the city Stip, as a small urban area
in the center of the East Macedonia is delivered as a visual information of the
acoustic behavior. For this purpose, the SoundPLAN software is used. The small and
medium sized agglomerations (up to 100,000 inhabitants) as well as model generation
and data administration are performed by the SoundPLAN as single software. It is of
great importance that noise modelling software is flexible in the administration of
multiple noise scenarios and to be able quickly and reliably to turn these models into
noise maps. Software’s like SoundPLAN use advanced filtering algorithms so the
model can be reduced with a user defined tolerance. The SoundPLAN software offers

Environmental Noise Modeling Using Soundplan 7.2 Software
17
many tools for data preparation, consistency checks and reports documentation. Many
of the tools go well beyond what could be expected in an acoustical simulation
program.
3) Comparison of Kilde Report 130 Rail Noise Modelling Predictions for
SoundPLAN 4.2 and 6.5, Mark Batstone, Rhys Brown and Jennifer Uhr [3]
suggested that Rail noise predictions in Queensland have historically been undertaken
using a DOS-based implementation of the SoundPLAN program. Rail noise levels
modelled using this DOS program have been validated with measured noise levels
throughout the history of its use. This DOS package has been superseded by
Windows-based implementations of SoundPLAN. Queensland Rail Network has
commissioned a study to compare the modelling results between the currently
accepted DOS-based version of SoundPLAN and the latest Windows-based
implementation. The outcomes of the study contained in this paper demonstrate why
QR Network is now able to accept Windows SoundPLAN results for rail noise
prediction projects within Queensland. Equivalent confidence in the modelled noise
levels reduces the amount of noise monitoring required at affected properties, leading
to a more efficient and sustainable use of available acoustical resources in
Queensland. Such reliable noise modelling results therefore enable more efficient
delivery of mitigation measures to sensitive areas than can be achieved with reliance
upon measurement results.
4) Generalizations and Accuracy in Community Noise Modelling – A Case Study
on Railway Noise in Burlöv Municipality, Kristoffer Mattisson [4]
describes that
when modeling noise it is important to consider the uncertainty in the method. There
are a number of sources of error that influence the result, such as the choice of
calculation method, software, data and user specific choices.
The purpose of this case study from Burlöv municipality in Scania, Sweden, was to
show the influence of such factors when modeling noise from railways with the
Nordic calculation method (Nordic council of ministers 1996) implemented in the
software SoundPLAN. The results were compared to a detailed modeling, and to
results from a previous large scale national noise mapping.

Environmental Noise Modeling Using Soundplan 7.2 Software
18
The results show differences in the area size exposed to noise levels over Lden 55,
65, and 75 dB(A), when using different resolution, search radius, elevation, ground
softness and inclusion or exclusion of buildings. The difference in the number of
persons exposed to different noise levels is also presented.
The comparison of the detailed noise mapping in this study and the previous national
mapping shows large differences. The same calculation method and software was
used, but different input data and modeling options had been used. . The differences
in results shows that it might be important to make more detailed mapping of the
noise levels, if specific areas are to be evaluated. Modeling large areas, without
consideration to factor that might have a large local influence can give misleading
results on specific areas. However, the calculation time increases rapidly when noise
is modeled at a detailed level, and simplifications are often used in large scale
investigations.
The results from this case study underscore the need for standardized noise modelling
methods for comparisons between different areas and different time periods.
5) Further Comparison of Traffic Noise Predictions Using the CadnaA and
SoundPLAN Noise Prediction Models, Peter Karantonis , Tracy Gowen and
Mathew Simon, Renzo Tonin & Associates (NSW) Pty Ltd, NSW, Australia [5]
an
update of information presented in a paper written for the AAS Acoustics 2008
conference in Geelong, Victoria. In particular this paper presents results of traffic
noise modeling using CadnaA and SoundPLAN and compares both to noise
measurements for three large recent road projects in NSW. CadnaA is a well-known
and internationally accepted noise modelling package, and its acceptance and use in
Australia amongst acoustic professionals is growing fast. To assist the Australian
acoustical profession, the appropriateness and accuracy of CadnaA under Australian
conditions is currently being verified, and this paper presents actual project results for
this purpose. Unlike CadnaA, the SoundPLAN noise prediction model is extensively
used in Australia, particularly for road traffic noise predictions, and has been
recognised and accepted nationally by various regulatory authorities including the
major road authorities and environmental agencies. The aim of this paper is to
provide additional comparative data for predicted traffic noise levels using the
Environmental Noise Modeling Using Soundplan 7.2 Software
19
Calculation of Road Traffic Noise (CoRTN) algorithms as implemented by
SoundPLAN and the CadnaA noise models for three large recent road projects in
NSW. These three projects offer features and characteristics that differ significantly
from the projects reported in the 2008 paper. Results from this study re-confirm that
the CadnaA noise modeling package is accurate and effective for modelling road
traffic noise in Australia.
6) Road Traffic Noise: GIS Tools for Noise Mapping and a Case Study for Skåne
Region, F. Farcaş , Å. Sivertun, Linköping University, Sweden [6]
states that
Traffic noise pollution is a growing problem that highly affects the health of people.
To cope with this problem one has to regulate traffic or construct noise barriers. In
order to implement effective measures against traffic noise the information about its
distribution – noise maps - is imperative. This paper presents our work in creating a
noise calculator software package implementation that can create noise maps. The
noise calculator is based on the noise model described in Nordic prediction method
for road traffic noise.
As a case study, the noise calculator was used to build both large noise maps for
Skåne region in south of Sweden and detailed noise maps for smaller areas in the city
of Lund.
7) Comparison of Traffic Noise Predictions of Arterial Roads using Cadna-A and
SoundPLAN Noise Prediction Models Michael Chung , Peter Karantonis , David
Gonzaga and Tristan Robertson, Environmental Acoustics Team, Renzo Tonin
& Associates Pty Ltd, Australia [7]
states that The use of Cadna-A is widely
accepted in Europe as a tool for predicting noise from various types of sources,
including traffic noise. However, traffic noise modeling using Cadna-A is still in the
early stages of acceptance in Australia and as such the appropriateness and accuracy
of Cadna-A for Australian conditions is currently being verified.
Unlike Cadna-A, the SoundPLAN noise prediction model is extensively used in
Australia, particularly for road traffic noise predictions, and has been recognised and
accepted nationally by various regulatory authorities including the major road
authorities and environmental agencies.

Environmental Noise Modeling Using Soundplan 7.2 Software
20
8) Modeling and simulation of noise impact along a new railway section in Sao
Paulo, Brazil Maria Luiza Belderrain, Rafael Vaidotas and Wanderley
Montemurro, CLB Engenharia Consultiva [8]
discusses the modeling and
simulation of noise impact along a new railway section that is being in operation in
the urban area of Sao Paulo, Brazil. In order to authenticate the study, background
noise measurements were taken along the 13 km of the railway section during its
planning and implementation stage, covering 10 points near subtle receivers. Each
sampling measurement persisted about 15 minutes in both periods: day and night.
Next, the terrain was modeled, including streets and buildings in the Sao Paulo,
Brazil, and then simulation map of the existing noise levels was generated for model
calibration purposes. Latest SoundPLAN simulation software was used to construct
and calibrate the noise model with the Leq values obtained from the measurements.
Once the noise modeling of the environment was ready, then the focus were shifted to
the modeling of the train as a linear noise source. Noise measurements were
performed on similar trains in the other region in order to assess the noise levels
generated due to the train. The outcomes were then used to produce additional
simulation map where the train is moving at 90 km/h. The comparative analysis of
both simulation maps will finally allow the design of mitigating systems, such as
noise barriers aimed at decreasing the receivers' nuisance in the urban area of Sao
Paulo, Brazil
9) A study on noise level produced by road traffic in putrajaya using SoundPLAN
road traffic noise software, Abdullah, M.E., Shamsudin, M.K., Karim, N.,
Bahrudin, I.A., and Shah, S.M.R.[9]
to use SoundPLAN Software and Norsonic 118
Sound Level Meter in defining, investigating and determining noise scattering levels
in Putrajaya with the rules recommended by WHO. Software Application and Field
Surveillance methods were used in this study to assess and compare the noise levels
calculated by each method. From the test results conducted in the Putrajaya area, it
was observed that, there is no noteworthy difference of using SoundPLAN software
package and manual handling by Sound Level Meter in the field. This was well
supported by the outcomes and its findings which shows that t-stat is not surpassed
than critical by the T-test assumption study. There is a direct relationship between

Environmental Noise Modeling Using Soundplan 7.2 Software
21
urban noises and traffic volume. The finding of the study also specified that the
distance from the traffic is the main factor to the increase of noise level at Putrajaya.
From the analysis, a new noise contour map that covers some part of the districts has
been produced by using the SoundPLAN software package. These noise maps have
been particularized via software application that provide noise barrier to prevent noise
level from disturbing human activities. Based on the study conducted, it was
concluded that 30 % of the measurements from the study area were higher than 75 dB
(A) which was exceeded than the limit that recommended by WHO which can effect
hearing loss.
10) Traffic Noise Predictive Models Comparison with Experimental Data, Claudio
Guarnaccia*, Tony LL Lenza°, Nikos E. Mastorakis, and Joseph Quartieri**
Department of Physics “E.R. Caianiello”, Faculty of Engineering° Department
of Industrial Engineering, Faculty of Engineering University of Salerno [10]
describes the use of Cadna-A is broadly recognized in Europe as a tool for predicting
noise from various types of source (s), including traffic noise. However, traffic noise
modeling using Cadna-A is still in the early stages of acceptance in Australia and as
such the appropriateness and accuracy of Cadna-A for Australian conditions is
currently being verified.
Unlike Cadna-A, the SoundPLAN noise prediction model are being extensively used
in Australia, particularly for road traffic noise forecasts, and has been recognised and
accepted nationally by various regulatory authorities including the major road
authorities and environmental agencies.
The aim of this published paper was to compare predicted traffic noise levels using
the CoRTN algorithm which is being implemented in SoundPLAN as well as the
Cadna-A noise models for a proposed road and an existing major road. An
authentication of both noise modeling packages is also shown based on actual
measurements of traffic noise from an existing arterial road and compared to one
another.
Results from this study shows that the Cadna-A noise modeling software package is
as precise and effective compared to SoundPLAN model in modeling road traffic
noise.

Environmental Noise Modeling Using Soundplan 7.2 Software
22
11) Using Traffic Models as a Tool When Creating Noise Maps- -Methods used in
the EU-project QCity Pia Sundbergh, Research Engineer Royal Institute of
Technology (KTH) Stockholm, Sweden [11]
describes a method to adapt outputs of a
macroscopic transport model to a noise mapping software. The boundary has been
developed as a part of a study in the EU-project QCity where noise effects of traffic
control measures are examined. A noise map of a base scenario where no policy has
been applied is presented. Moreover a sensitivity analysis of speed data input is made,
where limits speed is used instead of modelled speed. It shows that speed limits give
up to 3 dB higher noise levels than use of modelled speed. We believe this is an
aspect to consider when official noise maps and action plans are created, as official
speed restrictions are often used instead of actual speed.
12) Problems of Railway Noise—A Case Study Małgorzata Szwarc, Bożena Kostek,
Józef Kotus, Maciej Szczodrak, Andrzej Czyżewski, Faculty of Electronics,
Gdańsk University of Technology, Gdańsk, Poland [12]
states that under Directive
2002/49/EC relating to the assessment and management of environmental noise, all
European countries are pleased to model their environmental noise levels in greatly
populated areas. Some countries have their own specific method to predict noise but
most have not created one yet. The recommendation for countries that do not have
their own model is to use an interim method. E.g. The Dutch SRM II scheme is
suggested for railways. In addition to the Dutch model, this paper describes and
discusses 3 other national methods. Moreover, inconsistencies between the
HARMONOISE and IMAGINE projects were analysed. The results of rail traffic
noise measurements are compared with national methods.
13) Industrial Settlements Acoustic Noise Impact Study by Predictive Software and
Computational Approach Claudio Guarnaccia, Joseph Quartieri, Alessandro
Ruggiero, Tony L. Lenza, Department of Industrial Engineering, University of
Salerno[13]
states that The usage of predictive software in environmental impact study
is very frequent. In this paper, an acoustic noise analysis of an operating industrial
plant is performed, both in the internal and in the external environment, with the aid
of two different predictive software. A measurement campaign is designed and
performed, according to quality procedure, in order to describe the internal acoustic
Environmental Noise Modeling Using Soundplan 7.2 Software
23
climate, to characterize the noise sources, that are the production machines and
operations, and to have reference values to be used in the tuning of the model. With
the source characterization, the internal simulations are performed and compared with
measured levels. Finally, the simulations of the external surrounding area are made,
in two different operating conditions, and combined with the internal simulations. In
this way, a procedure to perform complete predictions, both inside and outside the
plant, is given, showing, in the validation test, a good agreement with the measured
values.
14) Noise Dispersion Modelling in Small Urban Areas with CUSTIC 3.2 Software,
Marija Hadzi-Nikolova, Dejan Mirakovski, Todor Delipetrov, Pance Arsov,
Faculty of Natural and Technical Sciences, University “Goce Delcev” Stip,
Macedonia [14]
, states that noise pollution is genuine danger to human health and the
quality of life and presents one of serious factors that local agencies and state
authorities have to consider in development planning. Noise dispersion modeling can
be helpful in the planning and decision making processes for reducing the noise
pollution. Noise dispersion models are used to assess and monitor the influence of the
noise effects and for land-use planning as one of the method of effective and
economic noise control. In this paper Noise dispersion model has been developed
using the possibilities of low costs CUSTIC 3.2, Noise Pollution Modelling Software,
produced by the Spanish company Canarina, and according to noise level
measurements in the central part of Stip, in Eastern Macedonia that is typical, and
thus representative, of most smaller urban areas in this region.
15) Integrating A Noise Modeling Capability With Simulation Environments,
Raymond M. C. Miraflor , NASA Ames Research Center, Moffett Field,
California U.S.A [15]
describes the requirements for integrating a noise modeling
capability into air transportation system simulations. In order to address public
concerns, noise impact should be investigated with suitable models in simulation
environments. Coupling a noise modeling competence with these simulators will lead
to better understanding of what impact certain flight operations may have on local
peoples. Described within this paper are the general data requirements that a noise
modeling tool must receive from a simulator. At a minimum, the simulator must

Environmental Noise Modeling Using Soundplan 7.2 Software
24
provide data to the noise model that may be classified under environmental
conditions, flight path information including aircraft and engine enactment, and grid
set-up in order to analyze noise effect. An application of these requirements to the
integration of a noise model with an air traffic control tower simulator is presented.
Difficulties in obtaining and adapting these data types from the simulator are
scrutinized. It is expected that the details of these requirements may be used to enable
the integration of a noise modeling proficiency into other air transportation system
simulation environments.
16) Integrated Noise Model Route Optimization for Aircraft, Student team: Jessica
Kreshover, Phil Larson, Simmons Lough, Eric Merkt, Faculty Advisors:
Garrick Louis and Christina Mastrangelo, Department of Systems Engineering
[16] states that the effect of airport noise on populations in surrounding areas is an
issue that the Federal Aviation Authority (FAA) and airports continue to address.
Their research mainly shows why and how the FAA could use a Geographic
Information System (GIS) in combination with an optimization algorithm, combined
with the Integrated Noise Model (INM), to determine flight tracks that minimize the
effects of noise on populations surrounding airports.
17) Noise mapping as a tool for controlling industrial noise pollution, W J P Casas1,
E P Cordeiro1, T C Mello and P H T Zannin Universidade Federal do Rio
Grande do Sul, Departamento de Engenharia Mecânica, Rua Sarmento Leite [17]
describes the purpose of their work is to identify the contribution of noise from
external sources to the noise pollution generated by a industries, by comparing sound
pressure levels measured in its surroundings and those calculated by noise mapping
using software tool. In their assessment, a metal mechanical manufacturing plant was
selected and sound pressure levels were measured at separate points along two rings
around it, called receivers. The noise measurement data from the first ring were
entered into the SoundPLAN software to determine, through iteration, the factory’s
main noise sources. The SoundPLAN software then used this data to estimate noise
maps and sound pressure levels at the receiver’s positions in the second ring. Finally,
the contribution of noise from external sources to the overall noise produced by the
factory was determined by comparing the noise measured in the second ring with the

Environmental Noise Modeling Using Soundplan 7.2 Software
25
simulated data. The placement of partial barriers along some critically noisy walls
was found to be effective as a solution in controlling nighttime noise, safeguarding
that the sound level limit for this type of neighborhood, which is established by
technical standards for environmental noise as Leq = 60 dB (A), is not reached.
18) International Journal for Science, Technics and Innovations for the Industry
MTM (Machines, Technologies, Materials) 01/2012; VI:38-42 , Modeling and
Mapping of Urban Noise Pollution with Sound PLAN Software, Marjia Hazdi-
Nikoloava, Dejan Mirakovski, Emilija Ristova, Ljubica Stefanovska Ceravolo [18]
states that, noise maps are used to assess and monitor the influence of the noise
effects. Thus, the number of citizens who are irritated can be determined. Noise map
image are very helpful in the forecasting and decision making processes for
plummeting the noise pollution. In this published paper, the noise map for parts of the
city Stip (Macedonia), as a small urban area in the center of the East Macedonia is
delivered as a visual information of the acoustic behavior. For this purpose, the
SoundPLAN software is used. The small and medium sized as well as model
generation and data administration were performed by the SoundPLAN software. It is
of great significance that noise modelling software is flexible in the administration of
multiple noise scenarios and to be able quickly and reliably to turn these models into
noise maps. SoundPLAN use advanced filtering algorithms so the model can be
reduced with a user defined tolerance. The SoundPLAN software gives many tools
for data preparation, uniformity checks and reports documentation. Many of the tools
go well beyond what could be expected in an acoustical simulation program.
The overall findings of this literature review shows that the SoundPLAN noise
modeling package is as accurate and effective compared to other noise modelling
packages in modelling industrial noise pollutions predictions.
Also SoundPLAN is standards based software system offering industrial noise
calculations in accordance to all known international standards such as,
Europe/International: ISO9613 part 1, Germany: VDI 2714 / VDI 2720 / DIN 18005 /
TA-Laerm, Austria: OeAL 28, UK: BS 5228, Nordic: General Prediction Method for
Industrial Plants / Nord 2000, Japan: ASJ industrial model, USA: Industry model based
on TNM, WDI etc.

Environmental Noise Modeling Using Soundplan 7.2 Software
26
Therefore SoundPLAN noise modelling software is considered as competent, reliable
and generally accurate in modelling industrial noise worldwide.

Environmental Noise Modeling Using Soundplan 7.2 Software
27
Chapter 3
ENVIRONMENTAL NOISE MODELLING
METHODOLOGY
Many of the threats associated with the production of environmental noise are
inherent and cannot be precisely diminished economically. Therefore in general the
preeminent way to manage risks is as part of the whole process of using noise models.
The following guidance/process is a suggested approach for noise modeling.
This section is broken into the several key component elements that make up any
environmental noise prediction program, as represented in the following flowchart:
Figure 3: Common approach to environmental noise measurements
In the above figure all stages are presented with a return path to client
consultation and brief, since development through the analysis will produce information
about the noise environment that either contradicts earlier assumptions or that may not
have been available at the outset of the study and so may necessitate re-evaluation of the
forward investigation strategy. An important point is that environmental noise predictions
may not always be able to notify the assessment to an acceptable level of risk, so another
approach may be required. The understanding that a amended approach may be more
suitable may ascend at any point throughout the course of the investigation as new
information becomes available, from the initial review right through to the post-analysis
phase of the study. Following sub-section explains methodologies used in the
environmental noise prediction program.
Environmental Noise Modeling Using Soundplan 7.2 Software
28
3.1 Step 1: Review the Requirement for Predictions
Whenever environmental noise predictions are planned, it is essential to have a
strong understanding of the reasons for the predictions, the importance of any decisions
shall be made on the basis of these predictions, any variable features of the sound field in
question that may represent sources of uncertainty (including longer term sources of
variability or change, as may be related to seasonal effects or future forthcoming
development that may inertly or directly alter the noise environment), and the likely
feasibility of conducting predictions.
It is at this point that attention must be given to the type of noise data that the evaluation
calls for, under the following categories:
• Absolute values, where the specific numeric value of the calculation is important
(e.g. comparison against known benchmark).
• Relative difference values (which may between sources or locations), where
developing attenuation strategies or complementing the design or findings of a
measurement study.
The relevance and reliability of any existing assessment data that is available
should be evaluated to determine whether this may negate the need for further
assessments. The limitations of any available existing data will need to be considered
against the difficulties that may face any attempt to develop new prediction data.
Finally, it is important at this point to identify any well-defined threshold values that
trigger significantly different assessment outcomes. The knowledge of such thresholds, in
conjunction with estimates of what predicted values that might be expected from the
study (see following screening exercise) is critical to determining the requirement for,
and scope of, subsequent detailed modelling exercises.
3.2 Step-2: Preliminary Screening Study
Preliminary screening prediction studies provide a means of assessing the
potential criticality of the prediction outcomes, and identifying critical source elements,
noise transmission paths, and noise assessment locations. These studies are comparatively
brief, and valuable for defining the scope of any upcoming work. Preliminary screening
study proceeds as follows:

Environmental Noise Modeling Using Soundplan 7.2 Software
29
1. Clearly define any thresholds at which contradictory assessment outcomes are
triggered. This might take the form of a threshold defined in a planning condition
or contract.
2. Pinpoint the assessment (receiving) locations.
3. Gather initial (preliminary sound source type and position) data.
4. Apply a very simple propagation assumption such as hemispherical spreading.
5. Produce very rough estimates of the expected noise levels at the identified
assessment locations for comparison with the thresholds or limit values.
In many of the instances, gathering information about the sound source (s) may be
problematic and difficult. In these cases, it can be possible to consider the separation
between the source and assessment locations, and then use this information to work back
to the magnitude of sound emission levels that would be needed to trigger differing
assessment outcomes.
Preliminary Screening studies then lead to one of the following outcomes:
No further studies are required, since the output information is already sufficient
to enable a decision to be made, and further detailed studies would not provide
any benefit to the study.
The available information suggests that further detailed studies can be averted by
a revised screening study.
A refined sound propagation model must be designed. The findings may provide
guidance as to the areas on which to focus.
Predictions with a risk level commensurate with project requirements cannot be
made and a different approach must be sought.
3.3 Step 3: Detailed Model Design
Given the extensive variety of uses of noise modelling, as well as the wide variety
of factors that influence environmental noise levels, there is no procedure for defining a
detailed model design that is suitable for every application. The process of developing a
detailed model design will often consist in a gradual refinement of the predictions of the
screening study. Since practical and technical constraints will often prevent the ideal
modelling approach from being pursued, the detailed design must identify the most

Environmental Noise Modeling Using Soundplan 7.2 Software
30
effective refinements that strike the best compromise between the resources required to
construct the model and the reliability of the outcome for decision-making purposes.
Reaching this compromise will need consideration of the criticality and financial impact
of the decision that depends on the assessment outcome.
The detailed model design will define the features of the sources and environment
whose description will have a significant effect on the calculated noise levels. These
features will often determine the type of algorithm required.
The following sections discuss the types of technical factor that should be
considered in developing the detailed model design.
3.3.1 Physical Environment
The first aspect of the physical environment to be defined is the scale of the
assessment area for which the detailed model needs to be developed. This will be based
on the assessment locations identified in the screening study.
The positional accuracy required decreases with increasing separating distance: a
10% change in separating distance equates in general to less than a ±1 dB change in the
calculated noise level.
The other aspects of the environment to be defined relate to the presence of
screening and reflecting surfaces, the location and extent of any absorptive ground
coverings, and the atmospheric conditions. The level of information required depends on
the sophistication of the propagation algorithm to be used.
In some instances, a decision that the assessment should consider atmospheric
conditions that are favorable to the propagation of sound will reduce the required
precision of details of screening structures and ground cover as their influences are
significantly reduced under such conditions.
The importance of precisely defining such attributes must be considered in the
context of the importance of small changes in calculated noise level to the assessment
outcome. However, when using engineering methods to calculate the influence of these
features, it must also be recognised that the validity of the methods is often restricted to
general characterizations, particularly when describing features such as acoustically soft
ground covers. It therefore does not follow that continually increasing the precision with

Environmental Noise Modeling Using Soundplan 7.2 Software
31
which the physical environment is described will necessarily translate to any increased
precision of calculated noise levels.
3.3.2 Sources
Based on the findings of the preliminary screening study it should be possible to
identify all sound sources that may together result in total noise levels similar to, or
higher than, the prevailing decision threshold or limit at the assessment locations. The
contribution of relatively low-power unscreened sources should not be neglected if the
model includes screening effects, as these may become significant if higher power
sources are screened.
A range of source attributes may need to be defined in more detail for the
purposes of the detailed model design. Consideration of the extent and nature of the
physical environment can simplify this definition. For example, in instances where there
is no screening and the separating distances are relatively small such that ground and
atmospheric effects are minimal, the calculation of total levels may not require any
information about the frequency profiles of the emission sources.
Attention must also be given to the range of emission levels that a source may
produce and the time span over which its emissions may vary. Correspondingly, the
relevant assessment time period must be clearly defined and related to the operating
patterns of the sources. For example, the standard most frequently used for rating
industrial noise in the UK defines time periods of 1 hour and 5 minutes for assessments
made during the day and night respectively. Therefore, sources with an ‘on-time’ or
pattern of time variation significantly less than the assessment period will need to be
directly factored into the emission rating. Conversely, sources which could display
differing emission levels in different assessment time periods will need to be rationalized
according to whether the assessment relates to average, typical upper, or worst case
conditions, as well as considering how the pattern of variations may relate to that of other
assessment sources or atmospheric conditions (e.g. is the highest noise level likely to
occur when favorable propagation conditions occur?).
Other important source characteristics such as frequency and directivity may also
need to be defined, depending on the likelihood of those characteristics being significant
Environmental Noise Modeling Using Soundplan 7.2 Software
32
to the assessment at the receiver location. For example, frequency information may be
important in terms of calculating the effect of ground coverings or screening, as well as
being a material consideration to the impact the noise may have at the location (i.e. is the
noise dominated by individual frequencies at the receiver location and therefore
potentially more disturbing than a wide-frequency source?).
In situations where barrier effects are to be factored into the calculation, careful
consideration must be given to the assignment of representative source heights for large
pieces of machinery. Conservative decisions may need to be made in order that
unrealistic screening benefits are not factored into the calculation. However this will need
to be balanced against the need for refinement of the calculation and may warrant closer
inspection of the sound radiation properties of the source.
3.3.3 Propagation Algorithm
In most practical assessments, environmental noise propagation calculations will
be performed using standard engineering methods such as ISO 9613 or CONCAWE. The
CONCAWE method was originally developed for noise impact from large industrial
(petrochemical) sites, but is now widely used in a range of environmental scenarios. For
an example of its use, click here. In the future, the newly developed procedures
formulated under the EU HARMONOISE and IMAGINE projects may be used. The use
of these engineering methods provides a relatively efficient means of producing
estimated noise levels that account for a significant level of detail. It must however be
recognised that these methods’ validated application is for the calculation of overall total
averaged noise levels under specified meteorological conditions. Not all of the
engineering methods are able to directly estimate noise levels that may occur in differing
meteorological conditions (e.g. ISO 9613 does not provide a method of calculating noise
levels that occur upwind of a source). In situations where the noise model is to account
for sources with very prominent and narrow frequency components, or where the
variations which occur for different meteorological conditions are of interest, engineering
methods should be used with a high level of caution. In some cases, the complexity of the
situation may warrant the use of more intensive scientific methods or, ultimately,
abandonment of predictions. To make informed decisions about the appropriate algorithm

Environmental Noise Modeling Using Soundplan 7.2 Software
33
to adopt requires background knowledge in the principles of sound propagation and an
overview of the relative merits and limitations of the various procedures.
3.4 Stage 4: Execute Calculations
The initial phase of the calculation is an extension of the detailed model design, in
the form of a review of the decisions made concerning the input information, through
testing elements of the calculation to gauge the sensitivity of the outputs to the precise
choice of input value, and thus identify where the quality of input information may need
to be revisited for further refinement.
Engineering methods can be implemented for many situations, but for large
numbers of source and receiver locations and/or complex propagation paths dedicated
software becomes practically essential. In particular, the use of such software enables the
rapid exploration of different scenarios that may be relevant to the assessment. Further,
such software often enables visualizations of the input data to be produced in order that a
user can readily check the plausibility of the input data. However, the use of such
software requires users to be fully aware of the manner in which it implements a
particular procedure and in particular what assumptions are being made. Additionally, the
documented descriptions of engineering methods are sometimes subject to a degree of
interpretation as to the correct procedure, and this is a source of variation between
different software packages. These considerations are such that proprietary modelling
software should not be used in the absence of a working knowledge of the calculation
routines.
At the outset of any calculation, the input data should be checked to confirm the
plausibility of the results, particularly where the latter are within close proximity to a
decision threshold or limit value. It is also essential to compare the predicted values with
the simple calculated values estimated during the screening study, and to check the
ranking of reported contributions attributable to each source against expectations.
3.5 Stage 5: Analyse and Report
Thorough reporting of environmental noise modelling is essential for users of the
outputs to understand the reliability of the information as a basis for decision-making
purposes. Important elements that the reporting must address are:

Environmental Noise Modeling Using Soundplan 7.2 Software
34
The assessment conditions that have been chosen as the basis for the assessment
and the reasoning behind the selection of these conditions.
The input information used to describe the sources, physical environment, and
propagation conditions, and how this input information relates to the chosen
assessment conditions.
Any uncertainties in the input information used for the model, how these
uncertainties have been rationalised in the modelling, and the significance of their
effect on the calculated values.
The choice of algorithm used to predict noise levels and the reasoning for its
choice, as well as any known limits associated with the method and assumptions
incorporated in the package that implements the algorithm.
A discussion of the output findings in comparison to any prevailing decision
thresholds or limit values, including references to the propensity for varied input
data or calculation uncertainties to alter this comparison, and thus the assessment
outcome, as well as reporting of the potential changes in noise for other possible
assessment conditions (as may be judged by prediction, knowledge of algorithm
limitations, or measurement data).
Any recommendations for further work that could be carried out to address any
residual risks associated with reliance on the calculation data for decision- making
purposes.
3.6 Risks in Environmental Noise Assessment
3.6.1 Introduction
An important factor in the consideration of site specific noise modelling is the
strong influence of commercial and practical constraints which are more prevalent than in
strategic mapping. In these instances, the commissioning party with ultimate
responsibility for allocating timescale and budget resources may not be aware of the
available choices, nor appreciate the varying risks of different approaches. Given the
degree of flexibility and interpretation permitted by relevant assessment criteria that may
drive the requirement for predictive studies, industry expectations of what may be
involved in conducting a predictive study are understandably wide ranging. These factors

Environmental Noise Modeling Using Soundplan 7.2 Software
35
will often lead to a situation where the scope of a study will be limited or compromised
without proper regard to the consequential trade off in terms of the risk and significance
of an incorrect assessment outcome.
In the context set out above, the challenge for practitioners is to raise the end
user’s appreciation of the potential decision risk associated with different approaches, and
to develop tailored assessment strategies that strike an appropriate balance between the
scale of resources required for a predictive study and the costs (social, financial or
otherwise) and likelihood of an incorrect decision resulting from a compromised study.
To achieve such a balance requires the assessment design to 'begin at the end'; that is,
prior to developing an assessment strategy, consider the nature and scale of the decision
to be made, and how predicted noise data could be used to inform the decision. In some
cases, designing the assessment strategy in this way may lead to a number of possible
approaches to conducting predictions, or may ultimately conclude that predictions do not
represent a viable decision making tool (requiring either the available resources to be re-
considered, or evaluation of alternative methods of informing the decision). This type of
approach provides the opportunity to focus inevitably limited resources on the most
critical elements of a study that influence the decision for which the assessment is
intended to inform.
The above considerations highlight the need for noise predictions to be used in a
way that appropriately manages the risk of incorrect assessment outcomes. It is worth
emphasizing that there are two main risks when considering the implication of an
incorrect assessment outcome. The first and perhaps most commonly recognized risk is
that of an outcome where a prediction fails to represent the full scale of noise levels that
occur in practice, leading to a situation where environmental noise levels breach
acceptable levels with associated social and financial consequences. However, the second
and perhaps most frequently underestimated risk is that of the unnecessary development
costs (direct costs as well as those associated with lost development opportunities) of
incorrect assessments arising from a prediction study that overestimates noise levels
experienced in practice. The latter risk is an important consideration within the current
assessment framework where worst case approaches are frequently relied upon to address
the challenges and limitations that apply to practical environmental noise studies.
Environmental Noise Modeling Using Soundplan 7.2 Software
36
3.7 Risk, Variability and Uncertainty
Appreciating from the previous section how environmental noise models are
constructed and used, the next stage is to discuss the challenges associated with use of the
modelling in environmental noise assessment and identify how these challenges may
translate into assessment risk.
It is essential that the users have an appreciation of variability in environmental
noise and equally important to recognize the distinction between variability, uncertainty
and risk.
This section of the guidelines commences with a discussion of environmental
noise variability and the challenges it presents to any attempt to objectively rate a noise
field. Understanding variability in this way provides a basis for identifying the types of
factors that a noise modelling exercise should take into account.
The section then concludes with a discussion of the compounding factors related
to the use of predictions that can introduce a further risk of incorrect assessment outcome
if not properly understood.
By far the most important limitation to the use of models is the fact that it is
necessary in exercising them to make some selection of the environmental parameters.
Often, a model will be required to output a single figure and it is crucial to realise that
this figure is dependent on assumptions about, for example, weather conditions that will
rarely be realised in practice. Since the variation of output values with input condition
values is so large, a model may very well therefore give an answer far different to what is
experienced in reality.
Environmental noise fields exhibit very large variability in space and time. In the
UK, environmental noise assessment of commercial or industrial installations relies
heavily on comparisons between the specific noise (the noise attributable to the
installation in question) and the background noise (the underlying noise in the absence of
influence from the installation in question). Thus, these forms of assessment are burdened
by the challenges of dealing with variability in two distinct sound fields.
In terms of both the background and specific noise, changing source and
propagation conditions will give rise to changes in both predicted and actual sound fields.

Environmental Noise Modeling Using Soundplan 7.2 Software
37
The reflection of these changes in predictions or measurements is thus a representation of
real trends exhibited in the sound field. Table 3 gives examples of how background and
specific noise levels can vary:
Table 3: Significant causes of variation in environmental noise sound fields
Component Examples of component variations
Source Background noise
Changing natural sound source contributions e.g. diurnal and seasonal
variations in the composition of natural sound sources such as streams and
wind disturbed vegetation
Changing traffic sound e.g. hourly, daily, and seasonal changes in the
general traffic flow volume and composition, as well short term (wet or
dry) and long term (road surface degradation) changes in road condition.
Specific noise
Operational characteristics, e.g. continuous or intermittent operation,
cyclical operations, load settings, personnel dependent effects, demand-
driven operational intensity
Seasonal effects for sources enclosed in buildings, such as open windows
in summer
Directionally varying sound characteristics
Varying sound characteristics and features such as tones and impact sound
Transmission Position dependent sound propagation, e.g. varying separation distances
due to sound source movement, varying degrees of sound path screening
according to source and receiver location, and localized
The variability of environmental noise fields presents the most critical challenge
to any attempt to rate the field by prediction. It raises the question of how an objective
rating of a sound field in one set of conditions may relate to those occurring in other
conditions. Further, the variation patterns of a sound field may be a very important
consideration to the assessment. The use of well-intended measures to suppress the
degree of variability exhibited in objective ratings may in fact undermine the validity of
Environmental Noise Modeling Using Soundplan 7.2 Software
38
an assessment finding by failing to recognize how actual sound variability may influence
the decision making process. For example, two separate sound fields each characterized
by identical average noise levels could invoke very different assessment outcomes if one
of the fields was characterised by constant levels consistent with the average value, whilst
the other field was characterised by widely varying levels with maximum levels
substantially above the average at certain times. This highlights the importance of
understanding the relative timing of the highs and lows exhibited by the background and
specific noise sources, e.g. does the highest background noise only occur when the
highest specific noise occurs? This is an important consideration for objective sound field
ratings that are often produced for downwind atmospheric conditions that favor sound
propagation from the source in question. Such an assessment condition cannot always be
assumed to be the condition in which the greatest difference between specific and
background noise levels occurs if the controlling background noise sources are also
affected by atmospheric propagation conditions outcomes are triggered, there is a
significant risk of an incorrect assessment being made. Whether the specific noise of the
installation in question is being compared against a background related limit or fixed
value limit, unidentified or misunderstood variability can create significant uncertainty as
to whether an objective sound field rating produced for one set of conditions will provide
a complete representation of the sound field. Subsequently, if unknown variability or
uncertainty overlaps some threshold value at which different assessment
A related issue is that available prediction methods are limited in the range of
conditions which they can model: for example, some engineering methods only enable
the calculation of noise levels which occur under downwind conditions. Given the
reliance on knowledge of the background and specific noise for the assessment of
commercial or industrial installations, it is important to recognize how each sound field
may vary. Importantly, when evaluating appropriate conditions for which an assessment
should take account of, it is necessary to identify any relationships that may exist
between the variability’s of the background and specific noise fields.
The importance of such relationships can be seen from Figure 3. This
demonstrates how the combined effects of variability in both sound fields can lead to
critical regions where the ability to discern the causes of variability becomes significant.

Environmental Noise Modeling Using Soundplan 7.2 Software
39
In this example assessment, where the priority is to determine if the specific noise
exceeds the background noise, the critical region occurs when the range of specific and
background noise levels overlap. The situation therefore arises as a result of the
combination of two factors; the relative magnitudes of the sound levels and the extent to
which each may vary. An important consequence is that, outside the critical zone, the
specific and/or background noise levels may exhibit even higher degrees of variability
but, due to the increased relative difference between background and specific noise
levels, this increased variability may have no impact on the assessment outcome. In
summary, outside of the critical zone, there is no risk of incorrect assessment outcome
despite potentially high levels of variability, even if the sources of this variability are not
known. However, within the critical zone the risk of incorrect assessment outcome
becomes significant as long as the sources of variability remain unknown.
Figure 4: Indicative sound level versus distance chart depicting increasing
variability with distance from source
It is important to emphasise the importance of understanding the relative timing of
the highs and lows exhibited by the background and specific noise sources, e.g. does the

Environmental Noise Modeling Using Soundplan 7.2 Software
40
highest background noise only occur when the highest specific noise occurs? This is an
important consideration for objective sound field ratings that are often produced for
downwind atmospheric conditions that favour sound propagation from the source in
question. Such an assessment condition cannot always be assumed to be the condition in
which the greatest difference between specific and background noise levels occurs if the
controlling background noise sources are also affected by atmospheric propagation
conditions.
Whether the specific noise of the installation in question is being compared
against a background related limit or fixed value limit, unidentified or misunderstood
variability can create significant uncertainty as to whether an objective sound field rating
produced for one set of conditions will provide a complete representation of the sound
field. Subsequently, if unknown variability or uncertainty overlaps some threshold value
at which different assessment outcomes are triggered, there is a significant risk of an
incorrect assessment being made.
3.8 Factors Affecting Risk in Environmental Noise Predictions
The preceding section sets out the challenges facing any attempt to objectively
rate an environmental noise field. In this section attention is now directed to the
challenges and risks specifically relating to objective ratings derived from predictions.
The origins of this risk can be described by two broad categories described as follows:
• Assessment Conditions: The inherent variability of environmental noise levels
presents the challenge of determining which source and propagation conditions
should be used for the assessment. This challenge applies equally to measurement
and prediction based studies. However, in the case of environmental noise
predictions there will often be less information to quantify the full range of
variability that may be expected in practice. Also, there is often a restricted range of
conditions for which the available prediction methodologies can offer meaningful
representations For example, some engineering methods only enable the calculation
of noise levels which occur under downwind conditions, whilst in some cases,
upwind conditions may be equally or more important.

Environmental Noise Modeling Using Soundplan 7.2 Software
41
• Prediction Quality: The accuracy with which the prediction model determines
the noise level that would occur in practice for the exact physical conditions that
the model is attempting to represent. These inaccuracies relate to the limitations
of the input data and to the ability of the chosen sound propagation algorithm to
represent actual transmission conditions.
In both of these two broad categories, the limits of application and accuracy of
practical prediction techniques represent important considerations. These limits
are discussed below in the context of the input data used to construct the models,
available calculation models, proprietary software packages that implement these
calculations, and the practical constraints typically encountered in dealing with
these challenges.
3.8.1 Input Data
The key input information to most noise prediction studies is a representation of
the sound emission level and character of the sources to be investigated. Where
available, such information might comprise a test emission level deduced from
measurements made in relatively controlled environmental and operational
conditions. In other instances, emission characteristics may be deduced from
empirical relationships according to the type of equipment under consideration
and some aspect of its performance rating. In cases where no such information is
available, an estimate may be acquired from field measurements of an installed
item of plant. In all cases, the data will be a relatively simple representation of the
total emission and character of a very complex sound-comp generating
mechanism. The total emission of a machine will comprise many contributions
from individual components which have their own sound emission characteristics.
This complexity introduces some important factors to bear in mind when
considering the representation provided by sound emission data:
• Source directivity: Many types of noise sources have directional characteristics
such that the noise level observed at a constant distance from the machine will
vary according to the orientation of the machine. These characteristics are often
not evident in sound emission data, and it is usually very difficult to establish the

Environmental Noise Modeling Using Soundplan 7.2 Software
42
extent to which the emission in a particular direction may vary from the average
quoted value.
• Source geometry: The distribution of the individual component noise sources
associated with a complex machine will affect the pattern of the noise field that
emanates from it. This is relevant to the source directivity as described above, but
also has an important relationship to how the source’s sound field will interact
with the surrounding environment. For example, a large piece of equipment may
be almost entirely visually obstructed from a receiver location of interest by a
solid screen; the question as to whether sound levels at the receiver location will
be significantly reduced by the obstruction will be highly dependent on whether
or not the exposed portion of the machine is a significant source of the machine’s
total sound emission. As with directivity, the distribution of sound sources about a
complex machine will often be very difficult to establish from the available
emission data.
Source input versus actual emission level and character: the actual emission level
and character of the item of plant being modelled may vary from the input
representation for a wide variety of reasons including manufacturing variations
between the tested and installed item of plant, sensitivity of the installed plant
item to mounting conditions and variations in the operational duty of the installed
machine.
• Representation of the physical environment: An accurate representation of the
physical dimensions of all acoustically significant features of a potentially large
assessment area can be very problematic. The additional challenge is then the
assignment of acoustical properties to surfaces that absorb, impede and reflect
sound to varying degrees. Accounting for the complexities of the terrain and built
environment generally requires simplifying assumptions to be made in order that
they can be included in a noise model. Subtle factors and variations not
represented in the estimation can lead to differences between predicted and actual
noise levels, particularly where the influence of certain environmental features
have interdependencies (e.g. the effect of screening and wind conditions cannot
be considered in isolation from each other).

Environmental Noise Modeling Using Soundplan 7.2 Software
43
The complexity further extends to the atmosphere through which the sound must
propagate. This is discussed in further detail in the following section.
3.8.2 Algorithms for Outdoor Sound Propagation
The ability of mathematical algorithms to accurately represent sound propagation
has been the focus of considerable research, particularly given the role of noise prediction
as an integral assessment tool in the fulfilment of the European Noise Directive (i.e. EU
Directive 2002/49/EC, which requires member states to produce noise maps and action
plans for urban areas and major transport infrastructures, including roads, railways and
airports). Predictive algorithms vary widely in sophistication from commonly employed
engineering methods (empirically based) through to more complex scientific methods
that are mostly employed for specialist research applications. Engineering methods offer
the benefit of robust and practical computation, but are generally limited to the prediction
of longer term average A- weighted noise levels, and exhibit increasing uncertainty when
attempting to evaluate noise fields with complex sources and/or propagation conditions.
At the opposite end of the spectrum, scientific methods can provide significantly greater
accuracy for complex situations, but generally only for very specific and limited
scenarios, and are computationally intensive to an extent that limits their viability as a
practical assessment tool.
The complexity of atmospheric conditions and the impracticability of measuring
all the relevant environmental parameters throughout the sound propagation path, require
that several assumptions and simplifications in the models are adopted. This set of
assumptions and approximations has led to the existence of a variety of methods to
mathematically represent sound propagation. Generally, all these methods can be
classified as one of the following three categories:
Practical engineering methods
Approximate semi-analytical methods
Numerical methods
3.8.3 Environmental Noise Modelling Proprietary Software’s
There are many practical complications of applying predictive algorithms to the
computation of a large number of sources over extensive areas; noise modelling

Environmental Noise Modeling Using Soundplan 7.2 Software
44
proprietary software packages is most commonly employed to generate predictive noise
models. These packages provide an efficient and organised method to the gathering of
input data, and then offer options to execute many predictive algorithms to generate
calculated noise levels over a wide range of receiver locations. The improvement of these
software packages involves the conversion of standard predictive algorithms (such as ISO
9613) into computational code. These software packages will often implement efficiency
algorithms that enable users to strike a balance between likely computational accuracy
and calculation time, in order to achieve practical computation times. Whilst such aspects
of proprietary packages are clearly advantageous for practical assessment purposes, there
is limited data available for the user to understand the extent to which such efficiency
techniques may compromise the anticipated value. Experience of numerous commonly
implemented packages has indicated that variations in the approach to efficiency can
potentially amount to significant variations in calculated outputs. Presently, there are no
any international or British Standards that provide a user with any certification of a
proprietary package’s accurateness in applying a given predictive algorithm, and the
trustworthiness of a particular package will therefore often derive from brand
acknowledgment. This contrasts with objective studies based on measurements that need
that any sound level meter used for such an exercise to be calibrated and demonstrated to
attain agreement with set reference conditions when verified in a laboratory scenario.
1) SoundPLAN v 7.2 Industrial Noise Indoors / Outdoors
SoundPLAN® was one of the very first noise modeling software’s on the market,
debuting in 1986. Due to its ever increasing popularity on the world market, an
international office was opened in 1999. The core of our business was and is the
prediction of noise in the environment. Noise emitted by various sources propagates and
disperses over a given terrain in accordance to the laws of physics. Worldwide, many
governments and engineering associations felt the need to algorithmize the principles of
acoustics so that different engineers assessing the same scenario would get reasonably
close answers.
The SoundPLAN industrial noise modeling is unique. All questions of frequency
dependent noise can be simulated whether it is purely an indoor problem, a receiver
outside that needs to be assessed for outside sources, or a complex problem with the
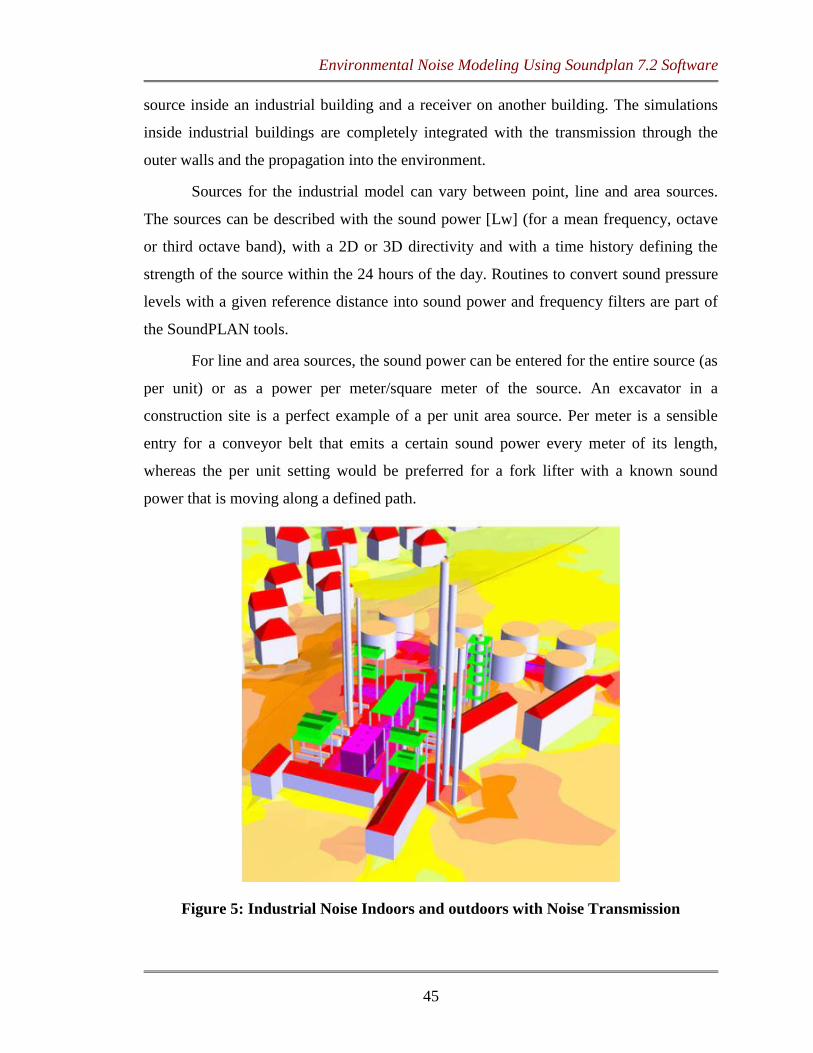
Environmental Noise Modeling Using Soundplan 7.2 Software
45
source inside an industrial building and a receiver on another building. The simulations
inside industrial buildings are completely integrated with the transmission through the
outer walls and the propagation into the environment.
Sources for the industrial model can vary between point, line and area sources.
The sources can be described with the sound power [Lw] (for a mean frequency, octave
or third octave band), with a 2D or 3D directivity and with a time history defining the
strength of the source within the 24 hours of the day. Routines to convert sound pressure
levels with a given reference distance into sound power and frequency filters are part of
the SoundPLAN tools.
For line and area sources, the sound power can be entered for the entire source (as
per unit) or as a power per meter/square meter of the source. An excavator in a
construction site is a perfect example of a per unit area source. Per meter is a sensible
entry for a conveyor belt that emits a certain sound power every meter of its length,
whereas the per unit setting would be preferred for a fork lifter with a known sound
power that is moving along a defined path.
Figure 5: Industrial Noise Indoors and outdoors with Noise Transmission

Environmental Noise Modeling Using Soundplan 7.2 Software
46
Calculation Standards for Industry Noise
SoundPLAN is standards based software system offering industrial noise
calculations in accordance to all known international standards.
Europe/International: ISO9613 part 1
Germany: VDI 2714 / VDI 2720 / DIN 18005 / TA-Laerm
Austria: OeAL 28
UK: BS 5228
Nordic: General Prediction Method for Industrial Plants / Nord 2000
Japan: ASJ industrial model
USA: Industry model based on TNM, WDI
The calculations for indoor noise problems are based on the VDI 3760.
Although all standards for industry noise intend to simulate the propagation of
noise from a source to a receiver (described by sound power, frequencies, directivity and
hourly history), they are each unique. There are differences in what is simulated and how
the physical parameters of the transmission path are described. Some of the standards
intend to give the worst case answer (i.e. simulate a downwind situation or slight morning
inversion conditions), some intend to simulate the annual average conditions, and some
specialize in describing the momentary situation with wind and weather of current
conditions. Episodes with multiple weather scenarios linked together can form annual
average conditions. Please read each standard text carefully in order to understand the
intent of each particular standard. For describing the physics, there are 3 basic models.
Some of the models share very similar parts with small, but important variations. VDI
2714/2720, the General Prediction Method for Industrial Plants, OEAL28 and the
ISO9613 with variations share the same roots and concepts.
CONCAWE was designed to simulate the propagation for a specific weather
scenario. It was derived from measured data and uses 3rd order polynomials to describe
the effects of wind, stability and ground effect. Unfortunately, these formulas all lose
their validity below 100 meters. SoundPLAN uses the formulas, but derives answers for
closer sources by linear interpolation of the value calculated at 100 meters.

Environmental Noise Modeling Using Soundplan 7.2 Software
47
The new Nord 2000 uses new concepts and features a phase correct reflection of
the wave on the ground. A frequency dependent Fresnel Ellipsoid marks the influence
zone for the propagation. Every object inside this zone has an influence on the results.
Because of this, simple cross-sections are no longer useful for describing the propagation
path.
2) Predictor-LimA Software Suite Type 7810
A software bundle for environmental noise projects that integrates the intuitive
Predictor™ and the flexible LimA™ software into one powerful, state-of-the-art package
- providing an efficient solution for any project.
In the suite, Predictor and LimA can be used as stand-alone applications, or as one
integrated application by using the LimA-Link option in Predictor. Because Predictor and
LimA both use the same fast LimA calculation cores, there is no difference in calculation
speed or calculation capacity.
Predictor has a fast learning curve, enabling you to work efficiently, even for
infrequent users. Modelling is easy with its intuitive and unique multi-model view and
unlimited undo/redo functionality. Being powerful and intuitive with macros for
automated model changes, you can model real life quickly, easily and accurately, even in
complex situations.
LimA is highly configurable. Its openness eases integration with external data
sets, calculation components and other systems. It includes powerful macro functionality
with automated data manipulation and advanced geometric handling for modelling
without the need to use other software such as Geographical Information Systems (GIS).
The suite offers three basic implementations:
1. Predictor: For most projects that require the calculation standards supported by
Predictor, its intuitive user-interface allows them to be handled quickly and easily.
2. LimA stand alone: For calculation standards not supported by Predictor such as
German and Eastern European standards.
3. LimA integrated into other (GIS) systems: For implementing environmental
noise calculation and analysis functionality in other systems.

Environmental Noise Modeling Using Soundplan 7.2 Software
48
Uses
Create and calculate models with the predictor system on multiple PCs on the
network with only one license
Environmental noise mapping, management, action planning and impact
assessment
Fulfillment of European Commission directives such as Environmental Noise
Directive (2002/49/EC) in accordance with Guidelines on Revised Interim
Computation Methods (2003/613/EC)
Fulfillment of the IPPC Directive (2008/1/EC) and similar
Educational purposes
Integration into other (GIS/management) systems
Features
Fast learning curve, even for infrequent users
Accurate and intuitive modelling for complex situations
Fast calculations
Time-saving integrated bookkeeping for model data and results
Powerful result analysis and what-if scenarios
Integration in environmental management, traffic management and Geographical
Information Systems (GIS) as noise calculation core
Automated reverse engineering and instant noise maps using measurements
Automated workflows (including calculation, plots, etc.)
3) CadnaA at a glance
Whether your objective is to study the noise Emission level of an industrial plant,
a mall including a parking lot, a road and railway scheme or even of an entire town with
airport
Industry
Plan noise reduction measures
Maintain emission data in convenient libraries
Compare different scenarios with variants
Review your model with various sophisticated 3D features

Environmental Noise Modeling Using Soundplan 7.2 Software
49
Calculate outdoor sound propagation based on sound sources inside
Take advantage of the data exchange with the indoor noise calculation software
Bastian™
Calculate the uncertainty with standard deviations for emission and propagation
Road & Railway
Compare different planning scenarios
Automatically optimize the barrier next to a street or railway
Visualize and auralize noise reduction scenarios
Efficient project management with object tree and variants
Automatically intersect object data with DTM
Check your model via visualization of all propagation tracks
Noise Mapping
Accelerate your calculation time with distributed calculation and multithreading
Employ all RAM available with 64-bit technology
Efficiently merge various data types using more than 30 different import formats
Access and alternate all object attributes within the 3D View
Analyze your model using various noise assessment techniques
Verify your model via quality assurance while using acceleration techniques
Profit from a maximum level of complexity in detail and the highest possible
clarity when working on large-scale segments.
Industrial Expert System
(Option SET)
Automatically generate sound power spectra based on technical system
parameters of a sound source (e.g. electric power in kW, volume flow in m3/h,
rotation speed in rpm)
Facilitate your work utilizing 150 predefined modules for technical sound sources
such as electric and combustion engines, pumps, ventilators, cooling towers, gear
boxes etc.
Model complex systems including transmissions by combining sources (e.g.
ventilator with two ducts connected)

Environmental Noise Modeling Using Soundplan 7.2 Software
50
Aircraft
(Option FLG)
Calculate noise emitted from civil and military airports based on the calculation
methods AzB 2008, AzB (1975), ECAC Doc.29 or DIN 45684-1
Cover the most relevant procedures for aircraft noise assessment at European and
international level
Perform an overall assessment of the total noise exposure including, road, railway
and aircraft noise
Use radar data and group classification according to ICAO code to calculate the
aircraft noise
Air Pollution
(Option APL)
Calculate, assess and present air pollutant distribution according to the
Lagrangian particle model AUSTAL2000 (other models are being integrated)
Combine the assessment of measures in the context of noise and air quality
mitigation plans
Enjoy the usability and calculation power of CadnaA also while modeling air
pollutant distribution
Apply all import formats without any additional costs
4) Traffic Noise Model
Prior to the release of the FHWA TNM, the FHWA Highway Traffic Noise
Prediction Model (FHWA-RD-77-108), or "108 model," was in use for over 20 years.
Although an effective model for its time, the "108 model" was comprised of acoustic
algorithms, computer architecture, and source code that dated to the 1970s. Since that
time, significant advancements have been made in the methodology and technology for
noise prediction, barrier analysis and design, and computer software design and coding.
Given the fact that over $500 million were spent on barrier design and construction
between 1970 and 1990, the FHWA identified the need to design, develop, test, and
document a state-of-the-art highway traffic noise prediction model that utilized these
Environmental Noise Modeling Using Soundplan 7.2 Software
51
advancements. This need for a new traffic noise prediction model resulted in the FHWA
TNM.
The core vehicle noise emissions database for the "108 model" was collected in
the mid-1970s. Because of the age and associated limitations with this database (e.g., no
data for vehicles on grade or vehicles subject to interrupted-flow conditions), it was
essential that a state-of-the-art, nationally representative database be developed for the
FHWA TNM. A state-sponsored, pooled-fund effort supported the development of the
national reference energy mean emission levels (REMEL) database for the FHWA TNM.
Between 1993 and 1995, data were collected for over 6000 vehicle pass-byes at over 40
sites in 9 states across the country.
The FHWA TNM (Version 1.0) was released in March of 1998. The model was
the culmination of six years of extensive research. It included a new/expanded vehicle
noise emissions database and state-of-the-art acoustical algorithms. After the release, a
survey was distributed to FHWA TNM users to allow user input for program Graphical
User Interface (GUI) enhancements and bug fixes. This list was prioritized, and many of
the enhancements/bug fixes were incorporated into FHWA TNM Versions 1.0a, 1.0b,
and 1.1. Version 1.1 also included a major improvement to the computational speed of
the program, upgrading the architecture from 16 to 32-bit. Unfortunately, this version
also introduced some new bugs. Version 2.0, released in June 2002, focused on removing
Version 1.1 bugs, while maintaining the faster computational speed. Version 2.1, released
in March 2003, fixed additional bugs and included over 20 enhancements to the TNM
GUI. Version 2.5, released in April 2004, is the first version of the software, since the
original release, with major improvements to the acoustics.
The FHWA TNM® is a registered copyright and trademark.
The FHWA TNM contains the following components:
Modeling of five standard vehicle types, including automobiles, medium trucks,
heavy trucks, buses, and motorcycles, as well as user-defined vehicles.
Modeling of both constant-flow and interrupted-flow traffic using a 1994/1995
field-measured data base.
Environmental Noise Modeling Using Soundplan 7.2 Software
52
Modeling of the effects of different pavement types, as well as the effects of
graded roadways.
Sound level computations based on a one-third octave-band data base and
algorithms.
Graphically-interactive noise barrier design and optimization.
Attenuation over/through rows of buildings and dense vegetation.
Multiple diffraction analysis.
Parallel barrier analysis.
Contour analysis, including sound level contours, barrier insertion loss contours,
and sound-level difference contours.
These components are supported by a scientifically founded and experimentally
calibrated acoustic computation methodology, as well as an entirely new, and more
flexible data base, as compared with that of its predecessor, Stamina 2.0/Optima. The
database is made up of over 6000 individual pass-by events measured at forty sites across
the country. It is the primary building block around which the acoustic algorithms are
structured. The most visible difference between the FHWA TNM and Stamina
2.0/Optima is the FHWA TNM's Microsoft Windows interface. Data input is menu-
driven using a digitizer, mouse, and/or keyboard. Users also have the ability to import
Stamina 2.0/Optima files, as well as roadway design files saved in CAD, DXF format.
Color graphics will play a central role in both case construction and visual analysis of
results.
5) CUSTIC software • noise pollution modelling
CUSTIC is software for noise pollution modelling. The program calculates the
noise level in each point of the space considering each one of the sources and the
conditions of the atmosphere. The system of simulation of processes of dispersion that
CUSTIC has, offers to the beginner and the expert programmer, a quick and practical
system to evaluate noise pollution. The program is based on the operating system
Microsoft WINDOWS where one works intensively with the mouse and the graphic
windows.

Environmental Noise Modeling Using Soundplan 7.2 Software
53
It is ideal for environmental impact assessments, environmental consultancy
services and environmental engineering.
With this application you will be able to import images and pictures (previously
saved BMP files) and Google maps. These images will be background pictures and
images for your program window. Many programs and computer applications
(AutoCAD, 3d Studio, ArcView,) export BMP files. You will be able to load pictures and
images generated by these programs.
This software can also be used for risk studies and safety in industries.
Advantages noise pollution modelling
Without considering the experience that the user possesses in programming
languages or in the use of simulation tools, in few minutes he will be able to have the first
results.
With this application you will be able to export your simulation results (BMP
files). These images will contain the background picture (map) and your simulation
results. Many programs and computer applications (AutoCAD, 3d Studio, ArcView, MS
Power Point, and MS Word) can import your saved BMP files.
It works in Cartesian and geographical coordinates and the results can be exported
in Microsoft EXCEL csv files. It is possible to import the CUSTIC generated data in GIS
systems, as Arc Map or ArcView.
CUSTIC carries out temporal averages (daily, monthly or annual) so that you can
calculate the concentration average in each point of the affected area.
CUSTIC works with two different models: the ISO-9613 for punctual sources and
the classical CUSTIC model.
It is possible to obtain XY and XZ noise maps.
6) Integrated Noise Model (INM)
Global Standard Modeling Tool for Aircraft Noise Impacts
ATAC is the primary software developer and system integrator of the Integrated
Noise Model (INM). The INM is the Federal Aviation Administration's (FAA's) standard
computer model for assessing aircraft noise impacts in the vicinity of airports and over

Environmental Noise Modeling Using Soundplan 7.2 Software
54
National Parks. It is the required noise assessment tool for airport noise compatibility
planning under FAR Part 150 and for environmental assessments and impact statements
under FAA Orders 1050 and 5050 in compliance with the National Environmental Policy
Act.
Over 1,000 users in over 65 countries use the INM to assess noise impacts caused
by changes in airspace structures, proposed runways or runway configurations, revised
aircraft routings and flight profiles, modified air traffic control operational procedures,
and revised traffic demand levels or fleet mix.
The INM computer program calculates noise exposure contours in the vicinity of
airports by using a large database of aircraft flight performance and acoustic data along
with airport-specific user-input data. The INM graphical user interface provides a
versatile, user-friendly, windows-style means for users to specify operational scenarios to
be modeled and to review the noise results.
Application of the INM includes:
• Assessing changes in noise impact resulting from new or extended runways or
runway configurations
• Assessing new traffic demand and fleet mix
• Evaluating other operational procedures
• Fulfilling statutory requirements defined in FAA Order 1050.1E, Policies and
Procedures for Considering Environmental Impacts; Order 5050.4A, Airport
Environmental Handbook; and Federal Aviation Regulations (FAR) Part 150,
Airport Noise Compatibility Planning
Features
• The model supports 16 different pre-defined noise metrics from the A-Weighted,
C-Weighted, and Perceived Tone-Corrected noise level families.
• User-defined metrics may also be created from these families, such as the
Australian version of the Noise Exposure Forecast.
• The main outputs from the INM model are noise exposure contours that are used
for land use compatibility mapping.
Environmental Noise Modeling Using Soundplan 7.2 Software
55
• The model calculates predicted noise levels at specific sites, such as hospitals,
schools, or other sensitive locations and provides detailed information for the
analyst to determine which events contribute most significantly to the noise at
each location.
Benefits
The Integrated Noise Model provides significant benefits to the user, including:
• Meeting the requirements for airport noise compatibility planning under FAR Part
150 and for environmental assessments and impact statements under FAA Orders
1050 and 5050 in compliance with the National Environmental Policy Act
• Use of the world's most extensive publicly-available database of aircraft noise and
flight performance data
• The ability to export graphical noise analysis data to commercially available
Geographic Information System (GIS) software such as ESRI Arc Explorer and
MapInfo
7) IMMI - The Noise Mapping Software
IMMI covers a wide range of applications ranging from noise mapping to air
pollution modelling. IMMI integrates both noise and air pollution in a single software
package. In this section we will concentrate on those features of IMMI that were
specifically designed for noise mapping and noise prediction. In these fields, IMMI is one
of the leading packages worldwide. With its modular design and price-list, IMMI can be
tailored to the user's needs and budgets - ask for details.
IMMI is continuously adapted to meet the requirements of evolving regulations
and standards. Depending on the calculation method, IMMI calculates Leq, Lday,
Levening, Lnight, Lden, LAmax, L10 and other sound or statistical indicators.
Currently IMMI can be equipped with:
• Noise calculation methods for road traffic noise, railway traffic noise, air
transport noise and industrial / recreational noise
• More than 20 national and international noise calculation methods
Environmental Noise Modeling Using Soundplan 7.2 Software
56
Noise Mapping gained additional importance with the arrival of Directive
2002/49/EC which is related to the assessment and management of environmental noise.
IMMI is equipped with a full set of functions to produce Strategic Noise Maps of major
roads, major railways, major airports and major agglomerations.
Noise propagation calculation methods according to 2002/49/EC: Road Traffic
Noise: XP S 31-133/NMPB+Guide du Bruit - Railway Noise: RMR-SRM II-1996 -
Industrial Noise: ISO 9613-2 - Aircraft Noise: ECAC. CEAC Doc. 29 and all European
national methods.
3 Packages are available! IMMI is available in any of the three following
packages, each of which carries a different price tag and more or less features.
• ##IMMI Standard is a comfortable entry-level into the world of noise mapping.
• ##IMMI Plus is the next step upwards to model, calculate, analyze and present
projects of varying size.
• ##IMMI Premium is the ultimate professional tool for noise prediction and large-
scale noise mapping.
8) Environmental Noise Control –Behrens and Associates
Using this noise modeling software, engineers can predict the sound levels at
specific points and the surrounding area to observe the impact and sound propagation of
sound sources on the environment.
A technician from ENC collects sound level measurements of sound sources, and
our team of engineers uses the collected data to model the sound sources. Building and
barriers that will affect noise propagation are added into the model. Calculations are
performed in an acoustical modeling program to determine the sound levels at specific
points determined by the client or by municipal codes. Our engineers perform further
calculations to determine any mitigation measures needed to comply with local noise
ordinances.
Engineers can use the software to design and optimize noise reduction measures,
such as enclosures and sound barriers.

Environmental Noise Modeling Using Soundplan 7.2 Software
57
9) Noise3D online™
Noise3D online™ is an innovative web based noise calculation and prediction
software. A solution for architects, industrial planners and environmental experts working
on noise measures. Please have a look at our free trial version. Thereafter, when you
calculate you will pay a fee, no further obligations, no termination needs.
Why noise3D online? … easy to use, yet complete and comprehensive
Noise abatement is a key issue and effective measures are expensive. noise3D
online will help you become successful. With its fast processing engine you will iterate
calculations. This will reduce expenditures and cost. As a service you will avoid
investment and have flexibility. Noise3D online is fast, accurate, effective and practical.
The tool for noise control engineering.
Architects and planners concerned with noise control issues will avoid high
consultants cost and address calculation and mapping needs with noise3D online
themselves – as many calculations as you wish, not just two or three shots by the experts.
Features
• Very user friendly, easy to operate
• Built to estimate or predict environmental noise for planning, engineering or
control of industrial facilities
• Sound pressure levels calculated according to ISO 9613
• considers multitude of acoustic elements including ground effects, obstacles,
reflection, insulation calculates accurate results and creates compelling noise
maps
• Facilitates sound power level simulation Google Earth™ Pro as basis for plan.
Benefits
Acknowledged calculations method according to ISO 9613-2 robust and proven
calculation module of Kramer-Schalltechnik quality graphical 3D input accurate results
in table format compelling 3D noise maps immediate results.
10) SARNAM™ Noise Impact Software
Weapons noise compromises the Department of Defense’s (DoD) ability to
maintain access to resources necessary for military training and testing. Community

Environmental Noise Modeling Using Soundplan 7.2 Software
58
reactions to military noise include complaints, damage claims, legal action, political
pressure, and other efforts to curtail the noisy activity. Noise concerns have prompted
installations to relocate training, impose firing curfews (both time of day and day of the
week), and close ranges. Such short-term-solution decisions, if made without reliable
noise management technology, can needlessly hamper training mission execution and
ultimately impact soldier proficiency and survival. Noise impact assessment software can
guide planning decisions to minimize noise impacts on soldier and civilian health and
welfare. Impulsive noise from military weapons training and testing is not governed by
national laws; consequently, noise management consists of striking a balance between
mission execution and environmental quality. Reliable guidance regarding noise level
reduction under a wide range of conditions is arguably more critical than the absolute
accuracy of noise level predictions for specific conditions.
The military noise impact assessment software, or noise model, known as
SARNAM™ enables calculation and display of noise contours for small arms ranges.
The name SARNAM™ is an acronym for Small Arms Range Noise Assessment Model.
Input options include the type of weapon and ammunition, number and time of shots,
range size and structure, noise dose metrics, and assessment protocols. The model
accounts for muzzle blast and projectile sonic boom spectrum and directivity, which
facilitates accurate sound level prediction and interpretation of receiver response.
SARNAM™ noise level predictions are based on the mean expected value of noise level
metrics for mild downwind sound propagation conditions; this calculation is used in all
directions, which moderately over-predicts noise levels in some regions. SARNAM™ is
most useful as an environmental planning tool to address unwanted noise as an
environmental attribute in the community; it can be used to avoid siting new noise-
sensitive land uses in areas impacted by military noise and to guide mitigation of
environmental impacts of operational plans or new facilities.
The overall objective of this project was to validate and demonstrate the
SARNAM™ small arms noise impact assessment software under typical conditions. The
“validation” aspect of the project sought to test the accuracy of SARNAM™ by
comparing calculation results with comprehensive noise monitoring data to judge noise
level prediction accuracy. The demonstration aspect of the project sought to evaluate the

Environmental Noise Modeling Using Soundplan 7.2 Software
59
software utility and cost during realistic noise management consultation. The software
was used to predict noise contours associated with the operation of a proposed new range
and was then used to explore revisions to the range location and design to reduce the
noise level in the adjacent community. The primary performance measures were the
amount of noise dose reduction, the cost of use, and the projected cost savings.
11) SPM9613 Community Noise Prediction Software, Version 2
Born from our years of estimating and predicting noise from industrial noise
sources, Power Acoustics, Inc. has developed and optimized a low-cost computer
program for analyzing community noise and sound propagation emitted from a variety of
noise sources. The engineering software is based on the ISO 9613 parts 1 and 2
standards. SPM9613 provides calculations at specific field points (listeners) and
predictions of A- and C-weighted sound level contours as well. We sell this software as a
low cost alternative to more expensive and difficult to use computer programs.
The original release of our community noise sound propagation model,
SPM9613™ was in January 1999. Version 2 was released in February 2002. The
software has a Windows based user interface and enables users to perform multi-source
and distributed source predictions with barriers and reflective surfaces. Because the
software is developed by a company that is also an end user, it is extremely flexible and
easy to use.
SPM9613 Features and Extensions
• Fast setup and calculation times
• Automatic breakdown of large 3-D or line sources into multiple point sources
• Multiple barriers
• Reflections - automatic image sources
• Ground Attenuation with defined limits
• Miscellaneous Attenuation (Foliage, Industrial Sites)
• Graphical capability to assure correct user inputs
• Plan views of equipment, barriers, foliage or industrial sites, and observer
locations

Environmental Noise Modeling Using Soundplan 7.2 Software
60
• Source sound power level spectrum plots and directivity plots (vertical and
horizontal)
• Sorted sound source waterfall plots at each observer location
• Contour plotting of A or C weighted levels
• 3-D Ground Elevation plots
• Ground Hardness contours
• Extended Octave Band Center Frequency range - 16 to 8000 Hz
• Computation of C-weighted levels
• Source sorting on A or C-weighting
• Customizing services available
• MS Windows 95, 98, NT, 2000, XP, Vista and Windows 7 Compatible
All calculations, sound sources, barriers, ground elevations and observers are
represented internally within SPM9613 in three dimensions (x, y, z coordinates).
Graphical output is presented in plan views of the equipment and observers and with
contour plots.
There are many other factors which influence the accuracy and usefulness of
models in practice, including the following:
3.8.4 Other factors related to the ways in which models are used in practice
Absence of nationally standardised requirements for the verification and quality
assurance of commercial software which implement engineering methods, leading to a
very wide range of performance and suitability for purpose.
In the absence of clearly defined assessment requirements, the conditions that
should be included in prediction models are often selected in a somewhat arbitrary
manner. There is no defined system for generating traceable accounts of a model output’s
development/construction.
There is varied industry understanding of modelling limitations.
There is an absence of guidance on how to deal with the limitations and
uncertainties of predictions.
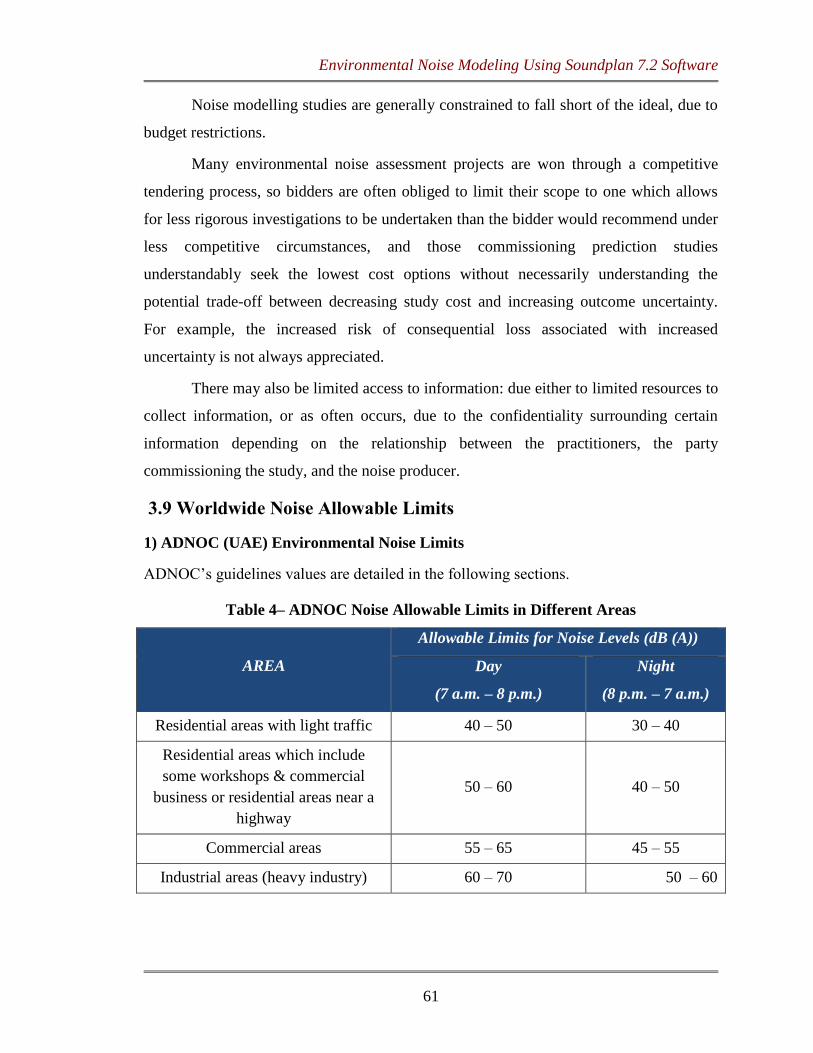
Environmental Noise Modeling Using Soundplan 7.2 Software
61
Noise modelling studies are generally constrained to fall short of the ideal, due to
budget restrictions.
Many environmental noise assessment projects are won through a competitive
tendering process, so bidders are often obliged to limit their scope to one which allows
for less rigorous investigations to be undertaken than the bidder would recommend under
less competitive circumstances, and those commissioning prediction studies
understandably seek the lowest cost options without necessarily understanding the
potential trade-off between decreasing study cost and increasing outcome uncertainty.
For example, the increased risk of consequential loss associated with increased
uncertainty is not always appreciated.
There may also be limited access to information: due either to limited resources to
collect information, or as often occurs, due to the confidentiality surrounding certain
information depending on the relationship between the practitioners, the party
commissioning the study, and the noise producer.
3.9 Worldwide Noise Allowable Limits
1) ADNOC (UAE) Environmental Noise Limits
ADNOC’s guidelines values are detailed in the following sections.
Table 4– ADNOC Noise Allowable Limits in Different Areas
AREA
Allowable Limits for Noise Levels (dB (A))
Day
(7 a.m. – 8 p.m.)
Night
(8 p.m. – 7 a.m.)
Residential areas with light traffic 40 – 50 30 – 40
Residential areas which include
some workshops & commercial
business or residential areas near a
highway
50 – 60 40 – 50
Commercial areas 55 – 65 45 – 55
Industrial areas (heavy industry) 60 – 70 50 – 60

Environmental Noise Modeling Using Soundplan 7.2 Software
62
2) CPCB- Environmental Noise Limits
Table 5– CPCB Noise Allowable Limits in Different Areas
AREA Code AREA
Allowable Limits for Noise
Levels (dB (A))
Day Night
(A) Industrial area 75 70
(B) Commercial area 65 55
(C) Residential area 55 45
(D) Silence Zone 50 40
Notes
1. Day time shall mean from 6.00 a.m. to 10.00 p.m.
2. Night time shall mean from 10.00 p.m. to 6.00 a.m.
3. Silence zone is an area comprising not less than 100 meters around hospitals,
educational institutions, courts, religious places or any other area which is declared
as such by the competent authority
4. Mixed categories of areas may be declared as one of the four above mentioned
categories by the competent authority.
12) 3) Environmental Protection Agency- Environmental Noise Limits
Table 6– EPA Noise Allowable Limits in Different Areas
Land use category
Allowable Limits for Noise Levels (dB (A))
Day
(7 a.m. – 10 p.m.)
Night
(10 p.m. – 7 a.m.)
Rural Living 47 40
Residential 52 45
Rural Industry 57 50
Light Industry 57 50
Commercial 62 55
General Industrial 65 55
Special Industry 70 60

Environmental Noise Modeling Using Soundplan 7.2 Software
63
Chapter-4
CASE STUDY- NOISE MODELLING OF SOUTH ISLAND
USING SOUNDPLAN 7.2 SOFTWARE
4.1 Executive Summary
A noise study for ZADCO UZ750K Project, South Island EPC2 has been
undertaken. The assessment has been conducted in line with ADNOC recommended
environmental noise limit values[20]
, ADNOC HSE Management Codes of Practice [21]
,
ZADCO’s noise design requirements for plant [22]
and Project HSE Philosophy[23]
.
The aim of the study was to demonstrate that EPC2 package facilities will comply
with 85 dB (A) at 1 m during normal operations and 115 dB (A) during emergency
conditions. An assessment of the likely impact on nearby noise sensitive receptors has
also been conducted in accordance with ADNOC allowable noise limits [20]
.
A review of equipment lists, plot plans and vendor supplied data was carried out
to identify noise items of equipment and model them to determine the cumulative noise
impact across South Island. The significant noise generating sources of plant that include
pumps, compressors, generators, the nitrogen package and piping noise were modelled
using SoundPLAN v7.2.
Both normal and emergency operations were modelled and noise contour maps
produced. Sources were either modelled as a point or area sources. In total, 45 noise
sources were modelled. Piping and control valve noise was modelled as an area source
within EPC2 process plant area. At this stage control valve data is not yet finalised
therefore it was estimated control valve and piping noise would account for 10 % of the
total sound energy within the process area.
Current vendor information indicated EPC2 equipment would meet the work area
noise limit of 85 dB(A) at 1 m and the results of the noise modelling showed cumulative
noise levels within the process areas would fall to below 70 dB(A) at the battery
boundary. The worker accommodation is located approximately 200 m south west of the
EPC2 process plant, predicted noise contribution from EPC2 process plant at the

Environmental Noise Modeling Using Soundplan 7.2 Software
64
accommodation area was predicted to be below 50 dB(A) and was in accordance with the
allowable noise limit prescribed by ADNOC.
Emergency plant was limited to firewater pumps and the emergency generators
both of which were found to be in compliance with the emergency nose limit of 115
dB(A). The PA system shall be designed at a minimum of 6 dB higher than the maximum
background level as per the project specification.
The following recommendations are made:
This report shall be updated during the Phase 3 HSEIA on receipt of vendor
information on equipment noise levels, noise levels from piping, control valves and
pressure safety valves. This will ensure compliance of with the FEED HSEIA
recommendation E6.
Cumulative noise impact from all the three compressor trains (2215-B-
1002),operating simultaneously needs to be evaluated at a later stage, and the need for
additional noise controls such as isolation mounts, acoustic insulation, discharge and
suction line silencers, acoustic cladding etc., shall be assessed.
4.2 Background
DNV GL has been retained by ZADCO to conduct a Noise study for the South
Island (SI) EPC2 package located of ZADCO UZ750k Project.
This report presents the findings of the preliminary noise modelling assessment
for normal and emergency operations associated with the equipment designated under the
EPC2 package. Modeled operational plant noise levels have been compared directly with
ADNOC [20]
and ZADCO [23]
noise requirements.
4.3 Noisy Equipment
Following a review of the EPC2 package equipment list the items detailed in
Table 7 were considered potential noise sources to be included in the noise model. The
maximum expected sound pressure level shown in the table for each noise source is
according to equipment datasheet and ZADCO noise specification [22]
. Full details of
modeled equipment are detailed in Appendix A.

Environmental Noise Modeling Using Soundplan 7.2 Software
65
Table 7– EPC2 Potential Noise Sources
Equipment Tag Equipment Name
Maximum Expected
Sound Pressure Level
at 1 m (dBA)
2202-P-
1001A/B/C/D/E/F Crude Oil Transfer Pumps 85
2210-P-1002
A/B/C/D/E/F Produced Water Disposal Pumps 85
2215-B-1001 Air Compressor Package ( Three Trains) 85
2215-B-1002 Compressed Air Dryer Package ( Three
Trains) 85
2216-B-1001 Nitrogen Generation Package 85
2117-B-1-002 Electro chlorination Package 85
2217-P-1001A/B/C Service Water Winning Pumps 85
2217-P-1010 A/B Drilling Water Supply Pumps 85
2211-P-1001A/B MP Flare KO Pump 85
2214-P-1005A/B Drain Water Disposal Pumps 85
2214-P-1001A/B Storm Basin Pumps 85
2214-P-1003A/B Lift Station Pumps (Small) 85
2214-P-1004A/B Lift Station Pumps (Large) 85
2219-P-1001
A/B/C/D/E Fire Water Pump (Diesel Engine Driven) 105
2200-G-001 Emergency Diesel Generator 85
2200-B-002 Emergency Diesel Generator 85
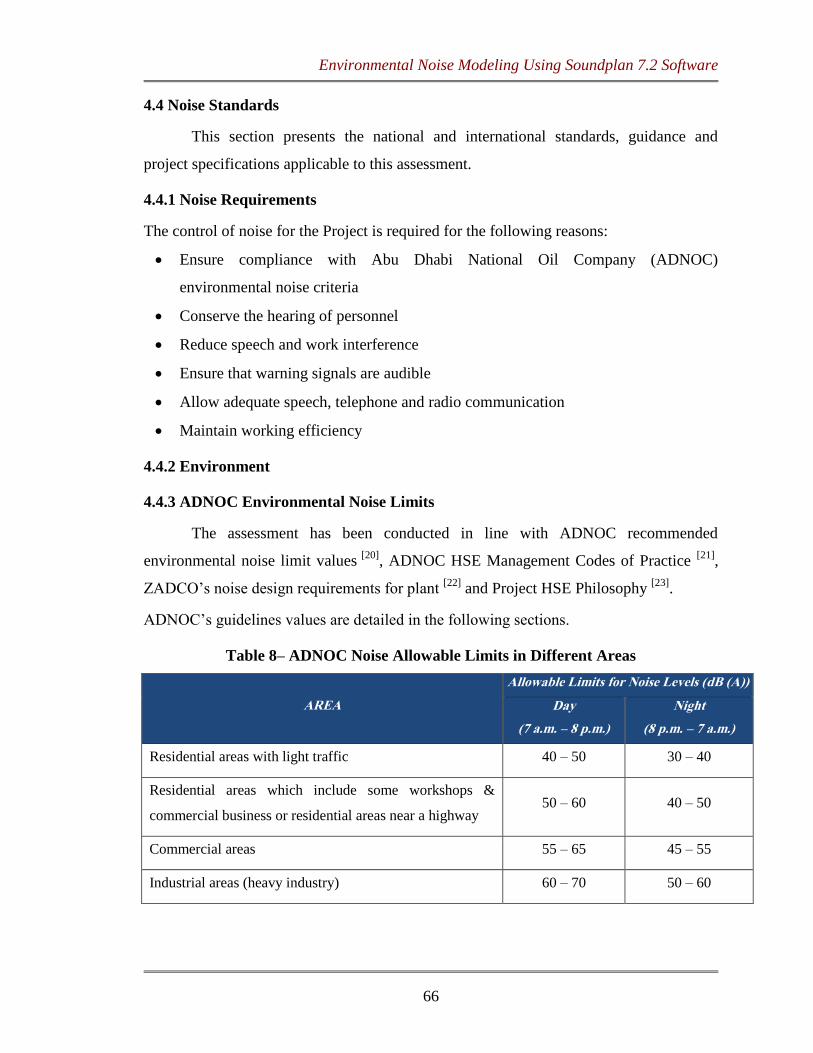
Environmental Noise Modeling Using Soundplan 7.2 Software
66
4.4 Noise Standards
This section presents the national and international standards, guidance and
project specifications applicable to this assessment.
4.4.1 Noise Requirements
The control of noise for the Project is required for the following reasons:
Ensure compliance with Abu Dhabi National Oil Company (ADNOC)
environmental noise criteria
Conserve the hearing of personnel
Reduce speech and work interference
Ensure that warning signals are audible
Allow adequate speech, telephone and radio communication
Maintain working efficiency
4.4.2 Environment
4.4.3 ADNOC Environmental Noise Limits
The assessment has been conducted in line with ADNOC recommended
environmental noise limit values [20]
, ADNOC HSE Management Codes of Practice [21]
,
ZADCO’s noise design requirements for plant [22]
and Project HSE Philosophy [23]
.
ADNOC’s guidelines values are detailed in the following sections.
Table 8– ADNOC Noise Allowable Limits in Different Areas
AREA
Allowable Limits for Noise Levels (dB (A))
Day
(7 a.m. – 8 p.m.)
Night
(8 p.m. – 7 a.m.)
Residential areas with light traffic 40 – 50 30 – 40
Residential areas which include some workshops &
commercial business or residential areas near a highway 50 – 60 40 – 50
Commercial areas 55 – 65 45 – 55
Industrial areas (heavy industry) 60 – 70 50 – 60
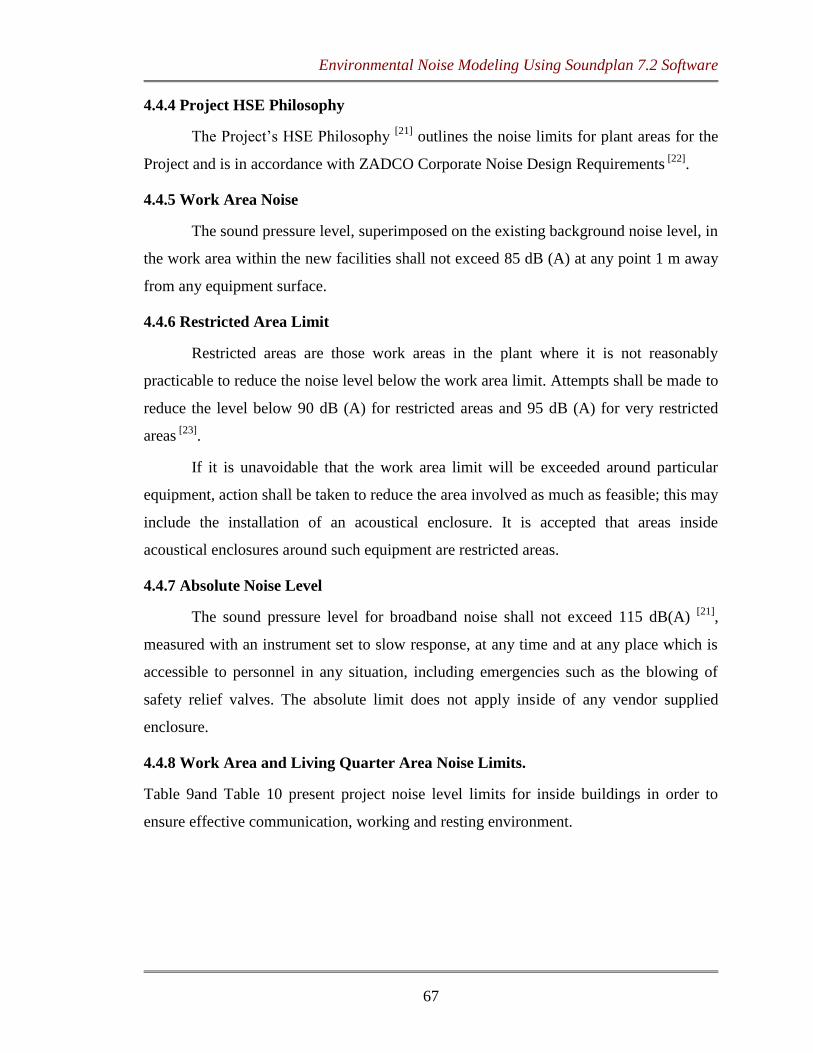
Environmental Noise Modeling Using Soundplan 7.2 Software
67
4.4.4 Project HSE Philosophy
The Project’s HSE Philosophy [21]
outlines the noise limits for plant areas for the
Project and is in accordance with ZADCO Corporate Noise Design Requirements [22]
.
4.4.5 Work Area Noise
The sound pressure level, superimposed on the existing background noise level, in
the work area within the new facilities shall not exceed 85 dB (A) at any point 1 m away
from any equipment surface.
4.4.6 Restricted Area Limit
Restricted areas are those work areas in the plant where it is not reasonably
practicable to reduce the noise level below the work area limit. Attempts shall be made to
reduce the level below 90 dB (A) for restricted areas and 95 dB (A) for very restricted
areas [23]
.
If it is unavoidable that the work area limit will be exceeded around particular
equipment, action shall be taken to reduce the area involved as much as feasible; this may
include the installation of an acoustical enclosure. It is accepted that areas inside
acoustical enclosures around such equipment are restricted areas.
4.4.7 Absolute Noise Level
The sound pressure level for broadband noise shall not exceed 115 dB(A) [21]
,
measured with an instrument set to slow response, at any time and at any place which is
accessible to personnel in any situation, including emergencies such as the blowing of
safety relief valves. The absolute limit does not apply inside of any vendor supplied
enclosure.
4.4.8 Work Area and Living Quarter Area Noise Limits.
Table 9and Table 10 present project noise level limits for inside buildings in order to
ensure effective communication, working and resting environment.
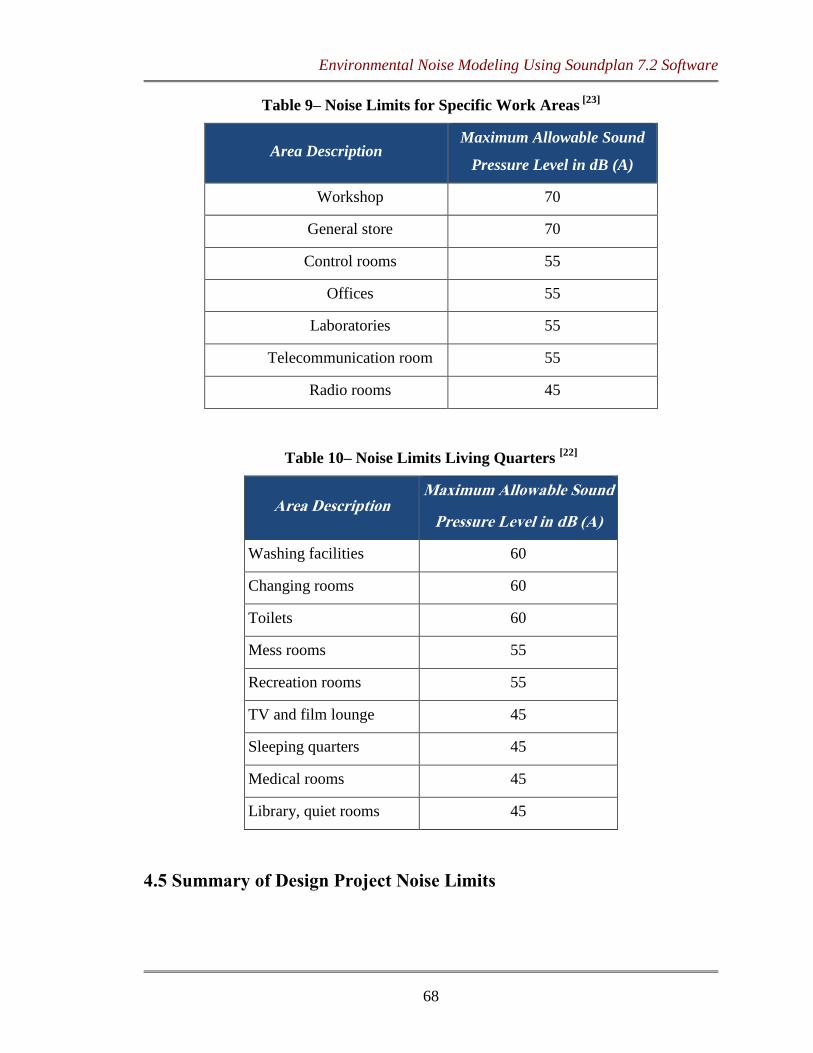
Environmental Noise Modeling Using Soundplan 7.2 Software
68
Table 9– Noise Limits for Specific Work Areas [23]
Area Description Maximum Allowable Sound
Pressure Level in dB (A)
Workshop 70
General store 70
Control rooms 55
Offices 55
Laboratories 55
Telecommunication room 55
Radio rooms 45
Table 10– Noise Limits Living Quarters [22]
Area Description Maximum Allowable Sound
Pressure Level in dB (A)
Washing facilities 60
Changing rooms 60
Toilets 60
Mess rooms 55
Recreation rooms 55
TV and film lounge 45
Sleeping quarters 45
Medical rooms 45
Library, quiet rooms 45
4.5 Summary of Design Project Noise Limits
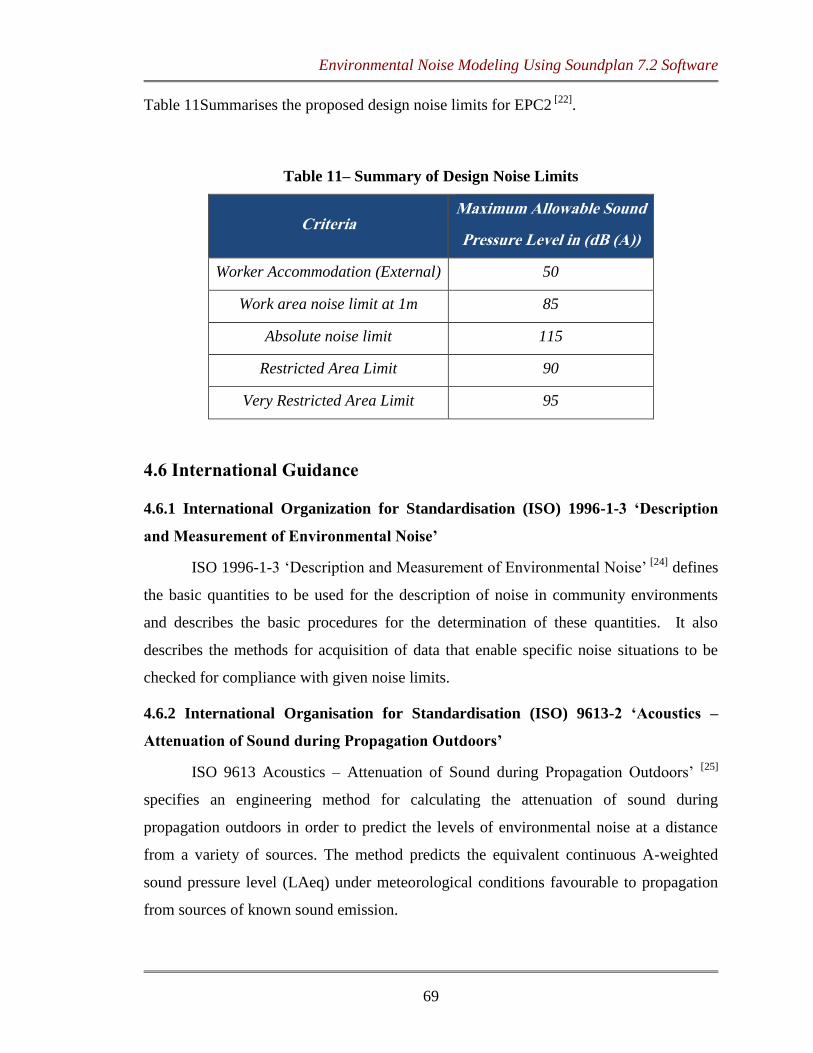
Environmental Noise Modeling Using Soundplan 7.2 Software
69
Table 11Summarises the proposed design noise limits for EPC2 [22]
.
Table 11– Summary of Design Noise Limits
Criteria Maximum Allowable Sound
Pressure Level in (dB (A))
Worker Accommodation (External) 50
Work area noise limit at 1m 85
Absolute noise limit 115
Restricted Area Limit 90
Very Restricted Area Limit 95
4.6 International Guidance
4.6.1 International Organization for Standardisation (ISO) 1996-1-3 ‘Description
and Measurement of Environmental Noise’
ISO 1996-1-3 ‘Description and Measurement of Environmental Noise’ [24]
defines
the basic quantities to be used for the description of noise in community environments
and describes the basic procedures for the determination of these quantities. It also
describes the methods for acquisition of data that enable specific noise situations to be
checked for compliance with given noise limits.
4.6.2 International Organisation for Standardisation (ISO) 9613-2 ‘Acoustics –
Attenuation of Sound during Propagation Outdoors’
ISO 9613 Acoustics – Attenuation of Sound during Propagation Outdoors’ [25]
specifies an engineering method for calculating the attenuation of sound during
propagation outdoors in order to predict the levels of environmental noise at a distance
from a variety of sources. The method predicts the equivalent continuous A-weighted
sound pressure level (LAeq) under meteorological conditions favourable to propagation
from sources of known sound emission.
Environmental Noise Modeling Using Soundplan 7.2 Software
70
4.7 Modelling Methodology
4.7.1 Noise Model
In order to predict operational noise levels, the internationally recognised noise
modelling software, SoundPLAN, has been utilised.
A 3-dimensional model is produced by defining the relative/absolute heights of
the local ground surfaces, sources and any obstacles which may provide noise screening.
Noise screening calculations include effects from tanks, bunds and buildings. In the
absence of spectral data for plant, single figure barrier attenuations were used.
The propagation methodology adopted within the SoundPLAN model was the
International Organisation for Standardisation (ISO) 9613 ‘Acoustics – Attenuation of
Sound during Propagation Outdoors’ (ISO, 1996) [25]
.
ISO 9613 specifies an engineering method for calculating the attenuation of sound
during propagation outdoors in order to predict the levels of environmental noise at a
distance from a variety of sources. The method predicts the equivalent continuous A-
weighted sound pressure level (LAeq) under meteorological conditions favourable to
propagation from sources of known sound emission. The source (or sources) may be
moving or stationary and takes account of the following physical effects:
Geometrical divergence
Atmospheric absorption
Ground effect
Reflection from surfaces
Screening by obstacles
This method is applicable in practice to a great variety of noise sources and
environments. It is applicable, directly or indirectly, to most situations concerning:
industrial noise sources, road or rail traffic, construction activities, and many other
ground-based noise sources.
Environmental Noise Modeling Using Soundplan 7.2 Software
71
4.7.2 Propagation of Sound
Historically, the variables which affect sound propagation over ground away from
a source have been the subject of much detailed investigation over the years. The
principal factors influencing sound attenuation with distance from the source are:
Geometrical spreading (this is the standard spherical wave divergence term which
gives 6 dB reduction in noise level for each doubling of distance from a point source e.g.
small motor, and 3 dB for a line source e.g. piping[26]
Source directivity
Atmospheric (molecular) absorption
Ground effects (different for hard/soft ground, and type of ground cover)
Atmospheric wind temperature gradients (refraction)
Source height
Atmospheric turbulence
Barrier effects (Diffraction)
The total attenuation due to all these factors except geometrical spreading and
directivity is generally referred to as ‘excess attenuation’, and will vary with frequency.
Because of these effects, a significant noise source may not be significant at, and beyond,
the boundary and vice-versa. A noise source dominated by low frequency noise (with a
long wave length) is likely to travel a greater distance under the same excess attenuation
factors to that of a noise source dominated with high frequency noise (with a shorter
wavelength).
4.7.3 Meteorological and Ground Conditions
The most influential environmental condition on noise propagation is distance, the
greater the distance between the noise source and the receiver the greater the noise
reduction achieved. Typically for stationary sources (such as a refinery), a reduction of 6
dB (A) per doubling of distance is considered the norm [26]
The type of ground cover also influences noise propagation. Soft ground such as
sand or agricultural land absorbs sound energy shortening the propagation path whereas
hard ground such as compact soil or tarmac reflects the sound energy and thereby noise
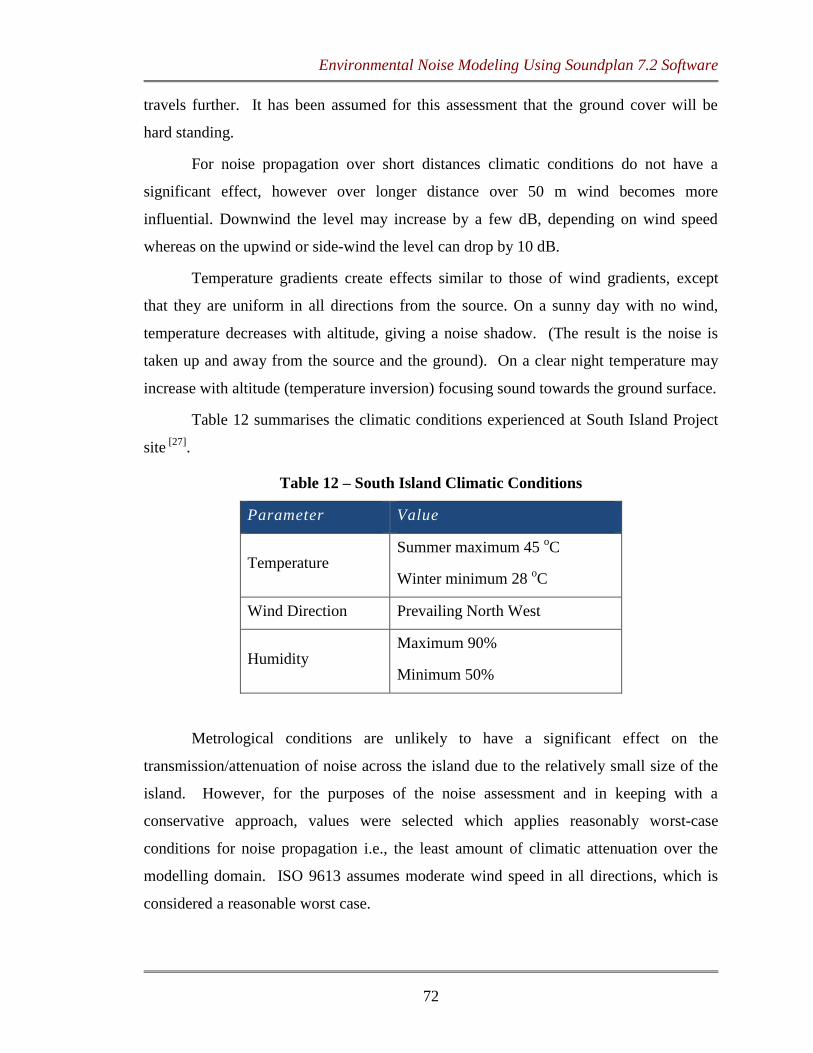
Environmental Noise Modeling Using Soundplan 7.2 Software
72
travels further. It has been assumed for this assessment that the ground cover will be
hard standing.
For noise propagation over short distances climatic conditions do not have a
significant effect, however over longer distance over 50 m wind becomes more
influential. Downwind the level may increase by a few dB, depending on wind speed
whereas on the upwind or side-wind the level can drop by 10 dB.
Temperature gradients create effects similar to those of wind gradients, except
that they are uniform in all directions from the source. On a sunny day with no wind,
temperature decreases with altitude, giving a noise shadow. (The result is the noise is
taken up and away from the source and the ground). On a clear night temperature may
increase with altitude (temperature inversion) focusing sound towards the ground surface.
Table 12 summarises the climatic conditions experienced at South Island Project
site [27]
.
Table 12 – South Island Climatic Conditions
Parameter Value
Temperature Summer maximum 45
oC
Winter minimum 28 oC
Wind Direction Prevailing North West
Humidity Maximum 90%
Minimum 50%
Metrological conditions are unlikely to have a significant effect on the
transmission/attenuation of noise across the island due to the relatively small size of the
island. However, for the purposes of the noise assessment and in keeping with a
conservative approach, values were selected which applies reasonably worst-case
conditions for noise propagation i.e., the least amount of climatic attenuation over the
modelling domain. ISO 9613 assumes moderate wind speed in all directions, which is
considered a reasonable worst case.

Environmental Noise Modeling Using Soundplan 7.2 Software
73
4.7.4 Modelled Equipment
Equipment was either modelled as a point or area source. The compressor trains,
pumps, nitrogen package and emergency generators were modelled as point sources and
the pipe racks were modelled as area sources. Lw values were estimated using the
following general acoustic equations, where r = 1metre:
Lw = Lp + 20 log10 (r) + 8dB (semi-spherical point source)
Lw = Lp + 20 log10 (r) + 11dB (spherical point source)
The estimated values are presented in Appendix A.
Data on control valves is not yet finalised, however vendors will need to design
control valves to comply with 85 dB (A) noise limit at 1 meter. In order to represent noise
from control valves and associated piping within the model, a conservative estimate has
been made that piping noise will account for 10% of the total sound power level per unit
area.
The sum sound power level of all equipment within the project was calculated at
107 dB (A) therefore piping noise was calculated at 97 dB (A). Please note that the
piping noise is isolated to pipe racks located in EPC2 Process area.
Noise from control valves will be re-assessed when this data is available.
4.7.5 Modelling Basis and Assumptions
The following assumptions have been made for the modelling assessment, and
wherever possible, a conservative approach has been taken:
Noise sources have been modelled as either point or area sources.
Pipe and control valve noise has been modelled as 10% of the total sound power level
of all other equipment.
There are no noise barriers between source and receptors, unless specified.
Calculations have been performed in the eight octave bands centered between 63
hertz (Hz) and 8 kilo hertz (kHz).
The model does not incorporate features which might provide partial screening (e.g.,
columns, pipe racks, structural steelwork, and small equipment) but does include
tanks and buildings.
Environmental Noise Modeling Using Soundplan 7.2 Software
74
Ground absorption has been modelled conservatively as hard (having an absorption
coefficient of 0).
The topography between noise source and the site boundary receptors is flat (in
reality, the topography may undulate leading to attenuation of noise).
Reasonable worst case meteorological conditions have been applied, i.e. steady wind
conditions blowing in each direction.
It is assumed that predicted noise level due to the project is more than 10dB (A)
higher than the background noise level. ADNOC Manual of Codes of Practice
Guideline on OHRM: Noise Control and Hearing Conservation, ADNOC CoP V3-10,
2009 in above table depicts that with a difference of 10dB noise level addition to a
higher noise level is 0.4 dB which is negligible. Therefore no background noise data
has been included in this model.
4.8 Predicted Noise Levels
Three noise contour maps have been prepared to determine the noise levels in-
plant areas, across the facility, and beyond the battery unit at ground level. Calculations
have been carried out under normal operating and emergency conditions to determine
level of compliance to environmental, occupational and project specific noise
requirements. Noise contour maps of the outputs are presented in Appendix B as follows:
Figure B1: EPC2 Normal Operations PBU 1 Phase: Noise Contour
Figure B2: EPC2 Normal Operations PBU 2A Phase: Noise Contour
Figure B3: EPC2 Emergency Conditions : Noise Contour
4.8.1 Normal Operations
EPC2 will include two operational phases; PBU 1 and PBU 2A. Along with the
noisy equipment modelled in PBU 1,
- PBU 2A also includes the following equipment items:
2202-P1001A F Crude Oil Transfer Pumps
2210-P-1002A-F Produced Water Disposal Pumps
High noise levels are localised to individual items of equipment within EPC2 with
cumulative noise levels falling to below 70 dB (A) at the battery fence line.
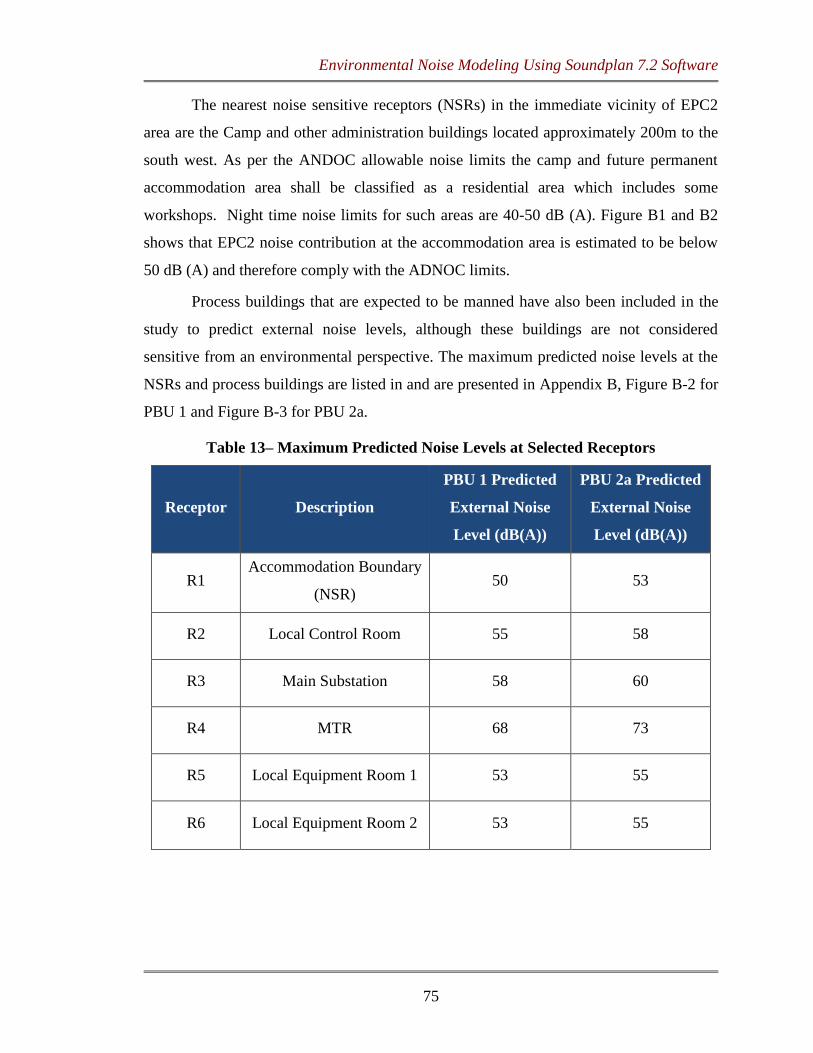
Environmental Noise Modeling Using Soundplan 7.2 Software
75
The nearest noise sensitive receptors (NSRs) in the immediate vicinity of EPC2
area are the Camp and other administration buildings located approximately 200m to the
south west. As per the ANDOC allowable noise limits the camp and future permanent
accommodation area shall be classified as a residential area which includes some
workshops. Night time noise limits for such areas are 40-50 dB (A). Figure B1 and B2
shows that EPC2 noise contribution at the accommodation area is estimated to be below
50 dB (A) and therefore comply with the ADNOC limits.
Process buildings that are expected to be manned have also been included in the
study to predict external noise levels, although these buildings are not considered
sensitive from an environmental perspective. The maximum predicted noise levels at the
NSRs and process buildings are listed in and are presented in Appendix B, Figure B-2 for
PBU 1 and Figure B-3 for PBU 2a.
Table 13– Maximum Predicted Noise Levels at Selected Receptors
Receptor Description
PBU 1 Predicted
External Noise
Level (dB(A))
PBU 2a Predicted
External Noise
Level (dB(A))
R1 Accommodation Boundary
(NSR) 50 53
R2 Local Control Room 55 58
R3 Main Substation 58 60
R4 MTR 68 73
R5 Local Equipment Room 1 53 55
R6 Local Equipment Room 2 53 55
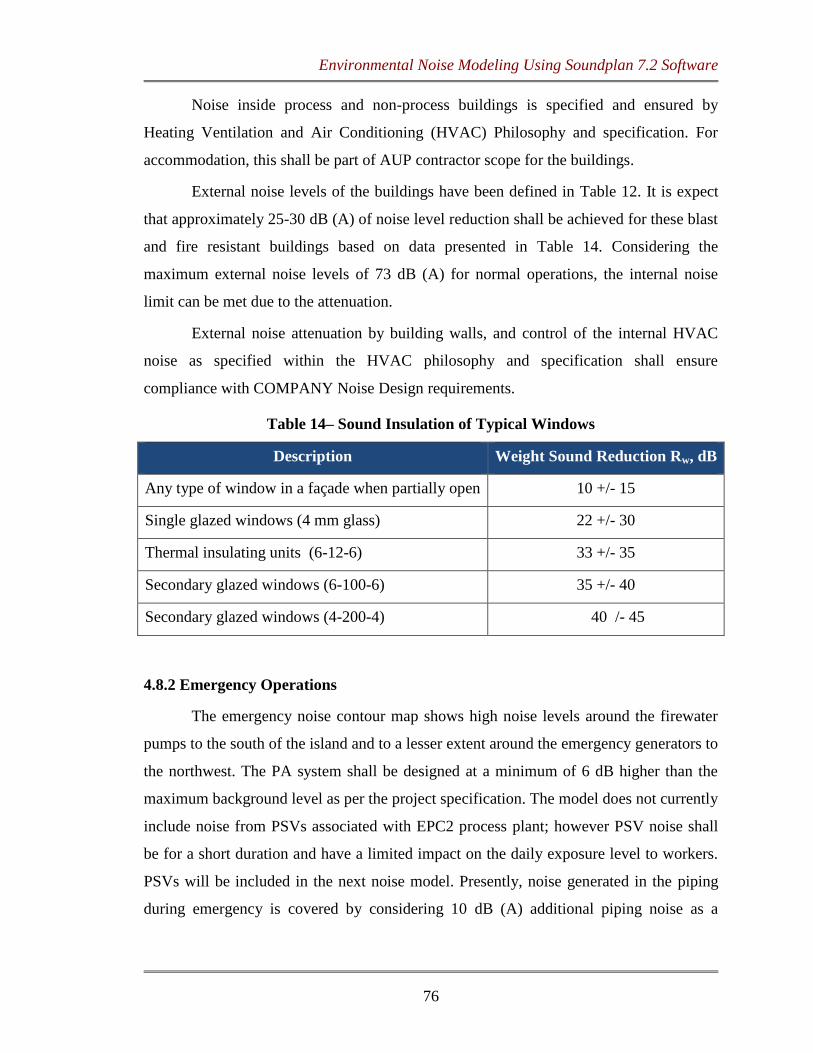
Environmental Noise Modeling Using Soundplan 7.2 Software
76
Noise inside process and non-process buildings is specified and ensured by
Heating Ventilation and Air Conditioning (HVAC) Philosophy and specification. For
accommodation, this shall be part of AUP contractor scope for the buildings.
External noise levels of the buildings have been defined in Table 12. It is expect
that approximately 25-30 dB (A) of noise level reduction shall be achieved for these blast
and fire resistant buildings based on data presented in Table 14. Considering the
maximum external noise levels of 73 dB (A) for normal operations, the internal noise
limit can be met due to the attenuation.
External noise attenuation by building walls, and control of the internal HVAC
noise as specified within the HVAC philosophy and specification shall ensure
compliance with COMPANY Noise Design requirements.
Table 14– Sound Insulation of Typical Windows
Description Weight Sound Reduction Rw, dB
Any type of window in a façade when partially open 10 +/- 15
Single glazed windows (4 mm glass) 22 +/- 30
Thermal insulating units (6-12-6) 33 +/- 35
Secondary glazed windows (6-100-6) 35 +/- 40
Secondary glazed windows (4-200-4) 40 /- 45
4.8.2 Emergency Operations
The emergency noise contour map shows high noise levels around the firewater
pumps to the south of the island and to a lesser extent around the emergency generators to
the northwest. The PA system shall be designed at a minimum of 6 dB higher than the
maximum background level as per the project specification. The model does not currently
include noise from PSVs associated with EPC2 process plant; however PSV noise shall
be for a short duration and have a limited impact on the daily exposure level to workers.
PSVs will be included in the next noise model. Presently, noise generated in the piping
during emergency is covered by considering 10 dB (A) additional piping noise as a

Environmental Noise Modeling Using Soundplan 7.2 Software
77
thumb rule. Noise modelling and assessment due to operation of blow down valves
considering vendor input shall be undertaken in the HSEIA Phase 3.
4.8.3 Control and Safety Valves
Currently there is not enough project data to include individual control or pressure
safety valves in the model. However piping noise has been included in EPC2 process
area, which provides a level of expected noise allocation from valve noise
Control valves that operate continuously or intermediately will need to comply
with the work area noise limit of 85 dB (A) at 1m. Whereas pressure safety valves or
control valves discharging in upset conditions should be designed not to exceed 115 dB
(A) at 1 m. The design of the PA system should therefore take these two parameters into
consideration.
Where there is the potential for control valves to exceed 85 dB (A), noise control
measures shown in Appendix C should be considered as a means of noise control.
Environmental Noise Modeling Using Soundplan 7.2 Software
78
Chapter 5.
RESULTS AND DISCUSSION
The aim of this study is to demonstrate that EPC2 package facilities will comply
with ADNOC [20]
and ZADCO’s noise requirements and design specifications [21]
. This
study is based on preliminary design data.
The significant noise generating sources of plant that include pumps,
compressors, generators, the nitrogen package and piping noise were modelled using
SoundPLAN v7.2. Normal and emergency operations were modelled and noise contour
maps produced for each. Sources were either modelled as a point or area sources. In total,
45 noise sources were modelled.
At this stage equipment noise data and specifications are limited, but it has been
confirmed that individual equipment items would meet the work area noise limit of 85 dB
(A) at 1 m. The exception to this was the firewater pumps that were modelled at 105 dB
(A) at 1 m and the emergency generators that were modelled at 85 dB (A) at 1m.
The modelling results show that the noise Levels across EPC2 process area range
from 62-85 dB (A) and that equipment would be in compliance with the work area noise
limits.
The emergency conditions scenario included all EPC2 equipment as well as the
firewater pumps and emergency generators. It is considered unlikely that noise from the
fire water pumps and generators will have a significant impact on the design of the PA
system and will not exceed the absolute noise level of 115 dB(A).
It is expected that equipment vendors will achieve the project noise limit of 85 dB
(A) at 1 m, if this is the case then it is predicted that EPC2 should be compliant with the
Project noise standards.
It should however be noted that as there are three compressor trains, these
cumulatively could pose a potential exceedance in the work area noise limit of 85 dB (A).
Therefore careful consideration should be made to the suction and discharge lines and
compressor connection points. Possible noise control measures include; isolation mounts,
acoustic insulation, silencers and acoustic cladding.

Environmental Noise Modeling Using Soundplan 7.2 Software
79
The following recommendations are made:
• This report shall be updated during the Phase 3 HSEIA on receipt of vendor
information on equipment noise levels, noise levels from piping, control valves
and pressure safety valves. This will ensure compliance of with the FEED HSEIA
recommendation E6.
• Cumulative noise impact from all the three compressor trains (2215-B-1002)
operating simultaneously needs to be evaluated at a later stage, and the need for
additional noise controls such as isolation mounts, acoustic insulation, discharge
and suction line silencers, acoustic cladding etc., shall be assessed.
• Noise Verification Survey during commissioning and normal operation of the
plant should be carried out per ZADCO requirement.

Environmental Noise Modeling Using Soundplan 7.2 Software
80
Noise Data Log
Table 15– EPC2 Process Plant Equipment Data Log Book
Equipment Tag Equipment Name
Number
of
sources
Height
above
ground
(m)
Continuous/
Intermittent /
Emergency
Scenario
Modelled
Source
Type
Equipment
Specification
Noise Limit
at 1 m
(dBA)
Sound
Power
Level
(dB)
Sound Power level frequency spectrum (dB)
63
Hz
125
Hz
250
Hz
500
Hz
1
KHz
2
KHz
4
KHz
8
KHz
2202-P-
1001A/B/C/D/E/F
Crude Oil Transfer
Pumps 6 1 C
PBU 2A/
Emergency Point 85 96 84.8 85.8 87.8 87.8 90.8 87.8 83.8 77.8
2210-P-1002
A/B/C/D/E/F
Produced Water
Disposal Pumps 6 1 C
PBU 2A/
Emergency Point 85 96 84.8 85.8 87.8 87.8 90.8 87.8 83.8 77.8
2215-B-1001 Air Compressor
Package 3 2.5 C
PBU 1 /
PBU 2A/
Emergency
Point 85 96 81.6 86.6 85.6 83.6 86.6 91.6 88.6 81.6
2215-B-1001
Air Compressor
Package (Air
coolers)
3 9.5 C
PBU 1 /
PBU 2A/
Emergency
Point 85 96 81.6 86.6 85.6 83.6 86.6 91.6 88.6 81.6
2215-B-1002
Compressed Air
Dryer Package
(Three Trains)
1 2.5 C
PBU 1 /
PBU 2A/
Emergency
Point 85 96 81.6 86.6 85.6 83.6 86.6 91.6 88.6 81.6
2216-B-1001
Nitrogen
Generation
Package
1 9.5 C
PBU 1 /
PBU 2A/
Emergency
Point 85 96 81.6 86.6 85.6 83.6 86.6 91.6 88.6 81.6
2117-B-1-002
Electro
chlorination
Package
1 1 C
PBU 1 /
PBU 2A/
Emergency
Point 85 96 81.6 86.6 85.6 83.6 86.6 91.6 88.6 81.6

Environmental Noise Modeling Using Soundplan 7.2 Software
81
Equipment Tag Equipment Name
Number
of
sources
Height
above
ground
(m)
Continuous/
Intermittent /
Emergency
Scenario
Modelled
Source
Type
Equipment
Specification
Noise Limit
at 1 m
(dBA)
Sound
Power
Level
(dB)
Sound Power level frequency spectrum (dB)
63
Hz
125
Hz
250
Hz
500
Hz
1
KHz
2
KHz
4
KHz
8
KHz
2217-P-
1001A/B/C
Service Water
Winning Pumps 3 1 C
PBU 1 /
PBU 2A/
Emergency
Point 85 96 84.8 85.8 87.8 87.8 90.8 87.8 83.8 77.8
2217-P-1010 A/B Drilling Water
Supply Pumps 2 1 C
PBU 1 /
PBU 2A/
Emergency
Point 85 96 84.8 85.8 87.8 87.8 90.8 87.8 83.8 77.8
2211-P-1001A/B MP Flare KO
Pump 2 1 E
PBU 1 /
PBU 2A/
Emergency
Point 85 96 84.8 85.8 87.8 87.8 90.8 87.8 83.8 77.8
2214-P-1005A/B Drain Water
Disposal Pumps 2 1 C
PBU 1 /
PBU 2A/
Emergency
Point 85 96 84.8 85.8 87.8 87.8 90.8 87.8 83.8 77.8
2214-P-1001A/B Storm Basin
Pumps 2 1 I
PBU 1 /
PBU 2A/
Emergency
Point 85 96 84.8 85.8 87.8 87.8 90.8 87.8 83.8 77.8
2214-P-1003A/B Lift Station Pumps
(Small) 2 1 C
PBU 1 /
PBU 2A/
Emergency
Point 85 96 84.8 85.8 87.8 87.8 90.8 87.8 83.8 77.8
2214-P-1004A/B Lift Station Pumps
(Large) 2 1 C
PBU 1 /
PBU 2A/
Emergency
Point 85 96 84.8 85.8 87.8 87.8 90.8 87.8 83.8 77.8

Environmental Noise Modeling Using Soundplan 7.2 Software
82
Equipment Tag Equipment Name
Number
of
sources
Height
above
ground
(m)
Continuous/
Intermittent /
Emergency
Scenario
Modelled
Source
Type
Equipment
Specification
Noise Limit
at 1 m
(dBA)
Sound
Power
Level
(dB)
Sound Power level frequency spectrum (dB)
63
Hz
125
Hz
250
Hz
500
Hz
1
KHz
2
KHz
4
KHz
8
KHz
2219-P-1001
A/B/C/D/E
Fire Water Pump
(Diesel Engine
Driven)
5 1 E Emergency Point 105 116 101.8 102.8 104.8 104.8 107.8 104.8 100.8 94.8
2200-G-001 Emergency Diesel
Generator 1 2 E Emergency Point 85 96 89.9 90.9 90.9 90.9 88.9 86.9 83.9 78,9
2200-B-002 Emergency Diesel
Generator 1 2 E Emergency Point 85 96 89.9 90.9 90.9 90.9 88.9 86.9 83.9 78,9
- Process Piping 2 10 C
PBU 1 /
PBU 2A /
Emergency
Area - 97 - - - - - - - -
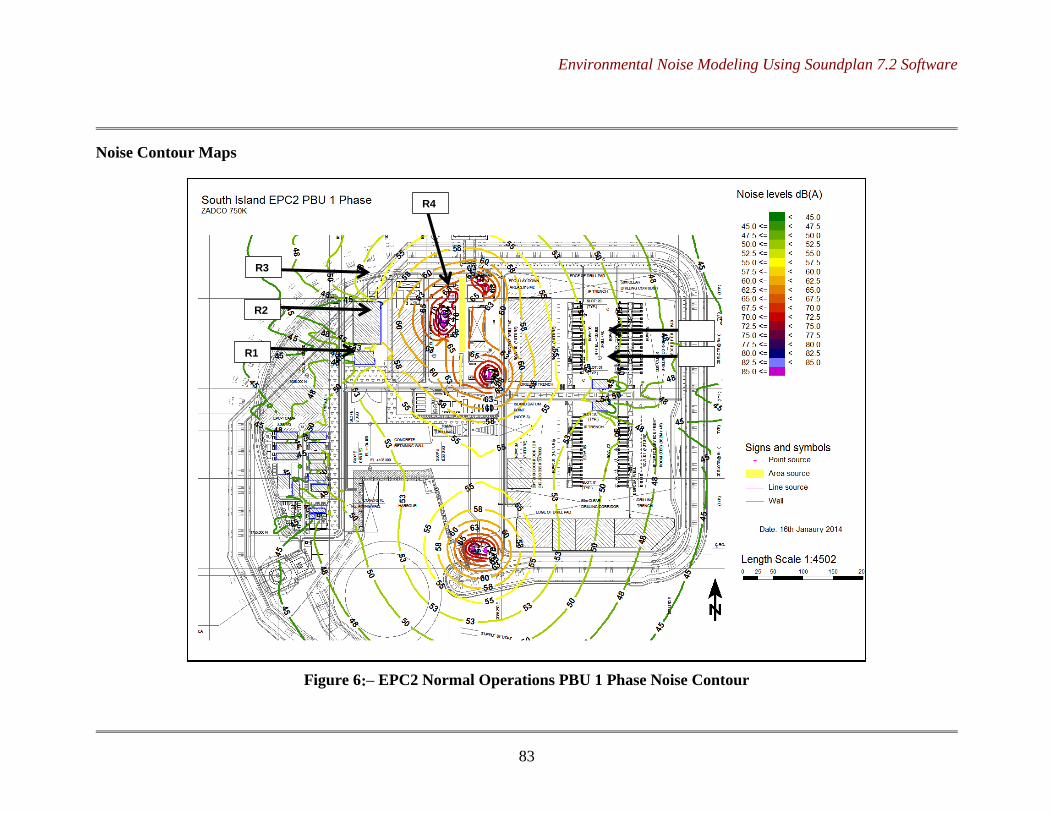
Environmental Noise Modeling Using Soundplan 7.2 Software
83
Noise Contour Maps
Figure 6:– EPC2 Normal Operations PBU 1 Phase Noise Contour
R1
R2
R3
R4
R5
R6

Environmental Noise Modeling Using Soundplan 7.2 Software
84
Figure 7:– EPC2 Normal Operations PUB 2A Phase Noise Contour
R1
R2
R3
R4
R5
R6
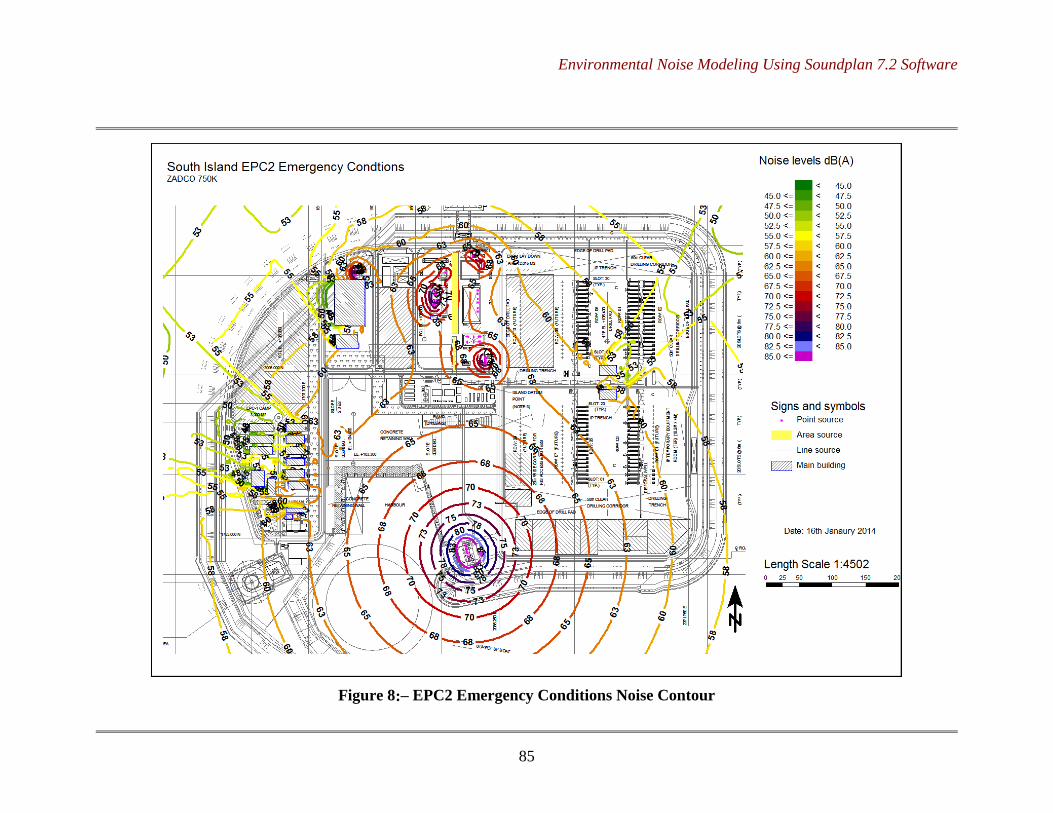
Environmental Noise Modeling Using Soundplan 7.2 Software
85
Figure 8:– EPC2 Emergency Conditions Noise Contour

Environmental Noise Modeling Using Soundplan 7.2 Software
86
5.1 Recommended Noise Controls for Valves and Piping Where
Applicable
5.1.1 Low Noise Valves
Low-noise’ trims for valves are commonly specified as a means of noise control
to meet workplace noise limits. These ‘low-noise’ trims reduce the pressure in numerous
discrete stages within the valve, resulting in lower valve-generated noise levels Figure A3
shows one arrangement of a ‘low noise’ valve (for example).
Figure 9– Low Noise Valve with Whisper Trim Type Cage
5.1.2 Multi Stage Restriction Orifices
As with ‘low noise’ valves, ‘low noise’ multi-stage restriction orifices, consisting
of a number of pressure-reducing plates or perforated screens, are available. Each plate,
or stage, is larger than the previous one, to adjust for increases in fluid volume as the
pressure is decreased. Figure A4 presents a typical arrangement of a multi-stage
restriction orifice.

Environmental Noise Modeling Using Soundplan 7.2 Software
87
Figure 10– Multi Stage Restriction Orifice
5.1.3 In-Line Silencers
In-line silencers are the most effective path treatment for attenuating acoustic
energy. A silencer located in the line downstream of a pressure reducing valve will
reduce the acoustic energy near its point of origin and prevent it from propagating along
the pipe.
5.1.4 Piping Insulation
International Organisation Standards (ISO) document: 15665; Acoustics-
Acoustic insulation for pipes, valves and flanges [28]
. This standard defines the three
classes of acoustic insulation, namely, A, B and C. The insertion loss data for each class
of acoustic insulation is detailed in Table A2.
The insertion loss of acoustic insulation is related to the diameter of the pipe on
which it is applied. The pipe diameters are divided into three pipe size groups and the
insulation class will consist of a letter/number combination indicating the diameter on
which the insulation is applied.
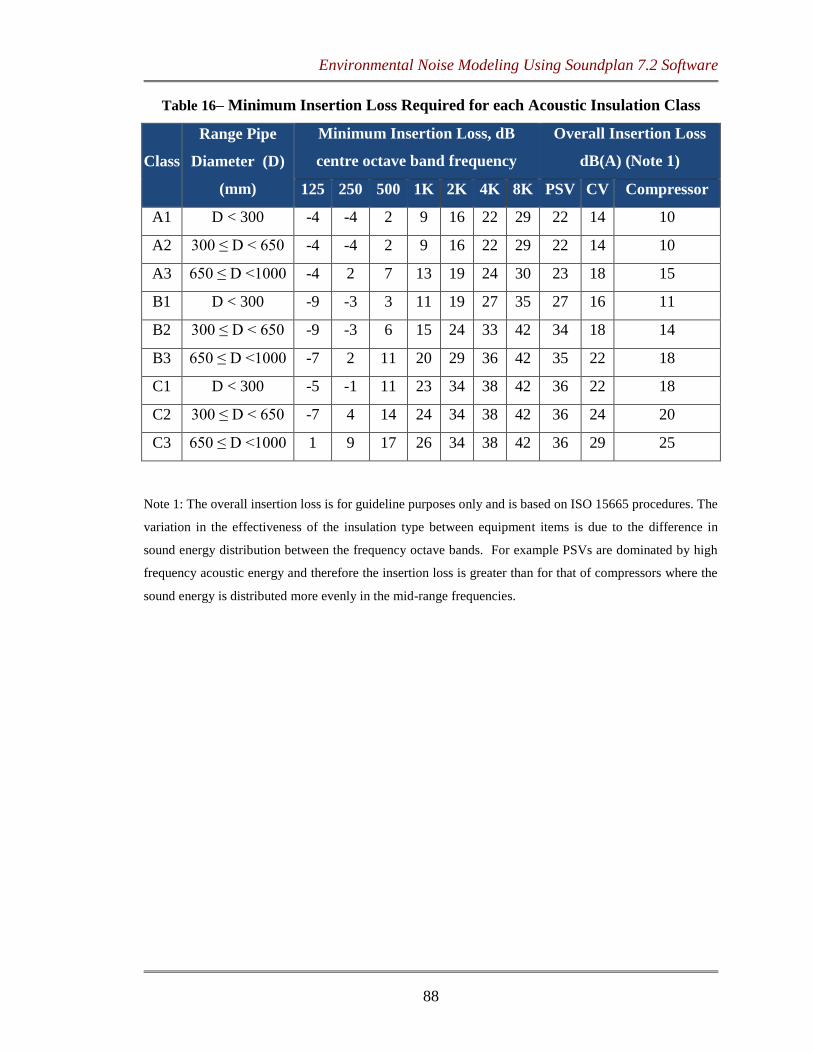
Environmental Noise Modeling Using Soundplan 7.2 Software
88
Table 16– Minimum Insertion Loss Required for each Acoustic Insulation Class
Class
Range Pipe
Diameter (D)
(mm)
Minimum Insertion Loss, dB
centre octave band frequency
Overall Insertion Loss
dB(A) (Note 1)
125 250 500 1K 2K 4K 8K PSV CV Compressor
A1 D < 300 -4 -4 2 9 16 22 29 22 14 10
A2 300 ≤ D < 650 -4 -4 2 9 16 22 29 22 14 10
A3 650 ≤ D <1000 -4 2 7 13 19 24 30 23 18 15
B1 D < 300 -9 -3 3 11 19 27 35 27 16 11
B2 300 ≤ D < 650 -9 -3 6 15 24 33 42 34 18 14
B3 650 ≤ D <1000 -7 2 11 20 29 36 42 35 22 18
C1 D < 300 -5 -1 11 23 34 38 42 36 22 18
C2 300 ≤ D < 650 -7 4 14 24 34 38 42 36 24 20
C3 650 ≤ D <1000 1 9 17 26 34 38 42 36 29 25
Note 1: The overall insertion loss is for guideline purposes only and is based on ISO 15665 procedures. The
variation in the effectiveness of the insulation type between equipment items is due to the difference in
sound energy distribution between the frequency octave bands. For example PSVs are dominated by high
frequency acoustic energy and therefore the insertion loss is greater than for that of compressors where the
sound energy is distributed more evenly in the mid-range frequencies.

Environmental Noise Modeling Using Soundplan 7.2 Software
89
CONCLUSIONS AND RECOMMENDATIONS
The computational results estimated by SoundPLAN software indicate that the
placement of individual barriers around some of the noisier equipment’s/machines did
not suffice to limit the noise propagating to the external environment. Since the main
objective is to control the cumulative noise propagating to the external environment, the
partial placement of barriers along some critically noisy walls or additional noise controls
such as isolation mounts, acoustic insulation, discharge and suction line silencers,
acoustic cladding etc. are more effective to control nighttime noise, preventing the
emission. limit of 50 dB(A) from reaching the neighborhood and adjacent buildings in the
factory.
The use of this Environment methodology allows one to predict noise distribution
patterns in the proximities of manufacturing plants, aiming to devise measures to control
and reduce noise propagation and thereby satisfy any statutory body
(ADNOC/CPCB/EPA etc.) Noise Allowable Limits.
The use of computational tools to analyze noise is suitable for cases in which it is
important to be aware of the environmental impact produced by a plant in a given region.
The proposed methodology for predicting noise pollution prior to the construction,
expansion or modification of manufacturing units is useful, enabling one to meet current
noise regulations.

Environmental Noise Modeling Using Soundplan 7.2 Software
90
REFERENCES
1) The International Journal of Transport & Logistics Medzinárodný Časopis Doprava
A Logistika, Traffic Noise In Small Urban Areas, M. Hadzi-Nikolova, D.
Mirakovski , Z. Despodov , N. Doneva (Faculty of Natural and Technical Science
Stip, Macedonia, University)[2012]
2) Modeling and Mapping of Urban Noise Pollution with Soundplan Software, Ass.
Hadzi-Nikolova M, Ass. Prof. Mirakovski D, Ass. Ristova E, Ass. Ceravolo S. Lj,
(Faculty of Natural and Technical Science Stip, Macedonia, University) [2010]
3) Acoustics 2008, Geelong Victoria, Australia 24th
to 26th
November 2008,
Comparison of Kilde Report 130 Rail Noise Modelling Predictions for SoundPLAN
4.2 and 6.5, Mark Batstone, Rhys Brown and Jennifer Uhr [2008]
4) Rapport AMM 2011:2, Generalizations and Accuracy in Community Noise
Modelling – A Case Study on Railway Noise in Burlöv Municipality, Kristoffer
Mattisson [2011]
5) Proceedings of 20th International Congress on Acoustics, ICA 2010 23-27 August
2010, Sydney, Australia, Further Comparison of Traffic Noise Predictions Using the
CadnaA and SoundPLAN Noise Prediction Models, Peter Karantonis , Tracy Gowen
and Mathew Simon, Renzo Tonin & Associates (NSW) Pty Ltd, NSW, Australia
[2010]
6) Road Traffic Noise: GIS Tools for Noise Mapping and a Case Study for Skåne
Region, F. Farcaş , Å. Sivertun, Linköping University, Sweden
7) Acoustics 2008, Geelong Victoria, Australia 24th
to 26th
November 2008,
Comparison of Traffic Noise Predictions of Arterial Roads using Cadna-A and
SoundPLAN Noise Prediction Models Michael Chung , Peter Karantonis , David
Gonzaga and Tristan Robertson, Environmental Acoustics Team, Renzo Tonin &
Associates Pty Ltd, Australia [2008]
8) Modeling and simulation of noise impact along a new railway section in Sao Paulo,
Brazil Maria Luiza Belderrain, Rafael Vaidotas and Wanderley Montemurro, CLB
Engenharia Consultiva
9) Proceedings of MUCEET2009, Malaysian Technical Universities Conference on
Engineering and Technology June 20-22, 2009, MS Garden,Kuantan, Pahang,

Environmental Noise Modeling Using Soundplan 7.2 Software
91
Malaysia, MUCEET2009, A study on noise level produced by road traffic in
putrajaya using soundplan road traffic noise software, Abdullah, M.E., Shamsudin,
M.K., Karim, N., Bahrudin, I.A., and Shah, S.M.R
10) Traffic Noise Predictive Models Comparison with Experimental Data, Claudio
Guarnaccia*, Tony LL Lenza°, Nikos E. Mastorakis, and Joseph Quartieri**
Department of Physics “E.R. Caianiello”, Faculty of Engineering° Department of
Industrial Engineering, Faculty of Engineering University of Salerno
11) Using Traffic Models as a Tool When Creating Noise Maps- -Methods used in the
EU-project QCity Pia Sundbergh, Research Engineer Royal Institute of Technology
(KTH) Stockholm, Sweden
12) International Journal of Occupational Safety and Ergonomics (JOSE) 2011, Vol. 17,
No. 3, 309–325, 12), Problems of Railway Noise—A Case Study Małgorzata
Szwarc, Bożena Kostek, Józef Kotus, Maciej Szczodrak, Andrzej Czyżewski,
Faculty of Electronics, Gdańsk University of Technology, Gdańsk, Poland
13) Latest Trends in Energy, Environment and Development, Industrial Settlements
Acoustic Noise Impact Study by Predictive Software and Computational Approach
Claudio Guarnaccia*, Joseph Quartieri*, Alessandro Ruggiero*, Tony L. Lenza,
Department of Industrial Engineering, University of Salerno [2014]
14) Noise Dispersion Modelling in Small Urban Areas with CUSTIC 3.2 Software,
Marija Hadzi-Nikolova, Dejan Mirakovski, Todor Delipetrov, Pance Arsov, Faculty
of Natural and Technical Sciences, University “Goce Delcev” Stip, Macedonia
15) Integrating a Noise Modeling Capability With Simulation Environments, Raymond
M. C. Miraflor , NASA Ames Research Center, Moffett Field, California U.S.A
16) Integrated Noise Model Route Optimization for Aircraft, Student team: Jessica
Kreshover, Phil Larson, Simmons Lough, Eric Merkt, Faculty Advisors: Garrick
Louis and Christina Mastrangelo, Department of Systems Engineering
17) Noise mapping as a tool for controlling industrial noise pollution, W J P Casas1*, E
P Cordeiro1, T C Mello and P H T Zannin Universidade Federal do Rio Grande do
Sul, Departamento de Engenharia Mecânica, Rua Sarmento Leite

Environmental Noise Modeling Using Soundplan 7.2 Software
92
18) Modeling and Mapping of Urban Noise Pollution with SoundPLAN Software,
Marjia Hazdi-Nikoloava, Dejan Mirakovski, Emilija Ristova, Ljubica Stefanovska
Ceravolo
19) Guide to Predictive Modelling for Environmental Noise
20) ADNOC Manual of Codes of Practice: ‘Code of Practice on Environmental Impact
Assessment’, ADNOC-COP V2-01. (May 2004).
21) ADNOC HSE Management Codes of Practice Volume 3: Occupational Health,
Guideline on OHRM: Noise Control and Hearing Conservation.
22) ZADCO Corporate Engineering Specifications – Noise Design Requirements for
Plant and Equipment Z0-TS-M-01020
23) Project HSE Philosophy Upper Zakum 750 Islands Surface Facilities Project – EPC2
Project. P7512-BD-2000-N-0001. (04 July 2013).
24) International Organization for Standardisation (ISO) ISO1996-1-3 ‘Description and
Measurement of Environmental Noise’
25) International Organisation for Standardisation (ISO) ISO9613-2 ‘Acoustics –
Attenuation of Sound During Propagation Outdoors’.
26) Sharland, Ian. Woods Practical Guide to Noise Control. Woods of Colchester
Limited (1979).
27) Upper Zakum - 750K Artificial Islands Project, Environmental Scoping Report –
EPC 1&2, Vectra, 2011.
28) International Organisation for Standardisation (ISO) ISO15665 – ‘Acoustic
Insulation for Pipes, Valves and Flanges’
29) PA/GA System Specification - Green & Brown Field Upper Zakum 750 Islands
Surface Facilities Project – EPC2 Project., Doc No. P7512-TS-2000-T-0007, 2013
30) Table 10, BS 8233:1999, Sound insulation and noise reduction for buildings. Code
of practice.
31) K E Gilbert, M J White, “Application of the parabolic equation to sound propagation
in a refracting. atmosphere”, J. A. S. A. 85, pp.630-637, 1989. Details of the BEM
are given in S N Chandler-Wilde, “The boundary element method in outdoor noise
propagation”, Proceedings of the Institute of Acoustics 19(8), 27-50, 1997

Environmental Noise Modeling Using Soundplan 7.2 Software
93
Standards, regulations and guidance notes
• ISO 9613-2, Acoustics — Attenuation of sound during propagation outdoors —
Part 2: General method of calculation
• ADNOC Manual of Codes of Practice: ‘Code of Practice on Environmental
Impact Assessment’, ADNOC-COP V2-01. (May 2004).
• ADNOC HSE Management Codes of Practice Volume 3: Occupational Health,
Guideline on OHRM: Noise Control and Hearing Conservation.
• BS 4142, Method for rating industrial noise affecting mixed residential and
industrial areas
• BS 5228-2, Noise and vibration control on construction and open sites — Part 2:
Guide to noise and vibration control legislation for construction and demolition
including road construction and maintenance
• BS 7445, Description and measurement of environmental noise
• IPPC H3 Horizontal Noise Guidance. Part 1 ‘Regulation and Permitting’ and Part
2 'Noise Assessment and Control'
• Calculation of Road Traffic Noise 1988, Department of Transport, Welsh Office
• Calculation of Railway Noise 1995. Department of Transport
• The CAA Aircraft Noise Contour Model: ANCON Version 1. DORA Report
9120, Civil Aviation Authority 1992
• PPG 24 Planning Policy Guidance: Planning and Noise. Department of the
Environment 1994. TAN11 (Wales); PAN56 (Scotland)
• BS 9142: 2006 Assessment methods for environmental noise — Guide,
2003/01534 12 July 2006

Environmental Noise Modeling Using Soundplan 7.2 Software
iv
ABSTRACT
The Environmental Noise Modeling Using SoundPLAN 7.2 Software thesis has
been prepared for all parties who commission, undertake or use environmental noise
predictions for commercial or industrial operations, of whatever type or scale, for which
an environmental noise assessment may be required.
The purpose of this thesis is to identify the contribution of noise from external
sources to the noise pollution generated by a industry, by comparing sound pressure
levels measured in its surroundings and those calculated by noise mapping.
As an example ZADCO UZ750K Project, South Island EPC2 was chosen and
sound pressure levels were measured at discrete points along two rings around it, called
receivers.
The noise measurement data from the first ring were entered into the SoundPLAN
software to determine, through iteration, the South Island EPC2 main noise sources. The
software then used this information to calculate noise maps and sound pressure levels at
the receiver’s positions in the second ring. Finally, the contribution of noise from external
sources to the overall noise generated by the factory was determined by comparing the
noise measured in the second ring with the simulated data. The placement of partial
barriers along some critically noisy walls was found to be effective in controlling
nighttime noise, ensuring that the sound level limit for this type of neighborhood, which
is established by technical standards for environmental noise as Leq = 60 dB (A), is not
reached.
Environmental Noise Modeling Using Soundplan 7.2 Software
v
CONTENTS
SR.
NO. TITLE
PAGE
NO.
TITLE i
CERTIFICATE ii
ACKNOWLEDGEMENT iii
ABSTRACT iv
CONTENTS v
LIST OF FIGURES vii
LIST OF TABLES vii
1. INTRODUCTION 1
1.1 Why Environmental Noise Modelling 2
1.2 Environmental Noise Modelling 3
1.3 Uses of the Environmental Noise Modelling: 5
1.4 Information Needed to Construct a Noise Model 6
1.5 Models in general use and their intrinsic limitations and risks 9
1.5.1 Practical Engineering Methods: 9
1.5.2 Approximate Semi-Analytical Methods: 9
1.5.3 Numerical Methods: 10
1.5.4 Hybrid Models: 12
1.5.5 Ray-Tracing Models 12
1.6 Reliability of the Environmental Noise Modelling 14
2. LITERATURE REVIEW 15
3. ENVIRONMENTAL NOISE MODELLING METHODOLOGY 25
3.1 Stage 1: Review the Requirement for Predictions 26
3.2 Stage 2: Preliminary Screening Study 26
3.3 Stage 3: Detailed Model Design 27
3.3.1 Physical Environment 28
3.3.2 Sources 29
3.3.3 Propagation Algorithm 30
Environmental Noise Modeling Using Soundplan 7.2 Software
vi
3.4 Stage 4: Execute Calculations 31
3.5 Stage 5: Analyse and Report 31
3.6 Risks in Environmental Noise Assessment 32
3.6.1 Introduction 32
3.7 Risk, Variability and Uncertainty 34
3.8 Factors Affecting Risk in Environmental Noise Predictions 38
3.8.1 Input Data 39
3.8.2 Algorithms for Outdoor Sound Propagation 41
3.8.3 Environmental Noise Modelling Proprietary Software 41
3.8.4 Other factors related to the ways in which models are used in
practice
58
3.9 Worldwide Noise Allowable Limits 59
4. CASE STUDY- NOISE MODELLING OF SOUTH ISLAND
USING SOUNDPLAN 7.2 SOFTWARE
61
4.1 Executive Summary 61
4.2 Background 62
4.3 Noisy Equipment 62
4.4 Noise Standards 64
4.4.1 Noise Requirements 64
4.4.2 Environment 64
4.4.3 ADNOC Environmental Noise Limits 64
4.4.4 Project HSE Philosophy 65
4.4.5 Work Area Noise 65
4.4.6 Restricted Area Limit 65
4.4.7 Absolute Noise Level 65
4.4.8 Work Area and Living Quarter Area Noise Limits. 65
4.5 Summary of Design Project Noise Limits 66
4.6 International Guidance 67
4.6.1 International Organization for Standardisation (ISO) 1996-1-
3 ‘Description and Measurement of Environmental Noise’
67

Environmental Noise Modeling Using Soundplan 7.2 Software
vii
4.6.2 International Organisation for Standardisation (ISO) 9613-2
‘Acoustics – Attenuation of Sound during Propagation Outdoors’
67
4.7 Modelling Methodology 68
4.7.1 Noise Model 68
4.7.2 Propagation of Sound 69
4.7.3 Meteorological and Ground Conditions 69
4.7.4 Modelled Equipment 71
4.7.5 Modelling Basis and Assumptions 71
4.8 Predicted Noise Levels 72
4.8.1 Normal Operations 72
4.8.2 Emergency Operations 74
4.8.3 Control and Safety Valves 75
5. RESULTS AND DISCUSSION 76
5.1 Recommended Noise Controls for Valves and Piping Where
Applicable
84
5.1.1 Low Noise Valves 84
5.1.2 Multi Stage Restriction Orifices 84
5.1.3 In-Line Silencers 85
5.1.4 Piping Insulation 85
CONCLUSIONS AND RECOMMENDATIONS 87
REFERENCES 88

Environmental Noise Modeling Using Soundplan 7.2 Software
viii
LIST OF FIGURES
FIGURE
NO. TITLE
PAGE
NO.
1 The simplest type of model 4
2 Noise Contours 4
3 Common approach to environmental noise measurements 25
4 Indicative sound level versus distance chart depicting increasing
variability with distance from source
37
5 Industrial Noise Indoors and outdoors with Noise Transmission 43
6 EPC2 Normal Operations PBU 1 Phase Noise Contour 81
7 EPC2 Normal Operations PUB 2A Phase Noise Contour 82
8 EPC2 Emergency Conditions Noise Contour 83
9 Noise Valve with Whisper Trim Type Cage 84
10 Multi Stage Restriction Orifice 85

Environmental Noise Modeling Using Soundplan 7.2 Software
ix
LIST OF TABLES
TABLE
NO. TITLE
PAGE
NO.
1 Necessities of the specification of a noisy environment 7
2 Features of commonly used environmental noise modelling
methods
13
3 Significant causes of variation in environmental noise sound fields 35
4 ADNOC Noise Allowable Limits in Different Areas 59
5 CPCB Noise Allowable Limits in Different Areas 60
6 EPA Noise Allowable Limits in Different Areas 60
7 EPC2 Potential Noise Sources 63
8 ADNOC Noise Allowable Limits in Different Areas 64
9 Noise Limits for Specific Work Areas 66
10 Noise Limits Living Quarters 66
11 Summary of Design Noise Limits 67
12 South Island Climatic Conditions 70
13 Maximum Predicted Noise Levels at Selected Receptors 73
14 Sound Insulation of Typical Windows 74
15 EPC2 Process Plant Equipment Data Log Book 78
16 Minimum Insertion Loss Required for each Acoustic Insulation
Class
86
d