environmental monitoring report...bcsf bulk chemical storage facility bod-5 biochemical oxygen...
TRANSCRIPT

Knolls Laboratory and Kesselring Site
Environmental Monitoring
Report
Calendar Year 2018
Prepared for the U. S. Department of Energy by Fluor Marine Propulsion, LLC

Environmental Monitoring Report – 2018
KNOLLS LABORATORY AND KESSELRING SITE
ENVIRONMENTAL MONITORING REPORT
CALENDAR YEAR 2018
Prepared for the U.S. Department of Energy by Fluor Marine Propulsion, LLC
Knolls Laboratory Niskayuna, New York
Document Number: KN-RES-ESH-EC-00022
Intentionally Blank
Environmental Monitoring Report – 2018
i
TABLE OF CONTENTS
Page
TABLE OF CONTENTS ................................................................................................................ i
LIST OF TABLES ........................................................................................................................... v
LIST OF FIGURES ......................................................................................................................... viii
LIST OF ACRONYMS ................................................................................................................... ix
COMMON ABBREVIATIONS ..................................................................................................... xii
EXECUTIVE SUMMARY .............................................................................................................. 1
INTRODUCTION ............................................................................................................................. 9
ENVIRONMENTAL PROGRAM & COMPLIANCE ....................................................... 13 ENVIRONMENTAL PROGRAM ....................................................................................................... 13 ENVIRONMENTAL, SAFETY, AND HEALTH MANAGEMENT SYSTEM ......................................... 13 ENVIRONMENTAL COMPLIANCE .................................................................................................. 14
ENVIRONMENTAL MONITORING ............................................................................................ 27
KNOLLS LABORATORY ................................................................................................................ 27
SITE DESCRIPTION ................................................................................................................ 27 LIQUID EFFLUENT MONITORING .......................................................................................... 29
Sources ....................................................................................................................... 29 Effluent Monitoring ....................................................................................................... 30 Effluent Analyses ......................................................................................................... 33 Assessment ................................................................................................................. 33
AIRBORNE EFFLUENT MONITORING ................................................................................... 43
Sources ....................................................................................................................... 43 Effluent Monitoring ....................................................................................................... 44 Effluent Analyses ......................................................................................................... 44 Assessment ................................................................................................................. 45
ENVIRONMENTAL MONITORING ........................................................................................... 47
Scope .......................................................................................................................... 47 Analyses ..................................................................................................................... 49 Assessment ................................................................................................................. 50 Special Mohawk River Surveys .................................................................................... 55
RADIATION MONITORING ...................................................................................................... 56
Scope .......................................................................................................................... 56 Analyses ..................................................................................................................... 57 Assessment ................................................................................................................. 57

Environmental Monitoring Report – 2018
ii
TABLE OF CONTENTS (continued)
Page GROUNDWATER MONITORING............................................................................................. 57
Scope .......................................................................................................................... 57 Sources ....................................................................................................................... 57 Analyses ..................................................................................................................... 58 Assessment ................................................................................................................. 61
CONTROL OF CHEMICALLY HAZARDOUS SUBSTANCES AND SOLID WASTE .................. 71 Sources ....................................................................................................................... 71 Chemical Control Program ........................................................................................... 71 Chemical Disposal ....................................................................................................... 72 Solid Waste Disposal/Recycling ................................................................................... 72
CONTROL OF RADIOACTIVE MATERIALS AND RADIOACTIVE WASTE .............................. 72
Sources ....................................................................................................................... 72 Control Program .......................................................................................................... 72 Disposal/Recycling ...................................................................................................... 73
CONTROL OF MIXED WASTES .............................................................................................. 73
Sources ....................................................................................................................... 73 Control Program .......................................................................................................... 73 Storage and Disposal .................................................................................................. 73
RADIATION DOSE ASSESSMENT .......................................................................................... 74
KESSELRING SITE ....................................................................................................................... 75
SITE DESCRIPTION ................................................................................................................ 75 LIQUID EFFLUENT MONITORING .......................................................................................... 77
Sources ....................................................................................................................... 77 Effluent Monitoring ....................................................................................................... 78 Effluent Analyses ......................................................................................................... 79 Assessment ................................................................................................................. 79
AIRBORNE EFFLUENT MONITORING ................................................................................... 85
Sources ....................................................................................................................... 85 Effluent Monitoring ....................................................................................................... 85 Effluent Analyses ......................................................................................................... 86 Assessment ................................................................................................................. 86
ENVIRONMENTAL MONITORING ........................................................................................... 88
Scope .......................................................................................................................... 88 Analyses ..................................................................................................................... 88 Assessment ................................................................................................................. 89
RADIATION MONITORING ...................................................................................................... 89
Scope .......................................................................................................................... 90 Analyses ..................................................................................................................... 90 Assessment ................................................................................................................. 90

Environmental Monitoring Report – 2018
iii
TABLE OF CONTENTS (continued)
Page GROUNDWATER MONITORING............................................................................................. 95
Scope .......................................................................................................................... 95 Sources ....................................................................................................................... 96 Analyses ..................................................................................................................... 96 Assessment ................................................................................................................. 101 Conclusion .................................................................................................................. 109
CONTROL OF CHEMICALLY HAZARDOUS SUBSTANCES AND SOLID WASTE .................. 109
Chemical Control Program ........................................................................................... 109 Solid Waste Disposal/Recycling ................................................................................... 110
CONTROL OF RADIOACTIVE MATERIALS AND RADIOACTIVE WASTE .............................. 110
Sources ....................................................................................................................... 110 Control Program .......................................................................................................... 110 Disposal/Recycling ...................................................................................................... 111
CONTROL OF MIXED WASTES .............................................................................................. 111
Sources ....................................................................................................................... 111 Control Program .......................................................................................................... 111 Disposal ...................................................................................................................... 111
RADIATION DOSE ASSESSMENT .......................................................................................... 111
SEPARATIONS PROCESS RESEARCH UNIT ............................................................................... 113
BACKGROUND ....................................................................................................................... 113 LIQUID EFFLUENT MONITORING .......................................................................................... 113
Sources ....................................................................................................................... 113 Effluent Monitoring ....................................................................................................... 115 Effluent Analyses ......................................................................................................... 115 Assessment ................................................................................................................. 115
AIRBORNE EFFLUENT MONITORING ................................................................................... 115
Sources ....................................................................................................................... 115 Effluent Monitoring ....................................................................................................... 115 Effluent Analyses ......................................................................................................... 116 Assessment ................................................................................................................. 116
ENVIRONMENTAL MONITORING ........................................................................................... 118
Scope .......................................................................................................................... 118 RADIATION MONITORING ...................................................................................................... 118 GROUNDWATER MONITORING............................................................................................. 118
Environmental Monitoring Report – 2018
iv
TABLE OF CONTENTS (continued)
Page CONTROL OF CHEMICALLY HAZARDOUS SUBSTANCES ................................................... 119
Sources ....................................................................................................................... 119 Chemical Control Program ........................................................................................... 119 Chemical Disposal ....................................................................................................... 119
CONTROL OF RADIOACTIVE MATERIALS AND RADIOACTIVE WASTE .............................. 120
Sources ....................................................................................................................... 120 Control Program .......................................................................................................... 120 Disposal/Recycling ...................................................................................................... 121
CONTROL OF MIXED WASTE ................................................................................................ 121
Sources ....................................................................................................................... 121 Control Program .......................................................................................................... 121 Storage and Disposal .................................................................................................. 121
RADIATION DOSE ASSESSMENT .......................................................................................... 121
RADIATION DOSE ASSESSMENT AND METHODOLOGY .............................................. 123
QUALITY ASSURANCE PROGRAM ........................................................................................ 129
SPRU QUALITY ASSURANCE PROGRAM ............................................................................. 131
RADIATION AND RADIOACTIVITY .......................................................................................... 133
RADIATION ............................................................................................................................. 133
Radiation Dose Assessment ........................................................................................ 134 RADIOACTIVITY ..................................................................................................................... 135
Measuring Radioactivity ............................................................................................... 135 Sources of Radioactivity .............................................................................................. 135
CONTROL OF RADIATION AND RADIOACTIVITY.................................................................. 136
GLOSSARY ..................................................................................................................................... 137
REFERENCES ................................................................................................................................ 145
EXTERNAL DISTRIBUTION ....................................................................................................... 149

Environmental Monitoring Report – 2018
v
LIST OF TABLES
Page TABLE 1 KNOLLS LABORATORY RADIOLOGICAL ENVIRONMENTAL MONITORING PROGRAM ............................................................... 3
TABLE 2 KNOLLS LABORATORY NONRADIOLOGICAL ENVIRONMENTAL MONITORING PROGRAM ............................................................... 5
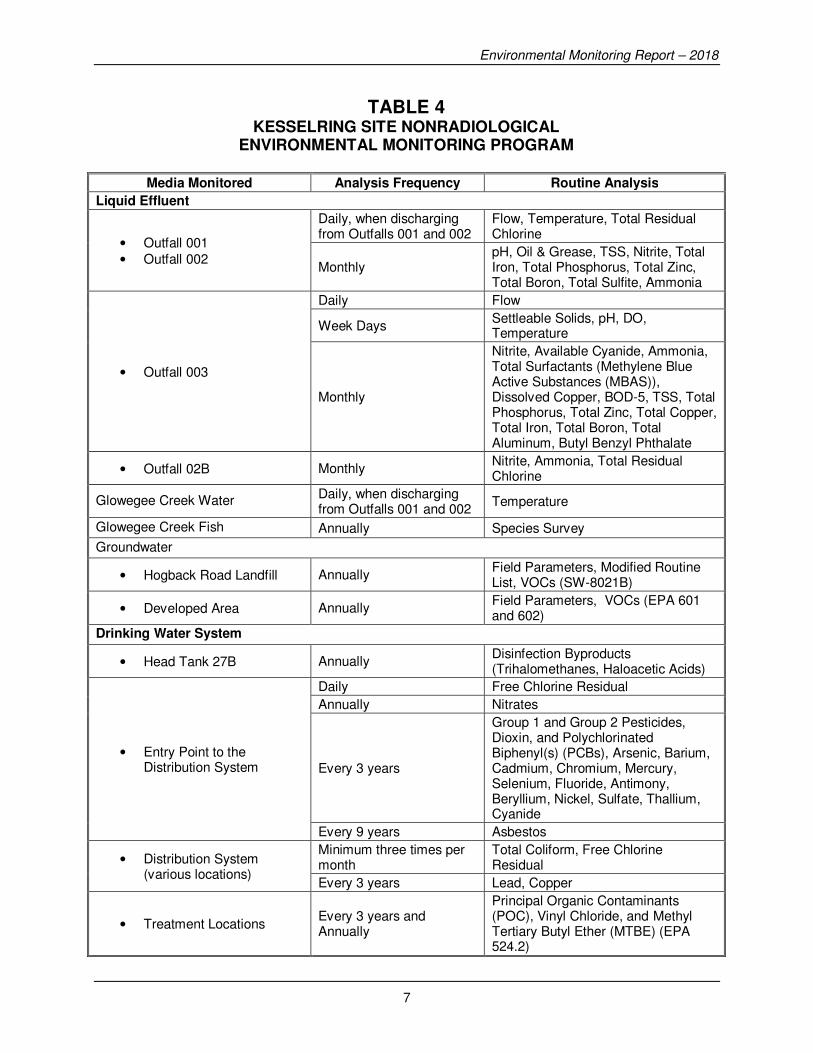
TABLE 3 KESSELRING SITE RADIOLOGICAL ENVIRONMENTAL MONITORING PROGRAM ............................................................... 6 TABLE 4 KESSELRING SITE NONRADIOLOGICAL ENVIRONMENTAL MONITORING PROGRAM ............................................................... 7
TABLE 5 SUMMARY OF VISITS & INSPECTIONS BY REGULATORY AGENCIES .................... 14
TABLE 6 KNOLLS LABORATORY, KESSELRING SITE, AND SPRU ENVIRONMENTAL PERMITS ....................................................................................... 15 TABLE 7 KNOLLS LABORATORY SPDES NONCOMPLIANCES ............................................... 18
TABLE 8 KESSELRING SITE SPDES NONCOMPLIANCES ....................................................... 18
TABLE 9 KNOLLS LABORATORY & KESSELRING SITE EPCRA REPORTING ......................... 25
TABLE 10 SPRU EPCRA REPORTING ......................................................................................... 25
TABLE 11 CHEMICAL CONSTITUENTS IN KNOLLS LABORATORY SANITARY SEWAGE EFFLUENT DISCHARGED TO THE TOWN OF NISKAYUNA PUBLICLY OWNED TREATMENT WORKS.................................................................................... 34 TABLE 12 CHEMICAL CONSTITUENTS AND TEMPERATURE IN KNOLLS LABORATORY LIQUID EFFLUENT ....................................................................................................... 35 TABLE 13 CHEMICAL CONSTITUENTS IN MOHAWK RIVER WATER ......................................... 37
TABLE 14 CHEMICAL CONSTITUENTS IN WEST BOUNDARY STREAM DITCH AND MIDLINE STREAM ............................................................................................... 38 TABLE 15 CHEMICAL CONSTITUENTS AND TEMPERATURE IN EAST BOUNDARY STREAM .................................................................................................. 39 TABLE 16 KNOLLS LABORATORY SANITARY SEWAGE EFFLUENT DISCHARGED TO THE TOWN OF NISKAYUNA PUBLICLY OWNED TREATMENT WORKS: QUARTERLY COMPOSITE SAMPLE RADIOACTIVITY RESULTS .............................. 40 TABLE 17 RADIOACTIVITY CONCENTRATIONS IN KNOLLS LABORATORY LIQUID EFFLUENT ................................................................................................................... 41 TABLE 18 KNOLLS LABORATORY RADIOACTIVITY RELEASED IN LIQUID EFFLUENT ............ 43
Environmental Monitoring Report – 2018
vi
LIST OF TABLES (continued)
Page TABLE 19 KNOLLS LABORATORY RADIOACTIVITY RELEASED IN AIRBORNE EFFLUENT ................................................................................................................... 46 TABLE 20 RESULTS OF MONITORING MOHAWK RIVER WATER AND MUNICIPAL WATER......................................................................................................................... 52 TABLE 21 RESULTS OF ANALYSES OF MOHAWK RIVER SEDIMENT FOR RADIOACTIVITY .......................................................................................................... 53 TABLE 22 GAMMA SPECTROMETRY RESULTS FOR MOHAWK RIVER FISH ........................... 54
TABLE 23 RADIOCHEMICAL ANALYSIS RESULTS FOR MOHAWK RIVER FISH........................ 54
TABLE 24 PERIMETER AND OFF-SITE RADIATION MONITORING RESULTS, KNOLLS LABORATORY (INCLUDING SPRU) .............................................................. 56 TABLE 25 GROUNDWATER MONITORING PARAMETERS ......................................................... 60
TABLE 26 RESULTS OF KNOLLS LABORATORY GROUNDWATER MONITORING OF LANDFILL WELLS .................................................................................................. 63
TABLE 27 RESULTS OF KNOLLS LABORATORY GROUNDWATER MONITORING OF LAND AREA WELLS ............................................................................................... 65
TABLE 28 RESULTS OF KNOLLS LABORATORY GROUNDWATER MONITORING OF HILLSIDE AREA AND LOWER LEVEL WELLS ....................................................... 68
TABLE 29 RESULTS OF KNOLLS LABORATORY GROUNDWATER MONITORING OF FORMER HIGH YEARD AREA, DETECTED VOLATILE ORGANIC COMPOUNDS..........................................................69
TABLE 30 RESULTS OF KNOLLS LABORATORY GROUNDWATER MONITORING FOR RADIOACTIVITY .................................................................................................. 70
TABLE 31 CHEMICAL CONSTITUENTS AND TEMPERATURE IN KESSELRING SITE LIQUID EFFLUENT, OUTFALL 001...................................................................... 81
TABLE 32 CHEMICAL CONSTITUENTS AND TEMPERATURE IN KESSELRING SITE LIQUID EFFLUENT, OUTFALL 002 AND 02B ...................................................... 82
TABLE 33 CHEMICAL CONSTITUENTS AND TEMPERATURE IN KESSELRING SITE SANITARY WASTEWATER TREATMENT FACILITY EFFLUENT, OUTFALL 003 ............................................................................................................... 84
TABLE 34 KESSELRING SITE RADIOACTIVITY RELEASE IN LIQUID EFFLUENT ................................................................................................................... 85
TABLE 35 KESSELRING SITE RADIOACTIVITY RELEASED IN AIRBORNE EFFLUENT ................................................................................................................... 87
TABLE 36 GLOWEGEE CREEK FISH SURVEY ............................................................................ 91
Environmental Monitoring Report – 2018
vii
LIST OF TABLES (continued)
Page TABLE 37 RESULTS OF ANALYSES OF GLOWEGEE CREEK FISH FOR RADIOACTIVITY .......................................................................................................... 93
TABLE 38 RESULTS OF ANALYSES OF GLOWEGEE CREEK SEDIMENT AND WATER FOR RADIOACTIVITY ............................................................................ 93
TABLE 39 PERIMETER AND OFF-SITE RADIATION MONITORING RESULTS, KESSELRING SITE ...................................................................................................... 95
TABLE 40 KESSELRING SITE GROUNDWATER MONITORING PROGRAM ............................... 97
TABLE 41 RESULTS OF KESSELRING SITE GROUNDWATER MONITORING, HOGBACK ROAD LANDFILL...................................................................................... 102
TABLE 42 RESULTS OF KESSELRING SITE GROUNDWATER MONITORING, DEVELOPED AREA WELLS ....................................................................................... 103
TABLE 43 CHEMICAL CONSTITUENTS IN KESSELRING SITE DRINKING WATER....................................................................................................................... 105
TABLE 44 RESULTS OF KESSELRING SITE GROUNDWATER MONITORING FOR RADIOACTIVITY ................................................................................................ 108
TABLE 45 SPRU RADIOACTIVITY RELEASED IN AIRBORNE EFFLUENT FROM PORTABLE VENTILATION UNITS .................................................................. 116
TABLE 46 SPRU RADIOACTIVITY RELEASED FROM DIFFUSE SOURCES ............................. 117 TABLE 47 SPRU AIRBORNE RADIOACTIVITY RELEASED ....................................................... 118 TABLE 48 ESTIMATED ANNUAL DOSE TO THE MAXIMALLY EXPOSED INDIVIDUAL AND ASSESSMENT AREA POPULATION FROM KNOLLS LABORATORY (INCLUDING SPRU) ............................................................ 125
TABLE 49 ESTIMATED ANNUAL DOSE TO THE MAXIMALLY EXPOSED INDIVIDUAL AND ASSESSMENT AREA POPULATION FROM KESSELRING SITE OPERATIONS ............................................................................ 125
TABLE 50 KNOLLS LABORATORY AND KESSELRING SITE PERFORMANCE IN THE ENVIRONMENTAL RESOURCE ASSOCIATES (ERA) QUALITY ASSURANCE PROGRAM ........................................................................... 130

Environmental Monitoring Report – 2018
viii
LIST OF FIGURES
Page FIGURE 1 KNOLLS LABORATORY (INCLUDING SPRU) AND KESSELRING SITE
LOCATIONS IN RELATION TO THE SURROUNDING COMMUNITIES ........................ 11 FIGURE 2 KNOLLS LABORATORY, NISKAYUNA, NEW YORK STREAM AND OUTFALL, GROUNDWATER, AND PERIMETER TLD MONITORING LOCATIONS ....................... 31 FIGURE 3 KNOLLS LABORATORY, NISKAYUNA, NEW YORK MOHAWK RIVER SAMPLING LOCATIONS .................................................................. 48 FIGURE 4 KNOLLS LABORATORY, NISKAYUNA, NEW YORK FORMER HIGH YARD AREA GROUNDWATER MONITORING LOCATIONS ..……….64 FIGURE 5 KESSELRING SITE, NEAR WEST MILTON, NEW YORK GLOWEGEE CREEK SAMPLING LOCATIONS AND OUTFALL LOCATIONS .............. 80 FIGURE 6 KESSELRING SITE, NEAR WEST MILTON, NEW YORK PERIMETER MONITORING LOCATIONS .................................................................... 94 FIGURE 7 KESSELRING SITE, NEAR WEST MILTON, NEW YORK LANDFILL GROUNDWATER MONITORING WELLS .................................................... 98 FIGURE 8 KESSELRING SITE, NEAR WEST MILTON, NEW YORK DEVELOPED AREA GROUNDWATER MONITORING WELLS ............... ……………...99 FIGURE 9 KESSELRING SITE, NEAR WEST MILTON, NEW YORK DISPOSAL AREAS - GROUNDWATER MONITORING WELLS .................................. 100 FIGURE 10 SPRU AREAS AT THE KNOLLS LABORATORY ........................................................ 114
FIGURE 11 EIGHTY KILOMETER (50 MILE) ASSESSMENT AREA MAP FOR KNOLLS LABORATORY (INCLUDING SPRU) AND KESSELRING SITE ........... 126 FIGURE 12 COMPARISON OF THE ESTIMATED RADIATION DOSE FROM KNOLLS LABORATORY (INCLUDING SPRU) AND KESSELRING SITE WITH DOSES FROM OTHER SOURCES.......................................................................................... 127

Environmental Monitoring Report – 2018
ix
LIST OF ACRONYMS
AE Air Emission
AEA Atomic Energy Act
AFR Air Facility Registration
ALARA As Low As Reasonably Achievable
ANSI American National Standards Institute
AOC Areas of Concern
ASFP Air State Facility Permit
ASGTF Advanced Steam Generator Test Facility
ASME American Society of Mechanical Engineers
ASTM American Society for Testing and Materials
BCSF Bulk Chemical Storage Facility
BOD-5 Biochemical Oxygen Demand, 5-day test
BTU(s) British Thermal Unit(s)
CAA Clean Air Act
CBS Chemical Bulk Storage
CEDR Consolidated Energy Data Report
CERCLA Comprehensive Environmental Response, Compensation, & Liability Act
CFR Code of Federal Regulations
COD Chemical Oxygen Demand
CWA Clean Water Act
CX(s) Categorical Exclusion(s)
D&D Decontamination and Decommissioning
DCG Derived Concentration Guide
DCS Derived Concentration Standard
DGS Distributed Generation Sources
DO Dissolved Oxygen
DOE U.S. Department of Energy
DOE-EM U.S. Department of Energy – Office of Environmental Management
DOT U.S. Department of Transportation
DOW Department of Water
ECL [New York State] Environmental Conservation Law
EHS Extremely Hazardous Substance
ELAP Environmental Laboratory Approval Program
EMS ESH Management System
EPA U.S. Environmental Protection Agency
EPCRA Emergency Planning and Community Right-to-Know Act
ERA Environmental Resource Associates
ESH Environment(al), Safety, and Health
Environmental Monitoring Report – 2018
x
LIST OF ACRONYMS (continued)
FFCA Federal Facility Compliance Act
FIFRA Federal Insecticide, Fungicide, and Rodenticide Act
FMP Fluor Marine Propulsion, LLC
HEPA High Efficiency Particulate Air [filters]
HSWA Hazardous and Solid Waste Amendments
KAPL Knolls Atomic Power Laboratory
LDR Land Disposal Restrictions
LEPC(s) Local Emergency Planning Committee(s)
MBAS Methylene Blue Active Substances
MCL Maximum Contaminant Level
MLLW Mixed Low Level Waste
MS4 Municipal Separate Storm Sewer System
MSDS(s) Material Safety Data Sheet(s)
MTBE Methyl Tertiary Butyl Ether
NA Not Applicable
NC No Criteria [Available]
NEPA National Environmental Policy Act
NESHAPs National Emission Standards for Hazardous Air Pollutants
NNL Naval Nuclear Laboratory
NNPP Naval Nuclear Propulsion Program
NOI(s) Notice(s) of Intent
NOx Nitrogen Oxides
NRC U.S. Nuclear Regulatory Commission
NRLFO Naval Reactors Laboratory Field Office
NSPS New Source Performance Standards
NYS New York State
NYSCC New York State Canal Corporation
NYSDEC New York State Department of Environmental Conservation
NYSDOH New York State Department of Health
PBS(F) Petroleum Bulk Storage (Facility)
PCB(s) Polychlorinated Biphenyl(s)
PCMMM Post-Closure Monitoring and Maintenance Manual
POC Principal Organic Contaminants
POTW Publicly Owned Treatment Works
PVU(s) Portable Ventilation Unit(s)
QAP Quality Assurance Program
RAE Radionuclide Air Emission
RCRA Resource Conservation and Recovery Act
Environmental Monitoring Report – 2018
xi
LIST OF ACRONYMS (continued)
RL Reporting Limit
RQ(s) Reportable Quantity(ies)
SBR Sequencing Batch Reactors
SCF Standard Cubic Feet
SDS(s) Safety Data Sheet(s)
SERC State Emergency Response Commission
SI (unit) Standard International (unit)
SOx Sulfur Oxides
SPDES State Pollutant Discharge Elimination System
SPRU Separations Process Research Unit
SPRU DP Separations Process Research Unit Disposition Project
SSW Site Service Water
STP Site Treatment Plan
SWDA Solid Waste Disposal Act
SWMP(s) Stormwater Management Program(s)
SWMU Solid Waste Management Unit
SWPPP Stormwater Pollution Prevention Plan
SWTF Sewage Waste Treatment Facility
TDS Total Dissolved Solids
TKN Total Kjeldahl Nitrogen
TLD(s) Thermoluminescent Dosimeter(s)
TOC Total Organic Carbon
TOGS Technical and Operational Guidance Series
TON Total Organic Nitrogen
TPQ Threshold Planning Quantity
TRI Toxic Release Inventory
TSCA Toxic Substances Control Act
TSDF(s) Treatment, Storage, and Disposal Facility(ies) TSS Total Suspended Solids
UIC Underground Injection Control
URS URS Corporation (formally United Research Service)
USACE U.S. Army Corps of Engineers
USGS U.S. Geological Survey
VOC(s) Volatile Organic Compound(s)
WBSD West Boundary Stream Ditch
WET Whole Effluent Toxicity
WIPP Waste Isolation Pilot Plant
WMP Waste Management Plan
Environmental Monitoring Report – 2018
xii
COMMON ABBREVIATIONS
Bq becquerel
C Celsius
CFU/100ml colony-forming units per 100 milliliters
cfs cubic feet per second
Ci curie
F Fahrenheit
hr(s) hour(s)
GPD gallons per day
μCi microcurie = 1 x 10⁻⁶ curie
μCi/ml microcuries per milliliter
μg microgram = 1 x 10⁻⁶ gram
μg/l micrograms per liter
μmho micromho = 1 x 10⁻⁶/ohm
μmho/cm micromho per centimeter
mg milligram = 1 x 10⁻³ gram
mg/l milligrams per liter
MGD million gallons per day
mrem millirem = 1 x 10⁻³ rem
ml milliliters = 1 x 10⁻³ liter
ml/l milliliters per liter
mSv millisieverts = 100 millirem
nCi nanocurie = 1 x 10⁻⁹ curie
ntu Nephelometric Turbidity Units
pCi picocurie = 1 x 10-12 curie
pCi/g picocuries per gram
pCi/l picocuries per liter
SU Standard [pH] Units
Environmental Monitoring Report – 2018
1
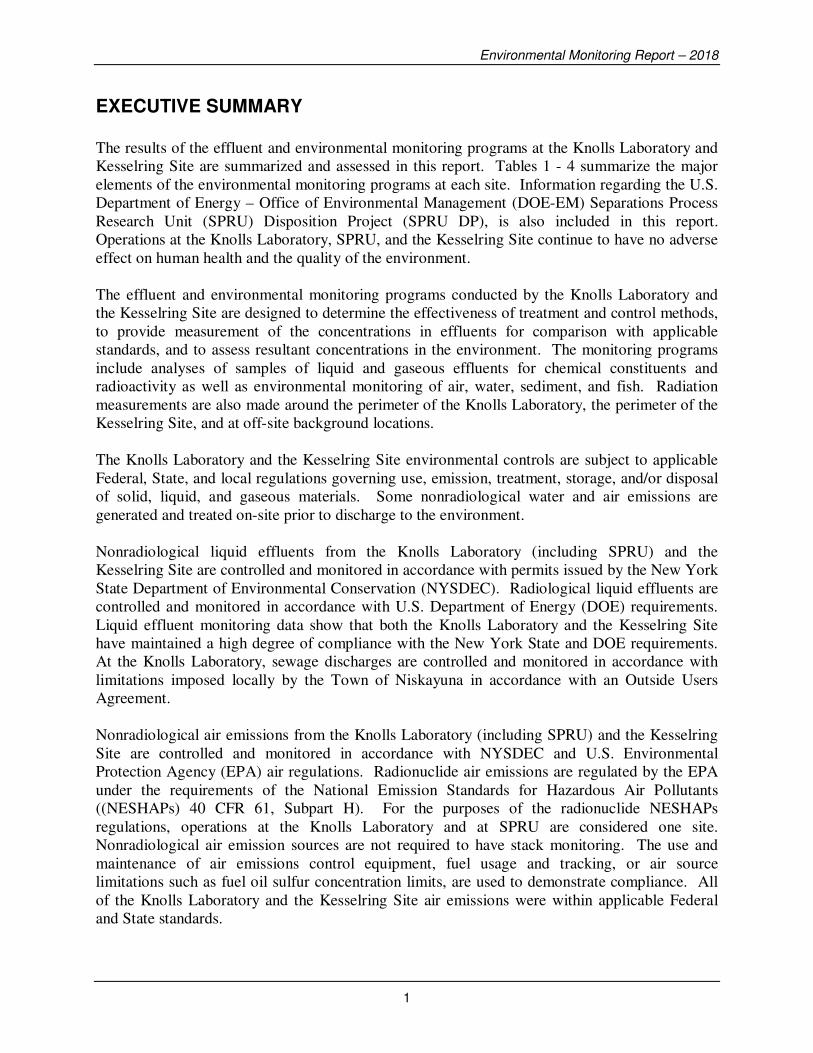
EXECUTIVE SUMMARY The results of the effluent and environmental monitoring programs at the Knolls Laboratory and
Kesselring Site are summarized and assessed in this report. Tables 1 - 4 summarize the major
elements of the environmental monitoring programs at each site. Information regarding the U.S.
Department of Energy – Office of Environmental Management (DOE-EM) Separations Process
Research Unit (SPRU) Disposition Project (SPRU DP), is also included in this report.
Operations at the Knolls Laboratory, SPRU, and the Kesselring Site continue to have no adverse
effect on human health and the quality of the environment.
The effluent and environmental monitoring programs conducted by the Knolls Laboratory and
the Kesselring Site are designed to determine the effectiveness of treatment and control methods,
to provide measurement of the concentrations in effluents for comparison with applicable
standards, and to assess resultant concentrations in the environment. The monitoring programs
include analyses of samples of liquid and gaseous effluents for chemical constituents and
radioactivity as well as environmental monitoring of air, water, sediment, and fish. Radiation
measurements are also made around the perimeter of the Knolls Laboratory, the perimeter of the
Kesselring Site, and at off-site background locations.
The Knolls Laboratory and the Kesselring Site environmental controls are subject to applicable
Federal, State, and local regulations governing use, emission, treatment, storage, and/or disposal
of solid, liquid, and gaseous materials. Some nonradiological water and air emissions are
generated and treated on-site prior to discharge to the environment.
Nonradiological liquid effluents from the Knolls Laboratory (including SPRU) and the
Kesselring Site are controlled and monitored in accordance with permits issued by the New York
State Department of Environmental Conservation (NYSDEC). Radiological liquid effluents are
controlled and monitored in accordance with U.S. Department of Energy (DOE) requirements.
Liquid effluent monitoring data show that both the Knolls Laboratory and the Kesselring Site
have maintained a high degree of compliance with the New York State and DOE requirements.
At the Knolls Laboratory, sewage discharges are controlled and monitored in accordance with
limitations imposed locally by the Town of Niskayuna in accordance with an Outside Users
Agreement.
Nonradiological air emissions from the Knolls Laboratory (including SPRU) and the Kesselring
Site are controlled and monitored in accordance with NYSDEC and U.S. Environmental
Protection Agency (EPA) air regulations. Radionuclide air emissions are regulated by the EPA
under the requirements of the National Emission Standards for Hazardous Air Pollutants
((NESHAPs) 40 CFR 61, Subpart H). For the purposes of the radionuclide NESHAPs
regulations, operations at the Knolls Laboratory and at SPRU are considered one site.
Nonradiological air emission sources are not required to have stack monitoring. The use and
maintenance of air emissions control equipment, fuel usage and tracking, or air source
limitations such as fuel oil sulfur concentration limits, are used to demonstrate compliance. All
of the Knolls Laboratory and the Kesselring Site air emissions were within applicable Federal
and State standards.

Environmental Monitoring Report – 2018
2
The Knolls Laboratory and the Kesselring Site operated their own landfills for facility-generated
nonradiological wastes during their early histories. The Knolls Laboratory and the Kesselring
Site landfill operations were terminated in 1993 and 1994, respectively. Nonhazardous solid
wastes are disposed of off-site through local permitted facilities.
Chemicals are not manufactured at either the Knolls Laboratory or Kesselring Site but are used
incidental to operations at both facilities. Those substances characterized as hazardous by
Federal and State regulations are controlled through administrative procedures and personnel
training. Small amounts of chemical wastes are generated and disposed of off-site by waste
vendors operating under permits issued by the cognizant Federal and State regulatory agencies.
Handling and storage incidental to shipment of wastes are controlled and monitored by trained
personnel in compliance with applicable permits and regulations. The Knolls Laboratory and
Kesselring Site strive to minimize the quantity of hazardous and solid waste that they produce.
Waste avoidance, beneficial reuse, and recycling are practiced whenever practicable.
Accountability and radiation survey procedures are used at the Knolls Laboratory (including
SPRU) and the Kesselring Site for the handling, packaging, and transportation of all radioactive
materials. Shipments of radioactive materials are performed in accordance with detailed written
procedures to ensure compliance with all applicable regulations of the U.S. Department of
Transportation (DOT), the DOE, and the U.S. Nuclear Regulatory Commission (NRC). All
Knolls Laboratory and Kesselring Site generated wastes that contain radioactive constituents are
regulated under the Atomic Energy Act of 1954 and applicable DOE requirements. The volume
of solid radioactive waste that requires disposal is minimized by using procedures that limit the
amount of materials that become contaminated and by recycling. Radioactive wastes are shipped
to government owned or licensed disposal sites. During 2018, approximately 24,408 cubic
meters (31,925 cubic yards) of low-level radioactive waste were shipped from the Knolls
Laboratory, SPRU, and the Kesselring Site for disposal. The majority of this volume was due to
SPRU demolition debris and water.
The Knolls Laboratory (including SPRU) and the Kesselring Site are within the DOE and EPA
standards governing the release of radioactivity to the environment. The annual average
concentration of Knolls Laboratory and Kesselring Site radioactivity in liquid and gaseous
effluents at the boundary of each Site corresponded to less than one percent of the permissible
DOE radioactivity concentration standards. Radionuclide air emissions were also less than one
percent of the EPA air emission standard. Radiation dose to the general public as a result of
Knolls Laboratory and Kesselring Site operations was too small to be measured and, therefore,
was estimated using conservative calculation techniques that provide an upper bound on the
potential dose. The maximum potential annual dose to an individual off-site was less than
0.1 mrem per year. This is less than one percent of the numerical guide established by the NRC
for commercial reactor sites to demonstrate that radioactive materials in effluents released to
unrestricted areas are as low as reasonably achievable. The maximum potential annual dose is
also less than ten percent of the total radiation a person aboard a commercial airplane would
receive from cosmic sources during one coast-to-coast flight. The estimated annual collective
dose to the entire population within 80 kilometers (50 miles) of either the Knolls Laboratory or
the Kesselring Site was less than 0.1 person-rem, which corresponds to less than one thousandth
of one percent of the dose received by that population from normal background radiation.
Environmental Monitoring Report – 2018
3
In summary, the operations and activities at the Knolls Laboratory (including SPRU) and the
Kesselring Site continue to have no adverse effect on human health or the quality of the
environment.
To improve clarity in this report, the following naming conventions are used:
• Knolls Laboratory refers to the Naval Nuclear Propulsion Program (NNPP) facility in
Niskayuna, New York only.
• Kesselring Site refers to the NNPP facility in West Milton, New York only.
• SPRU refers to the overall DOE-EM SPRU project in Niskayuna, New York.
• SPRU DP refers to the SPRU Disposition Project, which is the portion of the SPRU
project involved with the Buildings G2 and H2 Decontamination and Decommissioning
(D&D) in Niskayuna, New York.
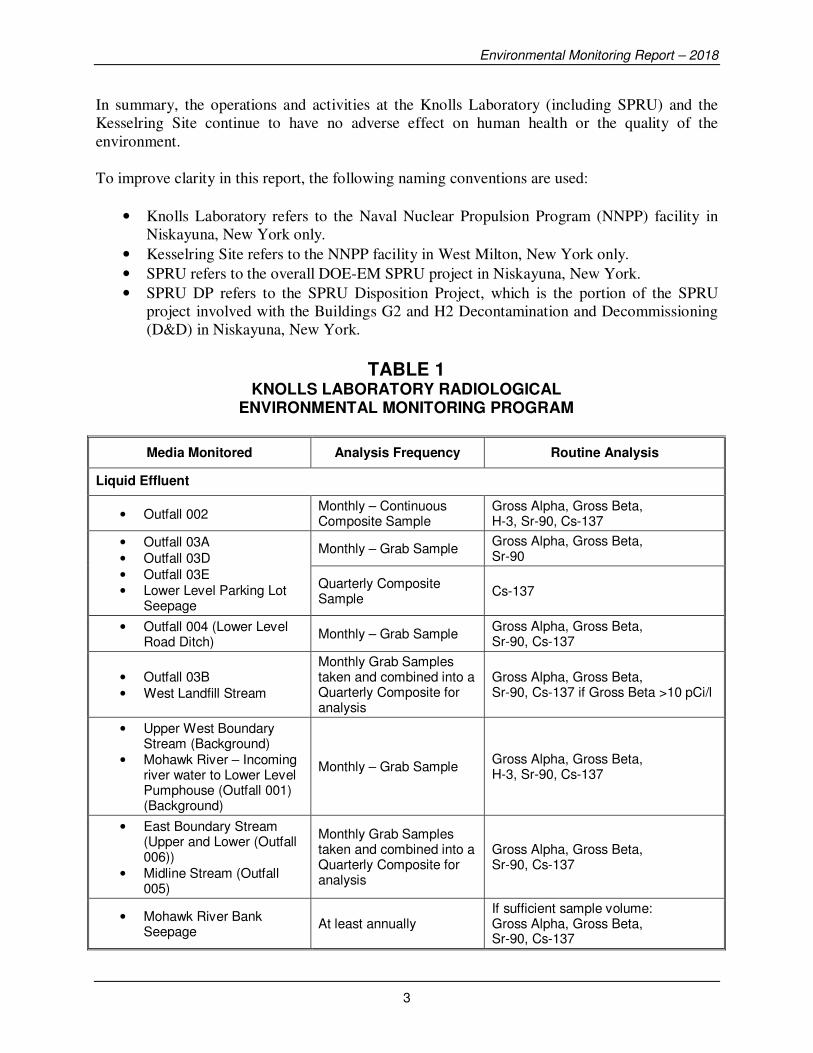
TABLE 1 KNOLLS LABORATORY RADIOLOGICAL
ENVIRONMENTAL MONITORING PROGRAM
Media Monitored Analysis Frequency Routine Analysis
Liquid Effluent
• Outfall 002 Monthly – Continuous Composite Sample
Gross Alpha, Gross Beta, H-3, Sr-90, Cs-137
• Outfall 03A
• Outfall 03D
• Outfall 03E • Lower Level Parking Lot
Seepage
Monthly – Grab Sample Gross Alpha, Gross Beta, Sr-90
Quarterly Composite Sample
Cs-137
• Outfall 004 (Lower Level Road Ditch)
Monthly – Grab Sample Gross Alpha, Gross Beta, Sr-90, Cs-137
• Outfall 03B
• West Landfill Stream
Monthly Grab Samples taken and combined into a Quarterly Composite for analysis
Gross Alpha, Gross Beta, Sr-90, Cs-137 if Gross Beta >10 pCi/l
• Upper West Boundary Stream (Background)
• Mohawk River – Incoming river water to Lower Level Pumphouse (Outfall 001) (Background)
Monthly – Grab Sample Gross Alpha, Gross Beta, H-3, Sr-90, Cs-137
• East Boundary Stream (Upper and Lower (Outfall 006))
• Midline Stream (Outfall 005)
Monthly Grab Samples taken and combined into a Quarterly Composite for analysis
Gross Alpha, Gross Beta, Sr-90, Cs-137
• Mohawk River Bank Seepage
At least annually If sufficient sample volume: Gross Alpha, Gross Beta, Sr-90, Cs-137

Environmental Monitoring Report – 2018
4
TABLE 1 (continued) KNOLLS LABORATORY RADIOLOGICAL
ENVIRONMENTAL MONITORING PROGRAM
Media Monitored Analysis Frequency Routine Analysis
Sanitary Effluent
Weekly – 24-hour composite sample
Gross Alpha, Gross Beta
Quarterly Composite of weekly samples
H-3, Co-60, Sr-90, Cs-137, Uranium
Municipal Drinking Water Systems
• Schenectady
• Niskayuna
• Latham/Colonie
Monthly Grab Samples taken and combined into a Quarterly Composite for analysis
Gross Alpha, Gross Beta; Sr-90, Cs-137 if Gross Beta >10 pCi/l
Knolls Laboratory Service Water Monthly Grab Sample Gross Alpha, Gross Beta, H-3, Sr-90, Cs-137
Mohawk River Water
• 1000 feet upriver • 3000 feet downriver
Second, Third, and Fourth Quarters
Gross Alpha, Gross Beta; Sr-90, Cs-137 if Gross Beta >10 pCi/l
• 2000 feet upriver
• 4500 feet downriver
Second, Third, and Fourth Quarters
Gross Alpha, Gross Beta, Sr-90, Cs-137
Mohawk River Sediment Second, Third, and Fourth Quarters
Gross Beta, Cs-137, Uranium, Plutonium; Sr-90 on seven sediment samples in second quarter sample set only
Mohawk River Fish
• Upriver above Lock 7 • Downriver below Outfall
002
Annually Sr-90, Cs-137, Plutonium
Groundwater Annually Gross Alpha, Gross Beta, H-3, Sr-90, Cs-137 (Well points – H-3 only)
Stack Air Effluents
• Particulate Radioactivity • Radioiodine
Weekly Gross Alpha, Gross Beta on Filter Papers; Gamma Spectrometry on Charcoal Cartridges
• Krypton-85 Continuous Noble Gas Monitor System
Environmental Air
• Particulate Radioactivity Weekly Gross Alpha, Gross Beta on Filter Papers
• Radioiodine Bi-monthly Gamma Spectrometry on Charcoal Cartridges
Environmental Radiation Quarterly Gamma Radiation
Environmental Monitoring Report – 2018
5
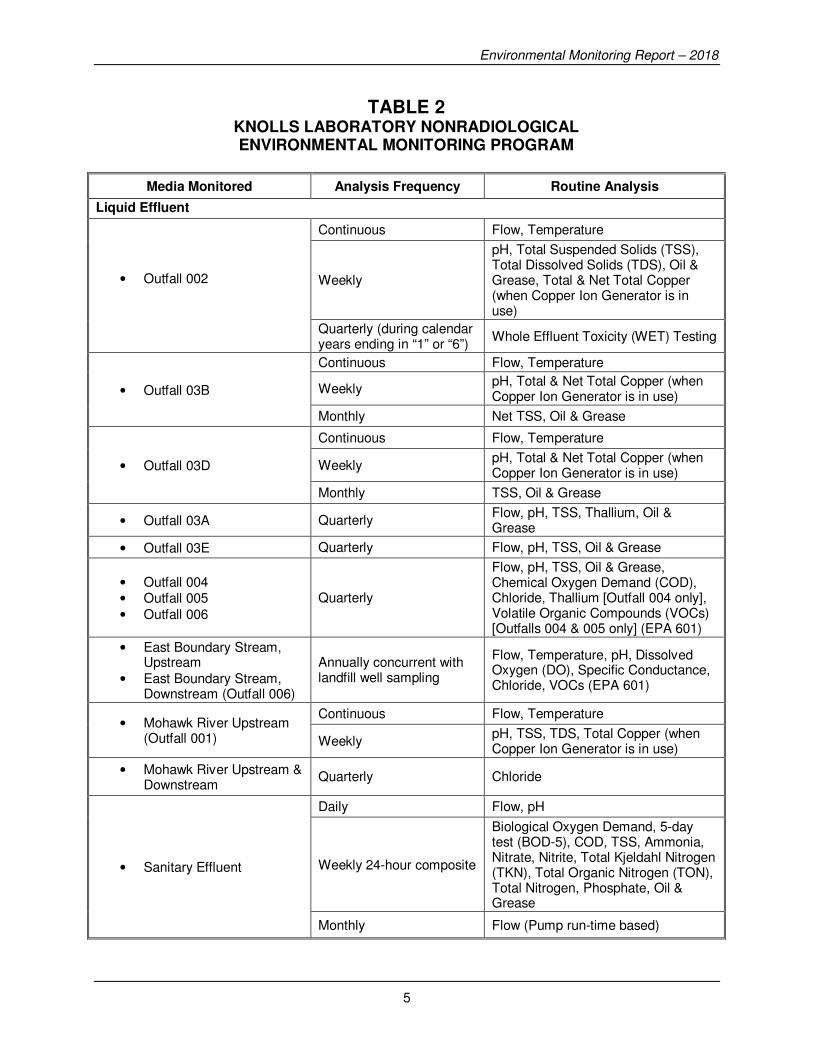
TABLE 2 KNOLLS LABORATORY NONRADIOLOGICAL ENVIRONMENTAL MONITORING PROGRAM
Media Monitored Analysis Frequency Routine Analysis
Liquid Effluent
• Outfall 002
Continuous Flow, Temperature
Weekly
pH, Total Suspended Solids (TSS), Total Dissolved Solids (TDS), Oil & Grease, Total & Net Total Copper (when Copper Ion Generator is in use)
Quarterly (during calendar years ending in “1” or “6”)
Whole Effluent Toxicity (WET) Testing
• Outfall 03B
Continuous Flow, Temperature
Weekly pH, Total & Net Total Copper (when Copper Ion Generator is in use)
Monthly Net TSS, Oil & Grease
• Outfall 03D
Continuous Flow, Temperature
Weekly pH, Total & Net Total Copper (when Copper Ion Generator is in use)
Monthly TSS, Oil & Grease
• Outfall 03A Quarterly Flow, pH, TSS, Thallium, Oil & Grease
• Outfall 03E Quarterly Flow, pH, TSS, Oil & Grease
• Outfall 004 • Outfall 005
• Outfall 006
Quarterly
Flow, pH, TSS, Oil & Grease, Chemical Oxygen Demand (COD), Chloride, Thallium [Outfall 004 only], Volatile Organic Compounds (VOCs) [Outfalls 004 & 005 only] (EPA 601)
• East Boundary Stream, Upstream
• East Boundary Stream, Downstream (Outfall 006)
Annually concurrent with landfill well sampling
Flow, Temperature, pH, Dissolved Oxygen (DO), Specific Conductance, Chloride, VOCs (EPA 601)
• Mohawk River Upstream (Outfall 001)
Continuous Flow, Temperature
Weekly pH, TSS, TDS, Total Copper (when Copper Ion Generator is in use)
• Mohawk River Upstream & Downstream
Quarterly Chloride
• Sanitary Effluent
Daily Flow, pH
Weekly 24-hour composite
Biological Oxygen Demand, 5-day test (BOD-5), COD, TSS, Ammonia, Nitrate, Nitrite, Total Kjeldahl Nitrogen (TKN), Total Organic Nitrogen (TON), Total Nitrogen, Phosphate, Oil & Grease
Monthly Flow (Pump run-time based)

Environmental Monitoring Report – 2018
6
TABLE 2 (continued) KNOLLS LABORATORY NONRADIOLOGICAL ENVIRONMENTAL MONITORING PROGRAM
Media Monitored Analysis Frequency Routine Analysis
Groundwater
• Landfill Wells Annually Field Parameters, VOCs (EPA 601)
• Land Area Wells Annually Field Parameters, Filtered & Unfiltered Metals, Turbidity, VOCs (EPA 601 and 602)
• Hillside and Lower Level Wells
Annually Field Parameters, VOCs (EPA 601 and 602)
• Hillside Remediation Wells Annually Acetone, Hexane (EPA 624), Field Parameters, VOCs (EPA 601 and 602)
• Former High Yard Area Wells
Quarterly VOCs (EPA 8260), PCBs (EPA 8082)
TABLE 3 KESSELRING SITE RADIOLOGICAL
ENVIRONMENTAL MONITORING PROGRAM
Media Monitored Analysis Frequency Routine Analysis
Liquid Effluent
• Retention Basins • Outfalls 001, 002
Monthly Composite Monthly Grab Sample
H-3, Co-60
• Glowegee Creek Water Quarterly Co-60
• Glowegee Creek Sediment Quarterly Co-60
• Glowegee Creek Fish Annually Co-60
• Groundwater (Hogback Road Landfill, Developed Area, and Perimeter Area Wells)
Annually H-3, Co-60, Cs-137
Stack Air Effluents
• Particulate Radioactivity Bi-monthly Co-60
• Radioiodine Bi-weekly I-131
• H-3/C-14 Weekly H-3, C-14
Environmental Air
• Particulate Radioactivity Bi-monthly Co-60
• Radioiodine Bi-weekly I-131
Environmental Radiation Quarterly Gamma Radiation
Environmental Monitoring Report – 2018
7
TABLE 4 KESSELRING SITE NONRADIOLOGICAL
ENVIRONMENTAL MONITORING PROGRAM
Media Monitored Analysis Frequency Routine Analysis
Liquid Effluent
• Outfall 001
• Outfall 002
Daily, when discharging from Outfalls 001 and 002
Flow, Temperature, Total Residual Chlorine
Monthly pH, Oil & Grease, TSS, Nitrite, Total Iron, Total Phosphorus, Total Zinc, Total Boron, Total Sulfite, Ammonia
• Outfall 003
Daily Flow
Week Days Settleable Solids, pH, DO, Temperature
Monthly
Nitrite, Available Cyanide, Ammonia, Total Surfactants (Methylene Blue Active Substances (MBAS)), Dissolved Copper, BOD-5, TSS, Total Phosphorus, Total Zinc, Total Copper, Total Iron, Total Boron, Total Aluminum, Butyl Benzyl Phthalate
• Outfall 02B Monthly Nitrite, Ammonia, Total Residual Chlorine
Glowegee Creek Water Daily, when discharging from Outfalls 001 and 002
Temperature
Glowegee Creek Fish Annually Species Survey
Groundwater
• Hogback Road Landfill Annually Field Parameters, Modified Routine List, VOCs (SW-8021B)
• Developed Area Annually Field Parameters, VOCs (EPA 601 and 602)
Drinking Water System
• Head Tank 27B Annually Disinfection Byproducts (Trihalomethanes, Haloacetic Acids)
• Entry Point to the Distribution System
Daily Free Chlorine Residual
Annually Nitrates
Every 3 years
Group 1 and Group 2 Pesticides, Dioxin, and Polychlorinated Biphenyl(s) (PCBs), Arsenic, Barium, Cadmium, Chromium, Mercury, Selenium, Fluoride, Antimony, Beryllium, Nickel, Sulfate, Thallium, Cyanide
Every 9 years Asbestos
• Distribution System (various locations)
Minimum three times per month
Total Coliform, Free Chlorine Residual
Every 3 years Lead, Copper
• Treatment Locations Every 3 years and Annually
Principal Organic Contaminants (POC), Vinyl Chloride, and Methyl Tertiary Butyl Ether (MTBE) (EPA 524.2)
Environmental Monitoring Report – 2018
8
Intentionally Blank

Environmental Monitoring Report – 2018
9
INTRODUCTION The Knolls Laboratory and the Kesselring Site are operated by Fluor Marine Propulsion, LLC
(FMP), under contract with the DOE and are both United States Government owned facilities.
The principal function at the Knolls Laboratory is research and development in the design and
operation of naval nuclear propulsion plants. The Kesselring Site is dedicated primarily to the
training of personnel in the operation of these plants. Knolls Laboratory and Kesselring Site are
two of four DOE sites that make up the Naval Nuclear Laboratory (NNL), which refers to the
collective operations of these sites performing NNPP work and the personnel operating at these
associated locations.
The Knolls Laboratory is located in the Town of Niskayuna, New York, approximately two
miles (3.2 kilometers) east of the City of Schenectady (Figure 1). The Knolls Laboratory is
situated on 170 acres of land on the south bank of the Mohawk River. Facilities at the Knolls
Laboratory include administrative offices; machine shops; a sewage pumping station; a boiler
house; oil storage facilities; cooling towers; waste storage facilities; and chemistry, physics, and
metallurgical laboratories. The surrounding area is a mixture of open land, other light industry,
small farms, a closed municipal landfill, a small municipal park, and suburban residential areas.
The Separations Process Research Unit (SPRU) was operated at the Knolls Laboratory from
1950 to 1953 as a pilot plant to research chemical processes to extract uranium and plutonium
from irradiated uranium. The historical SPRU operations resulted in contamination of the
facilities (Buildings G2 and H2, also known as the SPRU Disposition Project or SPRU DP) and
land areas where waste handling operations occurred. The SPRU work is being performed by a
separate contract under DOE-EM. URS Corporation (URS) is under contract for the Buildings
G2 and H2 areas. Information on the SPRU project is provided in a later section of this report.
Separate information can also be found at the DOE-EM website http://www.spru.energy.gov.
The Kesselring Site is located near West Milton, New York, approximately 17 miles
(27.4 kilometers) north of the City of Schenectady, nine miles (14.5 kilometers) southwest of
Saratoga Springs and 13 miles (21 kilometers) northeast of Amsterdam (Figure 1). The
Kesselring Site consists of 3900 acres on which are presently located two operating
pressurized-water naval nuclear propulsion plants and support facilities, including administrative
offices, machine shops, training facilities, equipment service buildings, chemistry laboratories, a
boiler house, oil storage facilities, cooling towers, waste storage facilities, and wastewater treat-
ment facilities. Additionally, there have been two other nuclear propulsion plants operated at the
Kesselring Site, the S3G plant (shut down in 1991) and the D1G plant (shut down in 1996). The
dismantlement process began in 1998 after completion of the National Environmental Policy Act
(NEPA) process. The dismantlement of the S3G plant was completed in 2006 and the
dismantlement of the D1G plant is still in process. The surrounding area is a rural, sparsely
populated region of wooded lands through which flow the Glowegee Creek and several small
streams that empty into the Kayaderosseras Creek.
Liquid effluents are monitored at the Knolls Laboratory and the Kesselring Site for the chemical
parameters listed in the applicable State Pollutant Discharge Elimination System (SPDES) per-
mits and for radioactivity. At the Knolls Laboratory, the Outside Users Agreement with the
Environmental Monitoring Report – 2018
10
Town of Niskayuna specifies the chemical parameters and radioactivity required to be monitored
in the sanitary sewage effluent. Analyses are also performed on effluent and receiving stream
water samples for select chemical parameters, some of which have State water quality standards.
Additionally, fish, water, and bottom sediment samples from the receiving streams are collected
periodically and analyzed for radioactivity. Nonradiological industrial air emission sources do
not require continuous monitoring under the terms of current New York State air regulations due
to the combustion fuels used and the very low levels of emissions from overall operations at the
Knolls Laboratory and the Kesselring Site. Airborne effluents from the main radiological
emission points are continuously sampled for radioactivity. Other minor radiological emission
points are evaluated for their potential for release, and a periodic measurement protocol is used
to confirm the low radionuclide emissions. In addition, radiation levels around the perimeter of
the Knolls Laboratory, the Kesselring Site, and at several off-site background locations are moni-
tored with sensitive thermoluminescent dosimeters.
The quantities of radioactivity contained in liquid and gaseous effluents during operations in
2018 at the Knolls Laboratory and the Kesselring Site were too small to have a measurable effect
on normal background radioactivity. Solid radioactive wastes are packaged and shipped from
the sites in accordance with all applicable DOT, DOE, and NRC regulations.
The use of chemically hazardous substances at the Knolls Laboratory and the Kesselring Site is
strictly limited to the types and quantities essential for operations. On-site handling of hazardous
waste is performed by trained personnel in accordance with applicable regulations and permits.
The transportation and disposal of hazardous waste is limited to vendors operating under permits
issued by the cognizant Federal and State regulatory agencies. Additionally, all Knolls
Laboratory and Kesselring Site personnel receive training on the hazards of chemical substances.
Other types of solid waste produced on-site, such as cafeteria waste, are disposed of at off-site
permitted facilities. Paper, cardboard, glass, wood, and plastic are also segregated for recycling
whenever possible. Scrap metals are recycled through local vendors.
Effluent and environmental surveillance programs are conducted at both the Knolls Laboratory
and the Kesselring Site in accordance with applicable DOE Orders to monitor conformance with
applicable Federal and State standards and to confirm that operations have had no adverse impact
on the environment or the public. Knolls Laboratory and Kesselring Site policy is to minimize
releases to levels that are as low as reasonably achievable. A summary of the year’s routine
monitoring data for each site is presented and assessed in this report.
Demonstration of compliance with environmental regulations is an integral part of the mission at
both the Knolls Laboratory and the Kesselring Site and is necessary for each site’s operations.
Federal, State, and local regulatory personnel periodically perform site visits and inspections of
the Knolls Laboratory, SPRU, and the Kesselring Site. During 2018 a total of eleven of these
visits and/or inspections were performed. Any questions or deficiencies identified during these
visits and/or inspections were immediately addressed or promptly corrected.
Areas where historical petroleum or chemical spills have been identified were reported to
appropriate regulatory authorities. These areas have been remediated or will be in the future to
meet State requirements.

Environmental Monitoring Report – 2018
11
FIGURE 1 KNOLLS LABORATORY (INCLUDING SPRU) AND KESSELRING SITE LOCATIONS IN RELATION TO THE SURROUNDING COMMUNITIES

Environmental Monitoring Report – 2018
12
Numerous programs to reduce the potential for environmental effects from operations at the
Knolls Laboratory and the Kesselring Site have been implemented over the years. Additionally,
both sites work to minimize the amount of hazardous waste generated annually.
A later section of this report provides information on radiation and radioactivity for those who
may not be familiar with radiological terms and concepts.

Environmental Monitoring Report – 2018
13
ENVIRONMENTAL PROGRAM & COMPLIANCE
ENVIRONMENTAL PROGRAM
Policy
The Knolls Laboratory and the Kesselring Site are committed to conducting operations and
activities in a manner that provides and maintains safe and healthful working conditions, protects
the environment and surrounding communities, and conserves natural resources. The Knolls
Laboratory and the Kesselring Site are committed to environmental excellence through compliance
with applicable Federal, State, and local regulations; proactive planning to integrate sound
environmental, safety, and health (ESH) principles into every aspect of the work, including hazard
identification and risk assessment; and a commitment to waste minimization and pollution
prevention.
Objectives
The objectives of the environmental monitoring programs are to:
• Demonstrate compliance with regulatory requirements,
• Demonstrate that operations do not significantly impact the environment,
• Confirm the effectiveness of control methods in preventing increases in environmental
radioactivity levels,
• Confirm that the potential radiation exposure received by a member of the public is
insignificant compared to the dose received from natural background radioactivity,
• Provide accurate monitoring results to applicable Federal, State, and local officials and to
the general public, and
• Maintain an accurate record of effluent releases to the environment from the Knolls
Laboratory and the Kesselring Site.
Organization
The Knolls Laboratory and the Kesselring Site employ environmental staff professionals to ensure
environmental responsibilities are met while also fulfilling the mission of each site. Although the
Knolls Laboratory and Kesselring Site each have distinct ESH organizations, there is significant
collaboration between the two sites’ ESH organizations to optimize personnel expertise, establish
uniform practices, and promote the sharing of best practices. These organizations are responsible
to identify, interpret, and communicate ESH requirements to facility personnel for implementation,
assist other Knolls Laboratory and Kesselring Site organizations in meeting their ESH
responsibilities, monitor ESH activities for compliance, interface with regulatory agencies, and
complete required regulatory reports.
ENVIRONMENTAL, SAFETY, AND HEALTH MANAGEMENT SYSTEM
The NNL Environmental, Safety, and Health Management System (EMS) documents the
management processes and systems to perform work in a manner protective of employees, the
Environmental Monitoring Report – 2018
14
public, and the environment, while ensuring regulatory compliance. Environmental performance
objectives, performance targets, and deliverables are prepared and reviewed annually. The
management processes and systems are used to identify, communicate, implement, assess, and
update environmental programs.
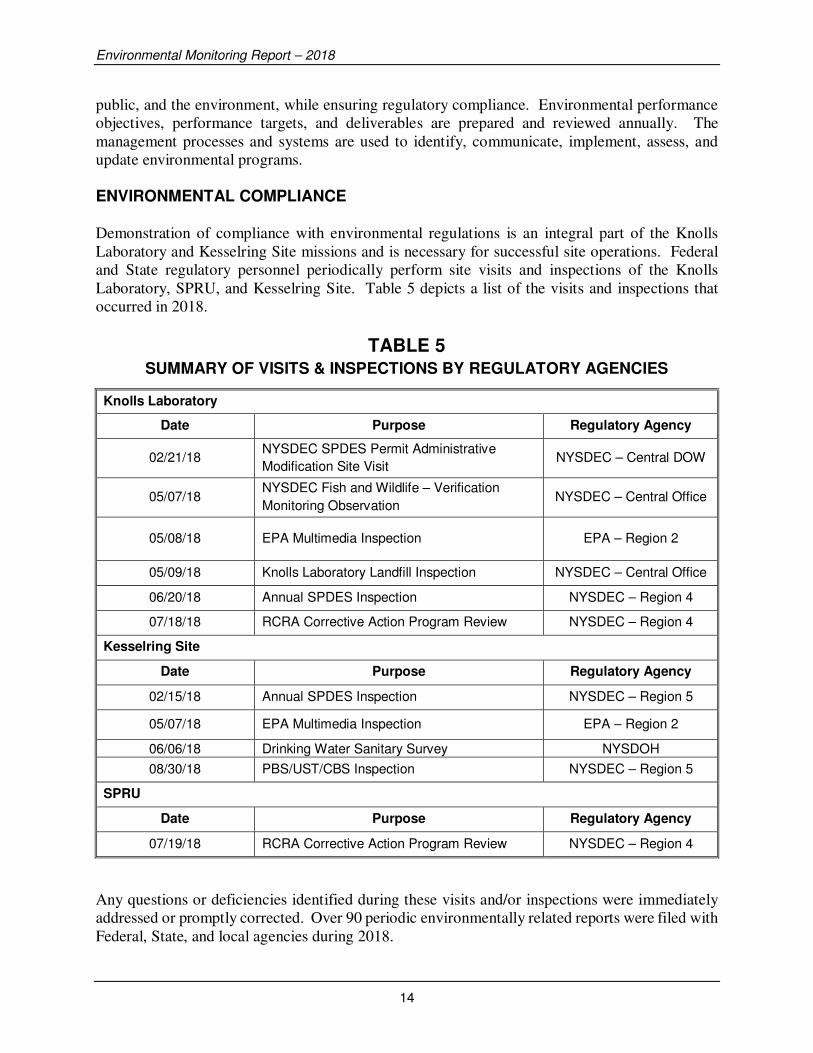
ENVIRONMENTAL COMPLIANCE Demonstration of compliance with environmental regulations is an integral part of the Knolls
Laboratory and Kesselring Site missions and is necessary for successful site operations. Federal
and State regulatory personnel periodically perform site visits and inspections of the Knolls
Laboratory, SPRU, and Kesselring Site. Table 5 depicts a list of the visits and inspections that
occurred in 2018.
TABLE 5 SUMMARY OF VISITS & INSPECTIONS BY REGULATORY AGENCIES
Knolls Laboratory
Date Purpose Regulatory Agency
02/21/18 NYSDEC SPDES Permit Administrative
Modification Site Visit NYSDEC – Central DOW
05/07/18 NYSDEC Fish and Wildlife – Verification
Monitoring Observation NYSDEC – Central Office
05/08/18 EPA Multimedia Inspection EPA – Region 2
05/09/18 Knolls Laboratory Landfill Inspection NYSDEC – Central Office
06/20/18 Annual SPDES Inspection NYSDEC – Region 4
07/18/18 RCRA Corrective Action Program Review NYSDEC – Region 4
Kesselring Site
Date Purpose Regulatory Agency
02/15/18 Annual SPDES Inspection NYSDEC – Region 5
05/07/18 EPA Multimedia Inspection EPA – Region 2
06/06/18 Drinking Water Sanitary Survey NYSDOH
08/30/18 PBS/UST/CBS Inspection NYSDEC – Region 5
SPRU
Date Purpose Regulatory Agency
07/19/18 RCRA Corrective Action Program Review NYSDEC – Region 4
Any questions or deficiencies identified during these visits and/or inspections were immediately
addressed or promptly corrected. Over 90 periodic environmentally related reports were filed with
Federal, State, and local agencies during 2018.
Environmental Monitoring Report – 2018
15
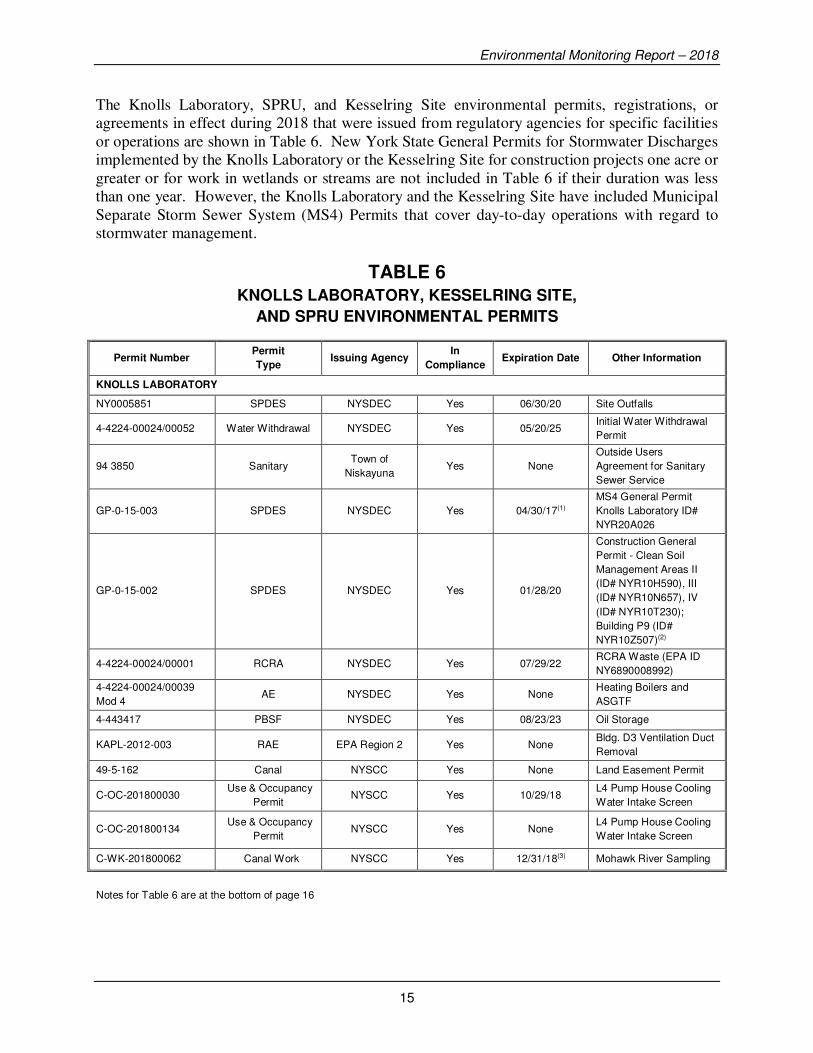
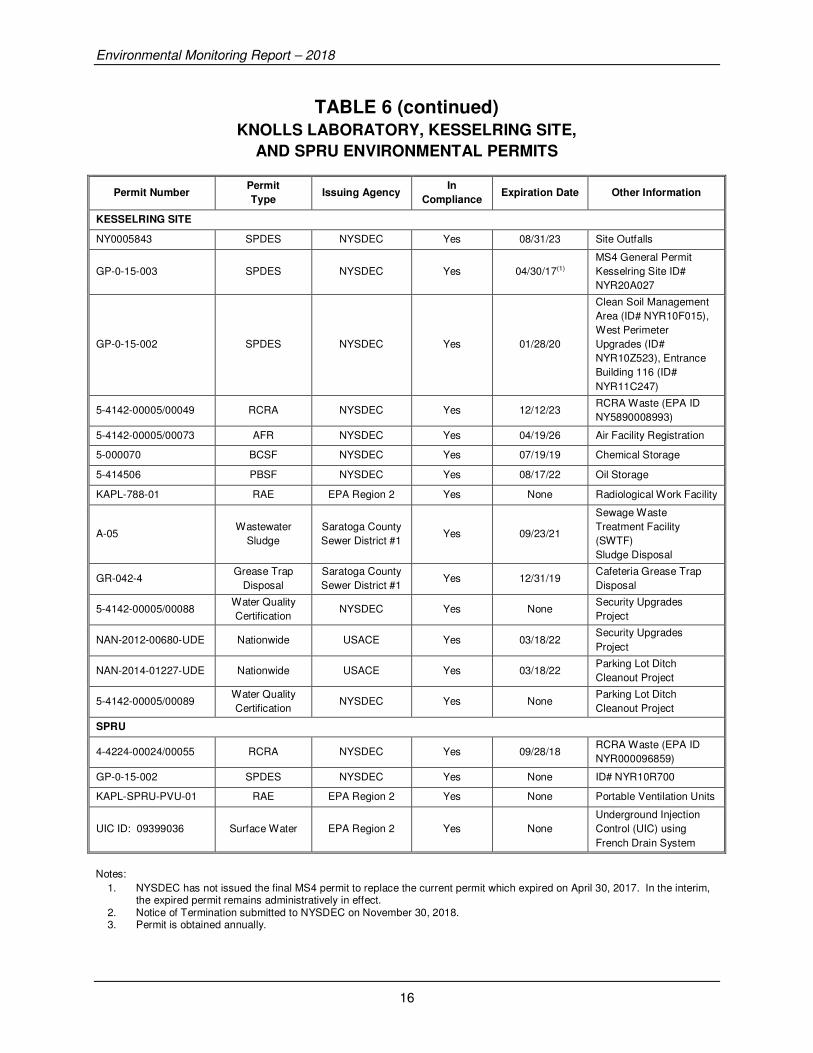
The Knolls Laboratory, SPRU, and Kesselring Site environmental permits, registrations, or
agreements in effect during 2018 that were issued from regulatory agencies for specific facilities
or operations are shown in Table 6. New York State General Permits for Stormwater Discharges
implemented by the Knolls Laboratory or the Kesselring Site for construction projects one acre or
greater or for work in wetlands or streams are not included in Table 6 if their duration was less
than one year. However, the Knolls Laboratory and the Kesselring Site have included Municipal
Separate Storm Sewer System (MS4) Permits that cover day-to-day operations with regard to
stormwater management.
TABLE 6
KNOLLS LABORATORY, KESSELRING SITE,
AND SPRU ENVIRONMENTAL PERMITS
Permit Number Permit
Type Issuing Agency
In
Compliance Expiration Date Other Information
KNOLLS LABORATORY
NY0005851 SPDES NYSDEC Yes 06/30/20 Site Outfalls
4-4224-00024/00052 Water Withdrawal NYSDEC Yes 05/20/25 Initial Water Withdrawal
Permit
94 3850 Sanitary Town of
Niskayuna Yes None
Outside Users
Agreement for Sanitary
Sewer Service
GP-0-15-003 SPDES NYSDEC Yes 04/30/17(1)
MS4 General Permit
Knolls Laboratory ID#
NYR20A026
GP-0-15-002 SPDES NYSDEC Yes 01/28/20
Construction General
Permit - Clean Soil
Management Areas II
(ID# NYR10H590), III
(ID# NYR10N657), IV
(ID# NYR10T230);
Building P9 (ID#
NYR10Z507)(2)
4-4224-00024/00001 RCRA NYSDEC Yes 07/29/22 RCRA Waste (EPA ID
NY6890008992)
4-4224-00024/00039
Mod 4 AE NYSDEC Yes None Heating Boilers and
ASGTF
4-443417 PBSF NYSDEC Yes 08/23/23 Oil Storage
KAPL-2012-003 RAE EPA Region 2 Yes None Bldg. D3 Ventilation Duct
Removal
49-5-162 Canal NYSCC Yes None Land Easement Permit
C-OC-201800030 Use & Occupancy
Permit NYSCC Yes 10/29/18
L4 Pump House Cooling
Water Intake Screen
C-OC-201800134 Use & Occupancy
Permit NYSCC Yes None
L4 Pump House Cooling
Water Intake Screen
C-WK-201800062 Canal Work NYSCC Yes 12/31/18(3) Mohawk River Sampling
Notes for Table 6 are at the bottom of page 16
Environmental Monitoring Report – 2018
16
TABLE 6 (continued) KNOLLS LABORATORY, KESSELRING SITE,
AND SPRU ENVIRONMENTAL PERMITS
Permit Number Permit
Type Issuing Agency
In
Compliance Expiration Date Other Information
KESSELRING SITE
NY0005843 SPDES NYSDEC Yes 08/31/23 Site Outfalls
GP-0-15-003 SPDES NYSDEC Yes 04/30/17(1)
MS4 General Permit
Kesselring Site ID#
NYR20A027
GP-0-15-002 SPDES NYSDEC Yes 01/28/20
Clean Soil Management
Area (ID# NYR10F015),
West Perimeter
Upgrades (ID#
NYR10Z523), Entrance
Building 116 (ID#
NYR11C247)
5-4142-00005/00049 RCRA NYSDEC Yes 12/12/23 RCRA Waste (EPA ID
NY5890008993)
5-4142-00005/00073 AFR NYSDEC Yes 04/19/26 Air Facility Registration
5-000070 BCSF NYSDEC Yes 07/19/19 Chemical Storage
5-414506 PBSF NYSDEC Yes 08/17/22 Oil Storage
KAPL-788-01 RAE EPA Region 2 Yes None Radiological Work Facility
A-05 Wastewater
Sludge
Saratoga County
Sewer District #1 Yes 09/23/21
Sewage Waste
Treatment Facility
(SWTF)
Sludge Disposal
GR-042-4 Grease Trap
Disposal
Saratoga County
Sewer District #1 Yes 12/31/19
Cafeteria Grease Trap
Disposal
5-4142-00005/00088 Water Quality
Certification NYSDEC Yes None
Security Upgrades
Project
NAN-2012-00680-UDE Nationwide USACE Yes 03/18/22 Security Upgrades
Project
NAN-2014-01227-UDE Nationwide USACE Yes 03/18/22 Parking Lot Ditch
Cleanout Project
5-4142-00005/00089 Water Quality
Certification NYSDEC Yes None
Parking Lot Ditch
Cleanout Project
SPRU
4-4224-00024/00055 RCRA NYSDEC Yes 09/28/18 RCRA Waste (EPA ID
NYR000096859)
GP-0-15-002 SPDES NYSDEC Yes None ID# NYR10R700
KAPL-SPRU-PVU-01 RAE EPA Region 2 Yes None Portable Ventilation Units
UIC ID: 09399036 Surface Water EPA Region 2 Yes None
Underground Injection
Control (UIC) using
French Drain System
Notes:
1. NYSDEC has not issued the final MS4 permit to replace the current permit which expired on April 30, 2017. In the interim, the expired permit remains administratively in effect.
2. Notice of Termination submitted to NYSDEC on November 30, 2018. 3. Permit is obtained annually.
Environmental Monitoring Report – 2018
17
A description of the Knolls Laboratory and the Kesselring Site’s compliance with key
environmental regulations is provided in the proceeding pages. Information on SPRU compliance
is also provided, where applicable.
Clean Water Act (CWA) The Federal CWA and the New York State Environmental Conservation Law (ECL) regulate the
chemical components and physical attributes of liquids discharged to the surface waters of the
State of New York. Specifically, the Knolls Laboratory and the Kesselring Site effluent and
environmental standards are established in site-specific SPDES Permits issued by NYSDEC. New
York State water quality standards applicable to the Mohawk River and Glowegee Creek are given
in Reference (1). NYSDEC renewed the Knolls Laboratory SPDES permit in 2015, which became
effective on July 1, 2015. Subsequently, NYSDEC issued an administrative SPDES permit
modification, dated March 30, 2018. NYSDEC renewed the Kesselring Site SPDES permit in
2018, which became effective on September 1, 2018. Renewed permits are generally in effect for
five years.
The constituents of the Knolls Laboratory sewage are regulated by an Outside Users Agreement
with the Town of Niskayuna as defined in Reference (2).
During 2018, the Knolls Laboratory experienced one SPDES noncompliance event as summarized
in Table 7. The Kesselring Site experienced two SPDES noncompliance events as summarized in
Table 8.
New York State implements the EPA Phase II Stormwater regulations under the SPDES program
through two stormwater general permits applicable to the Knolls Laboratory and the Kesselring
Site. The versions in effect during this reporting period were GP-0-15-002 (General Permit for
Stormwater Discharges from Construction Activities) and GP-0-15-003 (Municipal Separate
Storm Sewer System, or MS4). The Construction Stormwater permit requires the Knolls
Laboratory, the Kesselring Site, and SPRU to process Notices of Intent (NOIs) to participate in
the NYSDEC’s Stormwater general permitting program for sites disturbing one acre or greater of
soil. Participation in this general permit also requires preparation of project-specific Stormwater
Pollution Prevention Plans (SWPPPs). The MS4 general permits were applicable to the Knolls
Laboratory and Kesselring Site because they are Federal facilities and participation required
preparation and management of Stormwater Management Programs (SWMPs) for both sites.
SPRU was not required to obtain the MS4 permit coverage as they are embedded within the Knolls
Laboratory boundaries. In addition to certain administrative documentation requirements listed in
each permit, the SPDES general permit for construction activities requires an inspection of the
project site at least once every seven days. Post-rainfall inspections are required for specific
erosion and sediment control practices.

Environmental Monitoring Report – 2018
18
TABLE 7 KNOLLS LABORATORY SPDES NONCOMPLIANCES
Permit
Type Outfall Parameter
# of Permit
Exceedances
# of
Samples
Taken
# of
Compliant
Samples
Percent
Compliance
Date(s)
Exceeded
Description/
Solution
SPDES 002 TSS-Net 1 53 52 98% 02/27/18 See Note 1
Note:
1. The Total Suspended Solids (TSS) SPDES Permit effluent net limit (40 mg/l daily max) was exceeded, with a net value of
53 mg/l. The suspected cause of this non-compliance event is rapid melting of the snow banks from plowing/clearing
parking lots and walkways, due to unseasonably warm temperatures (~60°F).
TABLE 8 KESSELRING SITE SPDES NONCOMPLIANCES
Permit
Type Outfall Parameter
# of Permit
Exceedances
# of
Samples
Taken
# of
Compliant
Samples
Percent
Compliance
Date(s)
Exceeded
Description/
Solution
SPDES 001/002 pH 2 28 26 93% 01/04/18 See Note 1
SPDES North of
Bldg. 1
Sanitary
Bypass 1 0 0 NA 08/02/18 See Note 2
Notes:
1. The Kesselring Site had two pH permit exceedances in 2018. On January 4, 2018, Environmental Engineering noted high out-of-spec pH from Outfalls 001 and 002. The high pH stemmed from old pH probes not reading the correct values for the system.
2. The Kesselring Site had one sanitary bypass in 2018. On August 2, 2018, during routine sanitary line inspections, a crack North of Building 1 was identified. The sewage was lost into the surrounding ground.
Clean Air Act (CAA)
The Federal CAA and its amendments provide the regulatory basis for the protection of ambient
air quality; control and reduction in the emissions of the pollutants carbon monoxide, particulate
matter, and those compounds that contribute to the formation of ground-level ozone (i.e., volatile
organic compounds (VOCs) and nitrogen oxides (NOx)); control and reduction of pollutants likely
to increase the risk of death or serious illness; control and prevention of accidental releases of
regulated hazardous air pollutants or any other extremely hazardous substances; control of the
principal contributors to acid rain and other forms of acid deposition (i.e., sulfur dioxide (SO2) and
NOx); protection of stratospheric ozone; and a mandated Federal permitting program (Title V) for
major air emission sources.
The regulatory authority for the majority of the CAA regulations that affect the Knolls Laboratory
and the Kesselring Site in New York State has been delegated by the EPA to NYSDEC. Six
Federal regulations which currently affect the Knolls Laboratory and the Kesselring Site that have
not yet been implemented by the State, but require report submittals, recordkeeping, or operation
and maintenance activity tracking are “Standards of Performance for Small Industrial-
Commercial-Institutional Steam Generating Units” (40 CFR 60 – Subpart Dc), “National Emission
Environmental Monitoring Report – 2018
19
Standards for Hazardous Air Pollutants Area Sources: Industrial, Commercial, and Institutional
Boilers” (40 CFR 63 – Subpart JJJJJJ), “National Emission Standards for Emissions of
Radionuclides Other Than Radon From Department of Energy Facilities” (40 CFR 61 – Subpart
H), “National Emission Standards for Hazardous Air Pollutants for Stationary Reciprocating
Internal Combustion Engines at Area Sources” (40 CFR 63 – Subpart ZZZZ), “Standards of
Performance for Stationary Compression Ignition Combustion Engines” (40 CFR Part 60 –
Subpart IIII), and “General Compliance Provisions for Highway, Stationary, and Nonroad
Programs” (40 CFR 1068). For these six regulations, the EPA retains regulatory authority.
In 2016, 6 NYCRR Part 225.1, “Fuel Combustion and Use – Sulfur Limitations,” became effective
and regulates the sulfur content of diesel fuels combusted in stationary sources to a maximum of
0.0015% sulfur. Both Knolls Laboratory and the Kesselring Site have stationary combustion
sources (emergency power generators and site heating boilers) subject to this regulation. In
December 2016, NYSDEC adopted 6 NYCRR Part 222, Distributed Generation Sources (DGS),
which established emission standards, monitoring requirements and recordkeeping requirements
for certain DGS in New York State. In March of 2017, this regulation was stayed due to a lawsuit
filed by several New York based industries and has yet to be reinstated.
A number of air emission sources at both the Knolls Laboratory and the Kesselring Site, such as
site heating boilers, are regulated under the NYSDEC Air Permitting/Registration Program (see
Table 6). In addition to the site heating boilers at the Knolls Laboratory, one of the two Advanced
Steam Generator Test Facility (ASGTF) water heaters is also regulated by the EPA under 40 CFR
60 – Subpart Dc. Both the Knolls Laboratory heating boilers and the ASGTF water heaters are
permitted under a NYSDEC Air State Facility Permit, which was renewed in January 2010 and is
still in effect.
The Air State Facility permit for the Knolls Laboratory heating boilers has federally enforceable
capping provisions that allow the heating boilers to be classified as synthetic minor sources. As
such, the Knolls Laboratory does not require a Title V facility permit, which normally applies to
major sources under the CAA.
During the renewal process for the Kesselring Site’s NYSDEC Air Facility Registration for its two
boiler house stacks, which exhausts the Kesselring Site’s two heating boilers, NYSDEC stated that
the Kesselring Site no longer had the potential to emit contaminants above the Title V thresholds.
Therefore, the Kesselring Site no longer had to comply with the State’s cap-by-rule provisions,
and this requirement was removed from the Site’s new Air Facility Registration requirements in
2016. The Kesselring Site heating boilers are considered an area source and do not require a Title
V or a State Facility Permit.
The air emission sources listed in Table 6 have been operated in accordance with their permit or
facility registration conditions.
Other nonradioactive air emission sources that do not require State permits or registrations at the
Knolls Laboratory and Kesselring Site either come under an exemption for ventilating and
exhausts from laboratory operations, NESHAPs minor source exemptions presently in effect, or
are considered as exempt or trivial activities under New York State regulations.

Environmental Monitoring Report – 2018
20
The EPA, under 40 CFR 61 Subpart H, regulates radionuclide air emission sources at the Knolls
Laboratory (including SPRU) and the Kesselring Site. During 2018, the maximally exposed
individual effective dose equivalent, calculated using the EPA computer code CAP88-PC, was less
than 0.1 mrem for the Knolls Laboratory, including SPRU, and the Kesselring Site, which is less
than 1% of the 10 mrem/year EPA standard. Annual radionuclide air emission reports are provided
to the EPA, as required by the regulations, and also to NYSDEC.
Resource Conservation and Recovery Act (RCRA)
The Federal RCRA and the New York State ECL were enacted to address the safe disposal of
municipal and industrial solid and hazardous waste. RCRA, like most environmental legislation,
encourages States to develop their own hazardous waste programs as an alternative to direct
implementation of the Federal program. To this end, the EPA has delegated its authority to
NYSDEC for all aspects of RCRA, with the exception of a few specific portions associated with
the 1984 Hazardous and Solid Waste Amendments (HSWA) to RCRA.
During 2018, the Knolls Laboratory and the Kesselring Site continued to operate as both hazardous
waste generators and permitted storage facilities. In this latter instance, the Knolls Laboratory and
the Kesselring Site received their original NYSDEC, 6 NYCRR Part 373, hazardous waste storage
permits in July 1998 and June 1995, respectively. As such, both the Knolls Laboratory and the
Kesselring Site must follow specific requirements for handling and accumulation of hazardous
waste under applicable New York State regulations as well as the conditions for storage of such
waste under their respective State-issued hazardous waste management permits. Hazardous waste
management permits are generally in effect for ten years. The Knolls Laboratory permit was
renewed on July 30, 2012. The Kesselring Site permit was renewed on December 13, 2013.
Representatives from the EPA inspect both the Knolls Laboratory and the Kesselring Site annually
for compliance.
SPRU personnel and contractors manage universal/hazardous/mixed waste in accordance with
6 NYCRR Parts 370-373, Part 376, and Part 374-3 regulations, as applicable, and ship waste to
permitted Treatment, Storage, and Disposal Facilities (TSDFs). Storage of mixed TRU waste at
SPRU is managed under a NYSDEC issued consent order pending issuance of a 6 NYCRR
Part 373 Hazardous Waste Management Permit. In 2018, SPRU operated as a small quantity
generator.
RCRA Corrective Action Program
The 1984 HSWA to RCRA expanded EPA’s authority to require TSDFs to conduct corrective
action for releases from a facility. Under this section of RCRA, the EPA or an authorized State
must require corrective action for all releases of hazardous waste or constituents from any solid
waste management unit at a TSDF seeking a permit under RCRA, regardless of the time at which
the waste was placed in such units. The regulations implementing this section of RCRA define
the term “solid waste management unit (SWMU)” to include: any discernible unit at which solid
wastes have been placed at any time, irrespective of whether the unit was intended for the
management of solid or hazardous waste. Such units include any area at a facility at which solid
wastes have been routinely and systematically released.

Environmental Monitoring Report – 2018
21
NYSDEC has been granted authority by the EPA to manage their own RCRA 3004(u) corrective
action program via the New York State ECL. The Knolls Laboratory and the Kesselring
Site 6 NYCRR Part 373 hazardous waste permits require each site to pursue facility
characterization and corrective action, if necessary. In addition to the SWMUs included in each
of the permits, New York State has also established “areas of concern” or AOCs. An AOC is an
area that is not at this time known to be a SWMU, where hazardous waste and/or hazardous
constituents are present, or are suspected to be present as a result of a release from the facility.
The term includes areas of potential or suspected contamination as well as actual contamination.
Such area(s) may require study and a determination of what, if any, corrective action may be
necessary.
The Knolls Laboratory and the Kesselring Site are performing RCRA corrective action efforts
under the oversight of NYSDEC. Each site has several areas where historical releases of hazardous
chemicals require sampling and potential remedial action. Reports of sample analytical results
and actions taken are submitted for NYSDEC approval as they are accomplished, in accordance
with established schedules.
SPRU performs RCRA corrective actions in accordance with DOE-EM 6 NYCRR Part 373 Permit
No. 4-4224-00024/00055 (issued as #4-4224-00024/00042) under NYSDEC’s authority. This
permit is a Corrective Action Only permit, meaning that there are no treatment, storage, or disposal
provisions included therein. During 2018, the SPRU site completed the remediation of the G2
AOC and Upper Level SWMUs; and received NYSDEC concurrence for backfilling the
corresponding excavations. Close out of those areas is dependent on NYSDEC approval of the
closure reports, with completion of site restoration expected in 2019.
Federal Facility Compliance Act (FFCA) The FFCA was signed into law in October 1992 as an amendment to the Solid Waste Disposal Act
(SWDA). The FFCA applied certain requirements and sanctions of RCRA to Federal facilities.
In short, the FFCA waives sovereign immunity for Federal facilities from all civil and
administrative penalties and fines; this includes waivers for both coercive and punitive sanctions
for violations of the SWDA. Relative to mixed waste, the FFCA mandated the development and
Federal/State approval of Site Treatment Plans (STPs), that contain schedules for developing
treatment capabilities and for treating mixed wastes subject to the Land Disposal Restrictions
(LDR) of 40 CFR 268 and 6 NYCRR 376.
The DOE Naval Reactors Laboratory Field Office (NRLFO) and the NYSDEC signed
Administrative Consent Orders in October 1995 to establish commitments regarding compliance
with the approved STPs for mixed wastes stored and generated at the Knolls Laboratory and the
Kesselring Site. NRLFO and NYSDEC terminated the Kesselring Site’s Administrative Consent
Order in August 2009, because the requirements and milestones established in the Kesselring Site
STP had all been completed. In compliance with the Knolls Laboratory’s Order, the STP is
updated annually and issued to NYSDEC by June 30 each year, as needed. The Knolls Laboratory
STP has met all of its milestones with the exception of the mixed transuranic remote handled waste
stream, which has yet to be generated. The SPRU RCRA Permit authorizes transfer of small

Environmental Monitoring Report – 2018
22
amounts of mixed waste to the Knolls Laboratory permitted area until shipped off-site by SPRU
in accordance with DOE-EM’s STP.
Waste Minimization, Pollution Prevention, and Recycling Programs The Knolls Laboratory and Kesselring Site waste minimization and pollution prevention programs
promote pollution prevention and waste minimization by encouraging employees to reduce the
initial use of hazardous materials, energy, water, and other resources while protecting existing
resources through conservation and more efficient use. The program focuses mainly on process
efficiency improvements; source reduction; inventory control; preventive maintenance; improved
housekeeping; recycling; and increasing employee awareness of, and participation in, pollution
prevention.
The goal of the Pollution Prevention Program is to minimize the quantity and toxicity of waste
generated at its source and, if waste is generated, to ensure that the treatment and disposal method
used minimizes the present and future threat to people and the environment. The program consists
of the following elements:
• Control of chemical acquisitions, including type and quantity;
• Maximized use of on-hand chemicals;
• Minimized production of process wastes (Source Reduction); and
• Process evaluation and modification.
The Knolls Laboratory and the Kesselring Site ensure that pollution prevention strategies are met
by reviewing chemical purchases and major construction projects to incorporate source reduction
strategies for environmentally hazardous substances.
Consistent with the EMS, which serves as the foundation of both the Knolls Laboratory and the
Kesselring Site environmental management programs, both facilities established and implemented
a sustainable acquisition program.
Progress in sustainable acquisition is reported annually to the DOE via the DOE Sustainability
Dashboard, formerly the Consolidated Energy Data Report (CEDR). Sustainable acquisition
maximizes the amounts of material procured that contain recycled material. Environmentally
preferable items reported in the Knolls Laboratory and Kesselring Site programs include but are
not limited to: paper and paper products, vehicular products (e.g., engine coolants, oils),
construction (e.g., insulation, carpet, concrete, paint) and transportation products (e.g., traffic
barricades, traffic cones), park and recreation products, landscaping products, non-paper office
products (e.g., binders, toner cartridges, office furniture), and miscellaneous products (e.g., pallets,
sorbents, and industrial drums).
The Knolls Laboratory and the Kesselring Site facilities both maintain an extensive recycling
program which includes office paper, cardboard, newspapers, telephone books, printer cartridges,
scrap metal, batteries, scrap lead, cooking oil, aluminum cans, asphalt, concrete, tires, oil, light
bulbs, circuit boards, computer equipment, magnetic media, precious metals, and wood. The
facilities recycled approximately 53% of their waste streams in 2018.
Environmental Monitoring Report – 2018
23
SPRU complied with DOE Order 450.1, “Environmental Protection Program” that contains DOE
Sustainable Environmental Stewardship goals, which include the goals to reduce or eliminate the
acquisition, use, and release of toxic and hazardous chemicals and materials and to maximize the
acquisition and use of environmentally preferable products in the conduct of operations.
Toxic Substances Control Act (TSCA) The U.S. Congress enacted TSCA in 1976. TSCA authorizes EPA to secure information on all
new and existing chemical substances and to control any of these substances determined to cause
an unreasonable risk to public health or the environment. Unlike many other environmental laws,
which generally govern discharge of substances, TSCA requires that the health and environmental
effects be reviewed prior to a new chemical substance being manufactured for commercial use.
TSCA, therefore, closes the gap in environmental regulations by allowing the EPA to prevent toxic
problems rather than simply reacting to them after discharge. However, because the Knolls
Laboratory and the Kesselring Site do not manufacture chemicals or materials for commercial use,
a majority of the implementing TSCA regulations do not apply.
Polychlorinated biphenyls (PCBs) are regulated as a toxic substance under TSCA by means of
40 CFR Part 761. PCBs were used prior to 1979 mainly as a dielectric fluid in electrical equipment
such as transformers and capacitors. PCBs were also added to certain surface coatings and other
non-liquid materials due to their heat and chemical resistance. The Knolls Laboratory and the
Kesselring Site have identified PCBs in materials such as small electrical transformers, fluorescent
light ballasts, applied dried paints, lubricants/machine oils, and electrical cable insulation. The
Knolls Laboratory and the Kesselring Site have removed all large PCB transformers from their
sites and continue to remove and replace suspected PCB fluorescent light ballasts, where practical.
Additionally, both the Knolls Laboratory and the Kesselring Site employ strict controls for
removal, storage, and disposal of remaining PCB containing items. Similarly, SPRU manages
PCBs in accordance with the requirements of TSCA under 40 CFR Part 761.
Comprehensive Environmental Response, Compensation, and Liability Act (CERCLA) The Federal CERCLA, or Superfund, was designed to respond to situations involving the past
disposal of hazardous substances. As such, it complements RCRA, which regulates on-going
hazardous waste handling and disposal.
The National Priorities List is an important facet of CERCLA’s response procedures and is updated
annually to list sites warranting evaluation and/or cleanup under CERCLA. EPA Region 2, in
May 1994, designated both the Knolls Laboratory and the Kesselring Site as Site Evaluation
Accomplished following a series of studies and correspondence related to a Preliminary
Assessment and Site Inspection Report prepared in accordance with CERCLA Section 120. As a
result, neither the Knolls Laboratory nor the Kesselring Site warranted inclusion on the National
Priorities List.

Environmental Monitoring Report – 2018
24
Emergency Planning and Community Right-to-Know Act (EPCRA) The Federal EPCRA establishes authorities for emergency planning and preparedness, emergency
release notification reporting, community right-to-know reporting, and toxic chemical release
reporting. Under the provisions of this Act, covered facilities must provide the following
information to State and local entities: the name of the individual who will function as a Facility
Emergency Coordinator, notice that certain applicable substances (e.g., extremely hazardous
substances on-site above certain threshold planning quantities) are present at that facility and,
when required, report releases of those substances and other listed hazardous substances in excess
of certain reportable quantities (RQs). Additionally, EPCRA requires that facilities prepare and
submit, or retain on file, the information listed in the following EPCRA Sections below which are
codified under 40 CFR Parts 370 and 372:
§ 302-303 Provide initial notification to State Emergency Response Commission (SERC),
Local Emergency Planning Committees (LEPCs), and local fire departments
that the facility is subject to the emergency planning requirements under
EPCRA.
§ 304 Facilities must immediately notify the LEPC and the SERC if there is a release
to the environment of a hazardous substance that is equal to or exceeds the
minimum reportable quantity set in the regulations.
§ 311 The submission of Material Safety Data Sheets or Safety Data Sheets
(MSDS/SDS) for extremely hazardous substances (EHS) stored on-site in
quantities greater than the threshold planning quantity (TPQ) or any substance
on-site greater than 10,000 pounds for which a potential exposure to an
employee exists. Updated SDS are to be submitted within three months of
discovery of significant new information about the hazardous
chemicals/substances.
§ 312 Complete an annual Tier Two Emergency and Hazardous Chemical Inventory
Report for EHS and hazardous chemicals/substances present at each site in
excess of specified quantities during the previous calendar year. The
information is submitted to the SERC, LEPCs, and local fire departments for
emergency planning purposes.
§ 313 Complete an annual evaluation of activities associated with the manufacturing,
processing, or otherwise use of any of the listed toxic chemicals above the
designated activity thresholds and where necessary prepare a Toxic Release
Inventory (TRI) report for submittal to EPA.
The status summary of Knolls Laboratory, Kesselring Site, and SPRU EPCRA Reporting is shown
in Tables 9 and 10. There were no EPCRA reportable releases from any of the sites in 2018 and
none of the sites were required to submit TRI reports under Section 313 for the 2017 reporting
year. Reports are filed in the year following the reporting year’s activities (e.g., 2017 activities
are reported in 2018).

Environmental Monitoring Report – 2018
25
TABLE 9 KNOLLS LABORATORY & KESSELRING SITE EPCRA REPORTING
EPCRA Section Description of Reporting Status
EPCRA § 302-303 Planning Notification No Notifications required during calendar year 2018
EPCRA § 304 Emergency Release Notification No Reportable Releases
EPCRA § 311-312 SDS Submittal / Tier Two Emergency and Hazardous Chemical Inventory Reporting
New SDS notifications were made during calendar year 2018
The Chemical Inventory (Tier Two) Reports for calendar year 2017 filed
EPCRA § 313 TRI Reporting Not Required
TABLE 10 SPRU EPCRA REPORTING
EPCRA Section Description of Reporting Status
EPCRA § 302-303 Planning Notification No Notifications required during calendar year 2018
EPCRA § 304 Emergency Release Notification No Reportable Releases
EPCRA § 311-312 SDS Submittal / Tier Two Emergency and Hazardous Chemical Inventory Reporting
No Notifications required for calendar year 2018
EPCRA § 313 TRI Reporting Not Required
Federal Insecticide, Fungicide, and Rodenticide Act (FIFRA)
The FIFRA gives EPA authority to regulate the field use of pesticides, which EPA implements
through a State-administered certification program. Authorized Knolls Laboratory and Kesselring
Site personnel applying pesticides, such as cooling tower addition chemicals, keep a daily use log
for every application of a general use pesticide. Annual reports are filed and provided to NYSDEC
by the certified applicator/technician for all pesticides applied during the previous year. Any such
chemical applied by a subcontractor licensed commercial application business or under their
guidance is recorded and reported by the subcontractor directly.
National Environmental Policy Act (NEPA) Significant construction, renovation, demolition, decommissioning, decontamination, and
remediation activities are reviewed for their impact on the environment under the NEPA
requirements as provided by the DOE. Other projects or capital equipment expenditures that
have the potential for creating new emissions to the environment or effect any condition of a

Environmental Monitoring Report – 2018
26
permitted or otherwise regulated operation also receive a NEPA evaluation. Summary forms for
determinations made for the applicability of the use of Categorical Exclusions (CXs) for NEPA
Compliance and all NEPA documentation for the NNPP Sites including the Knolls Laboratory
and the Kesselring Site in New York are posted online at the U.S. DOE website located at
www.energy.gov/nepa/office-nepa-policy-and-compliance.
Environmental Monitoring Report – 2018
27
ENVIRONMENTAL MONITORING KNOLLS LABORATORY SITE DESCRIPTION
The Knolls Laboratory is located in the Town of Niskayuna, New York, approximately two miles
(3.2 kilometers) east of the City of Schenectady. The Knolls Laboratory is situated on 170 acres
of land on the south bank of the Mohawk River. Facilities at the Knolls Laboratory include
administrative offices; machine shops; a sewage pumping station; a boiler house; oil storage
facilities; cooling towers; waste storage facilities; and chemistry, physics, and metallurgical
laboratories. The surrounding area is a mixture of open land, other light industry, small farms, a
closed municipal landfill, a small municipal park, and suburban residential areas.
The climate in the region of the Knolls Laboratory is primarily continental in character but is
subject to some modification from the maritime climate that prevails in the extreme southeastern
portion of New York State. Winters are usually cold and occasionally severe. Maximum tempera-
tures during the colder winter months often are below freezing and nighttime low temperatures
frequently drop to 10° Fahrenheit or lower. Sub-zero temperatures occur rather infrequently, about
a dozen times a year. Snowfall in the area is quite variable, averaging approximately 65 inches
per year. The mean annual precipitation for the region is approximately 44 inches per year.
Westerly winds (W to NW) predominate, and a secondary maximum occurs about the south-
southeast direction.
The Knolls Laboratory is located in the Mohawk River Valley at an elevation of approximately
330 feet above mean sea level. Monitoring wells and soil/bedrock borings in the vicinity of the
Knolls Laboratory show that unconsolidated materials, consisting mainly of glacial deposits,
overlie bedrock. The depth of bedrock beneath the site generally ranges between 10 and 70 feet.
Rock outcrops are visible on both banks of the Mohawk River between the Rexford Bridge,
approximately two miles upstream, and a point about three quarters of a mile downstream from
the Knolls Laboratory. The outcrops are shales and sandstones of the Ordovician-age Schenectady
Formation. These rocks are characteristically non-porous and impermeable and form poor
aquifers. The bedrock structure is relatively simple. Over 90 percent of Schenectady County is
underlain by the Schenectady Formation, a series of alternating beds of shale, sandstone, and grit
about 2,000 feet thick, which dip gently west and southwest. The Snake Hill formation is exposed
along both sides of the Mohawk River near the dam at Lock 7, downstream from the Knolls
Laboratory. This formation consists of a considerable thickness of dark gray to black, bluish, and
greenish-gray shale. It is the only formation in Schenectady County that is strongly folded, having
been thrust westward against and over the Schenectady Formation.
The glacial deposits consist almost entirely of glacial till. The glacial till at the Knolls Laboratory
is clay rich, dense, compact, and is known locally as hardpan. The depth of the till beneath the
site ranges from 0 to 70 feet. The till appears a grayish-blue color but in the upper 12-foot portion,
it has been weathered to a yellowish brown color. Within the till, occasional lenses of graded
material, usually fine sand, exist. The till is almost entirely impermeable except for a few lenses
of sand, which are capable of transmitting water. These lenses are small in size and isolated from

Environmental Monitoring Report – 2018
28
one another based on drilling records and on-site monitoring well performance. Overlying the till
in the eastern portion of the site are glacial lake sequences (silts and clays) and thin, discontinuous
ice-contact deposits (sands and gravels). The ice-contact deposits are capable of transmitting
water, but their limited extent diminishes the potential for yielding useable water volumes.
The Knolls Laboratory is located adjacent to the Mohawk River that serves as the main
watercourse for the Mohawk River Drainage Basin, covering an area of 3,450 square miles. The
river flows eastward to where it joins the Hudson River in Cohoes, N.Y. The average flow rate
(1926–2018) of the Mohawk River is 5,924 cubic feet per second (cfs) and the lowest recorded
seven-day minimum flow is 458.1 cfs during August 1995. Three small streams that receive
drainage from the Knolls Laboratory are tributaries to the Mohawk River. The East Boundary
Stream is located between the Knolls Laboratory closed landfill and the closed Town of Niskayuna
landfill. The East Boundary Stream also receives runoff from a nearby housing development and
roadway. The Midline Stream originates on-site and drains the central portion of the site. The
West Boundary Stream is located adjacent to the Knolls Laboratory on General Electric Global
Research Center property. This stream receives some surface water runoff from a tributary ditch
from the site. A fourth surface water drainage-way, located on the west side of the closed Knolls
Laboratory landfill, is referred to as the West Landfill Stream. This drainage-way does not directly
discharge to the Mohawk River and rarely has an observable flow. The flow in all of these streams
becomes extremely low to nonexistent during the late summer/early fall. These streams are not
accessible to the public, except at the point where they each meet the Mohawk River, nor are they
suitable for fishing or swimming.
The groundwater within the immediate vicinity of the Knolls Laboratory is very limited due to
both low porosity and permeability of the till which prohibits the development of the groundwater
as a potable water supply. As such, there are no drinking water wells on-site. There are no
underlying principal or primary bedrock or overburden aquifers. Water for site operations
involving potable and noncontact cooling use is obtained from the Schenectady and Niskayuna
Municipal Water Systems. The majority of water for noncontact cooling at the Knolls Laboratory
is obtained from the Mohawk River.
The Mohawk River is classified by NYSDEC as a Class A stream. The best usages of Class A
waters are considered to be: a source of water for drinking, culinary or food processing purposes,
primary and secondary contact recreation, and fishing. The waters shall be suitable for fish
propagation and survival. The Knolls Laboratory discharges water from its various operations
within the concentration, mass loading, and flow limits set by the SPDES Permit, Reference (3).
Environmental Monitoring Report – 2018
29
LIQUID EFFLUENT MONITORING Sources
Nonradiological: The principal sources of effluent water are:
1. Sewage Pumping Station - Knolls Laboratory sewage is pumped to the Town of Niskayuna
Publicly Owned Treatment Works (POTW). The untreated sewage consists primarily of
wastewater from restrooms, cafeteria services, and janitorial sinks. A small portion may also
consist of dilute nonhazardous laboratory rinse water, dilute nonhazardous analytical waste,
environmental samples, and ammoniated or phosphated process water.
2. Cooling Towers - Cooling water, used mainly for central air conditioning, is treated to main-
tain a pH range of 7.0 to 7.5, to minimize scale buildup, to prevent corrosion of system
materials, and to inhibit the growth of algae and slime. The towers are periodically blown
down to control chemistry and some are drained to prevent freezing in the winter. The water
drained from the towers is discharged to the Mohawk River.
3. Site Boiler Plant - Site boiler water is chemically treated, softened, and de-alkalized. Opera-
tions that result in releases are (1) periodic blowdowns to control boiler chemistry and (2) ion
exchange resin regeneration effluent from the softener and the de-alkalizer systems. Water
generated by the blowdown and de-alkalizer regeneration operations are neutralized and
allowed to cool before being discharged to the Mohawk River.
4. Noncontact Cooling Water - Mohawk River water and Site Service Water ((SSW) municipal
water supply) are used as noncontact cooling media for several heat exchangers and are
discharged to the Mohawk River.
5. Process Water - Treated/untreated wastewater, primarily from the river water system, is
generated on-site. Process water treatment typically consists of one or more of the following
processes: sedimentation, filtration, ion exchange, activated carbon adsorption, or neutraliza-
tion before being discharged to the Mohawk River.
6. Site Drainage Water - Stormwater and groundwater also make up a portion of the liquid
effluent to the Mohawk River.
Approximate flows and chemical characteristics of the discharges to the Mohawk River
(Items 2-6) were incorporated into the SPDES Permit application and Permit, Reference (3).
Radiological: Historically, the concentrations of radioactivity in liquids released from the Knolls
Laboratory have always been below all applicable limits. The small volume of liquids generated
from current laboratory operations that may contain radioactivity are collected for shipment off-
site in an absorbed form to an approved disposal facility. This minimizes the quantities of
radioactivity released from the Knolls Laboratory.
Environmental Monitoring Report – 2018
30
The small amounts of groundwater and stormwater that runoff from SPRU contain low level
residual radioactivity from operations conducted during the 1950s and 1960s and are released in
the site drainage water. The principal radioactive constituents released to the Mohawk River from
all sources are the longer-lived fission products strontium-90 and cesium-137.
Effluent Monitoring Nonradiological: The Knolls Laboratory sanitary sewage is pumped to the Town of Niskayuna
POTW in accordance with an Outside Users Agreement, Reference (2). The Agreement specifies
the parameters and sampling frequency for the untreated sewage. The minimum sampling
frequency is monthly for chemical constituents, while flow and pH measurements are required
daily. Typically, a twenty-four hour flow-adjusted composite sample for chemical constituents is
collected weekly. All monitoring data are averaged, with the exception of pH for which the
maximum and minimum values for the month are reported, and then provided in a monthly report
to the Town. The sewage pumping station is equipped with a pH alarm that shuts off the main
pumps when the alarm set points are exceeded. Sewage flow is then allowed to passively overflow
into a holding tank.
The Knolls Laboratory water discharged to the Mohawk River is regulated by a SPDES Permit,
Reference (3). The SPDES Permit specifies the required sampling locations, parameters, and
minimum sampling frequencies. The SPDES Permit was renewed in June 2015 with an effective
date of July 1, 2015. An administrative change to the SPDES permit was approved by NYSDEC
on March 30, 2018. The change adjusted the sample location of Outfall 001 and modified the
copper sampling at Outfalls 001 and 002. The term of the permit is five years, with an expiration
date of June 30, 2020.
Liquid effluent from the Knolls Laboratory enters the Mohawk River through a submerged outfall
(Outfall 002), four small surface outfalls (Outfalls 03A, 03B, 03D, and 03E), and three natural
stormwater streams (Outfalls 004, 005, and 006) as shown in Figure 2.
Outfall 002 discharges noncontact cooling water, process water, stormwater, and groundwater
through a submerged drain line directly to the Mohawk River. The Outfall 002 monitoring station
consists of a continuous temperature monitor and a Parshall flume, which provides for the
continuous measurement and recording of effluent flow rate and total flow. In addition, weekly
grab and composite samples are taken at Outfall 002 and analyzed for the constituents specified in
the SPDES Permit, including copper when the Copper Ion Generator is operating.
Outfalls 03B and 03D discharge Mohawk River water used for once-through noncontact cooling,
municipal water, stormwater, and groundwater. The Outfalls 03B and 03D monitoring stations
consist of continuous temperature and flow monitoring which provides for the continuous
measurement and recording of effluent flow rates and total flows. In addition, weekly grab
samples are taken at Outfalls 03B and 03D and analyzed for the constituents specified in the
SPDES Permit, including copper when the Copper Ion Generator is operating. A Copper Ion
Generator is used to inhibit zebra mussel attachment to noncontact cooling water system piping
when the river water temperature is in excess of 50o Fahrenheit.
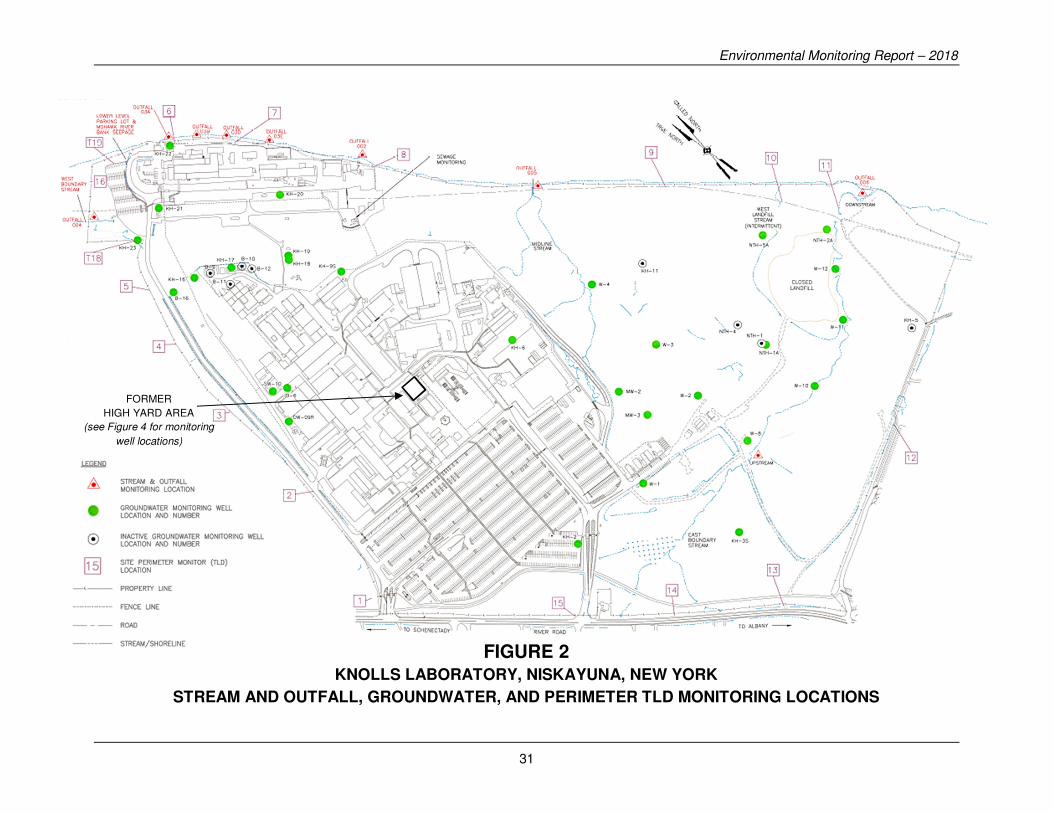
Environmental Monitoring Report – 2018
31
FIGURE 2 KNOLLS LABORATORY, NISKAYUNA, NEW YORK
STREAM AND OUTFALL, GROUNDWATER, AND PERIMETER TLD MONITORING LOCATIONS
FORMER
HIGH YARD AREA
(see Figure 4 for monitoring
well locations)

Environmental Monitoring Report – 2018
32
The river water used for noncontact cooling must be strained to remove particles and biological
life to prevent clogging of the Knolls Laboratory heat exchangers and instrumentation lines. In
2017, the Knolls Laboratory installed an inline screen (aka, Johnson screen) with a 0.79 mm screen
in the Mohawk River. The Johnson screen filters the river water prior to entering the pump house
galley. The settling tank, which removed sediment from the river water pump strainer backwash
effluent, was in use up through October 2017. The settling tank is currently not in use; however,
it is still installed inline for future use, if needed. The discharge from the settling tank is directed
to Outfall 03B. After installation of the Johnson screen in the Mohawk River, verification
monitoring to determine the efficiency of the Johnson screen was performed in 2018 per the
SPDES permit. An entrainment reduction of 98.3% was calculated, well in excess of the 90%
required by the facility’s SPDES permit.
Outfalls 03A and 03E discharge only groundwater and stormwater as allowed by the SPDES
Permit. These outfalls are monitored quarterly utilizing flow estimates and grab samples for pH
and chemical constituent analyses. All monitoring is in accordance with the SPDES Permit.
Three Knolls Laboratory stormwater outfalls, designated as 004, 005, and 006, are commonly
referred to as the West Boundary Stream Ditch, Midline Stream, and East Boundary Stream,
respectively. The flows in these surface water streams are intermittent, and the streams are
sampled quarterly for SPDES parameters, when possible. Additionally, the East Boundary Stream
is sampled annually in accordance with the Knolls Laboratory Landfill Post-Closure Monitoring
Program. The sampling location for Outfall 004 is a ditch on Knolls Laboratory property that
drains to the West Boundary Stream.
The West Landfill Stream is not part of the SPDES program and was removed from the Knolls
Laboratory Landfill Post-Closure Monitoring Program in September 2018.
The current SPDES permit requires Whole Effluent Toxicity (WET) testing for Outfall 002 every
five years, specifically in the years ending with a “1” or a “6.” The next required round of WET
Testing will occur in 2021.
Radiological: The Outfall 002 Monitoring station includes a system for the collection of samples
that are proportional to effluent flow. A monthly composite sample is prepared from the
proportional samples and analyzed monthly for radioactivity. Monthly grab samples are taken at
Outfalls 03A, 03B, 03D, 03E, 004, 005, 006, Upper East Boundary Stream, and West Landfill
Stream. Background grab samples are also taken monthly at the Upper West Boundary Stream,
Site Service Water, and Mohawk River Cooling Water Intake. Seepage samples are also collected
from the Mohawk River Bank and near the Lower Level Parking Lot. Beginning in May of 2011,
monthly split samples of Outfall 002 and 004 were provided to the New York State Department
of Health (NYSDOH). The monitoring by the NYSDOH was secured in July 2018.
The sanitary sewage pumped to the Town of Niskayuna POTW is required to be sampled a
minimum of quarterly for radioactivity in accordance with the Outside Users Agreement.
However, typically, weekly 24-hour composite samples are obtained and then composited into
quarterly samples and analyzed for radioactivity.

Environmental Monitoring Report – 2018
33
Effluent Analyses Nonradiological: Periodic grab and composite samples collected from Outfalls 002, 03A, 03B,
03D, 03E, 004, 005, and 006 are analyzed for the chemical constituents listed in Reference (3).
Samples from various outfalls may be analyzed for additional parameters for informational
purposes only and are presented in the appropriate data tables. A twenty-four hour flow adjusted
composite sample of the sewage pumped to the Town of Niskayuna POTW is collected and
analyzed as required by Reference (2).
Radiological: The monthly composite sample collected at the Outfall 002 is analyzed for
(1) strontium-90 by radiochemical separation and subsequent beta counting, (2) cesium-137 and
other gamma-emitting radionuclides by gamma spectrometry, (3) tritium by liquid scintillation
counting, and (4) gross alpha and gross beta radioactivity by direct sample evaporation and
subsequent alpha and beta counting. Samples from the remaining outfalls are analyzed for gross
alpha and gross beta radioactivity. Analyses for strontium-90 and cesium-137 are routinely
performed for Outfalls 03A, 03D, 03E, 004, 005, 006, Lower Level Parking Lot Seepage, and
Mohawk River Bank Seepage. For Outfall 03B and the West Landfill Stream, analysis for
strontium-90, cesium-137, and other gamma-emitting radionuclides are performed if the gross beta
radioactivity exceeds 10 pCi/l.
The quarterly composite sample of the sanitary sewage effluent to the Town of Niskayuna POTW
is analyzed for strontium-90, cesium-137, cobalt-60, tritium, and uranium. Weekly samples are
analyzed for gross alpha and beta radioactivity.
Assessment
Nonradiological: The analytical results for the chemical constituents, flow, and pH monitored in
the Knolls Laboratory sewage effluent during 2018 are summarized in Table 11. The Knolls
Laboratory average effluent results show that the Knolls Laboratory has operated within all
parameters specified in the Outside Users Agreement, Reference (2).
The analytical results for the chemical constituents, flow, and temperature monitored in the Knolls
Laboratory liquid effluent during 2018 are summarized in Table 12. The annual average values of
all parameters were within the appropriate effluent permit limits or standards where standards exist
for Outfalls 002, 03A, 03B, 03D, and 03E. This data was reported to NYSDEC as appropriate in
the monthly SPDES Discharge Monitoring Reports.
The Knolls Laboratory SPDES Permit designates the Mohawk River intake as Outfall 001 and
requires it to be monitored for flow, pH, total suspended solids, and copper (when the Copper Ion
Generator is operating). The designated Outfall 001 sampling location, per the 2018 SPDES
permit modification, is located in the L4 Pump House downstream of the Johnson Screen. The
Knolls Laboratory SPDES permit requires composite sampling for total suspended solids at
Outfalls 001 and 002 and composite sampling for total dissolved solids at Outfall 002. The 2018
SPDES permit modification requires composite sampling for total copper at Outfalls 001 and 002.
The intake data is used to determine both the net limits and appropriate pH ranges for the outfalls
or for information. Data is summarized in Table 12. The Mohawk River is voluntarily monitored

Environmental Monitoring Report – 2018
34
for chloride at two locations and total dissolved solids at Outfall 001. The data for the upstream
and downstream locations are presented in Table 13.
The Knolls Laboratory SPDES Permit requires the surface water streams, West Boundary Stream
Ditch, Midline Stream, and East Boundary Stream, to be monitored quarterly for five parameters,
when flow exists in these streams. The analytical results for required chemical constituents, flow,
and pH were within the specified limits. Additional parameters are monitored voluntarily. These
results are summarized in Tables 14 and 15.
Nonradioactive liquid effluent monitoring data are reported monthly as required in Reference (3).
The monthly SPDES Discharge Monitoring Reports are available for public viewing at the
Niskayuna Branch of the Schenectady County Public Library.
TABLE 11 CHEMICAL CONSTITUENTS IN KNOLLS LABORATORY SANITARY SEWAGE
EFFLUENT DISCHARGED TO THE TOWN OF NISKAYUNA PUBLICLY OWNED TREATMENT WORKS
Knolls Laboratory Sewage Lift Station
Parameter (Units) Number of Samples
Value(1) Percent of
Limit(4) Minimum Maximum Average(2) Limit(3)
Outside Users Agreement #94 3850 Requirements (Reference (2))
Flow (GPD) 365 3,040 38,685 18,933(5) 45,000 42
pH (SU) 721 6.8 8.9 ---- 6.0-9.5(6) ----
Biochemical Oxygen Demand (mg/l)
56(7) 207 937(8) 381 700 54
Chemical Oxygen Demand (mg/l) 56(7) 491 1,360 844 1,800 47
Total Suspended Solids (mg/l) 56(7) 172 1,410 449 1,600 28
Ammonia (as N, mg/l) 56(7) 79 152 114 200 57
Nitrate (as N, mg/l) 56(7) <0.04 0.27 <0.07 4 <2
Nitrite (as N, mg/l) 56(7) <0.01 0.49 <0.10 4 <2
Total Kjeldahl Nitrogen (as N, mg/l)
56(7) 106 192 143 250 57
Total Organic Nitrogen (as N, mg/l)
56(7) <1 113 <28 175 <16
Total Nitrogen(9) (as N, mg/l) 56(7) <106 193 <143 250 <57
Phosphate (as P, mg/l) 56(7) 10 18 14 30 45
Additional Parameters Monitored
Oil & Grease(10) (mg/l) 56(7) 10 46 20 100 20
Notes:
1. A value preceded by "<" is less than the reporting limit (RL)
2. Average values preceded by "<" contain at least one "less than reporting limit value" in the average calculation.
3. Limit based on Outside Users Agreement (Reference (2)). Outside Users Agreement allows for monthly averaging of data
unless noted.
4. Percent of limit for the average value, unless otherwise noted.
5. The average of the monthly flows reported to the Town of Niskayuna is used for this value.
6. pH values are not averaged and are required to be in this range.
7. Additional samples were collected in August 2018 for all parameters as part of quality assurance/quality control (QA/QC)
for an internal investigation involving elevated Biochemical Oxygen Demand results.
8. Biochemical Oxygen Demand is reported to the Town as a monthly average. The monthly average never exceeded the
700 mg/l limit.
9. Daily average limit; calculated as the sum of Nitrate + Nitrite + Total Kjeldahl Nitrogen concentrations.
10. This parameter is not limited by the Outside Users Agreement; however, the Town of Niskayuna sanitary code prohibits
fats, waxes, grease or oils in excess of 100 mg/l.
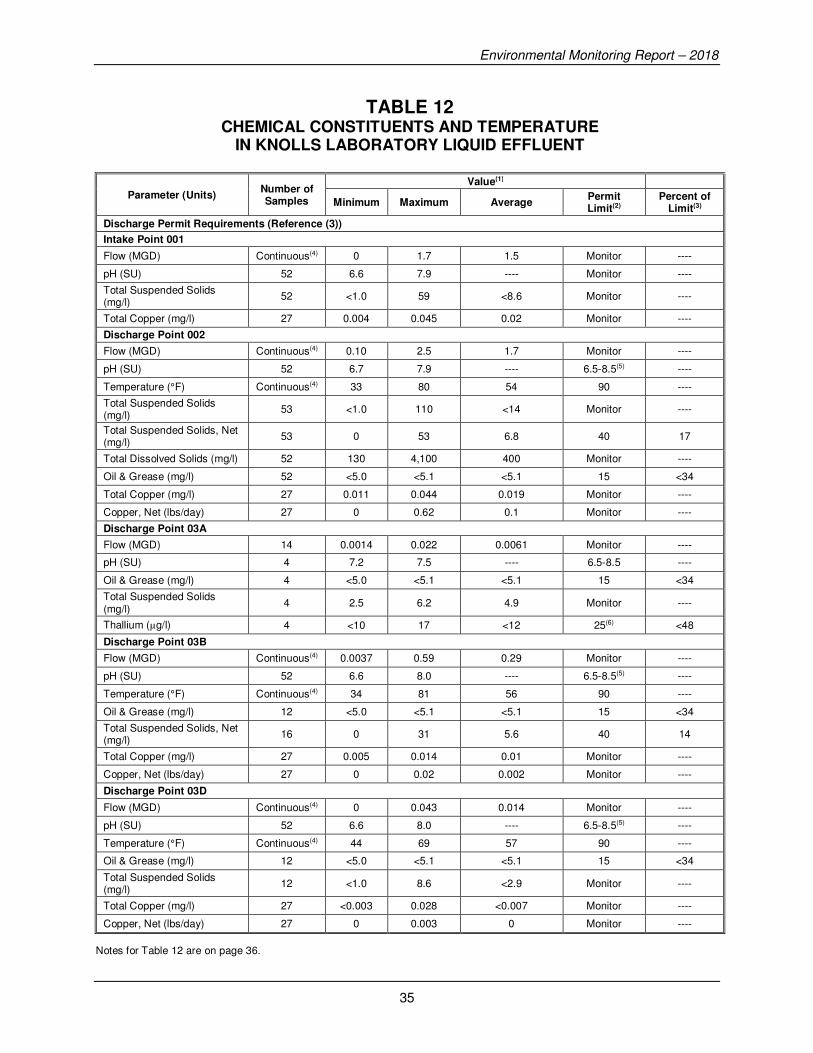
Environmental Monitoring Report – 2018
35
TABLE 12 CHEMICAL CONSTITUENTS AND TEMPERATURE
IN KNOLLS LABORATORY LIQUID EFFLUENT
Parameter (Units) Number of Samples
Value(1)
Minimum Maximum Average Permit Limit(2)
Percent of Limit(3)
Discharge Permit Requirements (Reference (3))
Intake Point 001
Flow (MGD) Continuous(4) 0 1.7 1.5 Monitor ----
pH (SU) 52 6.6 7.9 ---- Monitor ----
Total Suspended Solids (mg/l)
52 <1.0 59 <8.6 Monitor ----
Total Copper (mg/l) 27 0.004 0.045 0.02 Monitor ----
Discharge Point 002
Flow (MGD) Continuous(4) 0.10 2.5 1.7 Monitor ----
pH (SU) 52 6.7 7.9 ---- 6.5-8.5(5) ----
Temperature (°F) Continuous(4) 33 80 54 90 ----
Total Suspended Solids (mg/l)
53 <1.0 110 <14 Monitor ----
Total Suspended Solids, Net (mg/l)
53 0 53 6.8 40 17
Total Dissolved Solids (mg/l) 52 130 4,100 400 Monitor ----
Oil & Grease (mg/l) 52 <5.0 <5.1 <5.1 15 <34
Total Copper (mg/l) 27 0.011 0.044 0.019 Monitor ----
Copper, Net (lbs/day) 27 0 0.62 0.1 Monitor ----
Discharge Point 03A
Flow (MGD) 14 0.0014 0.022 0.0061 Monitor ----
pH (SU) 4 7.2 7.5 ---- 6.5-8.5 ----
Oil & Grease (mg/l) 4 <5.0 <5.1 <5.1 15 <34
Total Suspended Solids (mg/l)
4 2.5 6.2 4.9 Monitor ----
Thallium (µg/l) 4 <10 17 <12 25(6) <48
Discharge Point 03B
Flow (MGD) Continuous(4) 0.0037 0.59 0.29 Monitor ----
pH (SU) 52 6.6 8.0 ---- 6.5-8.5(5) ----
Temperature (°F) Continuous(4) 34 81 56 90 ----
Oil & Grease (mg/l) 12 <5.0 <5.1 <5.1 15 <34
Total Suspended Solids, Net (mg/l)
16 0 31 5.6 40 14
Total Copper (mg/l) 27 0.005 0.014 0.01 Monitor ----
Copper, Net (lbs/day) 27 0 0.02 0.002 Monitor ----
Discharge Point 03D
Flow (MGD) Continuous(4) 0 0.043 0.014 Monitor ----
pH (SU) 52 6.6 8.0 ---- 6.5-8.5(5) ----
Temperature (°F) Continuous(4) 44 69 57 90 ----
Oil & Grease (mg/l) 12 <5.0 <5.1 <5.1 15 <34
Total Suspended Solids (mg/l)
12 <1.0 8.6 <2.9 Monitor ----
Total Copper (mg/l) 27 <0.003 0.028 <0.007 Monitor ----
Copper, Net (lbs/day) 27 0 0.003 0 Monitor ----
Notes for Table 12 are on page 36.
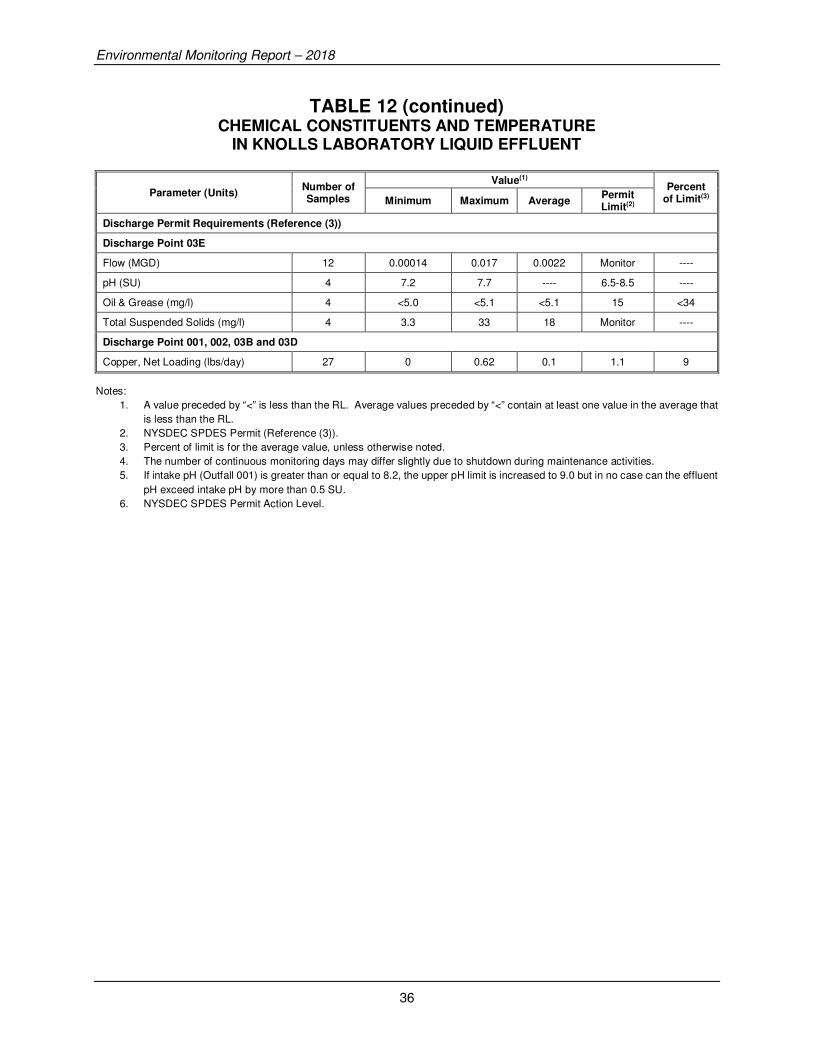
Environmental Monitoring Report – 2018
36
TABLE 12 (continued) CHEMICAL CONSTITUENTS AND TEMPERATURE
IN KNOLLS LABORATORY LIQUID EFFLUENT
Parameter (Units) Number of Samples
Value(1) Percent
of Limit(3) Minimum Maximum Average Permit Limit(2)
Discharge Permit Requirements (Reference (3))
Discharge Point 03E
Flow (MGD) 12 0.00014 0.017 0.0022 Monitor ----
pH (SU) 4 7.2 7.7 ---- 6.5-8.5 ----
Oil & Grease (mg/l) 4 <5.0 <5.1 <5.1 15 <34
Total Suspended Solids (mg/l) 4 3.3 33 18 Monitor ----
Discharge Point 001, 002, 03B and 03D
Copper, Net Loading (lbs/day) 27 0 0.62 0.1 1.1 9
Notes:
1. A value preceded by “<” is less than the RL. Average values preceded by “<” contain at least one value in the average that
is less than the RL.
2. NYSDEC SPDES Permit (Reference (3)).
3. Percent of limit is for the average value, unless otherwise noted.
4. The number of continuous monitoring days may differ slightly due to shutdown during maintenance activities.
5. If intake pH (Outfall 001) is greater than or equal to 8.2, the upper pH limit is increased to 9.0 but in no case can the effluent
pH exceed intake pH by more than 0.5 SU.
6. NYSDEC SPDES Permit Action Level.
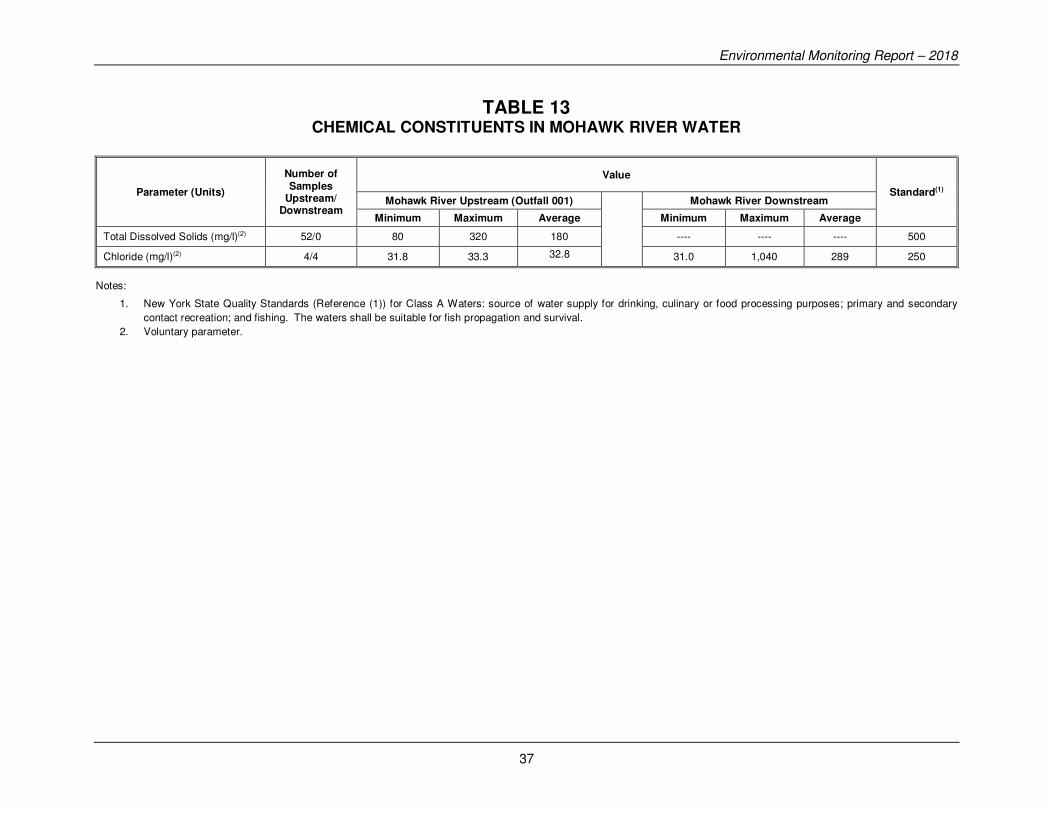
Environmental Monitoring Report – 2018
37
TABLE 13 CHEMICAL CONSTITUENTS IN MOHAWK RIVER WATER
Parameter (Units)
Number of Samples
Upstream/ Downstream
Value
Standard(1) Mohawk River Upstream (Outfall 001)
Mohawk River Downstream
Minimum Maximum Average Minimum Maximum Average
Total Dissolved Solids (mg/l)(2) 52/0 80 320 180 ---- ---- ---- 500
Chloride (mg/l)(2) 4/4 31.8 33.3 32.8
31.0 1,040 289 250
Notes:
1. New York State Quality Standards (Reference (1)) for Class A Waters: source of water supply for drinking, culinary or food processing purposes; primary and secondary
contact recreation; and fishing. The waters shall be suitable for fish propagation and survival.
2. Voluntary parameter.
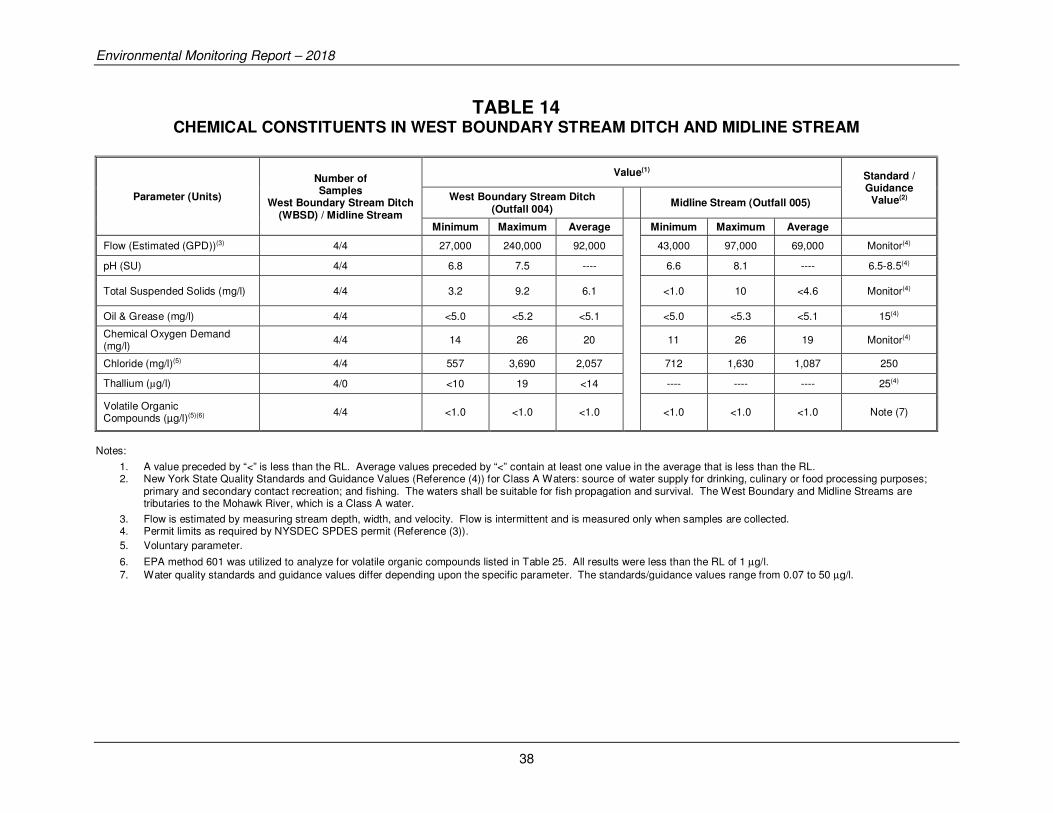
Environmental Monitoring Report – 2018
38
TABLE 14 CHEMICAL CONSTITUENTS IN WEST BOUNDARY STREAM DITCH AND MIDLINE STREAM
Parameter (Units)
Number of Samples
West Boundary Stream Ditch (WBSD) / Midline Stream
Value(1) Standard / Guidance
Value(2) West Boundary Stream Ditch (Outfall 004)
Midline Stream (Outfall 005)
Minimum Maximum Average
Minimum Maximum Average
Flow (Estimated (GPD))(3) 4/4 27,000 240,000 92,000 43,000 97,000 69,000 Monitor(4)
pH (SU) 4/4 6.8 7.5 ---- 6.6 8.1 ---- 6.5-8.5(4)
Total Suspended Solids (mg/l) 4/4 3.2 9.2 6.1 <1.0 10 <4.6 Monitor(4)
Oil & Grease (mg/l) 4/4 <5.0 <5.2 <5.1 <5.0 <5.3 <5.1 15(4)
Chemical Oxygen Demand (mg/l)
4/4 14 26 20 11 26 19 Monitor(4)
Chloride (mg/l)(5) 4/4 557 3,690 2,057 712 1,630 1,087 250
Thallium (µg/l) 4/0 <10 19 <14 ---- ---- ---- 25(4)
Volatile Organic
Compounds (µg/l)(5)(6) 4/4 <1.0 <1.0 <1.0 <1.0 <1.0 <1.0 Note (7)
Notes:
1. A value preceded by “<” is less than the RL. Average values preceded by “<” contain at least one value in the average that is less than the RL. 2. New York State Quality Standards and Guidance Values (Reference (4)) for Class A Waters: source of water supply for drinking, culinary or food processing purposes;
primary and secondary contact recreation; and fishing. The waters shall be suitable for fish propagation and survival. The West Boundary and Midline Streams are tributaries to the Mohawk River, which is a Class A water.
3. Flow is estimated by measuring stream depth, width, and velocity. Flow is intermittent and is measured only when samples are collected. 4. Permit limits as required by NYSDEC SPDES permit (Reference (3)).
5. Voluntary parameter.
6. EPA method 601 was utilized to analyze for volatile organic compounds listed in Table 25. All results were less than the RL of 1 µg/l.
7. Water quality standards and guidance values differ depending upon the specific parameter. The standards/guidance values range from 0.07 to 50 µg/l.

Environmental Monitoring Report – 2018
39
Notes:
1. A value preceded by “<” is less than the RL. Average values preceded by “<” contain at least one value in the average that is less than the RL. 2. New York State Quality Standards and Guidance Values (Reference (4)) for Class A Waters: source of water supply for drinking, culinary or food processing purposes; primary
and secondary contact recreation; and fishing. The waters shall be suitable for fish propagation and survival. The East Boundary Stream is tributary to the Mohawk River, which is a Class A water.
3. Flow is intermittent and is estimated by measuring stream depth, width, and velocity or by volume collected over a time period. Flow is measured only when samples are collected.
4. Permit limit as required by NYSDEC SPDES permit (Reference (3)) for the downstream location. 5. For non-trout waters, the minimum daily average shall not be less than 5.0 mg/l, and at no time shall the DO concentration be less than 4.0 mg/l. 6. EPA method 601 was used to analyze for volatile organic compounds listed in Table 25. All results were less than the RL of 1 μg/l. 7. Water quality standards and guidance values differ depending upon the specific parameter. The standards/guidance values range between 0.07 and 50 μg/l. 8. Voluntary parameter.
TABLE 15 CHEMICAL CONSTITUENTS AND TEMPERATURE IN EAST BOUNDARY STREAM
Parameter (Units)
Number of Samples
Upstream / Downstream
Value(1) Standard / Guidance Value(2)
East Boundary Stream Upstream East Boundary Stream Downstream
(Outfall 006)
Minimum Maximum Average Minimum Maximum Average
Flow (Estimated (GPD))(3) 1/4 27,000 27,000 27,000
46,000 180,000 92,000 Monitor(4)
pH (SU) 1/4 7.7 7.7 ---- 6.6 7.9 ---- 6.5-8.5(4)
Temperature (°F) 1/1 62 62 62 58 58 58 No Standard
Dissolved Oxygen (DO) (mg/l) 1/1 8.4 8.4 8.4 7.4 7.4 7.4 Note (5)
Specific Conductance (µmhos/cm)
1/1 2,570 2,570 2,570 2,421 2,421 2,421 No Standard
Volatile Organic
Compounds (µg/l)(6) 1/1 <1.0 <1.0 <1.0 <1.0 <1.0 <1.0 Note (7)
Oil & Grease (mg/l) 0/4 ---- ---- ---- <5.0 <5.2 <5.1 15(4)
Total Suspended Solids (mg/l) 0/4 ---- ---- ---- <1.0 130 <33 Monitor(4)
Chemical Oxygen Demand (mg/l)
0/4 ---- ---- ---- 11 27 17 Monitor(4)
Chloride (mg/l)(8) 1/4 613 613 613 395 1,030 665 250
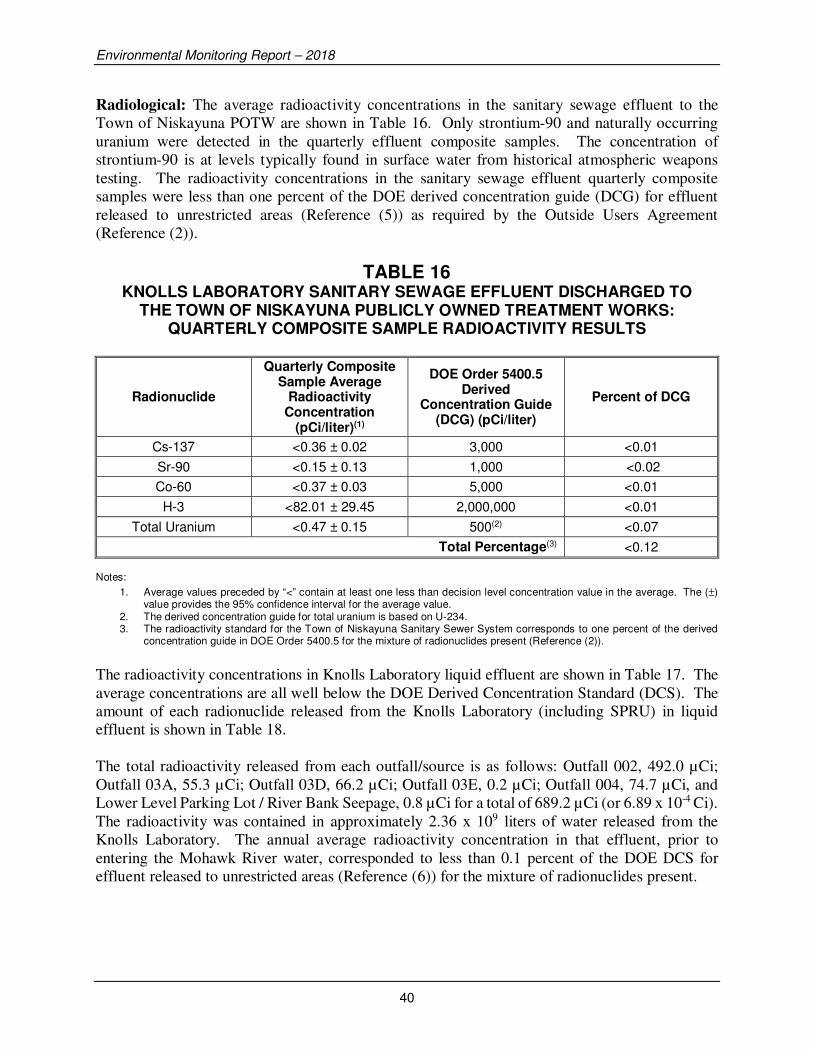
Environmental Monitoring Report – 2018
40
Radiological: The average radioactivity concentrations in the sanitary sewage effluent to the
Town of Niskayuna POTW are shown in Table 16. Only strontium-90 and naturally occurring
uranium were detected in the quarterly effluent composite samples. The concentration of
strontium-90 is at levels typically found in surface water from historical atmospheric weapons
testing. The radioactivity concentrations in the sanitary sewage effluent quarterly composite
samples were less than one percent of the DOE derived concentration guide (DCG) for effluent
released to unrestricted areas (Reference (5)) as required by the Outside Users Agreement
(Reference (2)).
TABLE 16 KNOLLS LABORATORY SANITARY SEWAGE EFFLUENT DISCHARGED TO
THE TOWN OF NISKAYUNA PUBLICLY OWNED TREATMENT WORKS: QUARTERLY COMPOSITE SAMPLE RADIOACTIVITY RESULTS
Radionuclide
Quarterly Composite Sample Average
Radioactivity Concentration
(pCi/liter)(1)
DOE Order 5400.5 Derived
Concentration Guide (DCG) (pCi/liter)
Percent of DCG
Cs-137 <0.36 ± 0.02 3,000 <0.01
Sr-90 <0.15 ± 0.13 1,000 <0.02
Co-60 <0.37 ± 0.03 5,000 <0.01
H-3 <82.01 ± 29.45 2,000,000 <0.01
Total Uranium <0.47 ± 0.15 500(2) <0.07
Total Percentage(3) <0.12
Notes:
1. Average values preceded by “<” contain at least one less than decision level concentration value in the average. The (±) value provides the 95% confidence interval for the average value.
2. The derived concentration guide for total uranium is based on U-234. 3. The radioactivity standard for the Town of Niskayuna Sanitary Sewer System corresponds to one percent of the derived
concentration guide in DOE Order 5400.5 for the mixture of radionuclides present (Reference (2)).
The radioactivity concentrations in Knolls Laboratory liquid effluent are shown in Table 17. The
average concentrations are all well below the DOE Derived Concentration Standard (DCS). The
amount of each radionuclide released from the Knolls Laboratory (including SPRU) in liquid
effluent is shown in Table 18.
The total radioactivity released from each outfall/source is as follows: Outfall 002, 492.0 µCi;
Outfall 03A, 55.3 µCi; Outfall 03D, 66.2 µCi; Outfall 03E, 0.2 µCi; Outfall 004, 74.7 µCi, and
Lower Level Parking Lot / River Bank Seepage, 0.8 µCi for a total of 689.2 µCi (or 6.89 x 10⁻⁴ Ci).
The radioactivity was contained in approximately 2.36 x 10⁹ liters of water released from the
Knolls Laboratory. The annual average radioactivity concentration in that effluent, prior to
entering the Mohawk River water, corresponded to less than 0.1 percent of the DOE DCS for
effluent released to unrestricted areas (Reference (6)) for the mixture of radionuclides present.

Environmental Monitoring Report – 2018
41
TABLE 17 RADIOACTIVITY CONCENTRATIONS
IN KNOLLS LABORATORY LIQUID EFFLUENT
Sample Point / Parameter Number
of Samples
Radioactivity Concentration (pCi/l)(1)
Percent of DCS Minimum Maximum Average
DOE-STD-1196-2011
DCS(2)
Outfall 002
Gross Alpha 12 <0.57 3.79 ± 3.64 <1.47 ± 0.56 140 <1.05
Gross Beta 12 1.37 ± 1.13 5.07 ± 1.62 <3.38 ± 0.78 1,100 <0.31
Sr-90 12 <0.07 0.38 ± 0.14 <0.16 ± 0.06 1,100 <0.01
Cs-137 12 <0.11 <0.24 <0.14 ± 0.03 3,000 <0.01
H-3 12 <68.59 <105.77 <92.05 ± 8.95 1,900,000 <0.01
Outfall 03A
Gross Alpha 12 <4.26 26.71 ± 22.58 <12.41 ± 4.20 140 <8.87
Gross Beta 12 6.05 ± 7.48 34.72 ± 12.09 <18.38 ± 6.29 1,100 <1.67
Sr-90 12 2.12 ± 0.29 9.18 ± 0.70 4.67 ± 1.15 1,100 0.42
Cs-137(3) 4 <0.11 <0.13 <0.12 ± 0.01 3,000 <0.01
Outfall 03B
Gross Alpha(3) 4 <0.40 2.64 ± 3.25 <1.10 ± 1.66 140 <0.79
Gross Beta(3) 4 1.32 ± 1.11 4.28 ± 1.62 2.48 ± 2.19 1,100 0.23
Outfall 03D
Gross Alpha 12 <3.26 <15.56 <8.17 ± 1.98 140 <5.84
Gross Beta 12 <4.50 29.78 ± 10.23 <13.12 ± 4.46 1,100 <1.19
Sr-90 12 1.05 ± 0.19 3.41 ± 0.39 1.82 ± 0.40 1,100 0.17
Cs-137(3) 4 <0.11 <0.25 <0.15 ± 0.10 3,000 <0.01
Outfall 03E
Gross Alpha(4) 12 <1.76 <14.68 <5.94 ± 2.76 140 <4.24
Gross Beta(4) 12 2.06 ± 1.21 11.83 ± 7.87 <6.17 ± 2.14 1,100 <0.56
Sr-90(4) 12 <0.08 1.06 ± 0.23 <0.25 ± 0.17 1,100 <0.02
Cs-137(3)(4) 4 <0.11 <0.12 <0.12 ± 0.01 3,000 <0.01
Outfall 004
Gross Alpha(4) 12 <3.54 21.26 ± 17.96 <9.14 ± 3.34 140 <6.53
Gross Beta(4) 12 4.68 ± 4.37 22.36 ± 9.82 <8.76 ± 3.28 1,100 <0.80
Sr-90(4) 12 0.45 ± 0.17 1.44 ± 0.22 0.89 ± 0.22 1,100 0.08
Cs-137(4) 12 0.11 ± 0.13 0.59 ± 0.13 <0.21 ± 0.09 3,000 <0.01
Outfall 005
Gross Alpha(3)(4) 4 <4.04 <15.69 <7.71 ± 8.66 140 <5.50
Gross Beta(3)(4) 4 <5.80 11.47 ± 7.87 <8.38 ± 3.74 1,100 <0.76
Sr-90(3)(4) 4 <0.09 0.37 ± 0.15 <0.23 ± 0.19 1,100 <0.02
Cs-137(3)(4) 4 <0.08 <0.25 <0.14 ± 0.12 3,000 <0.01
Outfall 006
Gross Alpha(3)(4) 4 <1.83 <9.63 <4.67 ± 5.44 140 <3.34
Gross Beta(3)(4) 4 <2.47 7.68 ± 7.23 <4.47 ± 3.95 1,100 <0.41
Sr-90(3)(4) 4 <0.08 0.22 ± 0.12 <0.15 ± 0.10 1,100 <0.01
Cs-137(3)(4) 4 <0.12 <0.12 <0.12 ± 0.01 3,000 <0.01
Notes for Table 17 are on shown on page 42.
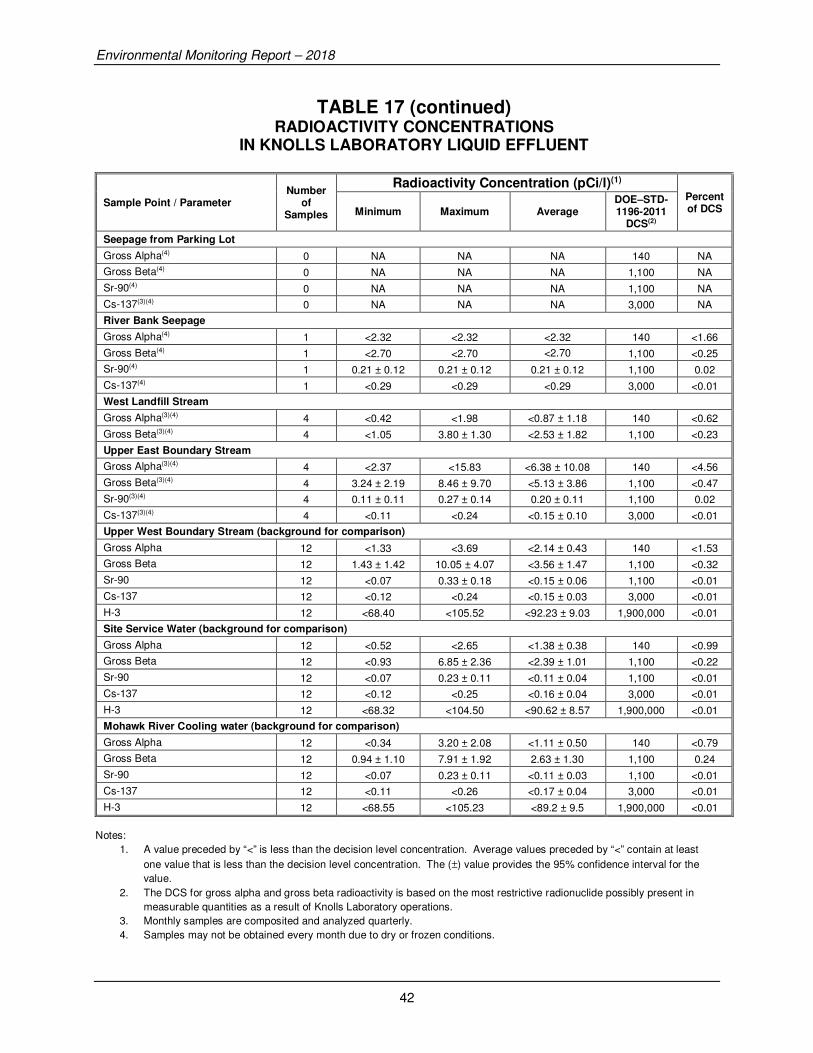
Environmental Monitoring Report – 2018
42
TABLE 17 (continued) RADIOACTIVITY CONCENTRATIONS
IN KNOLLS LABORATORY LIQUID EFFLUENT
Sample Point / Parameter Number
of Samples
Radioactivity Concentration (pCi/l)(1)
Percent of DCS Minimum Maximum Average
DOE–STD-1196-2011
DCS(2)
Seepage from Parking Lot
Gross Alpha(4) 0 NA NA NA 140 NA
Gross Beta(4) 0 NA NA NA 1,100 NA
Sr-90(4) 0 NA NA NA 1,100 NA
Cs-137(3)(4) 0 NA NA NA 3,000 NA
River Bank Seepage
Gross Alpha(4) 1 <2.32 <2.32 <2.32 140 <1.66
Gross Beta(4) 1 <2.70 <2.70 <2.70 1,100 <0.25
Sr-90(4) 1 0.21 ± 0.12 0.21 ± 0.12 0.21 ± 0.12 1,100 0.02
Cs-137(4) 1 <0.29 <0.29 <0.29 3,000 <0.01
West Landfill Stream
Gross Alpha(3)(4) 4 <0.42 <1.98 <0.87 ± 1.18 140 <0.62
Gross Beta(3)(4) 4 <1.05 3.80 ± 1.30 <2.53 ± 1.82 1,100 <0.23
Upper East Boundary Stream
Gross Alpha(3)(4) 4 <2.37 <15.83 <6.38 ± 10.08 140 <4.56
Gross Beta(3)(4) 4 3.24 ± 2.19 8.46 ± 9.70 <5.13 ± 3.86 1,100 <0.47
Sr-90(3)(4) 4 0.11 ± 0.11 0.27 ± 0.14 0.20 ± 0.11 1,100 0.02
Cs-137(3)(4) 4 <0.11 <0.24 <0.15 ± 0.10 3,000 <0.01
Upper West Boundary Stream (background for comparison)
Gross Alpha 12 <1.33 <3.69 <2.14 ± 0.43 140 <1.53
Gross Beta 12 1.43 ± 1.42 10.05 ± 4.07 <3.56 ± 1.47 1,100 <0.32
Sr-90 12 <0.07 0.33 ± 0.18 <0.15 ± 0.06 1,100 <0.01
Cs-137 12 <0.12 <0.24 <0.15 ± 0.03 3,000 <0.01
H-3 12 <68.40 <105.52 <92.23 ± 9.03 1,900,000 <0.01
Site Service Water (background for comparison)
Gross Alpha 12 <0.52 <2.65 <1.38 ± 0.38 140 <0.99
Gross Beta 12 <0.93 6.85 ± 2.36 <2.39 ± 1.01 1,100 <0.22
Sr-90 12 <0.07 0.23 ± 0.11 <0.11 ± 0.04 1,100 <0.01
Cs-137 12 <0.12 <0.25 <0.16 ± 0.04 3,000 <0.01
H-3 12 <68.32 <104.50 <90.62 ± 8.57 1,900,000 <0.01
Mohawk River Cooling water (background for comparison)
Gross Alpha 12 <0.34 3.20 ± 2.08 <1.11 ± 0.50 140 <0.79
Gross Beta 12 0.94 ± 1.10 7.91 ± 1.92 2.63 ± 1.30 1,100 0.24
Sr-90 12 <0.07 0.23 ± 0.11 <0.11 ± 0.03 1,100 <0.01
Cs-137 12 <0.11 <0.26 <0.17 ± 0.04 3,000 <0.01
H-3 12 <68.55 <105.23 <89.2 ± 9.5 1,900,000 <0.01
Notes:
1. A value preceded by “<” is less than the decision level concentration. Average values preceded by “<” contain at least
one value that is less than the decision level concentration. The (±) value provides the 95% confidence interval for the
value.
2. The DCS for gross alpha and gross beta radioactivity is based on the most restrictive radionuclide possibly present in
measurable quantities as a result of Knolls Laboratory operations.
3. Monthly samples are composited and analyzed quarterly.
4. Samples may not be obtained every month due to dry or frozen conditions.
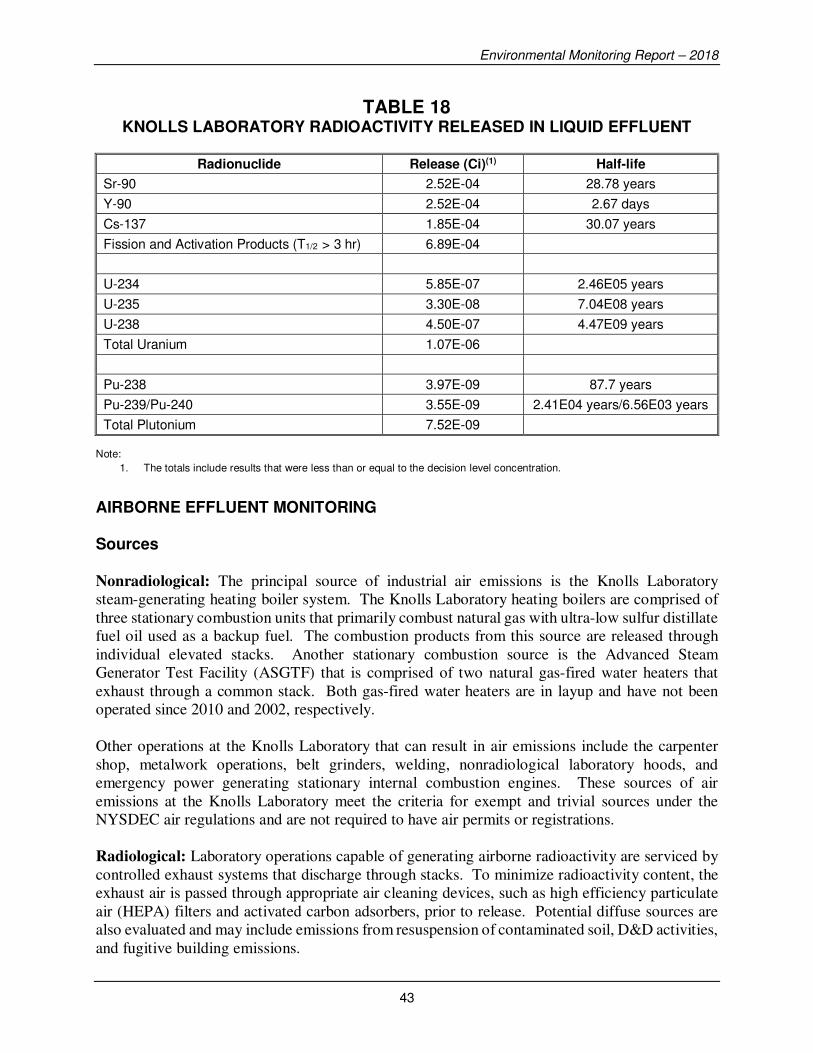
Environmental Monitoring Report – 2018
43
TABLE 18 KNOLLS LABORATORY RADIOACTIVITY RELEASED IN LIQUID EFFLUENT
Radionuclide Release (Ci)(1) Half-life
Sr-90 2.52E-04 28.78 years
Y-90 2.52E-04 2.67 days
Cs-137 1.85E-04 30.07 years
Fission and Activation Products (T1/2 > 3 hr) 6.89E-04
U-234 5.85E-07 2.46E05 years
U-235 3.30E-08 7.04E08 years
U-238 4.50E-07 4.47E09 years
Total Uranium 1.07E-06
Pu-238 3.97E-09 87.7 years
Pu-239/Pu-240 3.55E-09 2.41E04 years/6.56E03 years
Total Plutonium 7.52E-09 Note:
1. The totals include results that were less than or equal to the decision level concentration.
AIRBORNE EFFLUENT MONITORING Sources Nonradiological: The principal source of industrial air emissions is the Knolls Laboratory
steam-generating heating boiler system. The Knolls Laboratory heating boilers are comprised of
three stationary combustion units that primarily combust natural gas with ultra-low sulfur distillate
fuel oil used as a backup fuel. The combustion products from this source are released through
individual elevated stacks. Another stationary combustion source is the Advanced Steam
Generator Test Facility (ASGTF) that is comprised of two natural gas-fired water heaters that
exhaust through a common stack. Both gas-fired water heaters are in layup and have not been
operated since 2010 and 2002, respectively.
Other operations at the Knolls Laboratory that can result in air emissions include the carpenter
shop, metalwork operations, belt grinders, welding, nonradiological laboratory hoods, and
emergency power generating stationary internal combustion engines. These sources of air
emissions at the Knolls Laboratory meet the criteria for exempt and trivial sources under the
NYSDEC air regulations and are not required to have air permits or registrations.
Radiological: Laboratory operations capable of generating airborne radioactivity are serviced by
controlled exhaust systems that discharge through stacks. To minimize radioactivity content, the
exhaust air is passed through appropriate air cleaning devices, such as high efficiency particulate
air (HEPA) filters and activated carbon adsorbers, prior to release. Potential diffuse sources are
also evaluated and may include emissions from resuspension of contaminated soil, D&D activities,
and fugitive building emissions.

Environmental Monitoring Report – 2018
44
Effluent Monitoring Nonradiological: The Knolls Laboratory originally had two nonradiological air emission permits,
one for the heating boilers and one for the ASGTF. Effective December 7, 2009, the permits for
these two air emission sources were consolidated under an Air State Facility Permit (Mod 2). This
permit limits carbon monoxide and sulfur dioxide emissions from the heating boilers based on fuel
usage. The New York State emission standards for stationary combustion installations are listed
in Reference (7). Under the terms of the permit for these emission sources, direct emission
monitoring is not required. The quantities of pollutants released are estimated based on the
quantity and type of fuel burned multiplied by the appropriate EPA approved emission factors. In
January 2010, the Knolls Laboratory was granted a modification to the Air State Facility Permit
(Mod 4), listed in Table 6, to consolidate the reporting dates for certain regulatory submittals listed
in the permit.
The NYSDEC regulations do not require air emission permits for exempt and trivial activities. In
general, exempt and trivial activities do not require emissions monitoring; although some activities
may require monitoring of run times, installation and maintenance of air quality control equipment,
or limiting source material usage to maintain their exempt status.
Radiological: Airborne effluents from the main radiological emission points are continuously
sampled for particulate radioactivity with particulate filter samplers and with activated charcoal
cartridge samplers where iodine or antimony may be present. Exhaust systems servicing major
facilities are also continuously monitored for particulate, iodine, and noble gas radioactivity. The
monitors continuously record radioactivity levels in the effluents and are equipped with alarm
functions to provide an alert should an abnormal level occur. Other minor radiological emission
points are evaluated for the potential for release and monitored on a periodic basis, as necessary,
to confirm the low emissions.
Effluent Analyses Radiological: Particulate filters and activated charcoal cartridges are changed and analyzed on a
routine basis. Particulate filters are analyzed by direct counting for gross alpha and beta
radioactivity using a sensitive low-background gas proportional counting system. The system
provides decision level concentrations for alpha and beta radioactivity of approximately
1 x 10-15 µCi/ml and 5 x 10-15 µCi/ml, respectively. The activated charcoal cartridges are analyzed
for iodine-131 and antimony-125 by gamma spectrometry, which provides decision level
concentrations of approximately 2 x 10-14 µCi/ml and 1 x 10- 13 µCi/ml, respectively. Noble gas
radioactivity released is calculated based on integration of recorded data from a continuous noble
gas monitor.
Environmental Monitoring Report – 2018
45
Assessment
Nonradiological: The heating boiler operations at the Knolls Laboratory are "capped," or limited,
to the following conditions under the Air State Facility Permit (Mod 4) issued by NYSDEC:
1. A maximum heat input of 162.4 billion British Thermal Units (BTUs) during any 12-month
period;
2. The quantity of fuel used during any 12-month period shall not exceed 159.2 million
standard cubic feet (SCF) of natural gas or 1.16 million gallons of distillate fuel oil or any
combination of the two, not to exceed condition 1 above;
3. Annual emissions of the following contaminants are capped as follows:
Carbon monoxide (CO) – 13,370 pounds per year
Sulfur dioxide (SO2) – 82,360 pounds per year;
4. The sulfur content of any fuel oil burned shall not exceed 0.5 percent by weight, and the fuel
oil must conform to the specifications for distillate fuel oil per American Society for Testing
and Materials (ASTM) D396-78, as amended; and
5. The annual capping period will run from the first working day in September to the first
working day in September of the following year with the Annual Capping Certification due
by September 30 each year.
The ASGTF hot water heater operations are not capped under the Air State Facility Permit (Mod
4) (ASFP). Fuel oil supplier certification statements and/or applicable fuel oil analyses for
distillate fuel oil are maintained to confirm that the fuel oil burned in the Knolls Laboratory heating
boilers contained less than 0.5 percent sulfur by weight and conforms to the ASTM Standards for
distillate fuel oil. Semi-annual reports demonstrating compliance with the fuel oil sulfur limitation
are sent to both the EPA and NYSDEC. Under current NYSDEC regulations, the sulfur content
of fuel oil is limited to 0.0015 percent sulfur by weight. Although the EPA and the ASFP require
the combustion of fuel oil with a sulfur content of less than 0.5 perent sulfur, the Knolls Laboratory
complies with the more stringent NYSDEC regulatory requirement that fuel oils contain no more
than 0.0015 percent sulfur by weight.
Compliance with the capping requirements is determined by calculations using fuel usage records
each year, and an annual capping certification statement is sent to NYSDEC. Although the
emissions from the operation of Air Emission Point EP-00030, ASTGF, are not capped, the
emissions from this facility are included in the capping certification for information.
The Knolls Laboratory heating boilers continue to operate within the capped operating and
emission limits established by NYSDEC in the Knolls Laboratory’s ASFP for the boilers.
In May 2011, the Knolls Laboratory opted to operate their heating boilers as gas-fired boilers under
40 CFR 63 Subpart JJJJJJ – National Emission Standards for Hazardous Air Pollutants for
Industrial, Commercial, and Institutional Boilers located at Area Sources of Hazardous Air
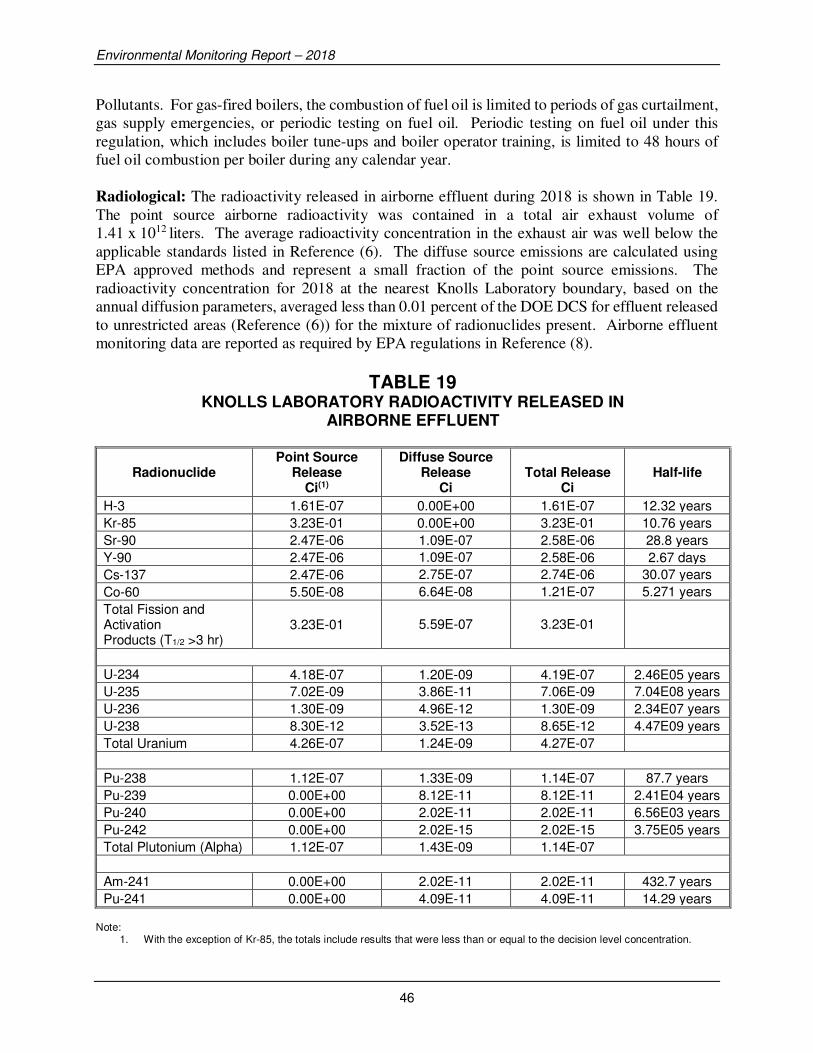
Environmental Monitoring Report – 2018
46
Pollutants. For gas-fired boilers, the combustion of fuel oil is limited to periods of gas curtailment,
gas supply emergencies, or periodic testing on fuel oil. Periodic testing on fuel oil under this
regulation, which includes boiler tune-ups and boiler operator training, is limited to 48 hours of
fuel oil combustion per boiler during any calendar year.
Radiological: The radioactivity released in airborne effluent during 2018 is shown in Table 19.
The point source airborne radioactivity was contained in a total air exhaust volume of
1.41 x 10¹² liters. The average radioactivity concentration in the exhaust air was well below the
applicable standards listed in Reference (6). The diffuse source emissions are calculated using
EPA approved methods and represent a small fraction of the point source emissions. The
radioactivity concentration for 2018 at the nearest Knolls Laboratory boundary, based on the
annual diffusion parameters, averaged less than 0.01 percent of the DOE DCS for effluent released
to unrestricted areas (Reference (6)) for the mixture of radionuclides present. Airborne effluent
monitoring data are reported as required by EPA regulations in Reference (8).
TABLE 19 KNOLLS LABORATORY RADIOACTIVITY RELEASED IN
AIRBORNE EFFLUENT
Radionuclide Point Source
Release Ci(1)
Diffuse Source Release
Ci Total Release
Ci Half-life
H-3 1.61E-07 0.00E+00 1.61E-07 12.32 years
Kr-85 3.23E-01 0.00E+00 3.23E-01 10.76 years
Sr-90 2.47E-06 1.09E-07 2.58E-06 28.8 years
Y-90 2.47E-06 1.09E-07 2.58E-06 2.67 days
Cs-137 2.47E-06 2.75E-07 2.74E-06 30.07 years
Co-60 5.50E-08 6.64E-08 1.21E-07 5.271 years
Total Fission and Activation Products (T1/2 >3 hr)
3.23E-01 5.59E-07 3.23E-01
U-234 4.18E-07 1.20E-09 4.19E-07 2.46E05 years
U-235 7.02E-09 3.86E-11 7.06E-09 7.04E08 years
U-236 1.30E-09 4.96E-12 1.30E-09 2.34E07 years
U-238 8.30E-12 3.52E-13 8.65E-12 4.47E09 years
Total Uranium 4.26E-07 1.24E-09 4.27E-07
Pu-238 1.12E-07 1.33E-09 1.14E-07 87.7 years
Pu-239 0.00E+00 8.12E-11 8.12E-11 2.41E04 years
Pu-240 0.00E+00 2.02E-11 2.02E-11 6.56E03 years
Pu-242 0.00E+00 2.02E-15 2.02E-15 3.75E05 years
Total Plutonium (Alpha) 1.12E-07 1.43E-09 1.14E-07
Am-241 0.00E+00 2.02E-11 2.02E-11 432.7 years
Pu-241 0.00E+00 4.09E-11 4.09E-11 14.29 years Note:
1. With the exception of Kr-85, the totals include results that were less than or equal to the decision level concentration.

Environmental Monitoring Report – 2018
47
ENVIRONMENTAL MONITORING Scope
Nonradiological: The Knolls Laboratory nonradiological environmental monitoring program
consists of routine surface water and groundwater sampling. Surface water is sampled for water
quality at the following locations: Mohawk River upstream and downstream from the Knolls
Laboratory outfalls, the Midline Stream near the point of entry to the Mohawk River, the West
Boundary Stream Ditch, and the East Boundary Stream upstream and downstream of the closed
landfill. The West Boundary Stream Ditch sample point is on Knolls Laboratory property, prior
to where the ditch enters the West Boundary Stream on the General Electric Global Research
Center property. The West Boundary Stream Ditch enters the Mohawk River upstream from the
Knolls Laboratory. Required analytical surface water parameters are discussed later in this report.
Stream sample points are shown in Figure 2.
The Knolls Laboratory contains a permanently capped landfill that covers an area of approximately
3.7 acres on the east side of the site. The landfill was officially closed in October 1993. The
groundwater and surface water surrounding the closed landfill is routinely monitored and the
results are reported to NYSDEC in compliance with Reference (9). A revised Post-Closure
Monitoring and Maintenance Manual (PCMMM) requesting a reduction in sampling and
monitoring frequency was approved by NYSDEC in September 2018. Quarterly landfill
inspections were conducted up through the third quarter 2018, and no degradation in the cap was
identified. Routine landfill maintenance was performed to ensure continued integrity of the
landfill cap and associated cover. In accordance with a NYSDEC-approved RCRA Corrective
Action groundwater monitoring plan, quarterly groundwater monitoring is performed at the former
electrical High Yard Area to assess the effectiveness of a soil remediation project. The results of
the groundwater monitoring are reported to NYSDEC annually. Groundwater is also monitored
by other groundwater monitoring wells located throughout the Knolls Laboratory. Knolls
Laboratory groundwater data are discussed separately later in this report.
Radiological: The Knolls Laboratory radiological environmental monitoring program includes:
a) the routine collection and analysis of samples of Mohawk River water, sediment, and fish;
surface water streams; groundwater; and local municipal waters; and b) the continuous sampling
of air at stations located in the predominant upwind and downwind directions from the Knolls
Laboratory.
Mohawk River water and bottom sediment samples are collected for radioactivity analyses at
locations upstream and downstream from the main Knolls Laboratory outfall as shown in Figure 3.
Samples are collected during each of three (3) calendar quarters; ice coverage and/or winter
weather prevents sampling during the first calendar quarter. A Birge-Ekman dredge, which
samples an area of approximately 15 cm x 15 cm to an average depth of 2.5 cm, is used for the
collection of sediment samples. In addition, bottom feeding fish and recreational sport fish are
collected from the Mohawk River upstream and downstream from the main Knolls Laboratory
outfall for gamma spectrometry and radiochemical analyses.

Environmental Monitoring Report – 2018
48
Surface water is also sampled monthly for radioactivity at the Midline Stream near the point of
entry to the Mohawk River, the West Boundary Stream Ditch, and the East Boundary Stream
upstream and downstream of the closed landfill, and the West Landfill Stream. Perimeter radiation
levels are continuously monitored with thermoluminescent dosimeters (TLDs) and are discussed
separately, later in this report in the Radiation Monitoring section. Groundwater wells are sampled
annually for radioactivity and are discussed separately in the Groundwater Monitoring section of
this report.
FIGURE 3
KNOLLS LABORATORY, NISKAYUNA, NEW YORK MOHAWK RIVER SAMPLING LOCATIONS
Environmental Monitoring Report – 2018
49
The municipal water systems servicing the area surrounding the Knolls Laboratory are those of
Schenectady, Niskayuna, and Latham/Colonie, New York. Supply wells for the Schenectady and
Niskayuna systems are located upstream and downstream, respectively, from the Knolls
Laboratory. Although there is no direct mechanism for Knolls Laboratory effluent to enter the
water supplies, samples are collected monthly from the Schenectady and Niskayuna municipal
water systems. A monthly sample is also collected from the Latham/Colonie municipal water
system that obtains a portion of its water from the Mohawk River. Monthly samples are
composited quarterly and analyzed for radioactivity.
Environmental air samplers are operated in the predominant upwind and ten downwind locations
around the entire perimeter of the Knolls Laboratory to measure normal background airborne
radioactivity, and to confirm that Knolls Laboratory (including SPRU) effluents have no
measurable effect on normal background airborne radioactivity levels.
Analyses
Nonradiological: The water samples collected from the Mohawk River and the three main surface
water streams are analyzed for the constituents listed in Tables 13, 14, and 15. The analyses were
performed in accordance with 40 CFR Part 136 utilizing the procedures provided in Standard
Methods, Reference (10), or other EPA approved methods.
Radiological: The individual quarterly samples of Mohawk River water and quarterly composite
samples of Schenectady, Niskayuna, and Latham/Colonie municipal waters are analyzed for
gross alpha and gross beta radioactivity. The stream samples are analyzed for gross alpha and
gross beta radioactivity, and for other radionuclides as appropriate. The methods used are
described in the Effluent Analyses portion of the Liquid Effluent Monitoring section of this report.
The Mohawk River sediment samples are analyzed for uranium and plutonium alpha radioactivity
by chemical extraction with subsequent direct counting on an alpha spectrometry system, for gross
beta radioactivity by direct counting of a dried sample, and for cesium-137 and other gamma
emitting radionuclides by gamma spectrometry. Seven samples from the second quarter sample
set collected at locations upstream, opposite, and downstream from the main Knolls Laboratory
outfall (i.e., Outfall 002) are also analyzed for strontium-90 by chemical extraction and gross beta
counting. The downstream samples for strontium-90 analyses are selected from locations that
previous monitoring had indicated would be locations of highest concentrations.
Edible portions of the fish collected from the Mohawk River are analyzed for gamma emitting
radionuclides with a high purity germanium spectrometer system, for strontium-90 by chemical
extraction and beta counting, and for plutonium by chemical separation followed by alpha
spectrometry.
The environmental air sample filters are changed on a routine basis and analyzed by direct counting
for gross alpha and gross beta radioactivity using the method described in the Effluent Analyses
of the Airborne Effluent Monitoring section of this report. An environmental air sampler was
installed in May 2011 near Outfall 002 that is owned and operated by NYSDOH as a result of the
Environmental Monitoring Report – 2018
50
September 29, 2010 SPRU radiological contamination event during Building H2 demolition and
was removed by NYSDOH in July 2018.
Assessment
Nonradiological: The results of the analyses of Mohawk River water for chemical quality are
summarized in Table 13. Results of routine analyses in the West Boundary Stream Ditch and
Midline Stream are summarized in Table 14, and results for the East Boundary Stream are summa-
rized in Table 15. Analyzed parameters were generally below the New York State standards for
Class A waters for the section of the Mohawk River that borders the Knolls Laboratory. The
surface water database shows that there is no water quality degradation attributable to the Knolls
Laboratory.
Current Knolls Laboratory Operations
The Midline Stream has the potential to be influenced by runoff from the east side of the Knolls
Laboratory. The West Boundary Stream Ditch captures runoff from an on-site road. Therefore,
the Knolls Laboratory SPDES Permit requires the stormwater for these areas to be monitored.
Additional voluntary monitoring is also performed and is presented in Tables 13, 14, and 15. The
State water quality standard for chloride was exceeded in West Boundary Stream Ditch, Midline
Stream, and East Boundary Stream. The high chloride results for all streams were attributed to
winter road salting and snow/ice removal operations.
Voluntary surface water monitoring is also performed for other parameters at these locations to
supplement the regulatory required SPDES and landfill post-closure monitoring activities. The
data from samples analyzed during 2018 continued to indicate there is no adverse impact from
current Knolls Laboratory operations on the Mohawk River or the closed landfill on the
surrounding surface water streams. Instances where surface water standards or guidance values
have been exceeded are discussed below.
Surface Water near the Closed Landfill
The former Knolls Laboratory landfill (permanently closed and capped in 1993) is bordered by the
East Boundary Stream, the West Landfill Stream (which is frequently dry), and the Mohawk River
to the north. Sample data for the East Boundary Stream is presented in Table 15. The East Bound-
ary Stream upstream and downstream locations were sampled concurrently with landfill post-
closure monitoring activities.
Sufficient water was not present in the West Landfill Stream during the second quarter 2018
sampling event, and the requirement to sample the West Landfill Stream was removed from the
Landfill Post-Closure Monitoring Program in September 2018.
The Mohawk River and East Boundary Stream data, as previously discussed, do not indicate any
measurable impact from the former landfill.
Environmental Monitoring Report – 2018
51
Radiological: Results of the radioactivity analyses performed on samples of Mohawk River and
municipal waters are summarized in Table 20. The results for the gross alpha and gross beta
radioactivity concentrations show no significant difference between river water samples upstream
and downstream from the Knolls Laboratory or in Schenectady, Niskayuna, and Latham/Colonie
municipal waters.
The results of radioactivity measurements for gross beta, strontium-90, cesium-137, plutonium,
and uranium in Mohawk River bottom sediment samples are summarized in Table 21. The 2018
data shows no significant differences between upstream and downstream radioactivity
concentrations for gross beta, strontium-90, cesium-137, plutonium, and uranium. Historically,
slightly higher concentrations of radioactivity have occasionally been measured in samples
collected from locations within one thousand feet downstream from the main Knolls Laboratory
outfall. This localized concentration of radioactivity is attributed to operations conducted prior to
1964, when the facility was subject to applicable Federal regulations and State and local
agreements through the Mohawk River Advisory Committee that permitted limited amounts of
radioactivity to be released to the Mohawk River. These low levels of radioactivity in the river
sediment do not present a health risk since the radioactivity is deposited as bottom sediment, which
is not subject to becoming airborne and is unlikely to interact with the aquatic environment.
Additional detail regarding the low level of radioactivity in the Mohawk River is discussed in the
Special Mohawk River Surveys section, later in this report.
The results of the detailed gamma spectrum analyses performed on Mohawk River bottom
sediment samples also indicated the expected low levels of potassium-40 and daughters of uranium
and thorium. The potassium-40 and daughters of uranium and thorium are naturally-occurring
radionuclides. No detectable cobalt-60 was found in any of the samples. However, localized low
levels of cobalt-60, attributable to operations prior to 1964, have been observed occasionally in
past river sediment samples.
The analytical results for the fish collected from the Mohawk River are summarized in Tables 22
and 23. The results indicate the presence of naturally occurring potassium-40. The results of
sensitive analyses for strontium-90 and plutonium indicate essentially no detectable strontium-90
or plutonium in either upstream or downstream fish. The measured concentrations of radioactivity
indicate no effect from Knolls Laboratory operations. In addition, the results of a detailed
biological survey (Reference (11)) confirm that the low levels of radioactivity in the Mohawk
River bottom sediment near the main Knolls Laboratory outfall (Outfall 002) are not taken up and
propagated through the food chain.
The analytical results for the environmental air samples for 2018 indicate that there were no
significant differences between the average upwind and downwind radioactivity concentrations.
The average upwind gross alpha and gross beta radioactivity concentrations were
8.7 x 10⁻¹⁶ µCi/ml and 1.5 x 10⁻¹⁴ µCi/ml, respectively. The average downwind gross alpha and
gross beta radioactivity concentrations were 8.9 x 10⁻¹⁶ µCi/ml and 1.6 x 10⁻¹⁴ µCi/ml, respectively.
Gamma spectrometry analyses performed on the environmental air samples indicated only
background quantities of naturally occurring radionuclides with the exception for the third quarter
of 2018. The gamma spectroscopy of the composite of all the third quarter 2018 downwind
perimeter weekly air filters together showed a positive indication of 1.6 pCi of Cs-137 from
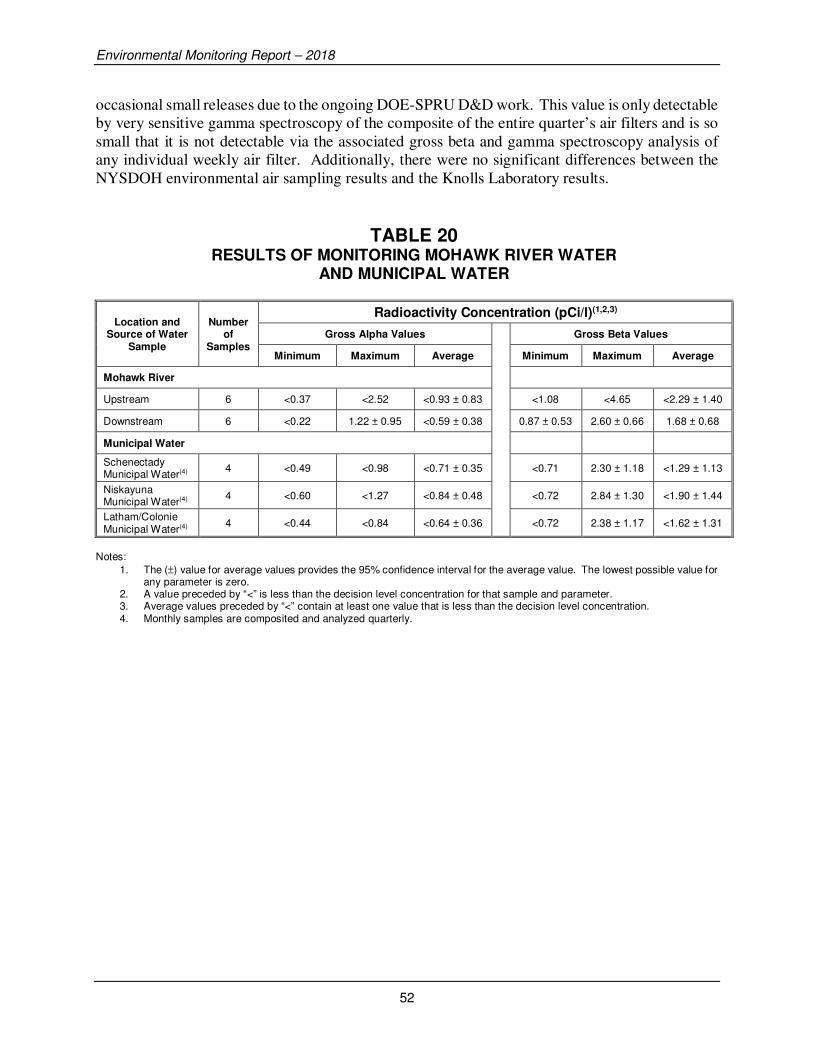
Environmental Monitoring Report – 2018
52
occasional small releases due to the ongoing DOE-SPRU D&D work. This value is only detectable
by very sensitive gamma spectroscopy of the composite of the entire quarter’s air filters and is so
small that it is not detectable via the associated gross beta and gamma spectroscopy analysis of
any individual weekly air filter. Additionally, there were no significant differences between the
NYSDOH environmental air sampling results and the Knolls Laboratory results.
TABLE 20 RESULTS OF MONITORING MOHAWK RIVER WATER
AND MUNICIPAL WATER
Location and Source of Water
Sample
Number of
Samples
Radioactivity Concentration (pCi/l)(1,2,3)
Gross Alpha Values
Gross Beta Values
Minimum Maximum Average Minimum Maximum Average
Mohawk River
Upstream 6 <0.37 <2.52 <0.93 ± 0.83
<1.08 <4.65 <2.29 ± 1.40
Downstream 6 <0.22 1.22 ± 0.95 <0.59 ± 0.38 0.87 ± 0.53 2.60 ± 0.66 1.68 ± 0.68
Municipal Water
Schenectady Municipal Water(4) 4 <0.49 <0.98 <0.71 ± 0.35 <0.71 2.30 ± 1.18 <1.29 ± 1.13
Niskayuna Municipal Water(4) 4 <0.60 <1.27 <0.84 ± 0.48 <0.72 2.84 ± 1.30 <1.90 ± 1.44
Latham/Colonie Municipal Water(4) 4 <0.44 <0.84 <0.64 ± 0.36 <0.72 2.38 ± 1.17 <1.62 ± 1.31
Notes:
1. The (±) value for average values provides the 95% confidence interval for the average value. The lowest possible value for any parameter is zero.
2. A value preceded by “<” is less than the decision level concentration for that sample and parameter. 3. Average values preceded by “<” contain at least one value that is less than the decision level concentration. 4. Monthly samples are composited and analyzed quarterly.
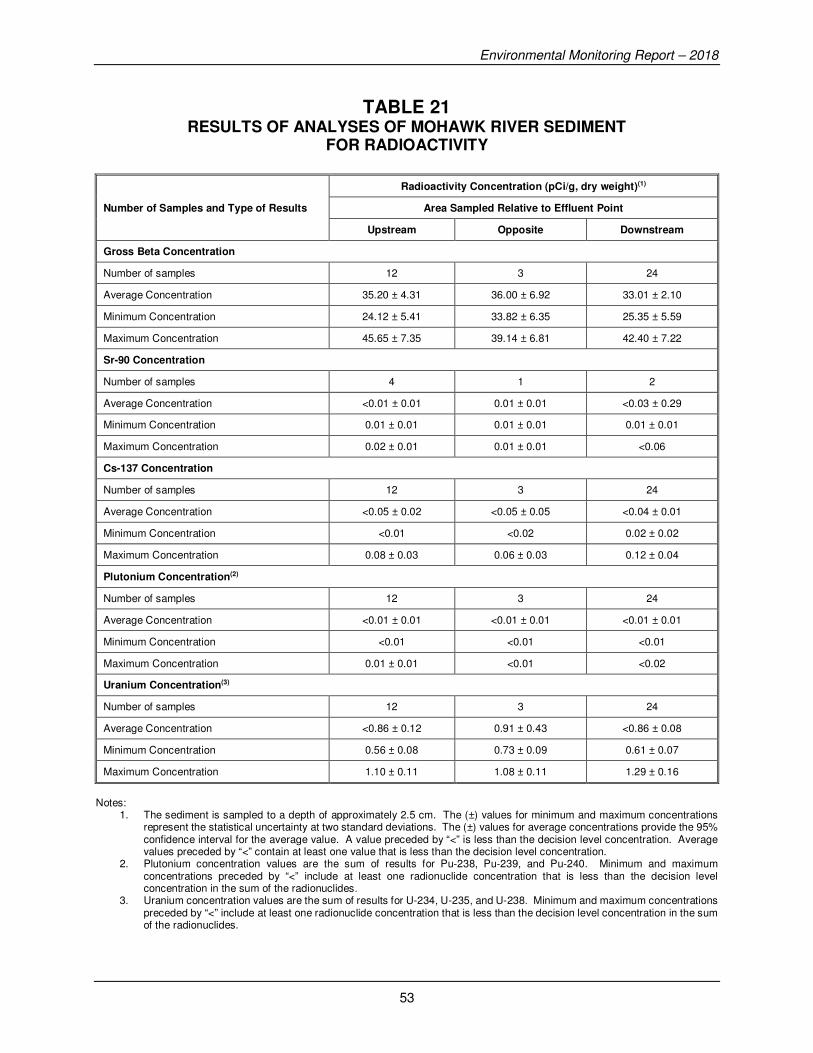
Environmental Monitoring Report – 2018
53
TABLE 21 RESULTS OF ANALYSES OF MOHAWK RIVER SEDIMENT
FOR RADIOACTIVITY
Number of Samples and Type of Results
Radioactivity Concentration (pCi/g, dry weight)(1)
Area Sampled Relative to Effluent Point
Upstream Opposite Downstream
Gross Beta Concentration
Number of samples 12 3 24
Average Concentration 35.20 ± 4.31 36.00 ± 6.92 33.01 ± 2.10
Minimum Concentration 24.12 ± 5.41 33.82 ± 6.35 25.35 ± 5.59
Maximum Concentration 45.65 ± 7.35 39.14 ± 6.81 42.40 ± 7.22
Sr-90 Concentration
Number of samples 4 1 2
Average Concentration <0.01 ± 0.01 0.01 ± 0.01 <0.03 ± 0.29
Minimum Concentration 0.01 ± 0.01 0.01 ± 0.01 0.01 ± 0.01
Maximum Concentration 0.02 ± 0.01 0.01 ± 0.01 <0.06
Cs-137 Concentration
Number of samples 12 3 24
Average Concentration <0.05 ± 0.02 <0.05 ± 0.05 <0.04 ± 0.01
Minimum Concentration <0.01 <0.02 0.02 ± 0.02
Maximum Concentration 0.08 ± 0.03 0.06 ± 0.03 0.12 ± 0.04
Plutonium Concentration(2)
Number of samples 12 3 24
Average Concentration <0.01 ± 0.01 <0.01 ± 0.01 <0.01 ± 0.01
Minimum Concentration <0.01 <0.01 <0.01
Maximum Concentration 0.01 ± 0.01 <0.01 <0.02
Uranium Concentration(3)
Number of samples 12 3 24
Average Concentration <0.86 ± 0.12 0.91 ± 0.43 <0.86 ± 0.08
Minimum Concentration 0.56 ± 0.08 0.73 ± 0.09 0.61 ± 0.07
Maximum Concentration 1.10 ± 0.11 1.08 ± 0.11 1.29 ± 0.16
Notes:
1. The sediment is sampled to a depth of approximately 2.5 cm. The (±) values for minimum and maximum concentrations represent the statistical uncertainty at two standard deviations. The (±) values for average concentrations provide the 95% confidence interval for the average value. A value preceded by “<” is less than the decision level concentration. Average values preceded by “<” contain at least one value that is less than the decision level concentration.
2. Plutonium concentration values are the sum of results for Pu-238, Pu-239, and Pu-240. Minimum and maximum concentrations preceded by “<” include at least one radionuclide concentration that is less than the decision level concentration in the sum of the radionuclides.
3. Uranium concentration values are the sum of results for U-234, U-235, and U-238. Minimum and maximum concentrations preceded by “<” include at least one radionuclide concentration that is less than the decision level concentration in the sum of the radionuclides.

Environmental Monitoring Report – 2018
54
TABLE 22 GAMMA SPECTROMETRY RESULTS FOR MOHAWK RIVER FISH
Sample Location(2)
Fish Type Number of Samples
Radioactivity Concentrations (pCi/g, wet weight)(1)
K-40
Cs-137
Maximum Average Maximum Average
Upstream Carp Shorthead Redhorse Sucker
3 4.35 ± 0.45 3.38 ± 2.15 <0.01 <0.01 ± 0.01
Upstream Smallmouth Bass Northern Pike
2 3.53 ± 0.36 3.27 ± 3.24 <0.01 <0.01 ± 0.01
Downstream Carp Brown Bullhead
4 3.77 ± 0.48 2.98 ± 0.85 <0.01 <0.01 ± 0.01
Downstream Walleye Smallmouth Bass
2 3.51 ± 0.35 3.40 ± 1.51 <0.01 <0.01 ± 0.01
Notes:
1. A value preceded by “<” is less than the decision level concentration for that sample and parameter. Average values preceded by “<” contain at least one value that is less than the decision level concentration. The (±) value provides the statistical uncertainty at the 95% confidence interval.
2. Upstream samples were obtained above Lock 8 and below Lock 9. (Lock 8 and Lock 9 are located approximately 9 miles and 14 miles, upstream respectively, from the Knolls Laboratory Outfall 002). Downstream samples were obtained between the Knolls Laboratory Outfall 002 and Lock 7.
TABLE 23 RADIOCHEMICAL ANALYSIS RESULTS FOR MOHAWK RIVER FISH
Sample Location(2) Fish Type Radioactivity Concentration (pCi/g wet weight)(1)
Sr-90 Plutonium(3)
Upstream Carp 0.005 ± 0.004 <0.001
Upstream Shorthead Redhorse 0.002 ± 0.003 <0.001
Upstream Northern Pike 0.003 ± 0.004 <0.001
Downstream Smallmouth Bass <0.003 <0.001
Downstream Walleye <0.003 <0.001
Downstream Carp <0.003 <0.001 Notes:
1. A value preceded by “<” is less than the decision level concentration for that sample and parameter. The (±) value provides the statistical uncertainty at the 95% confidence interval.
2. Upstream samples were obtained above Lock 8 and below Lock 9. (Lock 8 and Lock 9 are located approximately 9 miles and 14 miles, upstream respectively, from the Knolls Laboratory Outfall 002.) Downstream samples were obtained between the Knolls Laboratory Outfall 002 and Lock 7.
3. Plutonium concentration values are the sum of results for Pu-238, Pu-239, and Pu-240.
Environmental Monitoring Report – 2018
55
Special Mohawk River Surveys
The Knolls Laboratory conducted an extensive sediment and biological sampling program of the
Mohawk River during the summer of 1992 and again during the summer of 2002. These sampling
programs were performed to update information on the quantity and distribution of radioactivity
in the river sediment attributable to Knolls Laboratory operations prior to 1964 and to demonstrate
that the residual radioactivity has no adverse effect on human health or the environment. Samples
included numerous sediment core samples and various samples of fish, macrophyton, periphyton,
plankton, benthic macroinvertebrates, and water. NYSDEC participated in the 2002 survey by
observing the Knolls Laboratory sampling on the Mohawk River and splitting select core samples
for independent analysis. The Knolls Laboratory also conducted a special sampling program
consisting of only sediment core samples in 1981.
The results of the 1992 and 2002 sampling programs, as discussed in References (12) and (13),
respectively, show that the distribution of residual radioactivity in the Mohawk River sediment in
the vicinity of the Knolls Laboratory is well understood. The majority of radioactivity present is
confined to an area along the south side of the Mohawk River, which extends from the Knolls
Laboratory Outfall 002 to 1,000 feet downstream. The radioactivity generally is located at least
8 inches below the top of the sediment surface. Radioactivity concentrations above background
levels are also detectable further downstream; however, the concentrations are lower, and the
radioactivity is located even deeper in the sediment. Comparison of the 2002 sediment sampling
results with those from 1992 and to those obtained from the similar survey done in 1981 shows
that the 2002 results are similar to the 1992 results, though generally are lower than the 1981
results. The residual radioactivity remains deeper in the sediment than when surveyed in 1981,
due to deposition of new sediment in the outfall area. Additionally, the NYSDEC split sample
results for the 2002 survey were in very good agreement with the Knolls Laboratory sample results.
A comparison was made between the total amount of residual radioactivity of Knolls Laboratory
origin estimated to be present in the sediment above the Lock 7 dam for the 1981, 1992, and
2002 surveys. Though below the results from 1981 (with correction for radioactive decay), the
2002 survey results are not significantly different than the results obtained in 1992. The total
radioactivity of Knolls Laboratory origin present in the sediment above the Lock 7 dam is
considered to be the same as estimated from the 1992 study: less than 0.65 Ci, of which 90% is
attributable to cesium-137 and strontium-90 (and its short-lived daughter product yttrium-90). For
perspective, the total radioactivity of Knolls Laboratory origin present in the sediment is less than
10% of the naturally occurring radioactivity found in the sediment in the same region.
The results of the fish and other biological sampling conducted show no detectable radioactivity
of Knolls Laboratory origin above weapons testing fallout levels in any biological sample. These
results continue to demonstrate that the residual radioactivity in the sediment is not being taken up
in the food chain.
A radiological assessment of the residual radioactivity in the sediment concludes that, even using
very conservative assumptions and hypothetical scenarios, no measurable dose to a member of the
public would result, even if all of the radioactivity in the sediment were released back into the river
water. The major conclusion of the radiological assessment is that the radioactivity of Knolls
Laboratory origin continues to have no adverse effect on human health or the environment.

Environmental Monitoring Report – 2018
56
RADIATION MONITORING
The purpose of the environmental radiation monitoring program is to measure the ambient
radiation levels around the Knolls Laboratory to confirm that operations have not altered the
natural radiation background levels at the Knolls Laboratory perimeter. The sources of radiation
at the Knolls Laboratory are from small specimens of irradiated and non-irradiated materials and
from residual radioactivity remaining in facilities from historical operations.
TABLE 24
PERIMETER AND OFF-SITE RADIATION MONITORING RESULTS, KNOLLS LABORATORY (INCLUDING SPRU)
Monitoring Location(1)
Total Annual Exposure(2)
(millirem)
1 73 ± 4
2 68 ± 2
3 72 ± 3
4 81 ± 3
5 82 ± 3
6 72 ± 3
7 80 ± 2
8 75 ± 2
9 68 ± 2
10 67 ± 2
11 75 ± 3
12 70 ± 2
13 65 ± 2
14 70 ± 4
15 76 ± 3
16 71 ± 2
Off-Site Locations 67 ± 24(3)
Notes:
1. See Figure 2 for perimeter monitoring locations. 2. The (±) values for individual locations provide the 95% confidence interval for the exposure due to
random uncertainty. 3. Approximately 95% of off-site natural background measurements are expected to be within this
range.
Scope Environmental radiation levels were monitored at the perimeter of the Knolls Laboratory with a
network of standard DT-702/PD lithium fluoride TLDs. The sixteen locations of the Knolls
Laboratory perimeter TLD monitors are shown in Figure 2. Two new temporary perimeter TLD
locations were added to monitor the relocation of the SPRU project TRU waste temporary storage
at the end of 2018. Locations T18 and T19 were installed on November 27, 2018 at the start of
Environmental Monitoring Report – 2018
57
the first quarter 2019 monitoring period. These results will be reported in the 2019 Environmental
Monitoring Report.
Control TLD monitors were also posted at remote off-site locations to measure the natural
background levels typical of the surrounding area. All TLD monitors were posted for quarterly
exposure periods.
Analyses
The environmental TLDs were calibrated to a cesium-137 standard source. The TLD radiation
exposures were measured quarterly utilizing an automated TLD readout system, which was
calibrated prior to the processing of the TLDs.
Assessment
The results for the Knolls Laboratory perimeter and off-site radiation monitoring locations are
summarized in Table 24. The average of the total annual exposures for each perimeter location is
within the expected distribution of the off-site measurements at the 95% confidence interval. This
shows that Knolls Laboratory operations in 2018 had no significant effect on natural background
radiation levels at the Knolls Laboratory perimeter.
GROUNDWATER MONITORING Scope
The Knolls Laboratory groundwater monitoring program includes routine monitoring of the closed
Knolls Laboratory landfill, monitoring of localized areas as part of the RCRA Corrective Action
program, and voluntary monitoring across the site.
Groundwater from 32 monitoring wells was sampled and analyzed for chemical quality and/or
radioactivity in 2018. Sampling and analysis of fifteen groundwater monitoring wells is required
by State regulations or agreements. Five wells (NTH-1A, NTH-2A, NTH-5A, W-11, and W-12)
are associated with post-closure landfill groundwater monitoring. Three wells (SW-10, DW-09R,
and B-6) are remediation assessment wells associated with evaluating the effectiveness of a soil
remediation project in the former D3/D4 Yard area. Seven wells (MW-6R, MW-7, MW-8, MW-9,
MW-10, MW-11, and MW-12) are remediation assessment wells associated with evaluating the
effectiveness of a soil remediation project in the former electrical High Yard Area. The remaining
groundwater monitoring wells were voluntarily monitored by the Knolls Laboratory. Figure 2 is
a map showing the locations of the Knolls Laboratory monitoring wells and the location of the
former High Yard Area. The locations of the former High Yard Area groundwater monitoring
wells are shown on Figure 4.
Sources
Nonradiological: Generally, groundwater underlying the Knolls Laboratory is contained in highly
impermeable and nonporous soil and bedrock. As a consequence, there is only slight movement
of the water, generally believed to be toward the northeast, to the Mohawk River. Due to the

Environmental Monitoring Report – 2018
58
impermeable and nonporous nature of the soil and bedrock, there is no commercial or public
development of the groundwater in the vicinity of the Knolls Laboratory. Groundwater contami-
nants can be introduced through two possible routes. The first route, surface recharging, carries
atmospheric contaminants such as acid rain and airborne radioactivity from natural and manmade
sources (such as past nuclear weapons testing), and surface contaminants from operational and
historical land use (such as de-icing compounds, fertilizers, and pesticides). The second route is
leaching of shallow nonradioactive buried wastes in the closed Knolls Laboratory landfill and other
burial areas in the vicinity of the landfill where small amounts of waste chemicals from laboratory
operations were buried many years ago, consistent with common industrial practices at the time.
Radiological: In some areas of the Knolls Laboratory, the soil contains low levels of radioactivity
from operations over 55 years ago that is detectable above background levels. This has resulted
in low levels of radioactivity in some of the on-site groundwater wells.
Analyses
Nonradiological: During 2018, the landfill wells and the D3/D4 Yard remediation assessment
wells were sampled once, in accordance with regulatory agency (NYSDEC) agreements. The
remaining wells were also sampled once during 2018. The former High Yard Area wells were
sampled quarterly in 2018, in accordance with a NYSDEC-approved RCRA Corrective Action
groundwater monitoring plan.
Table 25 lists the specific analyses for each chemical parameter group (field parameters, metals,
and VOCs) for the landfill, D3/D4 Yard, and voluntary groundwater monitoring programs. For
the voluntary program, the selection of wells and parameter groups is based on the historical
groundwater monitoring program results, site operational history, well locations, and subsurface
hydrogeological information.
As part of the NYSDEC-approved Knolls Laboratory Landfill Post-Closure Monitoring Program,
Reference (9), the Knolls Laboratory monitors five overburden wells; one upgradient (NTH-1A)
and four downgradient wells (NTH-2A, NTH-5A, W-11, and W-12). The parameters monitored
under the revised monitoring plan (approved by NYSDEC in 2018) allow for adequate
groundwater quality assessment based on the large historical database. Under a 1997 remediation
agreement with NYSDEC, five wells (SW-10, DW-09R, B-5, B-6, and B-7) were monitored
annually as part of the voluntary groundwater monitoring program to assess the effectiveness of a
soil remediation project in the former D3/D4 yard area. The soil remediation project entailed
removal of soils containing VOCs and was driven by the need to construct a building at the Knolls
Laboratory and not by an environmental concern. The agreement to monitor these wells under the
voluntary groundwater monitoring program is included in the Knolls Laboratory RCRA Permit
and addresses the RCRA Corrective Action monitoring requirement until such time that a separate
RCRA Corrective Action groundwater monitoring plan is developed and approved by NYSDEC.
Well DW-09R was damaged in 2013 during a utility relocation. The requirement to monitor well
B-7 was removed under NYSDEC agreement in April 2008 to allow for a road modification
project. Monitoring well B-7 was decommissioned during 2008, and monitoring well B-5 was
decommissioned in 2017 during the NYSDEC-approved G1-D4 Alleyway remediation project to
remove VOCs from soil and groundwater. A new groundwater monitoring plan under the RCRA

Environmental Monitoring Report – 2018
59
Corrective Action program will be developed for this area of the site as part of the G1-D4 Alleyway
remediation report. Until that time, monitoring of B-6 and SW-10 will continue.
In accordance with a NYSDEC-approved RCRA Corrective Action groundwater monitoring plan,
seven wells (MW-6R, MW-7, MW-8, MW-9, MW-10, MW-11, and MW-12) were monitored
quarterly to assess the effectiveness of a soil remediation project in the former High Yard Area.
The soil remediation project was performed in accordance with State and Federal regulatory
agency approved plans and entailed the removal of soil and debris containing VOCs and PCBs.
Post-remediation groundwater monitoring of the former High Yard Area is a requirement of the
Knolls Laboratory RCRA Permit as part of the RCRA Corrective Action program and is separate
from the voluntary groundwater monitoring program. An annual groundwater monitoring report
for the former High Yard Area is provided to NYSDEC.

Environmental Monitoring Report – 2018
60
TABLE 25
GROUNDWATER MONITORING PARAMETERS
MONITORING PARAMETER GROUPS
FIELD METALS(1) VOLATILE ORGANIC COMPOUNDS
Static Water Level Specific Conductance Temperature pH Turbidity(2)
Aluminum Antimony Arsenic Barium Beryllium Boron Cadmium Calcium Chromium (total and hexavalent) Copper Iron Lead Magnesium Manganese Mercury Nickel Potassium Selenium Silver Sodium Thallium Zinc
EPA 601: Chloromethane Bromomethane Dichlorodifluoromethane Vinyl Chloride Chloroethane Methylene Chloride Trichlorofluoromethane 1,1-Dichloroethane 1,1-Dichloroethylene trans-1,2-Dichloroethylene cis-1,2-Dichloroethylene Chloroform 1,2-Dichloroethane 1,1,1-Trichloroethane Carbon Tetrachloride Bromodichloromethane 1,2-Dichloropropane trans-1,3-Dichloropropene Trichloroethylene Dibromochloromethane 1,1,2-Trichloroethane cis-1,3-Dichloropropene Bromoform 1,1,2,2-Tetrachloroethane Tetrachloroethylene Chlorobenzene p-Dichlorobenzene m-Dichlorobenzene o-Dichlorobenzene EPA 602:(3)
Benzene Toluene Ethylbenzene Xylenes
EPA 8260(C):(4)
Acetone
Hexane
Notes:
1. Analysis of metals (unfiltered and filtered) is performed voluntarily and only in the Land Area Wells.
2. Measured in the laboratory and only for the Land Area Wells.
3. EPA 602 parameters not required at the Landfill Wells.
4. Acetone and Hexane analysis for B-6, DW-09R, and SW-10 groundwater samples is required per NYSDEC agreement.
Environmental Monitoring Report – 2018
61
All field parameters except for turbidity are measured in the field using procedures provided in
Standard Methods, Reference (10), or other EPA approved methods for analyzing chemical
parameters. The vendor analytical laboratory is New York State (NYS) Environmental Laboratory
Approval Program (ELAP) certified in potable water analyses and wastewater chemical analyses.
Radiological: The groundwater well samples are analyzed by the Knolls Laboratory for
radiological parameters using the methods described in the Effluent Analyses section of this report.
Assessment Nonradiological: Tables 26, 27, and 28 summarize the 2018 groundwater monitoring
nonradiological results. Generally, the majority of analytical results are indicative of natural
groundwater quality. Most variations in the data are attributable to natural water quality,
variability in laboratory results at or near the RL, or interference associated with groundwater
turbidity. The turbidity is the result of natural particulate materials entering the well from the
surrounding clay and silt-rich geologic materials. Turbid water samples commonly show elevated
metal results that are caused by particle mineralogy and are not indicative of dissolved, mobile
metals. Table 29 summarizes the 2018 quarterly groundwater monitoring of the former High Yard
Area.
All monitoring results are compared to the NYS groundwater standards provided in 6 NYCRR
Part 703 for class GA groundwater (Reference (1)). If no standard is provided, then the results are
compared to the Guidance Values provided in the NYS Technical and Operational Guidance Series
(1.1.1) Water Quality Standards and Guidance Values.
Landfill
The Knolls Laboratory Landfill well results are presented in Table 26. Specific conductance and
pH were consistent with past monitoring results. Overall results of field parameters for the landfill
wells are within representative ranges typical of the landfill area per Reference (14). VOCs were
not detected at or above the RL in any of the monitored Landfill wells except for the detection of
trichloroethene on June 7, 2018, in monitoring well W-12. Trichloroethene was detected at 1.4
µg/l, which is below the NYS water quality standard of 5.0 µg/l. Trichloroethene has not been
detected in any of the landfill monitoring well locations since initiation of the Post-Closure
Landfill Monitoring Plan. In accordance with the Post-Closure Landfill Monitoring Plan, the
Knolls Laboratory attempted to resample this well on numerous occasions; however, due to low
groundwater levels, monitoring well W-12 had insufficient recharge to collect a sample.
Monitoring well W-12 will be sampled in the second quarter 2019.
Land Area
The Land Area data (Table 27) show natural water quality variations, the turbidity/elevated metal
relationship, and road salting effects. Toxic metal results from all wells are less than the
corresponding groundwater standard and are attributable to natural water quality. VOCs were not
detected at or above the RL at any Land Area well locations.

Environmental Monitoring Report – 2018
62
Hillside
The Hillside groundwater monitoring consists of field parameters and VOC analysis. The field
parameter data is consistent with the effects of natural groundwater compositional variations
(Table 28). VOCs were not detected at or above the RL at any Hillside well locations. An
investigation of the Hillside revealed that the VOCs are mostly restricted to porous backfill
associated with building foundations and utility lines, and are not migrating through indigenous
soils.
Lower Level
The Lower Level wells are installed in bedrock and are sampled for field parameters and VOCs.
Field analysis data is shown in Table 28. The field data shows the effects of natural groundwater
compositional variations. The data is generally consistent with that reported previously. VOCs
were not detected at or above the RL at any Lower Level well locations.
Former High Yard Area The former High Yard Area groundwater monitoring wells are installed adjacent to and within the
former High Yard Area (Figure 4). The former High Yard Area groundwater monitoring consists
of VOC and PCB analyses. VOCs were detected in samples collected from four of the seven
monitoring wells. The results are below applicable groundwater standards. PCBs were not
detected in any of the seven wells during 2018 quarterly monitoring. A summary of detected
VOCs is provided in Table 29. The trace detections of VOCs indicate the residual effects of
contamination removed during the former High Yard Area remediation.
Radiological: Results of the groundwater monitoring for radioactivity are summarized in
Table 30. Due to SPRU work, wells KH-16, and KH-17 were not accessible and were not sampled
in 2018. Some wells had slightly higher gross beta and/or gross alpha radioactivity than the
background wells. This is attributed to slightly higher levels of dissolved naturally occurring
uranium, thorium, and their respective daughter products. Naturally occurring potassium-40
would also contribute to the gross beta radioactivity. Strontium-90 was detected above
background levels in several wells. Strontium-90 and its daughter product, yttrium-90, also
contribute to the gross beta radioactivity. All gross alpha, gross beta, and strontium-90 results
were generally within the range of previously reported values. The maximum concentration of
strontium-90, which has the most restrictive DCS of any radionuclide measured in any well, was
detected in well KH-21. The KH-21 strontium-90 concentration was less than one percent of the
DOE DCS (Reference (6)).
Conclusion
The overall conclusion of the groundwater monitoring program is that previous operations and
waste disposal practices have resulted in some small, measurable effects on the groundwater
quality in localized areas of the Knolls Laboratory. Based on upstream and downstream
monitoring of the Mohawk River, there is no detectable effect on river water quality as a result of
past or current Knolls Laboratory operations. The groundwater is limited in quantity and is not

Environmental Monitoring Report – 2018
63
used as a drinking water supply. In addition, the Knolls Laboratory is not located over any
principal or primary bedrock or overburden aquifers. Therefore, the groundwater associated with
the Knolls Laboratory does not pose any threat to public health.
TABLE 26 RESULTS OF KNOLLS LABORATORY
GROUNDWATER MONITORING OF LANDFILL WELLS
Well Sample Date Parameter
Water Level Elevation
(feet)(1)
Temperature (°C)
pH (SU) Specific
Conductance (µmhos/cm)
VOCs(2) (µg/l)
NTH-1A(3) 06/04/18 317.46 9.4 6.9 753 <1.0
NTH-2A 06/04/18 232.68 8.4 6.6 948 <1.0
NTH-5A 06/04/18 267.67 9.6 6.3 410 <1.0
NTH-5A QA Duplicate 06/04/18 NM NM NM NM <1.0
W-11 06/04/18 257.49 10.6 7.0 1,063 <1.0
W-12 06/04/18 239.21 Note (4) Note (4) Note (4) Note (4)
06/07/18 238.63 11.4 6.9 1,013 1.4
Trichloroethene
FIELD BLANK (NTH-5A) 06/04/18 NM NM NM NM <1.0
STANDARD/GUIDANCE VALUE(5) Note (6) Note (6) 6.0 – 9.0(7) Note (6) Note (8)
Notes: NM Not Measured
1. The latest site-wide topological mapping project results were used for the groundwater elevation calculations.
2. See Table 25 for a listing of the Volatile Organic Compounds (VOCs). Landfill wells are analyzed for VOCs only using EPA
Method 601. A value preceded by “<” is less than the RL.
3. Up-gradient well
4. Inadequate recharge to produce a sample to determine field parameters or VOCs.
5. New York State Quality Standards and Guidance Values (Reference (4)).
6. No standard or guidance value available.
7. Per the NYSDEC-approved Post-Closure Landfill Monitoring Plan, the acceptable pH range is 6.0 – 9.0.
8. Standards/Guidance Values vary between 0.4 µg/l and 50 µg/l.
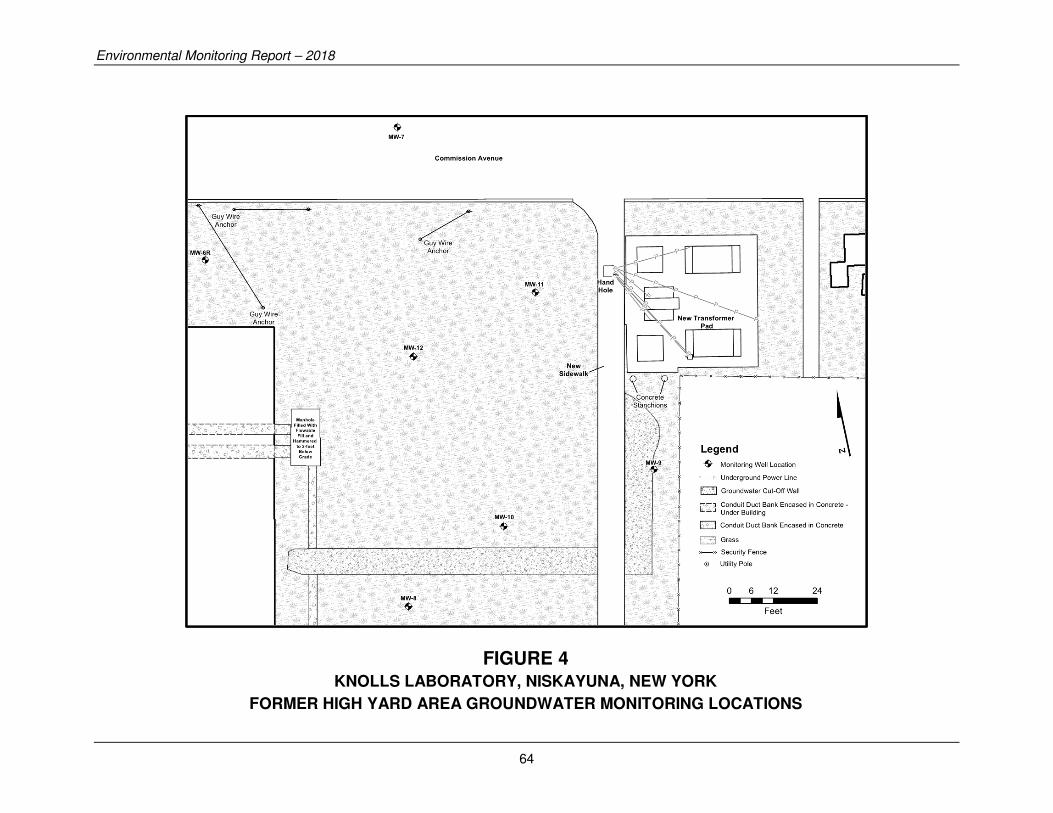
Environmental Monitoring Report – 2018
64
FIGURE 4 KNOLLS LABORATORY, NISKAYUNA, NEW YORK
FORMER HIGH YARD AREA GROUNDWATER MONITORING LOCATIONS
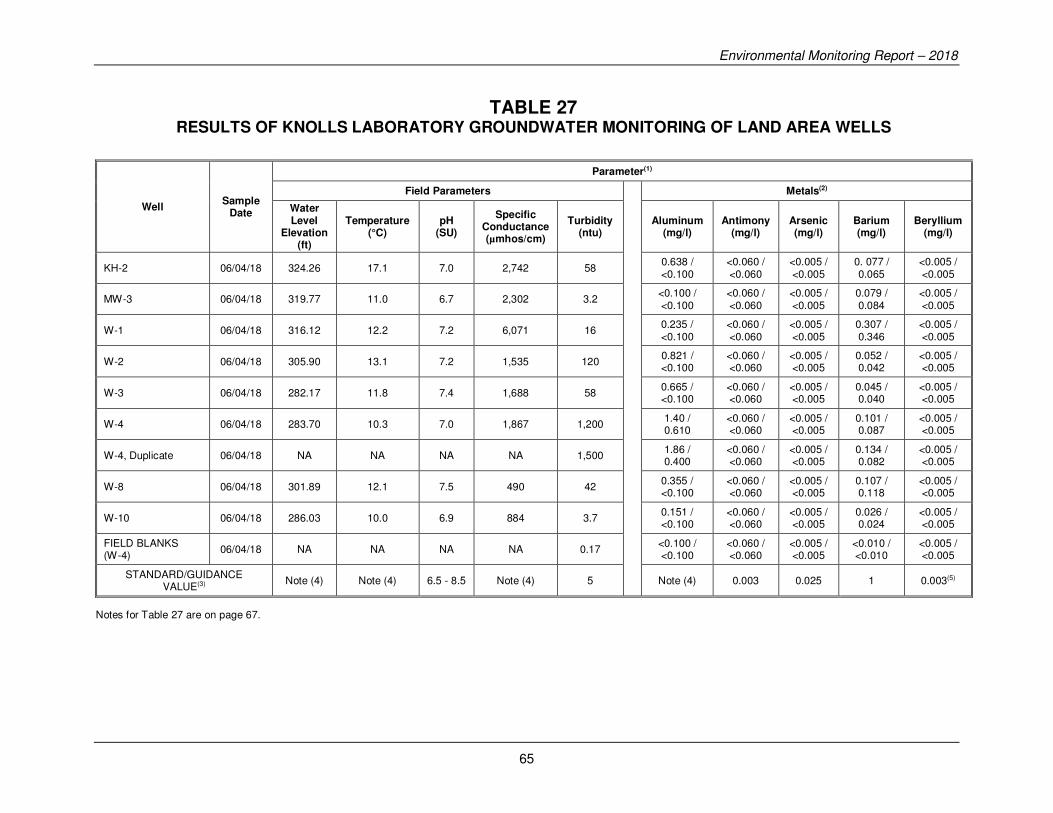
Environmental Monitoring Report – 2018
65
TABLE 27 RESULTS OF KNOLLS LABORATORY GROUNDWATER MONITORING OF LAND AREA WELLS
Well Sample
Date
Parameter(1)
Field Parameters Metals(2)
Water Level
Elevation (ft)
Temperature (°C)
pH (SU)
Specific Conductance (µmhos/cm)
Turbidity (ntu)
Aluminum (mg/l)
Antimony (mg/l)
Arsenic (mg/l)
Barium (mg/l)
Beryllium (mg/l)
KH-2 06/04/18 324.26 17.1 7.0 2,742 58
0.638 / <0.100
<0.060 / <0.060
<0.005 / <0.005
0. 077 / 0.065
<0.005 / <0.005
MW-3 06/04/18 319.77 11.0 6.7 2,302 3.2
<0.100 / <0.100
<0.060 / <0.060
<0.005 / <0.005
0.079 / 0.084
<0.005 / <0.005
W-1 06/04/18 316.12 12.2 7.2 6,071 16
0.235 / <0.100
<0.060 / <0.060
<0.005 / <0.005
0.307 / 0.346
<0.005 / <0.005
W-2 06/04/18 305.90 13.1 7.2 1,535 120
0.821 / <0.100
<0.060 / <0.060
<0.005 / <0.005
0.052 / 0.042
<0.005 / <0.005
W-3 06/04/18 282.17 11.8 7.4 1,688 58
0.665 / <0.100
<0.060 / <0.060
<0.005 / <0.005
0.045 / 0.040
<0.005 / <0.005
W-4 06/04/18 283.70 10.3 7.0 1,867 1,200
1.40 / 0.610
<0.060 / <0.060
<0.005 / <0.005
0.101 / 0.087
<0.005 / <0.005
W-4, Duplicate 06/04/18 NA NA NA NA 1,500
1.86 / 0.400
<0.060 / <0.060
<0.005 / <0.005
0.134 / 0.082
<0.005 / <0.005
W-8 06/04/18 301.89 12.1 7.5 490 42
0.355 / <0.100
<0.060 / <0.060
<0.005 / <0.005
0.107 / 0.118
<0.005 / <0.005
W-10 06/04/18 286.03 10.0 6.9 884 3.7
0.151 / <0.100
<0.060 / <0.060
<0.005 / <0.005
0.026 / 0.024
<0.005 / <0.005
FIELD BLANKS (W-4)
06/04/18 NA NA NA NA 0.17
<0.100 / <0.100
<0.060 / <0.060
<0.005 / <0.005
<0.010 / <0.010
<0.005 / <0.005
STANDARD/GUIDANCE VALUE(3)
Note (4) Note (4) 6.5 - 8.5 Note (4) 5
Note (4) 0.003 0.025 1 0.003(5)
Notes for Table 27 are on page 67.
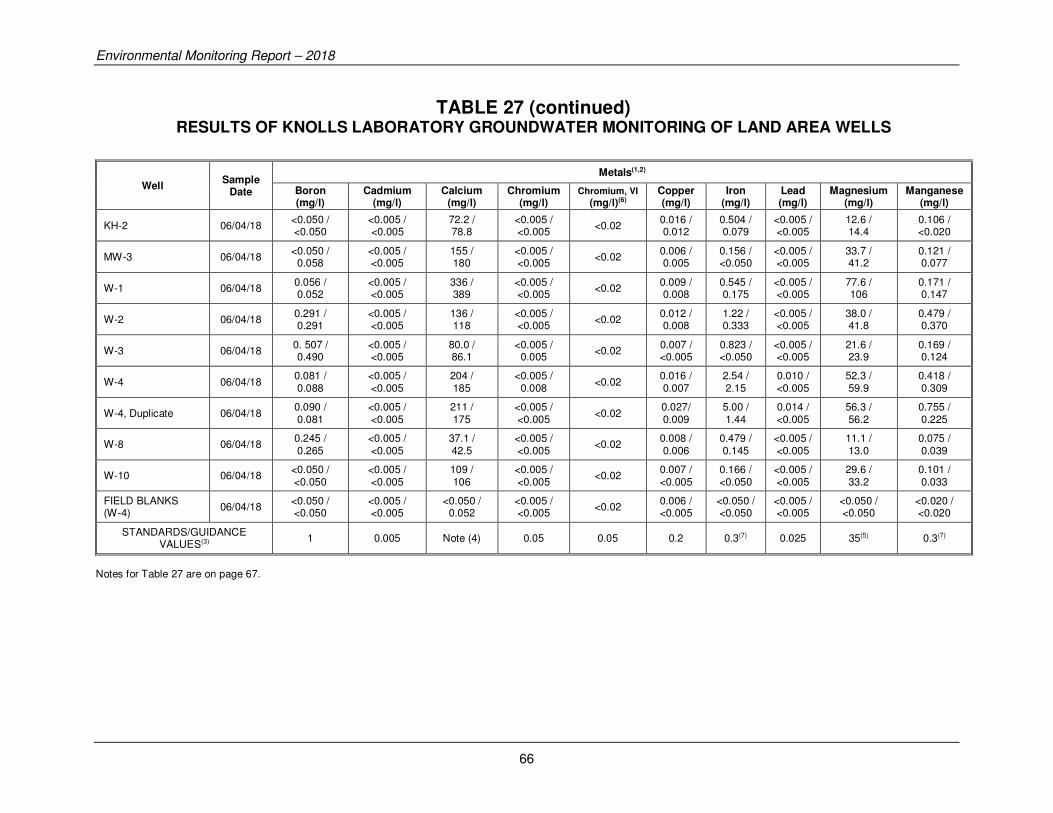
Environmental Monitoring Report – 2018
66
TABLE 27 (continued) RESULTS OF KNOLLS LABORATORY GROUNDWATER MONITORING OF LAND AREA WELLS
Well Sample
Date
Metals(1,2)
Boron (mg/l)
Cadmium (mg/l)
Calcium (mg/l)
Chromium (mg/l)
Chromium, VI
(mg/l)(6) Copper (mg/l)
Iron (mg/l)
Lead (mg/l)
Magnesium (mg/l)
Manganese (mg/l)
KH-2 06/04/18 <0.050 / <0.050
<0.005 / <0.005
72.2 / 78.8
<0.005 / <0.005
<0.02 0.016 / 0.012
0.504 / 0.079
<0.005 / <0.005
12.6 / 14.4
0.106 / <0.020
MW-3 06/04/18 <0.050 /
0.058 <0.005 / <0.005
155 / 180
<0.005 / <0.005
<0.02 0.006 / 0.005
0.156 / <0.050
<0.005 / <0.005
33.7 / 41.2
0.121 / 0.077
W-1 06/04/18 0.056 / 0.052
<0.005 / <0.005
336 / 389
<0.005 / <0.005
<0.02 0.009 / 0.008
0.545 / 0.175
<0.005 / <0.005
77.6 / 106
0.171 / 0.147
W-2 06/04/18 0.291 / 0.291
<0.005 / <0.005
136 / 118
<0.005 / <0.005
<0.02 0.012 / 0.008
1.22 / 0.333
<0.005 / <0.005
38.0 / 41.8
0.479 / 0.370
W-3 06/04/18 0. 507 / 0.490
<0.005 / <0.005
80.0 / 86.1
<0.005 / 0.005
<0.02 0.007 / <0.005
0.823 / <0.050
<0.005 / <0.005
21.6 / 23.9
0.169 / 0.124
W-4 06/04/18 0.081 / 0.088
<0.005 / <0.005
204 / 185
<0.005 / 0.008
<0.02 0.016 / 0.007
2.54 / 2.15
0.010 / <0.005
52.3 / 59.9
0.418 / 0.309
W-4, Duplicate 06/04/18 0.090 / 0.081
<0.005 / <0.005
211 / 175
<0.005 / <0.005
<0.02 0.027/ 0.009
5.00 / 1.44
0.014 / <0.005
56.3 / 56.2
0.755 / 0.225
W-8 06/04/18 0.245 / 0.265
<0.005 / <0.005
37.1 / 42.5
<0.005 / <0.005
<0.02 0.008 / 0.006
0.479 / 0.145
<0.005 / <0.005
11.1 / 13.0
0.075 / 0.039
W-10 06/04/18 <0.050 / <0.050
<0.005 / <0.005
109 / 106
<0.005 / <0.005
<0.02 0.007 / <0.005
0.166 / <0.050
<0.005 / <0.005
29.6 / 33.2
0.101 / 0.033
FIELD BLANKS (W-4)
06/04/18 <0.050 / <0.050
<0.005 / <0.005
<0.050 / 0.052
<0.005 / <0.005
<0.02 0.006 / <0.005
<0.050 / <0.050
<0.005 / <0.005
<0.050 / <0.050
<0.020 / <0.020
STANDARDS/GUIDANCE VALUES(3)
1 0.005 Note (4) 0.05 0.05 0.2 0.3(7) 0.025 35(5) 0.3(7)
Notes for Table 27 are on page 67.
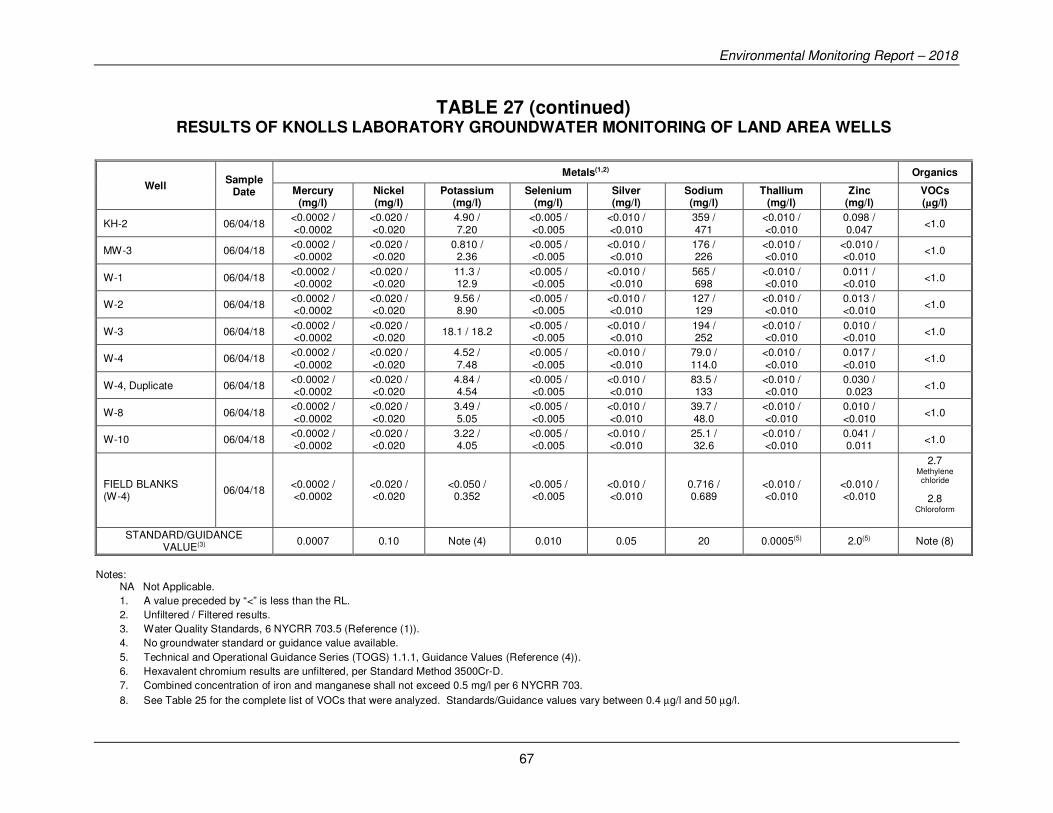
Environmental Monitoring Report – 2018
67
TABLE 27 (continued) RESULTS OF KNOLLS LABORATORY GROUNDWATER MONITORING OF LAND AREA WELLS
Well Sample
Date
Metals(1,2) Organics
Mercury (mg/l)
Nickel (mg/l)
Potassium (mg/l)
Selenium (mg/l)
Silver (mg/l)
Sodium (mg/l)
Thallium (mg/l)
Zinc (mg/l)
VOCs (µg/l)
KH-2 06/04/18 <0.0002 / <0.0002
<0.020 / <0.020
4.90 / 7.20
<0.005 / <0.005
<0.010 / <0.010
359 / 471
<0.010 / <0.010
0.098 / 0.047
<1.0
MW-3 06/04/18 <0.0002 / <0.0002
<0.020 / <0.020
0.810 / 2.36
<0.005 / <0.005
<0.010 / <0.010
176 / 226
<0.010 / <0.010
<0.010 / <0.010
<1.0
W-1 06/04/18 <0.0002 / <0.0002
<0.020 / <0.020
11.3 / 12.9
<0.005 / <0.005
<0.010 / <0.010
565 / 698
<0.010 / <0.010
0.011 / <0.010
<1.0
W-2 06/04/18 <0.0002 / <0.0002
<0.020 / <0.020
9.56 / 8.90
<0.005 / <0.005
<0.010 / <0.010
127 / 129
<0.010 / <0.010
0.013 / <0.010
<1.0
W-3 06/04/18 <0.0002 / <0.0002
<0.020 / <0.020
18.1 / 18.2 <0.005 / <0.005
<0.010 / <0.010
194 / 252
<0.010 / <0.010
0.010 / <0.010
<1.0
W-4 06/04/18 <0.0002 / <0.0002
<0.020 / <0.020
4.52 / 7.48
<0.005 / <0.005
<0.010 / <0.010
79.0 / 114.0
<0.010 / <0.010
0.017 / <0.010
<1.0
W-4, Duplicate 06/04/18 <0.0002 / <0.0002
<0.020 / <0.020
4.84 / 4.54
<0.005 / <0.005
<0.010 / <0.010
83.5 / 133
<0.010 / <0.010
0.030 / 0.023
<1.0
W-8 06/04/18 <0.0002 / <0.0002
<0.020 / <0.020
3.49 / 5.05
<0.005 / <0.005
<0.010 / <0.010
39.7 / 48.0
<0.010 / <0.010
0.010 / <0.010
<1.0
W-10 06/04/18 <0.0002 / <0.0002
<0.020 / <0.020
3.22 / 4.05
<0.005 / <0.005
<0.010 / <0.010
25.1 / 32.6
<0.010 / <0.010
0.041 / 0.011
<1.0
FIELD BLANKS (W-4)
06/04/18 <0.0002 / <0.0002
<0.020 / <0.020
<0.050 / 0.352
<0.005 / <0.005
<0.010 / <0.010
0.716 / 0.689
<0.010 / <0.010
<0.010 / <0.010
2.7 Methylene
chloride
2.8 Chloroform
STANDARD/GUIDANCE VALUE(3)
0.0007 0.10 Note (4) 0.010 0.05 20 0.0005(5) 2.0(5) Note (8)
Notes:
NA Not Applicable.
1. A value preceded by “<” is less than the RL.
2. Unfiltered / Filtered results.
3. Water Quality Standards, 6 NYCRR 703.5 (Reference (1)).
4. No groundwater standard or guidance value available.
5. Technical and Operational Guidance Series (TOGS) 1.1.1, Guidance Values (Reference (4)).
6. Hexavalent chromium results are unfiltered, per Standard Method 3500Cr-D.
7. Combined concentration of iron and manganese shall not exceed 0.5 mg/l per 6 NYCRR 703.
8. See Table 25 for the complete list of VOCs that were analyzed. Standards/Guidance values vary between 0.4 µg/l and 50 µg/l.

Environmental Monitoring Report – 2018
68
TABLE 28 RESULTS OF KNOLLS LABORATORY GROUNDWATER MONITORING
OF HILLSIDE AREA AND LOWER LEVEL WELLS
Locations Sample
Date
Water Level Elevation
(ft)
Temperature (°C)
pH (SU)
Specific Conductance (µmhos/cm)
Volatile Organic Compounds
(µg/l)(1)
Hillside Area
B-6 06/06/18 322.88 16.9 7.4 3,107 <1.0
SW-10 06/06/18 328.33 15.1 7.6 1,546 <1.0
SW-10 (Duplicate) 06/06/18 NA NA NA NA <1.0
B-16 06/06/18 268.86 12.3 6.8 4,471 <1.0
KH-6 06/06/18 314.98 11.6 6.8 814 <1.0
KH-9S 06/06/18 324.22 11.3 7.0 4,879 <1.0
KH-18 06/06/18 280.09 11.7 6.5 1,521 <1.0
Lower Level
KH-19 06/06/18 237.85 12.7 8.9 1,170 <1.0
KH-21 06/06/18 242.12 13.1 6.8 7,769 <1.0
KH-22 06/06/18 227.33 15.4 7.0 1,110 <1.0
KH-23 06/06/18 242.23 12.5 7.3 3,673 <1.0
KH-23 (Duplicate) 06/06/18 NA NA NA NA <1.0
Field Blanks
KH-23 06/06/18 NA NA NA NA <1.0
SW-10 06/06/18 NA NA NA NA <1.0
Notes:
NA – Not Applicable.
1. See Table 25 for the complete list of VOCs that were analyzed. A value preceded by “<” is less than the RL. The results for those parameters not listed in this table were all
less than the RL.
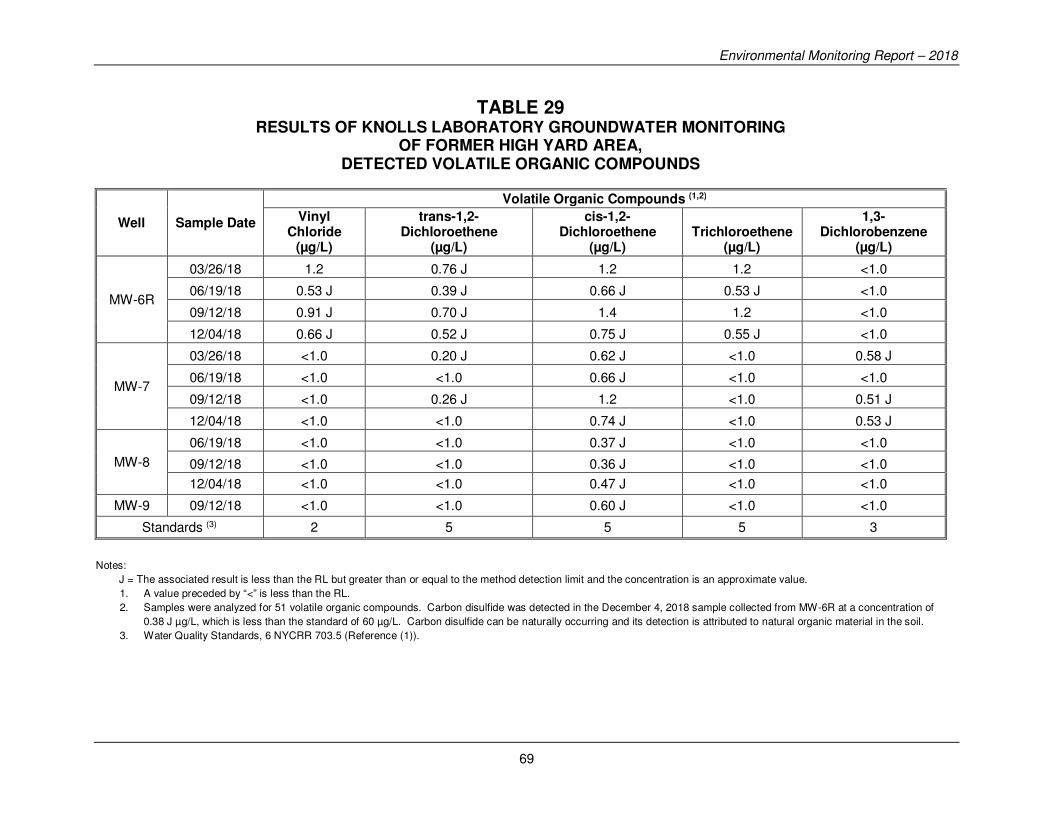
Environmental Monitoring Report – 2018
69
TABLE 29 RESULTS OF KNOLLS LABORATORY GROUNDWATER MONITORING
OF FORMER HIGH YARD AREA, DETECTED VOLATILE ORGANIC COMPOUNDS
Well Sample Date
Volatile Organic Compounds (1,2)
Vinyl Chloride
(µg/L)
trans-1,2-Dichloroethene
(µg/L)
cis-1,2-Dichloroethene
(µg/L) Trichloroethene
(µg/L)
1,3-Dichlorobenzene
(µg/L)
MW-6R
03/26/18 1.2 0.76 J 1.2 1.2 <1.0
06/19/18 0.53 J 0.39 J 0.66 J 0.53 J <1.0
09/12/18 0.91 J 0.70 J 1.4 1.2 <1.0
12/04/18 0.66 J 0.52 J 0.75 J 0.55 J <1.0
MW-7
03/26/18 <1.0 0.20 J 0.62 J <1.0 0.58 J
06/19/18 <1.0 <1.0 0.66 J <1.0 <1.0
09/12/18 <1.0 0.26 J 1.2 <1.0 0.51 J
12/04/18 <1.0 <1.0 0.74 J <1.0 0.53 J
MW-8
06/19/18 <1.0 <1.0 0.37 J <1.0 <1.0
09/12/18 <1.0 <1.0 0.36 J <1.0 <1.0
12/04/18 <1.0 <1.0 0.47 J <1.0 <1.0
MW-9 09/12/18 <1.0 <1.0 0.60 J <1.0 <1.0
Standards (3) 2 5 5 5 3
Notes:
J = The associated result is less than the RL but greater than or equal to the method detection limit and the concentration is an approximate value.
1. A value preceded by “<” is less than the RL.
2. Samples were analyzed for 51 volatile organic compounds. Carbon disulfide was detected in the December 4, 2018 sample collected from MW-6R at a concentration of
0.38 J µg/L, which is less than the standard of 60 µg/L. Carbon disulfide can be naturally occurring and its detection is attributed to natural organic material in the soil.
3. Water Quality Standards, 6 NYCRR 703.5 (Reference (1)).

Environmental Monitoring Report – 2018
70
TABLE 30 RESULTS OF KNOLLS LABORATORY
GROUNDWATER MONITORING FOR RADIOACTIVITY
Location Month Sampled
Radioactivity Concentrations(1,2)
Gross Alpha Gross Beta Sr-90 Cs-137
H-3
pCi/l x102 pCi/l
Landfill Area
June
NTH-1A <2.10 4.33 ± 2.79 0.40 ± 0.20 <0.28
<0.67
NTH-2A <3.69 11.73 ± 5.76 0.49 ± 0.23 <0.17 <0.67
NTH-5A <2.23 6.54 ± 3.28 0.25 ± 0.21 <0.52 <0.67
W-11 <3.29 10.40 ± 4.65 <0.18 <0.24 <0.67
W-12 <2.90 12.69 ± 4.23 0.42 ± 0.18 <2.35 <0.67
Land Area
June
W-2 <3.81 16.96 ± 6.76 <0.10 <0.48
<0.67
W-3 <0.86 6.96 ± 1.70 <0.12 <0.25 <0.67
W-4 <4.34 11.61 ± 6.37 <0.09 <0.41 <0.67
W-8 <1.93 12.48 ± 3.65 0.20 ± 0.22 <0.53 <0.67
W-10 <1.97 9.23 ± 2.70 <0.14 <0.49 <0.67
MW-3 <4.00 8.30 ± 5.90 0.30 ± 0.15 <0.17 <0.67
Hillside Area
June
B-6 <7.23 17.92 ± 9.18 <0.11 <0.54
<0.67
B-16 <8.81 23.17 ± 10.17 0.37 ± 0.18 <0.28 <0.68
KH-6 <2.80 9.66 ± 4.65 <0.21 <0.28 <0.71
KH-9S <6.00 17.30 ± 8.02 <0.12 <0.56 <0.68
KH-18 <4.17 13.21 ± 6.49 0.14 ± 0.11 <0.56 <0.68
SW-10 <3.28 11.59 ± 5.00 <0.09 <0.25 <0.67
Lower Level
June
KH-19 <2.07 6.56 ± 2.93 <0.12 <0.29
<0.68
KH-20 <3.12 12.62 ± 4.82 <0.11 <0.27 <0.68
KH-21 10.80 ± 13.94 21.97 ± 10.79 5.52 ± 0.48 <0.28 <0.69
KH-22 <2.55 64.13 ± 7.95 0.34 ± 0.16 <0.23 <0.68
KH-23 <7.73 15.10 ± 10.04 <0.59 <0.38 <0.68
Background Wells – for comparison
June
W-1 <11.40 19.02 ± 13.06 0.14 ± 0.14 <0.41
<0.68
KH-2 <7.04 16.80 ± 9.01 0.19 ± 0.20 <0.58 <0.68
KH-3S <2.09 9.02 ± 3.49 <0.10 <0.28 <0.68
Notes: 1. A value preceded by “<” is less than the decision level concentration for that sample and parameter. The (±) value
represents the statistical uncertainty at the 95% confidence interval. 2. The lowest possible value for any parameter is zero.

Environmental Monitoring Report – 2018
71
CONTROL OF CHEMICALLY HAZARDOUS SUBSTANCES AND SOLID WASTE Sources Chemicals are not manufactured at the Knolls Laboratory. Minimal quantities of hazardous wastes
do result from the necessary use of chemicals in Knolls Laboratory operations. To ensure the safe
use of chemicals and disposal of the resulting wastes, the Knolls Laboratory maintains a hazardous
waste control program. Hazardous wastes are disposed of through permitted off-site treatment and
disposal facilities.
Chemical Control Program The control program minimizes the quantity of waste material generated, ensures safe usage and
storage of the materials at the Knolls Laboratory, and provides for proper disposal of the wastes
by vendors that operate under permits issued by Federal and State agencies.
A principal part of the waste minimization program is the control of the acquisition of hazardous
substances for use at the Knolls Laboratory. Purchase requests for chemicals are reviewed to
ensure that the materials are actually necessary for Knolls Laboratory operations, the amount
ordered is not excessive, and that methods for proper disposal are in place before the material is
ordered. Hazardous substance storage controls include as a minimum: labeling, providing
revetments as appropriate, segregation based on compatibility, limited storage volumes, and
weather protection as appropriate. When required, large volumes of chemicals and petroleum
products are stored in accordance with the New York State Chemical Bulk Storage regulations
(Reference (15)) and the Petroleum Bulk Storage regulations (Reference (16)). The Knolls
Laboratory did not store any chemicals in quantities that are subject to the Chemical Bulk Storage
regulations during 2018.
Additionally, many hazardous substances have been replaced by non-hazardous substitutes. The
Knolls Laboratory stresses the "Know-Before-Do" principle. To this end, facility personnel must
identify ways to minimize waste prior to performing a waste generating process. The Knolls
Laboratory also evaluates the hazardous waste that is generated and determines if additional waste
minimization can be achieved.
All personnel working at the Knolls Laboratory are provided with general information on the
Knolls Laboratory policies for the procurement, use, and disposal of hazardous substances. For
individuals who use hazardous substances in operations, specific training is provided to ensure that
they are knowledgeable of safe handling techniques and emergency response procedures. After
chemicals are used and no longer needed, they are accumulated in designated staging and storage
areas where they are segregated and packaged for shipment. Waste is temporarily stored only as
necessary to accumulate sufficient volumes for shipment to a waste disposal vendor. Hazardous
and mixed (radioactive and hazardous) waste storage facilities are operated at the Knolls
Laboratory under a permit obtained from NYSDEC. The Knolls Laboratory has an inspection
program to verify routinely that hazardous substances are properly stored and controlled in
accordance with approved procedures.

Environmental Monitoring Report – 2018
72
In addition, the Knolls Laboratory hazardous waste control program is subject to an annual on-site
inspection. The EPA conducted a hazardous waste management inspection during 2018.
Chemical Disposal Hazardous waste is managed in compliance with RCRA. Generated waste is transported by
vendors to treatment, storage, and disposal facilities for final disposition. The transportation
vendors and the treatment, storage, and disposal facilities operate under permits issued by the
cognizant Federal and State regulatory agencies. The Knolls Laboratory requires the disposal
facilities to provide itemized written verification that the waste was actually received. During
2018, the Knolls Laboratory shipped approximately 8.3 tons of RCRA and New York State
hazardous waste off-site for disposal. This included approximately 1.6 tons of mixed waste. The
Knolls Laboratory reduces the potential environmental impact of the waste by selecting the
ultimate disposal methods that minimize or eliminate future environmental intrusion.
Non-hazardous chemical waste is also sent off-site for disposal. The transportation vendors and
the treatment, storage, and disposal facilities are typically the same as those used for hazardous
waste disposal. These facilities also operate under permits issued by the cognizant Federal and
State regulatory agencies. The Knolls Laboratory requires the disposal facility to provide itemized
written verification that the waste was actually received. During 2018, approximately 640 tons of
non-hazardous chemical waste was sent for off-site disposal via incineration, wastewater
treatment, chemical treatment, or land disposal from the Knolls Laboratory.
Solid Waste Disposal/Recycling
During 2018, approximately 968 tons of non-hazardous solid waste were generated from such
waste streams as office and cafeteria trash, construction and demolition debris, and classified scrap
paper. From these waste streams, the Knolls Laboratory recycles materials such as office paper,
except classified items, glass, tin, aluminum, newspapers, magazines, plastic, cardboard, wood,
asphalt, lead/lead acid batteries, concrete, precious metals, computers, metal and plastic drums,
cafeteria grease, used oil, and universal waste (e.g., light bulbs, batteries, thermostats). In 2018,
approximately 652 tons of these materials were recycled from the Knolls Laboratory.
CONTROL OF RADIOACTIVE MATERIALS AND RADIOACTIVE WASTE
Sources Operation of the Knolls Laboratory results in the generation of various types of radioactive
materials and wastes. Low level radioactive solid waste materials that require disposal include
filters, metal scrap, rags, resin, paper, and plastic materials.
Control Program
Detailed procedures are used for handling, packaging, transportation, and disposal of radioactive
waste at a government operated or licensed disposal site. Internal reviews are made prior to the
Environmental Monitoring Report – 2018
73
shipment of any radioactive material from the Knolls Laboratory to ensure that the material is
properly identified, surveyed, and packaged in accordance with Federal requirements.
The volume of radioactive waste is minimized through the use of special work procedures that
limit the amount of materials that become contaminated during work on radioactive systems and
components. Radioactive liquid waste is collected in an absorbed form prior to shipment to an
approved disposal facility. All radioactive wastes are prepared and shipped in accordance with
written procedures to meet the applicable DOT regulations given in Reference (17). The waste
packages also comply with all applicable requirements of the NRC, the DOE, and the disposal
sites.
Disposal/Recycling
The shipments of low level radioactive solid wastes were made by authorized common carriers to
disposal sites located outside New York State. During 2018, approximately 4,543.061 cubic
meters (5,942.1 cubic yards) of low level radioactive waste containing approximately 2.59 x 10⁻³
Ci were shipped from the Knolls Laboratory for disposal.
CONTROL OF MIXED WASTES
Sources
Waste that is both radioactive and chemically hazardous is regulated under both the Atomic Energy
Act (AEA) and RCRA as “mixed waste.” Also, per NYSDEC, certain TSCA regulated PCB waste
is also considered a hazardous waste. Operations at the Knolls Laboratory, in support of research
and development for the design and operation of naval nuclear propulsion plants, resulted in the
generation of a small quantity of mixed wastes. These wastes included laboratory chemicals, oils,
equipment, and debris.
Control Program
Mixed wastes were managed in accordance with the Knolls Laboratory RCRA permit, the Knolls
Laboratory Mixed Waste Site Treatment Plan, which is updated as required and provided to
NYSDEC, and the Federal Facility Compliance Act of 1992. The Knolls Laboratory takes
aggressive action to minimize the creation of mixed waste by reducing the commingling of
radioactive and hazardous materials and avoiding the use of hazardous substances where
technically acceptable. The amount of generated mixed waste was also minimized through the use
of detailed work procedures and worker training.
Storage and Disposal Mixed wastes were accumulated in designated regulated and permitted storage areas. The wastes
were packaged for storage and shipment to off-site treatment facilities in accordance with the
Knolls Laboratory Mixed Waste Site Treatment Plan. In 2018, there were four shipments totaling
approximately 1.6 tons of various mixed wastes to treatment and disposal facilities.

Environmental Monitoring Report – 2018
74
RADIATION DOSE ASSESSMENT
The effluent and environmental monitoring results show that radioactivity present in liquid and
gaseous effluents from 2018 operations at the Knolls Laboratory and SPRU had no measurable
effect on normal background radioactivity levels. Therefore, any radiation doses from the Knolls
Laboratory and SPRU operations to off-site individuals were too small to be measured and must
be calculated using conservative methods. Estimates of the radiation dose to the maximally
exposed individual in the vicinity of the Knolls Laboratory, including SPRU and the collective
dose to the population residing in the 80 kilometer (50 mile) radius assessment area are
summarized later in this report in the Radiation Dose Assessment and Methodology section.
The results show that the estimated doses were less than 0.1 percent of that permitted by the
radiation protection standards of the DOE listed in Reference (18) and that the estimated dose to
the population residing within 80 kilometers (50 miles) of the Knolls Laboratory was less than
0.001 percent of the natural background radiation dose to the population. In addition, the estimated
doses were less than one percent of that permitted by the NRC numerical guide listed in Reference
(19) for whole-body dose, demonstrating that doses are as low as is reasonably achievable. The
dose attributed to radioactive air emissions from both the Knolls Laboratory and SPRU was less
than one percent of the EPA standard in Reference (8).
The collective radiation dose to the public along the travel route from outgoing Knolls Laboratory
shipments of radioactive materials during 2018 was calculated using data given by the NRC in
Reference (20). The collective radiation dose to the public from all NNPP shipments of radioactive
materials is included in Reference (21).
Based on the type and number of shipments made, the collective annual radiation dose to the public
along the transportation routes, including transportation workers, was less than one person-rem.
(See the SPRU Radiation Dose Assessment section of this report for the collective radiation dose
from SPRU shipments). This is less than 0.001 percent of the dose received by the same population
from natural background radiation.
Environmental Monitoring Report – 2018
75
KESSELRING SITE SITE DESCRIPTION
The Kesselring Site consists of 3,900 acres on which two operating pressurized-water naval
nuclear propulsion plants and support facilities are located, including administrative offices,
machine shops, waste storage facilities, oil storage facilities, training facilities, equipment service
buildings, chemistry laboratories, a boiler house, cooling towers, and wastewater treatment
facilities. Two other nuclear propulsion plants were permanently shut down during the 1990s; one
has been dismantled, the other is undergoing dismantlement. Kesselring Site is located near West
Milton, New York, approximately 17 miles (27.4 kilometers) north of the City of Schenectady,
9 miles (14.5 kilometers) southwest of Saratoga Springs, and 13 miles (21 kilometers) northeast
of Amsterdam (see Figure 1). The surrounding area is a rural, sparsely populated region of wooded
lands through which flow the Glowegee Creek and several small streams that empty into the
Kayaderosseras Creek.
As a result of the end of the Cold War and the downsizing of the Navy, the S3G and D1G Prototype
reactor plants were shut down in May 1991 and March 1996, respectively. All spent nuclear fuel
was removed from the S3G Prototype reactor and shipped off-site in July 1994. All spent nuclear
fuel was removed from the D1G Prototype reactor and shipped off-site in February 1997. After
completion of the public National Environmental Policy Act process in 1998, a record of decision
was issued for prompt dismantlement of the defueled S3G and D1G reactor plants. Dismantlement
operations began, starting on the S3G plant, shortly after this decision was made. Dismantlement
of the S3G plant was completed during 2006 and dismantlement of the D1G plant is continuing.
The project is planned to be completed as soon as practicable subject to available appropriated
funding.
The climate in the region of the Kesselring Site is primarily continental in character, but is
subjected to some modification from the maritime climate, which prevails in the extreme
southeastern portion of New York State. Winters are usually cold and occasionally fairly severe.
Maximum temperatures during the colder winter months often are below freezing and nighttime
low temperatures frequently drop to 10° F or lower. Sub-zero temperatures occur rather
infrequently, about a dozen times a year. Snowfall in the area is quite variable, averaging
approximately 69 inches per year. Over some of the higher elevation areas nearby, snowfall ranges
up to 75 inches or more for a season. The mean annual precipitation for the area is approximately
45 inches per year. The prevailing winds are from the west.
The area surrounding the Kesselring Site has a complex geological history due to the processes of
erosion, glaciation, folding, and faulting. The geological formations of the West Milton area are
comprised of two major types: bedrock, which ranges in age from Precambrian to Ordovician, and
unconsolidated deposits of Pleistocene and Recent age. Bedrock underlying the area crops out
only on some steep hillsides and in some stream valleys. It is covered by the unconsolidated
deposits in the remainder of the area. These unconsolidated deposits range in thickness from zero
to 200 feet with an average thickness of 50 feet. Bedrock underlying the West Milton area may
be divided into two groups: (1) metamorphosed rocks of Precambrian age and (2) sedimentary
rocks of Paleozoic age. The older metamorphosed rocks consist of gneiss, schist, quartzite, and

Environmental Monitoring Report – 2018
76
limestone (marble) of sedimentary origin and syenite and granite of igneous origin. These rocks
are referred to as crystalline rocks. The Paleozoic rocks likewise consist of several types of rocks
including sandstone, dolomite, limestone, and shale. The unconsolidated deposits can be
subdivided into four groups: (1) till - an unstratified, dense heterogeneous mixture of glacially
deposited rock particles ranging in size from clay to gravel; (2) ice-contact deposits - kames and
eskers composed of stratified sand and gravel; (3) glaciolacustrine deposits - a homogeneous
stratified layer of sand, silt, and clay; and (4) recent fluvial deposits consisting of sand and gravel.
Generally, the coarser-grained and stratified unconsolidated deposits form better aquifers than the
fine-grained and unstratified unconsolidated deposits or bedrock foundations. Only small areas
are underlain by these coarse-grained deposits. Percolating water from rainfall and snowmelt
recharge the shallow, unconfined aquifers beneath the Kesselring Site, and in turn, streams are
recharged by shallow groundwater. The Kayaderosseras Creek is underlain by coarse-grained
glacial and fluvial valley-fill deposits from which all Site Service (drinking) Water is produced.
Kesselring Site drinking water well field is located near the eastern boundary of the Kesselring
Site within the Creek's floodplain. The Kesselring Site obtains all water for its operation from
on-site production wells that are hydrogeologically separate from current and historical operational
areas.
The Kesselring Site is located in the transition zone between the Adirondack Mountains and the
Hudson-Mohawk Valley lowland. The Kayaderosseras Creek forms the main drainage system in
the vicinity of the Kesselring Site. The average flow (1927–1994) in the Kayaderosseras Creek is
137.8 cubic feet per second (cfs) and the lowest recorded seven-day minimum flow is 12.4 cfs
during August 1964. The Kayaderosseras gauging station was taken out of service in 1995.
The Glowegee Creek, Crook Brook, and Hogback Brook drain the Kesselring Site. Crook Brook
directly joins the Kayaderosseras. Hogback Brook is a tributary to the Glowegee, which is the
receiving water for Kesselring Site drainage. The average flow (1948–2018) in the Glowegee is
38.6 cfs and the lowest recorded seven-day minimum flow is 0.51 cfs during August 1949. The
Glowegee Creek joins with the Kayaderosseras Creek approximately one mile east of West Milton.
The Glowegee and Kayaderosseras Creeks are classified under New York State Codes, Rules and
Regulations as Class C - Trout Streams. Under this classification, the waters are suitable for
fishing and fish propagation. Additionally, the water quality shall be suitable for primary and
secondary contact recreation, even though other factors may limit the use for that purpose. The
NYSDEC has permitted the Kesselring Site to discharge effluent from various Kesselring Site
operations to the Glowegee Creek as specified in the Kesselring Site’s SPDES Permit (Reference
(22)). Environmental monitoring has shown no measurable water quality degradation in the
Glowegee Creek due to Kesselring Site operations.

Environmental Monitoring Report – 2018
77
LIQUID EFFLUENT MONITORING
Sources
Nonradiological: The primary sources of the effluent water at the Kesselring Site are:
1. Site Boiler House Discharges - Site boiler water is treated demineralized water. Operations
that result in discharges are (1) annual boiler draining and periodic blowdowns to control the
concentration of solids and (2) wastewater from a reverse osmosis water treatment system.
2. Sanitary Wastewater Treatment Facility - The sanitary wastewater treatment facility consists
of influent wastewater grinding, a biological treatment process consisting of pre-equalization,
sequencing batch reactors (SBR), post-equalization, aeration, and filtration. Waste sludge is
stored in a holding tank and removed periodically by a licensed subcontractor for disposal at a
State-approved facility.
3. Cooling Tower Water - Cooling tower water is treated to minimize scale formation, to prevent
corrosion of system materials, and to inhibit the growth of algae and slime. The pH is normally
maintained in the range of 7.1 to 8.2.
4. Retention Basin Liquids - The retention basins receive wastewater from prototype plant
facilities including blowdown water from steam generators and drainage water from the engine
rooms.
5. Site Drainage Water - Stormwater and groundwater (treated and untreated) also make up a
portion of the liquid effluent. A portion of the groundwater on site is treated with sodium
hypochlorite due to elevated levels of ammonia in the groundwater.
6. Site Service Water - Site Service Water is used for drinking water and non-contact cooling
purposes. Sodium hypochlorite is added to the Site Service Water system as a drinking water
disinfectant.
With the exception of the Sanitary Wastewater Treatment Facility effluent and some stormwater,
all of the above sources of effluent water are discharged into the Kesselring Site Lagoon and
through a wastewater treatment system before ultimate off-site discharge into the Glowegee Creek.
The Kesselring Site lagoon is a five-million gallon holding basin that was designed to accumulate
effluent water for the purposes of pH control, thermal equalization, chlorine dissipation, and
settling of solid particles.
Radiological: Some of the liquid effluent discharged from the retention basins contains low levels
of radioactivity. The source of this radioactivity is small quantities of activation products. The
activation products may include tritium and radionuclides of corrosion and wear products.
Tritium is present in the reactor coolant as the result of neutron interaction with naturally occurring
deuterium present in the water. Tritium produced in the reactor exists in the oxide form and is
chemically indistinguishable from water. Corrosion and wear products, in the form of small
Environmental Monitoring Report – 2018
78
insoluble metal oxide particles, become radioactive as they pass through the reactor, with cobalt-
60 being the predominant radionuclide. Operation of the prototype plant requires processing
reactor coolant using radioactive liquid waste collection systems.
To minimize releases of radioactivity in liquid effluent to the environment, a water reuse system
and evaporators are employed. The reactor coolant water that is discharged from the prototype
plant to the radioactive liquid waste collection system is processed through a series of filters and
demineralizers. The processing system removes nearly all of the radioactivity with the exception
of tritium. After purification, the water is either reused as reactor coolant makeup and in other
radioactive systems, or evaporated to reduce the amount of radioactivity that could be released as
liquid effluent.
The low concentrations of radioactivity in the liquids released from the Kesselring Site have
always been below all applicable Federal and State limits and have not resulted in any detectable
radioactivity in the Glowegee Creek from Kesselring Site operations.
Effluent Monitoring
Nonradiological: Liquid effluents from the Kesselring Site enter the Glowegee Creek through two
surface channels (Outfalls 001 and 002) and a submerged drain line from the Sanitary Wastewater
Treatment Facility (Outfall 003) shown in Figure 5. A series of gates are located in the main
discharge channel upstream of the lagoon to provide a means to contain effluent if concentrations
should ever exceed applicable discharge limits. An internal outfall (Outfall 02B) discharges
groundwater treated with sodium hypochlorite to the main discharge channel upstream of the
lagoon.
Since 1998, the Kesselring Site has operated a wastewater treatment system at the outlet of the
lagoon. This treatment system is designed primarily to minimize total suspended solids and
residual chlorine levels, and adjust pH. This is necessary in order to maintain Kesselring Site
operations and to ensure continued compliance with the SPDES Permit limits. The system also
removes residual chlorine from the lagoon effluent using an automated sodium bisulfite system.
Treatment is also provided for pH using carbon dioxide, and temperature using Site Service Water.
Effluent samples from the lagoon wastewater treatment system (Outfalls 001 and 002) and the
Sanitary Wastewater Treatment Facility (Outfall 003) are collected and analyzed as required by
the SPDES Permit.
Stormwater from the Kesselring Site enters the Glowegee Creek from stormwater Outfalls 01A,
02A, 004, 005, and 006 (Figure 5). Outfalls 01A and 02A were used for Kesselring Site discharge
prior to the construction of the lagoon. These outfalls currently collect only stormwater.
Outfall 004, which discharges into the Glowegee Creek just below the main access road bridge,
collects drainage from the parking lot and the southern part of the Kesselring Site. Discharges
through this outfall are controlled locally or remotely by a sluice gate. This gate provides control
for contaminants (i.e., oils and chemicals) which could reach this drainage way in the event of a
spill, fire, or other emergency. Stormwater also collects in Outfall 005 from Hogback Road and

Environmental Monitoring Report – 2018
79
enters the Glowegee Creek. Outfall 006 collects stormwater runoff from the landfill that was
closed and capped in 1993. Currently, no routine sampling or monitoring is required for
stormwater Outfalls 01A, 02A, 004, 005, and 006.
In June 2007, NYSDEC’s Stream Biomonitoring Unit performed an assessment of the Glowegee
Creek. The report was published April 17, 2009, and a copy has been provided in the Saratoga
Library. The results and conclusions were that the water quality in Glowegee Creek was very
good at all locations, and there appeared to be no impacts from the Kesselring Site discharges.
Radiological: Liquid discharges that might contain tritium are either sampled and analyzed
individually or sampled and combined into a monthly composite that is then analyzed for tritium.
Monthly grab samples are also taken at Outfalls 001 and 002.
Effluent Analyses
Nonradiological: The analyses performed for chemical constituents on effluent samples from each
discharge point and the sanitary wastewater treatment facility are listed in Tables 31, 32, and 33.
Analyses for chemical constituents are performed using procedures described in Standard
Methods, Reference (10), or other EPA approved procedures. Flow, temperature, and total
residual chlorine are measured at Outfalls 001 and 002 during every day on which there is a
discharge from the lagoon, except when the flume is flooded with Glowegee Creek water. Outfall
001 is flooded more often than Outfall 002 because its elevation is lower.
Radiological: Each liquid discharge that might contain tritium is sampled. The samples are
combined into a monthly composite for each frequently used release point. Samples from other
tritium release points are analyzed individually. The monthly grab samples are analyzed for tritium
and by gamma spectrometry. Tritium analyses are performed by liquid scintillation counting.
Assessment
Nonradiological: The analytical results for the measurements of chemical constituents
summarized in Tables 31, 32, and 33 show that average values are within the applicable effluent
standards. Liquid effluent monitoring data is reported as required in Reference (22).
Radiological: The radioactivity released in Kesselring Site liquid effluent during 2018 totaled
9.37 x 10⁻⁴ Ci of tritium as shown in Table 34. The activity was contained in approximately
5.89 x 10⁶ liters of water. Tritium and gamma emitting radionuclides attributable to Kesselring
Site operations were not detected in the monthly grab samples of the outfalls. The resulting
annual average radioactivity concentration in the effluent corresponded to less than 0.1 percent
of the DOE DCS for effluent released to unrestricted areas, (Reference (6)) for the mixture of
radionuclides present.

Environmental Monitoring Report – 2018
80
FIGURE 5 KESSELRING SITE, NEAR WEST MILTON, NEW YORK
GLOWEGEE CREEK SAMPLING LOCATIONS AND OUTFALL LOCATIONS
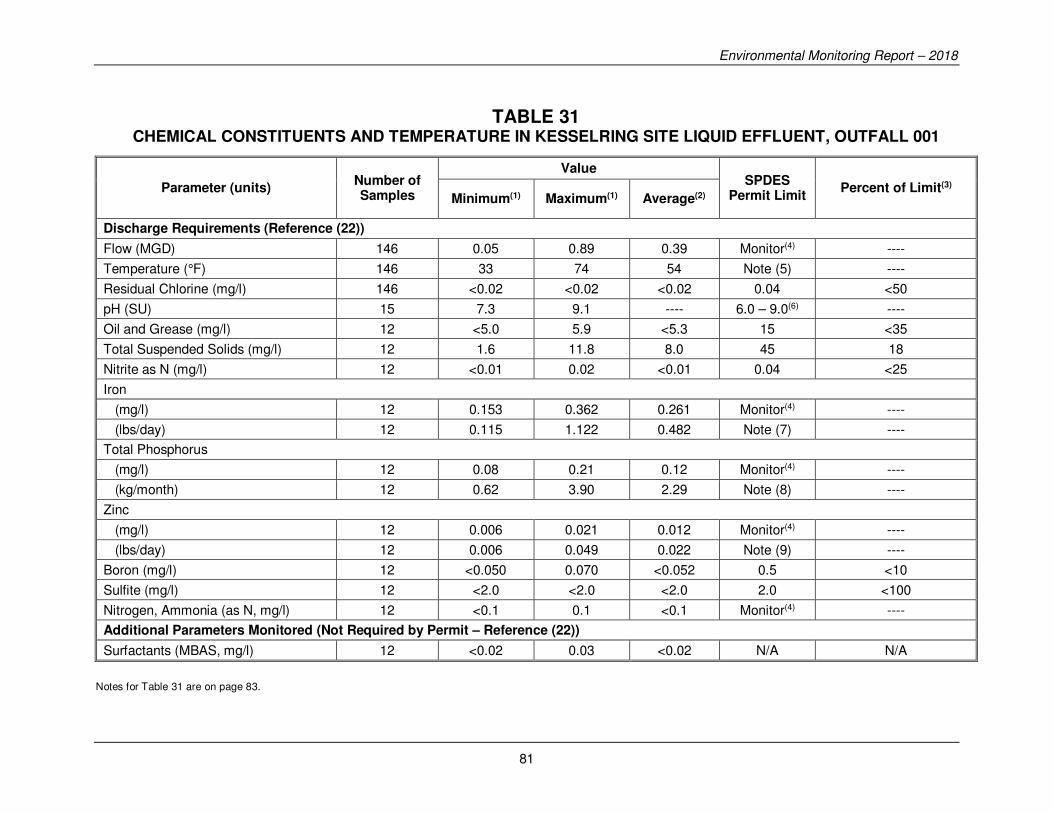
Environmental Monitoring Report – 2018
81
TABLE 31 CHEMICAL CONSTITUENTS AND TEMPERATURE IN KESSELRING SITE LIQUID EFFLUENT, OUTFALL 001
Parameter (units) Number of Samples
Value SPDES
Permit Limit Percent of Limit(3)
Minimum(1) Maximum(1) Average(2)
Discharge Requirements (Reference (22))
Flow (MGD) 146 0.05 0.89 0.39 Monitor(4) ----
Temperature (°F) 146 33 74 54 Note (5) ----
Residual Chlorine (mg/l) 146 <0.02 <0.02 <0.02 0.04 <50
pH (SU) 15 7.3 9.1 ---- 6.0 – 9.0(6) ----
Oil and Grease (mg/l) 12 <5.0 5.9 <5.3 15 <35
Total Suspended Solids (mg/l) 12 1.6 11.8 8.0 45 18
Nitrite as N (mg/l) 12 <0.01 0.02 <0.01 0.04 <25
Iron
(mg/l) 12 0.153 0.362 0.261 Monitor(4) ----
(lbs/day) 12 0.115 1.122 0.482 Note (7) ----
Total Phosphorus
(mg/l) 12 0.08 0.21 0.12 Monitor(4) ----
(kg/month) 12 0.62 3.90 2.29 Note (8) ----
Zinc
(mg/l) 12 0.006 0.021 0.012 Monitor(4) ----
(lbs/day) 12 0.006 0.049 0.022 Note (9) ----
Boron (mg/l) 12 <0.050 0.070 <0.052 0.5 <10
Sulfite (mg/l) 12 <2.0 <2.0 <2.0 2.0 <100
Nitrogen, Ammonia (as N, mg/l) 12 <0.1 0.1 <0.1 Monitor(4) ----
Additional Parameters Monitored (Not Required by Permit – Reference (22))
Surfactants (MBAS, mg/l) 12 <0.02 0.03 <0.02 N/A N/A
Notes for Table 31 are on page 83.
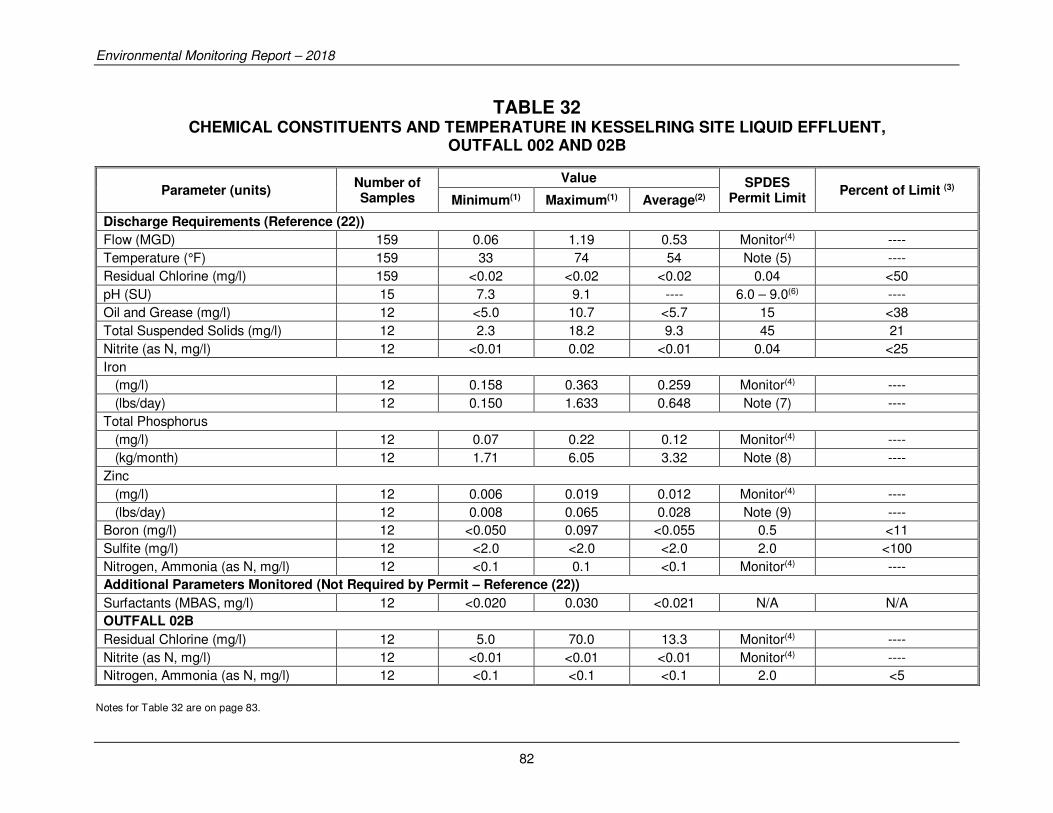
Environmental Monitoring Report – 2018
82
TABLE 32 CHEMICAL CONSTITUENTS AND TEMPERATURE IN KESSELRING SITE LIQUID EFFLUENT,
OUTFALL 002 AND 02B
Parameter (units) Number of Samples
Value SPDES Permit Limit
Percent of Limit (3) Minimum(1) Maximum(1) Average(2)
Discharge Requirements (Reference (22))
Flow (MGD) 159 0.06 1.19 0.53 Monitor(4) ----
Temperature (°F) 159 33 74 54 Note (5) ----
Residual Chlorine (mg/l) 159 <0.02 <0.02 <0.02 0.04 <50
pH (SU) 15 7.3 9.1 ---- 6.0 – 9.0(6) ----
Oil and Grease (mg/l) 12 <5.0 10.7 <5.7 15 <38
Total Suspended Solids (mg/l) 12 2.3 18.2 9.3 45 21
Nitrite (as N, mg/l) 12 <0.01 0.02 <0.01 0.04 <25
Iron
(mg/l) 12 0.158 0.363 0.259 Monitor(4) ----
(lbs/day) 12 0.150 1.633 0.648 Note (7) ----
Total Phosphorus
(mg/l) 12 0.07 0.22 0.12 Monitor(4) ----
(kg/month) 12 1.71 6.05 3.32 Note (8) ----
Zinc
(mg/l) 12 0.006 0.019 0.012 Monitor(4) ----
(lbs/day) 12 0.008 0.065 0.028 Note (9) ----
Boron (mg/l) 12 <0.050 0.097 <0.055 0.5 <11
Sulfite (mg/l) 12 <2.0 <2.0 <2.0 2.0 <100
Nitrogen, Ammonia (as N, mg/l) 12 <0.1 0.1 <0.1 Monitor(4) ----
Additional Parameters Monitored (Not Required by Permit – Reference (22))
Surfactants (MBAS, mg/l) 12 <0.020 0.030 <0.021 N/A N/A
OUTFALL 02B
Residual Chlorine (mg/l) 12 5.0 70.0 13.3 Monitor(4) ----
Nitrite (as N, mg/l) 12 <0.01 <0.01 <0.01 Monitor(4) ----
Nitrogen, Ammonia (as N, mg/l) 12 <0.1 <0.1 <0.1 2.0 <5
Notes for Table 32 are on page 83.

Environmental Monitoring Report – 2018
83
NOTES FOR TABLES 31 AND 32 1. A value preceded by “<” is less than the RL for that sample and parameter. 2. Average values preceded by “<” contain at least one value less than the RL value in the average. 3. Percent of limit for the average value, unless otherwise noted. 4. The Reference (22) permit requires the data to be reported but does not specify a limit for this
discharge parameter. 5. During the period from May through October, the temperature of heated water discharges from
Kesselring Site operations shall not exceed 75° F, except that if the ambient stream temperature exceeds 75° F, the temperature of the discharge can be equal to the stream temperature, up to a maximum of 78° F. During the period from November through April, the temperature of the heated water discharges from Kesselring Site operations shall not exceed 75° F. In addition, no discharges will occur which will raise the temperature of the stream by more than 5° F, or to a maximum of 55° F, whichever temperature is less, except that if the upstream temperature is > 55° F, the discharge to the stream shall be such that the downstream temperature is less than or equal to the upstream temperature. If the upstream creek temperature is > 55° F, the heated water discharges shall not exceed the upstream temperature of the creek.
6. The pH values are not averaged and are required to be in this range. 7. Total Kesselring Site mass discharge limit of 4.0 lbs/day for Outfalls 001, 002, and 003 combined. 8. An action level of 50 kg/month has been assigned for the total mass discharged from Outfalls
001, 002, and 003 combined. An action level is not a limit, but a specified effluent level that requires additional short term monitoring upon exceedance.
9. Total Kesselring Site mass discharge limit of 0.5 lbs/day for Outfalls 001, 002, and 003 combined. N/A = Not Applicable

Environmental Monitoring Report – 2018
84
TABLE 33 CHEMICAL CONSTITUENTS AND TEMPERATURE IN KESSELRING SITE
SANITARY WASTEWATER TREATMENT FACILITY EFFLUENT, OUTFALL 003
Parameter (units) Number
of Samples
Value SPDES Permit Limit
Percent of Limit(3)
Minimum(1) Maximum(1) Average(2)
Discharge Requirements (Reference (22))
Flow (MGD) 360 0.0002 0.027 0.012 0.09(4) 13
pH (SU) 360 7.4 8.5 ---- 6.0 - 9.0(5) ----
Settleable Solids (ml/l) 360 <0.1 <0.1 <0.1 0.1 <100
Dissolved Oxygen (mg/l) 360 7.7 13.0 10.0 ≥ 5.0 Note (6)
Nitrite (as N, mg/l) 12 0.01 0.29 0.06 0.6 10
Cyanide, Available (mg/l) 12 <0.006 <0.006 <0.006 0.09 <7
Ammonia (as N, mg/l) 12 <0.1 <0.1 <0.1 25 <1
Surfactants (MBAS) (mg/l) 12 <0.02 0.06 <0.03 0.7 <4
Boron (mg/l) 12 <0.050 0.146 <0.074 1.2(7) <6
Dissolved Copper (mg/l) 12 0.009 0.019 0.014 Monitor(8) ----
Biological Oxygen Demand-5 (mg/l) 12 <2 <4 <4 30(9) <13
Total Suspended Solids (mg/l) 12 1.2 3.7 2.4 30(9) 8
Total Phosphorus
(mg/l) 12 0.24 2.75 1.37 Monitor(8) ----
(kg/month) 12 0.22 4.52 1.99 Note (10) ----
Zinc
(mg/l) 12 <0.005 0.106 <0.016 Monitor(8) ----
(lbs/day) 12 <0.0001 0.015 <0.002 Note (11) ----
Total Copper (lbs/day) 12 0.0001 0.003 0.0016 0.06 3
Iron
(mg/l) 12 <0.050 0.092 <0.054 Monitor(8) ----
(lbs/day) 12 <0.001 0.013 <0.007 Note (12) ----
Aluminum (mg/l) 12 <0.100 0.140 <0.103 2.0(7) <5
Butyl Benzyl Phthalate (mg/l) 12 <0.0050 <0.0051 <0.0050 0.1(7) <5
Additional Parameters Monitored (Not Required by Permit – Reference (22))
Temperature (°F) 360 58 76 66 N/A N/A
Notes:
1. A value preceded by “<” is less than the RL for that sample and parameter. 2. Average values preceded by “<” contain at least one value less than the RL value in the average. 3. Percent of limit for the average value, unless otherwise noted. 4. 30-day average. 5. The pH values are not averaged and are required to be in this range. 6. The average value is well above the limit, which is a minimum value. 7. Values are action levels which are not a limit but a specified effluent level which requires additional short term monitoring
upon exceedance. 8. The Reference (22) permit requires the data to be reported but does not specify a limit for this discharge parameter. 9. The maximum limit for the 30-day arithmetic mean is 30 mg/l; the maximum limit for the 7-day arithmetic mean is 45 mg/l. 10. An action level of 50 kg/month has been assigned for the total mass discharged from Outfalls 001, 002 and 003
combined. An action level is not a limit but a specified effluent level that requires additional short term monitoring upon exceedance.
11. Total Site mass discharge limit of 0.5 lbs/day for Outfalls 001, 002, and 003 combined. 12. Total Site mass discharge limit of 4.0 lbs/day for Outfalls 001, 002, and 003 combined.
N/A = Not Applicable
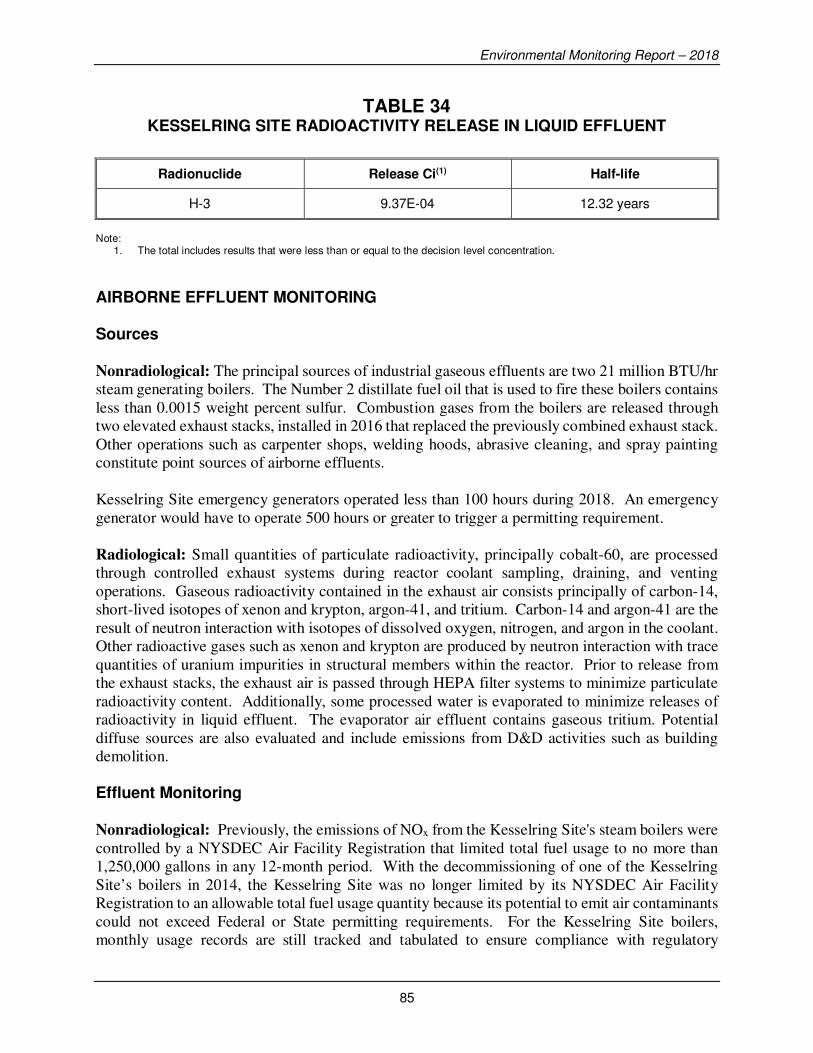
Environmental Monitoring Report – 2018
85
TABLE 34 KESSELRING SITE RADIOACTIVITY RELEASE IN LIQUID EFFLUENT
Radionuclide Release Ci(1) Half-life
H-3 9.37E-04 12.32 years
Note:
1. The total includes results that were less than or equal to the decision level concentration.
AIRBORNE EFFLUENT MONITORING Sources
Nonradiological: The principal sources of industrial gaseous effluents are two 21 million BTU/hr
steam generating boilers. The Number 2 distillate fuel oil that is used to fire these boilers contains
less than 0.0015 weight percent sulfur. Combustion gases from the boilers are released through
two elevated exhaust stacks, installed in 2016 that replaced the previously combined exhaust stack.
Other operations such as carpenter shops, welding hoods, abrasive cleaning, and spray painting
constitute point sources of airborne effluents.
Kesselring Site emergency generators operated less than 100 hours during 2018. An emergency
generator would have to operate 500 hours or greater to trigger a permitting requirement.
Radiological: Small quantities of particulate radioactivity, principally cobalt-60, are processed
through controlled exhaust systems during reactor coolant sampling, draining, and venting
operations. Gaseous radioactivity contained in the exhaust air consists principally of carbon-14,
short-lived isotopes of xenon and krypton, argon-41, and tritium. Carbon-14 and argon-41 are the
result of neutron interaction with isotopes of dissolved oxygen, nitrogen, and argon in the coolant.
Other radioactive gases such as xenon and krypton are produced by neutron interaction with trace
quantities of uranium impurities in structural members within the reactor. Prior to release from
the exhaust stacks, the exhaust air is passed through HEPA filter systems to minimize particulate
radioactivity content. Additionally, some processed water is evaporated to minimize releases of
radioactivity in liquid effluent. The evaporator air effluent contains gaseous tritium. Potential
diffuse sources are also evaluated and include emissions from D&D activities such as building
demolition.
Effluent Monitoring Nonradiological: Previously, the emissions of NOx from the Kesselring Site's steam boilers were
controlled by a NYSDEC Air Facility Registration that limited total fuel usage to no more than
1,250,000 gallons in any 12-month period. With the decommissioning of one of the Kesselring
Site’s boilers in 2014, the Kesselring Site was no longer limited by its NYSDEC Air Facility
Registration to an allowable total fuel usage quantity because its potential to emit air contaminants
could not exceed Federal or State permitting requirements. For the Kesselring Site boilers,
monthly usage records are still tracked and tabulated to ensure compliance with regulatory
Environmental Monitoring Report – 2018
86
requirements. Fuel oil supplier certification certificates for purchased distillate fuel oil are
maintained by the Kesselring Site to confirm that the fuel oil burned in the Kesselring Site boilers
contains less than 0.0015 percent sulfur by weight and conforms to the ASTM Standards for
distillate fuel oil. Semiannual reports demonstrating compliance with the fuel oil sulfur limitation
are sent to the EPA as required by EPA's New Source Performance Standards (NSPS) for these
stationary combustion installations. All other industrial emission points at the Kesselring Site do
not require permits due to very low emission levels.
Radiological: The air exhausted from the reactor plants is continuously monitored for particulate
radioactivity with monitors that are equipped with alarm functions to provide an alert should an
out-of-specification release occur. The air exhausted from all radiological work facilities is
continuously sampled for particulate radioactivity. Reactor plant air emissions are also
continuously sampled for radioiodine with activated charcoal cartridges. Sampling is performed
for tritium and carbon-14 using appropriate absorbers.
Effluent Analyses Radiological: The air particulate sample filters from the radiological emission points are changed
routinely and analyzed by gamma spectrometry. A decision level concentration of approximately
5 x 10-15 µCi/ml is achieved for cobalt-60. The activated charcoal cartridges are analyzed for
radioiodine by gamma spectrometry to a decision level concentration of approximately
5 x 10-15 µCi/ml for iodine-131. The tritium and carbon-14 absorbers are analyzed by liquid
scintillation spectrometry. The decision level concentrations of tritium and carbon-14 in air are
approximately 5 x 10-11 µCi/ml for typical sampling parameters. The quantity of gaseous
radioactivity released is calculated based on reactor plant operating parameters.
Assessment
Nonradiological: Emissions of NOx continue to be well within the limits established by NYSDEC
in the registration associated with the Kesselring Site boiler units. Emissions of sulfur oxides
(SOx) from the Kesselring Site boiler units are also well within the EPA's NSPS emission standards
for stationary combustion installations.
All other point source emissions also conform to the applicable Federal and State clean air
standards.
Radiological: The radioactivity released in airborne effluent during 2018 is shown in Table 35.
The radioactivity was contained in a total volume of 6.80 x 10¹¹ liters of air. The average
radioactivity concentration in the effluent air was well below the applicable standards listed in
Reference (6). The average annual radioactivity concentration at the nearest Kesselring Site
boundary, based on average annual diffusion parameters, was less than 0.01 percent of the DOE
DCS for effluent release to unrestricted areas (Reference (6)) for the mixture of radionuclides
present. Diffuse source emissions are calculated using EPA approved methods. Airborne effluent
monitoring data is reported as required in Reference (8).
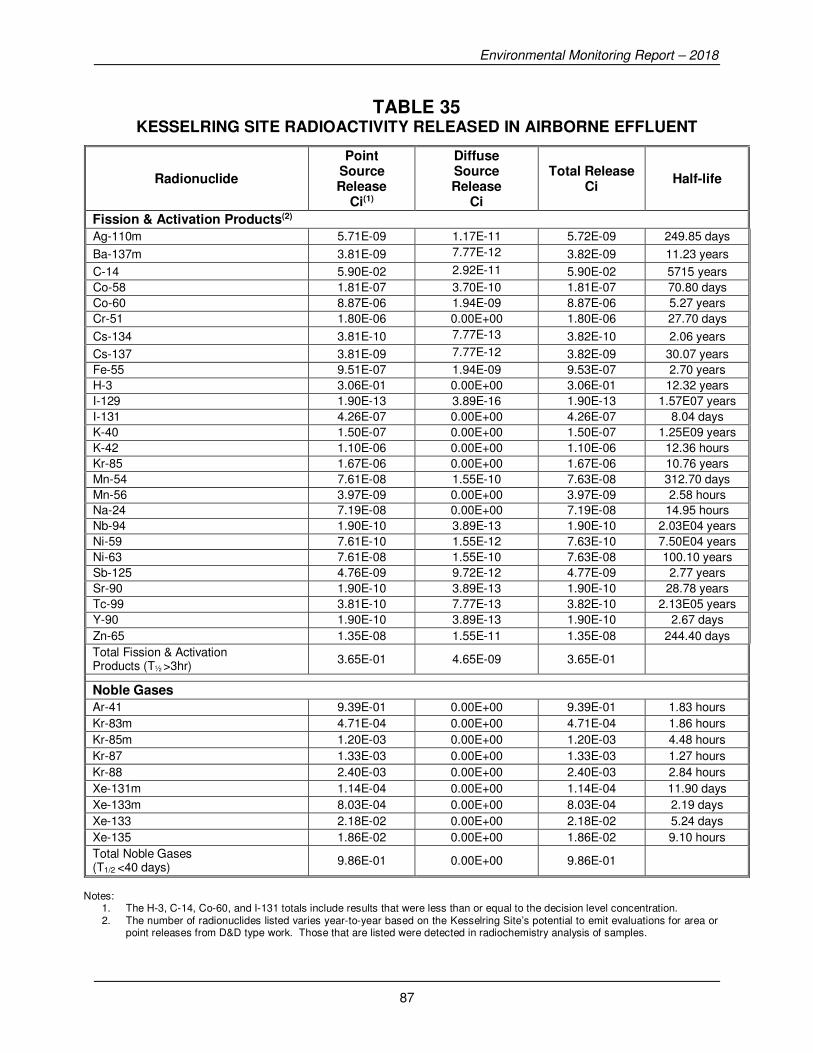
Environmental Monitoring Report – 2018
87
TABLE 35 KESSELRING SITE RADIOACTIVITY RELEASED IN AIRBORNE EFFLUENT
Radionuclide
Point Source Release
Ci(1)
Diffuse Source Release
Ci
Total Release Ci
Half-life
Fission & Activation Products(2)
Ag-110m 5.71E-09 1.17E-11 5.72E-09 249.85 days
Ba-137m 3.81E-09 7.77E-12 3.82E-09 11.23 years
C-14 5.90E-02 2.92E-11 5.90E-02 5715 years
Co-58 1.81E-07 3.70E-10 1.81E-07 70.80 days
Co-60 8.87E-06 1.94E-09 8.87E-06 5.27 years
Cr-51 1.80E-06 0.00E+00 1.80E-06 27.70 days
Cs-134 3.81E-10 7.77E-13 3.82E-10 2.06 years
Cs-137 3.81E-09 7.77E-12 3.82E-09 30.07 years
Fe-55 9.51E-07 1.94E-09 9.53E-07 2.70 years
H-3 3.06E-01 0.00E+00 3.06E-01 12.32 years
I-129 1.90E-13 3.89E-16 1.90E-13 1.57E07 years
I-131 4.26E-07 0.00E+00 4.26E-07 8.04 days
K-40 1.50E-07 0.00E+00 1.50E-07 1.25E09 years
K-42 1.10E-06 0.00E+00 1.10E-06 12.36 hours
Kr-85 1.67E-06 0.00E+00 1.67E-06 10.76 years
Mn-54 7.61E-08 1.55E-10 7.63E-08 312.70 days
Mn-56 3.97E-09 0.00E+00 3.97E-09 2.58 hours
Na-24 7.19E-08 0.00E+00 7.19E-08 14.95 hours
Nb-94 1.90E-10 3.89E-13 1.90E-10 2.03E04 years
Ni-59 7.61E-10 1.55E-12 7.63E-10 7.50E04 years
Ni-63 7.61E-08 1.55E-10 7.63E-08 100.10 years
Sb-125 4.76E-09 9.72E-12 4.77E-09 2.77 years
Sr-90 1.90E-10 3.89E-13 1.90E-10 28.78 years
Tc-99 3.81E-10 7.77E-13 3.82E-10 2.13E05 years
Y-90 1.90E-10 3.89E-13 1.90E-10 2.67 days
Zn-65 1.35E-08 1.55E-11 1.35E-08 244.40 days
Total Fission & Activation Products (T½ >3hr)
3.65E-01 4.65E-09 3.65E-01
Noble Gases
Ar-41 9.39E-01 0.00E+00 9.39E-01 1.83 hours
Kr-83m 4.71E-04 0.00E+00 4.71E-04 1.86 hours
Kr-85m 1.20E-03 0.00E+00 1.20E-03 4.48 hours
Kr-87 1.33E-03 0.00E+00 1.33E-03 1.27 hours
Kr-88 2.40E-03 0.00E+00 2.40E-03 2.84 hours
Xe-131m 1.14E-04 0.00E+00 1.14E-04 11.90 days
Xe-133m 8.03E-04 0.00E+00 8.03E-04 2.19 days
Xe-133 2.18E-02 0.00E+00 2.18E-02 5.24 days
Xe-135 1.86E-02 0.00E+00 1.86E-02 9.10 hours
Total Noble Gases (T1/2 <40 days)
9.86E-01 0.00E+00 9.86E-01
Notes:
1. The H-3, C-14, Co-60, and I-131 totals include results that were less than or equal to the decision level concentration. 2. The number of radionuclides listed varies year-to-year based on the Kesselring Site’s potential to emit evaluations for area or
point releases from D&D type work. Those that are listed were detected in radiochemistry analysis of samples.

Environmental Monitoring Report – 2018
88
ENVIRONMENTAL MONITORING Scope
Nonradiological: The nonradiological environmental monitoring program at the Kesselring Site
during 2018 included monitoring and recording of the Glowegee Creek temperature conducted
upstream of the Kesselring Site, between the discharge channels, and downstream of the
Kesselring Site discharge locations each day the Kesselring Site discharged water through Outfalls
001 and 002 (See Figure 5). Flow measuring equipment is installed in the Kesselring Site’s three
non-stormwater discharge channels. In addition, Glowegee Creek flow is monitored by the U.S.
Geological Survey (USGS) one-half mile downstream of the Kesselring Site at the West Milton
Road gauging station (USGS No. 01330000).
A voluntary aquatic life sampling and evaluation program is conducted in the Glowegee Creek
upstream, near the discharge channels, and downstream in the Glowegee Creek. Backpack electro-
fishing techniques are used to collect the fish, which are identified, measured, and returned to the
creek unharmed.
The Kesselring Site operated its own sanitary landfill for the disposal of non-radioactive and non-
hazardous solid wastes until October 1993, when landfill operations permanently ceased.
NYSDEC approved the final Landfill Closure Plan, and landfill closure construction was
completed in October 1994. The closed landfill is maintained in accordance with a Post Closure
Monitoring and Maintenance Operations Manual, which has been approved by NYSDEC.
Groundwater monitoring of the landfill is performed in accordance with this manual.
Radiological: The radiological environmental monitoring program at the Kesselring Site during
2018 included: (1) the collection of fish upstream and downstream of discharge locations to the
Glowegee Creek, (2) the collection of quarterly samples of Glowegee Creek water and sediment
at five locations, and (3) the operation of continuous air samplers at stations located in the primary
upwind and downwind directions from the Kesselring Site.
Three samples of sediment and one composite water sample are collected quarterly for
radioanalysis across the creek at the five locations shown in Figure 5.
Environmental air samplers are operated in the primary upwind and downwind directions from the
Kesselring Site to measure normal background airborne radioactivity and to confirm that
Kesselring Site effluents have no measurable effect on normal background levels.
Analyses
Radiological: The routine quarterly samples of Glowegee Creek water and bottom sediment
samples are analyzed with a high-purity germanium gamma spectrometer system. In addition, a
more sensitive gamma spectrometry analyses is performed annually on the fish and some of the
water and sediment samples collected from the Glowegee Creek. The more sensitive analysis is
intended to fully characterize the low levels of naturally and non-naturally occurring gamma-
Environmental Monitoring Report – 2018
89
emitting radionuclides. The environmental air particulate sample filters are changed and analyzed
routinely by high-purity germanium gamma spectrum analysis.
Assessment
Nonradiological: The Glowegee Creek fish survey results from 2018 are summarized in Table 36.
The concentrations of chemical constituents in liquid effluent from the Kesselring Site resulted in
no adverse effect on the quality of the Glowegee Creek. This conclusion is substantiated by results
of the fish surveys that confirmed the existence of a diverse and healthy aquatic community in the
creek water. The 2018 survey data is consistent with historical fish survey data. The different
relative abundance of fish species at each sampling location reflects their different preferred
habitats.
Radiological: The gamma spectrum analysis results for fish collected from the Glowegee Creek
are shown in Table 37. The results show no radioactivity attributable to Kesselring Site operations.
The only radionuclide observed in both fish samples was potassium-40. This naturally occurring
radionuclide is frequently observed in fish.
Results of the gamma analysis of sediment and water samples are shown in Table 38. The data
shows that there is no significant difference between radioactivity concentrations measured
upstream and downstream. Only naturally occurring radionuclides were detected in the Glowegee
Creek water samples. Results of the detailed gamma spectrum analyses performed on sediment
samples also indicate low concentrations of potassium-40, cesium-137, and daughters of uranium
and thorium. Potassium-40 and the daughters of uranium and thorium are naturally occurring
radionuclides and are not associated with Kesselring Site operations. The EPA has attributed
similar low levels of cesium-137 to fallout from low yield atmospheric nuclear weapon tests. Since
the beginning of prototype operations more than 60 years ago, the release of radioactivity into the
Glowegee Creek has been small and has had no adverse effect on the natural background
radioactivity levels in the sediment.
The results for the environmental air samples show that there was no significant difference between
the average upwind and downwind radioactivity concentrations. The average upwind radioactivity
concentration was 2.80 x 10⁻¹⁵ µCi/ml and the average downwind radioactivity concentration was
5.54 x 10⁻¹⁵ µCi/ml. Gamma spectrum analyses indicated the presence of only background
quantities of naturally occurring radionuclides.
RADIATION MONITORING
The purpose of the environmental radiation monitoring program is to measure the ambient
radiation levels around the Kesselring Site to confirm that operations have not altered the natural
radiation background levels at the Kesselring Site perimeter. The sources of radiation at the
Kesselring Site are the operation and maintenance of the prototype reactor plants.
Environmental Monitoring Report – 2018
90
Scope
Environmental radiation levels were monitored at the perimeter of the Kesselring Site with a
network of DT-702/PD lithium fluoride TLDs. The eight locations of the Kesselring Site perimeter
TLDs are shown in Figure 6. Control TLDs were posted at four remote off-site locations to
measure the natural background levels typical of the surrounding area. All TLDs were posted for
quarterly exposure periods.
Analyses
The DT-702/PD lithium-fluoride environmental TLDs are calibrated to a cesium-137 standard
source. The TLD radiation exposures were measured quarterly utilizing an automated TLD
readout system that was calibrated prior to the processing of the TLDs.
Assessment
The total annual radiation exposures measured with TLDs at the boundary of the Kesselring Site
and at remote, off-site monitoring locations are summarized in Table 39. There is no statistically
significant difference between the perimeter and the off-site measurements. This shows that
Kesselring Site operations in 2018 had no measurable effect on natural background radiation levels
at the Kesselring Site perimeter.
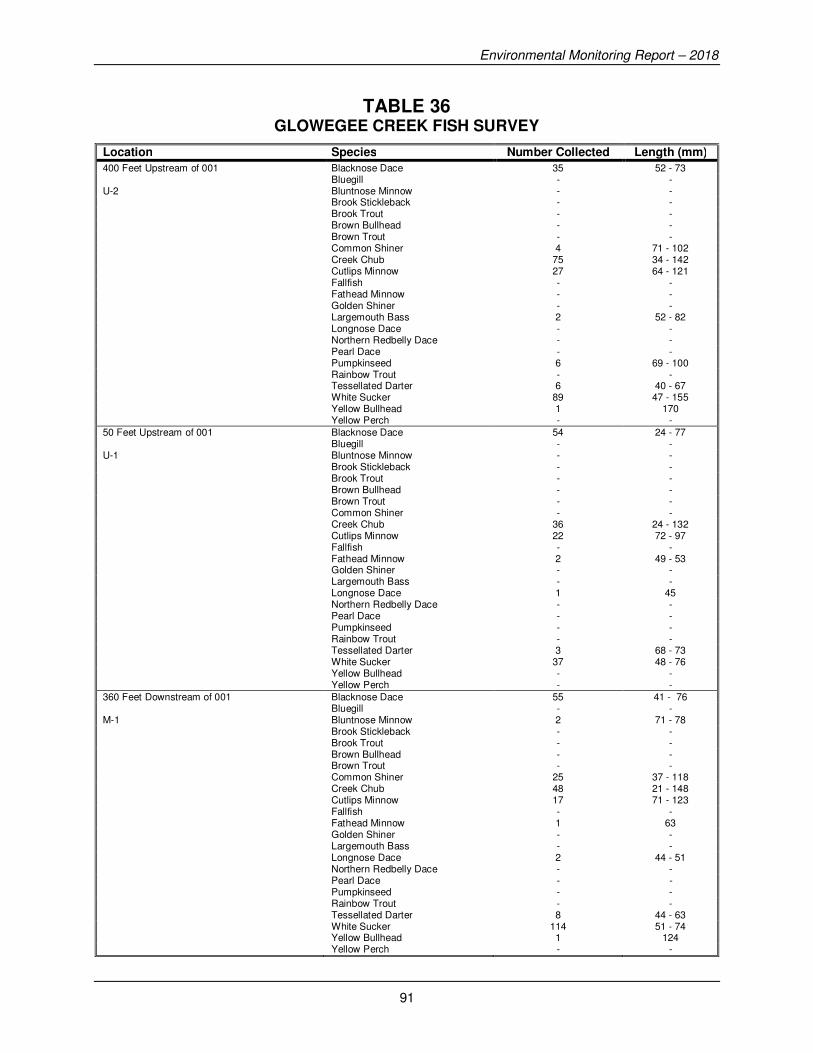
Environmental Monitoring Report – 2018
91
TABLE 36 GLOWEGEE CREEK FISH SURVEY
Location Species Number Collected Length (mm)
400 Feet Upstream of 001 Blacknose Dace 35 52 - 73 Bluegill - - U-2 Bluntnose Minnow - - Brook Stickleback - - Brook Trout - - Brown Bullhead - - Brown Trout - - Common Shiner 4 71 - 102 Creek Chub 75 34 - 142 Cutlips Minnow 27 64 - 121 Fallfish - - Fathead Minnow - - Golden Shiner - - Largemouth Bass 2 52 - 82 Longnose Dace - - Northern Redbelly Dace - - Pearl Dace - - Pumpkinseed 6 69 - 100 Rainbow Trout - - Tessellated Darter 6 40 - 67 White Sucker 89 47 - 155 Yellow Bullhead 1 170 Yellow Perch - -
50 Feet Upstream of 001 Blacknose Dace 54 24 - 77 Bluegill - - U-1 Bluntnose Minnow - - Brook Stickleback - - Brook Trout - - Brown Bullhead - - Brown Trout - - Common Shiner - - Creek Chub 36 24 - 132 Cutlips Minnow 22 72 - 97 Fallfish - - Fathead Minnow 2 49 - 53 Golden Shiner - - Largemouth Bass - - Longnose Dace 1 45 Northern Redbelly Dace - - Pearl Dace - - Pumpkinseed - - Rainbow Trout - - Tessellated Darter 3 68 - 73 White Sucker 37 48 - 76 Yellow Bullhead - - Yellow Perch - -
360 Feet Downstream of 001 Blacknose Dace 55 41 - 76 Bluegill - - M-1 Bluntnose Minnow 2 71 - 78 Brook Stickleback - - Brook Trout - - Brown Bullhead - - Brown Trout - - Common Shiner 25 37 - 118 Creek Chub 48 21 - 148 Cutlips Minnow 17 71 - 123 Fallfish - - Fathead Minnow 1 63 Golden Shiner - - Largemouth Bass - - Longnose Dace 2 44 - 51 Northern Redbelly Dace - - Pearl Dace - - Pumpkinseed - - Rainbow Trout - - Tessellated Darter 8 44 - 63 White Sucker 114 51 - 74 Yellow Bullhead 1 124 Yellow Perch - -
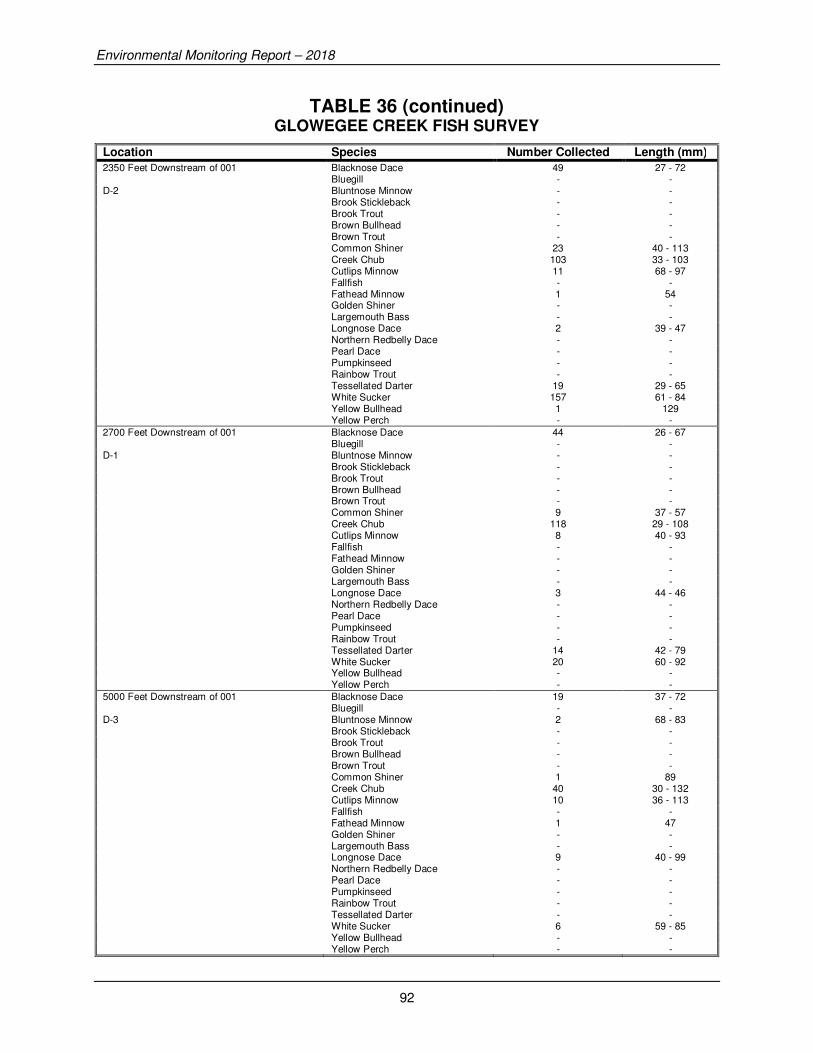
Environmental Monitoring Report – 2018
92
TABLE 36 (continued) GLOWEGEE CREEK FISH SURVEY
Location Species Number Collected Length (mm)
2350 Feet Downstream of 001 Blacknose Dace 49 27 - 72 Bluegill - - D-2 Bluntnose Minnow - - Brook Stickleback - - Brook Trout - - Brown Bullhead - - Brown Trout - - Common Shiner 23 40 - 113 Creek Chub 103 33 - 103 Cutlips Minnow 11 68 - 97 Fallfish - - Fathead Minnow 1 54 Golden Shiner - - Largemouth Bass - - Longnose Dace 2 39 - 47 Northern Redbelly Dace - - Pearl Dace - - Pumpkinseed - - Rainbow Trout - - Tessellated Darter 19 29 - 65 White Sucker 157 61 - 84 Yellow Bullhead 1 129 Yellow Perch - -
2700 Feet Downstream of 001 Blacknose Dace 44 26 - 67 Bluegill - - D-1 Bluntnose Minnow - - Brook Stickleback - - Brook Trout - - Brown Bullhead - - Brown Trout - - Common Shiner 9 37 - 57 Creek Chub 118 29 - 108 Cutlips Minnow 8 40 - 93 Fallfish - - Fathead Minnow - - Golden Shiner - - Largemouth Bass - - Longnose Dace 3 44 - 46 Northern Redbelly Dace - - Pearl Dace - - Pumpkinseed - - Rainbow Trout - - Tessellated Darter 14 42 - 79 White Sucker 20 60 - 92 Yellow Bullhead - - Yellow Perch - -
5000 Feet Downstream of 001 Blacknose Dace 19 37 - 72 Bluegill - - D-3 Bluntnose Minnow 2 68 - 83 Brook Stickleback - - Brook Trout - - Brown Bullhead - - Brown Trout - - Common Shiner 1 89 Creek Chub 40 30 - 132 Cutlips Minnow 10 36 - 113 Fallfish - - Fathead Minnow 1 47 Golden Shiner - - Largemouth Bass - - Longnose Dace 9 40 - 99 Northern Redbelly Dace - - Pearl Dace - - Pumpkinseed - - Rainbow Trout - - Tessellated Darter - - White Sucker 6 59 - 85 Yellow Bullhead - - Yellow Perch - -
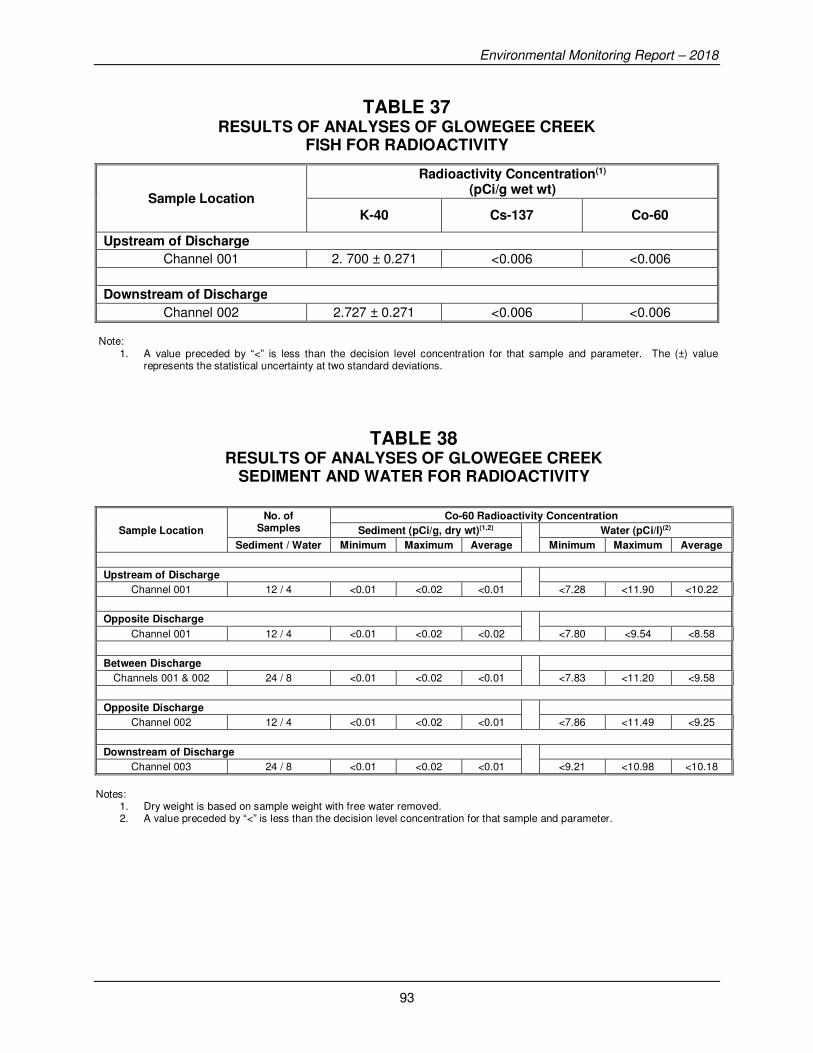
Environmental Monitoring Report – 2018
93
TABLE 37 RESULTS OF ANALYSES OF GLOWEGEE CREEK
FISH FOR RADIOACTIVITY
Sample Location
Radioactivity Concentration(1) (pCi/g wet wt)
K-40 Cs-137 Co-60
Upstream of Discharge
Channel 001 2. 700 ± 0.271 <0.006 <0.006
Downstream of Discharge
Channel 002 2.727 ± 0.271 <0.006 <0.006 Note:
1. A value preceded by “<” is less than the decision level concentration for that sample and parameter. The (±) value represents the statistical uncertainty at two standard deviations.
TABLE 38 RESULTS OF ANALYSES OF GLOWEGEE CREEK
SEDIMENT AND WATER FOR RADIOACTIVITY
Sample Location
No. of Samples
Co-60 Radioactivity Concentration
Sediment (pCi/g, dry wt)(1,2) Water (pCi/l)(2)
Sediment / Water Minimum Maximum Average Minimum Maximum Average
Upstream of Discharge
Channel 001 12 / 4 <0.01 <0.02 <0.01 <7.28 <11.90 <10.22
Opposite Discharge
Channel 001 12 / 4 <0.01 <0.02 <0.02 <7.80 <9.54 <8.58
Between Discharge
Channels 001 & 002 24 / 8 <0.01 <0.02 <0.01 <7.83 <11.20 <9.58
Opposite Discharge
Channel 002 12 / 4 <0.01 <0.02 <0.01 <7.86 <11.49 <9.25
Downstream of Discharge
Channel 003 24 / 8 <0.01 <0.02 <0.01 <9.21 <10.98 <10.18
Notes:
1. Dry weight is based on sample weight with free water removed. 2. A value preceded by “<” is less than the decision level concentration for that sample and parameter.
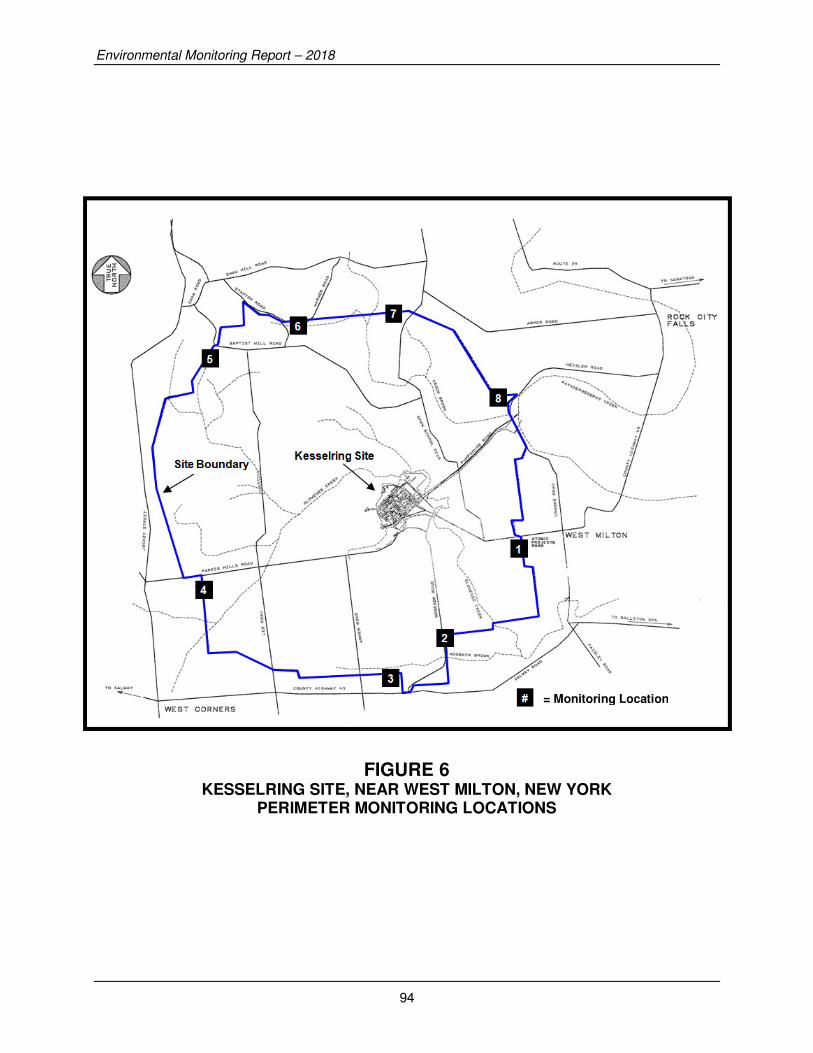
Environmental Monitoring Report – 2018
94
FIGURE 6
KESSELRING SITE, NEAR WEST MILTON, NEW YORK PERIMETER MONITORING LOCATIONS
= Monitoring Location
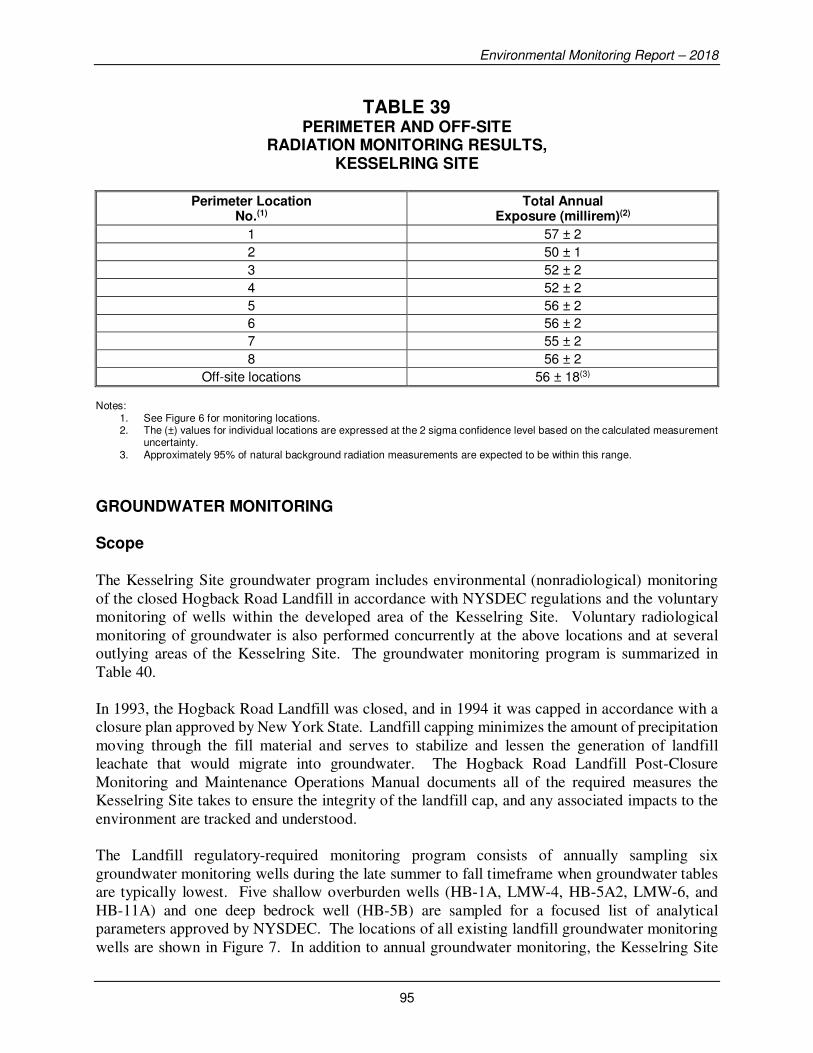
Environmental Monitoring Report – 2018
95
TABLE 39 PERIMETER AND OFF-SITE
RADIATION MONITORING RESULTS, KESSELRING SITE
Perimeter Location No.(1)
Total Annual Exposure (millirem)(2)
1 57 ± 2
2 50 ± 1
3 52 ± 2
4 52 ± 2
5 56 ± 2
6 56 ± 2
7 55 ± 2
8 56 ± 2
Off-site locations 56 ± 18(3)
Notes:
1. See Figure 6 for monitoring locations. 2. The (±) values for individual locations are expressed at the 2 sigma confidence level based on the calculated measurement
uncertainty. 3. Approximately 95% of natural background radiation measurements are expected to be within this range.
GROUNDWATER MONITORING
Scope The Kesselring Site groundwater program includes environmental (nonradiological) monitoring
of the closed Hogback Road Landfill in accordance with NYSDEC regulations and the voluntary
monitoring of wells within the developed area of the Kesselring Site. Voluntary radiological
monitoring of groundwater is also performed concurrently at the above locations and at several
outlying areas of the Kesselring Site. The groundwater monitoring program is summarized in
Table 40.
In 1993, the Hogback Road Landfill was closed, and in 1994 it was capped in accordance with a
closure plan approved by New York State. Landfill capping minimizes the amount of precipitation
moving through the fill material and serves to stabilize and lessen the generation of landfill
leachate that would migrate into groundwater. The Hogback Road Landfill Post-Closure
Monitoring and Maintenance Operations Manual documents all of the required measures the
Kesselring Site takes to ensure the integrity of the landfill cap, and any associated impacts to the
environment are tracked and understood.
The Landfill regulatory-required monitoring program consists of annually sampling six
groundwater monitoring wells during the late summer to fall timeframe when groundwater tables
are typically lowest. Five shallow overburden wells (HB-1A, LMW-4, HB-5A2, LMW-6, and
HB-11A) and one deep bedrock well (HB-5B) are sampled for a focused list of analytical
parameters approved by NYSDEC. The locations of all existing landfill groundwater monitoring
wells are shown in Figure 7. In addition to annual groundwater monitoring, the Kesselring Site
Environmental Monitoring Report – 2018
96
performs quarterly inspections of landfill integrity and an annual survey for explosive gases at the
landfill gas vents.
The groundwater monitoring program for the developed area (Figure 8) typically consists of annual
sampling of 18 monitoring wells. This sampling is performed as a best management practice to
track known constituents and to provide early detection of unexpected releases.
The groundwater monitoring program for the former disposal areas consists of annual sampling of
13 monitoring wells (Figure 9) for radiological analyses. In 1999, the Kesselring Site evaluated
each of the former disposal sites with regard to the nature of the disposal source material,
hydrogeology, and historic analytical database, and concluded that no groundwater threat exists.
These wells are monitored to maintain a record of negative radiological data.
Sources Nonradiological: Elevated parameters in the landfill wells are associated with past disposal
practices. The landfill, operated since 1951 and closed in 1993, was used predominantly for the
disposal of sanitary wastes. Prior to enactment of Federal and State regulations for solid waste
disposal activities that banned disposal of certain wastes in such facilities, asbestos scraps, scrap
metal including lead, some oil and oily water, solvents, paint, and chemicals were disposed of in
the landfill.
Elevated parameters in and adjacent to the developed area of the Kesselring Site are predominantly
the result of operational activities, such as: historical material handling practices and construction
activities, on-going use of roadway de-icing materials (e.g., sodium chloride, calcium chloride,
etc.), cooling tower operations, and routine operations of Site Service Water systems containing
chlorine. In 2007, elevated ammonia levels were detected in groundwater collected from the
drainage system underlying the newly constructed Building 102. Investigation of the elevated
ammonia levels indicated some potential sources, including leaking sanitary sewage lines and
historic farming operations. Results of the investigation did not reveal a definitive source;
however, any identified issues with sewage lines in the vicinity have since been fixed.
The five former disposal sites at the Kesselring Site were used for construction and demolition
waste, limited amounts of acid waste, and some waste burning. These disposal practices were
conducted prior to enactment of Federal and State regulations governing the disposal of these
materials.
Analyses
Nonradiological: All groundwater samples are analyzed by a New York State Department of
Health certified laboratory for chemical parameters in accordance with Reference (10) or other
EPA approved methods. Field parameters, which include static water level, temperature, and pH,
are measured on site at the time of environmental sampling. Specific conductance and turbidity
are sampled on site at the time of sampling for some monitoring events and are analyzed at a
certified laboratory for others.
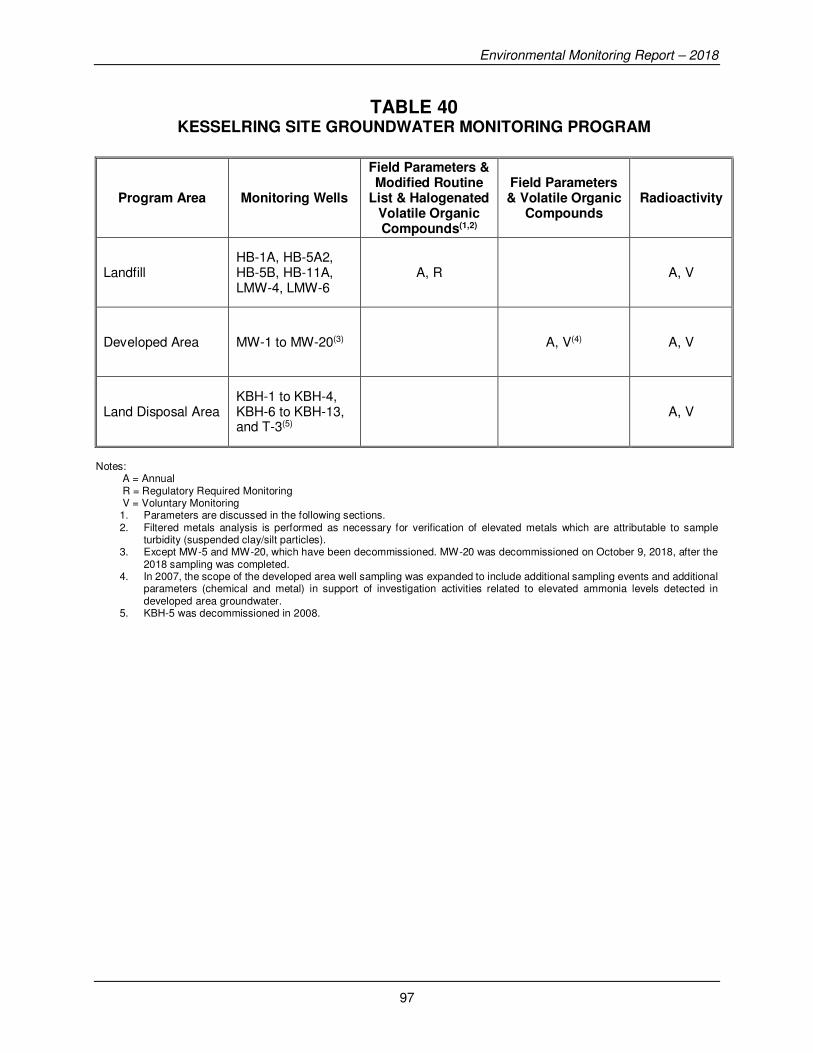
Environmental Monitoring Report – 2018
97
TABLE 40 KESSELRING SITE GROUNDWATER MONITORING PROGRAM
Program Area Monitoring Wells
Field Parameters & Modified Routine
List & Halogenated Volatile Organic Compounds(1,2)
Field Parameters & Volatile Organic
Compounds Radioactivity
Landfill HB-1A, HB-5A2, HB-5B, HB-11A, LMW-4, LMW-6
A, R A, V
Developed Area MW-1 to MW-20(3) A, V(4) A, V
Land Disposal Area KBH-1 to KBH-4, KBH-6 to KBH-13, and T-3(5)
A, V
Notes:
A = Annual R = Regulatory Required Monitoring V = Voluntary Monitoring 1. Parameters are discussed in the following sections. 2. Filtered metals analysis is performed as necessary for verification of elevated metals which are attributable to sample
turbidity (suspended clay/silt particles). 3. Except MW-5 and MW-20, which have been decommissioned. MW-20 was decommissioned on October 9, 2018, after the
2018 sampling was completed. 4. In 2007, the scope of the developed area well sampling was expanded to include additional sampling events and additional
parameters (chemical and metal) in support of investigation activities related to elevated ammonia levels detected in developed area groundwater.
5. KBH-5 was decommissioned in 2008.

Environmental Monitoring Report – 2018
98
FIGURE 7 KESSELRING SITE, NEAR WEST MILTON, NEW YORK
LANDFILL GROUNDWATER MONITORING WELLS

Environmental Monitoring Report – 2018
99
FIGURE 8 KESSELRING SITE, NEAR WEST MILTON, NEW YORK
DEVELOPED AREA GROUNDWATER MONITORING WELLS
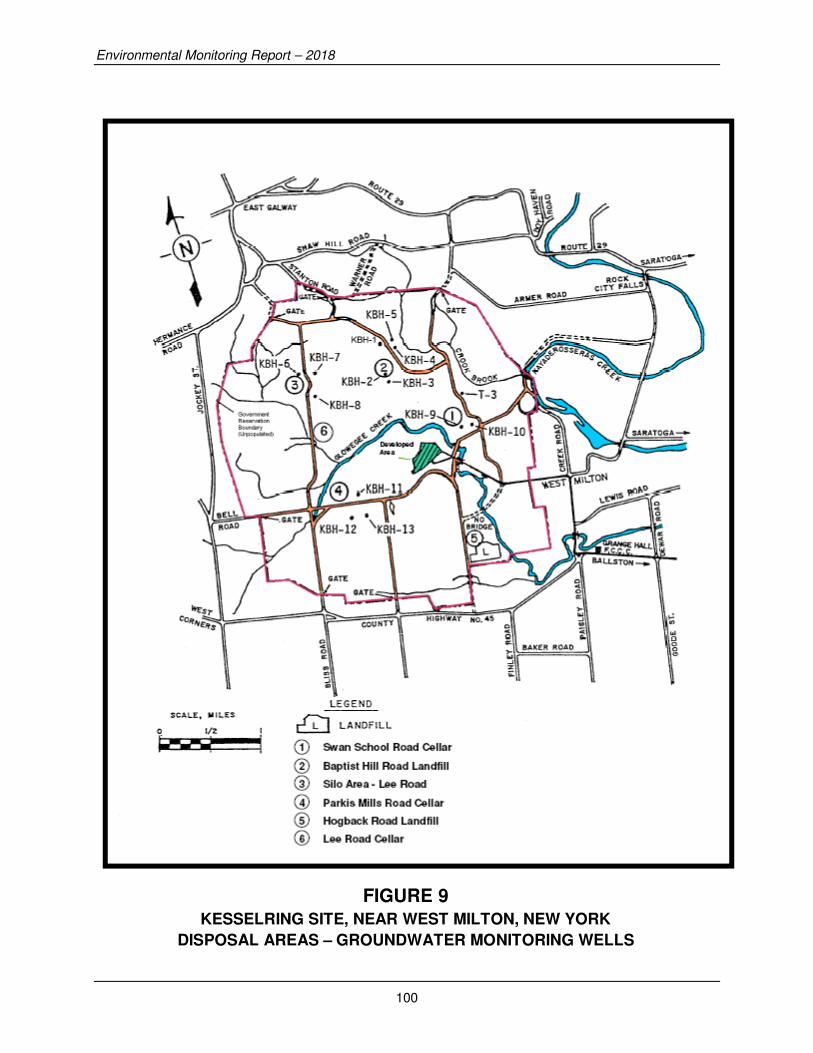
Environmental Monitoring Report – 2018
100
FIGURE 9
KESSELRING SITE, NEAR WEST MILTON, NEW YORK
DISPOSAL AREAS – GROUNDWATER MONITORING WELLS
Environmental Monitoring Report – 2018
101
Landfill samples are analyzed for a modified list of routine chemical and leachate-indicator
parameters approved by NYSDEC in 2002. The modified routine parameter list includes alkalinity,
ammonia, chemical oxygen demand (COD), chloride, hardness, nitrate, sulfate, total dissolved
solids (TDS), total organic carbon (TOC), calcium, iron, manganese, magnesium, potassium, and
sodium. The samples are also analyzed for halogenated and aromatic volatile organic compounds
(VOCs). All samples were collected in accordance with the procedures and requirements of the
Post-Closure Monitoring and Maintenance Operations Manual. All routine parameter results are
shown in Table 41. Gas monitoring was performed at the landfill in accordance with the
post-closure monitoring requirements using an oxygen/explosive gas detector calibrated to the
manufacturer’s specifications.
Within the developed area, the 18 monitoring wells are sampled for both halogenated and aromatic
VOCs. The VOC analysis suite consists of 29 halogenated and 5 aromatic compounds of which
only a few have been detected above the practical quantitation limit in the past. VOC results are
shown in Table 42. In addition, laboratory analyses are performed for chloride, nitrate, ammonia,
and nitrite for the developed area monitoring wells.
Groundwater from three production wells located along the Kesselring Site’s eastern property
boundary is used to supply the drinking water system at the Kesselring Site. The drinking water
is sampled in accordance with New York State drinking water regulations defined in Reference
(23). The sample results are shown in Table 43.
Radiological: The Kesselring Site conducts voluntary radiological monitoring on the groundwater
wells at the landfill area, the developed area, and four former disposal sites. The well locations
are shown in Figures 7, 8, and 9. The well samples are analyzed by gamma spectrometry for
cesium-137 and cobalt-60 and by liquid scintillation spectrometry for tritium. The results of the
analyses are shown in Table 44.
Assessment Nonradiological:
Landfill Groundwater wells were sampled both upgradient and downgradient of the Hogback Road Landfill
to monitor groundwater quality impacts from the landfill and for any indications of a breach in the
integrity of the landfill cap. Analytical results obtained during 2018 remain consistent overall with
historical data trends.
The 2018 analytical results continue to show that while certain routine parameters remain elevated
in most of the downgradient wells when compared to the upgradient well (HB-1A) (Table 41),
these parameters are either stable or decreasing over time, and that there remains no indication of
a breach in landfill cap integrity. The individual parameters that are typically elevated include:
specific conductance, alkalinity, hardness, TDS, chloride, sulfate, magnesium, manganese,
potassium, sodium, calcium, and VOCs. A number of other parameters exhibit variability and are
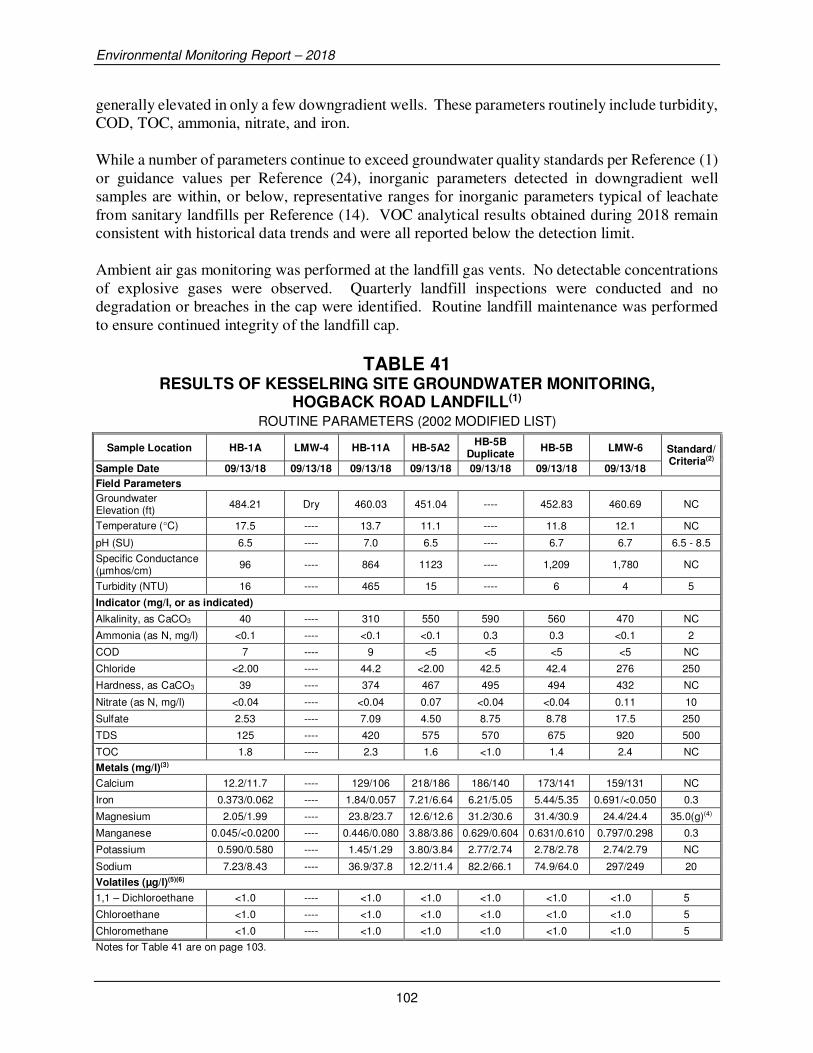
Environmental Monitoring Report – 2018
102
generally elevated in only a few downgradient wells. These parameters routinely include turbidity,
COD, TOC, ammonia, nitrate, and iron.
While a number of parameters continue to exceed groundwater quality standards per Reference (1)
or guidance values per Reference (24), inorganic parameters detected in downgradient well
samples are within, or below, representative ranges for inorganic parameters typical of leachate
from sanitary landfills per Reference (14). VOC analytical results obtained during 2018 remain
consistent with historical data trends and were all reported below the detection limit.
Ambient air gas monitoring was performed at the landfill gas vents. No detectable concentrations
of explosive gases were observed. Quarterly landfill inspections were conducted and no
degradation or breaches in the cap were identified. Routine landfill maintenance was performed
to ensure continued integrity of the landfill cap.
TABLE 41 RESULTS OF KESSELRING SITE GROUNDWATER MONITORING,
HOGBACK ROAD LANDFILL(1) ROUTINE PARAMETERS (2002 MODIFIED LIST)
Sample Location HB-1A LMW-4 HB-11A HB-5A2 HB-5B
Duplicate HB-5B LMW-6 Standard/
Criteria(2)
Sample Date 09/13/18 09/13/18 09/13/18 09/13/18 09/13/18 09/13/18 09/13/18
Field Parameters
Groundwater Elevation (ft)
484.21 Dry 460.03 451.04 ---- 452.83 460.69 NC
Temperature (°C) 17.5 ---- 13.7 11.1 ---- 11.8 12.1 NC
pH (SU) 6.5 ---- 7.0 6.5 ---- 6.7 6.7 6.5 - 8.5
Specific Conductance (µmhos/cm)
96 ---- 864 1123 ---- 1,209 1,780 NC
Turbidity (NTU) 16 ---- 465 15 ---- 6 4 5
Indicator (mg/l, or as indicated)
Alkalinity, as CaCO3 40 ---- 310 550 590 560 470 NC
Ammonia (as N, mg/l) <0.1 ---- <0.1 <0.1 0.3 0.3 <0.1 2
COD 7 ---- 9 <5 <5 <5 <5 NC
Chloride <2.00 ---- 44.2 <2.00 42.5 42.4 276 250
Hardness, as CaCO3 39 ---- 374 467 495 494 432 NC
Nitrate (as N, mg/l) <0.04 ---- <0.04 0.07 <0.04 <0.04 0.11 10
Sulfate 2.53 ---- 7.09 4.50 8.75 8.78 17.5 250
TDS 125 ---- 420 575 570 675 920 500
TOC 1.8 ---- 2.3 1.6 <1.0 1.4 2.4 NC
Metals (mg/l)(3)
Calcium 12.2/11.7 ---- 129/106 218/186 186/140 173/141 159/131 NC
Iron 0.373/0.062 ---- 1.84/0.057 7.21/6.64 6.21/5.05 5.44/5.35 0.691/<0.050 0.3
Magnesium 2.05/1.99 ---- 23.8/23.7 12.6/12.6 31.2/30.6 31.4/30.9 24.4/24.4 35.0(g)(4)
Manganese 0.045/<0.0200 ---- 0.446/0.080 3.88/3.86 0.629/0.604 0.631/0.610 0.797/0.298 0.3
Potassium 0.590/0.580 ---- 1.45/1.29 3.80/3.84 2.77/2.74 2.78/2.78 2.74/2.79 NC
Sodium 7.23/8.43 ---- 36.9/37.8 12.2/11.4 82.2/66.1 74.9/64.0 297/249 20
Volatiles (µg/l)(5)(6)
1,1 – Dichloroethane <1.0 ---- <1.0 <1.0 <1.0 <1.0 <1.0 5
Chloroethane <1.0 ---- <1.0 <1.0 <1.0 <1.0 <1.0 5
Chloromethane <1.0 ---- <1.0 <1.0 <1.0 <1.0 <1.0 5
Notes for Table 41 are on page 103.
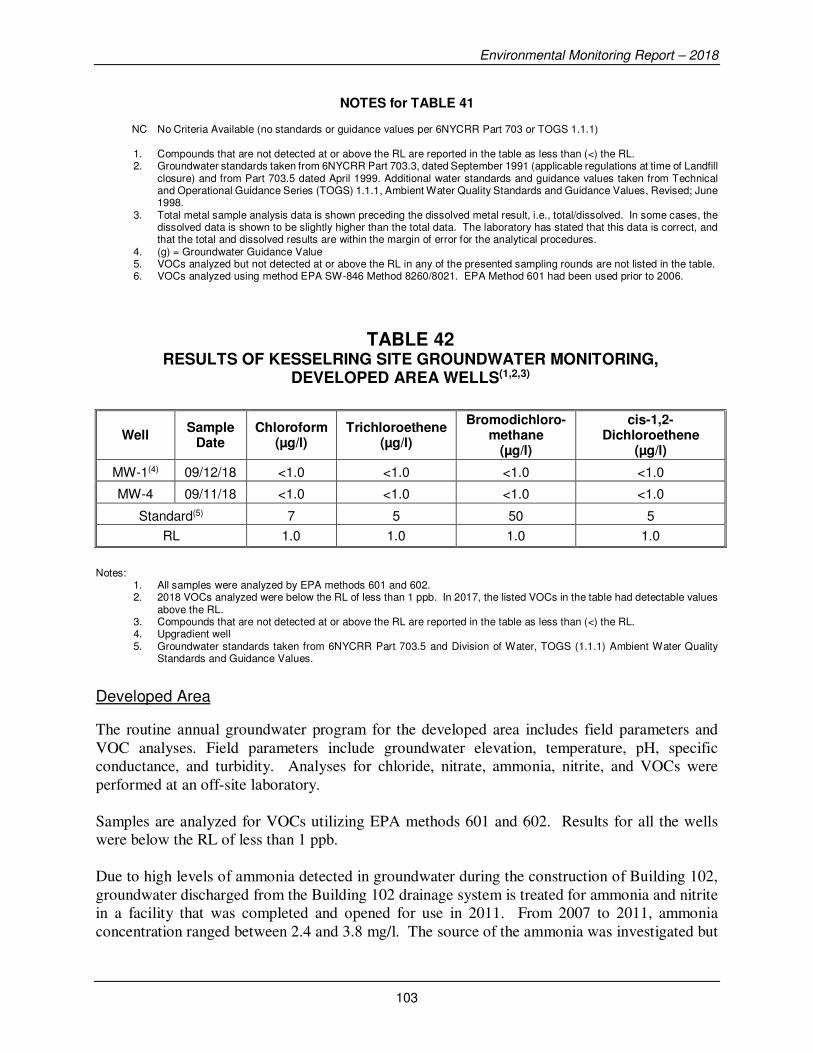
Environmental Monitoring Report – 2018
103
NOTES for TABLE 41
NC No Criteria Available (no standards or guidance values per 6NYCRR Part 703 or TOGS 1.1.1) 1. Compounds that are not detected at or above the RL are reported in the table as less than (<) the RL. 2. Groundwater standards taken from 6NYCRR Part 703.3, dated September 1991 (applicable regulations at time of Landfill
closure) and from Part 703.5 dated April 1999. Additional water standards and guidance values taken from Technical and Operational Guidance Series (TOGS) 1.1.1, Ambient Water Quality Standards and Guidance Values, Revised; June 1998.
3. Total metal sample analysis data is shown preceding the dissolved metal result, i.e., total/dissolved. In some cases, the dissolved data is shown to be slightly higher than the total data. The laboratory has stated that this data is correct, and that the total and dissolved results are within the margin of error for the analytical procedures.
4. (g) = Groundwater Guidance Value 5. VOCs analyzed but not detected at or above the RL in any of the presented sampling rounds are not listed in the table. 6. VOCs analyzed using method EPA SW-846 Method 8260/8021. EPA Method 601 had been used prior to 2006.
TABLE 42
RESULTS OF KESSELRING SITE GROUNDWATER MONITORING, DEVELOPED AREA WELLS(1,2,3)
Well Sample
Date Chloroform
(µg/l) Trichloroethene
(µg/l)
Bromodichloro- methane
(µg/l)
cis-1,2-Dichloroethene
(µg/l)
MW-1(4) 09/12/18 <1.0 <1.0 <1.0 <1.0
MW-4 09/11/18 <1.0 <1.0 <1.0 <1.0
Standard(5) 7 5 50 5
RL 1.0 1.0 1.0 1.0
Notes:
1. All samples were analyzed by EPA methods 601 and 602. 2. 2018 VOCs analyzed were below the RL of less than 1 ppb. In 2017, the listed VOCs in the table had detectable values
above the RL. 3. Compounds that are not detected at or above the RL are reported in the table as less than (<) the RL. 4. Upgradient well 5. Groundwater standards taken from 6NYCRR Part 703.5 and Division of Water, TOGS (1.1.1) Ambient Water Quality
Standards and Guidance Values.
Developed Area The routine annual groundwater program for the developed area includes field parameters and
VOC analyses. Field parameters include groundwater elevation, temperature, pH, specific
conductance, and turbidity. Analyses for chloride, nitrate, ammonia, nitrite, and VOCs were
performed at an off-site laboratory.
Samples are analyzed for VOCs utilizing EPA methods 601 and 602. Results for all the wells
were below the RL of less than 1 ppb.
Due to high levels of ammonia detected in groundwater during the construction of Building 102,
groundwater discharged from the Building 102 drainage system is treated for ammonia and nitrite
in a facility that was completed and opened for use in 2011. From 2007 to 2011, ammonia
concentration ranged between 2.4 and 3.8 mg/l. The source of the ammonia was investigated but

Environmental Monitoring Report – 2018
104
has not been specifically identified. Groundwater ammonia ranged between <0.1 mg/l to 14.2 mg/l
in 2018.
Elevated chloride and turbidity levels are attributed to the on-going use of roadway de-icing
materials and snow/ice removal operations. In 2018, groundwater chloride results ranged between
49.9 mg/l to 7,890 mg/l, and turbidity ranged from 2 ntu to >999 ntu, consistent with elevated
chloride levels. The 2018 pH results were all within the acceptable range for groundwater
standards.
Site Service (Drinking) Water
The drinking water supply is part of the Site Service Water (SSW) system and is supplied from a
deep (confined) groundwater aquifer. The drinking water system is sampled and monitored to
ensure its quality meets New York State Department of Health drinking water regulations
(Reference (23)). The sample results are shown in Table 43. The SSW well field is
hydrogeologically separate from the Kesselring Site landfill and former disposal sites and is
consequently not affected by materials at those locations.
Radiological: The groundwater sample results for radioactivity are summarized in Table 44. The
levels of cesium-137, cobalt-60, and tritium were below decision level concentrations in all wells.
The concentrations for these radionuclides were less than 0.1 percent of the respective
Reference (6) DCS values.

Environmental Monitoring Report – 2018
105
TABLE 43 CHEMICAL CONSTITUENTS IN KESSELRING SITE
DRINKING WATER
Parameter / Units(1)
(Units are mg/l unless otherwise noted)
Number of Samples
Value(2)
Standard(4) Percent of Standard(5) Minimum Maximum Average(3)
Drinking Water Standards (Reference (23))
Nitrates (mg/l as N) 1 0.633 0.633 0.633 10 6
Total Coliform(6,7) (CFU/100ml) 36 <1 <1 <1 None Detectable
N/A
Free Chlorine Residual 365 0.60 2.6 1.48 Note (8) N/A
Free Chlorine Residual(7) 36 0.05 2.03 1.29 Note (8) N/A
Benzene(9) 1 <0.0005 <0.0005 <0.0005 0.005 <10
Bromobenzene(9) 1 <0.0005 <0.0005 <0.0005 0.005 <10
Bromochloromethane(9) 1 <0.0005 <0.0005 <0.0005 0.005 <10
Bromomethane(9) 1 <0.0005 <0.0005 <0.0005 0.005 <10
n-Butylbenzene(9) 1 <0.0005 <0.0005 <0.0005 0.005 <10
sec-Butylbenzene(9) 1 <0.0005 <0.0005 <0.0005 0.005 <10
tert-Butylbenzene(9) 1 <0.0005 <0.0005 <0.0005 0.005 <10
Carbon Tetrachloride(9) 1 <0.0005 <0.0005 <0.0005 0.005 <10
Chlorobenzene(9) 1 <0.0005 <0.0005 <0.0005 0.005 <10
Chloroethane(9) 1 <0.0005 <0.0005 <0.0005 0.005 <10
Chloromethane(9) 1 <0.0005 <0.0005 <0.0005 0.005 <10
2-Chlorotoluene(9) 1 <0.0005 <0.0005 <0.0005 0.005 <10
4-Chlorotoluene(9) 1 <0.0005 <0.0005 <0.0005 0.005 <10
Dibromomethane(9) 1 <0.0005 <0.0005 <0.0005 0.005 <10
1,2-Dichlorobenzene(9) 1 <0.0005 <0.0005 <0.0005 0.005 <10
1,3-Dichlorobenzene(9) 1 <0.0005 <0.0005 <0.0005 0.005 <10
1,4-Dichlorobenzene(9) 1 <0.0005 <0.0005 <0.0005 0.005 <10
Dichlorodifluoromethane(9) 1 <0.0005 <0.0005 <0.0005 0.005 <10
1,1-Dichloroethane(9) 1 <0.0005 <0.0005 <0.0005 0.005 <10
1,2-Dichloroethane(9) 1 <0.0005 <0.0005 <0.0005 0.005 <10
1,1-Dichloroethene(9) 1 <0.0005 <0.0005 <0.0005 0.005 <10
cis-1,2-Dichloroethene(9) 1 <0.0005 <0.0005 <0.0005 0.005 <10
trans-1,2-Dichloroethene(9) 1 <0.0005 <0.0005 <0.0005 0.005 <10
1,2-Dichloropropane(9) 1 <0.0005 <0.0005 <0.0005 0.005 <10
1,3-Dichloropropane(9) 1 <0.0005 <0.0005 <0.0005 0.005 <10
2,2-Dichloropropane(9) 1 <0.0005 <0.0005 <0.0005 0.005 <10
1,1-Dichloropropene(9) 1 <0.0005 <0.0005 <0.0005 0.005 <10
cis-1,3-Dichloropropene(9) 1 <0.0005 <0.0005 <0.0005 0.005 <10
trans-1,3-Dichloropropene(9) 1 <0.0005 <0.0005 <0.0005 0.005 <10
Ethylbenzene(9) 1 <0.0005 <0.0005 <0.0005 0.005 <10
Hexachlorobutadiene(9) 1 <0.0005 <0.0005 <0.0005 0.005 <10
Isopropylbenzene(9) 1 <0.0005 <0.0005 <0.0005 0.005 <10
4-Isopropyltoluene(9) 1 <0.0005 <0.0005 <0.0005 0.005 <10
Methylene Chloride(9) 1 <0.0005 <0.0005 <0.0005 0.005 <10
Methyl Tertiary-Butyl Ether(9) 1 <0.002 <0.002 <0.002 0.010 <20
Notes for Table 43 are on page 107.

Environmental Monitoring Report – 2018
106
TABLE 43 (continued) CHEMICAL CONSTITUENTS IN KESSELRING SITE
DRINKING WATER
Parameter / Units(1)
(Units are mg/l unless otherwise noted) Number of Samples
Value(2)
Standard(4) Percent of Standard(5) Minimum Maximum Average(3)
n-Propylbenzene(9) 1 <0.0005 <0.0005 <0.0005 0.005 <10
Styrene(9) 1 <0.0005 <0.0005 <0.0005 0.005 <10
1,1,1,2-Tetrachloroethane(9) 1 <0.0005 <0.0005 <0.0005 0.005 <10
1,1,2,2-Tetrachloroethane(9) 1 <0.0005 <0.0005 <0.0005 0.005 <10
Tetrachloroethene(9) 1 <0.0005 <0.0005 <0.0005 0.005 <10
Toluene(9) 1 <0.0005 <0.0005 <0.0005 0.005 <10
1,1,1-Trichloroethane(9) 1 <0.0005 <0.0005 <0.0005 0.005 <10
1,1,2-Trichloroethane(9) 1 <0.0005 <0.0005 <0.0005 0.005 <10
Trichloroethene(9) 1 <0.0005 <0.0005 <0.0005 0.005 <10
Trichlorofluoromethane(9) 1 <0.0005 <0.0005 <0.0005 0.005 <10
1,2,3-Trichloropropane(9) 1 <0.0005 <0.0005 <0.0005 0.005 <10
1,2,3-Trichlorobenzene(9) 1 <0.0005 <0.0005 <0.0005 0.005 <10
1,2,4-Trichlorobenzene(9) 1 <0.0005 <0.0005 <0.0005 0.005 <10
1,2,4-Trimethylbenzene(9) 1 <0.0005 <0.0005 <0.0005 0.005 <10
1,3,5-Trimethylbenzene(9) 1 <0.0005 <0.0005 <0.0005 0.005 <10
Vinyl Chloride(9) 1 <0.0005 <0.0005 <0.0005 0.002 <25
m, p-Xylene(9) 1 <0.0005 <0.0005 <0.0005 0.005 <10
o-Xylene(9) 1 <0.0005 <0.0005 <0.0005 0.005 <10
2,4,5-TP (Silvex) 1 <0.0001 <0.0001 <0.0001 0.01 <1
2,4-D 1 <0.0001 <0.0001 <0.0001 0.05 <0.2
3-Hydroxycarbofuran 1 <0.0005 <0.0005 <0.0005 N/A(10) N/A
Alachlor 1 <0.0001 <0.0001 <0.0001 0.002 <5
Aldicarb 1 <0.0005 <0.0005 <0.0005 0.003 <17
Aldicarb Sulfone 1 <0.0007 <0.0007 <0.0007 0.002 <35
Aldicarb Sulfoxide 1 <0.0005 <0.0005 <0.0005 0.004 <13
Aldrin 1 <0.00005 <0.00005 <0.00005 N/A(10) N/A
Atrazine 1 <0.0001 <0.0001 <0.0001 0.003 <3
Benzo(a)pyrene 1 <0.00002 <0.00002 <0.00002 0.0002 <10
Butachlor 1 <0.0001 <0.0001 <0.0001 N/A(10) N/A
Carbaryl 1 <0.0005 <0.0005 <0.0005 N/A(10) N/A
Carbofuran 1 <0.0009 <0.0009 <0.0009 0.04 <2
Chlordane 1 <0.0002 <0.0002 <0.0002 0.002 <10
Dalapon 1 <0.001 <0.001 <0.001 N/A(10) N/A
Di(2-ethylhexyl)adipate
1 <0.0006 <0.0006 <0.0006 N/A(10) N/A
Di(2-ethylhexyl)phthalate
1 <0.0006 <0.0006 <0.0006 0.006 <10
Dibromochloropropane
1 <0.00001 <0.00001 <0.00001 0.002 <5
Dicamba 1 <0.0001 <0.0001 <0.0001 N/A(10) N/A
Dieldrin 1 <0.0001 <0.0001 <0.0001 N/A(10) N/A
Dinoseb 1 <0.0001 <0.0001 <0.0001 0.007 <1
Endrin 1 <0.00001 <0.00001 <0.00001 0.002 <1
Ethylene Dibromide 1 <0.00001
<0.00001
<0.00001
0.00005 <20
Heptachlor 1 <0.0004 <0.0004 <0.0004 0.0004 <100
Heptachlor Epoxide 1 <0.00002 <0.00002 <0.00002 0.0002 <10
Notes for Table 43 are on page 107.
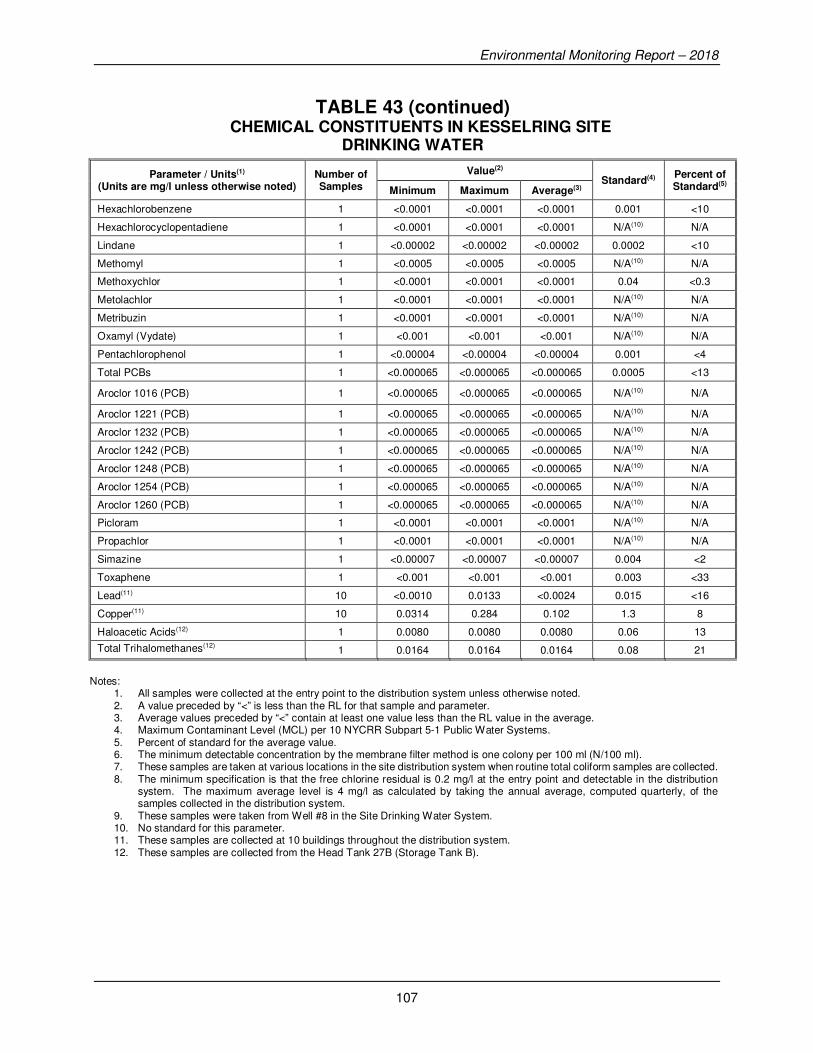
Environmental Monitoring Report – 2018
107
TABLE 43 (continued) CHEMICAL CONSTITUENTS IN KESSELRING SITE
DRINKING WATER
Parameter / Units(1)
(Units are mg/l unless otherwise noted) Number of Samples
Value(2) Standard(4)
Percent of Standard(5) Minimum Maximum Average(3)
Hexachlorobenzene 1 <0.0001 <0.0001 <0.0001 0.001 <10
Hexachlorocyclopentadiene 1 <0.0001 <0.0001 <0.0001 N/A(10) N/A
Lindane 1 <0.00002 <0.00002 <0.00002 0.0002 <10
Methomyl 1 <0.0005 <0.0005 <0.0005 N/A(10) N/A
Methoxychlor 1 <0.0001 <0.0001 <0.0001 0.04 <0.3
Metolachlor 1 <0.0001 <0.0001 <0.0001 N/A(10) N/A
Metribuzin 1 <0.0001 <0.0001 <0.0001 N/A(10) N/A
Oxamyl (Vydate) 1 <0.001 <0.001 <0.001 N/A(10) N/A
Pentachlorophenol 1 <0.00004 <0.00004 <0.00004 0.001 <4
Total PCBs 1 <0.000065 <0.000065 <0.000065 0.0005 <13
Aroclor 1016 (PCB) 1 <0.000065 <0.000065 <0.000065 N/A(10) N/A
Aroclor 1221 (PCB) 1 <0.000065 <0.000065 <0.000065 N/A(10) N/A
Aroclor 1232 (PCB) 1 <0.000065 <0.000065 <0.000065 N/A(10) N/A
Aroclor 1242 (PCB) 1 <0.000065 <0.000065 <0.000065 N/A(10) N/A
Aroclor 1248 (PCB) 1 <0.000065 <0.000065 <0.000065 N/A(10) N/A
Aroclor 1254 (PCB) 1 <0.000065 <0.000065 <0.000065 N/A(10) N/A
Aroclor 1260 (PCB) 1 <0.000065 <0.000065 <0.000065 N/A(10) N/A
Picloram 1 <0.0001 <0.0001 <0.0001 N/A(10) N/A
Propachlor 1 <0.0001 <0.0001 <0.0001 N/A(10) N/A
Simazine 1 <0.00007 <0.00007 <0.00007 0.004 <2
Toxaphene 1 <0.001 <0.001 <0.001 0.003 <33
Lead(11) 10 <0.0010 0.0133 <0.0024 0.015 <16
Copper(11) 10 0.0314 0.284 0.102 1.3 8
Haloacetic Acids(12) 1 0.0080 0.0080 0.0080 0.06 13
Total Trihalomethanes(12)
1 0.0164 0.0164 0.0164 0.08 21
Notes: 1. All samples were collected at the entry point to the distribution system unless otherwise noted. 2. A value preceded by “<” is less than the RL for that sample and parameter. 3. Average values preceded by “<” contain at least one value less than the RL value in the average. 4. Maximum Contaminant Level (MCL) per 10 NYCRR Subpart 5-1 Public Water Systems. 5. Percent of standard for the average value. 6. The minimum detectable concentration by the membrane filter method is one colony per 100 ml (N/100 ml). 7. These samples are taken at various locations in the site distribution system when routine total coliform samples are collected. 8. The minimum specification is that the free chlorine residual is 0.2 mg/l at the entry point and detectable in the distribution
system. The maximum average level is 4 mg/l as calculated by taking the annual average, computed quarterly, of the samples collected in the distribution system.
9. These samples were taken from Well #8 in the Site Drinking Water System. 10. No standard for this parameter. 11. These samples are collected at 10 buildings throughout the distribution system. 12. These samples are collected from the Head Tank 27B (Storage Tank B).

Environmental Monitoring Report – 2018
108
TABLE 44 RESULTS OF KESSELRING SITE GROUNDWATER MONITORING
FOR RADIOACTIVITY(1)
LOCATION Cs-137 Co-60
Tritium pCi/liter x 102 pCi/liter
LANDFILL AREA
HB-1A(2) <0.95 <0.82 <1.46
HB-1B(2) Well Dry, Not Sampled ---- ---- ----
HB-5A2 <0.95 <0.85 <1.46
HB-5B <0.95 <0.82 <1.46
HB-11A <0.93 <0.79 <1.54
HB-11B Well Dry, Not Sampled ---- ---- ----
LMW-4 <2.30 <2.00 <1.54
LMW-6 <0.96 <0.86 <1.46
DEVELOPED AREA
MW-1(2) <0.93 <0.78
<1.47
MW-2 <0.94 <0.81 <1.47
MW-3 <0.94 <0.83 <1.47
MW-4 <0.93 <0.78 <1.48
MW-6 <0.94 <0.80 <1.47
MW-7 <0.95 <0.81 <1.47
MW-8 <1.00 <0.89 <1.47
MW-9 <0.96 <0.82 <1.47
MW-10 <0.93 <0.80 <1.47
MW-11 <0.93 <0.81 <1.47
MW-12 <0.96 <0.84 <1.48
MW-13 <0.94 <0.81 <1.48
MW-14 <1.00 <0.90 <1.48
MW-15 <0.93 <0.84 <1.48
MW-16 <0.94 <0.86 <1.48
MW-17 <2.34 <2.00 <1.48
MW-18 <0.96 <0.80 <1.48
MW-19 <0.93 <0.81 <1.48
MW-20 Well Dry, Not Sampled ---- ---- ----
BAPTIST HILL ROAD LANDFILL
KBH-1(2) <0.94 <0.81
<1.51
KBH-2 <0.93 <0.79 <1.51
KBH-3 <0.94 <0.79 <1.47
KBH-4 <0.91 <0.78 <1.51
SILO AREA
KBH-6(2) <2.40 <2.10 <1.47
KBH-7 <0.92 <0.78 <1.54
KBH-8 Well Dry, Not Sampled ---- ---- ----
SWANN SCHOOL ROAD CELLAR
KBH-9 Well Dry, Not Sampled ---- ----
----
KBH-10 <0.96 <0.84 <1.50
T-3 <2.40 <2.03 <1.51
PARKIS MILLS ROAD CELLAR
KBH-11 Well Dry, Not Sampled ---- ---- ----
KBH-12 Well Dry, Not Sampled ---- ---- ----
KBH-13 <0.93 <0.81 <1.44
Notes:
1. A value preceded by “<” is less than the decision level concentration for that sample and parameter. 2. Background well for comparison purposes.

Environmental Monitoring Report – 2018
109
Conclusion
The 2018 groundwater data demonstrates no adverse changes from historical monitoring results.
Past waste disposal practices at the landfill have resulted in observable effects on groundwater
quality downgradient of the landfill. However, data trends show that groundwater quality has
improved since the landfill was closed and that there is no indication of a breach in landfill cap
integrity.
Within the industrial facility, groundwater results were obtained for chlorides, pH, and turbidity.
These results are predominantly attributed to normal facility operations including the continued
use of chlorinated Site Service Water for drinking, fire protection, and system cooling needs; the
operation of the Kesselring Site cooling towers; the on-going use of roadway de-icing materials
during winter months; and limited effects from past operational practices. Results from 2018 are
consistent with historical monitoring trends. Previously sampled downstream surface water
analysis has consistently shown no adverse effects from developed area Kesselring Site operations.
CONTROL OF CHEMICALLY HAZARDOUS SUBSTANCES AND SOLID WASTE
Chemical Control Program
Chemicals are not manufactured or disposed of at the Kesselring Site. To ensure the safe use of
chemicals and disposal of the resulting wastes, the Kesselring Site maintains hazardous substance
control and waste minimization programs similar to those at the Knolls Laboratory. Since 1990,
significant reductions in hazardous waste streams have been accomplished at the Kesselring Site.
Some hazardous waste streams have been eliminated through the use of non-hazardous
substitutes. Most notably, a corrosive waste stream was eliminated by a process change, to make
demineralized water by reverse osmosis rather than ion exchange. Hazardous substance storage
controls include as a minimum: labeling, secondary containment as appropriate, segregation based
on compatibility, limited storage volumes, and weather protection, as appropriate. When required,
large volumes of chemicals and petroleum products are stored in accordance with the New York
State Chemical Bulk Storage regulations as specified in Reference (15) and the Petroleum Bulk
Storage regulations in Reference (16). Minimal quantities of hazardous wastes do result from the
necessary use of chemicals in Site operations. Larger quantities of hazardous wastes result from
one-time facility decommissioning and dismantlement activities. Hazardous and mixed
(radioactive and hazardous) waste storage facilities are operated at the Kesselring Site under
provisions of the New York State regulation implementing RCRA and the Federal Facility
Compliance Act. The Kesselring Site operates these facilities under a Part 373 permit issued by
NYSDEC. During 2018, the Kesselring Site shipped approximately 147 tons of RCRA and New
York State hazardous waste off-site for treatment and disposal. This includes approximately
16 tons of mixed waste, predominantly from facility decommissioning and dismantlement
activities. Waste that is both radioactive and chemically hazardous is regulated under both the
AEA and RCRA as “mixed waste.” Additionally, per the NYSDEC, certain TSCA regulated PCB
waste is also considered a hazardous waste.

Environmental Monitoring Report – 2018
110
Elementary neutralization of small volume laboratory waste also occurs on-site. This process is
exempt from regulation as a RCRA treatment process. The neutralized discharge is controlled
under the Kesselring Site SPDES permit.
Nonhazardous chemical waste is also sent off-site for disposal. The transportation vendors and
the treatment, storage, and disposal facilities are typically the same as those used for hazardous
waste disposal. These facilities also operate under permits issued by the cognizant Federal and
State regulatory agencies. The Kesselring Site also requires the disposal facility to provide
itemized written verification that the waste was actually received. In 2018, approximately 349 tons
of nonhazardous chemical waste was sent for off-site treatment and disposal via incineration,
wastewater treatment, chemical treatment and/or land disposal. A significant fraction of these
wastes was the result of either dismantlement and/or renovation activities at the Kesselring Site.
In addition, the Kesselring Site hazardous waste control program is subject to periodic on-site
inspections by NYSDEC and the EPA.
Solid Waste Disposal/Recycling
During 2018, approximately 2,187 tons of nonhazardous, solid wastes were generated from such
waste streams as construction and demolition debris, office and cafeteria trash, and classified
paper. From these waste streams, the Kesselring Site recycles materials such as office paper,
except classified items, glass, plastic, aluminum, newspapers, magazines, scrap metal, corrugated
cardboard, computers, precious metals, lead, oil, fluorescent light bulbs, wood, asphalt, printer
cartridges, and batteries. Approximately 1,026 tons of materials were recycled.
CONTROL OF RADIOACTIVE MATERIALS AND RADIOACTIVE WASTE Sources
Operations at the Kesselring Site result in the generation of various types of radioactive materials
and wastes. Low level radioactive solid waste material that requires disposal includes filters, metal
scrap, resin, rags, paper, and plastic materials.
Control Program
Detailed procedures are used for handling, packaging, and transportation of radioactive materials
and disposal of radioactive waste at a government operated or licensed disposal site. Internal
reviews are made prior to the shipment of any radioactive material from the Kesselring Site to
ensure that the material is properly identified, surveyed, and packaged in accordance with Federal,
State, and local requirements.
The volume of radioactive waste is minimized through recycling and the use of special work
procedures that limit the amount of material that becomes contaminated during work on
radioactive systems and reactor components. Radioactive liquid waste is processed into an
absorbed form prior to shipment to an approved disposal facility. All radioactive wastes are
prepared and shipped to meet applicable regulations of the DOT given in Reference (17). The

Environmental Monitoring Report – 2018
111
waste packages also comply with all applicable requirements of the NRC, the DOE, and the
disposal sites.
Disposal/Recycling
The shipments of low level radioactive solid wastes were made by authorized common carriers to
disposal sites located outside of New York State.
During 2018, approximately 41.0 cubic meters (53.6 cubic yards) of low level radioactive waste
containing 0.0274 curies was shipped from the Kesselring Site for disposal. The Kesselring Site
did not ship radioactive metal for radioactive material recycling.
CONTROL OF MIXED WASTES Sources
Waste that is both radioactive and chemically hazardous is regulated under both the AEA and
RCRA as “mixed waste.” Ongoing operations at the Kesselring Site resulted in the generation of
a very small proportion of the mixed waste generated at Kesselring. The majority of the mixed
waste is generated as a result of dismantlement or refurbishment activities.
Control Program Since mixed wastes are both RCRA hazardous and radioactive, the controls for hazardous wastes
are applied to the hazardous constituents and the controls for radioactive wastes are applied to the
radioactive constituents.
Mixed wastes are managed on-site in accordance with the Kesselring Site RCRA permit. The
amount of mixed waste generated was minimized through the use of detailed work procedures and
worker training. Mixed wastes were collected in designated regulated and permitted storage areas
for the sole purpose of accumulating sufficient quantities to facilitate shipment to an off-site
facility for proper treatment and disposal.
Disposal
Mixed wastes shipped off-site were packaged in compliance with DOT requirements for transport
to and receipt at RCRA-permitted treatment and disposal facilities. In 2018, there were five
shipments totaling 16.2 tons of various mixed wastes sent to treatment and disposal facilities.
RADIATION DOSE ASSESSMENT
The effluent and environmental monitoring results show that the radioactivity in liquid and gaseous
effluents from 2018 operations at the Kesselring Site had no measurable effect on background
radioactivity levels. Therefore, any radiation doses from Kesselring Site operations to off-site
individuals were too small to be measured and must be calculated using conservative methods.
Estimates of the radiation dose to the maximally exposed off-site individual in the vicinity of the
Kesselring Site and the collective dose to the population residing in the 80 kilometer (50 mile)

Environmental Monitoring Report – 2018
112
radius assessment area are summarized later in this report in the Radiation Dose Assessment and
Methodology section.
The results show that the estimated doses were less than 0.1 percent of that permitted by the DOE
radiation protection standards listed in Reference (18) and that the estimated dose to the population
residing within 80 kilometers (50 miles) of the Kesselring Site was less than 0.001 percent of the
natural background radiation dose to the population. In addition, the estimated doses were less
than one percent of that permitted by the NRC numerical guide listed in Reference (19) for whole
body dose demonstrating that doses are as low as reasonably achievable. The dose attributed to
radioactive air emissions was less than one percent of the EPA standard in Reference (8).
The collective radiation dose to the public along travel routes from outgoing Kesselring Site
shipments of radioactive materials during 2018 was calculated using data given by the NRC in
Reference (20). The collective radiation dose to the public from all NNPP shipments of
radioactive materials is included in Reference (21).
Based on the type and number of shipments made, the collective annual radiation dose to the public
along the transportation routes, including transportation workers, was less than one person-rem.
This is less than 0.001 percent of the dose received by the same population from natural
background radiation.

Environmental Monitoring Report – 2018
113
SEPARATIONS PROCESS RESEARCH UNIT BACKGROUND
A Cold War era facility known as the Separations Process Research Unit (SPRU) operated between
1950–1953 at the Knolls Laboratory as a pilot plant to research chemical processes to extract
uranium and plutonium from irradiated uranium. The SPRU work was conducted under the
direction of the Atomic Energy Commission. The work was done on a limited scale; SPRU was
never a production plant. The SPRU processes were developed for use at the Atomic Energy
Commission’s Hanford Site in Washington State and the Savannah River Plant in South Carolina.
Following cessation of SPRU operations in 1953, partial cleaning of equipment and systems was
performed, and the facility was placed in a stable long-term storage condition by the Atomic
Energy Commission. The Knolls Laboratory maintained an environmental monitoring program
to confirm that the inactivated SPRU facility posed no threat to the health of Laboratory workers,
the public, or the environment.
Consistent with its objective to clean up legacy sites that are no longer needed, the U.S. Department
of Energy-Office of Environmental Management (DOE-EM) dedicated funding to support SPRU
dismantlement and remediation. The remediation of the SPRU facility and waste management
areas will result in the removal of hazardous equipment, building materials, and impacted soil and
the restoration of the land for Knolls Laboratory use. The Knolls Laboratory turned over the SPRU
facilities (Buildings G2 and H2) and land areas to DOE-EM as necessary to support the objectives
of the cleanup work. DOE-EM is responsible for the remediation of the SPRU areas, which are
shown on Figure 10.
The nature of the work performed during 2018 in the Building G2/H2 area consisted of operating
radioactive water collection systems, maintenance of the facility, removal of legacy radioactive
materials, remediation of hazardous materials, and D&D of Buildings G2 and H2. In 2018, the
work scope also included maintenance of contamination controls and shipments of waste. This
work culminated in the completion of the building demolition and site remediation activities. Site
restoration began in October 2018.
LIQUID EFFLUENT MONITORING
Sources
Nonradiological: The principal source of nonradiological effluent water from SPRU is stormwater
to the Mohawk River.
Radiological: The main sources of radiological water are water collected around the foundation
of Building H2 and water collected from the open excavation of the G2 Building and H2 Building
demolition footprints. The excavation water included that used for dust suppression during
demolition of the buildings and precipitation that fell on the footprint. Backfill of the building
excavations began in October 2018. Water from the SPRU facilities was shipped off-site to
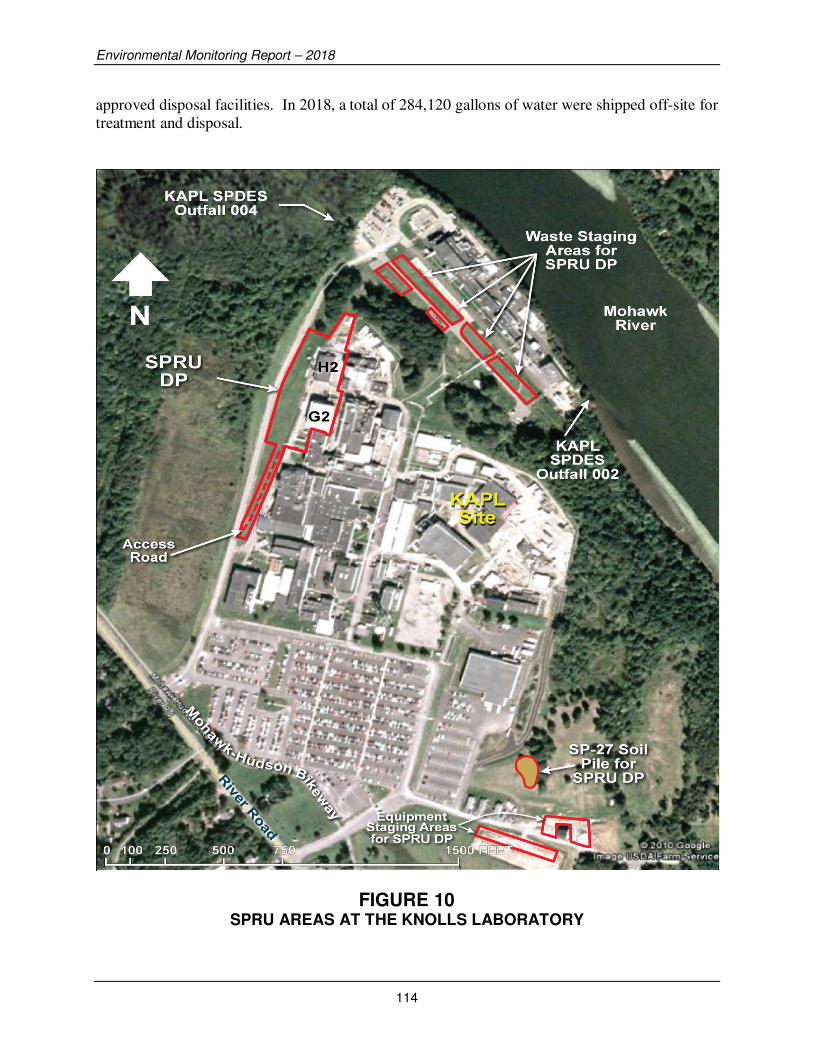
Environmental Monitoring Report – 2018
114
approved disposal facilities. In 2018, a total of 284,120 gallons of water were shipped off-site for
treatment and disposal.
FIGURE 10 SPRU AREAS AT THE KNOLLS LABORATORY
Environmental Monitoring Report – 2018
115
Effluent Monitoring
Effluent monitoring is performed by the Knolls Laboratory and is described in the Knolls
Laboratory section of this report.
Effluent Analyses
Effluent analyses are performed by the Knolls Laboratory and are described in the Knolls
Laboratory section of this report.
Assessment
See the Knolls Laboratory section on this subject.
AIRBORNE EFFLUENT MONITORING Sources
Nonradiological: The principal sources of nonradiological air emissions at SPRU are emergency
and non-emergency diesel generators. This source of air emissions at SPRU meets the criteria for
exempt and trivial sources under NYSDEC regulations and is not required to have air permits or
registrations.
Radiological: The SPRU operations capable of generating airborne radioactivity include the
operation of water collection systems, D&D activities associated with Portable Ventilation Units
(PVUs), demolition of the G2 and H2 Buildings, and soil excavation. The PVUs are permitted
point sources. PVUs were used intermittently at SPRU during 2018 to monitor decontamination
of the E1 and G1 tunnels and during decontamination of fractionation tanks used to collect and
store contaminated water. Building demolition, water collection, and soil excavation are sources
of fugitive emissions.
Effluent Monitoring
Nonradiological: In general, exempt and trivial activities do not require emissions monitoring,
although some activities such as operation of the diesel generators may require monitoring of run
times to maintain their exempt status.
Radiological: Airborne effluents from PVUs are continuously sampled for particulate activity
when the PVUs are in use. Emissions from diffuse sources were estimated using EPA methods.
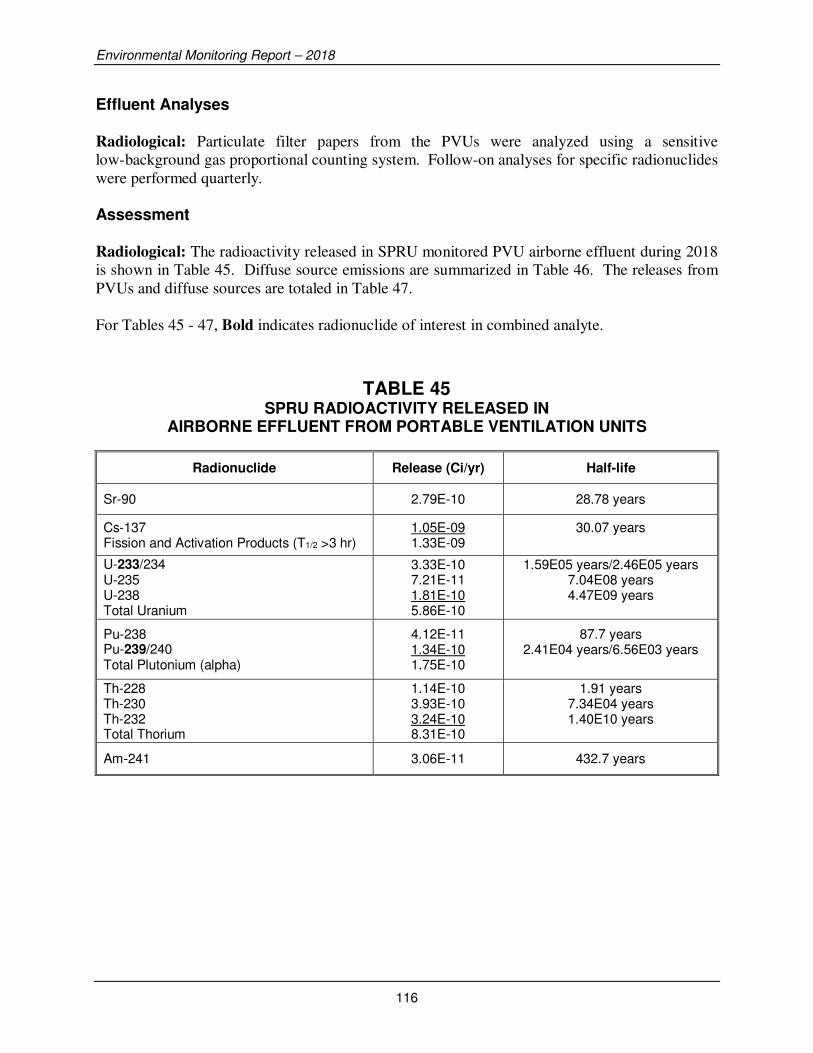
Environmental Monitoring Report – 2018
116
Effluent Analyses
Radiological: Particulate filter papers from the PVUs were analyzed using a sensitive
low-background gas proportional counting system. Follow-on analyses for specific radionuclides
were performed quarterly.
Assessment
Radiological: The radioactivity released in SPRU monitored PVU airborne effluent during 2018
is shown in Table 45. Diffuse source emissions are summarized in Table 46. The releases from
PVUs and diffuse sources are totaled in Table 47.
For Tables 45 - 47, Bold indicates radionuclide of interest in combined analyte.
TABLE 45 SPRU RADIOACTIVITY RELEASED IN
AIRBORNE EFFLUENT FROM PORTABLE VENTILATION UNITS
Radionuclide Release (Ci/yr) Half-life
Sr-90 2.79E-10 28.78 years
Cs-137 Fission and Activation Products (T1/2 >3 hr)
1.05E-09 1.33E-09
30.07 years
U-233/234 U-235 U-238 Total Uranium
3.33E-10 7.21E-11 1.81E-10 5.86E-10
1.59E05 years/2.46E05 years 7.04E08 years 4.47E09 years
Pu-238 Pu-239/240 Total Plutonium (alpha)
4.12E-11 1.34E-10 1.75E-10
87.7 years 2.41E04 years/6.56E03 years
Th-228 Th-230 Th-232 Total Thorium
1.14E-10 3.93E-10 3.24E-10 8.31E-10
1.91 years 7.34E04 years 1.40E10 years
Am-241 3.06E-11 432.7 years

Environmental Monitoring Report – 2018
117
TABLE 46 SPRU RADIOACTIVITY RELEASED FROM DIFFUSE SOURCES
Radionuclide Water Storage
(Ci/yr)
G2 and H2 Open Air Demolition
(Ci/yr)
Soil Disturbance
(Ci/yr)
Diffuse Total (Ci/yr)
Sr-90 3.77E-06 2.57E-04 1.33E-08 2.61E-04
C-14 Ni-63 Tc-99 Cs-137
3.31E-09 1.63E-09 1.04E-09 2.57E-06
0.00E+00 1.44E-09 1.69E-09 2.91E-04
0.00E+00 0.00E+00 0.00E+00 3.42E-07
3.31E-09 3.07E-09 2.73E-09 2.94E-04
Fission and Activation Products (T1/2 >3 hr) 5.55E-04
U-233/234 U-235 U-236 U-238 Total Uranium
1.25E-08 7.44E-10 0.00E-00 7.33E-09 2.06E-08
5.16E-07 1.56E-07 6.81E-09 3.66E-08 7.15E-07
1.38E-10 1.06E-10 0.00E-00 1.41E-09 1.65E-09
5.28E-07 1.57E-07 6.81E-09 4.54E-08 7.37E-07
Pu-238 Pu-239/240
Total Plutonium (alpha)
4.46E-10 3.51E-08 3.55E-08
2.32E-08 5.52E-06 5.54E-06
7.17E-11 3.47E-09 3.54E-09
2.37E-08 5.56E-06 5.58E-06
Th-228 Th-230 Th-232 Th-234 Total Thorium
1.43E-09 9.99E-11 0.00E+00 0.00E+00 1.53E-09
1.13E-09 1.25E-10 1.19E-09 0.00E+00 2.45E-09
1.36E-10 1.60E-10 1.23E-09 1.23E-09 2.76E-09
2.70E-09 3.85E-10 2.42E-09 1.23E-09 6.74E.09
Am-241 Pu-241 Cm-242
2.50E-08 1.70E-08 1.47E-10
3.90E-07 5.55E-07 0.00E+00
3.41E-10 0.00E+00 0.00E+00
4.15E-07 5.72E-07 1.47E-10

Environmental Monitoring Report – 2018
118
TABLE 47 SPRU AIRBORNE RADIOACTIVITY RELEASED
Radionuclide PVU
(Ci/yr) Diffuse Total
(Ci/yr)
Total Emissions
(Ci/yr)
Sr-90 2.79E-10 2.61E-04 2.61E-04
C-14 Ni-63 Tc-99 Cs-137
0.00E+00 0.00E+00 0.00E+00 1.05E-09
3.31E-09 3.07E-09 2.73E-09 2.94E-04
3.31E-09 3.07E-09 2.73E-09 2.94E-04
Fission and Activation Products (T1/2 >3 hr) 5.55E-04
U-233/234 U-235 U-236 U-238 Total Uranium
3.33E-10 7.21E-11 0.00E-00 1.81E-10 5.86E-10
5.28E-07 1.57E-07 6.81E-09 4.54E-08 7.37E-07
5.28E-07 1.57E-07 6.81E-09 4.56E-08 7.38E-07
Pu-238 Pu-239/240 Total Plutonium (alpha)
4.12E-11 1.34E-10 1.75E-10
2.37E-08 5.56E-06 5.58E-06
2.37E-08 5.56E-06 5.58E-06
Th-228 Th-230 Th-232 Th-234 Total Thorium
1.14E-10 3.93E-10 3.24E-10 0.00E-00 8.31E-10
2.70E-09 3.85E-10 2.42E-09 1.23E-09 6.74E-09
2.81E-09 7.78E-10 2.74E-09 1.23E-09 7.57E-09
Am-241 Pu-241 Cm-242
3.06E-11 0.00E+00 0.00E+00
4.15E-07 5.72E-07 1.47E-10
4.15E-07 5.72E-07 1.47E-10
ENVIRONMENTAL MONITORING Scope
Environmental air samplers are operated by the Knolls Laboratory and are described in that section
on this subject. Air samplers are operated within the SPRU work area and on the boundary
between SPRU and the Knolls Laboratory to confirm that SPRU work conforms to DOE
regulations for exposure to workers and visitors.
RADIATION MONITORING The environmental radiation monitoring program is performed by the Knolls Laboratory and is
described in the Knolls Laboratory section of this report.
GROUNDWATER MONITORING The groundwater monitoring program is performed by the Knolls Laboratory and is described in
the Knolls Laboratory section of this report.

Environmental Monitoring Report – 2018
119
CONTROL OF CHEMICALLY HAZARDOUS SUBSTANCES Sources
Chemicals are not manufactured at SPRU. To ensure the safe use of chemicals and disposal of the
resulting wastes, SPRU maintains a hazardous waste control program. Hazardous wastes are
disposed through permitted off-site treatment and disposal facilities.
Chemical Control Program
The control program minimizes the quantity of waste material generated, ensures safe usage and
storage of the materials at SPRU, and provides for proper disposal of the wastes through vendors
that operate under permits issued by Federal and State agencies.
The control of hazardous substances for use at SPRU includes a review of waste minimization
impact. Purchase orders for chemicals are reviewed to ensure that the materials are actually
necessary for operations, the amount ordered is not excessive, and that methods for proper disposal
are in place before the material is ordered. Hazardous substance storage controls include as a
minimum: labeling, providing revetments as appropriate, segregation based on compatibility,
limited storage volumes, and weather protection as appropriate. When required, large volumes of
chemicals and petroleum products would be stored in accordance with the New York State
Chemical Bulk Storage regulations (Reference (15)) and the Petroleum Bulk Storage regulations
(Reference (16)). SPRU currently does not store any chemicals or petroleum products in quantities
that are subject to the Chemical Bulk Storage regulations or the Petroleum Bulk Storage
regulations.
All personnel are provided with general information on the policies for the procurement, use, and
disposal of hazardous substances. For individuals who use hazardous substances in operations,
specific training is provided to ensure that they are knowledgeable of safe handling techniques and
emergency response procedures. After chemicals are used and no longer needed, they are
accumulated in designated staging and storage areas where they are segregated and packaged for
shipment. Waste is temporarily stored only as necessary to accumulate sufficient volumes for
shipment to a waste disposal vendor with the exception of mixed transuranic waste, which is stored
under NYSDEC-approved storage extension to the regulatory time requirements. SPRU has an
inspection program to routinely verify that hazardous substances are properly stored and controlled
in accordance with approved procedures.
Chemical Disposal
Hazardous waste is managed in compliance with RCRA. Generated waste is transported by
vendors to treatment, storage, and disposal facilities for final disposition. The transportation
vendors and the treatment, storage, and disposal facilities operate under permits issued by the
cognizant Federal and State regulatory agencies. The disposal facilities provide itemized written
verification that the waste was actually received. During 2018, SPRU shipped 1,468 pounds
(approximately 0.73 tons) of RCRA and New York State hazardous waste off-site for disposal,
Environmental Monitoring Report – 2018
120
including 397 lbs (0.20 tons) of universal waste. Approximately 2.39 cubic meters (3.13 cubic
yards) of mixed low level waste (MLLW) was shipped off-site during 2018.
The SPRU hazardous waste program is governed by the Waste Management Plan (WMP-001) and
implementing procedures. Prior to performing any waste generating activity at SPRU, the work
package is evaluated for safety, minimization, and compliance. Applicable process knowledge
and existing conditions are evaluated and documented. This information, along with any
additional sampling and analysis required, is used to make a hazardous waste determination for
the waste stream, as well as to establish the initial categorization of the waste type. The waste
determination process also includes consideration of the final disposition of the waste. This
“cradle to grave” review plan ensures that the waste can be certified to TSDF acceptance criteria
and that a generating activity will not generate a waste without a path forward.
Hazardous wastes that are not radioactive are packaged, treated, staged, transported, and disposed
of consistent with the applicable (RCRA, NYS, TSCA, DOT) regulations. These wastes are
disposed either by direct contract mechanism, by utilizing DOE’s broad spectrum contract
mechanism, or through a qualified hazardous waste broker.
No non-hazardous chemical waste was sent off-site for disposal during 2018.
CONTROL OF RADIOACTIVE MATERIALS AND RADIOACTIVE WASTE Sources
Operations at SPRU result in the generation of various types of radioactive materials and wastes.
Low level radioactive solid waste materials that require disposal include debris, soil, filters, metal
scrap, rags, resin, paper, and plastic materials. Prior to 2018, remediation activities at SPRU
generated waste that contained greater than 100 nCi of alpha-emitting transuranic isotopes per
gram of waste with half-lives greater than 20 years, which is referred to as TRU waste. TRU waste
(>100 nCi/g) is managed separately from low level radioactive waste and must be disposed of at
the DOE Waste Isolation Pilot Plant (WIPP).
Control Program
Detailed procedures are used for handling, packaging, transportation, and disposal of radioactive
waste at a government operated or licensed disposal site. Internal reviews are made prior to the
shipment of any radioactive material from SPRU to ensure that the material is properly identified,
surveyed, and packaged in accordance with Federal requirements.
The volume of radioactive waste that results from radiological control activities is minimized
through the use of work procedures that limit the amount of materials that become contaminated
during work on radioactive systems and components. All radioactive wastes are prepared and
shipped in accordance with written procedures to meet the applicable DOT regulations given in
Reference (17). The waste packages also comply with all applicable requirements of the DOE and
the disposal sites.

Environmental Monitoring Report – 2018
121
Disposal/Recycling
In 2018, 1872 shipments of low level radioactive wastes were made by authorized common carriers
to disposal sites located outside New York State. These shipments consisted of either water or
solid form wastes as described in the next paragraph. No radioactive materials were recycled.
During 2018, 1,076 cubic meters (1,407 cubic yards) of water containing approximately 0.0046 Ci
was shipped from SPRU for disposal. In addition, 1810 shipments totaling approximately 19,824
cubic meters (25,929 cubic yards) of solid low level radioactive waste containing approximately
5.38 Ci were shipped from SPRU for disposal.
CONTROL OF MIXED WASTE Sources Remediation activities at SPRU generate mixed waste, some of which, includes radioactive TSCA
regulated PCB waste that NYSDEC considers to also be hazardous waste. Mixed waste generated
from SPRU activities is packaged, treated, staged, transported and disposed of consistent with the
applicable (RCRA, NYS, TSCA, DOT) regulations. WMP-001 directs that these wastes be
disposed of either by direct contract mechanisms or by utilizing DOE’s broad spectrum contract
mechanism.
Control Program
SPRU cleanup operations take aggressive action to minimize the creation of mixed waste by
reducing the commingling of radioactive and hazardous materials and avoiding the use of
hazardous substances where practicable. The amount of generated mixed waste was also
minimized through the use of detailed work procedures and worker training.
Storage and Disposal All mixed wastes are accumulated in designated staging areas. Mixed wastes are packaged for
storage and eventual shipment to off-site treatment facilities. In 2018, six shipments of mixed
wastes totaling 2,087 pounds were made to treatment and disposal facilities. Mixed TRU waste
from SPRU is being managed under a consent order with NYSDEC that covers the storage of
mixed TRU until a hazardous waste storage permit is obtained by SPRU DP.
RADIATION DOSE ASSESSMENT The effluent and environmental monitoring results show that radioactivity present in liquid and
gaseous effluents from 2018 operations at the Knolls Laboratory (including SPRU) had no
measurable effect on normal background radioactivity levels. Therefore, any radiation doses from
the Knolls Laboratory (including SPRU) operations to off-site individuals were too small to be
measured and must be calculated using conservative methods. Estimates of the radiation dose to
the maximally exposed individual in the vicinity of the Knolls Laboratory (including SPRU) and
Environmental Monitoring Report – 2018
122
the collective dose to the population residing in the 80 kilometer (50 mile) radius assessment area
are summarized in the Radiation Dose Assessment and Methodology section later in this report.
The results show that the estimated doses were less than 0.1 percent of that permitted by the
radiation protection standards of the DOE listed in Reference (18) and that the estimated dose to
the population residing within 80 kilometers (50 miles) of the Knolls Laboratory (including
SPRU), was less than 0.001 percent of the natural background radiation dose to the population. In
addition, the estimated doses were less than one percent of that permitted by the NRC numerical
guide listed in Reference (19) for whole-body dose, demonstrating that doses are as low as is
reasonably achievable. The dose attributed to radioactive air emissions from the Knolls
Laboratory (including SPRU) was less than one percent of the EPA standard in Reference (8).
The collective radiation dose to the public along the travel route from SPRU shipments of
radioactive materials during 2018 was calculated using data and methods given by the NRC in
Reference (20). Based on the type and number of shipments made, the collective annual radiation
dose to the public along the transportation routes, including transportation workers, was less than
ten person-rem. This is less than 0.01 percent of the dose received by the same population from
natural background radiation.
Environmental Monitoring Report – 2018
123
RADIATION DOSE ASSESSMENT AND METHODOLOGY
Measurements for radioactivity in environmental media representing an exposure pathway to man
indicated no radioactivity attributable to operations at the Knolls Laboratory (including SPRU)
and Kesselring Site. Therefore, potential doses to the general public from liquid and airborne
effluents were too small to be measured and are estimated using conservative calculational
techniques based on assumed pathways to man.
The exposure pathways via air and water considered for estimating radiation exposures were:
1. Air Pathways
a. External exposure from airborne radioactivity and radioactivity deposited on the ground,
b. Ingestion of food products, and
c. Inhalation of airborne radioactivity.
2. Water Pathways
a. Ingestion of water and fish,
b. Ingestion of food products grown on irrigated land,
c. External exposure from irrigated land, and
d. Boating, swimming, and shoreline recreation.
For the Knolls Laboratory (including SPRU) and Kesselring Site, calculations were made to es-
timate: (1) the radiation dose to the maximally exposed individual in the vicinity of the two Sites,
and (2) the collective dose to the population residing in the 80 kilometer (50 mile) radius assess-
ment area. See Figure 11 for a map of the 80 kilometer (50 mile) assessment areas surrounding
the two Sites.
The fundamental equation for calculation of the annual dose from a single radionuclide is:
D = XUK where:
D = annual dose
X = the concentration of the radionuclide in the media of the
exposure pathway of interest
U = the annual exposure time (hours) or intake (ml or kg)
associated with the exposure pathway of interest
K = the annual dose factor for external exposure to a
radionuclide or the dose commitment for a 50 year
period from the current year's intake of a radionuclide
In estimating potential doses via the water pathway, the contribution from each radionuclide pres-
ent in the liquid effluents to the effective dose equivalent was calculated using DOE dose conver-
sion factors from Reference (25), Reference (18), and the Reference (26) liquid pathway model
for both the Knolls Laboratory (including SPRU) and the Kesselring Site.
Environmental Monitoring Report – 2018
124
Estimates of potential doses via air pathways were calculated using CAP88-PC, Version 4.0, the
EPA computer code package approved for use in Reference (27). The code package was prepared
to implement the dose assessment required to demonstrate compliance with Reference (8). It
includes the computer code AIRDOS2 and a file of the 50-year committed effective dose
equivalent conversion factors calculated by the computer code DARTAB, which uses the dose
factor database RADRISK using weighting factors from ICRP-72. CAP88-PC Version 4.0 is an
updated version of CAP88-PC. It incorporates Federal Guidance Report 13 dose and risk factors.
In CAP88-PC Version 4.0, the area surrounding the site is divided into a circular grid defined by
16 pie-shaped segments, which are subdivided into sectors by annular rings out to 80 kilometers
(50 miles). The computer code calculates the air concentration and surface deposition in each
sector for each radionuclide released from each Site using site specific average atmospheric
dispersion parameters. Dispersion parameters for each Site are based on on-site meteorological
data summarized in accordance with Reference (28). Next, the radionuclide concentrations in
meat, milk, and fresh vegetables produced in each sector are estimated using terrestrial food chain
models. In CAP88-PC Version 4.0 the environmental radionuclide transfer factors were updated
to the values from the National Council on Radiation Protection and Management Report 123.
The code then calculates the effective dose equivalent to persons (adults) residing in each sector
through the following exposure modes: (1) immersion in air containing radionuclides, (2) exposure
to radionuclides deposited on ground surfaces, (3) inhalation of radionuclides in air, and (4) in-
gestion of food produced in the sector. The collective (population) effective dose equivalent is
obtained by summing the product of the dose and population for each sector. The population
residing within 80 kilometers (50 miles) of each site is based on the 2010 census data as reported
in Reference (29).
The air pathway calculated doses are summarized in Tables 48 and 49. Ingestion was the
calculated principal exposure pathway for the hypothetical maximally exposed individual at the
Knolls Laboratory (including SPRU). At the Kesselring Site, the calculated principal exposure
pathway for this hypothetical person was the ingestion pathway.
A comparison of the estimated (calculated) radiation dose to the maximally exposed individual
from Knolls Laboratory (including SPRU) and Kesselring Site operations with the average
radiation dose received from other sources is shown in Figure 12. Data in Figure 12 show that the
maximum radiation dose that may have been received as a result of Knolls Laboratory and
Kesselring Site operations is much lower than the DOE radiation protection standard and the drink-
ing water and air emission standards established by the EPA, and considerably lower than the
average dose received from other sources (natural and man-made) of radiation.
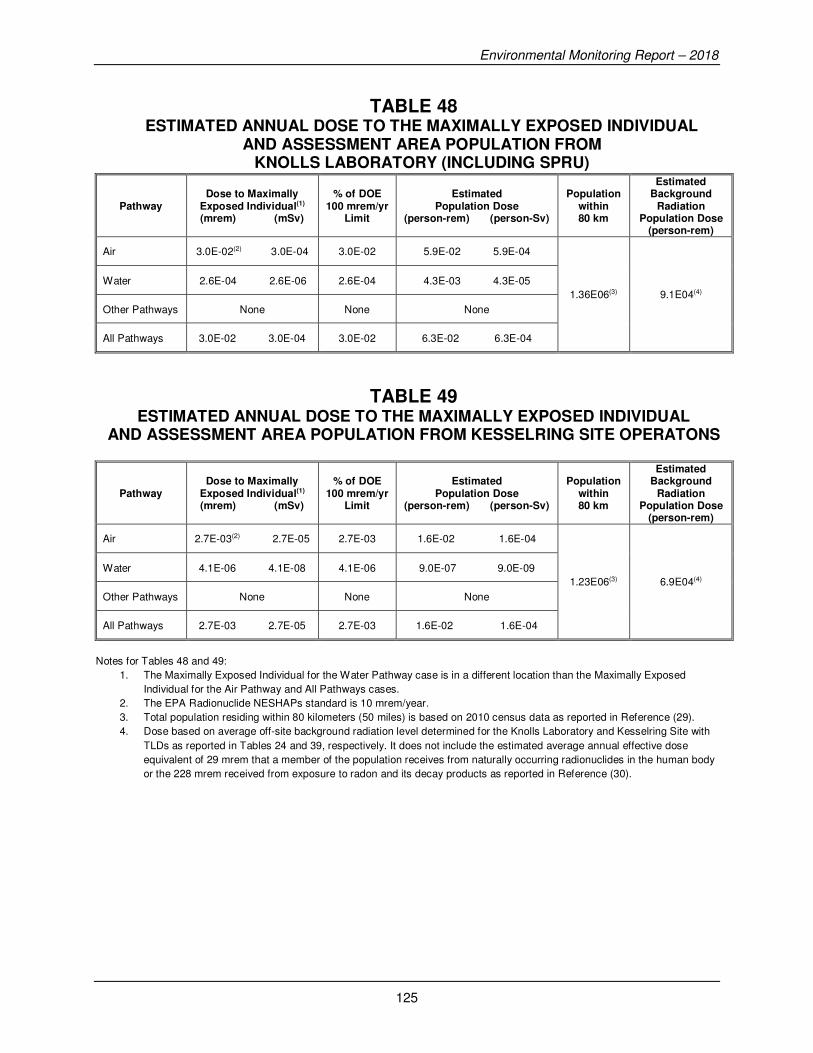
Environmental Monitoring Report – 2018
125
TABLE 48 ESTIMATED ANNUAL DOSE TO THE MAXIMALLY EXPOSED INDIVIDUAL
AND ASSESSMENT AREA POPULATION FROM KNOLLS LABORATORY (INCLUDING SPRU)
Pathway Dose to Maximally
Exposed Individual(1)
(mrem) (mSv)
% of DOE 100 mrem/yr
Limit
Estimated Population Dose
(person-rem) (person-Sv)
Population within 80 km
Estimated Background
Radiation Population Dose
(person-rem)
Air 3.0E-02(2) 3.0E-04 3.0E-02 5.9E-02 5.9E-04
1.36E06(3) 9.1E04(4)
Water 2.6E-04 2.6E-06 2.6E-04 4.3E-03 4.3E-05
Other Pathways None None None
All Pathways 3.0E-02 3.0E-04 3.0E-02 6.3E-02 6.3E-04
TABLE 49 ESTIMATED ANNUAL DOSE TO THE MAXIMALLY EXPOSED INDIVIDUAL
AND ASSESSMENT AREA POPULATION FROM KESSELRING SITE OPERATONS
Pathway Dose to Maximally
Exposed Individual(1)
(mrem) (mSv)
% of DOE 100 mrem/yr
Limit
Estimated Population Dose
(person-rem) (person-Sv)
Population within 80 km
Estimated Background
Radiation Population Dose
(person-rem)
Air 2.7E-03(2) 2.7E-05 2.7E-03 1.6E-02 1.6E-04
1.23E06(3) 6.9E04(4)
Water 4.1E-06 4.1E-08 4.1E-06 9.0E-07 9.0E-09
Other Pathways None None None
All Pathways 2.7E-03 2.7E-05 2.7E-03 1.6E-02 1.6E-04
Notes for Tables 48 and 49:
1. The Maximally Exposed Individual for the Water Pathway case is in a different location than the Maximally Exposed
Individual for the Air Pathway and All Pathways cases.
2. The EPA Radionuclide NESHAPs standard is 10 mrem/year.
3. Total population residing within 80 kilometers (50 miles) is based on 2010 census data as reported in Reference (29).
4. Dose based on average off-site background radiation level determined for the Knolls Laboratory and Kesselring Site with
TLDs as reported in Tables 24 and 39, respectively. It does not include the estimated average annual effective dose
equivalent of 29 mrem that a member of the population receives from naturally occurring radionuclides in the human body
or the 228 mrem received from exposure to radon and its decay products as reported in Reference (30).

Environmental Monitoring Report – 2018
126
FIGURE 11 EIGHTY KILOMETER (50 MILE) ASSESSMENT AREA MAP
FOR KNOLLS LABORATORY (INCLUDING SPRU) AND KESSELRING SITE

Environmental Monitoring Report – 2018
127
FIGURE 12 COMPARISON OF THE ESTIMATED RADIATION DOSE FROM KNOLLS LABORATORY (INCLUDING SPRU) AND KESSELRING SITE WITH DOSES FROM OTHER SOURCES
Knolls Laboratory
(including SPRU)
and Kesselring Site
(Maximally
Exposed Off-Site
Individual)
Environmental Monitoring Report – 2018
128
Intentionally Blank

Environmental Monitoring Report – 2018
129
QUALITY ASSURANCE PROGRAM
The Knolls Laboratory and Kesselring Site Quality Assurance Program is conducted to ensure the
accuracy and precision of effluent and environmental sampling, analysis, and reporting. The pro-
gram is based on the guidance contained in several DOE, EPA, and NRC documents on the subject
(References 31, 32, and 33, respectively).
The program for 2018 consisted of the following elements:
1. Internal quality assurance procedures
a. Personnel training and qualification
b. Written procedures for sampling, sample analysis, and computational methods
c. Calibration of sampling and sample analysis equipment
d. Internal quality assurance sample analyses
e. Data review and computation check
2. Participation in a Quality Assurance Program (QAP) administered by a commercial
laboratory, Environmental Resource Associates (ERA)
3. Subcontractor quality assurance procedures
4. Program audits
The internal quality assurance procedures start with the training of all personnel involved in the
collection and analysis of samples, in accordance with established Knolls Laboratory and
Kesselring Site policies. Personnel are not permitted to perform sampling and sample analysis
until they are trained and have demonstrated the ability to properly perform their duties. Written
procedures, based on the methods recommended in References (31) and (33), cover collection and
analysis of samples, the computation of results, and the calibration of sampling and analytical
equipment, as required. Radioactivity counting equipment is, whenever possible, calibrated using
standards that are traceable to the National Institute of Standards and Technology. Internal quality
assurance procedures also provide for a system of duplicate (or replicate) analyses of the same
sample and the analyses of spiked samples to demonstrate precision and accuracy. All meas-
urement data are assessed to detect anomalies, unusual results, and trends.
The Knolls Laboratory and the Kesselring Site participate in a QAP administered by a commercial
laboratory, ERA. The QAP provides an independent verification of the accuracy and precision of
Knolls Laboratory and Kesselring Site analyses of effluent and environmental monitoring samples.
The results of Knolls Laboratory and Kesselring Site participation in the ERA QAP are
summarized in Table 50. The data demonstrate satisfactory Knolls Laboratory and Kesselring Site
performance.
Vendor subcontractor laboratories perform non-radioactive effluent and environmental sample
analyses. The Knolls Laboratory and the Kesselring Site maintain a quality assurance program to
ensure the accuracy and precision of the subcontractor analytical results. This includes submitting
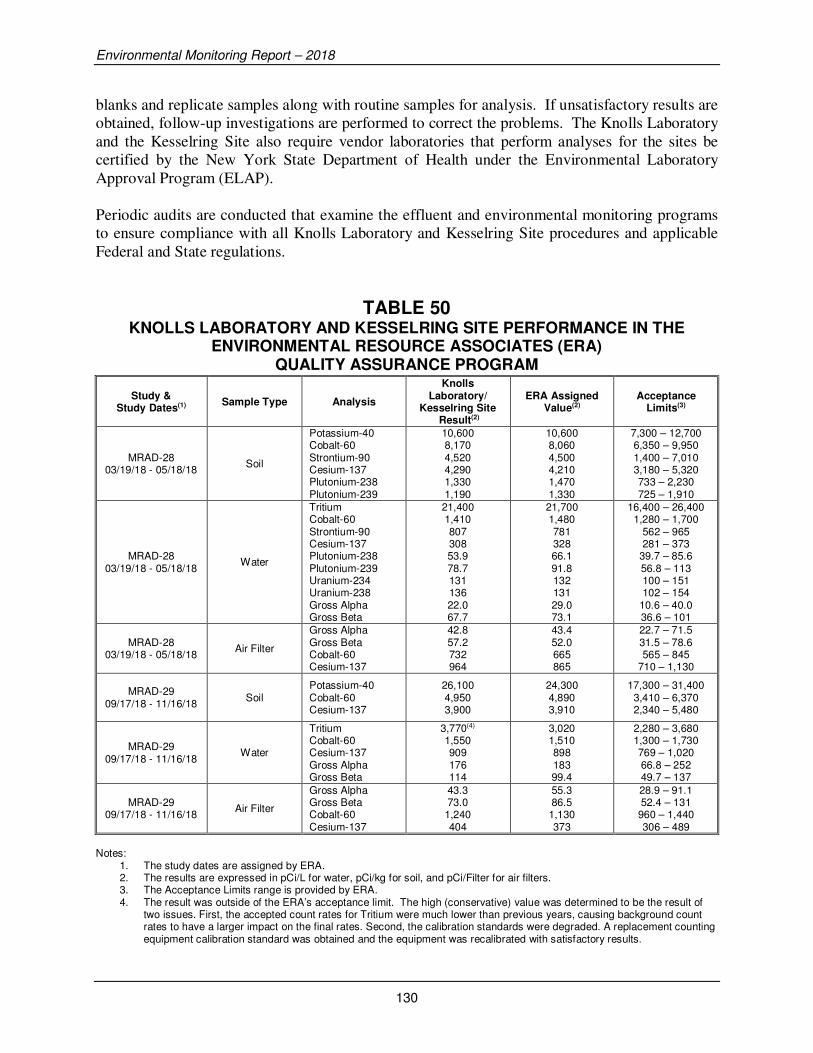
Environmental Monitoring Report – 2018
130
blanks and replicate samples along with routine samples for analysis. If unsatisfactory results are
obtained, follow-up investigations are performed to correct the problems. The Knolls Laboratory
and the Kesselring Site also require vendor laboratories that perform analyses for the sites be
certified by the New York State Department of Health under the Environmental Laboratory
Approval Program (ELAP).
Periodic audits are conducted that examine the effluent and environmental monitoring programs
to ensure compliance with all Knolls Laboratory and Kesselring Site procedures and applicable
Federal and State regulations.
TABLE 50 KNOLLS LABORATORY AND KESSELRING SITE PERFORMANCE IN THE
ENVIRONMENTAL RESOURCE ASSOCIATES (ERA) QUALITY ASSURANCE PROGRAM
Study & Study Dates(1) Sample Type Analysis
Knolls Laboratory/
Kesselring Site Result(2)
ERA Assigned Value(2)
Acceptance Limits(3)
MRAD-28 03/19/18 - 05/18/18
Soil
Potassium-40 Cobalt-60 Strontium-90 Cesium-137 Plutonium-238 Plutonium-239
10,600 8,170 4,520 4,290 1,330 1,190
10,600 8,060 4,500 4,210 1,470 1,330
7,300 – 12,700 6,350 – 9,950 1,400 – 7,010 3,180 – 5,320 733 – 2,230 725 – 1,910
MRAD-28 03/19/18 - 05/18/18
Water
Tritium Cobalt-60 Strontium-90 Cesium-137 Plutonium-238 Plutonium-239 Uranium-234 Uranium-238 Gross Alpha Gross Beta
21,400 1,410 807 308 53.9 78.7 131 136 22.0 67.7
21,700 1,480 781 328 66.1 91.8 132 131 29.0 73.1
16,400 – 26,400 1,280 – 1,700
562 – 965 281 – 373
39.7 – 85.6 56.8 – 113 100 – 151 102 – 154
10.6 – 40.0 36.6 – 101
MRAD-28 03/19/18 - 05/18/18
Air Filter
Gross Alpha Gross Beta Cobalt-60 Cesium-137
42.8 57.2 732 964
43.4 52.0 665 865
22.7 – 71.5 31.5 – 78.6 565 – 845
710 – 1,130
MRAD-29 09/17/18 - 11/16/18
Soil Potassium-40 Cobalt-60 Cesium-137
26,100 4,950 3,900
24,300 4,890 3,910
17,300 – 31,400 3,410 – 6,370 2,340 – 5,480
MRAD-29 09/17/18 - 11/16/18
Water
Tritium Cobalt-60 Cesium-137 Gross Alpha Gross Beta
3,770(4) 1,550 909 176 114
3,020 1,510 898 183 99.4
2,280 – 3,680 1,300 – 1,730 769 – 1,020 66.8 – 252 49.7 – 137
MRAD-29 09/17/18 - 11/16/18
Air Filter
Gross Alpha Gross Beta Cobalt-60 Cesium-137
43.3 73.0 1,240 404
55.3 86.5 1,130 373
28.9 – 91.1 52.4 – 131 960 – 1,440 306 – 489
Notes: 1. The study dates are assigned by ERA. 2. The results are expressed in pCi/L for water, pCi/kg for soil, and pCi/Filter for air filters. 3. The Acceptance Limits range is provided by ERA. 4. The result was outside of the ERA’s acceptance limit. The high (conservative) value was determined to be the result of
two issues. First, the accepted count rates for Tritium were much lower than previous years, causing background count rates to have a larger impact on the final rates. Second, the calibration standards were degraded. A replacement counting equipment calibration standard was obtained and the equipment was recalibrated with satisfactory results.

Environmental Monitoring Report – 2018
131
SPRU Quality Assurance Program
The DOE-EM Quality Assurance Program described in Revision 0 EM-QA-001 establishes DOE-
EM expectations for quality assurance programs and the implementation of quality assurance
requirements DOE-EM complex-wide in the context of DOE Order 414.1C and Title 10 of the
Code of Federal Regulations (CFR), Part 830, Subpart A. The DOE-EM QAP further adopts the
use of the 2004 Edition of the American National Standards Institute (ANSI)/American Society of
Mechanical Engineers (ASME) NQA-1, “Quality Assurance Requirements for Nuclear Facility
Applications,” Part I and the applicable subparts of Part II with Addenda through 2007 as a national
consensus standard for quality assurance requirements that apply to work accomplished by DOE-
EM and work accomplished by private organizations under contract with the DOE-EM. Together,
EM-QA-001, DOE Order 414.1C, 10 CFR 830 Subpart A and ANSI/ASME NQA-1-2004 Part I
and the applicable subparts of Part II form the basis for the SPRU quality assurance programs.
Environmental Monitoring Report – 2018
132
Intentionally Blank

Environmental Monitoring Report – 2018
133
RADIATION AND RADIOACTIVITY
This section provides general information on radiation and radioactivity for those who may not be
familiar with the terms and concepts.
Man has always lived in an environment where natural background radiation is present. This
background radiation is as much a part of the earth's environment as is light and heat from the sun's
rays. There are three principal sources of natural background radiation: cosmic radiation from the
sun and outer space, radiation from the natural radioactivity in soil and rocks (called “terrestrial
radiation”), and internal radiation from natural radioactive chemical elements that are part of our
bodies. A basic knowledge of the concepts of radiation and radioactivity is important in
understanding how effective control programs are in reducing radiation exposures and minimizing
radioactivity releases to levels that are “as low as is reasonably achievable” (ALARA).
RADIATION
In simple terms, radiation is a form of energy. Microwaves, radio waves, X-rays, light, and heat
are all common forms of radiation. The radiation from radioactive materials (radionuclides) is in
the form of particles or rays. During the decay of radionuclides, alpha, beta, and gamma radiation
can be emitted.
Alpha radiation consists of small, positively charged particles of low penetrating power that
can be stopped by a sheet of paper. Radionuclides that emit alpha particles include radium,
uranium, and thorium.
Beta radiation consists of positively or negatively charged particles that are smaller than alpha
particles but generally have more penetrating power and may require up to an inch of wood or
other light material to be stopped. Examples of beta emitters include strontium-90, cesium-137,
and cobalt-60.
Gamma radiation is an energy emission similar to an X-ray. Gamma rays have great
penetrating power but can potentially be stopped by several feet of concrete or several inches of
lead. The actual thickness required of a particular shielding material depends on the quantity
and energy of the gamma rays to be stopped. Most radionuclides emit gamma rays along with
beta or alpha particles.
Each radionuclide emits a unique combination of radiations that is like a "finger print" of that
radionuclide. Alpha or beta particles and/or gamma rays are emitted in various combinations and
energies. Radionuclides may be identified by measuring the type, relative amounts, and energy of
the radiations emitted. Measurement of half-life and chemical properties may also be used to help
identify radionuclides.
Environmental Monitoring Report – 2018
134
Radiation Dose Assessment
Body tissue can be damaged if enough energy from radiation is absorbed. The amount of energy
absorbed by body tissue during radiation exposure is called an "absorbed dose." The potential
biological effect resulting from a particular dose is based on a technically defined quantity called
a "dose equivalent." The unit of dose equivalent is called the Roentgen equivalent man or “rem.”
Another quantity called "effective dose equivalent" is a dose summation that is used to estimate
the risk of health-effects when the radiation dose is received from sources that are external to the
body and from radioactive materials that are within the various body tissues. The traditional unit
of effective dose equivalent, which is used in the United States is the rem, while the standard
international (SI) unit is the Sievert (One Sievert is equal to 100 rem). The rem is a unit that is
relatively large compared with the level of radiation doses received from natural background
radiation or projected as a result of releases of radioactivity to the environment. The millirem
(mrem, or one thousandth of a rem), is frequently used instead of the rem. The rem and mrem are
better understood by relating to concepts that are more familiar.
Radiation comes from both natural and man-made sources. Natural background radiation includes
cosmic radiation from the sun and outer space, terrestrial radiation from radioactivity in soil,
radioactivity in the body, and inhaled radioactivity.
The National Council on Radiation Protection and Measurements estimates that the average mem-
ber of the population of the United States receives an annual effective dose equivalent of approx-
imately 311 mrem from natural background radiation. This is composed of approximately 33
mrem from cosmic radiation, 21 mrem from terrestrial radiation, 29 mrem from radioactivity
within the body and 228 mrem from inhaled radon and its decay products. The cosmic radiation
component in the United States varies from 22 mrem in Honolulu, Hawaii to 65 mrem in Colorado
Springs, Colorado. The terrestrial component varies from about 10 mrem in the Atlantic and Gulf
Coastal Plain to about 40 mrem in the mountainous regions of the west. The dose from inhaled
radon and its decay products is the most variable because of fluctuations in radon concentrations
within houses due to changes in weather patterns and other factors such as changes in living habits.
The average natural background radiation level measured in the vicinity of the KAPL Sites is
approximately 70 mrem per year. Individual locations vary depending on soil composition, soil
moisture content and snow cover.
In addition to natural background radiation, people are also exposed to man-made sources of
radiation, such as medical and dental X-rays and conventional fluoroscopy, computed tomography,
nuclear medicine, and interventional fluoroscopy. The average radiation dose from these sources
is about 300 mrem per year. Other sources include consumer products such as building products
(brick and concrete), lawn and garden fertilizer, loose leaf spinach, and bananas. Additionally, an
airplane trip typically results in a radiation exposure. A round-trip flight between the east and the
west coast results in a dose of about 6 mrem.

Environmental Monitoring Report – 2018
135
RADIOACTIVITY
All materials are made up of atoms. In the case of a radioactive material, these atoms are unstable
and give off energy in the form of rays or tiny particles as they attempt to reach a stable state. Each
type of radioactive atom is called a radionuclide. Each radionuclide emits a characteristic form of
radiation as it gives off energy. Radionuclides change as radiation occurs, and this transition is
called radioactive decay. The rate at which a particular radionuclide decays is measured by its
half-life. A half-life is the time required for one-half the radioactive atoms in a given amount of
material to decay. For example, the half-life of the man-made radionuclide cobalt-60 is 5.3 years.
This means that after a 5.3 year period, half of the original cobalt-60 atoms present will have
decayed. The following 5.3 year period will result in half of the remaining cobalt-60 atoms to
decay, and so on.
The half-lives of radionuclides vary greatly. For instance, the half-life of naturally occurring
radon-220 is only 55 seconds, but the half-live of uranium-238, another naturally occurring
radionuclide, is 4.5 billion years.
Through the decay process, each radionuclide changes into a different nuclide or atom - often
becoming a different chemical element. For example, naturally occurring radioactive thorium-
232, after emitting its radiation, transforms to a second radionuclide, which transforms to a third,
and so on. Thus, a chain of eleven radionuclides is formed including radon-220, before non-
radioactive lead-208 is formed. Each of the radionuclides in the series has its own characteristic
half-life and type of radiation. The chain finally ends when the newest nuclide is stable. The
uranium chain starts with uranium-238 and proceeds through 13 radionuclides, ending with stable
lead-206. All of these naturally occurring radionuclides are present in trace amounts in the soil in
your backyard as well as in many other environmental media.
Measuring Radioactivity The curie (Ci) is the traditional unit used for expressing the magnitude of radioactive decay in a
sample containing radioactive material. The analogous SI unit to the Ci is the becquerel (Bq).
Specifically, the Ci is the amount of radioactivity equal to 3.7 x 10¹⁰ (37 billion) disintegrations
per second and a Bq is equal to one disintegration per second. For environmental monitoring
purposes, the Ci is usually too large a unit to work with conveniently and is broken down into
smaller values such as the microcurie (µCi, one millionth of a curie or 10-6 Ci) and the picocurie
(pCi, one trillionth of a Ci or 10-12 Ci). Older wristwatches that were painted with radium to allow
the numbers or segments to “glow in the dark” contained about one (1) µCi of radium. The average
person has about one tenth (0.1) of a µCi of naturally occurring potassium-40 in his body. Typical
soil and sediment samples contain about one (1) pCi of natural uranium per gram.
Sources of Radioactivity
Some of the radioactive atoms that exist in nature have always existed and natural processes are
continually forming others. For example, uranium has always existed, it is radioactive, and it
occurs in small but variable concentrations throughout the earth. Radioactive carbon and tritium,
on the other hand, are formed by cosmic radiation striking atoms in the atmosphere. Radionuclides
Environmental Monitoring Report – 2018
136
can also be created by man. For example, they are created in nuclear reactors and consist of fission
products and activation products. Fission products are residues of the uranium fission process that
produces the energy within the reactor. The fission process also produces neutrons that interact
with structural and other materials in the reactor to form activation products. Because of the nature
of the fission process, many fission products are radioactive. Most fission products have short
half-lives and are retained within the nuclear fuel itself; however, trace natural uranium impurities
in reactor structural materials release small quantities of fission products to the reactor coolant.
It should be noted that a certain level of background fission-product radioactivity also exists in the
environment, primarily due to past atmospheric nuclear weapons testing. Although the level is
very low, these fission products are routinely detected in air, food, and water when analyzed with
extremely sensitive instruments and techniques.
CONTROL OF RADIATION AND RADIOACTIVITY
To reduce the exposure of persons to ionizing radiation to “as low as is reasonably achievable,”
controlling the use and disposal of radioactive materials and comprehensive monitoring programs
to measure the effectiveness of these controls is required. Effluent streams that may contain ra-
dioactive materials must be treated by appropriate methods to remove the radioactive materials
and the effluent monitored to ensure that these materials have been reduced to concentrations that
are “as low as is reasonably achievable” and are well within all applicable guidelines and re-
quirements prior to discharge.
Environmental Monitoring Report – 2018
137
GLOSSARY
Activation Products - As cooling water circulates through the reactor, certain impurities present
in the water and even components of the water itself can be converted to radioactive nuclides (they
become "activated"). Important activation products present in reactor coolant water include
radionuclides of corrosion and wear products (Co-60, Fe-59, Co-58, Cr-51), of impurities dis-
solved in the water (Ar-41, Na-24, C-14) and of atoms present in the water molecules (tritium).
Of these, the predominant radionuclide and also the one with the most restrictive limits is Co-60.
Algae - Simple rootless plants that grow in bodies of water in relative proportion to the amount of
nutrients available. Algae blooms, or sudden growth spurts can affect water quality adversely.
Alkalinity - The measurable ability of solutions or aqueous suspensions to neutralize an acid.
Alpha Radioactivity - A form of radioactivity exhibited by certain radionuclides characterized by
emission of an alpha particle. Many naturally occurring radionuclides including radium, uranium,
and thorium decay in this manner.
Benthic Macroinvertebrates - Small organisms inhabiting the bottom of lakes and streams or
attached to stones or other submersed objects. The study of macroinvertebrate communities gives
an indication of the overall quality of the body of water from which they are taken.
Beta-Gamma Radioactivity - A form of radioactivity characterized by emission of a beta particle
and/or gamma rays. Many naturally occurring radionuclides such as Pb-212, Bi-212, and Bi-214
decay in this manner.
Biochemical Oxygen Demand (BOD) - The BOD test is used to measure the content of organic
material in both wastewater and natural waters. BOD is an important parameter for stream and
industrial waste studies and control of waste treatment plants because it measures the amount of
oxygen consumed in the biological process of breaking down organic materials in the water.
Birge-Ekman Dredge - A device used for sampling the bottom sediment in rivers, streams, lakes,
etc. The Birge-Ekman dredge is lowered to the bottom on a line and its spring-loaded "jaws" are
remotely tripped from the surface. It samples an area of approximately 230 cm2 to an average
depth of 2.5 cm.
British Thermal Unit (BTU) - A unit commonly used to quantify the heat output of boilers, fur-
naces, etc. Specifically, the amount of heat necessary to raise 1 lb. of water one degree Fahrenheit.
Chain Electro-Fishing Techniques - A technique of collecting samples of fish from a body of
water whereby the fish are stunned with an electric current, categorized, and returned to the water
unharmed.
Chemical Oxygen Demand (COD) - A measure of the oxygen required to oxidize all compounds
in water, organic and inorganic.

Environmental Monitoring Report – 2018
138
Collective Dose Equivalent and Collective Effective Dose Equivalent - The sums of the dose
equivalents or effective dose equivalents of all individuals in an exposed population within an
80-km radius and they are expressed in units of person-rem.
Committed Dose Equivalent (CDE) - The predicted total dose equivalent to a tissue or organ
over a 50-year period after a known intake of a radionuclide into the body. It does not include
contributions from external dose. Committed dose equivalent is expressed in units of rem.
Committed Effective Dose Equivalent (CEDE) - The sum of the committed dose equivalents to
various tissues in the body, each multiplied by the appropriate weighting factor. Committed
effective dose equivalent is expressed in units of rem.
Composite Sample - A sample that is comprised of a number of grab samples over the
compositing period. In some cases the composite sample obtained may be proportional to effluent
flow and is called a proportional sample or flow-composited sample.
Conductivity - A measure of water’s capacity to convey an electric current. This property is
related to the total concentration of the ionized substances in water and the temperature at which
the measurement is made.
Confidence Interval - Statistical terminology for the error interval (±) assigned to numerical data.
A two sigma (2σ) confidence interval means there is 95% confidence that the true value (as
opposed to the measured one) lies within the (±) interval. The 95% is the confidence level (See
(±) value, Standard Deviation of the Average).
Corrosion and Wear Products - Piping and components used in construction of a nuclear reactor
are fabricated from extremely durable, corrosion and wear resistant materials. Even under the best
circumstances, however, small amounts of these materials enter the reactor coolant due to wear of
moving parts and corrosion of the water contact surfaces of reactor plant components. While in
no way affecting operational characteristics or reactor plant integrity, some of these corrosion and
wear products may become activated as they pass through the reactor core. This necessitates that
the reactor coolant be processed by filtration or other methods of purification before it is
discharged or reused (See Activation Products).
Curie (Ci) - The common unit used for expressing the magnitude of radioactive decay in a sample
containing radioactive material. Specifically, the curie is that amount of radioactivity equal to
3.7 x 10¹⁰ (37 billion) disintegrations per second. For environmental monitoring purposes, the
curie is usually too large a unit to conveniently work with and is broken down to smaller values
(See microcurie and picocurie).
Decision Level Concentration - The quantity of radioactivity above which a decision is made that
a net amount of radioactivity is present with a five percent probability of erroneously reporting net
radioactivity when none is present (i.e., false positive).
Environmental Monitoring Report – 2018
139
Derived Concentration Guide (DCG) or Derived Concentration Standard (DCS) - The con-
centration of a radionuclide in air or water that, under conditions of continuous exposure for one
year by one exposure mode (i.e., ingestion of water, submersion in air, or inhalation), would result
in an effective dose equivalent of 100 mrem (0.1 rem).
Dose Equivalent - The quantity that expresses the biological effects of radiation doses from all
types (alpha, beta-gamma) of radiation on a common scale. The unit of dose equivalent is the rem.
Dosimeter - See Thermoluminescent Dosimeters
Duplicate Sample - A sample that is created by splitting existing samples before analysis and
treating each split sample as a separate sample. The samples are then analyzed as a quality
assurance method to assess the precision in the analytical process.
Ecosystem - The integrated, interdependent system of plant and animal life existing in an
environmental framework. Understanding of an entire ecosystem is important because changes or
damage to one component of the system may have effects on others.
Effective Dose Equivalent - The sum of the dose equivalent to the whole body from external
sources plus the dose equivalents to specific organs times a weighting factor appropriate for each
organ. The weighting factor relates the effect of individual organ exposure relative to the effect
of exposure to the whole body. The unit of effective dose equivalent is the rem.
Eh - A measure of the oxidation-reduction potential of water expressed in units of millivolts. The
oxidation-reduction potential affects the behavior of many chemical constituents present in water
in the environment.
Field Blank - A sample of laboratory distilled water that is put into a sample container at the field
collection site and is processed from that point as a routine sample. Field blanks are used as a
quality assurance method to detect contamination introduced by the sampling procedure.
Fission Products - During operation of a nuclear reactor, heat is produced by the fission (splitting)
of "heavy" atoms, such as uranium, plutonium or thorium. The residue left after the splitting of
these "heavy" atoms is a series of intermediate weight atoms generally termed "fission products."
Because of the nature of the fission process, many fission products are unstable and, hence, radio-
active. Most fission products have short lives and are retained within the nuclear fuel itself;
however, trace natural uranium impurities in reactor structural materials release small quantities
of fission products to the reactor coolant.
It should be noted that a certain level of background fission product radioactivity exists in the
environment, primarily due to atmospheric nuclear weapons testing. The level is very low, but
may be detectable when environmental samples are analyzed with extremely sensitive instruments
and techniques such as those used by the Knolls Atomic Power Laboratory.
Grab Sample - A single sample that is collected and is representative of the stream or effluent.
Environmental Monitoring Report – 2018
140
Half-life - A value assigned to a radionuclide that specifies how long it takes for one half of a
given quantity of radioactivity to decay away. Half-lives may range from fractions of a second to
millions of years.
High Purity Germanium Gamma Spectrometry - A gamma ray measuring system designed for
qualitative and quantitative determination of radionuclides present in a sample. Gamma
spectrometry systems make use of the fact that during the decay of most radionuclides, one or
more gamma rays are emitted at energy levels characteristic of the individual radionuclide. For
example, during the decay of Co-60, two gamma rays of 1.17 and 1.33 million electron volts
(MeV) are emitted while the decay of Ar-41 produces one gamma ray of 1.29 MeV. The high
purity germanium detectors used in these systems are capable of detecting and very precisely
resolving differences in gamma ray energy levels.
Long-Lived Gamma Radioactivity - Two very important characteristics of radionuclides are the
length of time it takes for a given amount to decay away and the type of radiation emitted during
decay. From an environmental standpoint, some of the most significant radionuclides are those
whose half-lives are relatively long and that also emit penetrating gamma radiation during decay.
Two radionuclides of concern in these respects are cobalt-60 (a corrosion and wear activation
product) and Cs-137 (a fission product). (See Half-life, Beta-Gamma Radioactivity)
Macrophyton - Macroscopic plants in an aquatic environment.
Method Detection Limit - The lowest value at which a nonradiological sample result shows a
statistically positive difference from a sample in which no constituent is present.
microcurie (µµµµCi) - One millionth of a curie (10-6 curie). A typical smoke detector contains 1 µCi
of Am-241 radioactive material (See curie and picocurie).
micrograms per liter (µµµµg/l) - A unit of concentration commonly used to express the levels of
impurities present in a water sample. A microgram is one millionth of a gram. One microgram
per liter is equal to one part per billion.
milligrams per liter (mg/l) - A unit of concentration commonly used to express the levels of
impurities present in a water sample. A milligram is one thousandth of a gram. One milligram per
liter is equal to one part per million.
millirem (mrem) - One thousandth of a rem (10-3 rem).
Mixed waste - Waste that contains both hazardous (regulated by EPA/NYSDEC) and
radioactive material (regulated by DOE)),
Outfall - A point of discharge (e.g., drain or pipe) of liquid effluent into a stream, river, ditch, or
other water body.
Environmental Monitoring Report – 2018
141
Parshall Flume - A specially constructed channel designed such that discharge water flow rate
can be accurately measured. The Parshall Flume may also be instrumented to record the total
volume of flow over long periods of time.
Pasquill Stability Class - A classification that defines the relative stability and dispersive capa-
bility of the atmosphere. Classification is highly dependent upon the change in temperature with
height.
Periphyton - Communities of microorganisms growing on stones, sticks, and other submerged
surfaces. The quantities and types of periphyton present are very useful in assessing the effects of
pollutants on lakes and streams.
Person-Rem - The sum of the individual dose equivalents or effective dose equivalents received
by each member of a certain group or population. It is calculated by multiplying the average dose
per person by the number of persons within a specific geographic area. For example, a thousand
people each exposed to 0.001 rem would have a collective dose of one person-rem.
pH - A measure of the acidity or alkalinity of a solution on a scale of 0 to 14 (low is acidic, high
is alkaline or caustic, 7 is neutral).
picocurie (pCi) - One trillionth of a curie (10-12 curie). Typical soil and sediment samples contain
about 1 pCi of natural uranium per gram. (See curie and microcurie.)
Plankton - Tiny plants and animals that live in water.
±±±± Value (plus or minus value) - An expression of the uncertainty in sample results. The magni-
tude of the (±) value depends on the number of samples, the size of the sample, intrinsic analytical
uncertainties and the degree of confidence required. The (±) value assigned to data in this report
is for the 95% confidence level (See Confidence Interval).
Polychlorinated Biphenyls (PCBs) - Halogenated aromatic hydrocarbons formed by the
chlorination of biphenyl molecules. PCB's were commonly used in transformers as a dielectric
fluid because of their stability.
Practical Quantitation Limit - The lowest concentration that can be reliably achieved in
nonradiological samples within specified limits of precision and accuracy during routine
laboratory operating conditions.
Radionuclides - Atoms that exhibit radioactive properties. Standard practice for naming radionuc-
lides is to use the name or atomic symbol of an element followed by its atomic weight (e.g.,
cobalt-60 or Co-60, a radionuclide of cobalt). There are several hundred known radionuclides,
some of which are man-made and some of which are naturally occurring. Radionuclides can be
differentiated by the types of radiation they emit, the energy of the radiation and the rate at which
a known amount of the radionuclide decays away (See Half-life).
Rem - The unit of dose equivalent and effective dose equivalent.

Environmental Monitoring Report – 2018
142
Reporting Limit - The lowest concentration of an analyte that can be reliably reported in
nonradiological samples within specified limits of precision and accuracy during routine
laboratory operating conditions.
Resource Conservation and Recovery Act (RCRA) - A Federal law that established a structure
to track and regulate hazardous wastes from the time of generation to disposal. The law requires
safe and secure procedures to be used in treating, transporting, storing, and disposing of hazardous
substances. RCRA is designed to prevent new, uncontrolled hazardous waste sites.
Reverse Osmosis - Also known as hyper-filtration, it is a process that allows the separation of
solutes (i.e., dissolved substances) from a solution by forcing the solvent through a semi-permeable
membrane by applying a pressure greater than the osmotic pressure associated with the solutes. A
semi-permeable membrane is a membrane that allows diffusion of solvent molecules through it,
while retarding the diffusion of solute molecules.
Settleable Solids - A measurement of the amount of solids that will settle out of a sample of water
in a certain interval of time. This parameter commonly applies to water being processed in sewage
treatment plants and is used to control the operation and evaluate the performance of these plants.
Short-Lived Gamma Radioactivity - Radioactive material of relatively short life that decays with
the emission of gamma rays. It is generally not important with respect to environmental discharges
because of the short life span. Some examples of short-lived gamma emitting radionuclides are
Ar-41 (an activation product gas), Kr-88 (a fission product gas), and Xe-138 (a fission product
gas).
Spiked Sample - A sample to which a known quantity of the material that is being analyzed for
has been added for quality assurance testing.
Standard Deviation of the Average - A term used to characterize the uncertainty assigned to the
mean of a set of analyzed data (See Confidence Interval, (±) Value).
Surber Bottom Sampler - A device for collecting samples of benthic macroinvertebrates from
the bottom of relatively shallow, fast moving streams.
Suspended Solids - Particulate matter, both organic and inorganic suspended in water. High levels
of suspended solids not only affect the aesthetic quality of water by reducing clarity, but may also
indirectly indicate other undesirable conditions present. The analysis for suspended solids is
performed by passing a sample of water through a filter and weighing the residue.
Thermoluminescent Dosimeters (TLDs) - Sensitive monitoring devices that absorb and store
energy from radiation. The TLDs used by the Knolls Laboratory and the Kesselring Site for
environmental monitoring consist of small chips of lithium fluoride (LiF) encased in appropriate
materials and strategically located at site perimeter and off-site locations. Thermoluminescent
Dosimeters derive their name from a property that certain crystals exhibit when exposed to
radiation and subsequently heated-that of emitting light proportional to the amount of radiation

Environmental Monitoring Report – 2018
143
exposure received (thermoluminescence). The emitted light can then be read out on special
instrumentation and correlated to the amount of radiation dose accumulated.
Turbidity - A cloudy condition in water due to suspended silt or organic matter. Turbidity is
measured in nephelometric turbidity units (ntu).
Upgradient - Referring to the flow of groundwater, upgradient is analogous to upstream and is a
point that is “before” an area of study that is used as a baseline for comparison with downgradient
or downstream data.
Volatile Organic Compound (VOC) - An organic (carbon-containing) compound that evaporates
(volatilizes) readily at room temperature.
Weight Percent - A term commonly used to describe the amount of a substance in a material. For
example, oil containing 0.5 lb. sulfur per 100 lb. oil would contain 0.5 percent by weight sulfur.
Weighting Factor - Tissue-specific representation of the fraction of the total health risk resulting
from uniform, whole-body irradiation that could be contributed to that particular tissue.
Whole Effluent Toxicity (WET) - The aggregate toxic effect to aquatic organisms from all
pollutants contained in a facility’s wastewater. WET tests measure wastewater’s effects on
specific test organisms’ (plants, vertebrates and invertebrates) ability to survive, grow, and
reproduce.

Environmental Monitoring Report – 2018
144
Intentionally Blank
Environmental Monitoring Report – 2018
145
REFERENCES
1. Title 6, New York Codes, Rules and Regulations, Parts 700-705, Water Quality Regulations
for Surface Waters and Groundwaters
2. Town of Niskayuna Sewer District No. 6 Outside Users Agreement No. 94 3850 between
KAPL, Inc. and The Town Board of Niskayuna dated, July 19, 1994
3. New York State Department of Environmental Conservation, Authorization to Discharge
under the State Pollutant Discharge Elimination System, Permit No. NY0005851
4. New York State Department of Environmental Conservation, Division of Water Technical and
Operational Guidance Series (1.1.1), Ambient Water Quality Standards and Guidance Values
and Groundwater Effluent Limitations, June 1998 (Addendums 1/1999, 4/2000, 6/2004)
5. U.S. DOE Order 5400.5, Radiation Protection of the Public and the Environment
6. DOE-STD-1196-2011, DOE Standard, Derived Concentration Technical Standard, April
2011
7. Title 6, New York Codes, Rules and Regulations, Part 227, Stationary Combustion
Installations
8. Title 40, Code of Federal Regulations, Part 61, Subpart H, National Emission Standards for
Emissions of Radionuclides Other Than Radon From Department of Energy (DOE) Facilities
9. Knolls Atomic Power Laboratory Existing Landfill Closure Report for the Knolls Site; dated,
August 2, 1991 and the Monitoring Plan; dated, March 9, 2000
10. Standard Methods for the Examination of Water and Wastewater, American Public Health
Association
11. Knolls Atomic Power Laboratory, Mohawk River Biological Survey, ES-80-1, April 1980
12. Knolls Atomic Power Laboratory, Mohawk River Survey Report, KAPL-4808, May 1995
13. Knolls Atomic Power Laboratory, Mohawk River Survey Report, Calendar Year 2002, KAPL-
4850
14. EPA-625/6-87/016, Handbook: Groundwater, March 1987
15. Title 6, New York Codes, Rules and Regulations, Parts 596-599, Chemical Bulk Storage
Regulations
16. Title 6, New York Codes, Rules and Regulations, Parts 613, Petroleum Bulk Storage
Regulations
Environmental Monitoring Report – 2018
146
17. Title 49, Code of Federal Regulations, Parts 171-175 and 177-178, Transportation of
Hazardous Materials
18. DOE Order 458.1, Radiation Protection of the Public and Environment.
19. Title 10, Code of Federal Regulations, Part 50, Appendix I, Numerical Guide for Design
Objectives and Limiting Conditions for Operation to Meet the Criterion "As Low As Is
Reasonably Achievable" for Radioactive Material in Light-Water-Cooled Nuclear Power
Reactor Effluents
20. NUREG 0170, Final Environmental Statement of the Transportation of Material by Air and
Other Modes. U.S. Nuclear Regulatory Commission, Vol. 1, December 1977
21. Report NT-19-1, Environmental Monitoring and Disposal of Radioactive Wastes from U.S.
Naval Nuclear-Powered Ships and Their Support Facilities. U.S. Department of the Navy,
May 2019
22. New York State Department of Environmental Conservation, Authorization to Discharge
under the State Pollutant Discharge Elimination System, Permit Number: NY0005843
23. Title 10, New York Codes, Rules and Regulations, Subpart 5-1, Public Water Systems
24. New York State Department of Environmental Conservation, Division of Water Technical and
Operational Guidance Series (1.1.1) Water Quality Standards and Guidance Values, Current
Edition
25. DOE/EH-0070, External Dose-Rate Conversion Factors for Calculation of Dose to the Public,
July 1988
26. Nuclear Regulatory Guide 1.109, Calculation of Annual Doses of Man from Routine Releases
of Reactor Effluents for the Purpose of Evaluating Compliance with 10 CFR Part 50, Appendix
I. Rev. 1, October 1977
27. Federal Register, Vol.80, No. 27, Tuesday, February 10, 2015, Environmental Protection
Agency, National Emission Standards for Hazardous Air Pollutants (Radionuclides);
Availability of Updated Compliance Model; or newer revision, if applicable
28. EPA-454/R-99-005, Meteorological Monitoring Guidance for Regulatory Modeling
Applications, February 2000
29. Site Population Distribution Analysis, 2010 Census Data, prepared by Oak Ridge National
Laboratory, April 2012
30. National Council on Radiation Protection and Measurements (NCRP) Report No. 160, Ionizing
Radiation Exposure of the Population of the United States, March 2009

Environmental Monitoring Report – 2018
147
31. DOE/EP-0023, A Guide For Environmental Radiological Surveillance at USDOE Instal-
lations, July 1981
32. EPA-600/7-77-088, Handbook for Analytical Quality Control in Radioanalytical
Laboratories, August 1977
33. Nuclear Regulatory Guide 4.15, Quality Assurance for Radiological Monitoring Programs
(Normal Operations) - Effluent Streams and the Environment, July 2007.

Environmental Monitoring Report – 2018
148
Intentionally Blank

Environmental Monitoring Report – 2018
149
EXTERNAL DISTRIBUTION
USDOE, Headquarters
USDOE, Office of Naval Reactors
USDOE, Naval Reactors Laboratory Field Office - Schenectady
USDOE, West Milton Field Office
USDOE, SPRU Field Office
The Honorable Charles E. Schumer
United States Senate
The Honorable Kirsten Gillibrand
United States Senate
The Honorable Paul D. Tonko
United States House of Representatives
The Honorable Antonio Delgado
United States House of Representatives
The Honorable Elise Stefanik
United States House of Representatives
The Honorable James Tedisco
New York State Senate
The Honorable Daphne Jordan
New York State Senate
The Honorable Mary Beth Walsh
New York State Assembly
The Honorable Phillip Steck
New York State Assembly
Mr. Rory Fluman, County Manager
Schenectady County, New York
Mr. Anthony Jasenski, Sr., Chair
Schenectady County Legislature

Environmental Monitoring Report – 2018
150
Mr. Joseph Berman, Chair
Environmental Advisory Council
Schenectady County, New York
Ms. Jennifer Priebe, Director
Environmental Health
Schenectady County Public Health Administration
Mr. Mark LaViolette, Director
Department of Emergency Management
Schenectady County, New York
The Honorable Gary McCarthy, Mayor
Schenectady, New York
Ms. Yasmine Syed, Supervisor
Town of Niskayuna, New York
Mr. Matthew Yetto, PE
Superintendent of Water and Sewer
Town of Niskayuna, New York
Mr. Trevor D. Strayer, Chairman
Conservation Advisory Council
Town of Niskayuna, New York
Mr. John Frazer, Superintendent
Department of Public Works
Division of Latham Water
Town of Colonie, New York
Mr. Edward Kinowski, Chairman
Board of Supervisors
Saratoga County, New York
Mr. Carl P. Zeilman, Director
Office of Emergency Services
Saratoga County, New York
Environmental Monitoring Report – 2018
151
Mr. Jason Kemper, Director
Planning
Saratoga County, New York
The Honorable Meg Kelly, Mayor
Saratoga Springs, New York
The Honorable Larry Woolbright, Mayor
Ballston Spa, New York
Mr. Scott Ostrander, Supervisor
Town of Milton, New York
Mr. Michael Smith, Supervisor
Town of Galway, New York
Mr. Pete Lopez, Regional Administrator
Region 2
United States Environmental Protection Agency
Ms. Kathleen Malone-Bogusky
Federal Facilities Program Manager, Region 2
United States Environmental Protection Agency
Ms. Dore LaPosta, Director
Division of Enforcement and Compliance Assistance, Region 2
United States Environmental Protection Agency
Mr. Adolph Everett, Chief
Hazardous Waste Programs Branch, Region 2
United States Environmental Protection Agency
Mr. Robert Buettner, Chief
Air Compliance Branch, Region 2
United States Environmental Protection Agency
Mr. Ariel Iglesias, Deputy Director
Clean Air and Sustainability Division, Region 2
United States Environmental Protection Agency
Dr. Howard Zucker, Commissioner
New York State Department of Health

Environmental Monitoring Report – 2018
152
Mr. Alexander Damiani, Director
Bureau of Environmental Radiation Protection
New York State Department of Health
Ms. Cynthia Costello, Chief
Radiological Emergency Response Section and
Environmental Radiation/Radon Section
Bureau of Environmental Radiation Protection
New York State Department of Health
Senior Sanitary Engineer
Glens Falls District Office
New York State Department of Health
Mr. Gary Holmes, Assistant Commissioner
Public Affairs Group
New York State Department of Health
Mr. John Emery, Emergency and Risk Communications Specialist
Public affairs Group
New York State Department of Health
Mr. Basil Seggos, Commissioner
New York State Department of Environmental Conservation
Mr. David Vitale, Director
Division of Materials Management
New York State Department of Environmental Conservation
Mr. Mark Klotz, Director
Division of Water
New York State Department of Environmental Conservation
Mr. Shayne Mitchell, Section Chief
Wastewater Permits, Central Section
New York State Department of Environmental Conservation
Mr. Steve Flint, Director
Division of Air Resources
New York State Department of Environmental Conservation

Environmental Monitoring Report – 2018
153
Ms. Erica Ringewald, Deputy Commissioner
Public Affairs
New York State Department of Environmental Conservation
Mr. Daniel Evans, Director
Bureau of Hazardous Waste and Radiation Management
New York State Department of Environmental Conservation
Mr. Timothy Rice, Radioactive Materials Management Section Chief
Bureau of Hazardous Waste and Radiation Management
New York State Department of Environmental Conservation
Mrs. Lynn Winterberger, RCRA Permitting Section Chief
Bureau of Hazardous Waste and Radiation Management
New York State Department of Environmental Conservation
Mr. Keith Goertz, Regional Director
Region 4
New York State Department of Environmental Conservation
Mr. Rick Georgeson
Regional Citizen Participation Specialist
New York State Department of Environmental Conservation
Ms. Victoria Schmitt
Regional Engineer and
Acting Regional Materials Management Engineer, Region 4
New York State Department of Environmental Conservation
Mr. Benjamin Potter
Regional Air Pollution Control Engineer, Region 4
New York State Department of Environmental Conservation
Mr. Derek Thorsland
Regional Water Engineer, Region 4
New York State Department of Environmental ConservationMr.
Rick Mustico
Regional Environmental Remediation Engineer, Region 4
New York State Department of Environmental Conservation
Environmental Monitoring Report – 2018
154
Mr. Robert Stegemann, Regional Director
Region 5
New York State Department of Environmental Conservation
Mr. Joseph Zalewski
Regional Engineer, Region 5
New York State Department of Environmental Conservation
Mr. Russell Huyck
Regional Environmental Remediation Engineer, Region 5
New York State Department of Environmental Conservation
Mr. Kevin Wood
Regional Materials Management Engineer, Region 5
New York State Department of Environmental Conservation
Mr. Robert Streeter
Regional Water Engineer, Region 5
New York State Department of Environmental Conservation
Mr. James Coutant
Regional Air Engineer, Region 5
New York State Department of Environmental Conservation
Mr. Dave Winchell
Regional Citizen Participation Specialist, Region 5
New York State Department of Environmental Conservation
Mr. William Peat, Jr. Public Information Officer
New York State Division of Homeland Security and Emergency Services
Ms. Alyse Peterson, Senior Project Manager
Radioactive Waste Policy and Nuclear Coordination
New York State Energy Research and Development Authority
Mr. Brian U. Stratton, Director
New York State Canal Corporation
Environmental Monitoring Report – 2018
155
Mr. Steven Feinberg, Federal Project Director
Separations Process Research Unit Project Office
United States Department of Energy
Schenectady County Public Library, Niskayuna Branch
Niskayuna, New York
Saratoga Springs Public Library
Saratoga Springs, New York
Environmental Monitoring Report – 2018
156
Intentionally Blank