environmental market value of agricultural methane
TRANSCRIPT

New York | London | Istanbul
Environmental Market Value of
Agricultural Methane

About Karbone
2
Karbone is a full service firm specializing in renewable energy and environmental markets. We offer integrated brokerage, project finance, research and advisoryservices to a wide range of market participants. This unique combination of services all under the same roof ensures that we add real value to our clients’ projects along each segment of the project lifecycle.
NYC Office Contact: Jonathan BurnstonCarbon Markets Manager+1 (646) 666 7353 [email protected]
From our offices in New York, London, and Istanbul, and strategic partnerships inCalifornia, Canada, South America, and China, our range of project experience spans across nearly every relevant environmental market around the globe.
Recent Awards
#1 US Voluntary Carbon Offset Broker#2 US Renewable Energy Credit Broker#3 US Biofuels Broker‐Energy Risk Magazine
Top North American Carbon Broker‐World Finance Magazine
Top 10 Sustainability Consultant‐Verdantix

Our Role in Carbon
3
Early stage market advisory and project financing
Mid‐stage carbon development management and carbon financing
Commercial‐stage marketing and sales of carbon and other commodities

Carbon Markets
4
Voluntary Compliance
Plus some other topics… Thanks to Point Carbon for data

California AB32 Program• AB32 will establish the total amount of GHG emissions that major sources in
California are allowed to emit. Air Resources Board (ARB) will distribute tradable allowances to emit GHGs. Each allowance permits the holder to emit one MTCO2e of GHG.
• Entities emitting more than 25,000 MTCO2e per year are covered by the program, to be phased into the program based on industrial type.
5
Phase in Year Industry Type
Phase I: 2013
Electricity generation (including imports)
Large stationary sources: refineries, cement production facilities, oil and gas production facilities, glass manufacturing facilities, food processing plants, etc.
Phase II: 2015
Transportation and other fuel providers
Natural gas providers
Combustion of other fossil fuels not covered directly at large sources in the initial phase of the program
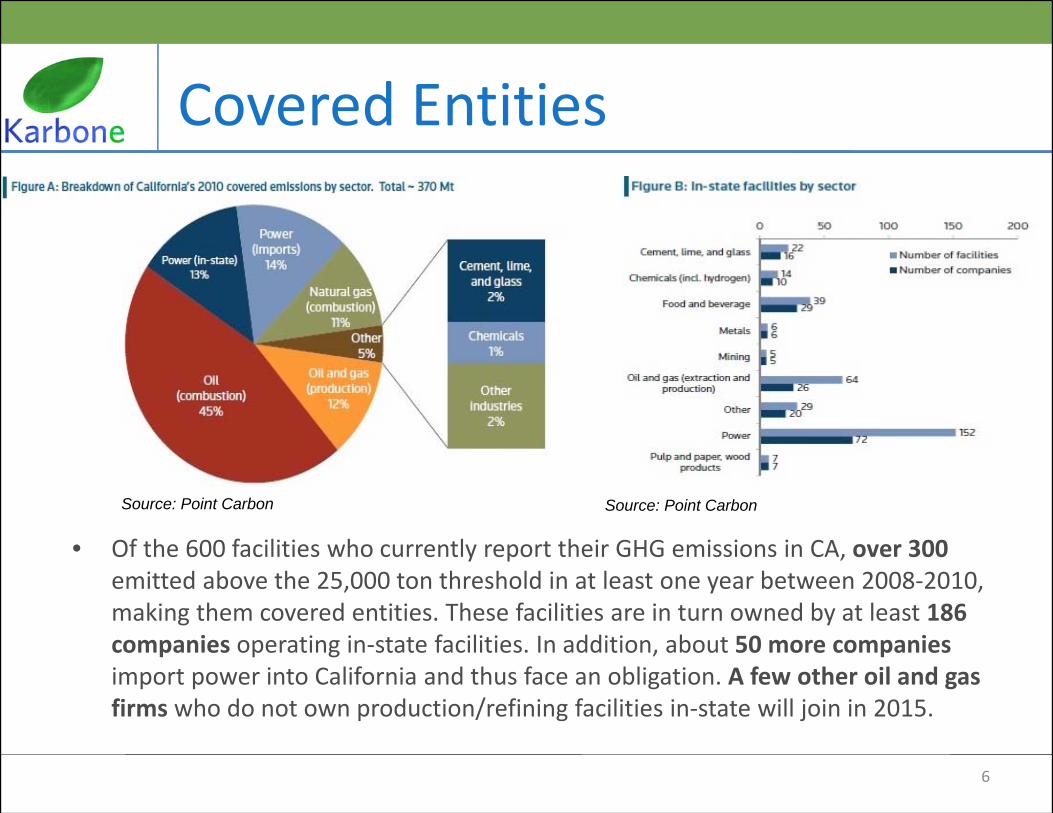
Covered Entities
• Of the 600 facilities who currently report their GHG emissions in CA, over 300 emitted above the 25,000 ton threshold in at least one year between 2008‐2010, making them covered entities. These facilities are in turn owned by at least 186 companies operating in‐state facilities. In addition, about 50 more companiesimport power into California and thus face an obligation. A few other oil and gas firms who do not own production/refining facilities in‐state will join in 2015.
6
Source: Point Carbon Source: Point Carbon

Supply/Demand: Allowances
7
150
200
250
300
350
400
450
2013 2014 2015 2016 2017 2018 2019 2020
EmissionsAllowances
Gap = Theoretical Demand

Supply/Demand: Offsets• To satisfy their required program reductions, regulated emitters may use
allowances and a set proportion of offset credits created by pollution cuts from unregulated sources. A maximum of 8 % of a regulated entity’s compliance obligation can be met using offsets.
• The four initial ARB offset protocols cover: 1) forestry; 2) urban forestry; 3) removal of ozone‐depleting substances; 4) agricultural methane.
8
Sou
rce:
Poi
nt C
arbo
n
Offset Cap vs. Offset Supply8% offset cap
Offset supply from 4 protocols
= Room for more offsets!

Offset Demand Gap
9
Source: Point Carbon

Pricing and Market Dynamics to Date
• Industry rule‐of‐thumb is that offsets trade at a 25‐50% discount to allowances.• Offsets trade at a discount due to the 8% limit on offset use and the risks from
buyer liability for revoked offsets. This discount varies as credit supply and demand fluctuate, and also across risk profiles of different offset types.
10
$0.00
$5.00
$10.00
$15.00
$20.00
$25.00
9/9/11
9/16/11
9/23/11
9/30/11
10/7/11
10/14/11
10/21/11
10/28/11
11/4/11
11/11/11
11/18/11
11/25/11
12/2/11
12/9/11
12/16/11
12/23/11
12/30/11
1/6/12
1/13/12
1/20/12
1/27/12
2/3/12
2/10/12
2/17/12
2/24/12
3/2/12
3/9/12
3/16/12
Price ($)
Date
Karbone California Carbon Allowance Prices
Vin 13 ‐ Dec 13
Vin 14 ‐ Dec 14

Pricing Forecasts
• Forecasted Offset Pricing– CP1: $6‐12 – CP2: $12‐25 – CP3: $25‐48
11
Source: Point Carbon
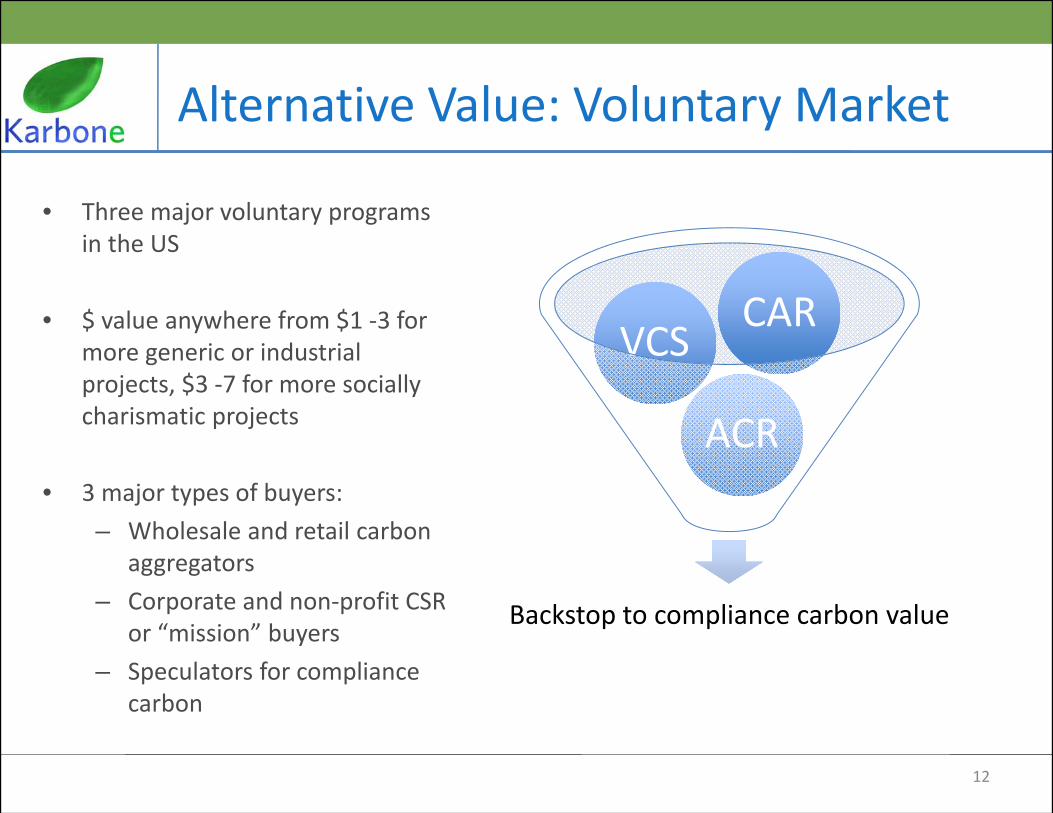
Alternative Value: Voluntary Market
• Three major voluntary programs in the US
• $ value anywhere from $1 ‐3 for more generic or industrial projects, $3 ‐7 for more socially charismatic projects
• 3 major types of buyers: – Wholesale and retail carbon
aggregators– Corporate and non‐profit CSR
or “mission” buyers– Speculators for compliance
carbon
12
Backstop to compliance carbon value
ACRACR
VCSVCSCARCAR

Additional Value Drivers
13
• Renewable power generation• Biogas export• Renewable energy credits (RECs)
Power
• Tipping fees for receiving waste manure
• Soil amendments created by treating digestate
Land and Soil

New York | London | Istanbul
Environmental Credit Brokerage Desk+ 1 646 666 7353
Environmental Finance Desk+1 646 553 5210
Carbon Advisory Services Group+1 646 616 0075