environmental management program technical report … · permission to reproduce copyrighted items...
TRANSCRIPT

Environmental Management ProgramUpper Mississippi River Restoration
Restoring and Monitoring the
Upper Mississippi River System
Long Term Resource Monitoring Program An element of the U.S. Army Corps of Engineers’
Upper Mississippi River Restoration- Environmental Management Program
Technical Report 2014–T001
Relationship of Weed Shiner and Young-of-Year Bluegill and Largemouth Bass Abundance to Submersed Aquatic Vegetation in Navigation Pools 4, 8, and 13 of the Upper Mississippi River, 1998–2012
2014

Long Term Resource Monitoring Program Technical Reports provide Long Term Resource Monitoring Program partners with scientific and technical support.
All reports in this series receive anonymous peer review.
Cover graphic by Mi Ae Lipe-Butterbrodt

Relationship of Weed Shiner and Youngof-Year Bluegill and Largemouth Bass Abundance to Submersed Aquatic Vegetation in Navigation Pools 4, 8, and 13 of the Upper Mississippi River, 1998–2012
By Steven A. DeLain and Walter A. Popp
Long Term Resource Monitoring Program
Technical Report 2014–T001
Manuscript prepared for publication by the U.S. Geological Survey, U.S. Department of the Interior

Published by the U.S. Army Corps of Engineers’ Upper Mississippi River Restoration-Environmental Management Program
Manuscript prepared for publication by the U.S. Geological Survey, U.S. Department of the Interior: 2014
Any use of trade, firm, or product names is for descriptive purposes only and does not imply endorsement by the U.S. Government.
Although this information product, for the most part, is in the public domain, it also may contain copyrighted materials as noted in the text. Permission to reproduce copyrighted items must be secured from the copyright owner.
Suggested citation: DeLain, S.A., and Popp, W.A., 2014, Relationship of weed shiner and young-of-year bluegill and largemouth bass abundance to submersed aquatic vegetation in Navigation Pools 4, 8, and 13 of the Upper Mississippi River, 1998– 2012: A technical report submitted to the U.S. Army Corps of Engineers’ Upper Mississippi River Restoration-Environmental Management Program from the U.S. Geological Survey, Technical Report 2014–T001, 29 p.
iii
Preface
The U.S. Army Corps of Engineers’ (USACE) Upper Mississippi River Restoration-Environmental Management Program’s (UMRR-EMP) Long Term Resource Monitoring Program (LTRMP) was authorized under the Water Resources Development Act of 1986 (Public Law 99–662). The LTRMP is a multi-federal and state agency partnership among the USACE, the U.S. Geological Survey’s (USGS) Upper Midwest Environmental Sciences Center (UMESC), the U.S. Fish and Wildlife Service (USFWS), and the five Upper Mississippi River System (UMRS) States of Illinois, Iowa, Minnesota, Missouri, and Wisconsin. The USACE provides guidance and has overall Program responsibility. UMESC provides science coordination and leadership. The mode of operation and respective roles of the agencies are outlined in a 1988 Memorandum of Agreement.
The UMRS encompasses the commercially navigable reaches of the Upper Mississippi River, as well as the Illinois River and navigable portions of the Kaskaskia, Black, St. Croix, and Minnesota Rivers. Congress has declared the UMRS to be both a nationally significant ecosystem and a nationally significant commercial navigation system. The mission of the LTRMP is to support decisionmakers with the information and understanding needed to manage the UMRS as a sustainable, large river ecosystem, given its multiple use character. The long-term goals of the Program are to better understand the system, determine resource status and trends, develop management alternatives, manage the information, and develop useful products.
This report supports Objective 2.3 as specified in Goal 2, Monitor Resource Change, of the LTRMP Operating Plan (U.S. Fish and Wildlife Service, 1993) and fulfills milestone #2009B5 from the FY13 LTRMP scope of work. This report was developed with funding provided by the UMRR-EMP.
Acknowledgments
The authors thank their former coworkers and the many interns who collected the fish and vegetation data during 1998–2012. The authors also thank Megan Moore (Minnesota Department of Natural Resources (MNDNR)) for vegetation analysis, figures, and review; Todd Koel (National Park Service), Kevin Stauffer (MNDNR), and Rob Burdis (MNDNR) for review of the report; and Brian Ickes (U.S. Geological Survey (USGS)), Jennie Sauer (USGS), Mel Bowler (Iowa Department of Natural Resources), Andy Bartels (Wisconsin Department of Natural Resources), Doug Dieterman (MNDNR), and John Hoxmeier (MNDNR) for providing technical assistance.

iv
Contents
Preface ...........................................................................................................................................................iii Acknowledgments ........................................................................................................................................iii Abstract ...........................................................................................................................................................1 Introduction.....................................................................................................................................................1 Study Area.......................................................................................................................................................2 Methods...........................................................................................................................................................2
Aquatic Vegetation Monitoring ..........................................................................................................2 Fish Monitoring......................................................................................................................................2 Age Determination of Fish ...................................................................................................................4 Analysis ..................................................................................................................................................4
Results .............................................................................................................................................................5 Submersed Aquatic Vegetation Trends ............................................................................................5 Weed Shiner Abundance and Relationship with SAV ....................................................................6 Bluegill Abundance and Relationship with SAV ............................................................................10 Largemouth Bass Abundance and Relationship with SAV ..........................................................10
Discussion .....................................................................................................................................................19 References Cited..........................................................................................................................................20 Appendix 1.....................................................................................................................................................23
Figures 1. Map showing location of the four study reaches (Upper Pool 4, Lower Pool 4,
Pool 8, and Pool 13), Upper Mississippi River ..........................................................................3 2–4. Graphs showing: 2. Annual mean summer (June–August) discharge during 1998–2012 at
Lock and Dams 3, 4, 8, and 13 .....................................................................................................5 3. Temporal trends in percent frequency of occurrence of submersed aquatic
vegetation when all strata (contiguous backwaters, side channels, impounded areas, and main channel borders) in Upper Pool 4, Lower Pool 4, Pool 8, and Pool 13 were grouped during 1998–2012 ..................................................................................6
4. Temporal trends in percent frequency of occurrence of submersed aquatic vegetation by strata in Upper Pool 4, Lower Pool 4, Pool 8, and Pool 13 during 1998–2012 .......................................................................................................................................7

v
5–14. Graphs showing: 5. Annual number of weed shiners (Notropis texanus) caught in Upper Pool 4,
Lower Pool 4, Pool 8, and Pool 13 in all strata combined using mini-fyke nets and day electrofishing during time periods 2 and 3 (Aug. 1–Oct. 31) during 1998–2012 ..........................................................................................................................9
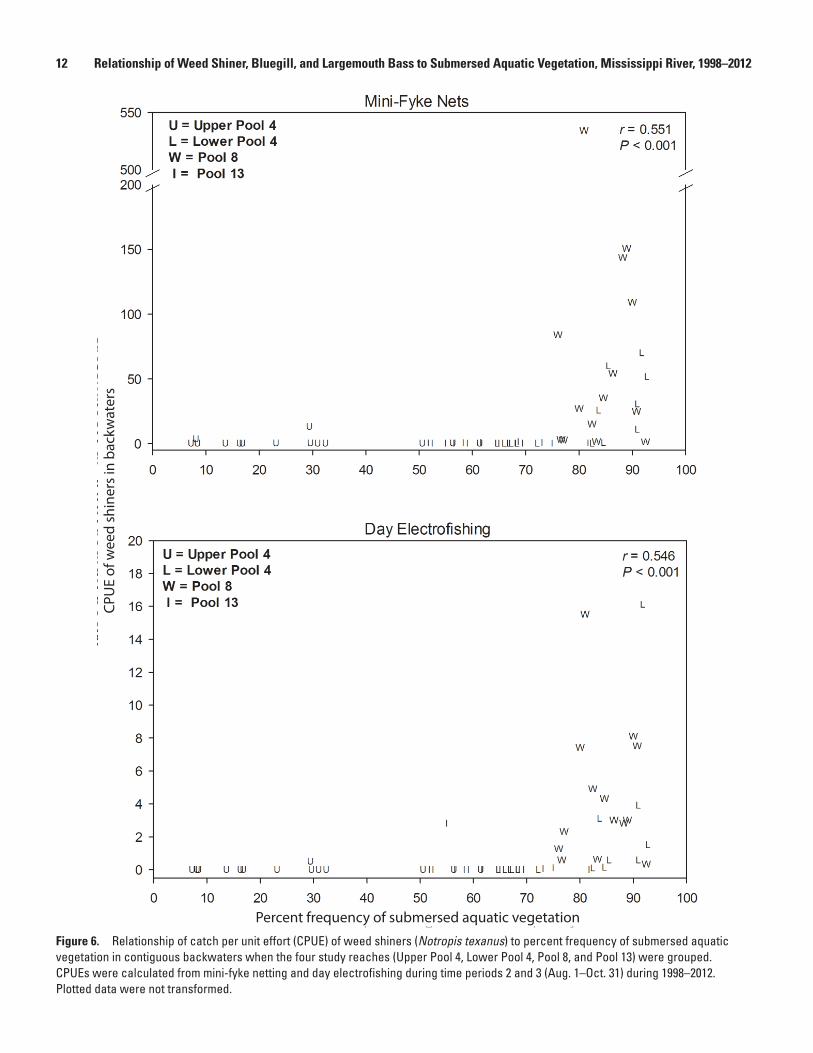
6. Relationship of catch per unit effort of weed shiners (Notropis texanus) to percent frequency of submersed aquatic vegetation in contiguous backwaters when the four study reaches were grouped .........................................................................12
7. Relationship of catch per unit effort of weed shiners (Notropis texanus) to percent frequency of submersed aquatic vegetation in side channels when the four study reaches were grouped ...........................................................................................13
8. Weed shiner (Notropis texanus) catch per unit effort in four categories of percent coverage of aquatic vegetation using mini-fyke nets in contiguous backwaters and side channel borders of Lower Pool 4 and Pool 8 during time periods 2 and 3 during 1998–2012 .......................................................................14
9. Relationship of catch per unit effort of young-of-year bluegills (Lepomis macrochirus) to percent frequency of submersed aquatic vegetation in contiguous backwaters when the four study reaches were grouped ..........................15
10. Relationship of catch per unit effort of young-of-year bluegills (Lepomis macrochirus) to percent frequency of submersed aquatic vegetation in side channels when the four study reaches were grouped ...........................................16
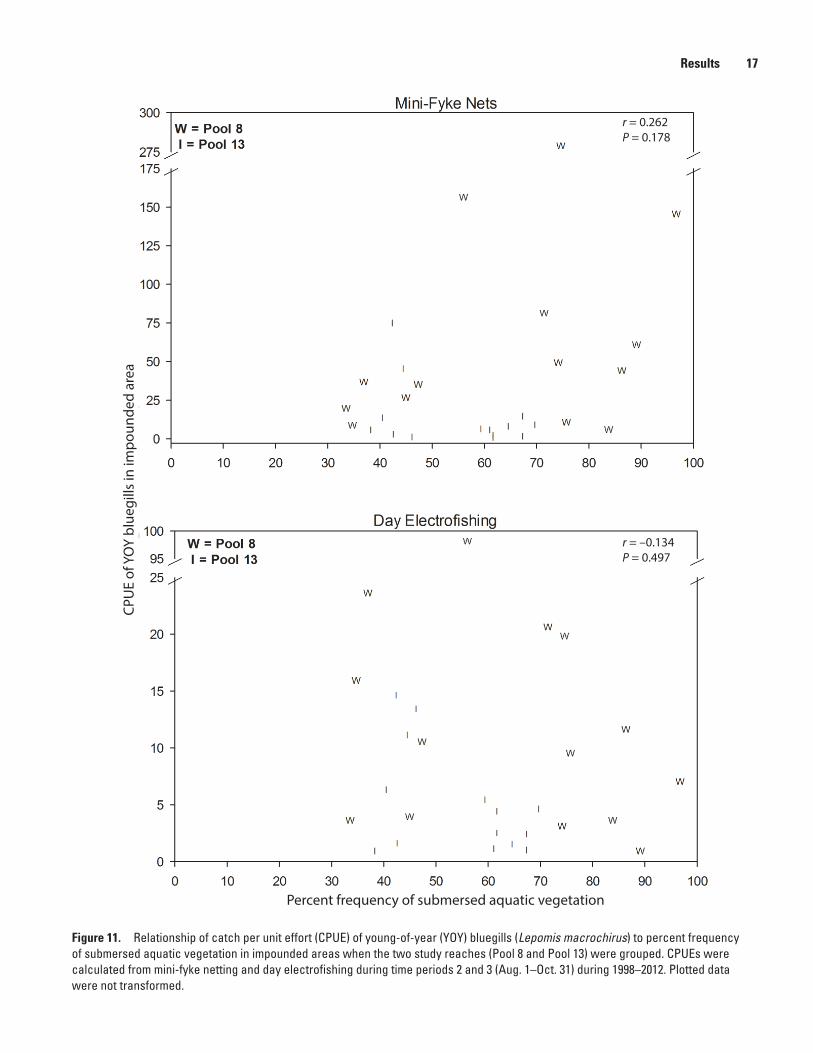
11. Relationship of catch per unit effort of young-of-year bluegills (Lepomis macrochirus) to percent frequency of submersed aquatic vegetation in impounded areas when the two study reaches (Pool 8 and Pool 13) were grouped ........................................................................................................................................17
12. Relationship of catch per unit effort of young-of-year largemouth bass (Micropterus salmoides) to percent frequency of submersed aquatic vegetation in contiguous backwaters when the four study reaches were grouped ......18
13. Relationship of catch per unit effort of young-of-year largemouth bass (Micropterus salmoides) to percent frequency of submersed aquatic vegetation in side channels when the four study reaches were grouped .......................18
14. Relationship of catch per unit effort of young-of-year largemouth bass (Micropterus salmoides) to percent frequency of submersed aquatic vegetation in impounded areas when the two study reaches (Pool 8 and Pool 13) were grouped ..............................................................................................................................19

vi
Appendix 1 Figures 1–1 thru 1–6. Graphs showing:
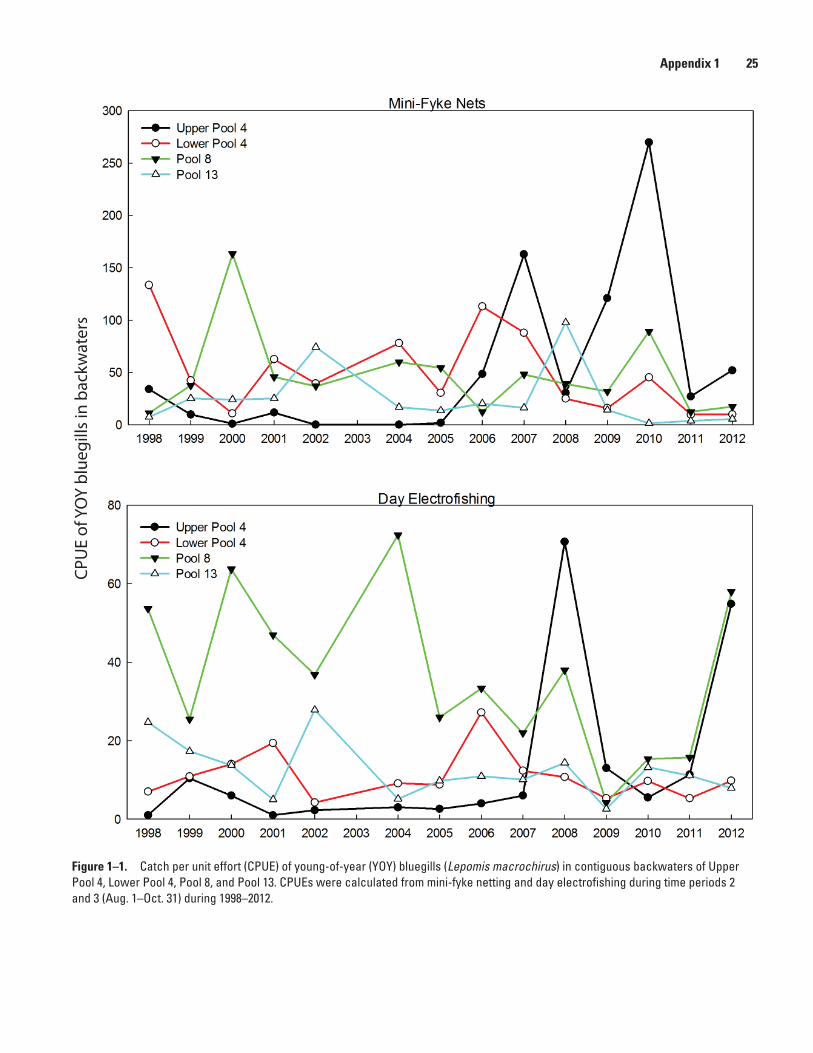
1–1. Catch per unit effort of young-of-year bluegill (Lepomis macrochirus) in contiguous backwaters of Upper Pool 4, Lower Pool 4, Pool 8, and Pool 13 ...................................................................................................................25
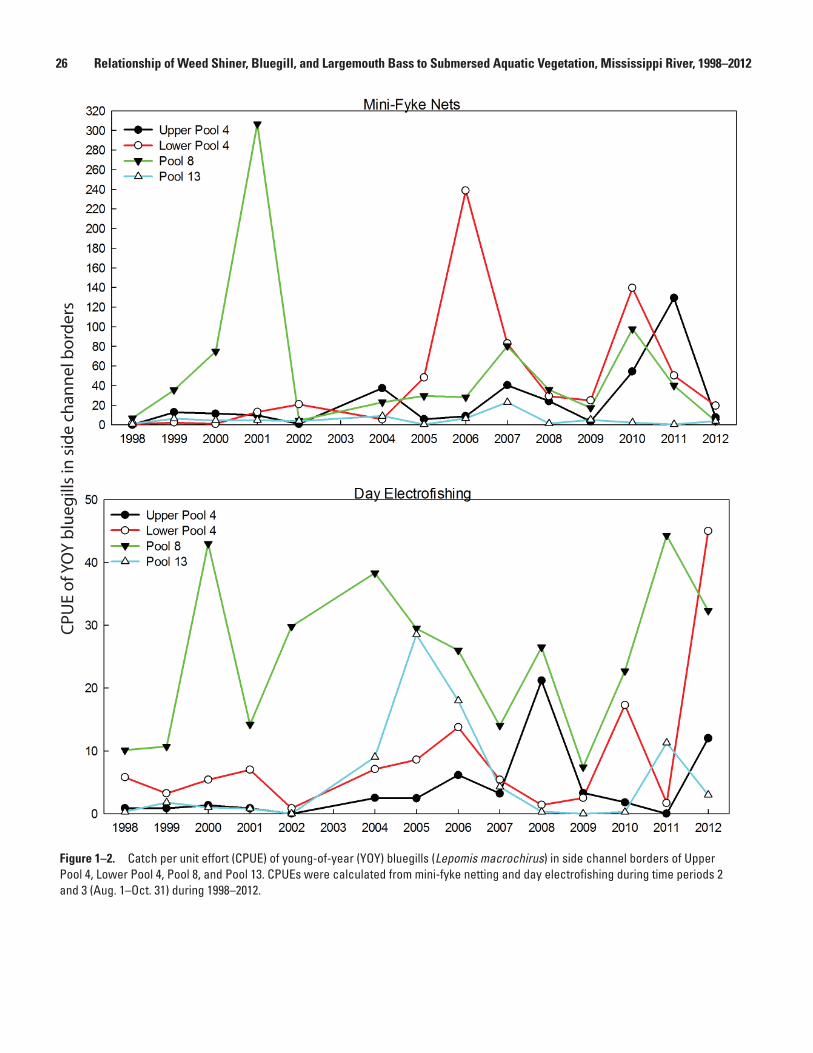
1–2. Catch per unit effort of young-of-year bluegill (Lepomis macrochirus) in side channel borders of Upper Pool 4, Lower Pool 4, Pool 8, and Pool 13 ...................................................................................................................26
1–3. Catch per unit effort of young-of-year bluegill (Lepomis macrochirus) in impounded areas of Pool 8 and Pool 13 ......................................................27
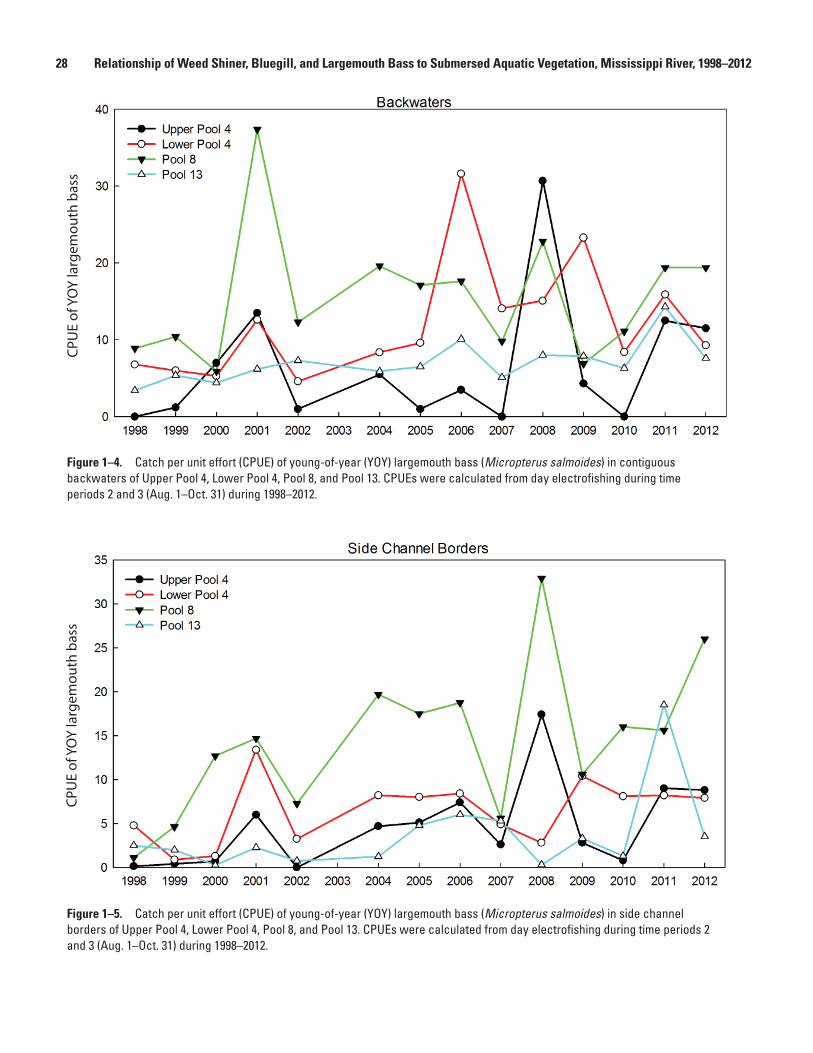
1–4. Catch per unit effort of young-of-year largemouth bass (Micropterus salmoides) in contiguous backwaters of Upper Pool 4, Lower Pool 4, Pool 8, and Pool 13 ..............................................................................................28
1–5. Catch per unit effort of young-of-year largemouth bass (Micropterus salmoides) in side channel borders of Upper Pool 4, Lower Pool 4, Pool 8, and Pool 13 ..............................................................................................28
1–6. Catch per unit effort of young-of-year largemouth bass (Micropterus salmoides) in impounded areas of Pool 8 and Pool 13 ..................................29
Tables 1. Features of the four study reaches (Upper Pool 4, Lower Pool 4, Pool 8, and
Pool 13), Upper Mississippi River, monitored by the Long Term Resource Monitoring Program .....................................................................................................................4
2. Pearson’s correlation coefficients (r) for the relationship between percent frequency of submersed aquatic vegetation and weed shiner (Notropis texanus), bluegill (Lepomis macrochirus), and largemouth bass (Micropterus salmoides) catch per unit effort (CPUE) when each of the four study reaches was treated independently ..............................................................................................................................11
Conversion Factors and Abbreviations
Multiply By To obtain Length
millimeter (mm) 0.03937 inch (in) kilometer (km) 0.6214 mile (mi)
Area hectare (ha) 2.471 acre
Volume milligram (mg) 0.000035 ounce, fluid (fl. oz) liter (L) 1.057 quart (qt)
Concentrations of chemical constituents in water are given in milligrams per liter (mg/L)

vii
Abbreviations
BWC contiguous backwaters
commun communication
CPUE catch-per-unit effort
IMP impounded areas
LTRMP Long Term Resource Monitoring Program
MCB main channel borders
MN DNR Minnesota Department of Natural Resources
SAV submersed aquatic vegetation
SC side channels (for aquatic vegetation); side channel borders (for fish)
SRS stratified random sampling
UMESC Upper Midwest Environmental Sciences Center
UMR Upper Mississippi River
UMRR-EMP Upper Mississippi River Restoration-Environmental Management Program
UMRS Upper Mississippi River System
USACE U.S. Army Corps of Engineers
USFWS U.S. Fish and Wildlife Service
USGS U.S. Geological Survey
YOY young-of-year
> greater than
≥ greater than or equal to
< less than
≤ less than or equal to

__________
Relationship of Weed Shiner and Young-of-Year Bluegill and Largemouth Bass Abundance to Submersed Aquatic Vegetation in Navigation Pools 4, 8, and 13 of the Upper Mississippi River, 1998–2012
By Steven A. DeLain1 and Walter A. Popp1
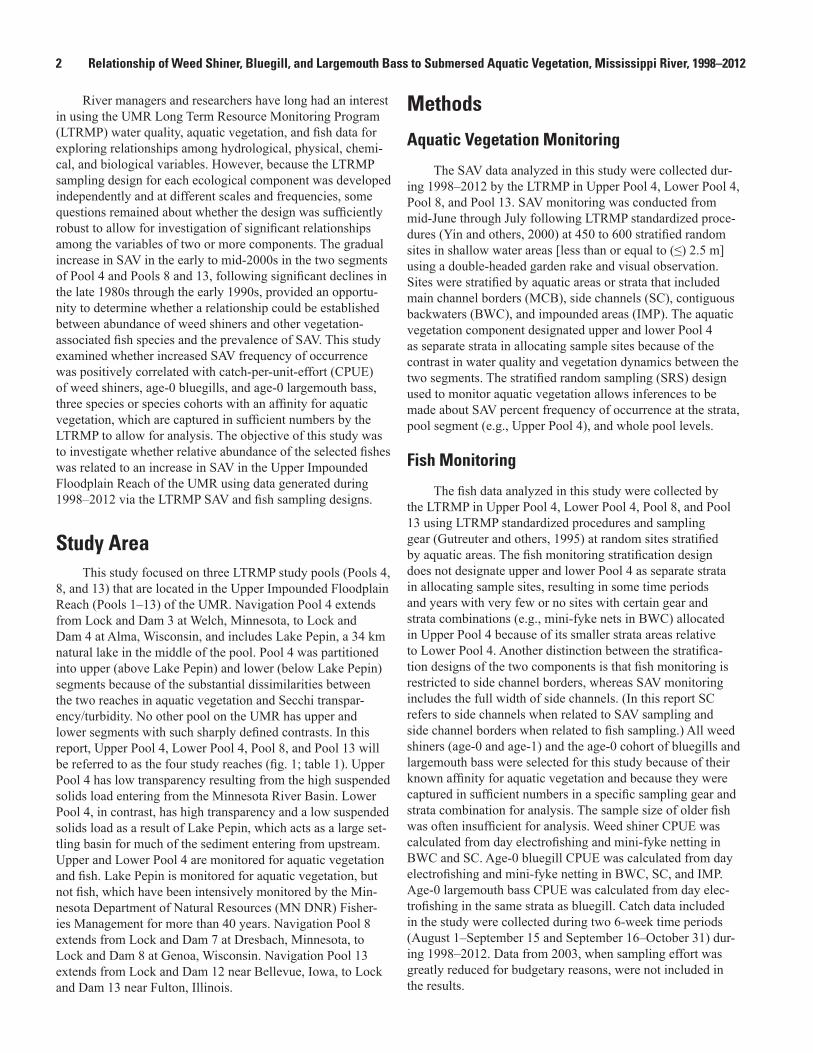
Abstract Aquatic vegetation provides food resources and shelter
for many species of fish. This study found a significant rela-tionship between increases in submersed aquatic vegetation (SAV) in four study reaches of the Upper Mississippi River (UMR) and increases in catch-per-unit-effort (CPUE) of weed shiners (Notropis texanus) and age-0 bluegills (Lepomis mac-rochirus) and largemouth bass (Micropterus salmoides) when all of the study reaches were treated collectively using Long Term Resource Monitoring Program (LTRMP) vegetation and fish data for 1998–2012. The selected fishes were more abun-dant in study reaches with higher SAV frequencies (Pool 8 and Lower Pool 4) and less abundant in reaches with lower SAV frequencies (Pool 13 and Upper Pool 4). When each study reach was examined independently, the relationship between SAV frequency and CPUE of the three species was not significant in most cases, the primary exception being weed shiners in Lower Pool 4. Results of this study indicate that the prevalence of SAV does affect relative abundance of these vegetation-associated fish species. However, the poor annual relationship between SAV frequency and age-0 relative abun-dance in individual study reaches indicates that several other factors also govern age-0 abundance. The data indicate that there may be a SAV frequency threshold in backwaters above which there is not a strong relationship with abundance of these fish species. This is indicated by the high annual CPUE variability of the three selected fishes in backwaters of Pool 8 and Lower Pool 4 when SAV exceeded certain frequencies.
Introduction Aquatic vegetation, one of the key ecological drivers of
the Upper Mississippi River (UMR), greatly facilitates the transfer of energy among trophic levels and provides habitat
for many species of fish. Johnson and Jennings (1998) found a positive relationship between densities of 44 taxa of fish and moderate to high vegetation abundance in the UMR. Aquatic plants support an abundant and rich invertebrate fauna (Chil-ton, 1990; Beckett and others, 1992) that provides much of the food for small forage fish and young-of-year (YOY) of larger species, such as bluegills (Lepomis macrochirus) (Dewey and others, 1997). Aquatic macrophytes also serve as an important refuge from predation by piscivores for many species of fish (Hall and Werner, 1977; Mittelbach, 1984), including YOY bluegills, which utilize the vegetation to avoid predation by largemouth bass (Micropterus salmoides) (Savino and Stein, 1982; Werner and others, 1983; Dewey and others, 1997). However, vegetated habitats also provide abundant prey for piscivores, such as largemouth bass and northern pike (Esox lucius). Holland and Huston (1984) found YOY northern pike were closely associated with submersed vegetation, rather than emergent or floating-leafed vegetation, in backwaters of the UMR, likely because of food availability.
A large increase in the number of weed shiners (Notro-pis texanus) was recorded during sampling of Lower Pool 4 in 2006 concurrent with an increase in submersed aquatic vegetation (SAV) frequency of occurrence. Weed shiners had been more abundant for several years prior to 2006 in Pool 8 where SAV frequency had been increasing for a longer period. However, in Pool 13 and Upper Pool 4 where SAV was less prevalent, weed shiners were scarce. Weed shiners are known to feed by scraping periphyton and detritus off the leaves of macrophytes (Goldstein and Simon, 1999). Reported as uncommon in the Mississippi River and the lower reaches of its tributaries by Becker (1983), weed shiners appear to be sensitive to environmental changes. Like several other non-game species of fish with short life spans and close association with specific habitat types, weed shiners may serve as a good indicator of aquatic habitat integrity (Ickes and others, 2005). Habitat integrity on the UMR is linked by river resource man-agers to abundant aquatic vegetation, which in turn is linked to healthy fish populations (Johnson and Jennings, 1998).
1Minnesota Department of Natural Resources, Lake City Field Station,1801 S. Oak Street, Lake City, MN 55041; phone: 651-345-3331
2 Relationship of Weed Shiner, Bluegill, and Largemouth Bass to Submersed Aquatic Vegetation, Mississippi River, 1998–2012
River managers and researchers have long had an interest in using the UMR Long Term Resource Monitoring Program (LTRMP) water quality, aquatic vegetation, and fish data for exploring relationships among hydrological, physical, chemi-cal, and biological variables. However, because the LTRMP sampling design for each ecological component was developed independently and at different scales and frequencies, some questions remained about whether the design was sufficiently robust to allow for investigation of significant relationships among the variables of two or more components. The gradual increase in SAV in the early to mid-2000s in the two segments of Pool 4 and Pools 8 and 13, following significant declines in the late 1980s through the early 1990s, provided an opportu-nity to determine whether a relationship could be established between abundance of weed shiners and other vegetation-associated fish species and the prevalence of SAV. This study examined whether increased SAV frequency of occurrence was positively correlated with catch-per-unit-effort (CPUE) of weed shiners, age-0 bluegills, and age-0 largemouth bass, three species or species cohorts with an affinity for aquatic vegetation, which are captured in sufficient numbers by the LTRMP to allow for analysis. The objective of this study was to investigate whether relative abundance of the selected fishes was related to an increase in SAV in the Upper Impounded Floodplain Reach of the UMR using data generated during 1998–2012 via the LTRMP SAV and fish sampling designs.
Study Area This study focused on three LTRMP study pools (Pools 4,
8, and 13) that are located in the Upper Impounded Floodplain Reach (Pools 1–13) of the UMR. Navigation Pool 4 extends from Lock and Dam 3 at Welch, Minnesota, to Lock and Dam 4 at Alma, Wisconsin, and includes Lake Pepin, a 34 km natural lake in the middle of the pool. Pool 4 was partitioned into upper (above Lake Pepin) and lower (below Lake Pepin) segments because of the substantial dissimilarities between the two reaches in aquatic vegetation and Secchi transpar-ency/turbidity. No other pool on the UMR has upper and lower segments with such sharply defined contrasts. In this report, Upper Pool 4, Lower Pool 4, Pool 8, and Pool 13 will be referred to as the four study reaches (fig. 1; table 1). Upper Pool 4 has low transparency resulting from the high suspended solids load entering from the Minnesota River Basin. Lower Pool 4, in contrast, has high transparency and a low suspended solids load as a result of Lake Pepin, which acts as a large set-tling basin for much of the sediment entering from upstream. Upper and Lower Pool 4 are monitored for aquatic vegetation and fish. Lake Pepin is monitored for aquatic vegetation, but not fish, which have been intensively monitored by the Min-nesota Department of Natural Resources (MN DNR) Fisher-ies Management for more than 40 years. Navigation Pool 8 extends from Lock and Dam 7 at Dresbach, Minnesota, to Lock and Dam 8 at Genoa, Wisconsin. Navigation Pool 13 extends from Lock and Dam 12 near Bellevue, Iowa, to Lock and Dam 13 near Fulton, Illinois.
Methods
Aquatic Vegetation Monitoring
The SAV data analyzed in this study were collected dur-ing 1998–2012 by the LTRMP in Upper Pool 4, Lower Pool 4, Pool 8, and Pool 13. SAV monitoring was conducted from mid-June through July following LTRMP standardized proce-dures (Yin and others, 2000) at 450 to 600 stratified random sites in shallow water areas [less than or equal to (≤) 2.5 m] using a double-headed garden rake and visual observation. Sites were stratified by aquatic areas or strata that included main channel borders (MCB), side channels (SC), contiguous backwaters (BWC), and impounded areas (IMP). The aquatic vegetation component designated upper and lower Pool 4 as separate strata in allocating sample sites because of the contrast in water quality and vegetation dynamics between the two segments. The stratified random sampling (SRS) design used to monitor aquatic vegetation allows inferences to be made about SAV percent frequency of occurrence at the strata, pool segment (e.g., Upper Pool 4), and whole pool levels.
Fish Monitoring
The fish data analyzed in this study were collected by the LTRMP in Upper Pool 4, Lower Pool 4, Pool 8, and Pool 13 using LTRMP standardized procedures and sampling gear (Gutreuter and others, 1995) at random sites stratified by aquatic areas. The fish monitoring stratification design does not designate upper and lower Pool 4 as separate strata in allocating sample sites, resulting in some time periods and years with very few or no sites with certain gear and strata combinations (e.g., mini-fyke nets in BWC) allocated in Upper Pool 4 because of its smaller strata areas relative to Lower Pool 4. Another distinction between the stratifica-tion designs of the two components is that fish monitoring is restricted to side channel borders, whereas SAV monitoring includes the full width of side channels. (In this report SC refers to side channels when related to SAV sampling and side channel borders when related to fish sampling.) All weed shiners (age-0 and age-1) and the age-0 cohort of bluegills and largemouth bass were selected for this study because of their known affinity for aquatic vegetation and because they were captured in sufficient numbers in a specific sampling gear and strata combination for analysis. The sample size of older fish was often insufficient for analysis. Weed shiner CPUE was calculated from day electrofishing and mini-fyke netting in BWC and SC. Age-0 bluegill CPUE was calculated from day electrofishing and mini-fyke netting in BWC, SC, and IMP. Age-0 largemouth bass CPUE was calculated from day elec-trofishing in the same strata as bluegill. Catch data included in the study were collected during two 6-week time periods (August 1–September 15 and September 16–October 31) dur-ing 1998–2012. Data from 2003, when sampling effort was greatly reduced for budgetary reasons, were not included in the results.

Methods 3
Upper Pool 4
Lower Pool 4
Pool 4
Pool 8
Pool 13
Figure 1. Location of the four study reaches (Upper Pool 4, Lower Pool 4, Pool 8, and Pool 13), Upper Mississippi River.
4 Relationship of Weed Shiner, Bluegill, and Largemouth Bass to Submersed Aquatic Vegetation, Mississippi River, 1998–2012
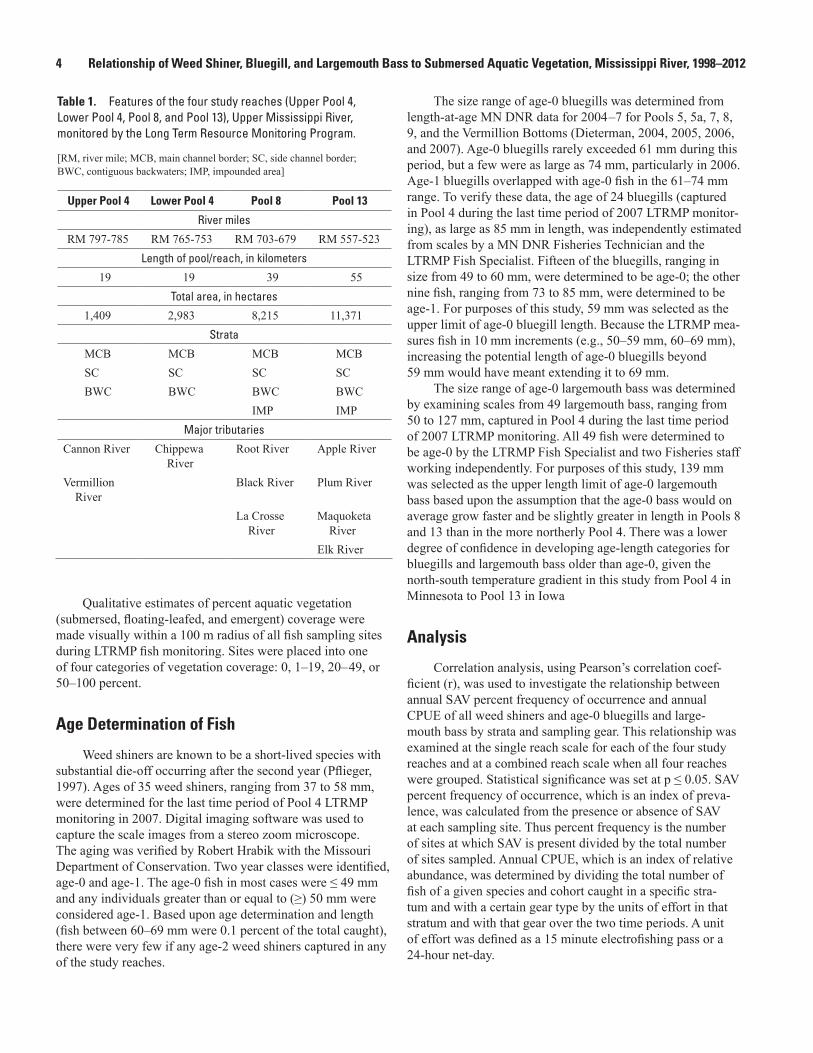
Table 1. Features of the four study reaches (Upper Pool 4, Lower Pool 4, Pool 8, and Pool 13), Upper Mississippi River, monitored by the Long Term Resource Monitoring Program.
[RM, river mile; MCB, main channel border; SC, side channel border; BWC, contiguous backwaters; IMP, impounded area]
Upper Pool 4 Lower Pool 4 Pool 8 Pool 13
River miles
RM 797-785 RM 765-753 RM 703-679 RM 557-523 Length of pool/reach, in kilometers
19 19 39 55 Total area, in hectares
1,409 2,983 8,215 11,371 Strata
MCB MCB MCB MCB SC SC SC SC BWC BWC BWC BWC
IMP IMP Major tributaries
Cannon River Chippewa Root River Apple River River
Vermillion Black River Plum River River
La Crosse Maquoketa River River
Elk River
Qualitative estimates of percent aquatic vegetation (submersed, floating-leafed, and emergent) coverage were made visually within a 100 m radius of all fish sampling sites during LTRMP fish monitoring. Sites were placed into one of four categories of vegetation coverage: 0, 1–19, 20– 49, or 50–100 percent.
Age Determination of Fish
Weed shiners are known to be a short-lived species with substantial die-off occurring after the second year (Pflieger, 1997). Ages of 35 weed shiners, ranging from 37 to 58 mm, were determined for the last time period of Pool 4 LTRMP monitoring in 2007. Digital imaging software was used to capture the scale images from a stereo zoom microscope. The aging was verified by Robert Hrabik with the Missouri Department of Conservation. Two year classes were identified, age-0 and age-1. The age-0 fish in most cases were ≤ 49 mm and any individuals greater than or equal to (≥) 50 mm were considered age-1. Based upon age determination and length (fish between 60–69 mm were 0.1 percent of the total caught), there were very few if any age-2 weed shiners captured in any of the study reaches.
The size range of age-0 bluegills was determined from length-at-age MN DNR data for 2004 –7 for Pools 5, 5a, 7, 8, 9, and the Vermillion Bottoms (Dieterman, 2004, 2005, 2006, and 2007). Age-0 bluegills rarely exceeded 61 mm during this period, but a few were as large as 74 mm, particularly in 2006. Age-1 bluegills overlapped with age-0 fish in the 61–74 mm range. To verify these data, the age of 24 bluegills (captured in Pool 4 during the last time period of 2007 LTRMP monitor-ing), as large as 85 mm in length, was independently estimated from scales by a MN DNR Fisheries Technician and the LTRMP Fish Specialist. Fifteen of the bluegills, ranging in size from 49 to 60 mm, were determined to be age-0; the other nine fish, ranging from 73 to 85 mm, were determined to be age-1. For purposes of this study, 59 mm was selected as the upper limit of age-0 bluegill length. Because the LTRMP mea-sures fish in 10 mm increments (e.g., 50–59 mm, 60–69 mm), increasing the potential length of age-0 bluegills beyond 59 mm would have meant extending it to 69 mm.
The size range of age-0 largemouth bass was determined by examining scales from 49 largemouth bass, ranging from 50 to 127 mm, captured in Pool 4 during the last time period of 2007 LTRMP monitoring. All 49 fish were determined to be age-0 by the LTRMP Fish Specialist and two Fisheries staff working independently. For purposes of this study, 139 mm was selected as the upper length limit of age-0 largemouth bass based upon the assumption that the age-0 bass would on average grow faster and be slightly greater in length in Pools 8 and 13 than in the more northerly Pool 4. There was a lower degree of confidence in developing age-length categories for bluegills and largemouth bass older than age-0, given the north-south temperature gradient in this study from Pool 4 in Minnesota to Pool 13 in Iowa
Analysis
Correlation analysis, using Pearson’s correlation coef-ficient (r), was used to investigate the relationship between annual SAV percent frequency of occurrence and annual CPUE of all weed shiners and age-0 bluegills and large-mouth bass by strata and sampling gear. This relationship was examined at the single reach scale for each of the four study reaches and at a combined reach scale when all four reaches were grouped. Statistical significance was set at p ≤ 0.05. SAV percent frequency of occurrence, which is an index of preva-lence, was calculated from the presence or absence of SAV at each sampling site. Thus percent frequency is the number of sites at which SAV is present divided by the total number of sites sampled. Annual CPUE, which is an index of relative abundance, was determined by dividing the total number of fish of a given species and cohort caught in a specific stra-tum and with a certain gear type by the units of effort in that stratum and with that gear over the two time periods. A unit of effort was defined as a 15 minute electrofishing pass or a 24-hour net-day.

5 Results
Weed shiner CPUE, using mini-fyke nets in BWC and SC of Pool 8 and Lower Pool 4 over the 15-year period, was cal-culated for each of the four categories of vegetation percent-coverage that was recorded at each sampling site.
Tests for normality indicated that both the SAV frequency and fish CPUE data sets were non-normally distributed. A logarithmic transformation was used on the fish CPUE data and an arcsine transformation was used on the SAV percent frequency data prior to testing for a relationship. However, graphics in this report present non-transformed data.
Results
Submersed Aquatic Vegetation Trends
Summer mean discharge in Pools 4, 8, and 13 was well below the long-term mean during 2006, 2007, and 2009 (fig. 2), and was the lowest since the 1988–89 drought. Low
discharge, and thus lower water levels, coincided with the peak growing season for macrophytes on the UMR. SAV frequency in Lower Pool 4 and Pool 8 began a 5 to 6-year pro-gressive increase from prior years beginning in 2005 (fig. 3). Frequency of SAV in Pool 13 began to increase in 2004 and in Upper Pool 4 in 2007. SAV attained the highest frequen-cies during 2009–11 in all four study reaches since stratified random sampling began in 1998, enabling reach-wide esti-mates of SAV. Reach-wide SAV frequency in Pool 8 increased 31 percent from 2004 to 2010 when it peaked at 89 percent; Lower Pool 4 SAV increased by 29 percent from 2004 to 2009 when it reached 84 percent frequency; and Pool 13 SAV increased 21 percent since 2003 to around 62 percent from2006 through 2010. Upper Pool 4 SAV frequency, which has historically been much lower than in the other study reaches,increased by 36 percent from 2006 to 2011 when it peaked at 43 percent. SAV frequency declined in all four reaches in2012, which was the third consecutive year of high summerdischarge that exceeded the long term mean in every reach butPool 13 (fig. 2).
0
Lock and Dam 3 Lock and Dam 4
10000
20000
30000
40000
50000
0
10000
20000
30000
40000
50000
60000
70000
Dis
char
ge
0
1998
1999
2000
2001
2002
2003
2004
2005
2006
2007
2008
2009
2010
2011
2012
1998
1999
2000
2001
2002
2003
2004
2005
2006
2007
2008
2009
2010
2011
2012
Dis
char
ge
80000 100000
9000070000 80000
60000 70000
50000 60000
40000 50000
4000030000 30000
20000 20000
10000 10000
0 0
Lock and Dam 8 Lock and Dam 13
Figure 2. Annual mean summer (June–August) discharge during 1998–2012 at Lock and Dams 3, 4, 8, and 13. Horizontal line indicates a 50-year summer mean (1963–2012) at Lock and Dams 3, 4, and 8 and a 27-year mean (1986–2012) at Lock and Dam 13.
100 P
erce
nt fr
eque
ncy
of S
AV
80
70
60
50
40
30
20
10
0 1998 1999 2000 2001 2002 2003 2004 2005 2006 2007 2008 2009 2010 2011 2012
90 Upper Pool 4 Lower Pool 4 Pool 8 Pool 13
6 Relationship of Weed Shiner, Bluegill, and Largemouth Bass to Submersed Aquatic Vegetation, Mississippi River, 1998–2012
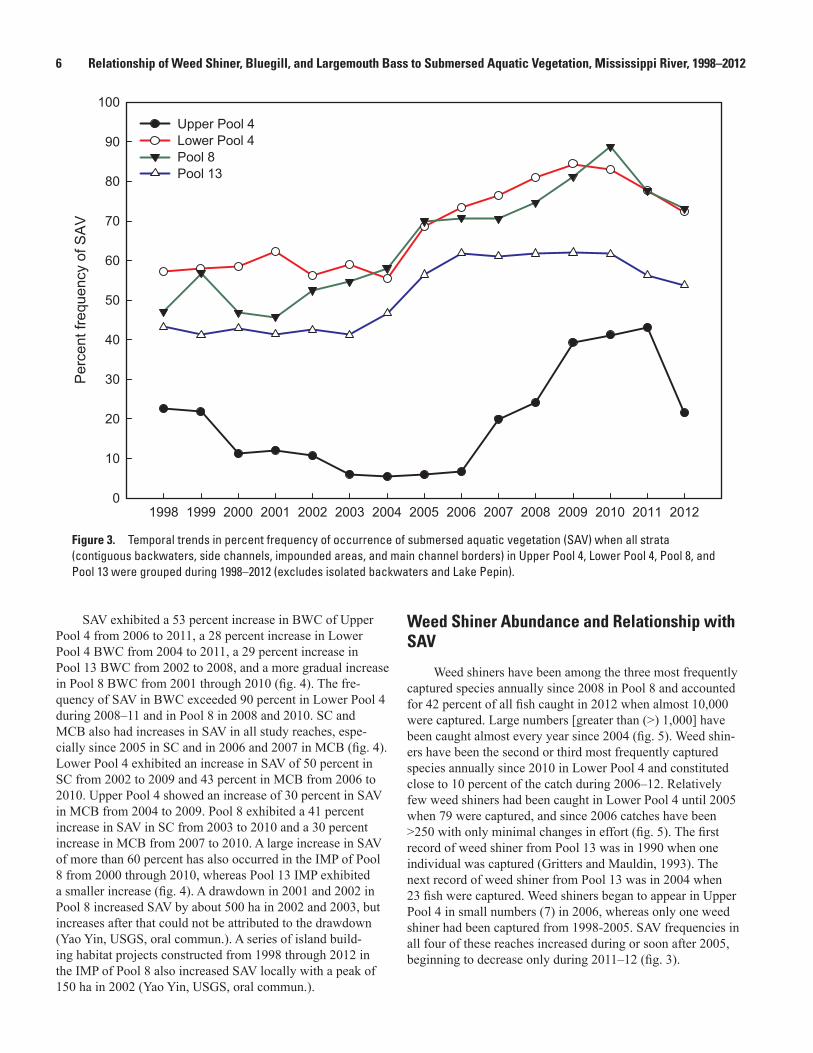
Figure 3. Temporal trends in percent frequency of occurrence of submersed aquatic vegetation (SAV) when all strata (contiguous backwaters, side channels, impounded areas, and main channel borders) in Upper Pool 4, Lower Pool 4, Pool 8, and Pool 13 were grouped during 1998–2012 (excludes isolated backwaters and Lake Pepin).
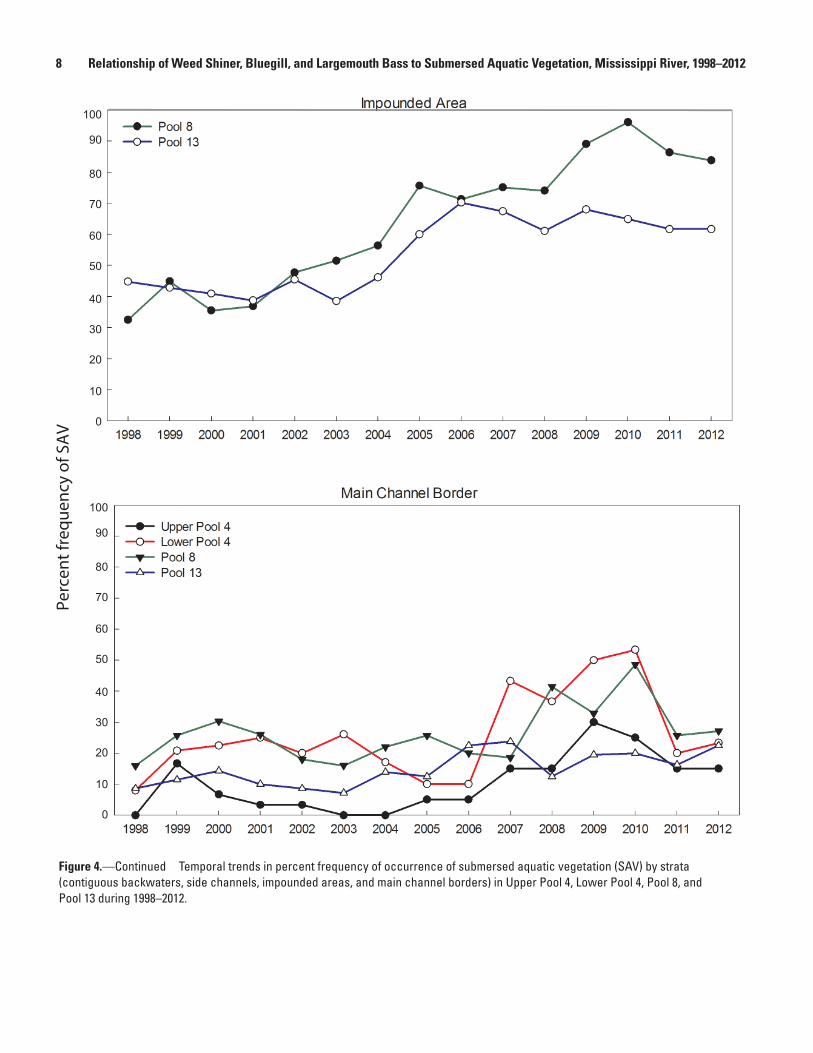
SAV exhibited a 53 percent increase in BWC of Upper Pool 4 from 2006 to 2011, a 28 percent increase in Lower Pool 4 BWC from 2004 to 2011, a 29 percent increase in Pool 13 BWC from 2002 to 2008, and a more gradual increase in Pool 8 BWC from 2001 through 2010 (fig. 4). The fre-quency of SAV in BWC exceeded 90 percent in Lower Pool 4 during 2008–11 and in Pool 8 in 2008 and 2010. SC and MCB also had increases in SAV in all study reaches, espe-cially since 2005 in SC and in 2006 and 2007 in MCB (fig. 4). Lower Pool 4 exhibited an increase in SAV of 50 percent in SC from 2002 to 2009 and 43 percent in MCB from 2006 to 2010. Upper Pool 4 showed an increase of 30 percent in SAV in MCB from 2004 to 2009. Pool 8 exhibited a 41 percent increase in SAV in SC from 2003 to 2010 and a 30 percent increase in MCB from 2007 to 2010. A large increase in SAV of more than 60 percent has also occurred in the IMP of Pool 8 from 2000 through 2010, whereas Pool 13 IMP exhibited a smaller increase (fig. 4). A drawdown in 2001 and 2002 in Pool 8 increased SAV by about 500 ha in 2002 and 2003, but increases after that could not be attributed to the drawdown (Yao Yin, USGS, oral commun.). A series of island build-ing habitat projects constructed from 1998 through 2012 in the IMP of Pool 8 also increased SAV locally with a peak of 150 ha in 2002 (Yao Yin, USGS, oral commun.).
Weed Shiner Abundance and Relationship with SAV
Weed shiners have been among the three most frequently captured species annually since 2008 in Pool 8 and accounted for 42 percent of all fish caught in 2012 when almost 10,000 were captured. Large numbers [greater than (>) 1,000] have been caught almost every year since 2004 (fig. 5). Weed shin-ers have been the second or third most frequently captured species annually since 2010 in Lower Pool 4 and constituted close to 10 percent of the catch during 2006–12. Relatively few weed shiners had been caught in Lower Pool 4 until 2005 when 79 were captured, and since 2006 catches have been >250 with only minimal changes in effort (fig. 5). The first record of weed shiner from Pool 13 was in 1990 when one individual was captured (Gritters and Mauldin, 1993). The next record of weed shiner from Pool 13 was in 2004 when 23 fish were captured. Weed shiners began to appear in Upper Pool 4 in small numbers (7) in 2006, whereas only one weed shiner had been captured from 1998-2005. SAV frequencies in all four of these reaches increased during or soon after 2005, beginning to decrease only during 2011–12 (fig. 3).

7 Results
100
90
80
70
60
50
40
30
20
10
0
100
90
80
70
60
50
40
30
20
10
0
Perc
ent f
requ
ency
of S
AV
Figure 4. Temporal trends in percent frequency of occurrence of submersed aquatic vegetation (SAV) by strata (contiguous backwaters, side channels, impounded areas, and main channel borders) in Upper Pool 4, Lower Pool 4, Pool 8, and Pool 13 during 1998–2012.
Perc
ent f
requ
ency
of S
AV
100
90
80
70
60
50
40
30
20
10
0
100
90
80
70
60
50
40
30
20
10
0
8 Relationship of Weed Shiner, Bluegill, and Largemouth Bass to Submersed Aquatic Vegetation, Mississippi River, 1998–2012
Figure 4.—Continued Temporal trends in percent frequency of occurrence of submersed aquatic vegetation (SAV) by strata (contiguous backwaters, side channels, impounded areas, and main channel borders) in Upper Pool 4, Lower Pool 4, Pool 8, and Pool 13 during 1998–2012.

9 Results
Num
ber o
f wee
d sh
iner
s ca
ptur
ed
Figure 5. Annual number of weed shiners (Notropis texanus) caught in Upper Pool 4, Lower Pool 4, Pool 8, and Pool 13 in all strata (contiguous backwaters, side channel and main channel borders, and impounded areas) combined using mini-fyke nets and day electrofishing during time periods 2 and 3 (Aug. 1–Oct. 31) during 1998–2012. Annual units of effort are in parentheses.
10 Relationship of Weed Shiner, Bluegill, and Largemouth Bass to Submersed Aquatic Vegetation, Mississippi River, 1998–2012
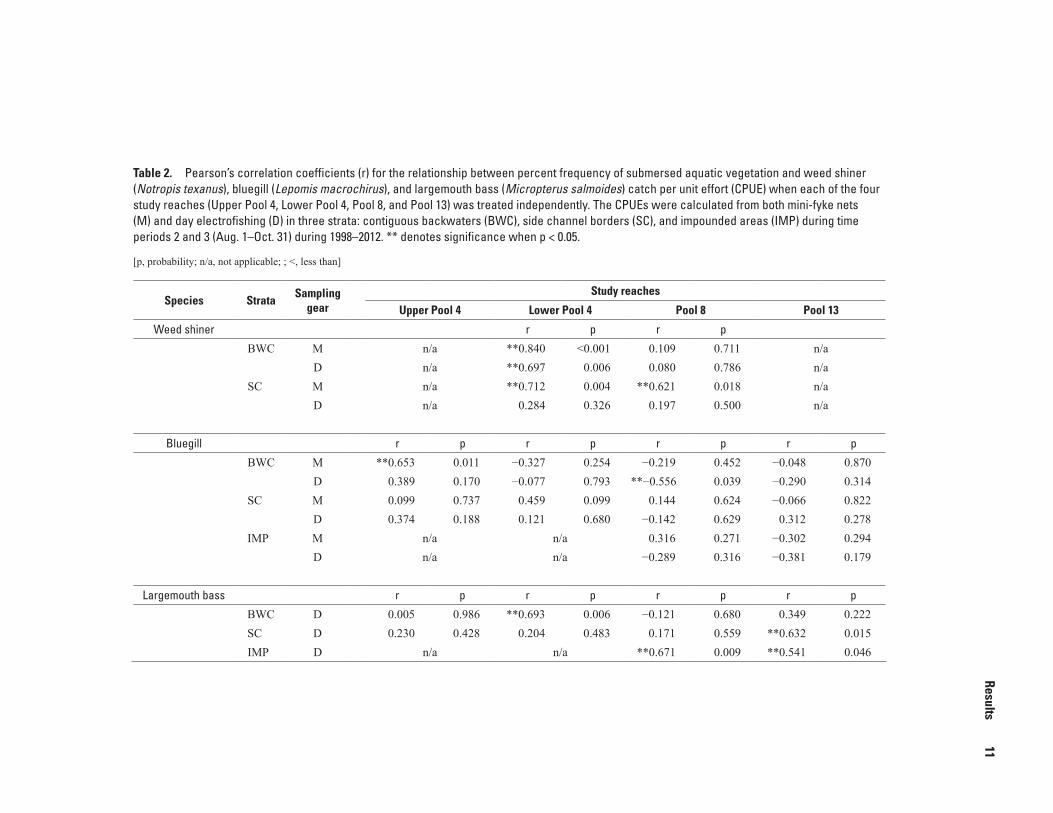
When each study reach was treated independently, annual weed shiner CPUE in Lower Pool 4 BWC during 1998–2012 correlated with SAV frequency of occurrence using mini-fyke nets (r = 0.840; p < 0.001) and electrofishing (r = 0.697; p = 0.006) and in Lower Pool 4 SC using mini-fyke nets (r = 0.712; p = 0.004; table 2). Weed shiner CPUE in Pool 8 SC also correlated with SAV frequency using mini-fyke nets (r = 0.621; p = 0.018). In all other reach, strata, and gear permu-tations tested, there was not a significant relationship between weed shiner CPUE and SAV frequency (table 2).
When the four study reaches were treated collectively, annual weed shiner CPUE in BWC correlated with SAV fre-quency using mini-fyke nets (r = 0.551; p < 0.001) and elec-trofishing (r = 0.546; p < 0.001; fig. 6). CPUE in the grouped reaches also correlated with SAV frequency in SC using mini-fyke nets (r = 0.719; p < 0.001) and electrofishing (r = 0.467; p = 0.003; fig. 7). Too few weed shiners were captured in the IMP in Pools 8 and 13 to test for a correlation with SAV.
Ninety-nine percent of weed shiners captured in mini-fyke nets in BWC and SC in Pool 8 and Lower Pool 4 were caught in or near some vegetation coverage (fig. 8). Almost all of the weed shiners captured in mini-fyke nets in Lower Pool 4 BWC (99 percent) and most in SC (61 percent) were found in vegetation coverage of 50–100 percent. In Pool 8 BWC and SC, weed shiner CPUE was highest (117 and 97, respectively) in the 20–49 percent vegetation coverage category, but the CPUE was also high in the 50–100 and 1–19 percent coverage categories.
Bluegill Abundance and Relationship with SAV
When each study reach was treated independently, annual YOY bluegill CPUE during 1998–2012 correlated with SAV frequency of occurrence only in Upper Pool 4 BWC using mini-fyke nets (r = 0.653; p = 0.011) and in Pool 8 BWC using electrofishing (r = −0.556; p = 0.039; table 2). However, the
bluegill CPUE in Pool 8 BWC was negatively correlated with SAV. There was very high variability in YOY bluegill CPUE during 1998–2012 in BWC, SC, and IMP in all study reaches using mini-fyke nets and electrofishing (see appendix figures 1–1 to 1–3). Year-to-year CPUE trends in the same strata and reach often did not align between sampling gear types.
When the four study reaches were treated collectively, annual CPUE of YOY bluegills in BWC correlated with SAV frequency using mini-fyke nets (r = 0.348; p = 0.009) and electrofishing (r = 0.419; p = 0.001; fig. 9). Likewise CPUE in the grouped reaches correlated with SAV frequency in SC using mini-fyke nets (r = 0.373; p = 0.005) and electrofishing (r = 0.503; p < 0.001; fig. 10). CPUE using either sampling gear did not correlate with SAV frequency in the IMP of Pools 8 and 13 when the two reaches were examined collec-tively (fig. 11).
Largemouth Bass Abundance and Relationship with SAV
When each study reach was treated independently, annual YOY largemouth bass CPUE during 1998-2012 correlated with SAV frequency of occurrence in Lower Pool 4 BWC (r = 0.693; p = 0.006), Pool 8 IMP (r = 0.671; p = 0.009), and Pool 13 SC and IMP (r = 0.632; p = 0.015 and r = 0.541; p = 0.046, respectively) using electrofishing (table 2). Like bluegills, there was high annual variability in largemouth bass CPUE in all strata (see appendix figures 1– 4 to 1–6).
When the four study reaches were treated collectively, annual CPUE of YOY largemouth bass correlated with SAV frequency in BWC (r = 0.561; p < 0.001; fig. 12) and SC (r = 0.485; p < 0.001; fig. 13) using electrofishing. Annual CPUE also correlated with SAV frequency in the IMP (r = 0.612; p = 0.001; fig. 14) when Pools 8 and 13 were grouped.
Results 11
Table 2. Pearson’s correlation coefficients (r) for the relationship between percent frequency of submersed aquatic vegetation and weed shiner (Notropis texanus), bluegill (Lepomis macrochirus), and largemouth bass (Micropterus salmoides) catch per unit effort (CPUE) when each of the four study reaches (Upper Pool 4, Lower Pool 4, Pool 8, and Pool 13) was treated independently. The CPUEs were calculated from both mini-fyke nets (M) and day electrofishing (D) in three strata: contiguous backwaters (BWC), side channel borders (SC), and impounded areas (IMP) during time
periods 2 and 3 (Aug. 1–Oct. 31) during 1998–2012. ** denotes significance when p < 0.05.
[p, probability; n/a, not applicable; ; <, less than]
Species Strata Sampling
gear Study reaches
Upper Pool 4 Lower Pool 4 Pool 8 Pool 13
Weed shiner r p r p
BWC
SC
M D M D
n/a n/a n/a n/a
**0.840 **0.697 **0.712
0.284
<0.001 0.006 0.004 0.326
0.109 0.080
**0.621 0.197
0.711 0.786 0.018 0.500
n/a n/a n/a n/a
Bluegill r p r p r p r p
BWC
SC
IMP
M D M D M D
**0.653 0.389 0.099 0.374
n/a n/a
0.011 0.170 0.737 0.188
−0.327 −0.077
0.459 0.121
n/a n/a
0.254 0.793 0.099 0.680
−0.219 **−0.556
0.144 −0.142
0.316 −0.289
0.452 0.039 0.624 0.629 0.271 0.316
−0.048 −0.290 −0.066
0.312 −0.302 −0.381
0.870 0.314 0.822 0.278 0.294 0.179
Largemouth bass r p r p r p r p
BWC SC IMP
D D D
0.005 0.230
n/a
0.986 0.428
**0.693 0.204
n/a
0.006 0.483
−0.121 0.171
**0.671
0.680 0.559 0.009
0.349 **0.632 **0.541
0.222 0.015 0.046
Percent frequency of submersed aquatic vegetation
CPU
E of
wee
d sh
iner
s in
bac
kwat
ers
12 Relationship of Weed Shiner, Bluegill, and Largemouth Bass to Submersed Aquatic Vegetation, Mississippi River, 1998–2012
Figure 6. Relationship of catch per unit effort (CPUE) of weed shiners (Notropis texanus) to percent frequency of submersed aquatic vegetation in contiguous backwaters when the four study reaches (Upper Pool 4, Lower Pool 4, Pool 8, and Pool 13) were grouped. CPUEs were calculated from mini-fyke netting and day electrofishing during time periods 2 and 3 (Aug. 1–Oct. 31) during 1998–2012. Plotted data were not transformed.

CPU
E of
wee
d sh
iner
s in
sid
e ch
anne
ls
Percent frequency of submersed aquatic vegetation
Results 13
Figure 7. Relationship of catch per unit effort (CPUE) of weed shiners (Notropis texanus) to percent frequency of submersed aquatic vegetation in side channels when the four study reaches (Upper Pool 4, Lower Pool 4, Pool 8, and Pool 13) were grouped. CPUEs were calculated from mini-fyke netting and day electrofishing during time periods 2 and 3 (Aug. 1–Oct. 31) during 1998–2012. Plotted data were not transformed.

Lower Pool 4
Pool 8
Percent coverage of aquatic vegetation
CPUE
of w
eed
shin
ers
0 1–19 20–49 50–100
BWC
SC
BWC
SC
0 1–19 20–49 50–100
14 Relationship of Weed Shiner, Bluegill, and Largemouth Bass to Submersed Aquatic Vegetation, Mississippi River, 1998–2012
Figure 8. Weed shiner (Notropis texanus) catch per unit effort (CPUE) in four categories of percent coverage of aquatic vegetation using mini-fyke nets in contiguous backwaters (BWC) and side channel borders (SC) of Lower Pool 4 and Pool 8 during time periods 2 and 3 (Aug. 1–Oct. 31) during 1998–2012.

CPU
E of
YO
Y bl
uegi
lls in
bac
kwat
ers
Percent frequency of submersed aquatic vegetation
Results 15
Figure 9. Relationship of catch per unit effort (CPUE) of young-of-year (YOY) bluegills (Lepomis macrochirus) to percent frequency of submersed aquatic vegetation in contiguous backwaters when the four study reaches (Upper Pool 4, Lower Pool 4, Pool 8, and Pool 13) were grouped. CPUEs were calculated from mini-fyke netting and day electrofishing during time periods 2 and 3 (Aug. 1–Oct. 31) during 1998–2012. Plotted data were not transformed.

Percent frequency of submersed aquatic vegetation
CPU
E of
YO
Y bl
uegi
lls in
sid
e ch
anne
ls
r = 0.373 P = 0.005
r = 0.503 P < 0.001
16 Relationship of Weed Shiner, Bluegill, and Largemouth Bass to Submersed Aquatic Vegetation, Mississippi River, 1998–2012
Figure 10. Relationship of catch per unit effort (CPUE) of young-of-year (YOY) bluegills (Lepomis macrochirus) to percent frequency of submersed aquatic vegetation in side channels when the four study reaches (Upper Pool 4, Lower Pool 4, Pool 8, and Pool 13) were grouped. CPUEs were calculated from mini-fyke netting and day electrofishing during time periods 2 and 3 (Aug. 1–Oct. 31) during 1998–2012. Plotted data were not transformed.
Percent frequency of submersed aquatic vegetation
CPU
E of
YO
Y bl
uegi
lls in
impo
unde
d ar
ea
r = 0.262 P = 0.178
r = –0.134 P = 0.497
Results 17
Figure 11. Relationship of catch per unit effort (CPUE) of young-of-year (YOY) bluegills (Lepomis macrochirus) to percent frequency of submersed aquatic vegetation in impounded areas when the two study reaches (Pool 8 and Pool 13) were grouped. CPUEs were calculated from mini-fyke netting and day electrofishing during time periods 2 and 3 (Aug. 1–Oct. 31) during 1998–2012. Plotted data were not transformed.

Percent frequency of submersed aquatic vegetation
CPU
E of
YO
Y la
rgem
outh
bas
s
Figure 12. Relationship of catch per unit effort (CPUE) of young-of-year (YOY) largemouth bass (Micropterus salmoides) to percent frequency of submersed aquatic vegetation in contiguous backwaters when the four study reaches (Upper Pool 4, Lower Pool 4, Pool 8, and Pool 13) were grouped. CPUEs were calculated from day electrofishing during time periods 2 and 3 (Aug. 1–Oct. 31) during 1998– 2012. Plotted data were not transformed.
Percent frequency of submersed aquatic vegetation
CPU
E of
YO
Y la
rgem
outh
bas
s
18
Percent frequency of submersed aquatic vegetation
CPU
E of
YO
Y la
rgem
outh
bas
s
Percent frequency of submersed aquatic vegetation
CPU
E of
YO
Y la
rgem
outh
bas
s
Relationship of Weed Shiner, Bluegill, and Largemouth Bass to Submersed Aquatic Vegetation, Mississippi River, 1998–2012
Figure 13. Relationship of catch per unit effort (CPUE) of young-of-year (YOY) largemouth bass (Micropterus salmoides) to percent frequency of submersed aquatic vegetation in side channels when the four study reaches (Upper Pool 4, Lower Pool 4, Pool 8, and Pool 13) were grouped. CPUEs were calculated from day electrofishing during time periods 2 and 3 (Aug. 1–Oct. 31) during 1998–2012. Plotted data were not transformed.

19 Discussion
CPU
E of
YO
Y la
rgem
outh
bas
s
Percent frequency of submersed aquatic vegetation
Figure 14. Relationship of catch per unit effort (CPUE) of young-of-year (YOY) largemouth bass (Micropterus salmoides) to percent frequency of submersed aquatic vegetation in impounded areas when the two study reaches (Pool 8 and Pool 13) were grouped. CPUEs were calculated from day electrofishing during time periods 2 and 3 (Aug. 1–Oct. 31) during 1998–2012. Plotted data were not transformed.
Discussion Weed shiners and age-0 bluegill and largemouth bass
showed significant increases in CPUE in relationship to SAV frequency increases in BWC and SC when all four study reaches were treated collectively. Results of this study indicate that there tends to be greater abundance of these three fishes in reaches with higher SAV frequencies (Lower Pool 4 and Pool 8) and lower abundance in reaches with lower SAV frequencies (Upper Pool 4 and Pool 13). However, there was often not a significant relationship between SAV frequency and the CPUE of a selected species when each study reach was treated independently. Other abiotic variables such as water temperature, discharge, and fluctuating water levels likely play a larger role in lotic systems than the physical habitat structure provided by aquatic vegetation in governing annual YOY recruitment of most vegetation-associated fish species (Parkos and Wahl, 2002; DeVries and others, 2009). However, it appears SAV may have a stronger link to annual recruitment of weed shiners, which are near the northern edge of their range (Becker, 1983), in Lower Pool 4 and possibly Pool 8 (table 2). Weed shiners have become more abundant in all of the study reaches during 2006 –12, a period during which SAV frequency was at the highest level since strati-fied random sampling for SAV began in 1998. More than
70 percent of the weed shiners captured in the BWC and SC in Pool 8 and Lower Pool 4 were caught in the two highest vegetation coverage categories (50 –100 and 20 –49 percent). Eddy and Underhill (1974) reported that the weed shiner’s name comes from its preference for “weedy” zones in large rivers and streams. The findings of this study indicate a strong link between increasing numbers of weed shiners and increas-ing aquatic vegetation in the four study reaches. SAV frequen-cies ≥ 75 percent in Pool 8 and Lower Pool 4 BWC appear to be a threshold at which a noticeable increase in weed shiner abundance was triggered (fig. 6), such that they have become one of the three most common species in the fish community in those two reaches on the basis of LTRMP data.
High to moderately high (≥ 50 percent) SAV frequencies in the BWC of the study reaches appear to support a higher abundance of YOY bluegills and largemouth bass, providing the food resources and refuge from predators that are required by many YOY and small fish species for good growth and survival. These results are consistent with those of Dewey and others (1997), who found that the abundance of YOY bluegills and YOY largemouth bass during summer was posi-tively related to macrophyte biomass in a Mississippi River backwater, and with those of Butler (1988) who found small bluegills to be numerous in densely vegetated littoral zones in lakes. Hoyer and Canfield (1996) observed that a complex

20 Relationship of Weed Shiner, Bluegill, and Largemouth Bass to Submersed Aquatic Vegetation, Mississippi River, 1998–2012
macrophyte community provided young largemouth bass with epiphytic invertebrates and small fish as food resources, as well as protection from other predators, which were key fac-tors affecting the number of young largemouth bass recruited into the adult population. Dewey and others (1997) found that most YOY bluegills were vulnerable during the summer to predation by YOY largemouth bass. Richardson and others (1998) hypothesized that the growth rates of YOY bluegills in vegetated habitat were higher than those in unvegetated areas of Mississippi River backwaters. Thus bluegills in vegetated areas would be susceptible to predation pressure by juvenile bass for a shorter period of time than bluegills with less access to vegetated habitat because of their faster growth rates, result-ing in increased first-year survival.
The annual CPUE of the three selected species was quite variable at higher SAV frequencies, indicating that other factors likely affect annual abundance levels of these spe-cies more than the prevalence of SAV. Maceina and Bettoli (1998) and Brown and Maceina (2002) found largemouth bass recruitment inversely related to discharge after spawning in southern impoundments. They also found that aquatic vegeta-tion was not the primary factor associated with largemouth bass year-class production in these impoundments. This can be observed in BWC of Pool 8 and Lower Pool 4 in the high annual variability of weed shiner CPUE using mini-fyke net-ting and electrofishing when SAV frequencies are ≥ 75 percent (fig. 6), in the variability of YOY bluegill CPUE in BWC using both gear types when SAV frequencies are > 60 to 70 percent (fig. 9), and in the variability of largemouth bass CPUE in BWC using electrofishing when SAV frequencies are > 75 percent (fig. 12). The lower SAV frequencies and highly variable abundance of bluegills and largemouth bass in Upper Pool 4 BWC limits the inferences that can be drawn regarding a SAV threshold in that reach. A SAV threshold in SC is not easily discernible in any of the study reaches because SAV fre-quencies in that stratum are considerably lower than in BWC. There does, however, appear to be a highly variable increase in bluegill CPUE using mini-fyke nets in the IMP of Pool 8 (fig. 11) and in largemouth bass CPUE using electrofishing in the IMP of Pools 8 and 13 (fig. 14) when SAV frequencies are > 60 to 70 percent. Butler (1988) found that the number of young bluegill present in an area was significantly related to plant density. However, he found no significant difference in bluegill abundance between intermediate and high plant density sites. Crowder and Cooper (1982) reported that in experimental ponds of different vegetation densities, inter-mediate plant densities were most advantageous to bluegills because they consumed more prey at intermediate densities than at low or high densities. They hypothesized that feeding rates of predators would be maximized at intermediate macro-phyte density because, although prey biomass is often posi-tively correlated with increasing macrophyte density, predator efficiency is often negatively correlated with a high density of macrophytes, which can inhibit foraging. When in the pres-ence of piscivorous fish, small bluegills have been shown to be restricted to dense vegetation (Werner and others, 1983).
Presumably, this is due to the decrease in juvenile bluegill mortality from largemouth bass predation that was observed with increasing plant density (Savino and Stein, 1982).
Although aquatic macrophytes have been shown to be important habitat for many species of YOY fish, SAV fre-quency may not be the best variable to measure the strength of this relationship. Other measures of vegetation such as SAV density, cover area, species composition, or structure may show a stronger correlation with YOY fish abundance, as might emergent, floating-leafed, or all aquatic vegetation combined. Hoyer and Canfield (1996) and Havens and others (2005) found that the abundance of juvenile largemouth bass was not correlated with the percent area covered by SAV. They indicated that it was not just the presence of SAV, but the structural diversity of the vegetation community that was important in determining bass numbers. A structurally diverse vegetation community provides both the refuge and food resources necessary for survival of young fish (Havens and others, 2005).
The results of this study indicate that the prevalence of SAV is positively related to the abundance of some fish species. Although aquatic vegetation may not be the primary driver of year-class strength of most vegetation-associated fish species, it does appear to modify the range of their abundance, and for some species with a strong affinity for vegetation and at the edge of their range (e.g., weed shiners), it may be a principal regulator of year-class strength. The results also demonstrate that the LTRMP SAV and fish community based sampling designs are sufficiently robust to allow for statisti-cal investigation of relationships between variables of the two components.
References Cited
Becker, G.C., 1983 Fishes of Wisconsin: University of Wis-consin Press, 1052 p.
Beckett, D.C., Aartila, T.P., and Miller, A.C., 1992, Contrasts in density of benthic invertebrates between macrophyte beds and open littoral patches in Eau Galle Lake, Wiscon-sin: American Midland Naturalist, v. 127, p. 77–90.
Brown, S. J., and Maceina. M.J., 2002, The influence of dis-parate levels of submersed aquatic vegetation on largemouth bass population characteristics in a Georgia reservoir: Jour-nal of Aquatic Plant Management, v. 40, p. 28–35.
Butler, M.J., 1988, In situ observations of bluegill (Lepomis macrochirus) foraging behavior—The effects of habitat complexity, group size, and predators: Copeia, v. 4, p. 939– 944.

21 References Cited
Chilton II, E.W., 1990, Macroinvertebrate communities associ-ated with three aquatic macrophytes (Ceratophyllum demer-sum, Myriophyllum spicatum, and Vallisneria americana) in Lake Onalaska, Wisconsin: Journal of Freshwater Ecology, v. 5, p. 455–466.
Crowder, L.B., and Cooper, W.E., 1982, Habitat structural complexity and the interaction between bluegills and their prey: Ecology, v. 63, p. 1802–1813.
DeVries, D.R., Garvey, J.E., and Wright, R.A., 2009, Early life history and recruitment, in Cooke, S.J., and Philipp, D.P., eds., Centrarchid fishes—Diversity, biology, and conserva-tion: UK, Wiley-Blackwell, p. 105–133.
Dewey, M.R., Richardson, W.B., and Zigler, S.J., 1997, Pat-terns of foraging and distribution of bluegill sunfish in a Mississippi River backwater—Influence of macrophytes and predation: Ecology of Freshwater Fish, v. 6, p. 8–15.
Dieterman, D.M., 2004, Major river survey, Upper Mississippi River Pools 3, 5, 5A, 6, 7, upper 9, and lower Vermillion River, 2004: Minnesota Department of Natural Resources, Division of Fish and Wildlife, Section of Fisheries, Stream Survey Report, 78 p.
Dieterman, D.M., 2005, Major river survey, Upper Mississippi River Pools 3, 5, 5A, 6, 7, upper 9, and lower Vermillion River, 2005: Minnesota Department of Natural Resources, Division of Fish and Wildlife, Section of Fisheries, Stream Survey Report, 74 p.
Dieterman, D.M., 2006, Major river survey, Upper Mississippi River Pools 3, 5, 5A, 6, 7, upper 9, and lower Vermillion River, 2006: Minnesota Department of Natural Resources, Division of Fish and Wildlife, Section of Fisheries, Stream Survey Report, 67 p.
Dieterman, D.M., 2007, Major river survey, Upper Mississippi River Pools 3, 4, 5, 5A, 6, 7, upper 9, and lower Vermillion River, 2007: Minnesota Department of Natural Resources, Division of Fish and Wildlife, Section of Fisheries, Stream Survey Report, 72 p.
Eddy, S., and Underhill, J.C., 1974, Northern fishes: Minne-apolis, Minn., University of Minnesota Press, 414 p.
Goldstein, R.M., and Simon, T.P., 1999, Toward a united definition of guild structure for feeding ecology of North American freshwater fishes, in Simon, T.P., ed., Assessing the sustainability and biological integrity of water resources using fish communities: Boca Raton, Fla., CRC Press, p. 123–202.
Gritters, S.A., and Mauldin, L.M., 1993, The status of the weed shiner (Notropis texanus) in Pool 13 of the Upper Mississippi River System: Onalaska, Wis., U.S. Fish and Wildlife Service, Environmental Management Technical Center, LTRMP 93–S007, 7 p.
Gutreuter, S., Burkhardt, R., and Lubinski, K. 1995, Long Term Resource Monitoring Program procedures—Fish monitoring: Onalaska, Wis., National Biological Service, Environmental Management Technical Center, LTRMP 95– P002–1, 42 p., plus appendixes A–J.
Hall, D.J., and Werner, E.E., 1977, Seasonal distribution and abundance of fishes in the littoral zone of a Michigan lake: Transactions of the American Fisheries Society, v. 106, p. 545–555.
Havens, K.E., Fox, D., Gornak, S., and Hanlon, C., 2005, Aquatic vegetation and largemouth bass population responses to water-level variations in Lake Okeechobee, Florida: Hydrobiologia, v. 539, p. 225–237.
Holland, L.E., and Huston, M.L., 1984, Relationship of young-of-the-year northern pike to aquatic vegetation types in backwaters of the Upper Mississippi River: North Ameri-can Journal of Fisheries Management, v. 4, p. 514–522.
Hoyer, M.V., and Canfield, Jr., D.E., 1996, Largemouth bass abundance and aquatic vegetation in Florida lakes—An empirical analysis: Journal of Aquatic Plant Management, v. 34, p. 23–32.
Ickes, B.S., Bowler, M.C., Bartels, A.D., Kirby, D.J., DeLain, S., Chick, J.H., Barko, V.A., Irons, K.S., and Pegg, M.A., 2005, Multiyear synthesis of the fish component from 1993 to 2002 for the Long Term Resource Monitoring Program: La Crosse, Wis., U.S. Geological Survey, Upper Midwest Environmental Sciences Center, LTRMP 2005–T005, 60 p., plus appendixes A–E.
Johnson, B.L., and Jennings, C.A., 1998, Habitat associations of small fishes around islands in the Upper Mississippi River: North American Journal of Fisheries Management, v. 18, p. 327–336.
Maceina, M.J., and Bettoli, P.W., 1998, Variation in large-mouth bass recruitment in four mainstream impoundments of the Tennessee River: North American Journal of Fish Management, v. 18, p. 998–1003.
Mittelbach, G.G., 1984, Predation and resource partitioning in two sunfishes (Centrarchidae): Ecology, v. 65, p. 499–513.
Parkos, III, J.J., and Wahl, D.H., 2002, Towards an under-standing of recruitment mechanisms in largemouth bass, in Philipp, D.P., and Ridgway, M.S., eds., Black bass—Ecol-ogy, conservation, and management: American Fisher-ies Society Symposium 31, American Fisheries Society, Bethesda, Md., p. 25–45.
Pflieger, W.L., 1997, The fishes of Missouri: Missouri Depart-ment of Conservation, 372 p.
22 Relationship of Weed Shiner, Bluegill, and Largemouth Bass to Submersed Aquatic Vegetation, Mississippi River, 1998–2012
Richardson, W.B., Zigler, S.J., and Dewey, M.R., 1998, Bio-energetic relations in submerged aquatic vegetation—An experimental test of prey use by juvenile bluegills: Ecology of Freshwater Fish, v. 7, p. 1–12.
Savino, J.F., and Stein, R.A., 1982, Predator-prey interac-tion between largemouth bass and bluegills as influenced by simulated, submersed vegetation: Transactions of the American Fisheries Society, v. 111, p. 255–266.
U.S. Fish and Wildlife Service, 1993, Operating plan for the Upper Mississippi River System Long Term Resource Monitoring Program (revised September 1993): Onalaska, Wis., Environmental Management Technical Center, EMTC 91–P002R, 179 p.
Werner, E.E., Gilliam, J.F., Hall, D.J., and Mittelbach, G.G., 1983, An experimental test of the effects of predation risk on habitat use in fish: Ecology, v. 64, p. 1540–1548.
Yin, Y., Winkelman, J.S., and Langrehr, H.A., 2000, Long Term Resource Monitoring Program procedures—Aquatic vegetation monitoring: La Crosse, Wis., U. S. Geological Survey, Upper Midwest Environmental Sciences Center, LTRMP 95–P002–7, 8 p., plus appendixes A–C.

Appendix 1.

25 Appendix 1 CP
UE
of Y
OY
blue
gills
in b
ackw
ater
s
Figure 1–1. Catch per unit effort (CPUE) of young-of-year (YOY) bluegills (Lepomis macrochirus) in contiguous backwaters of Upper Pool 4, Lower Pool 4, Pool 8, and Pool 13. CPUEs were calculated from mini-fyke netting and day electrofishing during time periods 2 and 3 (Aug. 1–Oct. 31) during 1998–2012.
CP
UE
of Y
OY
blue
gills
in s
ide
chan
nel b
orde
rs
26 Relationship of Weed Shiner, Bluegill, and Largemouth Bass to Submersed Aquatic Vegetation, Mississippi River, 1998–2012
Figure 1–2. Catch per unit effort (CPUE) of young-of-year (YOY) bluegills (Lepomis macrochirus) in side channel borders of Upper Pool 4, Lower Pool 4, Pool 8, and Pool 13. CPUEs were calculated from mini-fyke netting and day electrofishing during time periods 2 and 3 (Aug. 1–Oct. 31) during 1998–2012.

27 Appendix 1
CPU
E of
YO
Y bl
uegi
lls in
impo
unde
d ar
eas
Figure 1–3. Catch per unit effort (CPUE) of young-of-year (YOY) bluegills (Lepomis macrochirus) in impounded areas of Pool 8 and Pool 13. CPUEs were calculated from mini-fyke netting and day electrofishing during time periods 2 and 3 (Aug. 1–Oct. 31) during 1998–2012.
CP
UE
of Y
OY
larg
emou
th b
ass
Figure 1–4. Catch per unit effort (CPUE) of young-of-year (YOY) largemouth bass (Micropterus salmoides) in contiguous backwaters of Upper Pool 4, Lower Pool 4, Pool 8, and Pool 13. CPUEs were calculated from day electrofishing during time periods 2 and 3 (Aug. 1–Oct. 31) during 1998–2012.
CPU
E of
YO
Y la
rgem
outh
bas
s
28 CP
UE
of Y
OY
larg
emou
th b
ass
CPU
E of
YO
Y la
rgem
outh
bas
sRelationship of Weed Shiner, Bluegill, and Largemouth Bass to Submersed Aquatic Vegetation, Mississippi River, 1998–2012
Figure 1–5. Catch per unit effort (CPUE) of young-of-year (YOY) largemouth bass (Micropterus salmoides) in side channel borders of Upper Pool 4, Lower Pool 4, Pool 8, and Pool 13. CPUEs were calculated from day electrofishing during time periods 2 and 3 (Aug. 1–Oct. 31) during 1998–2012.

29 Appendix 1 CP
UE
of Y
OY
larg
emou
th b
ass
Figure 1–6. Catch per unit effort (CPUE) of young-of-year (YOY) largemouth bass (Micropterus salmoides) in impounded areas of Pool 8 and Pool 13. CPUEs were calculated from day electrofishing during time periods 2 and 3 (Aug. 1–Oct. 31) during 1998–2012.


Environmen
tal Man
agemen
tP
rogramU
pperM
ississippi
Riv
erR
estoration
Restorin
g an
d M
onitorin
gth
eU
pper M
ississippi R
iver Sy
stem
The Long Term Resource Monitoring Program (LTRMP) for the Upper Mississippi River System was authorized under the Water Resources Development Act of 1986 as an element of the U.S. Army Corps of Engineers’ Upper Mississippi River Restoration-Environmental Management Program. The mission of the LTRMP is to provide river managers with information for maintaining the Upper Mississippi River System as a sustainable large river ecosystem given its multiple-use character. The LTRMP is a cooperative effort by the U.S. Geological Survey, the U.S. Army Corps of Engineers, and the States of Illinois, Iowa, Minnesota, Missouri, and Wisconsin.
Long Term Resource M
onitoring Program—
Relationship of Weed Shiner and Young-of-Year B
luegill and Largemouth B
ass Abundance to
Submersed A
quatic Vegetation in Navigation Pools 4, 8, and 13 of the U
pper Mississippi River, 1998–2012