environmental - landis+gyr · landisgyr.com. as a consequence of the acquisition of the landis+gyr...
TRANSCRIPT

EnvironmentalProfile

| 2013 /14 at a Glance
| Foreword: Committed to Sustainability
| Landis+Gyr Joined the Carbon Disclosure Project
| Water Consumption
| Landis+Gyr India Has Committed to Water Consumption Reduction Plan
| Waste
| Landis+Gyr North America Has Committed to a Landfill Reduction Program
| Chemicals
| Landis+Gyr Banned the Use of DCM in its Gas Meter Manufacturing Process
| Carbon Footprint
| Reducing CO2 Emissions Already During the Development Stage
| Appendix
| Table 1: Global energy consumption of Landis+Gyr Group in 2013/14
| Table 2: Total group emissions, by scope and source (t CO2e)
| Table 3: Carbon footprint for the four regions, 2009 – 2014
| Table 4: Carbon footprint and percentage contribution of the Four Regions
| Table 5: Individual greenhouse gases emitted by Landis+Gyr Group in 2013 /14
Contents
3
5
7
9
10
11
12
13
14
15
26
28
28
29
30
30
31

+ 2 %
+ 0.8 %
– 9.5 %
+ 2 %
Water Primarily caused by increased volumes and construction works to expand existing and build up new production capacities.
Waste Comparison limited to level 1 sites
Chemicals Comparison limited to level 1 sites
CO2Overall CO2 emissions slightly increased from 1.7 kg to 1.8 kg per USD 100 turnover, mainly due to large engineering efforts for the Japanese market. However, emissions per turn over have decreased by 33 % since the program’s inception in 2007.
2013 /14 at a GlanceLandis+Gyr enables society to “manage energy better.” This is the mission that the Company aims to accomplish in a deliberate and responsible manner. Today’s demand for energy is growing and electricity generation resources will become increasingly stretched. Landis+Gyr is proud to provide smart solutions that help to successfully overcome this challenge while at the same time contributing to preserving natural resources by constantly seeking to reduce emissions throughout the entire design and production process.

Five-year Key Figures2009 2010 2011 2012 /13 2013 /14
m3 water n. a. n. a. 167,239 132,710 135,395
t waste n. a. n. a. 2,319 2,421 2,441
t chemicals n. a. n. a. n.a. 23.2 21.0
kg CO2e/USD 100 turnover 2.3 2.0 1.9 1.7 1.8
kg per product 2.2 2.1 1.8 1.6 1.6
Turnover in USD billion 1.4 1.5 1.6 1.7 1.5
Employees 4,850 5,140 5,210 5,300 5,500
t CO2e * 35,461 35,238 35,060 33,921 34,600
* Total Scope 1, Scope 2 and Scope 3
Landis+Gyr acts in accordance with all relevant health, safety and environmental regulations, codes and standards. In addition to requiring ISO 14001 certification throughout the Company and at all its key suppliers, Landis+Gyr addresses life cycle and recycling aspects as key ingredients of its product design process.
Landis+Gyr Group
Landis+Gyr is the leading global provider of inte-grated energy management products tailored to energy company needs and unique in its ability to deliver true end-to-end Advanced Metering solu-tions. Today, the Company offers the broadest portfolio of products and services in the electric-ity metering industry, and is paving the way for the next generation of the Smart Grid.
With annual sales of USD 1.5 billion, Landis+Gyr, an independent growth platform of the Toshiba Corporation (TKY:6502) and 40% owned by the Innovation Network Corporation of Japan, oper-ates in more than 30 countries across five conti-nents, and employs more than 5,500 people with the sole mission of helping the world manage energy better. More information is available at landisgyr.com.
As a consequence of the acquisition of the Landis+Gyr Group by the Toshiba Corporation in 2011, the reporting period was changed from the calendar year to Toshiba’s fiscal year, which runs from 1 April to 31 March.

| 5
“Landis+Gyr’s green product offering contributes to a sustainable society and the protection of natural resources for the well-being of current and future generations. Beyond reducing our carbon footprint, we mitigate the environmental impact of our development and manufacturing processes by reducing waste and encourag-ing the responsible use of water and chemicals.”
Andreas Umbach, President and CEO
Landis+Gyr's mission is to manage energy bet-ter, and the group's products and services allow utility customers to improve the efficiency of their operations and drive towards each firm's sus-tainability goals and begin implementing smarter electricity grids. This outcome will in turn benefit society. Smart grids and smart meters allow for efficiency gains and the integration of renewable energy resources, enabling end-consumers and utilities to reduce their CO2 emissions considera-bly. Knowing that two-thirds of today’s electricity is generated from fossil resources, as statistics from the OECD and IEA show, these emission savings are relevant in the fight against climate change.
Thanks to the current deployment of smart meters and two-way communications with com-mercial and household customers, utilities are gaining new intelligence about consumer energy usage. More importantly, they are empowering their customers to take greater control over their energy usage with the deployment of next genera-tion demand response programs.
Joining forces against climate change
It is Landis+Gyr and Toshiba Corporation’s ambi-tion to contribute to tomorrow’s smart commu-nities by pooling their expertise and corporate resources. The goal is to offer new technologies for secure and efficient energy infrastructure while protecting natural resources and fighting climate change. The reduction of CO2 and asso-ciated pollutant generation from diminished coal consumption will improve global environmental protection. Meanwhile, the problems of waste generated as a result of economic development as well as problems arising from water scarcity and the use of chemicals are becoming increasingly serious. Besides protecting the environment, the two companies are committed to pushing the creation of sustainable, energy-saving commu-nities, mainly by actively introducing renewable energy and energy management systems.
Committed to Sustainability

| 6
Committed to Sustainability
This year’s report therefore includes additional data expressing total originated waste, divided into the four categories of sold, incinerated, land-fill and recycled. The presentation of the use of water specifies the amount of recycled water. The chemicals data serve to reduce the use of chemi-cals in general.
At Landis+Gyr, beyond the corporate initia-tives, each employee is invited to contribute new ideas and proposals for process optimization that further enhance the Company’s environmental profile. I am proud of the team’s motivation and engagement. The common mind set at Landis+Gyr represents the basis for the impressive improve-ments the Company has achieved over the past few years. We’ve had a good start but there is much more to do. Let’s continue our efforts with even more drive!
Andreas Umbach, President and CEO
Greening the businessAs an independent growth platform within Toshi-ba’s group of companies, Landis+Gyr backs its parent company’s goal to become one of the world’s foremost eco-companies. With their “Greening of Products” initiative, Toshiba and Landis+Gyr aim to achieve the highest level of environmental performance for all products and reduce environmental impacts throughout prod-uct life cycles. With their “Greening by Technol-ogy” initiative, the two companies are working to provide a stable power supply and mitigate climate change on a global scale by developing low-carbon energy technologies. An important aspect of both initiatives is “Greening of Process”, which aims to minimize inputs such as materials and energy in manufacturing processes globally, reducing the discharge of waste and chemical substances, and keeping environmental impacts at a minimum.
Expansion of data recording
In addition to the carbon footprint analysis pre-pared since 2007, Landis+Gyr expanded its reporting scope on water, waste and chemicals data in 2013/14. In the current reporting period, Landis+Gyr expanded the data recording for waste and the use of chemicals from its level 1 to its level 2 sites (all 26 major sites), accounting for 85% of all employees. Data recording of water use had been expanded to all production levels (1-3) in the year before.
The ultimate goal of Landis+Gyr is to make a substantial contribution to the conservation of natural resources and environments:
Avoiding the use of harmful materials, thereby minimizing pollution
Integration of life cycle and recycling aspects as an integral factor of the product design process
Reduction of waste to a minimum
Compliance with relevant health, safety and environmental regulations and standards, among them ISO 9001, ISO 14001, BS 18001

| 7
The Carbon Disclosure Project (CDP) is a glob-ally active, non-profit organization that provides companies and cities with a platform to publish and compare environmental impact and resource consumption data. CDP helps companies, inves-tors and cities to better mitigate risk, capitalize on opportunities and make investment deci-sions that drive action towards a more sustain-able world. The organization is independent and funded by a wide range of partnerships and spon-sors, as well as by membership fees and special projects.
CDP holds the largest collection globally of self reported climate change, water and forest-risk data. On a volunteer basis, a standardized ques-tionnaire with more than one hundred questions is filled out annually. It covers the areas of carbon emissions, climate risks, reduction goals and according strategies.
Extended commitment of Landis+Gyr
CDP creates a universal standard for all contribut-ing entities and allows comparability of environ-mental data across of environmental data across various businesses. Landis+Gyr is particularly using CDP to benchmark against peer industries and thus further develop its focus areas and ini-tiatives. In the first half of 2014, Landis+Gyr pro-vided information on, water and climate change data that will be published at the end of the year. Assessment of this data will support Landis+Gyr’s efforts to continuously improve its environ-mental footprint and to set additional binding targets. Our customers and stakeholders can get access to Landis+Gyr information on CDP ( https://www.cdp.net )
“Each company is faced with the challenge of reducing its carbon foot-print while ensuring stable business growth. The CDP survey is an important benchmark to maintain and expand our dedication towards protecting the environment.”
Hans Sonder, Director Technology Management & Process Excellence, Group Headquarters
Landis+Gyr Joined the Carbon Disclosure Project

| 9
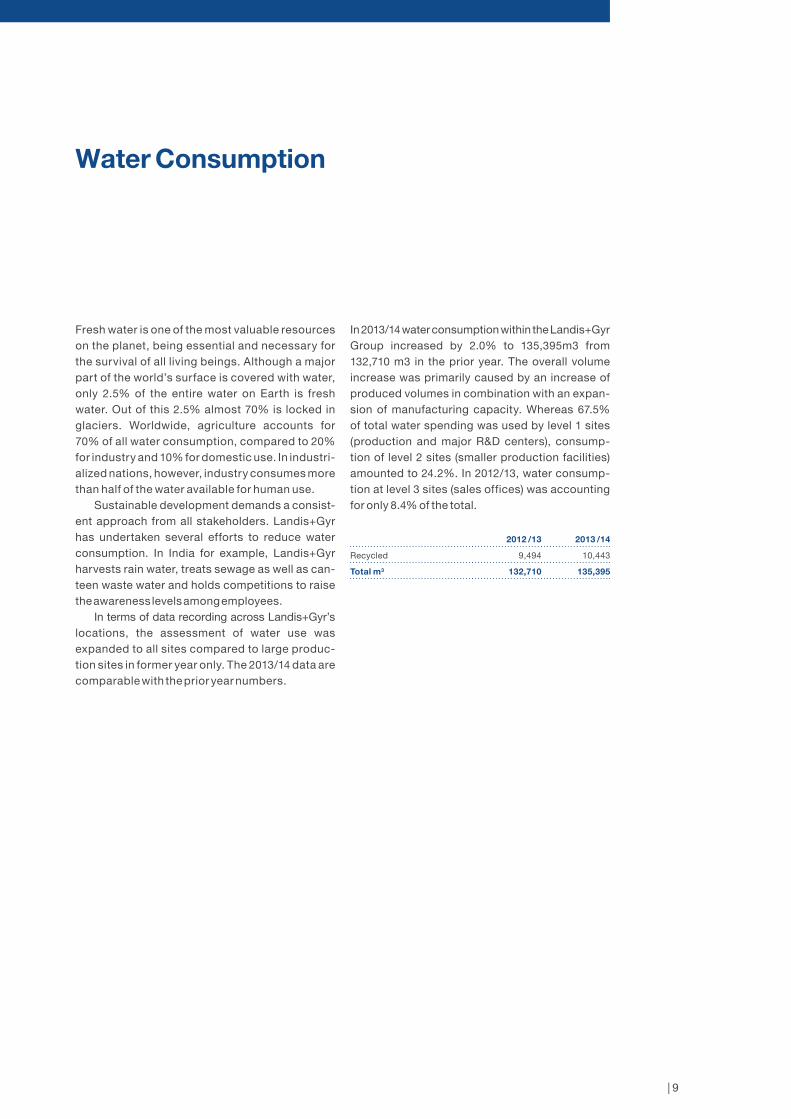
Fresh water is one of the most valuable resources on the planet, being essential and necessary for the survival of all living beings. Although a major part of the world’s surface is covered with water, only 2.5% of the entire water on Earth is fresh water. Out of this 2.5% almost 70% is locked in glaciers. Worldwide, agriculture accounts for 70% of all water consumption, compared to 20% for industry and 10% for domestic use. In industri-alized nations, however, industry consumes more than half of the water available for human use.
Sustainable development demands a consist-ent approach from all stakeholders. Landis+Gyr has undertaken several efforts to reduce water consumption. In India for example, Landis+Gyr harvests rain water, treats sewage as well as can-teen waste water and holds competitions to raise the awareness levels among employees.
In terms of data recording across Landis+Gyr’s locations, the assessment of water use was expanded to all sites compared to large produc-tion sites in former year only. The 2013/14 data are comparable with the prior year numbers.
In 2013/14 water consumption within the Landis+Gyr Group increased by 2.0% to 135,395m3 from 132,710 m3 in the prior year. The overall volume increase was primarily caused by an increase of produced volumes in combination with an expan-sion of manufacturing capacity. Whereas 67.5% of total water spending was used by level 1 sites (production and major R&D centers), consump-tion of level 2 sites (smaller production facilities) amounted to 24.2%. In 2012/13, water consump-tion at level 3 sites (sales offices) was accounting for only 8.4% of the total.
2012 /13 2013 /14
Recycled 9,494 10,443
Total m3 132,710 135,395
Water Consumption

| 10
The project targets a reduction in water consump-tion by minimizing waste from various sources such as leakage, irresponsible use or overflow-ing tanks. The team project involves maintenance specialists, who provide all services required, supported by management. The overall goal is to reduce total water drawn at the site and water drawn per employee year over year.
The measures initiated by the project team under the lead of Prabir Chakraborty include the identification and elimination of all leakages in underground pipes and immediate repair of pipe bursts, the installation of automatic water level monitoring systems on water tanks, and the removal of old, unnecessary water pipelines for use elsewhere. In addition, various training ses-sions improved employee awareness of water scarcity and responsible water usage behavior.
“Water is an essential commodity and managing water is an essential compo-nent of Landis+Gyr’s ambition of Managing Energy Better. Landis+Gyr attaches considerable importance to water conservation and puts great efforts in achieving a ‘single drop control.’”
Vivek Namboodiripad, Deputy General Manager Quality Assurance, Landis+Gyr Kolkata, India
Landis+Gyr India Has Committed to Water Consumption Reduction Plan
| 10

| 11
The environmental impact of waste is becoming increasingly problematic. The growing volumes of waste are driven by several factors including population growth rates, socio-economic devel-opments and rising prosperity. Closely related to this is the increasing use of hazardous and non-hazardous materials. Negative impacts not only concern human health, e.g. the risk of epidemic diseases, but also the degradation of scenic landscapes. To reduce the environmental threats, new disposal, treatment and incineration sites are gaining importance. Moreover, physical, thermal, chemical or biological processes are continually evolving. They can change the char-acteristics of the waste in order to reduce volume or hazardous content, facilitate its handling or enhance recovery.
On the company level, Landis+Gyr aims for constant improvements that curb the harmful effects of the produced waste. Landis+Gyr seeks to reduce or prevent the production of waste through in-process modifications, reuse and recy-cling. Waste management operations also include the final treatment and disposal of waste at landfills and incineration facilities. Landis+Gyr assumes its responsibilities as a corporate citizen and has therefore set the ambitious goal of reducing total waste.
In 2013/14, Landis+Gyr expanded the data recording from its level 1 to its level 2 sites (all 26 major sites), accounting for 85 % of all employ-ees. Total waste amounted to 3,131 tons. Thereof 78.0% came from level 1 and 22.0% from level 2 sites.
In prior years, only level 1 sites had been tracked, accounting for most of the waste impact. A year-over-year comparison is therefore limited to level 1 data, which showed an increase of 0.8%, from 2,421 to 2,441 tons due to higher volumes in combination with construction work to expand production capacities.
2012 /13* 2013 /14* 2013 /14
Level 1 2,421 2,441 2,441
Level 2 n.a. n.a. 690
Total 2,421 2,441 3,131
Sold n.a. 694
Incinerated n.a. 215
Landfill n.a. 550
Recycled n.a. 1,672
Total t 2,421 2,441 3,131
* only site level 1 amounts
Waste

| 12
The goal is to reduce waste to landfill year over year by 1% throughout the organization (tons to landfill FY 13 versus FY 14).
For the current fiscal year 2014/15 (ending March 31, 2015), Landis+Gyr SA de CV in Reynosa, Mexico, has committed itself to a 2 t reduction in total waste to landfill by repurposing packag-ing corner cardboard (0.2 t), through the reuse of packing material (0.4 t), packaging plastic layers (0.35 t) and packaging rubber banding (0.35 t), and by starting a program for returning reusable shipping containers to suppliers (0.7 t). In addition, the Reynosa operation is planning for an addi-tional 10,2 t reduction in total waste to landfill in FY 2015/16, by fully implementing the program for returning reusable shipping containers to suppli-ers (4 t), making use of plastic and reusable pallets (6 t), and implementing a cafeteria leftover com-posting program (0.2 t).
In parallel as an overall North American-wide effort, management is formalizing the organi-zation's waste to landfill reduction program and developing the requisite processes, as well as setting new targets for the years to come. This program builds on Landis+Gyr and Toshiba Cor-poration's environmental policy and correspond-ing targets.
“We will continue our dialogue with all Landis+Gyr operations in North America and work on receiving new commit-ments for additional waste reduction in order to continually reduce our overall waste sent to landfill.”
Don Roberts, Director QEHS , Landis+Gyr North America
Landis+Gyr North America Has Committed to a Landfill Reduction Program

| 13
Chemicals
Chemicals play an essential role in our everyday life. But they can also be harmful to nature and human health. Worldwide, more than 25% of the reported incidences of disease can be traced to environmental factors, which include exposure to chemicals. Especially in developing countries and economies in transition, the quantity and range of new and existing chemicals are rapidly growing. Therefore, the sound management of chemicals throughout their lifecycle is essen-tial in order to avoid significant and increasingly complex risks to human health and ecosystems and substantial costs to national economies.
Even though metal treating operations were discontinued in 1994 and the Company’s manufac-turing processes fully comply with the latest qual-ity and environmental standards, Landis+Gyr has been working and coordinating with local officials to determine adequate measures for soil decon-tamination. Various analyses are currently being carried out.
It is a priority of Landis+Gyr to minimize the use of chemicals in the entire value chain of the Group’s products and services. The Company aims to reduce chemical emissions. Furthermore, the use of Dichlormethane (DCM) and Perchloroethylene (PCE) is planned to be phased out or significantly reduced in Stockport (UK), Joka (India) and Corinth (Greece) and new filtering systems will be deployed at sites with residual use.
In 2013/14, Landis+Gyr expanded the data recording from its level 1 to its level 2 sites (all 26 major sites), accounting for 85 % of all employ-ees. However, the use of chemicals at the level 2 and 3 sites was negligible. Total use of chemicals amounted to 21 tons. In prior years, only level 1 sites had been tracked, accounting for most of the chemicals impact. A year-over-year compar-ison is therefore limited to level 1 data. Level 1 sites decreased the use of chemicals in 2013/14 to 21.0 tons from 23.2 tons in the prior year, which corresponds to a reduction of 9.5 %. This sub-stantial improvement is a significant milestone in optimizing processes to further reduce resolvent and other chemicals.
2012 /13* 2013 /14* 2013 /14
Level 1 23.2 21.0 21.0
Total t 23.2 21.0 21.0
* only site level 1 amounts

| 14| 14
Landis+Gyr Banned the Use of DCM in its Gas Meter Manufacturing Process
In order to manufacture transducers for Gas Meters, the Landis+Gyr production specialists first need to create the rod using heavy metal fix-tures. These fixtures are regularly cleaned using a release agent. The original release agent contained DCM (Dichloromethane, a banned substance under Toshiba’s guidelines). Aiming to remove or at least substantially reduce the use of DCM, Landis+Gyr’s Stockport (UK) operation initiated a project to review the fixtures cleaning process with a view to substituting the release agent that contained DCM whilst maintaining performance and quality of product.
As part of its validation processes Landis+Gyr contacted various suppliers, including the manu-facturer of the DCM-containing product, who was able to provide the Company with alternative sub-stances. Some of these substances were rejected after assessment tests. One substance containing two silicone additives plus a small amount of DCM mixed with 60% water caused production issues due to build-up of silicone residue on the fixtures. In a new effort aiming to completely eliminate DCM from the process, the specialists looked at alter-native cleaning methods. They undertook experi-ments using different substances in varying quan-tities as well as the two original silicone additives in significantly smaller quantities. After twenty
weeks of intensive trials, a new methodology was deemed successful and introduced into the pro-duction process.
Today the modified process is running well and results have been highly repeatable over sev-eral months. Rod production is stable and quality standards are being met. As a result, the remaining DCM has been removed from the site and blocked in the product data management (PDM) system to prevent inadvertent re-ordering.
“We have been trialing various alterna-tive cleaning agents and processes. Eliminating DCM without any drawbacks by simply modifying the production process was a great achievement. ”
Tony Fenwick, Engineering Manager, Landis+Gyr (Stockport), UK

| 15
The carbon footprint analyses were undertaken for the seventh consecutive year (2007 to 2013/14) to quantify the greenhouse gas (GHG) emissions of Landis+Gyr. Progress is monitored by collect-ing detailed emission data and by constantly analyzing this data and defining further improve-ment potential. The web-based SoFi software and reporting system was used for data capture, aggregation and analysis. The SoFi system is now well integrated into the Landis+Gyr Group and its sites worldwide and is currently being expanded to capture a broader range of sustainability indi-cators.
Due to the acquisition of Landis+Gyr by the Toshiba Corporation in 2011, Landis+Gyr’ activity data are consolidated and verified within Toshi-ba’s controlling and auditing processes. In addi-tion, own analysis included a thorough consist-ency check by PE INTERNATIONAL, a specialized consulting company in the area of sustainability management with all level 1 and 2 sites and some selected level 3 sites. The verification process confirmed that the entered data was found to be within the tolerance ranges.
Landis+Gyr selected the “operational control approach” to determine which sites are to be included in the corporate carbon footprint. The application of the operational control approach implies that GHG-relevant impacts of activities are accounted for at those sites, subsidiaries or operations which are controlled by the Com-pany. Landis+Gyr’s corporate carbon footprint includes all of its R&D, sales and manufacturing sites.
The GHG protocol provides the three “scopes” (scope 1, scope 2 and scope 3) in order to help delineate direct and indirect emission sources, improve transparency and provide utility for dif-ferent types of organizations and different types of climate policies and business goals. The carbon footprint is expressed in CO2 equivalents (CO2e). The unit of measurement is metric tons, and all GHG emissions are converted to metric tons of CO2e, using appropriate GWP (Global Warming Potential) factors as published by the Intergov-ernmental Panel on Climate Change (IPCC). This allows for the aggregation of all GHG emissions in one single indicator, expressed as the carbon foot-print.
Carbon Footprint
Landis+Gyr Group is a sustainable and environ-mentally conscious corporation to the benefit of customers, current and potential future shareholders, employees, suppliers and other stakeholders
Carbon footprint records since 2007
Constantly reduced the greenhouse emissions per unit since 2008, reaching a new low of 1.63 kg per device

| 16
Scope 1
Direct emissions from sources that are owned or controlled by the Company:– Energy carriers for the generation of electricity,
heat and steam– Diesel for the operation of emergency
generators– Direct GHG emissions attributable to chemical/
physical processing– Energy carriers consumed in transportation
(Landis+Gyr fleet only)
Scope 2
Indirect emissions associated with the gener-ation of purchased electricity consumed by the Company as well as district heating and process steam.
Scope 3
All other indirect emissions that occur as a con-sequence of the activities of the Company from sources not owned or controlled by the Company. Landis+Gyr used business air travel as an indica-tor of its scope 3 emissions.
Carbon Footprint
Scope 3Indirect
Scope 2Indirect
Scope 1Direct
Fuel combustion
Purchased electricity or own use
Contractor-used vehicles
Production of purchased materials and product use
Waste disposal
Employee business travel
Company owned vehicles

| 17
2013 /14 Results in Brief
Slight Increase per USD 100 Turnover In the financial year 2013/14, overall CO2 emis-sions slightly increased from 1.7 kg to 1.8 kg per USD 100 turnover, mainly due to large engineer-ing efforts for the Japanese market. This caused the first year-over-year increase in CO2 generated based on sales after six consecutive years of improvement. Nevertheless, on a per-unit-of-production basis, the continuous downward trend of emissions remained intact, reaching a new low of 1.63 kg per device, a 33 % decrease since the program’s inception in 2007. Total CO2e emissions within the Landis+Gyr Group amounted to 34,600 tons CO2e in 2013/14, up by 2.0 % compared to 33,900 tons CO2e in 2012/13.
The increase of the overall emissions can mainly be attributed to Scope 3 (up from 5,400 tons CO2e to 6,200 tons CO2e) and was related to increased travel activities caused by the intensive joint busi-ness development projects with Toshiba. Scope 2 decreased by 1.7 % compared to the 2012/13 level thanks to production process improvements in the production sites. With 22,500 tons CO2e it represented the largest component in 2013/14. Scope 1 went up by 5.8 %, with 5,900 tons CO2e amounting for a small proportion of overall emis-sions. The higher emissions were caused by the increased use of emergency power generators in India and the extension of production capacity in South Africa.
Carbon Footprint
Scope 1 emissions increased by 5.8%
Scope 2 emissions decreased by 1.7%
Scope 3 emissions increased by 13.9%
60% (21,600 t) of total scope 1+2+3 emissions stem from the Group’s electricity consumption
Within scope 1 (“direct emissions”) 2,700 t CO2e are attributable to gasoline consumption in company vehicles

| 18
2013 /14 Results in Details
In total, the Landis+Gyr Group emitted 34,600 tonnes of CO2e in 2013/14. This is 700 t or 2% more than in 2012/13.
In accordance with accepted global stand-ards, the carbon footprint has also been docu-mented in “scopes”: Scope 1 (direct emissions) amounts to 5,900 t CO2e (17% of total). Scope 2 (indirect emissions) represents the largest compo-nent with 22,500 t CO2e (65%). Business air travel, as part of scope 3, only contributes a relatively small component (6,200 t or 18%) to the total car-bon footprint.
With around 13,500 t CO2e, North America gen-erates the largest proportion of overall emissions (39%), followed by EMEA with 12,300 t CO2e (36%), the Asia-Pacific region with 7,100 t CO2e (21%), and South America with 1,600 t (5%).
Carbon Footprint
0
5,000
10,000
15,000
20,000
25,000
30,0002012/1320112010200920082007
Scope 3Scope 2Scope 1
2013/14
tCO2e

| 19
Carbon Footprint
2013 /14 Breakdown by Source
Global 1+2+3 emissions:33,921 tCO2e
Electricity / District Heating 64.96 % Fuels (diesel oil) 3.71 % Fuels (natural gas, LPG) 3.00 %
Direct process emissions 0.11 %
Road travel 10.24 % Air travel 17.98 %
65% (22,500 t) of total scope 1+2+3 emissions stem from the Group’s electricity consumption.(Global tCO2e Total 34,623 tCO2e)
2013 /14 Regional Breakdown
The Landis+Gyr Group has sites in its four regions worldwide: Asia-Pacific (AP), Europe, Middle East and Africa (EMEA), North America (NA) and South America (SA).
With around 13,500 t CO2e, North America gen-erates the largest proportion of overall emissions (39%), followed by EMEA with 12,300 t CO2e (36%), the Asia-Pacific region with 7,100 t CO2e (21%), and South America with 1,600 t (5%).
0
3200
6400
9600
12800
16000Scope 3Scope 2Scope 1
t CO2e
SANAEM
EAAP

| 20
Carbon Footprint
South America
Electricity / District Heating 76 % Fuels 3 %
Process emissions 0 %
Road travel 0 % Business air travel 21 %
South America shows that the electricity compo-nent represents 76%. Other sources except air travel (21%) are insignificant.
North America
Electricity / District Heating 59 % Fuels 4 %
Process emissions 0 %
Road travel 17 % Business air travel 20 %
Emissions in North America are dominated by electricity consumption (59%). Emissions from travel are fairly high (road travel as well as air trav-el with 37% in total) due to the significant service operations, which require higher deployment and field service work.

| 21
Carbon Footprint
Europe / Middle East /Africa (EMEA)
Electricity / District Heating 67 % Fuels 9 %
Process emissions 0 %
Road travel 10 % Business air travel 14 %
In Europe/Middle East/Africa (EMEA), 67% of emissions are caused by the use of electricity and district heating. The use of fuels (stationary com-bustion) only accounts for 9%. On the other hand, with 10% of the total, road travel in the EU is much more significant than in Asia-Pacific. Air travel contributes 14% of emissions.
Asia-Pacifi c
Electricity / District Heating 70 % Fuels 9 %
Process emissions 0 %
Road travel 1 % Business air travel 20 %
In the Asia-Pacific region, almost three-quarters (70%) of emissions are caused by consumption of electricity and district heating, followed by emissions caused by air travel (20%). The use of fuels for stationary power generation contrib-utes 9% to the carbon footprint. Emissions from road travel amount to 1%, whereas direct process emissions are insignificant.

| 22
Carbon Footprint
0
2000
4000
6000
8000
10000
12000
UKSouth AfricaBrazilArgentinaUSAMexicoSwitzerlandSwedenSpainSloveniaSlovak RepublicPolandNorwayNetherlandsItalyGreeceGermanyFranceFinlandDenmarkCzech RepublicBelgiumAustriaTaiwanSingaporeNew ZealandIndiaHongKongChinaAustralia
Scope 1 Scope 2 Scope 3t CO2e
UK
South Africa
Brazil
USA
Mexico
Switzerl
and
Sweden
Spain
Slovenia
Slovak R
epublic
Poland
Norway
Netherl
ands
Italy
Greece
German
y
France
Finland
Denmark
Czech
Rep
ublic
Belgium
Austria
Singapore
New Zea
land
India
HongKongChina
Australi
a
Carbon Footprint in Individual Countries
Due to the employee intensive service model used to meet utility operations requirements in the US, this country is the greatest emitter of GHG with 11,100 t of CO2e followed by Australia with around 3,000 t of CO2e. Next are India, Greece, Mexico, UK and South Africa with between 2,000 and 3,000 t, followed by Brazil, Switzerland, Fin-land, Germany, and China (between 1,000 and 2,000 t). The emissions of all remaining countries are very low.

| 23
Carbon Footprint
Breakdown of Each Country’s Carbon Footprint by Source
In the US, 51% of the emissions are caused by the consumption of electricity and almost 45% are attributable to road and air travel.
0
20 %
40 %
60 %
80 %
100 %
90 %
70 %
50 %
30 %
10 %
Business air travelRoad travel
Process emissions
Fuels (stationary combustion)
Electricity/District Heating
South
Africa UK
Brazil
USA
Mexico
Switzerl
and
Sweden
Spain
Sloven
ia
Slovac
Repub
lic
Poland
Norway
Netherl
ands
Italy
Greece
German
y
Franc
e
Finlan
d
Denmark
Czech
Repub
lic
Belgium
Austria
Singap
ore
New Zea
land
India
HongK
ong
China
Austra
lia

| 24
Carbon Footprint
Economic Intensity Ratios
Ratio indicators provide information on perfor-mance relative to a business type and can facil-itate comparisons between products and pro-cesses. Intensity ratios express the GHG impact per unit of physical activity or unit of economic output. In order to enable better comparison with other businesses, only scope 1 and scope 2 emissions have been used for the calculation of intensities. The indicators chosen to express GHG intensities are: – Emissions per product – Emissions per employee– Emissions per 10 square meters of floor space – Emissions per USD 100 of turnover.
2007 2008 2009 2010 2011 2012 /13 2013 /14
kg per product 2.3 2.5 2.2 2.1 1.8 1.6 1.6
t per employee 6.5 6.5 6.4 6.0 5.7 5.4 5.1
t per 10 m2 floorspace 1.8 1.5 1.7 1.5 1.6 1.5 1.5
kg CO2e per USD 100 turnover 2.8 2.4 2.3 2.0 1.9 1.7 1.8
The average Group emissions are 1.6 kg per (average) product, 5.1 t per employee, 1.5 t per 100 m2 of floor space and 1.8 kg per USD 100 of turno-ver. The table also shows the values for the previ-ous years.
Over the five year timeframe between 2007 and 2012/13, Landis+Gyr has reduced emissions on a “per turnover” basis from 2.8 kg per USD 100 of turnover (2007) to 1.7 kg per USD 100 (2012/13), or by 40%. In 2013/14 the emissions per turnover have risen slightly to 1.8 kg per USD 100. Compared to 2007, however, this still signifies a reduction by 36%.
The indicator “Emissions per employee” reduced (from 6.5 t in 2007 to 5.1 t in 2013/14). “Emis-sions per product” also noticeably decreased (from 2.3 kg in 2007 to 1.6 kg in 2013/14).

| 25
Carbon Footprint
Economic Intensity Ratios per Region
Looking at emissions per turnover, a strong trend towards a more “carbon-efficient” performance is observable in the Asia-Pacific and North Amer-ica regions (mainly between 2007 – 2011). This is likely in response to a combination of higher sales and increased energy efficiency. In 2013/14, emissions per turnover have risen in three regions mainly due to intensive travel activities resulting from joint business development projects with Toshiba. Compared to last year emissions per product have declined in all regions, with the larg-est decrease in North America (from 3.68 kg CO2e in 2012/13 to 3.13 kg CO2e per product in 2013/14.)
0
2
4
6
8
10
12
North AmericaEurope / Middle East / Africa (EMEA) South AmericaAsia-Pacific
2011 2012/2013 2013/20142010200920082007
t CO2 e /employee

| 26| 26
With its “Greening of Products” initiative Landis+Gyr aim to achieve the highest level of environmental performance for all products and reduce environmental impacts throughout prod-uct life cycles. Its heat meter project shows that considerable savings can be reaped already dur-ing the product development process, for example by choosing the right materials.
The greatest opportunities for reducing the CO2 emissions of heat meters arise during the development and manufacturing processes. No carbon dioxide is emitted during operation because these heat meters run on batteries and most countries have strict regulations for product disposal, recycling and landfilling, so the potential for reducing emissions is also limited at the end of the life cycle.
Building on this knowledge, Landis+Gyr made sure that green criteria were included in the specifi-cation profile for its next generation of heat meters right from the beginning. Environmental aspects therefore already figured prominently in the ini-tial blueprints and in production planning. The materials used and the selection of partners and suppliers were key factors. For example, the cas-ing material for the heat meters was identified as a CO2-relevant material. The plastic material that was ultimately used for the casing had a carbon
footprint of 6.01 kg CO2 equivalent per kg of prod-uct, which was far superior to a different material whose properties were similar but which had a car-bon footprint of 8.35 kg CO2 equivalent per kg. With regard to manufacturing partners, for example the contractors who supplied instruction manuals and packaging materials, a key requirement was that they be located in the same region as the manufac-turing sites. Short transport routes are another way of significantly reducing CO2 emissions.
“The manufacturing phase is critical for reducing CO2 emissions. Green manufacturing is assured over the long term by selecting the right materials in the first place.”
Natali Reimer, Product Management Heat Metering, Landis+Gyr Nuremberg, Germany
Reducing CO2 Emissions Already During the Development Stage


| 28
Table 1: Global energy consumption of Landis+Gyr Group in the fiscal year 2013 /14
Energy consumption L&G
AP
EMEA
NA
SA
Electricity (national grid mix) – daytime [MWh] 27,317 4,239 10,557 10,776 1,746
Electricity (national grid mix) – nighttime [MWh] 1,319 – 1,319 - -
Electricity (renewable sources) [MWh] 293 131 162 – -
Electricity by on-site power generator [MWh] 135 135 – – –
Steam (district heating) [MWh] 2,937 – 2,937 – –
Heavy fuel oil [MWh] 144 – 144 – –
Light fuel oil [MWh] 83 – 83 – –
Emergency power diesel [MWh] 1,608 580 931 97 –
Town gas (natural gas) [MWh] 4,890 881 1,741 2,269 –
LPG (50 / 50) [MWh] 0,5 – – 0,5 –
LPG (70 / 30) [MWh] 184 – – – 184
Process emissions
CO2 [kg] – – – – –
CH4 [kg] 1,472 – 1,472 – –
N2O [kg] – – – – –
HFC [kg] – – – – –
PFC [kg] – – – – –
SF6 [kg] – – – – –
Business Travel (own fleet)
Gasoline consumption [m3] 1,098 3 151 943 –
Diesel consumption [m3] 188 – 184 5 –
CNG consumption [m3] – – – – –
Alcohol consumption [m3] – – – – –
Gasoline (< 1.4 l) [km] 36,205 33,450 2,755 – –
Gasoline (1.4 – 2.0 l) [km] 384,426 41,550 342,876 – –
Gasoline (> 2.0 l) [km] 303,362 134,011 169,351 – –
Diesel (1.4 – 2.0 l) [km] 1,628,628 215,583 1,413,045 – –
Diesel (> 2.0 l) [km] 250,216 9,723 240,493 – –
Truck Diesel (7.5 t) [km] – – – – –
Business Travel (other)
Airplane (short haul) [pkm] 4,296,418 1,585,965 1,110,500 161,712 1,438,241
Airplane (long haul) [pkm] 46,663,844 9,740,449 12,884,035 23,534,368 504,993
Appendix

| 29
Electricity and district heating is the major con-tributor, accounting for 65% of the company’s total emissions. On-site consumption of natural gas and other fuels accounts for an only minor part of overall GHG emissions.
Appendix
Scope 1 2007 2008 2009 2010 2011 2012 /13 2013 /14 Increase
Heavy fuel oil 542 545 32 107 33 42 41
Light fuel oil 81 55 77 45 56 26 22
Emergency power diesel 675 1’031 827 793 729 685 1,222
Natural gas 878 1’054 1’163 1’058 957 941 995
LPG (50/50) 117 64 35 47 37 0 0
LPG (70/30) 24 78 61 37 41 43 43
Process emissions 157 242 304 350 182 52 37
Gasoline consumption 3,130 3,346 3,484 2,958 2,544 3,035 2.580
Diesel consumption 1,198 1,282 561 455 511 489 503
Gasoline: Not for vehicle 0 0 0 0 0 0 6
Gasoline (< 1.4 l) 2 17 21 0 1 6 6
Gasoline (1.4 – 2.0 l) 74 112 122 452 240 58 5
Gasoline (> 2.0 l) 145 202 193 177 131 85 72
Diesel (1.4 – 2.0 l) 67 99 126 160 176 78 76
Diesel (> 2.0 l) 44 29 14 40 45 46 232
CNG (1.4 – 2.0 l) 0 0 0 0 6 0 49
CNG (<1.4l) 0 0 0 0 0 0 22
Truck Diesel (7.5 t) 10 21 37 0 0 0 5
Total (t CO2e) 7,142 8,177 7,057 6,680 5,690 5,585 5,911 5,8 %
Scope 2 2007 2008 2009 2010 2011 2012 /13 2013 /14 Reduction
Electricity 26,916 23,941 22,924 23,251 23,387 22,018 21,638
District heating 847 756 846 725 746 851 849
Total (t CO2e) 27,762 24,698 23,770 23,976 24,133 22,869 22,487 -1,7 %
Scope 3 2007 2008 2009 2010 2011 2012 /13 2013 /14 Increase
Airplane (short haul) 973 1,969 619 566 705 935 847
Airplane (long haul) 4,547 4,668 4,014 4,016 4,532 4,532 5,379
Total (t CO2e) 5,521 6,637 4,633 4,582 5,237 5,467 6,225 13,9 %
By source 2007 2008 2009 2010 2011 2012 /13 2013 /14 Increase
Electricity/ district heating 27,762 24,698 23,770 23,976 24,133 22,869 22,487
Fuels (diesel oil) 1,298 1,631 936 945 818 752 1,292
Fuels (natural gas, LPG) 1,019 1,196 1,258 1,143 1,036 984 1,038
Direct process emissions 157 242 304 350 182 52 37
Road travel 4,669 5,108 4,560 4,242 3,654 3,797 3,545
Air travel 5,521 6,637 4,633 4,582 5,237 5,467 6,225
Total (t CO2e) 40,425 39,512 35,460 35,238 35,060 33,921 34,623 2,1 %
Table 2: Total group emissions, by scope and source (t CO2e)
The table illustrates the contribution of individ-ual energy sources to the global carbon footprint:

| 30
Appendix
Table 3: Carbon footprint for the four regions, 2008–2013 /14
AP EMEA
2008 2009 2010 2011 2012/13 2013/14 2008 2009 2010 2011 2012/13 2013/14
Scope 3 1,161 987 1,094 1,236 1,576 1,435 2,100 1,426 1,371 1,477 1,470 1,704
Scope 2 6,925 5,637 6,126 5,423 4,719 5,000 8,817 8,014 8,117 7,985 8,189 8,232
Scope 1 1,486 1,167 1,094 970 866 707 3,270 2,028 2,023 1,524 1,659 2,391
NA SA
2008 2009 2010 2011 2012/13 2013/14 2008 2009 2010 2011 2012/13 2013/14
Scope 3 1,976 1,821 1,771 2,009 1,949 2,744 1,401 399 348 515 471 342
Scope 2 7,626 9,144 8,580 9,427 8,728 8,033 1,329 975 1,152 1,298 1,234 1221
Scope 1 3,166 3,638 3,530 3,158 3,017 2,770 256 224 33 38 43 43
Table 4: Carbon footprint and percentage contribution of the four regions
Region 2008 2009 2010 2011 2012 /13 2013 /14
t CO2e % t CO2e % t CO2e % t CO2e % t CO2e % t CO2e %
AP 9,571 24.2 % 7,791 22.0 % 8,314 23.6 % 7,629 21.8 % 7,161 21.1 % 7,143 20.6 %
EMEA 14,187 35.9 % 11,468 32.3 % 11,510 32.7 % 10,985 31.3 % 11,318 33.4 % 12,328 35.6 %
NA 12,768 32.3 % 14,603 41.2 % 13,881 39.4 % 14,594 41.6 % 13,694 40.4 % 13,547 39.1 %
SA 2,986 7.6 % 1,598 4.5 % 1,533 4.3 % 1,852 5.3 % 1,748 5.2 % 1,606 4.6 %
Total 39,512 100.0 % 35,461 100.0 % 35,238 100.0 % 35,060 100.0 % 33,921 100.0 % 34,623 100.0 %

| 31
Table 5: Individual greenhouse gases emitted by Landis+Gyr Group in 2013 /14
Scope 1 CO2 (t) CH4 (t) N2O (t) SF6 (t) HFC (t) PFC (t)
Heavy fuel oil 41.21 0.00 0.00 0.00 0.00 0.00
Light fuel oil 22.21 0.00 0.00 0.00 0.00 0.00
Emergency power diesel 1.215,83 0.05 0.02 0.00 0.00 0.00
Natural gas 989,37 0.05 0.01 0.00 0.00 0.00
LPG (50 / 50} 0.11 0.00 0.00 0.00 0.00 0.00
LPG (70 / 30) 41.77 0.04 0.00 0.00 0.00 0.00
Gasoline consumption 2.562.40 0.03 0.06 0.00 0.00 0.00
Diesel consumption 500.31 0.01 0.01 0.00 0.00 0.00
CNG consumption 0.00 0.00 0.00 0.00 0.00 0.00
Alcohol consumption 0.00 0.00 0.00 0.00 0.00 0.00
Gasoline (< 1.4 I) 3.84 0.00 0.00 0.00 0.00 0.00
Gasoline (1.4 – 2.0 I) 52.39 0.00 0.01 0.00 0.00 0.00
Gasoline (> 2.0 I) 55.51 0.00 0.00 0.00 0.00 0.00
Diesel (1.4 – 2.0 I) 192.16 0.00 0.01 0.00 0.00 0.00
Diesel (> 2.0 I) 40.86 0.00 0.00 0.00 0.00 0.00
Truck Diesel (7.5 t) 0.00 0.00 0.00 0.00 0.00 0.00
Process emissions 0.00 0.00 0.00 0.00 0.00 0.00
Scope 2
Electricity (national grid mix) 21.395.77 1.35 0.34 0.00 0.00 0.00
Total 27.113.74 1.52 0.45 0.00 0.00 0.00
Note that not all emissions data is split up into the Kyoto gases. This is why the total in this table differs from the Group’s total emissions.
Appendix

| Contacts
Contacts
Zug, SwitzerlandThomas ZehnderVice PresidentCorporate CommunicationsPhone +41 41 935 60 [email protected]
New York, USAStan MarchSenior Vice PresidentCorporate CommunicationsPhone +1 678 258 [email protected]
Published by:Landis+Gyr AGTheilerstrasse 16301 Zug, Switzerlandwww.landisgyr.com