environmental impacts of small hydropower plants
TRANSCRIPT
Department of Energy and Environment Division of Environmental System Analysis CHALMERS UNIVERSITY OF TECHNOLOGY Gothenburg, Sweden 2014 Report no. 2014:3
Environmental Impacts of Small Hydropower Plants -A Case Study of Borås Energi och Miljö’s Hydropower Plants Master of Science Thesis in the Master Degree Programme, Industrial Ecology MARIA STEINMETZ NATHALIE SUNDQVIST

REPORT NO. 2014:3
Environmental Impacts of Small Hydropower Plants-A Case Study of Borås Energi och Miljö’s Hydropower Plants
Master´s Thesis within the Industrial Ecology Programme
MARIA STEINMETZ & NATHALIE SUNDQVIST
Department of Energy and EnvironmentDivision of Environmental System Analysis
CHALMERS UNIVERSITY OF TECHNOLOGYGothenburg, Sweden 2014
Environmental Impacts of Small Hydropower Plants
-A Case Study of Borås Energi och Miljö’s Hydropower PlantsMARIA STEINMETZ & NATHALIE SUNDQVIST
© Maria Steinmetz & Nathalie Sundqvist, Gothenburg, 2014.
Report No. 2014:3
Department of Energy and EnvironmentDivision of Environmental System AnalysisChalmers University of TechnologySE-412 96 GothenburgSwedenTelephone + 46 (0)31-772 1000
Cover:
[The cover pictures show the four different hydropower plants owned by Borås Energi ochMiljö. The image at the top left is Haby power station and the upper right picture shows Hultapower plant. The picture, which are at the bottom left shows Axelfors power plant and thepicture on the bottom right shows the tube that is at Häggårda power plant. Copyright ©BoråsEnergi och Miljö.]
Chalmers ReproserviceGöteborg, Sweden 2014
Environmental Impacts of Small Hydropower Plants-A Case Study of Borås Energi och Miljö’s Hydropower PlantsMaster’s Thesis within the Industrial Ecology ProgrammeMARIA STEINMETZ & NATHALIE SUNDQVISTDepartment of Energy and EnvironmentDivision of Environmental System AnalysisChalmers University of Technology
Abstract
The use of hydropower in the society has a long history that started more than 2000 years ago.In Sweden, the first hydropower plants used for producing electricity were commissioned inthe 1890s. The major expansion of hydroelectric power in Sweden took place in the 1940s-1970s. Today there are about 2000 hydropower plants in Sweden, accounting for in average45% of the electricity production. Of these 2000 hydropower plants a large majority are socalled small-scale hydropower plants.
The aim of this Master’s thesis is to do an environmental review of the four hydropower plantsowned by Borås Energi och Miljö. The four hydropower plants, Haby, Hulta, Häggårda andAxelfors, were all built and commissioned in the first part of the 1900s in a time when therequirements on the companies to also take the environmental impacts into consideration weresmall. The four plants are small-scale hydropower plants and located in two tributaries toViskan, Slottsån and Häggån and in Ätran. In order to gain knowledge about the environmen-tal impacts hydropower plants can result in, the project started with a literature study wherescientific articles, reports and studies performed on hydropower plants were included. Alsoreports and previous studies performed about the four specific hydropower plants were lookedat. The information from the literature study was used together with the information about thehydropower plants in the analysis to do an environmental review of the hydropower plants.
The analysis showed on how complex the impacts from hydropower on the environment areand that there are both direct and indirect impacts on the species living in the areas aroundthe hydropower plants. The main impacts proved to come from the migration barriers that thehydropower plants constitutes, the changes in the water flow due to the regulation of the plantsand especially the short-term regulation in Haby and Hulta, and the dry riverbeds that the di-version of the water has caused.
i
The literature study included also different measures that can be performed in order to mitigateor avoid the environmental impacts hydropower plants are resulting in. For the hydropowerplants in this case, the focus should be on building fishways to that the species living in thestream can migrate as they could before the construction of the hydropower plants, start a min-imum flow in the original riverbeds so that once existing aquatic life can be restored and startto regulate the water flow so that follows a more natural patter. Borås Energi och Miljö shouldalso perform biotope adjustments to improve spawning sites for the fish.
The thing that mainly has hampered this environmental review was that information about theconditions at the sites before the construction were very limited due to the age of the plants. Ithas, however been possible to conclude that the four hydropower plants owned by Borås Energioch Miljö have effects on the environment. The impacts are possible to avoid or mitigate bydifferent measures. The measures will result in costs but it is the only way to reduce the impactsthe hydropower plants have today.
Keywords: Hydropower plant, environmental impacts, hydrological regime, migration barri-ers
ii
Miljöpåverkan från Småskalig Vattenkraft-En Fallstudie av Borås Energi och Miljö’s VattenkraftverkExamensarbete inom Masterprogrammet Industrial EcologyMARIA STEINMETZ & NATHALIE SUNDQVISTInstitutionen för Energi och MiljöAvdelningen för MiljösystemanalysChalmers Tekniska Högskola
Sammanfattning
Vattenkraftens historia går långt bak i tiden och började redan för över 2000 år sedan. I Sverigebörjade vattenkraften att användas för att producera elektricitet i slutet av 1800-talet. Denstora utbyggnaden av vattenkraften skedde mellan 1940-1970 och idag finns över 2000 vat-tenkraftverk i Sverige. Av de 2000 vattenkraftverken är en stor majoritet så kallade småskaligavattenkraftverk. Tillsammans utgör idag den totala produktionen från vattenkraftverken 45%av elektricitetsproduktionen.
Syftet med examensarbetet var att undersöka vilken påverkan som de fyra vattenkraftverkensom Borås Energi och Miljö äger har på miljön. De fyra vattenkraftverken, Haby, Hulta, Häg-gårda och Axelfors är småskaliga vattenkraftverk och byggdes i början av 1900-talet, under entid då kraven på att undvika skador på miljön var små eller obefintliga. Tre av vattenkraftverkenär belägna i biflöden till Viskan, Slottsån och Häggån. Det fjärde vattenkraftverket är belägeti Ätran. För att få kunskap om de olika effekterna som vattenkraftverk har på miljön startadeprojektet med en litteraturstudie där vetenskapliga artiklar och undersökningar och rapporterom vattenkraftverk studerades. I litteraturstudien inkluderades även rapporter och studier sombehandlade specifikt de områden och miljön där de fyra vattenkraftverken ligger. Informatio-nen från litteraturstudien användes i analysen för att kunna dra slutsatser om den miljöpåverkansom vattenkraftverken resulterar i.
Analysen visade hur komplex frågan om miljöpåverkan från vattenkraftverk är med direkt ochindirekt påverkan på ekosystemen som de fyra vattenkraftverken ligger i. De faktorer somvisade sig ha störst inverkan på miljön var de vandringshinder som vattenkraftverken utgör ochsom hindrar arterna i vattendragen från att röra på sig så som de en gång har kunnat, de än-dringar i vattenflödet som regleringen har orsakat och främst då korttidsregleringen i Haby ochHulta samt de torrfåror som avledningen av vattenflödet från den ursprungliga vattenfåran harorsakat.
iii

Litteraturstudien inkluderade också olika åtgärder som kan genomföras för att undvika ellerminska den miljöpåverkan som vattenkraftverken resulterar i. För vattenkraftverken i det härfallet borde fokus ligga på att bygga fiskvägar så att de arter som lever i vattendragen kan van-dra i vattendragen utan att stöta på konstgjorda hinder, minimiflöden skall släppas i torrfårorså att det liv som en gång fanns där kan komma tillbaka och regleringen av vattenflödena skallanpassas så att de mer följer de naturliga variationerna som finns. Biotopåtgärder bör ocksåutföras så att lekområden för fiskar förbättras.
Det som främst har försvårat arbetet med att avgöra vattenkraftverkens påverkan på miljön äravsaknaden av information om hur förhållandena såg ut runt vattenkraftverken innan de byg-gdes. Det har dock varit möjligt att dra slutsatsen att de fyra vattenkraftverken har påverkan påmiljön och på vad som kan göra för att minska denna påverkan. Åtgärderna kommer medförakostnader men är det enda sättet att minska vattenkraftverkens påverkan. Se Appendix A fören mer utförlig och övergripande sammanfattning på svenska.
iv

Contents
Abstract i
Sammanfattning iii
Contents v
List of Figures ix
List of Tables xi
Acknowledgments xiii
1 Introduction 1
1.1 Hydropower . . . . . . . . . . . . . . . . . . . . . . . . . . . . . . . . . . . . 1
1.2 Directive/Regulations . . . . . . . . . . . . . . . . . . . . . . . . . . . . . . . 6
1.2.1 Water Framework Directive . . . . . . . . . . . . . . . . . . . . . . . 6
1.2.2 Water Activity Investigation . . . . . . . . . . . . . . . . . . . . . . . 7
1.2.3 Natura 2000 . . . . . . . . . . . . . . . . . . . . . . . . . . . . . . . . 7
1.3 Project . . . . . . . . . . . . . . . . . . . . . . . . . . . . . . . . . . . . . . . 8
1.4 Company . . . . . . . . . . . . . . . . . . . . . . . . . . . . . . . . . . . . . 9
1.5 Purpose . . . . . . . . . . . . . . . . . . . . . . . . . . . . . . . . . . . . . . 9
1.6 Problem Formulation . . . . . . . . . . . . . . . . . . . . . . . . . . . . . . . 10
1.7 Boundaries . . . . . . . . . . . . . . . . . . . . . . . . . . . . . . . . . . . . 10
2 Method 12
3 Literature Review 14
3.1 Impacts . . . . . . . . . . . . . . . . . . . . . . . . . . . . . . . . . . . . . . 14
3.1.1 General Information . . . . . . . . . . . . . . . . . . . . . . . . . . . 14
v
CONTENTS
3.1.2 Hydrological Regimes . . . . . . . . . . . . . . . . . . . . . . . . . . 16
3.1.2.1 Natural Water Flow . . . . . . . . . . . . . . . . . . . . . . 17
3.1.2.2 Hydropower Plants and the Hydrological Regime . . . . . . 19
3.1.2.3 Classification . . . . . . . . . . . . . . . . . . . . . . . . . 22
3.1.3 Sedimentation . . . . . . . . . . . . . . . . . . . . . . . . . . . . . . 23
3.1.4 Water Quality . . . . . . . . . . . . . . . . . . . . . . . . . . . . . . . 25
3.1.5 Migrations Barriers . . . . . . . . . . . . . . . . . . . . . . . . . . . . 28
3.1.6 Greenhouse Gas Emissions . . . . . . . . . . . . . . . . . . . . . . . . 32
3.1.7 Biodiversity . . . . . . . . . . . . . . . . . . . . . . . . . . . . . . . . 40
3.1.7.1 Introduction to Biodiversity and Hydropower . . . . . . . . . 40
3.1.7.2 The Riparian Zone . . . . . . . . . . . . . . . . . . . . . . . 42
3.1.7.3 Aquatic Species . . . . . . . . . . . . . . . . . . . . . . . . 43
3.2 Mitigation Actions . . . . . . . . . . . . . . . . . . . . . . . . . . . . . . . . 46
3.2.1 Dam Removal . . . . . . . . . . . . . . . . . . . . . . . . . . . . . . 46
3.2.2 Flow Regulations . . . . . . . . . . . . . . . . . . . . . . . . . . . . . 47
3.2.3 Sedimentation Measures . . . . . . . . . . . . . . . . . . . . . . . . . 49
3.2.4 Biotope Adjustments . . . . . . . . . . . . . . . . . . . . . . . . . . . 49
3.2.5 Fishways . . . . . . . . . . . . . . . . . . . . . . . . . . . . . . . . . 50
3.2.5.1 Examples of Fishways . . . . . . . . . . . . . . . . . . . . . 51
3.2.6 Fish Plantations . . . . . . . . . . . . . . . . . . . . . . . . . . . . . . 53
3.2.7 Fish Friendly Turbines . . . . . . . . . . . . . . . . . . . . . . . . . . 53
4 Case Study 55
4.1 Summary and History About the Hydropower Plants . . . . . . . . . . . . . . 57
4.1.1 Haby . . . . . . . . . . . . . . . . . . . . . . . . . . . . . . . . . . . 57
4.1.2 Hulta . . . . . . . . . . . . . . . . . . . . . . . . . . . . . . . . . . . 59
4.1.3 Hyltenäs . . . . . . . . . . . . . . . . . . . . . . . . . . . . . . . . . 62
4.1.4 Häggårda . . . . . . . . . . . . . . . . . . . . . . . . . . . . . . . . . 63
4.1.5 Axelfors . . . . . . . . . . . . . . . . . . . . . . . . . . . . . . . . . . 65
4.2 Ecosystem in the area . . . . . . . . . . . . . . . . . . . . . . . . . . . . . . . 66
4.2.1 Viskan . . . . . . . . . . . . . . . . . . . . . . . . . . . . . . . . . . 66
4.2.2 Slottsån . . . . . . . . . . . . . . . . . . . . . . . . . . . . . . . . . . 67
4.2.2.1 Potential to Reach Good Ecological Status . . . . . . . . . . 70
4.2.3 Hyltenäsån . . . . . . . . . . . . . . . . . . . . . . . . . . . . . . . . 70
vi
CONTENTS
4.2.3.1 Potential to Reach Good Ecological Status . . . . . . . . . . 70
4.2.4 Häggån . . . . . . . . . . . . . . . . . . . . . . . . . . . . . . . . . . 70
4.2.4.1 Potential to Reach Good Ecological Status . . . . . . . . . . 72
4.2.5 Ätran . . . . . . . . . . . . . . . . . . . . . . . . . . . . . . . . . . . 73
4.2.5.1 Potential to Reach Good Ecological Status . . . . . . . . . . 74
4.3 Comparison and Compilation . . . . . . . . . . . . . . . . . . . . . . . . . . . 74
5 Analysis 76
5.1 Hydrological Regime . . . . . . . . . . . . . . . . . . . . . . . . . . . . . . . 76
5.1.1 Haby & Hulta . . . . . . . . . . . . . . . . . . . . . . . . . . . . . . . 76
5.1.2 Häggårda . . . . . . . . . . . . . . . . . . . . . . . . . . . . . . . . . 79
5.1.3 Axelfors . . . . . . . . . . . . . . . . . . . . . . . . . . . . . . . . . . 82
5.1.4 Compilation of Hydrological Review . . . . . . . . . . . . . . . . . . 84
5.2 Sedimentation . . . . . . . . . . . . . . . . . . . . . . . . . . . . . . . . . . . 86
5.3 Water Quality . . . . . . . . . . . . . . . . . . . . . . . . . . . . . . . . . . . 86
5.4 Migration Barriers . . . . . . . . . . . . . . . . . . . . . . . . . . . . . . . . 88
5.5 Greenhouse Gas Emissions . . . . . . . . . . . . . . . . . . . . . . . . . . . . 91
5.6 Biodiversity . . . . . . . . . . . . . . . . . . . . . . . . . . . . . . . . . . . . 93
5.6.1 Slottsån . . . . . . . . . . . . . . . . . . . . . . . . . . . . . . . . . . 93
5.6.2 Häggån . . . . . . . . . . . . . . . . . . . . . . . . . . . . . . . . . . 93
5.6.3 Ätran . . . . . . . . . . . . . . . . . . . . . . . . . . . . . . . . . . . 94
5.6.4 Compilation of Biodiversity Review . . . . . . . . . . . . . . . . . . . 94
5.7 Compilation of the Analysis . . . . . . . . . . . . . . . . . . . . . . . . . . . 96
6 Comparisons 98
6.1 Tranås Energi . . . . . . . . . . . . . . . . . . . . . . . . . . . . . . . . . . . 98
6.2 Falkenberg Energi . . . . . . . . . . . . . . . . . . . . . . . . . . . . . . . . . 102
6.3 Nordisk Elmix . . . . . . . . . . . . . . . . . . . . . . . . . . . . . . . . . . . 104
7 Mitigation Actions and Recommendations 105
7.1 Dam Removal . . . . . . . . . . . . . . . . . . . . . . . . . . . . . . . . . . . 105
7.2 Flow Regulations . . . . . . . . . . . . . . . . . . . . . . . . . . . . . . . . . 106
7.3 Sedimentation . . . . . . . . . . . . . . . . . . . . . . . . . . . . . . . . . . . 107
7.4 Biotope Adjustments . . . . . . . . . . . . . . . . . . . . . . . . . . . . . . . 107
7.5 Adapted Intake Screens . . . . . . . . . . . . . . . . . . . . . . . . . . . . . . 108
vii
CONTENTS
7.6 Fishways . . . . . . . . . . . . . . . . . . . . . . . . . . . . . . . . . . . . . 108
7.7 Fish Plantations . . . . . . . . . . . . . . . . . . . . . . . . . . . . . . . . . . 112
7.8 Fish Friendly Turbines . . . . . . . . . . . . . . . . . . . . . . . . . . . . . . 112
8 Discussion 113
8.1 Literature Review . . . . . . . . . . . . . . . . . . . . . . . . . . . . . . . . . 113
8.2 Analysis . . . . . . . . . . . . . . . . . . . . . . . . . . . . . . . . . . . . . . 114
8.3 Environmental Work . . . . . . . . . . . . . . . . . . . . . . . . . . . . . . . 114
8.4 Recommendations . . . . . . . . . . . . . . . . . . . . . . . . . . . . . . . . . 115
9 Conclusions 117
10 Future Work 118
Bibliography 119
Appendices 132Appendix A - Övergripande Sammanfattning . . . . . . . . . . . . . . . . . . . . . 139
Appendix B - Interview with Tranås Energi . . . . . . . . . . . . . . . . . . . . . . 139
Appendix C - Interview with Falkenberg Energi . . . . . . . . . . . . . . . . . . . . 141
viii
List of Figures
1.1 General components of a hydro power plant. The figure is based on the originalpicture from (Gatte and Kadhim, 2012) . . . . . . . . . . . . . . . . . . . . . 3
1.2 Francis turbine (Sempler, 2009). . . . . . . . . . . . . . . . . . . . . . . . . . 5
1.3 Kaplan turbine (Sempler, 2009). . . . . . . . . . . . . . . . . . . . . . . . . . 5
1.4 Pelton turbine (Sempler, 2009). . . . . . . . . . . . . . . . . . . . . . . . . . . 6
3.1 Strongly identified impacts from hydropower plants. (European Small Hy-dropower Association (ESHA), 2009) . . . . . . . . . . . . . . . . . . . . . . 15
4.1 Schematic orientation map. Översiktlig orienteringskarta ©Länsstyrelsen Hal-lands län (Länsstyrelsen Hallands län, n.d. ). . . . . . . . . . . . . . . . . . . . 56
4.2 Haby hydropower plant. Upper left: the swelling tower, upper right: headrace,bottom left: dam construction and bottom right: tube (Seger, F., 2014, Habyhydropower plant [photography]). . . . . . . . . . . . . . . . . . . . . . . . . 58
4.3 Hulta hydropower plant. Upper left: hydropower station, bottom left: cleaningracks at the turbine intake and right: dam construction. (Steinmetz, M., 2014,Hulta hydropower plant [photography]) . . . . . . . . . . . . . . . . . . . . . 60
4.4 The water levels per week in Öresjön between 2008-2013. Height indicatorsrefer to a local measure in meter based on a point in the area (Borås Energi ochMiljö, 2013b). . . . . . . . . . . . . . . . . . . . . . . . . . . . . . . . . . . . 61
4.5 The water levels per week in Tolken between 2004-2013. Height indicatorsrefer to a local measure in meter based on a point in the area (Borås Energi ochMiljö, 2013b). . . . . . . . . . . . . . . . . . . . . . . . . . . . . . . . . . . 61
4.6 Hyltenäs dam construction (Steinmetz, M., 2014, Hyltenäs regulation dam[photography]) . . . . . . . . . . . . . . . . . . . . . . . . . . . . . . . . . . 62
4.7 Häggårda hydropower plant. Headrace leading to intake to tube. (Steinmetz,M.,2014, Häggårda hydropower plant [photography]) . . . . . . . . . . . . . . . . 63
ix
LIST OF FIGURES
4.8 The water levels per week in Frisjön between 2004-2013. Height indicatorsrefer to a local measure in meter based on a point in the area (Borås Energi ochMiljö, 2013b). . . . . . . . . . . . . . . . . . . . . . . . . . . . . . . . . . . . 64
4.9 Axelfors hydropower plant. Dam construction and tube. Spillways are closedand no water is passing by the turbine. (Seger, F., 2014, Axelfors hydropowerplant [photography]) . . . . . . . . . . . . . . . . . . . . . . . . . . . . . . . 65
5.1 Electricity production in Haby and Hulta, December 2013 (Borås Energi ochMiljö, n.d. g). . . . . . . . . . . . . . . . . . . . . . . . . . . . . . . . . . . . 77
5.2 Electricity production in Haby and Hulta, May 2013 (Borås Energi och Miljö,n.d. g) . . . . . . . . . . . . . . . . . . . . . . . . . . . . . . . . . . . . . . . 78
5.3 Electricity production in Haby and Hulta, December 2012 (Borås Energi ochMiljö, n.d. g). . . . . . . . . . . . . . . . . . . . . . . . . . . . . . . . . . . . 78
5.4 Electricity production in Haby and Hulta, May 2012 (Borås Energi och Miljö,n.d. g). . . . . . . . . . . . . . . . . . . . . . . . . . . . . . . . . . . . . . . 79
5.5 Electricity production in Haby and Hulta 2012 & 2013 (Borås Energi ochMiljö, n.d. g). . . . . . . . . . . . . . . . . . . . . . . . . . . . . . . . . . . . 79
5.6 Electricity production in Häggårda, October 2013 (Borås Energi och Miljö,n.d. g). . . . . . . . . . . . . . . . . . . . . . . . . . . . . . . . . . . . . . . . 80
5.7 Electricity production in Häggårda, July 2013 (Borås Energi och Miljö, n.d. g). 81
5.8 Electricity production in Häggårda, October 2012 (Borås Energi och Miljö,n.d. g). . . . . . . . . . . . . . . . . . . . . . . . . . . . . . . . . . . . . . . . 81
5.9 Electricity production in Häggårda, July 2012 (Borås Energi och Miljö, n.d. g). 81
5.10 Electricity production in Häggårda 2012 & 2013 (Borås Energi och Miljö, n.d. g). 82
5.11 Electricity production in Axelfors, June 2013 (Borås Energi och Miljö, n.d. g). 82
5.12 Electricity production in Axelfors, December 2013 (Borås Energi och Miljö,n.d. g). . . . . . . . . . . . . . . . . . . . . . . . . . . . . . . . . . . . . . . . 83
5.13 Electricity production in Axelfors, June 2012 (Borås Energi och Miljö, n.d. g). . 83
5.14 Electricity production in Axelfors, December 2012 (Borås Energi och Miljö,n.d. g). . . . . . . . . . . . . . . . . . . . . . . . . . . . . . . . . . . . . . . . 83
5.15 Electricity production in Axelfors 2012 & 2013 (Borås Energi och Miljö, n.d. g). 84
x
List of Tables
3.1 Hydrological regime characteristics . . . . . . . . . . . . . . . . . . . . . . . 18
3.2 The classification for the regulation amplitude (Naturvårdsverket, 2008). . . . . 23
3.3 Classification for regulation degree (Naturvårdsverket, 2008). . . . . . . . . . . 23
3.4 Summary of GHG-emissions from different LCA studies . . . . . . . . . . . . 39
3.5 Life cycle emissions from different energy sources (Akella et al., 2009) . . . . 39
4.1 Haby in numbers (Borås Energi och Miljö, n.d. b). . . . . . . . . . . . . . . . 59
4.2 Hulta in numbers (Borås Energi och Miljö, n.d. b). . . . . . . . . . . . . . . . 62
4.3 Häggårda in numbers (Borås Energi och Miljö, n.d. c). . . . . . . . . . . . . . 65
4.4 Axelfors in numbers (Borås Energi och Miljö, n.d. a). . . . . . . . . . . . . . . 66
5.1 The losses of eel when passing the turbines at different flows (Leonardsson, 2012) 89
5.2 Compiled information about the biodiversity. . . . . . . . . . . . . . . . . . . 96
6.1 Short information about Forsnäs and Olstorp . . . . . . . . . . . . . . . . . . . 99
6.2 Tranås Energi’s environmental work . . . . . . . . . . . . . . . . . . . . . . . 100
6.3 Short information about Herting power plant . . . . . . . . . . . . . . . . . . . 102
6.4 Shows the approximate size of the CO2-emissions that would have been re-leased if the electricity produced from the hydropower plants with electric-ity from Nordisk elmix. Information about the produced electricity at the hy-dropower plants is from (Borås Energi och Miljö, 2013b). . . . . . . . . . . . . 104
7.1 Total revenue from the last five years for the four hydropower plants (A Rieck2014, pers. comm., 5 May) . . . . . . . . . . . . . . . . . . . . . . . . . . . . 105
7.2 Estimations of the costs for the installation of fishways (Fredberg, n.d. ) . . . . 109
xi

xii

Acknowledgments
This master’s thesis work has been carried out at Borås Energi och Miljö in Borås during thespring 2014.
First of all we want to thank our supervisor Fredrik Seger and Elenor Loyd at Borås Energioch Miljö, for coming up with the project idea and for giving us the opportunity to do this mas-ter’s thesis. We also want to thank Miljöbron, for the help to mediate the project and for havinginteresting education occasions during the spring. We especially want to express our thanks toSandra Johansson at Miljöbron who has been our contact person and helped and supported usthrough the project.
We also want to express our great gratitude to Anna Rieck at Borås Energi och Miljö. Weare deeply thankful for your help and that you always had patience with our questions andhelped us navigate through all the information. Also thanks to Kjell-Åke Matsson at BoråsEnergi och Miljö, who guided us at the study visit at the hydropower plants and provided muchinformation about the sites. We also want to thank all other employees at Borås Energi ochMiljö for welcoming and helping us when needed.
Also many thanks to our examiner and supervisor, Sverker Molander at Chalmers Universityof Technology. Thanks for all your help, guidance and for taking your time for interesting dis-cussions throughout the project.
Many thanks also to Elina Gahm at Tranås Energi and Jens Melin at Falkenberg Energi fortaking your time to answer our questions.
Finally, we also want to thank our families, friends and of course our supportive boyfriendsfor their eternal support and encouragement.
Maria Steinmetz & Nathalie SundqvistGothenburg, June 12, 2014.
xiii
Chapter 1
Introduction
This project aim to look at the environmental impacts related to the operation of Borås Energioch Miljö’s four hydropower plants. What are the possible environmental impacts and whichare the options available to mitigate the impacts or avoid them? The following chapter will givean introduction to the concept of hydropower, the history, the technology and the hydropower’ssituation in today’s society. It should also give an introduction to the project itself including thepurpose and the boundaries.
1.1 Hydropower
The use of hydropower has a long history, a history that goes far beyond the use of hydropowerfor electrification. The Greeks used the power from water for more than 2000 years ago forgrinding wheat into flour. It has also been used for irrigation systems, watermills and sawmills.In 1870 the first hydropower plants used for electricity production was installed in Cragside,Rothbury, England. But the breakthrough did not come until 12 years later when the turbinewas connected to the generator. The use of hydropower for making electricity proved to bemuch more stable than other ways of producing electricity at the time. This resulted in an in-crease of the installation of small- and middle-sized hydropower plants. By 2008 the installedcapacity from hydropower in the world contributed with 16% of the total electricity production(Kumar et al., 2012).
The first hydropower plants in Sweden were built in the 1880s but it was between the 1940s-1970s the major expansion of the hydropower in Sweden occurred. Today the installed capacityfrom hydropower plants is about 16 200 MW spread over about 2000 hydropower plants. The200 biggest plants, with an installed power above 10 MW, contribute with about 94% of thetotal production. The hydropower plants lying in the range 1.5 MW-10 MW contributes with3.9 % of the total production. The hydropower plants with an installed power of less than 1.5MW are the largest group of hydropower plants in Sweden. Around 1700 plants in Sweden
1
CHAPTER 1. INTRODUCTION
have an installed power of less than 1.5 MW and together they produce about 2.6% of the totalelectricity production from hydropower (Statens Offentliga Utredningar, 2013).
The hydropower is today an important part of the electricity production in Sweden and notonly as a producer of electricity but also as a possibility to use it as a regulating- and balancingpower, by storing the water in reservoirs, the water can be saved and used for electricity pro-duction when there is demand for it. The production and the possibility to store water fluctuatedue to the changes in the weather conditions. In the last 10 years the hydropower has producedon average 66 TWh, which is about 45% of the total production in Sweden (Statens OffentligaUtredningar, 2013).
There are three main categories in which the different types of hydropower plants can be di-vided into, run of river, storage hydropower and pumped storage. The run of river could have asmaller storage, which is big enough to store water for some hours or a day but the amount ofelectricity it produces depends generally on the flow of water available at the time. This resultin that it is hard to control the amount of electricity produced and when it is produced, and itdepends instead on the conditions in the water flow (Kumar et al., 2012). The flow dependson precipitation and runoff and has often daily, monthly and seasonal variations (InternationalEnergy Agency, 2011). Run of river plants have in general lower environmental impact thanstorage hydropower plants of similar size (Kumar et al., 2012).
Storage hydropower consists of a reservoir used for controlling the flow through the turbines.The reservoir will decrease the dependence on the natural water flow and level out the variabil-ity. The generating stations are situated at the dam toe or further down streams. The stationsare linked with the reservoir through pipelines or tunnels (Kumar et al., 2012). Generally thedams used are artificial but when the conditions allows, natural existing lakes can be used asreservoirs (International Energy Agency, 2011).
A pumped storage hydropower plant on the other hand, is not a way of producing energy but away to store the energy. When not so much electricity is needed the water is pumped up from alower reservoir to a higher reservoir. At the time for an increased need of electricity the storedwater can be used to produce electricity (Kumar et al., 2012).
Another kind of hydropower technology, which is rather new, is the water current turbines,also called hydrokinetic or in-stream turbines. This technology has received a growing interestin many parts of the world. These turbines can be used to produce electricity from free flowingwater in a river or stream and it do not rely upon a head to produce electricity. No dams ormajor construction is therefore needed to extract the energy (Sørnes, 2010).
2
1.1. HYDROPOWER
Another way to divide and classify different kinds of hydropower plants can be according to thesize. However, there is no existing general standard on how to classify the hydropower plantsafter the size today (Kumar et al., 2012). Different ways are used to classify them and also theview on which size of the plant that should be seen as small differs. One way to classify themis to order them after the size of the head. For example could heads over 300 m be said to behigh-heads, head between 30-300 m be medium-heads and heads below 30 m could be seenas low-head. But there is no general standard and what is seen as low or high differs betweencountries. Another way to structure the hydropower plants after size is to look at the installedcapacity. Also here, the distinction in what should be considered as small or large varies be-tween the countries and there is a wide range. In China, for example is hydropower with aninstalled capacity of below 50 MW considered as small-scale (International Energy Agency,2011). In Europe on the other hand is the general definition for small hydropower, a plantwith an installed effect of up to 10 MW (European Small Hydropower Association (ESHA),2014). For Sweden the limit for large-scale hydropower is considered to be above 10 MW(Bergengren et al., 2013). However, there are few different perceptions about what should beconsidered as small-scale hydropower in Sweden and it is possible to find classifications in theliterature where only hydropower plants with an installed capacity below 1.5 MW should beseen as small-scale.
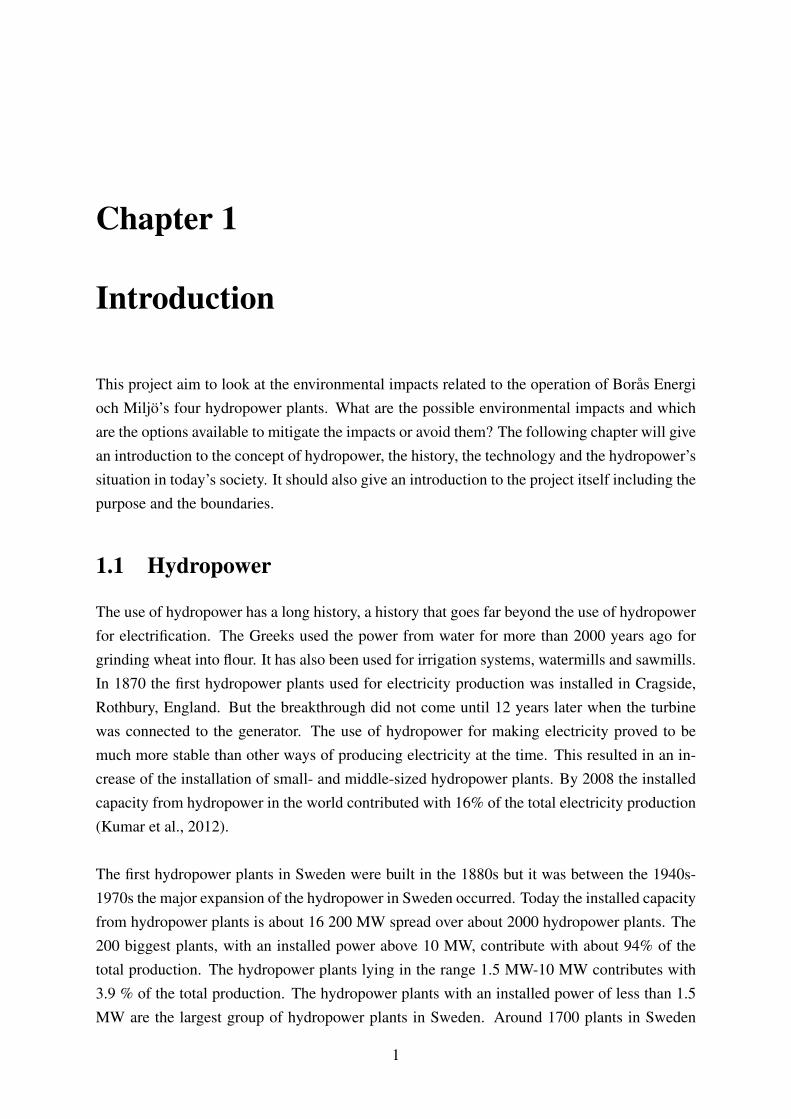
Generally it can be said that hydropower consists of different basic components, see figure1.1.
Figure 1.1: General components of a hydro power plant. The figure is based on the originalpicture from (Gatte and Kadhim, 2012)
3
CHAPTER 1. INTRODUCTION
This picture is mainly valid for storage hydro but may also be consistent with the run of riverwhen disregarding the dam construction. For the storage hydro there first is a dam constructionwith intake and spillways. Before entering the intake there will be an intake screen. This intakescreen has the task to clear away garbage such as branches that can cause problems in the tur-bine. The screen will also protect so that the fish does not come through and can be damagedby the turbine. The intake screen consists of a grid, the distance between each parallel elementin the grid is called the grid width. Different sizes of the grid width affect what can be releasedthrough it. At many hydropower plants the intake screens are occasionally cleaned. This isdone by a device similar to rakes. The rakes, which can be manually or mechanical, gatherswhat have been stuck on the screens for example levees, branches but also fish (Calles et al.,2013).
Further, now also applicable for run of rivers, the intake whit its intake screen, leads to atake-off channel that is called headrace, which directs all or a part of the water in the stream tothe power plant. At the end of the headrace a settling tank is located, called the forebay tank.This tank helps to slow down the water and having particles to settle down, this to counteractthat all particles go through the turbines where it can make damage. From the forebay tankthe water continue in a closed pipe, commonly called a penstock. This pipe is leading the wa-ter in to the powerhouse where the turbine(s) and the generator are located. After the waterhas passed through the turbine it is returned to the river via a channel called tailrace. Worthmentioning, however, is that there are different variations of how a hydropower plant couldbe constructed and that the use of the different components may differ (Gatte and Kadhim,2012; Packer, 2011). The magnitude of the environmental impacts is also depending on whichcomponents that is included and how the power plants are constructed. Another thing worth tomention, is that it does not normally flow so much water in the natural riverbed, which can bemisleading in the picture. This is only valid when the spillways are open due to regulations.
To extract electricity from hydropower different kind of energy is used. First, there is thepotential energy, this energy is available upstream the power plant due to the water mass andthe head. This potential energy will then be converted to kinetic energy, which is the energyin the falling water. The pressure from the water makes the turbines to rotate and mechanicalenergy can be converted. The mechanical power can then be used to produce electricity in gen-erators. The possible amount of power to produce is proportional to the head times the flow. Itcan in a more general formula be described as:
P = η∗ ρ∗g∗Q∗H [W ]
In the formula is P the mechanical power, η is the efficiency of the turbine, ρ [kg/m3] is thedensity of the water, g [m/s2] is the acceleration of the water due to the gravity, Q [m3/s] is the
4
1.1. HYDROPOWER
flow of the water through the turbine and H [m] is the head (Paish, O. 2002).
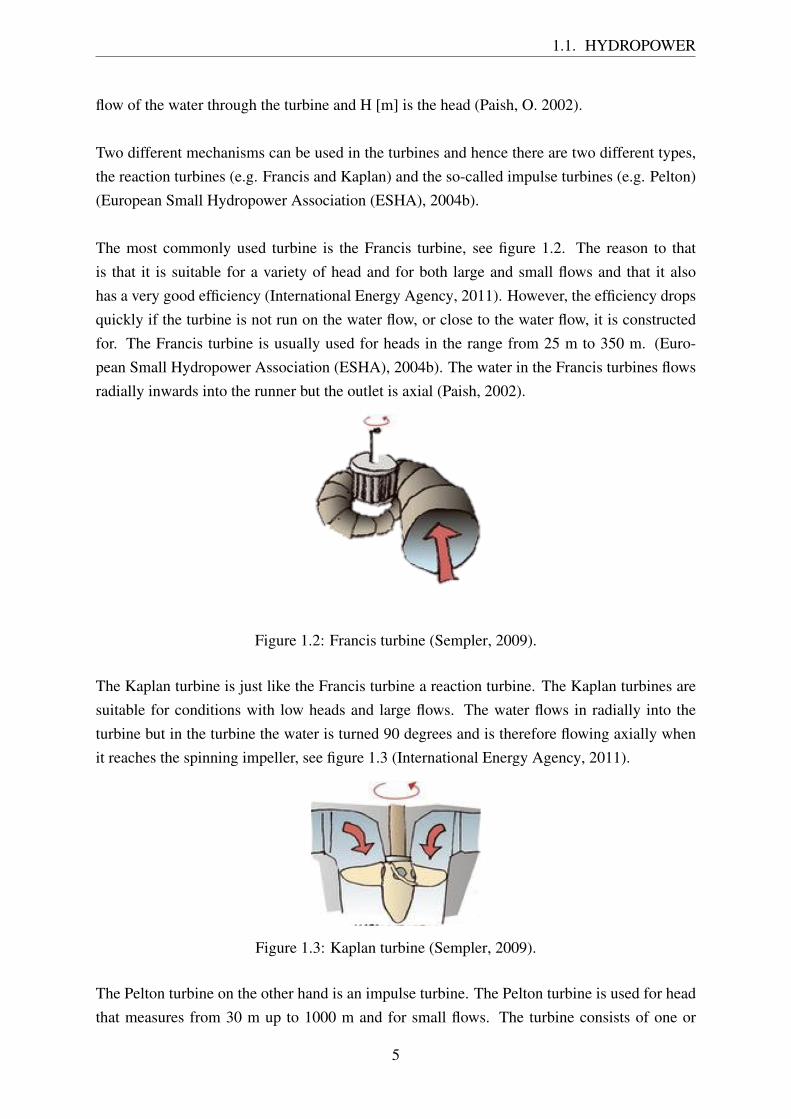
Two different mechanisms can be used in the turbines and hence there are two different types,the reaction turbines (e.g. Francis and Kaplan) and the so-called impulse turbines (e.g. Pelton)(European Small Hydropower Association (ESHA), 2004b).
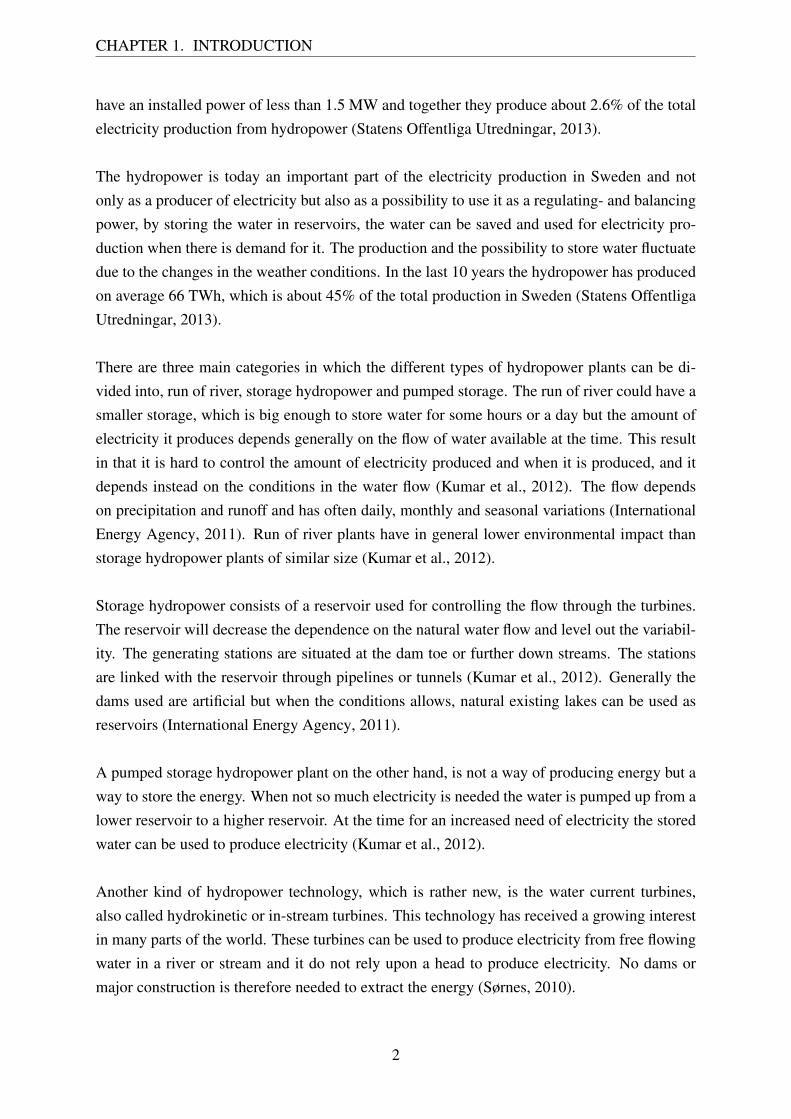
The most commonly used turbine is the Francis turbine, see figure 1.2. The reason to thatis that it is suitable for a variety of head and for both large and small flows and that it alsohas a very good efficiency (International Energy Agency, 2011). However, the efficiency dropsquickly if the turbine is not run on the water flow, or close to the water flow, it is constructedfor. The Francis turbine is usually used for heads in the range from 25 m to 350 m. (Euro-pean Small Hydropower Association (ESHA), 2004b). The water in the Francis turbines flowsradially inwards into the runner but the outlet is axial (Paish, 2002).
Figure 1.2: Francis turbine (Sempler, 2009).
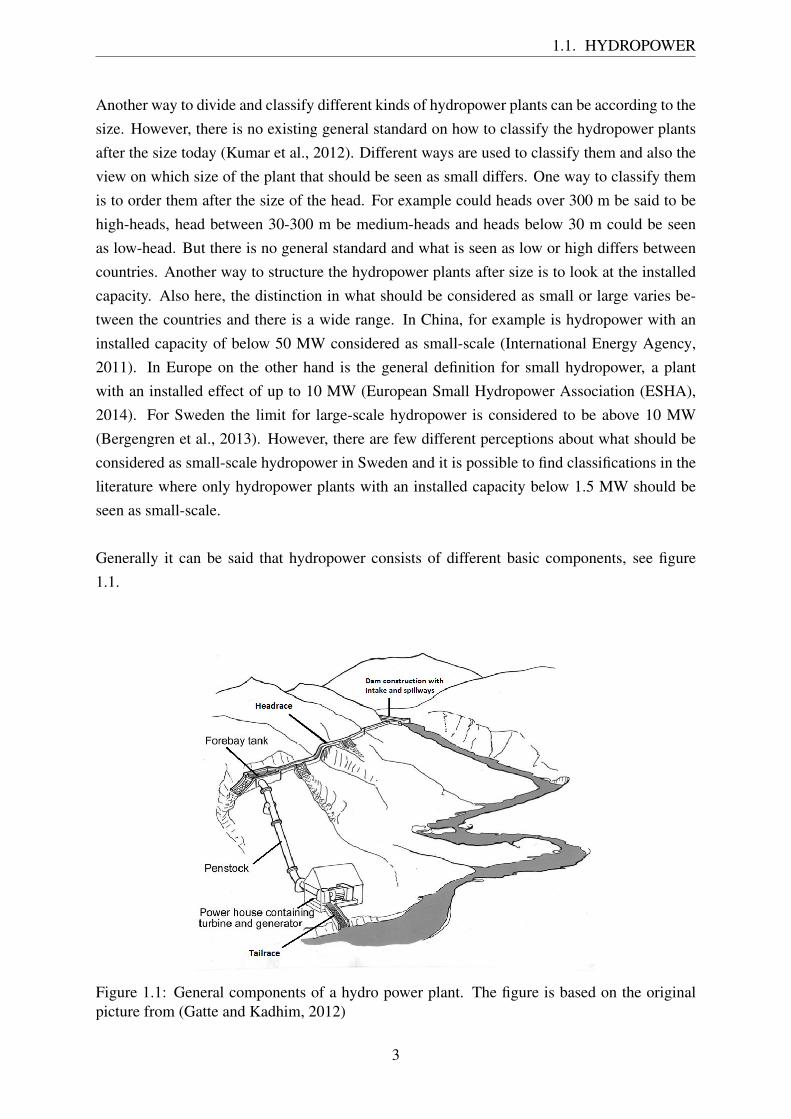
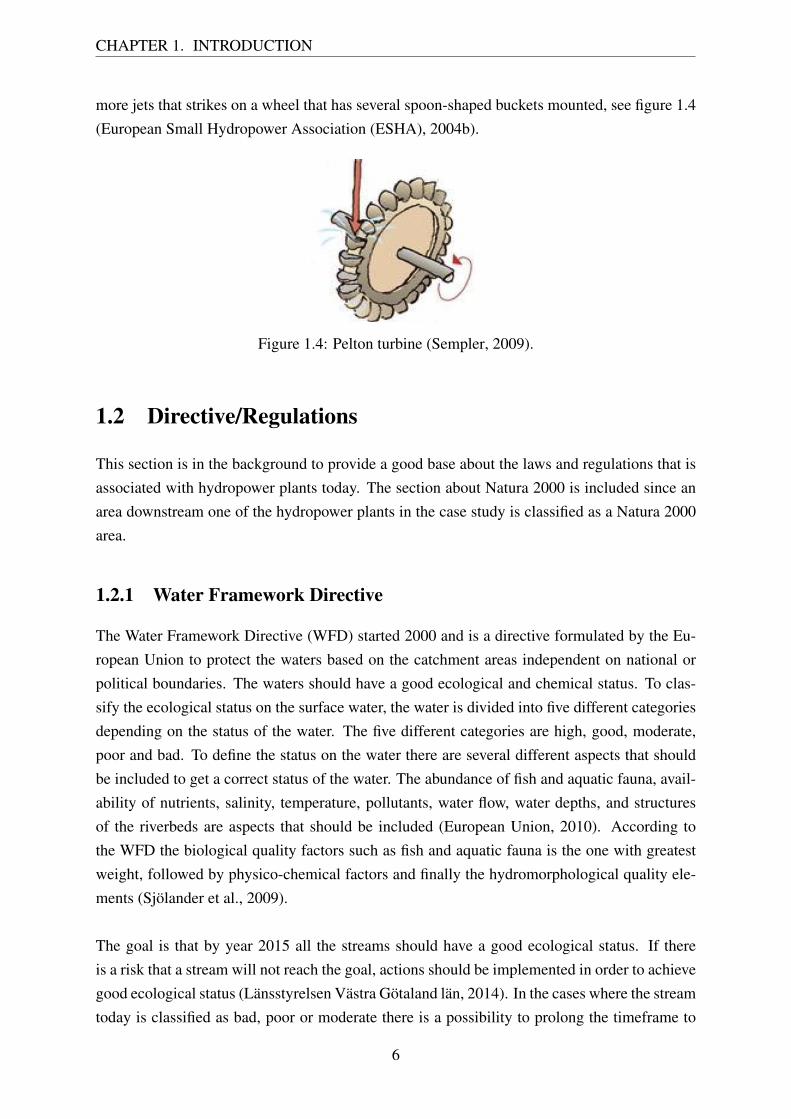
The Kaplan turbine is just like the Francis turbine a reaction turbine. The Kaplan turbines aresuitable for conditions with low heads and large flows. The water flows in radially into theturbine but in the turbine the water is turned 90 degrees and is therefore flowing axially whenit reaches the spinning impeller, see figure 1.3 (International Energy Agency, 2011).
Figure 1.3: Kaplan turbine (Sempler, 2009).
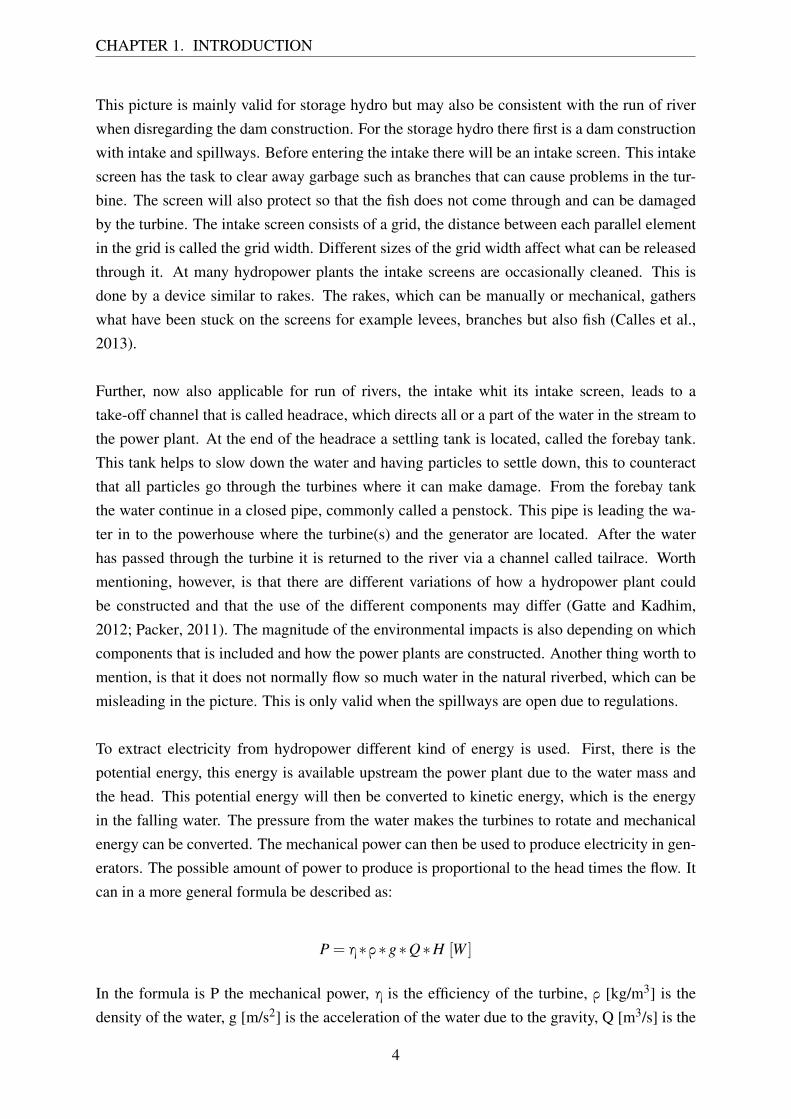
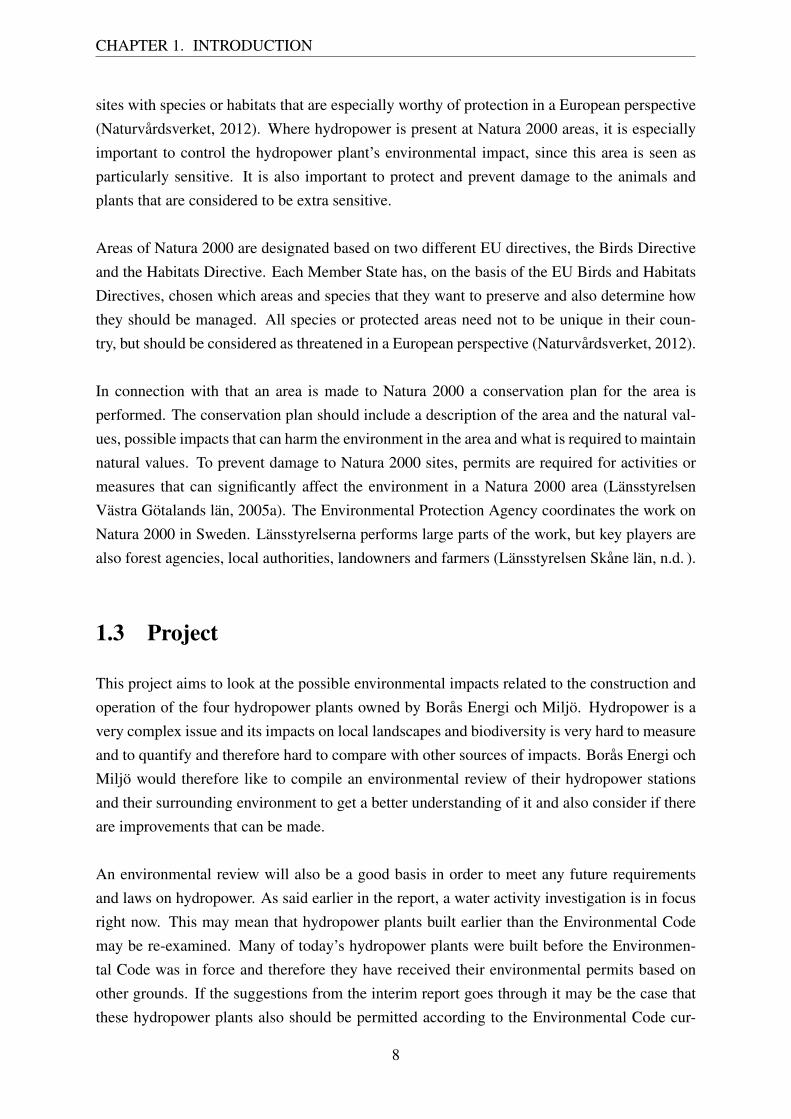
The Pelton turbine on the other hand is an impulse turbine. The Pelton turbine is used for headthat measures from 30 m up to 1000 m and for small flows. The turbine consists of one or
5
CHAPTER 1. INTRODUCTION
more jets that strikes on a wheel that has several spoon-shaped buckets mounted, see figure 1.4(European Small Hydropower Association (ESHA), 2004b).
Figure 1.4: Pelton turbine (Sempler, 2009).
1.2 Directive/Regulations
This section is in the background to provide a good base about the laws and regulations that isassociated with hydropower plants today. The section about Natura 2000 is included since anarea downstream one of the hydropower plants in the case study is classified as a Natura 2000area.
1.2.1 Water Framework Directive
The Water Framework Directive (WFD) started 2000 and is a directive formulated by the Eu-ropean Union to protect the waters based on the catchment areas independent on national orpolitical boundaries. The waters should have a good ecological and chemical status. To clas-sify the ecological status on the surface water, the water is divided into five different categoriesdepending on the status of the water. The five different categories are high, good, moderate,poor and bad. To define the status on the water there are several different aspects that shouldbe included to get a correct status of the water. The abundance of fish and aquatic fauna, avail-ability of nutrients, salinity, temperature, pollutants, water flow, water depths, and structuresof the riverbeds are aspects that should be included (European Union, 2010). According tothe WFD the biological quality factors such as fish and aquatic fauna is the one with greatestweight, followed by physico-chemical factors and finally the hydromorphological quality ele-ments (Sjölander et al., 2009).
The goal is that by year 2015 all the streams should have a good ecological status. If thereis a risk that a stream will not reach the goal, actions should be implemented in order to achievegood ecological status (Länsstyrelsen Västra Götaland län, 2014). In the cases where the streamtoday is classified as bad, poor or moderate there is a possibility to prolong the timeframe to
6

1.2. DIRECTIVE/REGULATIONS
reach the goal or modify the goal that should be reached (Statens Offentliga Utredningar, 2013).In a report from Hav- och vattenmyndigheten from year 2012 they are concluding after having ameeting with a dialogue with relevant authorities, environmental organizations and hydropowercompanies, that water regulation and reservoirs are the main obstacles to reach the goal in thewater framework directive (Havs- och vattenmyndigheten, 2012).
1.2.2 Water Activity Investigation
The Swedish Government decided in April 2012 to appoint a special commission with the mis-sion to review the rules on water activities in the Environmental Code and the Law on specialprovisions for water operations. This becomes known as the Water Activity Investigation. Theinvestigation suggests how to ensure that the facilities that are not permitted under the Environ-mental Code should be designed and operated in such a way that the Environmental Code aretaken into account and that the requirements of EU laws with respect to water quality and theeffect on animal and plant life will be met (Statens Offentliga Utredningar, 2013). Today only2% of Swedish hydropower and dams are examined under the Environmental Code (Natursky-ddsföreningen, 2013).
An interim report was published in 2013 where the investigators presented their standpointsregarding the analysis. The interim report comes with the proposals that hydropower plantsconstructed under older permits, with the support of older licenses and requirements than theEnvironmental Code should be reassessed so that they complies with the environmental require-ments under the Environmental Code and the European Union law. An assessment would becarried out as if it were a brand new business or facility. This mean that the impact of these hy-dropower plants would be needed to be assessed and reported (Statens Offentliga Utredningar,2013). New re-investigations of the hydropower plants are fundamental in the case that theircondition must meet current environmental legislation and to Sweden as a country to live up tothe requirements of the EU Water Directives (Naturskyddsföreningen, 2013).
The interim report has now been circulated for comments and opinions. A final report of theWater Activity Investigation shall be presented in the beginning of the summer, 2014 (StatensOffentliga Utredningar, 2013).
1.2.3 Natura 2000
Natura 2000 is a network in EU of protected areas in the environment. The purpose with Natura2000 is to protect and preserve the biodiversity in the European countries within EU. The net-work was created to stop the extinction of animals and plants and to prevent their habitats fromdisappearing (Länsstyrelsen Västra Götalands län, n.d. b). Areas classified as Natura 2000 are
7
CHAPTER 1. INTRODUCTION
sites with species or habitats that are especially worthy of protection in a European perspective(Naturvårdsverket, 2012). Where hydropower is present at Natura 2000 areas, it is especiallyimportant to control the hydropower plant’s environmental impact, since this area is seen asparticularly sensitive. It is also important to protect and prevent damage to the animals andplants that are considered to be extra sensitive.
Areas of Natura 2000 are designated based on two different EU directives, the Birds Directiveand the Habitats Directive. Each Member State has, on the basis of the EU Birds and HabitatsDirectives, chosen which areas and species that they want to preserve and also determine howthey should be managed. All species or protected areas need not to be unique in their coun-try, but should be considered as threatened in a European perspective (Naturvårdsverket, 2012).
In connection with that an area is made to Natura 2000 a conservation plan for the area isperformed. The conservation plan should include a description of the area and the natural val-ues, possible impacts that can harm the environment in the area and what is required to maintainnatural values. To prevent damage to Natura 2000 sites, permits are required for activities ormeasures that can significantly affect the environment in a Natura 2000 area (LänsstyrelsenVästra Götalands län, 2005a). The Environmental Protection Agency coordinates the work onNatura 2000 in Sweden. Länsstyrelserna performs large parts of the work, but key players arealso forest agencies, local authorities, landowners and farmers (Länsstyrelsen Skåne län, n.d. ).
1.3 Project
This project aims to look at the possible environmental impacts related to the construction andoperation of the four hydropower plants owned by Borås Energi och Miljö. Hydropower is avery complex issue and its impacts on local landscapes and biodiversity is very hard to measureand to quantify and therefore hard to compare with other sources of impacts. Borås Energi ochMiljö would therefore like to compile an environmental review of their hydropower stationsand their surrounding environment to get a better understanding of it and also consider if thereare improvements that can be made.
An environmental review will also be a good basis in order to meet any future requirementsand laws on hydropower. As said earlier in the report, a water activity investigation is in focusright now. This may mean that hydropower plants built earlier than the Environmental Codemay be re-examined. Many of today’s hydropower plants were built before the Environmen-tal Code was in force and therefore they have received their environmental permits based onother grounds. If the suggestions from the interim report goes through it may be the case thatthese hydropower plants also should be permitted according to the Environmental Code cur-
8

1.4. COMPANY
rent today. This may mean that the impact of these hydropower plants may be needed to bereported and a lot of work has probably to be carried out for the hydropower plants’ owners(Regeringskansliet, 2013; Svenskt Näringsliv, 2014).
This master’s thesis and the result of the study will help Borås Energi och Miljö to get an over-all picture of their hydropower plants, the possible environmental impacts that the hydropowerplants have on the ecosystems surrounding them and what can be done to mitigate the environ-mental impacts. The master’s thesis will also be helpful in the way that Borås Energi och Miljölater will be able to use this information for further evaluation work. By using for example anassessment model and thus weighting different impacts, they can be able to compare differentimpacts from different activity sources. By doing that they can compare their various fields ofactivity for example hydropower with district heating in an easier way.
1.4 Company
Borås Energi och Miljö is a company, which provide customized solutions in energy-, waste-,water and environmental areas within and around Borås municipality. The company is ownedby Borås Stad and has 228 employees (Kretsloppsstaden, 2014). The yearly turnover for thecompany is about 950 million SEK (Borås Energi och Miljö, 2014a).
Borås Energi och Miljö’s fields of activity are district heating and cooling, biogas, waste man-agement, water and sanitation, energy and waste services. The company also produces elec-tricity in their combined heat and power plant (CHP) and also in their hydropower stations(Borås Energi och Miljö, 2014a). Borås Energi och Miljö convert the energy from for examplewaste to become other energy sources as heating, cooling and biogas. They manage waste andwastewater treatment and they also provide drinking water to Borås.
Borås Energi och Miljö’s ambition is to preserve and take care of all energy flows in Boråsand convert them into utility. The company works to achieve the vision so that Borås will be-come a city free of fossil fuels. Borås is today an international role model in the work field ofthe cycle of the society (Kretsloppsstaden, 2014).
1.5 Purpose
The purpose of this thesis is to do an environmental review of the four hydropower plants, andsome constructions belonging to the hydropower plants, owned by Borås Energi och Miljö. Thereport should include the environmental impacts the different plants may have on the surround-ing ecosystem and also recommendations and different actions that can be taken to improve the
9
CHAPTER 1. INTRODUCTION
situation and decrease the possible environmental impacts from the hydropower plants.
1.6 Problem Formulation
The project will include several different parts such as background information and informationabout earlier studies done in the field but there are some specific questions that should beanswered during the progress of the work:
• Which are the environmental impacts from the hydropower plants owned by Borås Energioch Miljö?
• What can Borås Energi och Miljö do to mitigate the environmental impacts from hy-dropower on the surrounding ecosystem?
• How is Borås Energi och Miljö action processes against negative environmental impactscompared to some other operators at the market?
1.7 Boundaries
The project is a case study on the four hydropower plants owned by Borås Energi och Miljöand the environmental impacts described in text is therefore concerning the four specific hy-dropower plants. The project includes a literature study on the possible environmental impactsfrom hydropower, measures that can be taken to mitigate the impacts, information gatheringabout the four different hydropower plants and an analysis part where the information in theliterature review is connected to the situation at the four plants. The study have not includedany measurements or investigations performed at the sites.
The four hydropower plants are classified as small-scale hydropower plants and in general istherefore the information gained and presented here concerning small-scale hydropower plants.This is because the large amount of available information about hydropower plants, there wasno time to look at all kinds of impacts from hydropower plants and it is neither relevant for thisstudy. The four hydropower plants are approaching, or have even passed an age of 100 years.Due to that, no comparisons with the situation before the construction of the four hydropowerplants have been included and the environmental impacts described is based on how the situa-tion for the ecosystem are today.
No consideration has been taken on the remaining infrastructure such as roads and transmis-sions lines and the environmental impact related to that. Instead the focus has been on hy-dropower plants and the surrounding ecosystem and the environmental impacts connected to
10

1.7. BOUNDARIES
the plants. In similar way has the cumulative effects not been included, the focus should be onthe four specific hydropower plants and what Borås Energi och Miljö can do to mitigate theirenvironmental impact.
11
Chapter 2
Method
The master’s thesis started with a literature study in order to gain the needed knowledge aboutthe environmental impacts that can be connected with hydropower plants and especially small-scaled hydropower plants. To broaden the understanding about hydropower, information abouthow hydropower works and the history of hydropower was included in the literature study.Another important part of the literature study was to find information about the four differenthydropower plants owned by Borås Energi och Miljö. This was done through e.g. earlier inves-tigations. Information was gathered about how they are built and how they are operated. Exceptfrom only reading about the plants, a study visit at the four different hydropower plants alsohas been included. This was done in order to get a better view on how the hydropower plantslooks, in what kind of environment they are situated and the size of the plants. The literaturestudy was, also after the first weeks of the project, an important and ongoing part of projectsince new questions occurred as the work was progressing. The information from the literaturestudy has been compiled in a literature review. The literature review has been divided into onepart where the possible environmental impacts are described and the mechanisms behind them.Following the impact part is a section describing the possible measures that can be taken tomitigate or avoid damages on the ecosystem.
The case study about Borås Energi och Miljö’s hydropower plants required a different approachthan when performing the literature review. The literature review information was mainly gath-ered from scientific articles and reports about hydropower and its environmental impacts. Theinformation about Borås Energi och Miljö’s hydropower plants and the condition of the sur-rounding ecosystem have shown more diversity in form of the different sources to informationthat have been used. The information have had its origin in documents from Borås Energioch Miljö, notes from Borås Energi och Miljö about the renovations on the hydropower plants,water permits, different investigations of the ecosystem at the sites and by conversations withknowledgeable persons at Borås Energi och Miljö.
12
The gained information in the literature study has formed a base from which a model has beencreated. In the analysis, the model has been compared with the gathered information about thefour hydropower plants so that an evaluation about the plants and their environmental impactshas been performed. Finally, the literature study have been used to write recommendationsabout what Borås Energi och Miljö can do to mitigate or avoid impacts on the surroundingecosystems.
Except from looking at the four specific hydropower plants, a part has also been included inthe project about what is done in other companies that seems to be at the forefront with theirenvironmental work. Interviews with persons, familiar with the environmental work, have beenperformed to get information on how they have worked and thought when performing the envi-ronmental work. The questions asked to the companies have been develop through reading theinformation available about the companies and what the companies have performed in order tomitigate or avoid impacts on the environment together with a base in that the answers shouldget a view of why the company decided to do this kind of environmental work and what kindof result they have got.
13
Chapter 3
Literature Review
In the literature review the compiled information from the literature study is presented. Theliterature review is divided into two different main categories, impacts and mitigation actions.The chapter aims to give an insight, which the known environmental impacts connected to theoperation of hydropower plants are, and especially those connected to small-scale hydropowerplants. The chapter aims also to give an insight in what kind of measures that can be taken toavoid or mitigate the environmental impacts.
3.1 Impacts
The following section introduces possible impacts on the environment that are connected tohydropower plants. Both environmental impacts related to the construction of hydropowerplants and impacts related to the operation of hydropower plants are included.
3.1.1 General Information
Hydropower plants are generally seen as green energy sources, which are carbon free and useinexhaustible resources to produce the energy. The prime driver is the force of gravity and thewater used to drive this power is non-destructive (Abbasi and Abbasi, 2011). According toYüksel (2010) hydropower do not pollute the air we breathe in the way that the energy sourcedoes not produce any air pollutants. Unlike thermal power plants for example, there are nogaseous of fly ash emissions emitted during the production. The fact that hydropower oftenreplace fossil-fired generation, it can therefore also be said that it is reducing the problem withacid rain and smog (Abbasi and Abbasi, 2011; Yüksel, 2010).
Despite all these advantages hydropower plants have, there may also be negative impacts.Lately the impact on the ecological aspects from the power plants has received attention. In thereport from World Commission on Dams (2000), it is stated that dams will have effects e.g. on
14
3.1. IMPACTS
the terrestrial ecosystem and biodiversity, the flow regime, migration of aquatic organisms, andcan cause emissions of greenhouse gases. Bratrich et al. (2004) states that hydropower affectsthe flow regime, migration of organisms and transport of nutrients and sediments. Abbasi andAbbasi (2000) claim that hydropower plants causes major ecological impacts in all of the fourdifferent habitats, which are associated with the projects; the estuary into which the river flows,the downstream reaches of the dammed river, the reservoir catchment and the artificially cre-ated lake. So how right it is to say that hydropower is a green energy source or not has comeup for discussion lately.
In the environmental barometer on small hydro power, by European Small Hydropower As-sociation (ESHA) (2009), it can be read that 100% of questioned experts agreed upon thatsmall hydropower plants has an impact on the environment. They all agreed that there is nodifference in impacts depending on the size of the power plants.
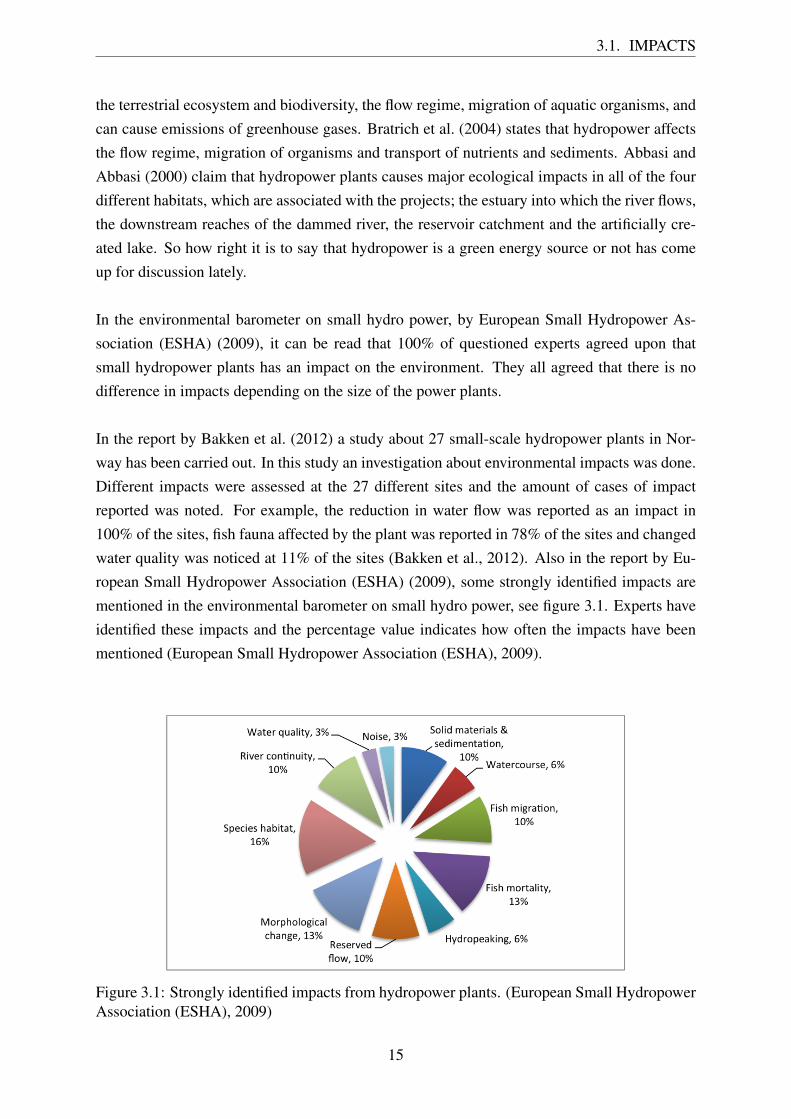
In the report by Bakken et al. (2012) a study about 27 small-scale hydropower plants in Nor-way has been carried out. In this study an investigation about environmental impacts was done.Different impacts were assessed at the 27 different sites and the amount of cases of impactreported was noted. For example, the reduction in water flow was reported as an impact in100% of the sites, fish fauna affected by the plant was reported in 78% of the sites and changedwater quality was noticed at 11% of the sites (Bakken et al., 2012). Also in the report by Eu-ropean Small Hydropower Association (ESHA) (2009), some strongly identified impacts arementioned in the environmental barometer on small hydro power, see figure 3.1. Experts haveidentified these impacts and the percentage value indicates how often the impacts have beenmentioned (European Small Hydropower Association (ESHA), 2009).
Figure 3.1: Strongly identified impacts from hydropower plants. (European Small HydropowerAssociation (ESHA), 2009)
15
CHAPTER 3. LITERATURE REVIEW
From figure 3.1 above it can be seen that species habitat, fish mortality and morphologicalchange are the most common impacts identified.
According to Bergkamp et al. (2000) it is possible to divide the impacts from hydropowerplants into three different categories, first-, second-, and third-order impacts. This can furtherbe divided into what happens downstream and upstream for the different levels. The first-orderimpacts located upstream are for example related to the change of the thermal regime, alterationof the water quality and accumulation of sediment in the reservoirs. Downstream the first-orderimpacts are related to changes in e.g. the water flow, morphology, water quality, water temper-ature and reduced sediment flow.
The second-order impacts are a result from the first-order impacts and concern the abiotic andbiotic changes in the ecosystem structure together with the primary production, both upstreamand downstream. Unlike the first-order impacts that occur as soon as a reservoir is commis-sioned, the impacts related to the second-order impacts are something that can take place overseveral years. The ecosystem that become affected downstream and upstream are similar toeach other and concern for example the riparian vegetation, the growth of aquatic macrophytesand the plankton and periphyton in the stream (Bergkamp et al., 2000).
The third-order impacts are in turn a result of the first- and second-order impacts. Thesechanges are on going over many years until a new ecological equilibrium may be reached. Thethird-order impacts are related to the effects on the invertebrates, mammals, fishes and birds inthe ecosystem. Downstream it is also related to the marine and estuarine impacts (Bergkampet al., 2000).
With the knowledge from this general information part about environmental impacts from hy-dropower plants, some impacts are further investigated in the report. These are; hydrologicalregimes, sedimentation, water quality, migration barrier, greenhouse gas emissions and biodi-versity.
3.1.2 Hydrological Regimes
In the following section the impacts that hydropower plants have on the hydrological regimewill be described. The first part gives an introduction to why the natural water flow is im-portant for the ecosystem. The second part is more focused on the changes that hydropowerplants result in. The section ends with some examples of how the hydrological regime can beclassified.
16
3.1. IMPACTS
3.1.2.1 Natural Water Flow
The flow of a stream varies naturally and is dependent on the climate and the geomorphology,which is the study of landforms and the processes that shape them. The naturally variabilityof flows is the most important characteristics in streams, this because it helps with structuringand maintain different functions of the natural waterways (Malm Renöfält and Ahonen, 2013).According to Bunn and Arthington (n.d. ) many aquatic ecologists regards the flow regime tobe the key driver of river ecosystems. The naturally variability of a flow create a dynamic en-vironment for the surrounding, which creates conditions that favour high biodiversity. Naturalpatterns of longitudinal and lateral connectivity is said to be essential to the viability of popula-tions of many riverine species. Aquatic species for example have evolved life-patterns based onthe naturally seasonal flows. A natural flow variability also control nutrition and competitiverelationships between species, which creates a stable ecosystem (Bunn and Arthington, n.d. ;Malm Renöfält and Ahonen, 2013).
How the natural flow varies depends on both size of catchment areas and position in the land-scape. To get an understanding of how natural variability of flow works, one could look at theamount of water (magnitude), duration of flow, how often a specific flow rate occur during atime span (frequency), for how long time the flow rate persist, when a flow rate happens (tim-ing) and the rate of change. Due to regulations, one or more of these properties will be changed,which in turn affects the entire system (Malm Renöfält and Ahonen, 2013). Alterations of flowregimes is often claimed to be the most serious and continuing threat to ecological sustainabil-ity of rivers and their associated floodplain wetlands (Bunn and Arthington, n.d. ).
The natural variability of the flow can consist of different kinds of flow conditions. Someflow components are for example base flow, extremely low flows, pulses of high flows andlarger floods. All of these components help to keep up with a good basis for good functioningwaterways with associated ecosystems, one can say that different flows represent different ser-vices for ecosystems. Base flow helps to maintain adequate habitats among aquatic organismsand keep appropriate water quality. It contributes to a good situation for fish and allows themto look for food and to reach spawning grounds. The base flow also helps to provide a drinkingwater source for terrestrial animals. It also contribute to maintaining the water level in the shoreland and ensure that the water content in the land closest to the stream, the shore soil, does notget too low during dry periods. Extremely low flows on the other hand helps prevent invasivespecies to establish. The flow also helps to concentrate some species to restricted areas forthe benefit of predators but it can also create hiding places for some other species to help fornot being reached by predators. The flow component regarding pulses of high flows helps toshape the structure of the riverbed and prevent the shore vegetation from growing down into theriverbed. The high flows also restore the water quality after periods of prolonged low flows and
17
CHAPTER 3. LITERATURE REVIEW
rinse off pollutions. It also controls the amount and size of the bottom substrate such as sand,gravel and stones. Larger floods are a component with a large effect of the shape of the riverbedand can also contribute to supply nutrients to the riparian zone. New habitats can be created andthe floods can trigger changes in phases in different organisms’ life cycle. The flood controlsthe vegetation of the riparian zone by drowning or pulling up certain vegetation. It also helpsto provide the stream with organic material to the aquatic food webs and bring seeds into thestream to help the spreading. It is the naturally variability of floods and the related transfersof material that makes floodplains and rivers among the most fertile, productive and diverseecosystems in the world (Jansson, 2002; Malm Renöfält and Ahonen, 2013; Bergkamp et al.,2000).
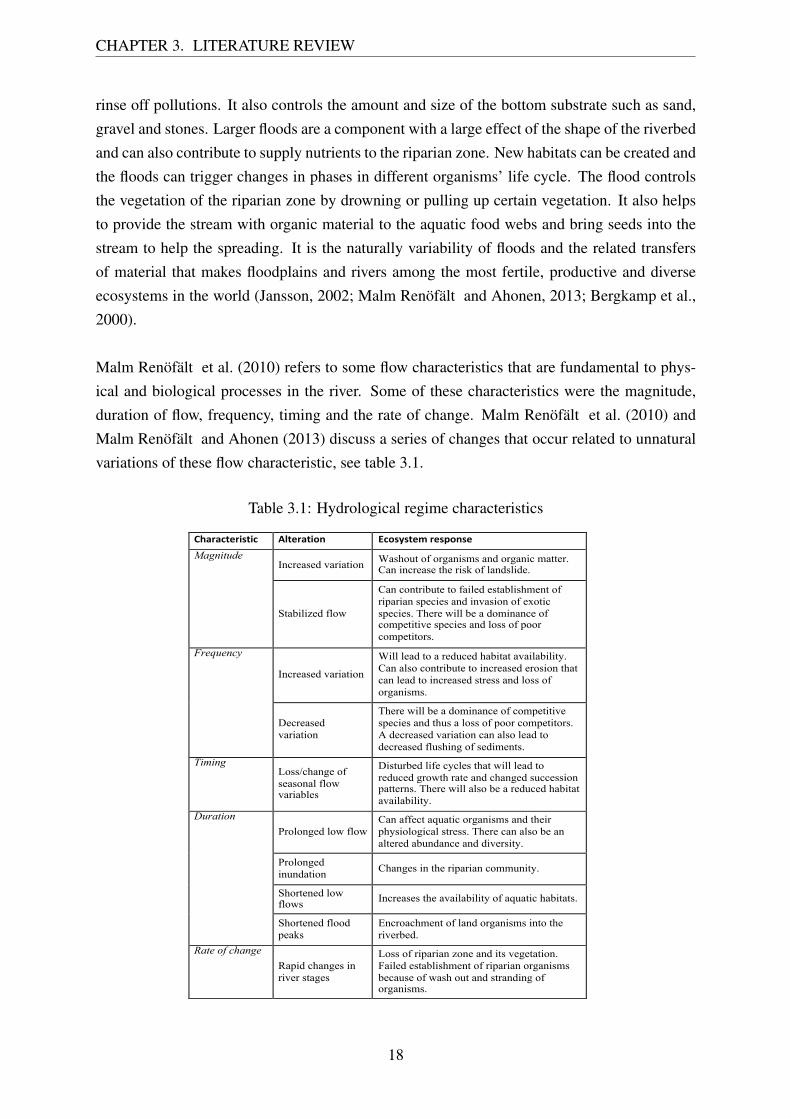
Malm Renöfält et al. (2010) refers to some flow characteristics that are fundamental to phys-ical and biological processes in the river. Some of these characteristics were the magnitude,duration of flow, frequency, timing and the rate of change. Malm Renöfält et al. (2010) andMalm Renöfält and Ahonen (2013) discuss a series of changes that occur related to unnaturalvariations of these flow characteristic, see table 3.1.
Table 3.1: Hydrological regime characteristics
!"#$#%&'$()&(%* +,&'$#&(-.* /%-)0)&'1*$')2-.)'*Magnitude
Increased variation Washout of organisms and organic matter. Can increase the risk of landslide.
Stabilized flow
Can contribute to failed establishment of riparian species and invasion of exotic species. There will be a dominance of competitive species and loss of poor competitors.
Frequency
Increased variation
Will lead to a reduced habitat availability. Can also contribute to increased erosion that can lead to increased stress and loss of organisms.
Decreased variation
There will be a dominance of competitive species and thus a loss of poor competitors. A decreased variation can also lead to decreased flushing of sediments.
Timing Loss/change of seasonal flow variables
Disturbed life cycles that will lead to reduced growth rate and changed succession patterns. There will also be a reduced habitat availability.
Duration Prolonged low flow
Can affect aquatic organisms and their physiological stress. There can also be an altered abundance and diversity.
Prolonged inundation Changes in the riparian community.
Shortened low flows Increases the availability of aquatic habitats.
Shortened flood peaks
Encroachment of land organisms into the riverbed.
Rate of change Rapid changes in river stages
Loss of riparian zone and its vegetation. Failed establishment of riparian organisms because of wash out and stranding of organisms.
!
18
3.1. IMPACTS
Within these broad patterns of change due to unnatural variations of the flow characteristic,Bergkamp et al. (2000) states that there is a wide diversity of specific impacts. Impacts mayvary between dams, catchments, ecosystems and also between species.
3.1.2.2 Hydropower Plants and the Hydrological Regime
Bergengren et al. (2013) states in their report that when constructing a dam or hydropowerplant, changes in the hydrological regime will follow. IPCC suggest the same thing and claimin their report that changes in the hydrological regime is a significant impact from the hydro-power plant. They argue that due to a hydropower plant there will be changes in water level,timing and temperature, which will affect the surrounding terrestrial and aquatic ecosystem(Edenhofer et al., 2012).
Many hydropower plants have a storage reservoir, which is created by damming a river. Thiscreates a flood of the area upstream the power plant. By the creation of reservoirs by us-ing dams it changes the naturally occurring water level variations and the land that have beenabove the water now turns under water, this cause impacts on the riparian zone. Conditionswill be changed and organisms will be challenged (Hovsenius et al., 2002). The flooded areawill impact people, animals and vegetation. In a regulated reservoir the water level fluctuationsmay not be synchronised with the natural regime. This contributes in the way that the riparianvegetation cover becomes extremely sparse and the riparian ecosystem gives the impression ofa barren strip. The impacts of reservoirs are directly related to the topography, thus the gra-dient of the drawdown zone, which is the area alternately exposed to air and water due to theregulations of the water flow. In the case with steep gradient drawdown zones together withwater fluctuations the zone often become characterised by barren strips. With flat gradients onthe other hand, much wider areas can be affected, causing both a disappearance of species andthe creation of new habitats for amphibians, birds and drawdown-area plants (Bergkamp et al.,2000).
When a dam is constructed, the water can be regulated, which in some cases can mean thatat certain times no water will be released through the dam. This would then lead to that thearea downstream the power plant would be largely dry. The dried flood bed will deterioratethe living environment for all the species living in and around the river. In the most extremecase, the whole riverbed will be dry downstream to the hydropower plant. This is devastatingfor any flora and fauna living in the water or in the riparian zone (Melin, 2010). Due to thedam and the reduced water flow, the spreading of seeds will be affected (Malm Renöfält andAhonen, 2013). This will in turn have an effect of the fragmentation of the river vegetation(Melin, 2010). A reduced inundation of the riverbed downstream of dams may also reducegroundwater recharge in the riparian zone. This will result in a lowering of the groundwater
19

CHAPTER 3. LITERATURE REVIEW
table, with consequent impacts on riparian vegetation (Bergkamp et al., 2000).
Other problems with dry riverbeds are arising upstream and along the side of the plant. Thisbecause the situation when the water is led through a channel, tube or tunnel to reach a hy-dropower plant that is located some distance away from the dam or the water intake. Sincemost of the water is directed by the passage to the turbine, the water in the natural riverbed isreduced. If no water at all is let through the dam or through the spillways which are leading tothe original riverbed, there will be a non-aquatic environment and significant changes in habitatand ecosystem (Bergengren et al., 2013). In some cases a minimum flow can be directed to thisoriginal waterway. This is done to get a more environmentally adapted flow and protect theold riverbed and its ecosystem and to maintain a good ecological status. The more water thatgoes through the old riverbed the better it is in an environmental perspective, this because it be-come more similar to the unregulated stream (Malm Renöfält and Nilsson, 2005). Accordingto Malm Renöfält and Ahonen (2013) one single time of no water through the original riverbedcan decrease the length of the food web to one third of its original length and the effect of thiscan last for about 20 years. If the minimum flow is very low the available proportion of theoriginal habitats will decrease, this will hence complicate the spreading of organisms. Staticminimum flows should although be avoided, the best way is if it reflects the naturally variabil-ity of the flow regime in current region. The Irish Department of Communications Energy andNatural Resources (2007) states that for low heads is the water diverted to the turbines largerelative to total flow. This may reduce the residual flow in the natural channel. They claim thatadverse effects to this can for example be disruptions of food webs downstream, stranding offishes and drying out of egg masses.
When building a dam it will also affect the speed of the water. Earlier lotic water can betransformed into, almost lake-like lentic water upstream (Bergengren et al., 2013). High,fast changes of the flow rate can downstream result in damage to the vegetation, erosion andchanged ice conditions, which in its way also lead to erosion and damage to the vegetation.Spawns of different fish species can be affected by fast flow changes in the way that they be-come stranded and the mortality will therefore increase (Malm Renöfält and Ahonen, 2013).A reduced flow rate on the other hand will also have impacts, in the winter lower flows in-crease the probability of anchor ice formation. This affect in the manner that anchor ice canisolate, strand and kill fish (Douglas, 2007). Sedimentation and transport of nutrients will alsobe affected by decrease of the flow rate. This will lead to that the bottom of the river and its bi-ological significance will be changed. The ability to dilute contaminants will also be decreasedbecause of a reduced water flow. A decreased flow rate can also have an impact on the sur-rounding environment. If the water stream will be slow, diffusion of small water droplets candecrease, this can affect the viability of the surrounding flora such as bryophytes and lichens(Hovsenius et al., 2002).
20
3.1. IMPACTS
The temperature of the water will also be affected due to increased or decreased flow rate.The temperature is important for the flora but also for some fauna. Even though the tempera-ture is in the range of the level of tolerance some organisms can be affected of both higher andlower temperatures. Temperature changes will for example impact on the fish spawning andthe chances of survival for the spawn. Another example is that an increased water temperaturein the spring has an impact on chironomids. Chironomids are mosquito-like insects that live inlakes and slower streams. Huge populations of these insects make them the most prolific foodsource for trout (Fly Fishing Shop, n.d. ). The chironomids are influenced by the increasedwater temperature in the manner that their life cycles become to be brought forward and theywill pupate earlier than usual. This will have an indirect effect on fishes, especially trout, be-cause the chironomid will be lost as food for them (Hovsenius et al., 2002; Malm Renöfält andAhonen, 2013).
The regulation of watercourses from hydropower plants alters the natural lifecycle of the flood-plains located downstream from the plant. This can affect community structures and vegetationspecies, which in turn affect the avian fauna and mammalians. Frequent fluctuations in thewater level downstream a hydropower plant might create problems for different mammals andcan also affect birds as well (Edenhofer et al., 2012). Aquatic animals that lives in the streamsare one of the organisms that will be mostly affected when the water stream become regulated(Malm Renöfält and Ahonen, 2013).
When using a run of river project, it change the river’s flow pattern marginally, thus creat-ing fewer impacts downstream from the plant (Edenhofer et al., 2012). But if there is a smallhydropower plant that has small shallow reservoir or ponds they are likely to dry up quickerthan deeper reservoirs used in large projects, and can therefore instead creating larger impacts(Abbasi and Abbasi, 2011).
When using a dam to regulate the water flow in hydropower plants the water flow is changedfrom a natural variation over the year to a water flow that is saved so that it can produce elec-tricity when there is a need for it. This controlled water flow can show large variations fromthe natural flow. For example the large water flows during the spring in the north of Sweden,can be saved to be used when it gets colder outside and the need for electricity increases. Thisis because the demand is higher during this period. Too high flows and large and rapid flowchanges during this period involves a fundamental stress on the ecosystem. In summers whenthe demand is lower the flow instead becomes low. Low flows during the productive summerperiod limit the available areas for benthic fauna and fish. When the regulation fluctuation fol-lows the demand it has meant a reverse water regime in relation to natural conditions, whichhas caused major damage to biological life (Bergengren et al., 2013). Due to the climatic dif-
21
CHAPTER 3. LITERATURE REVIEW
ferences in Sweden are there also differences in the natural water flow of the year. In the northof Sweden large parts of the precipitation comes as snow during the winter. This snow meltsthen in the spring causing high spring floods. In the south parts of Sweden only 10-20 % of theprecipitation comes as snow during the cold part of the year. This means that the water flowin the south part of Sweden has a much more even appearance than the water flow in streamslocated in the north of Sweden. Unregulated streams in the south of Sweden have normallythe peak in the water flow during April. The flow is also usually high in December and Jan-uary. The lowest flows are normally found in July and August (Naturvårdsverket, 2003). Whencomparing regulated and unregulated streams in the south of Sweden it has been shown thatthe range of variations in the water flow for the regulated streams is smaller. It has also beenshown that for the regulated streams so are the changes in the size of water flow more frequentthan for unregulated streams (Bergengren et al., 2013).
The hydropower can also be used to follow the variations in the demand during the night andday and produce more electricity at day time when more is needed (Svensk Energi, 2011). Thisshort-term regulation causes decreased abundance and species richness in the stream and has alarge impact on the benthos. For the fish in the stream the short-term regulation has both directand indirect impacts. The large variations in the flow can lead to that it gets harder for the fishesto find food. It can also cause stranding at rapid reductions in the water flow or so can rapidincreases of the water flow cause the fish fry and roe to be flushed away (Bergengren et al.,2013). Another consequence of regulation is when no water at all is let through the turbinesor the spillways. That kind of regulation can cause times when the water downstream adoptslake-type conditions or gets drained. This will harm ecosystem and means that stream livingfishes, e.g. the trout, will be exposed to an increased risk of predation from pikes. It can alsolead to, as for the short-term regulation, that roe is drained or flushed away (Statens OffentligaUtredningar, 2013).
3.1.2.3 Classification
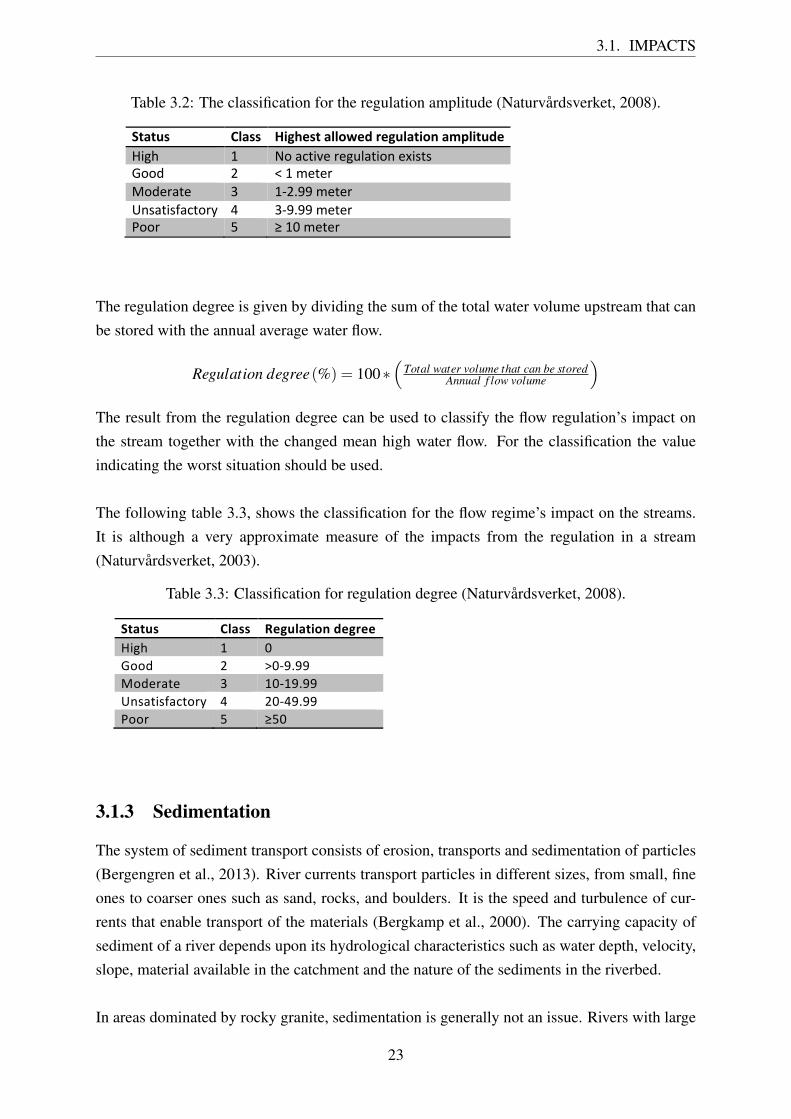
There exists ways to classify the hydrological regime in water streams with respect to e.g. theregulation amplitude and regulation degree. To classify the regulation amplitude, the prescribedregulation amplitude permitted by the Water Rights Court should be used. Depending on howlarge the regulation amplitude is, it can be divided into different groups and given a status(Naturvårdsverket, 2008). The different limits for the regulation amplitudes are shown in thetable 3.2 below:
22
3.1. IMPACTS
Table 3.2: The classification for the regulation amplitude (Naturvårdsverket, 2008).
!"#"$%& '(#%%& )*+,-%"&#((./-0&1-+$(#"*.2"(*"$0-&!"#$% &% '(%)*+",-%.-#/0)+"(1%-2"3+3%4((5% 6% 7%&%8-+-.%9(5-.)+-% :% &;6<==%8-+-.%>13)+"3?)*+(.@% A% :;=<==%8-+-.%B((.% C% D%&E%8-+-.% %%
The regulation degree is given by dividing the sum of the total water volume upstream that canbe stored with the annual average water flow.
Regulation degree(%) = 100∗(
Total water volume that can be storedAnnual f low volume
)The result from the regulation degree can be used to classify the flow regulation’s impact onthe stream together with the changed mean high water flow. For the classification the valueindicating the worst situation should be used.
The following table 3.3, shows the classification for the flow regime’s impact on the streams.It is although a very approximate measure of the impacts from the regulation in a stream(Naturvårdsverket, 2003).
Table 3.3: Classification for regulation degree (Naturvårdsverket, 2008).
!"#"$%& '(#%%&& )*+$(#",-.&/*+0**&!"#$% &% '%())*% +% ,'-./..%0)*12341% 5% &'-&./..%67834"893:4)2;% <% +'-<./..%=))2% >% ?>'%%
3.1.3 Sedimentation
The system of sediment transport consists of erosion, transports and sedimentation of particles(Bergengren et al., 2013). River currents transport particles in different sizes, from small, fineones to coarser ones such as sand, rocks, and boulders. It is the speed and turbulence of cur-rents that enable transport of the materials (Bergkamp et al., 2000). The carrying capacity ofsediment of a river depends upon its hydrological characteristics such as water depth, velocity,slope, material available in the catchment and the nature of the sediments in the riverbed.
In areas dominated by rocky granite, sedimentation is generally not an issue. Rivers with large
23
CHAPTER 3. LITERATURE REVIEW
sediment loads are found mainly in arid and semi arid or mountainous regions with fine soilcomposition (Edenhofer et al., 2012). In the matter of small hydropower plants the upstreamwater in some times comes from a closely located lake. This provides a calm body of waterall the way upstream. In this type of sequence it is normally less of a problem with sediment(European Small Hydropower Association (ESHA), 2004a).
When constructing a dam the slope and the water velocity become reduced first in the reservoir.That results in a decreased ability for the streams to carry sediment. An increased depositionof sediment because of the reduced capacity could cause raised levels in the river bed and inextension, increase the risk for flooding. The degree of sedimentation depends on external cir-cumstances such as geomorphologic composition of the riverbed, soil composition and whatkind of vegetation living in the catchment area (Edenhofer et al., 2012). An increased deposi-tion can affect the possibilities for fish reproduction, this because migrating fish reproduction isdependent on gravel and stone bottoms (Kungliga ingenjörsvetenskapsakademien IVA, 2002).
Azarpour et al. (2012) claim on the same thing. They suggest that the natural carried sedi-ment from the usual natural flow will be negatively affected. Just as Kumar et al. (2012) theysay that the sediment that is naturally carried will be impeded by the dam impoundment result-ing in accumulation of sediment. This will lead to the situation that the area just upstream ofthe impoundment would become shallow because of the increased deposition. Downstream ofthe dam on the other hand the turbidity of the water may be reduced, which indicates on thelack of sediments. This can however also be a problem because the sediment might also bea source of nutrients for the biota. Reduction in sediment deposition can lead to decrease inland fertility (Azarpour et al., 2012). According to the International Hydropower Associationthe impacts of a reduced sediment load downstream of a plant may arise depending on pre-existing sedimentation and erosion patterns, the riparian vegetation condition and the nature ofthe regulated flow release and the altered flooding regimes. When there are reduced sedimentloads downstream of a power station combined with higher than natural base flows it may leadto erosion of the existing channel and destabilization of the riparian vegetation (InternationalHydropower Association, 2014a). According to Graf (2006) both general studies, site- specificinvestigations, and research based on different models have all came to the conclusion thatchannels downstream from dams are about to degrade through erosion related to the trappingof sediment in the reservoir behind the dam.
The reduction in sediment transport in rivers downstream of dams do not only has impactson the channel and its floodplains it also alters habitat for fish and other groups of plants andanimals. As a consequence of impoundment the turbidity may be reduced. Production of someorganisms such as for example plankton is influenced by for instance the turbidity. Turbidityinterferes with photosynthesis and algal development may be attenuated by the presence of
24

3.1. IMPACTS
suspended inorganic particles. Plankton development may therefore be enhanced because of areduced turbidity and may even be stimulated to appear in new sections of rivers (Bergkampet al., 2000).
3.1.4 Water Quality
The report by the International Energy Agency (2011) emphasizes that the impacts on the waterquality is site-specific and depends on different conditions, such as the operation of the powerplant and type of power plant. Except from the production of the electricity from small hy-dro plants no harmful discharges to the river are produced. The water have the same qualityand quantity both before and after flowing through the turbines (European Small HydropowerAssociation (ESHA), 2000; International Hydropower Association, 2014b). It is although de-scribed in the report by Bergkamp et al. (2000) that the water quality may be affected arounda hydropower plant. They states in opposition to ESHA (2000) that water discharged from areservoir can be of a different composition to the water that is flowing into a reservoir. Howthe impacts appear depend on different factors, dam morphology and depth, the retention timeof the water in the dam, the water quality in the tributaries, the kind of the soil and vegetationinundated and how fast the impoundment was going. How the plant is run can also affect thewater quality, both in negative and positive ways (Edenhofer et al., 2012).
In the case where water quality issues arise, the problems can vary greatly and may includereduced oxygenation, stratification potential, temperature, nutrient capture, pollutant inflow,algal bloom potential, propensity for disease proliferation and the release of toxicants from in-undated sediments (International Hydropower Association, 2014b).
Bergengren et al. (2013) states that for streams with reduced water flow, which often is thecase in streams with installed hydropower plants, the sensitivity for contaminations increases,which can affect the water quality. Other reasons behind decreased water quality could also bechanges in the sedimentation and retention time and inundation of land areas. Another issuecausing poor water quality could according to Abbasi and Abbasi (2011) be that wastes fromrunning hydropower plants for example using biocides and anti fouling preparations for pipecleaning and other maintenance work can pollute the water. Due to the fact that oil based sys-tems are used in hydropower plant for regulations of turbines and intake- and spillway gates,oil spill can also be a waste component affecting the water quality. Oil spill can provide envi-ronmental damage caused by pollution or toxic effects. The extent of damage depends on thetype of oil, the size of the spill, duration time, the sensitivity of the area, season and externalfactors. Many hydraulic systems, where moving parts are lubricated by oil, have a small con-tinuous leak during normal operation, which means that a certain amount of lubricating oilscan disappear into the water (Åstrand, 2008).
25
CHAPTER 3. LITERATURE REVIEW
Due to the fact that hydropower plants uses water regulations, removal of organic materialfrom the riparian zone will increase when the water volume become changed. For areas wherethere is good potential for sedimentation this material will sink. Oxygen is required for de-composition of this material, in calm water there can therefore be a risk for lack of oxygen.Further, the released organic material will also gain the production of algae, which in turn alsocan increase the lack of oxygen (Kungliga ingenjörsvetenskapsakademien IVA, 2002). Someblue-green algae can in addition to oxygen depletion also cause an increased concentration ofiron and manganese in the bottom layer of a reservoir. In stratified reservoirs this can lead toan increased amount of oxygen and pH in the upper layers, which will affect the water quality(Bergkamp et al., 2000).
Regulations of large areas of land may also contribute to the accumulation and release of nu-trients originated from the flooded biomass from for example the riparian zone. This can inits turn lead to the undesired effect of eutrophication (von Sperling, 2012). Although nutrientlevels generally decrease over time as the organic matter decreases, some reservoirs requirea period of more than 20 years to become stable. Regarding eutrophication, Bergkamp et al.(2000) suggest that it may occur as a consequence of large influxes of organic materials andnutrients. But they also state that in most cases it is an anthropogenic consequence of for ex-ample using fertilizers, rather than a direct consequence of the presence of a reservoir.
Another problem with using regulations is that the total water volume increases in the catch-ment area due to the storage of water in reservoirs. This can lead to changed transports out tothe sea for different substances, for example different nutrients. Kungliga Ingenjörsvetenskap-sakademien, IVA (2002) refers to studies that indicate that the transport of nitrogen out to theBaltic Sea is less from regulated streams than from those who are not regulated. Phosphorusis still under investigation but also seems to be less transported out from regulated streams.Another problem according to Kungliga Ingenjörsvetenskapsakademien, IVA (2002) is due toinundation of land and that it can lead to the release of mercury that has been accumulated inthe terrestrial environment. Mercury is naturally present as a harmless inorganic form in manysoils. When the water level varies, variations in oxygen conditions also vary, this can facil-itate for bacteria to transform this inorganic mercury to methylmercury. Plankton and otherorganisms at the bottom of the aquatic food chain absorb methylmercury. Due to the fact thatmethylmercury is a strong bio accumulative contaminant it become increasingly concentratedin the bodies of the animals higher up in the food chain eating the contaminated prey (Kungligaingenjörsvetenskapsakademien IVA, 2002; Bergkamp et al., 2000).
In a hydropower plant with large and deep dams there can be a deficit on dissolved oxygen.In plant with bottom intake this problem can create an adverse impacts on the habitats in the
26
3.1. IMPACTS
stream (International Energy Agency, 2011). In deep lakes that tend to stratify, colder de-oxygenated water at depths in the lake has in some cases released metals from the sediments e.g.methylmercury. Deep intakes can in some cases result in deoxygenated and hydrogen sulphiderich releases out of the power station into the downstream river (International HydropowerAssociation, 2014b). But there can also be water quality problems for hallow lakes, poorwater quality can under certain catchment conditions result from wind-induced sediment re-suspension, eutrophication and algal blooms (International Hydropower Association, 2014b).
Another quality problem that can affect the water is the temperature. Temperature is an impor-tant regulator of many important physical, chemical and biological processes. As for examplethe temperature together with light conditions, seasonal availability of minerals and nutrientdynamics controls the primary productivity (Bergkamp et al., 2000). Temperature also plays animportant role for the metabolism of organisms (Arthington et al., 2009). The water of a reser-voir is usually cooler in the summer and warmer in the winter than it would be without a dam.This altered temperature also affects the river when the water flows downstream. Thereforethe temperature affects the animal life present in both the reservoir and the river (von Sper-ling, 2012). The temperature can differ from ambient temperatures, it can also fluctuate overshort time scales depending on operating patterns. The temperature can have a major influ-ence on biological health and can also be instrumental in providing migration signals for somespecies (International Hydropower Association, 2014b). Water temperature changes have beenidentified as a cause of the reduction in native species of fish, particularly impacting spawningsuccess negatively. Changes may also affect growth rates and length of the growing season formany species (Bergkamp et al., 2000).
Turbidity is another thing also affecting the water quality. Turbidity attributes to the visualproperty of water. Increase in turbidity normally accounts for an increase in the concentrationof suspended solids in the water. This increase in suspended solid is due to the increase in sed-iment concentration of the water body (Dahal, 2013). Turbidity issues can arise in cases dueto erosion of riverbanks, incoming sediments, and resuspension of bottom sediments in shal-low lakes (International Hydropower Association, 2014b). An increase in the concentration ofsuspended solids leads to a change in the amount of light available for the biological life in thestream (Dahal, 2013). Gas supersaturating is another problem. Particularly high hydropowerdams have in cases had problems with gas supersaturation resulting in fish deaths and dam-age to invertebrates (International Hydropower Association, 2014b; Douglas, 2007). However,small hydropower plants generally reduce the total gas pressure leaving the plant, instead ofincreasing it (Douglas, 2007).
Hydropower plants can also have a positive impact on the water quality. According to Ghoshand Prelas (2011) a run of river system do not change the water quality in terms of temperature,
27
CHAPTER 3. LITERATURE REVIEW
decreased food production, siltation, increased nitrogen and phosphorus levels and low oxygenlevels. In the case of run of river plants and areas with poor water quality the hydropowerplant even can help with increasing the oxygen level in the water levels and filter floating wasteout of the river (Edenhofer et al., 2012). Another positive impact is that many modern smallhydropower plants have trash rack-cleaning machines. This machine removes material fromthe water and by doing this avoiding it to enter the plant waterways and reducing hydraulicperformance and damaging electromechanical equipment. By using these machines it keepsthe rivers clean and material such as plastic bags, cans and bottles become removed, whichthey would not have been otherwise. Another thing to keep the water quality good is to usebiodegradable oils, which become more common to do in small hydropower plants (EuropeanSmall Hydropower Association (ESHA), 2000).
3.1.5 Migrations Barriers
According to the report by Havs-och vattenmyndigheten, one of the biggest environmentalproblems due to hydropower is the barrier effect (Bergengren et al., 2013). Hydropower damsimpede the flows of rivers and thereby affect the habitat of various aquatic lives (Ghosh andPrelas, 2011). Fishes are the main species affected by the hinder that the hydropower conductbut also other organisms are affected (Bergengren et al., 2013). Ström (2012) sees the problemin the same way and he means that hydropower only has local effects. He indicates that oneof the major problems is that aquatic organisms have a harder time to migrate between streamsand to get to lakes and seas than it had been without hydropower plants.
Migratory fishes require different environments for their different phases of their life cycle.Different stages are reproduction, production of juveniles, growth and sexual maturation. Thesedifferent stages take place in different environments for different fishes (Laarinier, 2001).Fishes that migrate can basically be divided into two different categories. Anadromous fishesgrow up in the sea and migrate from the sea to fresh lakes to spawn, this is called upstream fishmigration. Examples of anadromous fishes are salmon and sea trout. Catadromous fishes areones that grow up in fresh lakes and migrate from the fresh water into the sea to spawn, this is adownstream fish migration. (Bergengren et al., 2013). An example of a catadromous fish is theEuropean eel (Calles et al., 2012). A third category is potadromous fish, which are fishes whosemigrations occur wholly within fresh water lakes and streams (Länsstyrelsen Västra Götalandlän, 2005).
Hydropower plants and its associated dam buildings can affect the fishes in several ways. Bothdownstream and upstream fish migration become affected. Fish migration is affected by a singledam but multiple dams in the same stream can worsen this situation dramatically (Bergkampet al., 2000). Dams can restrict and delay the fish migration, increase predation and subject
28
3.1. IMPACTS
fishes to direct damage and stress (Ghosh and Prelas, 2011). One of the major effects of theconstruction of a dam on fish populations is the decline of anadromous species. If there isno kind of fishway for upstream migrating fish, the fish will not be able to bypass the powerplant at all. According to Calles et al. (2013) only 10% of the hydropower plants in Swedenhave fishways for upstream migrating fish. Passage of fishes from upstream to downstream isanother barrier problem. A major concern regarding the use of hydropower is the mortality ofturbine-passed fishes (Ghosh and Prelas, 2011). If there is no other fishway to lead the fishpast the power plant the only possible way to pass the plant is through the turbines or to be im-movable and be trapped upstream (Calles et al., 2013). Fish that survive the stressful conditionassociated with turbine passage are often damaged and susceptible to predation and mortal-ity due to their injuries (Irish Department of Communications Energy and Natural Resources,2007). The number of fishes injured, stressed or killed by turbine passage varies with species,age of the fish, time of year, temperature of the water, turbine type and operations (Ghosh andPrelas, 2011). The size of the fishes is another subject the injury is related to. The longer thefish is the higher risk to get hurt of the turbine. One species, which are badly affected is the eel(Calles and Bergdahl, 2009).
Fish passing through turbines are subjected to various forms of stress that are likely to causedamage or mortality. Damage to fish associated with power plant passage is in no way onlyrestricted to strike from stationary or moving parts of the turbine blades, there are also othercauses of loss, which are just as important or even more critical (Irish Department of Com-munications Energy and Natural Resources, 2007). Calles et al. (2013) states that these othercauses can include pressure variation, cavitation, shear, abrasion and turbulence. The extent towhich these factors cause damage to the fish depends upon the design on e.g. the water intake,cleaning machines, head, type of turbine and several other factors (Calles et al., 2013).
According to European Small Hydropower Association (ESHA) (2004a) the injury and mor-tality of fish depends on turbine type. A Kaplan turbine is more fish friendly than a Francisturbine. This is due to the different construction of the turbines. Calles et al. (2013) also agreeon this and states that no turbine type is safe but a Kaplan turbine gives less damage to thefish than any other turbine type. They claim that the survival follows the efficiency curve of aKaplan turbine, the more efficiently run the larger amount of fish survival.
Bourgeois and Therrien (2000) writes in their report, Fish Passage at Small Hydro Sites, that themajor area of concern for cause to mortality for Francis turbines is the runner entrance wherethe guide vanes, the turbine blades and the runner’s peripheral speed may harm the fish. Theystate that higher mortality has been correlated with greater guide vane openings and higher pe-ripheral runner speed. According to European Small Hydropower Association (ESHA) (2004a)the mortality will increase from 5 to 35% if the peripheral speed increases from 12 m/s to 30
29
CHAPTER 3. LITERATURE REVIEW
m/s when using a Francis turbine. Just as for the Kaplan turbine the Francis turbine has lowerfish mortality the higher the efficiency on the turbine is (European Small Hydropower Associa-tion (ESHA), 2004b). For Kaplan turbines, the major area of concern is the interaction betweenthe blade tips and the discharge ring. There is no strong relationship between peripheral runnerspeed and fish mortality for the Kaplan turbines unlike the Francis turbines. Bourgeois & Ther-rien (2000) asserts that there is no correlation between plant head and fish mortality for none ofthe different type of turbines. It has although often been stated that the head has an influence onthe mortality rate but this can be explained on the fact that Francis turbines, which has a highermortality rate, often are used at higher heads than Kaplan (Bourgeois and Therrien, 2000).
As written earlier in this report, pressure variation is another problem for fishes passing tur-bines. The pressure increases just before the passage of the turbine blades, but then it decreasesvery rapidly after the blades. This reduction in pressure is very fast and can cause major damageas for example rupture of swim bladder (Calles et al., 2013). Bourgeois and Therrien (2000)assert that the risk of injuries caused by pressure variations is higher if the plant head is greaterthan 20 m. The risk is also higher when the fish is going in through a deep-water intake com-pared to a water intake at the surface (Bourgeois and Therrien, 2000; Calles et al., 2013). As aconsequence of the pressure drop, a dissolved gas supersaturation in the water can appear. Adissolved gas super saturation occur downstream of the turbine and exist when the water gascontent exceeds the amount that can be dissolved in water at respective pressure and temper-ature. Due to this condition fishes can suffer from a gas bubble disease. This disease arisesbecause of the dissolved gas supersaturation leads to the formation of gas bubbles in fish’sblood and tissue. The problem with this condition seams to increase for higher heads over 30m (Calles et al., 2013). Another pressure related problem is cavitation. Cavitation is the forma-tion of vapour cavities in a liquid. When the pressure of water is lower than the vapour pressure,vapour cavities arises (European Small Hydropower Association (ESHA), 2004b). The formedbubbles in the water can collapse or implode at slightly increased pressure, this creates strongshock waves, and these chock waves may damage nearby fish tissue or give bleedings in theeyes and gills (Bourgeois and Therrien, 2000). Calles et al. (2013) says that cavitation is a verylocal problem and fish has to be very close to the turbine blades to get hurt. They also state thatthe risk for cavitation is related to the difference in height between the turbine and the waterlevel at the water outlet.
Shear stress can also harm fishes when passing turbines. Shear stress is when different parts ofa fish body are subjected to different forces in parallel. Fishes can be affected by shear stresswhen two masses of water moving in different directions intersect, or where moving waterslows near a solid structure(Calles et al., 2013). Damage can occur for example where rapidlyflowing water passes near structures such as turbines, pipelines, and canals. According to Cadaet al. (2007), field observations and laboratory studies suggest that fluid forces such as these
30
3.1. IMPACTS
can cause tearing or bruising of tissues and even decapitation of fish.
Fishes passing through turbines and tailraces is affected by turbulence. This can in turn af-fect the way the fish is moving and they lose the ability to operate optimally. As a result theybecome dazed. When the fish reach the downstream area the dazed and exhausted fishes be-come particularly vulnerable and therefore an easy target for attacks of predators. Anotherthing that can harm fish passing turbines is trough abrasion. When fishes migrate through nar-row passages or goes through pipes or end up in strongly turbulent passages they can get seriousabrasions (Calles et al., 2013).
Except all of these injuries caused by turbine-associated conditions, damage can also ariseto downstream migrating fishes due to intake screens. By keeping the water pressure on thescreen low, the risk of contact and getting stuck will be minimized. The damage to the fishdepends on the angel of the screen, the width between the grids and the water velocity. If thesweeping velocity of the fish along the screen is low, the fish can become pushed against thescreen instead of being able to orient themselves along the screen. A low pressure on the intakescreen is synonymous with a low head loss, this is therefore something to strive for in botha power as for an environmental perspective. Calles et al. (2013) claim that mortality due tointake screens occur at water velocities above 0.5 m per second. As said before, the widthbetween the grids also plays an important role for the grade of injury to the fish. Screens thathad been evaluated with a good function and adapted to fishes had a grid width of 18 mm. Insome cases, the grid width has been further reduced to prevent fish from getting through thescreen. But if it is hard for the fishes to find an alternative way or that there is no alternativeway for the fish to go the function of the adapted intake screen could be insignificant or evennegative. Small individuals can pass the screen and become forced to go through the turbine.Large individuals on the other hand become trapped and killed directly on the grid. The angelof the screen is another important thing to consider in order to make the intake screen as fishfriendly as possible. An angel less than 45 degrees relative to the ground means that the forceparallel to the intake screen will be larger than the force acting perpendicular to it. For goodfunctioning however, any angle should be less than 30 degrees since the force parallel to thescreen then becomes twice as high as the force against it, which increases the likelihood that abody, which is close of the intake screen will be passed along with it instead of being trappedagainst it. In Calles et al. (2013) two different hydropower plants are described, Ätrafors inÄtran and Övre Finsjö in Emån. Both of the plants reduced the risk of entrapment on the intakescreens by replacing old steep 20 mm grid width with low sloping (less than 45 degrees) 18mm grid.
Another problem associated with the intake screens are the cleaning of it by the use of therake-like tool. This tool is used to remove what have been stuck on the screens for example
31
CHAPTER 3. LITERATURE REVIEW
levees, branches but also fish. The rakes are although not very kind to the fish and the residuesare after it has been gathered, transferred further on a moving belt to a container or just dumpedonto the hard ground (Calles et al., 2013).
Calles et al. (2013) states that even though the rate of injury for the different kinds of causeswhich occurs when a fish pass a hydropower plant is not that high, the synergistic as well asthe cumulative effects during the passage of several hydropower plants can although be veryharmful. In the Swedish magazine, Forskning och Framsteg, it can be read that according toFiskeriverket, adult eels have roughly 30% chance of surviving passage through a hydropowerplant. In some streams they also must get past several power stations to reach the sea, theprobability to arrive alive to the coast was therefore estimated to be four percent on average(Nyström, 2011). By using e.g. Monte Carlo simulations it is possible to calculate estimationsof the eel losses when passing different hydropower plants in the south of Sweden. In the reportby Leonardsson (2012), Monte Carlo simulations have been performed in two different cases,one assuming that the total capacity of the turbines flow capacity is used and one assuming thathalf of the turbines capacity is used. It should be noted that no concern has been taken to thesize of the intake screens and that there exists some insecurities so the numbers should be seenrather as estimations than as exact calculations. The author concludes in a stream with e.g.four hydropower plants the mortality cannot exceed 20 % per plant if 40 % of the eels shouldreach the ocean, which is a European goal. Despite that, it seems like there are few hydropowerplants that not are exceeding a mortality of 20 % (Leonardsson, 2012).
If a hydropower plant was built where there was no hinders for the fish before, the constructionmay block the migration of fishes. But if a hydropower plant was build in a place where therewas for example a waterfall before which made up a hinder for the fishes itself, the hydropowerplant makes no difference seen to the obstacles for the migration of fishes (Edenhofer et al.,2012).
3.1.6 Greenhouse Gas Emissions
One of the biggest challenges the society is facing today is the climate change. The green housegas (GHG) emissions coming from the production of energy are responsible for a great share ofthe increased levels of GHG emissions in the atmosphere. By using renewable energy systemsthere exists a possibility to reduce the GHG emissions from fossil fuel based technologies andto mitigate the climate change (Edenhofer et al., 2012). Also the European Union points outthe importance of that the energy sector reduces the CO2 emissions and that renewable energysources are good for the environment (Europeiska kommissionen, 2014). Hydropower is a re-newable energy source. But even if hydropower is a renewable energy source it is not an energysource without GHG emissions (Kumar et al., 2012).
32
3.1. IMPACTS
All energy systems used in the society today contributes to the anthropogenic emissions ofGHG emissions to some extent (Gagnon et al., 2002). In order to estimate the emissions, ap-proaches such as life cycle assessment (LCA) can be applied. LCA is a method that looksinto the environmental impacts and emissions from the life cycle of a product or project, fromcradle to grave. Both bottom-up and top-down approaches can be used to assess the emissionsper functional unit (Raadal et al., 2011). In the report from IPCC they mention three differentphases for a hydropower plant where GHG emissions can occur, the construction, the opera-tion and maintenance and the decommissioning of the plant. During the construction phase theemissions comes from the production and transport of the materials needed for the constructionand from the work equipment. In the second phase, the operation and maintenance, the emis-sions can come from e.g. heating or cooling systems and transportation for maintenance work(Kumar et al., 2012).
One important source of GHG emissions that should not be neglected is emissions that canarise from land use change due to constructions of reservoirs and the changes of the terrestrialcarbon cycle that comes with that. There is today no consensus on the emissions that can arisefrom the land-use change that follows the construction of hydropower plants and reservoirs(Kumar et al., 2012). The estimations and the views of the size of the GHG emissions canshow large variations. According to European Small Hydropower Association (ESHA) (2000)the hydropower contributes with no CO2 emissions at all. There exist also estimations thatshow quite high values for the GHG emissions per kWh and in the article by Turconi et al.(2013) they report emissions of the order of 340 g CO2 equivalents/kWh for hydropower plantsin Brazil. For run of river plants the estimations are lower (Turconi et al., 2013). Abbasi andAbbasi (2000) states that according to some authors there are some hydropower plants withreservoirs that could be as worse as fossil fuel based energy systems when looking at the sizeof the GHG emissions, which also Hertwich (2013) agrees with.
The problem with quantifying the GHG emissions from hydropower plants is that they arehighly site-specific. Literature reviews done in the area points out the diversity in the results,both depending on which boundaries used and where the hydropower plants in the research arelocated.
Hertwich (2013) points out the importance with understanding how the dams change the carboncycle due to increased sedimentation, decay in the water bodies and the reduced transport ofsedimentation to the seas. When building dams and reservoirs, the following result is often in-undation of areas that before were wetlands or land. This can cause the release of labile carbonthe first 10-15 years after the construction. Another result of the construction can be change ofriver areas into reservoir areas. This can increase the fractions of emitted CH4 compared to the
33
CHAPTER 3. LITERATURE REVIEW
emissions of CO2 due to the increased formation of anoxic conditions at the bottom. The damswill also change the transportation of organic matter in the stream and with following increasedsedimentation or decay. Less particulate organic carbon will follow the stream to the oceanand instead of reaching the deep of the oceans it will be released earlier in the stream. A netabsorption of carbon can be formed by the increased water temperature that can exist in dams,the higher temperature creates good conditions for growth of biomass and therefore there canbe a net absorption (Hertwich, 2013).
The variation on the emissions depends on the specific conditions at the site. The factors thatdetermine the size of the emissions are e.g. reservoir size, topography, climate, materials usedin the construction and type of ecosystem (Gagnon, 1997).
To calculate the emissions per energy unit the life length of the plant must be estimated. In thestudy by Gagnon (1997) the used life length is 100 years and the included gases were carbondioxide (CO2), methane (CH4), nitrous dioxide (N2O) and carbon tetrafluoride (CF4). Theseemissions come mainly from different parts of the production and manufacturing of the plantbut can also come from the areas that have been flooded due to the building of the reservoir.The flooded biomass will start to decay and this process will emit GHG. The amount emittedis due to different factors. The size of the reservoir is an important factor that affects the sizeof the emissions. The climate affects also the size of the emissions. A cold climate will slowdown the decay of the biomass. Another factor is the amount of biomass flooded and dependson what type of ecosystem the plant is located in. However, it is important to remember thatmeasurements on the emissions from the reservoirs only show the gross emissions and not thenet emissions (Gagnon, 1997). The reservoirs part in the anthropogenic release of GHG emis-sions is debated. There are uncertainties in both the measurements of the gross emissions fromreservoir and the net emissions (Tremblay et al., 2004).
In the report by Teodoru et al. (2012) they have quantified both the emissions from the land-scape before the creation of a reservoir and the emissions after the creation of a reservoir duringa seven years long period. The measurements showed that the landscape before the impound-ment was more or less neutral. After the impoundment the measurements indicated that thereservoirs in the beginning were a large source of net emissions of CO2. The net emissionsdecreased fast the following years but even when looking over a long period the results suggestthat the CO2 emissions from the flooded area exceed the CO2 emissions if there had not beenany reservoir. However, it is not known where the emissions come from. This is although veryimportant to have knowledge about in order to decide if the emissions increase the total amountof CO2 or not. If the emissions are a result of the degradation of the flooded soil the emis-sions are a consequence of the construction of the reservoir. But if the emissions are a resultof biological and photochemical mineralisation of allochthonous sources, which are sources of
34
3.1. IMPACTS
carbon or nutrients that comes from outside of the aquatic system, such as plant and soil mate-rials, this would have happened anyway further down in the stream and is not a consequence inthe same way of the construction of the reservoir (Teodoru et al., 2012; Sitka National Histori-cal Park (U.S. National Park Service), 2014). The authors emphasize that even when includingthe emissions following from the impoundment, hydropower plants has probably much lessemissions over a life length than fossil fuel based technologies per unit energy produced. Inthe report by Teodoru et al. (2012) measurements have been done on a reservoir in a boreallandscape and the result will not be the same for reservoir for other types of landscape e.g.tropical and subtropical. The result will also differ depending on the management of the plantand type of landscape flooded. If the landscape flooded, before was a wetland or peat bog theemissions can be reduced. This makes it hard to translate the emissions from one reservoir toanother (Teodoru et al., 2012).
Also in the report by Gagnon (1997) it is suggested that the GHG emissions will decreasewith time. The numbers on the emissions are from plants with an age of 2-25 years. Even if nonumbers are included from older plants, the opinion in the report is that emissions will declinewith time and that after 50 years the emissions from the reservoir will have reached zero netemissions. According to Demarty et al. (2011) old reservoirs shows the same behaviour aslakes when looking at the GHG emissions. A similar result can be found in the study done byTremblay et al. (2004) where they have measured the carbon fluxes in more than 280 sites inreservoirs, rivers and natural lakes in Canada. The measurements showed that ten years afterthe commissioning of the reservoirs, the conditions in the reservoirs was similar to the condi-tions in terms of water quality and gross emissions of GHG emissions in natural lakes. Theflooding of terrestrial ecosystems alters the chemistry in the soil and release both labile carbonand nutrients into the water. This in turn leads to an increase of the bacterial activity and theprimary production in the reservoir. This will enhance the overall production in the lake. After10-15 years the reservoirs will have approached values that are similar to natural lakes. In bo-real ecosystem, these changes occur in a time period of 5-10 years. Due to the flooding therewill also be a decomposition of the carbon in the soil and the plants. This carbon will partly beturned into CO2 and CH4 (Tremblay et al., 2004).
For cold climate, the sizes of the emissions are according to Gagnon (1997) 15 g CO2 - equiva-lent/kWh, including the emissions from the construction phase. For run of river plants withoutreservoirs the emissions are generally lower since they require less material per unit energycreated and since it is the reservoir that contributes the most with emissions from decayingbiomass, plants without reservoirs will emit less. For small hydropower it can be seen thatlarge hydropower plants have better ratios reservoir area/ energy unit produced than what smallhydropower plants have (Gagnon, 1997).
35
CHAPTER 3. LITERATURE REVIEW
In the report by Turconi et al. (2013) they have included 12 case studies on the emissionsfrom hydropower plants. The largest share of the emissions comes from the infrastructure. Theamount of emissions differed depending on if the plant was built with a reservoir or not. Forplants with the reservoir the amount of GHG emissions emitted lay in the range of 11-20 gCO2 - equivalents/kWh. For the run of river plants the emissions was in the range of 2-5 gCO2 - equivalents/kWh. Large variations in the size of emissions were possible to see, whichcan be due to different factors such as climate, size of reservoir, soil type and which kind ofvegetation flooded. The amount of flooded biomass can vary with a factor of 5, from 100 ton/hafor boreal regions up 500 ton/ha in areas with tropical forests (Gagnon et al., 2002). All thesefactors influence the possible methane emissions from reservoirs due to anaerobic digestion.The emission factors can vary from 0.35 g CO2 - equivalents/kWh for alpine regions up to 340g CO2 - equivalents/kWh in Brazil. Also NOx and SO2 from the case studies were reported.The NOx emissions were 0.004-0.006 g NOx/kWh and 0.004-0.03 g SO2/ kWh. However, theseemissions are mainly related to the construction and not the operation of the dam (Turconi et al.,2013).
Raadal et al. (2011) has compiled the result from 39 LCA studies on the GHG emissions fromhydropower. They found that there were large variations in the emissions reported from thehydropower plants. The emissions started from 0.2 g CO2 - equivalents/kWh. The highestnumber found was 152 g CO2 - equivalents/kWh. The large range can mostly be explained bythe variation of GHG emissions from the flooded areas. It is important to remember that themeasured and reported emissions most often are the gross emissions. If the emissions from thedecaying if biomass not is taken into account the emissions per kWh is reduced to 2.9 g CO2 -equivalents. For run of river plants the emissions from possible flooded areas are not assessed.The emissions for this kind of plants are 4.9 g CO2 - equivalents/kWh. When the emissionsfrom the flooded area are not included for plants with reservoirs the range is narrowed to 0.2-11.2 g CO2 - equivalents/kWh (Raadal et al., 2011).
The report by Bratrich et al (2004) includes values for hydropower schemes in temperate re-gions. The emissions from a hydropower plant during the life cycle lies around 3-4 g CO2 -equivalents/kWh and 0.00001 g SOx/kWh and 0.00001 g NOx/kWh (Bratrich et al., 2004).
Kungliga Ingenjörsvetenskapsakademien, IVA has looked at LCA:s performed on hydropowerplants in Sweden. According to them the hydropower plants in Sweden have the same per-formance seen too emissions to air and water as wind power. There will be more carbondioxide emissions from regulated waters than waters without regulations. The water regula-tion contributes with 5 g CO2/kWh. They emphasize however the uncertainty in this numbers.The rivers in the north of Sweden have emissions that vary from 0.7 g CO2/kWh up to 13.2 gCO2/kWh. The average number for the emissions was 2.4 g CO2/ kWh (Hovsenius et al., 2002).
36
3.1. IMPACTS
To get a fair comparison of different kinds of energy systems it is important that the assessedhydropower plant is used only for producing electricity and not has a diversity of uses. Thewater in a reservoir could, even if that may not be the case in Sweden, for example also be usedfor irrigation. If that is the case, the emissions should be allocated so that the energy systemsget assessed on equal terms. According to Gagnon et al. (2002) this is often not done, whichleads to an overestimation of the emissions from the hydropower. Another aspect they mentionis the difference in energy systems that are intermittent or systems with low flexibility such asnuclear and run of river plants compared to hydropower plants with reservoirs that can produceenergy when there is a specific need for it. This should in the best of worlds be included inthe comparison of the emissions from the energy systems even if it is difficult to include. Away to include this for intermittent energy systems is to also include the backup system so thetotal energy systems work as a "stand-alone" system. If the backup system is not included itis important to point that out so that is known when assessing the emissions (Gagnon et al.,2002). Also in the report from IPCC they points out the importance of the allocation and thathow the allocation is done can play a significant role in the outcome of the LCA (Kumar et al.,2012).
The part contributing with most uncertainties when estimating the size of the GHG emissionsis the emissions from flooded areas. In boreal areas is the quantity of flooded biomass rathersmall, thus it is probable that the emissions will stay at about the same level. For tropical areasthe emissions could be higher than reported numbers (Gagnon et al., 2002). The emissionsfrom the plants reported by Gagnon et al. (2002) are from hydropower plants with moderntechnology, the size of the plants were not considered, the short-term performance of the plantswere used and the conditions were generally typical for the conditions in North-America andEurope. For hydropower plants with reservoirs, the typical size of the emissions were 15 g CO2
- equivalents/kWh and for run of river the plants the typical size was 2 g CO2 - equivalents/kWh.
LCA is one tool to estimate the impact from the different energy systems. The disadvantageaccording to Gagnon et al. (2002) is that the outcome of the LCA is largely affected by up-stream choices for energy supplies. The report gives the example that, if aluminium is used, thesize of the emissions will have large variations depending on what kind of energy is assumedto be used for the aluminium smelters, if it is energy from coal or from hydropower. To reducethese variations, another method, the energy payback ratio can be used. The energy ratio isthe energy produced by the energy system during its life span divided with the energy neededto build, operate and maintain the energy system. The higher ratio the better energy payback.For hydropower plants with reservoirs the typical energy payback ratio is 205. For run of riverplants the energy payback is as high as 267. The ratios are for plants with an expected lifelength of 100 years and for plants located in northeastern North America. To get a comparison
37
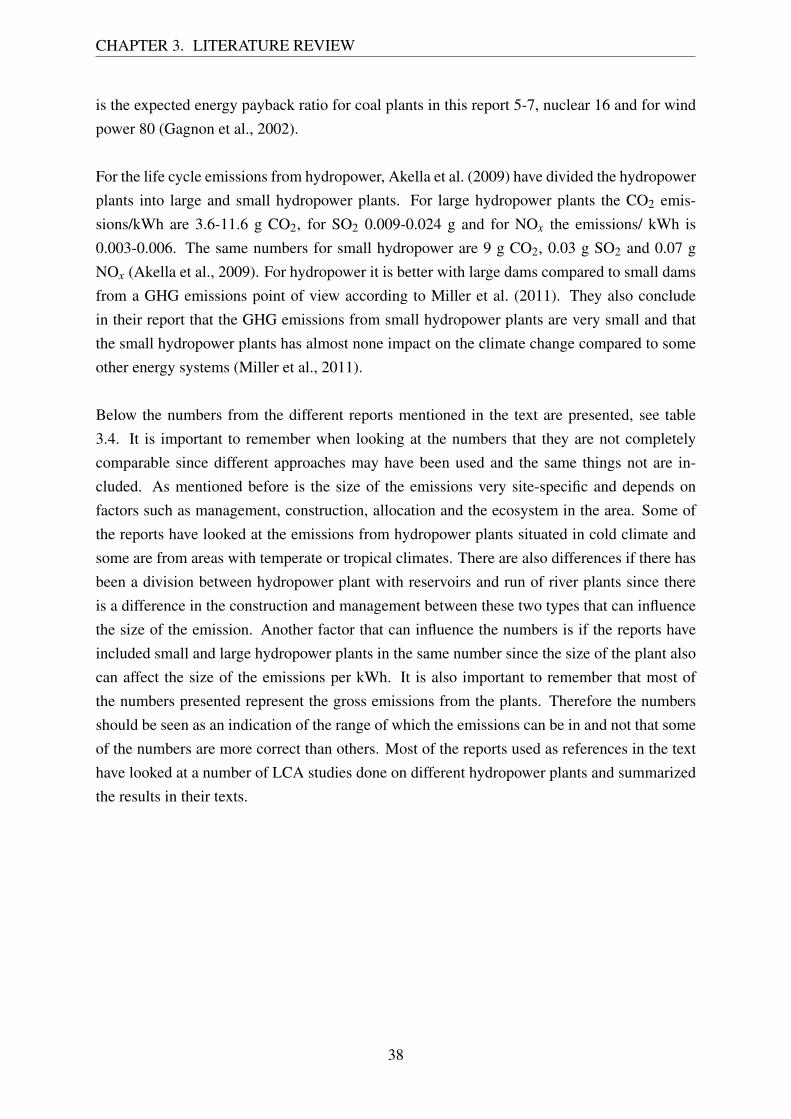
CHAPTER 3. LITERATURE REVIEW
is the expected energy payback ratio for coal plants in this report 5-7, nuclear 16 and for windpower 80 (Gagnon et al., 2002).
For the life cycle emissions from hydropower, Akella et al. (2009) have divided the hydropowerplants into large and small hydropower plants. For large hydropower plants the CO2 emis-sions/kWh are 3.6-11.6 g CO2, for SO2 0.009-0.024 g and for NOx the emissions/ kWh is0.003-0.006. The same numbers for small hydropower are 9 g CO2, 0.03 g SO2 and 0.07 gNOx (Akella et al., 2009). For hydropower it is better with large dams compared to small damsfrom a GHG emissions point of view according to Miller et al. (2011). They also concludein their report that the GHG emissions from small hydropower plants are very small and thatthe small hydropower plants has almost none impact on the climate change compared to someother energy systems (Miller et al., 2011).
Below the numbers from the different reports mentioned in the text are presented, see table3.4. It is important to remember when looking at the numbers that they are not completelycomparable since different approaches may have been used and the same things not are in-cluded. As mentioned before is the size of the emissions very site-specific and depends onfactors such as management, construction, allocation and the ecosystem in the area. Some ofthe reports have looked at the emissions from hydropower plants situated in cold climate andsome are from areas with temperate or tropical climates. There are also differences if there hasbeen a division between hydropower plant with reservoirs and run of river plants since thereis a difference in the construction and management between these two types that can influencethe size of the emission. Another factor that can influence the numbers is if the reports haveincluded small and large hydropower plants in the same number since the size of the plant alsocan affect the size of the emissions per kWh. It is also important to remember that most ofthe numbers presented represent the gross emissions from the plants. Therefore the numbersshould be seen as an indication of the range of which the emissions can be in and not that someof the numbers are more correct than others. Most of the reports used as references in the texthave looked at a number of LCA studies done on different hydropower plants and summarizedthe results in their texts.
38
3.1. IMPACTS
Table 3.4: Summary of GHG-emissions from different LCA studies
!"#$%&' ()*'"+,-./0"1&2''3456789'
:)*5:);'3456789' <);''3456789' <$&"'
!"#$%&'()'%*+',-.,/+'
0(1(&234&5'67.6' 7' 7' 8%9'%*13':3#;9'2%*#(1'%1'<4=<'%1'.>-'='?@,'(ABCD<':3&'&(1(&234&1'E#)')<('$%F3&4)G'H%1'E()H((;')<('$(;)43;(9+'
0#;'3:'&42(&5'67.>'
!I%=;3;'.JJK/+' .>'' 7' 7' L3&'M3*9'M*4$%)(+'N<('2%*#(1':3#;9':3&'&#;'3:'&42(&'H%1'%'E4)'*3H(&'
!N#&M3;4'()'%*+',-.O/+'
0(1(&234&5'..7,-' -+--67-7-O' -+--67-+--P' '
0#;'3:'&42(&5',7>'
!0%%9%*'()'%*+',-../+'
0(1(&234&5'-+,7.>,'
7' 7' D<(;')<('($41143;1':&3$')<(':*339(9'%&(%'H%1';3)')%C(;'4;)3'%MM3#;)':3&'Q*%;)1'H4)<'&(1(&234&1')<('?@,'2%*#(1'&%;=(9'E()H((;'-+,7..+,''
0#;'3:'&42(&5'6+J'
!R&%)&4M<'()'%*+',--6/+'
O76' -+----.' -+----.' N<('($41143;1'%&(':&3$'<G9&3Q3H(&'Q*%;)1'4;')($Q(&%)('&(=43;1+'
!8321(;4#1'()'%*+',--,/+'
-+K7.O+,' 7' 7' L3&'M3;94)43;1'4;')<(';3&)<'3:'SH(9(;'
!I%=;3;'()'%*+',--,/+'
0(1(&234&15'.>' 7'' 7' L&3$'Q*%;)1'14)#%)(9'4;';3&)<7(%1)(&;'T3&)<'U$(&4M%'
0#;'3:'&42(&5','
=>6"00/'"&'/0?*@@AB?'
V%&=('Q*%;)15'O+P7..+P'
V%&=('Q*%;)15'-+--J7-+-,6'
V%&=('Q*%;)15'-+--O7-+--P'
'
S$%**'Q*%;)15'J' S$%**'Q*%;)15'-+-O'
S$%**'Q*%;)15'-+-K'
'
To get a comparison of the size of the possible life cycle emissions from hydropower the lifecycle emissions from other energy sources are showed in the table 3.5 below.
Table 3.5: Life cycle emissions from different energy sources (Akella et al., 2009)
Energy source CO2 [g/kWh] SO2 [g/kWh] NOx [g/kWh]
Coal (best practice). 955 11.8 4.3
Oil (best practice) 818 14.2 4.0
Natural gas 430 - 0.5
Wind 7-9 0.02-0-09 0.02-0.06
Solar photovoltaic 98-167 0.2-0.34 0.18-0.3
Energy crops 17-27 0.07-0.16 1.1-2.5
!
39
CHAPTER 3. LITERATURE REVIEW
3.1.7 Biodiversity
The earlier sections in this impact chapter are describing the physical changes on the surround-ing ecosystem that the installation and operation of a hydropower plant can result in. Thesechanges will, in various degrees, affect the biodiversity. This section will therefore give anoverview of how the hydropower plants are affecting the biodiversity and which the effects are.
3.1.7.1 Introduction to Biodiversity and Hydropower
To know how the biodiversity is affected by installation and operation of hydropower plantsand the regulation of the water level following it, it is important to have an understanding forwhat biodiversity is. In the Convention on Biological Diversity from the United Nations, bio-diversity is described as "the variability among living organisms from all sources including,inter alia, terrestrial, marine and other aquatic ecosystems and the ecological complexes ofwhich they are part; this includes diversity within species, between species and of ecosystems"(CBD Secretariat, 2014). Biological diversity is more than just the sum of species numbers,it encompasses the variety, the variability and the uniqueness of genes and species and of theecosystems in which they occur. Generally, biodiversity can be said to be built up of threedifferent levels. To achieve a sustainable biodiversity there should be diversity on a geneticlevel within and between individual populations, diversity of species and in the interaction inbetween the species, and a diversity of ecosystems and habitats (Länsstyrelsen Kalmar län,2014). The biggest threats today against the biodiversity from a global perspective are destruc-tion of biotopes, over-exploitation and the introduction of alien species and genotypes. Thepreservation of different ecosystems is very important since the ecosystems provide us withservices that we cannot live without. It is the ecosystems that give us pollination, regulation ofthe climate, recirculation of nutrients, oxygen, food and drinking water to just a few ecosystemservices we will not survive without (Centrum för biologisk mångfald, 2010).
The knowledge about the impacts on the biodiversity is today rather limited. There has althoughbeen studies in the area, which have managed to point out which the main environmental im-pacts from a hydropower plant are. The main disturbances pointed out are habitat changes,geological and climate changes in the surrounding such as temperature changes, increased hu-man use of the area and the last one, direct mortality. According to these disturbances the mostserious causes from the installation from hydropower plants on the wildlife is permanent lossof habitat and special biotopes through inundation, fluctuating water levels, loss of flooding,introduction and dispersal of exotic species and also obstacles to fish migration. However, theimpacts are very general and it is hard to put any numbers on the losses. The impacts on biodi-versity are also site-specific and depend on the situation and ecosystem where the hydropowerplant is situated (Edenhofer et al., 2012). The report from The Swedish Agency for Marineand Water Management by Bergengren et al. (2013) points also out that it is very complex to
40
3.1. IMPACTS
quantify and be precise about how the biodiversity is affected and especially when it comes topopulation of terrestrial animals living close to streams.
The ecosystem around a stream includes several different parts. It is made up of the head-waters and the associated catchment areas, riparian areas, groundwater associated to the area,wetlands, estuaries and the environment close to the shores, which are dependent of the fresh-water coming from stream. As for other ecosystems, this type of ecosystem provides us withimportant ecosystem services. This kind of ecosystem stands for things such as flood control,storm protection, wild life, fish and forest resources. A modified habitat caused by hydropowerplant associated with a large dam often create environments that are more conducive to non-native and exotic plant, fish, insect and animal species. These resulting non-native speciesoften out-compete the native species. This often lead to developing ecosystems that are un-stable, nurture disease vectors, and are no longer able to support the social- and the historicalenvironmental components (Bergkamp et al., 2000).
It exists thus many important reasons for why we should preserve the biodiversity. There isecological, material, economical, cultural, social and health reasons to why we should not de-stroy the ecosystems surrounding us. Except for all these reason there are also an ethical reasonto why we should preserve the biodiversity. All species have the right to live and the humansliving now have a responsibility to preserve the biodiversity (Centrum för biologisk mångfald,2010).
According to Kungliga ingenjörsvetenskapsakademien IVA (2002) the hydropower rarely leadsto total exclusion of species and extinguishment of environments in a larger perspective. De-spite this, the proportions between different organisms often become changed and some envi-ronmental habitats will be increased to the detriment of some other habitats. Therefore, one cansay that hydropower is not influencing on a nationally level but however the local effects maybe significant (Hovsenius et al., 2002). Jansson (2002) indicates on the same thing and statesthat hydropower has caused relatively few species to go extinct from an entire river system inthe Northern Europe but at the scale of rivers however, regulation has reduced species richness.Bergengren et al. (2013) also states that it is known that species living in environments withflowing water are negatively affected due to installations of hydropower plants.
In the Environmental barometer on small hydropower from European Small Hydropower As-sociation (ESHA) (2009) experts in the subject were interviewed. According to most of theexperts the most critical impacts of small hydropower is that on the aquatic species. They ar-gue that not only fishes are affected but also other species living in the rivers. The species areaffected in the terms of migration, change in the conditions and quality of their habitats butalso in terms of mortality. Consequences due to morphological changes of the river and losses
41
CHAPTER 3. LITERATURE REVIEW
in the characteristics of the composition of the water are that some species can be disappearingand other can be arriving (European Small Hydropower Association (ESHA), 2009).
The International Energy Agency (2011) describes rather briefly how the biodiversity is af-fected by hydropower plants. They agree with European Small Hydropower Association (ESHA)(2009) that the power plants complicate or impede the migration for the fishes and they alsoindicate that the turbines can cause damages on the fish. The International Energy Agency(2011) also states that the other species living in the ecosystem surrounding the plant can beaffected even if the impacts not necessarily need to be adverse according to them.
3.1.7.2 The Riparian Zone
The riparian zone, which are the interface between land and a river or a stream, have an im-portant role in many ways, it gives for example protection for the fishes and the zone and itsvegetation supplies the water with dead organic matter. With high regulations of the stream theriparian zone can be destroyed. The riparian ecosystem will change when its adjoining aquaticenvironment changes. In streams where the water flow is undisturbed by humans, the waterregularly is flooding the strand zone, for example at the spring flood. These floods are nec-essary to maintain a high biodiversity in the vegetation. When these floods cease, the speciessensitive to competition get it harder to survive (Bergengren et al., 2013). Melin (2010) indi-cate that when a reservoir replaces a river environment it offers a new habitat with much lowerbiodiversity. Studies from Sweden and Canada has shown that the riparian zone surroundinga reservoir is decreased by 84% regarding degree of coverage and 34% regarding number ofspecies, compared to a natural river or a natural lake (Melin, 2010). It has also been shown thatthe use of hydropower, together with other impacts, is behind the larger reduction of speciesrichness in this kind of ecosystem compared to the species richness in marine and terrestrialecosystems (Malm Renöfält et al., 2010).
Species that will be affected by the water regulations are different species of insects. Theywill during the autumn lay eggs, if this will happen in dams with high water level the eggs canbecome to be drained when the level decreases. In the spring with low water level the eggs willbe exposed to drought and sunlight and thus find it difficult to survive (Hovsenius et al., 2002).Birds, whose main food is insects is then negatively affected because a reduced accessibility tofood. There is impact also on other birds but the correlations there are not as clear for insectseating birds (Bergengren et al., 2013). According to Bergkamp et al. (2000), waterbirds are im-portant components of the biodiversity of wetlands. They use natural and dammed open waterwetlands for breeding, and during their nonbreeding seasons for feeding and for roosting. Dueto regulation wetlands may be changed and the birds become affected.
42
3.1. IMPACTS
The riparian vegetation along run of rivers impoundments often forms a narrow belt withoutzonation close to the high water level, and below this there are sparse occurrences of amphibi-ous and aquatic species. In the report by Jansson (2002), the biological cost of hydropower, itis said that in free flowing rivers in northern Sweden there are about 90 vascular plant speciesper 200 m long stretch of river. Along run of river impoundments on the other side, about onefourth of the species have disappeared whereas one third of the species are lost from storagereservoirs compared to free flowing rivers. Another study from Gunnilboån in central Swedenindicates in the same direction by showing the effect of small hydropower on biodiversity. Inthe study the intensity of water flow variation was increased, making the stream frequently varyin width from 7 to 1-2 m. The result was that 62 of the 198 taxa found in the stream before thenew operations were missing (Jansson, 2002). Kungliga ingenjörsvetenskapsakademien IVA(2002) states that the highest water level aquatic plants can manage is about 2-3 m, if the depthincreases due to regulations the light needed in order to be able to live will become insufficient(Hovsenius et al., 2002). According to Jansson (2002) the effect of regulation on species rich-ness of riparian plants remains about 70 years after onset of regulations and will probably staypermanent.
3.1.7.3 Aquatic Species
As understandable, fishes are one of the species that are most affected by hydropower plants.Dams are closing waterways, and this eliminates the possibility for upstream migration for or-ganisms, especially for the fishes. Downstream migration can also be affected in the way thatthe only passage can be through the turbines (Hovsenius et al., 2002). Kumar et al. (2012) sug-gests that it is not only the possible fish barriers that can occur and affect the fishes negativelybut also changed flow regimes, changes in water temperature and destroyed habitats are im-pacts that harms the populations (Edenhofer et al., 2012). Bergengren et al. (2013) also agreeupon that one of the biggest problems with hydropower plants are that they work as barriersfor fishes. According to changed water flow regimes, short-term regulations can affect fishpopulations indirectly when the access to food decreases as a consequence of the regulation.Sudden regulations of the water could also flush spawn and roe away (Bergengren et al., 2013).In Bergkamp et al. (2000) it is written about 66 different case studies that have been assessedwith regard to the impacts of dams on fish biodiversity. They concluded that 27% of the caseshad positive impacts (i.e. increase in species richness). and 73% of the cases had a negativeimpact (i.e. decrease in species richness). Of those who were negatively affected 53% weredownstream of the dam, and had problem with the upward migration (Bergkamp et al., 2000).
The European eel (Anguilla anguilla) is one of the fish species that are very important to pro-tect. The eel is according to the ArtDatabanken critically endangered (ArtDatabanken SwedishSpecies Information Centre, 2010). The European eel population has declined dramatically
43
CHAPTER 3. LITERATURE REVIEW
over the past decades. The eels have a remarkable life cycle whose details are largely unknownto us humans. However it can broadly be described that they starts their life as larvae in theSargasso Sea and then crosses the North Atlantic until it reaches our latitude. When they havecrossed the Atlantic sea, they have evolved into glass eels and then developed to pigmentedjuvenile eels. Some of the juvenile eels migrate up the rivers and lakes, others stay in coastalwaters throughout their lives, while some periodically migrates between the sea and the fresh-water during the entire growing period. After the growing period the juvenile eels becomeyellow eels, this phase will last approximately for 2-20 years. After these years in freshwaterthe eels become sexually mature and the eels become known as silver eels. Now they begintheir migration back to the Sargasso Sea to spawn and then die. The migration barrier due tohydropower plant is a significant form of impact on the eel population and therefore also on thebiodiversity (Nyström, 2011; Calles et al., 2012).
Kungliga Ingengörsvetenskapsakademien, IVA says that the regulation of the water level willhave an impact on the benthos (Hovsenius et al., 2002). There exists a large diversity of speciesin the benthos and it is not unusual that the species have specific demands on the environmentthey live in, in form of e.g. temperature, the velocity of the water and water quality. When theenvironment is altered, it could lead to that the environments needed for the organisms livingin the benthos are destroyed. It has been seen that streams with highly reduced water flow hasa decreased biodiversity and also smaller amounts of the species living there. Heavily vary-ing flows, in form of for example short-term regulation means that the organisms are forcedto move to find the environmental conditions they need and also that there is a risk for thatthe organisms are flushed away when the flow changes (Bergengren et al., 2013). At stronglyreduced water levels the cavity in sediment and aquatic bryophyte will decrease, which alsowill have an impact on larger animals in the way they cannot establish (Hovsenius et al., 2002).
Some other organisms that will be affected in the way the water flows, the temperature changesand the turbidity are changed, are plankton. Plankton are organisms that float freely in thewater, and are therefore dependent on water currents to move. The plankton organisms includeanimals (zooplankton), plants (phytoplankton), algae, fungi (mykoplankton), bacteria (bacteri-oplankton) and viruses (virioplankton). Plankton forms the basic nutrition for organisms higherup the food web and are an important link in the cycling of nutrients (Nationalencyklopedin,n.d. ). If the amount of plankton decreases, it will indirectly affect many organisms due tothe fact that most marine food chains depend on the plankton’s presence as a primary foodsource. If the amount on the other hand increases the large amount of plankton makes the wa-ter transmits light less and that photosynthesis and oxygenation decreases in the bottom layerof the lake (Encyclopedia Britannica, n.d. ). The Kungliga ingenjörsvetenskapsakademien IVA(2002) says that there will be further indirect impacts on the plankton by changes of the riparianzone and the nutrition leakage accompanying.
44
3.1. IMPACTS
Freshwater mussels are another organism that become threatened of hydropower plants antits regulations. Some of the species live mainly in lakes and dams but all can be found in flow-ing water as well, such as the well-known freshwater pearl mussel. The freshwater pearl mussel(Margaritifera margaritifera) is an important species in the mussel family, this because it is arare population and that the population still remains small. Because of this the freshwater pearlmussel is classed as vulnerable at the Red List of Threatened Species. According to the EUHabitats Directive, regarding the protection of habitats for plants and animals, the freshwaterpearl mussels also are specially considered. The freshwater pearl mussel is dependent on trout(Salmo trutta) and salmon (Salmo salar), in the way they help for the mussel’s reproductionand works as a host for the mussels larvae. If there are trout and freshwater pearl musselsavailable in the streams it indicates on an in general good water environment. In streams wherethese two species become viable the environment for other species also are assumed to be good(Bergengren, 2008; Svensk Energi, 2012). Large freshwater mussels are today used extensivelyas environmental indicators, this is thanks to the complex reproduction. This means that themussels are relatively sensitive to the influence of their environment and therefore appreciativeto use as indicators. One reason for this is also that the mussels have a relatively long lifetime.At inventories of the freshwater pearl mussel, one important part is to note the smallest musselfound. This is in order to detect recruitment and the population’s viability. It is often generallysaid that individuals below 50 mm indicates that there has been recruitment during the past 10years (Bergengren, 2008).
A study of Xiaocheng et al. (2008) suggests that the sites beneath the dam of a hydropowerplant are the place that has the most different community structures. This was indicating thatdiverting the water current completely is harmful to the protection of macro invertebrate diver-sity of the river. Small insect nymphs and invertebrates, which cannot tolerate high velocities,are often under-represented in downstream reaches. Although run of river plants do not nor-mally affect downstream habitat or terrestrial habitat (Ghosh and Prelas, 2011).
In some ways, hydropower plants can lead to an increased primary production. This can be thecase for aquatic macrophytes. At the inlets to a reservoir, water depths can become reduced,and then rapid build up of deposits near river can encourage macrophyte growth. However,if there are large water fluctuations their ability to colonies these areas may be limited. Theincreased growth of macrophytes can be a positive impact as they create wetland-like condi-tions with good biodiversity values, but also support fisheries and assist in structuring habitats.However, there can also be a negative impact in the way an increased production can providehabitat for disease vectors such as bilharzia-carrying snails and mosquitoes (Bergkamp et al.,2000).
45
CHAPTER 3. LITERATURE REVIEW
3.2 Mitigation Actions
The purpose of environmental mitigation requirements at hydroelectric projects is to avoid orminimize the adverse effects of development and operation. Hydropower mitigation usuallyinvolves costs, such as reduced profits to developers and reduced energy production. The im-plementation of the measures should be followed by a monitoring phase, in order to check theeffectiveness on biological function. In the follow section some types of mitigation actions willbe described.
3.2.1 Dam Removal
Dam removal is becoming a more frequently used management option all around the world.Although, the practice of using dam removal as an environmental restoration method in Swe-den is rather new. Dam removal is taking into consideration for especially old dams in needof renovation or small dams that are no longer used or have lost most of their reservoir capac-ity. Another point of view is that dams and the reservoirs have many ecological effects, thedisruption of the movement of different organisms is probably the most important reason fordam restoration. Thereby, dam removal makes it possible for fish migration and fish species toshift from lentic to lotic, which in turn have the ability to migrate and reproduce in free-flowingwater (Lejon et al., 2009)
Under some circumstances it may be economically more beneficial for the dam owner to re-move the dam than to keep it, even if it still produces revenue. From a study made in USA,14 dam removals in Wisconsin showed that the estimated cost of repair was on average threetimes higher than that the cost of removal. Removal can also be economically preferable to ren-ovation because of the environmental benefits gained from the restoration of turbulent streamreaches and thus fish migration routes. Another important aspect for removing a dam is thesafety issue, especially in cases in which dams are in bad shape and hold large amounts ofwater (Lejon et al., 2009). In the report from World Commission on Dams (2000), incentivesto removal of dams are mentioned and could e.g. that the dams no longer are have an usefulpurpose, too large impacts and too expensive to maintain the safety.
There are no general guidelines on how to accomplish dam removals, neither are there anylong term studies to learn from. Nevertheless, the choice to remove the dams is becoming morecommon because the recreation of more natural aquatic habitats is achievable and also politi-cally desirable (Lejon et al., 2009). Most of the rivers can although not be completely restoredto the condition it was before the dam was built. But the removal can however often recreateconditions that move the river towards those historic conditions (American Rivers, 2014)
46
3.2. MITIGATION ACTIONS
According the many facts that dams contribute with negative consequences on the ecosystemone would assume that the society would support a dam removal decision. However, this isoften not the case. In the report of Lejon et al. (2009) another study also from Wisconsin inUSA is mentioned. The study shows that in all the cases of the removal of 14 dams citizensoriginally opposed the removal when it was first discussed at stakeholder meetings. Due to lackof information and misconceptions about what will happen after a dam is removed people thinkthat the removal of a dam will alter the scenery in a negative manner.
American Rivers (2014) state that dam removal can result in fundamental changes to the lo-cal environment. They claim that dam removal can have short-term impacts such as increasedwater turbidity, water quality impacts from sudden releases of water, changes in temperatureand sediment build-up downstream from releasing large amounts of sediment from the reser-voir. The long build-up of sediment can contain toxic substances and the resuspending ofaccumulated toxic-laden sediments in the process of dam removal has the potential to damagedownstream water quality and threaten the health of fish and wildlife. However, AmericanRivers (2014) also state that these short-term impacts are greatly outweighed by the quick re-covery of the system and the long-term benefits that result from the dam removal.
Lejon et al. (2009) agrees with American Rivers and writes about a study from Wisconsin,which showed that vegetation established quickly after a dam removal and that less than 1%of all sampled areas (five quadrates out of a total of 650 surveyed) was bare sediment evenon sites restored as recently as a year previously. The production capacity was even measuredto be higher in former reservoirs compared to reference sites. This was probably because ofnutrient-rich sediments and good access to sunlight (Lejon et al., 2009).
In some cases rivers can be so heavily developed and dammed that the removal of one damwill be pointless or just return flows to a smaller part of the river. Although, American Rivers(2014) claim that dams that have been targeted for removal generally have been strategicallylocated and therefore, this additional section of river is enough to sustain a crucial section ofthe river critical to fish and wildlife.
The fact when removing a dam is that the electricity production will be less or completelydisappears. The difficult position is therefore to weight the economic interest against the envi-ronmental gains that can be made by removing a dam (Ingram, 2012).
3.2.2 Flow Regulations
In order to make the use of hydropower plants more compatible with the natural life of rivers, aminimum flow must be released so as to assure the preservation of the hydrological continuity
47
CHAPTER 3. LITERATURE REVIEW
of the river and the consequent conservation of natural habitat and ecological life (EuropeanSmall Hydropower Association (ESHA), n.d. ). Minimum flow release means that you allowsome flow below a hydropower plant with the dual aim of maintaining current water ecologi-cal conditions and partly also for aesthetic or recreational purposes on a watercourse distance,which would mostly had remained drained otherwise (Erlandsson, 2008). According to Vovk-korže and Korže (n.d. ) the concept of minimum flow release is that a threshold value shouldbe kept above which the discharge has to be kept all time in order to ensure the survival ofdownstream ecosystem.
The Irish Department of Communications Energy and Natural Resources (2007) agrees thatthe minimum flow is important. They state that the minimum flow would be designed to ensurean adequate flow regime downstream of the power plant to accommodate upstream migration,spawning sites, safeguard juvenile salmonids, and invertebrate life and also maintain holdingpools for adult fish. They claim that an amount of water also should be released even at lowsummer flows.
Proper dimensioning of the release of minimum flow is controversial because the problemthat energy output will be lost. This factor often contributes to the fact that no action to useminimum flow is done. Another contributing factor to that minimum flow not is applied is thatthere is no uniform method for determining the amount of the released flow in Sweden and lackof knowledge counteracts the attempt of action (Erlandsson, 2008). The Irish Department ofCommunications Energy and Natural Resources (2007) state that the release of minimum flowlargely depends on the type of the riverbed and varies greatly from site to site.
Even though there is no uniform method to determine how a minimum flow should be ap-plied, there are several general assessment methods. The methods range from simple, desktopcalculations to methodologies that may require considerable site-specific fieldwork (Oak RidgeNational Laboratory et al., 2010). Nevertheless, it is still quite difficult to express biologicalaspects in a mathematical formula. The European Small Hydropower Association (ESHA)(n.d. ) state that there is a common belief among ecologist associations that it almost is im-possible to extrapolate a optimum minimum flow to a special area. They claim that the ansite-specific approach is needed, together with field activities and modelling, intregrated visionof the ecosystem and collaboration of competences.
Compared to mitigation measures like for example fish ladders and fish friendly turbines, theinitiating of flow releases are not contributing to large construction costs or any installation ofhardware that is difficult to remove or alter. Environmental flow releases can rather be alteredrelatively easily to make experiments and test hypotheses and to optimize environmental bene-fits and power production (Oak Ridge National Laboratory et al., 2010).
48
3.2. MITIGATION ACTIONS
To avoid draining out of the river bed by using minimum flows is essential for aquatic organ-isms, but it is also important to work towards a more dynamic regulation that follows the naturalseasonal variations in order to protect the ecosystem. The level of the minimum flow should beset to reflect the variability in the flow regime in the current location. Completely static mini-mum flows should therefore be avoided (Malm Renöfält and Ahonen, 2013). According to theSwedish Society for Nature Conservation the release of the minimum flow should correspond tothe normal low water flow, thus about 5-20% of the average water flow depending on location.The pursuit should be that the minimum water flow over time at least corresponds to the nat-ural low water flow with natural dynamics for the season (Fiskeriverket and Naturvårdsverket,2008).
3.2.3 Sedimentation Measures
The problem with sedimentation in the surroundings of the hydropower plant can be mitigatedby for example the construction of small-scale weirs to trap the sands and the particles that latercan be manually removed (International Energy Agency, 2006). A direct approach to reducethe accumulation of sediment is to mechanically remove the sediments by periodic dredging(Bergkamp et al., 2000). Another way to deal with the sediment problem could be to remove itthrough periodic flushing of the reservoir by releasing large volumes of water through outletsin the dam. In the case of run of rivers the sediment can be reduced by using flow diversion,which excludes the sediment (Melin, 2010).
3.2.4 Biotope Adjustments
Through the creation of greater environmental heterogeneity, by using such as habitat adjust-ing measures, the biological diversity of the benthic fauna will be strengthened (Hovseniuset al., 2002). Gravel and rock bottoms are for example very important for the reproduction ofmigrating fish. In order to improve the habitat in the rivers, restoration can be made throughartificial alterations of the channel morphology involving elevations and indentations to creategood places for the fish. Stone blocks and rocks among other things will be placed in the riverand thus creating stream concentrations and barriers. New spawning sites can also be createdfor example by putting out gravel to give a natural impression (Erlandsson, 2008). To makethese adjustments to be efficient, however, the water depth have to be greater than 2 m in orderto prevent the area from drying out or to freeze at the bottom (Hovsenius et al., 2002). The ad-justed areas should also not be so small that there becomes a risk for the fish or other organismsto fall prey to predators (Erlandsson, 2008).
Biotope adjustments are often accepted as successful substitutes for increased releases of water
49
CHAPTER 3. LITERATURE REVIEW
in Sweden. Biotope adjustments have for a long time been established in Sweden, but it hasalthough been little requirement to evaluate the outcome of such undertakings in scientificallysatisfactory ways, making it difficult to say what advantages and disadvantages it has (Svens-son, 2000).
Costs for biotope adjustments vary considerably, according to Svensson (2000) total amountsexpended, including planning and field-working, range between SEK 15 000 and 50 000 perkilometre of the river.
3.2.5 Fishways
The construction of a hydropower plant in a stream often results in that where it before waspossible to migrate for the species in the stream, there is now a barrier that stops the speciesfrom migrating, both upstream and downstream. To facilitate for the migration of the speciesin the streams it is therefore desirable to construct fishways (Oak Ridge National Laboratoryet al., 2010). The aim should always be to allow passage for all occurring species, not onlyfish, but also benthic invertebrates, mammals and amphibians and the fishways should enablemigration both upstream and downstream (Länsstyrelsen Västra Götalands län, n.d. a).
To make fishways possible and efficient there are many factors that have to be taken in ac-count. One of the big problems for passage through fishways is to direct the fish into them.A common cause of dysfunction of many fishways would be that a low flow of water wouldbe directed to the fishway in relation to the total flow of the river. The flow of water to andfrom a fishway must therefore have sufficient water velocity to attract the fish. Otherwise thefish will not simply find the fishway or just ignoring it in the belief that it is a smaller tributary(Länsstyrelsen Västra Götalands län, 2005b). It is therefore important to know which period ofthe year the fish migration occurs in order to construct fishways that takes into account the waterflow at that particular period of migration (Ström, 2012). According to Bourgeois and Therrien(2000) the volume of discharge through the fishway and the attraction flow should be about1-5% of the mean stream flow during the migration period. According to the Irish Departmentof Communications Energy and Natural Resources (2007) tests have been done, which haveshown that if the ratio between the outflow velocity from the fishway downstream and the ve-locity in the receiving pool should be at least 3:1 to make the fish attracted to the fishway. Thewater depth at the outflow downstream of the fishway should be adequate and there is a needof a pool with sufficient depth to allow the fishes to rest before entering or finishing the fishway.
Another important factor to make the fishway well functioning is the location of the fishwayentrance. The entrance should be positioned as close as possible to the barrier. The entranceshould also be constructed in the way that high flows and turbulence would be avoided, which
50
3.2. MITIGATION ACTIONS
would otherwise complicate the entrance for the fish (Bourgeois and Therrien, 2000). Theslope of the fishway is another factor to be considered. According to the Environmental Protec-tion Agency’s recommendations, the slope of a pool-type fishway should not exceed 10% forsalmonids. For other fish spices, the slope should ideally be less than 10%. A Denil fishwaymay have a slightly higher slope, up to 25% for salmonids and 10-15% for trout (LänsstyrelsenVästra Götalands län, 2005b).
The angle between the flow from the fishway downstream and the main flow is also impor-tant. It is best to have the attraction flow parallel to the main flow. If this angle increases theattraction to the fishway decreases. The best situation for the fish is when they do not have toturn back to find the entrance (Irish Department of Communications Energy and Natural Re-sources, 2007).
A lot of new different techniques are under development, which incorporate a more sophis-ticated technology. Technologies like this can for example be light- or sound-based guidancemeasures that are used to help fishes to pass obstacles with a minimal loss of flow for powergeneration (Sale et al., 1991).
There exist also possibilities to facilitate fish migration without constructing fishways. Onesolution can be to trap and transport the fishes. This type involves attracting and trapping thefish below a barrier and then physically transports them over the barrier. This solution althoughrequire much more work (NSW Department of Primary Industries, n.d. ).
3.2.5.1 Examples of Fishways
According to Fiskeriverket and Naturvårdsverket (2008) there are four natural-like options tomake migration possible. The four different options that can be taken to action is removal of theobstacles, upfilling of the watercourse downstream the migration barrier with for example natu-ral stones so that the bottom of the watercourse become to be at the same level as the migrationbarrier. The migration barrier is eliminated by rising up the entire watercourse (LänsstyrelsenVästra Götalands län, 2005b). Next option can be to build a stream through the obstacle (Sjö-lander et al., 2009). The last nature-like fishway option is to construct a stream around theobstacle. When constructing this new way it is important that it is made in the way that theslope becomes small, this however often entails that its path becomes long (Länsstyrelsen Väs-tra Götalands län, 2005b). According to Erlandsson (2008) fishways built in this way, are about50-90 m long distributed over a vertical drop of three to 6 m. This means that the constructionof a bypass channel assumes that the environment around the migration barrier is relatively flatand does not consist of, for example mountain. The benefit of the construction of bypass chan-nels like this is that it fits all different kinds of fish species and is almost maintenance-free. The
51
CHAPTER 3. LITERATURE REVIEW
idea is that it completely will mimic a natural watercourse and even may contribute to that anew reproduction and growth local will be formed (Fiskeriverket and Naturvårdsverket, 2008;Länsstyrelsen Västra Götalands län, 2005b).
Fiskeriverket and Naturvårdsverket (2008) also states that there in addition to these natural-likefishways also are five technical solutions available. Common to these five different construc-tions is that usually only fish can pass through them. They are also often very selective, thusonly certain species and sizes of fish can pass. These technical solutions are often used at powerplants with high heads. The five different constructions are; construction of spillways or stepsin the barrier that allows passage, pool-type fishway, vertical-slot fish passage, Denil fishwayand finally, also eel and elver fishways can be constructed (Fiskeriverket and Naturvårdsverket,2008).
The pool-type fishway is one of the most common types of fishways used in the society to-day. The construction is based on pools, which the fish has to jump between to move throughthe fishway. Drawback of this fishway is that it is primarily suited to salmonids because theyhave a better ability to jump. The fishway is also very sensitive to variations in water flow.Advantage of this type of fishway is however that it has relatively low construction costs andthat it does not require as much maintenance work (Länsstyrelsen Västra Götalands län, 2005b).
The vertical-slot fishway is similar to a pool-type fishway except that each pool has a smallerslot in the wall. This helps fish to swim through the fishway without jumping (Pettersson, n.d. ).The benefits of a vertical-slot fishway construction are that it works in all different kinds of wa-ter flows and that it also is suitable to many different fish species. The disadvantages are that itis expensive and complicated to build (Erlandsson, 2008).
The Denil fishway uses a series of symmetrical close-spaced baffles in a channel to redirectthe flow of water. This creates turbulence in the water flow, which in turn reduces the watervelocity (Länsstyrelsen Västra Götalands län, 2005b). This type of fishway is common at highheads and at areas where it is lack of space (Erlandsson, 2008). The benefits of a Denil fishwayis that it can handle large gradients and that it is not as sensitive to variations in water flow. Thedrawbacks are that they require much inspection because branches easily get stuck between thebaffles (Länsstyrelsen Västra Götalands län, 2005b).
For eels and elvers it is often very difficult to use traditional fishways due to the water ve-locity. Therefore it is a need of a special way for these young eels. These fishways are based onthe ability of eel/elvers to climb and crawl when passing an obstacle, a wet and rough surfaceis therefore required for the construction of this way (Vovk-korže and Korže, n.d. ). The eel andelver fishway is often constructed of plastic tubes with some kind of substrate inside, which
52
3.2. MITIGATION ACTIONS
make it possible for the eel to move forward (Länsstyrelsen Västra Götalands län, 2005b).
3.2.6 Fish Plantations
These obstacles hydropower plants pose to migrating fish has made it necessary to artificiallymanage the fertilization, hatching, growth and release of especially salmonid fish (Kungligaingenjörsvetenskapsakademien IVA, 2002). To introduce planted fish to protect endangeredspecies or reintroduce species that have disappeared may be of great benefit to the environmentand the biodiversity (Jordbruksverket, 2014). Fish farming has long been used in Sweden andis important in order to maintain a certain stock of various species. The technology used todayhowever, affects the ecology, behaviour and genetics in wild populations and need to be devel-oped to become a more naturalistic fish farming (Erlandsson, 2008).
The disadvantage of farmed fish is that they differ from the wild in for example appearanceand behaviour. Release of those fishes therefore represents a risk that infectious fish diseasesare spread and that different species of fish will be spread in an undesirable way to environ-ments where they do not belong (Jordbruksverket, 2014). The introduction of planted fish canbring the risk that the new species will predate or invade the ecological niches of native species,so reducing the biological diversity instead (Bergkamp et al., 2000).
As the fish grows up in safe catchment areas with a good supply of food, they are not fullyadapted to life in a natural water stream and the survival thus become lower than for naturalfishes once they are released into freedom (Erlandsson, 2008). In Forskning & Framsteg it canbe read that Fiskeriverket has studied planted eels in Mälaren in Sweden. From this study ithas been seen that when it was time to begin the migration, only a few of the eels found theirway out of the lake. This has been proven to be a widespread problem among the importedstocks. One explanation for their lack of orientation may be that they were transported to therelease sites rather than to swim there. Indeed, there are studies that show that eels are orientedby the magnetic fields in the earth’s crust, and it is believed that they create a kind of internalmap during their travels, which will help them to find back the way they came (Nyström, 2011).
Another problem with fish plantation is that the planted fish become merged with various com-munities from a river that developed over a very long time period, which means that you get anew tribe that will not be adapted to any part of the watercourse instead (Erlandsson, 2008).
3.2.7 Fish Friendly Turbines
Fish friendly turbine technology is an emerging technology that provides a safe approach forfish passing though the turbines by minimizing the risk of injury or even death (Edenhofer et al.,
53
CHAPTER 3. LITERATURE REVIEW
2012). The research, which is done on fish friendly turbines, mostly aims at reducing four dif-ferent causes of harm. These causes are strike, shear forces, pressure and cavitation (Bourgeoisand Therrien, 2000). Conventional hydropower turbines only focus on electrical power gener-ation, the aim of the new fish friendly technology is to bring benefits for both power generationand the protection of fish species (Edenhofer et al., 2012).
Much of the ongoing research in the hydropower sector is concerned with the attainment ofthe ideal turbine. The U.S. Department of Energy initiated the Advanced Hydropower TurbineSystem (AHTS) Program for developing just as wanted a low impact, fish friendly turbine. Anew turbine, the Alden turbine, which is designed by the Alden Research Laboratory amongothers, has today been developed under this AHTS program and is based on the shape of apump impeller. This one will minimize the leading edge of the blade and maximize the size offlow passages (Ghosh and Prelas, 2011). The Alden Laboratory predicts that this fish friendlyturbine will have a maximum efficiency of 90.5% with a survival rate for fish of between 94and 100% (Edenhofer et al., 2012). As a result of this research work, the Alden turbine is nowready for installation and further testing at a hydroelectric plant will be carried out during thefollowing years (HydroWorld, 2013).
Another principle that can be used to be friendlier to the fish is the Archimedes screw. TheArchimedes screw is a slow speed rotor and thanks to their much slower rotations velocity theturbine become fish friendly (European Small Hydropower Association (ESHA), n.d. ). Thescrew works in the way that it takes in large blocks of water that travel slowly down the ma-chine before emerging at the end. The blocks of water bodies are large enough to hold largefish. The speed of the blades on the rotor is very low, and they tend to bring the fish aside ratherthan hurt them. There are neither any high-pressure regions impacting the fish in the waterbecause of the low forces from the screw. The Environmental Agency in the UK have beeninvolved in considerable testing of the impact on fish from the screw, and they have found thatdamage to fish is extremely low or non-existent (Hutton, 2012).
There is still much to be learned about the causes and extent of injuries in the turbine sys-tem as well as the significance of indirect mortality and the effects of turbine passage on fishes.However, improvements in turbine design and operation, as well as new fields, laboratory fa-cilities and modelling techniques to assess turbine-passage survival, are contributing toward abetter solution of the fish passage issue at hydropower plants.
54

Chapter 4
Case Study
Borås Energi och Miljö are the owners to four different hydropower plants, located in themunicipality of Borås and in adjacent municipalities. This section will give information aboutthe hydropower plant and the environment surrounding the hydropower plants. The figure 4.1on the next side shows a schematic orientation map of Ätran and Viskan and gives an overviewof where the hydropower plants are located and how many other plants that are located in thetwo streams. Since three of the plants are located in tributaries to Viskan, also those streamsare included on the map.
55
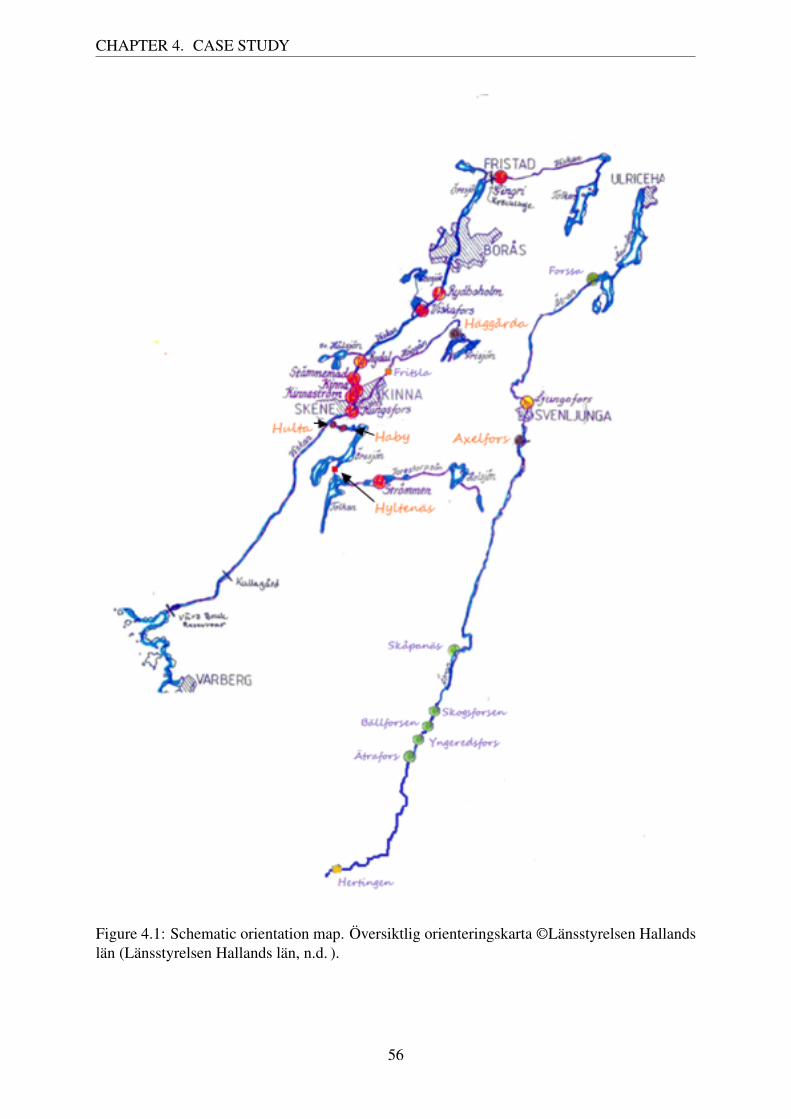
CHAPTER 4. CASE STUDY
Figure 4.1: Schematic orientation map. Översiktlig orienteringskarta ©Länsstyrelsen Hallandslän (Länsstyrelsen Hallands län, n.d. ).
56

4.1. SUMMARY AND HISTORY ABOUT THE HYDROPOWER PLANTS
4.1 Summary and History About the Hydropower Plants
The hydropower plants owned by Borås Energi och Miljö were all built in the beginning in thefirst part of the 20:th century. The conditions at the different sites were considered as favourablefor the construction of hydropower plants since possible problem with cold weather and snowcould be considered as small. All the four hydropower plants are situated in Götaland andSMHI describes the climate in Götaland as temperate/mesothermal climate in the coast regionsand the other parts of Götaland as continental/microthermal climate (SMHI, 2009a). The con-tinental/microthermal climate is about the same as the boreal climate and even if it is hard inthis case to find an exact definition of which climate zone the four hydropower plants belong to,so according to what can be read at SMHI (2009a), the climate can be compared with a borealclimate.
The four hydropower plants are of similar size even if there are some differences in the con-struction. Due to the long time period since the hydropower plants were built, there have beenchanges at the sites and the following sections will describe the hydropower plants and whichchanges that have been performed at the hydropower plants. The sections will also give anintroduction to the hydrology at the sites and how the lakes, used as reservoirs, are regulated.
4.1.1 Haby
1912 the decision was made by Borås city to start to construct a hydropower plant in Haby inSlottsån. The conditions at the place were considered to be favourable for the construction ofa hydropower plant. Haby is located three kilometres south of Skene, in the municipality ofMark and at Haby is the catchment area 413 km2. The average water flow at the plant is 7m3/s and the hydropower plant has a head of 27.8 m. Upstream of Haby are the lakes Öresjönand Tolken. Öresjön consists of Västra and Östra Öresjön. To ease the control of the flowthrough Haby and the electricity production, Borås Energi och Miljö were given permission toregulate the water level in the Öresjön and Tolken. By being given the permissions to regulatethe lake Öresjön 2.8 m and Tolken 2.5 m, storage of 60 million m3 was possible (Borås En-ergi och Miljö, n.d. b). There are no requirements on a minimum flow from the plant. Eventhough they have the possibility to regulate both of the lakes more than 2 m the usual varia-tions in the water level lies in the range 1-1.5 m and can at occasions reach 2 m (Fredberg, n.d. ).
The construction of the plant started in February 1913 and two years later in January it waspossible to start up the plant. From the regulation dam in Öresjön, a 200 m long headrace wasbuilt to lead the water. After the headrace follows a 630 m long tube made out of steel and witha diameter of 4 m. The steel tube ends up with swelling tower and thereafter is there a 100 mlong tube down to the turbines, see figure 4.2. The purpose of the swelling tower is to work as
57
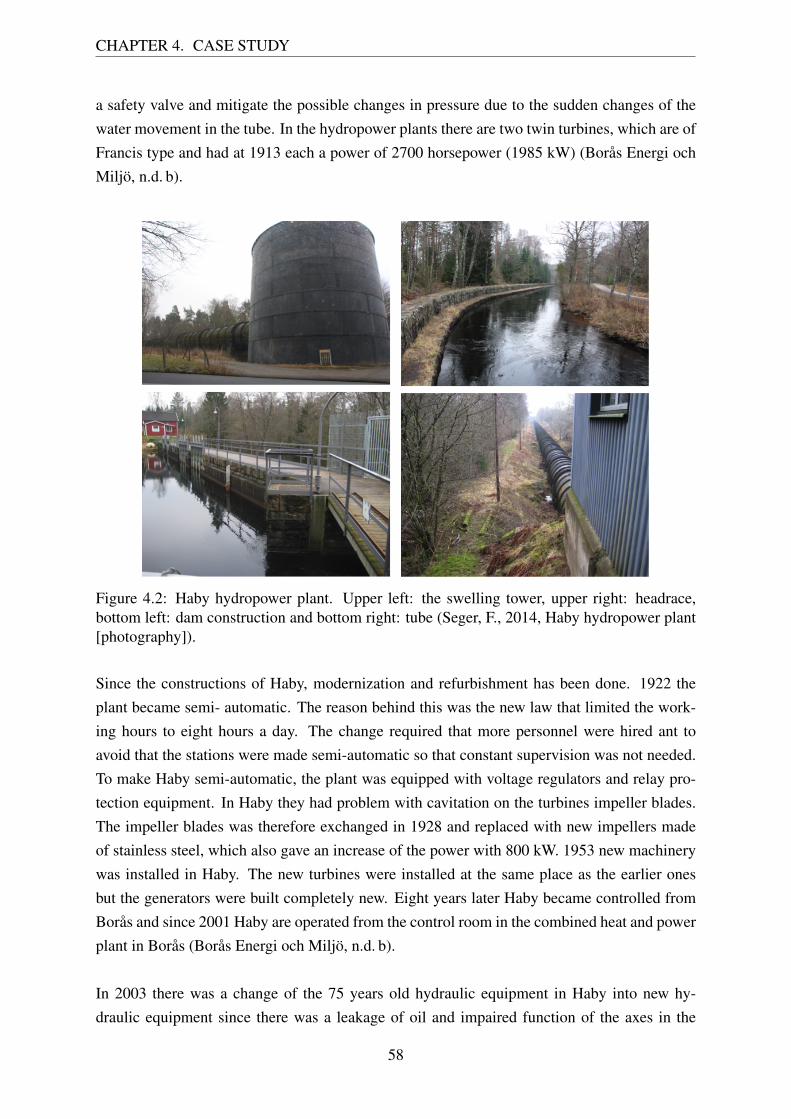
CHAPTER 4. CASE STUDY
a safety valve and mitigate the possible changes in pressure due to the sudden changes of thewater movement in the tube. In the hydropower plants there are two twin turbines, which are ofFrancis type and had at 1913 each a power of 2700 horsepower (1985 kW) (Borås Energi ochMiljö, n.d. b).
Figure 4.2: Haby hydropower plant. Upper left: the swelling tower, upper right: headrace,bottom left: dam construction and bottom right: tube (Seger, F., 2014, Haby hydropower plant[photography]).
Since the constructions of Haby, modernization and refurbishment has been done. 1922 theplant became semi- automatic. The reason behind this was the new law that limited the work-ing hours to eight hours a day. The change required that more personnel were hired ant toavoid that the stations were made semi-automatic so that constant supervision was not needed.To make Haby semi-automatic, the plant was equipped with voltage regulators and relay pro-tection equipment. In Haby they had problem with cavitation on the turbines impeller blades.The impeller blades was therefore exchanged in 1928 and replaced with new impellers madeof stainless steel, which also gave an increase of the power with 800 kW. 1953 new machinerywas installed in Haby. The new turbines were installed at the same place as the earlier onesbut the generators were built completely new. Eight years later Haby became controlled fromBorås and since 2001 Haby are operated from the control room in the combined heat and powerplant in Borås (Borås Energi och Miljö, n.d. b).
In 2003 there was a change of the 75 years old hydraulic equipment in Haby into new hy-draulic equipment since there was a leakage of oil and impaired function of the axes in the
58
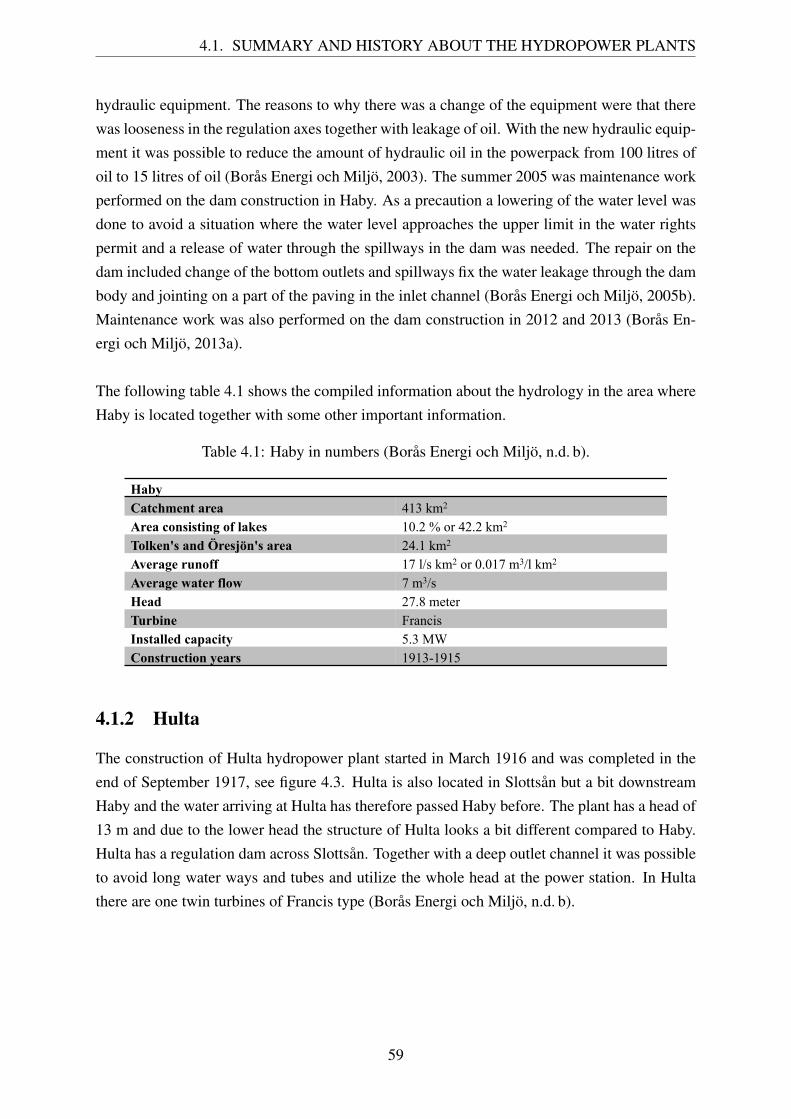
4.1. SUMMARY AND HISTORY ABOUT THE HYDROPOWER PLANTS
hydraulic equipment. The reasons to why there was a change of the equipment were that therewas looseness in the regulation axes together with leakage of oil. With the new hydraulic equip-ment it was possible to reduce the amount of hydraulic oil in the powerpack from 100 litres ofoil to 15 litres of oil (Borås Energi och Miljö, 2003). The summer 2005 was maintenance workperformed on the dam construction in Haby. As a precaution a lowering of the water level wasdone to avoid a situation where the water level approaches the upper limit in the water rightspermit and a release of water through the spillways in the dam was needed. The repair on thedam included change of the bottom outlets and spillways fix the water leakage through the dambody and jointing on a part of the paving in the inlet channel (Borås Energi och Miljö, 2005b).Maintenance work was also performed on the dam construction in 2012 and 2013 (Borås En-ergi och Miljö, 2013a).
The following table 4.1 shows the compiled information about the hydrology in the area whereHaby is located together with some other important information.
Table 4.1: Haby in numbers (Borås Energi och Miljö, n.d. b).
Haby Catchment area 413 km2 Area consisting of lakes 10.2 % or 42.2 km2 Tolken's and Öresjön's area 24.1 km2 Average runoff 17 l/s km2 or 0.017 m3/l km2 Average water flow 7 m3/s Head 27.8 meter Turbine Francis Installed capacity 5.3 MW Construction years 1913-1915
4.1.2 Hulta
The construction of Hulta hydropower plant started in March 1916 and was completed in theend of September 1917, see figure 4.3. Hulta is also located in Slottsån but a bit downstreamHaby and the water arriving at Hulta has therefore passed Haby before. The plant has a head of13 m and due to the lower head the structure of Hulta looks a bit different compared to Haby.Hulta has a regulation dam across Slottsån. Together with a deep outlet channel it was possibleto avoid long water ways and tubes and utilize the whole head at the power station. In Hultathere are one twin turbines of Francis type (Borås Energi och Miljö, n.d. b).
59
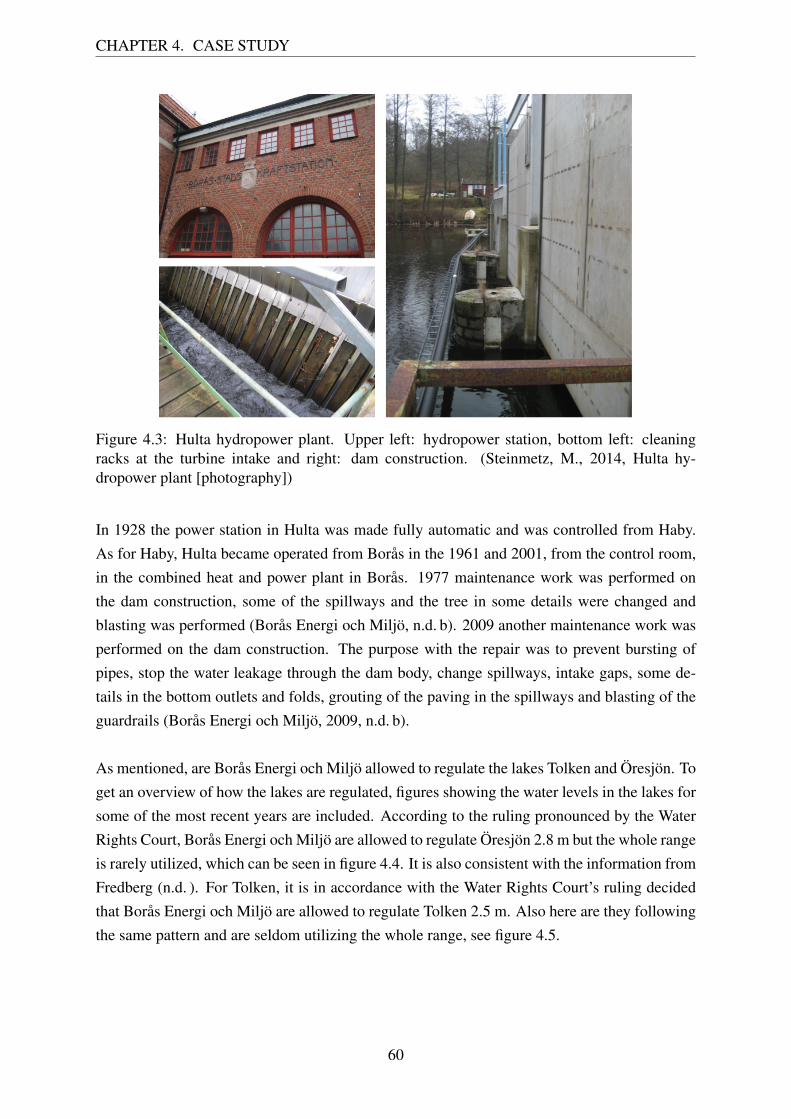
CHAPTER 4. CASE STUDY
Figure 4.3: Hulta hydropower plant. Upper left: hydropower station, bottom left: cleaningracks at the turbine intake and right: dam construction. (Steinmetz, M., 2014, Hulta hy-dropower plant [photography])
In 1928 the power station in Hulta was made fully automatic and was controlled from Haby.As for Haby, Hulta became operated from Borås in the 1961 and 2001, from the control room,in the combined heat and power plant in Borås. 1977 maintenance work was performed onthe dam construction, some of the spillways and the tree in some details were changed andblasting was performed (Borås Energi och Miljö, n.d. b). 2009 another maintenance work wasperformed on the dam construction. The purpose with the repair was to prevent bursting ofpipes, stop the water leakage through the dam body, change spillways, intake gaps, some de-tails in the bottom outlets and folds, grouting of the paving in the spillways and blasting of theguardrails (Borås Energi och Miljö, 2009, n.d. b).
As mentioned, are Borås Energi och Miljö allowed to regulate the lakes Tolken and Öresjön. Toget an overview of how the lakes are regulated, figures showing the water levels in the lakes forsome of the most recent years are included. According to the ruling pronounced by the WaterRights Court, Borås Energi och Miljö are allowed to regulate Öresjön 2.8 m but the whole rangeis rarely utilized, which can be seen in figure 4.4. It is also consistent with the information fromFredberg (n.d. ). For Tolken, it is in accordance with the Water Rights Court’s ruling decidedthat Borås Energi och Miljö are allowed to regulate Tolken 2.5 m. Also here are they followingthe same pattern and are seldom utilizing the whole range, see figure 4.5.
60
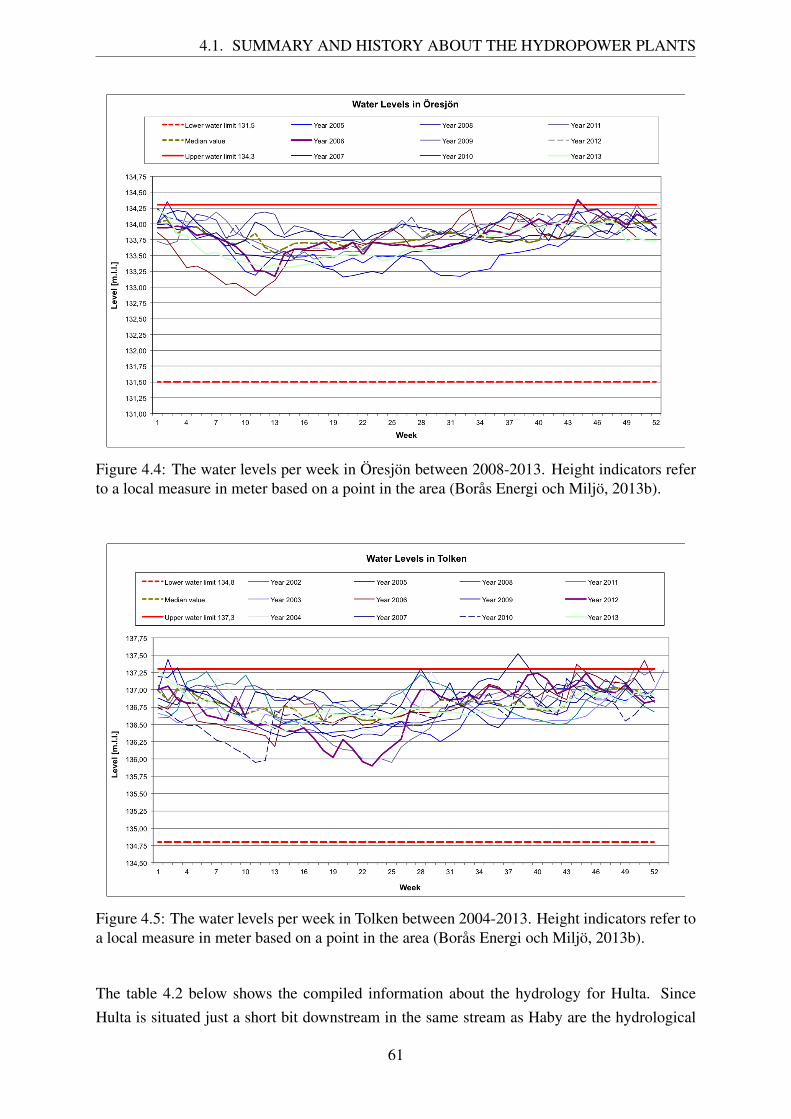
4.1. SUMMARY AND HISTORY ABOUT THE HYDROPOWER PLANTS
Figure 4.4: The water levels per week in Öresjön between 2008-2013. Height indicators referto a local measure in meter based on a point in the area (Borås Energi och Miljö, 2013b).
Figure 4.5: The water levels per week in Tolken between 2004-2013. Height indicators refer toa local measure in meter based on a point in the area (Borås Energi och Miljö, 2013b).
The table 4.2 below shows the compiled information about the hydrology for Hulta. SinceHulta is situated just a short bit downstream in the same stream as Haby are the hydrological
61
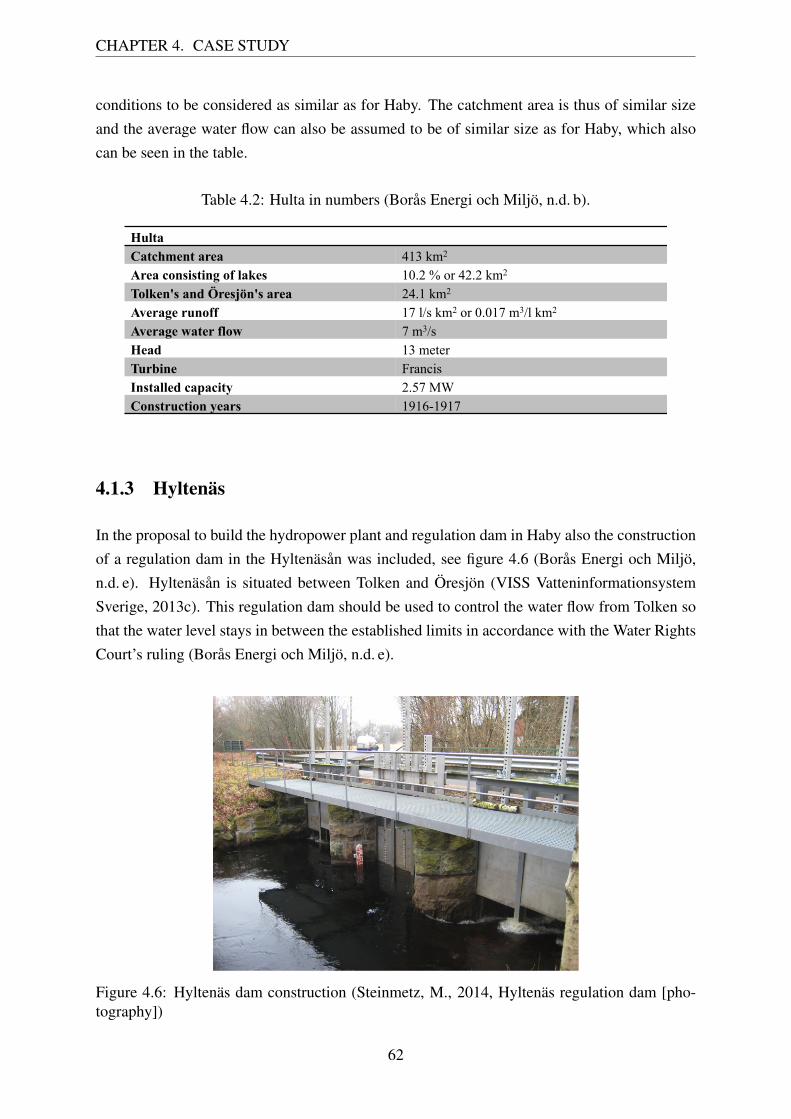
CHAPTER 4. CASE STUDY
conditions to be considered as similar as for Haby. The catchment area is thus of similar sizeand the average water flow can also be assumed to be of similar size as for Haby, which alsocan be seen in the table.
Table 4.2: Hulta in numbers (Borås Energi och Miljö, n.d. b).
Hulta Catchment area 413 km2 Area consisting of lakes 10.2 % or 42.2 km2 Tolken's and Öresjön's area 24.1 km2 Average runoff 17 l/s km2 or 0.017 m3/l km2 Average water flow 7 m3/s Head 13 meter Turbine Francis Installed capacity 2.57 MW Construction years 1916-1917
4.1.3 Hyltenäs
In the proposal to build the hydropower plant and regulation dam in Haby also the constructionof a regulation dam in the Hyltenäsån was included, see figure 4.6 (Borås Energi och Miljö,n.d. e). Hyltenäsån is situated between Tolken and Öresjön (VISS VatteninformationsystemSverige, 2013c). This regulation dam should be used to control the water flow from Tolken sothat the water level stays in between the established limits in accordance with the Water RightsCourt’s ruling (Borås Energi och Miljö, n.d. e).
Figure 4.6: Hyltenäs dam construction (Steinmetz, M., 2014, Hyltenäs regulation dam [pho-tography])
62
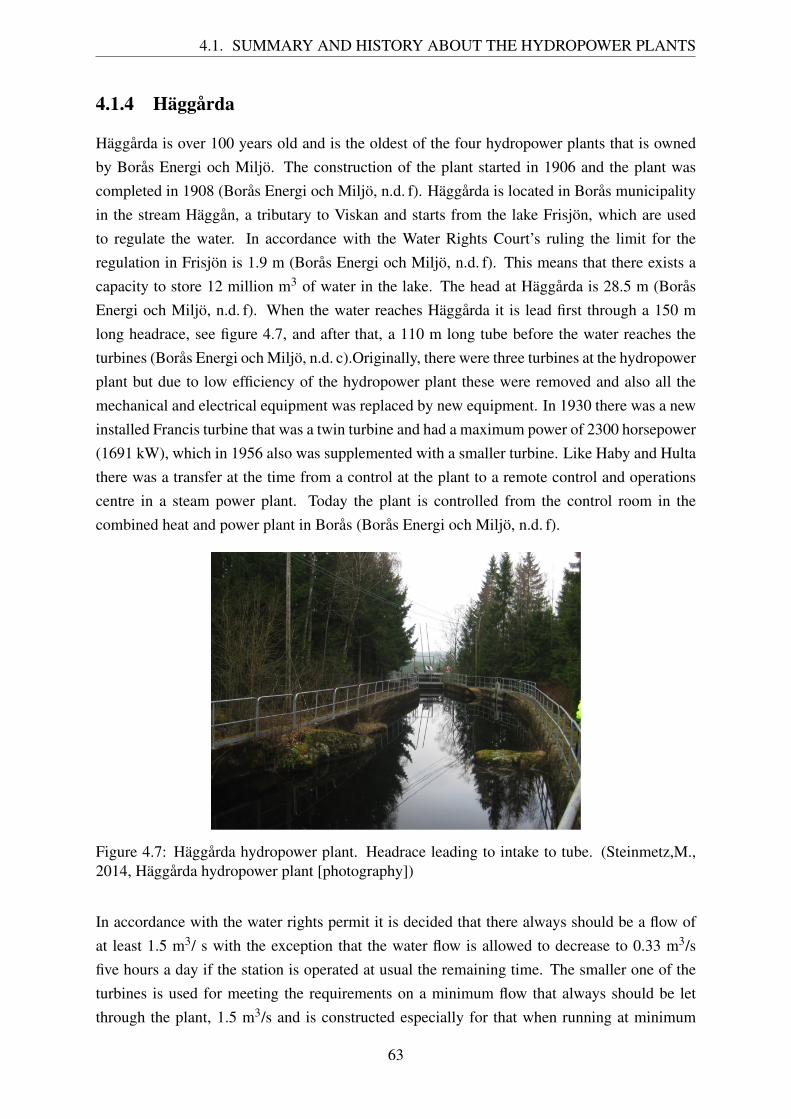
4.1. SUMMARY AND HISTORY ABOUT THE HYDROPOWER PLANTS
4.1.4 Häggårda
Häggårda is over 100 years old and is the oldest of the four hydropower plants that is ownedby Borås Energi och Miljö. The construction of the plant started in 1906 and the plant wascompleted in 1908 (Borås Energi och Miljö, n.d. f). Häggårda is located in Borås municipalityin the stream Häggån, a tributary to Viskan and starts from the lake Frisjön, which are usedto regulate the water. In accordance with the Water Rights Court’s ruling the limit for theregulation in Frisjön is 1.9 m (Borås Energi och Miljö, n.d. f). This means that there exists acapacity to store 12 million m3 of water in the lake. The head at Häggårda is 28.5 m (BoråsEnergi och Miljö, n.d. f). When the water reaches Häggårda it is lead first through a 150 mlong headrace, see figure 4.7, and after that, a 110 m long tube before the water reaches theturbines (Borås Energi och Miljö, n.d. c).Originally, there were three turbines at the hydropowerplant but due to low efficiency of the hydropower plant these were removed and also all themechanical and electrical equipment was replaced by new equipment. In 1930 there was a newinstalled Francis turbine that was a twin turbine and had a maximum power of 2300 horsepower(1691 kW), which in 1956 also was supplemented with a smaller turbine. Like Haby and Hultathere was a transfer at the time from a control at the plant to a remote control and operationscentre in a steam power plant. Today the plant is controlled from the control room in thecombined heat and power plant in Borås (Borås Energi och Miljö, n.d. f).
Figure 4.7: Häggårda hydropower plant. Headrace leading to intake to tube. (Steinmetz,M.,2014, Häggårda hydropower plant [photography])
In accordance with the water rights permit it is decided that there always should be a flow ofat least 1.5 m3/ s with the exception that the water flow is allowed to decrease to 0.33 m3/sfive hours a day if the station is operated at usual the remaining time. The smaller one of theturbines is used for meeting the requirements on a minimum flow that always should be letthrough the plant, 1.5 m3/s and is constructed especially for that when running at minimum
63
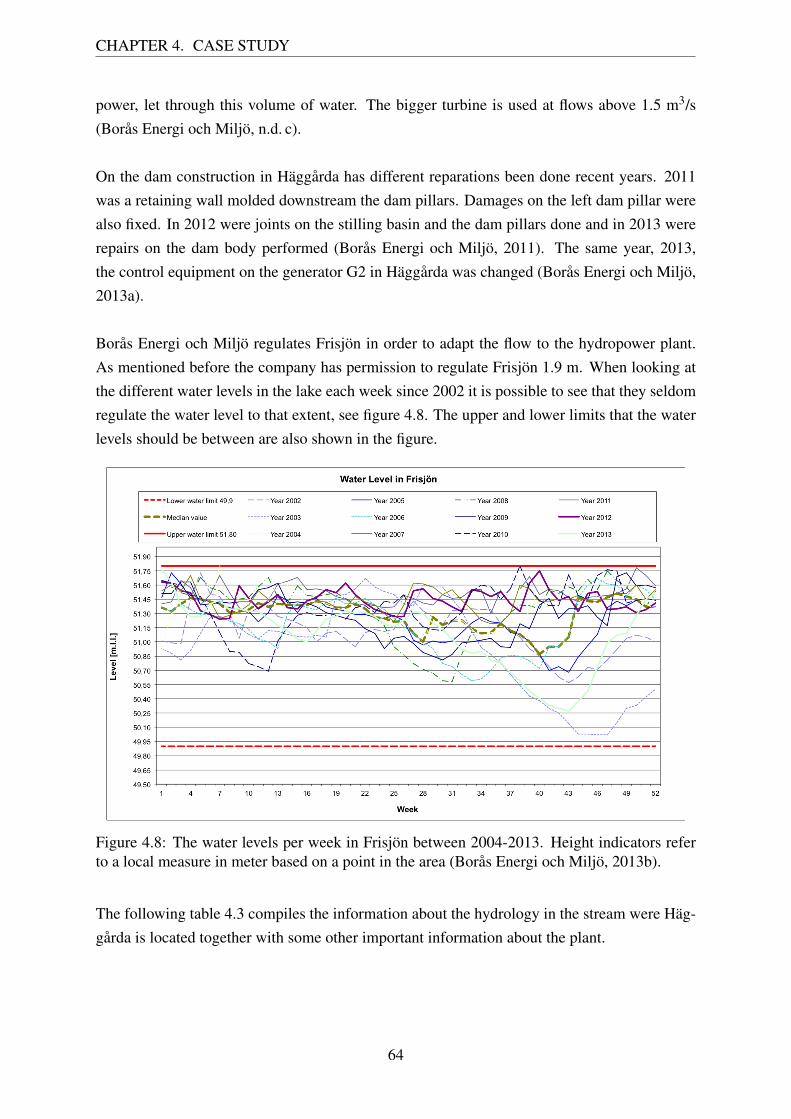
CHAPTER 4. CASE STUDY
power, let through this volume of water. The bigger turbine is used at flows above 1.5 m3/s(Borås Energi och Miljö, n.d. c).
On the dam construction in Häggårda has different reparations been done recent years. 2011was a retaining wall molded downstream the dam pillars. Damages on the left dam pillar werealso fixed. In 2012 were joints on the stilling basin and the dam pillars done and in 2013 wererepairs on the dam body performed (Borås Energi och Miljö, 2011). The same year, 2013,the control equipment on the generator G2 in Häggårda was changed (Borås Energi och Miljö,2013a).
Borås Energi och Miljö regulates Frisjön in order to adapt the flow to the hydropower plant.As mentioned before the company has permission to regulate Frisjön 1.9 m. When looking atthe different water levels in the lake each week since 2002 it is possible to see that they seldomregulate the water level to that extent, see figure 4.8. The upper and lower limits that the waterlevels should be between are also shown in the figure.
Figure 4.8: The water levels per week in Frisjön between 2004-2013. Height indicators referto a local measure in meter based on a point in the area (Borås Energi och Miljö, 2013b).
The following table 4.3 compiles the information about the hydrology in the stream were Häg-gårda is located together with some other important information about the plant.
64
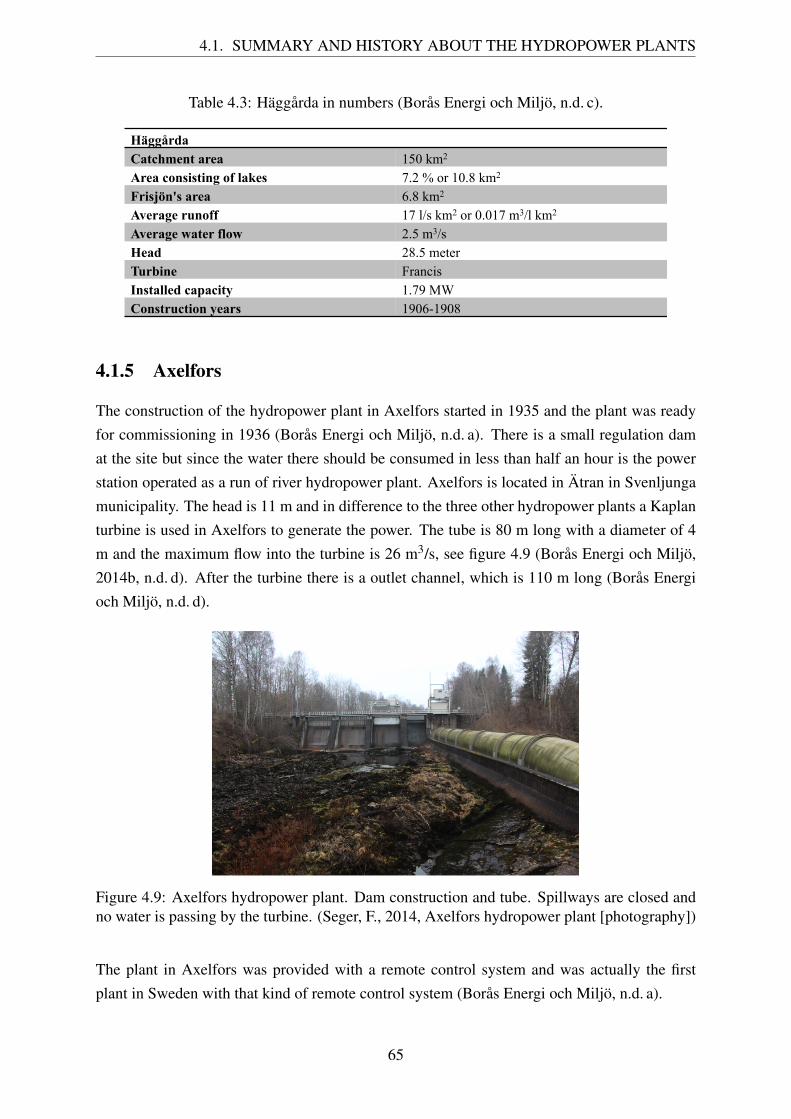
4.1. SUMMARY AND HISTORY ABOUT THE HYDROPOWER PLANTS
Table 4.3: Häggårda in numbers (Borås Energi och Miljö, n.d. c).
Häggårda Catchment area 150 km2 Area consisting of lakes 7.2 % or 10.8 km2 Frisjön's area 6.8 km2 Average runoff 17 l/s km2 or 0.017 m3/l km2 Average water flow 2.5 m3/s Head 28.5 meter Turbine Francis Installed capacity 1.79 MW Construction years 1906-1908
4.1.5 Axelfors
The construction of the hydropower plant in Axelfors started in 1935 and the plant was readyfor commissioning in 1936 (Borås Energi och Miljö, n.d. a). There is a small regulation damat the site but since the water there should be consumed in less than half an hour is the powerstation operated as a run of river hydropower plant. Axelfors is located in Ätran in Svenljungamunicipality. The head is 11 m and in difference to the three other hydropower plants a Kaplanturbine is used in Axelfors to generate the power. The tube is 80 m long with a diameter of 4m and the maximum flow into the turbine is 26 m3/s, see figure 4.9 (Borås Energi och Miljö,2014b, n.d. d). After the turbine there is a outlet channel, which is 110 m long (Borås Energioch Miljö, n.d. d).
Figure 4.9: Axelfors hydropower plant. Dam construction and tube. Spillways are closed andno water is passing by the turbine. (Seger, F., 2014, Axelfors hydropower plant [photography])
The plant in Axelfors was provided with a remote control system and was actually the firstplant in Sweden with that kind of remote control system (Borås Energi och Miljö, n.d. a).
65
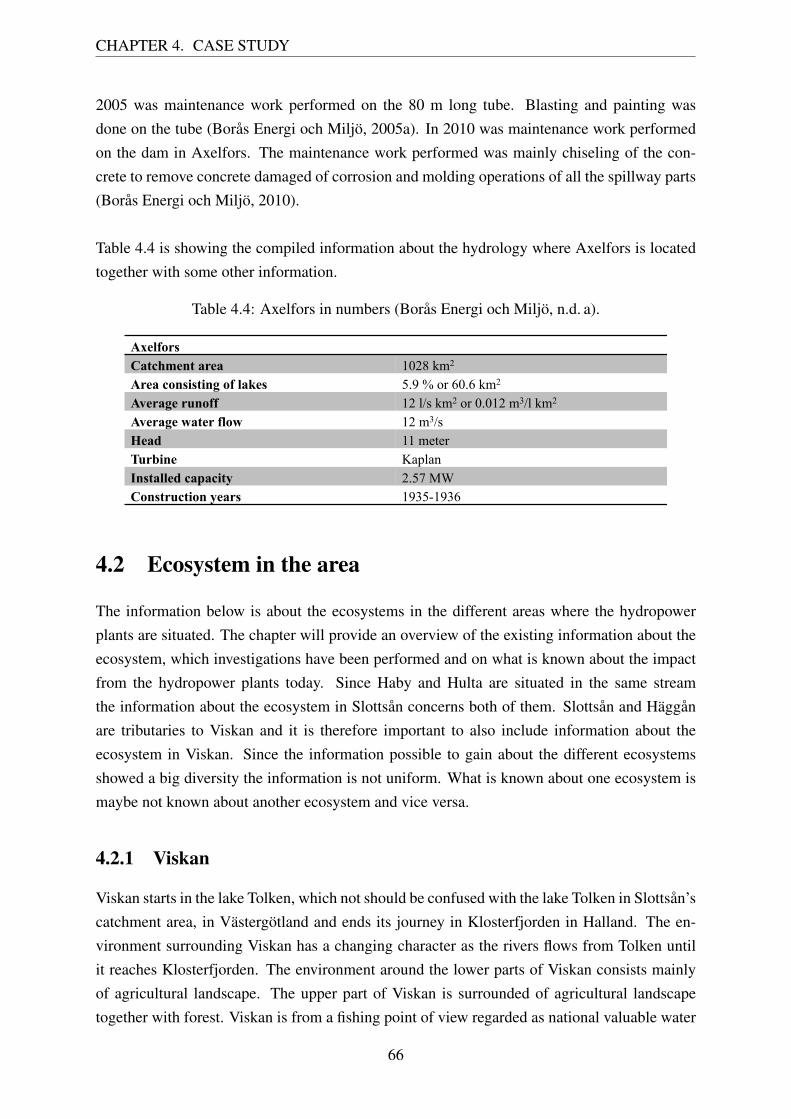
CHAPTER 4. CASE STUDY
2005 was maintenance work performed on the 80 m long tube. Blasting and painting wasdone on the tube (Borås Energi och Miljö, 2005a). In 2010 was maintenance work performedon the dam in Axelfors. The maintenance work performed was mainly chiseling of the con-crete to remove concrete damaged of corrosion and molding operations of all the spillway parts(Borås Energi och Miljö, 2010).
Table 4.4 is showing the compiled information about the hydrology where Axelfors is locatedtogether with some other information.
Table 4.4: Axelfors in numbers (Borås Energi och Miljö, n.d. a).
Axelfors Catchment area 1028 km2 Area consisting of lakes 5.9 % or 60.6 km2 Average runoff 12 l/s km2 or 0.012 m3/l km2 Average water flow 12 m3/s Head 11 meter Turbine Kaplan Installed capacity 2.57 MW Construction years 1935-1936
4.2 Ecosystem in the area
The information below is about the ecosystems in the different areas where the hydropowerplants are situated. The chapter will provide an overview of the existing information about theecosystem, which investigations have been performed and on what is known about the impactfrom the hydropower plants today. Since Haby and Hulta are situated in the same streamthe information about the ecosystem in Slottsån concerns both of them. Slottsån and Häggånare tributaries to Viskan and it is therefore important to also include information about theecosystem in Viskan. Since the information possible to gain about the different ecosystemsshowed a big diversity the information is not uniform. What is known about one ecosystem ismaybe not known about another ecosystem and vice versa.
4.2.1 Viskan
Viskan starts in the lake Tolken, which not should be confused with the lake Tolken in Slottsån’scatchment area, in Västergötland and ends its journey in Klosterfjorden in Halland. The en-vironment surrounding Viskan has a changing character as the rivers flows from Tolken untilit reaches Klosterfjorden. The environment around the lower parts of Viskan consists mainlyof agricultural landscape. The upper part of Viskan is surrounded of agricultural landscapetogether with forest. Viskan is from a fishing point of view regarded as national valuable water
66
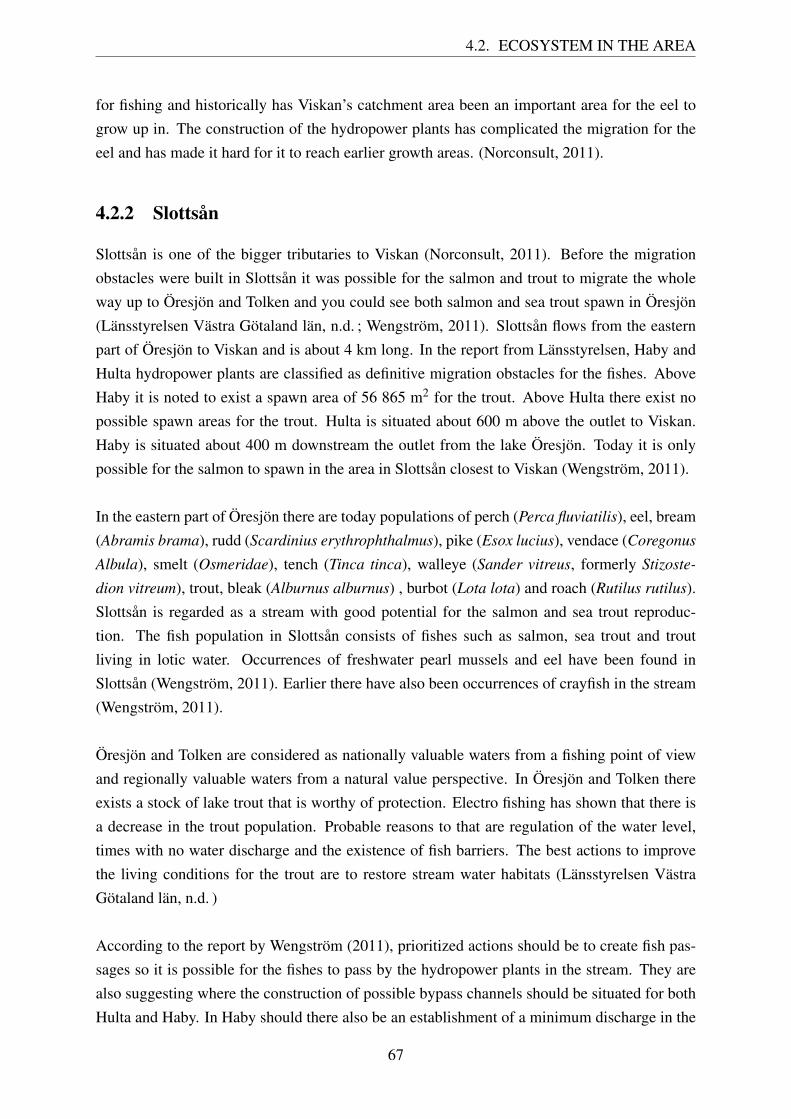
4.2. ECOSYSTEM IN THE AREA
for fishing and historically has Viskan’s catchment area been an important area for the eel togrow up in. The construction of the hydropower plants has complicated the migration for theeel and has made it hard for it to reach earlier growth areas. (Norconsult, 2011).
4.2.2 Slottsån
Slottsån is one of the bigger tributaries to Viskan (Norconsult, 2011). Before the migrationobstacles were built in Slottsån it was possible for the salmon and trout to migrate the wholeway up to Öresjön and Tolken and you could see both salmon and sea trout spawn in Öresjön(Länsstyrelsen Västra Götaland län, n.d. ; Wengström, 2011). Slottsån flows from the easternpart of Öresjön to Viskan and is about 4 km long. In the report from Länsstyrelsen, Haby andHulta hydropower plants are classified as definitive migration obstacles for the fishes. AboveHaby it is noted to exist a spawn area of 56 865 m2 for the trout. Above Hulta there exist nopossible spawn areas for the trout. Hulta is situated about 600 m above the outlet to Viskan.Haby is situated about 400 m downstream the outlet from the lake Öresjön. Today it is onlypossible for the salmon to spawn in the area in Slottsån closest to Viskan (Wengström, 2011).
In the eastern part of Öresjön there are today populations of perch (Perca fluviatilis), eel, bream(Abramis brama), rudd (Scardinius erythrophthalmus), pike (Esox lucius), vendace (Coregonus
Albula), smelt (Osmeridae), tench (Tinca tinca), walleye (Sander vitreus, formerly Stizoste-
dion vitreum), trout, bleak (Alburnus alburnus) , burbot (Lota lota) and roach (Rutilus rutilus).Slottsån is regarded as a stream with good potential for the salmon and sea trout reproduc-tion. The fish population in Slottsån consists of fishes such as salmon, sea trout and troutliving in lotic water. Occurrences of freshwater pearl mussels and eel have been found inSlottsån (Wengström, 2011). Earlier there have also been occurrences of crayfish in the stream(Wengström, 2011).
Öresjön and Tolken are considered as nationally valuable waters from a fishing point of viewand regionally valuable waters from a natural value perspective. In Öresjön and Tolken thereexists a stock of lake trout that is worthy of protection. Electro fishing has shown that there isa decrease in the trout population. Probable reasons to that are regulation of the water level,times with no water discharge and the existence of fish barriers. The best actions to improvethe living conditions for the trout are to restore stream water habitats (Länsstyrelsen VästraGötaland län, n.d. )
According to the report by Wengström (2011), prioritized actions should be to create fish pas-sages so it is possible for the fishes to pass by the hydropower plants in the stream. They arealso suggesting where the construction of possible bypass channels should be situated for bothHulta and Haby. In Haby should there also be an establishment of a minimum discharge in the
67
CHAPTER 4. CASE STUDY
dry riverbed to benefit the species in the area (Wengström, 2011).
On behalf of Borås Energi och Miljö, Medins Biologi AB examined the benthic zone andits benthos at two sites in Slottsån in the autumn 2007. Maintenance work was supposed to becarried out at the dam at Hulta and a cofferdam would be built. The study aimed to describethe benthic zone before the procedure was carried out. The results from investigations on ben-thic zones have since the 1980’s been used as bio indicators. Samples were taken at the damof Hulta hydropower plant and also at Slottsberget (about 1.5 km upstream). Species richnesswas moderately high at the dam area, 25 taxa were found. The benthic zone was dominated byspecies that usually are found in still or quietly flowing water. No rare or endangered specieswere found at the place. However, there were several moderately sensitive species present.The caddisfly, Lype phaeopa that are sensitive to acidification were also found at the area. Thepresence of moderately sensitive species and the Lype phaeopa indicated that no acidificationexisted. At Slottsberget there were also a lot of species that were sensitive to acidification,which indicated also at this area that no acidification existed. From samples at Slottsberget 54taxa were found, this is a very high diversity of species according to the report. There werealso three rare species that were found, the caddisfly Goera pilosa and Notidobia ciliaris andthe shell Marstoniopsis scholtzi. Overall, the benthic composition was indicating on nutrientrich conditions (Nilsson and Rådén, 2007).
In November 2011 another investigation was performed on the benthic zone. The investiga-tion was performed on the behalf of Länsstyrelsen. A number of different places in Viskanwere investigated and Slottsån was one of the places investigated. The purpose with this studywas to see how the benthos was affected by the regulations at the selected locations. In Slottsånsamples were taken at two locations, one close downstream the regulation dam for Haby andone a bit further downstream from the regulation dam. The distances were approximately 200metres and 2 kilometres. The samples showed that the condition of the benthic zone in Slottsåncould be assessed as good with respect to the hydromorphological impact. Even if the statuswas assessed to be good so is it probable that if there had not been any regulation in Slottsånso had the samples shown a higher species richness. The sample taken close to the regulationdam in Slottsån was taken where the original stream was flowing. It showed that high speciesrichness could be found in the original stream. That suggests that there is probable no timeswhen the original stream is totally drained. It was however possible to see that the samplestaken further away from the regulation dam exhibited a higher species richness than the sam-ples taken closer to the regulation dam (Ericsson et al., 2012).
The changes that can be seen in the species richness that can be derived to the regulationsare that e.g. species that are favoured by the increased production of plankton in the regulationdam can be found in an increased number close to the floodgates since food availability for
68
4.2. ECOSYSTEM IN THE AREA
them has increased, so called filter feeders. Species that in other hand is affected negatively isfor example stoneflies since the water often is changed from a streaming flow to a calmer flow.(Ericsson et al., 2012).
In the sample taken close to the regulation dam the type of species eating plankton mentionedearlier was possible to find, which can be regarded as natural because of the proximity toÖresjön. The benthic zone was assessed to have moderate species richness. The overall statuswas good but there exists some impact from the regulation (Ericsson et al., 2012). The sampletaken in the location further down in the stream showed a similar result to the other sampleeven if it was possible to distinguish some differences. The location showed a higher speciesrichness than the other one in Slottsån. Also here it was possible to find filter feeders but asfor the sample taken at the location upstream it can be seen as natural due to the proximity toÖresjön (Ericsson et al., 2012).
Overall, all of the samples taken at the different locations in Viskan and its tributaries showeda good or high status. It can be understood in the text that it was a bit surprising for the authorsof the report since Viskan and the other streams can be seen as heavily affected by regulation,something that is known to have adverse effects on the ecosystem. They are also discussing thereasons behind the result. One possible reason that they come up with is that even if the streamsare regulated so are the regulation done in a way so that the changes in the flow happens slowlyand that the differences in the regulated water flow compared to how the flow would be withoutthe regulation is not that large as they could be. It is also worth to mention that the locationfurthest away from the regulation dam was specimens of stoneflies found. Stoneflies are veryunusual in the southern part of Sweden. That the location provides a suitable environment forthe stonefly to live in can be seen as an indicator of that the benthic zone holds high naturalvalues (Ericsson et al., 2012).
Regarding the surrounding land area a geotechnical investigation was carried out at Slottsånfor the area around Hulta hydropower plant. The study was made because the area just up-stream the power station was planned to be dried up to enable the performance of maintenancework, and they therefore wanted to investigate if the surroundings could manage this. The re-sults of this investigation were that due to Slottsån’s relatively slow flow and the stability of thesurrounding land no current erosion was available (SWECO Infrastructure, 2008).
From the same investigation as above it can also be read how the topography closest to theriver looks. On the east side of Slottsån the ground is almost flat closest to the water. But onthe south side on the other hand the hillside is steep (SWECO Infrastructure, 2008).
69
CHAPTER 4. CASE STUDY
4.2.2.1 Potential to Reach Good Ecological Status
Due to the lack of continuity and the changes in the water flow has it been assessed that itis technically impossible to achieve the goal of good ecological status by year 2015 and thedeadline has been postponed to year 2021. The criteria that define the status in the streamscan be read about in chapter 1.2.1. Despite the prolonged time frame Slottsån has according toLänsstyrelsen in Västra Götaland still a risk that the ecological potential will not be reached byyear 2021. Today the stream is classified as moderate. The water body has poor status due tothe barriers in the stream. The fishes and other species living in the stream cannot migrate ina natural way and there exists two migration barriers in the water body that are anthropogenic(VISS Vatteninformationsystem Sverige, 2013d).
4.2.3 Hyltenäsån
Hyltenäsån is the stream that connects the two lakes, Öresjön and Tolken and as mentionedearlier has Borås Energi och Miljö a regulation dam in Hyltenäsån from where they control thewater levels in Tolken (Borås Energi och Miljö, n.d. b; VISS Vatteninformationsystem Sverige,2013c).
4.2.3.1 Potential to Reach Good Ecological Status
At Länsstyrelsens’s homepage it can be read that there is a risk that a good ecological statuswill not be reached by year 2021 in Hyltenäsån. Today the ecological status in the stream isclassified as moderate. Due to the conditions in the stream the deadline to reach good ecolog-ical status has been postponed until year 2021 since it has been assessed to being technicallyimpossible to reach the goal by 2015. The reason to why that good ecological status not willbe achieved is the changes in continuity in the stream. The species in the stream are hinderedby barriers and migration species are also hindered by barriers downstream. The hydrologicalregime is also affected due to the water regulation in the dam (VISS VatteninformationsystemSverige, 2013c).
4.2.4 Häggån
Häggån is mainly a slow floating stream even though parts with more streaming water canbe found. An estimation of freshwater pearl mussel population in Häggån was done in year2003 and was assessed to consist of 10-100 individuals. No juvenile freshwater pearl mus-sels were found in the stream. Because of the existence of the freshwater pearl mussels, isthe river considered to have a protection value. In the same report was also the result from anearlier inventory, from 1990 presented. The investigations done then estimated that populationconsisted of between 100-1000 individuals. It seems however like the population of freshwater
70
4.2. ECOSYSTEM IN THE AREA
pearl mussels in Lillån also are included in this inventory (Andersson, 2006). A more recent in-vestigation on the occurrence of freshwater pearl mussel was done in 2013. In the investigationthey looked for individuals of the freshwater pearl mussel in a test local located 400 m upstreamwhere the watercourse gets divided into several branches. No individuals of the freshwater pearlmussel were found in this area, despite that approximately 3000 m2 of what can be consideredas good biotopes for the freshwater pearl mussel was searched. In total only three individualsof the freshwater pearl mussel were found in Häggån. The three individuals were found in aplace close to Häggårda hydropower plant and thus not in the test local in Tattarströmmarna(Länsstyrelsen Västra Götalands län, 2014). Tattarströmmarna is a part of Häggån and can befound downstream the hydropower plant Häggårda. It is an approximately one-kilometre longdistance of Häggån and is a Natura 2000 area (Naturvårdsverket, 2012). Tattarströmmarna isdescribed by Naturvårdsverket as a watercourse that split into several channels that are sur-rounded by deciduous woodland and is regularly flooded. Tattarströmmarna is an unusualhabitat and a home to threatened species such as the freshwater pearl mussel (Naturvårdsver-ket, 2013). Occasional freshwater pearl mussels can also be found in other parts of Häggån(Nilsson and Rådén, 2012). From the result of the investigation, the authors conclude that thereis a risk that only single individuals are left in Häggån (Länsstyrelsen Västra Götalands län,2014). The populations of trout have been estimated by performing electrofishing. The occur-rence of trout in Häggån is assessed to be moderate and the fish is assessed to be negativelyaffected by the regulation of the hydropower plant in the stream (Andersson, 2006).
According to the report from Borås Kommun (2003) is there without doubt that the regula-tion of Häggån has had an adverse impact on the size of the trout population. The areas closeto the hydropower plants and the dams, that before had the potential to be spawn- and growthareas have now disappeared. To improve the environment for the organisms in the stream theregulations should be adapted after conditions that are most suitable for the stream. Unnaturallarge fluctuations should be avoided and instead be adapted after the fluctuations in the prevail-ing water conditions (Borås Kommun, 2003).
In the conservation plan for the Natura 2000 area in Häggån there are two types of habitats/species that must be retained in this area, the freshwater pearl mussel and the alluvial deciduousforests that occasionally are flooded. Both the freshwater pearl mussel and the alluvial decid-uous forests are probably affected negatively by the regulation from the hydropower plant inHäggån. The regulation has probably decreased the area that is regularly flooded, resulting inthat there is an increased risk for spreading of spruce in the area. For the freshwater pearl mus-sel means the regulation both indirect and direct adverse impacts. The freshwater pearl musselis in the larval stage dependent on the trout stock for their survival since they live up to tenmonths as a parasite in the trout’s gills. When the trout stock is affected by the regulation fromthe hydropower plant and the stock decreases it means that the possibilities for the glochidia
71

CHAPTER 4. CASE STUDY
to find a suitable trout gill to live in decreases and so are the possibilities for the freshwaterpearl mussel to survive. It is also especially young individuals of trout that is suitable for theglochidia so a decreased reproduction of trout can also have adverse effects on freshwater pearlmussel population. The freshwater pearl mussel can also be affected directly by the regulation.Low water flows that may occur as a result of the regulation in Häggårda can directly damagethe freshwater pearl mussel population (Länsstyrelsen Västra Götalands län, 2005a).
In June 2012 there was an examination performed in Tattarströmmarna as a follow up of theeffects in the stream due to a disruption in March the same year. During the disruption it wasfor almost 24 hours no water flow from Frisjön. The stream was however, not totally empty onwater since water comes from the tributary Sävbäcken. The follow up consisted of an exami-nation of the benthic and the freshwater pearl mussel and electro fishing. The examination ofthe benthic showed that Tattarströmmarna has a valuable benthic and weak stock of trout andfreshwater pearl mussel. The trout population was assessed to be adversely affected by the reg-ulation in the stream but it was not possible to determine if it was due to the earlier mentioneddisruption or the usual regulation in the stream since no earlier examinations have been doneof the area (Nilsson and Rådén, 2012).
The marsh gentian (Gentiana pneumonanthe) grows in the riparian zone to lakes and rivers,on wet meadows and on moisture moors. It can be found in the Swedish red list and is classi-fied as vulnerable. According to Kinnarumma Naturskyddsförening the marsh gentian can befound in three places within Borås municipality, and Frisjön is one of the places. To protect themarsh gentian Kinnarumma Naturskyddsförening has asked Borås Energi och Miljö to regulatethe water levels in Frisjön so that the levels is kept on normal or low levels in July and onlylater let the levels rise in Frisjön so that the marsh gentian is protected (Kinnarumma Natursky-ddsförening, 2013).
For Frisjön there also exists a wish to regulate the water levels so it will not affect the black-throated loon (Gavia Arctica) during the birds brooding, or the pike when it spawns (BoråsEnergi och Miljö, 2013b).
4.2.4.1 Potential to Reach Good Ecological Status
The last classification judges the ecological status in Häggån as moderate. Since Häggån isassessed to not have the possibility to reach a good ecological status by 2015 the time frame toreach good ecological status has been prolonged until 2021. However, even with the prolongedtime frame, there is a risk that a good ecological status will not be reached by year 2021. Theconnectivity is judged as poor. There are migration barriers that ate definitive. The speciesin the stream cannot migrate in natural ways and there are barriers that stop the salmon and
72
4.2. ECOSYSTEM IN THE AREA
trout from reaching spawn areas in the water body of Häggån. The littoral zone is also affectedand there is today a lack of natural environments for animals and plants. The hydrologicalregime is considered as good. Except for the hydropower plant in Häggårda there is also a plantdownstream in Häggån that works as a barrier for the species that wants to migrate in the stream.The hydropower plant Kungsfors situated in Viskan is also a barrier for the species downstreamin Viskan that wishes to reach upstream in Häggån. The water body is also regulated in a wayso that the ecosystem is expected to be affected negatively (VISS VatteninformationsystemSverige, 2013b).
4.2.5 Ätran
According to Calles et al. (2012) Ätran has a history of being a productive stream and largepopulations of e.g. salmon and eel have lived in the stream. Ätran is classified as nationallyparticularly valuable. Today you can find valuable species such as sea trout (Salmo trutta
trutta), river lamprey (Lampetra fluviatilis), sea lamprey (Petromyzon marinus), freshwaterpearl mussel, eel and duck mussel (Anodonta anatina), swollen river mussel (Unio tumidus)and painter’s mussel (Unio pictorum) (Calles and Bergdahl, 2009; Calles et al., 2012). Thesespecies together with the wild salmon stock that lives in Ätran is the reason behind why it isclassified as particularly valuable. The benthic has high natural values and is also the onlyplace in Scandinavia where the caddisfly, Setodes punctatus can be found (Calles et al., 2012).There exist eight hydropower plants in Ätran, from its start in a bog east of Ulricehamn to theoutflow in Kattegat (Dahlin-Ros, 2008; Calles and Bergdahl, 2009). Due to the hydropowerplants Ätran is considered as heavily fragmented (Calles and Bergdahl, 2009). In a study doneby Calles et al. (2012) they have looked at the eels’ migration in Ätran. The result shows thatÄtran still produces a high number of silver eels each year and that the production of eel inÄtran has been underestimated. The authors focused however on the parts of Ätran down-stream Axelfors and do not say that much of the situation in Axelfors (Calles et al., 2012).
The parts of Ätran between the hydropower plants Skåpanäs and Ätrafors is according to Vat-tenmyndigheten Västerhavet (2010) heavily modified in terms of hydrology, morphology andlack of continuity in the stream. This is mostly due to the hydropower plants in that part ofÄtran. Axelfors is situated upstream of Skåpanäs together with Ljungafors hydropower plant.This part of Ätran is assessed to not be substantially physically affected despite the existenceof the hydropower plants in this part of the stream and the regulation in Forsa at the outlet ofÅsunden (Vattenmyndigheten Västerhavet, 2010).
73
CHAPTER 4. CASE STUDY
4.2.5.1 Potential to Reach Good Ecological Status
The part of Ätran, which Axelfors hydropower plant is located in was in year 2013 classified ashaving moderate ecological status. As for the other streams the time frame for reaching goodecological status have been prolonged from 2015 to 2021 but there is still a risk that the goalswill not be reached by 2021. The connectivity is judged as poor due to the migration barriersexisting in the stream, the species in the stream are hindered to migrate in a natural way (VISSVatteninformationsystem Sverige, 2013a).
4.3 Comparison and Compilation
As mentioned the knowledge differs about the hydropower plant and the ecosystem aroundthem due to that the studies performed on the areas differs in type and number. To get an easyand short overview about the existing knowledge about the ecosystem where the hydropowerplants are situated, a table is included with a short compilation of the information, see nextpage. Hyltenäsån and the dam in Hyltenäsån is not included in the table since most of the focushas been to find information about the streams that the hydropower plants are located in.
74
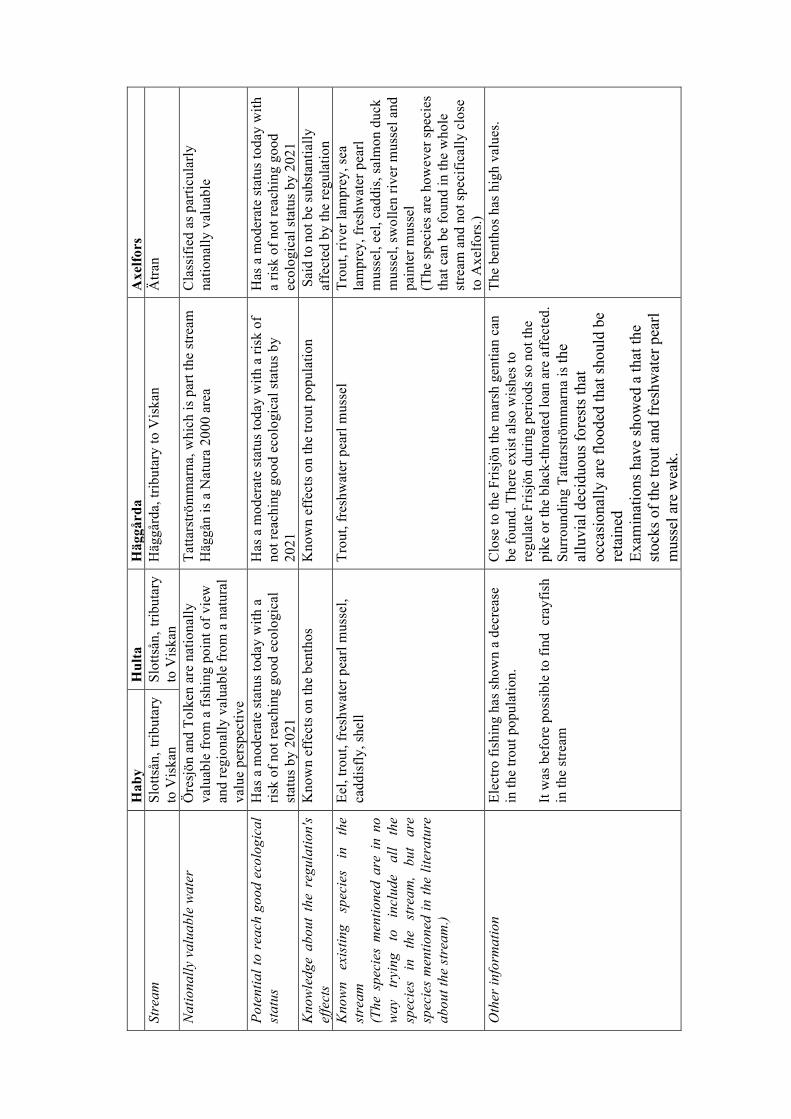
H
aby
Hul
ta
Häg
gård
a A
xelfo
rs
Stre
am
Slot
tsån
, trib
utar
y to
Vis
kan
Slot
tsån
, trib
utar
y to
Vis
kan
Häg
gård
a, tr
ibut
ary
to V
iska
n Ä
tran
Nat
iona
lly v
alua
ble
wat
er
Öre
sjön
and
Tol
ken
are
natio
nally
va
luab
le fr
om a
fish
ing
poin
t of v
iew
an
d re
gion
ally
val
uabl
e fr
om a
nat
ural
va
lue
pers
pect
ive
Tatta
rströ
mm
arna
, whi
ch is
par
t the
stre
am
Häg
gån
is a
Nat
ura
2000
are
a C
lass
ified
as p
artic
ular
ly
natio
nally
val
uabl
e
Pote
ntia
l to
reac
h go
od e
colo
gica
l st
atus
H
as a
mod
erat
e st
atus
toda
y w
ith a
ris
k of
not
reac
hing
goo
d ec
olog
ical
st
atus
by
2021
Has
a m
oder
ate
stat
us to
day
with
a ri
sk o
f no
t rea
chin
g go
od e
colo
gica
l sta
tus b
y 20
21
Has
a m
oder
ate
stat
us to
day
with
a
risk
of n
ot re
achi
ng g
ood
ecol
ogic
al st
atus
by
2021
K
now
ledg
e ab
out
the
regu
latio
n's
effe
cts
Kno
wn
effe
cts o
n th
e be
ntho
s K
now
n ef
fect
s on
the
trout
pop
ulat
ion
S
aid
to n
ot b
e su
bsta
ntia
lly
affe
cted
by
the
regu
latio
n K
now
n ex
istin
g sp
ecie
s in
th
e st
ream
(T
he s
peci
es m
entio
ned
are
in n
o w
ay
tryi
ng
to
incl
ude
all
the
spec
ies
in
the
stre
am,
but
are
spec
ies
men
tione
d in
the
liter
atur
e ab
out t
he st
ream
.)
Eel,
trout
, fre
shw
ater
pea
rl m
usse
l, ca
ddis
fly, s
hell
Trou
t, fr
eshw
ater
pea
rl m
usse
l Tr
out,
river
lam
prey
, sea
la
mpr
ey, f
resh
wat
er p
earl
mus
sel,
eel,
cadd
is, s
alm
on d
uck
mus
sel,
swol
len
river
mus
sel a
nd
pain
ter m
usse
l (T
he sp
ecie
s are
how
ever
spec
ies
that
can
be
foun
d in
the
who
le
stre
am a
nd n
ot sp
ecifi
cally
clo
se
to A
xelfo
rs.)
Oth
er in
form
atio
n
Elec
tro fi
shin
g ha
s sho
wn
a de
crea
se
in th
e tro
ut p
opul
atio
n.
It w
as b
efor
e po
ssib
le to
find
cra
yfis
h in
the
stre
am
Clo
se to
the
Fris
jön
the
mar
sh g
entia
n ca
n be
foun
d. T
here
exi
st a
lso
wis
hes t
o re
gula
te F
risjö
n du
ring
perio
ds so
not
the
pike
or t
he b
lack
-thro
ated
loan
are
aff
ecte
d.
Surr
ound
ing
Tatta
rströ
mm
arna
is th
e al
luvi
al d
ecid
uous
fore
sts t
hat
occa
sion
ally
are
floo
ded
that
shou
ld b
e re
tain
ed
Exam
inat
ions
hav
e sh
owed
a th
at th
e st
ocks
of t
he tr
out a
nd fr
eshw
ater
pea
rl m
usse
l are
wea
k.
The
bent
hos h
as h
igh
valu
es.
Chapter 5
Analysis
In the analysis the information from the literature study is connected with the knowledge aboutthe hydropower plants and the environment at the sites. This is done in order to estimate theimpacts from the hydropower plants and which effects the impacts have on the environmentsurrounding the hydropower plants.
5.1 Hydrological Regime
The hydrology and the impacts from the water regulation differ between the four differenthydropower plants. As mentioned in the literature review about the hydrological regime thenatural flow is made up of several different factors, factors that will be changed when there isregulation in the stream. Things as the frequency and timing of different flows will be changedas well as the rate of change, changes that will affect the entire system. The following chapterwill use the background from the literature together with the compiled information about thehydrological regime at the different hydropower plants to get an estimation about how large theeffects are from the regulation of the water flow through the hydropower plants. Graphs for thefour different hydropower plants are included in the following paragraphs. The graphs showthe production of electricity on e.g. yearly or daily basis. They are used to get an overview ofhow the regulation is operated in the hydropower plants. What the figures shows are furtherdiscussed later in the text, see section 5.1.4, Compilation of hydrological review.
5.1.1 Haby & Hulta
Haby and Hulta use the same water for their electricity production. Two lakes are used forthe water storage, Öresjön and Tolken. For Öresjön, the upper limit is approved by the WaterRights Court to be 134.3 meter local level (m.l.l.) and the lower limit is approved to be 131.5m.l.l. That gives an allowed range of 2.8 m. According to the classification for the regulationamplitude this corresponds to class 3. The whole regulation amplitude is seldom utilized. In
76
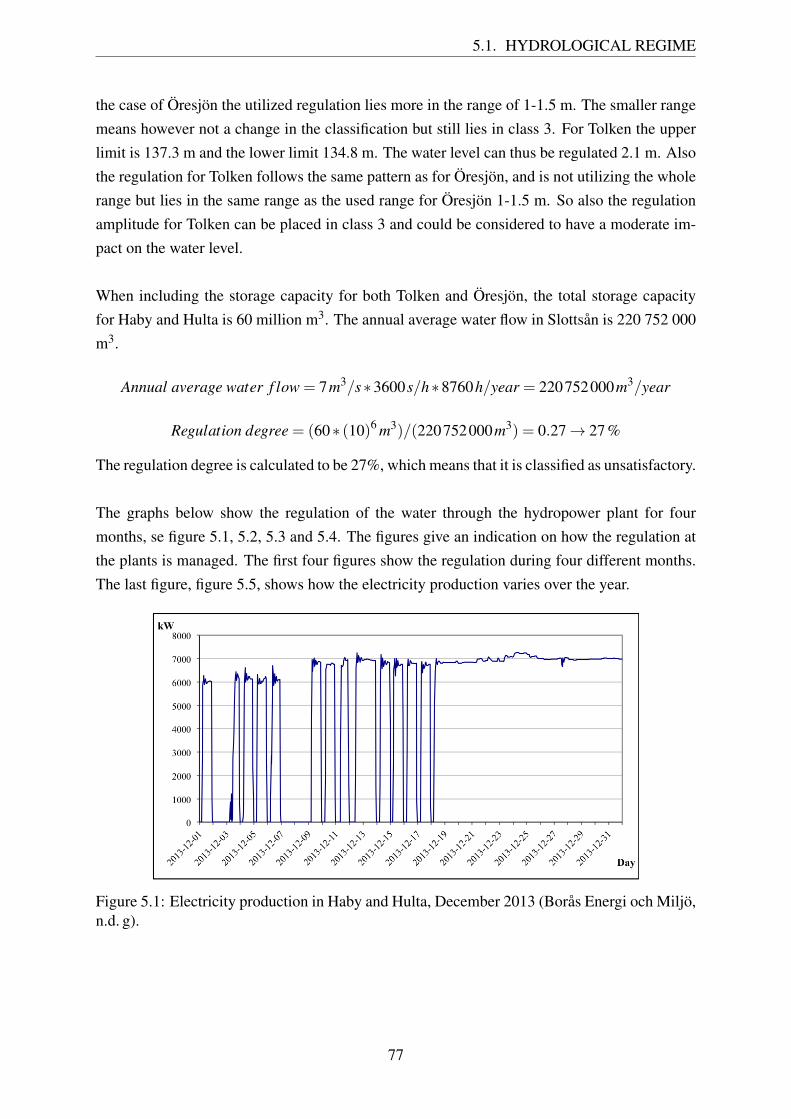
5.1. HYDROLOGICAL REGIME
the case of Öresjön the utilized regulation lies more in the range of 1-1.5 m. The smaller rangemeans however not a change in the classification but still lies in class 3. For Tolken the upperlimit is 137.3 m and the lower limit 134.8 m. The water level can thus be regulated 2.1 m. Alsothe regulation for Tolken follows the same pattern as for Öresjön, and is not utilizing the wholerange but lies in the same range as the used range for Öresjön 1-1.5 m. So also the regulationamplitude for Tolken can be placed in class 3 and could be considered to have a moderate im-pact on the water level.
When including the storage capacity for both Tolken and Öresjön, the total storage capacityfor Haby and Hulta is 60 million m3. The annual average water flow in Slottsån is 220 752 000m3.
Annual average water f low = 7m3/s∗3600s/h∗8760h/year = 220752000m3/year
Regulation degree = (60∗ (10)6 m3)/(220752000m3) = 0.27→ 27 %
The regulation degree is calculated to be 27%, which means that it is classified as unsatisfactory.
The graphs below show the regulation of the water through the hydropower plant for fourmonths, se figure 5.1, 5.2, 5.3 and 5.4. The figures give an indication on how the regulation atthe plants is managed. The first four figures show the regulation during four different months.The last figure, figure 5.5, shows how the electricity production varies over the year.
Figure 5.1: Electricity production in Haby and Hulta, December 2013 (Borås Energi och Miljö,n.d. g).
77
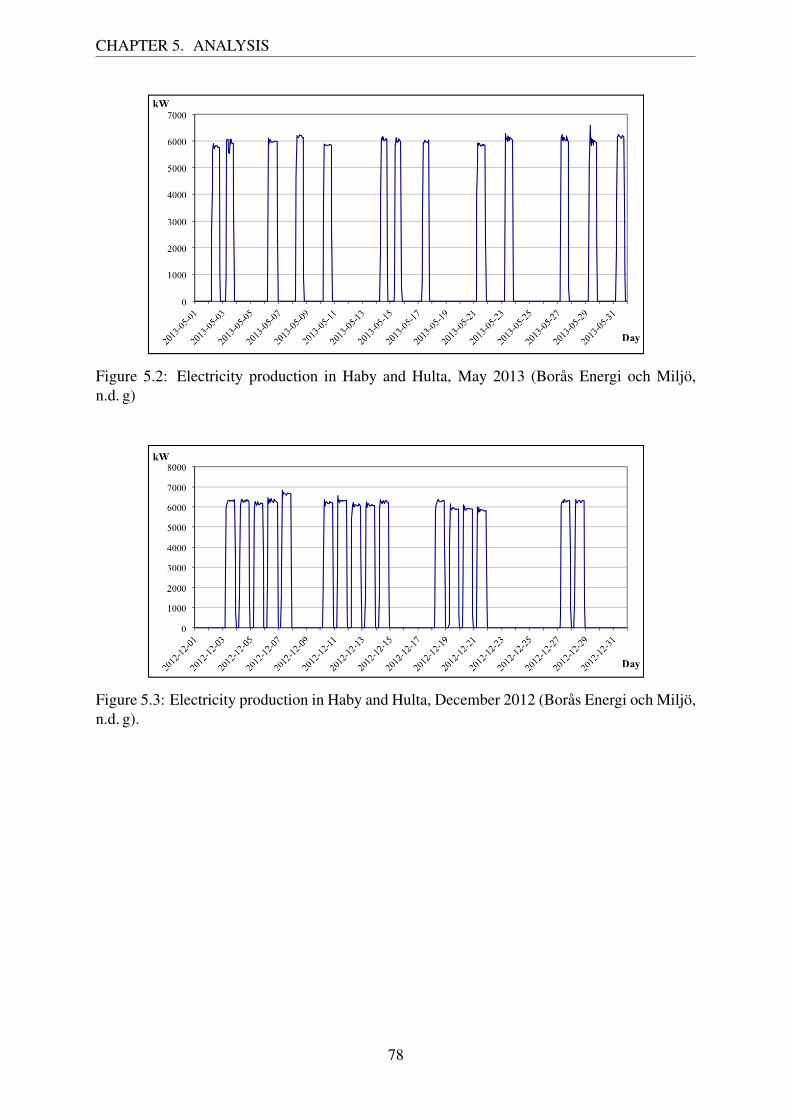
CHAPTER 5. ANALYSIS
Figure 5.2: Electricity production in Haby and Hulta, May 2013 (Borås Energi och Miljö,n.d. g)
Figure 5.3: Electricity production in Haby and Hulta, December 2012 (Borås Energi och Miljö,n.d. g).
78
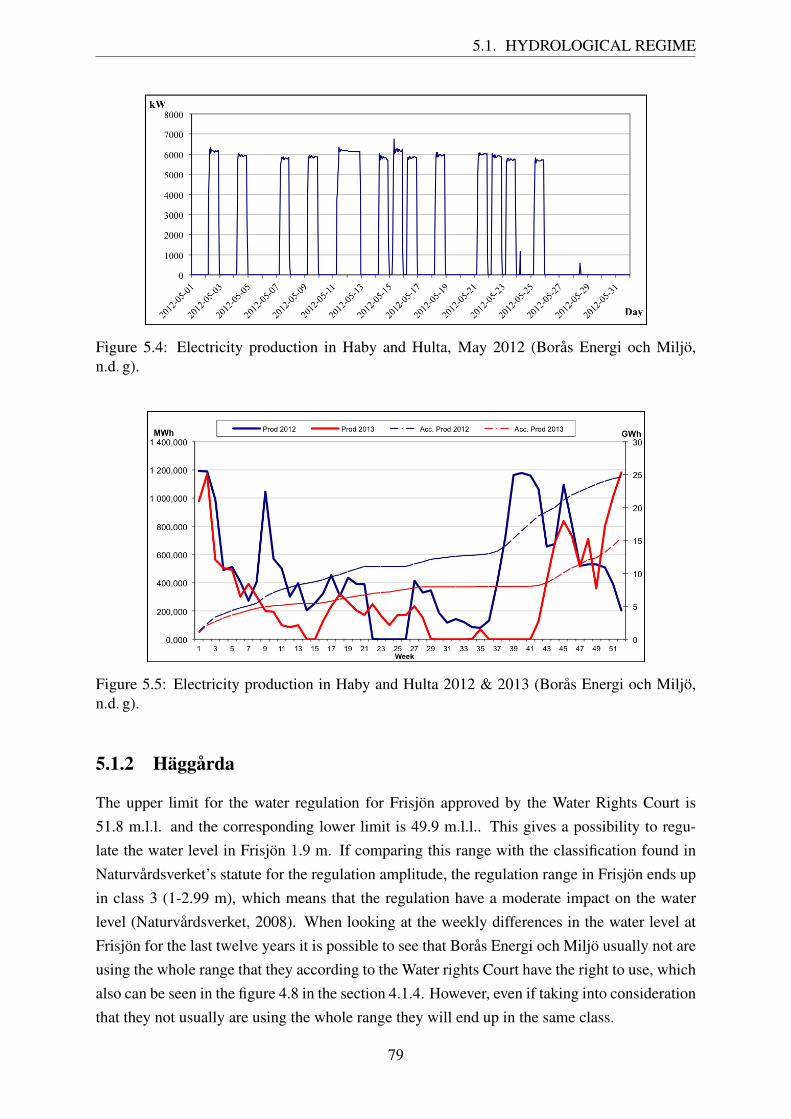
5.1. HYDROLOGICAL REGIME
Figure 5.4: Electricity production in Haby and Hulta, May 2012 (Borås Energi och Miljö,n.d. g).
Figure 5.5: Electricity production in Haby and Hulta 2012 & 2013 (Borås Energi och Miljö,n.d. g).
5.1.2 Häggårda
The upper limit for the water regulation for Frisjön approved by the Water Rights Court is51.8 m.l.l. and the corresponding lower limit is 49.9 m.l.l.. This gives a possibility to regu-late the water level in Frisjön 1.9 m. If comparing this range with the classification found inNaturvårdsverket’s statute for the regulation amplitude, the regulation range in Frisjön ends upin class 3 (1-2.99 m), which means that the regulation have a moderate impact on the waterlevel (Naturvårdsverket, 2008). When looking at the weekly differences in the water level atFrisjön for the last twelve years it is possible to see that Borås Energi och Miljö usually not areusing the whole range that they according to the Water rights Court have the right to use, whichalso can be seen in the figure 4.8 in the section 4.1.4. However, even if taking into considerationthat they not usually are using the whole range they will end up in the same class.
79
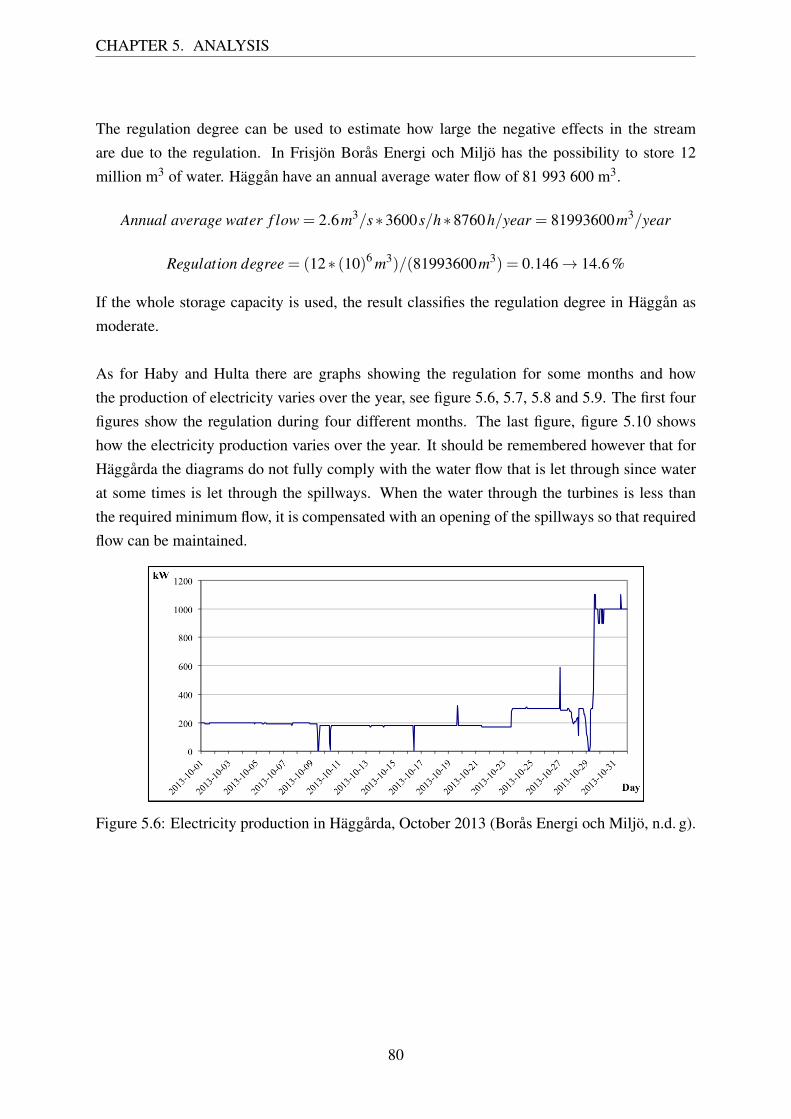
CHAPTER 5. ANALYSIS
The regulation degree can be used to estimate how large the negative effects in the streamare due to the regulation. In Frisjön Borås Energi och Miljö has the possibility to store 12million m3 of water. Häggån have an annual average water flow of 81 993 600 m3.
Annual average water f low = 2.6m3/s∗3600s/h∗8760h/year = 81993600m3/year
Regulation degree = (12∗ (10)6 m3)/(81993600m3) = 0.146→ 14.6 %
If the whole storage capacity is used, the result classifies the regulation degree in Häggån asmoderate.
As for Haby and Hulta there are graphs showing the regulation for some months and howthe production of electricity varies over the year, see figure 5.6, 5.7, 5.8 and 5.9. The first fourfigures show the regulation during four different months. The last figure, figure 5.10 showshow the electricity production varies over the year. It should be remembered however that forHäggårda the diagrams do not fully comply with the water flow that is let through since waterat some times is let through the spillways. When the water through the turbines is less thanthe required minimum flow, it is compensated with an opening of the spillways so that requiredflow can be maintained.
Figure 5.6: Electricity production in Häggårda, October 2013 (Borås Energi och Miljö, n.d. g).
80
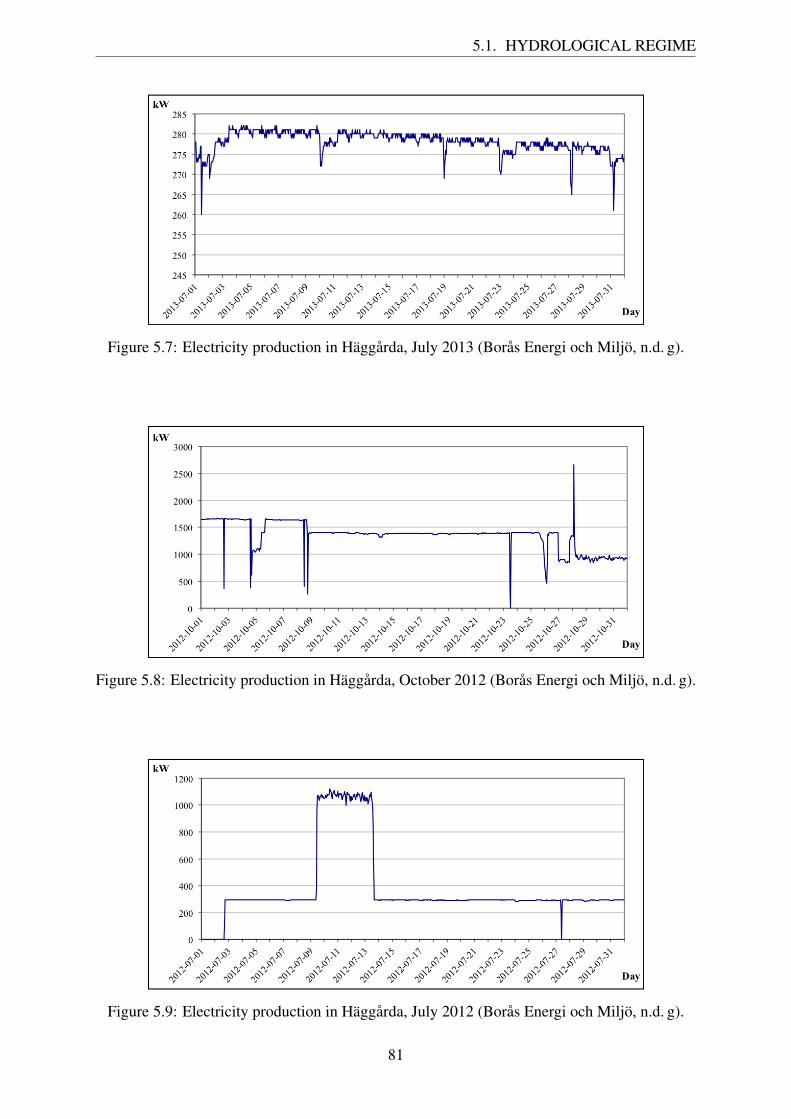
5.1. HYDROLOGICAL REGIME
Figure 5.7: Electricity production in Häggårda, July 2013 (Borås Energi och Miljö, n.d. g).
Figure 5.8: Electricity production in Häggårda, October 2012 (Borås Energi och Miljö, n.d. g).
Figure 5.9: Electricity production in Häggårda, July 2012 (Borås Energi och Miljö, n.d. g).
81
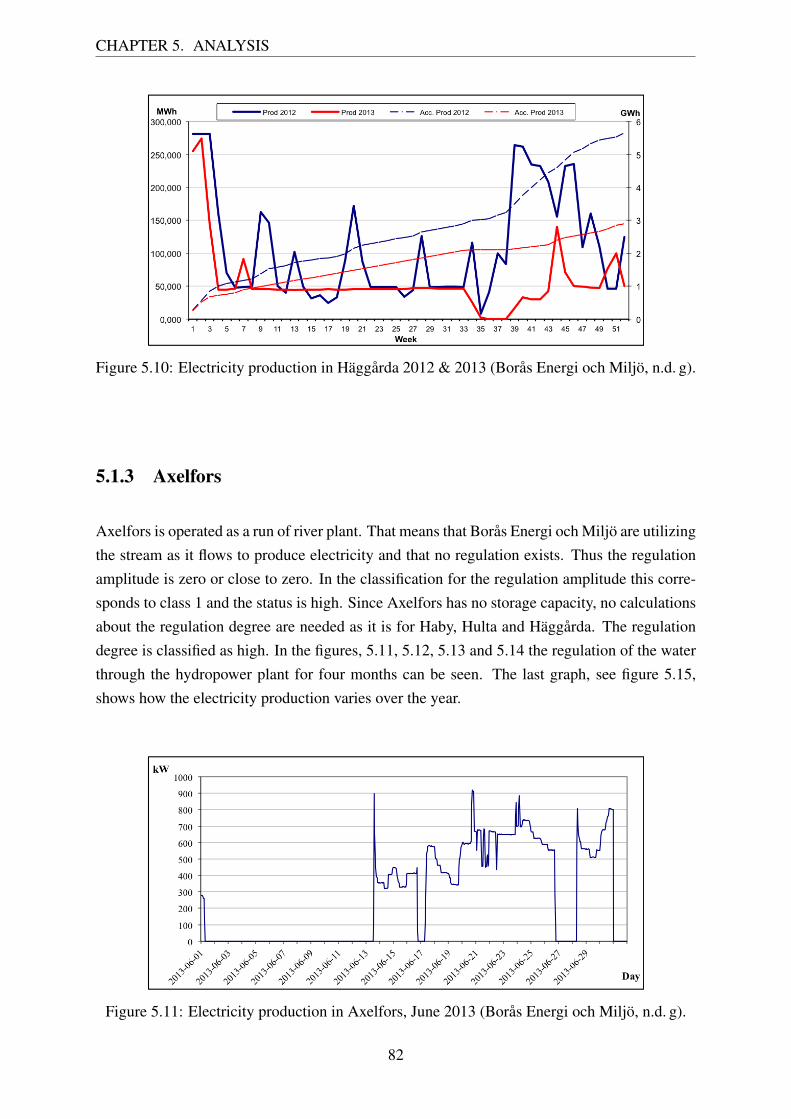
CHAPTER 5. ANALYSIS
Figure 5.10: Electricity production in Häggårda 2012 & 2013 (Borås Energi och Miljö, n.d. g).
5.1.3 Axelfors
Axelfors is operated as a run of river plant. That means that Borås Energi och Miljö are utilizingthe stream as it flows to produce electricity and that no regulation exists. Thus the regulationamplitude is zero or close to zero. In the classification for the regulation amplitude this corre-sponds to class 1 and the status is high. Since Axelfors has no storage capacity, no calculationsabout the regulation degree are needed as it is for Haby, Hulta and Häggårda. The regulationdegree is classified as high. In the figures, 5.11, 5.12, 5.13 and 5.14 the regulation of the waterthrough the hydropower plant for four months can be seen. The last graph, see figure 5.15,shows how the electricity production varies over the year.
Figure 5.11: Electricity production in Axelfors, June 2013 (Borås Energi och Miljö, n.d. g).
82
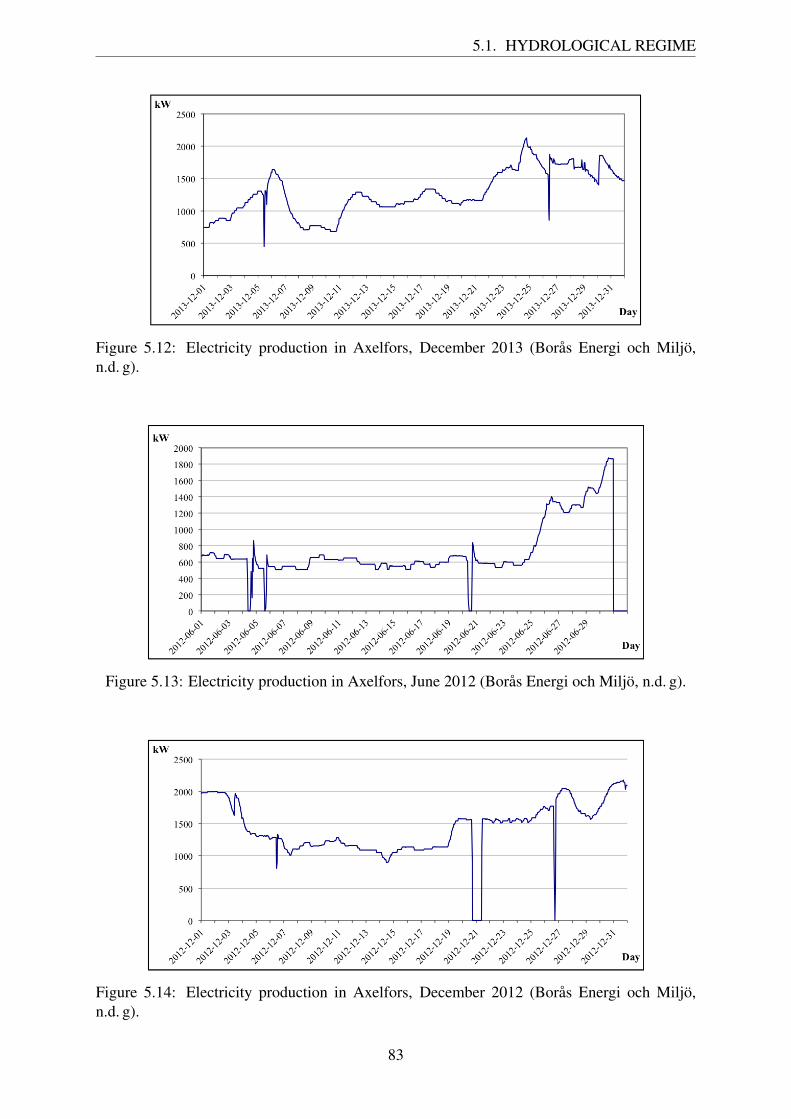
5.1. HYDROLOGICAL REGIME
Figure 5.12: Electricity production in Axelfors, December 2013 (Borås Energi och Miljö,n.d. g).
Figure 5.13: Electricity production in Axelfors, June 2012 (Borås Energi och Miljö, n.d. g).
Figure 5.14: Electricity production in Axelfors, December 2012 (Borås Energi och Miljö,n.d. g).
83
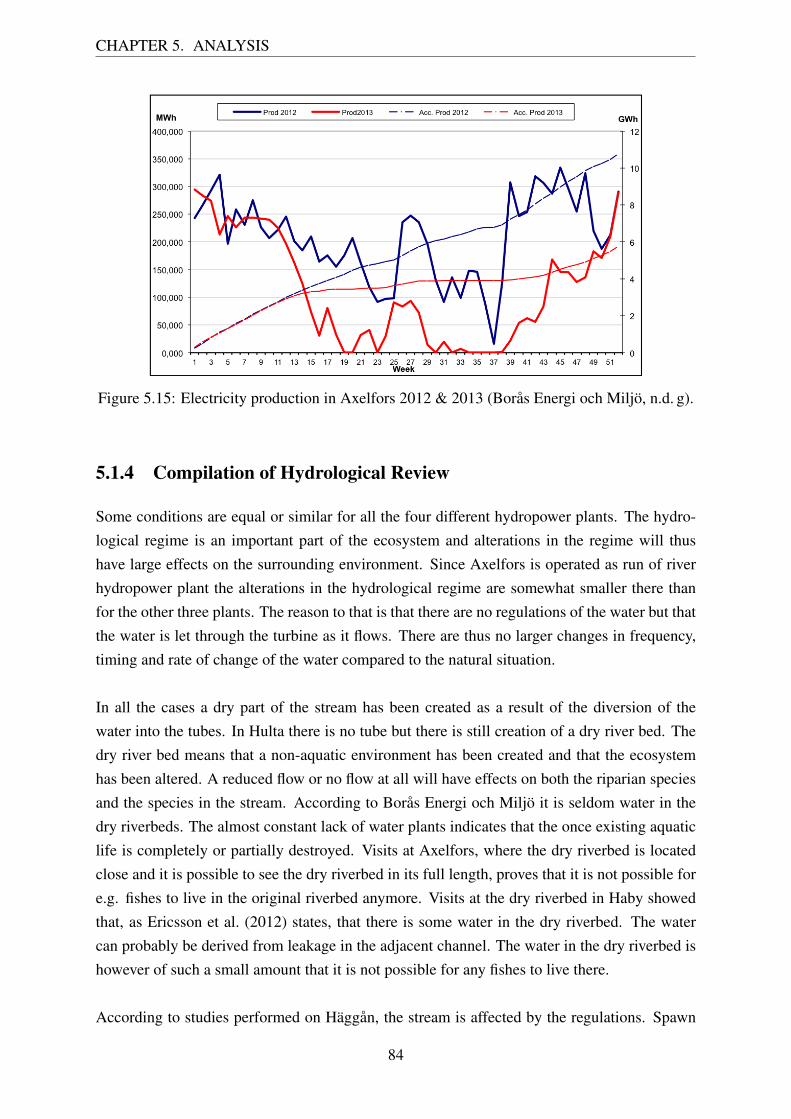
CHAPTER 5. ANALYSIS
Figure 5.15: Electricity production in Axelfors 2012 & 2013 (Borås Energi och Miljö, n.d. g).
5.1.4 Compilation of Hydrological Review
Some conditions are equal or similar for all the four different hydropower plants. The hydro-logical regime is an important part of the ecosystem and alterations in the regime will thushave large effects on the surrounding environment. Since Axelfors is operated as run of riverhydropower plant the alterations in the hydrological regime are somewhat smaller there thanfor the other three plants. The reason to that is that there are no regulations of the water but thatthe water is let through the turbine as it flows. There are thus no larger changes in frequency,timing and rate of change of the water compared to the natural situation.
In all the cases a dry part of the stream has been created as a result of the diversion of thewater into the tubes. In Hulta there is no tube but there is still creation of a dry river bed. Thedry river bed means that a non-aquatic environment has been created and that the ecosystemhas been altered. A reduced flow or no flow at all will have effects on both the riparian speciesand the species in the stream. According to Borås Energi och Miljö it is seldom water in thedry riverbeds. The almost constant lack of water plants indicates that the once existing aquaticlife is completely or partially destroyed. Visits at Axelfors, where the dry riverbed is locatedclose and it is possible to see the dry riverbed in its full length, proves that it is not possible fore.g. fishes to live in the original riverbed anymore. Visits at the dry riverbed in Haby showedthat, as Ericsson et al. (2012) states, that there is some water in the dry riverbed. The watercan probably be derived from leakage in the adjacent channel. The water in the dry riverbed ishowever of such a small amount that it is not possible for any fishes to live there.
According to studies performed on Häggån, the stream is affected by the regulations. Spawn
84

5.1. HYDROLOGICAL REGIME
areas have been destroyed and the trout is one species that have been assessed to be affectednegatively by the regulation.
Another important factor connected to the impacts on the environment and the hydrologicalregime is how the regulation is operated. Fast and short changes in the water flow, so calledshort-term regulation, will have adverse effects on the ecosystem, which also can be read in theliterature review about the hydrological regime, se chapter 3.1.2. The regulations of the waterlevel at Tolken, Frisjön and Öresjön are decided on a weekly basis. If no unforeseen eventshappen during the week, e.g. sudden increases in the water level in the lakes due to heavyrainfalls, no changes are done in the planned week regulation (A Rieck 2014, pers. comm., 24February)1 How the regulation of the water in the stream is operated can be seen by lookingat the diagrams showing the production for the different months. It can be seen that it is Habyand Hulta that has the most significant short-term regulation. The plants in Haby and Hultaare often operated so that no electricity is produced during the night and then started up in themorning to produce electricity. This means that there are often times with no water coming atall through the hydropower plants and since there are no requirements on a minimum flow itmeans that no water at all is let through downstream. The short-term regulation can underlieadverse impacts at the ecosystem downstream and as can be read in the literature review therecan be damages e.g. on the fish and the benthos living downstream. For the two other plants,Axelfors and Häggårda it is not possible to see the same short-term regulation as in Haby andHulta. Axelfors has no regulation at all, the variations in the production is a result of the vari-ations in the water flow. There are however times when there is no production, which also canbe seen in e.g. the production for June 2013. However, at these times, the water is releasedthrough spillways. The reason behind the stops could e.g. be low water flows or revisions ofthe hydropower plants.
Another change following the commissioning of the hydropower plants are the damming ofthe river for the creation of a storage reservoir. Since Axelfors is a run of river hydropowerplants no storage reservoir is created. For the three other plants, natural lakes are used for thestorage of water. This means that no artificial reservoirs were created following the construc-tion of the hydropower plants but that the natural existing lakes are used as reservoirs. Due tothe lack of information about the state of the water levels in the lakes before the regulation it ishard to get an understanding for the size of the changes. It is however possible to assume thatthe changes were smaller than if a part of the stream would have been used for the creation of astorage reservoir. With a smaller part of land inundated it is also probable that there were fewerdamages on e.g. the riparian zone.
It is possible to draw conclusions that due to the changes in the hydrological regime the flora
1Anna Rieck, Process Engineer Borås Energi och Miljö, conversation 24 February 2014
85
CHAPTER 5. ANALYSIS
and fauna, both in the water and land living, are affected by regulation in the water streamand in the lakes. The hydrological regime and the alteration of the hydrological regime playan important role for the functions in the ecosystem, which also could be understood from theliterature review where the hydrological regime and the changes in it is said to have an sig-nificant impact. The problem is to quantify the effects. Looking at the classifications has allthe plants except Axelfors a moderate status for the regulation amplitude. For the regulationdegree is Haby and Hulta classified as unsatisfactory and Häggårda as moderate. This does notsay anything about the magnitude of the impacts on the ecosystem but only where on the scalethe regulation of the plants is. Even if it does not say anything about the magnitude so givesit indications on that there are impacts. It is mentioned earlier in the text about the wishes tokeep the water levels in Frisjön so it will not harm the pike, the black-throated loon and themarsh gentian. If that not is done, it is simple but obvious examples of impacts related to theregulation of the lake.
5.2 Sedimentation
In the literature review about sedimentation it is stated that the rate of sedimentation is due toseveral different factors. It can also be read that in the case of small hydropower plants with thewater coming from a closely located lake, a calm body with water is provided. Generally withthis type of hydropower plants the rate of sedimentation is low. Haby, Hulta and Häggårda areall small hydropower plants with the water coming from a closely located lake, which thereforecould indicate on a low sedimentation rate. Also for Axelfors the conditions are indicating thatthe problem with sedimentation is small. When talking to Borås Energi och Miljö they statethat they do not have any known problems with sedimentation. This together with the abovementioned reasons it is probable that the problems with sedimentation is not significant for thefour hydropower plants.
5.3 Water Quality
The existing knowledge about the water quality in Häggån, Slottsån and Ätran is very limitedwhich makes it hard to say anything about the water quality and if it depends on the hydropowerplants or if it is derived from other disturbances. Literature findings indicate a strong site de-pendency for hydropower impacts on water quality. This makes it therefore hard to concludeanything about e.g. increased sensitivity due to reduced flow, turbidity and gas supersaturationin the stream. What can be said about the temperature is that the kind of changes in temperaturerelated to the creation of reservoirs are not relevant here since Haby, Hulta and Häggårda areusing naturally existing lakes as storage reservoirs. Axelfors has no storage of water at all andthat kind of temperature changes are not relevant here either.
86
5.3. WATER QUALITY
From the operation of a hydropower plants there are generally no direct emissions that areharmful but the hydropower plants can in other ways affect the water quality. The exception isthe release of oil in the water and if different substances are used for the e.g. anti-fouling. In2002 there was a release of oil in Haby due to a valve that was not sealed. There is no exactnumbers on the amount of oil that reached the water but 75 litres was pumped out and not all ofstayed in the sump or was wiped up but reached the water, exact quantities are not known. Thiscaused an oil film on the water downstream the plant. The emergency services was called andplaced out an oil boom and a company was hired for the oil decontamination (Borås Energi ochMiljö, 2002). This shows that there exists a risk for oil spills that can have an adverse impacton the ecosystem.
As mentioned in the text about the hydropower plants there was a change of the hydraulicequipment in Haby, in 2003. When the hydraulic equipment was changed, a large amount ofoil needed in the powerpack was reduced. This means that the amount of oil that will be in thepower plant is significantly reduced. This means that if something goes wrong and the oil in thepowerpack starts to leak, there is less oil that can reach and harm the surrounding environment.
From the inundation of land there can be a release of mercury that has been accumulated inthe soil. Some of the mercury that can be find in the environment today in Sweden is resultfrom use of alkyl mercury in the agriculture and the use of phenyl mercury in the pulp andpaper industry (Kihlström, 2006). This started in the 1940’s, which means that at the time forthe commissioning of the four hydropower plants, there was no mercury accumulated in thesoil that could be released. Since no measurements have been performed it is not known if thishappened at the site here but since natural existing lakes has been used and the area of landinundated probably is limited, a possible estimation that the risk for a release of mercury issmaller than if large land areas had been inundated.
In the literature review different causes to eutrophication are mentioned. One possible cause isthat the regulation leads to an increased level of nutrients in the water from the flooded biomass.Since natural existing lakes have been used and more than 20 years have passed, which is theapproximate time limit for it to get stable, it is possible to assume that it is probably not a largeproblem here. It is also mentioned that in most cases the eutrophication is due to other anthro-pogenic causes and not due to the existence of hydropower plants.
Hydropower plants do not necessary need to have an adverse effect on the water quality butcan actually improve the water quality. Run of river plants do not have many of the adverse ef-fects on the water quality written about in the literature review. As known is Axelfors operatedas a run of river plant and therefore can many of the impacts such as temperature, decreased
87
CHAPTER 5. ANALYSIS
food production, siltation, increased nitrogen and phosphorus levels and low oxygen levels beexcluded in this case. For small hydropower plants, a category which all the four hydropowerplants can be included in, the use of trash rack-cleaning machines hinders things such as plasticand bottles to be spread in the water system. This may not be a big problem in the streams inthis case but it is one of the good effects on the water quality that hydropower plants can resultin. For gas supersaturating it is also mentioned that in the case of small hydropower plants,the gas pressure often is decreased instead of increased, which means that gas supersaturationprobably not is a problem here.
5.4 Migration Barriers
The problem with the hydropower plants and that it often constitutes a definite barrier for thespecies in the stream that migrates has briefly been discussed in the chapter about the impactson the biodiversity. In this chapter the possible problems with the fish barriers in AxelforsHaby, Hulta and Häggårda will be more thoroughly discussed.
The fact that hydropower plants often stops the fishes and the other species in the stream frommigrating is seen as one of the biggest problems with hydropower plants. As mentioned in theliterature review some of the fish species are dependent of different environmental conditionsduring the different parts of the life cycle.
None of the hydropower plants owned by Borås Energi och Miljö has any fishways, nor arethere any eel passages despite that it for Haby, Hulta and Häggårda are requirements on thatmentioned in the water rights permit. The lack of connectivity constitutes a problem for allof the streams. The barriers that the hydropower plants form, is mentioned in the informationfrom Vatteninformationssystem Sverige, as one of the main problems to reach good ecologicalstatus by 2021. The fishes are recognized as the main animal group affected by the existence ofbarriers in the stream but also other organisms living in the stream are affected. As can be readin the literature review about fish barriers examples of anadromous fishes are salmon and troutand an example of a catadromous fish is eel, examples of fishes that all can be found or hasbeen found in the concerning streams. The hydropower plants in Haby and Hulta hinders todaythe trout from reaching 56 865 m2 spawn area above Haby. It is therefore possible to drawthe conclusion that the two hydropower plants together with the dam in Hyltenäsån hinders thesalmon and trout from reaching Öresjön and Tolken and the trout form reaching its spawn area.Even for the eel, Hulta and Haby constitute a barrier and it is for example not unusual to seedeed eel caught in the intake screen to Hulta (K-Å Mattson 2014, pers. comm., 3 March)2.Also for Axelfors and Häggårda the hydropower plants constitutes a barrier for the fishes.
2Kjell-Åke Mattson, Project Manager Borås Energi och Miljö, conversation 2 March 2014
88
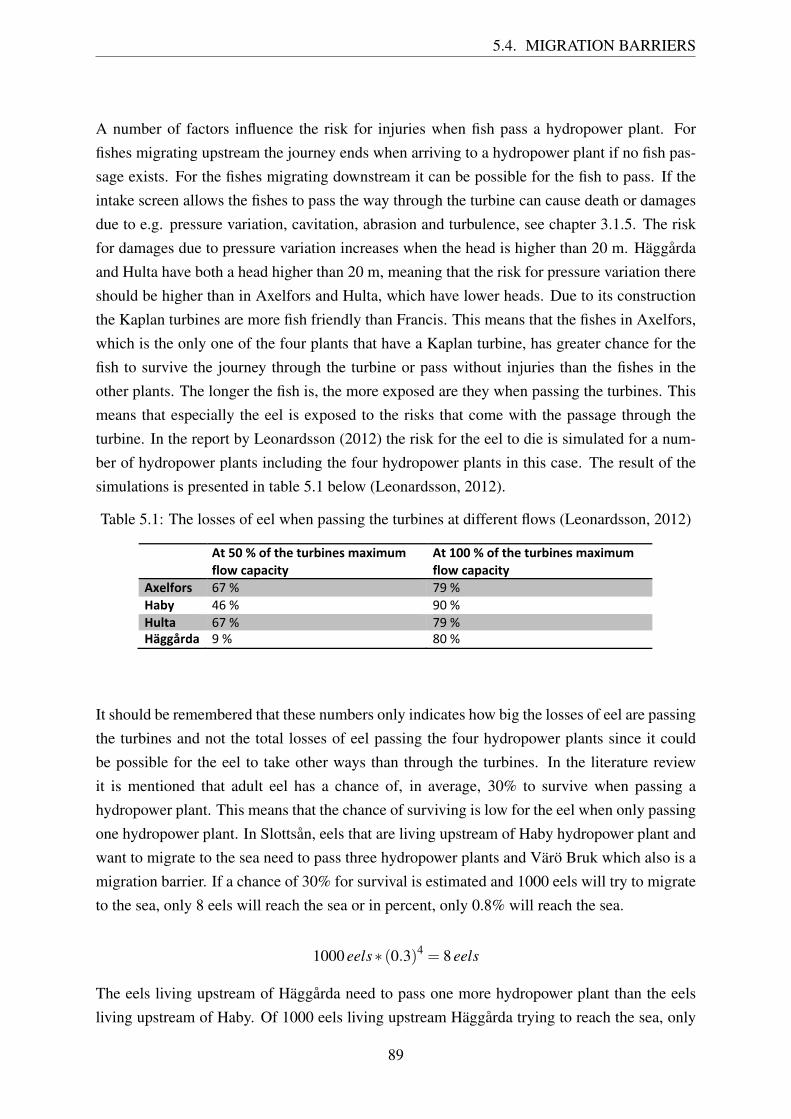
5.4. MIGRATION BARRIERS
A number of factors influence the risk for injuries when fish pass a hydropower plant. Forfishes migrating upstream the journey ends when arriving to a hydropower plant if no fish pas-sage exists. For the fishes migrating downstream it can be possible for the fish to pass. If theintake screen allows the fishes to pass the way through the turbine can cause death or damagesdue to e.g. pressure variation, cavitation, abrasion and turbulence, see chapter 3.1.5. The riskfor damages due to pressure variation increases when the head is higher than 20 m. Häggårdaand Hulta have both a head higher than 20 m, meaning that the risk for pressure variation thereshould be higher than in Axelfors and Hulta, which have lower heads. Due to its constructionthe Kaplan turbines are more fish friendly than Francis. This means that the fishes in Axelfors,which is the only one of the four plants that have a Kaplan turbine, has greater chance for thefish to survive the journey through the turbine or pass without injuries than the fishes in theother plants. The longer the fish is, the more exposed are they when passing the turbines. Thismeans that especially the eel is exposed to the risks that come with the passage through theturbine. In the report by Leonardsson (2012) the risk for the eel to die is simulated for a num-ber of hydropower plants including the four hydropower plants in this case. The result of thesimulations is presented in table 5.1 below (Leonardsson, 2012).
Table 5.1: The losses of eel when passing the turbines at different flows (Leonardsson, 2012)
! "#!$%!&!'(!#)*!#+,-./*0!123.1+1!(4'5!62726.#8!
"#!9%%!&!'(!#)*!#+,-./*0!123.1+1!(4'5!62726.#8!
"3*4(',0! !"#$# "%#$#:2-8! &!#$# %'#$#:+4#2! !"#$# "%#$#:;<<=,>2! %#$# ('#$##
It should be remembered that these numbers only indicates how big the losses of eel are passingthe turbines and not the total losses of eel passing the four hydropower plants since it couldbe possible for the eel to take other ways than through the turbines. In the literature reviewit is mentioned that adult eel has a chance of, in average, 30% to survive when passing ahydropower plant. This means that the chance of surviving is low for the eel when only passingone hydropower plant. In Slottsån, eels that are living upstream of Haby hydropower plant andwant to migrate to the sea need to pass three hydropower plants and Värö Bruk which also is amigration barrier. If a chance of 30% for survival is estimated and 1000 eels will try to migrateto the sea, only 8 eels will reach the sea or in percent, only 0.8% will reach the sea.
1000 eels∗ (0.3)4 = 8 eels
The eels living upstream of Häggårda need to pass one more hydropower plant than the eelsliving upstream of Haby. Of 1000 eels living upstream Häggårda trying to reach the sea, only
89
CHAPTER 5. ANALYSIS
2 eels will reach the sea or 0.2 % of the eels will survive their migration to the sea.
1000 eels∗ (0.3)5 = 2 eels
For the eel living upstream of Axelfors, the chance of reaching the sea is even smaller. The eelupstream Axelfors needs to pass seven hydropower plants. This results in that no eel, if thereis as in this example 1000 eels trying to migrate, will reach the sea or that only 0.02 % of theeels living upstream of Axelfors will survive their migration to the sea.
1000 eels∗ (0.3)7 = 0.2 eels
Even if other factors affect the eels’ survival and the survival rate may differ between the dif-ferent hydropower plants, give the calculations indications on how small the chances are forthe eels to reach the sea when they need to pass several hydropower plants.
Borås Energi och Miljö are members of both Ålplan (eel plan) Ätran and Ålplan Viskan. Thepurpose with the eel plans is to plant out eel fry in the stream. The planting out of the eelfry works as a compensation for the missing eel passages. As mentioned in the text about theecosystem, there are concerns on how well the eel plans works compared to if there had beenwell functioning eel fishways. It is therefore likely that the losses of eel are bigger than theywould have been if there had been eel fishways at the hydropower plants instead. The authorsin the report from Norconsult (2011) states even that the eel plan could have negative effects inthe long term on the eel population due to insufficient knowledge about the eel collectors andthe fact that the eels let out upstream have small chances of reaching the sea.
Some of the different causes behind injuries and death of the fishes are hard to prove, suchas cavitation, abrasion, shear and turbulence, to the case for the four hydropower plants dueto lack of information. However, these are common causes and there is nothing proving theopposite, thus it is possible to assume that the fishes are exposed to at least some of them. Itis possible to conclude that all the four hydropower plants and the dam in Hyltenäsån are fishbarriers and hinders the fish and other species to migrate in the stream. All of the streamswhere the hydropower plants are situated are classified, according to Länsstyrelsen, as havinga moderate ecological status and with a risk of not reaching good ecological status by 2021.One of the reasons behind that is the existence of fish barriers in the streams. In the reportby Wengström (2011) it is stated that the hydropower plants in Haby and Hulta works as defi-nite migration barriers. With definite it means that the barrier most likely cannot be passed byfishes. For the dam in Hyltenäsån the migration barrier is partial, which means that the barrierat favorable conditions can be passed. The same information does not exist for Axelfors orHäggårda. However, by drawing parallels to the conditions in Haby and Hulta and combining
90
5.5. GREENHOUSE GAS EMISSIONS
that with the existing information, it is possible to do draw conclusions. For both Axelfors andHäggårda, there is a lack of fishways as for Haby and Hulta and the hydropower plants areconstructed in similar ways. This means that both Häggårda and Axelfors constitutes at leastpartial migration barriers but probably are also they definite.
5.5 Greenhouse Gas Emissions
To get a correct estimation about the GHG emissions from the hydropower plants accurateand comprehensive studies would be needed. Numbers would have been needed about all theemissions from the whole life cycle, including construction, operation and maintenance etc.Measurements would also be needed on the differences in the GHG emissions from the landthat may have been inundated following the commissioning of the hydropower plant. Evenif those numbers not are available it is possible to use the knowledge from the studied litera-ture to get an approximate estimation if the GHG emissions are of concern or not seen to theenvironmental impacts due to the use of the operation of the hydropower plants. The size ofthe emissions are highly site-specific and depends, as mentioned in the literature review, onfactors such as climate, size of reservoir and the kind of vegetation flooded. It is therefore ofimportance to have an approximate idea about in which climate zone the hydropower plantsare situated since the type of climate zone is one of the factors that can affect the size of theemissions. As can be read in chapter 4.1., can the climate where Haby, Hulta, Häggårda andAxelfors are situated, be seen as boreal climate and can be compared with the GHG emissionsfrom hydropower plants located in boreal climate.
The size of the reservoir is an important factor when it comes to the estimation of the GHGemissions, one reason to that is that the size of the reservoir also determines the amount of landinundated. The biomass flooded will start to decay and produce GHG emissions. The numbersindicating on the largest emissions are from locations with tropical climates and these are thusnot comparable with the size of the possible GHG emissions from plants located in other cli-mates. With the exception of Axelfors that has no reservoir, natural existing lakes have beenused as reservoirs. This means that it is possible to assume that very small areas were inundatedat the time for the commissioning of the hydropower plants. One of the studies included in theliterature review also points out that the quantity of the flooded biomass in boreal areas is rathersmall.
Some of the studies used in the literature review have also looked at the development of theinundated areas and the following GHG emissions. It seems like that the collective opinionwas that the emissions will decline with the years and that reservoirs will after 10-15 yearsreach lake-like conditions and for boreal climates an even shorter time period is required. An-
91
CHAPTER 5. ANALYSIS
other study estimates that after 50 years the emissions from the reservoirs will have reachedzero net emissions.
The conditions at the locations for the three hydropower plants with the possibility to storewater and the fact that natural existing lake have been used indicates that the possible GHGemissions was small already at the first years after the hydropower plants was built. Due to theage of the plants, which is considerably higher than 50 years, it can be assumed that the possibleGHG emissions as declined and now reached zero net emissions. Looking back at the differentstages of the life cycle that can produce GHG emissions, it is operation and maintenance thatproduces GHG emissions today. The overall conclusion is therefore that the operation of thefour hydropower plants today produces very small amount of GHG emissions. From a life cycleperspective the GHG emissions probably lies in the range of 3-14 g CO2/kWh. This is the sizeof the emissions that most of the studies performed on hydropower plants in similar conditionslooked at in the literature study have shown. For Axelfors the numbers can be assumed to be abit smaller than for the other plants due to its properties as a run of river plant. For most of thestudies read in the literature review the expected life length, or the numbers of years they haveallocated the emissions from the whole life cycle on, are 100 years. That makes the numberssuitable for a comparison with the conditions for the four hydropower plants in this case studysince they are approaching or even have reached this life length. It could even indicate for anoverestimating of the numbers since the plants can reach a life length that exceeds 100 years.The emissions today are connected to the emissions from the operation of the plant, e.g. reno-vations and maintenance.
Some of the LCA studies have also included NOx and SO2 emissions. The studies show that hy-dropower produces low emissions of these substances compared to many other energy sources.It should always be remembered, which also is emphasized in almost all the studies in theliterature review, that the size of the emissions are highly site-specific. It is however, still pos-sible to draw parallels to the situation in Axelfors, Haby, Hulta and Häggårda. There are somevariations in the size of the emissions estimated for the NOx and SO2. None of the estimatesindicates any high values and it is therefore possible to assume that the NOx and SO2 also forthe four hydropower plants range in the lower part of scale. Thus the NOx and SO2 or the GHGemissions should not have a big environmental impact compared to many other energy sources.Also compared with other renewable energy sources such as wind power, the four hydropowerplants should stand up well considering GHG, NOx and SO2 emissions.
92
5.6. BIODIVERSITY
5.6 Biodiversity
The changes in the environment that construction and operation of the hydropower plants re-sults in will have effects on the environment. This section will use the compiled informationfrom the literature review together with the known information about the ecosystem where thehydropower plants are situated, to get an estimation about the effects on the species living theredue to the hydropower plants. In the literature review chapter it can be read that the impactsfrom hydropower plants can be divided into three different levels, see section 3.1.1. Since theinformation about the species living in the stream concern the species in the third level thatit what mainly will be discussed here. This does not mean that there are no impacts at theother levels, especially since that the third-order impacts are a result of the two first ones, butthat there is a lack of information. Due to variation in the information that is possible to gainabout the biodiversity in the different streams, the information is not uniform and there are alsodifferences on how much information that exists about the different streams.
5.6.1 Slottsån
Before the construction of the hydropower plants in Slottsån it was possible for the salmonand trout to migrate up to Öresjön according to Wengström (2011), which is something that isimpossible today. The trout population has decreased, which can be seen as a possible result ofthe existence of the hydropower plants in the stream. Occurrences of eel and freshwater pearlmussel have been found in Slottsån. Investigations have also been performed on the speciesrichness in the benthos at different locations in the stream. For the dam area in Hulta thespecies richness in 2007 was classified as moderately high. A later investigation was performedin 2011. The conclusion from that investigation was that even if the result indicated goodconditions for the benthic zone with respect to hydro morphological impact the conditionswould probably been even higher if there were no hydropower plants.
5.6.2 Häggån
According to the reports about Häggån, it is possible to conclude that the hydropower plant hashad an adverse effect on the trout population in the stream. There have been several investiga-tions performed to get an estimation of the size of the freshwater pearl mussel population. Theproblem with comparing them is that they have not the same boundaries and that not totallythe same areas are included. However, looking at the studies, it is possible to see a reductionin the freshwater pearl mussel population. In an inventory from 1990, which probably alsoincluded the population in the tributary Lillån, the population was estimated to consist of 100-1000 individuals. An inventory performed 2003, estimated the population to consist of 10-100individuals. The most recent inventory, performed in 2013, found only single individuals in
93

CHAPTER 5. ANALYSIS
Häggån. The inventory from 2003 states also that no juvenile freshwater pearl mussels werepossible to find.
Another species that can be affected by the hydropower plant is the marsh gentian. As canbe read in the chapter about the different ecosystems, the regulation of Frisjön can cause thatthe flower is drained if the water level rises to high during some weeks in the summer. Also theblack-throated loon and the pike living in Frisjön may be affected negatively of the hydropowerplant.
5.6.3 Ätran
The information about the biodiversity in Axelfors is quite general and it is hard to find anyspecific information about the biodiversity around Axelfors. It can be read for example in thechapter about the information concerning the ecosystem around the hydropower plants thate.g. salmon and eel can be found in Ätran and that the benthic has high values. Since theinformation concerns mainly other parts of Ätran or the biodiversity in general it is hard to getan estimation of possible impacts on the biodiversity from the hydropower plant in Axelfors.
5.6.4 Compilation of Biodiversity Review
It is possible to conclude in some cases that the existence of the hydropower plants have had anegative effect on the biodiversity and species living in the ecosystem around the hydropowerplants, which can be read earlier in the text, see section 3.1.7. In other cases it can be hard todecide if the changes in the biodiversity are coming from the hydropower plants in the differentstreams or if it is a result of other impacts and it is hard to put any numbers on the losses.One problem with deciding the impacts on the biodiversity is that it is still an area with limitedknowledge and that the impacts on the biodiversity, as for many of the other impacts due to hy-dropower plants are very site-specific. In one of the studies, some fields, e.g. loss of habitat andspecial biotopes through inundation, fluctuating water levels, loss of flooding, introduction anddispersal of exotic species and also obstacles to fish migration, are pointed out as the most seri-ous causes following the installation of hydropower plants. It can be stated that the hydropowerplants are obstacles for fish migration and the problems with fish barriers is also pointed out inmany of the studies included in the literature review about biodiversity. The problem with fishbarriers due to the four hydropower plants in this case is further discussed in section 5.4 aboutMigration barriers. Since already existing natural lakes are used for the storage of water thesize of land inundated was probably not as large as it would have been if reservoirs had beencreated instead. This means that loss of habitats probably also are smaller than if reservoirswould have been created where there before was a stream. But some land areas has most likelybeen inundated and caused loss of habitats.
94
5.6. BIODIVERSITY
One of the studies included in the literature review have compared the amount of species inthe riparian zone for streams with run of river hydropower plants and streams with hydropowerplants with regulation to streams without hydropower plants. The study shown a lower amountof species for the stream with a run of river plant compared to a stream without hydropowerand even lower amounts for a stream with a hydropower plant with regulation. Transferringthis information to the situation for Haby, Hulta, Häggårda and Axelfors would mean that forall the cases is the riparian zone affected but that the effects probably are larger for the threeplants with regulation.
In one of the studies it can be read that the biodiversity in the benthos will be affected bythe regulation of the water. For Slottsån, one of the investigations also concluded that the con-ditions for the benthos probably would have been better if there was no regulation. It can alsobe read that heavy regulation can force the organisms to move or flush them away. Haby andHulta are more regulated than the two other plants in this case, which could indicate a possiblelarger impact on the organisms in the benthos there, than for the other plants.
The existence of trout and freshwater pearl mussel can be used as indicators for a generalgood environment in the stream. It is impossible to draw any exact conclusions about that nojuvenile freshwater pearl mussels are found in Häggån and that the trout population in bothHäggån and Slottsån are affected by the hydropower plants. But the fact that both the trout andfreshwater pearl mussel are affected should at least not be seen as a good sign.
In the table 5.2 below is the information about the biodiversity compiled. Even if only thetrout and freshwater pearl mussel is included in the table, it does not mean that they are theonly species affected but that they are the species the commonly in focus in the informationincluded in the literature study.
95
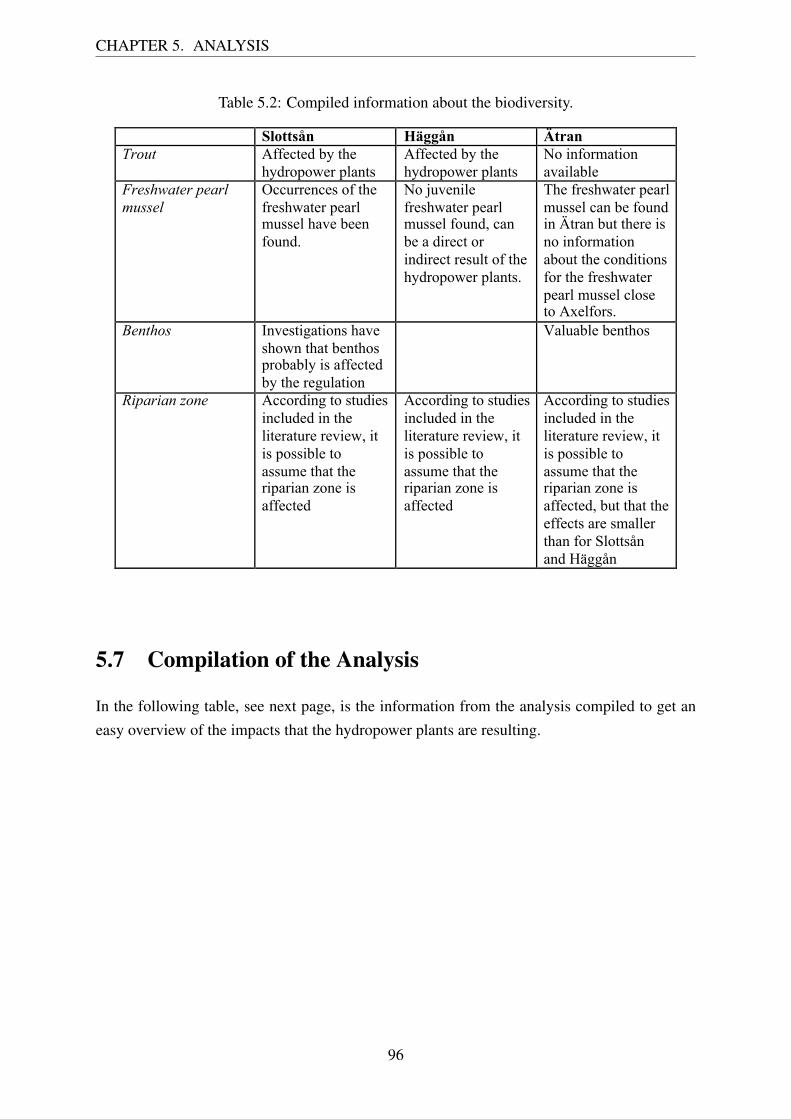
CHAPTER 5. ANALYSIS
Table 5.2: Compiled information about the biodiversity.
Slottsån Häggån Ätran Trout Affected by the
hydropower plants Affected by the hydropower plants
No information available
Freshwater pearl mussel
Occurrences of the freshwater pearl mussel have been found.
No juvenile freshwater pearl mussel found, can be a direct or indirect result of the hydropower plants.
The freshwater pearl mussel can be found in Ätran but there is no information about the conditions for the freshwater pearl mussel close to Axelfors.
Benthos Investigations have shown that benthos probably is affected by the regulation
Valuable benthos
Riparian zone According to studies included in the literature review, it is possible to assume that the riparian zone is affected
According to studies included in the literature review, it is possible to assume that the riparian zone is affected
According to studies included in the literature review, it is possible to assume that the riparian zone is affected, but that the effects are smaller than for Slottsån and Häggån
!
5.7 Compilation of the Analysis
In the following table, see next page, is the information from the analysis compiled to get aneasy overview of the impacts that the hydropower plants are resulting.
96
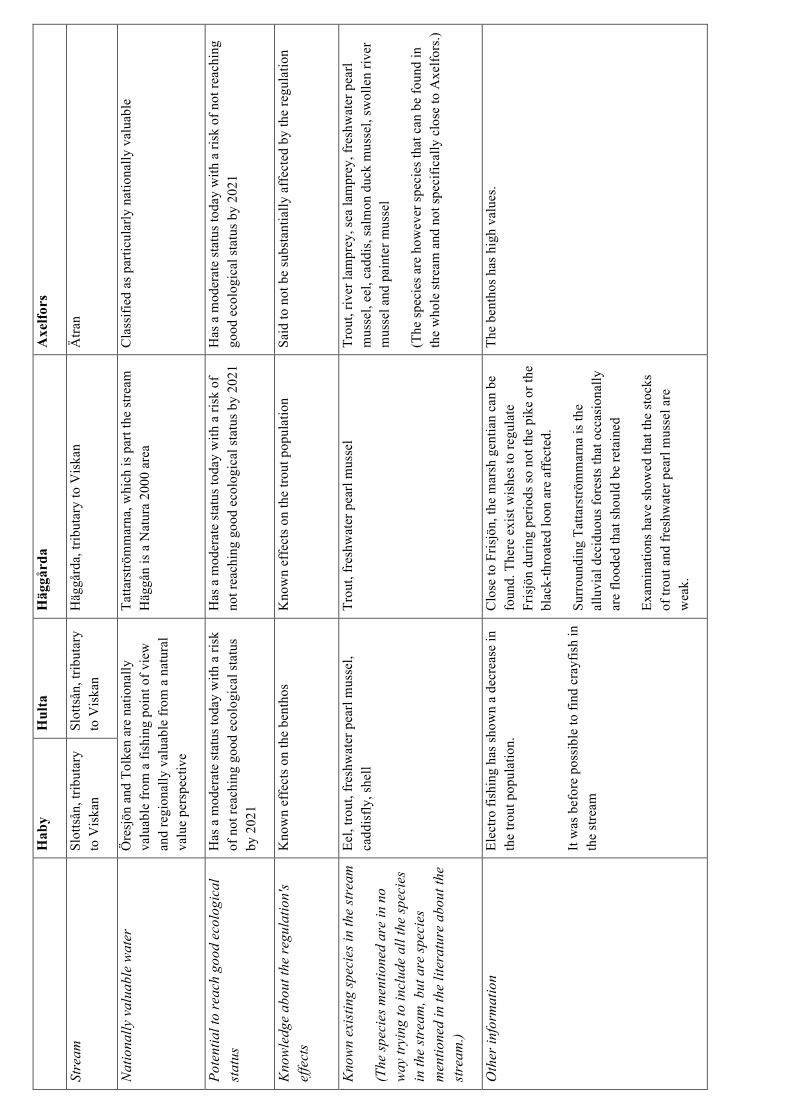
H
aby
Hul
ta
Häg
gård
a A
xelfo
rs
Stre
am
Slot
tsån
, trib
utar
y to
Vis
kan
Slot
tsån
, trib
utar
y to
Vis
kan
Häg
gård
a, tr
ibut
ary
to V
iska
n Ä
tran
Nat
iona
lly v
alua
ble
wat
er
Öre
sjön
and
Tol
ken
are
natio
nally
va
luab
le fr
om a
fish
ing
poin
t of v
iew
an
d re
gion
ally
val
uabl
e fr
om a
nat
ural
va
lue
pers
pect
ive
Tatta
rströ
mm
arna
, whi
ch is
par
t the
stre
am
Häg
gån
is a
Nat
ura
2000
are
a C
lass
ified
as p
artic
ular
ly n
atio
nally
val
uabl
e
Pote
ntia
l to
reac
h go
od e
colo
gica
l st
atus
H
as a
mod
erat
e st
atus
toda
y w
ith a
risk
of
not
reac
hing
goo
d ec
olog
ical
stat
us
by 2
021
Has
a m
oder
ate
stat
us to
day
with
a ri
sk o
f no
t rea
chin
g go
od e
colo
gica
l sta
tus b
y 20
21
Has
a m
oder
ate
stat
us to
day
with
a ri
sk o
f not
reac
hing
go
od e
colo
gica
l sta
tus b
y 20
21
Kno
wle
dge
abou
t the
regu
latio
n's
effe
cts
Kno
wn
effe
cts o
n th
e be
ntho
s K
now
n ef
fect
s on
the
trout
pop
ulat
ion
Said
to n
ot b
e su
bsta
ntia
lly a
ffec
ted
by th
e re
gula
tion
Kno
wn
exis
ting
spec
ies i
n th
e st
ream
(The
spec
ies m
entio
ned
are
in n
o w
ay tr
ying
to in
clud
e al
l the
spec
ies
in th
e st
ream
, but
are
spec
ies
men
tione
d in
the
liter
atur
e ab
out t
he
stre
am.)
Eel,
trout
, fre
shw
ater
pea
rl m
usse
l, ca
ddis
fly, s
hell
Trou
t, fr
eshw
ater
pea
rl m
usse
l Tr
out,
river
lam
prey
, sea
lam
prey
, fre
shw
ater
pea
rl m
usse
l, ee
l, ca
ddis
, sal
mon
duc
k m
usse
l, sw
olle
n riv
er
mus
sel a
nd p
aint
er m
usse
l
(The
spec
ies a
re h
owev
er sp
ecie
s tha
t can
be
foun
d in
th
e w
hole
stre
am a
nd n
ot sp
ecifi
cally
clo
se to
Axe
lfors
.)
Oth
er in
form
atio
n
Elec
tro fi
shin
g ha
s sho
wn
a de
crea
se in
th
e tro
ut p
opul
atio
n.
It w
as b
efor
e po
ssib
le to
find
cra
yfis
h in
th
e st
ream
Clo
se to
Fris
jön,
the
mar
sh g
entia
n ca
n be
fo
und.
The
re e
xist
wis
hes t
o re
gula
te
Fris
jön
durin
g pe
riods
so n
ot th
e pi
ke o
r the
bl
ack-
thro
ated
loon
are
aff
ecte
d.
Surr
ound
ing
Tatta
rströ
mm
arna
is th
e al
luvi
al d
ecid
uous
fore
sts t
hat o
ccas
iona
lly
are
flood
ed th
at sh
ould
be
reta
ined
Exam
inat
ions
hav
e sh
owed
that
the
stoc
ks
of tr
out a
nd fr
eshw
ater
pea
rl m
usse
l are
w
eak.
The
bent
hos h
as h
igh
valu
es.
Chapter 6
Comparisons
In the earlier chapter, several different environmental impacts that hydropower results in to-gether with different suggestions on what can be done to mitigate the impacts have been men-tioned. To widen the horizon from only looking at the hydropower plants owned by BoråsEnergi och Miljö and to get a comparison on what companies of a similar size actually hasdone in order to reduce their environmental impacts, two companies lying have been lookedat. One person at each company with knowledge about the environmental work have beeninterviewed in order to get information about why the company chose to do this kind of envi-ronmental work and what kind of results the companies have seen.
A comparison with Nordisk elmix is also included to get an idea of how large the GHG emis-sions would be if the electricity produced would be replaced with electricity from Nordiskelmix.
6.1 Tranås Energi
Tranås Energi AB is an energy company located in Tranås, which distributes and sells electric-ity, fiber networks, district heating and energy services. It is a company with approximately11 400 customers, with an electricity demand of 159 GWh/year. At Tranås Energi there are 40employees and the company’s annual turnover in 2013 was 194 million SEK (Tranås Energi,n.d. b).
The company wants to keep the services and products delivered to customers as renewableas possible. The electricity sold by Tranås Energi is 100% renewable. The electricity producedcomes from two hydropower plants, and from their cogeneration plant (Tranås Energi, n.d. b).
Tranås Energi has two hydropower plants in operation, Forsnäs and Olstorp, but they alsohave four remaining installations that have no hydropower generation today. These are Tranås
98
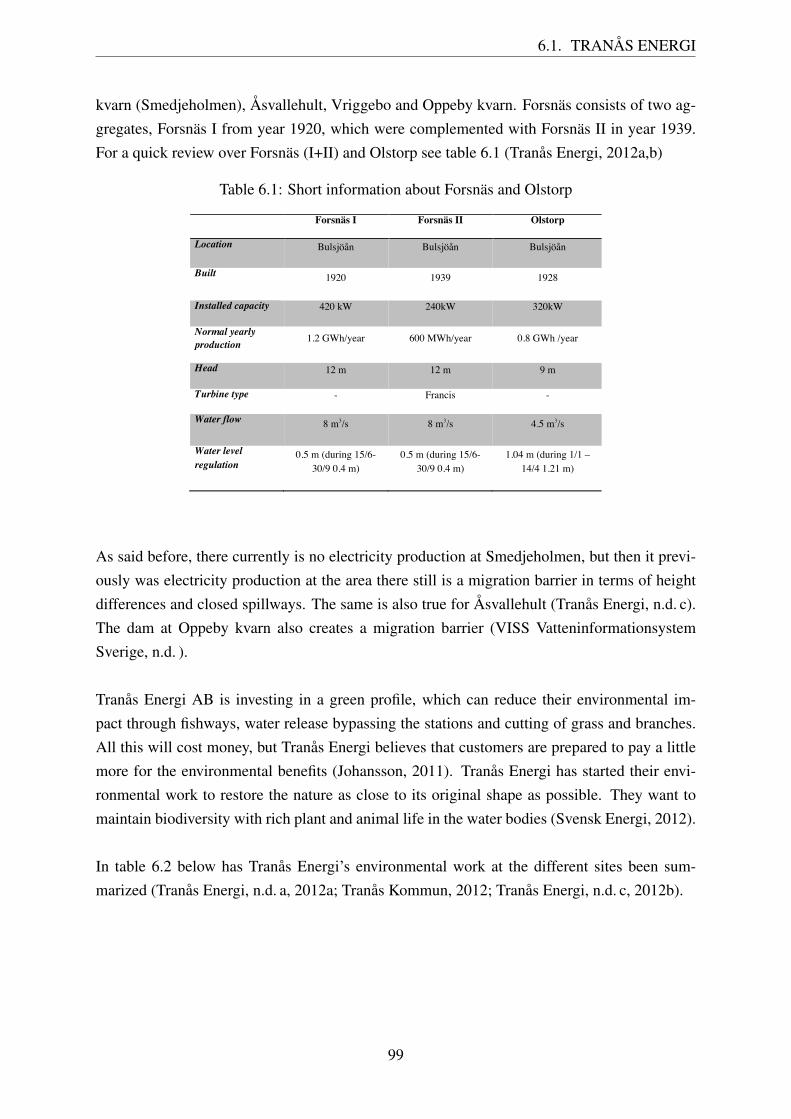
6.1. TRANÅS ENERGI
kvarn (Smedjeholmen), Åsvallehult, Vriggebo and Oppeby kvarn. Forsnäs consists of two ag-gregates, Forsnäs I from year 1920, which were complemented with Forsnäs II in year 1939.For a quick review over Forsnäs (I+II) and Olstorp see table 6.1 (Tranås Energi, 2012a,b)
Table 6.1: Short information about Forsnäs and Olstorp
Forsnäs I Forsnäs II Olstorp
Location Bulsjöån Bulsjöån Bulsjöån
Built 1920 1939 1928
Installed capacity 420 kW 240kW 320kW
Normal yearly production 1.2 GWh/year 600 MWh/year 0.8 GWh /year
Head 12 m 12 m 9 m
Turbine type - Francis -
Water flow 8 m3/s 8 m3/s 4.5 m3/s
Water level regulation
0.5 m (during 15/6-30/9 0.4 m)
0.5 m (during 15/6-30/9 0.4 m)
1.04 m (during 1/1 – 14/4 1.21 m)
!
As said before, there currently is no electricity production at Smedjeholmen, but then it previ-ously was electricity production at the area there still is a migration barrier in terms of heightdifferences and closed spillways. The same is also true for Åsvallehult (Tranås Energi, n.d. c).The dam at Oppeby kvarn also creates a migration barrier (VISS VatteninformationsystemSverige, n.d. ).
Tranås Energi AB is investing in a green profile, which can reduce their environmental im-pact through fishways, water release bypassing the stations and cutting of grass and branches.All this will cost money, but Tranås Energi believes that customers are prepared to pay a littlemore for the environmental benefits (Johansson, 2011). Tranås Energi has started their envi-ronmental work to restore the nature as close to its original shape as possible. They want tomaintain biodiversity with rich plant and animal life in the water bodies (Svensk Energi, 2012).
In table 6.2 below has Tranås Energi’s environmental work at the different sites been sum-marized (Tranås Energi, n.d. a, 2012a; Tranås Kommun, 2012; Tranås Energi, n.d. c, 2012b).
99
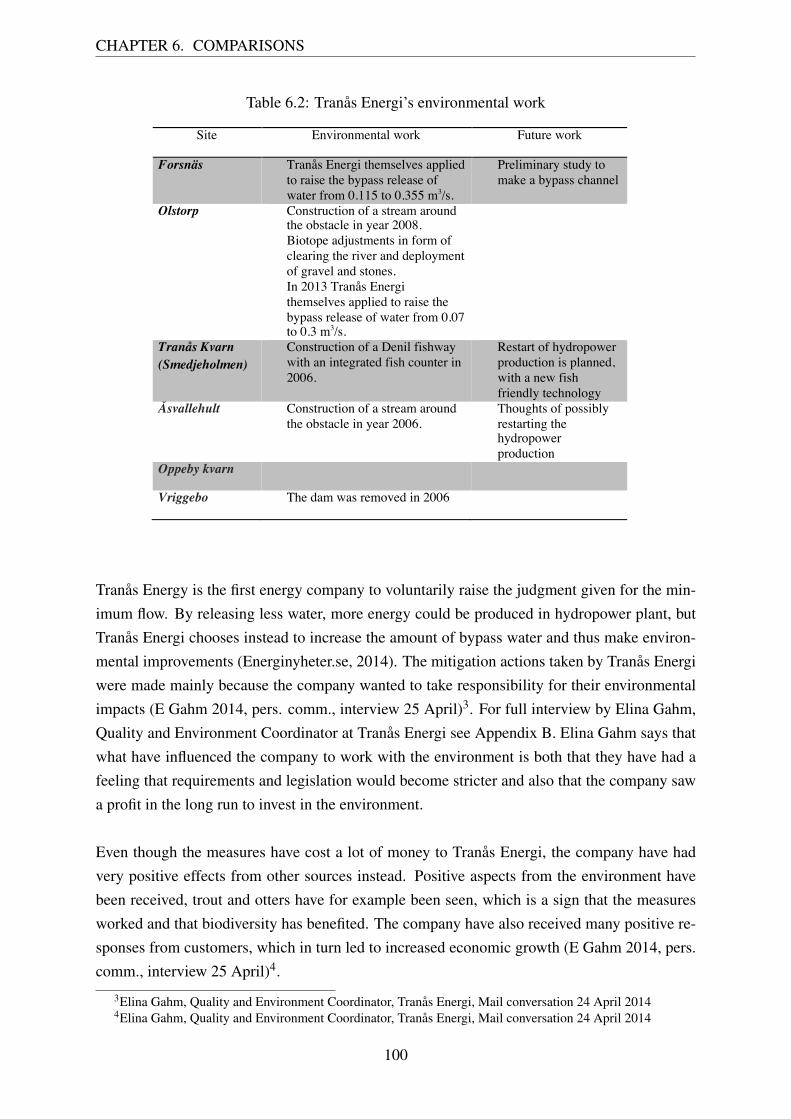
CHAPTER 6. COMPARISONS
Table 6.2: Tranås Energi’s environmental work
Site Environmental work Future work
Forsnäs Tranås Energi themselves applied to raise the bypass release of water from 0.115 to 0.355 m3/s.
Preliminary study to make a bypass channel
Olstorp Construction of a stream around the obstacle in year 2008. Biotope adjustments in form of clearing the river and deployment of gravel and stones. In 2013 Tranås Energi themselves applied to raise the bypass release of water from 0.07 to 0.3 m3/s.
Tranås Kvarn (Smedjeholmen)
Construction of a Denil fishway with an integrated fish counter in 2006.
Restart of hydropower production is planned, with a new fish friendly technology
Åsvallehult Construction of a stream around the obstacle in year 2006.
Thoughts of possibly restarting the hydropower production
Oppeby kvarn
Vriggebo The dam was removed in 2006
!
Tranås Energy is the first energy company to voluntarily raise the judgment given for the min-imum flow. By releasing less water, more energy could be produced in hydropower plant, butTranås Energi chooses instead to increase the amount of bypass water and thus make environ-mental improvements (Energinyheter.se, 2014). The mitigation actions taken by Tranås Energiwere made mainly because the company wanted to take responsibility for their environmentalimpacts (E Gahm 2014, pers. comm., interview 25 April)3. For full interview by Elina Gahm,Quality and Environment Coordinator at Tranås Energi see Appendix B. Elina Gahm says thatwhat have influenced the company to work with the environment is both that they have had afeeling that requirements and legislation would become stricter and also that the company sawa profit in the long run to invest in the environment.
Even though the measures have cost a lot of money to Tranås Energi, the company have hadvery positive effects from other sources instead. Positive aspects from the environment havebeen received, trout and otters have for example been seen, which is a sign that the measuresworked and that biodiversity has benefited. The company have also received many positive re-sponses from customers, which in turn led to increased economic growth (E Gahm 2014, pers.comm., interview 25 April)4.
3Elina Gahm, Quality and Environment Coordinator, Tranås Energi, Mail conversation 24 April 20144Elina Gahm, Quality and Environment Coordinator, Tranås Energi, Mail conversation 24 April 2014
100
6.1. TRANÅS ENERGI
In Olstorpsbäcken, which is a part of Bulsjöån, Östergötland’s most numerous populations withfreshwater pearl mussel can be found. The stock is although relatively small and any rejuvena-tion of mussels has not been detected in the past ten years. Inventories in the area have beenconducted in the year 1985, 1999, 2006 and 2008. At the inventories 1985-2006 the musselsstock has shown a negative downward trend. However, thanks to the biotope adjustments andthe construction of the stream around the obstacle at Olstorp so have the habitats of both thefreshwater pearl mussel and the host organism for its larvae, the trout, improved significantly(Svensk Energi, 2012; Bergengren, 2008).
According to the construction of the Denil fishway at Tranås kvarn, one can also here no-tice a significant improvement. Due to the integrated fish counter there has been noted that thenumber of fish that passed the counter has increased every year since 2008. Both trout, perchand bream have been registered (Svensk Energi, 2012; Johansson, 2011).
According to Fiskejournalen, Tranås Energi goes first and shows the way. The chairman ofÄlvräddarna claims that by starting early all the costs and other things that are complained aboutwhen it comes to the water activity investigation can be eliminated (Fiskejournalen, 2014). AsTranås Energi already had a feeling that requirements and legislation would be stricter and dueto the fact that the company already are prioritizing greening their facilities, Tranås Energi arenot as much affected of the water activity investigation (E Gahm 2014, pers. comm., interview25 April)5.
The electricity produced by Tranås Energi is labelled with the independent environmental la-bel, Bra Miljöval, which is issued by Naturskyddsföreningen (Tranås Energi, n.d. d). In theyear 2012 Tranås Energi received, as the first energy company in Sweden, a diploma fromÄlvräddarna for their work on biodiversity and the greening of the hydropower plants (TranåsEnergi, n.d. a).
Tranås Energi has further plans to make even more environmental mitigation measures. Plansexist to remove more obstacles to migration, to build more fishways and to reopen the hy-dropower production at one of their facilities with a new fish friendly screw technology (EGahm 2014, pers. comm., interview 25 April)6 .
5Elina Gahm, Quality and Environment Coordinator, Tranås Energi, Mail conversation 24 April 20146Elina Gahm, Quality and Environment Coordinator, Tranås Energi, Mail conversation 24 April 2014
101
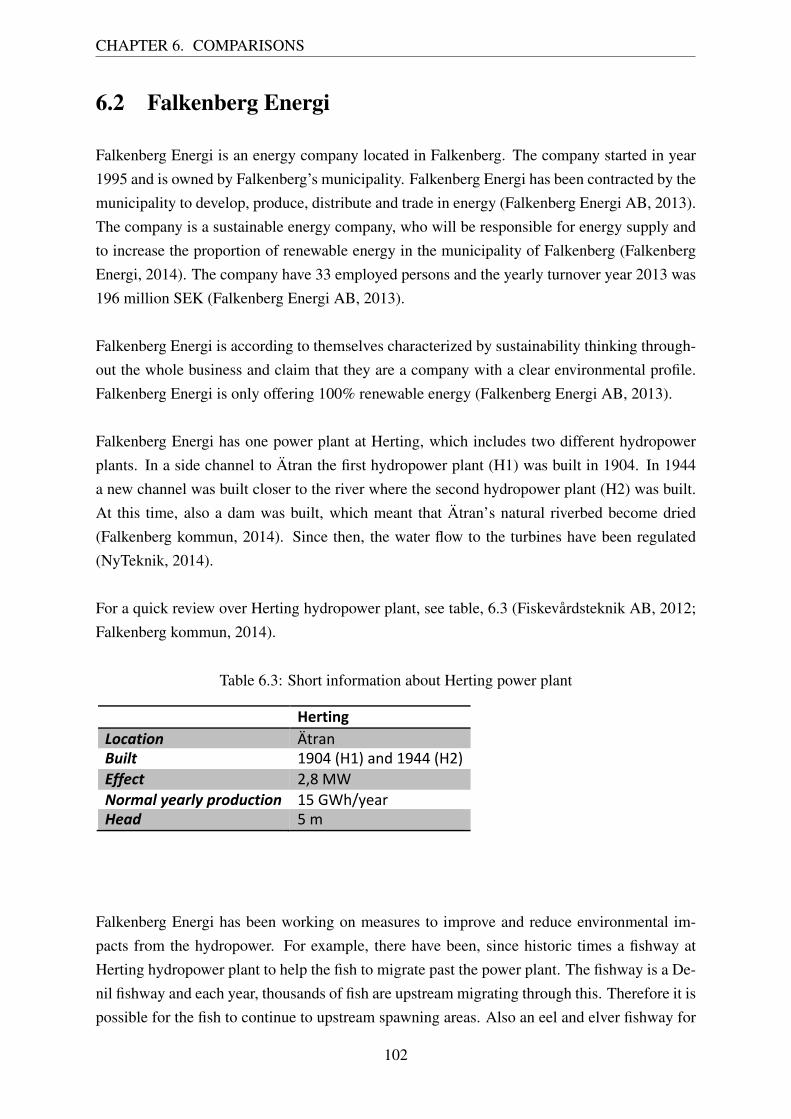
CHAPTER 6. COMPARISONS
6.2 Falkenberg Energi
Falkenberg Energi is an energy company located in Falkenberg. The company started in year1995 and is owned by Falkenberg’s municipality. Falkenberg Energi has been contracted by themunicipality to develop, produce, distribute and trade in energy (Falkenberg Energi AB, 2013).The company is a sustainable energy company, who will be responsible for energy supply andto increase the proportion of renewable energy in the municipality of Falkenberg (FalkenbergEnergi, 2014). The company have 33 employed persons and the yearly turnover year 2013 was196 million SEK (Falkenberg Energi AB, 2013).
Falkenberg Energi is according to themselves characterized by sustainability thinking through-out the whole business and claim that they are a company with a clear environmental profile.Falkenberg Energi is only offering 100% renewable energy (Falkenberg Energi AB, 2013).
Falkenberg Energi has one power plant at Herting, which includes two different hydropowerplants. In a side channel to Ätran the first hydropower plant (H1) was built in 1904. In 1944a new channel was built closer to the river where the second hydropower plant (H2) was built.At this time, also a dam was built, which meant that Ätran’s natural riverbed become dried(Falkenberg kommun, 2014). Since then, the water flow to the turbines have been regulated(NyTeknik, 2014).
For a quick review over Herting hydropower plant, see table, 6.3 (Fiskevårdsteknik AB, 2012;Falkenberg kommun, 2014).
Table 6.3: Short information about Herting power plant
! !"#$%&'("#$%&'#(! !"#$%&)*'+&! '()*&+,'-&$%.&'(**&+,/-&,--.$&! /01&23&/#01%+!2.%0+2!30#4*$&'#(! '4&536789$#&5.%4! 4&:&&
Falkenberg Energi has been working on measures to improve and reduce environmental im-pacts from the hydropower. For example, there have been, since historic times a fishway atHerting hydropower plant to help the fish to migrate past the power plant. The fishway is a De-nil fishway and each year, thousands of fish are upstream migrating through this. Therefore it ispossible for the fish to continue to upstream spawning areas. Also an eel and elver fishway for
102
6.2. FALKENBERG ENERGI
the upstream migrating eels have been built (J Melin 2014, pers. comm., interview 16 May)7.For full interview by Jens Melin, Environmental Manager at Falkenberg Energi see AppendixC. In the year 2006, a trap was constructed right next to the turbine intake at H1 (FalkenbergEnergi, n.d. b). Around this time, initial attempts with trapping, marking and new release ofdownstream migrating fish was started. This to see how the fish was behaving in the water(Falkenberg Energi, n.d. a). During 2013 the process of removing the dam began (FalkenbergEnergi AB, 2013). This was done to improve the problem with the downstream migration. Thedam construction was removed and a fish safe, energy efficient intake screen was installed atH1 (Falkenberg kommun, 2014).
The action taken by removing the dam was due to the fact that the company received a re-quirement from Kammarkollegiet. They demanded that something had to be done to improvethe downstream migration of the fish. Kammarkollegiet first suggested that Falkenberg Energishould build a culvert, but the company was uncertain about this solution and started insteadan investigation in collaboration with the University of Karlstad. The study involved exam-ining the fish in the stream and also to look at their migration pattern. Different alternativemeasures were examined to find out which solution would be best for the site. The conclusionfrom the investigation was to remove the dam (J Melin 2014, pers. comm., interview 16 May)8.
The oldest part of Herting hydropower plant from 1904 (H1) is of cultural interest and willoperate under the entire year. The new hydropower plant that opened in 1945 (H2) will onthe other hand only be used during the winter when high flows occur (Falkenberg Energi AB,2013). However, at least 11 m3 of water should flow freely through the riverbed before thepower plant may start to take water to the turbines. Therefore, no production at all is occurringin the power plant at certain times of the year (NyTeknik, 2014).
According to Falkenberg Energi themselves follow-ups and labeling of fish will be conductedduring 2014 to verify the impact of the reconstruction. The company argues that by recreatingthe stream, the biodiversity that has been lost over decades will be restored (Falkenberg EnergiAB, 2013).
Due to the fish counter, positive effects have already been seen. From this study it has beenfound that the number of fish has increased by a factor of four compared to before the damwas removed. The company has although noticed economical decreases following the damremoval. This due to the fact that their electricity production has gone down, the production atthe power plant has decreased from 13 GWh to 8 GWh per year. However, the company expectto have a positive economic impact in the future. This will come from for example increased
7Jens Melin, Environmental Manager, Falkenberg Energi, Telephone conversation 16 May 20148Jens Melin, Environmental Manager, Falkenberg Energi, Telephone conversation 16 May 2014
103

CHAPTER 6. COMPARISONS
fishing activities and tourism (J Melin 2014, pers. comm., interview 16 May)9.
Anna Krantz, investigator at Älvräddarna claim that Falkenberg Energi probably is next upfor Älvräddarnas’ diploma thanks to their environmental work (Fiskejournalen, 2013).
6.3 Nordisk Elmix
From the analysis of the hydropower plants it has been concluded that the operation of the fourhydropower plants have small carbon dioxide emissions. The emissions of carbon dioxide areone of the most important green house gases and already today can changes in the climate beseen (SMHI, 2012, 2009b). If Borås Energi och Miljö decides to stop the production of elec-tricity at the four hydropower plants and replaces the production with electricity from Nordiskelmix, the emissions of green house gases would increase. 2012 consisted Nordisk elmix of28.4 % electricity produced from renewable energy sources, 38.2 % of the electricity camefrom nuclear power and the rest, 33.4 % from fossil based energy sources. This results in thatapproximately 258 g CO2 is emitted per produced kWh (Affärsverken, 2013). The productionof electricity from the four hydropower plants varies from year to year so to get an estimationof the size of the possible emissions if the electricity from the hydropower plants is replacedwith electricity from Nordisk elmix, the emissions are calculated for each year from 2000 to2009. The average value from these years is also calculated, se table 6.4.
Table 6.4: Shows the approximate size of the CO2-emissions that would have been releasedif the electricity produced from the hydropower plants with electricity from Nordisk elmix.Information about the produced electricity at the hydropower plants is from (Borås Energi ochMiljö, 2013b).
!"#$% &$'()*"(%"+"*,$-*-,.%#,%,/"%/.($'0'1"$%0+#2,3%456/7%
89:;"<-33-'23%,/#,%1')+(%/#="%>""2%$"+"#3"(%1-,/%?'$(-3@%"+<-A%-2%,'22"3%
:BB:% !"#$%%# &#'%%#:BBC% ()#*%%# )#*%%#:BBD% )+#$%%# "#*%%#:BBE% !'#*%%# +#)%%#:BBF% )!#)%%# $#)%%#:BBG% ''#*%%# ((#*%%#:BBH% ''#&%%# ((#*%%#:BBI% !'#'%%# +#)%%#:BJB% ))#%%%# $#*%%#:BJJ% '!#+%%# ((#%%%##
Looking at the average value for these years it can be seen that if Nordisk elmix would havebeen used instead, 8 420 tonnes of CO2 had been released into the atmosphere. Since BoråsEnergi och Miljö works for a fossil free city this could be of importance.
9Jens Melin, Environmental Manager, Falkenberg Energi, Telephone conversation 16 May 2014
104
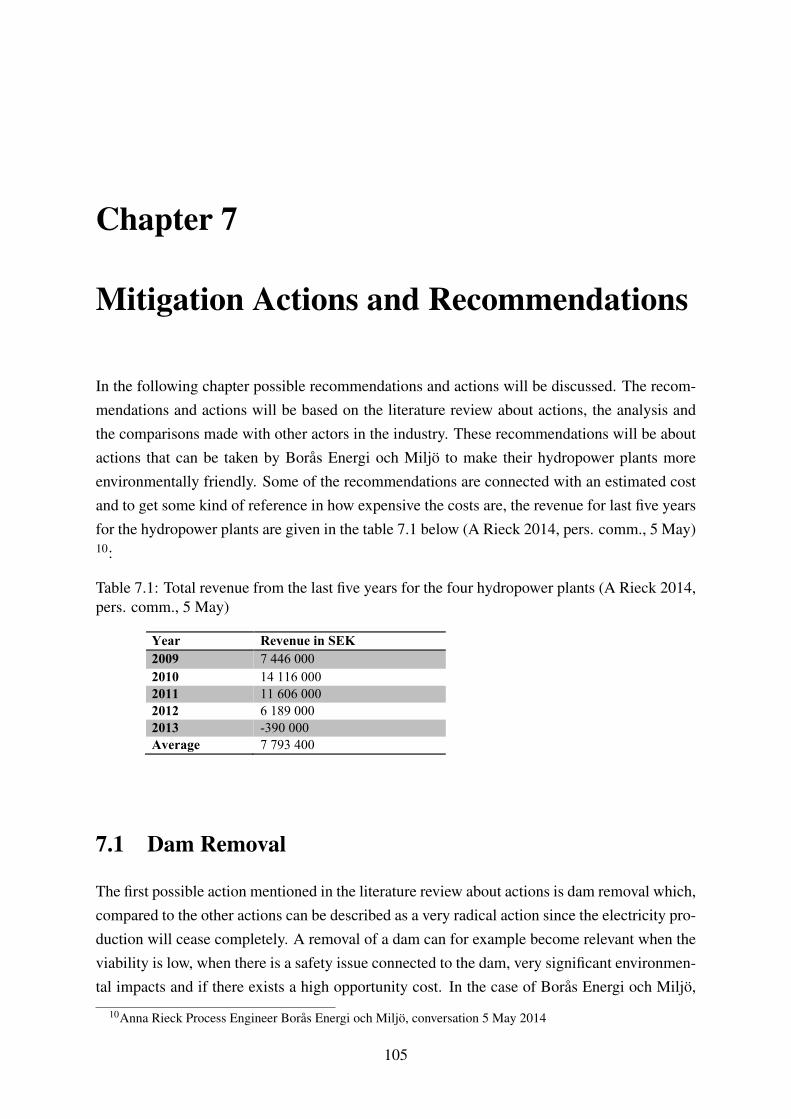
Chapter 7
Mitigation Actions and Recommendations
In the following chapter possible recommendations and actions will be discussed. The recom-mendations and actions will be based on the literature review about actions, the analysis andthe comparisons made with other actors in the industry. These recommendations will be aboutactions that can be taken by Borås Energi och Miljö to make their hydropower plants moreenvironmentally friendly. Some of the recommendations are connected with an estimated costand to get some kind of reference in how expensive the costs are, the revenue for last five yearsfor the hydropower plants are given in the table 7.1 below (A Rieck 2014, pers. comm., 5 May)10:
Table 7.1: Total revenue from the last five years for the four hydropower plants (A Rieck 2014,pers. comm., 5 May)
Year Revenue in SEK 2009 7 446 000 2010 14 116 000 2011 11 606 000 2012 6 189 000 2013 -390 000 Average 7 793 400 !
7.1 Dam Removal
The first possible action mentioned in the literature review about actions is dam removal which,compared to the other actions can be described as a very radical action since the electricity pro-duction will cease completely. A removal of a dam can for example become relevant when theviability is low, when there is a safety issue connected to the dam, very significant environmen-tal impacts and if there exists a high opportunity cost. In the case of Borås Energi och Miljö,
10Anna Rieck Process Engineer Borås Energi och Miljö, conversation 5 May 2014
105
CHAPTER 7. MITIGATION ACTIONS AND RECOMMENDATIONS
they have in the recent years performed several renovations on the hydropower plants. For now,Borås Energi och Miljö have no planned renovations in the future but the hydropower plantsare in good condition. This means that there is no economical incentive to remove the dams,which there could have been if the viability was very low and there would have been a greatneed of renovation and reparation. Nor do Borås Energi och Miljö have any opportunity costconnected to the existence of the dams. It should also be remembered that as concluded in theanalysis so are the GHG emissions from the hydropower plants very small. That is somethingthat can be seen as an important factor by Borås Energi och Miljö since one of their visions isthat Borås should be a city free of fossil fuels and that it can be hard to replace the electric-ity from the hydropower plants with electricity from another energy source with equally smallGHG emissions. The overall conclusion, with the current knowledge about the hydropowerplants and the environmental impacts, is that a removal of the dams is not a recommendation.
7.2 Flow Regulations
An establishment of a minimum flow, also called environmental or ecological flow, can help toget the hydropower plants more compatible with the natural life of rivers. A minimum flow canrefer to both the situation in Häggårda where there is constant flow of water trough the plantsor the spillways of at least 1.5 m3/s or when there is a water flow going on the side of the plant.Axelfors is operated as a run of river plant so there is a constant flow of water through the plant.For Häggårda there are requirements on a minimum flow so as for Axelfors there are no timeswhen no water at all reached the stream downstream the plants. However, for both of the plantsthe water is let through the plants and not through the dry riverbed. For Haby and Hulta thesituation differs compared to Axelfors and Häggårda. There are no requirements on a mini-mum flow for Haby and Hulta and following the regulation of the plants there are times whennow water at all is reaching the stream downstream the plants. The problem with the minimumflow is that there exists no easy way to determine how large the minimum flow should be orhow it should be operated. One recommendation on the size of the water flow is that is shouldcorrespond to 5-20% of the normal low water flow in the stream. It is also important that theflow not is static, it should follow the natural variations.
With a minimum flow in Haby and Hulta the situation with the short-term regulation shouldalso be improved. Short-term regulation can have adverse effects on the ecosystem and shouldtherefore be avoided. With a minimum flow the times when no water at all is let through couldbe avoided and reduce the damages. Overall, the recommendation is to look over the regula-tion of these plants since short-term regulation should be avoided. The damages connected toshort-term regulation are described in the literature review can be adverse and investigationsperformed on the benthos in Slottsån have showed effects due to the regulation. It is hard to say
106
7.3. SEDIMENTATION
how large the benefits for the ecosystem would be with a more environmentally friendly regula-tion without the fast changes and times without water but at least should some of the damagesbe avoided. Seen from an economical perspective, a change from short-term regulation to aregulation without that many changes in the water flow, will probably lead to a decrease in theearnings of the hydropower plants since the possibility to produce electricity when the price isas highest will decrease. Instead there will be improved conditions for the environment and thespecies living in the stream.
7.3 Sedimentation
Since the available information did not indicate any larger problems with sedimentation at thefour sites there is no need at the moment to implement actions to improve the situation.
7.4 Biotope Adjustments
Another possible action is different kinds of biotope adjustments. Due to the regulation, spawnareas have been destroyed in Häggån, and Hyltenäsån is today more like a channel than anatural stream. By performing biotope adjustment it could be possible to restore the formerspawn areas in Häggån or at least improve the current situation. For Hyltenäsån, biotope ad-justments in form of placement of stones and spawning gravel, is recommended in the reportfrom Wengström (2011). If biotope adjustments were done in Hyltenäsån, some of the earlierbiotopes that existed in the stream could be restored, resulting in improved conditions for thetrout. According to Wengström (2011), the stones that earlier lied in the stream, now are lyingoutside the stream, so in the case of a biotope adjustment, it would only be to put back thestones into the stream. About Axelfors in Ätran and the two plants in Slottsån, the same infor-mation about the need of biotope adjustments have not been found. But it is not improbablethat also parts of Slottsån and Ätran are in the need of biotope adjustments due to cleaning forthe development of hydropower plants or timber rafting that may have occurred. The cost forbiotope adjustments range between 15 000 - 50 000 SEK/km (Svensson, 2000). If the inflationis taken into account this means that the cost varies between approximately 18 000 - 60 000SEK/km (Statistiska centralbyrån, 2014). This means that for Hyltenäsån that is approximately700 m long, the maximum cost would be 42 000 SEK and that is only if the whole distanceof the stream is in the need of biotope adjustments and the "worst case" is assumed in formof the maximum cost. This means that cost for biotope adjustments in Hyltenäs are rather lowcompared to the revenue for the hydropower plants, apart from 2013, see table 7.1. For theother streams it is hard to estimate the cost since the extent of the requirements of biotopeadjustments are not known.
107
CHAPTER 7. MITIGATION ACTIONS AND RECOMMENDATIONS
7.5 Adapted Intake Screens
As can be read in the literature review the angel and the width of the intake screens is ofimportance for how large the risk is for damages to the fish in the stream. The ideal angelof the intake screens is 30 degrees. With an angel of 30 degrees or lower the risk that a fishwill get stuck at the screen is smaller than with a higher angel since the force parallel to thescreen becomes twice as high as the force against it. The grid width at the four sites is notexactly known but smallest grid width can be found in Häggårda, the grid width there is 2.5centimetres, at the three other plants the grid width is larger than 2.5 centimetres (A Rieck 2014,pers. comm., 5 May)11. This means that none of the intake screens have the recommended gridwidth. The angel of the intake screens at the four hydropower plants is not known so it is hardto say if the angel is good or not. An intake screen with a grid width with a maximum of 20millimetres and preferably 11 millimetres at Hulta and for Haby, a grid width of 11 millimetresis also recommended as an action in the report from Norconsult (2011). However, it shouldbe remembered that without an alternative way for the species in the stream, the angel of andthe grid width of the intake screens is of lesser importance. So even if it is a recommendationchange the intake screens so that they follow the recommended measures, it should be donein connection to the construction of alternative ways for the species in the stream to pass thehydropower plants.
7.6 Fishways
Today all the four hydropower plants and the regulation dam in Hyltenäsån constitutes barriersfor the migrating species in the stream. The migration barriers are even mentioned as one ofthe main problems to reach good ecological status by 2021. By the construction of fishways,the migration of the species in the stream could be facilitated and one of the biggest problemsthat the hydropower plants causes could be corrected or at least be of smaller magnitude. Thereare several different kinds of fishways. The aim of fishway is that should allow passage for allthe migrating species and not only for fishes. The different kinds can be divided into natural-like fishways and fishway with technical solutions. The fishways with technical solutions hasusually the disadvantage of only being suitable for fishes and not for other species. For examplethe pool-type fishway may not be recommended since it is primarily suited for salmonids.There have earlier been feasibility studies on if and possible fishways should be constructedat Haby and Hulta and the possible cost connected to the construction. Except from the costfor the construction of the fishway there will be an additional annual cost for the water that isspilled in the fishway and not goes through the hydropower plant to produce electricity. Whenconstructing a fishway there is, as mentioned in the literature review, many aspects to take into
11Anna Rieck Process Engineer Borås Energi och Miljö, conversation 5 May 2014
108
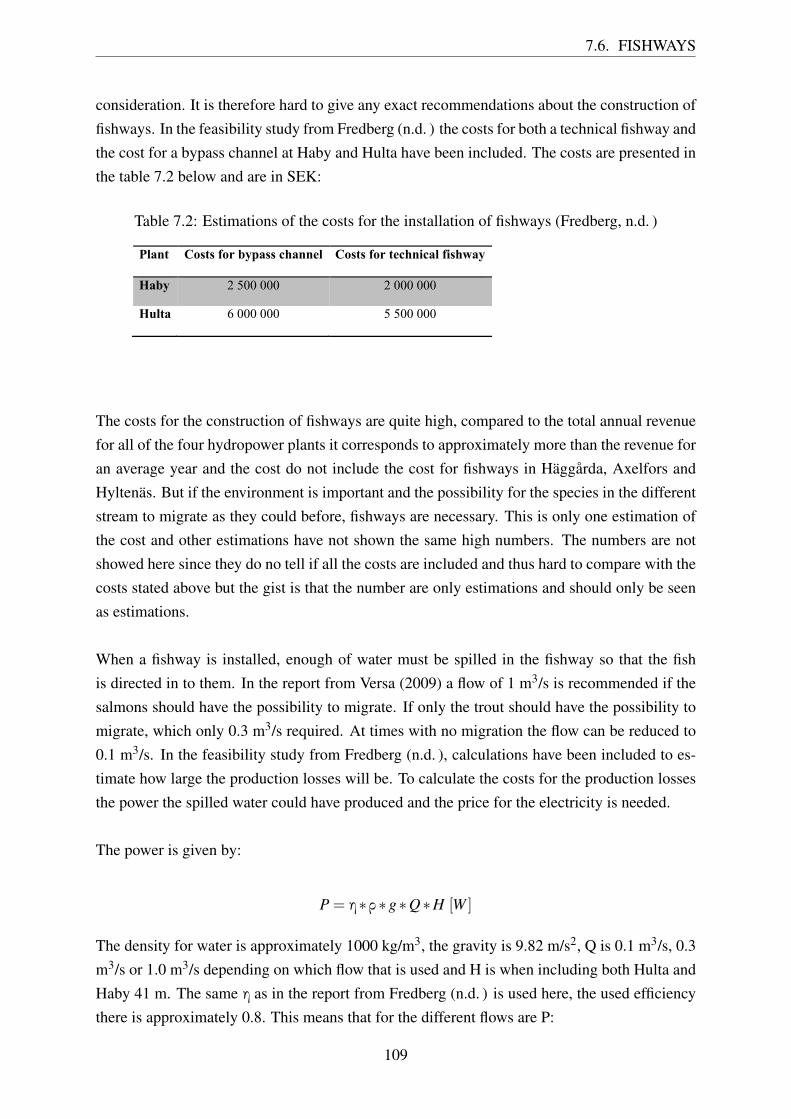
7.6. FISHWAYS
consideration. It is therefore hard to give any exact recommendations about the construction offishways. In the feasibility study from Fredberg (n.d. ) the costs for both a technical fishway andthe cost for a bypass channel at Haby and Hulta have been included. The costs are presented inthe table 7.2 below and are in SEK:
Table 7.2: Estimations of the costs for the installation of fishways (Fredberg, n.d. )
Plant Costs for bypass channel Costs for technical fishway
Haby 2 500 000 2 000 000
Hulta 6 000 000 5 500 000
!
The costs for the construction of fishways are quite high, compared to the total annual revenuefor all of the four hydropower plants it corresponds to approximately more than the revenue foran average year and the cost do not include the cost for fishways in Häggårda, Axelfors andHyltenäs. But if the environment is important and the possibility for the species in the differentstream to migrate as they could before, fishways are necessary. This is only one estimation ofthe cost and other estimations have not shown the same high numbers. The numbers are notshowed here since they do no tell if all the costs are included and thus hard to compare with thecosts stated above but the gist is that the number are only estimations and should only be seenas estimations.
When a fishway is installed, enough of water must be spilled in the fishway so that the fishis directed in to them. In the report from Versa (2009) a flow of 1 m3/s is recommended if thesalmons should have the possibility to migrate. If only the trout should have the possibility tomigrate, which only 0.3 m3/s required. At times with no migration the flow can be reduced to0.1 m3/s. In the feasibility study from Fredberg (n.d. ), calculations have been included to es-timate how large the production losses will be. To calculate the costs for the production lossesthe power the spilled water could have produced and the price for the electricity is needed.
The power is given by:
P = η∗ ρ∗g∗Q∗H [W ]
The density for water is approximately 1000 kg/m3, the gravity is 9.82 m/s2, Q is 0.1 m3/s, 0.3m3/s or 1.0 m3/s depending on which flow that is used and H is when including both Hulta andHaby 41 m. The same η as in the report from Fredberg (n.d. ) is used here, the used efficiencythere is approximately 0.8. This means that for the different flows are P:
109
CHAPTER 7. MITIGATION ACTIONS AND RECOMMENDATIONS
P = 0.8∗1000kg/m3 ∗9.82m/s2 ∗0.1m3/s∗41m = 32.2 kW
P = 0.8∗1000kg/m3 ∗9.82m/s2 ∗0.3m3/s∗41m = 96.6 kW
P = 0.8∗1000kg/m3 ∗9.82m/s2 ∗1m3/s∗41m = 322 kW
Depending on which size of the water flow that is spilled in the fishway and for how longtime period the production losses vary. Two different combinations, the same as in reportfrom Fredberg (n.d. ), are used here. In the first combination, the largest water flow is spilledduring six months of the year and the two other flows are spilled three months each. To getthe production losses per each year, the power is multiplied with the total amount of hours peryear.
Production losses = 32.2kW ∗ (8760h)/4 = 71 MWh
Production losses = 96.6kW ∗ (8760h)/4 = 212 MWh
Production losses = 322kW ∗ (8760h)/2 = 1410 MWh
This gives a total production loss of:
Total production losses = 71MWh+212MWh+1410MWh = 1693 MWh
If the price for the produced electricity is 0.4 SEK/kWh the cost for the total production lossesfor one year is:
Costs due to production losses = 400SEK/(MWh)∗1693 = 677200SEK
With another combination the different flows, the costs due to production losses will be changed.If the flow with 1 m3/s is spilled only four months instead of six months and the other waterflows also are spilled four months each, the production losses will be:
Production losses = 32.2kW ∗ (8760h)/3 = 94 MWh
Production losses = 96.6kW ∗ (8760h)/3 = 282 MWh
Production losses = 322kW ∗ (8760h)/3 = 940 MWh
This gives a total production loss of:
Total production losses = 940MWh+282MWh+94MWh = 1316 MWh
If the price for the produced electricity is 0.4 SEK/kWh the cost for the total production losses
110
7.6. FISHWAYS
for one year is:
Costs due to production losses = 400SEK/(MWh)∗1316 = 526400SEK
As for the other costs, the costs due to the production losses only are rough estimations. In thiscase, factors such as the price for the electricity and the combinations of the amount and dura-tion of the spilled water flow will affect the costs. Another important factor is that the spilledwater not always will result in production losses since at times when there is no production itis possible that the water that now is spilled in the spillways can be lead through the fishwaysinstead. Therefore the costs only should be seen as indications and should be weight to that theinstallation of fishways enables for the fishes to pass the hydropower plants. The costs for theproduction losses at Axelfors and Häggårda can be calculated in the same way. Since no infor-mation have been found on how large the water flow spilled in the possible fishway should bean estimation of 0.5 m3/s. The reason to why that specific water flow is used is that, accordingto the report from Pöyry (2012), it is a water flow that represents an average of the water flowin a plurality of fishways in small-scale hydropower plants. For Häggårda an estimation of thecosts due to the production losses are:
P = 0.8∗1000kg/m3 ∗9.82m/s2 ∗0.5m3/s∗28.5m = 112 kW
Production losses = 112kW ∗8760h = 981 MWh
Costs due to production losses = 400SEK/(MWh)∗981 = 392400SEK
For Axelfors the estimation of the costs due to the production losses are:
P = 0.8∗1000kg/m3 ∗9.82m/s2 ∗0.5m3/s∗11m = 43 kW
Production losses = 43kW ∗8760h = 377 MWh
Costs due to production losses = 400SEK/(MWh)∗377 = 150800SEK
An installation of a fishway can be seen as quite expensive action, both the construction of itand the following costs due to the production losses. But as mentioned earlier, the migrationbarriers in the streams are seen as one of the biggest problem to reach the goal of good ecologi-cal status by 2021. If taking the decision to construct fishways, it is important to construct it soit gets attractive for the fishes and is build in such a way so that many species is benefited fromit. Enough of water should be spilled into it and the entrance should be as close as possibleto the migration barrier, the fishway should also have characteristics as similar as to naturalconditions for the best result.
According to the water rights permit, Borås Energi och Miljö has requirements on fishways
111
CHAPTER 7. MITIGATION ACTIONS AND RECOMMENDATIONS
for the eels at the plants. As mentioned, the substitution in form of eel plans may not showthe same positive result as if there had been functioning fishways for the eels. To improve thesituation in the streams for the eel, installation of fishways for eels would be recommendedif not other fishways that also works for the eels is constructed. The eels that today wish tomigrate are facing a very difficult situation and a lot of them never reach their destination orget killed along the way.
7.7 Fish Plantations
One of the drawbacks with fish plantation is that the planted fishes do not exhibit the samecharacteristics as the natural living fishes in the streams. This can lead to that planted fisheswill have difficulties with e.g. food and finding their way when migrating. Another drawbackis that the plantation of fishes can spread infectious diseases. There are also advantages withfish plantation, e.g. it can be advantageous when reintroducing extinct species, but the rec-ommendation here will be that there are other actions that are of more importance than fishplantation.
7.8 Fish Friendly Turbines
There exists turbines that are more fish friendly than others but since there still is much to belearned about the turbines and how to make them more fish friendly, installation of more fishfriendly turbines is therefore nothing that is recommended.
112
Chapter 8
Discussion
In the discussion the literature review, analysis and recommendations will be discussed. Also asection called environmental work will be discussed.
8.1 Literature Review
Borås Energi och Miljö’s hydropower plants are approaching or have even reached the 100-year mark. As the baseline for comparison is set to be before the power plants were built andthe fact that it is such a long time ago since the hydropower plants were built, it has compli-cated the investigation. It is almost impossible to know especially much about the conditionsbefore the commissioning of the hydropower plants, which makes the comparisons about theenvironmental changes from the original situation hard. If for example data from investigationsfrom the time before the hydropower plants were built existed, it would have been a differentstarting point for this investigation. It had in that case been easier to draw quantitative conclu-sions about the effects.
When searching for information to the literature review, one can see that there are many dif-ferent views about how hydropower plants affect the environment or not. Some informationsuggests that the effect is small, while other information shows that the effects are large. How-ever, there are clear evidences that the environment is affected. Another clear trend in theinformation found is that it says that the environmental impact is very site-specific. This makesit difficult to completely apply general information from the literature study on the specificsites where Borås Energi och Miljö’s hydropower plants are located. Therefore, the informa-tion from Borås Energi och Miljö’s hydropower plants and their surrounding areas, have beennecessary in order to use and adapt the general information and thus on this basis to analyse theeffects.
Another difficulty in this study was to gather the same kind of material about Borås Energi
113

CHAPTER 8. DISCUSSION
och Miljö’s own hydropower plants and about the ecosystems that are in the areas the powerplants are located. The information that was found was not uniform, the existing informationabout one hydropower plant and its area had for example information about some things whileanother power plant and its area had information about other things. There were also differ-ences in how much information that existed about the different sites. This finding made it hardto analyse the different hydropower plants on the same basis and it also affected the conclusionsthat could be drawn about the different impacts from the different hydropower plants.
8.2 Analysis
The gained information in the literature review has formed a base from where a model hasbeen created. In the analysis of the report, the model has been compared with the gatheredinformation about the four specific hydropower plants so that an evaluation about the plantsand their environmental impacts has been performed. Even though very little information frombefore the hydropower plants were built was available, environmental impacts have been de-tected. A difficulty in this study has although been to quantify the environmental impact. Thisis generally seen as a difficult task and often leads to that environmental impacts not are takenseriously because the understanding and the perception of how big the impact really are. Assaid before, one can on the basis of this study actually point out that there are environmentalimpacts from hydropower plants and thus put the emphasis on the importance and needs formitigation actions to be taken.
In this study, no cumulative effects have been included. If one nevertheless, considers forexample all hydropower plants located in a stream, the environmental impact would probablybe much larger. Even when for example the regulation from one hydropower plant is not seenas a major threat to the environment, the regulation from two or more power plants can have asignificant effect.
8.3 Environmental Work
In the comparison chapter of the report, it can be read about Tranås Energi and Falkenberg En-ergi, which are two companies that seem to be at the forefront with their environmental work.Both of the two companies have done much environmental work at their hydropower plantsand both of them have also seen signs of positive improvement for the environment. The twocompanies are in about the same size as Borås Energi och Miljö and their hydropower plantsare also in about the same sizes. This could be seen as a sign that it could also be successfulfor Borås Energi och Miljö to consider and take action to improve the environment. TranåsEnergi and Falkenberg Energi’s successes can show that it is possible to do something for the
114
8.4. RECOMMENDATIONS
environment although the companies and the hydropower plants are not that large compared tosome of the larger energy companies in Sweden.
Tranås Energi has made their actions without special requirements or laws, which is very un-usual. More companies should take the initiative to do something about the environmentalimpact from the hydropower. However, according to the ongoing water activity investigation,it can come to be that many of Sweden’s hydropower owners must meet certain environmentalrequirements to comply with the law. Thus, need to perform environmental mitigation actions.
Borås Energi och Miljö have performed a feasibility study on how to construct fishways atHaby and Hulta, which can be seen as a step in the right direction to decrease their environ-mental work. As mentioned earlier, Borås Energi och Miljö are not using the whole regulationamplitude they are allowed to in the lakes, which also can be seen as a measure to reduce theenvironmental impact from the regulation. Today, only a few of the hydropower plants in Swe-den have functioning fishways and overall there are a lot of things that can be performed todecrease the impacts on the ecosystem from the hydropower plants. So, compared to many ofthe existing hydropower plants in Sweden, Borås Energi och Miljö seems to be on the samelevel when it comes to environmental work. But when comparing with the companies lying inthe forefront, such as Tranås Energi and Falkenberg Energi, Borås Energi och Miljö needs toimprove the situation in the streams before they can reach the same standard.
There are a lot of different opinions among the hydropower industry actors about the wateractivity investigation. The issue generally builds up two opposite sides. On one side the powercompanies stands, where it usually involves the economic interest and at the other side environ-mental organizations and agencies that work with the environment stands. The question aboutcost against environmental benefit is in focus, and is very complex due to the fact that quantifi-cation of environmental impacts is very hard. But, there is a fact that hydropower plants haveimpacts on the environment, and to do something about this involves a cost. It should however,also be remembered that there also could be other positive effects than the environmental. Theenvironment coordinator Elina Gahm from Tranås Energi points for example out that they havehad many positive responses from customers that have lead to economic benefits.
8.4 Recommendations
Some of the actions recommended in this study are quite expensive, but if the wish is to im-prove the situation in the streams for the species living in and around the stream and in ex-tension reach good ecological status, actions need to be taken. As emphasized several timesbefore in this report, Borås Energi och Miljö’s hydropower plants are barriers and hinders not
115
CHAPTER 8. DISCUSSION
only the fishes but is also a hinder to reach good ecological status. To make it possible for thespecies in the streams, fishways are needed. The fishways should, ideally, be built so that itis adapted to all migrating species. To improve the situation further, the intake screens shouldbe constructed so that the species do not get trapped and killed against or can make it throughthe grid. The recommendation is to start with the construction of fishways in Slottsån. Byconstructing fishways in Haby and Hulta the species will have the possibility to migrate all theway from Viskan and up to Öresjön, which was a possibility before the hydropower plants werebuilt. In Ätran there are several other plants constituting a barrier and also in Häggån there areother plants. This means that the construction of fishways in Slottsån has the advantage that theresponsibility and possibility to improve the situation in Slottsån only lies at Borås Energi ochMiljö and no other company or person. In the other streams, cooperation with other plant own-ers can be needed to achieve the same result. Another reason to start with Haby and Hulta isthat there is already some material and earlier investigations on how to construct fishways there.
Several of the recommended actions are connected in some way or depend on each other. Forexample it is important to change the regulation in Haby and Hulta so the kind of short-termregulation that exists today is avoided as far as possible. Another important thing is the inves-tigation of a minimum flow and if there is a need of it in the dry riverbeds or if it should besomewhere else. If a minimum flow is implemented the effect from the regulation may be lesssevere compared to the situation today. The minimum flow can also go in the fishways. Thereare stated effects that probably are due to the regulation in Slottsån and Häggån and a change ofthe regulation and further studies on how to operate a minimum flow are of importance for theecosystem either in a fishway when that is constructed or in other ways until there are fishways.
Of importance for ecosystem are also the recommended biotope adjustments. Biotope ad-justments can have good effects on several of the species in the stream and should therefore beconsidered.
In some cases it may be seen as unnecessary to take environmental actions at one single hy-dropower plant in a river where there are several power plants, this because it might just benefitthe environment at a certain distance and not the whole stream. But if one hydropower plantowner start taking action, it is easier to get the others to continue.
116
Chapter 9
Conclusions
To conclude, this study has given a generally knowledge about hydropower and its environ-mental impacts. By using this basis, conclusions about Borås Energi och Miljö’s hydropowerplants have been drawn.
The first conclusion drawn is that the hydropower plants owned by Borås Energi och Miljöare affecting the environment in a negative way. The major identified environmental impactsare:
• Migration barriers, the power plants are definitive migration barriers to fish.
• No minimum flow in the original riverbeds.
• Short-term regulation at Haby and Hulta, times during night when no water is releaseddownstream.
The second conclusion that can be drawn from the study is that Borås Energi och Miljö actuallycan do something to reduce their environmental impact from the hydropower plants. The mainthings that Borås Energi och Miljö should address is:
• Build some kind of fishway, a bypass channels is recommended to benefit all organisms.
• Do some biotope adjustments to improve spawning sites for the fish and overall improvethe environment for them.
• Start with minimum flow in the original riverbed.
• Have a regulation that will follow the naturally variable flow without any short-termregulations.
For some mitigation actions, more comprehensive investigations should be conducted for themeasures to be site- specific adapted.
117
Chapter 10
Future Work
Before the work with the proposed measures can be taken into account, further work is needed.Thorough investigations is needed so that the fishways are constructed in a way so that as manyspecies as possible can be benefited of them. It is also important to construct the fishways sothat it is easy for species to find their way into them. Also for the biotope adjustments andminimum flow studies are needed so that the work gives the wished result.
Except for that can a lot be performed in order to gain more specific knowledge about theecosystems where the hydropower plants are situated, how the situation are for the species liv-ing there and how the hydropower plants are affecting them. As emphasized earlier are theimpacts from hydropower plants very site-specific and it is therefore important to do investiga-tions on site to get an understanding for which measures that are needed and how they shouldbe performed.
118
Bibliography
Abbasi, S., Abbasi, N., 2000. The likely adverse environmental impacts of renewable energysources. Applied Energy 65 (1-4), 121–144.
Abbasi, T., Abbasi, S., 2011. Small hydro and the environmental implications of its extensiveutilization. Renewable and Sustainable Energy Reviews 15 (4), 2134–2143, Available at:http://linkinghub.elsevier.com/retrieve/pii/S1364032110004193 [Accessed at: February 28,2014].
Affärsverken, 2013. Elens ursprung.
Akella, A., Saini, R., Sharma, M., Feb. 2009. Social, economical and environmental impacts ofrenewable energy systems. Renewable Energy 34 (2), 390–396.
American Rivers, 2014. American Rivers | FAQs on Dams & Dam Removal | AmericanRivers. Available at: http://www.americanrivers.org/initiatives/dams/faqs/ [Accessed: April14, 2014].
Andersson, M., 2006. Flodpärlmussla i Västra Götalands län - Känd förekomst 2005. Tech.rep., Göteborg.
ArtDatabanken Swedish Species Information Centre, 2010. Artfakta - Sök arter. Availableat: http://www.artfakta.se/GetSpecies.aspx?SearchType=Advanced [Accessed: March 25,2014].
Arthington, A. H., Naiman, R. J. ., Mcclain, M. E., Nilsson, C., 2009. Preserving the biodiver-sity and ecological services of rivers : new challenges and research opportunities. FreshwaterBiology.
Åstrand, S., 2008. Miljöeffekter av turbinoljeläckage från vattenkraftverk till älvar Environ-mental Effects of Turbine Oil Spills from Hydro Power Plants to Rivers. Ph.D. thesis.
Azarpour, A., Suhaimi, S., Zahedi, G., Bahadori, A., 2012. A Review on the Drawbacks of Re-newable Energy as a Promising Energy Source of the Future. Arabian Journal for Scienceand Engineering 38 (2), 317–328, Available at: http://link.springer.com/10.1007/s13369-
012-0436-6 [Accessed: February 21, 2014].
119
BIBLIOGRAPHY
Bakken, T. H., Sundt, H. k., Ruud, A., Harby, A., 2012. Development of small versus largehydropower in norway - comparison of environmental impacts. Energy Procedia 20 (1876),185–199, Available at: http://linkinghub.elsevier.com/retrieve/pii/S1876610212007497 [Ac-cessed: February 19, 2014].
Bergengren, J., 2008. Flodpärlmussla i Olstorpsbäcken- inventeringar 1999, 2006 & 2008.Tech. rep., Länsstyrelsen Östergötland.
Bergengren, J., Näslund, I., Kling, J., 2013. Vattenkraftens påverkan på akvatiska ekosystem.Havs-och vattenmyndigheten, Göteborg.
Bergkamp, G., Mccartney, M., Dugan, P., Mcneely, J., 2000. Dams , Ecosystem Functions andEnvironmental Restoration.
Borås Energi och Miljö, 2002. Rapport oljeutsläpp Haby.
Borås Energi och Miljö, 2003. PM3 Haby Ledskenestyrning.
Borås Energi och Miljö, 2005a. Blästring ståltub Axelfors 2005.
Borås Energi och Miljö, 2005b. Dammreparation Haby 2005.
Borås Energi och Miljö, 2009. Dagbok Hulta dammreparation 2009.
Borås Energi och Miljö, 2010. Dagbok Axelfors dammreparation 2010.
Borås Energi och Miljö, 2011. Dagbok Dammreparation Häggårda kraftstation 2010/2011.
Borås Energi och Miljö, 2013a. Dammreparationer 2012 och 2013.
Borås Energi och Miljö, 2013b. Produktionsuppföljning VKS 2013.
Borås Energi och Miljö, 2014a. Borås Energi och Miljö AB - Om Företaget. Available at:http://www.borasenergimiljo.se/vanstermeny/omforetaget/borasenergiochmiljoab.4.6d83c43
4110a12a0dbc8000724.html [Accessed: January 27, 2014].
Borås Energi och Miljö, 2014b. Våra vattenkraftstationer - Borås Energi och Miljö.
Borås Energi och Miljö, n.d. a. Axelfors kraftverk.
Borås Energi och Miljö, n.d. b. Haby och Hulta kraftverk.
Borås Energi och Miljö, n.d. c. Häggårda kraftverk.
Borås Energi och Miljö, n.d. d. Information om Axelfors vattendom.
Borås Energi och Miljö, n.d. e. Information om Haby Vattendom.
120
BIBLIOGRAPHY
Borås Energi och Miljö, n.d. f. Information om Häggårda vattendom.
Borås Energi och Miljö, n.d. g. Information om Produktion.
Borås Kommun, 2003. Naturvärden i Häggåns vattensystem och förslag till bevarandeåtgärder.Tech. Rep. september, Borås.
Bourgeois, G., Therrien, J., 2000. Fish Passage at Small Hydro Sites. Tech. rep., Quebec,Canada.
Bratrich, C., Truffer, B., Jorde, K., Markard, J., Meier, W., Peter, A., Schneider, M., Wehrli,B., Dec. 2004. Green hydropower: a new assessment procedure for river management. RiverResearch and Applications 20 (7), 865–882.
Bunn, S. E., Arthington, A. H., n.d. . Basic Principles and Ecological Consequences of AlteredHydrological Regimes on Aquatic Biodiversity. Environmental Management 30, 492–507.
Cada, G. F., Garrison, L. A., Fisher Jr, R. K., 2007. Determining the Effect of Shear Stress onFish Mortality during Turbine Passage - HydroWorld.Available at: http://www.hydroworld.com/articles/hr/print/volume-26/issue-7/technical-
articles/determining-the-effect-of-shear-stress-on-fish-mortality-during-turbine-
passage.html [Accessed: March 6, 2014].
Calles, O., Bergdahl, D., 2009. Ålens nedströmspassage av vattenkraftverk Ålens ned-strömspassage av vattenkraftverk. Tech. rep.
Calles, O., Christiansson, J., Andersson, J., Sahlberg, T., Stein, F., Olsson, B.-M., Alenäs, I.,Tielman, J., 2012. Ål i Ätran - en fallstudie för svensk ålförvaltning. Tech. rep., Karlstad.
Calles, O., Degerman, E., Wicktsröm, H. k., Christiansson, J., Gustafsson, S., Näslund, I.,2013. Anordningar för upp- och nedströmspassage av fisk vid vattenanläggningar. Havs-ochvattenmyndigheten, Göteborg.
CBD Secretariat, 2014. Article 2. Use of Terms.
Centrum för biologisk mångfald, 2010. Biologisk mångfald. Tech. rep., Uppsala.
Dahal, S., 2013. Hydropower Reservoir and Sedimentation A Study of Nam Ngum Reser-voir (May).
Dahlin-Ros, I., 2008. Äramossen: Här börjar Ätran.
Demarty, M., Bastien, J., Tremblay, a., Jan. 2011. Annual follow-up of gross diffusive carbondioxide and methane emissions from a boreal reservoir and two nearby lakes in Québec,Canada. Biogeosciences 8 (1), 41–53.
121
BIBLIOGRAPHY
Douglas, T., 2007. Green Hydro Power Understanding Impacts , Approvals , and Sustainabilityof Run-of-River Independent Power Projects in British Columbia. Tech. Rep. August.
Edenhofer, O., Pichs-Madruga, R., Sokona, Y., Seyboth, K., Matschoss, P., Jul. 2012. Renew-able energy sources and climate change mitigation: special report of the IntergovernmentalPanel on Climate Change. Vol. 49. Intergovernmental Panel on Climate Change, New York.
Encyclopedia Britannica, n.d. . plankton (marine biology). Available at:http://global.britannica.com/EBchecked/topic/463121/plankton [Accessed: May 8, 2014].
Energinyheter.se, 2014. Ändrad vattendom vid Olstorps vattenkraftverk. Available at:http://www.energinyheter.se/2014/02/ndrad-vattendom-vid-olstorps-vattenkraftverk [Ac-cessed: April 29, 2014].
Ericsson, U., Nilsson, C., Ljungman, M., 2012. Bottenfauna och vattenkraft - En under-sökning av regleringseffekter påbottenfauna i Viskans avrinningsområde, 2012th Edition.Länsstyrelsen Västra Götaland, Vattenvårdsenheten.
Erlandsson, K., 2008. Användning av scenarier vid strategiska miljöbedömningar för anläggn-ingsåtgärder inom vattenkraften. Ph.D. thesis, Sveriges Lantbruksuniversitet.
European Small Hydropower Association (ESHA), 2000. Hydropower Respects the Environ-ment - A Clean and Indigenous Renewable Energy.
European Small Hydropower Association (ESHA), 2004a. Guide on How to Develop a SmallHydropower Plant.
European Small Hydropower Association (ESHA), 2004b. SmåVattenkraftverk- En Handbok.
European Small Hydropower Association (ESHA), 2009. Environmental Barometer on SmallHydro Power.
European Small Hydropower Association (ESHA), 2014. European Small HydropowerAssociation - ESHA: In Europe. Available at: http://www.esha.be/about/about-small-
hydropower/in-europe.html [Accessed: February 26, 2014].
European Small Hydropower Association (ESHA), n.d. . Hydropower and environment tech-nical and operational procedures to better integrate small hydropower plants in the environ-ment.
European Union, 2010. Water Framework Directive.
Europeiska kommissionen, 2014. Klimatåtgärder - För en bättre värld med ett bättre klimat.Tech. rep., Luxemburg.
122
BIBLIOGRAPHY
Falkenberg Energi, 2014. Välkommen till Falkenberg Energi!Available at: http://www.falkenberg-energi.se/ [Accessed: May 16, 2014].
Falkenberg Energi, n.d. a. Vattenkraft. Available at:http://www.falkenberg-energi.se/vattenkraft/vattenkraft [Accessed: May 18, 2014].
Falkenberg Energi, n.d. b. Vattenkraft och nedströms vandrande fisk. Available at:http://www.falkenberg-energi.se/vattenkraft/falla-for-nedvandrande-fisk [Accessed: May 18,2014].
Falkenberg Energi AB, 2013. Årsredovisning 2013. Tech. rep.
Falkenberg kommun, 2014. Hertingprojektet - Falkenbergs kommun.Available at: http://www.falkenberg.se/1/bygga-bo–miljo/naturvard/naturvardsprojekt/herting
projektet.html#.U3Yz5ig1pVh [Accessed: May 16, 2014].
Fiskejournalen, 2013. Falkenberg Energi tar ansvar. Available at:http://fiskejournalen.se/falkenberg-energi-tar-ansvar/ [Accessed: May 18, 2014].
Fiskejournalen, 2014. Frivillig omprövning av vattenkraft. Available at:http://fiskejournalen.se/frivillig-omprovning-av-vattenkraft/ [Accessed: April 29, 2014].
Fiskeriverket, Naturvårdsverket, 2008. Ekologisk restaurering av vattendrag.
Fiskevårdsteknik AB, 2012. Återställn av vandringsväg.
Fly Fishing Shop, n.d. . Midges and Chironomids.Available at: http://www.flyfishusa.com/flies/midges.htm [Accessed: May 14, 2014].
Fredberg, U., n.d. . Förstudie angående möjlighet att anlägga fiskvägar vid Haby kraftverk ochHulta kraftverk.
Gagnon, L., 1997. Greenhouse gas emissions from hydropower The state of research in 199625 (I), 7–13.
Gagnon, L., Bélanger, C., Uchiyama, Y., Nov. 2002. Life-cycle assessment of electricity gen-eration options: The status of research in year 2001. Energy Policy 30 (14), 1267–1278.
Gatte, M. T., Kadhim, R. A., Oct. 2012. Energy Conservation. InTech,Available at: http://www.intechopen.com/books/energy-conservation/hydro-power http://
www.intechopen.com/books/energy-conservation [Accessed: May 9, 2014].
Ghosh, T. K., Prelas, M. a., 2011. Energy Resources and Systems. Vol. 2. Springer Nether-lands, Dordrecht, Available at: http://link.springer.com/10.1007/978-94-007-1402-1 [Ac-cessed: January 31, 2014].
123
BIBLIOGRAPHY
Graf, W. L., 2006. Downstream hydrologic and geomorphic effects of largedams on American rivers. Geomorphology 79 (3-4), 336–360, Available at:http://linkinghub.elsevier.com/retrieve/pii/S0169555X06002571 [Accessed: february25, 2014].
Havs- och vattenmyndigheten, 2012. Dialog om vattenkraft och miljö - En redovisning av utförtregeringsuppdrag. Björn Risinger, Göteborg.
Hertwich, E. G., 2013. Addressing biogenic greenhouse gas emissions from hy-dropower in LCA. Environmental science & technology 47 (17), 9604–11, Available at:http://www.ncbi.nlm.nih.gov/pubmed/23909506 [Accessed: March 28, 2014].
Hovsenius, G., Nilsson, C., Leijon, M., 2002. Vattenkraften i Sverige: En faktarapport inomIVA-projektet energiframsyn Sverige i Europa. Tech. rep., Eskilstuna.
Hutton, R., 2012. Damage to Fish By Hydro Turbines A New Fish Friendly Approach Usingthe Archimedes Screw Generator By.
HydroWorld, 2013. Update on status of technology research for the Alden fish-friendlyhydro turbine. Available at: http://www.hydroworld.com/articles/hr/print/volume-32/issue-
2/articles/development-status-of-the-alden–fish-friendly–turbine.html [Accessed: April 11,2014].
Ingram, E. A., 2012. Exploring the Reasons behind Dam Removal. Available at:http://www.renewableenergyworld.com/rea/news/article/2012/05/exploring-the-reasons-
behind-dam-removal [Accessed: May 9, 2014].
International Energy Agency, 2006. Iplementing agreements for hydropower technologiesand programmes Annex VIII hydropower good practice : Environmental mitigation mea-sures (May).
International Energy Agency, 2011. Technology Roadmap Hydropower. Tech. rep., Paris.
International Hydropower Association, 2014a. Hydropower Sustainability - Erosion & sedi-mentation. Available at: http://www.hydrosustainability.org/About-Sustainability/Environme
nt/Erosion—sedimentation.aspx#.UxCCFyh3-SR [Accessed: February 28, 2014].
International Hydropower Association, 2014b. Hydropower Sustainability - Water Quality.Available at: http://www.hydrosustainability.org/About-Sustainability/Environment/Water-
Quality.aspx#.UxA5uyh3-SR [Accessed: February 28, 2014].
Irish Department of Communications Energy and Natural Resources, 2007. Guidelines on thePlanning, Design, Construction & Operation of Small-Scale Hydro-Electric Schemes andFisheries. Tech. rep., Dublin.
124
BIBLIOGRAPHY
Jansson, R., 2002. The biological cost of hydropower. Tech. rep., UmeåUniversity, Umeå, Swe-den.
Johansson, M., 2011. Minnesanteckningar från regleringsmötet i Boxholm 2011-02-15.
Jordbruksverket, 2014. Utsättning av fisk. Available at: http://www.jordbruksverket.se/amnes
omraden/djur/olikaslagsdjur/fiskarochandravattenbruksdjur/utsattningavfisk.4.5586fdf512
e8fc79a8480002288.html [Accessed: April 22, 2014].
Kihlström, J.-E., 2006. Miljögifterna upptäcks - Från oförstånd till medvetenhet på tio år.Forskning & Framsteg (3).
Kinnarumma Naturskyddsförening, 2013. Klockgentiana och Frisjöns vattennivå.
Kretsloppsstaden, 2014. Kretsloppsstaden. Available at: http://www.kretsloppsstaden.se/ [Ac-cessed: january 5, 2014].
Kumar, A., Schei, A., Ahenkorah, A., Caceres Rodriguez, R., Devernay, J.-m., Freitas, M.,Hall, D., Killingtveit, A., Liu, Z., 2012. Hydropower. In IPCC Special Report on Renew-able Energy Sources and Climate Change Mitigation. Intergovernmental Panel on ClimateChange, Cambridge.
Kungliga ingenjörsvetenskapsakademien IVA, 2002. Vattenkraften i Sverige - En Faktarapportinom IVA-Projektet Energiframsyn Sverige i Europa. Tech. rep.
Laarinier, M., 2001. Dams, Fish and Fisheries: Opportunities, Challenges and Conflict Resolu-tion, Utgåva 419. Available at: http://books.google.com/books?hl=sv&lr=&id=JpIO_ijVlW
cC&pgis=1 [Accessed: March 5, 2014].
Länsstyrelsen Hallands län, n.d. . Översiktlig orienteringskarta.
Länsstyrelsen Kalmar län, 2014. Vad är biologisk mångfald?
Länsstyrelsen Skåne län, n.d. . Natura 2000 skyddar växter, djur och deras livsmiljöer i EU.Available at: http://www.lansstyrelsen.se/skane/Sv/djur-och-natur/skyddad-natur/natura-
2000/Pages/index.aspx [Accessed: April 25, 2014].
Länsstyrelsen Västra Götaland län, 2005. Fungerar våra fiskvägar? Tech. rep., Vattenvårdsen-heten, Vänersborg.
Länsstyrelsen Västra Götaland län, 2014. Vattenförvaltning.
Länsstyrelsen Västra Götaland län, n.d. . Lst Fiskevårdsplan.
Länsstyrelsen Västra Götalands län, 2005a. Bevarandeplan för Natura 2000-område -SE0530110. Tech. rep.
125
BIBLIOGRAPHY
Länsstyrelsen Västra Götalands län, 2005b. Fungerar våra fiskvägar? Tech. rep., Vänersborg.
Länsstyrelsen Västra Götalands län, 2014. Flodpärlmusslans status i Västra Götaland - En in-ventering av nio av länets musselvattendrag 2013. Tech. rep.
Länsstyrelsen Västra Götalands län, n.d. a. Miljöanpassningsåtgärder vid dammar och vat-tenkraftverk.
Länsstyrelsen Västra Götalands län, n.d. b. Natura 2000.
Lejon, A., Malm Renöfält , B., Nilsson, C., 2009. Conflicts Associated with Dam Removal inSweden.
Leonardsson, K., 2012. Modellverktyg för beräkning av ålförluster vid vattenkraftverk. Elforsk12:36, Stockholm.
Malm Renöfält , B., Ahonen, J., 2013. Ekologiska flöden och ekologiskt anpassad vattenreg-lering. Tech. rep.
Malm Renöfält , B., Jansson, R., Nilsson, C., 2010. Effects of hydropower generation and op-portunities for environmental flow management in Swedish riverine ecosystems. FreshwaterBiology 55 (1), 49–67, Available at: http://doi.wiley.com/10.1111/j.1365-2427.2009.02241.x
[Accessed: January 27, 2014].
Malm Renöfält, B., Nilsson, C., 2005. Miljöanpassade flöden, Sammanställning av forskningoch utveckling med avseende på flödesregimer. Tech. rep., Umeå University, Umeå, Sweden.
Melin, L., 2010. Potentially conflicting interests between Hydropower and the EuropeanUnions Water Framework Directive. Ph.D. thesis, Lund University.
Miller, V. B., Landis, A. E., Schaefer, L. a., Mar. 2011. A benchmark for life cycle air emis-sions and life cycle impact assessment of hydrokinetic energy extraction using life cycleassessment. Renewable Energy 36 (3), 1040–1046.
Nationalencyklopedin, n.d. . plankton. Available at: http://www.ne.se/lang/plankton [Accessed:May 14, 2014].
Naturskyddsföreningen, 2013. Utredning om vattenkraft hjälper Sverige att slippa hamnai EU-domstolen. Available at: http://www.naturskyddsforeningen.se/nyheter/utredning-
om-vattenkraft-hjalper-sverige-att-slippa-hamna-i-eu-domstolen [Accessed: February 26,2014].
Naturvårdsverket, 2003. Flöden i vattendrag - Bakgrundsrapport till Miljökvalitetsnormer förflöden/nivåer i rinnande vatten - redovisning av ett regeringsuppdrag (NV rapport 5292), nvrapport Edition. Naturvårdsverket, Stockholm.
126
BIBLIOGRAPHY
Naturvårdsverket, 2008. Naturvårdsverkets författningssamling.
Naturvårdsverket, 2012. Natura 2000 - Naturvårdsverket.
Naturvårdsverket, 2013. Naturvårdsverket - områdesbeskrivning.
Nilsson, C., Rådén, R., 2012. Biologisk effektuppföljning i Tattarströmmarna , Häggån juni2012 Undersökning av bottenfauna och flodpärlmussla samt.
Nilsson, P.-A., Rådén, R., 2007. Bottenfaunan vid två lokaler i Slottsån 2007. Tech. Rep.556389, Medins Biologi AB, Mölnlycke.
Norconsult, 2011. Fiskevårdsplan för Viskan Från mynningen i havet upp till Kungsfors.
NSW Department of Primary Industries, n.d. . Fishways | NSW Department of Primary Indus-tries. Available at: http://www.dpi.nsw.gov.au/fisheries/habitat/rehabilitating/fishways#pool
[Accessed: April 24, 2014].
Nyström, J., 2011. De okända hoten mot ålen | Forskning & Framsteg | Populärvetenskapligtmagasin. Available at: http://fof.se/tidning/2011/10/de-okanda-hoten-mot-alen [Accessed:March 25, 2014].
NyTeknik, 2014. Dammen revs för att rädda ålen. Available at: http://www.nyteknik.se/nyheter/
energi_miljo/vattenkraft/article3824656.ece [Accessed: May 17, 2014].
Oak Ridge National Laboratory, the National Hydropower Association, the Hydropower Re-search Foundation, 2010. Environmental Mitigation Technology for Hydropower :. Tech.rep., Washington, DC.
Packer, N., 2011. Anatomy of a Small Scale Hydropower system (June).
Paish, O., 2002. Small hydro power: technology and current status. Re-newable and Sustainable Energy Reviews 6 (6), 537–556, Available at:http://linkinghub.elsevier.com/retrieve/pii/S1364032102000060 [Accessed: March 18,2014].
Pettersson, L., n.d. . Fiskvägar / Faunapassager.
Pöyry, 2012. Miljöförbättrande åtgärder vattenkraft, Delrapport 4: Småskalig vattenkraft,fiskvägar, miljöanpassade flöden, biotopvårdsåtgärder.
Raadal, H. L., Gagnon, L., Modahl, I. S., Hanssen, O. J. r., Sep. 2011. Life cycle greenhouse gas(GHG) emissions from the generation of wind and hydro power. Renewable and SustainableEnergy Reviews 15 (7), 3417–3422.
127
BIBLIOGRAPHY
Regeringskansliet, 2013. Ny tid ny prövning - förslag till ändrade vattenrättsliga regler. Avail-able at: http://www.regeringen.se/sb/d/16982/a/225262 [Accessed: February 26, 2014].
Sale, M. J., Cada, G. F., Chang, L. H., Christensen, S. W., Railsback, S. F., Francfort, J. E.,Rinehart, B. N., Sommers, G. L., 1991. Environmental mitigation at hydroelectric projectsVolume 1. Current Practices for Instream Flow Needs, Dissolved Oxygen, and Fish Passage.Tech. Rep. December 1991.
Sempler, K., 2009. Vattenkraften värdefull vindkraftregulator - NyTeknik. Available at:http://www.nyteknik.se/popular_teknik/teknikfragan/article261964.ece [Accessed: May 15,2014].
Sitka National Historical Park (U.S. National Park Service), 2014. Stream Ecology -Allochthonous Input. Available at: http://www.nps.gov/sitk/naturescience/stream-ecology-
allochthonous-input.htm [Accessed: May 1, 2014].
Sjölander, E., Strömberg, M., Degerman, E., Göthe, L., Jougda, L., Schreiber, H., 2009. Åt-gärdsplanering i reglerade vattendrag.
SMHI, 2009a. Jordens huvudklimattyper. Available at:http://www.smhi.se/kunskapsbanken/klimat/jordens-huvudklimattyper-1.640 [Accessed:April 3, 2014].
SMHI, 2009b. Klimatförändringarna märks redan idag. Available at:http://www.smhi.se/kunskapsbanken/klimat/klimatforandringarna-marks-redan-idag-1.1510
[Accessed: April 29, 2014].
SMHI, 2012. Växthuseffekten. Available at: http://www.smhi.se/kunskapsbanken/vaxthuseffekten-
1.3844 [Accessed: April 29, 2014].
Sørnes, K., 2010. Small-scale Water Current Turbines for River Applications (January).
Statens Offentliga Utredningar, 2013. Ny tid ny prövning. Stockholm.
Statistiska centralbyrån, 2014. Prisomräknaren - räkna på inflationen - Statistiska centralbyrån.
Ström, M., 2012. Småskalig vattenkraft: Dagsläge och framtidsplaner. Master thesis, KungligaTekniska Högskolan, Available at: http://www.diva-portal.org/smash/record.jsf?pid=diva2:
544010 [Accessed: February 7, 2014].
Svensk Energi, 2011. Korttidsreglering - Energilexikon.
Svensk Energi, 2012. Vattenkraft och Biologisk Mångfald - Goda exempel från elbranschen.Tech. rep.
128
BIBLIOGRAPHY
Svenskt Näringsliv, 2014. Vattenkraften hotad av nya miljökrav. Available at:http://www.svensktnaringsliv.se/fragor/miljoratt/vattenkraften-hotad-av-nya-miljokrav_210
471.html [Accessed: February 26, 2014].
Svensson, B. S., 2000. Hydropower and instream flow requirements for fish inSweden. Fisheries Management and Ecology 7 (1-2), 145–155, Available at:http://doi.wiley.com/10.1046/j.1365-2400.2000.00184.x [Accessed: February 26, 2014].
SWECO Infrastructure, 2008. Hulta vattenkraftsanläggning Geoteknisk utredning. Tech. rep.,Geoteknik, Göteborg.
Teodoru, C. R., Bastien, J., Bonneville, M.-C., del Giorgio, P. a., Demarty, M., Garneau, M.,Hélie, J.-F., Pelletier, L., Prairie, Y. T., Roulet, N. T., Strachan, I. B., Tremblay, A., 2012. Thenet carbon footprint of a newly created boreal hydroelectric reservoir. Global BiogeochemicalCycles 26 (2), n/a–n/a.
Tranås Energi, 2012a. Tranås Energi - Vattenkraft. Available at:http://www.limnologerna.org/VD2012/foredrag 2012/dag2 vattenkraft/MagnusLundberg.pdf
[Accessed: April 28, 2014].
Tranås Energi, 2012b. Tranås Energi AB Översikt. Available at:http://www.vattenorganisationer.se/motalasodra/downloads/36/Tranas_energi.pdf
[Accessed: April 28, 2014].
Tranås Energi, n.d. a. Anpassad vattenkraft och naturvård. Available at:http://www.tranasenergi.se/default.asp?initid=527&menutree=537&toplinkname=V%E5rtmil
j%F6arbete&menuheading=V%E5rt milj%F6arbete&mainpage=templates/05.asp?sida=463
[Accessed: April 28, 2014].
Tranås Energi, n.d. b. Tranås Energi AB. Available at:http://www.tranasenergi.se/default.asp?viewset=1&on=OmTransEnergi&initid=347&hea
ding=OmTrans Energi&mainpage=templates/05.asp?sida=265 [Accessed: April 28,2014].
Tranås Energi, n.d. c. Våra anläggningar. Available at:http://www.tranasenergi.se/default.asp?initid=527&menutree=537&toplinkname=V%E5rtmil
j%F6arbete&menuheading=V%E5rt milj%F6arbete&mainpage=templates/05.asp?sida=463
[Accessed: April 28, 2014].
Tranås Energi, n.d. d. Vårt miljöarbete. Available at:http://www.tranasenergi.se/default.asp?viewset=1&on=V%E5rtmilj%F6arbete&initid=527
&he
ading=V%E5rtmilj%F6arbete&mainpage=templates/08.asp?sida=456 [Accessed: April28, 2014].
129
BIBLIOGRAPHY
Tranås Kommun, 2012. Tranås Energi satsar på vattenkraft. Available at:http://www.tranas.se/arkiv/nyhetsarkiv/tranasenergisatsarpavattenkraft.5.7ded76b9137e77
3257b80003.html [Accessed: April 29, 2014].
Tremblay, a., Lambert, M., Gagnon, L., Mar. 2004. Do Hydroelectric Reservoirs Emit Green-house Gases? Environmental Management 33 (S1), 509–517.
Turconi, R., Boldrin, A., Astrup, T., Dec. 2013. Life cycle assessment (LCA) of electricity gen-eration technologies: Overview, comparability and limitations. Renewable and SustainableEnergy Reviews 28, 555–565.
Vattenmyndigheten Västerhavet, 2010. Åtgärdsprogram Västerhavets vattendistrikt 2009-2015.
Versa, R., 2009. Fiskvandring och biotopåtgärder.
VISS Vatteninformationsystem Sverige, 2013a. Vattendrag - Ätran: Svenljunga - sammaflödemed Assman. Available at: http://www.viss.lansstyrelsen.se/Waters.aspx?waterEUID=SE6
37327-133786 [Accessed: February 28, 2014].
VISS Vatteninformationsystem Sverige, 2013b. Vattendrag - Häggån (från Frisjön till utlopp iViskan ). Available at: http://www.viss.lansstyrelsen.se/Waters.aspx?waterEUID=SE6385
33-131840 [Accessed: February 27, 2014].
VISS Vatteninformationsystem Sverige, 2013c. Vattendrag - Hyltenäsån (mellan Öresjön ochTolken). Available at: http://www.viss.lansstyrelsen.se/Waters.aspx?waterEUID=SE636906-
130880&userProfileID=3 [Accessed: March 14, 2014].
VISS Vatteninformationsystem Sverige, 2013d. Vattendrag - Slottsån (från Ö Öresjön till ut-lopp i Viskan). Available at: http://www.viss.lansstyrelsen.se/Waters.aspx?waterEUID=SE6
37559-130958 [Accessed: February 27, 2014].
VISS Vatteninformationsystem Sverige, n.d. . Vandringshinder - Oppeby Kvarn. Available at:http://www.viss.lansstyrelsen.se/Measures/EditMeasure.aspx?measureEUID=VISSMEAS
URE0107900 [Accessed: April 29, 2014].
von Sperling, E., 2012. Hydropower in Brazil: Overview of Positive and Neg-ative Environmental Aspects. Energy Procedia 18, 110–118, Available at:http://linkinghub.elsevier.com/retrieve/pii/S187661021200793X [Accessed: April 29,2014].
Vovk-korže, A., Korže, D., n.d. . Review of best practices / guidelines for compensation mea-sures for hydropower About CH 2 OICE. Tech. rep.
130
BIBLIOGRAPHY
Wengström, N., 2011. Biotopkartering av vattendrag i Slottsåns avrinningsområde 2003 Biol-ogisk återställning i kalkade vatten. Tech. rep.
World Commission on Dams, 2000. Dams and Development - A new framework for decision-making. No. November. Earthscan Publications Ltd.
Xiaocheng, F., Tao, T., Wanxiang, J., Fengqing, L., Naicheng, W., Shuchan,Z., Qinghua, C., 2008. Impacts of small hydropower plants on macroin-vertebrate communities. Acta Ecologica Sinica 28 (1), 45–52, Available at:http://linkinghub.elsevier.com/retrieve/pii/S1872203208600190 [Accessed: March 17,2014].
Yüksel, I., 2010. Hydropower for sustainable water and energy development.Renewable and Sustainable Energy Reviews 14 (1), 462–469, Available at:http://linkinghub.elsevier.com/retrieve/pii/S1364032109001592 [Accessed: May 7, 2014].
131
Appendices
Appendix A - Övergripande Sammanfattning
Nedan presenteras en längre sammanfattning av rapporten. Fokus ligger på de slutsatser somdragits i analysen och i rekommendationerna även om en kort del av litteraturstudien är inklud-erad för förståelsens skull.
Bakgrund
Vattenkraftens historia går långt bak i tiden och började redan för över 2000 år sedan. I Sverigebörjade vattenkraften att användas för att producera elektricitet i slutet av 1800-talet. Denstora utbyggnaden av vattenkraften skedde mellan 1940-1970 och idag finns över 2000 vat-tenkraftverk i Sverige. Av de 2000 vattenkraftverken är en stor majoritet så kallade småskaligavattenkraftverk. Det finns idag ingen generell uppfattning om hur vattenkraftverken skall in-delas och klassificeringen varierar mycket mellan olika länder. Även i Sverige varierar uppfat-tningen om hur vattenkraftverken skall indelas men det som verkar vara den mest rådande idagär att vattenkraftverk med installerad effekt över 10 MW skall klassificeras som storskaliga.Tillsammans utgör vattenkraften i Sverige idag den totala produktionen från vattenkraftverken45 % av elektricitetsproduktionen.
Syfte och Metod
Syftet med examensarbetet var att undersöka vilken påverkan som de fyra vattenkraftverkensom Borås Energi och Miljö äger har på miljön. De fyra vattenkraftverken, Haby, Hulta, Häg-gårda och Axelfors är småskaliga vattenkraftverk och byggdes i början av 1900-talet, under entid då kraven på att undvika skador på miljön var små eller obefintliga. Under de två senasteåren har det varit en pågående utredning, vattenverksamhetsutredningen, om huruvida de vat-tenkraftverk som idag inte står under miljöbalken skall omprövas så att även de innefattas av demiljökrav som finns idag. Det betyder att det i framtiden kan komma ökande krav på att ävenäldre vattenkraftverk skall anpassas så att dess miljöpåverkan minskas. För att få kunskap omde olika effekterna som vattenkraftverk har på miljön startade projektet med en litteraturstudie
132
APPENDICES
där vetenskapliga artiklar och undersökningar och rapporter om vattenkraftverk studerades. Ilitteraturstudien inkluderades även rapporter och studier som behandlade specifikt de områdenoch miljön där de fyra vattenkraftverken ligger. Informationen från litteraturstudien användesi analysen för att kunna dra slutsatser om den miljöpåverkan som vattenkraftverken resulterari. Litteraturstudien inkluderade också olika åtgärder som kan genomföras för att undvika ellerminska den miljöpåverkan som vattenkraftverken resulterar i.
Litteraturstudie
Vattenkraften har länge ansetts som en miljövänlig energikälla med en mycket liten inverkanpå miljön. Den miljöpåverkan som vattenkraften medför har dock fått allt mer uppmärksamhetoch det är idag lätt att hitta information om de skador som vattenkraftverk faktiskt har påekosystemen. Under konstruktionen och driften av vattenkraftverk är det ett antal faktorer i denomgivande miljön som påverkas och förändras. I ett orört vattendrag finns det flera naturligavariationer som är mycket viktiga för upprätthållandet av flera viktiga funktioner i ekosystemet.Till exempel så är basflödet viktigt för att upprätthålla lämpliga livsmiljöer för vattenlevandeorganismer och tillhandahålla vatten för de landlevande arterna. Höga flöden är viktiga för attrensa bort föroreningar och för att upprätthålla en bra vattenkvalitet. Löga flöden är viktigaför att förhindra att invasiva arter etablerar sig. När vattenflödet regleras till följd av ett vat-tenkraftverk i vattendraget innebär det att flera av de här viktiga funktionerna förhindras vilketkan få långtgående negativa följder på den omgivande miljön.
När ett vattenkraftverk och en damm byggs innebär det att vattnet går från att vara ström-mande till mer lugnflytande. Vattenflödets hastighet ovan dammen reduceras vilket kan ledatill sedimentation eftersom vattnets förmåga att bära sediment minskar, vilket innebär en ökadrisk för sedimentation uppströms dammen. Det leder också till att vattnet nedströms innehållermindre sediment eftersom sedimentet blivit kvar uppströms. Det kan orsaka erosion och ocksåleda till att viktiga näringsämnen inte når arter som lever nedströms dammen.
Trots att det inte finns några större direkta utsläpp från vattenkraft som kan påverka vat-tenkvaliteten så innebär ändå konstruktionen och driften av vattenkraftverk att kvaliteten avvattnet kan påverkas. Då konstruktionen och driften av vattenkraftverk innebär att vattenflödetändras kan det leda till att känsligheten för externa föroreningar ökar, det kan också orsaka tem-peraturförändringar, frisättning av ackumulerat kvicksilver i marken, och förändrad transportav olika ämnen, exempelvis kväve och fosfor.
Ett av de största problemen som vattenkraftverk medför är att de utgör vandringshinder förarterna som lever i vattendragen. Det medför att inte bara migrerande arter påverkas utan dethar även negativa effekter på andra arter i ekosystemet. Ett exempel är flodpärlmusslan som
133
APPENDICES
under sitt larvstadie lever i gälarna på lax och öring. Både lax och öring är migrerande arteroch när de hindras från att vandra i vattendragen påverkas även flodpärlmusslan. För arter somvandrar nedströms kan det finnas en chans att de kan ta sig igenom turbinen och på så sätt nå denedströms liggande delarna även om det ofta medför skador eller till och med död. För arternasom vandrar uppströms innebär dock vattenkraftverken ett definitivt stopp.
Konstruktionen av vattenkraftverk med tillhörande reservoarer kan medföra utsläpp av väx-thusgaser. Den vegetation som översvämmas bryts ner och kan då skapa koldioxid och metan.Hur stora utsläppen av växthusgaserna blir beror på klimat och mängd vegetation. I tropiskaklimat där stora mängder vegetation översvämmas samtidigt som det bildas anaeroba förhållan-den påstår en del forskare att utsläppen av växthusgaser från vattenkraftverk kan vara av sammastorlek som utsläppen av växthusgaser från kolkraftverk. Uppskattningarna på hur stora utsläp-pen är varierar dock mycket och för vattenkraftverk i boreala klimat uppvisar betydligt mindreutsläpp av växthusgaser.
När alla ovan beskrivna faktorer förändras innebär det att den biologiska mångfalden i ekosys-tem påverkas. Kunskapen om hur den biologiska mångfalden påverkas är idag begränsad mendet går att se både direkt och indirekt påverkan. Det är också så att även om enbart en artpåverkas direkt av vattenkraftverken innebär det i förlängningen att flera olika arter påverkasindirekt.
Analys
De båda vattenkraftverken Haby och Hulta är belägna i Slottsån som är ett biflöde till Viskan.För att kontrollera produktionen av elektricitet finns två uppströms belägna sjöar som användssom reservoarer. För sjön Tolken är den tillåtna regleringsamplituden 2,5 m och för Öresjönär den tillåtna regleringsamplituden 2,8 m. Det är dock sällan den hela regleringsamplitudenanvänds utan regleringsspannet ligger på 1-1,5 m. I tabellerna nedan finns information om debåda vattenkraftverken samlade. Då de båda vattenkraftverken ligger i Slottsån med endast ettkort avstånd emellan är hydrologin för dem samma vilket också kan ses i tabellerna.
134
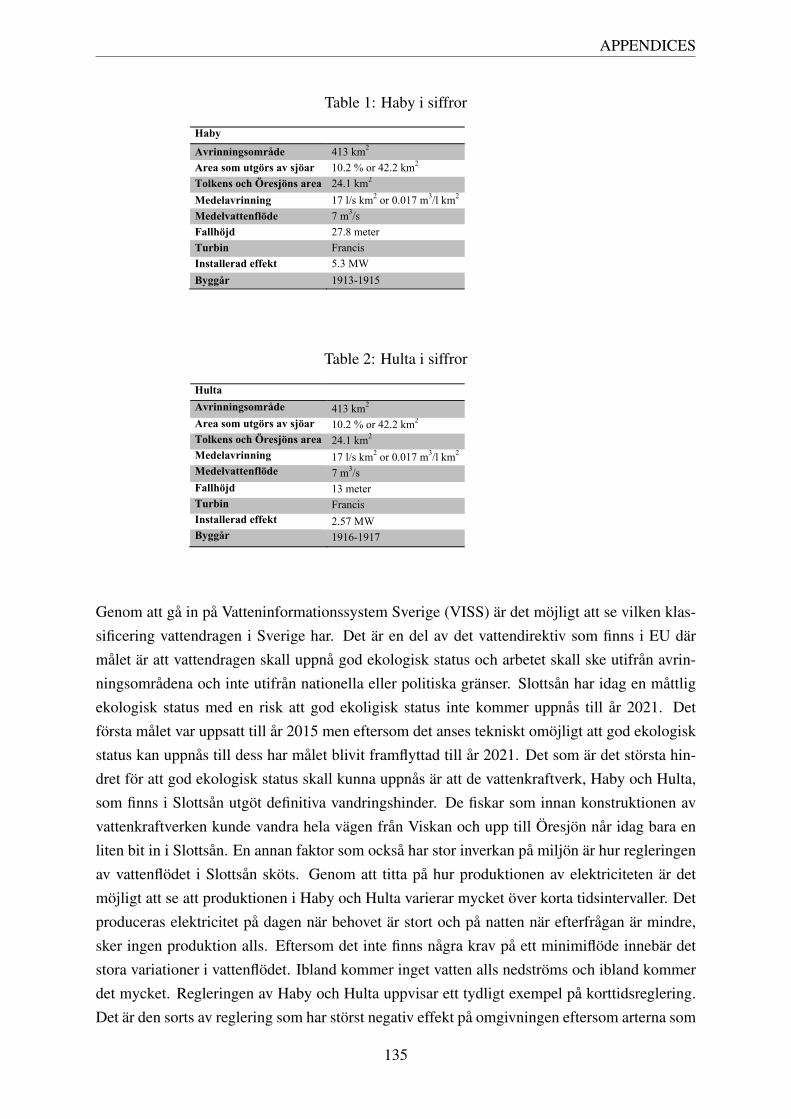
APPENDICES
Table 1: Haby i siffror
Haby
Avrinningsområde 413 km2 Area som utgörs av sjöar 10.2 % or 42.2 km2 Tolkens och Öresjöns area 24.1 km2 Medelavrinning 17 l/s km2 or 0.017 m3/l km2 Medelvattenflöde 7 m3/s Fallhöjd 27.8 meter Turbin Francis Installerad effekt 5.3 MW Byggår 1913-1915 !
Table 2: Hulta i siffror
Hulta Avrinningsområde 413 km2 Area som utgörs av sjöar 10.2 % or 42.2 km2 Tolkens och Öresjöns area 24.1 km2 Medelavrinning 17 l/s km2 or 0.017 m3/l km2 Medelvattenflöde 7 m3/s Fallhöjd 13 meter Turbin Francis Installerad effekt 2.57 MW Byggår 1916-1917 !
Genom att gå in på Vatteninformationssystem Sverige (VISS) är det möjligt att se vilken klas-sificering vattendragen i Sverige har. Det är en del av det vattendirektiv som finns i EU därmålet är att vattendragen skall uppnå god ekologisk status och arbetet skall ske utifrån avrin-ningsområdena och inte utifrån nationella eller politiska gränser. Slottsån har idag en måttligekologisk status med en risk att god ekoligisk status inte kommer uppnås till år 2021. Detförsta målet var uppsatt till år 2015 men eftersom det anses tekniskt omöjligt att god ekologiskstatus kan uppnås till dess har målet blivit framflyttad till år 2021. Det som är det största hin-dret för att god ekologisk status skall kunna uppnås är att de vattenkraftverk, Haby och Hulta,som finns i Slottsån utgöt definitiva vandringshinder. De fiskar som innan konstruktionen avvattenkraftverken kunde vandra hela vägen från Viskan och upp till Öresjön når idag bara enliten bit in i Slottsån. En annan faktor som också har stor inverkan på miljön är hur regleringenav vattenflödet i Slottsån sköts. Genom att titta på hur produktionen av elektriciteten är detmöjligt att se att produktionen i Haby och Hulta varierar mycket över korta tidsintervaller. Detproduceras elektricitet på dagen när behovet är stort och på natten när efterfrågan är mindre,sker ingen produktion alls. Eftersom det inte finns några krav på ett minimiflöde innebär detstora variationer i vattenflödet. Ibland kommer inget vatten alls nedströms och ibland kommerdet mycket. Regleringen av Haby och Hulta uppvisar ett tydligt exempel på korttidsreglering.Det är den sorts av reglering som har störst negativ effekt på omgivningen eftersom arterna som
135
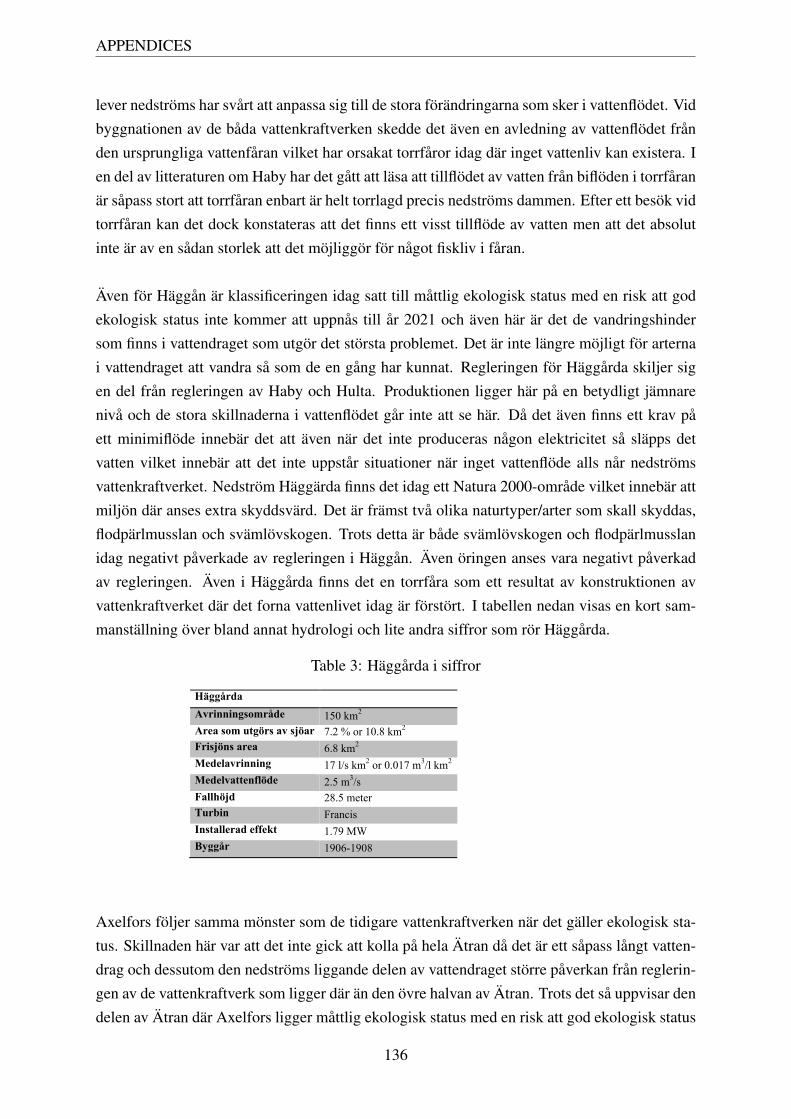
APPENDICES
lever nedströms har svårt att anpassa sig till de stora förändringarna som sker i vattenflödet. Vidbyggnationen av de båda vattenkraftverken skedde det även en avledning av vattenflödet frånden ursprungliga vattenfåran vilket har orsakat torrfåror idag där inget vattenliv kan existera. Ien del av litteraturen om Haby har det gått att läsa att tillflödet av vatten från biflöden i torrfåranär såpass stort att torrfåran enbart är helt torrlagd precis nedströms dammen. Efter ett besök vidtorrfåran kan det dock konstateras att det finns ett visst tillflöde av vatten men att det absolutinte är av en sådan storlek att det möjliggör för något fiskliv i fåran.
Även för Häggån är klassificeringen idag satt till måttlig ekologisk status med en risk att godekologisk status inte kommer att uppnås till år 2021 och även här är det de vandringshindersom finns i vattendraget som utgör det största problemet. Det är inte längre möjligt för arternai vattendraget att vandra så som de en gång har kunnat. Regleringen för Häggårda skiljer sigen del från regleringen av Haby och Hulta. Produktionen ligger här på en betydligt jämnarenivå och de stora skillnaderna i vattenflödet går inte att se här. Då det även finns ett krav påett minimiflöde innebär det att även när det inte produceras någon elektricitet så släpps detvatten vilket innebär att det inte uppstår situationer när inget vattenflöde alls når nedströmsvattenkraftverket. Nedström Häggärda finns det idag ett Natura 2000-område vilket innebär attmiljön där anses extra skyddsvärd. Det är främst två olika naturtyper/arter som skall skyddas,flodpärlmusslan och svämlövskogen. Trots detta är både svämlövskogen och flodpärlmusslanidag negativt påverkade av regleringen i Häggån. Även öringen anses vara negativt påverkadav regleringen. Även i Häggårda finns det en torrfåra som ett resultat av konstruktionen avvattenkraftverket där det forna vattenlivet idag är förstört. I tabellen nedan visas en kort sam-manställning över bland annat hydrologi och lite andra siffror som rör Häggårda.
Table 3: Häggårda i siffror
Häggårda Avrinningsområde 150 km2 Area som utgörs av sjöar 7.2 % or 10.8 km2 Frisjöns area 6.8 km2 Medelavrinning 17 l/s km2 or 0.017 m3/l km2 Medelvattenflöde 2.5 m3/s Fallhöjd 28.5 meter Turbin Francis Installerad effekt 1.79 MW Byggår 1906-1908 !
Axelfors följer samma mönster som de tidigare vattenkraftverken när det gäller ekologisk sta-tus. Skillnaden här var att det inte gick att kolla på hela Ätran då det är ett såpass långt vatten-drag och dessutom den nedströms liggande delen av vattendraget större påverkan från reglerin-gen av de vattenkraftverk som ligger där än den övre halvan av Ätran. Trots det så uppvisar dendelen av Ätran där Axelfors ligger måttlig ekologisk status med en risk att god ekologisk status
136

APPENDICES
kommer att uppnås till år 2021. Även här är det vandringshindrena som är det stora problemet.Ett tydligt exempel på hur svårt det är för den migrerande fisken är att kolla på överlevnad-schansen för de ålar som lever uppströms Axelfors och skall vandra till havet. I genomsnitt harålarna en chans på 30 % att klara sig levande förbi passagen av ett vattenkraftverk. Ålen somlever uppströms Axelfors behöver passera sju vattenkraftverk innan den når havet. Det innebäratt endast 0.02 % av de ålar som påbörjar vandringen kommer nå havet. Även för ålen levandeuppströms de andra vattenkraftverken ser situationen dyster ut även om de inte behöver passerariktigt lika många vattenkraftverk.
100 alar ∗ (0.3)7 = 0.002→ 0.02%
Axelfors skiljer sig från de andra vattenkraftverken då det är ett strömkraftverk och inte ettreglerkraftverk. Det innebär att vattenflödet inte regleras utan produktionen följer tillgången påvatten och det finns inte heller någon sjö här som regleras. Det betyder att den påverkan frånregleringen som finns är mindre här än vad den är i de övriga tre vattenkraftverken. Även härhar det dock skapats en torrfåra där det idag inte är möjligt för något vattenliv att existera. Itabellen nedan visas en kort sammanställning om Axelfors.
Table 4: Axelfors i siffror
Axelfors
Avrinningsområde 1028 km2 Area som utgörs av sjöar 5.9 % or 60.6 km2 Medelavrinning 12 l/s km2 or 0.012 m3/l km2 Medelvattenflöde 12 m3/s Fallhöjd 11 meter Turbin Kaplan Installerad effekt 2.57 MW Byggår 1935-1936 !
Genom att jämföra informationen från litteraturstudien med informationen om de fyra vat-tenkraftverken har det gått att konstatera att de fyra vattenkraftverken troligen inte har någonnegativ påverkan på sedimentation och vattenkvalitet. Inte heller storleken på utsläppen avväxthusgaser är något problem då de kan anses vara små vilket också stämmer överens med attdet främst är i tropiska klimat problemet med stora utsläpp av växthusgaser uppstår. Genomatt titta på livscykelanalyser gjorda på vattenkraftverk i boreala klimat, vilket på ett ungefärstämmer överens med området där vattenkraftverken ligger, uppskattas utsläppen ligga på 3-14g CO2-ekvivalenter/kWh. De utsläpp som finns idag kommer ifrån renoveringar och underhåll.
137

APPENDICES
Rekommendationer
I litteraturstudien ingick också en del där olika åtgärder för att minska eller undvika miljöpåverkanfrån vattenkraftverk undersöktes. Efter att ha konstaterat vilken sorts miljöpåverkan de fyraolika vattenkraftverken har är det också möjligt att dra slutsatser över vad som behöver görasför att förbättra situationen. För att möjliggöra vandring i vattendragen behöver fiskvägar byg-gas. Det är viktigt att fiskvägarna konstrueras så att så många arter som möjligt kan dra nytta avdem. Många av de fiskvägar som finns idag är konstruerade så att endast några få arter klararav att ta sig igenom dem. Det innebär att fiskvägen får begränsad nytta. Det är också viktigtatt underlätta passagen förbi kraftverken för ålarna. De ålar som idag vandrar ut till havet harmycket liten chans att överleva den resan. Det är också så att de ålplaner som idag finns förViskan och Ätrantroligen har en betydligt sämre effekt för ålarna överlevnadschans än om dethade funnits fungerande ålledare.
För att förbättra situationen för arterna i vattendraget bör biotopåtgärder utföras så att fornalekområden återställs. Detta för att förbättra reproduktionsmöjligheterna och för att minskarisken för predation för en del arter.
Som nämnt har det skapats torrfåror vid alla de fyra olika vattenkraftverken. I dessa bör detsläppas ett vattenflöde så att det vattenliv som en gång har existerat i dem kan komma tillbaka.Det bör också släppas någon sorts minimiflöde så att de tillfällen när det inte släpps något vat-ten alls genom vattenkraftstationerna upphör. Även regleringen bör ses över och speciellt dåregleringen i Haby och Hulta så den korttidsregleringen som finns idag kan undvikas. Redanidag så används inte hela den regleringsamplitud i de tre sjöarna Öresjön, Tolken och Frisjönsom Borås Energi och Miljö hat tillåtelse till enligt vattendomarna vilket är bra men även i fort-sättningen bör regleringen skötas så att de önskemål som finns om att inte skada storlommen,gäddan och klockgentianan när de är som känsligast uppfylls.
Det är också viktigt att komma ihåg att flera av de nämnda rekommendationerna ovan hängersamma. Byggs det fiskvägar så behöver de släppas ett minimiflöde i dem vilket kan minska denpåverkan som finns från regleringen. Det är också möjligt att fiskvägarna hamnar i anslutnin-gen till torrfårorna vilket innebär att vattenlivet kan komma tillbaka till dem. Så även om detlåter som många rekommendationer så hänger flera av dem ihop.
138
APPENDICES
Appendix B - Interview with Tranås Energi
Interview with Elina Gahm, Quality and Environmental Coordinator at Tranås Energi. Mailcontact 25/4.
In English:
1. What have you done to reduce the environmental impact at your hydro power plants? (asfor example, built fishway.) We have built two bypass fishways and a Denil fishway, removed a
dam and raised the minimum flow.2. Why did you do these actions? What made you take the decision to make them? Firstly, we
wanted to take responsibility for our environmental impact, and secondly, we had a feeling that
requirements and legislation would be tougher on this, and we saw a profit in the long run to
invest in the environment. Then we had a good support from the Länsstyrelsen, the municipality
and other expertise that could help us to get to it in the best way.
3. Have you noticed any positive/negative differences in ecological and economic aspects? We
have seen trout and otters, which is a sign that the measures worked and that biodiversity has
benefited. We have received many positive reactions from customers and the surroundings,
which had led to increased economic growth.
4. Given that you have built fishways and also raised the minimum flow, is this somethingthat has reduced your production (given the less water through the turbines)? And has thisbeen noticeably for your economic activity? It is clear that these measures reduce production
somewhat and that we not get the maximum economic efficiency in the same way, but we do not
consider that it is constitutes a significant impact on our business. With the ecological values
we win so we think it’s worth it.
5. What do you plan for the future? Do you have more plans for improvement? We continue
the greening of our facilities. Plans exist to remove more obstacles to migration and to build
more fishways.
6. I read that you have plans to use a new screw technology, is this something you still planningto get started? It is true that we shall restore the hydro power of one of our facilities with a new
fish friendly screw technology. We are currently applying for an environmental permit for this.7. How do you see the water activity investigation? Since we already prioritize greening of our
facilities, we are not so much affected. We think it’s important that you take responsibility but
then it is of course also true that not everyone has the same opportunities to implement these
139

APPENDICES
actions because they cost a lot of money.
Original Version in Swedish:
1. Vad har ni gjort för att minska miljöpåverkan vid era kraftverk (ex. byggt fiskväg)? Vi har
byggt två fiskomlöp och en fisktrappa, rivit ut en damm och höjt minimitappningen.
2. Varför gjorde ni dessa åtgärder? Vad fick er att ta besluten att göra dem? Dels ville vi ta
ansvar för vår miljöpåverkan och dels hade vi på känn att krav och lagstiftning skulle bli hår-
dare på detta och vi såg en lönsamhet på sikt att investera i miljön. Sedan hade vi ett gott stöd
av länsstyrelsen, kommunen och annan expertis som kunde hjälpa oss att få till det på bästa
sätt.
3. Har ni märkt någon positiv/negativ skillnad i ekologiska och ekonomiska aspekter? Vi har
sett öring och utter, vilket är ett tecken på att åtgärderna fungerat och att den biologiska mång-
falden har gynnats. Vi har fått många positiva reaktioner från kunder och omgivning som lett
till ökad ekonomiskt tillväxt.
4. Med tanke på att ni byggt fiskvägar och även höjt minimitappningen, är detta något somminskat er produktion (med tanke på mindre vatten genom turbinerna)? Har detta då varitmärkbart för er ekonomiska verksamhet? Det är klart att dessa åtgärder minskar produktionen
något och att vi inte får maximal ekonomisk lönsamhet på samma sätt, men vi anser inte att
det utgör en märkbar påverkan på vår ekonomiska verksamhet. Med de ekologiska värden vi
vinner så tycker vi att det är värt det.
5. Hur tänker ni inför framtiden? Har ni fler planer på förbättringsarbete? Vi fortsätter miljöan-
passningen av våra anläggningar. Planer finns på att undanröja fler vandringshinder och
bygga fler fiskvägar.
6. Läste att ni har planer för att använda en ny skruvteknik, är detta något ni fortfarande planeraratt sätta igång? Det stämmer att vi ska återuppta vattenkraften i en av våra anläggningar med
en ny fiskvänlig skruvteknik, glömde nämna det ;) Vi håller just nu på att ansöka om miljötill-
stånd för detta.
7. hur ser ni på vattenverksamhetsutredningen? Eftersom vi redan prioriterar miljöanpassning
av våra anläggningar påverkas vi inte så mycket av vattenverksamhetsutredningen. Vi tycker
det är viktig att man tar sitt ansvar men sedan är det naturligtvis också så att alla inte har
samma förutsättningar för att genomföra dessa åtgärder då de kostar mycket pengar.
140
APPENDICES
Appendix C - Interview with Falkenberg Energi
Interview with Jens Melin, Environmental Manager at Falkenberg Energi. Telephone 16/5.
In English
1. What have you done to reduce the environmental impact at your hydropower plants (as forexample, built fishway.)? We have built a fishway for the upstream migratory salmon and also
an eel and elver fishway for the upstream migrating eels. This has although not helped the
downstream migration which has continued to be a problem. Recently, we have removed our
dam construction and thus have been able to re-create free flowing streams and promote free
migration in both directions. The hydropower plant closest to the removed dam will now only
be run in the winter at high water flows.
2. Why did you do these actions? What made you take the decision to make them? What led us
to our decision about removing the dam was that we got a requirement from Kammarkollegiet.
They demanded that something had to be done to improve the downstream migration of fish. A
proposal from Kammarkollegiet was to build a culvert, Falkenberg Energi was uncertain about
this solution and chose to start an investigation in collaboration with the University of Karlstad.
The study involved examining the fish in the stream and also to look at their migration pattern.
Different alternative measures were examined to find out which solution would be best for the
site. In the investigation, they concluded that the best solution was to remove the dam, simply
to go "all in".
3. Have you noticed any positive/negative differences in ecological and economic aspects?Economically, we have noticed a difference because we have been producing less electricity.
Our production at the plant has decreased from 13 GWh to 8 GWh per year. But we also expect
to have a positive economic impact from for example increased fishing activities and tourism.
However, it is too early to evaluate this effect. Ecologically speaking, we have already seen a
positive difference. In collaboration with studies from the University of Karlstad, downstream
migrating fish has been counted by being collected in a trap. This study has been going on for
a few years so the study has also been going on before the dam was removed, which means that
a difference can be seen when comparing before and after. The result we have been able to see
is that the amount of salmon smolts have increased to twice as many as it was before. Since not
all the fish go into the trap, but also goes in the stream on the side, the smolts have been radio
labelled. After the fish have been labelled they have been placed back upstream and then we
have been able to see how many that have been collected in the trap and how many that have
been swimming in the side stream. The result we can see out of this is that the number of fish
has increased by a factor of four compared to before the dam was removed.
141
APPENDICES
4. What do you plan for the future? Do you have more plans for improvement? We feel that
we have done what we can to improve the fish migration right now. What we can do more, and
what we shall do, is to continue with the evaluation of our work.
5. How do you see the water activity investigation? As we already done the work that could
come to be needed if hydropower plants should start to be re-investigated according to the
water activity investigation, we do not see any problem with it. I myself am very indecisive in
the question. While I think that the electricity we get from hydropower is very important for
Sweden as a country, I also in the meantime think that we need to protect the environment.
Original in Swedish
1. Vad har ni gjort för att minska miljöpåverkan vid era kraftverk (ex. byggt fiskväg)? Vi har
byggt en laxtrappa för uppvandrande lax och en krypränna för uppvandrande ål, detta har
dock inte hjälpt för nedvandringen av fisk som har fortsatt att vara ett problem. Nyligen så
har vi rivit fördämningen vid kraftverket och på så sätt kunnat återskapa forsen och främja
fria vandringsvägar åt båda hållen. Det kraftverk som ligger närmst den rivna fördämningen
kommer nu bara att köras vintertid vid höga vattenflöden.
2. Varför gjorde ni dessa åtgärder? vad fick er att ta besluten att göra dem? Det som fick
företaget att ta beslut om att riva fördämningen var ett krav från Kammarkollegiet. De krävde
att något var tvunget att göras för att förbättra nedvandringen av fisk. Ett förslag från Kam-
markollegiet var att bygga en kulvert, Falkenberg Energi var dock osäkra på denna lösning och
valde att starta en utredning i samarbete med Karlstads Universitet. Utredningen innebar att
studera fisken i forsen och se på dess vandringsmönster. Olika åtgärdsalternativ utreddes för
att ta reda på vilken lösning som skulle passa bäst. I utredningen kom de fram till att den bästa
lösningen var att riva fördämningen, at helt enkelt gå ”all in!”.
3. Har ni märkt någon positiv/negativ skillnad i ekologiska och ekonomiska aspekter? Ekonomiskt
sett har vi märkt skillnad i och med att vi har producerat mindre elektricitet. Vår produktion
vid kraftverket har minskat från 13 GWh till 8 GWh per år. Men vi förväntar oss även att få en
positiv ekonomisk effekt från bland annat ökat fiske och ökad turism. Det är dock allt för tidigt
för att kunna utvärdera denna effekt. Ekologiskt sett har vi redan sett en positiv skillnad. I
samarbete med studier från Karlstads Universitet så räknas den nedvandrande fisken som fån-
gas i en utsatt fälla. Detta har pågått i några år så studien har även pågått innan fördämningen
revs, vilket gör att man kan se en skillnad på före och efter. Resultatet man har kunnat se är
att lax smolt har ökat till dubbelt så många. Då inte alla fiskar går i fällan utan också går i
forsen vid sidan om har man radiomärkt smolt. Efter att de har märkts har man satt tillbaka
dem uppströms och därefter kunnat se hur många som gått till fällan och hur många som gått
i forsen. Resultatet utav detta är att man kan se att antalet fisk har ökat med en faktor fyra,
jämfört med innan fördämningen revs.
4. Hur tänker ni inför framtiden? Har ni fler planer på förbättringsarbete? Fiskmässigt känner
142

APPENDICES
vi att vi är framme och det vi kan göra nu är att fortsätta med utvärderingar över vårt arbete.
5. Hur ser ni på vattenverksamhetsutredningen? Då vi redan utfört arbetet som skulle kunna
komma till att behövas om vattenkraften skall börja utredas så ser vi inga problem med det.
Själv är jag väldigt kluven i frågan. Samtidigt som jag tycker att elektriciteten vi får från vat-
tenkraften är mycket viktig för Sverige tycker jag också att vi behöver skydda miljön.
143