environmental impacts of ict and the opportunities of
TRANSCRIPT

Environmental impacts of ICT and the opportunities of circular economy solutions
Case study of the City of Helsinki’s ICT procurements
University of Helsinki Master’s programme in Environmental Change and Global Sustainability Master’s thesis 05/2021 Sami Syrjälä (Supervisor: Eva Heiskanen)

Tiedekunta - Fakultet - Faculty Bio- ja ympäristötieteellinen tiedekunta
Tekijä - Författare – Author
Sami Syrjälä
Työn nimi - Arbetets titel –Title
Tietotekniikan ympäristövaikutukset ja kiertotalouden ratkaisumahdollisuudet – Tapaustutkimus Helsingin kaupungin tietotekniikkahankinnoista
Oppiaine - Läroämne - Subject Ympäristömuutos ja globaali kestävyys Työn laji/ Ohjaaja - Arbetets art/Handledare - Level/Instructor Pro gradu/ Eva Heiskanen
Aika - Datum - Month and year
05/2021
Sivumäärä - Sidoantal - Number of pages
74 s + 14 s liitteet
Tiivistelmä - Referat - Abstract Elektroniikkajäte on maailman nopeimmin kasvava jätevirta, mikä johtuu yhteiskunnan kiihtyvästä digitalisaatiokehityksestä. Tehokkaampia laitteita tulee markkinoille jatkuvasti, minkä seurauksena käytössä olevat laitteet vanhentuvat kiihtyvällä tahdilla. Kiihtyvän digitalisaation ja kasvavien jätevirtojen ympäristövaikutuksista merkittävimpiä ovat kasvihuonekaasupäästöt sekä luonnonvarojen kulutus. Ratkaisuksi näihin ympäristöhaasteisiin on esitetty kiertotaloutta, jossa tuotteiden arvo pyritään säilyttämään mahdollisimman tehokkaasti ja tavoitteena on luoda suljettu materiaalien kierto. Tässä tutkielmassa tarkastellaan kiertotalouden periaatteisiin pohjautuvan tuote palveluna -mallin ja laitteiden omistajuuteen pohjautuvan mallin eroja kannettavien tietokoneiden ja tablettien hankinnasta aiheutuvien ympäristövaikutusten osalta. Tutkielman tuloksia hyödynnetään Helsingin kaupungin Kierto- ja jakamistalouden tiekartan toimenpideohjelman tavoitteiden toteutuksessa. Tutkielma toteutettiin yksinkertaistettuna elinkaariarviointina, jossa hyödynnettiin systemaattista kirjallisuuskatsausta laitteiden elinkaaren vaiheisiin ja komponentteihin liittyvien ympäristövaikutusten kartoituksessa. Lisäksi edellä mainittuja liiketoimintamalleja edustavien yritysten uudelleenkäyttö ja kierrätyskäytänteistä kerättiin tietoa haastattelemalla kumpaakin hankintamallia toteuttavan yrityksen edustajia. Lopuksi systemaattisen kirjallisuuskatsauksen ja asiantuntijahaastattelujen avulla kerättyjen tietojen pohjalta arvioitiin laitteiden kasvihuonekaasupäästöihin ja materiaalihukkaan liittyviä eroja näissä hankintavaihtoehdoissa. Tarkastelussa käytettiin Helsingin kaupungin vuosittaisia laitteiden hankintamääriä. Tutkielman tulosten perusteella kasvihuonekaasupäästöjen kannalta laitteiden merkittävimmät elinkaaren vaiheet ovat tuotanto ja käyttö. Ympäristövaikutuksiltaan merkittävimpiä komponentteja ovat piirilevyt, virtapiirit, näytöt ja kotelot. Tulosten perusteella laitteiden elinkaaren pidentäminen tarjoaa mahdollisuuksia vähentää merkittävästi laitteiden ympäristövaikutuksia kummassakin tarkastelukategoriassa, mikäli laitteet kierrätetään asianmukaisesti pidennetyn elinkaaren päätteeksi. Avainsanat - Nyckelord kiertotalous, elinkaariarviointi, tietotekniikka, ympäristövaikutukset, tuote palveluna
Säilytyspaikka - Förvaringsställe - Where deposited Helsingin yliopiston kirjasto, Viikki
Muita tietoja - Övriga uppgifter - Additional information

Tiedekunta - Fakultet - Faculty Faculty of Biological and Environmental Sciences
Tekijä - Författare - Author Sami Syrjälä
Työn nimi - Arbetets titel - Title Environmental impacts of ICT and the opportunities of circular economy solutions – Case study of the City of Helsinki’s ICT procurements
Oppiaine - Läroämne - Subject Environmental Change and Global Sustainability
Työn laji/ Ohjaaja - Arbetets art/Handledare - Level/Instructor Master’s Thesis / Eva Heiskanen
Aika - Datum - Month and year
05/2021
Sivumäärä - Sidoantal - Number of pages
74 pp. + 14 pp. appendices
Tiivistelmä - Referat - Abstract
Electronic waste is the fastest growing type of waste stream in the world, and this development results from the rapidly accelerating digitalization. Electronic devices become obsolete on an accelerating speed, as there are constantly more powerful devices coming to the market. The most significant environmental impacts of this development are greenhouse gas emissions and natural resource consumption. Circular economy has been proposed as a solution to these environmental challenges, and the goal of this approach is to preserve the value of the materials in the circulation as efficiently as possible. One way of implementing the principles of circular economy is the product-as-a-service-based business model. This research examines the differences between the product-as-a-service-based model and ownership-based model in terms of the environmental impacts that are related to the laptop and tablet procurements. The results of this thesis will be utilized in implementing the actions of the City of Helsinki’s Roadmap for Circular and Sharing Economy. This research was conducted as streamlined life cycle assessment, in which the systematic literature review was used for tracking the environmental impacts of the products’ life cycle stages and components. In addition, expert interviews were carried out in order to collect information about the reuse and recycling practices of the supplier companies that follow these previously mentioned business models. Finally, based on the results of the systematic literature review and the interviews, the company specific differences were assessed in terms of the greenhouse gas emissions and material waste that result from the procurements. The City of Helsinki’s annual procurement volumes were used in this assessment. Based on the results of this research, production and use are the most significant life cycle stages in terms of the devices’ greenhouse gas emissions. Printed circuit boards/printed wiring boards, integrated circuits, displays, and casings are the components with the most significant impact. The results suggest that increasing the lifespan of the devices provides opportunities for significantly lowering impacts in both impact categories, if the devices are efficiently recycled after this.
Keywords circular economy, ICT, environmental impacts, product-as-a-service
Säilytyspaikka - Förvaringsställe - Where deposited Viikki Campus Library
Muita tietoja - Övriga uppgifter - Additional information

List of abbreviations and concepts
3R framework Circular economy related framework, which consists of the
practices of reducing, reusing, and recycling the products
(Kirchherr, Reike & Hekkert 2017, 221)
CO2 emissions Carbon dioxide emissions
CO2e emissions Carbon dioxide equivalent emissions, which describe the total
impacts of CO2 and other GHG emissions (Clément et al. 2020,
1)
Direct effects Emissions and resource usage that stem from production, use, and
disposal (Bieser & Hilty 2018, 1.)
E-waste Electronic waste (Kahhat 2012, 5)
Flowchart Documentation of the activities and the flows between these
activities in the analyzed system (Baumann & Tillman 2004, 26)
Functional unit Quantified performance of a product system that can be used as a
reference unit (ISO 14040 2006, 16-17)
GHG emissions Greenhouse gas emissions (Bieser & Hilty 2018, 11)
GWP Global warming potential (Clément et al. 2020, 1)
IC Integrated circuit (Clément et al. 2020, 3)
ICT Information and communication technology (Bieser & Hilty
2018, 1)
Indirect effects ICT-induced changes in consumption and production patterns in
other domains than ICT. (Bieser & Hilty 2018, 1)
LCA Life cycle assessment is a methodological approach, in which the
products’ environmental impacts are mapped from raw material
extraction to disposal phase (Baumann & Tillman 2004, 19)
LCI Life cycle inventory analysis is a stage of LCA where the data is
collected and the relevant inputs and outputs of the product
system are calculated (ISO 14040 2006, 32–33)
LCIA Life cycle impact assessment is a stage of LCA, where the
magnitude of environmental impacts is evaluated (ISO 14044
2006, 14-15)
LCD Liquid-crystal display (André et al. 2019, 270)
LED Light-emitting diode (André et al. 2019, 270)
PaaS Product-as-a-service is a procurement model where the supplier
retains the product’s ownership and the customer procures them
as a service (Vermunt et al. 2018, 893)
PC-ABS Polycarbonate/acrylonitrile butadiene styrene plastic (Meyer &
Katz 2015, 372)
PCB Printed circuit boards (Clément et al. 2020, 5)
PCR Post-consumer recycled materials (Meyer & Katz 2015, 381)
PWB Printed wiring board (Kasulaitis et al. 2015, 2)
sLCA Streamlined life cycle assessment refers to qualitative or semi-
quantitative form of LCA, or a quantitative LCA that is based on
already existing data (Pesonen & Horn 2013, 1782)
SLR Systematic literature review is used for finding, picking out,
evaluating, and combining all relevant research that is related to
the research question (Bettany-Saltikov 2012, 5)
WEEE Waste electrical and electronic equipment (Kahhat 2012, 5)
Table of content
LIST OF ABBREVIATIONS AND CONCEPTS
1 INTRODUCTION ........................................................................................ 1
2 ANALYTICAL FRAMEWORK ..................................................................... 5
2.1 Technological and social development ................................................ 5
2.1.1 Technological acceleration .......................................................... 5
2.1.2 Information society and sustainability in a Finnish context .......... 7
2.2 Sustainability challenges of ICT ........................................................... 8
2.2.1 Increasing greenhouse gas emissions and energy consumption 9
2.2.2 Increasing material consumption .............................................. 10
2.3 Circular economy ............................................................................... 11
3 THE CITY OF HELSINKI AND THE RESEARCH CONTEXT ................... 14
4 METHODS AND DATA ............................................................................. 17
4.1 Life cycle assessment ........................................................................ 18
4.1.1 Stages of LCA ........................................................................... 19
4.1.2 LCA in the context of this study ................................................. 19
4.2 Systematic literature review as a research method ........................... 21
4.3 Screening ........................................................................................... 24
4.4 Expert interviews ............................................................................... 27
4.5 Selection of interviewees and ethical considerations ......................... 29
5 ANALYSIS AND RESULTS ...................................................................... 31
5.1 Results of the SLR ............................................................................. 31
5.1.1 Life cycle stages and the most impactful components .............. 32
5.1.2 Raw material extraction, production, assembly, and use .......... 36
5.1.3 End-of-life stages ...................................................................... 38
5.1.4 CO2e impacts per functional unit ............................................... 39
5.1.5 Material impacts per functional unit ........................................... 43
5.2 Interview results: reuse and recycling practices in the two case companies ......................................................................................... 47
5.2.1 Company 1: Ownership-based model ....................................... 47
5.2.2 Company 2: Product-as-a-service-based model ....................... 50
5.3 Impact assessment ............................................................................ 55

5.3.1 CO2e impacts of alternative procurement options ...................... 55
5.3.2 The material impacts of alternative procurement options .......... 58
5.3.3 Interpretation ............................................................................. 59
6 DISCUSSION ............................................................................................ 63
6.1 Assumptions and limitations .............................................................. 63
6.2 Results and the analytical framework ................................................ 68
7 CONCLUSIONS ........................................................................................ 72
REFERENCES ................................................................................................. 75
APPENDICES .................................................................................................. 81

1 Introduction
Electronic waste is the fastest growing type of waste stream in the world. This develop-
ment is related to rapidly accelerating digitalization, which causes the electronic devices
to become obsolete on an accelerating speed. Growing waste volumes and rapid manu-
facturing of new and more powerful devices cause significant stress for the environment,
for example in terms of carbon dioxide equivalent (CO2e) emissions and material con-
sumption. (Ojala, Mettälä, Heinonen & Oksanen 2020, 24, 75.) The significance of these
impacts is extensively associated with the end-of-life disposal options (see subsection
5.1.3). It is important to find solutions for a more comprehensive utilization of this waste,
as it is likely that the acceleration of the digitalization continues in the future (e.g. Schwab
2016, 12).
Circular economy has been proposed as a measure for redesigning the linear consumption
patterns. It is a systematic approach, in which the aim is to preserve the value of the
materials in the circulation as efficiently as possible. In contrast to a so-called linear eco-
nomic model, in which the raw materials are collected in order to make a product, which
is then used, and finally disposed as a waste, in circular economy the goal is to form
closed material cycles. (e.g. Ellen MacArthur Foundation 2013.) The problem with the
concept of circular economy is its ambiguous nature, but very often it is associated with
a so-called 3R framework, which consists of the practices of reducing, reusing, and recy-
cling the products (Kirchherr, Reike & Hekkert 2017, 221). One form of implementing
circular economy is the so-called product-as-a-service (PaaS) business model, in which
the supplier retains the ownership of the products, and the customer procures them as a
service (Vermunt et al. 2018, 980). This has been argued to extend the useful life of prod-
ucts due to the product take-back programs (Kerdlap, Gheewala & Ramakrishna 2020,
331). Circular economy has been proposed as a solution to the overconsumption of natural
resources and to CO2e emissions that exert pressure on biodiversity (Ellen MacArthur
Foundation 2019B, 9, 26). Thus, it is important to study the potential of this approach in
reducing the environmental impacts of ICT devices.
In order to comprehend the total impacts of ICT devices, it is necessary to understand the
impacts that occur at every different life cycle stage. Life cycle assessment (LCA) is a

2
methodological approach, in which the products’ environmental impacts are mapped
from raw material extraction to disposal phase (Baumann & Tillman 2004, 19), and by
utilizing this approach it is possible to assess the ICT devices’ most relevant components,
life cycle phases, and environmental impacts. Several researchers also argue that there is
a research gap in the studies considering environmental impacts of implementing circular
economy, due to the lack of real-world business-related case studies (André, Söderman
& Nordelöf 2019, 269). This study aims to advance the filling of this gap by providing
information about the environmental savings potential of circular economy utilization in
ICT procurements, focusing on opportunities that exist in the real-world business context.
Cities have been identified as especially important actors for advancing the transition
from linear economy to circular economy (Häikiö & The ORSI consortium 2020), and
large shares of natural resource consumption, greenhouse gas emissions production, and
global waste generation take place in cities (Ellen MacArthur Foundation 2019A, 3).
Therefore, studying the environmental saving potential of the product-as-a-service solu-
tions in the context of cities’ procurement operations is highly relevant. In this thesis, the
object is to study the environmental savings potential of these solutions in the context of
the City of Helsinki’s ICT procurements. Finland is one of the world’s leading countries
in digitalization (Ojala et al. 2020, 13) and the City of Helsinki is the largest public pro-
curement operator in Finland (Helsinki 2020, 5). Thus, studying the City of Helsinki’s
procurement alternatives provides an excellent target for a case study, in which the aim
is to understand the environmental impacts of these procurement model options.
This thesis is conducted as a commission work for the City of Helsinki, and the objective
of this study is to provide support for procurement related actions that are declared in The
City of Helsinki’s (2020) Roadmap for Circular and Sharing Economy. These actions
include transition to service-based procurement model for those product groups that it is
sensible and increasing understanding of procurement models that are smart in terms of
life cycle impacts. (City of Helsinki Urban Environment Division 2020, 13.) The focus
of this study is on the environmental impacts of laptops and tablets, and on the most
significant life cycle stages and components of these devices, in terms of the most relevant
impact categories. The differences between the life cycle impacts of these devices are
assessed in the case of ownership-based procurement model and product-as-a-service-
based procurement model.

3
In this study, two alternative ICT supplier companies’ operations and environmental im-
pacts are assessed. One of these companies states to follow the principles of circular econ-
omy, and to operate as a platform for service-based product procurements. Since the prin-
ciples of a circular economy can mean many different things, this study also compares
the company’s operations to the most common definitions of the circular economy. This
thesis is carried out as streamlined life cycle assessment case study, which is based on the
ISO 14040 (2006) and ISO 14044 (2006) -standards, which provide a systematic ap-
proach for conducting the life cycle assessment. The data that is used for carrying out the
LCA is collected by conducting a systematic literature review of the already existing
studies, and by interviewing the representatives of the supplier companies.
The goal is to provide an answer to the following research questions:
RQ1. What are the most important stages and components in laptops’ and tablets’ life
cycles, in terms of CO2e emissions and material consumption?
RQ2. How are these stages and their impacts different in ownership-based procurement
model and service-based procurement model?
The need for a shift from linear to circular economy has also been recognized in the City
of Helsinki’s strategy papers. In the Helsinki City Strategy for 2017–2021, it is stated that
circular economy projects will be implemented in cooperation with companies, and in
Carbon-neutral Helsinki 2035 Action Plan one of the declared actions is that the city
would be implementing a carbon-neutral circular economy by 2050. (City of Helsinki
Urban Environment Division 2020, 4.) Additionally, in the City of Helsinki’s new pro-
curement strategy it is stated that it is important to actively analyze the supplier markets
in order to find new service models early on (Helsinki 2020, 9). This thesis will provide
an extensive support for the city’s several target programs, and it can assist in a transition
to more sustainable operating models.
The thesis contains seven main chapters. The second chapter of this thesis is the analytical
framework, which will introduce the reader to the theoretical assumptions and perspec-
tives that motivate the need for this study. The third chapter will provide information

4
about the City of Helsinki’s state of affairs in the context of this study. The selected meth-
odological approaches and the utilized data will be introduced to the reader in the fourth
chapter, and the fifth chapter will provide the results that were obtained by these methods.
The sixth chapter will consider the limitations of this research, and in this chapter the
results are also linked to the theoretical assumptions that were introduced in the second
chapter. Finally, in the seventh chapter the main finding and conclusions of this study will
be made.

5
2 Analytical framework
The first aim of this chapter is to review the topical nature of technological development.
This will be the focus of the first section 2.1. This section is divided into subsections 2.1.1
where the exponential growth of technological acceleration will be considered through
various descriptions presented by different scholars and intellectuals, and to 2.1.2 where
the implications of this development for a highly digitalized welfare state will be ana-
lyzed. The following section 2.2 will consider the sustainability challenges that are related
to ICT. The section is divided into two subsections in which the most significant environ-
mental challenges of ICT will be presented. Subsection 2.2.1 will focus on the increasing
greenhouse gas emissions and energy consumption and subsection 2.2.2 on the increasing
material consumption. The last section of this chapter, 2.3, will present the concept of
circular economy, and consider it as a possible solution for the environmental challenges
that are related to ICT procurements.
2.1 Technological and social development
Technological development is one of the most important social phenomena, as technol-
ogy has started to blend into almost every aspect of life and manifests as various social
trends that each shape the society (Ahmed, Naeem & Iqbal 2016, 43; Dufva 2020, 2, 39;
Røpke & Christensen 2012, 349). One of the key features of technological development
has been its long-lasting exponential acceleration (e.g. Mollick 2006; Brynjolfsson and
McAfee 2014), which indicates that the impact on society could also accelerate in the
future. To some extent these impacts can be seen to contribute to socially pursued goals,
such as economic and social progress, but on the other hand, technological development
also poses various risks for the society and the environment (e.g. Dufva 2020, 40–42;
Ojala et al. 2020). Technological acceleration is an important concern when considering
opportunities for a more circular economy, since it entails a rapid pace of change in ma-
terials and products.
2.1.1 Technological acceleration On the 1960s Intel’s former chairman Gordon Moore predicted that the number of tran-
sistors that can be fitted into a microchip would double every year or two, which later

6
became known as Moore’s law. While no longer valid as a ’law’, the prediction of expo-
nential technological development has remained rather successful for several decades.
(Mollick 2006, 62; Brynjolfsson and McAfee 2014, 40–41; Lange, Pohl & Santarius
2020, 5.) This exponential development speed has in recent decades revolutionized the
society in many ways, but according to many scholars, the greatest revolutions are yet to
come.
Klaus Schwab (2016, 7), the founder and executive chairman of the World Economic
Forum, has for example argued that we are in the middle of the fourth industrial revolu-
tion, which can be characterized as “a profound shift across all industries”. Correspond-
ingly, according to Schwab (2016, 12) and Massachusetts Institute of Technology (MIT)
Professors Brynjolfsson and McAfee (2014), we are now on an inflection point, after
which the effects of technological development really start to manifest. Brynjolfsson and
McAfee (2014) argue of the significance of the force of change, by referring to the current
period as the second machine age. This concept refers to an idea, that computers have
started to do the same thing for mental work that steam engines did for muscle work; that
is to exceed the previous limitations. Technological acceleration can also be seen as a
self-propelling process, because economic operators are under the pressure to adopt the
latest technology, as otherwise they will be outdated (Rosa & Scheuerman 2009, 88–89).
In addition to exponentially increasing computer speed, a crucial assumption of Moore’s
law is the affordability of computing power. Moore noticed that computing power ob-
tained per every spent dollar doubled yearly from 1962 to 1965. (Ahmed et al. 2016, 43;
Brynjolfsson & McAfee 2014, 40–41; Mollick 2006, 65.) The reason why the improve-
ment of computers has been so radical, is that the physical limitations in digital world are
much looser than in many other forms of manufacturing. In addition, engineers have been
able to find many ways to overcome the obstacles that physics have set for development.
(Brynjolfsson & McAfee 2014, 42.) Next, the aim is to review how this constant increase
in computing power, and decrease in its price, has affected people and society in Finland,
which is one of the world’s leading countries in digitalization (Ojala et al. 2020, 13).
7
2.1.2 Information society and sustainability in a Finnish context The internet and the development of ICT devices have increased labor productivity
(Brynjolfsson & McAfee 2014, 98–99; Castells & Himanen 2002, 2, 21; Lange, Pohl &
Santarius 2020, 2). Various studies show that ICT development has a positive impact on
a country’s economic growth and this relation seems to be especially pronounced in high-
income countries (Lange, Pohl & Santarius 2020, 5). Finland has been regarded as a prime
example of a Nordic information society and as one of the world’s leading countries in
digitalization, because of the strong information and communication sector. (Ojala et al.
2020, 13; Castells & Himanen 2002, 5). The Finnish model has been a target of academic
interest as different scholars have contemplated the reasons behind the success (see e.g.
Castells & Himanen 2002; Miettinen 2013).
According to the studies by Castells & Himanen (2002, 141–146) and Miettinen (2013,
2), Finland has been able to form a self-reinforcing system, in which social and economic
sustainability goals are being achieved in a mutually supportive way. However, although
Finland has ranked globally well in terms of various measures of well-being, it has not
been as successful in terms of ecological sustainability (Ojala et al. 2020, 13). According
to the ORSI joint project, the current level of social welfare in Finnish society cannot be
considered as being on an environmentally sustainable basis, because the carbon dioxide
emissions and the use of natural resources are on a high level compared to the rest of the
world. Finland is not alone with this challenge, since no other welfare state has presented
a credible plan for transition to eco-welfare state yet either. (Häikiö & The ORSI
consortium 2020.)
Finland aims to be carbon neutral by 2035, which requires that emissions are reduced in
all sectors. There is a need for coherent and transparent measures for tackling the
environmental and climate impacts of the ICT sector, as the sector has continued to
advance, and the environmental impact has continued to increase. (Ojala et al. 2020, 12–
13.) As a later review shows, the environmental impacts of ICT sector contribute to those
challenges that have been remarked by ORSI joint project as especially challenging for
Finland (Häikiö & The ORSI consortium 2020; Dufva 2020, 42; Ojala et al. 2020, 24).
Changes in consumption patterns are an essential measure for a state’s ability to reach the
sustainability goals of Agenda 2030, that Finland as a member state of the United Nations

8
has agreed on (Ministry for Foreign Affairs of Finland 2020). Cities are considered as
important drivers of this change (Häikiö & The ORSI consortium 2020.), as they account
for 75% of the natural resource consumption and produce 50% of the global waste and
60–80% of greenhouse gas emissions (Ellen MacArthur Foundation 2019A, 3).
2.2 Sustainability challenges of ICT
The economic development and growing middle classes are driving changes in Earth’s
life support system (WWF 2018, 23; Ellen Macarthur Foundation 2013, 14), and as
mentioned in the subsection 2.1.2, no technologically advanced welfare state has been
able to provide their standard of living on an environmentally sustainable basis (Häikiö
& The ORSI consortium 2020). The technological progress is an important driver of
social and economic development, but it is important to understand its true costs.
Moreover, as the progress is accelerating, the environmental risks should be mapped
expeditiously, as there is a chance that they also worsen with an accelerating pace in the
future.
The environmental impacts of the ICT sector have only recently begun to arouse public
interest, and the focus has so far been mainly on the digitalization’s potential in emission
reductions (Ojala et al. 2020, 12, 14). The ICT sector provides enormous potential in
lowering other sectors’ carbon emissions through optimizing, replacement of physical
products, and resource efficiency enhancing (Ojala et al. 2020, 23; Lange, Pohl &
Santarius 2020, 4–5), but it is also associated with significant negative environmental
impacts. The most significant of them are related to greenhouse gas (GHG) emissions that
stem from growing energy use and material consumption (Dufva 2020, 42; Ojala et al.
2020, 24), which will be considered in the following subsections 2.2.1 and 2.2.2. In the
context of Finland, the consumption of data has been growing exponentially in
approximately two years cycles (Wirén, Vuorela, Müller & Laitinen 2019, 9–10). The
demand for energy is also increasing exponentially (Ahmed et al. 2016, 43), and therefore
it is likely that the environmental impacts of digitalization will continue to increase in the
future.

9
2.2.1 Increasing greenhouse gas emissions and energy consumption The environmental impacts of ICT have been studied since the early 1990s, and special
focus has been put on energy consumption (Røpke & Christensen 2012, 348). The
progress in digitalization has had a positive correlation with increases in energy
consumption and GHG emissions during the last decades, which is a problem as a great
proportion of the global electricity production is generated by burning fossil fuels (Ojala
et al. 2020, 27). This increase has resulted from the rising production, use and disposal of
ICT devices. (Lange et al. 2002, 2.) Improving energy efficiency and increasing the share
of low-emission electricity have been proposed as direct means for reducing the
environmental impacts of ICT (Ojala et al. 2020, 98). Energy efficiency on the ICT sector,
has continuously improved during the last decades, but as the sector’s growth has been
more significant than the growth in efficiency, the energy consumption has not been
decreasing (Lange et al. 2020, 4).
A situation, in which increase in energy efficiency does not lead to decrease in energy
consumption, is referred to as the Jevons’ paradox. The notion was put forward by an
economist William Stanley Jevons (1865), and the original context of the paradox was
the increasing demand of the British coal resources. Later this finding has been cited in
various contexts, and the concept of a rebound effect has been used as an umbrella term
for such mechanisms (Sorrell 2009, 1456–1457). As mentioned in the previous chapter,
the mechanisms seem to also apply to energy efficiency on the ICT sector, as the sector
has grown more rapidly than its energy efficiency (Lange et al. 2020, 4). Yet, many
governmental and non-governmental operators still assume that the efficiency lowers
consumption and the environmental impacts (Alcott 2005, 9). If the apparent mechanism
explains the growing energy use on ICT sector, it would have profound implications for
the discussion of carbon emissions (Sorrell 2009, 1456). There is still not a unanimous
perception of whether this is the case, but the majority of the rebound effect researchers
argue that the effect is significant enough to prevent sufficient reduction in energy use
(Lange et al. 2020, 5). It is important that the governmental and non-governmental
operators adopt a critical standpoint, when studying the potential environmental impacts
of energy efficiency. This does not imply that the focus on energy efficiency should be
neglected in reviews, but the existence of the rebound effect must be recognized when
designing sustainability measures for the ICT sector.
10
Another important factor influencing the environmental impacts of ICT is the source of
the energy being used. Electricity is often produced by burning coal, natural gas, or oil
(Ahmed et al. 2016, 43–44), which generates carbon dioxide (CO2) missions. ICT
companies can reduce their CO2 footprint by utilizing renewable electricity (Ojala et al.
2020, 28), and some scholars argue that due to the rebound effect, this measure is more
effective in coping with the ICT related CO2 emissions than focusing on the energy
efficiency (Herring 2006). Globally only 20–25% of the total energy is collected from
hydro, nuclear or renewable sources, so internationally compared, the electricity
consumed in Finland is relatively carbon-free, as approximately 35% comes from
renewable sources and 27% is produced by nuclear power (Ahmed et al. 2016, 44; Ojala
et al. 2020, 27, 143).
There are different research results on the distribution of energy consumption in the ICT
sector. According to some studies, it is precisely the role of data centers in energy
consumption that is significant, and according to others, the consumption takes mostly
place in consumer devices. (Ojala et al. 2020, 25.) In addition, the use of ICT also
increases energy consumption through the production and running of the products (Røpke
& Christensen 2012, 349). It is undeniable that due to digitalization, a larger share of the
societal energy use will be in a form of electricity. However, this development is crucial,
since ICT has an important role in making the infrastructures more energy efficient.
(Ahmed et al. 2016, 45.)
2.2.2 Increasing material consumption In addition to growing CO2 emissions and energy consumption, the construction and use
of ICT infrastructure also consume an increasing amount of materials. The extraction of
raw materials is a significant cause of greenhouse gas (GHG) emissions, but it also has
other environmental impacts, such as habitat loss and deterioration. (Ojala et al. 2020,
22.) Electronic waste (e-waste) contains toxic elements, such as lead, mercury, and
chromium, that can potentially harm humans and nature if the waste is being placed on
municipal solid waste landfills (Kahhat 2012, 7–8). It has been estimated that the amount
of e-waste continues to grow as much as 6.5% annually, which makes it the fastest
growing waste stream in the world (Ojala et al. 2020, 75). In order to reduce the material
11
consumption, it is important to locate the different processes of the life cycle, in which
the material consumption is formed.
The material basis of ICT devices forms in a so-called upstream and downstream
processes. Upstream processes refer to mining and extraction, refining, and production of
the raw materials, production of components, and lastly the product itself. Downstream
processes, again, refer to the use of the product, material recovery, and disposal. (Wäger,
Hischier & Widmer 2014, 3.) The largest share of the materials that are used in terminals
are metals, polymers, and glass. Some of the most commonly used metals are aluminium,
copper, and iron. In addition, the devices contain scarce metals, such as gold, indium,
platinum group metals, and rare earth elements. (Ojala et al. 2020, 78; Wäger et al. 2014,
2.) Laptops and tablets are considered as the most valuable form of e-waste, due to the
high content of essential metals in relation to their size. Being more compact, tablets have
a very high content of those materials, but the compactness also makes it more
challenging to recycle the devices. (Cucchiella et al. 2015, 265.)
The problem with the material consumption is that a large proportion of the materials
does not end up in a circulation at the end of the device’s life cycle, even though they
have a lot of value embedded in them. Printed circuit boards (PCBs), for example, are
components that are significant in terms of their environmental impacts (see later
subsection 5.1.5). Yet, 40% of them end up in landfills, because recycling is difficult due
to their complex composition and structure (Cucchiella et al. 2015, 265). As a result of
the rapidly evolving performance of the devices, new devices are introduced and old ones
are discarded at an accelerating rate, and a rather large proportion of the discarded devices
would still be usable. (Ojala et al. 2020, 75.)
2.3 Circular economy
The growing amount of e-waste reflects the issue that the value of the resources that are
used in products are not fully utilized, after the product has come to the end of its life
cycle. These kinds of problems are related to the so-called linear consumption model,
which relies on take-make-dispose principles. Linear consumption creates supply chains
that are material and energy intensive, as the material flows come to a dead end by the

12
end of the product’s life cycle. In order to meet the current level of material demand,
circular economy has been proposed as a key to a system level redesign. Such transition
could not only lower the pressure on resource supply, but also lead to significant economic
opportunities. (Ellen MacArthur Foundation 2013, 5, 14, 23–24.)
Circular economy is an economic model that is restorative by intension and the aim in
this model is to manage material flows carefully. The goal of minimizing the amount of
waste is already considered in the product design phase, since the product’s life cycle is
mainly determined already during its development. The technical materials and
components are already in this stage designed in a way that they can be recovered,
refreshed, or upgraded if needed. Reducing, reusing, and recycling form a taxonomy of
the so-called 3R practices. (Ellen MacArthur Foundation 2013, 26; Sihvonen & Ritola
2015, 639–640.) Reducing refers to extending the product’s life cycle, for example by
making it high-quality or emotionally attachable, so that the need to purchase new
products decreases. Reusing refers to using either the whole product or its components
again for example by repairing, refurbishing, or remanufacturing them. Reusing can also
be carried out for example by reselling the product for a lower price into a different market
segment. Recycling refers to any operation, in which the waste material is transformed
into new products or materials. Sometimes also a fourth R has been added to the
taxonomy, standing for recovery, which refers to the practices that recover, for example,
valuable or hazardous materials after the product’s life cycle. (Sihvonen & Ritola 2015,
640–642.)
However, the problem with the concept of circular economy is its ambiguous nature. In
their study, Kirchherr et al. (2017, 221) mapped out 114 definitions for circular economy,
and the most common depiction was the 3R framework. The ambiguity is especially
important to highlight when conducting a case study of a company that portrays itself as
an operator that follows the principles of circular economy. Based on the extensive
mapping by Kirchherr et al. (2017) the most important determinants for circular economy
principles are following the practices of the 3Rs.
One way of implementing circular economy is the so-called product-as-a-service model,
in which the supplier retains the ownership of the products, and the customer procures
them as a service. This model is essentially linked to the reducing practices of the 3R

13
framework, as it redefines how the products are used. (Vermunt et al. 2018, 893.) Utilizing
this business model can lead to an extension of the product’s lifespan due to the
companies’ product take-back programs that keep the products in use as long as they have
service value (Kerdlap et al. 2020, 331). In some circular business model taxonomies, the
product life cycle extension has also been considered as a separate business model, which
is mostly related to the reusing practices in the 3R framework (Vermunt et al. 2018, 893).
Although the life cycle extension category has been separated as a distinct circular
business category in some taxonomies, PaaS-based business models can still often lead
to product’s life cycle extension as well.
Implementing circular economy -based business solutions is not only related to lowering
the products’ material impacts, but it also provides significant potential in reducing the
CO2e emissions of key industrial materials, such as steel, aluminium, and plastics (Ellen
MacArthur Foundation 2019B, 26). As mentioned in previous subsections, the most
important environmental impacts of ICT sector are CO2e emissions and material
consumption. Thus, as the principles of circular economy have been proposed to provide
solutions for both environmental challenges of ICT, it is important to study the potential
environmental savings of implementing circular economy principles in the ICT sector.

14
3 The City of Helsinki and the research context
As mentioned in subsection 2.1.1, cities offer a great potential for supporting the
transition to more sustainable procurement practices due to their exceptionally large
procurement volumes. In the case of the City of Helsinki, for example, the annual
procurement volume is approximately four billion euros, making the City of Helsinki the
largest public procurement operator in Finland (Helsinki 2020, 5). Thus, reviewing the
environmental savings potential of the ICT procurements in the context of the City of
Helsinki can have significant environmental impact potential, contributing not only to the
city’s strategies but also on a country level to the Carbon-neutral Finland by 2035
programme.
Many large cities around the world have started to notice the capability of circular
economy solutions in promoting their environmental, social, and economic interests
(Crocker et al. 2018, 3). The need for a shift from linear economy into circular economy
in solving the global sustainability challenges has also been recognized by the City of
Helsinki. In the Helsinki city strategy for 2017–2021, circular economy projects were
stated to be implemented in cooperation with companies and citizens, and the Carbon-
neutral Helsinki 2035 Action Plan was approved in 2018. One of the declared actions of
this action plan was to form a roadmap for circular and sharing economy.
The aim of this thesis is to support the City of Helsinki in achieving the circular economy
goals of this roadmap in terms of procurements, which has been defined as one of the key
target areas. These actions include moving to service-based procurement model for those
product groups that it is rational and increasing understanding of procurement models that
can provide savings in terms of life cycle impacts. (City of Helsinki Urban Environment
Division 2020, 13.) Additionally, the city’s procurement strategy has been updated in
2020 into a form that takes responsibility in procurements more extensively into account.
In the new procurement strategy, it is stated, that in order to recognize the available
solutions early on, it is important to actively analyze the supplier markets and build
market dialogue with different suppliers (Helsinki 2020, 9).
Conducting this study provides the City of Helsinki a chance to have a deeper review of
the two procurement types, that are representing different business models. The first

15
supplier was selected for the review, because the City of Helsinki was already familiar
with the company’s ICT services, and it was considered to be a supplier whose services
could potentially be utilized in the future. The second company, on the other hand, had
been noticed by the City of Helsinki’s procurement officers, as it markets itself as an ICT
company that follows the principles of circular economy and operates as a platform for
service-based product procurements. Assessing the environmental impacts of the two
companies’ operations will support the City of Helsinki’s pursuit of lowering the
environmental impacts of their ICT procurements. However, as mentioned in subsection
2.3, the problem of the concept of circular economy is its ambiguous nature. Thus, to truly
understand whether the operations of the Company 2 correspond with the general
understanding of circular economy, it is important to consider the products’ and their
components’ life cycles in both procurement options (see figures 2 and 3).
Carbon-neutral Helsinki 2035 Action Plan states that in order to achieve its goal, it is
necessary to implement circular economy principles in all of the possible procurement
areas (Helsinki 2020, 11). The City of Helsinki procures approximately 20,000 laptops
each year, and as the typical office laptop weighs around 1.8 kg, the city’s annual laptop
procurements weigh around 36,000 kg (Lehtinen 2018, 7). Furthermore, focusing on the
environmental impacts of the ICT procurements is especially important, because as stated
in subsection 2.2.2, e-waste is one of the fastest growing forms of waste, and the laptops
and tablets are the most valuable form of e-waste. Therefore, studying the life cycle
impacts of alternative laptop and tablet procurement measures can provide an
exceptionally influential approach for affecting the city’s environmental footprint.
The city has formed a fixed term contract with the current supplier, who takes care of the
secure disposal of the equipment. The minimum responsibility requirements for the
supplier in tenders is that they accept as many old devices for secure and environment
friendly recycling as they have provided as new ones. Once the devices are delivered,
they are entered into the ICT equipment register and the maintenance and repair are taken
care of by the warranty provider. Currently the most common reason for disposal is that
the device has become unusable due to damage or end of service life. (Lehtinen 2018, 5–
7.)
16
However, the city is not obligated to return the used devices back to the supplier. A part
of the disposed devices has been directed to the Uusix workshop, which is a work
rehabilitation center operating under the City of Helsinki’s Social Services. There the
devices are repaired and security processed, after which they are directed for reuse. Some
of the working components of the otherwise unusable devices have been used in repairing
other devices. According to the foreman of Uusix, during 2018 around 8500 items had
gone through their accounts. Of those items a relatively larger share was reused than
disposed. (Lehtinen 2018, 7–8.)
However, information presented in here can be considered to some extent outdated, as it
reflects the situation in 2018. In order to gain more recent information, the original plan
was to interview the foreman of Uusix as a part of this study. However, as Uusix operates
under the City of Helsinki’s Social Services, the unit’s need for a research permit would
have caused broad scheduling challenges for the progress of this study. For this reason,
information related to Uusix was based on an internal report by Lehtinen (2018), in which
the cycle of the City of Helsinki’s ICT devices is reviewed.
As Lehtinen (2018) points out, the City of Helsinki is already engaging in circular econ-
omy of ICT devices to some extent, by utilizing the services of the Uusix workshop for
extending the products’ life cycles. Yet, the procurement volumes are relatively large,
and only a portion of the disposed devices is reused through Uusix. Therefore, it is im-
portant to study the differences in environmental impacts of implementing different pro-
curement models and the end-of-life treatments that are related to them.

17
4 Methods and data In this chapter the reader will be familiarized with the methods and data that are used in
this study. The study is conducted as a streamlined life cycle assessment (sLCA), and the
focus of this approach is on the two of the devices’ most significant impact categories,
CO2e impacts and material consumption. The principles of life cycle assessment (LCA)
are presented in section 4.1, and subsections 4.1.1 and 4.1.2 provide more details about
the stages, simplifying, and limitations of the process. The first step of this study is to
understand the most important stages and components in laptops’ and tablets’ life cycles,
in terms of CO2e emissions and material consumption. In this step, a systematic literature
review (SLR) of already existing LCA articles is conducted, as it is often an efficient way
to start LCA by utilizing data that has been already collected in previous studies
(Baumann & Tillman 2004, 94). SLR is often used to support other research measures
(Salminen 2011, 9–10), and it offers a good basis for the later steps of this study. Thus,
the aim of the SLR step is to provide answers to the RQ1 and to guide in the creation of
the devices’ flowcharts in different end-of-life treatment options (see subsection 5.1.1).
SLR as a research measure is presented in section 4.2, and section 4.3 considers the actual
screening process, in which the inclusion and exclusion criteria will be defined, and the
selected search terms and database will be presented. At the end of the section the actual
literature search is also conducted, but the analysis will be presented in chapter 5.
The second step of the sLCA is to assess the differences in the life cycle stages and their
impacts in the context of the ownership-based procurement model and service-based
procurement model. The conduction of this step relies on expert interviews, in which the
representatives of the case specific companies are interviewed about the procedures that
their companies use at the end of the devices’ life cycles. One of the case companies
represent a business model, in which the customer owns the devices, and the other case
company represents service-based business model, in which the customer procures the
devices as a service. The interview questions are formed based on the findings of the SLR,
and the results of the expert interviews put the information that is obtained by the SLR,
into the context of the City of Helsinki’s procurement choices that are under
consideration. Section 4.4 will provide details about the expert interviews as a scientific
method. The companies, who’s representatives are being interviewed, will be presented
in section 4.5. The aim of the interviews is to provide information about the devices’ life
18
cycles in the different procurement contexts. Based on this information, it is possible to
answer the RQ2.
4.1 Life cycle assessment
Life cycle assessment (LCA) is a method that is used to track the product’s or service’s
environmental impacts during its whole life cycle, for example, from raw material
extraction to disposal phase (Baumann & Tillman 2004, 19). This measure can be used to
support the decision-making process, when the operator is considering between different
alternative operating models (Baumann & Tillman 2004, 40; Kjaer, Pigosso, McAloone
& Birkved 2018, 666–667). LCA principles have been assembled as ISO 14040 standard
series, and the most important standards for working with LCA are undoubtedly the ISO
14040 and ISO 14044 standards (Beemsterboer, Baumann & Wallbaum 2020, 2160).
These standards offer a terminologically and methodologically systematic review for the
implementation of LCA, by focusing on principles and main features of the LCA, and the
requirements and guidelines for conducting it (ISO 14040, 2006; ISO 14044 2006).
Environmental impacts are difficult to estimate on a very detailed level, and transparent
reporting of research phases is important, in order for the reader to understand the possible
complexities and shortcuts that have been taken in the process (Baumann & Tillman 2004,
21, 207). Obtaining all the data that is required for documentation can also be difficult,
and the use of assumptions to fill data gaps is not unusual. Informing the reader about
missing information is also important, so that the process remains transparent (Baumann
& Tillman 2004, 228.)
Using a full LCA is not always a possible or suitable methodological solution, due to the
lack of time or resources, and LCA has been simplified into many different versions
(Pesonen & Horn 2013, 1781–1782). Streamlined LCA is a concept that refers to
qualitative or semi-quantitative form of LCA, or a quantitative LCA that is based on
already existing data. The streamlined version is particularly suitable for supporting
decision-making, and for detecting the aspects that need to be optimized in terms of
organizations’ sustainability and life cycle perspectives. Also, it should be highlighted
that the researchers’ finding that have been obtained by these measures, have led to actual
19
changes in the ways that the studied organizations have been operating. (Pesonen & Horn
2013, 1781–1783.)
4.1.1 Stages of LCA In this study, the ISO 14040 (2006) and ISO 14044 (2006) standards are used as
guidelines for conducting the LCA, as they offer a reliable and high-quality framework
for the work. According to these standards, the LCA process can be divided into four
different phases, which are: 1. the goal and scope definition phase, 2. the inventory
analysis phase, 3. the impact assessment phase, and 4. interpretation phase (ISO 14040
2006, 8–9; ISO 14044 2006, 8–9).
Considering the subject and the intended use for the study is important, when defining
the goal and scope of the study. In this first phase, the functions of the compared systems,
the limitations of the study, the assumptions taken, the functional unit, and the data re-
quirements are defined. The data is collected in the life cycle inventory (LCI) analysis
phase. Relevant objects for data gathering are the inputs, waste, and emissions that are
related to the products or services under consideration. In the third step, the life cycle
impact assessment (LCIA), the aim is to assess the potential environmental impacts, based
on the results of LCI. The limitation of LCIA is that it only focuses on the environmental
aspects that are reviewed and it cannot provide information about all the environmental
aspects that are related to the product or service. There also is not a generally accepted
method for accurately connecting the LCI data into potential environmental impacts. The
last phase of the LCA is interpretation, and in this phase the conclusions and recommen-
dations are made. If the LCA is conducted for a third party and LCIA is included, it is
important to inform the reader about the data quality, selection process of impact catego-
ries, and other relevant aspects that might impact the quality of the assessment. (ISO
14040 2006, 30–41.)
4.1.2 LCA in the context of this study The public sector is often assumed to be a pioneer in sustainable procurements, and LCA
is a suitable environmental tool for supporting this goal (Baumann & Tillman 2004, 293),
which is why it is chosen as a methodological approach for providing answers to the
research questions. The LCA being conducted in this study is a streamlined version of the

20
LCA. The reason for selecting this approach is the shortage of time and data for
conducting a full scale LCA of the case companies. Pesonen & Horn (2013, 1781) for
example state that sLCA is a faster assessment tool than full LCA and provides results
that are easier to understand by the stakeholders.
The sLCA in this study is simplified in terms of excluding the assessment of the impacts
of life cycle stages that are similar in both procurement models. According to ISO 14044
(2006, 24–25), it is important to also present the excluded stages when such approach is
taken and articulate why they can be left out of the review. As the aim of this thesis is to
review the differences of the impacts in different procurement models, it is sensible to
only focus on the stages that differ. The excluded stages are presented for the reader in
the devices’ flowcharts (see subsection 5.1.1). Another simplifying strategy that is taken
in this sLCA, is to include only those impact categories, that are considered in chapter 2
as the most significant ones in the case of the devices in question. These categories are
CO2e emissions and material consumption. However, it is worth highlighting that by
focusing only on specific impact categories, the ability to predict the total environmental
impacts suffers. (Beemsterboer et al. 2020, 2157–2158; Baumann & Tillman 2004, 25.).
An important step of the LCA study is to define the functional unit, to which the LCIA is
related, as it determines what is being studied and ensures that all analyzes are relative to
a similar unit. (ISO 14040 2006, 22–23.) The functional unit in this study is ”one year of
access to the device”. Although it can be argued that reused devices are not functionally
equivalent to new ones, similar functional unit was taken in a resembling study by André
et al. (2019), which is included into the SLR. In this study, André et al. (2019, 270) argue
that due to the devices’ as-new condition and the subjective nature of the functionality,
the devices’ can be considered functionally equivalent even after the first life cycle.
The proceeding of this LCA is conducted by following the stages that are presented in the
ISO 14040 (2006) standard, but in an order that fits better to the structure of a thesis work
(see appendix 1). The first step is to define the goal and scope of the study, which are
defined in the introduction chapter. The limitations of the study and the assumptions taken
are presented later in section 6.1, the functional unit is defined in this subsection, and the
functions of the compared systems are presented in section 5.2. The second stage is the
LCI, in which the data is collected. For this stage, systematic literature review (SLR) is
21
used for gathering data of the environmentally most impactful components and stages of
life cycle of the devices in question. In the case of ICT, it can be difficult to collect all the
needed data, as the products are very complex. However, during the last two decades it
has become possible to utilize already available databases or already existing LCA
studies. (Beemsterboer et al. 2020, 2158–2159; Baumann & Tillman 2004, 94.)
After the data has been collected, it is used to support the creation of the interview frames
(appendix 4 and 5) for the expert interviews, which provide data of the context related
differences in different procurement models. Analyzing the differences becomes more
efficient, if the most impactful stages of the life cycle can be known in advance
(Beemsterboer et al. 2020, 2157). The third stage is the LCIA, in which the potential
environmental impacts are assessed. This assessment is carried out in section 5.3. The last
stage is the interpretation phase, in which the conclusions and recommendations are
made. This stage is presented in subsection 5.3.3.
4.2 Systematic literature review as a research method
The general characterization of a literature review is that it is a research method intended
to gather results from other scientific sources in order to create new results. The process
needs to follow precise rules and guidelines, as otherwise it might lack systematicity and
reproducibility. (Salminen 2011, 1, 5.) The aim is to collect and retrieve the available
evidence of a specific topic, and to obtain a comprehensive understanding of what is
known about it. Comparing and reviewing the results of an individual study with several
studies on the same topic can also be seen to add value to an individual piece of research,
as it is seen in a broader context. (Aveyard 2014, XV.) Literature review is not a lightly
discussed bibliography, but the quality is measured by the depth, precision, consistency,
and the effectiveness of the analysis and synthesis. (Hart 1998, 1.)
There are several reasons for selecting a literature review as a research method. It can be
used, for example, in cases where the aim is to build a comprehensive picture of a
particular issue or identify problems that should be addressed (Salmela 2011, 3).
Literature review is a hypernym for several measures, and it is often distributed into three
different subcategories: descriptive literature review, meta-analysis, and systematic

22
literature review (SLR). The aim of the SLR measure is to find, pick out, evaluate, and
combine all relevant research that is related to the research question (Bettany-Saltikov
2012, 5). Along with the meta-analysis, the SLR is the most detailed form of literature
review, as the process follows a strict protocol and a search strategy (Aveyard 2014, 10–
11). In addition, for being used as a research method on its own, often it is also used as a
measure to support other study methods and to build an introduction for a study. Due to
the rapid growth of the amount of information available, using SLR is practical solution
in case there is a need to collect information that supports decision-making process.
(Salminen 2011, 9–10.)
As the aim of this study is to support the City of Helsinki’s decision-making in selecting
an environmentally sustainable ICT procurement measure, using systematic literature
review is a relevant method for mapping the products’ life cycles and life cycle impacts.
It allows an extensive assessing of the existing literature that is relevant for the topic and
provides a basis for conducting the expert interviews. Also, due to the exponential growth
of technological development (e.g. Mollick 2006; Brynjolfsson and McAfee 2014; Lange,
Pohl & Santarius 2020), it is well reasoned to assume that the data collection should
proceed systematically, as the studies being utilized must represent current state of affairs.
It is also generally considered that if literature review is being used as a research method
in a thesis or dissertation, the approach should be systematic (Aveyard 2014, XVI). Lastly,
it is possible to save a lot of effort when conducting a LCA, if the data collection can be
implemented by relying on studies that have already been carried out (Baumann &
Tillman 2004, 98).
The systematic protocol of conducting SLR can be divided into separate steps. The so-
called Fink’s (2005, 3–5) model is presented in the work by Salminen (2014, 10–11), and
in this model the process of conducting a SLR is divided into seven distinct steps. Another
comparatively similar modeling is presented by Bettany-Saltikov (2012), but in this
model the steps are arranged in a slightly different manner. The steps presented in this
paper are formed based on these two comparatively similar models, and they are
presented in figure 1. Due to the slight differences in order of the steps presented by Fink
(2005) and Bettany-Saltikov (2012), the steps produced by the combination of these
models formed a six-step procedure for SLR conduction.

23
The first step is to choose a research topic and to form a research question. The question
should be answerable and focused, and it should be justified why it is worth investigating.
The second step is to form a study plan and to introduce the background for the study.
Forming a study plan minimizes the risk of bias, as the researcher should not change the
way they review the papers after seeing the results. Introducing the background, again,
outlines the context of the study and the reasons why investigating it is important. The
third phase is to choose the inclusion and exclusion criteria that will be used in the
screening. The criteria can concern for example the articles’ publishing year, language, or
content, and they should be transparently reported to allow the study’s reproducibility.
The fourth step is to select the databases and the search terms. By selecting the proper
databases and search terms, the material being examined is more likely to answer the
research question. Usually, it is useful to utilize multiple databases, and the keywords
being used can be either single words or phrases.
The fifth step is to conduct the literature search. The aim is to examine the scientific
quality of the articles and their suitability for review and filter out any irrelevant articles.
The sixth step is to conduct the actual study and to analyze the selected papers’ content,
which is usually the most challenging stage of SLR. The aim is to gather all the
information from the articles that is relevant in answering the research question. For the
results to be valid and the process to be systematic, it is helpful to create a data extraction
form that describes the article-specific results (see appendix 2 and 3). Lastly, the seventh
step is to synthesize and summarize the results that arise from the selected papers. Current
information and demonstration of research needs are being reported, and the similarities
and differences in data are being examined. These different steps are portrayed in figure
1 (Fink 2005, 3–5; Salminen 2014, 10–11; Bettany-Saltikov 2012.)

24
Figure 1. The steps of conducting a SLR (Fink 2005, 3–5; Salminen 2014, 10–11;
Bettany-Saltikov 2012)
By this paragraph, the first two steps have already been conducted. The remaining steps
are more focused on the actual screening process (Salminen 2014, 10), and the steps from
three to five will be presented in the next section. The last two steps will be presented in
chapter 5. The data extraction forms will also be displayed in the appendices (appendix 2
and 3).
4.3 Screening
Strictly and transparently reported inclusion and exclusion criteria are a precondition for
a high-quality systematic literature review. Setting them allows one to target only to the
papers that are relevant to the research question and to exclude the irrelevant ones.
(Bettany-Saltikov 2012, 55.) It also ensures that the focus stays on answering the research
25
questions, and that the study does not start to stray too far from the original emphasis. As
the aim of this review is to map the laptops’ and tablets’ life cycle, and the environmental
impact on different stages of the cycle, the inclusion and exclusion criteria must also be
selected in a way that supports this matter.
One important criterion in this context is the publishing year. As ICT devices develop on
an accelerating speed (e.g. Mollick 2006; Brynjolfsson and McAfee 2014; Lange, Pohl
& Santarius 2020), it is important that the reviewed papers are published recently, as the
relevance of an ICT related paper can become obsolete quickly. In addition, financial
constraints limit the accessibility in a context of this thesis, which adds another criterion
of a free access to the resource. Material review is also limited to electronic databases
only, and only publications in English are included in the review in order to ensure a clear
understanding of the content. The last criterion for the inclusion is the methodological
approach that has been taken. As one goal of the SLR is to collect and combine
information from already implemented LCA studies, it is important that the articles that
are included in the SLR are methodologically equivalent. Thus, only those articles that
use LCA, or a LCA related methodological approach, are included into this review.
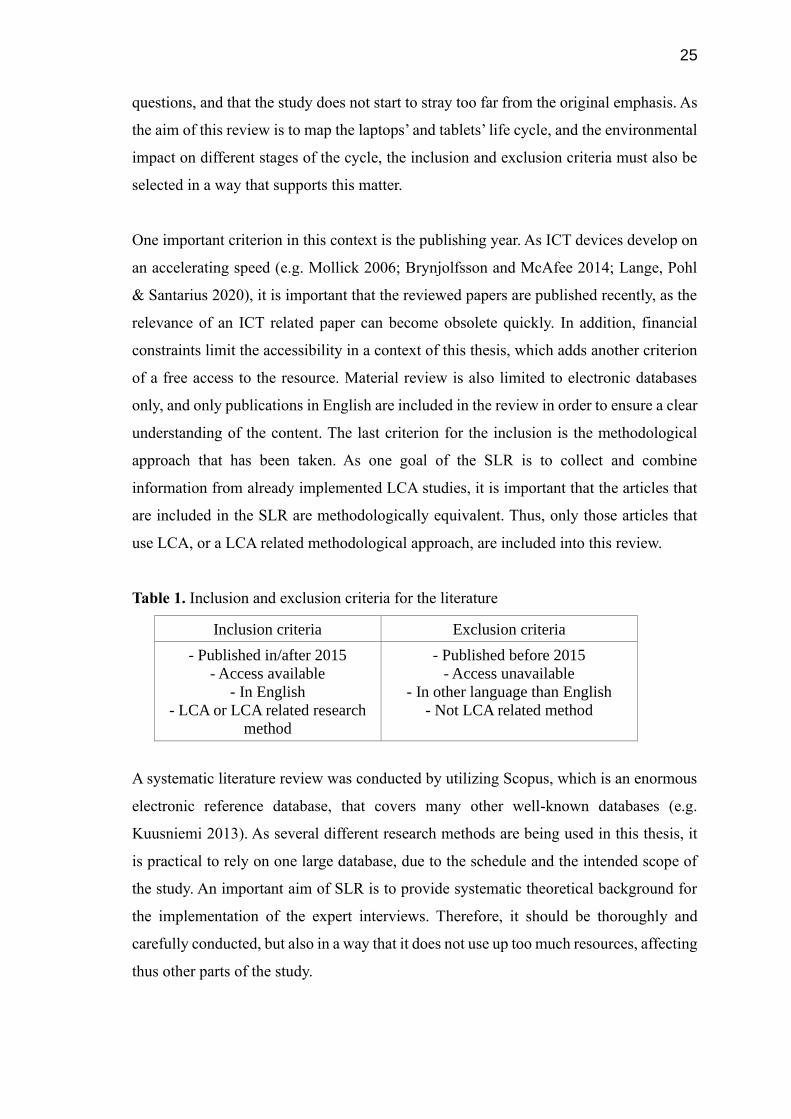
Table 1. Inclusion and exclusion criteria for the literature
Inclusion criteria Exclusion criteria
- Published in/after 2015
- Access available
- In English
- LCA or LCA related research
method
- Published before 2015
- Access unavailable
- In other language than English
- Not LCA related method
A systematic literature review was conducted by utilizing Scopus, which is an enormous
electronic reference database, that covers many other well-known databases (e.g.
Kuusniemi 2013). As several different research methods are being used in this thesis, it
is practical to rely on one large database, due to the schedule and the intended scope of
the study. An important aim of SLR is to provide systematic theoretical background for
the implementation of the expert interviews. Therefore, it should be thoroughly and
carefully conducted, but also in a way that it does not use up too much resources, affecting
thus other parts of the study.
26
Keywords for the literature search were selected based on their suitability for finding
articles on the life cycles of laptops and tablets, as well as finding out about the
environmental impacts that are caused during the life cycles. Potential synonyms for these
words were also examined by utilizing www.thesaurus.com -website. Both, literature
search from the Scopus database and synonym search from Thesaurus, were conducted
in October 19, 2020. As the goal of the SLR was to combine already published LCA
related studies, both “life cycle assessment” and “LCA” were selected as search terms,
since it is likely that these measures have been used in many relevant papers. Other LCA
related keywords that were used were “ISO 14040”, “life cycle impact assessment”, and
“LCIA”.
Different keywords were selected to target the devices under consideration. The term
“information communication technology” (ICT) was considered to give important search
results that are related to laptops and tablets, and for that reason both “information
communication technology” and “ICT” were selected as keywords. Another keyword
that was added was “laptop”. Thesaurus provided few synonyms for laptop, such as
“desktop computer” and “workstation”, which were ranked as the most relevant ones
according to the website. However, test searches revealed that the use of these search
terms generated results that did not refer to laptops, which is why they were not included
in the actual search. According to Thesaurus, the synonyms for the word “tablet” were,
for example, “pad” and “notebook”. However, neither of these terms were utilized in the
actual search, as the test search “LCA AND Pad” or “LCA AND Notebook” did not appear
to provide relevant search results on Scopus. All the used search terms are presented on
table 2.
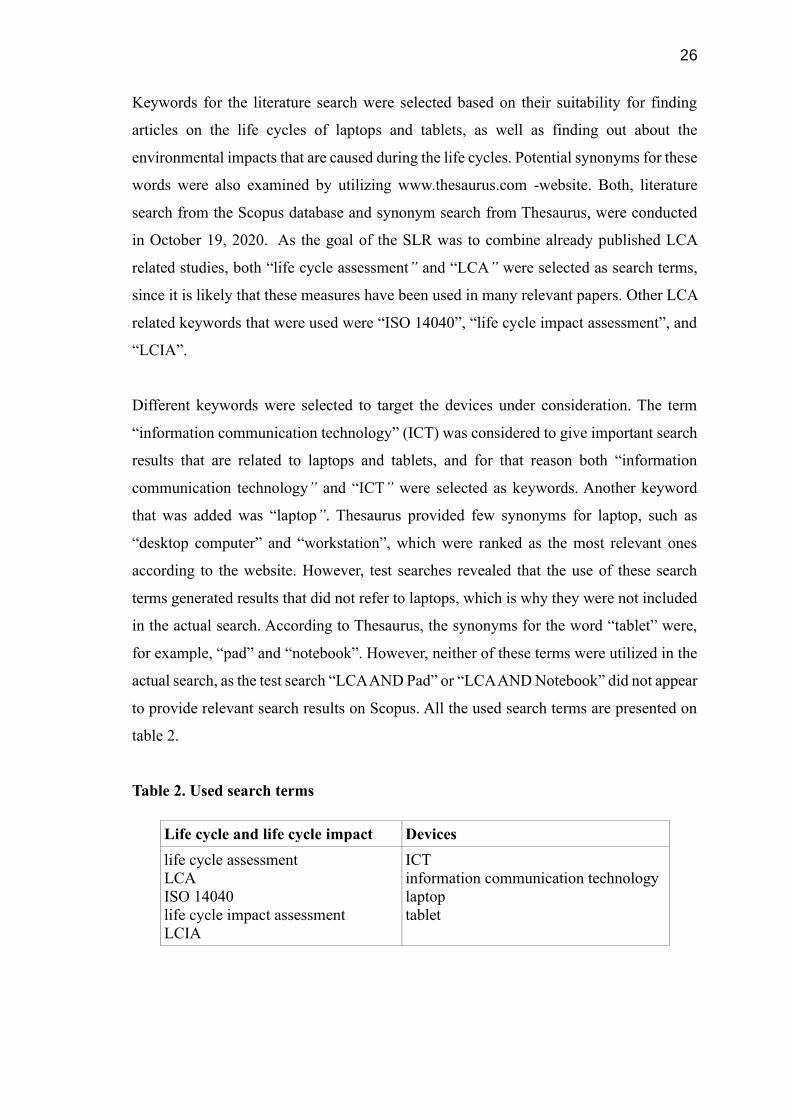
Table 2. Used search terms
Life cycle and life cycle impact Devices
life cycle assessment
LCA
ISO 14040
life cycle impact assessment
LCIA
ICT
information communication technology
laptop
tablet
27
Based on these search terms, the following search query was formed: (ICT or
“information communication technology” or laptop or tablet) AND (LCA or “life cycle
assessment” or LCIA or “life cycle impact assessment” or “ISO 14040”). The search was
targeted to the articles’ title, abstract and keywords. This search provided 207 results.
After this, the other inclusion criteria were added to the search. Limiting the searched
articles’ publishing year to 2015 onwards and language to English generated a new search
query: TITLE-ABS-KEY (( ict OR "information communication technology" OR
laptop OR tablet ) AND ( lca OR "life cycle assessment" OR lcia OR "life cycle
impact assessment" OR "ISO 14040" ) ) AND ( LIMIT-TO ( PUBYEAR , 2020 ) OR
LIMIT-TO ( PUBYEAR , 2019 ) OR LIMIT-TO ( PUBYEAR , 2018 ) OR LIMIT-
TO ( PUBYEAR , 2017 ) OR LIMIT-TO ( PUBYEAR , 2016 ) OR LIMIT-TO
( PUBYEAR , 2015 ) ) AND ( LIMIT-TO ( LANGUAGE , "English" )).
This query provided 82 results, which were first screened based on the title and the
abstract. After selecting the topic relevant articles, 32 articles were chosen for further
screening. Of these 32 articles 11 were inaccessible freely, which further limited the
sample size to 21 articles. Lastly each of these articles were carefully read, and 11 articles
were selected to form the research material. The selection was based on the relevance of
the used methods and the relevance of the targeted product groups. Some of the articles
that were selected made references to other articles in terms of information that was
considered valid for this study. The articles that were referred to were also included as
secondary references. The data extraction form, which also presents the secondary
references’ primary articles can be found as an appendix 2. When secondary articles are
included, a total amount of 16 articles were included into the SLR analysis. The results
of the SLR are presented and analyzed in section 5.1. The articles that were included as a
research material, and the key findings are also presented as an appendix 2 by the end of
this thesis.
4.4 Expert interviews
Expert interviews are the second method that is used in this study. The results that are
obtained from the SLR can be used in constructing the interview guides, and
correspondingly, through the interviews it is possible to link the SLR’s results into the

28
context of the companies under consideration. The idea of the expert interviews is to
collect data about the devices life cycle stages in a given context.
Expert interviews are an efficient and concentrated measure for data collection (Bogner,
Littig & Menz 2009, 2), and as for example in this section the aim is to understand the
processes of individual companies, it provides an easy access to the case specific
information. If the experts have practical insider knowledge, the measure can be
considered as extremely efficient (Bogner et al. 2009, 3). Expert interviews are often
carried out as semi-structured interviews (Alastalo, Vaittinen & Åkerman 2017), and this
approach is also taken in this study. In semi-structured interviews, the addressed topics
are pre-determined, but the interviewees are given a lot of freedom in the wording and
length of the answers, and they are encouraged to tell things in their own words (Packer
2011, 43).
Expert interviews also contain some special features that, compared to other forms of
interviews, must be given an extra thought. The importance of groundwork is emphasized
for many reasons. If enough background information has not been collected, it is
challenging to bring up problems from the data, as the answers might be given on a very
general level (Alastalo & Åkerman 2010). Another challenge that might occur, is that the
interviewee discusses the organization they represent on a PR (public relations) manner
and focuses only on the positive aspects of the organization. However, thorough
preparation allows the interviewer to get deeper into the matters. (Alastalo et al. 2017.)
In this study, two ICT supplier companies were selected for the interviews. One of the
companies represented a procurement model that is based on equipment ownership, and
the other company represented a procurement model that is argued to be based on the
principles of circular economy. Both companies are Finnish owned. A different amount
of information was found in advance for them, and for this reason the interview guides
could also be formed slightly differently for each company. The articles that were
included in the SLR were used in designing the interview guides, and in the case of the
service-based company, the company’s sustainability report was also used in this
designing process. As answering some of the interview questions required information
that is not directly related to the interviewees’ positions, the interview guides were sent
in advance, so that the interviewees could seek the information if necessary.
29
Conducting the interviews face to face, and possibly visiting on site would have been
convenient, but due to the ongoing COVID-19 pandemic, the interviews were carried out
through Microsoft Teams, and recorded into Microsoft Stream. The recordings were
stored in the interviewer's password-protected profile, and later on they were transcribed
with the precision that was necessary for describing the companies’ device-specific
practices. The interviews were carried out in Finnish, but in this study their content is
referred to in English, while still trying to preserve the original content as well as possible.
The interview guides, translated into English, can be found at the end of the thesis as
appendices (appendix 4 and 5).
4.5 Selection of interviewees and ethical considerations
In both interviews, the main focus was to study the end of the devices’ life cycles. Until
the point when the devices are delivered to the customer, the devices’ life cycles can be
considered to be identical, as in both procurement models the production and assembly
are conducted by the manufacturer (figures 2 and 3). According to the SLR results (see
section 5.1), the manufacturing phase is the most important stage of the life cycle in terms
of environmental impacts, and an efficient way to decrease the environmental impact of
small electronic devices, is to reuse or recycle them (Clément, Jacquemotte & Hilty
2020). The results of the SLR also highlighted the devices’ most important components
in terms of environmental impacts, and thus the focus of the interview could be directed
especially into the treatments of those components.
Company 1 was selected for the study to represent a procurement model, that is based on
the customer’s ownership of the devices. This company is referred to as C1. The
representative of the company was contacted by e-mail and the time for the interview was
arranged through phone. The company was interviewed about its practices in general,
about its possible reuse practices, and about the recycling measures for the most important
materials. The representative of this company is referred to as R1 (Representative 1).
Company 2 was selected into the study to represent a service-based procurement model,
which provides devices through leasing. This company is referred to as C2. In the case of

30
this company, it was challenging to define a suitable person for contacting, so the
interview was arranged by calling into the company’s general phone number. We agreed
on a group interview with two experts, who are suitable for the interview due to their job
description. In this study they are referred to as R2 (Representative 2) and R3
(Representative 3). The company's sustainability report 2019 provided valuable
information, which could be used for modifying the interview guide to be more precise.
However, the main themes were identical to those of the other interview.
All the representatives were informed about the ethical principles of the research before
the interviews. They were informed about their right to leave any question unanswered
and right to withdraw from the interview any time. It was also clarified that the interview
would be recorded to Microsoft Stream for transcription, where it would be stored pass-
word protected till the research is ready. The interviewees were also informed that the
recordings would be deleted afterwards and that they, and the companies that they repre-
sent, would be anonymized. Finally, they were informed that the City of Helsinki will
utilize the results to support their procurements and that the representatives will have a
right to read the research once it is ready.

31
5 Analysis and results
In this chapter the analysis processes and achieved results will be presented. These stages
are presented individually for each used method. In section 5.1, the results of the SLR are
presented and the aim of this section is to answer to the first research question. In section
5.2, again, the interview results are presented, and the general practices and end-of-life
treatment operations of the case companies are reviewed. Lastly, in section 5.3 the
previous results are combined in order to describe the case companies’ functional unit
specific environmental impacts in terms of CO2e emissions and material impacts. Finally,
the differences between the case companies in terms of these impacts are assessed. The
goal of this section is to answer to the second research question.
5.1 Results of the SLR
In this chapter the results that emerged from the SLR are reviewed. A systematic screening
process was targeted to answer RQ1: “What are the most important stages and
components in laptops’ and tablets’ life cycles, in terms of CO2e emissions and material
consumption?”. In subsection 5.1.1 the life cycle stages, and the most impactful
components of laptops and tablets are presented and visually demonstrated by creating
flowcharts of the devices and their end-of-life treatments. In subsection 5.1.2, the focus
is put on the environmental impacts of the phases of raw material extraction, production,
assembly and use. Subsection 5.1.3 focuses on the impacts of solution options for the
treatment at the end of the products’ life cycles, and finally subsections 5.1.4 and 5.1.5
describe the concrete impacts in terms of CO2e emissions and material consumption.
However, it is important to notice that ICT’s environmental impacts can be divided into
direct and indirect effects. Direct effects include the emissions and resource usage that
stem from production, use, and disposal. Indirect effects refer to the ICT-induced changes
in consumption and production patterns in other domains than ICT. (Bieser & Hilty 2018,
1.) In this analysis, the focus is only on the direct effects, as the assessment of indirect
effects is not possible within the scope of this study.
32
5.1.1 Life cycle stages and the most impactful components
Laptop and tablet production is based on resource and energy intensive processes (André
et al. 2019, 268; Kasulaitis, Babbitt, Kahhat, Williams & Ryen 2015, 2). As a result of
technological acceleration, along with other factors, such as manufacturers’ planned
obsolescence and predominating values and norms (Sabbaghi & Behdad 2017, 1), the
devices become prematurely obsolescent and are being underutilized by consumers
(André et al. 2019, 268). The growing markets of ICT devices cause a need to find more
sustainable production measures (Meyer & Katz 2015, 369), as the waste electrical and
electronic equipment (WEEE) are one the fastest growing forms of waste. WEEE can
cause many social and environmental hazards if not treated properly, but it also provides
enormous resource potential if utilized efficiently. (Van Eygen, De Meester, Tran &
Dewulf 2015, 53.) In order to understand better the environmental impacts of laptops and
tablets, it is important to form a comprehensive picture of the life cycle impacts, so that
the measures can be targeted to the environmentally most harmful phases and components
of the cycle. Several researchers also argue that there is an important gap at the studies
considering environmental impact of circular economy measures, due to the lack of real-
world commercial business-related case studies (André et al. 2019, 269).
The lack of transparent LCA studies for tablets is especially critical, and according to
Clément et al. (2020, 3), the only previous studies available are from Teehan and
Kandlikar (2013) and Hischier, Achachlouei & Hilty (2014A). In the approach that is
taken by Teehan and Kandlikar (2013), the component life cycles are divided into life
cycle phases, after which the most significant sources of impact were considered for these
stages. Lastly, they measured the impact of the components in terms of CO2 emissions
and electricity consumption. In their article, Clément et al. (2020, 2) take a similar
approach, but due to the lack of data, they could not observe the electricity consumption
in the use phase. A similar approach is also taken in this part of this study, as the already
formed formula offers a systematic procedure for analyzing the results of the SLR.
However, in this study the impacts will be directly reviewed as CO2e emissions instead of
assessing the electricity consumption. The data is collected from already conducted LCA
studies, and in these studies the material impacts and the CO2e emissions for different
stages and components are readily available. However, it should be noted that the impacts

33
of electricity consumption are directly linked to the burning of fossil fuels (see subsection
2.2.1).
The first step of the SLR is to identify the life cycle phases of the devices’ components
and the significance of their impact. In their article André et al. (2019, 271) present a
flowchart for the life cycle of a new laptop. In this flowchart the life cycle is divided into
phases of raw material extraction and production, assembly, use, and disposal. Disposal
phase is divided into WEEE recycling and landfilling. The life cycle review by André et
al. (2019) is based on dividing the device into several components, and the significance
of their impacts is separately considered. The separate components that were taken into
consideration were printed circuit boards (PCBs), casing, liquid-crystal display (LCD)
screen’s light-emitting diode (LED) backlights, LCD module, and cables. Based on an
extensive literature review, the impacts of these components were considered to represent
the majority and diversity of laptop’s environmental impacts. For some of the components
the greenhouse gas emissions from production stage are significant, and for some of them
the impact is related to the material composition. (André et al. 2019, 269–270.)
Clément et al. (2020, 3) also conclude that in the case of tablets the PCBs, displays, and
integrated circuits (ICs) are the most significant greenhouse gas emission sources,
followed by the casing and the battery. The difference between the two studies seems to
be that in the case of tablets, the battery has a relatively higher impact significance than
in the case of the laptops, as they were excluded from the review by André et al. (2019).
However, it is worth noticing that there is a lot of variance in ICT related LCA studies
considering the component specific impacts. This can occur, for example, due to the
modelling uncertainties, such as limited access to representative data, uncertainties
caused by technological development, or any other factors that force the researchers to
rely on estimations (André et al. 2019, 269).
Other studies that have been included into this SLR confirm the significance of some of
these components. According to Alcaraz et al. (2018, 822) displays, ICs, and printed
wiring boards (PWBs) account for large shares of the tablets’ CO2e impact, ICs being
especially impactful. Kasulaitis et al. (2015, 7) again highlight the significance of
motherboards, which consists of a large share of the laptop’s ICs and semiconductor
materials. Despite the small differences in the stand of the included studies, the most

34
impactful components in the case of laptops and tablets seem to be relatively similar,
those being PCBs/PWBs, ICs, display, and casing.
In addition to mapping out the devices’ most impactful components, it is also important
to map out the devices’ life cycle stages and their significance for the total life cycle
impact. In their study, André et al. (2019, 271) present flowcharts of scenarios where the
laptop is either recycled or reused. The life cycle stages in both models consist raw
material extraction and production, assembly, use, and end-of-life treatments. If the
devices are not reused, the end-of-life treatment consists of alternative terminals for the
components, which are landfill or WEEE recycling. If the device is reused, preparation
for reuse and reuse are extra stages before these terminals. (André et al. 2019, 271.) The
articles that were included in the SLR did not provide a similar flowchart for tablets.
However, the article by Andrae & Vaija (2017, 6) present the most significant stages of a
tablet’s life cycle, which are part production, use, and end-of-life treatments. Clément et
al. (2020, 3–4) add transportation as another stage for tablet’s life cycle, yet they state
that the production and use phases represent over 90% of the devices’ total impact. There
is still no reason to assume that the tablet’s life cycle would not contain assembly phase,
and it can be concluded that the life cycle stages of laptops and tablets are identical. The
most impactful components and the life cycle phases in different end-of-life treatments
are presented in figures 2 and 3. Figure 2 represents the operation model, in which the
devices are recycled, and figure 3 represents a model, in which the devices are also reused.
Both figures are applied versions of the flowcharts presented by André et al. (2019, 271),
and they are modified to represent both devices in question.

35
Figure 2. Flowchart of laptop’s/tablet’s life cycle if only recycled (applied from André et
al. 2019, 271)
Figure 3. Flowchart of laptop’s/tablet’s life cycle if reused (applied from André et al.
2019, 271)
36
5.1.2 Raw material extraction, production, assembly, and use
According to Alcaraz et al. (2018, 819), the materials and manufacturing phase drive the
environmental impacts of the tablets’ life cycle, ICs and PWBs being especially impactful
in this stage of the product’s life cycle. Alcaraz et al. (2018, 822) indicate that the ICs
account for over 15% of the total impacts in the material and manufacturing stages. The
main contributors in the case of IC manufacturing are the water and energy that are needed
in production. However, the amount of available data is limited and for this reason there
are uncertainties and differing results related to the impacts of IC production. The largest
IC manufacturers are located in South-Korea and Taiwan, and these countries rely on
energy production sources with high GHG emissions. The electricity mix has also an
important role for the impacts in the case of PCBs. (Clément et al. 2020, 3–8.) Fossil
carbon dioxide emissions are the most important contributors to climate change, and the
ICs that are contained in the PCBs are responsible for approximately a third of all the
laptop’s climate change impacts (André et al. 2019, 273). PCBs also contain a lot of
precious metals, and the concentration can be over ten times higher compared to the
respective metal ores (Van Eygen et al. 2015, 53). Climate change, resource use, and
human toxicity are considered as the most important impact categories of the devices in
question. (André et al. 2019, 272). The human toxicity can be effectively mitigated by
proper end-of-life treatment processes (Clément et al. 2020, 3). Yet, due to the scope of
this study, the impacts are only considered in the impact categories of climate change and
material resource consumption.
Of the four different components that were selected for this review, displays represent a
group of which there was the least amount of information available. According to Andrae
and Vaija (2014), the GHG emissions in LCD production are mainly linked to the
electricity production (Clement et al. 2020, 4). For the casing again, the climate change
impacts are mainly linked to the production of the magnesium alloy, which forms a
relatively large mass of the component (André et al. 2019, 272; Meyer & Katz 2015, 61).
Casing can be made of different materials, and Meyer and Katz (2015) have compared
the environmental impacts of polycarbonate/acrylonitrile butadiene styrene (PC-ABS)
plastic and aluminium casings. For both materials, the impacts in different categories can
be decreased by increasing the share of post-consumer recycled (PCR) materials (Meyer
& Katz 2015, 381). However, a large share of the PC-ABS plastics is still landfilled rather

37
than recycled, as it is challenging to separate different polymers of the waste stream.
Aluminium has a significantly higher recycling rate (see subsection 5.1.5). (Van Eygen et
al. 2015, 57–60.)
The broad scale of impact categories that were taken into consideration by Meyer and
Katz (2015, 375) were ozone depletion, global warming, smog, acidification,
eutrophication, carcinogenics, non-carcinogenics, respiratory effects, ecotoxicity, and
fossil fuel depletion. The preferability of aluminium versus PC-ABS use in casings
depends on the share of PCR in these materials. If the share of PCR in aluminium is as
low as reported in the econinvent database (32%), then PC-ABS causes lower impacts in
terms of smog formation, acidification, eutrophication, carcinogenics, non-carcinogenics,
respiratory effects, and ecotoxicity. If the PCR share of PC-ABS is 60%, it becomes a
better option also in terms of fossil fuel depletion. However, the share of PCR in
aluminium casings can also be increased, which would decrease the need for primary
metal extraction. (Meyer & Katz 2015, 379–381.)
The impacts of the assembly phase were not comprehensively considered in the articles
that were selected for this review. Hischier et al. (2014B, 8) argue that the impacts are
very marginal compared to the more impactful stages. However, according to André et al.
(2019, 274), in the case of laptops, the impacts are to certain extent significant in terms
of climate change (see table 3). The arrows in figures 2 and 3 represent the transportation
processes, which are also presented very briefly in the literature. However, according to
André et al. (2019, 274) the impacts are very minimal, even when compared to assembly.
In addition to raw material extraction and production, use is another highly impactful
phase of the life cycle and together they are undoubtedly the most contributing phases.
Different results show that approximately 85–90% of the total impacts are caused by the
manufacturing and use phases. The most important factor for the variation in use phase is
the energy mix being used and this applies also for the production phase. Other relevant
variables that effect the impacts of the use phase are device’s lifetime, charger efficiency,
duration of the battery’s lifetime, and charger’s plugged-in time. (Alcaraz et al. 2018,
822–823; Clément et al. 2020, 1–2.) However, in the case of small electronic devices,
such as laptops and tablets, the production phase is more dominant than the use phase in
terms of environmental impacts (Boldoczki, Thorenz & Tuma 2020, 1).

38
5.1.3 End-of-life stages The end-of-life treatments options are reusing the device, recycling it, or disposing it to
the landfill (e.g. André et al. 2019; Boldoczki et al. 2020). These alternative treatments
are presented in figures 2 and 3. The most preferable option is usually considered to be
reusing the device, because the materials maintain the highest value in this solution.
However, this is not the case for all electronic equipment. For some devices, the main
environmental impacts stem from the high energy consumption that is related to the use
of the product. Therefore, in this case replacing the device with new and more energy
efficient version can actually be a more sustainable option than reusing it. (Boldoczki et
al. 2020, 1.) The preferable option depends on the device in question. The worst-case
option, however, is disposal to landfill (Meyer & Katz 2015, 373), because in this option
the value of the materials is wasted. Compared to landfilling, recycling of a laptop saves
approximately 87% of natural resources (Van Eygen et al. 2015, 53, 62). In North Europe,
around half of the laptops are being recycled, but there are no reliable estimates available
about the other pathways (Buchert et al. 2012).
In the case of small electronic devices, such as laptops and tablets, production is
environmentally a more impactful phase than the use phase. As a result, for these devices
reusing is a better alternative than recycling in various impact categories, such as global
warming, mineral resource scarcity, and terrestrial ecotoxicity. (Boldoczki et al. 2020, 1–
2.) The benefits of using second-hand laptops, however, depend on the length of use
extension and reuse efficiency. A typical use extension is approximately 2–3 years, and
the length of the first use is around 3–5 years. If the first use period is for example three
years, and the reuse period is four years, almost half of the production impacts of a laptop
can be reduced by the reuse activity. (André et al. 2019, 270, 273, 276.) However, the
used product may not be functionally equivalent to a new one, but this can be also seen
to some extent as a matter of user preferences, as a significant number of completely
working devices are disposed every year, because the owners consider them to be obsolete
(e.g. Raghavan 2010; André et al. 2019, 269).
The process of WEEE recycling is usually divided into three steps, which are collecting
and sorting, dismantling and mechanical separation, and end-processing. Dismantling and
separation is an important phase, as it defines the amounts of materials that end up in an
39
efficient end-of-life processing. Some components, such as PCBs, are directly sent for
end-processing, while some components, such as displays, are further separated to differ-
ent materials. In the last step of the recycling, the materials are turned into secondary raw
materials. The treatment for preparing the components for end-processing can be carried
out in different ways. PCBs, for example, are shredded and send into smelter, as well as
parts that are made of steel, aluminium, magnesium, or copper. Plastic polymers are also
separated and processed into pellets. (Van Eygen et al. 2015, 54–55, 57.) First the plastics
are shredded and put into a froth flotation process, in which the different plastics are
separated and finally they are formed into a PCR resin. The use of PCR plastic has sig-
nificant benefits over virgin materials in terms of environmental impacts. (Meyer & Katz
2015, 370, 373.) However, as the separation of plastics is relatively difficult (Van Eygen
et al. 2015, 60), it is currently not often economically viable to recycle them (Meyer &
Katz 2015, 373). In addition to the difficulties in plastic recycling, the low collection rate
of WEEE is another bottleneck for efficient ICT recycling. Lastly, the improved pre-
treatment of PCBs could decrease the share of precious metals that end up in the landfill.
(Van Eygen et al. 2015, 57, 60) The most significant benefits of efficient recycling are
related the impact categories of resource consumption and human toxicity (André et al.
2019, 269).
5.1.4 CO2e impacts per functional unit In this section, the functional unit specific CO2e impacts are considered in terms of
different life cycle stages and components. CO2e refers to carbon dioxide equivalent
emissions, which describe the total impacts of CO2 and other GHG emissions (Clément
et al. 2020, 1). The impacts of laptops are presented first, and the results are rather
extensively based on the article by André et al. (2019), which has the most similar
research design with this study (see appendix 2). The article does not present detailed
quantitative information about the CO2e impacts, but it contains a figure showing the
functional unit specific emissions approximately on an accuracy of one kilogram. The
functional unit for of this study is also one year of laptop use. The information of the
article is based on ecoinvent data, literature sources, and data that is provided by a
Swedish IT refurbishment company (André et al. 2019, 272). The figure by André et al.
(2019, 274) provides information about CO2e impacts of PCBs, display, casing, assembly,
40
transportation, end-of-life treatment, and the total CO2e impact of a laptop. The
magnitudes of the impacts are presented in tables 3 and 4.
In their article Hischier et al. (2014B, 8) provide information about the climate impacts
of laptop’s production, use, and end-of-life treatment phases. In terms of end-of-life
treatment, the results support those that are provided by André et al. (2019). Hischier et
al. (2014B) do not provide quantitative information either, but they present a figure of the
life cycle phase specific shares of non-renewable energy consumption and global
warming potential (GWP). The shares between these two categories are relatively
identical, and it can be assumed that the share of non-renewable energy consumption and
GWP also describe the relative shares of CO2e emissions, as the emissions are directly
related to the share of fossil-fuel based energy in the electricity mix (see subsection 2.2.1).
The product life cycle stage impacts are based on an assumption that the life cycle of a
laptop would be four years, and it would be used daily for two hours. The share of
production phase is approximately 65–70% and the share of use phase is approximately
30–35%. End-of-life treatment does not cause significant CO2e emissions. (Hischier et al.
2014B, 8.)
As the total CO2e impact of a laptop is approximately 54 kgCO2e per one functional unit
(André et al. 2019, 274), and the share of production for non-renewable energy
consumption and GWP is 65–70% (Hischier et al. 2014B, 8), the share of production
causes approximately 36.5 kgCO2e emissions in one functional unit. Again, as the share
of use is 30–35% in the same impact categories, the share of use causes approximately
17.5 kgCO2e emissions in one functional unit. Although the ICs contribute significantly
to the devices’ total environmental impacts, the articles that were included into this study
did not provide information about the share of the CO2e emissions of these components.
However, as mentioned in subsection 5.1.2, the ICs on the laptop’s PCBs are responsible
for approximately a third of the device’s total climate change impacts (André et al. 2019,
273). Therefore, an assumption is taken that the CO2e emissions of the ICs are 18 kgCO2e
per one functional unit.
As mentioned in subsection 5.1.1, there are only very few LCA studies available about
the impacts of tablets. Alcaraz et al. (2018, 823) state that there are also large brand
specific differences in terms of the impacts. For example, one of the devices that they
41
present in their study is a tablet device by Dell, for which the total emissions are 45
kgCO2e, and 45% of the emissions are caused by manufacturing, 15% by transportation,
and 40% by use. Again, other tablets that they examine are Apple devices, for which the
total emissions are 270 kgCO2e and 170 kgCO2e. The device which has an impact of 270
kgCO2e has larger screen size, but the significant differences can also be partly explained
by the discrepancies between different studies. In the case of these devices, 86% of the
emissions are caused by production, 3% by transportation, 10% by use, and 1% by
recycling. (Alcaraz et al. 2018, 823.)
For all of these devices, the order of the impact significance is the same, but there are
large differences on the percentage shares. Based on the results of Alcaraz et al. (2018,
823) the average percentage shares for the CO2e impacts of the reviewed tablets are 65.5%
for manufacturing, 9% for transportation, 25% for use, and 0.5% for recycling. The study
by Clément et al. (2020, 3) provides similar results for the share of manufacturing, stating
that the share is 68.4 ± 21.3% of the total impacts. While Alcaraz et al. (2018) compare a
relatively narrow selection of different devices, Clément et al. (2020, 5) compare the total
CO2e emissions of 30 different tablet models. There are also relatively broad differences
among these models, but the median emissions are approximately 120 kgCO2e. Due to
the broadness of the comparison by Clément et al. (2020), this amount is assumed to
represent the total emissions of tablet’s life cycle.
An average life cycle of a tablet is approximately three years (Clément et al. 2020, 3).
The CO2e emissions per functional unit are then acquired, when the 120 kgCO2e emissions
are divided by three. As the emissions per functional unit for a laptop are approximately
54 kgCO2e, the 40 kgCO2e impact per functional unit of tablets would support the
estimation by Hischier et al. (2014B, 13), according to which the share of non-renewable
energy consumption is approximately ¾ for tablets compared to the laptops. When the
total CO2e impact per functional unit is divided into the percentage shares of different life
cycle stages (Alcaraz et al. 2018, 823), the life cycle stage specific emissions can be
calculated for one functional unit. These shares are presented in the table 3.
Clément et al. (2020, 5) also present the CO2e emissions for the tablet’s components, but
as the model specific differences are relatively large, there are also differences in
component specific emissions. However, the device that represents the median emissions

42
of those 30 devices that were assessed by Clément et al. (2020), also represents relatively
accurately the typical emission shares of different components, when compared to the
other devices under consideration. Approximately 36 kgCO2e of these emissions are
caused by ICs, 30 kgCO2e by PCBs, 33 kgCO2e by display, and 18 kgCO2e by casing. The
functional unit specific shares are acquired when these amounts are divided by three.
According to Clément et al. (2020, 5), the assembly phase does not produce significant
amount of emissions. Yet, this stage is likely to cause certain amount of emissions, which
is why it was marked as not available in the table 3.
The estimated CO2e emissions for different life cycle stages and components are presented
below in the tables 3 and 4. Despite the variation between different studies and different
devices, it seems that when the impacts of different stages are summed up together, the
results correspond relatively well with the total emissions. Same applies when the impacts
of different components are summed up together. However, as some of the ICs are
mounted into PCBs/PWBs (André et al. 2019, 269), they should not be counted as sepa-
rate shares of emissions. The article specific differences are still visible. For example, in
the case of tablets the transportation and end-of-life treatment were assumed to cause
emissions (Clément et al. 2020, 5), while in the case of laptops it was estimated that these
stages do not cause emissions (André et al 2019, 274). However, these stages are not
emission-free stages, which is why instead of giving them a value of 0, the information
was marked as not available in the table 3.
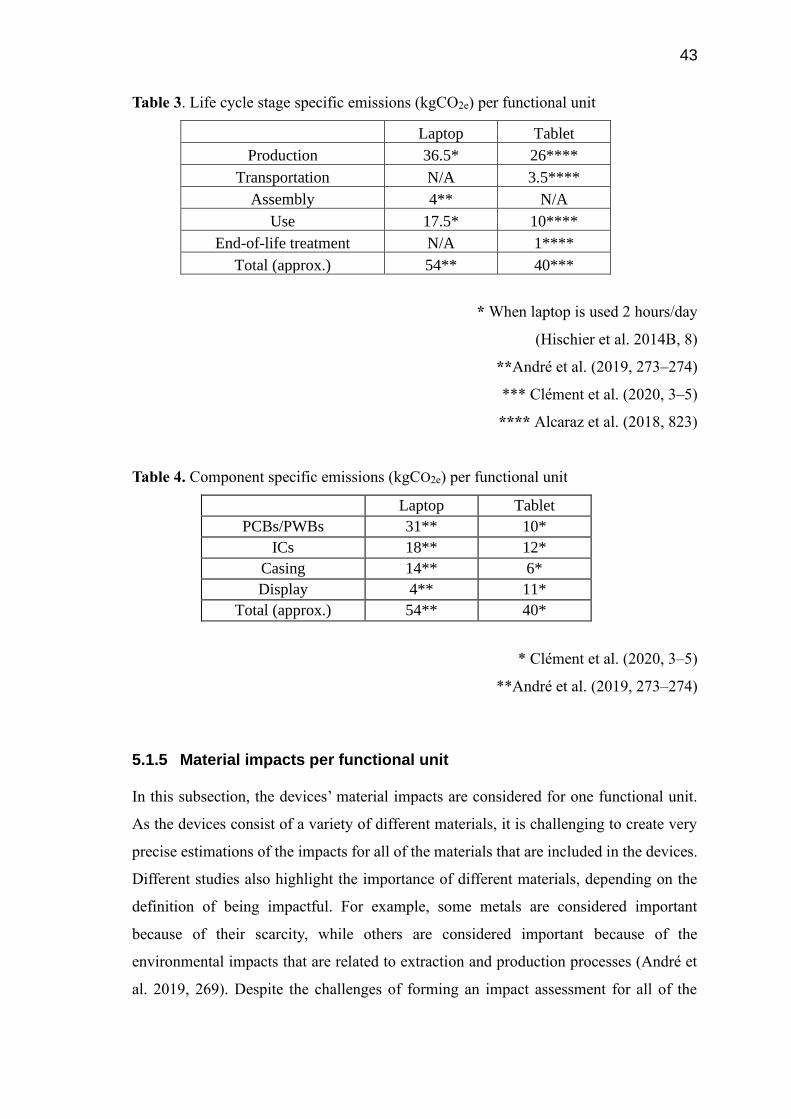
43
Table 3. Life cycle stage specific emissions (kgCO2e) per functional unit
Laptop Tablet
Production 36.5* 26****
Transportation N/A 3.5****
Assembly 4** N/A
Use 17.5* 10****
End-of-life treatment N/A 1****
Total (approx.) 54** 40***
* When laptop is used 2 hours/day
(Hischier et al. 2014B, 8)
**André et al. (2019, 273–274)
*** Clément et al. (2020, 3–5)
**** Alcaraz et al. (2018, 823)
Table 4. Component specific emissions (kgCO2e) per functional unit
Laptop Tablet
PCBs/PWBs 31** 10*
ICs 18** 12*
Casing 14** 6*
Display 4** 11*
Total (approx.) 54** 40*
* Clément et al. (2020, 3–5)
**André et al. (2019, 273–274)
5.1.5 Material impacts per functional unit
In this subsection, the devices’ material impacts are considered for one functional unit.
As the devices consist of a variety of different materials, it is challenging to create very
precise estimations of the impacts for all of the materials that are included in the devices.
Different studies also highlight the importance of different materials, depending on the
definition of being impactful. For example, some metals are considered important
because of their scarcity, while others are considered important because of the
environmental impacts that are related to extraction and production processes (André et
al. 2019, 269). Despite the challenges of forming an impact assessment for all of the

44
different materials, it is still possible to use certain materials, whose significance is
mentioned in several studies, for demonstrating the material savings that can be achieved
from implementing different end-of-life-treatment options.
Of those articles that were included into this review, a relatively smaller share focused on
material impacts compared to CO2e emissions, when considering the devices’ life cycle
impacts. The significance of recycling is higher for material consumption impact category
than for the CO2e emissions (André et al. 2019, 269). Reusing can even be a worse option
than recycling in terms of material impacts, because if reusing takes place in a country
that does not have an effective recycling system, the materials will go to waste after the
second life cycle. Compared to landfilling, laptop recycling saves approximately 87% of
the material resources. (Van Eygen et al. 2015, 55, 62.)
For this reason, it is important to also consider the role of recycling for the devices’
material impacts. As only a certain share of the materials is not efficiently treated,
mapping out the recycling rates will help in understanding the shares that are actually
wasted per one functional unit. In order to understand the impact of the recycling shares,
it is also important to review how large the device specific shares of different materials
are. The differences between the material composition of devices from different model
years are relatively low, but there are large differences depending on the size of the device.
For example, comparison by Kasulaitis et al. (2015, 5) demonstrates that the product
weight loss is less than 2% annually when comparing different model years, while the
dematerialization for HP’s smallest and largest laptop is approximately 30%. Kasulaitis
et al. (2015, 5) also point out that when comparing laptops from 1999 to those from 2007,
the relative material shares have remained rather similar, and the biggest change is a shift
from plastic casings to aluminium casings.
As mentioned in subsection 2.2.2, the largest share of the materials that are used in the
devices are metals, polymers, and glass. The most common metals are aluminium, copper,
and iron. In addition, the devices contain scarce metals, such as gold or platinum group
metals. However, there is a lack of information concerning scarce metals used in the tablet
devices (Clement et al. 2020, 3), so the present study only covers aluminium, copper and
plastics for tablets, whereas precious metals are additionally included in the analysis for
laptops. As mentioned in the previous paragraph, device’s size has a significant impact

45
on its material consumption. In this study the laptop’s material composition is studied by
first reviewing material composition of 1000 kg of disposed laptops, following the
procedure demonstrated by Van Eygen et al. (2015, 60). Then the material composition is
calculated for a single 14.1-inch laptop, that weights approximately 2.5 kg (Kasulaitis et
al. 2015, 5). In the case of tablets, again, the material composition is reviewed for a 10-
inch LCD tablet device, and the material shares are based on the results of Hischier et al.
(2014A, 29–30).
The material of the casing makes up the biggest share of a laptop’s mass, and aluminium
and plastics are some of the most commonly used casing materials (Van Eygen et al. 2015,
57). The material shares of a laptop and the recycling rates are based on the results of Van
Eygen et al. (2015, 60). However, it should be still noticed that the study focuses on the
recycling rates in Belgium in 2013, which is why it does not offer an exact estimation for
the context of this study. However, according to The Global E-Waste Statistics
Partnership (2021) tracking, the collection rates for e-waste in Belgium and Finland have
been relatively similar between the years 2015 to 2019. During this period the e-waste
recycling rate in Belgium has stayed in 55%, while for Finland the percentage has varied
from 57% to 61%.
In terms of tablets, the study by Hischier et al. (2014A, 29–30) only provides information
about the material specific recycling rates for aluminium, which is why the material
specific recycling rates that are provided by Van Eygen et al. (2015, 60) are also used in
assessing the tablets’ material impacts. Hischier et al. (2014A, 29–30) estimate that
approximately 51% of tablet’s total weight can be directly recycled and approximately
15% of the remaining aluminium can be taken into material recycling. Thus, it is
estimated that the recycling rate for aluminium in the case of tablets is approximately
58.4%.
Material specific shares of weight, recycling rates, and the shares of materials that are
wasted are presented in the table 5 for a 14.1-inch laptop and a 10-inch LCD tablet. In
addition, functional unit specific shares of wasted material are presented by dividing the
amounts of wasted materials by the average length of the device’s lifespan. A typical life
cycle for a laptop is approximately 4 years (André et al. 2019, 270; Hischier et al. 2014B,
8) and the average life cycle for a tablet is estimated to be 3 years (Clément et al. 2020,

46
3). Because the laptop’s device specific material shares are calculated from the results of
Van Eygen et al. (2015,60), the shares are presented in percentages and grams. However,
in the case of tablets the material shares are only presented in grams, since Hischier et al.
(2014A, 29–30) provide information about the device specific shares.
Table 5. Laptop’s and tablet’s material composition, recycling rates and share of materials
that are wasted in recycling
Materials Laptop (2.5kg) Tablet
Aluminium
Share of weight (%) 8.45* N/A
Weight in one device (g) 211 135**
Recycling rate (%) 75* 58.4**
Wasted material/one device (g) 53 57
Wasted material/functional unit (g) 13.25 19
Copper
Share of weight (%) 6.85* N/A
Weight in one device (g) 171 12.5**
Recycling rate (%) 85* 85*
Wasted material/one device (g) 26 2
Wasted material/functional unit (g) 6.5 0.66
Plastic
Share of weight (%) 40.6* N/A
Weight in one device (g) 1000 17**
Recycling rate (%) 13* 13*
Wasted material/one device (g) 870 15
Wasted material/functional unit (g) 217.5 5
Precious metals
Share of weight (%) 0.029* N/A
Weight in one device (g) 0.7 N/A
Recycling rate (%) 63* N/A
Wasted material/one device (g) 0.26 N/A
Wasted material/functional unit (g) 0.065 N/A
Source: *Van Eygen et al. 2015, ** Hischier et al. 2014A

47
5.2 Interview results: reuse and recycling practices in the two
case companies
The focus of this chapter is to review the company-specific processes at the end of the
devices’ life cycles. The aim of this chapter is to define how the life cycles’ stages differ
in traditional ownership-based procurement model and service-based procurement model.
Subsection 5.2.1 focuses on the C1 (Company 1), and subsection 5.2.2 focuses on the C2
(Company 2). The interviews were divided into three sections, which contain the
company’s repair practices, company’s reuse practices, and company’s recycling
practices.
5.2.1 Company 1: Ownership-based model A. Repair practices of Company 1
By repairing the broken devices, it is possible to extend their life cycle. According to the
3R framework (see section 2.3), life cycle extension provides an efficient way to mitigate
the product’s environmental impacts. However, if the costs of the repairing activities
exceed a certain threshold, consumers are unwilling to do so, and they replace the product
instead (Sabbaghi & Behdad 2017). Thus, it is important to study the warranty policies in
both companies.
According to the R1 (Representative 1), the warranty period is defined by the
manufacturer, and different manufacturers have differing warranty periods. C1 also
provides different warranty solutions for their devices. A typical warranty time is three
years for the laptops and one year for tablets. Clients have, for example, an option to pay
for extra warranty, which extends the warranty time, or it is possible to purchase a service
that provides a repairing within 24 hours. In terms of volume, only very few office devices
need to be repaired, while the difference with student devices is clear.
“Well, they are not repaired very often considering the volume … the difference is like
night and day. When talking about student devices, we talked about thousands annually …
when used by adults we talk about few dozen devices, which are repaired.”

48
The devices have only very few hardware failures that are independent from the
consumer. R1 describes that they only appear on 1% or less of the devices. The most
common repairing operations that C1 takes care of outside of the warranty are, that the
user has spilled something on the keyboard, or that the screen or keyboard has broken due
to the cable or pencil that has been forgotten between them. For example, replacement of
screens and keyboards are done very often, because it is cost-effective in relation to the
value of the device. In the case of a more extensive damage, the repairing costs may turn
out to be very expensive and it is not profitable to repair the device.
“Motherboard defects are not repaired … if some liquid has gone there, because the
motherboard is almost as expensive, if not more expensive, than buying a completely new
device”.
C1 receives devices that are considered as removals by the customers, and they are
securely recycled. According to R1, the main reason why the devices are returned by
customers as removals is, that they have become to the end of their life cycle, or the
warranty time has ended and they are irreparable. When asked for further details for the
meaning of the end of the life cycle, they specified:
“Well, it is the devices age. So of course the programs develop, despite if it is city or
municipality or whatever, so the old devices become to the end of their life cycle so to
speak. So PC is that kind of device that… well of course updates are also being made, but
to the old devices it simply is pointless to conduct them. And then, some of them are rather
worn, and like I said, in student use they are pretty dented and scratched, and then when
they stop working we conduct this [cyber] secure recycling for them.”
R1 thought that a typical length for the devices’ life cycles is difficult to define, because
there are differences between manufacturers. However, for tablets, the lifespan is from
two to three years, and most often the reason for withdrawal is a screen related problem.
In terms of laptops, the lifespan for student devices is approximately from three to four
years, but in office use the devices can have a significantly longer lifespan, such as four
to five years.
49
B. Reuse practices of Company 1
After a device no longer serves the consumer, it is possible to lower the environmental
impact by reusing or recycling the device, or its components. In the case of small
electronic devices, such as laptops and tablets, it is more convenient to reuse than recycle
the devices, as the main source of their impact is not the use, but the manufacturing
(Boldoczki et al. 2020). For this reason, it is important to review how companies 1 and 2
carry out the possible reuse or recycling operations.
According to R1, C1 does not provide a service, in which the used devices would be
updated and sold again, because typically the devices that are collected after the use are
in such a condition, that they can be considered to be at the end of their life cycle.
However, the subcontractor, who is responsible for handling the recycling, repairs few of
the devices for reusing them. R1 did not have information about where these repaired
devices go, but they assumed that they are sold somewhere in large batches. The main
processing treatment is recycling.
“We do not have this kind of arrangement for the city, that we would, like, update the
devices and sell them to the workers, so these devices that come to us are, as I said, mainly
pretty much at the end of their life cycle. They do go to reuse from us, yeah, so our partner,
who we do this together with ... like some of the devices are in such a condition that you
cannot really save anything from them, other than the memory comb, and the rest is
recycled. … It [preparing for reuse] is being done by the subcontractor who repairs the
devices if possible, and tries to get them back on track, so to speak, but the material that
comes is pretty old. … Mainly it is recycling, pretty rarely they go to reuse, but of course
it also happens. But that is a demanding process, like the hardware is renewed and it
requires investments to put it back on track. … I cannot really say how it happens, but I
have understood that they are sold in bigger quantities … I have understood that for
example Swedes and Danes use old PC devices in the school world. But I cannot give you
any specific address where they go.”
R1 was also asked if they know if C1 has had discussion about starting to provide reuse
services. R1 said that they had personally discussed with clients about the possibility that
the devices that are still working would be updated and new hardware would be installed,

50
and that the devices would be returned to the customers’ use. The last discussion,
regarding customers’ devices in student use, had been two-three months prior to the
interview.
C. Recycling practices of Company 1
Apart from reuse, one way to impact devices’ environmental footprint is to recycle them,
and therefore it is also important to review the companies’ recycling practices. The
recycling in C1 has been conducted through a partner, which is a recycling company, that
has ISO 19001, ISO 14001, and OHSAS 18001 certificates. Recycling is conducted
securely, which means that the components that contain memory are crushed. Of those
memory-containing components R1 mentions SSD disks, that are mainly made of plastic.
Metals are separated from the crush, and according to R1, the crush is used for example
in producing containers. However, more detailed information was not available, as
reflected in the following quote.
“I have heard that for example the hard drive powder can be used for making
containers. … Not for food sector, but for some other sectors … I cannot describe it more
precisely, but once I just for fun asked how the crush is reused, and they answered that it
can be used for [making] some kind of containers.”
C1 often receives broken screens, which cannot be repaired. R1 estimates that
approximately 94% of the screens’ materials can be recycled, 4% is used in energy
production, and 2% go to disposal. Microcircuits and printed circuit boards are reportedly
sorted properly, and the recycling rate of precious metals is good. Aluminium is collected
and sorted, and the material is simple to reuse. Plastic materials are melted and used for
making recycled plastic. For more precise information R1 recommended to contact the
recycling partner. However, within the scope of this study, it was not possible to conduct
extra interviews.
5.2.2 Company 2: Product-as-a-service-based model
C2 represents a procurement model, which according to the company, follows the
principles of circular economy. In this model the devices are leased for the customer, and
51
after the customer no longer uses them, C2 offers them a second life. Two representatives
of C2 were interviewed, and they are referred to as R2 (Representative 2) and R3
(Representative 3). R2 is responsible for marketing, communication, and responsibility
for the company’s Finnish operations. R3 is responsible for the company’s relations with
public administration. The interview was divided into three different themes, which are
the company’s operating model in general, the company’s reuse activities, and the
company’s recycling activities.
A. The operating model of Company 2 in general
The company’s operating strategy is that they purchase the devices from the supplier and
rent them for the customer. The supplier and the devices are selected by the customer, and
in the case of municipalities, procurement takes usually place on a competitive basis. The
winner of the tendering is selected as the supplier, and the leasing contract allows a more
even distribution of the ICT related costs for the customer. According to R2, the
company's operating model does not include warranty repairs, but the equipment supplier
is responsible for repairs during the warranty period. C2 takes care of other forms of
devices’ life cycle management, for example by maintaining device register, which sorts
the organization’s devices, their users, whether latest software and application updates
have been conducted successfully, and if the antivirus protection is up to date. According
to R2, monitoring and anticipation make it possible to avoid broader maintenance
procedures.
“So we are brand independent actor, so the customer themselves choose devices and
where they want to purchase them. So we do not, kind of, have a role in defining this for
the customer, for example, like deciding which devices and from which channel … So we
do not have, like R3 said, that kind of maintenance role, but then again … we do have this
device registry maintenance, in which these customers’ devices are registered, so then
again, we can know how they work, if the updates have gone through properly and if like
the whole fleet that the customer has, is properly used and optimized, and so on. And then
from this, the customer gains valuable information, like the IT people, so they can
anticipate and ... anticipate possible maintenance.” -R2

52
The other operating model that C2 has, is to buy the existing devices from the customer.
The customer receives money from selling the devices, and if they want, they can also
rent the devices back after selling them. This will free up resources, while the same
devices will remain in use. Also, in this case the life cycle management is taken care of
by the company in a similar manner as in their other operating model. Compared to many
other IT-companies, the difference of C2 is that their business model is based on reselling
the devices after the customer no more uses them. Another difference is that the supply
chains processes, such as logistics and the treatments for the devices are carried out by
C2, as it does not use subcontractors in these processes. However, it is worth mentioning
that it does use a subcontractor for the recycling processes.
“Well, we provide two different services. … We purchase the devices from the customer,
we also give money for them, but then they are retrieved, packed, secured, the same way
as these devices that return from leasing.” - R3
Typical first service life is three to four years for the laptops and two to three years for
the tablets. The length of the rental agreement depends for example on the intended use.
Devices that are in office use last longer than those that need to be actively travelled with.
According to R3, cities and municipalities normally procure devices that have relatively
high-quality components, which partly increases the service life, and encourages the use
for the second service life. Customers have an option to decide, whether they want for
example three or four years cycle for the device renewing, and having the same devices
longer decreases the monthly rent.
“Municipalities and cities also procure, good professional laptops, corporate level
laptops, so then you have better memory, better battery, better hard drives, processors.
So they are like different devices than like maybe these consumer devices. And and, well,
the intended use also … how long they last … well, they last longer with office workers
than those kinds of workers who move a lot, use it a lot, and are not at the office. … So,
so, the professional devices also serve still well on the second use cycle.” - R3
According to the representatives, a surprisingly large share of the devices, that are in the
ownership of the customer, does not return to the second-hand markets, but remain unused
in a storage. Thus, by having rental devices, the customer does not have to think about

53
the end-of-life treatment, but the devices are returned into the market by C2. This way
resources, that would risk being untapped, are held in circulation. Also, if other customer
organizations do not have a need for brand-new equipment, they can save natural
resources by offering a second life for the devices, instead of buying new devices.
“We have studied if as many devices end up to the secondhand markets as new ones are
procured. And surprisingly large amount of the devices, laptops, tablets and phones,
never return to recognized secondhand markets.” -R3
B. Reuse practices of Company 2
“We collect them from the customer and practically pack them for the customer, so that
they remain operational. They come to our logistics center, where we inventory them,
after which we overwrite the data, and conduct a quality assessment, regarding what kind
of condition the returning devices are in. And then we sell those reconditioned devices
forward, into the secondhand markets.” - R3
According to the representatives, approximately 97–98% of the devices can be reused
after C2 has made the necessary updates to them. The representatives could not provide
very specific details about these updating processes, but they note that the processes can
relate for example to renewing the components, such as battery or the hard drive. Both
new and used components are used in these repairing activities, and some of the
components of those devices that cannot be repaired anymore, can still be used as a spare
parts. R2 states that of those 2–3% of the devices that cannot be repaired anymore, 80%
can still be used as spare parts.
“Approximately 80% of those devices that have basically been stated not to work can be,
in one way or another, in our so-called repair program to, well, be reused and used … so
that we can fix the devices, which means that we reduce 56% of the e-waste through these
activities.” -R2
When selling the used devices, C2 also checks the customer's backgrounds, and there are
several requirements that need to be met. C2 does not sell to countries that are not covered
by the e-waste scheme, and mainly operates with reliable long-term partners. Most of the

54
customers are from Europe, and the main markets are in Poland and Sweden. Some of the
customers are also from Asia. The representatives did not have very detailed information
about what kind of use the devices go into, but they assumed that they mainly go to
companies and schools. Reusing typically doubles the total period that they are being
used. R3 points out that the authorities require that the devices going on sale abroad are
still intact. C2 also ensures that all the data on the device has been deleted and that the
reselling is secure.
“It is also a part of being responsible, that when we acquire the devices, we are very strict
about who we resell them to. So, so, we have there checking that one is not on any banned
list and we check the backgrounds and cooperate with long-term business partners. So
we also do not sell them for everyone. … The main markets are specifically in Europe …
It is very strictly supervised by authorities that the devices that are leaving from Finland
are actually working.” - R3
C. Recycling practices of Company 2
The remaining 2–3% of the devices are so damaged that they cannot be reused, and are
sent to the recycling center, which is the same subcontractor that C1 uses. According to
R2, the components are crushed and the materials are separated at the center. Circuit
boards are sorted separately, and non-ferrous metals, copper and aluminium are melted
and utilized as raw materials, for example for the automotive and electronics industries.
R2 was not sure but recalled that 95% of the materials can be reused as they go through
the recycling center’s treatment.
“From all of the devices the renewable metals and minerals are collected into utilization
in there, through these different programs, very well. … I do not know about percentage,
but I know that at least the aluminium and copper are melted and then they go further
into an automotive and electronic industries to be used as raw materials, and the circuit
boards are treated, like completely as an own form of waste.” - R2
“I do not remember very precisely but was it that 95% of those acquire a new life of those
2% that goes through the recycling center’s program. … So even if they are not used as
computers anymore, but they can be used as raw materials, and then … So there are

55
pretreatments and crushing and then there are different immersing, floating and
crushing … and these kinds of [measures], through which the different raw materials go
into reusing.” - R2
5.3 Impact assessment
In this section the differences between companies 1 and 2 are examined based on the
information that was obtained through conducting the SLR and the interviews. The
functional unit specific CO2e impacts are first assessed for both companies in subsection
5.3.1 and in subsection 5.3.2 the focus is on the functional unit specific material impacts.
Finally, in subsection 5.3.3 the differences between the companies are assessed in terms
of CO2e and material impacts. The goal of this chapter is to respond to the second research
question.
5.3.1 CO2e impacts of alternative procurement options In order to calculate the functional unit specific CO2e impacts for the devices in both
procurement options, the total CO2e impacts of these devices must be divided by the
length of the devices’ lifespans in both procurement options. The end-of-life treatments
that are practiced by the companies have an important role in defining the average lifespan
of the devices. The practices of C1 does not include reuse practices, but as it was pointed
out in chapter 3, the City of Helsinki also carries out reuse operations through the Uusix
workshop if the devices are owned by the city. Due to this option, even if the devices are
not reused by the supplier company, the ownership-based procurement model allows
reusing of some of the devices through Uusix, which expands the average lifespan.
As it was not possible to interview the foreman of Uusix, it is challenging to estimate the
share of the devices that is annually made reusable by the workshop. However, according
to the report by Lehtinen (2018, 7) the annual procurement volume for the City of
Helsinki is approximately 20,000 workstations and the number of objects that Uusix had
processed was approximately 8500 in year 2018. In the report, it is also stated that a larger
share of these 8500 devices was reused than recycled (Lehtinen 2018, 8). Based on this
information, it is possible to define an interval, for which the reusing rate could potentially

56
settle. If it is assumed that for example 5000–7000 devices are reused annually, it means
that 25–35% of the annual procurements of 20,000 devices would be reused through
Uusix. The same way as C1, also Uusix steers the nonreusable devices and components
into WEEE recycling (Lehtinen 2018, 8). This indicates that the remaining share of the
devices would be recycled efficiently in both procurement options.
R1 states that typical life cycle for their laptops in office use is approximately 4–5 years,
which corresponds with the SLR results. There is no information available about the
length of the life cycle extension period by Uusix, but R3 from C2 argues that reusing
practices can double the length of the life cycle. Due to the slight difference between the
results of SLR (see subsection 5.1.3) and the view of R3, it can be estimated that the
second life cycle for laptops would be approximately 3 years. If 25–35% of the devices
gain these additional life cycle years, the average life cycle for a laptop would be 5.4
years if it is procured from Company 1.
As pointed out in subsection 5.1.4, various articles propose that the average life cycle for
tablets is 3 years. This corresponds with the answer by R1, who states that the average
life cycle for the tablets is approximately 2–3 years. The articles that were included into
SLR did not provide information about the life cycle extension that can be acquired if a
tablet is reused. The only estimation that is available for this information is the statement
by R3 from C2, who argues that the devices’ life cycles can be twice as long with the
reusing practices. If the lifespan can be doubled for a similar share of the devices by
Uusix, the average life cycle for tablet in this procurement option is 3.25 years. Based on
the calculations that are presented in appendix 6, it can be estimated that the functional
unit specific CO2e impacts in this procurement option are approximately 40 kgCO2e for
laptop and 37 kgCO2e for tablet. Considering the argument that non-renewable energy
consumption is approximately ¾ for tablets compared laptops (Hischier et al. 2014B, 13),
it may seem surprising how similar the functional unit specific CO2e emissions for the
devices are. However, this is mainly because the service life of the tablets is considerably
shorter.
In the case of C2, the devices’ life cycles resemble figure 3, which presents a flowchart
for devices that are being reused. It should be mentioned, however, that the share that
goes to landfills or even recycling in the preparation for reuse phase, is very small for C2.
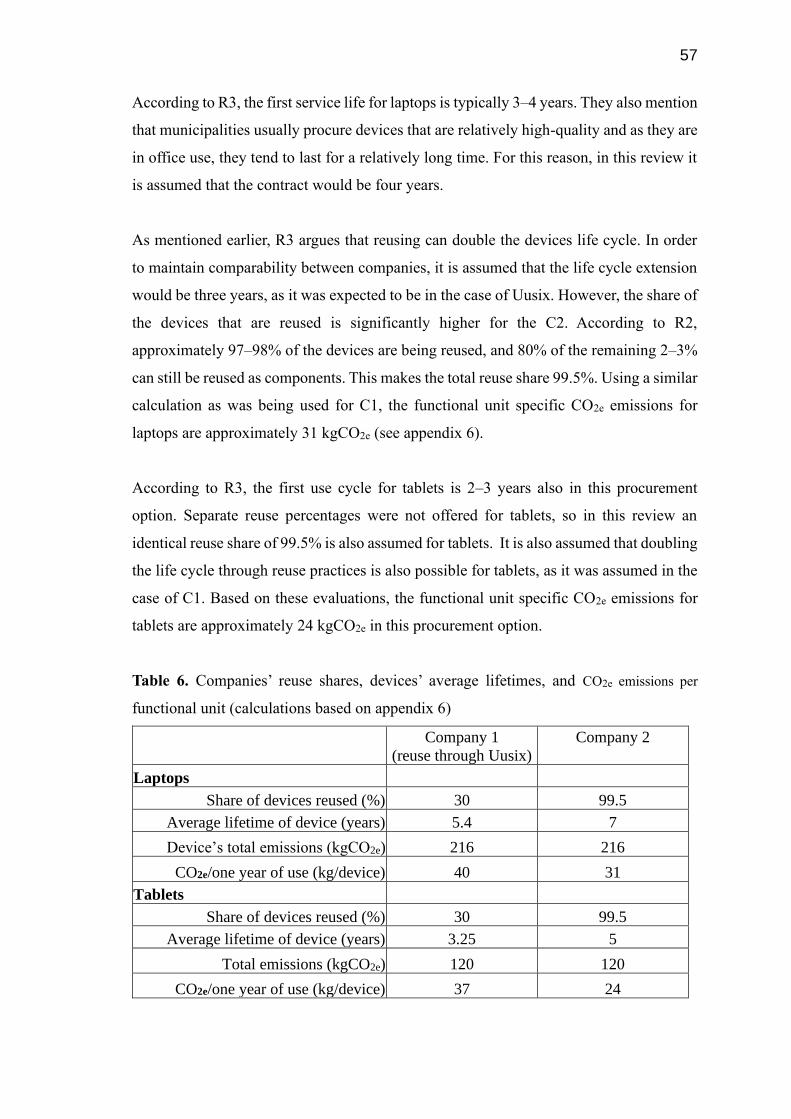
57
According to R3, the first service life for laptops is typically 3–4 years. They also mention
that municipalities usually procure devices that are relatively high-quality and as they are
in office use, they tend to last for a relatively long time. For this reason, in this review it
is assumed that the contract would be four years.
As mentioned earlier, R3 argues that reusing can double the devices life cycle. In order
to maintain comparability between companies, it is assumed that the life cycle extension
would be three years, as it was expected to be in the case of Uusix. However, the share of
the devices that are reused is significantly higher for the C2. According to R2,
approximately 97–98% of the devices are being reused, and 80% of the remaining 2–3%
can still be reused as components. This makes the total reuse share 99.5%. Using a similar
calculation as was being used for C1, the functional unit specific CO2e emissions for
laptops are approximately 31 kgCO2e (see appendix 6).
According to R3, the first use cycle for tablets is 2–3 years also in this procurement
option. Separate reuse percentages were not offered for tablets, so in this review an
identical reuse share of 99.5% is also assumed for tablets. It is also assumed that doubling
the life cycle through reuse practices is also possible for tablets, as it was assumed in the
case of C1. Based on these evaluations, the functional unit specific CO2e emissions for
tablets are approximately 24 kgCO2e in this procurement option.
Table 6. Companies’ reuse shares, devices’ average lifetimes, and CO2e emissions per
functional unit (calculations based on appendix 6)
Company 1
(reuse through Uusix)
Company 2
Laptops
Share of devices reused (%) 30 99.5
Average lifetime of device (years) 5.4 7
Device’s total emissions (kgCO2e) 216 216
CO2e/one year of use (kg/device) 40 31
Tablets
Share of devices reused (%) 30 99.5
Average lifetime of device (years) 3.25 5
Total emissions (kgCO2e) 120 120
CO2e/one year of use (kg/device) 37 24

58
5.3.2 The material impacts of alternative procurement options In this subsection, the functional unit specific material impacts in different procurement
options are reviewed. The reviews are based on similar assumptions that were taken in
the previous subsection, considering the reuse shares carried out by Uusix and C2, and
the life cycle extensions that are achieved through these reuse practices. The problem is
that it was not possible to interview the recycling partner that the companies use, and thus
it was not possible to acquire context specific information about the companies’ material
recycling shares. For this reason, recycling share estimations are based on the results of
the SLR.
As it was pointed out by Boldoczki et al. (2020, 1–2) reusing the devices is a better option
than recycling in terms of various impact categories, such as mineral resource scarcity.
However, Van Eygen et al. (2015, 55) argue that in some cases reusing can also be a worse
option than recycling in terms of material impact, if the devices are shipped to be reused
in a country with poor recycling facilities. The devices that are reused by Uusix stay in
Finland. R3 also pointed out that C2 is very strict about who they resell the devices to,
and they are only shipped to countries that cover an e-waste scheme. According to R3,
the main markets for used devices are in Sweden and Poland. The data from The Global
E-Waste Statistics Partnership (2021), demonstrates that the e-waste collection rate in
Poland has been 61% from 2017 to 2019, and for Sweden the rate has been 70%. As the
similar rate for Finland was 61%, it can be assumed that in the case of C2, the devices are
recycled after second life cycle as efficiently as those that are recycled after the first life
cycle.
The functional unit specific shares of material consumption in different procurement
options can be calculated by dividing the devices’ total material waste by the devices’ life
cycle lengths in these procurement options. The total shares of wasted material are
presented in table 5 and the average lifespans of the devices in these procurement options
are presented in table 6. The functional unit specific material impacts are presented below
in table 7. In reality, the material impacts do not occur annually through the use, but as
the devices’ are updated to new ones after the life cycle, longer life cycle decreases the
material waste that stems from the old devices’ recycling process, while also decreasing
natural resource consumption.

59
Table 7. Functional unit specific material impacts (grams) in different procurement
options
Company 1 Company 2
Laptops
Aluminium wasted/functional unit 9.8 7.6
Copper wasted/functional unit 4.8 3.7
Plastic wasted/functional unit 161 124
Precious metals wasted/functional unit 0.05 0.04
Tablets
Aluminium wasted/functional unit 17.5 11.4
Copper wasted/functional unit 0.6 0.4
Plastic wasted/functional unit 4.6 3
5.3.3 Interpretation
Finally, in this subsection the functional unit specific differences between the
environmental impacts in different procurement options are reviewed in terms of CO2e
emissions and material impacts. This review is based on the City of Helsinki’s annual
procurement volumes. However, it is again important to highlight that due to the lack of
context specific information, several assumptions had to be taken to provide a basis for
this review stage, and it might not perfectly mirror the context of the case studied
companies.
The City of Helsinki is estimated to procure 20,000 laptop devices annually (Lehtinen
2018, 7) and the functional unit specific CO2e emissions for a single laptop in the case of
buying it from C1 and utilizing the reuse services of Uusix are 40 kgCO2e. Therefore, the
total annual impact of applying this option is worth of 800,000 kgCO2e emissions. Due to
the laptop’s longer lifespan in the case of procuring them from C2, the functional unit
specific emissions for a single laptop are approximately 31 kgCO2e. Considering the
annual volume of the procurements, the total impact in this option is approximately
620,000 kgCO2e. The difference between these options is 180,000 kgCO2e annually,
which denotes a 22.5% decrease if the devices are reused more regularly in the latter
option. However, it should be noticed that even if the devices are owned by the city, the

60
difference can also be mitigated by extending the contract period or utilizing the services
of Uusix more comprehensively.
There was no exact information available about the City of Helsinki’s procurement
volumes for tablets. However, it was estimated by the city’s IT specialist that the
procurements are probably between 5000 to 6000 devices annually. Thus, it can be
expected that the annual procurement volume is approximately 5500 tablet devices. If the
devices are procured from C1 and the services of Uusix are utilized in reusing a share of
them, the functional unit specific impact of a tablet is approximately 37 kgCO2e. Thus,
the total annual impact that stem from this procurement option is 203,500 kg worth of
CO2e emissions. The similar annual impact for a single device in the case of procuring it
from C2 is 24 kgCO2e emissions, and therefore the total annual impact is 132,000 kg
worth of CO2e emissions. When the total annual impacts in both procurement options are
considered, it seems that the higher extent of reused devices decreases the CO2e emissions
by 71,500 kg annually.
Table 8. Annual CO2e emission and the differences between the procurement options
Laptops Tablets
Company 1: Total annual emissions (kgCO2e) 800000 203500
Company 2: Total annual emissions (kgCO2e) 620000 132000
Difference (kgCO2e) 180000 71500
The functional unit specific material impacts were measured for laptops by focusing on
the material shares that are wasted due to the recycling inefficiencies. When procuring
the laptops from C1 and utilizing Uusix for reusing some of the devices, it was estimated
that approximately 9.8 g of aluminium, 4.8 g of copper, 161 g of plastic, and 0.05 g of
precious metals go to waste annually per one laptop. When these quantities are multiplied
by the procurement volume of 20,000 devices, it can be estimated that approximately 196
kg of aluminium, 96 kg of copper, 3220 kg of plastic and 1 kg of precious metals are
annually wasted if this procurement option is utilized.
The annual quantities of wasted materials are smaller in the case of C2, as a larger share
of the devices are reused. It was estimated earlier (see subsection 5.3.2) that in this option

61
approximately 7.6 g of aluminium, 3.7 g of copper, 124 g of plastic, and 0.04 g of precious
metals are annually wasted per laptop. When these quantities are correspondingly
multiplied by the procurement volume, estimated 152 kg of aluminium, 74 kg of copper,
2480 kg of plastic, and 800 g of precious metals are annually wasted when utilizing this
procurement option. To conclude, the material waste shares in this option are smaller, as
44 kg of aluminium, 22 kg of copper, 740 kg of plastic, and 200 g of precious metals are
annually saved compared to the first option.
The shares of the annually wasted materials were smaller for tablets, and in the first
procurement option an estimated quantities of 17.5g of aluminium, 0.6 g of copper, and
4.6 g of plastic are annually wasted per device due to the recycling inefficiencies. As the
city’s annual procurement volume is approximately 5500 tablets, the total annual material
impacts in the first procurement option are approximately 96 kg of aluminium, 3.3 kg of
copper, and 25.3 kg of plastic. Similar device specific material impact shares in the second
procurement option were 11.4 g of aluminium, 0.4 g of copper, and 3 g of plastic. Thus,
the total annual impact in this option is 62.7 kg of aluminium, approximately 2.2 kg of
copper, and 16.5 kg of plastic being wasted. Based on these calculations, it can be
estimated that in the case of tablets, the total annual material saving potential is 33.3 kg
of aluminium, 1.1 kg of copper, and 8.8 kg of plastic, when the devices are reused more
systematically in the second procurement option.
However, it should be highlighted that in reality the material waste does not occur
annually during the product’s life cycle, but the waste shares that stem from recycling
inefficiencies were only fitted into the format of the functional unit as part of this study.
In addition, the recycling shares and the shares of wasted materials do not accurately
represent the case specific context of the studied companies, but they are estimations that
were based on the results of the SLR. However, as mentioned in subsection 5.1.5, the e-
waste collection rates in Belgium, which was used as a reference for the recycling rates,
and the collection rates in Finland are relatively similar. Defining the recycling rates of
the subcontractor who is responsible for the companies recycling practices was not
possible to carry out within the schedule of this study. Furthermore, there was no
information available about the recycling operators that are used by Uusix or those who
purchase the devices from C2 as secondhand. It should be noticed that despite the positive

62
environmental impacts of reusing the devices, it also makes it more challenging to track
the devices’ material flows, as the devices are circulated internationally.
Table 9. Annual material impacts and the differences between the procurement options
Company 1 Company 2 Difference
Total aluminium waste in a year (kg)
Laptops 196 152 44
Tablets 96 62.7 33.3
Total copper waste in a year (kg)
Laptops 96 74 22
Tablets 3.3 2.2 1.1
Total plastic waste in a year (kg)
Laptop 3220 2480 740
Tablets 25.3 16.5 8.8
Precious metals in a year (kg)
Laptops 1 0.8 0.2

63
6 Discussion In this chapter, the limitations of this study are considered and the results that have been
obtained are linked to the broader social implications that were presented in chapter 2.
The assumptions and limitations are acknowledged in section 6.1, and it is typical for
LCA studies that there are several data gaps that require assumption making (Baumann
& Tillman 2004, 228). The social implications of the results of this study are discussed in
section 6.2.
6.1 Assumptions and limitations
A research process always contains certain limitations, but as it was mentioned in section
4.1, it is important to report the complexities and shortcuts in a transparent manner. This
also allows the reader to be aware of the motives for different solutions that have been
made. The limitations section of this study is relatively broad, because conducting an
LCA study requires certain number of assumptions to be taken due to the data gaps. As it
was also mentioned in section 4.1, it is also important to notify the reader about the
missing pieces of information, but this is mainly done already in the method sections. The
limitations of this research are presented separately for each method in the following
paragraphs.
The challenge for this study was the relatively large scope considering the timetable. As
the time available had to be utilized as effectively as possible, it was necessary to keep
the individual methods relatively succinct. Only one broad database was used in the SLR,
as it provided an access to multiple databases and thus saved time. A broader literature
review could have provided a larger amount of suitable articles, because now a relatively
large share of the laptop related information was obtained from the article by André et al
(2019) and for tablets the information was rather extensively based on the article by
Clément et al. (2020). However, as it is highlighted several times in this study, the problem
is that the amount of suitable LCA studies is still limited. It seems, especially in the case
of tablets (see e,g, Clément et al. 2020, 3), that even a broader SLR would not have
provided a significantly higher number of relevant articles, while it would have still
consumed time. In addition, both previously mentioned articles, for example, utilized
64
several data sources in their studies. Despite relying only on Scopus, the SLR section
provided an extensive amount of information in relation to the time that was invested.
One limitation of the study was the extent of the impact categories, in which the impacts
were studied in. For example, human toxicity is a relevant impact category for ICT
devices life cycle impacts, but the scope of this study did not allow studying the
differences in all of the relevant categories. The decision to focus on CO2e emissions and
material impacts was based on the report by Ojala et al. (2020) which was used in chapter
2 as a background material for designing the content and the structure of this study. This
report states that according to previous reviews, the most significant environmental
impacts of ICT are energy and material consumption (Ojala et al. 2020, 24), while some
of the articles in SLR also include human toxicity into the most significant impacts (see
e.g. André et al. 2019, 272). However, the CO2e emissions and material consumption were
not excluded in any of the articles that considered most important impacts, but including
human toxicity is also highly relevant to consider in similar studies that are conducted in
the future.
In addition, the scope of this study was limited only to direct emissions, which rise from
production, use, and disposal (Bieser & Hilty 2018, 1). Including the indirect emissions
was not possible within the scope of this study, but in order to achieve a more
comprehensive impact assessment of the devices in question, it is also important to study
these indirect impacts in the future. Finally, for some of the devices’ components there
was no CO2e impact information available from SLR articles. In order to form a chart
about the life cycle stages’ and components’ CO2e emissions that is as illustrative as
possible, certain assumptions had to be taken. For some components or life cycle stages
the information that was obtained from different articles seemed to be in conflict, as
different devices were used in comparisons. Using a median of the model specific CO2e
emissions as an assumed standard was not an ideal mean, but due to large device specific
differences, it was considered to be the best solution available. In addition, the assessment
of the laptops’ life cycle stage specific CO2e impacts was based on an assumption that the
devices are only used daily for two hours. In the office use, however, the devices are often
used much more and thus it should be noticed that in terms of CO2e impacts the
significance of use stage is likely to be higher in the context of this study. It was also
assumed that the devices are functionally equivalent during their second life cycle.
65
Similar assumption was made in the study by André et al. (2019), but it should be still
noticed that even if the devices are in as-new condition, different organizations have
different requirements for the devices.
Certain limitations were also related to the measuring of the material impacts. As it was
mentioned in subsection 5.1.5, different studies have different approaches for defining
the importance of certain materials, and some of them highlighted material scarcity, while
others focused on materials’ environmental impacts (André et al. 2019, 269). For this
reason, the focus on this study was put on several materials, and some of them are
considered important because of the scarcity, while others are considered important
because of their large share in devices.
In this study, the material composition of a laptop was based on the general composition
of disposed laptops, and this approach might neglect the device specific differences that
stem, for example, from different casing materials and device sizes. On the other hand,
this approach allows independence from these differences, and focusing only on the
composition of one device would give a biased understanding of the laptops’ general
composition. Another limitation that was related to the laptops’ material impacts was the
limited amount of information about the recycling shares. The study that was used in this
section (Van Eygen et al. 2015) was based on information that was collected in Belgium
in 2013. As the study is relatively old, the recycling efficiency might have improved and
there might also be company specific differences in the WEEE recycling efficiency,
although the e-waste collection rates are relatively similar between the countries in
question. For this reason, interviewing the recycling company that both of the case
companies use, would have provided more context specific information, but unfortunately
it was not possible to carry out this interview as a part of this study within the schedule.
In the case of C2 it was only stated that the main markets for the used devices are in
Poland and Sweden. Although it is possible to consider the e-waste recycling rates of
these countries, it is still difficult to get precise information of the end-of-life treatments
that are used for these reused devices. However, this is a relevant observation, because it
highlights the importance of supply chain transparency, if the end-of-life treatments are
carried out through international cooperation.

66
An important limitation for studying the material impacts of tablets was the lack of
previous studies. Clément et al. (2020, 3) state that there are only two previously existing
transparent LCA studies of tablets, and only one of them focused on the material impacts.
For this reason, there were no studies available that could be used for comparing the
results by Hischier et al. (2014A). The article by Hischier et al. (2014A) did not provide
material specific recycling shares for tablets, and for this reason the recycling shares had
to be based on those for laptops. However, it is possible that these shares differ between
different devices and in the future it is important to study how efficiently different
materials are recycled for tablets as well. Despite these limitations, this study provides an
illustration of the recycling shares, device specific material shares, and impacts of some
of the key materials that are used in these devices. On a general level, it can be said that
in addition to the suppliers’ practices, for example, the size and casing materials of the
devices have also a key role for the material impacts when considering procurements.
It is also worth noticing that only two companies were included into the study, and thus
it should be kept in mind that the interview results only represent the practices of these
case companies and cannot be used for making generalizations about other ICT
companies’ practices. Quantitative information concerning Company 2’s reuse shares was
drawn from the company’s sustainability report and verified through an interview with
company representatives. As it was pointed out by André et al. (2019, 269) there is a lack
of real-world business-related case studies of circular economy measures. In that sense
this study, despite the narrowness, provided valuable information on a topic that has not
yet been extensively studied.
Another challenge that emerged during the interviews was that the company’s
representatives had limited knowledge of how the recycling company would carry out the
recycling operations. In this sense it would have been beneficial to interview the recycling
company’s representative, but this realization came up only when the company interviews
were already carried out and at that stage it was already too late to include extra
interviewees. However, asking these questions from the case companies’ representatives
was also important because it allows the identification of knowledge gaps. For C1 only
one representative was interviewed, while for C2 there were two interviewees. This might
also create an imbalance on how much the representatives are able to tell about the
company that they represent.

67
It would have also been more convenient to conduct the interviews face to face, but due
to the ongoing COVID-19 pandemic they were conducted on Microsoft Teams. Another
interview setting related challenge was that the thesis is carried out in English, while
interviews were carried out in Finnish. Selecting Finnish as an interview language made
the interview situation flow more naturally, than it probably would have, if the interviews
would had carried out in English. It was assumed that a possibility to answer the interview
questions in one’s native language would have a positive impact on quality of the answer.
The original interview questions and answers were translated into English in such a way
that the original meaning was preserved as well as possible, but the meanings always
change slightly due to the translation process. As the focus of the interviews was to obtain
factual information about the companies’ practices, the translating could be done well
without changing the most essential information content.
As it was pointed out by Alastalo et al. (2017) there is also a risk that when companies’
representatives are interviewed, they have an incentive to describe the company’s
practices from public relations (PR) point of view. This challenge was acknowledged
during the interviews. However, the most important factors that were obtained from the
interviews for the impact assessment were the devices’ life cycles in years and the
companies’ reuse rates for these devices. These pieces of information that were provided
by the representatives about the life cycles, seemed to correspond with the results of the
SLR. For C2 the reported reuse rates corresponded with their sustainability report. For
C1 there were no clear estimations about the reuse rates that their recycling operator
carries out, thus these operations were excluded from the impact assessment. As C2 uses
the same recycling partner, the impact assessment was still balanced, as these possible
reuse operations were excluded for both companies.
In addition, it would have been convenient to interview the representative of the Uusix
workshop. The original intention was to carry out this interview as well, but neither the
author of this thesis nor thesis commissioners were aware that conducting this interview
would require a research permit. Acquiring this permit would have taken too long in terms
of the research schedule and the interview had to be left out. It was fortunately possible
to find relevant information about Uusix from the report by Lehtinen (2018). However,
as this report was carried out in 2018, it is possible that some of the information, such as
68
reuse rates, can be outdated. Also, as there is no clear number for the share of reused
devices, the impact assessment had to be based on an estimation that was based on the
information that was available. The report by Lehtinen (2018, 8) also states that Uusix
recycles the nonreusable devices through a company that accepts electronic waste, but
there is no further information about the company available.
Lastly, there were certain limitations related to the conduction of the LCA. However,
making assumptions is a distinctive feature for LCA studies and it has been observed that
even LCA studies that focus on similar subjects can provide very different results (Andrea
& Vaija 2014, 410). A precise modeling of impacts is always difficult and using databases
always involve limitations (Teehan & Kandlikar 2013, 3998). Many of the LCA related
limitations of this study were related to the limitations of the methods that were used to
collect the data, such as scarcity of previous studies and uncertainties in context specific
recycling shares. As the information was collected from several different articles, there
might be different article specific assumptions that were taken in these earlier LCA
studies.
Yet, streamlined LCA, which relies on already existing data, has been described as a
particularly suitable tool for supporting organizations’ decision-making. Conducting a
full LCA is often not possible because of the time limitations (Pesonen & Horn 2013,
1781–1783.), and relying on a streamlined version was considered as an optimal measure
for the purpose of this study. It should still be noticed that when the procurement volumes
are as large as they are in this study, the significance of estimation errors multiplies.
Therefore, the results of the streamlined LCA should be considered as guidelines, rather
than as precise quantitative measures.
6.2 Results and the analytical framework
Finally, it is important to regard what the broader social implications of the results of this
study are and how the results can be linked to the theoretical perspectives that were
presented in chapter 2. As mentioned in chapter 2, e-waste is the fastest growing form of
waste (Ojala et al. 2020, 75) and energy consumption is increasing exponentially due to
rapid digitalization (Ahmed et al. 2016, 43). Thus, it is likely that the environmental

69
impacts of this progress will continue to accelerate in the future. In chapter 2, circular
economy was proposed as a potential reform to cope with these challenges, and the 3R
framework, consisting of practices of reducing, reusing, and recycling, was presented in
the chapter. Although this study mainly focused on assessing the environmental savings
that can be acquired through reusing and recycling practices, the reducing step was also
indirectly considered through the interview results.
The length of the devices’ life cycles has a key role in defining the functional unit specific
environmental impacts and in addition to reusing the devices, the lifespan can also be
prolonged by extending the contract period. During the interview, R1 mentioned the
possibility to update the devices in order to keep them in use longer without having to sell
them for second life cycle. Correspondingly R3 mentioned that extending the contract
period also decreases the monthly costs, which means that reducing the need to procure
new devices is not only environmentally more sustainable, but also more cost efficient.
However, R1 also highlighted that if the repairing activities are too expensive, consumers
are instead more willing to replace them with new ones. This observation relates to the
notion by Sabbaghi & Behdad (2017, 1) about how the manufacturers’ planned
obsolescence and the values and norms lead to the underutilization of the devices, as the
repairing activities are generally considered from the perspective of economic viability.
Differing norms were also visible in the interviews, as R1 considered the devices to be at
the end of their life cycle when they are collected back from the consumer, while R3
argued that the devices’ lifespans can be even doubled through reusing practices. The
defining factor for the possibilities to extend the lifespan are the requirements that the
consumers set for the devices’ capacity. R3 noted that not all organizations need very
powerful devices, which is why the circulation can be extended by selling them to another
market segment (Sihvonen & Ritola 2015, 641).
The conflict between the environmental and economic savings that can be acquired by
extending the devices’ contract period and the capacity requirements for the devices
applies also in the case of the City of Helsinki. More powerful ICT devices increase the
labor productivity (Brynjolfsson & McAfee 2014, 98–99; Castells & Himanen 2002, 2,
21; Lange, Pohl & Santarius 2020, 2), but more regular renewal of the devices also
increases the environmental burden. For this reason, it is important to define what the
70
organizational requirements for the devices are and whether these requirements could be
given in for achieving environmental savings. This disharmony relates to the standpoint
of Rosa and Scheuerman (2009, 88–89), who argue that organizations are under the
pressure to adopt the latest technologies in order to avoid becoming outdated.
Furthermore, according to Moore’s law, the computing power not only increases
exponentially, but it also becomes more affordable in an accelerating speed (Ahmed et al.
2016, 43; Brynjolfsson & McAfee 2014, 40–41; Mollick 2006, 65). Thus, the incentive
to renew the devices more often is also greater due to this factor. In the future it has been
estimated that the digitalization continues on an exponentially growing acceleration
(Schwab 2016, 12; Brynjolfsson & McAfee 2014) and it is possible that the dilemma
between increasing efficiency and the environmental burden will become even more
urgent.
Although it is important to consider the possibilities of lowering the environmental
impacts by reducing the need for new devices, the main purpose of this study was to focus
on the environmental impacts of reusing and recycling practices. The results of SLR
demonstrated that as the main impacts stem from the production phase, reusing is a better
option than recycling in both impact categories, as long as it is ensured that the devices
will be treated properly after the second life cycle. According to Boldoczki et al. (2020),
for some electronic devices it can also be a more environmentally sustainable option to
replace them with more energy efficient versions, but this is the case if the impact mainly
stems from the use phase. For this reason, energy efficiency should not be considered as
a valid argument for renewing in the case of laptops and tablets. As mentioned in chapter
2, it can also be the case that increasing energy efficiency does not lead to decreasing
energy consumption due to the Jevon’s (1865) paradox.
The devices’ functional unit specific impacts can be decreased by extending their lifespan,
and as it was mentioned earlier in this section, this can be achieved also by selling the
devices to another market segment that has lower criteria for the devices’ capacity
(Sihvonen & Ritola 2015, 641). According to R3, this ensures that the devices are not
forgotten in storages after the first life cycle, which often happens to be the case with the
devices that are owned by customers. This leads to a situation where the devices become
obsolete, and the use potential is wasted. Thus, if reducing the need for new devices, for
example through longer contract periods, is not considered possible by the City of
71
Helsinki, it is possible to extend the devices’ life cycles by reselling them to an operator
that does not have such strict requirements for the capacity.
Lastly, the devices’ impacts can be decreased by recycling them. Recycling mainly
decreases the material impact, while the effect on CO2e emissions is lower (André et al.
2019, 269). For the material impact, it is important that the devices are also recycled
efficiently after the second life cycle if they are reused. This appeared to be the case for
both of the reuse providers in this study, but it should be noticed that reselling the devices
internationally also makes it more challenging to receive information about the recycling
efficiencies that the devices are dealt with. The additional fourth R, standing for recovery,
is also directly related to recycling, as it extensively defines how efficiently for example
the valuable and hazardous materials are collected.
Given the assumptions on which this sLCA is based, it was important that different life
cycle stages’ and components’ impacts were mapped in this study, so that the measures
for lowering the environmental impact can be targeted as effectively as possible. To
conclude, the most significant measures for tackling the impact take place at the end of
the life cycle. These measures reduce the need to produce new devices, which is the most
impactful stage of the devices’ life cycles. However, use is another relevant life cycle
stage in terms of the devices’ GHG emissions. The energy mix that is used in the use
phase has also an important role in defining the emissions (Clément et al. 2020, 2–3.) and
if the goal is to lower the total environmental footprint, it is also important to utilize
renewable forms of energy in the use phase.
72
7 Conclusions
This final chapter presents the conclusions that can be made from this research. The aim
of this study was to provide evidence-based support for the City of Helsinki for mitigating
the environmental impacts of their ICT procurements. This assessment was carried out
by examining how the circular economy -based solutions impact the environmental
burden in the case of laptops and tablets. This topic was approached through two research
questions: 1. What are the most important stages and components in laptops’ and tablets’
life cycles, in terms of CO2e emissions and material consumption? 2. How are these stages
and their impacts different in ownership-based procurement model and service-based
procurement model?
The study was conducted as a streamlined life cycle assessment, which was based on
already existing data. The data was collected from previous ICT related LCA studies by
using systematic literature review. The goal of the SLR was to answer the first research
question by providing information about the most impactful life cycle stages and
components. Based on this information it was possible to create the devices’ flowcharts
for both procurement options and illustrate the magnitude of the impacts in the considered
impact categories. To answer the second research question, it was necessary to interview
the representatives of the case companies about their practices in the 3R framework. The
information that was obtained through expert interviews was used for conducting the
context specific impact assessments and interpretation, which were carried out in order
to answer the second research question.
It is common that the researcher faces several data gaps and is forced to rely on
assumptions and estimations when conducting an LCA study. This was also the case in
this study, and it was not possible to carry out impact assessment on a very detailed level,
because some of the context specific data was not available. However, this does not mean
that the study could not provide valuable results, and despite these shortcomings, sLCA
is considered to be a particularly suitable tool for supporting organizations’ decision-
making when their aspiration is to optimize their operations in terms of sustainability and
life cycle perspectives. Previous sLCA studies have also demonstrated that the results that
have been obtained by using the measure can lead to actual changes in the ways that the
organizations operate. (Pesonen & Horn 2013, 1781–1783.) In addition, it was important

73
to study the impacts in the context of ICT, because of the research gaps that considered
the life cycle assessments of the tablets and the real-world business-related case studies.
Despite the inexactness of the impact assessment phase, various concrete results were
obtained. The results indicate that the most important impact categories that should be
considered in the case of laptops and tablets are CO2e emissions and the material impacts,
human toxicity being another relevant impact category in terms of end-of-life impacts.
The most impactful life cycle stages are production and use, and some of the most
impactful components are PCBs/PWBs, ICs, display, and casing. The functional unit
specific impacts are strongly impacted by the device’s lifespan and thus reusing can be
considered as a better option for both impact categories, as long as the devices are also
efficiently recycled after the second life cycle. C2 was able to provide second life cycle
for almost all of the devices that are procured through them, and they had also taken into
account the recycling intensity after the second life cycle. C1 does not provide reuse
services, but in their case the City of Helsinki can organize reuse by utilizing the services
of Uusix workshop. Lastly, the lifespan can also be extended by lengthening the contract
period if the devices’ capacities are still considered as functionally sufficient.
These pieces of information support the City of Helsinki in achieving the targets of the
procurement related actions of The City of Helsinki’s Roadmap for Circular and Sharing
Economy. The results also support the City of Helsinki in their other strategies, such as
Helsinki City Strategy for 2017–2021, Carbon-neutral Helsinki 2035 Action Plan, and
the new procurement strategy. Cities have been considered as especially important drivers
for the transition to circular economy, and changes in city level practices will also impact
the transition on a country level. Finland being one of the most highly digitalized
countries in the world, and the City of Helsinki being the largest public procurement
operator in Finland, it is possible for the City of Helsinki to act as a leading example in
the circular economy transition process. Due to the significant procurement volumes of
the city, changes in procurement practices can lead to significant environmental savings
in both studied impact categories. According to various scholars, digitalization will
continue to accelerate in the future, and early reacting to this societal development allows
effective mitigation of the environmental impacts that stem from this development.
74
Due to the lack of real-world business-related case studies of the potential environmental
savings that can be acquired through circular economy -based measures, it is important
to carry out more such studies in the future. The concept of circular economy is still
relatively ambiguous, and although the conceptualization of circular economy in different
studies has already been assessed, it is also important to assess how it is being
conceptualized by different companies that argue to follow the principles of circular
economy in their operations. Precise definition of the concept makes it more challenging
to use the concept as a tool for green washing, and it clarifies the desired tendencies of
this societal transition. Tablet being relatively new kind of terminal, it is also important
to carry out more research about the material impacts of tablets and their components. As
digitalization is considered to be an accelerating process, it is important that the research
field actively seeks to keep up to date with this development and its consequences. Further
research needs to also focus on the impacts of ICT devices on human toxicity, as it is
another relevant impact category that was not assessed as a part of this study.
Finally, it is important for the City of Helsinki to actively keep track of their procurement
volumes and the course of their devices. If the end-of-life treatments are not carried out
in a systematic manner, there is a risk that after the first life cycle the devices remain
unused in a storage and the remaining use potential will be wasted. The companies that
were interviewed did not have detailed information about the recycling efficacy of their
subcontractor and in the future it is important that in order to achieve transparency, both
companies and the City of Helsinki should require this information. In addition to life
cycle management, it is also important to consider the role of the electricity mix in
defining the environmental impacts of the use phase and aim to utilize renewable energy.
If the devices are sold to secondhand markets, it is also essential to ensure the recycling
efficiency that the devices will ultimately be treated with. This will make the reusing
practices and the material cycles more transparent.

75
References Ahmed, F., Naeem, M. & Iqbal, M. (2016) ICT and renewable energy: a way forward to
the next generation telecom base stations. Telecommunication Systems, Vol. 64,
43–56.
Alastalo, M., Vaittinen, T. & Åkerman, M. (2017) Asiantuntijahaastattelu. In:
Tutkimushaastattelun käsikirja, eds. Hyvärinen, M.– Nikander, P. – Ruusuvuori,
J., Vastapaino.
Alastalo, M. & Åkerman, M. (2010) Asiantuntijahaastattelun analyysi: faktojen jäljillä.
In: Haastattelun analyysi, eds. Ruusuvuori, J. – Nikander, P. – Hyvärinen, M.
Vastapaino, Tampere.
Alcaraz, M., Noshadravan, A., Zgola, M., Kirchain, R. & Olivetti, E. (2018)
Streamlined Life Cycle Assessment: A Case Study on Tablets and Integrated
Circuits. Journal of Cleaner Production,Vol. 200, 819–826.
Alcott, B. (2005) Jevons’ paradox. Ecological Economics, Vol. 54 (1), 9–21.
Andrae, A. & Vaija, M. (2014) To which degree does sector specific standardization
make life cycle assessments comparable? – The case of global warming
potential of smartphones. Challenges, Vol. 5 (2), 409–429.
Andrae, A. & Vaija, M. (2017) The life cycle assessments of an optical network terminal
and a tablet: Experiences of the product environmental footprint methodology.
In: Advances in Environmental Research, eds. Daniels, J.A., Nova Science
Publishers, New York.
André, H., Söderman, M–L. & Nordelöf, A. (2019) Resource and environmental
impacts of using second-hand laptop computers: A case study of commercial
reuse. Waste Management, Vol. 88, 268–279.
Aveyard, H. (2014) Doing a literature review in health and social care: a practical
guide. Open University Press, Cambridge.
Baumann, H. & Tillman, A-M. (2004) The Hitch Hiker’s Guide to LCA: An orientation
in life cycle assessment methodology and application. Studentlitteratur, Lund.
Beemsterboer, S., Baumann, H. & Wallbaum, H. (2020) Ways to get work done: a
review and systematisation of simplification practices in the LCA literature. The
International Journal of Life Cycle Assessment, Vol. 25, 2154–2168.
Bettany-Saltikov, J. (2012) How to do a Systematic Literature Review in Nursing? A
step-by-step guide. McGraw-Hill Education, Maidenhead.
Bieser, C. & Hilty, L. (2018) Assessing Indirect Environmental Effects of Information
and Communication Technology (ICT): A Systematic Literature Review.
Sustainability, Vol. 10 (8).

76
Bogner, A., Littig, B. & Menz, W. (2009) Introduction: Expert Interviews – An
Introduction to a New Methodological Debate. In: Interviewing Experts, eds.
Bogner, A. – Littig B. – Menz, W. Palgrave Macmillan.
Boldoczki, S., Thorenz, A. & Tuma, A. (2020) The environmental impacts of
preparation for reuse: A case study of WEEE reuse in Germany. Journal of
Cleaner Production. Vol. 252.
Brynjolfsson, E. & McAfee, A. (2014) The Second Machine Age: Work, Progress, and
Prosperity in a Time of Brilliant Technologies. Norton & Company, New York.
Buchert, M., Manhart, A., Bleher, D. & Pingel, D. (2012) Recycling Critical Raw
Materials from Waste Electronic Equipment. Öko-Institut eV, Freiburg.
Castells, M. & Himanen, P. (2002) The Information Society and the Welfare State: The
Finnish Model. Oxford University Press, New York.
City of Helsinki Urban Environment Division (2020) The City of Helsinki’s Roadmap
for Circular and Sharing Economy. The City of Helsinki’s Urban Environment
Publications, Vol. 10.
Clément, L–P., Jacquemotte, Q. & Hilty, L. (2020) Sources of variation in life cycle
assessments of smartphones and tablet computers. Environmental Impact
Assessment Review, Vol. 84.
Crocker, R., Saint, C., Chen, G. & Tong, Y. (2018) Unmaking Waste in Production and
Consumption: Towards The Circular Economy. Emerald Publishing Limited,
Bingley.
Cucchiella, F., D’Adamo, I., Koh, S.C.L. & Rosa, P. (2015) Recycling of WEEEs: An
economic assessment of present and future e-waste streams. Renewable and
Sustainable Energy Reviews, Vol. 51, 263–272.
Dufva, M. (2020) Megatrendit 2020. Sitra: Sitra studies 162. Erweko, Vantaa.
Ellen MacArthur Foundation (2013) Towards the Circular Economy Vol. 2:
Opportunities for the consumer goods sector. Ellen MacArthur Foundation.
Ellen MacArthur Foundation (2019A) Circular Economy in Cities: Project Guide. Ellen
MacArthur Foundation, Arup.
Ellen MacArthur Foundation (2019B) Completing the Picture: How the Circular
Economy Tackles Climate Change. Ellen MacArthur Foundation, Material
Economics.
Fink, A. (2005) Conducting Research Literature Reviews: From the Internet to the
Paper. SAGE Publications, London.
Hart, C. (1998) Doing a Literature Review: Releasing the Social Science Research
Imagination. SAGE Publications, London.
77
Helsinki (2020) Helsingin kaupungin hankintastrategia 2020. Helsingin
kaupunginkanslia, Talous- ja suunnitteluosasto, Helsinki.
Herring, H. (2006) Energy efficiency a critical view. Energy. Vol. 31(1), 10–20.
Hischier, R., Achachlouei, M.A. & Hilty, L.M., (2014A). Evaluating the sustainability
of electronic media: Strategies for life cycle inventory data collection and their
implications for LCA results. Environmental Modelling & Software, Vol. 56,
27–36.
Hischier, R., Coroama, V–C., Schien, D. & Achachlouei, M–A. (2014B) Grey Energy
and Environmental Impacts of ICT Hardware. In: ICT Innovations for
Sustainability, eds. Hilty, L. & Aebischer, B., Springer, Cham.
Hickel, J. & Kallis, G. (2019) Is Green Growth Possible? New Political Economy. Vol.
25 (4), 469–486.
Hiekkanen, K., Seppälä, T. & Ylhäinen, I. (2020) Energy and Electricity Consumption
of the ICT sector in Finland. ETLA Report 104, ETLA.
Häikiö, L. & The ORSI consortium (2020) Towards an Eco-Welfare State:
Orchestrating for Systemic Impact (ORSI).
<https://www.ecowelfare.fi/en/2020/01/14/towards-an-eco-welfare-state-
orchestrating-for-systemic-impact-orsi/>, retrieved 22.7.2020.
ISO 14040 (2006) Environmental management. Life cycle assessment. Principles and
framework. Finnish Standards Association SFS.
ISO 14044 (2006) Environmental management. Life cycle assessment. Requirements
and guidelines. Finnish Standards Association SFS.
Jevons, W.S. (1865) The coal question: can Britain survive? In: The Coal Question: An
Inquiry Concerning the Progress of the Nation, and the Probable Exhaustion of
Our Coal-mines, eds. Flux, A.W., Augustus M. Kelley, New York.
Kahhat, R. (2012) Electronic Waste Environment and Society. In: E-Waste
management: From waste to resource, eds. Hieronymi, K. – Kahhat, R. –
Williams, E., 5–23, Routledge.
Kasulaitis, P., Babbitt, C., Kahhat, R. & Williams, E. (2015) Evolving materials,
attributes, and functionality in consumer electronics: Case study of laptop
computers. Resources, Conservation and Recycling, Vol. 100, 1–10.
Kerdlap, P., Gheewala, S. & Ramakrishna, S. (2020) To Rent or Not to Rent: A Question
of Circular Prams from a Life Cycle Perspective. Sustainable Production and
Consumption, Vol. 26, 331–342.

78
Kirchherr, J., Reike, D. & Hekkert, M. (2017) Conceptualizing the circular economy:
An analysis of 114 definitions. Resources, Conservation & Recycling, Vol. 127,
221–232.
Kjaer, L., Pigosso, D., McAloone, T., & Birkved, M. (2018) Guidelines for evaluating
the environmental performance of Product/Service-Systems through life cycle
assessment. Journal of Cleaner Production, Vol. 190, 666–678.
Kuusniemi, M-E. (2013) Viitetietokantojen sinivalas Scopus palvelee monia
tieteenaloja. Verkkari 2013 (3), University of Helsinki.
Lange, S., Pohl, J. & Santarius, T. (2020) Digitalization and energy consumption. Does
ICT reduce energy demand? Ecological Economics, Vol. 176.
Lehtinen, H. (2018) Työasemien ja älypuhelimien kierto kaupungilla.
Ympäristöpalvelujen selvitys 2018, Helsinki.
Mao, J., Li, C., Pei, Y. & Xu, L. (2018) Circular economy and sustainable development
enterprises. Springer, Singapore.
Meyer, D. & Katz, J. (2015) Analyzing the environmental impacts of laptop enclosures
using screening-level life cycle assessment to support sustainable consumer
electronics. Journal of Cleaner Production, Vol. 112, 369–383.
Miettinen, R. (2013) Innovation, Human Capabilities, and Democracy: Towards an
Enabling Welfare State. Oxford University Press, Oxford.
Ministry for Foreign Affairs of Finland (2020) Agenda 2030 – Sustainable Development
Goals. <https://um.fi/agenda-2030-sustainable-development-goals>, retrieved
23.7.2020.
Mollick, E. (2006) Establishing Moore’s Law. IEEE Annals of the History of
Computing, Vol. 28 (3), 62–75.
Ojala, T., Mettälä, M., Heinonen, M. & Oksanen, P. (2020) The ICT sector, climate and
the environment – Interim report of the working group preparing an ICT climate
and environmental strategy. Publications of the Ministry of Transport and
Communications 9/2020. Ministry of Transport and Communications, Helsinki.
Packer, M. (2011) The Science of Qualitative Research. Cambridge University Press,
New York.
Pesonen, H. & Horn, S. (2013) Evaluating the Sustainability SWOT as a streamlined
tool for life cycle sustainability assessment. The International Journal of Life
Cycle Assessment, Vol. 18(9), 1780–1792.
Raghavan, S. (2010) Don’t Throw It Away: The Corporate Role in Product Disposition,
Journal of Business Strategy, Vol. 31 (3), 50–55.

79
Rosa, H. (2013) Social Acceleration: A New Theory of Modernity. Columbia University
Press, New York.
Rosa, H. & Scheuerman, W.E. (2009) High-Speed Society Social Acceleration, Power
and Modernity. The Pennsylvania State University Press, Pennsylvania.
Røpke, I. & Christensen, T.H. (2012) Energy impacts of ICT – Insights from an
everyday life perspective. Telematics and Informatics, Vol. 29 (4), 348–361.
Sabbaghi, M. & Behdad, S. (2017) Environmental Evaluation of Product Design
Alternatives: The Role of Consumer’s Repair Behavior and Deterioration of
Critical Components. Journal of Mechanical Design, Vol. 139 (8).
Salminen, A. (2011) Mikä kirjallisuuskatsaus? Johdatus kirjallisuuskatsauksen
tyyppeihin jahallintotieteellisiin sovelluksiin. Vaasan yliopiston julkaisuja,
Vaasa.
Schwab, K. (2016) The Fourth Industrial Revolution. World Economic Forum, Geneva.
Sihvonen, S. & Ritola, T. (2015) Conceptualizing ReX for Aggregating End-of-life
Strategies in Product Development. Procedia CIRP, Vol. 29, 639–644.
Sorrell, S. (2009) Jevons’ Paradox revisited: The evidence for backfire from improved
energy efficiency. Energy policy, Vol. 37 (4), 1456–1469.
Teehan, P. & Kandlikar, M. (2013) Comparing embodied greenhouse gas emissions of
modern computing and electronics products. Environmental Science &
Technology, Vol. 47(9), 3997–4003.
The Global E-Waste Statistics Partnership (2021) Country and Regional Sheets.
<https://globalewaste.org/country-sheets/>, retrieved 14.4.2021.
Van Eygen, E., De Meester, S., Tran, H-P. & Dewulf, J. (2015) Resource savings by
urban mining: The case of desktop and laptop computers in Belgium.
Sustainable Materials Management, Report no. 17, Leuven.
Vermunt, D., Negro, S., Verweij, P., Kuppens, D. & Hekker, M. (2018) Exploring
barriers to implementing different circular business models. Journal of Cleaner
Production, Vol. 222, 891–902.
Wirén, S., Vuorela, K., Müller, T. & Laitinen, K. (2019) Turning Finland into the world
leader in communications networks – Digital infrastructure strategy 2025.
Publications of the Ministry of Transport and Communications 10/2018.
Ministry of Transport and Communications, Helsinki.
WWF (2018) Living Planer Report 2018: Aiming Higher. Grooten, M. & Almond,
R.E.A. (Eds). WWF, Gland, Switzerland.

80
Wäger, P.A., Hischier, R. & Widmer, R. (2014) The Material Basis of ICT. In: ICT
Innovations for Sustainability. Advances in Intelligent Systems and Computing,
eds. Hilty, L.M. – Aebischer, B., Springer International Publishing.
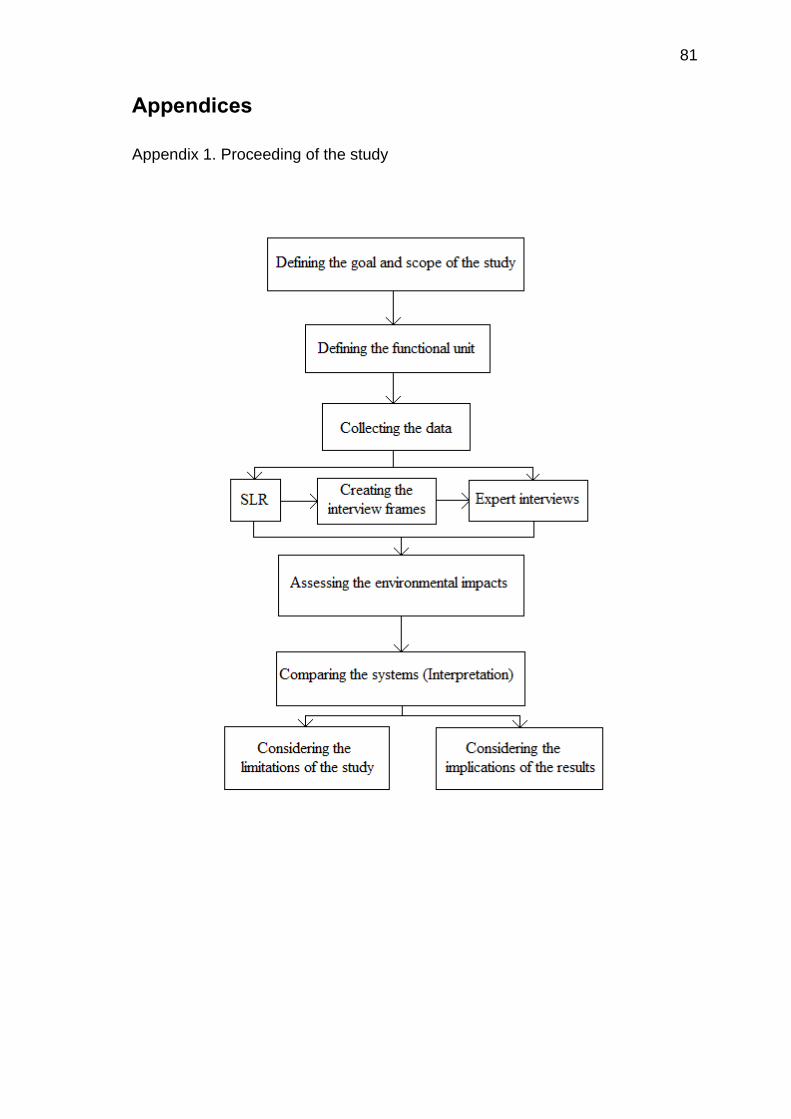
81
Appendices
Appendix 1. Proceeding of the study

82
Appendix 2. Results of SLR
Article and
publishing
information
Theme/Topic Methods Key findings/results
for this study
Alcaraz, M.,
Noshadravan, A.,
Zgola, M., Kirchain,
R. & Olivetti, E.
(2018)
Streamlined life cycle
assessment: A case
study on tablets and
integrated circuits.
Journal of Cleaner
Production, Vol. 200,
819–826.
To carry out the
structured under-
specification and
probabilistic triage
method and to develop
metrics for determining
when enough data has
been collected to carry
out reliable streamlined
LCA. The efficiency of
this method is
demonstrated on a case
study on tablets.
Streamlined life cycle
assessment/Structured
under-specification
and probabilistic
triage
- Most impactful
components for
tablets.
- Manufacturing
phase is most
important in terms of
the devices’
environmental
impacts.
- Shares of different
life cycle stages for
the devices’ total
CO2e emissions.
- Variables that define
the impact of the use
phase.
- There are brand
specific differences in
terms of the devices’
impacts.
Andrae, A. & Vaija,
M. (2017)
The life cycle
assessments of an
optical network
terminal and a tablet:
Experiences of the
product
environmental
footprint
methodology.
Advances in
Environmental
Research.
To use product
environmental footprint
method (PEF) to study
the impact of two
goods: optical network
terminal (ONT) and a
tablet device.
Screening life cycle
assessment
Product
environmental
footprint method
- The most significant
stages of tablets’ life
cycle in terms of
climate change.
- Tablets’
environmental
impacts are mostly
found in production
phase
André, H., Söderman,
M–L. & Nordelöf, A.
(2019)
Resource and
environmental
impacts of using
How the use of second-
hand laptops reduces
different types of
environmental impact,
through reuse and
recycling, compared to
use of new ones.
Life cycle assessment - The devices become
prematurely
obsolescent and are
being underutilized
by consumers.
- There is an
important gap at the
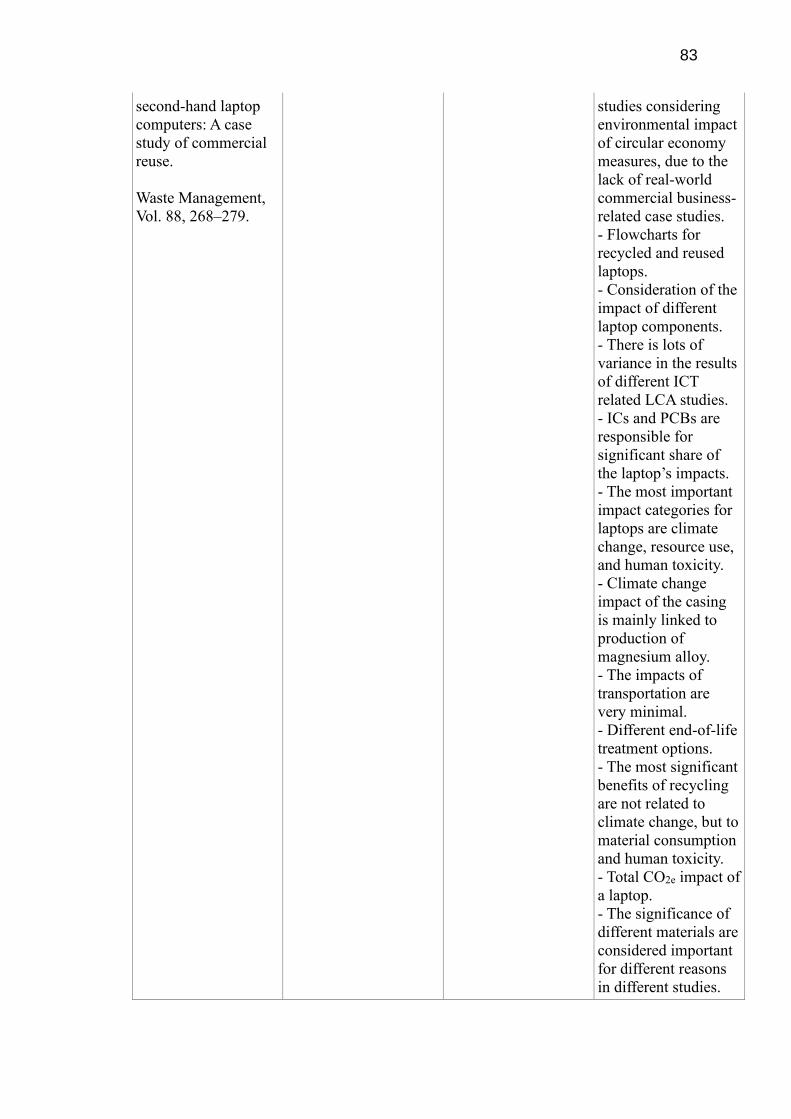
83
second-hand laptop
computers: A case
study of commercial
reuse.
Waste Management,
Vol. 88, 268–279.
studies considering
environmental impact
of circular economy
measures, due to the
lack of real-world
commercial business-
related case studies.
- Flowcharts for
recycled and reused
laptops.
- Consideration of the
impact of different
laptop components.
- There is lots of
variance in the results
of different ICT
related LCA studies.
- ICs and PCBs are
responsible for
significant share of
the laptop’s impacts.
- The most important
impact categories for
laptops are climate
change, resource use,
and human toxicity.
- Climate change
impact of the casing
is mainly linked to
production of
magnesium alloy.
- The impacts of
transportation are
very minimal.
- Different end-of-life
treatment options.
- The most significant
benefits of recycling
are not related to
climate change, but to
material consumption
and human toxicity.
- Total CO2e impact of
a laptop.
- The significance of
different materials are
considered important
for different reasons
in different studies.

84
- Typical life cycle for
a laptop is
approximately 4 years
and the second life
cycle is
approximately 2–3
years.
Bieser, C. & Hilty, L.
(2018)
Assessing Indirect
Environmental
Effects of Information
and Communication
Technology (ICT): A
Systematic Literature
Review.
Sustainability, Vol. 10
(8).
To assess different
approaches that have
been taken in studies
considering indirect
environmental impacts
of ICT.
Systematic literature
review of existing
assessments of ICT’s
indirect
environmental
impacts.
- Definitions of direct
and indirect ICT
emissions.
Boldoczki, S.,
Thorenz, A. & Tuma,
A. (2020)
The environmental
impacts of
preparation for reuse:
A case study of
WEEE reuse in
Germany
Journal of Cleaner
Production Vol. 252.
Exploring the potential
benefits of preparation
for reuse (PfR) to other
waste management
options, including a
review for laptops.
Life cycle assessment - For small electric
devices, such as
laptops, the
production phase is
most dominant, and
reuse leads to large
savings in almost
every impact
category.
- The optional end-of-
life treatments.
- Recycling can be
more beneficial than
reusing, if the
emissions are mainly
caused by use phase.
But if the
manufacturing phase
is the main cause,
reuse is better option
in terms of
environmental
impacts.
Clément, L–P.,
Jacquemotte, Q. &
Hilty, L. (2020)
Sources of variation
in life cycle
Analysing the studies
that report the
environmental impacts
of smartphones and
tablets. Identifying the
Literature review of
LCA studies/Meta-
analysis of LCAs
- Production phase is
the most important
part of the tablet’s life
cycle in terms of
environmental
impacts. Together

85
assessments of
smartphones and
tablet
computers.
Environmental Impact
Assessment Review,
Vol. 84.
main sources of
variation in their LCAs.
with use phase they
account for over 90%
of the total impacts.
- There are only two
previously conducted
transparent LCA
studies for tablets.
- The most impactful
components of tablets
and their CO2e
emissions.
- The electricity mix
that is used has also
important role for the
impacts.
- Average life cycle of
a tablet is
approximately 3
years.
- Assembly phase
does not contribute
significantly to the
CO2e emissions.
Hischier, R.,
Coroama, V–C.,
Schien, D. &
Achachlouei, M– A.
(2014B)
Grey Energy and
Environmental
Impacts of ICT
Hardware.
In: ICT Innovations
for Sustainability, eds.
Hilty, L. & Aebischer,
B., 171–189,
Springer, Cham.
To form a more
comprehensive picture
of the total energy
requirement and
releases during the
whole life cycle of the
assessed ICT devices.
Life cycle assessment - The impacts of
assembly and end-of-
life treatment phases
are not significant.
- Impacts of the most
important life cycle
stages of laptops.
- Compared to a
laptop, the share of
non-renewable energy
being used with tablet
is smaller by the
factor of ¾.
- Typical life cycle for
a laptop is
approximately 4
years.

86
Kasulaitis, P., Babbitt,
C., Kahhat, R. &
Williams, E. (2015)
Evolving materials,
attributes, and
functionality in
consumer electronics:
Case study of laptop
computers.
Resources,
Conservation and
Recycling, Vol. 100,
1–10.
To study material
intensity of laptop
computer for different
model years and to
understand the variance
and dematerialization
that occurs due to
product development.
Also, to study potential
of life cycle inventory
approximations for
consumer electronics.
Life cycle assessment
Bill of attributes
- Semiconductor
manufacturing
contributes
significantly to
electronic products’
environmental
impacts, and majority
of these are contained
e.g. in motherboard.
- Product weight loss
is less than 2%
annually between
different model years,
but there are
significant differences
between different
sized devices. Most
significant change is
the shift from plastic
casings to aluminium
casings.
- An average laptop
weights
approximately 2.5 kg.
Meyer, D. & Katz, J.
(2015)
Analyzing the
environmental
impacts of laptop
enclosures using
screening-level life
cycle assessment to
support sustainable
consumer electronics.
Journal of Cleaner
Production, Vol. 112,
369–383.
To form a better
understanding of
promoting
environmentally
sustainable electronics
by using different
laptop case materials.
Different materials are
compared, such as
plastic, bamboo, and
aluminium.
Screening life cycle
assessment
- Majority of laptop’s
CO2 emissions stem
from manufacturing.
- A large share of the
plastic in the casings
ends up in the
landfills, as the
separation of plastics
is difficult and not
economically viable.
- Use of PCR has
significant
environmental
benefits compared to
the use of virgin
materials.
- Using recyclable
aluminium is not
better option than
using plastic, if the
post-consumer
recyclability is too
low.
Sabbaghi, M. &
Behdad, S. (2017)
To investigate the
environmental impact
Life cycle assessment - Consumer behavior
is affected by

87
Environmental
Evaluation of Product
Design Alternatives:
The Role of
Consumer’s Repair
Behavior and
Deterioration of
Critical Components.
Journal of Mechanical
Design, Vol. 139.
of components’
deterioration and
consumers’ decisions to
repair the devices.
manufacturer’s
planned obsolescence
and the release time
of new technologies.
- If the repair costs
exceed a threshold,
consumers are not
willing to repair their
devices.
- The decision to
repair a device is also
impacted by the
norms, values, and
beliefs.
Van Eygen, E., De
Meester, S., Tran, H-
P. & Dewulf, J.
(2015)
Resource savings by
urban mining: The
case of desktop and
laptop computers in
Belgium.
Sustainable Materials
Management, Report
no. 17, Leuven.
Assessing the
performance of WEEE
recycling of laptops
and desktop computers
in Belgium.
Life cycle assessment
Material flow analysis
(MFA)
Cumulative Exergy
Extraction from the
Natural Environment
(CEENE) method
- PCBs contain lots of
precious metals.
- Large share of PC-
ABS plastics is
landfilled.
- Recycling a laptop
saves approximately
87% of the natural
resources compared
to landfilling.
- Recycling
treatments for
different components
and materials.
- Casing material
forms the biggest
share of the laptop’s
materials.
- Material
composition of 1000
kg of disposed laptops
and their recycling
rates.
- Reusing can also be
worse option than
recycling in terms of
material impact, if the
devices are not treated
properly after the
second life cycle.
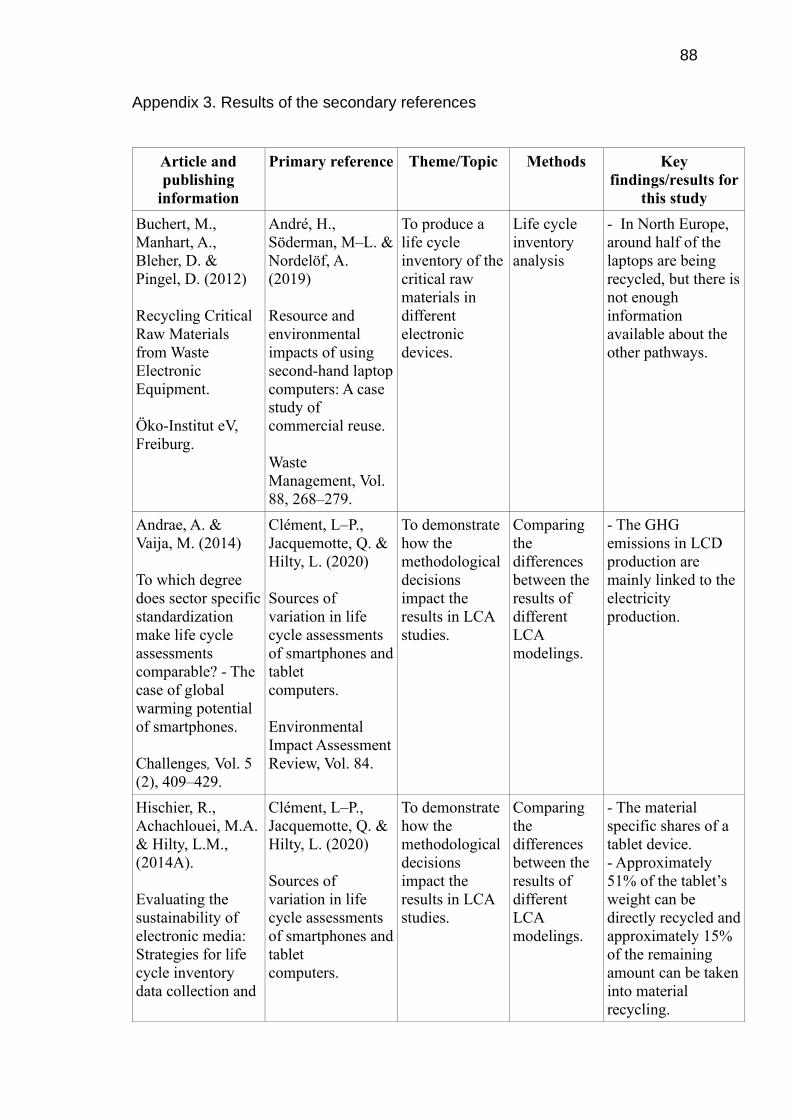
88
Appendix 3. Results of the secondary references
Article and
publishing
information
Primary reference Theme/Topic Methods Key
findings/results for
this study
Buchert, M.,
Manhart, A.,
Bleher, D. &
Pingel, D. (2012)
Recycling Critical
Raw Materials
from Waste
Electronic
Equipment.
Öko-Institut eV,
Freiburg.
André, H.,
Söderman, M–L. &
Nordelöf, A.
(2019)
Resource and
environmental
impacts of using
second-hand laptop
computers: A case
study of
commercial reuse.
Waste
Management, Vol.
88, 268–279.
To produce a
life cycle
inventory of the
critical raw
materials in
different
electronic
devices.
Life cycle
inventory
analysis
- In North Europe,
around half of the
laptops are being
recycled, but there is
not enough
information
available about the
other pathways.
Andrae, A. &
Vaija, M. (2014)
To which degree
does sector specific
standardization
make life cycle
assessments
comparable? - The
case of global
warming potential
of smartphones.
Challenges, Vol. 5
(2), 409–429.
Clément, L–P.,
Jacquemotte, Q. &
Hilty, L. (2020)
Sources of
variation in life
cycle assessments
of smartphones and
tablet
computers.
Environmental
Impact Assessment
Review, Vol. 84.
To demonstrate
how the
methodological
decisions
impact the
results in LCA
studies.
Comparing
the
differences
between the
results of
different
LCA
modelings.
- The GHG
emissions in LCD
production are
mainly linked to the
electricity
production.
Hischier, R.,
Achachlouei, M.A.
& Hilty, L.M.,
(2014A).
Evaluating the
sustainability of
electronic media:
Strategies for life
cycle inventory
data collection and
Clément, L–P.,
Jacquemotte, Q. &
Hilty, L. (2020)
Sources of
variation in life
cycle assessments
of smartphones and
tablet
computers.
To demonstrate
how the
methodological
decisions
impact the
results in LCA
studies.
Comparing
the
differences
between the
results of
different
LCA
modelings.
- The material
specific shares of a
tablet device.
- Approximately
51% of the tablet’s
weight can be
directly recycled and
approximately 15%
of the remaining
amount can be taken
into material
recycling.
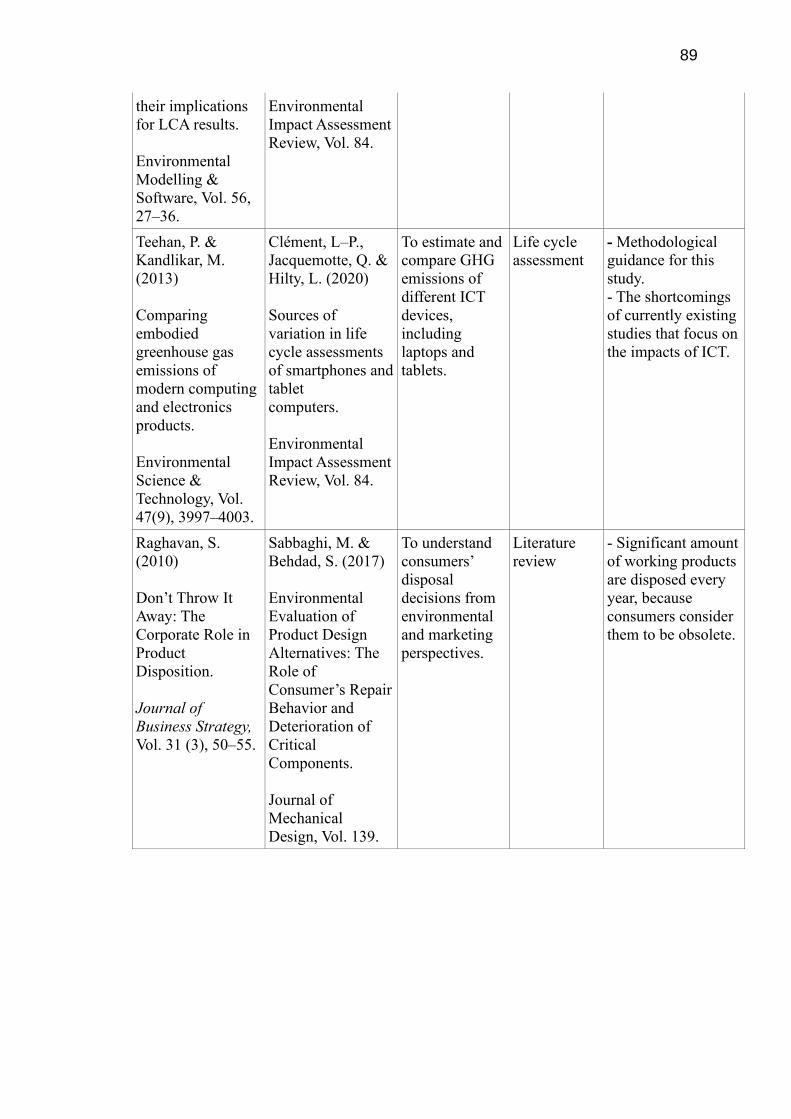
89
their implications
for LCA results.
Environmental
Modelling &
Software, Vol. 56,
27–36.
Environmental
Impact Assessment
Review, Vol. 84.
Teehan, P. &
Kandlikar, M.
(2013)
Comparing
embodied
greenhouse gas
emissions of
modern computing
and electronics
products.
Environmental
Science &
Technology, Vol.
47(9), 3997–4003.
Clément, L–P.,
Jacquemotte, Q. &
Hilty, L. (2020)
Sources of
variation in life
cycle assessments
of smartphones and
tablet
computers.
Environmental
Impact Assessment
Review, Vol. 84.
To estimate and
compare GHG
emissions of
different ICT
devices,
including
laptops and
tablets.
Life cycle
assessment
- Methodological
guidance for this
study.
- The shortcomings
of currently existing
studies that focus on
the impacts of ICT.
Raghavan, S.
(2010)
Don’t Throw It
Away: The
Corporate Role in
Product
Disposition.
Journal of
Business Strategy,
Vol. 31 (3), 50–55.
Sabbaghi, M. &
Behdad, S. (2017)
Environmental
Evaluation of
Product Design
Alternatives: The
Role of
Consumer’s Repair
Behavior and
Deterioration of
Critical
Components.
Journal of
Mechanical
Design, Vol. 139.
To understand
consumers’
disposal
decisions from
environmental
and marketing
perspectives.
Literature
review
- Significant amount
of working products
are disposed every
year, because
consumers consider
them to be obsolete.

90
Appendix 4. Interview questions in English for the Company 1
Section 1: General practices
1. Could you describe Company 1’s warranty policies for the devices? (Is it common
that the devices that are in the office use need to be repaired during the warranty period?
If so, can you say what kind problems are most typically repaired within the warranty
period?)
2. Can you tell me about the reasons why a laptop or tablet computer purchased from
the Company 1 most often arrives back to you as a disposal? (Is it more often, for
example, that the pre-defined service life of the equipment has been reached, or that the
equipment has broken down after the warranty period, or for some other reason?)
3. What is the average length of the life cycle of the laptops or tablets, after which they
will be returned to you as disposals?
4. Can you name a certain manufacturer or model that would have been particularly
popular in office use, and which represents a significant proportion of the equipment
provided by Company 1?
Section 2: Reuse of the devices
5. Does the Company 1 provide some kind of reuse service for incoming devices, such
as replacing damaged components and reselling the device for a lower price?
5.1 If yes,
5.1.1 Are there any specific components that need to be most often renewed in order to
make the device reusable? Could you estimate a percentage share for the devices that
need these kinds of replacements in order to make them reusable?
5.1.2 Do you use new or used components for making the devices reusable?
5.1.3 How long are the second life cycles for reused laptops and tablets?
5.1.4 How big is the share of discarded laptops and tablets that can be given a second
life cycle by replacing components?
5.1.5 Which customer groups are mainly interested in purchasing reused equipment?
Would you be able to estimate the percentage shares of these customer groups?
5.2 If no,
5.2.1 In your opinion, what are the main challenges for the provision of reuse services
from the perspective of the IT-device supplier?
5.2.2 Can you say whether there has been a discussion about the possibility to provide
reuse services by the Company 1?
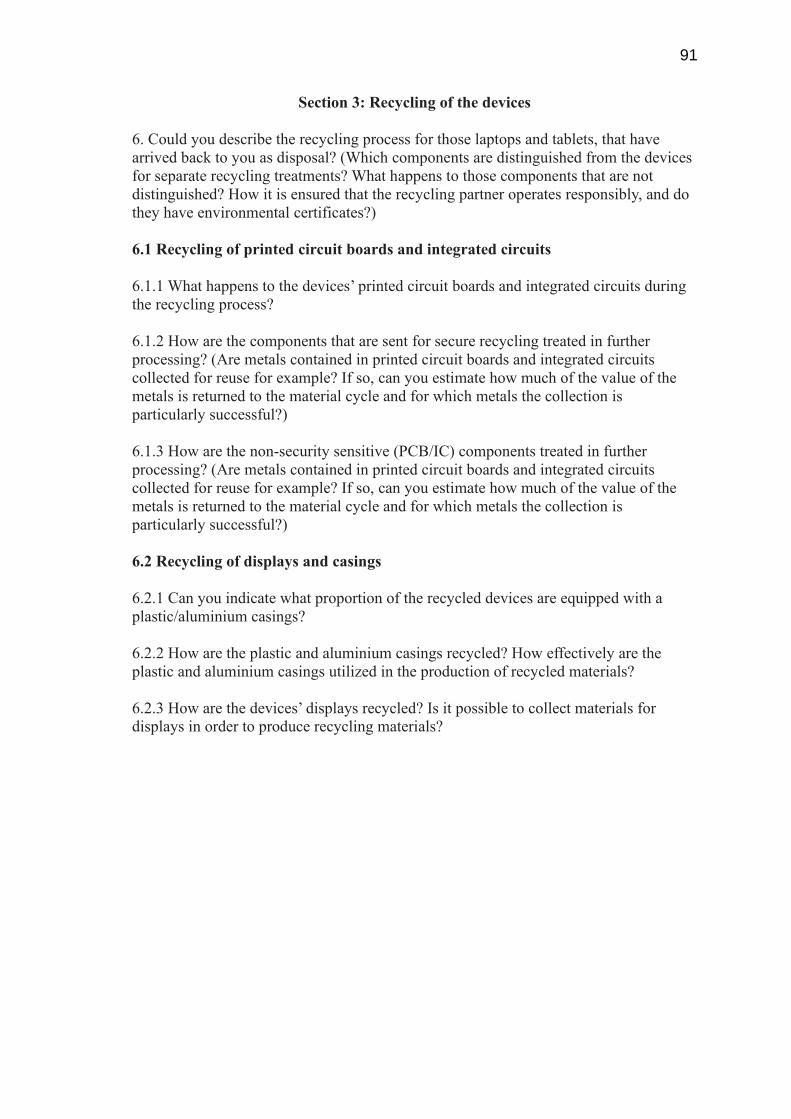
91
Section 3: Recycling of the devices
6. Could you describe the recycling process for those laptops and tablets, that have
arrived back to you as disposal? (Which components are distinguished from the devices
for separate recycling treatments? What happens to those components that are not
distinguished? How it is ensured that the recycling partner operates responsibly, and do
they have environmental certificates?)
6.1 Recycling of printed circuit boards and integrated circuits
6.1.1 What happens to the devices’ printed circuit boards and integrated circuits during
the recycling process?
6.1.2 How are the components that are sent for secure recycling treated in further
processing? (Are metals contained in printed circuit boards and integrated circuits
collected for reuse for example? If so, can you estimate how much of the value of the
metals is returned to the material cycle and for which metals the collection is
particularly successful?)
6.1.3 How are the non-security sensitive (PCB/IC) components treated in further
processing? (Are metals contained in printed circuit boards and integrated circuits
collected for reuse for example? If so, can you estimate how much of the value of the
metals is returned to the material cycle and for which metals the collection is
particularly successful?)
6.2 Recycling of displays and casings
6.2.1 Can you indicate what proportion of the recycled devices are equipped with a
plastic/aluminium casings?
6.2.2 How are the plastic and aluminium casings recycled? How effectively are the
plastic and aluminium casings utilized in the production of recycled materials?
6.2.3 How are the devices’ displays recycled? Is it possible to collect materials for
displays in order to produce recycling materials?
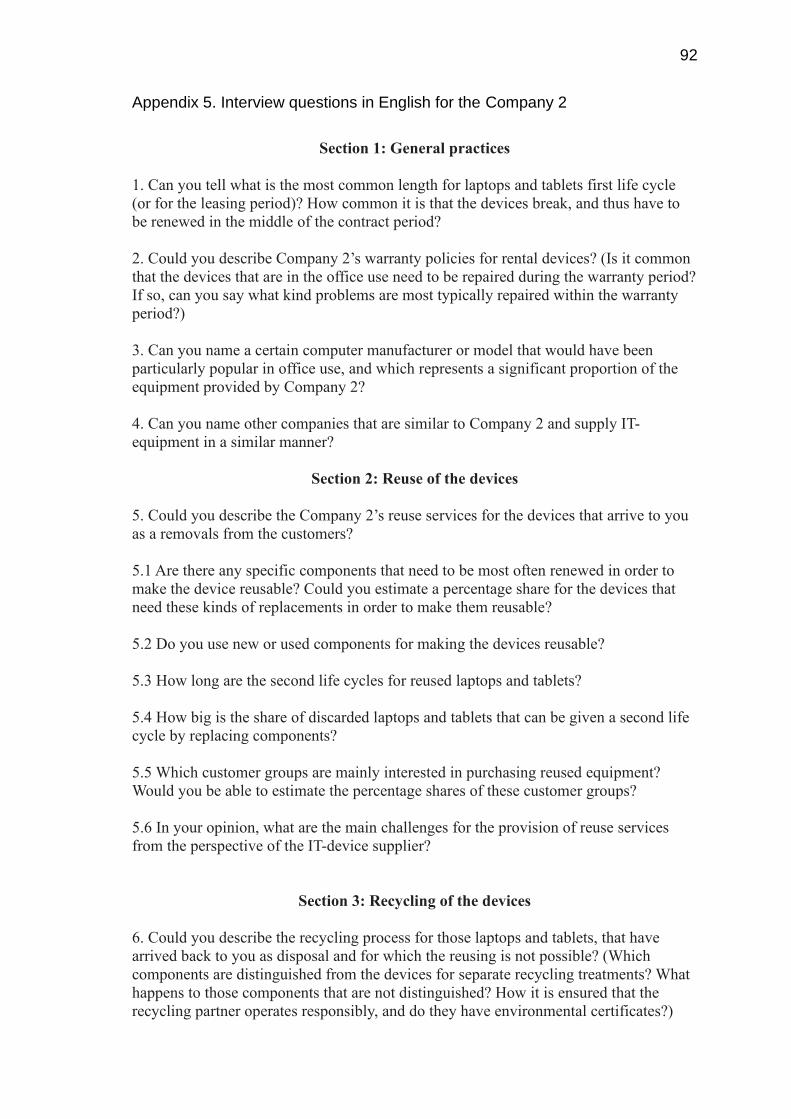
92
Appendix 5. Interview questions in English for the Company 2
Section 1: General practices
1. Can you tell what is the most common length for laptops and tablets first life cycle
(or for the leasing period)? How common it is that the devices break, and thus have to
be renewed in the middle of the contract period?
2. Could you describe Company 2’s warranty policies for rental devices? (Is it common
that the devices that are in the office use need to be repaired during the warranty period?
If so, can you say what kind problems are most typically repaired within the warranty
period?)
3. Can you name a certain computer manufacturer or model that would have been
particularly popular in office use, and which represents a significant proportion of the
equipment provided by Company 2?
4. Can you name other companies that are similar to Company 2 and supply IT-
equipment in a similar manner?
Section 2: Reuse of the devices
5. Could you describe the Company 2’s reuse services for the devices that arrive to you
as a removals from the customers?
5.1 Are there any specific components that need to be most often renewed in order to
make the device reusable? Could you estimate a percentage share for the devices that
need these kinds of replacements in order to make them reusable?
5.2 Do you use new or used components for making the devices reusable?
5.3 How long are the second life cycles for reused laptops and tablets?
5.4 How big is the share of discarded laptops and tablets that can be given a second life
cycle by replacing components?
5.5 Which customer groups are mainly interested in purchasing reused equipment?
Would you be able to estimate the percentage shares of these customer groups?
5.6 In your opinion, what are the main challenges for the provision of reuse services
from the perspective of the IT-device supplier?
Section 3: Recycling of the devices
6. Could you describe the recycling process for those laptops and tablets, that have
arrived back to you as disposal and for which the reusing is not possible? (Which
components are distinguished from the devices for separate recycling treatments? What
happens to those components that are not distinguished? How it is ensured that the
recycling partner operates responsibly, and do they have environmental certificates?)

93
6.1 Recycling of printed circuit boards and integrated circuits
6.1.1 What happens to the devices’ printed circuit boards and integrated circuits during
the recycling process?
6.1.2 Are the metals that are contained in printed circuit boards and integrated circuits
collected? If yes, can you estimate how much of the value of the metals is returned to
the material cycle and for which metals the collection is particularly successful? For
which metals the recycling is particularly challenging?
6.2 Recycling of displays and casings
6.2.1 Can you indicate what proportion of the recycled devices are equipped with a
plastic/aluminium casings?
6.2.2 How are the plastic and aluminium casings recycled? How effectively are the
plastic and aluminium casings utilized in the production of recycled materials?
6.2.3 How are the devices’ displays recycled? Is it possible to collect materials for
displays in order to produce recycling materials?

94
Appendix 6. Calculations for the functional unit specific CO2e impacts in different
procurement options
Company 1
Laptops 216 kgCO2e ÷ {(4.5+3)x[(0.25+0.35)÷2]+4.5x[(0.75+0.65)/2]}= 40 kgCO2e
Tablets 120 kgCO2e ÷ {(2.5+2.5)x[(0.25+0.35)÷2]+2.5x[(0.75+0.65)/2]}≈ 37 kgCO2e
Company 2
Laptops 216 kgCO2e ÷ {[(4+3)x0.995]+(4x0.005)}≈ 31 kgCO2e
Tablets 120 kgCO2e ÷ {[(2.5+2.5)x0.995]+(2.5x0.005)}≈ 24 kgCO2e