environmental flows recommendations report · science team (urg bbest) hereby submits its...
TRANSCRIPT

Environmental Flows Recommendations Report
Final Submission to the Environmental Flows
Advisory Group, Rio Grande Basin and Bay Area Stakeholders Committee, and Texas Commission on
Environmental Quality
Upper Rio Grande Basin and Bay Expert Science Team
July 2012

ii
Cover Photo:
The Lower Canyons of the Rio Grande. View is looking downstream towards Big Canyon.
Photo credit: Jeff Bennett, National Park Service

i
Upper Rio Grande
Basin & Bay Expert Science Team
July 12, 2012
The Honorable Troy Fraser, Co-Presiding Officer
Environmental Flows Advisory Group
The Honorable Allan Ritter, Co-Presiding Officer
Environmental Flows Advisory Group
Mark Vickery, P.G., Executive Director
Texas Commission on Environmental Quality
Tony Reisinger, Chair
Rio Grande, Rio Grande Estuary, and Lower Laguna Madre
Basin & Bay Area Stakeholder Committee
Dear Chairman Fraser, Chairman Ritter, Mr. Vickery, and Mr. Reisinger:
Pursuant to its charge under Senate Bill 3 of the 80th Texas Legislature, the Upper Rio Grande Basin & Bay Expert
Science Team (URG BBEST) hereby submits its Environmental Flows Recommendations Report for your
consideration.
Respectively Submitted,
_____________________________ _____________________________
Kevin Urbanczyk, Ph.D., Chair Zhuping Sheng, Ph.D, Vice-Chair
______________________________ _____________________________
Jeff Bennett David Dean
______________________________ _____________________________
Gary Bryant Ryan Smith

ii
Upper Rio Grande Acknowledgements
The Upper Rio Grande Basin & Bay Expert Science Team respectfully and gratefully acknowledge the invaluable
technical and logistical support provided by the following organizations and very capable individuals:
U.S. Geological Survey Grand Canyon Monitoring and Research Center – Jack Schmidt, Ronald Griffiths,
and Thomas Sabol
U.S. Geological Survey – Bruce Moring and David Topping
U.S. Fish and Wildlife Service – Aimee Roberson
Trungale Engineering and Science – Joe Trungale
The Nature Conservancy – John Karges, Corbin Neil, Jason Wrinkle, and Scott McWilliams
Texas Water Development Board – Ruben Solis, Mark Wentzel, Nolan Raphelt, Gayla Ray, Dave Flores,
Mike Vielleux, Caimee Schoenbaechler, and Tony Connel
Texas State University–San Marcos: Timothy Bonner and Thomas Hardy
Texas Parks and Wildlife Department – Ken Saunders, Gary Garrett, Dan Opdyke, Megan Bean, David
Bradsby, and Steve Boles
Texas Commission on Environmental Quality – Cory Horan, Chris Loft, Gregg Easley, and Christine
Kolbe
Texas AgriLife Research
Texas Agrilife Extension Service
Sul Ross State University and the Rio Grande Research Center – Chris Jackson, Rusty Woodburn, Kris
Farmer, and Leslie Hopper
National Park Service – Joe Sirotnak, Raymond Skiles, and Mark Wondzell
International Boundary and Water Commission – Elizabeth Verdecchia
This report may be cited as follows:
Upper Rio Grande Basin and Bay Expert Science Team. 2012. Environmental Flows
Recommendations Report. Final Submission to the Environmental Flows Advisory Group,
Rio Grande Basin and Bay Area Stakeholders Committee and Texas Commission on
Environmental Quality.

iii
Table of Contents
Upper Rio Grande Acknowledgements
Table of Contents
Common Abbreviations
Glossary of Terms
Introduction
Executive Summary
Contents
Section 1. Preamble ........................................................................................... 1-1
1.1 Senate Bill 3 Environmental Flows Process ................................................................ 1-1
1.1.1 Environmental Flows Advisory Group (EFAG) .................................................................1-1
1.1.2 Science Advisory Committee (SAC) ....................................................................................1-2
1.1.3 Basin and Bay Area Stakeholder Committee (BBASC) ......................................................1-2
1.2 Upper Rio Grande Basin and Bay Expert Science Team (Upper Rio Grande BBEST)
1-3
1.2.1 Membership ........................................................................................................................1-3
1.2.2 Upper Rio Grande BBEST Charge .....................................................................................1-3
1.3 Sound Ecological Environment – Upper Rio Grande BBEST................................... 1-4
1.3.1 SEE: Rio Grande, from the confluence with the Rio Conchos to Amistad Reservoir .........1-5
1.3.2 Alamito Creek .....................................................................................................................1-7
1.3.3 Pecos River .........................................................................................................................1-8
1.3.4 SEE: Independence Creek ................................................................................................1-10
1.3.5 Devils River ......................................................................................................................1-11
1.4 Introduction to Environmental Flows Recommendation Report ............................ 1-13
1.4.1 Rio Grande, Alamito, and Terlingua Creeks ....................................................................1-13
1.4.2 Pecos River and Independence Creek ..............................................................................1-14
1.4.3 Devils River ......................................................................................................................1-15
Section 2. Overview of the Upper Rio Grande & Current Conditions ............ 2-1
2.1 Geographic coverage of the Upper Rio Grande Sub-basin ........................................ 2-1
2.2 Ecoregions; Edwards Plateau and Chihuahuan Desert ............................................. 2-2
2.3 Climate of the Upper Rio Grande BBEST Area ......................................................... 2-4
2.4 Geology ........................................................................................................................... 2-7
2.5 Regional aquifers ........................................................................................................... 2-8
2.6 Physiography and Geomorphic History of Sub-basins ............................................ 2-12
2.6.1 Geology, Physiography, and Geomorphic History of the Rio Grande .............................2-12
ii
2.6.1.1 Ground water and low flows in the Rio Grande ................................................2-15
2.6.1.2 Alamito and Terlingua Creeks ...........................................................................2-17
2.6.2 Pecos River .......................................................................................................................2-18
2.6.3 Devils River Sub-Basin .....................................................................................................2-28
2.6.3.1 Physiography .....................................................................................................2-30
2.6.3.2 Relationship to Aquifers ....................................................................................2-30
2.6.4 Amistad Reservoir .............................................................................................................2-31
2.7 Regional Water Planning (Regions E,F,J) ................................................................. 2-32
2.7.1 2012 State Water Plan ......................................................................................................2-32
2.7.2 Unique Stream Segments ..................................................................................................2-32
2.7.2.1 The Rio Grande .................................................................................................2-32
2.7.2.2 The Pecos River .................................................................................................2-34
2.7.2.3 Devils River .......................................................................................................2-36
2.8 URG Study Area Unique Issues ................................................................................. 2-37
2.8.1 United States – Mexico Water Treaty (1944) ...................................................................2-37
2.8.2 Pecos River Compact ........................................................................................................2-37
2.8.3 Pecos River Watershed Protection Plan ...........................................................................2-37
Section 3. Instream Flow Analysis .................................................................... 3-1
3.1 Introduction ................................................................................................................... 3-1
3.2 Geographic Scope .......................................................................................................... 3-4
3.2.1 Streamflow gaging stations.................................................................................................3-4
3.2.1.1 Rio Grande Gaging Stations ................................................................................3-6
3.2.1.2 Pecos River Gaging Stations ...............................................................................3-9
3.2.1.3 Devils River Gaging Stations ............................................................................3-13
3.3 Hydrology-based environmental flow regime methods ............................................ 3-14
3.3.1 Flow Components .............................................................................................................3-15
3.3.2 Seasons .............................................................................................................................3-16
3.3.3 Period of Record ...............................................................................................................3-17
3.4 Biological Overlay Methods ........................................................................................ 3-18
3.4.1 Fishes of the Upper Rio Grande Basin and Instream Habitat Modeling in the Pecos and
Devils River Sub-basins .................................................................................................................3-18
3.4.1.1 Focal Fish Species Selection .............................................................................3-20
3.4.1.2 Fish Habitat Suitability Criteria .........................................................................3-21
3.4.1.3 Fish Habitat Availability and Suitability Modeling ...........................................3-22
3.5 Water Quality Impairments in the Upper Rio Grande of West Texas ................... 3-29
iii
3.6 Rio Grande ................................................................................................................... 3-30
3.6.1 Hydrology-Based Environmental Flow Regimes ..............................................................3-30
3.6.1.1 Instream flow regimes and flow regime components ........................................3-30
3.6.1.2 Period of Record ................................................................................................3-33
3.6.1.3 HEFR application ..............................................................................................3-35
3.6.2 Water Quality Overlay ......................................................................................................3-37
3.6.3 Biology Overlay ................................................................................................................3-41
3.6.3.1 Background ........................................................................................................3-41
3.6.3.2 Hydrology, Geomorphology and Habitats. ........................................................3-41
3.6.3.3 Benthic Macroinvertebrates ...............................................................................3-43
3.6.3.4 Ichthyofauna ......................................................................................................3-44
3.6.3.5 Riparian Biology ................................................................................................3-46
3.6.4 Geomorphology Overlay ..................................................................................................3-46
3.6.4.1 Sediment Transport ............................................................................................3-49
3.7 Pecos River ................................................................................................................... 3-55
3.7.1 Hydrology-based Environmental Flow Regimes ..............................................................3-55
3.7.2 Water Quality overlay ......................................................................................................3-55
3.7.3 Flow-habitat Modeling Results and Overlay (Independence Creek and Pecos River) ....3-63
3.7.3.1 Effects of flow-habitat analysis on environmental flow recommendations .......3-64
3.7.3.2 Pecos River at Brotherton Ranch near Pandale .................................................3-75
3.7.3.3 Effects of flow-habitat analysis on environmental flow recommendations .......3-76
3.7.4 Geomorphology overlay ...................................................................................................3-87
3.8 Devils ............................................................................................................................. 3-88
3.8.1 Hydrology-based Environmental Flow Regimes ..............................................................3-88
3.8.2 Water Quality overlay ......................................................................................................3-89
3.8.3 Flow-habitat Modeling Results and Overlay (Devils River at Juno) ...............................3-91
3.8.3.1 Effects of flow-habitat analysis on environmental flow recommendations .......3-92
3.8.4 Geomorphology overlay .................................................................................................3-103
Section 4. Environmental Flow Recommendations ......................................... 4-1
4.1 Environmental Flow Regime Summaries .................................................................... 4-1
4.1.1 Hydrologic Conditions .....................................................................................................4-14
4.1.2 Subsistence Flows .............................................................................................................4-14
iv
4.1.2.1 Rio Grande Sub-basin ........................................................................................4-14
4.1.2.2 Pecos River Sub-basin .......................................................................................4-15
4.1.2.3 Devils River Sub-basin ......................................................................................4-15
4.1.3 Base Flows ........................................................................................................................4-16
4.1.3.1 Rio Grande Sub-basin ........................................................................................4-16
4.1.3.2 Pecos River Sub-basin .......................................................................................4-16
4.1.3.3 Devils River Sub-basin ......................................................................................4-17
4.1.4 High pulse flows ...............................................................................................................4-17
4.1.4.1 Rio Grande Sub-basin ........................................................................................4-18
4.1.4.2 Pecos River Sub-basin .......................................................................................4-18
4.1.4.3 Devils River Sub-basin ......................................................................................4-19
4.1.5 Overbank flows .................................................................................................................4-19
4.1.5.1 Rio Grande Sub-basin ........................................................................................4-19
4.1.5.2 Pecos River Sub-basin .......................................................................................4-19
4.1.5.3 Devils River Sub-basin ......................................................................................4-20
4.1.6 Reset Flows for the Upper Rio Grande Sub-basin ...........................................................4-20
Section 5. Adaptive Management ...................................................................... 5-1
5.1 Introduction ................................................................................................................... 5-1
5.2 Future Research and Monitoring Needs ...................................................................... 5-1
5.2.1 Describe relationships between flow and physical, chemical, and biological structure and
function of the streams and how these relationships support ecological health. ............................5-1
5.2.2 Describe relationships between flow and geomorphic processes such as sediment transport
5-2
5.2.3 Conduct additional modeling of relationships between in-stream habitat and flow. .........5-3
5.2.4 Identify stream locations not included in the BBEST environmental flow regime report that
should be analyzed for relationships between flow and environmental health. ..............................5-4
5.2.5 Describe the relationship between flow and water quality. ................................................5-4
5.2.6 Evaluate reliability and comparability between gages. ......................................................5-5
5.2.7 Conduct a complete water balance analysis for all stream segments within the upper Rio
Grande. ............................................................................................................................................5-5
5.2.8 Evaluate status of benthic macroinvertebrates within the URG. ........................................5-5
5.2.9 Investigate the relationship between flow dynamics and riparian vegetation establishment
and persistence. ...............................................................................................................................5-5
5.2.10 Describe relationship of the URG stream segments, its tributaries, and major springs to
ground water and how it is likely to be affected by changes in water use. ......................................5-6
5.2.11 Identify water development activities planned for the future, and how they might influence
ground water, river flows, and physical and hydrologic connections between the two ..................5-6

v
5.2.12 Creating an Sound Ecological Environment for the Upper Pecos River ..........................5-6
5.3 Adaptive Management/Work Plan Process and Products ......................................... 5-8
Section 6. References ......................................................................................... 6-1
List of Tables
Table 2.3-1. Summary of annual lake evaporation and precipitation in URG area ..................................................................... 2-5 Table 2.6-1. Pecos River Sub Watersheds in Texas. ................................................................................................................. 2-24 Table 3.1-1. General flow components for the stream segments of the Upper Rio Grande Basin. ............................................. 3-2 Table 3.2-1 Upper Rio Grande BBEST – Streamflow Gage Selection. Highlighted rows indicate gages used in making
Environmental Flow Recommendations (Section 4). ........................................................................................................ 3-5 Table 3.3-1. Streamflow gage period of record. ........................................................................................................................ 3-17 Table 3.4-1. Fish species list for the Upper Rio Grande Basin BBEST area. shown are the sub-basins in which each species
occurs; with each species noted as Native or Introduced in the indicated sub-basin. Focal species for flow-habitat
modeling (see text for description) are in bold. Et = extirpated from Texas, E = presumed extinct and R=reintroduced. .. 3-
18 Table 3.4-2. Focal species for flow-habitat modeling, which sites they are focal species at and their mesohabitat affinities.
Primary and secondary mesohabitat preferences are indicated by large X’s and dark shading and small x’s and light
shading, respectively........................................................................................................................................................ 3-21 Table 3.4-3. Focal species for flow-habitat modeling and the cross-section subsets for analysis and decision-making. .......... 3-25 Table 3.5-1. Water quality standards and designated uses for segments in the Upper Rio Grande .......................................... 3-29 Table 3.6-1. Rio Grande flow regime components, HEFR classifications, and associated riverine processes. ........................ 3-32 Table 3.6-2. HEFR results for Rio Grande at the below Rio Conchos, Johnson’s Ranch, and Foster’s Weir gages for selected
time periods. .................................................................................................................................................................... 3-36 Table 3.6-3. Mussel data from NPS survey (Renfro, 2005) ...................................................................................................... 3-43 Table 3.6-4. List of native mussel species with status............................................................................................................... 3-44 Table 3.7-1. Percent of maximum weighted usable habitat area with a 0.5 minimum quality threshold for 10 focal species
resulting from hydrology-based flow regime (HEFR) results at the Independence Creek near Sheffield. Shown are
percentages for Subsistence and all three ranges of Base Flows. Shaded cells are those flows meeting "enoughness"
thresholds of 20 % for Subsistence flows and 75 or 90 % (per requirements for each species) for all three ranges of Base
Flows. .............................................................................................................................................................................. 3-69 Table 3.7-2. Percent of maximum weighted usable area across all cross-sections with a minimum habitat quality of 0.5 for all
10 focal species at all modeled flows for Independence Creek near Sheffield. Shaded cells are those flows meeting
"enoughness" thresholds of 75 or 90 % (per requirements for each species). ................................................................. 3-70 Table 3.7-3. Percent of maximum weighted usable area across riffle cross-sections with a minimum habitat quality of 0.5 for all
10 focal species at all modeled flows for Independence Creek near Sheffield. Shaded cells are those flows meeting
"enoughness" thresholds of 75 or 90 % (per requirements for each species). ................................................................. 3-71 Table 3.7-4. Percent of maximum weighted usable area across run cross-sections with a minimum habitat quality of 0.5 for all
10 focal species at all modeled flows for Independence Creek near Sheffield. Shaded cells are those flows meeting
"enoughness" thresholds of 75 or 90 % (per requirements for each species). ................................................................. 3-72 Table 3.7-5. Percent of maximum habitat maintained by the range of percent exceedance examined for the full period of record
of historical flows at Independence Creek near Sheffield. Shaded cells are those exceedance levels that meet the 75 or 90
% (per requirements for each species) enoughness thresholds. Data presented are for all cross-sections. ...................... 3-74 Table 3.7-6. Initial base flow numbers derived from an abbreviated hydrographic separation using IHA for the Pecos River at
Brotherton near Pandale. ................................................................................................................................................. 3-75 Table 3.7-7. Percent of maximum weighted usable habitat area with a 0.5 minimum quality threshold for 10 focal species
resulting from abbreviated hydrology analysis results at the Pecos River at Brotherton Ranch near Pandale. Shown are
percentages for Subsistence and all three ranges of Base Flows. Shaded cells are those flows meeting "enoughness"
thresholds of 20 % for Subsistence flows and 75 or 90 % (per requirements for each species) for all three ranges of Base
Flows. .............................................................................................................................................................................. 3-81
vi
Table 3.7-8. Percent of maximum weighted usable area across all cross-sections with a minimum habitat quality of 0.5 for all
10 focal species at all modeled flows for the Pecos River at Brotherton Ranch near Pandale. Shaded cells are those flows
meeting "enoughness" thresholds of 75 or 90 % (per requirements for each species). .................................................... 3-82 Table 3.7-9. Percent of maximum weighted usable area across riffle cross-sections with a minimum habitat quality of 0.5 for all
10 focal species at all modeled flows for the Pecos River at Brotherton Ranch near Pandale. Shaded cells are those flows
meeting "enoughness" thresholds of 75 or 90 % (per requirements for each species). .................................................... 3-83 Table 3.7-10. Percent of maximum weighted usable area across run cross-sections with a minimum habitat quality of 0.5 for all
10 focal species at all modeled flows for the Pecos River at Brotherton Ranch near Pandale. Shaded cells are those flows
meeting "enoughness" thresholds of 75 or 90 % (per requirements for each species). .................................................... 3-84 Table 3.7-11. Percent of maximum habitat maintained by the range of percent exceedance examined for the full period of
record (2007-2012) of historical flows at the Pecos River at Brotherton Ranch near Pandale. Shaded cells are those
exceedance levels that meet the 75 or 90 % (per requirements for each species) enoughness thresholds. Data presented
are for all cross-sections. ................................................................................................................................................. 3-86 Table 3.8-1. Environmental flow components and their functions in the Devils River sub-basin. ........................................... 3-88 Table 3.8-2. Percent of maximum weighted usable habitat area with a 0.5 minimum quality threshold for 10 focal species
resulting from hydrology-based flow regime (HEFR) results at the Devils River near Juno. Shown are percentages for
Subsistence and all three ranges of Base Flows. Shaded cells are those flows meeting "enoughness" thresholds of 20 %
for Subsistence flows and 75 or 90 % (per requirements for each species) for all three ranges of Base Flows. ............. 3-97 Table 3.8-3. Percent of maximum weighted usable area across all cross-sections with a minimum habitat quality of 0.5 for all
10 focal species at all modeled flows for the Devils River near Juno. Shaded cells are those flows meeting "enoughness"
thresholds of 75 or 90 % (per requirements for each species). ........................................................................................ 3-98 Table 3.8-4. Percent of maximum weighted usable area across riffle cross-sections with a minimum habitat quality of 0.5 for all
10 focal species at all modeled flows for the Devils River near Juno. Shaded cells are those flows meeting "enoughness"
thresholds of 75 or 90 % (per requirements for each species). ........................................................................................ 3-99 Table 3.8-5. Percent of maximum weighted usable area across run cross-sections with a minimum habitat quality of 0.5 for all
10 focal species at all modeled flows for the Devils River near Juno. Shaded cells are those flows meeting "enoughness"
thresholds of 75 or 90 % (per requirements for each species). ...................................................................................... 3-100 Table 3.8-6. Percent of maximum habitat maintained by the range of percent exceedance examined for the full period of record
of historical flows at the Devils River near Juno. Shaded cells are those exceedance levels that meet the 75 or 90 % (per
requirements for each species) enoughness thresholds. Data presented are for all cross-sections. ............................... 3-102 Table 4.1-1. Environmental Flow Regime Recommendation, Alamito Creek. ........................................................................... 4-1 Table 4.1-2. Environmental Flow Regime Recommendation, Rio Grande below Rio Conchos near Presidio. .......................... 4-2 Table 4.1-3. Environmental Flow Regime Recommendation, Terlingua Creek. ........................................................................ 4-3 Table 4.1-4. Environmental Flow Regime Recommendation, Rio Grande at Johnson’s Ranch. ................................................ 4-4 Table 4.1-5. Environmental Flow Regime Recommendation, Rio Grande at Foster’s Weir. ..................................................... 4-5 Table 4.1-6. Environmental Flow Regime Recommendation, Pecos River near Orla. ............................................................... 4-6 Table 4.1-7. Environmental Flow Regime Recommendation, Pecos River near Pecos . ............................................................ 4-7 Table 4.1-8. Environmental Flow Regime Recommendation, Pecos River near Girvin. ............................................................ 4-8 Table 4.1-9. Environmental Flow Regime Recommendation, Independence Creek near Sheffield. .......................................... 4-9 Table 4.1-10. Environmental flow regime recommendation, Pecos River near Brotherton Ranch. .......................................... 4-10 Table 4.1-11. Environmental Flow Regime Recommendation, Pecos River at Langtry. .......................................................... 4-11 Table 4.1-12. Environmental Flow Regime Recommendation, Devils River near Juno ........................................................... 4-12 Table 4.1-13. Environmental Flow Regime Recommendation, Devils River at Pafford’s Crossing. ....................................... 4-13

vii
List of Figures
Figure 1.1-1. SB3 Environmental Flows Process. ....................................................................................................................... 1-1 Figure 1.3-1. TCEQ stream segments in the Upper Rio Grande Basin. ...................................................................................... 1-5 Figure 2.1-1. Location of Upper Rio Grande BBEST sub-basins. .............................................................................................. 2-1 Figure 2.2-1. Ecoregions within the URG BBEST sub-basins (Omernik, 2004). ....................................................................... 2-2 Figure 2.3-1. Mean annual precipitation and elevation/ precipitation relationships in the Trans-Pecos, TX (TECO, 2008). ..... 2-4 Figure 2.3-2. County quadrangles (modified from TWDB, 2012) .............................................................................................. 2-5 Figure 2.3-3. Average Annual Temperature (TECO, 2008). ....................................................................................................... 2-6 Figure 2.5-1. Major aquifers in the Upper Rio Grande BBEST area (modified from George et al., 2011). ............................... 2-8 Figure 2.5-2. Minor aquifers in the URG BBEST area (modified from George et al., 2011). .................................................... 2-9 Figure 2.6-1. Location of the Upper Rio Grande Basin below the confluence with the Rio Conchos. ..................................... 2-12 Figure 2.6-2. Median hydrographs of the Rio Grande near Presidio upstream and downstream from the Rio Conchos for the
period 1900 to 1914. ........................................................................................................................................................ 2-13 Figure 2.6-3. Reconstructed model of changes in channel width and vegetation density since 1900. Modified from Dean and
Schmidt (2011). ............................................................................................................................................................... 2-14 Figure 2.6-4. Historic ground photographs from 1945 and 2008 depicting the magnitude of geomorphic change on the Rio
Grande in the Big Bend region, and the expansion of riparian vegetation, much of which is non-native. ...................... 2-14 Figure 2.6-5. Conceptual diagram illustrating the continuum between wild conditions and potentially severely degraded
conditions of river systems. Each part of today’s Rio Grande exists somewhere on this continuum. Small degrees of
change are typically referred to as mitigation, whereas attempts to significantly shift the ecosystem towards the formerly
wild conditions are called rehabilitation. (adapted from Schmidt, 2010). ....................................................................... 2-15 Figure 2.6-6. Average gain in Q (discharge). From Bennett et al., 2009. ................................................................................. 2-16 Figure 2.6-7. Longitudinal trends in discharge and specific conductance for years 2006 and 2011. From Bennett et al. 2012. .. 2-
16 Figure 2.6-8. The boundary of the Pecos River Basin in Texas ................................................................................................ 2-18 Figure 2.6-9. Ground water wells within the Pecos River Basin. .............................................................................................. 2-22 Figure 2.6-10: Concrete dam at Ward II Turnout (G. Bryant photo) and aerial view (Goolge Earth, 2/7/2011). ..................... 2-23 Figure 2.6-11. Detail of irrigation canals along the Pecos River (shown in red). ..................................................................... 2-23 Figure 2.6-12: Pecos River Sub Watersheds (8-digit HUCs) in Texas ..................................................................................... 2-25 Figure 2.6-13. Location of the Devils River Basin and gaging stations. ................................................................................... 2-28 Figure 2.7-1: Region E, Recommended Ecologically Unique Rivers and Streams (TWDB, 2011) ......................................... 2-33 Figure 2.7-2: Texas Parks and Wildlife Department Ecologically Significant River and Stream Segments in Region F ........ 2-35 Figure 3.1-1. The five components of the natural flow regime that directly and indirectly affect the ecological integrity of river
ecosystems (adapted from Poff, et al., 1997) and taken from Nueces BBEST Environmental Flow Recommendations
Report (2011). .................................................................................................................................................................... 3-1 Figure 3.2-1. Gaging stations for the Rio Grande, Pecos, and Devils Rivers in the Upper Rio Grande BBEST area. ............... 3-4 Figure 3.2-2. Alamito Creek upstream from the FM 170 bridge. ................................................................................................ 3-6 Figure 3.2-3. Photos of the Rio Grande below Rio Conchos gage. Both photos taken from left bank and flow is from right to
left. ..................................................................................................................................................................................... 3-6 Figure 3.2-4. Photo of the Terlingua Creek gage and cableway. Photo is taken from left bank and flow if from right to left. .. 3-7 Figure 3.2-5. Photo of the Rio Grande near Castolon gage. Photo is taken from left bank and flow is from right to left. ......... 3-7 Figure 3.2-6. Photo looking downstream at the Johnson’s Ranch gage. ..................................................................................... 3-8 Figure 3.2-7. Photo taken above Rio Grande at Rio Grande Village gage. Gage house is in the bottom center on the hillslope
above the irrigation pump house. Gage cross section is at the bottom edge of the photo. ................................................. 3-8 Figure 3.2-8. Foster's Weir. ......................................................................................................................................................... 3-9 Figure 3.2-9. Photo of the Pecos River near Orla gage. Both Pictures were taken from the right bank. Flow is from left to right.
Photo credit: Zhuping Sheng, Texas AgriLife Research. .................................................................................................. 3-9 Figure 3.2-10. Photo of the Pecos River near Pecos gage. The Picture was taken from the right bank. Flow is from left to right.
Photo credit: Zhuping Sheng, Texas AgriLife Research. ................................................................................................ 3-10 Figure 3.2-11. Photos of the Pecos River near Girvin gage. Both Pictures were taken from the left bank. Flow is from right to
left. Photo credit: Gary Bryant, Texas AgriLife Extension Service. ................................................................................ 3-10 Figure 3.2-12. Photos of the Independence Creek gage. The pictures were taken from the center of the Creek and the left bank.
Flow is away from the photographer. Photo credit: TPWD and TNC. ............................................................................ 3-11 Figure 3.2-13. Photo of the Pecos River at Brotherton Ranch near Pandale gage. The pictures were taken from the center of the
river. Flow is moving away from the photographer. Photo credit: TPWD. ..................................................................... 3-11

viii
Figure 3.2-14. Photos of the Pecos River near Langtry gage. The picture was taken from the right bank. Flow is from left to
right. Photo credit: Zhuping Sheng, Texas AgriLife Research. ....................................................................................... 3-12 Figure 3.2-15. Photos of the Devils River near the Juno/Baker’s Crossing gage. Both photos taken from left bank and flow is
from right to left. Photo credit: Christine Kolbe, TCEQ. ................................................................................................ 3-13 Figure 3.2-16. Photo of the Devils River at the Pafford’s Crossing gage. Photo is taken from right bank and flow is from left to
right. Photo credit: US Geological Survey. ..................................................................................................................... 3-13 Figure 3.3-1. An IHA analysis showing the revised environmental flow components. ............................................................ 3-15 Figure 3.6-1. Total annual stream flow volume for the Rio Grande below the Rio Conchos, Johnson’s Ranch, and Foster’s weir.
10-year running averages are shown. .............................................................................................................................. 3-33 Figure 3.6-2. Annual peak mean daily discharge for the Rio Grande below the Rio Conchos, Johnson Ranch, and Foster’s weir.
10-year running averages are shown. .............................................................................................................................. 3-34 Figure 3.6-3. Plot showing ft³/s days greater than the average annual flood at the Rio Grande below the Rio Conchos of 15,467
ft³/s. This metric combines both flood magnitude and duration. Note that downstream from the Rio Conchos, there are
occasional moderate to large floods that occur at the Johnson’s Ranch and Foster’s weir gage caused by tributary inputs.
......................................................................................................................................................................................... 3-35 Figure 3.6-4. Total dissolved solids are plotted against flow for four stations along the Rio Grande, from Bennett et al., 2012. 3-
39 Figure 3.6-5. TDS plotted through time for four stations: Rio Grande above Rio Conchos, Rio Grande below Rio Conchos , Rio
Grande at Santa Elena Take Out, and Rio Grande at Foster’s Weir, from Bennett et al., 2012. ..................................... 3-40 Figure 3.6-6. Results from a mussel survey conducted in 2005 depicting downstream increase in abundance. Reported river
mile is at the downstream end of each sampling reach. ................................................................................................... 3-43 Figure 3.6-7. Preliminary analyses of suspended sediment dynamics at sediment gaging stations near Castolon and Rio Grande
Village, TX during a flash flood in June 2010, see additional descriptive text below in italics. ..................................... 3-47 Figure 3.6-8. Results from 1-dimensional hydraulic modeling to characterize the magnitude of a channel filling flow. ......... 3-48 Figure 3.6-9. Plot of suspended sediment concentration vs. discharge on the Green River near Jenson, UT showing the 2 orders
of magnitude difference in suspended-sediment concentration in relation to discharge. Figure taken from Grams and
Schmidt (2002). ............................................................................................................................................................... 3-49 Figure 3.6-10. Plot of bed load transport vs. discharge on the Snake River in Grand Teton National Park, WY, showing highly
non-linear bed-load transport and the large uncertainty when correlating bed-load transport to discharge (Erwin et al.,
2011). ............................................................................................................................................................................... 3-49 Figure 3.6-11. Preliminary analyses of suspended silt and clay transport during a dam release in July 2010. ......................... 3-50 Figure 3.6-12. Channel cross sections measured at the mouth of Alamo Creek near Castolon, TX between 2009 and 2012. Note
the aggradation of the channel bed between 2009 and 2010. .......................................................................................... 3-51 Figure 3.6-13. Stepped hydrograph used in the 1-dimensional sediment analysis completed using HEC-RAS. ...................... 3-51 Figure 3.6-14. Sediment transport calculations for a cross section near Alamo Creek obtained from 1-dimensional sediment
modeling. (a) Sediment transport rate over the duration of the model run. (b) Cumulative volume of sediment transported
over the duration of the model run. .................................................................................................................................. 3-52 Figure 3.6-15. 2012 DEM of the Rio Grande downstream from the mouth of Alamo Creek. Areas of green are within the
channel. Brownish areas are the banks. Areas of deposition and erosion between 2011 and 2012 surveys are shown in
gradational red to blue scale. Nearly all channel change consisted of deposition. .......................................................... 3-53 Figure 3.6-16. Probability distribution functions of Manning’s n (roughness parameter), the critical Shield’s parameter (values
used for mobility threshold), and grain size distribution (obtained from field measurements) used in the Monte Carlo
analysis. These distributions are based on user inputs for the purpose of understanding the uncertainty involved in
sediment transport estimates. ........................................................................................................................................... 3-53 Figure 3.6-17. Results of the Monte Carlo simulation. ............................................................................................................. 3-54 Figure 3.7-1. Dry Pecos River Bed. .......................................................................................................................................... 3-56 Figure 3.7-2. Water quality data for the Pecos River at Orla. ................................................................................................... 3-57 Figure 3.7-3. Distribution of ground water total dissolved solids (TDS) in the Pecos Basin of Texas. .................................... 3-58 Figure 3.7-4. Water quality data for the Pecos River at Girvin. ................................................................................................ 3-59 Figure 3.7-5. Water quality data for the Pecos River at Independence Creek near Sheffeild. .................................................. 3-60 Figure 3.7-6. Historical records of flow and salinity at Girvin and Langtry (original data at Girvin from USGS, those at Langrty
from IBWC). .................................................................................................................................................................... 3-61 Figure 3.7-7. Water quality data from the Pecos River at Langtry. ........................................................................................... 3-62 Figure 3.7-8. Four ranges of weighted usable habitat area quality (<0.5, 0.5-0.8, >0.8, and total) versus modeled flow (ft³/s) for
proserpine shiner (Cyprinella proserpina) at Independence Creek near Sheffield. .......................................................... 3-64 Figure 3.7-9. Weighted usable habitat area with a 0.5 minimum quality threshold versus modeled flow (ft³/s) for 10 focal
species at Independence Creek near Sheffield. Shown are WUA versus flow relationships for a) all cross-sections, b)
ix
riffle cross-sections, c) run cross-sections and d) pool cross-sections. Vertical bars bracket environmental flow regime
components. ..................................................................................................................................................................... 3-65 Figure 3.7-10. Percent of maximum weighted usable habitat area with a 0.5 minimum quality threshold versus modeled flow
(ft³/s) for 10 focal species at Independence Creek near Sheffield. Shown are percent of maximum WUA versus flow
relationships for a) all cross-sections, b) riffle cross-sections, 3) run cross-sections and d) pool cross-sections. Vertical
bars bracket environmental flow regime components. .................................................................................................... 3-68 Figure 3.7-11. Habitat frequency curves for 10 focal species for the full period of record of historical flows (1975-1985, 2002-
2009) at the USGS gage at Independence Creek near Sheffield. ..................................................................................... 3-73 Figure 3.7-12. Four ranges of weighted usable habitat area quality (<0.5, 0.5-0.8, >0.8, and total) versus modeled flow (ft³/s)
for Tamaulipas shiner (Notropis braytoni) at the Pecos River at Brotherton Ranch near Pandale. ................................. 3-76 Figure 3.7-13. Weighted usable habitat area with a 0.5 minimum quality threshold versus modeled flow (ft³/s) for 10 focal
species at the Pecos River at Brotherton Ranch near Pandale. Shown are WUA versus flow relationships for a) all cross-
sections, b) riffle cross-sections, 3) run cross-sections and d) pool cross-sections. Vertical bars bracket environmental
flow regime components. ................................................................................................................................................. 3-77 Figure 3.7-14. Percent of maximum weighted usable habitat area with a 0.5 minimum quality threshold versus modeled flow
(ft³/s) for 10 focal species at the Pecos River at Brotherton Ranch near Pandale. Shown are percent of maximum WUA
versus flow relationships for a) all cross-sections, b) riffle cross-sections, 3) run cross-sections and d) pool cross-sections.
Vertical bars bracket environmental flow regime components. ....................................................................................... 3-80 Figure 3.7-15. Habitat frequency curves for 10 focal species for the full period of record of historical flows (2007-2012) at the
USGS gage at the Pecos River at Brotherton Ranch near Pandale. ................................................................................. 3-85 Figure 3.8-1. Total dissolved solids measurements for the Devils River above Dolan Falls and at Pafford’s Crossing. Also
shown is the TCEQ standard of 300 mg/L and a regression line for the Pafford’s Crossing data indicating an increasing
trend. ................................................................................................................................................................................ 3-90 Figure 3.8-2. Total dissolved solids versus flow for the Devils River at Pafford’s Crossing. ................................................... 3-90 Figure 3.8-3. Four ranges of weighted usable habitat area quality (<0.5, 0.5-0.75, >0.75, and total) versus modeled flow (ft³/s)
for Devils River minnow (Dionda diaboli) at the Devils River near Juno. ..................................................................... 3-92 Figure 3.8-4. Weighted usable habitat area with a 0.5 minimum quality threshold versus modeled flow (ft³/s) for 10 focal
species at the Devils River near Juno. Shown are WUA versus flow relationships for a) all cross-sections, b) riffle cross-
sections, c) run cross-sections and d) pool cross-sections. Vertical bars bracket environmental flow regime components.
......................................................................................................................................................................................... 3-93 Figure 3.8-5. Percent of maximum weighted usable habitat area with a 0.5 minimum quality threshold versus modeled flow
(ft³/s) for 10 focal species at the Devils River near Juno. Shown are percent of maximum WUA versus flow relationships
for a) all cross-sections, b) riffle cross-sections, 3) run cross-sections and d) pool cross-sections ................................. 3-96 Figure 3.8-6. Habitat frequency curves for 10 focal species for the full period of record of historical flows (1926-1949, 1963-
1972) at the USGS gage at the Devils River near Juno. ................................................................................................ 3-101
x
Common Abbreviations
AF acre-feet
AMIS Amistad National Recreation Area
ARS Agriculture Research Service
BBASC Basin and Bay Area Stakeholder Committees
BBEST Basin and Bay Expert Science Team
BBNP Big Bend National Park
BMP best management practice
BOD biological oxygen demand
Ca calcium
cfs (ft³/s) cubic feet per second
CILA Comisión Internacional de Límites y Aguas , Mexican Section, International Boundary and
Water Commission
Cl chloride
CMM Coordinated Monitoring Meeting
cms cubic meters per second
CONANP Comisión Nacional de Áreas Naturales Protegidas , Mexican Commission for the
Protection of Natural Areas
CRP Texas Clean Rivers Program
CSREES USDA Cooperative State Research, Education and Extension Service
CWA Federal Clean Water Act
DEM Digital Elevation Model
DO dissolved oxygen
EFAG Environmental Flows Advisory Group
EPA United States Environmental Protection Agency
EQIP Environmental Quality Incentives Program
ETPA Edwards-Trinity Plateau aquifer
FM Farm to Market Road
FOTG Field Office Technical Guide
FWTRWPG Far West Texas Regional Water Planning Group
GPS global positioning system
HEC-RAS Hydrologic Engineering Centers River Analysis System
HDFR High Dam Flow Releases
HEFR Hydrology-based Environmental Flow Regime
HSC Habitat Suitability Criteria
HUC Hydrologic Unit Code
I/E information and education
IBI Index of Biotic Integrity
IBWC International Boundary and Water Commission, US Section
IHA Indicators of Hydrologic Alteration
LPRB Lower Pecos-Red Bluff
mg/L milligrams per liter
MX Mexico
Na sodium
NM New Mexico, USA

xi
NPS National Park Service
OFCUF Oil Field Cleanup Fund
ppm parts per million
PRAC Pecos River Advisory Committee
PRBAP Pecos River Basin Assessment Project
PRCC Pecos River Compact Commission
PRISM Parameter-elevation Regressions on Independent Slopes Model
Q Discharge (volume rate of water flow)
QA/QC Quality Assurance/Quality Control
RGBI Rio Grande Basin Initiative
RGSM Rio Grande Silvery Minnow
RIGR Rio Grande Wild and Scenic River
RRC Railroad Commission of Texas
SAC Science Advisory Committee
SB3 Senate Bill 3
SEE Sound Ecological Environment
SO4 sulfate
SOC Species of Concern
SWCD Soil and Water Conservation District
TCEQ Texas Commission on Environmental Quality
TCRP Texas Clean Rivers Program
TDS total dissolved solids
TECO Texas Extension Counties Online System
TFS Texas Forest Service
TIFP Texas Instream Flow Program
TMDL Total Maximum Daily Load
TNC The Nature Conservancy
TPWD Texas Parks and Wildlife Department
TPWT Trans Pecos Water and Land Trust
TSSWCB Texas State Soil and Water Conservation Board
TWDB Texas Water Development Board
TWRI Texas Water Resources Institute
URG Upper Rio Grande
USACE United States Army Corps of Engineers
USDA United States Department of Agriculture
USGS United States Geological Survey
USGS-GCMRC USGS Grand Canyon Monitoring and Research Center
USIBWC International Boundary and Water Commission, United States Section
USU Utah State University
UT Utah, USA
WHIP Wildlife Habitat Incentives Program
WPCD Water and Power Control District
WPP watershed protection plan
WQMP water quality management plan
WUA Weighted Usable Area
WY Wyoming, USA

xii
Glossary of Terms
Adaptive management—An iterative and structured decision making process that seeks to address uncertainty
through system monitoring.
Aggradation—the raising or elevating of a bottomland surface through the process of alluvial deposition;
conceptually it is the vertical component of accretion and is most frequently applied to sediment deposition
on a channel bed, bar or other near-channel surfaces, flood plain, or, less often, low-lying alluvial terrace
(Osterkamp, 2008).
Appropriation—A specified amount of water set aside by Congress, other legislative body or state or provincial
water regulatory authority to be used for a specified purpose at a specified place, if available.
Aquatic life—All organisms living in or on the water.
Base flow—Average stream flow in the absence of significant precipitation or runoff events. Also known as
“normal flow”.
Bed load—Material moving on or near the streambed.
Bosque—A Spanish term for “woodlands”, the name refers to areas of gallery forest found along riparian
floodplains of stream and river banks, primarily in the southwestern United States.
Channel—That cross section containing the stream that is distinct from the surrounding area due to breaks in the
general slope of the land, lack of terrestrial vegetation, and changes in the composition of the substrate
materials. The portion of the river bottomland that conveys water at all discharges
Connectivity—Maintenance of lateral, longitudinal, and vertical pathways for biological, hydrological, and
physical processes.
Discharge—The rate of stream flow or the volume of water flowing at a location within a specified time interval.
Usually expressed as cubic meters per second (cms) or cubic feet per second (ft³/s). Commonly referred to
as “Q”.
Diversion—A withdrawal from a body of water by human-made contrivance.
Drainage area—The total land area draining to any point in a stream. Also called catchment area, watershed, and
basin.
Flood—Any flow that exceeds the bankfull capacity of a stream or channel and flows out on the floodplain.
Floodplain—(1) Land beyond a stream channel that forms the perimeter for the maximum probability flood. (2) A
relatively flat strip of land bordering a stream that is formed by sediment deposition.
Flow—(1) The movement of a stream of water or other mobile substance from place to place. (2) Discharge.
Flow regime—The distribution of annual surface runoff from a watershed over time such as hours, days, or months
(See also Hydrologic regime).
Fluvial—Pertaining to streams or produced by river action.
Gradient—The rate of change of any characteristic, expressed per unit of length. (See Slope) May also apply to
longitudinal succession of biological communities.
Ground water—In general, all subsurface water that is distinct from surface water; specifically, that part which is
in the saturated zone of a defined aquifer.
High flow pulse—A short-duration, high flow within the stream channel that occurs during or immediately
following storm events and serves to flush fine sediment deposits and waste products, restore normal water
quality following prolonged low flows, and provide longitudinal connectivity for species movement along
the river.
Hydrograph—A graph showing the variation in discharge over time.
Hydrologic regime—The distribution over time of water in a watershed, among precipitation, evaporation, soil
moisture, ground water storage, surface storage, and runoff.

xiii
Hyporheic zone— the area below and adjacent to the stream through which surface water and ground water are
readily exchanged and mixed, having a strong influence on stream biogeochemistry
Index of biotic integrity—A numerical gauge of the biological health of stream fish communities based on various
attributes of species richness, species composition, trophic relations, and fish abundance.
Instream flow—The rate of flow in a natural stream channel at any time of year.
Main Stem—The main channel of a river, as opposed to tributary streams, and oxbow lakes or floodplain sloughs.
Mussel—Freshwater clam.
Natural flow—The flow regime of a stream as it occurs under completely unregulated conditions; that is, a stream
not subjected to regulation by reservoirs, diversions, or other human works.
Overbank flow—An infrequent, high flow event that overtops the river banks, physically shapes the channel and
floodplain, recharges ground water tables, delivers nutrients to riparian vegetation, and connects the
channel with floodplain habitats that provide additional food for aquatic organisms.
Pool—A part of the stream that is deeper than other parts of the stream and where the water is not visibly flowing
downstream.
Reach—A comparatively short length of a stream, channel, or shore. One or more reaches compose a segment.
Riffle—A relatively shallow reach of stream in which the water flows swiftly and the water surface is broken into
waves by obstructions that are completely or partially submerged.
Riparian/ riparian zone—as applied to the study of fluvial systems, is an ecological term referring to that part
of the fluvial landscape inundated or saturated by flood flows; it consists of all surfaces of active
fluvial landforms up through the flood plain including channel, bars, shelves, and related riverine
features such as oxbow lakes, oxbow depressions, and natural levees. Particularly in arid and semiarid
(water-deficient) environments, the riparian zone may support plants and other biota not present on
adjacent, drier uplands (Osterkamp, 2008).
Riparian vegetation—Vegetation that is dependent upon an excess of moisture during a portion of the growing
season on a site that is perceptively more moist than the surrounding area.
Sediment—Solid material, both mineral and organic, that is in suspension in the current or deposited on the
streambed.
Sediment load—A general term that refers to material in suspension and/ or in transport. It is not synonymous with
either discharge or concentration.
Segment—A relatively long section of a river, exhibiting relatively homogeneous conditions of hydrology, channel
geomorphology, and pattern.
Sound Ecological Environment (SEE)—An environment that sustains the full complement of the current suite of
native species in perpetuity, or at least support the reintroduction of extirpated species, sustains key habitat
features required by these species, retains key features of the natural flow regime required by these species
to complete their life cycles, and sustains key ecosystem processes and services, such as elemental cycling
and the productivity of important plant and animal populations.
Stream—A natural water course of any size containing flowing water, at least part of the year, supporting a
community of plants and animals within the stream channel and the riparian vegetative zone.
Streambed—The bottom of the stream channel; may be wet or dry.
Subsistence flow—The minimum stream flow needed during critical drought periods to maintain tolerable water
quality conditions and provide minimal aquatic habitat space for the survival of aquatic organisms.
Suspended sediment—Particles that are suspended in the moving water column for long distances downstream.
Much of this material settles out when water movement slows or ceases.
Tributary—A stream feeding, joining, or flowing into a larger stream.
Water resources—The supply of ground water and surface water in a given area.

xiv
Water right—A legally protected right to use surface or ground water for a specified purpose (such as crop
irrigation or water supply), in a given manner (such as diversion or storage), and usually within limits of a
given period of time. While such rights may include the use of a body of water for navigation, fishing,
hunting, and other recreational purposes, the term is usually applied to the right to divert or store water for
some out-of-stream purpose or use.
Watershed—See Drainage area.

xvii
Executive Summary
The Upper Rio Grande BBEST (URG BBEST) study area includes the Rio Grande basin upstream of Amistad
Reservoir and below Presidio, including the Pecos and Devils river basins. This report is written to provide a
summary of the best available science regarding this reach of the Rio Grande and its tributaries. It includes river-
specific definitions of a Sound Ecological Environment (SEE) and discussion of whether such an environment
exists for specific river and tributary segments. It also includes environmental flow regime recommendations to
sustain the SEE consistent with the Texas 80th legislature Senate Bill 3 Environmental Flows process.
We conclude that the “Lower Canyons” reach of the Rio Grande, the Lower reach of the Pecos river and the Devils
river currently support a sound ecological environment and make specific flow recommendations to sustain or
improve this status. We also conclude that the “Parks” reach of the Rio Grande and the upper Pecos between Red
Bluff reservoir and Independence Creek are not sound and make variable recommendations to improve or at
minimum to not degrade the environment in these reaches. Recommendations for the Rio Grande and the Pecos are
written as to not exceed the limitations of the 1944 Treaty with Mexico or the Pecos River Compact.
We follow previous BBEST’s in recommending flow regimes in terms of four primary environmental flow
components (subsistence flows, base flows, high flow pulses and overbank flows) derived from both analyses of
historical hydrology and overlays of available water quality, biology and geomorphology information. The URG
BBEST developed environmental flow regime recommendations for a total of thirteen locations in three Upper Rio
Grande sub-basins: the Rio Grande, Pecos River and Devils River. The approach to development of flow
recommendations varied somewhat across these three sub-basins.
The hydrology of the upper Rio Grande is determined by inflows from the Rio Grande upstream from Presidio, TX,
inflows from the Rio Conchos in Chihuahua, MX, and other large desert ephemeral tributaries in both countries.
Stream flow is primarily comprised of runoff produced by monsoon rains during the summer months, tropical
storms and hurricanes from both the Pacific Ocean and the Gulf of Mexico, and ground water inputs from adjacent
aquifers. The Rio Grande also transports extremely high sediment loads, and channel morphology changes rapidly
as dictated by the magnitude, duration, and source areas of flood flows, and the quantity of sediment input by
ephemeral tributaries. Thus, flow recommendations for the Rio Grande sub-basin rely upon historic hydrologic
analysis, with a strong emphasis placed upon study of sediment transport and analysis of geomorphology for the
Rio Grande for high flow pulses and, on water quality and biology for base flows and subsistence flow.
The hydrology of the Pecos River is primarily driven by groundwater inputs from the Pecos Valley and Rustler
Aquifers as well as other local springs from undetermined aquifer sources. Extensive ground water pumping from
the Pecos Valley Aquifer occurs for irrigated agriculture. High-flows are derived from regional frontal storms and
convective storms during the monsoon season. Water availability and water quality are the two most dominant
environmental concerns for the Pecos River, and directly control the health of the aquatic and riparian ecosystem.
To address these concerns within this report, several analyses were conducted to determine environmental flow
recommendations for six locations in the Pecos River sub-basin. HEFR analyses were used to describe all aspects
of the historical flow regime. The evaluation of existing data and information combined with the URG BBEST
analysis concluded the upper Pecos River to be unsound and unable to sustain a sound ecological environment,
therefore the flow regime recommendations for the upper gages are considered initial recommendations to maintain
existing conditions. Recommendations for flows to restore the soundness of this reach are not offered, however the
URG BBEST has laid out adaptive management steps to develop future flow recommendations, should such

xviii
become priority. For the lower Pecos River and Independence Creek, which the URG BBEST determined sound,
the flow regime recommendations are intended to maintain the current ecological conditions. To refine hydrology-
based flow recommendations, a biological overlay consisting of flow-instream habitat modeling for 10 focal fish
species was incorporated. This methodology was also used to develop base-flow recommendations for one lower
Pecos River gage and for Independence Creek. Thereafter a water quality overlay was applied to evaluate and
refine subsistence flow recommendations.
The Devils River sub-basin is characterized by groundwater inputs governing the low flows of the river, and frontal
storms and convective storms during the monsoon season driving high flows. The Devils River is considered
pristine with exceptional water quality and an abundant and diverse aquatic and riparian ecosystem. We make
environmental flow recommendations for two locations in the Devils River sub-basin. We began by using HEFR
analyses to characterize the historical stream-flow record. A biological overlay consisting of habitat modeling for
10 focal fish species are used to evaluate the base-flow component of the hydrology-based flow regime and refine
the base flow recommendations for one of the two Devils River gages. A water quality overlay was employed for
the evaluation of the subsistence flow recommendations, but no modifications to the hydrology-based subsistence
flows were necessary
The URG BBEST flow regime recommendations were develop using the best available science; however there are
many areas in which more information is needed to develop and strengthen aspects of the flow regimes. To
accomplish this, adaptive management recommendations including improved stream gage maintenance, future
studies regarding geomorphology and sediment transport, biology, and water quality are offered in order to better
understand the instream flow – SEE relationship.
1-1
Section 1. Preamble
1.1 Senate Bill 3 Environmental Flows Process
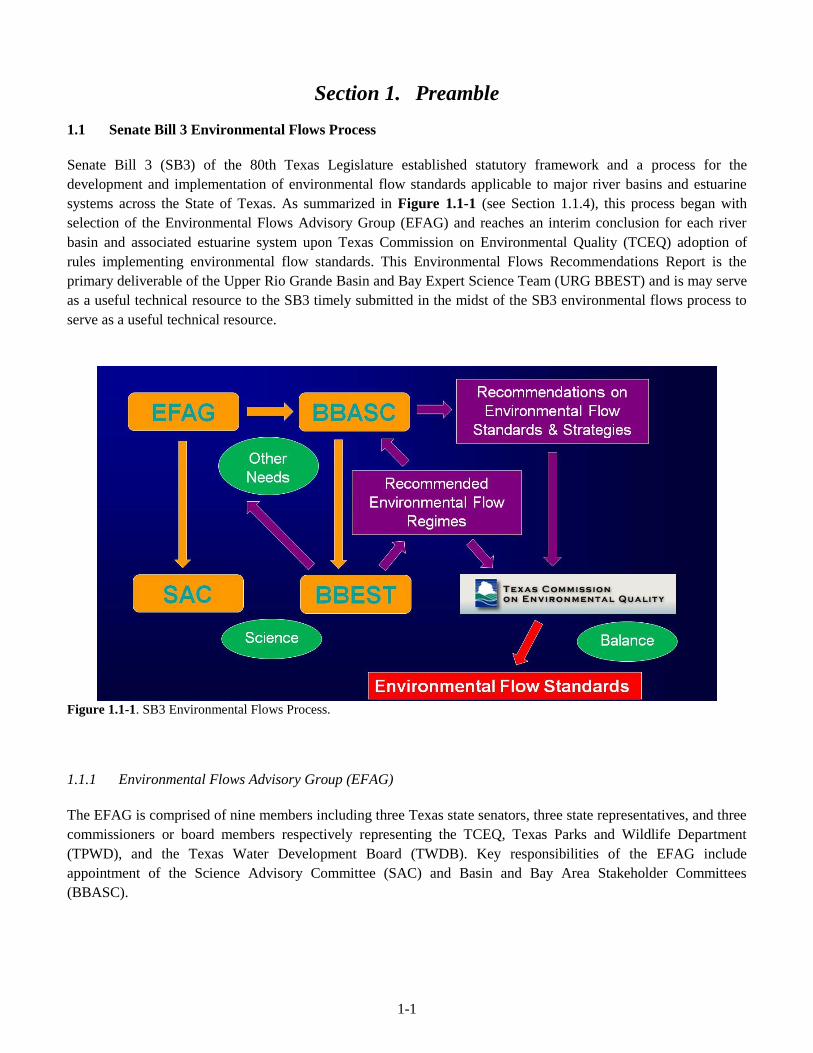
Senate Bill 3 (SB3) of the 80th Texas Legislature established statutory framework and a process for the
development and implementation of environmental flow standards applicable to major river basins and estuarine
systems across the State of Texas. As summarized in Figure 1.1-1 (see Section 1.1.4), this process began with
selection of the Environmental Flows Advisory Group (EFAG) and reaches an interim conclusion for each river
basin and associated estuarine system upon Texas Commission on Environmental Quality (TCEQ) adoption of
rules implementing environmental flow standards. This Environmental Flows Recommendations Report is the
primary deliverable of the Upper Rio Grande Basin and Bay Expert Science Team (URG BBEST) and is may serve
as a useful technical resource to the SB3 timely submitted in the midst of the SB3 environmental flows process to
serve as a useful technical resource.
Figure 1.1-1. SB3 Environmental Flows Process.
1.1.1 Environmental Flows Advisory Group (EFAG)
The EFAG is comprised of nine members including three Texas state senators, three state representatives, and three
commissioners or board members respectively representing the TCEQ, Texas Parks and Wildlife Department
(TPWD), and the Texas Water Development Board (TWDB). Key responsibilities of the EFAG include
appointment of the Science Advisory Committee (SAC) and Basin and Bay Area Stakeholder Committees
(BBASC).

1-2
1.1.2 Science Advisory Committee (SAC)
The SAC is comprised of nine technical experts in diverse areas relevant to evaluation of environmental flows, and
has since 2009 diligently provided documented guidance to both BBEST’s and BBASC’s. Guidance provided by
the SAC regarding environmental flows has addressed geographic scope, use of hydrologic data, fluvial sediment
transport (geomorphology), methodologies for establishing freshwater inflow regimes for estuaries, biological
overlays, nutrient and water quality overlays, moving from flow regimes to flow standards, lessons learned from
early BBEST’s, work plans for adaptive management, methods for evaluating interrelationships between
environmental flow regimes and water supply projects, and consideration of attainment frequencies and hydrologic
conditions. This guidance has been relied upon by the Upper Rio Grande BBEST in execution of its charge and
creates the general structure of this recommendations report.
1.1.3 Basin and Bay Area Stakeholder Committee (BBASC)
BBASC’s must reflect a fair and equitable balance of interest groups concerned with particular river basins and bay
systems. Interest groups represented on BBASC’s include: agriculture, recreation, municipalities, soil and water
conservation districts, refining industry, chemical manufacturing, electricity generation, commercial fishing, public
interests, regional water planning, ground water conservation districts, river authorities, and environmental groups.
BBASC’s, in turn, appoint BBEST’s comprised of technical experts with knowledge of particular river basin and
bay systems and/or development of environmental flow regimes. The Upper Rio Grande BBASC is comprised of
18 members. On April 21, 2010, the Upper Rio Grande BBASC acted to appoint 6 scientists as members of the
Upper Rio Grande BBEST. Information regarding the Upper Rio Grande BBEST is summarized in Section 1.2.
Once a BBEST issues its recommendations report, the appointing BBASC will consider the BBEST
recommendations in conjunction with other factors — including the present and future needs for water for other
uses related to water supply planning — and prepare recommendations on environmental flow standards and
strategies within six months. Subsequently, BBASC’s are charged with development of a work plan that addresses
periodic review of environmental flow standards, prescribes necessary monitoring and studies, and establishes a
schedule for continuing validation or refinement of environmental flow regime recommendations.
Texas Commission on Environmental Quality (TCEQ)
With due consideration and balancing of all relevant information available, including BBEST and BBASC
recommendations, the TCEQ will adopt environmental flow standards for each river basin and bay system through
an established, public rule-making process.

1-3
1.2 Upper Rio Grande Basin and Bay Expert Science Team (Upper Rio Grande BBEST)
1.2.1 Membership
The Upper Rio Grande BBEST is comprised of 6 members appointed by the Upper Rio Grande BBASC. Due to
scheduling conflicts and other commitments, one original member chose to withdraw in March 2011 and was
subsequently replaced by the Upper Rio Grande BBASC. Active membership of the Upper Rio Grande BBEST is
summarized below along with administrative and subcommittee assignments.
Kevin Urbanczyk — Chair
Zhuping Sheng — Vice-Chair, Pecos River Subcommittee
Jeff Bennett — Rio Grande Subcommittee
David Dean — Rio Grande Subcommittee
Gary Bryant — Pecos River Subcommittee
Ryan Smith — Devil’s River Subcommittee
1.2.2 Upper Rio Grande BBEST Charge
Pursuant to Section §11.02362(m) of the Texas Water Code, the initial charge of a BBEST is summarized as
follows (emphasis added):
Each basin and bay expert science team shall develop environmental flow analyses and a recommended
environmental flow regime for the river basin and bay system for which the team is established through a
collaborative process designed to achieve a consensus. In developing the analyses and recommendations, the
science team must consider all reasonably available science, without regard to the need for the water for other
uses, and the science team's recommendations must be based solely on the best science available.
SB3 of the 80th Texas Legislature offers the following definitions pertinent to the BBEST initial charge (emphasis
added):
"Environmental flow analysis" means the application of a scientifically derived process for predicting the response
of an ecosystem to changes in instream flows or freshwater inflows.
"Environmental flow regime" means a schedule of flow quantities that reflects seasonal and yearly fluctuations that
typically would vary geographically, by specific location in a watershed, and that are shown to be adequate to
support a sound ecological environment and to maintain the productivity, extent, and persistence of key aquatic
habitats in and along the affected water bodies.
1-4
1.3 Sound Ecological Environment – Upper Rio Grande BBEST
Senate Bill 3 (SB 3) defines an environmental flow regime as:
“a schedule of flow quantities and yearly fluctuations that typically would vary geographically, by specific
location in a watershed, and that are shown to be adequate to support a sound ecological environment and
to maintain the productivity extent, and persistence of key aquatic habitats in and along the affected water
bodies.”
SB3 did not define Sound Ecological Environment, but the SAC and other groups have provided definitions. The
following is an interpretation from SAC (2006) with additions from the Upper Rio Grande BBEST.
A sound ecological environment is one that:
• sustains the full complement of the current suite of native species in perpetuity, or at least support the
reintroduction of extirpated species,
• sustains key habitat features required by these species,
• retains key features of the natural flow regime required by these species to complete their life cycles, and
• sustains key ecosystem processes and services, such as elemental cycling and the productivity of important
plant and animal populations.
The streams of the upper Rio Grande, including the Pecos and Devils Rivers as well as major tributaries like
Alamito and Terlingua Creeks have changed in a variety of ways and extents in the years since major reservoirs
were constructed and major water diversions began. For the purposes of this report it is assumed that the key
ecosystem processes, services, habitat features and biological communities and species were in dynamic
equilibrium with any changes attributable to natural environmental fluctuations and that the large changes in water
quality, quantity, or species composition and distribution subsequent to major water development can be attributed
to anthropogenic causes. We note, as have other BBEST’s, that the adjective “sound” can be interpreted in many
ways. In our view, “sound” does not equate to “natural’, “pristine”, or “in a condition similar to that before major
diversions”. However, in as much as it is the ecosystem services that support stakeholders (i.e. water quality and
water supply, native species) and maintain, to a reasonable level, the physical, chemical, and biological attributes,
“sound” will equate to active and functioning processes such as sediment and solute transport, habitat maintenance,
persistent base flows, and elemental cycling.
There is not a single measure to test for soundness. Rather a test for soundness necessarily requires a review of a
suite of measurements to assess the key features of a sound environment. These measures include flow data, water
quality standards, fish and other biological surveys, sediment transport, flood frequency patterns, indices of
biologic integrity and species occurrence, abundance, and diversity.
Many of the rivers and streams, riparian, wetland ecosystems (water bodies) of our assigned area exist wholly on
private land and are not serviced by any state or federal monitoring systems. Given the paucity of data for these
streams it is impossible to make a thorough determination of soundness in all places. For the purposes of this report,
we will focus on the following stream segments: Rio Grande downstream of the confluence with the Rio Conchos
at Presidio, Texas and above Amistad Reservoir, as well as two gaged tributaries: Alamito and Terlingua Creeks,
Pecos River from the New Mexico state line to Amistad reservoir and one of its tributaries Independence Creek,
and the Devils River from the headwaters to Amistad Reservoir (see Figure 1.3-1).
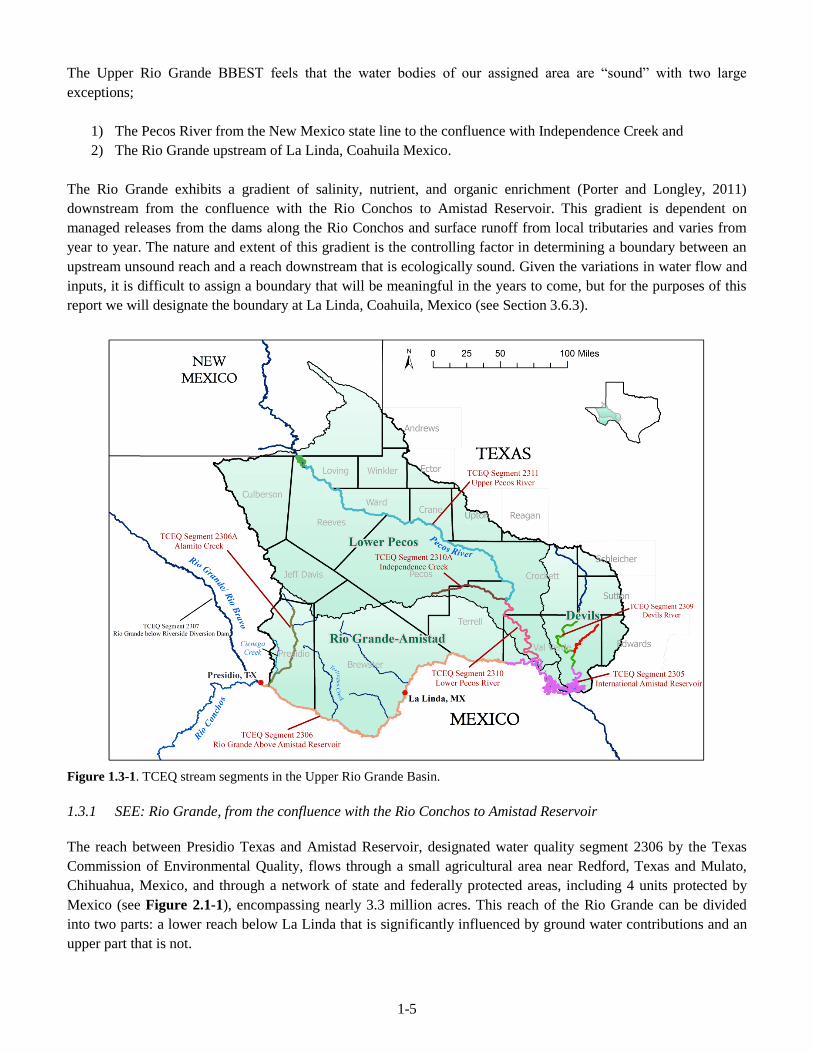
1-5
The Upper Rio Grande BBEST feels that the water bodies of our assigned area are “sound” with two large
exceptions;
1) The Pecos River from the New Mexico state line to the confluence with Independence Creek and
2) The Rio Grande upstream of La Linda, Coahuila Mexico.
The Rio Grande exhibits a gradient of salinity, nutrient, and organic enrichment (Porter and Longley, 2011)
downstream from the confluence with the Rio Conchos to Amistad Reservoir. This gradient is dependent on
managed releases from the dams along the Rio Conchos and surface runoff from local tributaries and varies from
year to year. The nature and extent of this gradient is the controlling factor in determining a boundary between an
upstream unsound reach and a reach downstream that is ecologically sound. Given the variations in water flow and
inputs, it is difficult to assign a boundary that will be meaningful in the years to come, but for the purposes of this
report we will designate the boundary at La Linda, Coahuila, Mexico (see Section 3.6.3).
Figure 1.3-1. TCEQ stream segments in the Upper Rio Grande Basin.
1.3.1 SEE: Rio Grande, from the confluence with the Rio Conchos to Amistad Reservoir
The reach between Presidio Texas and Amistad Reservoir, designated water quality segment 2306 by the Texas
Commission of Environmental Quality, flows through a small agricultural area near Redford, Texas and Mulato,
Chihuahua, Mexico, and through a network of state and federally protected areas, including 4 units protected by
Mexico (see Figure 2.1-1), encompassing nearly 3.3 million acres. This reach of the Rio Grande can be divided
into two parts: a lower reach below La Linda that is significantly influenced by ground water contributions and an
upper part that is not.

1-6
Sustains the full complement of the current suite of native species in perpetuity
Eight of 41 native fish have been extirpated or are extinct from the Big Bend Reach of the Rio Grande (see Section
3.6.3.2) (Hubbs et al., 2008). A recent mussel survey by the National Park Service (NPS) found only dead shells of
three of five species that are believed to exist in the area with no individuals found in the upper reach and
increasing numbers moving downstream. The invasive red eared slider is displacing and hybridizing with the native
Big Bend Slider. This is in contrast to the recent and early success of the reintroduction of the Rio Grande Silvery
Minnow (RGSM). Quarterly monitoring for the RGSM occurs at five sites in Brewster County. It is reasonable to
suggest that this success is attributable to concurrent timing between the initial release and the channel reset flows
of late 2008 (see Section 4.1.1). It is notable that of the 304 miles of river between the Rio Conchos and Amistad
Reservoir, biological sampling is guided by the greater ease of access in the upper reach than in the lower reach,
and thus the same level of sampling effort is not conducted everywhere. Monitoring of the RGSM through the next
phase of channel sedimentation and narrowing that occurs after large floods will remain an important element of
adaptive management programs. The overall trend is a decline in native species diversity. This criterion is not met
for the reach above La Linda.
Sustains key habitat features required by these species
Dean and Schmidt (2011) have documented channel sedimentation, narrowing, and a loss of exposed gravel bars
and multithreaded sections for the segment of the Rio Grande within Big Bend National Park (BBNP). The same
has been documented for the El Paso to Presidio reach (Everitt, 1993). Dean and Schmidt (2011) further
documented that channel reset events where significant channel widening occurs, like the one in 2008, only
partially recover channel features and that channel narrowing re-occurs rapidly; the overall trend is an alteration of
channel and habitat features from a wide multi-threaded channel with shallow and sparsely vegetated banks to a
narrow, deeper channel with steeper heavily vegetated banks. As the channel accumulates sediment, its conveyance
capacity is decreased and flooding frequency increases.
Downstream of La Linda, the Rio Grande enters a reach typified by deep canyons and spring fed base flows.
Steeper tributaries deliver a coarser sediment load. A riverine ecosystem dominated by sediment transport gives
way to one where geology may play a more important role. The impact of sediment accumulation on the reach
below Boquillas Canyon has not been studied and is not well understood. In some locations channel and habitat
features appear to be in decline, while in others this trend has not been documented.
Given the long term trend documented by Dean and Schmidt (2011) this criterion is not met for the reach above
Boquillas Canyon.
Retains key features of the natural flow regime, such as water quality, required by these species to complete their
life cycles.
Segment 2306, like 2307 above it, is an impaired water body, failing water quality standards for chloride, sulfate
and total dissolved solids (TDS). In 2010, segment 2306 was included in the state’s list of impaired water bodies,
(TCEQ, 2010, 303D). The TCEQ averages all measurements across the reach; water quality measurements taken in
the upper portion of the reach are consistently above acceptable limits while measurements taken in the lower reach
are consistently within an acceptable range and yet the reach average violates the standards. The overall trend is
increasing salinity at 3 of the 4 continuous monitoring stations operated by the Texas Clean Rivers Program
(TCRP) (Bennett, et al 2012).
1-7
Ground water contributions to the Rio Grande from Cretaceous limestone aquifers in the lower end of the reach
sustain aquatic habitats during dry years and mitigate water quality impairment (Bennett and Cutillo, 2007).
Thermal springs occur along the Rio Grande from below Mariscal Canyon in Big Bend National Park to below
Foster’s Weir and just above Amistad Reservoir. Ground water contributions can account for as much as 2/3 of the
flow at Foster’s Weir and the river entering the reservoir during low flow conditions.
Given the long term trend in declining water quality in the upper reach this criteria is not met for the reach between
the Rio Conchos and the TCRP station at Rio Grande Village.
Sustains key ecosystem processes and services, such as elemental cycling and the productivity of important plant
and animal populations.
Quantitative studies of algal communities within the Rio Grande were completed by Porter and Longley in 2011.
These studies revealed that the reach between Presidio and Castolon was dominated by brackish water species of
algae indicating eutrophic to hypereutrophic conditions. The reach between Castolon and La Linda was a transition
zone dominated by algal communities indicating mesotrophic or eutrophic conditions. Downstream of La Linda
algal assemblages indicated improving water quality. These observations are congruent with the TCRP assessment
in 2008 that lists the upper segments of this reach as impaired for contact recreation due to bacterial levels. The
same assessment found increasing ammonia levels at one station. Eutrophic conditions indicate that elemental
cycling is not in balance with nutrient inputs. Given the current condition and trends this criterion is not met above
La Linda.
1.3.2 Alamito Creek
Adapted from: Far West Texas Water Planning Group. 2011. Far West Texas Water Plan.
http://www.twdb.state.tx.us/wrpi/rwp/3rdRound/2011_RWP/RegionE/
Alamito Creek extends from its confluence with the Rio Grande upstream to north of Marfa in Presidio County. A
high quality tributary, Cienega Creek extends from its confluence with Alamito Creek upstream to its headwaters
also in Chinati Mountains State Natural Area. Springs north of the Big Bend Ranch State Park form the headwaters
of both creeks. Segments of these two streams on public land and on land held by the Trans Pecos Water and Land
Trust are designated ecologically significant in the state water plan.
Sustains the full complement of the current suite of native species in perpetuity
Alamito Creek is recognized as a high quality ecoregional stream with exceptional aquatic life and high aesthetic
value. The stream contains a diverse benthic community of macroinvertebrates and fishes (Bayer et al., 1992;
Linam et al., 1999). Unique communities of threatened or endangered species include: Concho pupfish (Federal
Species of Concern/State Threatened), Chihuahua shiner (Federal Species of Concern/State Threatened), Mexican
stoneroller (Federal Species of Concern/State Threatened) (Bayer et al., 1992). Cienega Creek is an intact desert
spring ecosystem displaying overall habitat value. Unique communities of threatened or endangered species
include: Big Bend mud turtle and various endangered desert fishes.
The Dixon Water Foundation recently donated a tract of land approximately 35-40 miles south of Marfa in Presidio
County to the Trans Pecos Water and Land Trust (TPWT), a non-profit 501.c.3 corporation. The 1,061-acre
donated property, designated as the Trans Pecos Water Trust Alamito Creek Preserve, includes a 3.5-mile riparian

1-8
zone of Alamito Creek and a shorter segment of Matonoso Creek. The southern downstream boundary of this
property is located where TX 169, also known as Casa Piedra Road, bridges Alamito Creek. The 3.5- mile segment
of Alamito Creek within the Preserve boundary is recommended by the Far West Texas Regional Water Planning
Group (FWTRWPG) as an "Ecologically Unique River and Stream Segment.
This criterion is met for Alamito Creek.
Sustains key habitat features required by these species
Alamito Creek runs on the surface for most of the TPWT Preserve stretch. There are pools with year round
populations of endemic fish, amphibians and aquatic invertebrates. Alamito Creek supports an extensive
cottonwood bosque. Ash and willow species are present. There is very little tamarix/salt cedar. The segment offers
superb wildlife habitat, natural diversity, and perennial stream flow, deserving recognition as an ecologically
unique stream segment. This criterion is met.
Retains key features of the natural flow regime, such as water quality, required by these species to complete their
life cycles.
A large concrete dam is located on Alamito Creek just south of Marfa, Texas and was built to create San Esteban
Reservoir in the early part of the last century. Though the reservoir rarely holds water, the dam is intact and
effectively disconnects the upper portion of Alamito Creek with the lower reach. Large stands of cottonwoods,
willows and ash in the ecologically significant reach indicate a relatively intact hydrology.
Sustains key ecosystem processes and services, such as elemental cycling and the productivity of important plant
and animal populations.
No information is available for this stream segment.
1.3.3 Pecos River
The Pecos River, TCEQ water quality segments 2311 (from Red Bluff Reservoir to the confluence with
Independence Creek) (Figure 1.3-1) and 2310 (from the confluence with Independence Creek to Amistad
Reservoir),
Sustains the full complement of the current suite of native species in perpetuity
The fish communities of the Pecos River in Texas have been highly altered. The reach from the Red Bluff
Reservoir to Independence Creek (segment 2311) has lost 16 of its 35 native species (Hoagstrom 2003) and most
fishes that persist are tolerant of high salinity and low water quality. Many of these species losses are directly
related to flow impacts, particularly the flow regulation by Red Bluff Reservoir. Some species losses in both
reaches are due to hybridization and competition with introduced species (Wilde and Echelle 1992, Hoagstrom
1994, Hoagstrom 2003). Because of the highly altered fish community, this criterion for a sound ecological
environment is not met for the upper reach of the Pecos.
The fish community of the reach below Independence Creek (segment 2310) exhibits similar declines with 18 of its
39 native species persisting (Hoagstrom 2003). Many of these species losses are also related to flow impacts and
hybridization and competition with introduced species (Wilde and Echelle 1992, Hoagstrom 1994, Hoagstrom
1-9
2003). While this lower reach is a much different environment than it was before water development and has also
seen a loss or significant decline of most large river fishes, it does maintain a thriving, albeit different, fish
community. The lower reach is now primarily a ground water, spring-fed stream with a fish community similar to
Independence Creek with the large river fishes that do remain in highly reduced abundances. Primarily due to
ground water input, this reach maintains healthy and stable biological communities and still supports several rare
species. We consider this lower reach to meet this criterion for a sound ecological environment.
The fish community of Independence Creek, a primary tributary of the lower Pecos River, is largely intact with
only a few species declining or extirpated due to hybridization or other factors separate from flow regulation and
impacts. We consider this criterion to be met for Independence Creek. Information is insufficient to evaluate this
criterion for other tributaries of the Pecos such as Live Oak Creek.
Sustains key habitat features required by these species
The water development of the Pecos River has also had major effects on the river’s channel and the instream,
riparian and floodplain habitat features that it provides. The upper and lower reaches have always been somewhat
different, with the lower portion intersecting the Edwards Plateau. The Upper Pecos has seen major changes from
its historical deep, swift flow with steep, unstable banks and shifting sandy bed to its current narrow, muddy
channel with highly reduced flow. This reach does not meet this criterion for a sound ecological environment.
However, the lower Edwards Plateau influenced reach retains more of its historical characteristics, which is partly
responsible for it maintaining a more healthy fish community. The lower reach does meet this criterion for a sound
ecological environment.
Retains key features of the natural flow regime, such as water quality, required by these species to complete their
life cycles.
The Pecos River from Red Bluff Dam to Independence Creek (segment 2311) can be divided into three ecological
sections. The first section, from Red Bluff Dam to Ward II turnout, is managed by the Red Bluff Water Power
Control District. Varying management strategies have been utilized in the past some of which have totally dried the
river bed but very little water ever passes Ward II turnout (Figure 2.6-8 and Figure 2.6-10). In this section of the
river, high flow pulse flows events are diverted by the seven irrigation districts. This criterion is not met in the
upper reach.
Section 2, from Ward II turnout to Iraan, receives high salinity ground water from the Pecos Valley Aquifer. Total
dissolved solids for base flows are > 15,000 ppm TDS in the aquifer which feeds the springs into this segment of
the Pecos River (Figure 2.7-2). During the summer months TDS can exceed 30,000 ppm in the vicinity of Iraan. In
this section of the river, the majority of overland flows are intercepted by Ward II and Pecos II and III irrigation
districts. Therefore, storm water events which would cause pulse flow events never make it to the Pecos River. Key
features of the natural flow regime are not met in this section of the river.
From Iraan to the confluence of Independence Creek the River is spring fed by fresh water from the Edwards
Aquifer. This water dilutes the TDS concentration in the river until it reaches the confluence with Independence
Creek. Storm events in Tunas sub-basin and Pecos sub-basin enter the river as do storm events in Comanche Creek
and Landreth Draw. Therefore, overland flows in this section do create pulse flows which contribute to the
improved water quality and habitat. However the low base flows and the low water quality keep this section of the
1-10
river from meeting the criteria of retaining a natural flow regime required by these species to completer their life
cycles.
Downstream from the confluence of Independence creek (segment 2310), flow and water quality are drastically
improved. Below Independence Creek, river flow increases 42% and the sodium concentration decreases 50%.
Water quality improves to the vicinity of 2,000 ppm TDS (Miyamoto et al. 2006). Below Independence Creek, the
river has storm event flows from Comanche Creek, Landreth Draw, Tunas sub-basin, Pecos sub-basin, and
Independence Creek sub-basin. This provides the natural flow regime to maintain a sound ecological environment
for the smaller native fishes which currently exist in the river. To maintain this sound ecological environment,
overland flow must be protected to support sufficient channel flow for smaller fishes and ground water flows must
be protected to provide base and subsistence flow. If the spring flows are not protected, the river will not sustain a
sound ecological environment for even the smaller fishes.
Sustains key ecosystem processes and services, such as elemental cycling and the productivity of important plant
and animal populations.
To our knowledge, there has not been a large amount of research on ecosystem processes on the Pecos River. We
also do not know of studies of important processes like sediment transport and sediment budget, ecosystem
productivity, etc. There have been studies of riparian vegetation, insect, bird, and herpetofaunal communities in the
area of Independence Creek Preserve, which indicate a high degree of health and intactness. The critical process for
the ecological health of the Pecos is ground water contributions in lower portion of TCEQ segment 2311 and the
entirety of Segment 2310. For the purposes of this report, we have determined that segment 2310 is ecologically
sound based wholly on occurrence of high quality ground water input. We consider it highly unlikely that this
criterion is met for the upper reach, but that it is met, in its current state of “soundness”, in the lower reach.
1.3.4 SEE: Independence Creek
Independence Creek, unclassified TCEQ water quality segment 2310A,
Sustains the full complement of the current suite of native species in perpetuity
Nearly all of the 29 native fishes of Independence Creek are currently extant with good population sizes. Only one
species, the Pecos pupfish (Cyprinodon pecosensis) has been extirpated, due to hybridization with the introduced
sheepshead minnow (Cyprinodon variegatus) (Wilde and Echelle 1992). Independence Creek supports 2 listed
species [proserpine shiner Cyprinella proserpina (State-Threatened) and Rio Grande darter Etheostoma grahami
(State-Threatened)] and several other rare fish (e.g., headwater catfish Ictalurus lupus and manantial roundnose
minnow Dionda argentosa). All currently extant Independence Creek fishes have stable populations (Kelsch and
Hendricks 1990, Hoagstrom 2003, Bonner et al. 2005, Watson 2006), though at least two are threatened by
hybridization, the headwater catfish by channel catfish (Ictalurus punctatus) (Wilde and Echelle 1992) and the
plains killifish (Fundulus zebrinus) by introduced Gulf killifish (Fundulus grandis) (Hoagstrom 1994).
Independence Creek serves as a refuge for Pecos River fishes during periods of environmental stresses such as poor
water quality (Rhodes and Hubbs 1992).

1-11
Sustains key habitat features required by these species
Independence Creek does currently sustain key habitat features required by the native species. Again, any habitat
impacts are not likely due to flow alteration, but to watershed impacts and other factors. Similar to the Devils River,
large floods seem to severely impact instream habitats, with the post-flood channel tending to be wider, shallower
with a higher abundance of gravels (Watson 2006), though this does not seem to severely impact the post-flood fish
community. The Independence Creek watershed sustains grazing which was heavier in the past, but the effects of
this grazing on watershed hydrology have not been investigated. There has been some development of
Independence Creek for irrigation, particularly in the area of Caroline Springs now contained in The Nature
Conservancy’s (TNC) Independence Creek Preserve. But, diversions are now very small and are made primarily to
water wetland habitats.
Retains key features of the natural flow regime, such as water quality, required by these species to complete their
life cycles.
Independence Creek does currently retain all aspects of its natural flow regime on which species’ life histories
depend. There is currently no flow regulation of Independence Creek, so there has been little to no management of
or impacts to high flow events. Base flow has not been highly altered by minimal irrigation in the watershed, but is
the aspect of the flow regime most likely to be affected in the future, primarily by aquifer pumping. Trends in base
flow should be examined in more detail using annual summaries and other parameters in future work.
Sustains key ecosystem processes and services, such as elemental cycling and the productivity of important plant
and animal populations.
A large amount of research on ecosystem processes in Independence Creek was in evidence at the time of this.
Published studies of important processes like sediment transport and sediment budget, ecosystem productivity, etc.
were not located. Studies of riparian vegetation, insect, bird, and herpetofaunal communities have been conducted
in the area of Independence Creek Preserve, which indicate a high degree of health and intactness.
1.3.5 Devils River
The Devils River, TCEQ water quality segment 2309, flows approximately 66 miles through Val Verde County in
south central Texas. There are no major diversions on the river and only one continuous monitoring station. The
lower 21 miles of this reach are impounded by Amistad Reservoir. It is widely recognized as the state’s most
unsoiled stream in terms of water quality.
Sustains the full complement of the current suite of native species in perpetuity
Nearly all of the 33 native fishes of the Devils River are currently extant with good population sizes. Only one
species, the blotched gambusia (Gambusia senilis) has been extirpated, likely due to construction of Amistad
Reservoir (Hubbs et al. 2008). The Devils River supports 4 listed species [Devils River minnow Dionda diaboli
(Federal, State-Threatened), Proserpine shiner Cyprinella proserpina (State-Threatened), Rio Grande darter
Etheostoma grahami (State-Threatened), and Conchos pupfish – Devils River subspecies Cyprinodon eximius ssp.
(State-Threatened)] and several other rare fish (e.g., headwater catfish Ictalurus lupus, manantial roundnose
minnow Dionda argentosa and Tex-Mex Gambusia G. speciosa). The construction of Amistad Reservoir seems to
have not only extirpated blotched gambusia, but also severely reduced another species (Conchos pupfish) (Davis
1980a, Hubbs and Garrett 1990) and may have reduced or eliminated some larger bodied large river fishes. The

1-12
Conchos pupfish was nearly extirpated, but was re-established in the upper river (Dolan Falls area) from a
downstream population (Hubbs and Garrett 1990). All currently extant imperiled fishes have stable populations
(Kelsch and Hendricks 1990, Garrett et al. 1992, Cantu and Winemiller 1997, Robertson and Winemiller 2003,
Kollaus and Bonner 2012). There have been several exotic species introduced into the Devils River, some of which
may affect native fishes (Lopez-Fernandez and Winemiller 2005). Also, several reservoir fishes (e.g., striped bass)
now occur in the river as they move upstream from Amistad Reservoir. There is no ongoing fish community
monitoring as part of a Clean Rivers Program, but the Devils River was used as a reference stream for development
of regional fish IBI’s (Bayer et al. 1992, Linam et al. 2002) and all recent studies indicate that the fish communities
are highly intact.
The freshwater mussel community of the Devils River seems to be mostly intact. There have been few recent
surveys, but Popenaias popeii was recently rediscovered in the Devils River. The aquatic reptiles and amphibians
of the Devils River also seem to be largely intact (Bailey et al. 2008). The Rio Grande cooter is a species of
conservation concern that seems to have stable population in the Devils River. However, more survey attention and
information on the current status of species such as Rio Grande cooter and springs salamander (Eurycea sp., spring-
dwelling species, not in river itself) is needed. All recent studies of benthic macroinvertebrates indicate that the
insect communities of the Devils River are also highly intact.
Overall, most of the native species of the Devils River are sustained by the current flow regime. The few species
losses and declines that have taken place in the Devils seem to be due not to flow effects, but to downstream
reservoir construction and other human activities. This criterion is met for the Devils River.
Sustains key habitat features required by these species
The Devils River does currently sustain key habitat features required by the native species. Again, any habitat
impacts are not likely due to flow alteration, but to watershed impacts and other factors. Periodic large floods have
major effects on instream habitats, with the post-flood channel tending to be wider, shallower with a higher
abundance of gravels (Harrell 1978). It is not known whether this has been exacerbated by land uses. There is some
suggestion of impacts from heavy grazing of the Devils watershed in the early and middle part of the 20th century.
While not having been heavily studied, the Devils River channel has not sustained heavy alteration such as the Rio
Grande. The biggest impact to the Devils River has been Amistad Reservoir which cuts off access to downstream
habitats. This criterion is met for the Devils River.
Retains key features of the natural flow regime, such as water quality, required by these species to complete their
life cycles.
The Devils River does currently retain all aspects of its natural flow regime on which species’ life histories depend.
There is currently no flow regulation in the Devils River, so there has been little to no management of or impacts to
high flow events. Base flow has not been highly altered, and is the aspect of the flow regime most likely to be
affected in the future, primarily by aquifer pumping. Trends in base flow need to be analyzed in more detail using
annual summaries and other parameters. The Devils River meets all current water quality standards (De La Cruz
2004) and is often put forward as one of the standards for high water quality in Texas. This criterion is met for the
Devils River.
Sustains key ecosystem processes and services, such as elemental cycling and the productivity of important plant
and animal populations.

1-13
To our knowledge, there has been little research on ecosystem processes in the Devils. There have also been no
studies of important processes like sediment transport, ecosystem productivity, etc. There have been studies funded
by The Nature Conservancy of riparian vegetation, insect, bird, and herpetofaunal communities in the area of Dolan
Falls Preserve, which indicate a high degree of health and intactness. This criterion is met for the Devils River.
1.4 Introduction to Environmental Flows Recommendation Report
The remainder of the Environmental Flows Recommendations Report of the Upper Rio Grande BBEST is
comprised of four major sections and supporting appendices. Section 2 provides an overview of the geologic,
physiographic, climatic, and biophysical characteristics of the upper Rio Grande basin and sub-basins and their
respective current conditions. Section 3 describes the in-stream flow analyses conducted for each sub-basin
including the bio-physical overlays used to guide the flow analyses and recommendations. Section 4 provides the
environmental flow recommendations for each river, and Section 5 outlines the adaptive management actions that
may be taken to improve the understanding of biophysical processes and future environmental flow
recommendations for each sub-basin.
The river segments under review in this report span two ecoregions that include diverse geologic and physiographic
characteristics, climatic and hydrologic regimes, and different environmental and land use histories. Thus, the
environmental processes that occur within each are unique with respect to the natural variability guiding these
processes as well as the land use histories and the degree of hydrologic development that has occurred. Previous
scientific investigations conducted within the URG basin are equally diverse and range from detailed geomorphic
investigations, habitat modeling, and water quality monitoring, to areas where little to no scientific investigations
have been conducted. The diverse physical and hydrologic environments and the different levels of scientific
understanding necessitate a unique suite of methods and biophysical overlays to be used for each river segment. It
is the URG BBEST’s opinion that applying standardized methodologies and analyses to each portion of the URG
basin would be a disservice to the unique nature of each river segment. For the above reasons, fundamentally
different approaches were used to guide the environmental flow analyses included within this report.
Methods for environmental flow analyses are the most unique on the Rio Grande because of the rapid rates of
geomorphic change that occur from year to year. An extensive geomorphic overlay is used for the Rio Grande
because the rapidly changing geomorphic template is viewed by regional environmental managers as the one of the
most important factors affecting the aquatic and riparian health of this river. Water quality is the other primary
overlay used for the Rio Grande because portions of the river are often listed as impaired by the TCEQ. For the
Pecos and Devils Rivers, environmental flow recommendations primarily consist of historic hydrologic .analyses
using Hydrology-based Environmental Flow Regimes (HEFR), along with low flow biological overlays pertaining
to fish habitat, as well as water quality. These differences are highlighted below and more fully described in
Sections 2 and 3.
1.4.1 Rio Grande, Alamito, and Terlingua Creeks
Stream flow of the upper Rio Grande river segment (318 miles between Presidio, TX and Amistad Reservoir,
Figure 2.1-1) is determined by inflows from the Rio Grande upstream from Presidio, TX, inflows from the Rio
Conchos in Chihuahua, MX, and other large desert ephemeral tributaries in both countries. Within these areas,
stream flow is comprised of runoff produced by monsoon rains during the summer months, tropical storms and
hurricanes from both the Pacific Ocean and the Gulf of Mexico, and ground water inputs from adjacent aquifers.

1-14
Over 80% of Rio Grande stream flow is derived from the Rio Conchos and other Mexican tributaries, and thus,
climatic conditions and hydrologic conditions in the Rio Conchos headwaters high in the Mexican Sierra Madre
Occidental, and Mexican water development directly influence the hydrologic regime of the Rio Grande. The Rio
Grande also transports extremely high sediment loads, and channel morphology changes rapidly as dictated by the
magnitude, duration, and source areas of flood flows, and the quantity of sediment input by ephemeral tributaries.
Significant ground water inputs begin approximately 148 miles downstream from Presidio, TX, and augment low
flow and improve the water quality. Few studies regarding the aquatic ecology of the Rio Grande have been
conducted; however, it is believed that native aquatic species are strongly affected by the rapid geomorphic changes
and longitudinal differences in water quality.
Based on the above characteristics, environmental flow recommendations for the Upper Rio Grande rely heavily
upon geomorphology, and water quality overlays, and to a lesser extent, biological overlays. HEFR analyses are
used to help characterize past hydrologic trends, and are supplemented by additional hydrologic analyses. The
geomorphology overlay, and the understanding of historic hydrologic trends in driving geomorphic process is used
to provide recommendations with regards to high flow pulses, because high flows (or lack thereof) dictate the rate,
magnitude, and trajectory of geomorphic change. The water quality overlay and biological overlay is used to
provide recommendations with regards to the low-flow regime.
The environmental flow recommendations for Alamito and Terlingua Creeks are entirely obtained by HEFR
analyses. These creeks have changed little over that last century, and there have been few studies from which to
incorporate bio-physical overlays. These creeks may potentially be affected by ground water pumping in the future;
however, there is little understanding of current land use trends with regards to the biological health and physical
characteristics of these creeks.
1.4.2 Pecos River and Independence Creek
The hydrology of the Pecos River is primarily driven by ground water inputs from the Pecos Valley and Rustler
Aquifers as well as other local springs. Extensive ground water pumping from the Pecos Valley Aquifer occurs for
irrigated agriculture. High-flows are derived from regional frontal storms and convective storms during the
monsoon season.
Water availability and water quality are the two most dominant environmental concerns for the Pecos River, and
directly control the health of the aquatic and riparian ecosystem. To address these concerns within this report, we
use several analyses in determining environmental flow recommendations for six locations in the Pecos River sub-
basin. HEFR analyses are used to describe all aspects of the historical flow regime. Because we consider the upper
Pecos River to be unsound, the flow regime recommendations for the upper gages (Pecos River at Orla, Pecos and
Girvin) are considered initial recommendations to maintain current conditions. We do not offer recommendations
for flows to restore the soundness of this reach, but do lay out adaptive management steps to develop this. For the
lower Pecos River, which we consider to be sound, our flow regime recommendations are intended to maintain the
current ecological conditions. To refine our hydrology-based flow recommendations, we incorporate a biological
overlay consisting of flow-instream habitat modeling for 10 focal fish species to develop base-flow
recommendations for one gage in the lower Pecos River (Pecos River at Brotherton Ranch near Sheffield). We then
employ a water quality overlay to evaluate subsistence flow recommendations.
Independence Creek is the most important freshwater tributary to the lower Pecos River. Independence Creek is
spring fed and pristine supporting a diverse suite of bird and fish species and we consider it to be sound ecological

1-15
environment. Because of the ecological importance of Independence Creek to the region, a biological overlay
consisting of flow-instream habitat modeling for 10 focal fish species was developed to refine the hydrology-based
environmental flow recommendations.
1.4.3 Devils River
Hydrology of the Devils River is similar to that of the Pecos with ground water inputs governing the low flows of
the river, and frontal storms and convective storms during the monsoon season driving high flows. The Devils
River is considered pristine with exceptional water quality and an abundant and diverse aquatic and riparian
ecosystem and we consider it to support a sound ecological environment.
For environmental flow recommendations, HEFR analyses are used to characterize the historical stream-flow
record of two locations on the Devils River. A biological overlay consisting of habitat modeling for 10 focal fish
species is used to evaluate the base-flow component of the hydrology-based flow regime and refine the base flow
recommendations for one of the two Devils River gages (Devils River near Juno). A water quality overlay is
employed for the evaluation of the subsistence flow recommendations, but no modifications to the hydrology-based
subsistence flows were necessary.

2-1
Section 2. Overview of the Upper Rio Grande & Current Conditions
2.1 Geographic coverage of the Upper Rio Grande Sub-basin
As discussed in the previous section, the Upper Rio Grande BBEST covers the Rio Grande sub-basin (segment
from the Confluence of the Rio Grande and the Rio Conchos to above Amistad Reservoir), the Pecos River sub-
basin (segment from the Red Bluff Reservoir to its confluence with the Rio Grande), and the Devils River sub-basin
and associated watersheds (Figure 2.1-1) (SAC, 2009; TCEQ et al. 2008). They are located in the Trans-Pecos
region, also known as Far West Texas and the Big Bend Country, consisting of the Chihuahuan Desert and isolated
mountain ranges. The environmental flow assessments used 3 selected gage stations along a 318 mile long segment
of the Rio Grande, 4 gage stations along a 398 mile long segment of the Pecos River and 2 gage stations along a 67
mile long segment of the Devils River. Additional stream flow data included in the Rio Grande geomorphic and
water quality overlays is obtained from two additional gaging stations (USGS near Castolon #08374550, and USGS
near Rio Grande Village #08375300) that have short records and thus are not used in the environmental flow
recommendation. The total drainage area is approximately 35,322 square miles (10,360 for the sum of Alamito,
Terlingua, Maravillas, and Rio Grande; 20,700 for Lower Pecos; 4,262 for the Devils). The work of URG BBEST
encounters 20 counties; Andrews, Brewster, Crane, Crockett, Culberson, Ector, Edwards, Jeff Davis, Loving,
Pecos, Presidio, Reagan, Reeves, Schleicher, Sutton, Terrell, Upton, Val Verde, Ward, Winkler, across three water
planning regions, Far West Texas Region (Region E) (FWT Water Planning Group, 2011), Region F (Region F
Water Planning Group, 2010), and Plateau Region (Region J) (Plateau Water Planning Group, 2011; TWDB, 2012)
(see Figure 2.7-1 and Figure 2.7-2).
Figure 2.1-1. Location of Upper Rio Grande BBEST sub-basins.

2-2
2.2 Ecoregions; Edwards Plateau and Chihuahuan Desert
All the following information is summarized from the ECOREGIONS OF TEXAS (publication AS -199) authored
by Glenn Griffith, Sandy Bryce, James Omernik, and Anne Rogers (Griffith, et al. 2007) for the Texas Commission
on Environmental Quality in December, 2007. The State of Texas is comprised of 56 level IV ecoregions reflecting
the ecological and biological diversity of the State of Texas. The term ecoregion attempts to categorize areas with
similar type, quality and quantity of environmental resources, disturbance response, and management requirements.
Within this categorization are the Chihuahuan Desert and Southern Texas Plains ecoregions which contain the
Upper Rio Grande basin in southwest Texas (Figure 2.2-1). In this region, the Rio Grande is comprised of three
unique drainage basins: the Rio Grande comprising the southern border of Big Bend National Park, Pecos River
basin downstream from the park boundary, and the Devils River basin from Lake Amistad. The Chihuahuan Desert
ecoregion contains the stretch of the Rio Grande bordering Big Bend National Park and the Pecos River. The Devils
River is in the northeastern corner of the Southern Texas Plains ecoregion and more specifically, the Semiarid
Edwards Plateau.
Figure 2.2-1. Ecoregions within the URG BBEST sub-basins (Omernik, 2004).

2-3
The Chihuahuan Desert ecoregion is comprised of alternating mountains and basins. The mountains consist of
faulted limestone reefs, volcanic basalt, rhyolite, and tuff extrusive rocks with woodlands (oak, juniper, Texas
madrone, bunchgrasses, and pinyon), coniferous forest (Douglas-fir, ponderosa pine, and Arizona cypress), and
grasses such as gramas and bluestems. The basins are formed by deep depressions or sediment filled grabens,
alluvial basins (Rio Grande Basin), or internally drained (Salt Basin) dominated by semi–desert grasslands, arid
shrublands, and ephemeral streams. This ecoregion is further broken down into Chihuahuan Basin and Playas (1200
to 4500 feet in elevation, 8 to 14 inches annual precipitation, and 67ºF to 97ºF average low/high temperature);
Chihuahuan Desert Grasslands (2000 to 6000 feet in elevation, 10 to 18 inches annual precipitation, and 62ºF to
90ºF average low/high temperature); Low Mountains and Bajada (2000 to 6000 feet in elevation, 9 to 17 inches
annual precipitation, and 65ºF to 92ºF average low/high temperature); and Chihuahuan Montane Woodlands (4800
to 8378 feet in elevation, 18 to 26 inches annual precipitation, and 58ºF to 90ºF average low/high temperature).
The semiarid Edwards Bajada of the Southern Texas Plains ecoregion is at a lower elevation than the Chihuahuan
Desert ecoregion (Figure 2.2-1), and forms the northwest boundary and historically supported grasslands and
savanna vegetation but as a result of anthropogenic impacts has become dominated by honey mesquite and black
brush. This ecoregion is comprised of alluvial and slope wash deposits from the Edwards Plateau. This ecoregion
supports a network of springs and streams originating from deep “cool” water aquifers beneath the Edwards
Plateau. The Rio Grande Floodplain ecoregion consist mainly of Holocene alluvium or Holocene and Pleistocene
terraces with hyperthermic soils. Vegetation on the floodplain along the Rio Grande in this upper reach may include
honey mesquite, salt-cedar, black willow, black mimosa, and common and giant reed. This region ranges in
elevation from 880 to 1780 feet receiving 19 to 22 inches of precipitation annually, and experiences average
temperatures ranging from 74ºF to 96ºF.

2-4
2.3 Climate of the Upper Rio Grande BBEST Area
The URG BBEST area is located in a Subtropical Steppe and Arid climate of the Trans-Pecos Region and is
typified by semi-arid to arid conditions (Larkin and Bomar, 1983; Nielsen-Gammon, 2008). During fall, winter, and
spring, it experiences the clearest days statewide. It is also the driest, receiving an average annual rainfall of less
than 16 inches (410 mm) or less (TECO, 2008; TWDB, 2012). The wettest months in this region occur during the
summer. In general the precipitation decreases westward across the area except in mountain ranges. Precipitation
increases with the elevation within the mountain range as shown in Figure 2.3-1.
Figure 2.3-1. Mean annual precipitation and elevation/ precipitation relationships in the Trans-Pecos, TX (TECO, 2008).
Based on monthly and annual precipitation at county quadrangles, No. 604, 605, 705, 706, and 803 through 806
(Figure 2.3-2) from 1940 through 2010 compiled by the National Weather Service and by the Texas Water
Development Board (TWDB, 2012), annual mean precipitation varies from 11.77 inches at the quadrangle 604 to
21.28 inches at the quadrangle 803.
Based on gross lake surface evaporation data at county quadrangle, No. 604, 605, 705, 706, and 803 through 806
from 1954 through 2010 (TWDB 2012), annual mean evaporation varies from 55.01 inches at the quadrangle 804
to 71.57 inches at the quadrangle 605.

2-5
Figure 2.3-2. County quadrangles (modified from TWDB, 2012)
Annual precipitation and lake evaporation calculation at selected quadrangles are summarized in Table 2.3-1.
Table 2.3-1. Summary of annual lake evaporation and precipitation in URG area
ID Annual Lake Evaporation (inch) Annual Precipitation (inch)
Min Max Median Mean Min Max Median Mean
604 48.43 93.1 67.06 68.18 2.8 25.33 10.49 11.77
605 48.45 97.34 71.79 71.57 5.64 29.37 12.36 13.67
705 44.17 89.25 63.68 64.33 4.09 28.85 12.82 13.81
706 43.94 94.2 63.53 64.21 6.76 34.91 19.01 19.16
803 39.67 80.44 54.22 55.54 3.82 67.03 13.53 21.28
804 38.98 81.74 53.23 55.01 6.21 40.35 13.81 15.11
805 47.45 81.75 63.89 64.5 4.69 26.51 11.5 11.9
806 47.91 81.85 67.67 67.79 4.38 28.96 16.13 16.95

2-6
The coldest temperatures in URG area are observed
in the Davis Mountains (Figure 2.3-3). The
temperature variations are shown with maps of
January normal minimum temperature and July
normal maximum temperature (Figure 2.3-4).
Typical daily minimum temperatures in January vary
from 28°F to 35°F. The maximum temperatures in
July vary from 84°F to 96°F. Hotspots are found
along the Rio Grande and Pecos River, while the
coolest summertime temperatures are found in the
mountains of West Texas (Nielsen-Gammon, 2008).
Figure 2.3-3. Average Annual Temperature
(TECO, 2008).
Figure 2.3-4. Normal January and July daily minimum temperatures (°F), 1971-2000. Redrawn after graphics
created Feb. 20, 2004 by the PRISM Group, Oregon State University, http://prismclimate.org (modified from
Nielsen-Gammon, 2008).

2-7
2.4 Geology
The Rio Grande flows through the Trans-Pecos region of Texas which encompasses many snapshots of North
American geologic history. Precambrian crystalline metamorphic rocks are exposed in the Franklin Mountains, Van
Horn Mountains, and Sierra Diablo Mountains. Xenoliths of these rocks recovered from volcanic rocks in the Davis
Mountains, Bofecillos Mountains, and Chisos Mountains provide strong evidence that almost all of Trans-Pecos
Texas is underlain by Precambrian rocks similar to those that crop out at the surface. Cambrian to Pennsylvanian
rocks crop out in the Franklin Mountains, Marathon Basin, Solitario, and at Persimmon Gap. These rocks represent
a transgressive, then regressive marine sequence that was caught between the North American continent and
another unidentified continent during the Pennsylvanian Period and intensely deformed and thrust on to North
America, forming the Marathon-Ouachita Mountains. The foreland basin of these mountains became the Permian
Basin, and the carbonate rocks associated with this intracratonic sea now crop out in the Guadalupe, Glass, Apache,
Van Horn, and Sierra Diablo mountain ranges. A depositional hiatus from the Triassic to Mid-Cretaceous was
followed by the deposition of Mid- to Late-Cretaceous limestone that covers much of central and west Texas and
frequently hosts important aquifers. From the Late Cretaceous to the Early Tertiary, these rocks were locally
deformed during the Laramide Orogeny, which can be seen in the Del Norte-Santiago Mountains, Mariscal
Mountain, the Terlingua-Fresno Monocline, and in the Chihuahua Tectonic Belt. Laramide compression was
followed by a long period of large-scale ignimbritic volcanism in Trans-Pecos Texas. As compression continued to
wane, ignimbritic volcanism yielded to smaller-scale effusive volcanism that was coupled with extensional
tectonics, resulting in Rio Grande Rift / Basin and Range structures and related mountain ranges in the Trans-Pecos.
Between these ranges, which include the Franklin, Hueco, Guadalupe, Delaware, Sierra Diablo, Sierra Vieja, and
Van Horn mountains, large basins formed that filled with thick sequences of gravel and sand eroded from the
adjacent mountains (Urbanczyk et al., 2001).
Down river from Big Bend National Park, the Rio Grande flows through the easternmost limits of both the Rio
Grande Rift and Laramide deformation. Evidence of this can be found in the form complex structures including
thrust faults, monoclines and broad folds in the Lower Canyons reach (see map). Also in this reach, the river has
carved canyons into rocks of Edwards / Trinity (Cretaceous) association in the uplifted Stockton Plateau.
Significant spring inflow from Creteaceous aquifers begins in the eastern part of Big Bend National Park and
reaches a maximum in the Lower Canyons reach. These springs emerge from the Edwards-Trinity Plateau Aquifer
(ETPA) which, combined with the Pecos Valley Aquifer occupies an area of 44,000 square miles in west central
Texas (Anaya and Jones, 2009).

2-8
2.5 Regional aquifers
The western half of Texas experiences low rainfall, a high frequency of drought, and possesses few major rivers.
Consequently, the people and natural resources of the region rely on ground water to a great extent. The
hydrogeologic centerpiece of the aquifers of west Texas is the Edwards-Trinity Plateau Aquifer (ETPA). A second
major aquifer, the Pecos Valley Aquifer, is located within the upper reach of the Pecos River (Anaya and Jones,
2009). Five minor aquifers interact directly or indirectly with the river reaches within the URG area and include the
West Texas Bolsons (Wade et al., 2011), Igneous Aquifer, Capitan Reef Complex, Rustler Aquifer, and the
Marathon Aquifer, (George et al., 2011).
The Edwards-Trinity (Plateau) Aquifer is a major aquifer extending across much of the southwestern part of the
state (Figure 2.5-1). The water-bearing units are composed predominantly of limestone and dolomite of the
Edwards Group and sands of the Trinity Group. Although maximum saturated thickness of the aquifer is greater
than 800 feet, freshwater saturated thickness averages 433 feet. Water quality ranges from fresh to slightly saline;
with total dissolved solids ranging from 100 to 3,000 milligrams per liter (mg/L), and water is characterized as hard
within the Edwards Group. Water typically increases in salinity to the west within the Trinity Group. Elevated
levels of fluoride in excess of primary drinking water standards occur within Glasscock and Irion counties. Of
ground water pumped from this aquifer, more than two-thirds is used for irrigation, with the remainder used for
municipal and livestock supplies. Water levels have remained relatively stable because recharge has generally kept
pace with the relatively low amounts of pumping over the extent of the aquifer. The regional water planning
groups, in their 2006 Regional Water Plans, recommended water management strategies that use the Edwards
Trinity (Plateau) Aquifer, including the construction of a well field in Kerr County and public supply wells in Real
County (George et al. 2011).
Figure 2.5-1. Major aquifers in the Upper Rio Grande BBEST area (modified from George et al., 2011).

2-9
The Pecos Valley Aquifer is a major aquifer in West Texas. Water-bearing sediments include alluvial and
windblown deposits in the Pecos River Valley. These sediments fill several structural basins, the largest of which
are the Pecos Trough in the west and Monument Draw Trough in the east. Thickness of the alluvial fill reaches
1,500 feet, and freshwater saturated thickness averages about 250 feet. The water quality is highly variable, the
water being typically hard, and generally better in the Monument Draw Trough than in the Pecos Trough. Total
dissolved solids in ground water from Monument Draw Trough are usually less than 1,000 mg/L. The aquifer is
characterized by high levels of chloride and sulfate in excess of secondary drinking water standards, resulting from
previous oil field activities. In addition, naturally occurring arsenic and radionuclides occur in excess of primary
drinking water standards. More than 80% of ground water pumped from the aquifer is used for irrigation, and the
rest is withdrawn for municipal supplies, industrial use, and power generation. Localized water level declines in
south-central Reeves and northwest Pecos counties have moderated since the late 1970s as irrigation pumping has
decreased; however, water levels continue to decline in central Ward County because of increased municipal and
industrial pumping. The Region F Regional Water Planning Group recommended several water management
strategies in their 2006 Regional Water Plan that would use the Pecos Valley Aquifer, including drilling new wells,
developing two well fields in Winkler and Loving counties, and reallocating supplies (George et al., 2011).
In the URG BBEST area there are five minor aquifers, which are connected hydrologically with three rivers in one
way or another. They include West Texas Bolsons Aquifer, Igneous Aquifer, Captain Reef Complex Aquifer,
Rustler Aquifer, and Marathon Aquifer (Figure 2.5-2).
Figure 2.5-2. Minor aquifers in the URG BBEST area (modified from George et al., 2011).
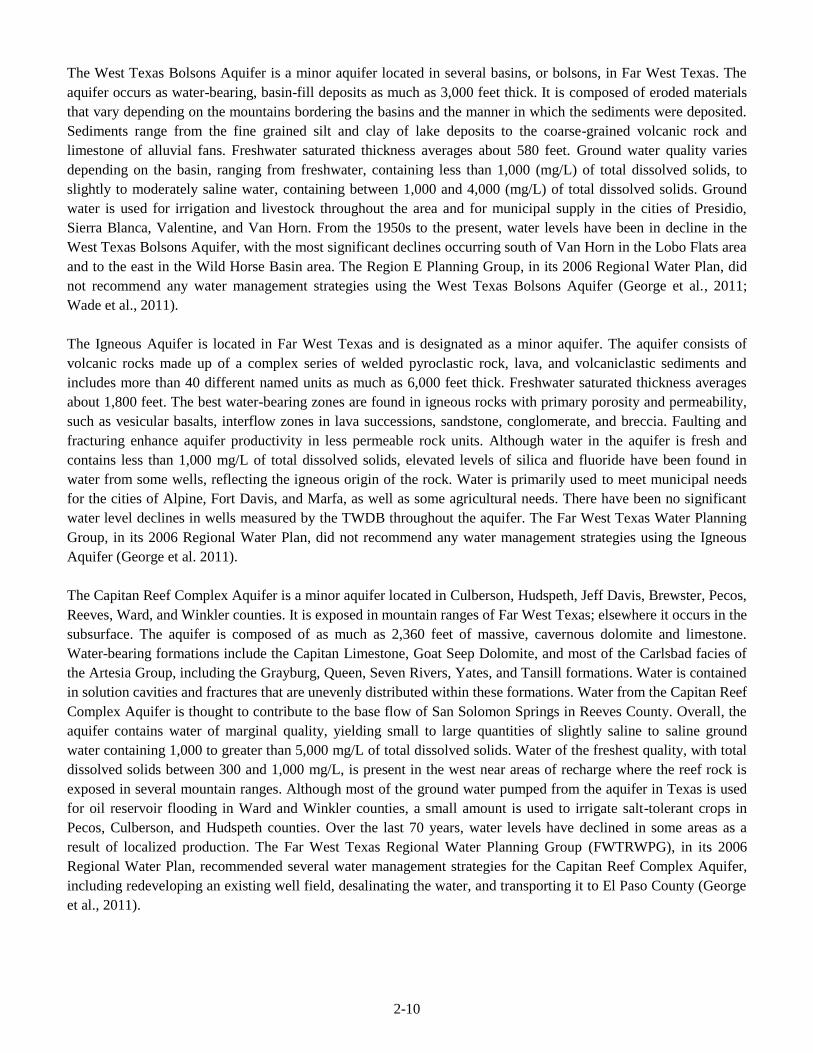
2-10
The West Texas Bolsons Aquifer is a minor aquifer located in several basins, or bolsons, in Far West Texas. The
aquifer occurs as water-bearing, basin-fill deposits as much as 3,000 feet thick. It is composed of eroded materials
that vary depending on the mountains bordering the basins and the manner in which the sediments were deposited.
Sediments range from the fine grained silt and clay of lake deposits to the coarse-grained volcanic rock and
limestone of alluvial fans. Freshwater saturated thickness averages about 580 feet. Ground water quality varies
depending on the basin, ranging from freshwater, containing less than 1,000 (mg/L) of total dissolved solids, to
slightly to moderately saline water, containing between 1,000 and 4,000 (mg/L) of total dissolved solids. Ground
water is used for irrigation and livestock throughout the area and for municipal supply in the cities of Presidio,
Sierra Blanca, Valentine, and Van Horn. From the 1950s to the present, water levels have been in decline in the
West Texas Bolsons Aquifer, with the most significant declines occurring south of Van Horn in the Lobo Flats area
and to the east in the Wild Horse Basin area. The Region E Planning Group, in its 2006 Regional Water Plan, did
not recommend any water management strategies using the West Texas Bolsons Aquifer (George et al., 2011;
Wade et al., 2011).
The Igneous Aquifer is located in Far West Texas and is designated as a minor aquifer. The aquifer consists of
volcanic rocks made up of a complex series of welded pyroclastic rock, lava, and volcaniclastic sediments and
includes more than 40 different named units as much as 6,000 feet thick. Freshwater saturated thickness averages
about 1,800 feet. The best water-bearing zones are found in igneous rocks with primary porosity and permeability,
such as vesicular basalts, interflow zones in lava successions, sandstone, conglomerate, and breccia. Faulting and
fracturing enhance aquifer productivity in less permeable rock units. Although water in the aquifer is fresh and
contains less than 1,000 mg/L of total dissolved solids, elevated levels of silica and fluoride have been found in
water from some wells, reflecting the igneous origin of the rock. Water is primarily used to meet municipal needs
for the cities of Alpine, Fort Davis, and Marfa, as well as some agricultural needs. There have been no significant
water level declines in wells measured by the TWDB throughout the aquifer. The Far West Texas Water Planning
Group, in its 2006 Regional Water Plan, did not recommend any water management strategies using the Igneous
Aquifer (George et al. 2011).
The Capitan Reef Complex Aquifer is a minor aquifer located in Culberson, Hudspeth, Jeff Davis, Brewster, Pecos,
Reeves, Ward, and Winkler counties. It is exposed in mountain ranges of Far West Texas; elsewhere it occurs in the
subsurface. The aquifer is composed of as much as 2,360 feet of massive, cavernous dolomite and limestone.
Water-bearing formations include the Capitan Limestone, Goat Seep Dolomite, and most of the Carlsbad facies of
the Artesia Group, including the Grayburg, Queen, Seven Rivers, Yates, and Tansill formations. Water is contained
in solution cavities and fractures that are unevenly distributed within these formations. Water from the Capitan Reef
Complex Aquifer is thought to contribute to the base flow of San Solomon Springs in Reeves County. Overall, the
aquifer contains water of marginal quality, yielding small to large quantities of slightly saline to saline ground
water containing 1,000 to greater than 5,000 mg/L of total dissolved solids. Water of the freshest quality, with total
dissolved solids between 300 and 1,000 mg/L, is present in the west near areas of recharge where the reef rock is
exposed in several mountain ranges. Although most of the ground water pumped from the aquifer in Texas is used
for oil reservoir flooding in Ward and Winkler counties, a small amount is used to irrigate salt-tolerant crops in
Pecos, Culberson, and Hudspeth counties. Over the last 70 years, water levels have declined in some areas as a
result of localized production. The Far West Texas Regional Water Planning Group (FWTRWPG), in its 2006
Regional Water Plan, recommended several water management strategies for the Capitan Reef Complex Aquifer,
including redeveloping an existing well field, desalinating the water, and transporting it to El Paso County (George
et al., 2011).

2-11
The Rustler Aquifer is a minor aquifer located in Brewster, Culberson, Jeff Davis, Loving, Pecos, Reeves, and
Ward counties. The aquifer consists of the carbonates and evaporites of the Rustler Formation, which is the
youngest unit of the Late Permian Ochoan Series. The Rustler Formation is 250 to 670 feet thick and extends down
dip into the subsurface toward the center of the Delaware Basin to the east. It becomes thinner along the eastern
margin of the Delaware Basin and across the Central Basin Platform and Val Verde Basin. There it conformably
overlies the Salado Formation. Ground water occurs in partly dissolved dolomite, limestone, and gypsum. Most of
the water production comes from fractures and solution openings in the upper part of the formation. Although some
parts of the aquifer produce freshwater containing less than 1,000 mg/L of total dissolved solids, the water is
generally slightly to moderately saline and contains total dissolved solids ranging between 1,000 and 4,600 mg/L.
The water is used primarily for irrigation, livestock, and waterflooding operations in oil-producing areas.
Fluctuations in water levels over time most likely reflect long-term variations in water use patterns. The regional
water planning groups in their 2006 Regional Water Plans did not propose any water management strategies for the
Rustler Aquifer (George et al., 2011).
The Marathon Aquifer is located within the Marathon Basin in north central Brewster County and is composed of a
series of highly folded and faulted Paleozoic formations including the Gaptank Formation, the Dimple Limestone,
the Tesnus Formation, the Caballos Novaculite, the Maravillas Chert, the Fort Pena Formation, and the Marathon
Limestone. The Marathon Limestone is the most productive of the group, although there are very few wells and
consequently very little information to evaluate properties of the aquifer. Most of the ground water production
occurs at depths of less than 1000 feet; well depths are commonly less than 250 feet (Ashworth, personal
communication; Smith, 2001). Shallow wells are generally produce from alluvial deposits on top of the bedrock
and are under water table conditions while deeper portions of the aquifer are under artesian pressure. Ground water
flow is likely to the south east toward the Rio Grande. Several significant springs occur south of Marathon,
including Peña Colorada Springs near a county park (Brune, 1981) Total dissolved solids range from 500 to 1000
mg/L. Primary use is for supply to the town of Marathon, other domestic supply and agriculture. Well yields range
from 10 to 300 gallons per minute (TWDB website, accessed 6/22/2012).

2-12
2.6 Physiography and Geomorphic History of Sub-basins
2.6.1 Geology, Physiography, and Geomorphic History of the Rio Grande
The upper Rio Grande described in this study extends from the confluence of the Rio Grande and Rio Conchos 304
miles downstream to Amistad Reservoir (Figure 2.1-1). Today, the Rio Grande in this region is predominantly
single-threaded and flows through wide alluvial valleys in structural basins and narrow canyons cut through
intervening ranges. Some of the canyons are very narrow, and the channel banks are bedrock. In wider canyons,
alluvium forms the channel banks. Channel slope ranges from approximately 0.0005 in the alluvial valleys to 0.002
in the canyons. The bed of the Rio Grande is composed of sand and gravel. Gravel is most predominant at the
mouths and downstream from ephemeral tributaries. There is also a large supply of silt and clay, and thick muddy
deposits (>1 m) may consist along the channel margins or in low velocity pools. The channel banks are
predominantly very fine sand and mud.
Figure 2.6-1. Location of the Upper Rio Grande Basin below the confluence with the Rio Conchos.
The early 20th century Rio Grande was wide, meandering, multi-threaded, and prone to avulsion (Mueller, 1975;
Everitt, 1993; Stotz, 2000; Dean and Schmidt, 2011). These geomorphic characteristics were a result of a highly
variable flow regime consisting of intense flooding followed by extremely low flows, and large sediment loads
contributed by the surrounding desert landscape. High flows occurred for nearly 5 months of the year; beginning
with the spring snowmelt in northern New Mexico and southern Colorado, and ended with the last monsoon rains in
late summer and early fall (Figure 2.6-2). Stream flow remained low during the remainder of the year. Sediment
loads were contributed by the upper Rio Grande and Rio Conchos as well as the numerous ephemeral tributaries
that drain the sparsely vegetated Chihuahuan Desert (Schmidt et al., 2003, Dean and Schmidt, 2011). The

2-13
combination of the extended high flows and large sediment supply produced a dynamic river that changed course
from year to year and had an extremely diverse physical template that contained numerous migrating in-channel
bars, side-channels, and backwaters.
Figure 2.6-2. Median hydrographs of the Rio Grande near Presidio upstream and downstream from the Rio Conchos for the
period 1900 to 1914.
By the mid-1900’s, water development on the upper Rio Grande and the Rio Conchos caused drastic reductions in
stream flow (Everitt, 1993; Schmidt et al., 2003; Dean and Schmidt, 2011). Operations of Elephant Butte and
Caballo Dams in New Mexico, and irrigation diversions in the El Paso–Juarez valley completely eliminated the
natural spring snowmelt flood of the upper Rio Grande (Schmidt et al., 2003). Virtually no flow now passes beyond
Fort Quitman, TX (Everitt, 1998). Today, more than 90% of the present stream flow of the lower Rio Grande
comes from the Rio Conchos, and stream flow from the Rio Conchos has also greatly declined (Schmidt et al.,
2003; Dean and Schmidt; 2011).
Declines in mean and peak stream flow, and a relatively unchanged sediment supply, has resulted in progressive
channel narrowing over the last sixty years. Channel narrowing has occasionally been interrupted by large, long
duration floods in excess of 35,000 ft³/s. We refer to these floods as channel resetting floods because they erode
accumulating sediment, scour vegetation, and push the morphology of the channel back towards its historic form. In
the early 1900s, floods of this magnitude occurred approximately once every 4 or 5 years. Since 1950, however,
floods of this size have occurred just five times. Following each of these floods, channel narrowing has resumed
and each subsequent channel resetting flood has failed to reset the channel to widths following the previous reset
(Figure 2.6-3) (Dean and Schmidt, 2011). Between the 1940s and 2008, the channel of the Rio Grande narrowed
by over 50% (Figure 2.6-3, Figure 2.6-4).

2-14
Figure 2.6-3. Reconstructed model of changes in channel width and vegetation density since 1900. Modified from Dean and
Schmidt (2011).
Non-native vegetation has exacerbated the processes of channel narrowing. Since the early 1900s, non-native
tamarisk and giant cane have become dominant species along the river corridor (Everitt, 1998; Moring, 2002). The
invasion of the channel by these species during drought exacerbates processes of channel narrowing by stabilizing
banks, increasing channel margin roughness, and inducing additional sediment deposition (Tal and Paola, 2007;
Pollen-Bankhead et al., 2009). For example, during the low flow years between 1992 and 2008, sediment
accumulation and non-native vegetation establishment within the active channel caused the channel to narrow by
36% to 52% (Dean and Schmidt, 2011; Dean et al., 2011a). Non-native vegetation establishment during these years
resulted in the conversion of 39% to 77% of active channel bars to floodplains as measured in three study reaches
(Dean and Schmidt, 2011; Dean et al., 2011a) (Figure 2.6-3, Figure 2.6-4).
Figure 2.6-4. Historic ground photographs from 1945 and 2008 depicting the magnitude of geomorphic change on the Rio
Grande in the Big Bend region, and the expansion of riparian vegetation, much of which is non-native.
Channel narrowing is of great concern to the native and endemic ecosystem of the lower Rio Grande (Heard et al.,
2012). As channel narrowing occurs, ecologically important habitat such as backwaters and side-channels fill with
sediment and are abandoned. Thus, the environmental flow analyses herein aim to determine the flows necessary to
shift the present ecosystem towards a condition (Figure 2.6-5) more like that of the early to mid-1900s, because
this is a period when a sound ecological environment (see Section 1.3) is believed to have persisted. In the
definition of “sound”, geomorphic attributes/processes are responsible for both sediment transport and habitat

2-15
maintenance, and thus, an emphasis is placed on characterizing the flows that would rejuvenate and maintain the
key geomorphic attributes of a sound ecological environment.
Figure 2.6-5. Conceptual diagram illustrating the continuum between wild conditions and potentially severely degraded
conditions of river systems. Each part of today’s Rio Grande exists somewhere on this continuum. Small degrees of change are
typically referred to as mitigation, whereas attempts to significantly shift the ecosystem towards the formerly wild conditions
are called rehabilitation. (adapted from Schmidt, 2010).
2.6.1.1 Ground water and low flows in the Rio Grande
The western half of Texas experience low rainfall, high frequency of drought, and few major rivers. Consequently,
the people and natural resources of the region rely heavily upon ground water resources. The hydrogeologic
centerpiece of the aquifers of west Texas is the Edwards-Trinity Plateau Aquifer (ET). A significant portion of the
flow of the Rio Grande, Pecos, and Devils Rivers is derived from this aquifer. Two other aquifers are associated
with surface water in the study area: the Cenezoic Pecos Alluvium, and the Ogallala.
Ground water contributions to the Rio Grande from the ET sustain aquatic habitats during dry years and mitigate
water quality impairment (Bennett and Cutillo, 2007). Thermal springs occur along the Rio Grande from below
Mariscal Canyon in Big Bend National Park to below Foster’s Weir and just above Amistad Reservoir.
We examined IBWC gage data on the Rio Grande for low flow periods in 2001, 2002, 2003, and 2005. Net spring
discharges along the reach can range from 196 ft³/s to 266 ft³/s. Ground water contributions can account for as
much as 2/3 of the flow at Foster’s Weir and the river entering AMIS during low flow conditions (Figure 2.6-6).
An analysis of stream flow for selected low flow periods suggest that ground water contributions may range
between 142,000 and 192,000 acre feet annually. Between the IBWC gages near Johnson Ranch and Foster’s Weir,
gains in flow account for 23% of the mean annual flow for the period 1961 to 1985 (Saunders, 1987). In addition,
some spring flow may be lost to the channel and would not be included here. The importance of spring flow to the
aquatic recourses of the Rio Grande is site specific.
Ground water is generally better quality than surface water in the Rio Grande and therefore the addition of ground
water improves the water quality in the river. The gain loss study described here was initiated to better quantify

2-16
ground water contribution and add to a growing data set documenting the natural resource value of Rio Grande
springs. Water quality and discharge data are plotted in (Figure 2.6-7).
Figure 2.6-6. Average gain in Q (discharge). From Bennett et al., 2009.
Figure 2.6-7. Longitudinal trends in discharge and specific conductance for years 2006 and 2011. From Bennett et al. 2012.

2-17
2.6.1.2 Alamito and Terlingua Creeks
Alamito and Terlingua Creeks are two of the largest tributaries to the Rio Grande within the geographic scope of
this report. The confluence of Alamito Creek and the Rio Grande is approximately 11 km downstream from the Rio
Conchos (approximate IBWC river mile 947). Terlingua Creek joins the Rio Grande in the western portion of Big
Bend National Park at IBWC river mile 885. Each of these creeks flow perennially at their downstream ends.
Perennial flow is provided by springs and ground water inputs. In the upstream portions of these watersheds, stream
flow is ephemeral.
The hydrology of Alamito and Terlingua Creeks is extremely flashy. Monsoon rains and convective thunderstorms
can cause large flash floods. The largest flood measured at on Alamito Creek was 12,395 ft³/s, and the largest flood
measured on Terlingua Creek was 17,198 ft³/s. Base flows are often less than 5 ft³/s. Both creeks have extremely
high sediment loads during floods and are braided in plan form. In some areas the braid plains of these creeks
exceed 1,500 ft. in width. The braided geomorphic form of these rivers reflects the high variability between base
flow and flood flow, and the high sediment loads transported during high-flow pulses.
Both Alamito and Terlingua Creeks are remote. Development is minimal and consists of mining with several
bentonite mines in the Terlingua Creek drainage and zeolite mines in Alamito Creek. The primary land use within
each drainage is ranching. Aerial photos reveal a great deal of manipulation of surface flow with large diversions
and terracing. A large concrete dam exists on Alamito Creek near Marfa, TX that was designed as a resort property
in the early part of the last century. Though intact, the dam no longer functions as designed.

2-18
2.6.2 Pecos River
The Pecos River enters Texas just east of the 104th meridian and continues to flow 418 winding miles through semi-
arid West Texas before entering the Rio Grande (Figure 2.6-8). The river creates the eastern boundary of the most
mountainous and arid region of Texas, known as the Trans-Pecos. It also forms the boundaries of Loving, Ward,
Reeves, Pecos, Crane, Crockett, and Terrell counties. Andrews, Brewster, Culberson, Ector, Jeff Davis, Presidio,
Reagan, Upton, and Winkler counties are also included in the Pecos River watershed (Figure 2.6-8). The Pecos
River watershed in Texas is bound by Texas’ Colorado River Basin to the northeast and by the Rio Grande
watershed on the south and west. As the largest river subwatershed flowing into the Rio Grande, the 10 million-acre
Pecos River watershed in Texas plays a significant role, both biologically and hydrologically, in the future of the
Rio Grande Basin. The flows of the once great Pecos River have dwindled to a mere trickle due to many causes,
some natural but most are due to anthropogenic factors.
Figure 2.6-8. The boundary of the Pecos River Basin in Texas.
The soils of the Pecos River watershed consist mostly of well-drained Aridisols and Entisols that support sparse
desert shrubs. The drainage basin near Red Bluff Reservoir consists of gypsic soils, such as the Reeves and
Holloman soil series. The majority of Reeves and Pecos counties consist of either shallow Aridisols (Del Norte,
Nikel, and Reakor) or calcareous silty clay loam, such as a Hoban series. The soils in the east bank of the river are
predominantly Simona and Sharvana series, both of which are shallow calcareous soils developed over caliche and
have moderate permeability. The soils along the Pecos River are alluvial, namely Pecos, Patrole, Toyah, and Gila
series that have textures ranging from silty to loamy. Arno series, also alluvial, is the only series along the river that
has montmorillonitic clayey textures with low permeability (Miyamoto et al., 2005).
2-19
The topography of the Pecos Basin varies greatly. The northern part of the river in New Mexico includes mountain
pastures and reaches elevations of 13,000 feet above sea level. In Texas, the elevation shifts from 2,700 feet above
sea level at Red Bluff Reservoir to 1,050 feet above sea level at the mouth of the Pecos. The river passes through a
deep canyon (walls as high as 200 feet or more in some places) in its lower reaches before merging with the Rio
Grande in Val Verde County.
The river and its watershed have long served as a vital source of life in the Trans-Pecos Region. Archeological
evidence collected in the watershed has verified that humans have relied on the watershed as a source of food,
water, and shelter for thousands of years. Numerous Native American tribes and peoples have also been identified
as inhabitants of the Pecos River watershed and, undoubtedly, depended on the waters of the river and springs in
the watershed to sustain themselves (Jensen, 2006).
Salinity in the Pecos has long been a known water quality concern and led to people establishing numerous water
wells capable of providing better quality water. In some cases, people have referred to the Pecos as the “dirty
river,” the “salty river” or the “pig river” (Daggett, 1985; Dearen, 2000; Williams, 1982). Salinity levels in the
Pecos are commonly above 6,000 mg/L at the Texas-New Mexico state line, often exceed 12,000 mg/L near Girvin,
and usually decline to about 2,000 mg/L after Independence Creek converges with the river (Miyamoto et al.,
2005). Elevated salinity levels in the Pecos have multiple detrimental effects. The salts limit the types of crops that
can be grown and irrigated with river waters and can negatively impact the productivity of crops that can tolerate
the salinity levels present. Increased salinity is also detrimental to downstream activities and uses. The Pecos River
greatly influences the water quality of Amistad International Reservoir, located just below the confluence of the
Pecos and the Rio Grande. Miyamoto et al. (2006) indicated that the Pecos River contributes 9.5 % of the annual
inflow into Lake Amistad and 26 % of the annual salt load. For a month in 1998, salinity of Amistad exceeded
1,000 ppm, the maximum limit for drinking water, and has since fluctuated below that level. This exceedance
greatly concerns those who depend on Amistad as a source of drinking water and should be strongly considered
when managing salinity across the watershed. To successfully maintain the salinity levels of the reservoir below
1,000 ppm will require management to control salt loading from the Pecos to the Rio Grande. Reducing salinity in
the upper segments of the Pecos in Texas will also make river flows more suitable for livestock use and irrigation
of croplands.
Despite the overall contributions of salts into the Pecos and the potential impacts that can be seen downstream,
some segments of the river have relatively good water quality. Salinity levels in the upper portion of the river can
be restrictive for the majority of agricultural production and are definitely not suitable for human consumption.
Downstream to Iraan, the river is dominated by fresh water spring flow and, as a result, is of much better quality
than the upstream portions of the river. These inflows result in a significant dilution effect that greatly improves the
quality of the water before it enters the Rio Grande.
Encroaching woody plant species have also drastically altered the Pecos River watershed. Historical accounts
indicate that grasses were the dominant vegetation in the watershed and any type of woody plant was scarce at best.
The establishment of vast cattle ranches and subsequent over grazing have undoubtedly influenced the shift from
grassland to woodland in upland and riparian areas. Salt cedar (Tamarix spp.) practically took over riparian areas in
the watershed and created monocultures along almost every waterway. Originally introduced to the watershed in
the early 1900s to control stream bank erosion, this plant has taken over and formed dense stands along the river
banks and floodplain (Jensen, 2006). In many cases, salt cedar pulls water from shallow water tables near the river,
diverting river flow into these water tables. Based on this information, salt cedar removal is seen as a viable option
to increase flows in the river by increasing local water table levels. Removing this noxious plant will also help in

2-20
re-establishing native riparian vegetation. Upland brush and other non-grass species have also changed the face of
the watershed. Areas that were once short-grass prairies are now dominated by mesquite, greasewood, creosote
bush, prickly pear, and many other species that have a competitive advantage over native grass species. Proper
control practices and long-term management can effectively restore these grasslands to a semi-native state that is
more productive and produces cleaner, more available water in the watershed.
National Land Cover Dataset information from 2001 was used to delineate land uses and land coverages for the
Pecos River watershed. Primary land uses and land cover were divided into seven major categories. Rangeland is
by far the dominant land cover in the watershed and accounts for approximately 68% of the land area. Grassland is
the second most prominent land cover found in the watershed accounting for about 28% of the watershed area. Uses
for these land covers include primarily livestock and wildlife grazing. The remainder of the watershed (4%) is split
between many different land uses and land covers. The largest of these are quarries (2.2%), combined forest (1%),
urban (0.37%), agriculture (0.26%), water (0.08%) and wetlands (0.0087%). These seven land uses and land covers
account for 99.9% of the watershed; the remaining 0.1% is dispersed over 43 other land use and land cover
categories.
Farming has historically been very important to the economy of communities in the Pecos River watershed in
Texas. The Torres Irrigation Company began using the waters of the Pecos River in 1870 to support irrigation in
Pecos County in 1870. This effort watered 480 acres that produced 12,000 bushels of corn that year (Williams,
1975). In 1877, the Pecos River Irrigation Company was incorporated to take water from the Pecos River and
develop irrigation on 320 acres (Bogener, 2003; Daggett, 1985; Dearen, 2000; Williams, 1982; Bogener, 1993). By
1914, work had started or had been completed on 10 irrigation projects stretching from Arno (near the Texas-New
Mexico state line) to Girvin about 150 river miles downstream (Lingle & Linford, 1961). On paper, more than
173,000 acres of irrigable land were included in these 10 projects, but less than 30,000 acres were actually
cultivated (Jensen, 2006). Some crops grown in the Pecos watershed of Texas throughout the early 1900s included
cantaloupes, alfalfa, vegetables, grapes, orchard crops, and strawberries (Newman & Dale, 1993).
The Texas Water Development Board (TWDB) reported in 2001 that irrigated acreage rose to 233,578 acres in
1958 and peaked at nearly 260,000 acres in 1964 because of widespread ground water pumping. Irrigated acreage
began to decline in the 1970s because of rising costs to pump ground water from greater depths and because less
water was flowing in the Pecos River. Currently, irrigated acreage has increased slightly in the region with data
from 2000 showing 73,171 acres in the Pecos watershed.
These data also reveal trends in ground water and surface water uses for agricultural irrigation since the 1950s. For
example, ground water pumping for irrigation totaled more than 684,972 acre-feet (AF) in 1958, peaked at 777,785
AF in 1964, and has generally declined ever since. In 2000, ground water pumping totaled 176,541 AF (TWDB,
2001).
Irrigation water use from the Pecos River and other surface waters has largely been confined to a few counties. The
volume of surface water used for irrigation (ranging from a low of 1,415 AF in 1969 to a high of 35,189 AF in
1958) is only a small percentage (less than 5 %) of overall agricultural water use in the region.
Total water use for agricultural irrigation in the region peaked in 1964 at 835,412 AF and declined to a low of
193,163 AF in 1989; however, the most recent data from 2000 showed that agricultural water use totaled 202,221
AF in 2000. Increasing costs to pump ground water from increasing depths has caused some decline while a general
decrease in the number of acres farmed in the watershed has significantly reduced the demand as well.

2-21
Surface water is scarce in the Pecos watershed of Texas. The Pecos River is the main source of perennial surface
water in the upper end of the watershed and has been known to go dry in some places. Numerous springs in the
watershed also provide perennial sources of surface water that bolster the flow of the Pecos. In Texas, Salt Creek
provides readily observable surface flow and high salt loading in the Upper Pecos while Independence Creek
provides high-quality water to the river in the Lower Pecos. The remaining tributaries in Texas are intermittent and
typically only carry flow during high volume rain events (Belzer, 2007).
Across the basin, surface water and ground water resources are highly connected and can significantly influence
each other. Many areas of the Pecos are known to lose large amounts of stream flow to shallow water tables and
aquifers near the river. Although this water is “lost” from the river’s flow, it often flows parallel to the river and can
re-enter the channel further downstream. The river also has a significant connection to ground water resources
further away from the river. Springs, such as Caroline Springs that supplies about 25% of Independence Creek
inflow, arise in the watershed and can be significant sources of inflow to the Pecos. According to Gunnar Brune’s
comprehensive description of the springs of Texas (2002), the Pecos Basin originally contained more than 50
flowing springs. Some of these springs stopped flowing during the “drought of record” that lasted in Texas
throughout most of the 1950s. According to local experts (Karges, 2006), as few as eight springs may still flow in
Reeves and Loving counties. Some of the springs in the Pecos watershed include:
Kokernot Spring (Brewster County)
Live Oak Springs and Cedar Springs (Crockett County)
Rustler Springs (Culberson County)
Madera Springs, Phantom Lake Springs, and Seven Springs (Jeff Davis County)
Comanche Springs, Diamond Y Springs, Leon Springs, Pedro Ureta Springs, Santa Rosa Springs, and San
Pedro Springs (Pecos County)
Giffin Springs, Sandia Springs, San Solomon Springs (Reeves County)
Red Bluff Springs (Loving County)
Caroline Springs, Cedar Springs, Geddes Springs, King Springs, Myers Springs, and Vanderbeek
Springs (Terrell County)
There are several significant ground water resources along the Pecos River, including the Pecos Alluvium,
Dockum, Capitan Reef, Rustler, Igneous, and Edwards-Trinity Plateau aquifers (Figure 2.5-1 and Figure 2.5-2).
The Pecos Valley Aquifer is the principal aquifer in the Texas portion of the river and consists of up to 1,500 feet
thick alluvial sediments. This aquifer was once used for irrigating large areas of cropland in the Pecos Valley of
Reeves County. During the peak irrigation era of the 1950s, pumping from wells was estimated to have reached as
much as 730,000 AF/year. Pumping from this alluvium declined drastically after the 1960s, and water tables have
dropped as much as 200 feet according to a TWDB report (Ashworth, 1990). However, recent data shows that
water tables west of the Pecos rose as much as 30 feet between 1989 and 1998 while areas east of the river have
declined by 40 feet or more (Boghici, 1999). Perched water tables near the Pecos River are usually between 10 feet
and 20 feet below the surface, and deepen to 50 feet away from the river. Water table depth fluctuates depending on
the flow of the Pecos (TWDB, 2001). TWDB 2006 data reports that the depth-to-ground water in Pecos and Reeves
counties averages 125 feet and ranges from 12 feet to 1,492 feet with the greatest depth occurring where cones of
depression have developed as a consequence of ground water pumping for agriculture and other purposes
(Miyamoto et al., 2005). Mills (2005) suggests that ground water inflows to the Pecos River between Red Bluff and
Girvin averaged 30,000 AF/year before large-scale irrigation projects were developed. Figure 2.6-9 depicts the
location of ground water wells within the Pecos basin.

2-22
Declining ground water levels in these aquifers have caused the reversal of flow paths in some locations. This
reversal results in lower quality water in the river flowing into the aquifers instead of the higher quality aquifer
water flowing into the river. Essentially, the river is contaminating nearby aquifers with lower quality water, which
only intensifies the need to improve the river’s water quality. Pumping paired with rampant salt cedar growth in the
watershed has undoubtedly exacerbated this phenomenon. Decreasing the influences of these impacts will have a
positive impact on restoring hydrologic function along the river and water quality of the river.
Figure 2.6-9. Ground water wells within the Pecos River Basin.
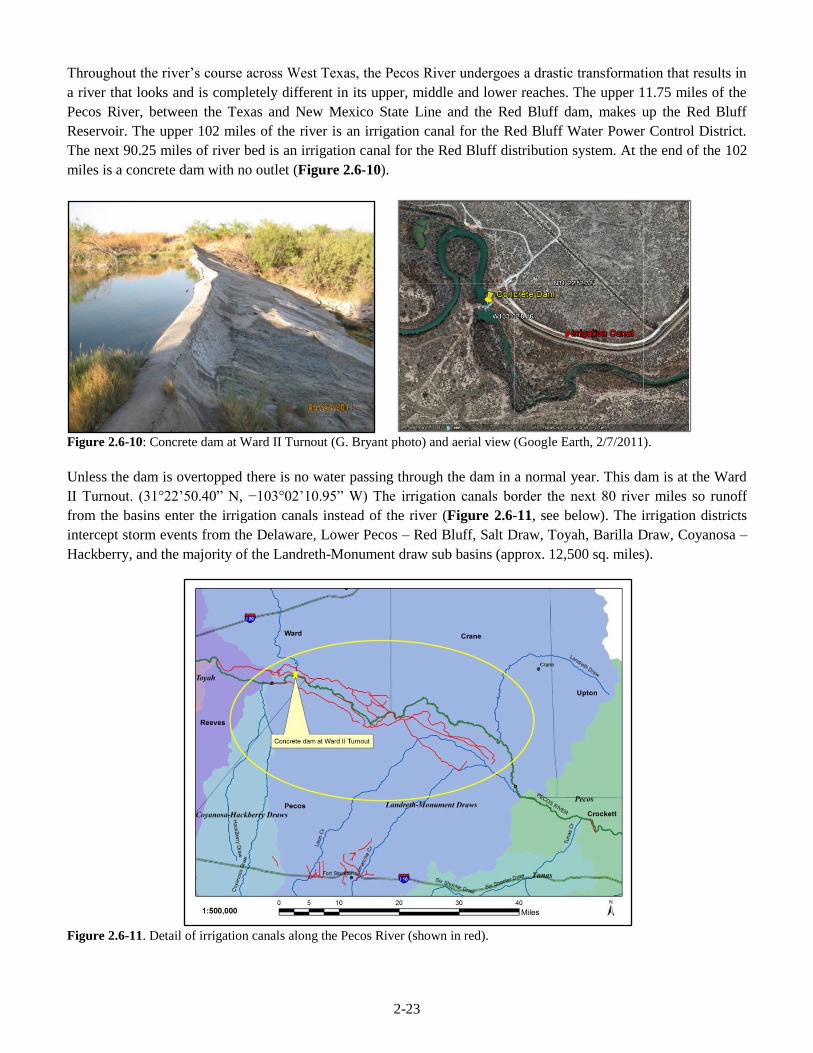
2-23
Throughout the river’s course across West Texas, the Pecos River undergoes a drastic transformation that results in
a river that looks and is completely different in its upper, middle and lower reaches. The upper 11.75 miles of the
Pecos River, between the Texas and New Mexico State Line and the Red Bluff dam, makes up the Red Bluff
Reservoir. The upper 102 miles of the river is an irrigation canal for the Red Bluff Water Power Control District.
The next 90.25 miles of river bed is an irrigation canal for the Red Bluff distribution system. At the end of the 102
miles is a concrete dam with no outlet (Figure 2.6-10).
Figure 2.6-10: Concrete dam at Ward II Turnout (G. Bryant photo) and aerial view (Google Earth, 2/7/2011).
Unless the dam is overtopped there is no water passing through the dam in a normal year. This dam is at the Ward
II Turnout. (31°22’50.40” N, −103°02’10.95” W) The irrigation canals border the next 80 river miles so runoff
from the basins enter the irrigation canals instead of the river (Figure 2.6-11, see below). The irrigation districts
intercept storm events from the Delaware, Lower Pecos – Red Bluff, Salt Draw, Toyah, Barilla Draw, Coyanosa –
Hackberry, and the majority of the Landreth-Monument draw sub basins (approx. 12,500 sq. miles).
Figure 2.6-11. Detail of irrigation canals along the Pecos River (shown in red).

2-24
For the next 187 river miles, the river flows through Pecos Valley sediments and does have contribution from storm
events from the basin. Overland flows from Tunas and portions of Landreth-Monument Draws sub basins (3,500
sq. miles) enter into the river in this stretch.
Below Sheffield and I-10, the Pecos, Independence Creek, Howard Draw, and Lower Pecos sub basins flow into the
Pecos River (4,773 sq. miles). The river begins to transform into a predominantly spring fed river with greatly
improved water quantity and quality as compared to the upper portion. The inflow of Independence Creek adds a
vital source of fresh water that doubles the flow of the river and reduces the salinity by one half or more.
The U.S. Geological Survey (USGS) has delineated watersheds throughout the country based on surface hydrologic
features, which are much smaller than the larger river watersheds. In Texas, the Pecos River watershed has been
divided into 11 separate cataloguing units (8-digit) that were determined based on major tributaries that flow to the
river (Figure 2.6-12). These cataloguing units, as defined by the USGS, will be used to divide the Pecos watershed
into sub watersheds to facilitate focused water quality management. Most of the tributaries within these sub
watersheds are dry creek beds throughout most of the year and only contribute measurable flow to the Pecos during
heavy rainfall events (Belzer, 2007).
Table 2.6-1. Pecos River Sub Watersheds in Texas.
Hydrologic Unit Code (HUC) Sub Watershed Name Area (mi2)
13070001 Lower Pecos – Red Bluff * 2,492
13070002 Delaware * 787
13070003 Toyah 1125
13070004 Salt Draw 1,959
13070005 Barilla Draw 707
13070006 Coyanosa – Hackberry Draws 1,480
13070007 Landreth – Monument Draws * 6,337
13070008 Pecos 1,916
13070009 Tunas 967
13070010 Independence Creek 771
13070011 Howard Draw 1,092
13070012 Lower Pecos 994
* This HUC is not entirely in Texas
There are ten springs located within the watershed including Comanche, Cottonwood, Diamond Y, Horseshoe,
Monument, Rustler, Salt, Santa Rosa, Screw Bean and Toyah (http://www.esg.montana.edu). Diamond Y Spring
Preserve is owned and managed by The Nature Conservancy (TNC) and provides important habitat for two species
of rare desert fishes listed as federally endangered species: the Leon Springs pupfish (Cyprinodon bovines) and the
Pecos Gambusia (Gambusia nobilis). Diamond Y is also home to the federally threatened, rare, salt-tolerant Pecos
sunflower (Helianthus paradoxus). Red Bluff Reservoir is located on the main stem of the Pecos just below the
state line and Imperial Reservoir is located in northern Pecos County.
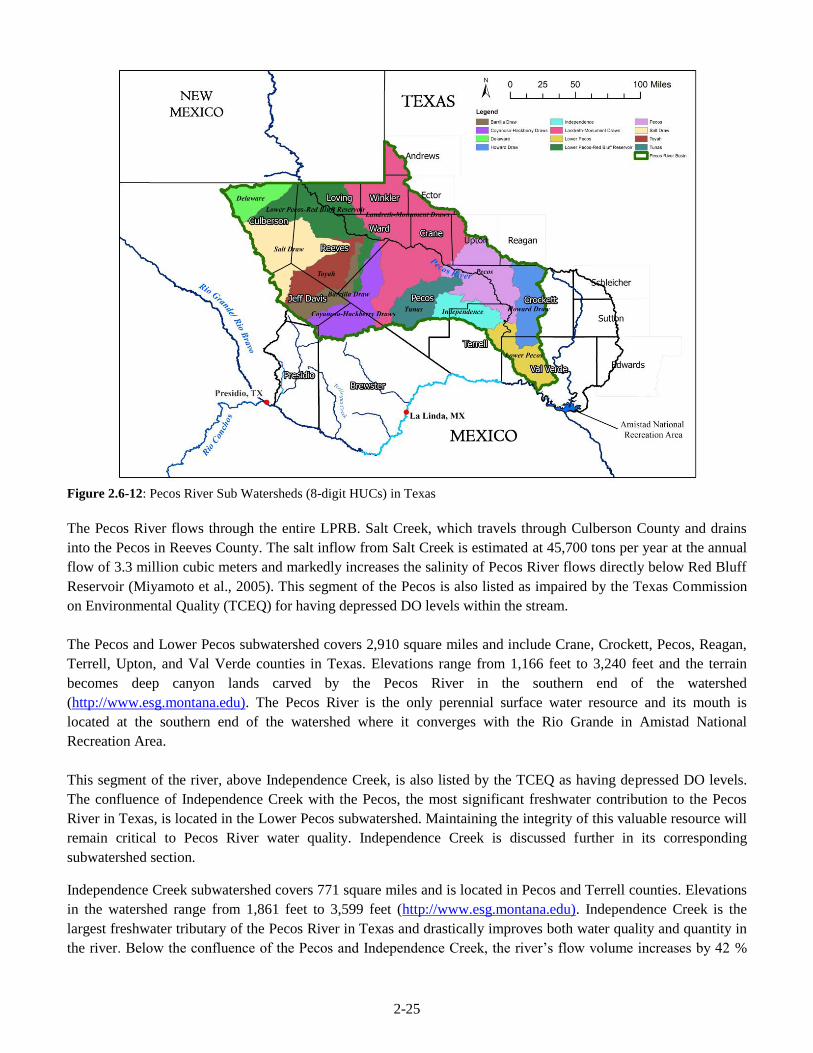
2-25
Figure 2.6-12: Pecos River Sub Watersheds (8-digit HUCs) in Texas
The Pecos River flows through the entire LPRB. Salt Creek, which travels through Culberson County and drains
into the Pecos in Reeves County. The salt inflow from Salt Creek is estimated at 45,700 tons per year at the annual
flow of 3.3 million cubic meters and markedly increases the salinity of Pecos River flows directly below Red Bluff
Reservoir (Miyamoto et al., 2005). This segment of the Pecos is also listed as impaired by the Texas Commission
on Environmental Quality (TCEQ) for having depressed DO levels within the stream.
The Pecos and Lower Pecos subwatershed covers 2,910 square miles and include Crane, Crockett, Pecos, Reagan,
Terrell, Upton, and Val Verde counties in Texas. Elevations range from 1,166 feet to 3,240 feet and the terrain
becomes deep canyon lands carved by the Pecos River in the southern end of the watershed
(http://www.esg.montana.edu). The Pecos River is the only perennial surface water resource and its mouth is
located at the southern end of the watershed where it converges with the Rio Grande in Amistad National
Recreation Area.
This segment of the river, above Independence Creek, is also listed by the TCEQ as having depressed DO levels.
The confluence of Independence Creek with the Pecos, the most significant freshwater contribution to the Pecos
River in Texas, is located in the Lower Pecos subwatershed. Maintaining the integrity of this valuable resource will
remain critical to Pecos River water quality. Independence Creek is discussed further in its corresponding
subwatershed section.
Independence Creek subwatershed covers 771 square miles and is located in Pecos and Terrell counties. Elevations
in the watershed range from 1,861 feet to 3,599 feet (http://www.esg.montana.edu). Independence Creek is the
largest freshwater tributary of the Pecos River in Texas and drastically improves both water quality and quantity in
the river. Below the confluence of the Pecos and Independence Creek, the river’s flow volume increases by 42 %

2-26
and total dissolved solids decrease by 50 % (http://www.nature.org). This virtually transforms the Pecos, providing
the water necessary to support both recreation and healthy populations of aquatic species.
The Chandler family and TNC have permanently protected approximately 20,000 acres along Independence Creek
through conservation easements and are committed to maintaining the ecological integrity of this resource. Caroline
Spring, located on the Nature Preserve, produces 3,000 gallons to 5,000 gallons of fresh water per minute and
contributes approximately 25% of Independence Creek’s flow (http://www.nature.org).
For the purposes of the Environmental Flows Report, it is advantageous to divide the river the same as the TCEQ
water quality segments. Segment 2310 is referred as the Lower Pecos and 2311 is referred to as the Upper Pecos.
The Lower Pecos reaches from the confluence of Independence Creek to Amistad Reservoir and has been
determined to be a Sound Ecological Environment by the Upper Rio Grande BBEST team. The Upper Pecos River
reaches form the TX-NM line to the confluence of the Pecos River and Independence Creek. The Upper Pecos
River has been determined as an Unsound Ecological Environment.
The purpose of the BBEST is to determine the flow required to maintain a sound ecological environment or
determine the flow required to create a sound ecological environment. In the lower Pecos, the BBEST has done
exactly that. These recommendations are based on historical flow assessments based on the HEFR modeling
programs, water quality data, biological overlays and geomorphological characteristics and requirements of the
river.
However, the Upper Pecos cannot be evaluated in this manner. The upper river has a dissolved oxygen (DO) water
quality impairment and an extremely high total dissolved solid content which has altered the biological community
so the majority of the native fishes of the river no longer inhabit the river or have been hybridized with salt tolerant
invasive species.
There are three USGS flow gages in the Upper Pecos which record water flow in the river but the flow is for
managed water data and have never reported natural flow patterns. All three of the gages were installed after the
construction of Red Bluff Reservoir. The gage at Orla is nine river miles below Red Bluff Reservoir. Basically this
gage reports the opening and closing of the gates at Red Bluff Reservoir. Modeling can be done on the data from
the gage but it in no way represents any type of a natural flow pattern.
Above, the Pecos gage, four irrigation district canals divert water from the river. Water is purchased from Red Bluff
Water Power Control District and delivered to the lower irrigation districts. These four irrigation districts remove
the allotted water from the river. If there is a storm event which creates pulse flows in the river, the first water
which is laden with salt and debris is allowed to flow downstream. The rest of high flow is diverted to the irrigation
canals where it freshens the irrigation water but does nothing for the river. The irrigation districts refer to this as
“free” water.
Below the Pecos gage are two more diversions for the next three irrigation districts. The standard operating
procedures are the same which results in basically all the water being removed from the river at the last irrigation
diversion, Ward II.
Paralleling the river from Orla to 80 miles below the Ward II turnout, are irrigation canals which catch any runoff
from the surrounding watershed. This is important because this runoff would naturally create pulse flows to

2-27
transport sediment and create biological habitat imperative to a healthy river. This water would also freshen the
saline waters of the river and dilute the current salt concentrations.
Between the Ward II turnout and Girvin, there are springs which contribute water to the river. However, the water
is between 12,000 and 15,000 ppm tds. This water slowly flows across the Girvin gage and to Iraan. During the
summer months, this water can reach salt concentration of 30,000 ppm due primarily to evaporation. The winter
water quality will remain in the 15,000 to 18,000 ppm range. Once the water reaches Iraan, the water is mixed with
fresh water spring flow and increases in quantity and quality. It isn’t until the water reaches the confluence of
Independence Creek and the flow increases 42% and the salt concentration decreases by 50% (Miyamoto 2008).
The most practical way to determine a subsistence flow for the Upper Pecos is to begin releases from Red Bluff
Reservoir and monitor the water at Iraan. Once the flows have sufficient DO then this will be the subsistence flows.
The base flows would then be calculated as percentages based upon the subsistence flows. Pulse flows would have
to be based on rainfall in each of the basins as each of the basins in the upper reaches of the Pecos are intercepted
by irrigation district diversion districts and collect “free“ water and the storm water doesn’t create pulse events
which are necessary to transport sediment and maintain the channel habitat for the biology of the river. Basin
analyses would have to be conducted to determine the amount of rainfall in each basin and then correlated with the
runoff curves for individual events based on soil and vegetation types. These pulse flows would then need to be
simulated by releases from Red Bluff Reservoir. Analyses would also need to be conducted to determine the
probabilities of rainfall across multiple basins in order to create the high pulse flows.
Imperative to any attempt to reestablish environmental flows in the Upper Pecos is the potential to pollute the
Lower Pecos and Amistad Reservoir. In 1998, a storm event occurred which increased flow in the Pecos River and
produced salinity levels in Amistad Reservoir above the 1,000 ppm drinking water standards (Miyamoto 2006). All
practical testing of flow enhancements should be aware of the effects on the entire water system of the Rio Grande.
These analyses are beyond the time and financial scope of this report.

2-28
2.6.3 Devils River Sub-Basin
The Devils River sub-basin covers approximately 4,300 square miles, encompassing all or part of 5 counties in
South-Central/South-West Texas (Figure 2.6-13). The sub-basin is bordered by the Colorado River Basin to the
north, the Nueces River Basin to the east and other sub-basins of the Rio Grande Basin to the south and west. The
permanent surface water of the Devils River extends for approximately 71 km. (45 mi.) entirely within Val Verde
County from its headwaters at Pecan Springs to the weir dam at Pafford’s Crossing at the upper end of the Devils
River arm of Lake Amistad. An additional 34 km. (21 mi.) of the Devils River from Pafford’s Crossing, where the
downstream most IBWC stream flow gaging station (08-4494.00) is located, to its confluence with the Rio Grande
is now inundated by Lake Amistad. Just above Dolan Falls, spring-fed Dolan Creek is the largest tributary along the
river. There are also numerous smaller tributaries and many seeps and basal springs along the river. The discharge
of the Devils River, as measured at the IBWC gaging station at Pafford’s Crossing, averages 362 ft³/s, with a
maximum of 122,895 ft³/s and a minimum of 54 ft³/s.
Figure 2.6-13. Location of the Devils River Basin and gaging stations.
The Devils River is recognized as one of the most pristine aquatic systems in the state (De La Cruz 2004) and is
often considered the benchmark for surface water quality in Texas. The river flows through an arid landscape
dominated by mesas, steep cliffs and canyons and is generally characterized by long, flat-water pools punctuated by
shallow riffles and stair-step cascades. All this flow is channelized within fluted limestone bedrock.
The Devils River sub-basin is remarkable in its biodiversity; occurring at the ecological transition zone at the
confluence of three ecoregions (Edwards Plateau, Tamaulipan Thornscrub, and Chihuahuan Desert), as well as
supporting the high species richness associated with a riparian community occurring in an otherwise arid
ecosystem. It is a cross-section of both eastern and western species and has a high number of localized endemic
species, particularly in the aquatic realm. Because of all these factors, the Devils River is a major conservation
priority.

2-29
The species richness resulting from the convergence of ecoregions is further augmented by the aquatic communities
associated with the Devils River, Dolan Creek, and Dolan Springs. These waters are home to numerous endemic
and rare species, including the Devils River minnow (Dionda diabola), Rio Grande darter (Etheostoma grahami),
proserpine shiner (Cyprinella proserpina), Conchos pupfish (Cyprinodon eximius), Dolan Falls salamander
(Eurycea sp. 10) and Rio Grande cooter (Pseudemys gorzugi).
The diverse habitats in the conservation area support a variety of terrestrial species of conservation concern,
including breeding black-capped vireos (Vireo atricapilla), the largest known population of Texas snowbells
(Styrax platanifolius ssp. texana), and small populations of Tobusch fishhook cactus (Sclerocactus brevihamatus
var. tobuschii), all three federally endangered species. Also found here are several endemic and peripheral species,
such as the Devils River blackhead snake (Tantilla cucullata), ringed kingfisher (Ceryle torquata) and rufous-
capped warbler (Basileuterus rufifrons, not confirmed breeding). Common black-hawks (Buteogallus anthracinus)
and zone-tailed hawks (Buteo albonotatus) nest here, and the Devils River provides a critical north-south corridor
for myriad species of migratory songbirds, waterbirds, shorebirds, and raptors. Monarch butterflies (Danaus
plexippus) also utilize the Devils River riparian zone on their migratory journey. Other terrestrial fauna include
white-tailed deer (Odocoileus virginianus), black-tailed jackrabbits (Lepus californicus), cottontails (Sylvilagus
auduboni, S. floridianus), gray foxes (Urocyon cinereoargenteus), raccoons (Procyon lotor), ringtails (Bassariscus
astutus), beavers (Castor canadensis), bobcats (Lynx rufus), and occasional transitory mountain lions (Felis
concolor) and black bears (Ursus americanus).
There are multiple conservation and managed lands in the Devils River sub-basin, the primary public land being the
7,689-ha (19,000-ac) Devils River State Natural Area (DRSNA) in the middle portion of the basin. There is also a
second, recently purchased 17,000 acre section of the DRSNA under development near the bottom of the Devils
River sub-basin immediately around the Pafford’s Crossing weir dam. The DRSNA is used for canoeing, kayaking,
hiking, camping, and mountain biking. There is also a National Park Service managed Amistad National
Recreational Area adjacent to Amistad Reservoir.
The Devils River sub-basin is also a location with extensive private conservation partnerships. The Nature
Conservancy owns and manages the Dolan Falls Preserve, a 1,943 ha (4,800 ac) property adjacent to the upper
SNA section. This preserve serves as the nucleus for the Conservancy’s work with private landowners along the
Devils River. As a result of these partnerships over 28,000 ha (70,000 ac) are under conservation easement. Many
partnership lands contain some of the important springs maintaining the Devils River base flow, such as Snake
Spring, the headspring of Dolan Creek.
In addition to its biological diversity, this area is rich in artifacts of ancient Native American people. Pictographs
dating back 5,000 years are found on the surface of many cliff shelters and overhangs at the heads of canyons and
along rimrock ledges, with younger pictographs (post-European contact) at the base of the limestone cliffs at Dolan
Springs. Prehistoric Indian rock middens in the area may be as much as 10,000 years old. The historic rock art of
the Dolan Falls area is widely recognized and appreciated by members of the anthropological community.
Since the late 1800s, this area has been used for cattle, sheep and goat ranching. Changes in the market have led to
a general decline of livestock ranching in the area, and today an increasing percentage of the income generated on
these lands is from game hunting. Exotic game animals, most notably aoudad or Barbary sheep (Ammotragus
lervia) have been introduced for hunting, with mixed results from an economic and ecological perspective. Other
past and continuing land uses in the area are primarily recreational, including fishing, swimming, and canoeing.
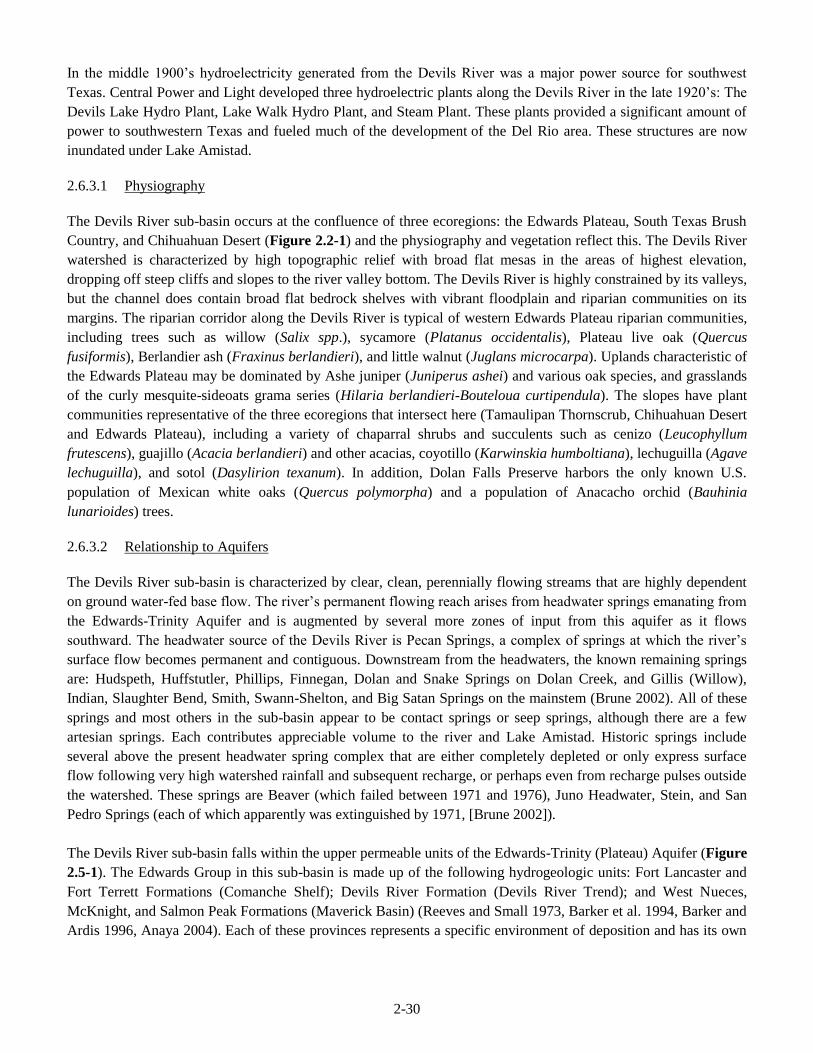
2-30
In the middle 1900’s hydroelectricity generated from the Devils River was a major power source for southwest
Texas. Central Power and Light developed three hydroelectric plants along the Devils River in the late 1920’s: The
Devils Lake Hydro Plant, Lake Walk Hydro Plant, and Steam Plant. These plants provided a significant amount of
power to southwestern Texas and fueled much of the development of the Del Rio area. These structures are now
inundated under Lake Amistad.
2.6.3.1 Physiography
The Devils River sub-basin occurs at the confluence of three ecoregions: the Edwards Plateau, South Texas Brush
Country, and Chihuahuan Desert (Figure 2.2-1) and the physiography and vegetation reflect this. The Devils River
watershed is characterized by high topographic relief with broad flat mesas in the areas of highest elevation,
dropping off steep cliffs and slopes to the river valley bottom. The Devils River is highly constrained by its valleys,
but the channel does contain broad flat bedrock shelves with vibrant floodplain and riparian communities on its
margins. The riparian corridor along the Devils River is typical of western Edwards Plateau riparian communities,
including trees such as willow (Salix spp.), sycamore (Platanus occidentalis), Plateau live oak (Quercus
fusiformis), Berlandier ash (Fraxinus berlandieri), and little walnut (Juglans microcarpa). Uplands characteristic of
the Edwards Plateau may be dominated by Ashe juniper (Juniperus ashei) and various oak species, and grasslands
of the curly mesquite-sideoats grama series (Hilaria berlandieri-Bouteloua curtipendula). The slopes have plant
communities representative of the three ecoregions that intersect here (Tamaulipan Thornscrub, Chihuahuan Desert
and Edwards Plateau), including a variety of chaparral shrubs and succulents such as cenizo (Leucophyllum
frutescens), guajillo (Acacia berlandieri) and other acacias, coyotillo (Karwinskia humboltiana), lechuguilla (Agave
lechuguilla), and sotol (Dasylirion texanum). In addition, Dolan Falls Preserve harbors the only known U.S.
population of Mexican white oaks (Quercus polymorpha) and a population of Anacacho orchid (Bauhinia
lunarioides) trees.
2.6.3.2 Relationship to Aquifers
The Devils River sub-basin is characterized by clear, clean, perennially flowing streams that are highly dependent
on ground water-fed base flow. The river’s permanent flowing reach arises from headwater springs emanating from
the Edwards-Trinity Aquifer and is augmented by several more zones of input from this aquifer as it flows
southward. The headwater source of the Devils River is Pecan Springs, a complex of springs at which the river’s
surface flow becomes permanent and contiguous. Downstream from the headwaters, the known remaining springs
are: Hudspeth, Huffstutler, Phillips, Finnegan, Dolan and Snake Springs on Dolan Creek, and Gillis (Willow),
Indian, Slaughter Bend, Smith, Swann-Shelton, and Big Satan Springs on the mainstem (Brune 2002). All of these
springs and most others in the sub-basin appear to be contact springs or seep springs, although there are a few
artesian springs. Each contributes appreciable volume to the river and Lake Amistad. Historic springs include
several above the present headwater spring complex that are either completely depleted or only express surface
flow following very high watershed rainfall and subsequent recharge, or perhaps even from recharge pulses outside
the watershed. These springs are Beaver (which failed between 1971 and 1976), Juno Headwater, Stein, and San
Pedro Springs (each of which apparently was extinguished by 1971, [Brune 2002]).
The Devils River sub-basin falls within the upper permeable units of the Edwards-Trinity (Plateau) Aquifer (Figure
2.5-1). The Edwards Group in this sub-basin is made up of the following hydrogeologic units: Fort Lancaster and
Fort Terrett Formations (Comanche Shelf); Devils River Formation (Devils River Trend); and West Nueces,
McKnight, and Salmon Peak Formations (Maverick Basin) (Reeves and Small 1973, Barker et al. 1994, Barker and
Ardis 1996, Anaya 2004). Each of these provinces represents a specific environment of deposition and has its own

2-31
unique geologic formations with discreet hydraulic characteristics. The major depositional provinces (Comanche
Shelf, Devils River Trend, and Maverick Basin) and structural features (e.g., Carta Valley Fault Zone) may be the
major controls on ground water flows (Barker and Ardis, 1996).
The primary importance of ground water to the Devils River flow underscores the importance of ground water
management to maintenance of sufficient instream flow in the sub-basin. Impacts to the sound ecological
environment of the Devils River will not only come from surface water withdrawals, but also from excessive
ground water pumping. It will be important to consider instream flow and/or springflow standards in ground water
management, e.g., in setting desired conditions for the aquifer and in drought management plans. This will also be
important as San Antonio and other cities to the east and north look to eastern Val Verde County aquifers as
additional sources for municipal water supply. This is doubly important because Val Verde County ground water is
the water supply for the city of Del Rio and the air force base.
2.6.4 Amistad Reservoir
Amistad Reservoir is a very prominent feature in the Devils River sub-basin as it impounds the lower 21 miles of
the river to its confluence with the Rio Grande. In high lake stands, the upstream end of the reservoir pool is at the
Pafford’s Crossing weir dam on the new Devils River State Natural Area. Amistad Reservoir provides flood control
and water supply, primarily for downstream agricultural users in the lower Rio Grande Valley. Throughout the
basin, the rivers are used for water supply and recreational purposes. There are currently no surface water rights
within the Devils River watershed. Diversions from the Devils River are thus restricted to domestic and livestock
use at river front properties, typically from shallow wells. Use of ground water in the Devils River Basin in Val
Verde County is currently unregulated; however, part of the basin lies within Kinney County and as such may be
subject to regulation by the Kinney County Ground water Conservation District. To date, the Kinney Ground water
Conservation District has focused on the eastern portion of that county, outside the Devils River basin.

2-32
2.7 Regional Water Planning (Regions E,F,J)
2.7.1 2012 State Water Plan
Texas State Water Plan updated and published in 2012 assessed water demands and water supplies for next 50
years for 16 regions (TWDB, 2012). The URG BBEST’s work is closely related to three regional water plans,
including Regions E (FWTRWPG, 2011), Region F (Region F Water Planning Group, 2010), and Plateau Region
(Region J) (Plateau Water Planning Group, 2011). Each regional water plan is designed to meet the regional needs
for water during times of drought. Each planning group evaluates population projects, water demand projections,
and existing water supplies that would be available during times of drought. By comparing water demands and
supplies, water user groups that will not have enough water during time of drought will be identified. Strategies for
addressing such water shortage are recommended in the water plan. During the planning process, the planning
group also assessed risks and uncertainties, and evaluated potential impacts of water management strategies on the
regional water, agricultural and natural resources. One of the potential future planning issues identified in the Texas
State Water Plan is impacts to water availability from new environmental flow standards (TWDB, 2012).
2.7.2 Unique Stream Segments
The Texas Water Development Board (TWDB) regional water planning guidelines require that a regional water
plan include recommendations for regulatory, administrative, and legislative changes that will facilitate water
resources development and management:
“357.7(a) Regional water plan development shall include the following… regulatory, administrative, or legislative
recommendations that the regional water planning group believes are needed and desirable to facilitate the orderly
development, management, and conservation of water resources and preparation for and response to drought
conditions in order that sufficient water will be available at a reasonable cost to ensure public health, safety, and
welfare; further economic development; and protect the agricultural and natural resources of the state and
regional water planning area. The regional water planning group may develop information as to the potential
impact once proposed changes in law are enacted.” (TWDB, 2001).
The guidelines also call for regional water planning groups to make recommendations on the designation of
ecologically unique river and stream sites and unique sites for reservoir development. In each regional water plan,
unique stream segments are identified and recommended by the State Legislature and stakeholders. Following
sections summarize those unique stream segments that are related to this project.
2.7.2.1 The Rio Grande
In region E water plan, the planning group recognizes the significance of the 196-mile Rio Grande Wild and Scenic
River segment that was designated by Congress in 1978 under the Wild and Scenic River Act (16 USC 28 §1274)
and encourages the proper conservative management of this region (Figure 2.7-1). The segment is covering the
United States side of the river, extending from river mile 842.3 above Mariscal Canyon downstream to river mile
641.1 at the Terrell-Val Verde County line. The International Boundary and Water Commission later revised the
beginning and ending river miles to 853.2 and 657.5 respectively. The upper 69-mile section of this corridor lies
within the Big Bend National Park, however the National Park Service administers the entire 196-mile designated
section. For purposes of the Far West Texas Regional Water Plan (FWTRWPG, 2011), the Planning Group
officially recommends that only the part of the federally designated Rio Grande that is bordered by the Big Bend
National Park be considered under the guidelines of “Ecologically Unique River and Stream Segments”. The

2-33
following river segment characterization is principally contained with the National Parks Service / Rio Grande Wild
and Scenic River Final General Management Plan and Environmental Impact Statement
(http://www.nps.gov/rigr/parkmgmt/upload/RIGR_gmp-eis.pdf).
Figure 2.7-1: Region E, Recommended Ecologically Unique Rivers and Streams (TWDB, 2011)
The Rio Grande Wild and Scenic River (RIGR) was designated for the following purposes:
To preserve the free-flowing condition and essentially primitive character of the river (expect as
provided by treaty)
To protect the outstanding scenic, geologic, fish and wildlife, recreational, scientific, and other similar
values of the river and its immediate environment
To provide opportunities for river-oriented recreation that is dependent upon the free- flowing
condition of the river and consistent with the primitive character of the surroundings.
The Rio Grande Wild and Scenic River is significant as part of a valuable and largely intact ecological system
representing major riparian and aquatic habitat associated with the Chihuahuan Desert. Spectacular river canyons,
the primitive character of the river, and its international flavor combine to form a stimulating environment for high
quality scenic and recreational experience. Protecting and managing this outstanding natural resource extends a
valuable opportunity for international cooperation between the United States and Mexico.
The designated Wild and Scenic stretch of the Rio Grande begins in Big Bend National Park, opposite the boundary
between the Mexican states of Chihuahua and Coahuila. It then flows through Mariscal and Boquillas Canyons in
the national park. Downstream from the park, it extends along the state-managed Black Gap Wildlife Management

2-34
Area and several parcels of private land in the Lower Canyons. The wild and scenic river segment ends at the
county line between Terrell and Val Verde Counties. The National Park Service’s jurisdiction on the Rio Grande
Wild and Scenic River downstream from the park boundary includes only the river area from the United
States/Mexico international boundary in the middle of the deepest channel to the gradient boundary at the edge of
the river on the United States side. The gradient boundary, as recognized by the State of Texas, is defined as located
midway between the lower level of the flowing water that just reaches the cut bank and the higher level of it that
just does not overtop the cut bank. The riverbed of the Wild and Scenic River downstream from the park is the
property of the State of Texas.
The following sections are classified as wild: Talley to Solis, which includes Mariscal Canyon; the entrance to
Boquillas Canyon to the exit of Boquillas Canyon; and Reagan Canyon to San Francisco Canyon (the bulk of the
“Lower Canyons”). The remainder of the Wild and Scenic River is classified as scenic. The area is an outstanding
example of Chihuahuan Desert wildlife in Texas. This isolated area represents a rapidly dwindling, irreplaceable
natural resource. The riparian corridor, containing more vegetative growth and a reliable water supply, attracts
many wildlife species.
Forty-six known species of fish inhabit the Big Bend area; 34 of these are native. Shiners and daces are the most
abundant fishes in the Rio Grande. Larger fish found here are the long-nose gar, channel catfish, blue catfish, and
European carp. Six native fish species have been extirpated in recent decades because of the effects of dams, habitat
modification, and competition from at nonnative species (FWTRWPG, 2011). Native freshwater mussels have
virtually disappeared from this area. Some historic species no longer can be found, and the more persistent Texas
hornshell and Salina Mucket have not been found alive in recent years. Other aquatic species may be in danger of
extirpation. Reductions in water quality and quantity adversely affect these and other aquatic species. At least 12
nonnative fish species are prominent in the Rio Grande, however, at present there is insufficient information about
the distribution and spread of exotic species.
Birds are the most frequently seen animals along the river. Common resident species seen or heard along the river
include yellow-breasted chat, black phoebe, white-winged dove, canyon wren, and roadrunner. Ravens, turkey
vultures, and various raptors regularly soar overhead. Peregrine falcons (Falco peregrinus) use high cliff faces for
nesting in Santa Elena, Mariscal, and Boquillas canyons. Reptiles include lizards, snakes, and both terrestrial and
aquatic turtles. Several amphibian species also are present.
2.7.2.2 The Pecos River
In the Region E water plan, the planning group identified and designated Independence Creek as ecologically
unique segment (Figure 2.7-1). It is a large spring-fed creek in northeastern Terrell County. It is the most important
and one of the few remaining freshwater tributaries of the lower Pecos River. The Texas Nature Conservancy owns
and manages the 19,740-acre Independence Creek Preserve. Caroline Spring, located at the Texas Nature
Conservancy’s Preserve headquarters, produces 3,000 to 5,000 gallons per minute and comprises about 25% of the
creek’s flow. Independence Creek’s contribution increases the Pecos River water volume by 42% and reduces the
total dissolved solids, thus improving water quantity and quality. The Preserve hosts a variety of bird and fish
species, some of which are extremely rare. Caroline Spring, along with the entirety of the Independence Creek
Preserve, is a significant piece of West Texas natural heritage. That portion of Independence Creek that flows
through the Preserve continues to be recommended as an "Ecologically Unique River and Stream Segment".
Caroline Spring is recognized as a "Major Spring" (FWTWRPG, 2011).
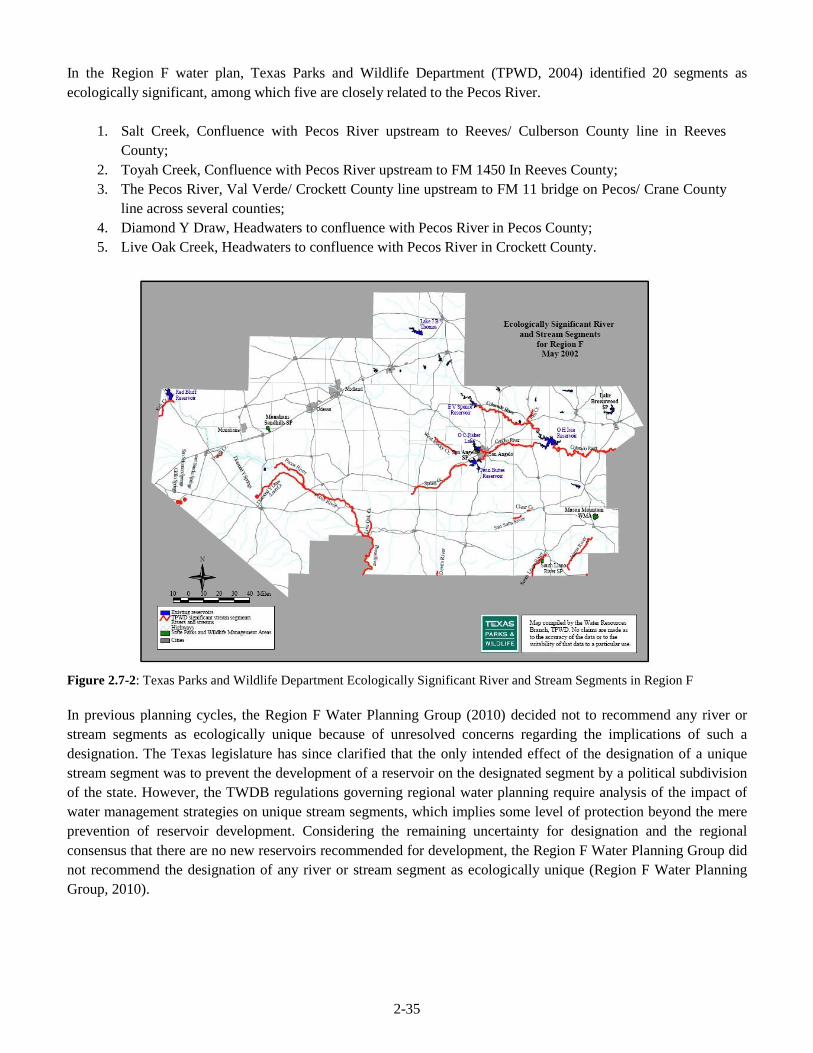
2-35
In the Region F water plan, Texas Parks and Wildlife Department (TPWD, 2004) identified 20 segments as
ecologically significant, among which five are closely related to the Pecos River.
1. Salt Creek, Confluence with Pecos River upstream to Reeves/ Culberson County line in Reeves
County;
2. Toyah Creek, Confluence with Pecos River upstream to FM 1450 In Reeves County;
3. The Pecos River, Val Verde/ Crockett County line upstream to FM 11 bridge on Pecos/ Crane County
line across several counties;
4. Diamond Y Draw, Headwaters to confluence with Pecos River in Pecos County;
5. Live Oak Creek, Headwaters to confluence with Pecos River in Crockett County.
Figure 2.7-2: Texas Parks and Wildlife Department Ecologically Significant River and Stream Segments in Region F
In previous planning cycles, the Region F Water Planning Group (2010) decided not to recommend any river or
stream segments as ecologically unique because of unresolved concerns regarding the implications of such a
designation. The Texas legislature has since clarified that the only intended effect of the designation of a unique
stream segment was to prevent the development of a reservoir on the designated segment by a political subdivision
of the state. However, the TWDB regulations governing regional water planning require analysis of the impact of
water management strategies on unique stream segments, which implies some level of protection beyond the mere
prevention of reservoir development. Considering the remaining uncertainty for designation and the regional
consensus that there are no new reservoirs recommended for development, the Region F Water Planning Group did
not recommend the designation of any river or stream segment as ecologically unique (Region F Water Planning
Group, 2010).

2-36
2.7.2.3 Devils River
In Region J (Plateau Water Regional Planning Group, 2011), TPWD provided a list of stream segments that were
identified as meeting ecologically unique criteria, including the Devils River. For each segment, TPWD lists
qualities of each segment that support the stream’s candidacy. These qualities may include but are not limited to
biological function, hydrological function, location with respect to conservation areas, water quality, the presence
of state or federally listed, threatened, or endangered species, and the critical habitat for such species.
The Devils River, from a point 0.4 miles downstream of the confluence of Little Satan Creek in Val Verde County
upstream to the Val Verde/Sutton County line (within TNRCC classified stream segment 2309), is recommended
for ecologically unique segment by TPWD. The Devils River serves following functions. (a) Biological function,
National Wild and Scenic Rivers System nominee for outstandingly remarkable fish and wildlife values (NPS,
1995); (b) Riparian conservation area, Devils River State Natural Area High water quality/exceptional aquatic
life/high aesthetic value – ecoregion stream (Bayer et al., 1992); high water quality and exceptional aquatic life use
(TNRCC, 1996); exceptional aesthetic value (NPS, 1995); (c) Threatened or endangered species/unique
communities - Devils River minnow (Federally Endangered/ State Threatened), Conchos pupfish (Species of
Concern/State Threatened) (Hubbs et al., 1991); proserpine shiner (Species of Concern/ State Threatened), Rio
Grande darter (Species of Concern/ State Threatened) (Bayer et al., 1992; Hubbs et al., 1992); largest known
population of Texas snowbells (Federally Endangered/ State Endangered) (J. Poole, 1999, pers. comm.).
The Plateau Water Regional Planning Group recognized the importance of preservation of this natural environment
and the uniqueness of this Region as the Region’s economy is closely tied to these natural resources. Throughout
the planning period the planning group has followed a policy of always considering the impact that their decisions
have on the area’s ecological resources. However, because the subsequent ramifications of designation are not fully
understood, the planning group had chosen to refrain from recommending specific segments for designation as
“ecologically unique”. The Water Planning Group strongly asserts that all river and stream segments in the Plateau
Region are vitally important and their flows constitute a major consideration in adoption of the regional water plan
(Plateau Water Regional Planning Group, 2011).

2-37
2.8 URG Study Area Unique Issues
2.8.1 United States – Mexico Water Treaty (1944)
The 1944 International Treaty addresses the waters in the international segment of the Rio Grande from Fort
Quitman, Texas to the Gulf of Mexico. The Treaty allocates water in the River based on percentage of flows in the
River from each country’s tributaries to the Rio Grande. The 1944 Treaty also stipulates that one third of the flow
of the Rio Conchos in Mexico is allotted to the United States. The Rio Conchos is by far the largest tributary of the
Rio Grande. The treaty requires that the combined flow of the Rio Conchos and five other tributaries (San Diego,
San Rodrigo, Escondido, Salado Rivers and Las Vacas Arroyo) shall have an annual average of not less than
350,000 acre-ft. The IBWC/CILA is responsible for implementing the treaties between the United States and
Mexico. As of the printing of this Plan in 2012, Mexico was current on its obligations (Far West Texas Water Plan,
2011).
2.8.2 Pecos River Compact
The major purposes of the Pecos River Compact among the State of New Mexico, the State of Texas and the United
States are to provide for the equitable division and apportionment of the use of the waters of the Pecos River; to
promote interstate comity; to remove causes of present and future controversies; to make secure and protect present
development within the states; to facilitate the construction of works for, (a) the salvage of water, (b) the more
efficient use of water, and (c) the protection of life and property from floods. Under this Compact, New Mexico
shall not deplete by man's activities the flow of the Pecos River at the New Mexico-Texas state line below an
amount which will give to Texas a quantity of water equivalent to that available to Texas under the 1947 condition.
The beneficial consumptive use of water salvaged in New Mexico through the construction and operation of a
project or projects by the United States or by joint undertakings of Texas and New Mexico, is hereby apportioned
43% to Texas and 57% to New Mexico. The beneficial consumptive use of water which shall be non-beneficially
consumed, and which is recovered, is hereby apportioned to New Mexico but not to have the effect of diminishing
the quantity of water available to Texas under the 1947 condition. Any water salvaged in Texas is apportioned to
Texas. Beneficial consumptive use of unappropriated flood waters is hereby apportioned 50% to Texas and 50% to
New Mexico. Moreover, the Compact requires that the nothing shall be construed as:
a) Affecting the obligations of the United States under the Treaty with the United Mexican States (Treaty
Series 994); and
b) affecting any rights or powers of the United States, its agencies or instrumentalities, in or to the waters of
the Pecos River, or its capacity to acquire rights in and to the use of said waters. These rules have great
impacts on the acquisition of water rights to maintain environmental flows.
2.8.3 Pecos River Watershed Protection Plan
The Watershed Protection Plan for the Pecos River in Texas (WPP) prepared by Texas AgriLife Extension Service,
Texas AgriLife Research, the U.S. Section of the International Boundary and Water Commission, the Texas Water
Resources Institute and the Texas State Soil and Water Conservation Board, is a plan to restore water quality in the
river and generally improve watershed health (Gregaory and Hatler, 2008). The WPP assesses water quality and
quantity concerns and other natural resource issues across the entire Pecos River watershed in Texas, and provides
practical, landowner-supported solutions to address these concerns. The overall goal of the WPP is to sustain a
landowner-driven process to promote voluntary best management practices throughout the watershed that will
improve water quality and overall health of the watershed.

2-38
The WPP includes an extensive overview of the watershed and the physical characteristics that define the
watershed. The WPP identifies concerns, information on the causes and sources, critical areas for management,
estimated load reductions, management measures, and assistance needed. Some of major concerns listed in the
WWP are summarized as below: Salinity management, biological diversity, water quantity, golden algae, DO,
sediment, oil and gas production, nutrients and chlorophyll-a. The WPP also addressed technical and financial
assistance, implementation schedule, public education and outreach, and monitoring programs. Following sections
are summarized from the WPP.
Salinity: The sources of elevated salinity in the Pecos River are irrigation return flows flowing across naturally
occurring salt deposits across the Permian Basin then returning to the river and saline ground water entering the
river in several locations. Human influences and activities can alter the effects of natural sources of salt on the
river’s salinity. These sources occur in New Mexico and Texas, yet both influence the quality of water in Texas.
Two critical areas for management and further investigation are the ground water intrusion points near Malaga, NM
and Imperial, TX. A pilot project conducted near Malaga, NM in the 1960s verified that a 25% load reduction in
salinity is feasible through pumping a saline aquifer and harvesting the salt. Although highly saline inflows have
been noted near the Imperial area, specific information about the intrusion point and salinity of these inflows is
currently unknown. Further information will be needed prior to implementing management measures in this area.
Salt cedar (Tamarix spp.) removal and subsequent water salvage also has the ability to decrease salinity. Decreases
in salinity will be inversely related to increases in stream flow because of salt cedar removal. Previously treated salt
cedar and planned salt cedar treatment also have the ability to influence in-stream salinity concentrations if
salvaged water materializes as stream flow.
Biological Diversity: Biological diversity refers to a variety of features in the watershed that can include aquatic,
riparian, and upland vegetation; aquatic life species; and wildlife species. The changes in these aspects of the
watershed are due primarily to human influences occurring over the last 150 years. The combination of overgrazing
in the late 1800s, extensive droughts, the introduction of the invasive species salt cedar, and the increased use of
water from the river and aquifers have been the driving factors in changing the biological diversity. Critical areas
for improving biological diversity have been identified in three primary areas: riparian brush control and
revegetation, upland brush management, and aquatic habitat improvement. Specific management measures
recommended to achieve biological diversity restoration are widespread salt cedar control followed by prescribed
burns to remove debris and promote natural revegetation, controlling other invasive species in riparian areas such as
giant cane and willow baccharis, conducting upland brush control and implementing improved land management
practices, and working to improve aquatic habitat.
Estimated changes in biological diversity are extensive and it will take many years to fully realize these changes.
Over 2,000 acres of invasive salt cedar trees remain to be treated in the riparian corridor along with undocumented
new growth and regrowth from previously treated salt cedar. Chemical treatment paired with biological control is
not anticipated to eradicate this invasive species but rather to prevent it from consuming thousands of acres as it has
in the past. Aquatic habitat, also expected to improve over an extended period, will be dependent upon many of the
management measures implemented throughout the watershed.
Water Quantity: Water quantity issues are always a concern in a desert environment. Causes of water shortages in
the river are a combination of climate and increased water consumption throughout the watershed. Critical areas for
managing water quantity are improving on-farm irrigation and delivery of irrigation water, promoting water
conservation throughout the watershed, controlling invasive plant species, and promoting new management

2-39
practices to enhance existing land stewardship. Estimated improvements in water quantity are primarily derived
from irrigation efficiency improvements, reservoir release modifications, and salt cedar control. Irrigation
efficiency of 95% to 97% can be achieved using drip irrigation technology, thus making a 20% savings realistic as
compared to surge flow irrigation. Reservoir releases currently lose more than 50% of the released water, and
research shows that these losses could be reduced to around 35%. Lastly, salt cedar removal is anticipated to
salvage 0.5 to 1 acre-foot of water per acre of salt cedar treated and this salvaged water should supplement shallow
water tables or stream flow.
Dissolved Oxygen: Improving DO levels in the river between Pecos and Girvin is one of the primary objectives of
the WPP. Maintaining sufficient DO levels in the river is critical to the survival of aquatic life and an indicator of
overall river health. The critical area for improving DO levels in the river is the stretch between Business 20 near
Pecos downstream to US 67 near Girvin. Data collected in this area over a three-year period resulted in this reach
of the river being listed as impaired on the 2008 303(d) List for not meeting current water quality standards.
Depressed DO can stem from a variety of causes and sources such as low flows, high nutrients and algal growth,
higher salinity, and increased biological oxygen demand; however, these have not been fully evaluated for the
Pecos River. Planned work will use computer-based modeling to evaluate the influence of environmental
parameters on in-stream DO levels. Without a sound understanding of the causes leading to low DO levels,
appropriate management measures cannot be recommended; however, increasing the agitation of the river,
decreasing water temperatures and salinity in the river, decreasing the amount of dead organic matter in the river,
and reducing nutrient loading into the river will all positively affect DO levels in the river.
Sediment: Sediment loading in the Pecos River is not a major problem in most areas; however, planned salt cedar
debris removal activities will increase the risk of excessive sediment until vegetation is re-established. Establishing
healthy ground cover in upland and riverbank areas will have the greatest positive impact on sediment levels and
may increase available grazing in the watershed. Critical areas where erosion potential will need to be managed are
in areas where salt cedar debris is burned. Sediment loading to the river will be reduced by 6,192 tons if all treatable
areas are sprayed, burned, and subsequently revegetated.
Oil and Gas Production: The long-standing influence of the oil and gas industry in the Pecos River watershed has
led to many landowner concerns about potential industry-related water quality impacts. Some landowners have
reported abandoned wells, leaking wells, and/or improper brine disposal in their land or adjacent lands, all of
which could pose significant threats to water quality. The critical area to watch for these activities and issues is in
the upper portion of the watershed (above I-10) where exploration and drilling began almost 100 years ago and the
bulk of today’s oil and gas production in the region still occurs. One management measure recommended in the
WPP is to document the date and location of abandoned wells, leaking wells, and/or improper brine disposal and
report them to the Railroad Commission of Texas (RCC) or to the Pecos River Watershed Coordinator. Once
problem areas are identified, solutions with industry and state and federal agencies can be achieved.
Nutrients and chlorophyll-a: Several segments of the Pecos River and Red Bluff Reservoir have elevated nutrient
levels and are listed as concerns on the 2008 Texas Water Quality Inventory. Critical areas for implementing
nutrient management measures are in the upper portions of the watershed in Texas and in irrigated agriculture
areas in New Mexico. The elevated nutrients in Red Bluff Reservoir indicate that excessive levels of nutrients are
being delivered in the river from New Mexico. Management techniques and educational activities recommended
in the WPP will help address this issue. Management measures specific to nutrients are primarily education based.
Educational programs and workshops will teach participants about proper nutrient management and will lead to

2-40
reduced nutrient levels in the river. Coordinating with New Mexico is also a key to effectively managing nutrient
levels in Texas.

3-1
Section 3. Instream Flow Analysis
3.1 Introduction
The guiding principle applied to the Upper Rio Grande BBEST instream flow analyses and associated
methodologies is the concept of the "Natural Flow Regime”, which stresses the importance of the dynamic
processes that occur over a range of flows that help maintain the physical, biological, chemical, and ecological
integrity of river systems (Poff, et al.,1997).
The natural flow regime paradigm incorporates five critical components of flow that regulate ecological processes
in river ecosystems: magnitude, frequency, duration, timing, and rate of change in flow (Poff and Ward, 1989;
Richter, et al., 1996; Walker, et al., 1995). The five components represent attributes of the entire range of both
flood flows and low flows. Along with the over–arching physical characteristics of each river basin, the flow
regime is the single-most important variable in controlling physical, biologic, and chemical processes.
Additionally, these processes feedback upon each other, and thus, changes to one aspect of the flow regime may
cause cascading effects throughout the river system. For further discussion on the interrelationships between the
physical, biologic, and ecologic processes (Figure 3.1-1), refer to the above publications, TIFP 2008 and previous
BBEST reports including the Nueces Environmental Flow Recommendations Report (Section 3; 2011).
Figure 3.1-1. The five components of the natural flow regime that directly and indirectly affect the ecological integrity of river
ecosystems (adapted from Poff, et al., 1997) and taken from Nueces BBEST Environmental Flow Recommendations Report
(2011).

3-2
As a tool for characterization of flow regimes within Texas rivers, the SAC (2009) adopted the HEFR
Methodology which employs statistical calculations based on historic mean daily discharges in order to quantify
attributes of four portions of the flow regime: subsistence flows, base flows, high flow pulses, and overbank
flows. For each of these flow regime components, HEFR was designed to assist in characterizing their attributes in
terms of magnitude, duration, timing, and frequency. For environmental flow recommendations within this report,
HEFR results are then integrated with overlays of biology, water quality, and geomorphology in order to tailor
HEFR outputs and fulfill the requirement of achieving a sound ecologic environment for each river segment. A
description of the ecological function of these flow components can be found in Richter, et al. (2006), Richter and
Thomas (2007), TIFP (2008) and SAC (2009). Table 3.1-1 summarizes the ecological functions of various flow
components for perennial and intermittent locations in the upper Rio Grande basin, taking into consideration the
unique physical characteristics of the basin and its biota.
Table 3.1-1. General flow components for the stream segments of the Upper Rio Grande Basin.
Component Hydrology Geomorphology Biology Water Quality No-Flow Periods Flow ceases between
perennial pools Encroachment of vegetation
Generally stressful for fish communities
Temperatures rise and oxygen levels decrease.
These condition
sometimes cause fish kills
Subsistence Flows Infrequent low flows Increased deposition of fine and organic particles,
encroachment of
vegetation
Provide restricted aquatic habitat limit connectivity
Elevate temperature and constituent concentrations
Maintain adequate levels
of dissolved oxygen
Base Flows Average flow condition,
including variability
Maintain soil moisture
and ground water table
Maintain a diversity of habitats, Exports or
transports sediment?
Provide suitable aquatic
habitat, Provide
connectivity along channel corridor
Provide suitable in-
channel water quality
High Flow Pulses In channel short duration,
high flows
Deposit sediment,
development of inset flood plains; Prevent
encroachment of riparian
vegetation
Serve as recruitment
events for organisms; Provide connectivity to
near-channel water bodies
Restore in-channel water
quality after prolonged low flow periods.
Episodic in nature and
associated with fish kills (anecdotal, no real
investigation of this yet)
Overbank flows Infrequent high flows that exceed the channel
Provide lateral channel movement and floodplain
maintenance; Recharge
floodplain water table; form new habitats; flush
organic material into
channel; Deposit nutrients in floodplain
Provide new life phase cues for organisms;
Maintain diversity of
riparian vegetation; Provide conditions for
seedling development;
Provide connectivity to floodplain
Restore water quality in floodplain water bodies
Channel Maintenance For most streams, channel
maintenance occurs mostly during pulse and
overbank flows
Long-term maintenance
of existing channel morphology
Maintains foundation for
physical habitat features instream
Water quality condition
like those during pulse overbank flows
Environmental flow analyses are summarized in the following sub-sections of Section 3. These sub-sections
follow a logical progression established in SAC guidance through which: a) regime recommendation locations are
selected with due consideration of geographic scope; b) hydrology-based tools are applied to extract statistics
descriptive of flows and flow regime components at the selected locations; and c) biological, water quality, and
geomorphology, overlays are applied to confirm or refine the hydrology-based statistics. The conclusion of this
logical progression is the set of environmental flow regime recommendations provided in Section 4.

3-3
The stream segments for which we provide environmental flow recommendations for in this report have all
experienced a wide range of scientific attention varying from little to no scientific work concerning some
ecosystem processes, and extensive work concerning other processes. However, there have generally been few, if
any, scientific investigations or monitoring efforts designed to relate physical or biological processes to the flow
regime. Although we incorporate the best available scientific data to inform our recommendations, very few data
collection or monitoring efforts were conducted with the specific purpose for informing management decisions
regarding the establishment of in-stream flows. As a reflection of the different levels of scientific attention, and
the different initial purposes of scientific data collection, the datasets included herein as part of the biologic, water
quality, and geomorphic overlays are extremely disparate and are at times difficult to use to specifically adjust
HEFR output numbers. For example, the physical processes that occur on some streams, most notably, the Rio
Grande, are extremely dynamic and have received a considerable degree of scientific investigation, whereas the
physical processes that occur on the Devils and Pecos rivers are not understood. For the reasons described above,
the overlays included within the individual flow recommendations for each river vary widely in scope, and are
used to much different degrees depending on the stream. In order to benefit future environmental flow
recommendation efforts, we outline many adaptive management actions in section 5 that could potentially provide
for more scientifically robust recommendations.

3-4
3.2 Geographic Scope
3.2.1 Streamflow gaging stations
A total of 20 gaging stations were evaluated within the Upper Rio Grande BBEST work area, including 7 gaging
stations for the Rio Grande, 10 for the Pecos River and 3 for the Devils River. Thirteen of these gages were chosen
for development of environmental flow regime recommendations, 5 for the Rio Grande, 6 for the Pecos River and 2
for the Devils River. These gage stations are shown in Figure 3.2-1. The characteristics of gage stations are listed
in Table 3.2-1. and gage descriptions are included in Sections 3.2.1.1, 3.2.1.2 and 3.2.1.3.
Figure 3.2-1. Gaging stations for the Rio Grande, Pecos, and Devils Rivers in the Upper Rio Grande BBEST sub-basin.
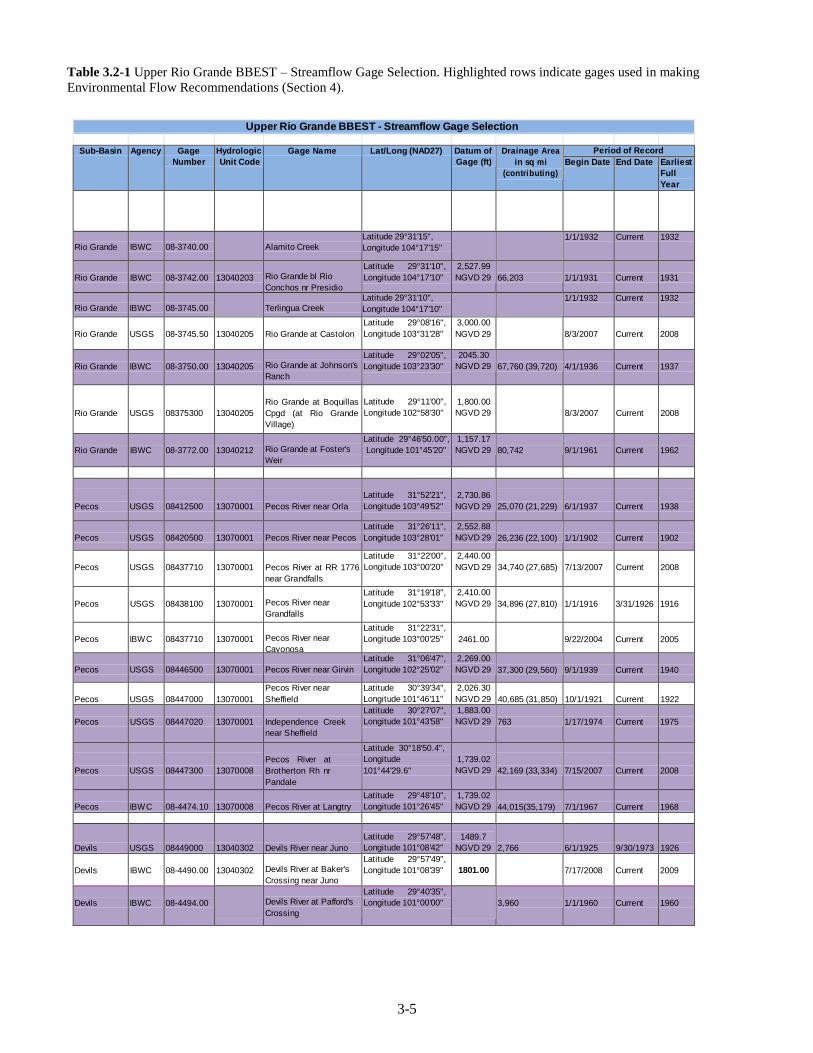
3-5
Table 3.2-1 Upper Rio Grande BBEST – Streamflow Gage Selection. Highlighted rows indicate gages used in making
Environmental Flow Recommendations (Section 4).
Upper Rio Grande BBEST - Streamflow Gage Selection
Sub-Basin Agency Gage
Number
Hydrologic
Unit Code
Gage Na me Lat/Long (NAD27) Datum of
Gage (ft)
Drainage Area
in sq mi
(contributing)
Period of Re cord
Begin Date End Date Earliest
Full
Year
Rio Grande
IBWC
08-3740.00
Alamito Creek
Latitude 29°31'15",
Longitude 104°17'15" 1/1/1932 Current 1932
Rio Grande
IBWC
08-3742.00
13040203
Rio Grande bl Rio
Conchos nr Presidio
Latitude 29°31'10",
Longitude 104°17'10"
2,527.99
NGVD 29
66,203
1/1/1931
Current
1931
Rio Grande
IBWC
08-3745.00
Terlingua Creek
Latitude 29°31'10",
Longitude 104°17'10" 1/1/1932 Current 1932
Rio Grande
USGS
08-3745.50
13040205
Rio Grande at Castolon
Latitude 29°08'16",
Longitude 103°31'28"
3,000.00
NGVD 29
8/3/2007
Current
2008
Rio Grande
IBWC
08-3750.00
13040205
Rio Grande at Johnson's
Ranch
Latitude 29°02'05",
Longitude 103°23'30"
2045.30
NGVD 29 67,760 (39,720)
4/1/1936
Current
1937
Rio Grande
USGS
08375300
13040205
Rio Grande at Boquillas
Cpgd (at Rio Grande
Village)
Latitude 29°11'00",
Longitude 102°58'30"
1,800.00
NGVD 29
8/3/2007
Current
2008
Rio Grande
IBWC
08-3772.00
13040212
Rio Grande at Foster's
Weir
Latitude 29°46'50.00",
Longitude 101°45'20"
1,157.17
NGVD 29
80,742
9/1/1961
Current
1962
Pecos
USGS
08412500
13070001
Pecos River near Orla
Latitude 31°52'21",
Longitude 103°49'52"
2,730.86
NGVD 29
25,070 (21,229)
6/1/1937
Current
1938
Pecos
USGS
08420500
13070001
Pecos River near Pecos
Latitude 31°26'11",
Longitude 103°28'01"
2,552.88
NGVD 29 26,236 (22,100)
1/1/1902
Current
1902
Pecos
USGS
08437710
13070001
Pecos River at RR 1776
near Grandfalls
Latitude 31°22'00",
Longitude 103°00'20"
2,440.00
NGVD 29
34,740 (27,685)
7/13/2007
Current
2008
Pecos
USGS
08438100
13070001
Pecos River near
Grandfalls
Latitude 31°19'18",
Longitude 102°53'33"
2,410.00
NGVD 29
34,896 (27,810)
1/1/1916
3/31/1926
1916
Pecos
IBW C
08437710
13070001
Pecos River near
Cayonosa
Latitude 31°22'31",
Longitude 103°00'25"
2461.00
9/22/2004
Current
2005
Pecos
USGS
08446500
13070001
Pecos River near Girvin
Latitude 31°06'47",
Longitude 102°25'02"
2,269.00
NGVD 29 37,300 (29,560)
9/1/1939
Current
1940
Pecos
USGS
08447000
13070001
Pecos River near
Sheffield
Latitude 30°39'34",
Longitude 101°46'11"
2,026.30
NGVD 29
40,685 (31,850)
10/1/1921
Current
1922
Pecos
USGS
08447020
13070001
Independence Creek
near Sheffield
Latitude 30°27'07",
Longitude 101°43'58"
1,883.00
NGVD 29 763
1/17/1974
Current
1975
Pecos
USGS
08447300
13070008
Pecos River at
Brotherton Rh nr
Pandale
Latitude 30°18'50.4",
Longitude
101°44'29.6"
1,739.02
NGVD 29
42,169 (33,334)
7/15/2007
Current
2008
Pecos
IBW C
08-4474.10
13070008
Pecos River at Langtry
Latitude 29°48'10",
Longitude 101°26'45"
1,739.02
NGVD 29 44,015(35,179)
7/1/1967
Current
1968
Devils
USGS
08449000
13040302
Devils River near Juno
Latitude 29°57'48",
Longitude 101°08'42"
1489.7
NGVD 29
2,766
6/1/1925
9/30/1973
1926
Devils
IBWC
08-4490.00
13040302
Devils River at Baker's
Crossing near Juno
Latitude 29°57'49",
Longitude 101°08'39"
1801.00
7/17/2008
Current
2009
Devils
IBWC
08-4494.00
Devils River at Pafford's
Crossing
Latitude 29°40'35",
Longitude 101°00'00"
3,960
1/1/1960
Current
1960

3-6
3.2.1.1 Rio Grande Gaging Stations
In order from upstream to downstream, the stream-flow gages that exist or have existed on the Rio Grande are
listed below:
IBWC #08-3740.00 – Alamito Creek – 1932 to present
The gage at Alamito Creek is located approximately 0.2 miles upstream from its confluence with the Rio Grande.
The gage is situated on the left edge of the creek. The creek at this location is braided and the braid plain is
approximately 125 ft. wide. The gage resides downstream of a wider braided section that is greater than 800 ft.
wide.
Figure 3.2-2. Alamito Creek upstream from the FM 170 bridge.
IBWC #08-3472.00 – Rio Grande below Rio Conchos – 1900 to present
The Rio Grande below Rio Conchos gage is located 9 miles downstream from the Rio Conchos and just
downstream of the confluence with Alamito Creek. The gage is near the beginning of a bedrock narrow on the
downstream end of the Presidio Bolson This gage has a cableway and is located immediately upstream of a weir
that controls the water surface at the gage. The left bank at the gage consists of sloping concrete. The gage cross
section spans a wide flat floodplain approximately 750 feet wide that resides within a bedrock canyon. The
floodplain vegetation is predominantly bermuda grass (Cynodon dactylon) with tamarisk (Tamarix spp.) existing
on the wider portions of the floodplain.
Figure 3.2-3. Photos of the Rio Grande below Rio Conchos gage. Both photos taken from left bank and flow is from right to
left.
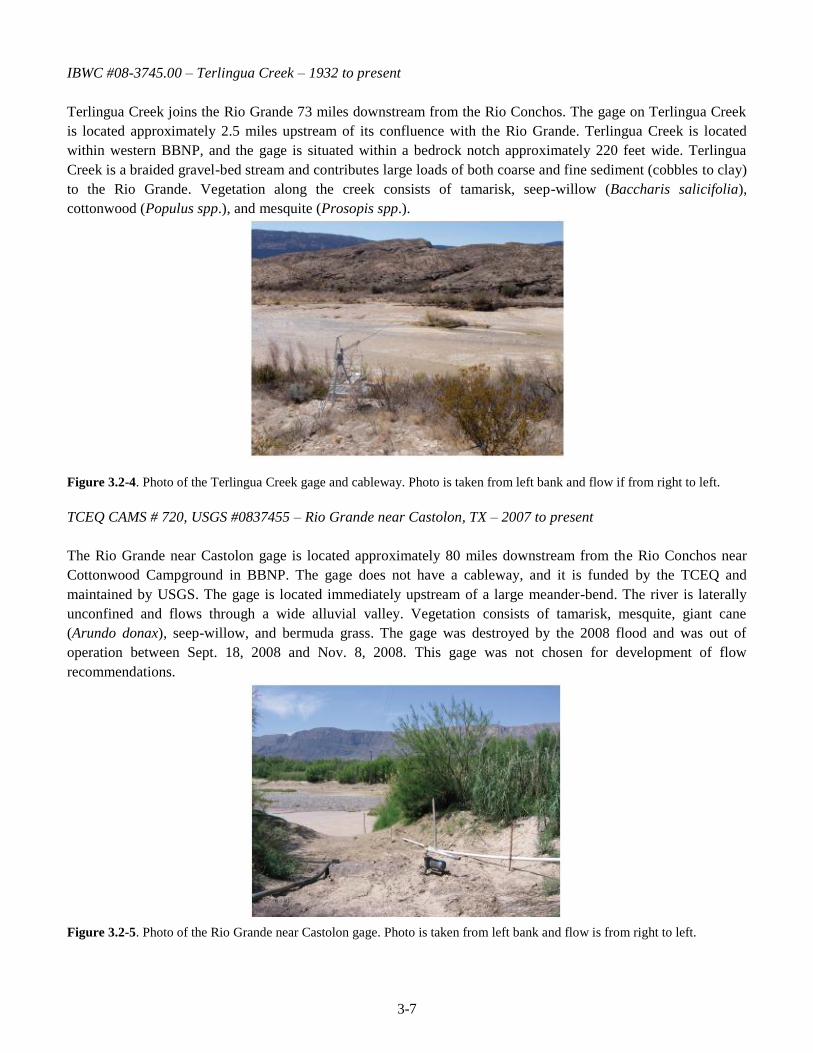
3-7
IBWC #08-3745.00 – Terlingua Creek – 1932 to present
Terlingua Creek joins the Rio Grande 73 miles downstream from the Rio Conchos. The gage on Terlingua Creek
is located approximately 2.5 miles upstream of its confluence with the Rio Grande. Terlingua Creek is located
within western BBNP, and the gage is situated within a bedrock notch approximately 220 feet wide. Terlingua
Creek is a braided gravel-bed stream and contributes large loads of both coarse and fine sediment (cobbles to clay)
to the Rio Grande. Vegetation along the creek consists of tamarisk, seep-willow (Baccharis salicifolia),
cottonwood (Populus spp.), and mesquite (Prosopis spp.).
Figure 3.2-4. Photo of the Terlingua Creek gage and cableway. Photo is taken from left bank and flow if from right to left.
TCEQ CAMS # 720, USGS #0837455 – Rio Grande near Castolon, TX – 2007 to present
The Rio Grande near Castolon gage is located approximately 80 miles downstream from the Rio Conchos near
Cottonwood Campground in BBNP. The gage does not have a cableway, and it is funded by the TCEQ and
maintained by USGS. The gage is located immediately upstream of a large meander-bend. The river is laterally
unconfined and flows through a wide alluvial valley. Vegetation consists of tamarisk, mesquite, giant cane
(Arundo donax), seep-willow, and bermuda grass. The gage was destroyed by the 2008 flood and was out of
operation between Sept. 18, 2008 and Nov. 8, 2008. This gage was not chosen for development of flow
recommendations.
Figure 3.2-5. Photo of the Rio Grande near Castolon gage. Photo is taken from left bank and flow is from right to left.

3-8
IBWC #08-3750.00 – Rio Grande at Johnson’s Ranch – 1936 to present
The Rio Grande at Johnson’s Ranch is located approximately 98 miles downstream from the Rio Conchos. The
gage resides within a small canyon approximately 315 feet wide. The gage is mounted on bedrock cliff, and a
floodplain is inset into the canyon wall on the right side of the river. Although the gage is situated within bedrock,
the river generally flows through a wide alluvial valley. Vegetation is dominated by tamarisk, giant cane, and
bermuda grass.
Figure 3.2-6. Photo looking downstream at the Johnson’s Ranch gage.
TCEQ CAMS # 721, USGS #0837530 – Rio Grande at Rio Grande Village, Big Bend NP, TX – 2007 to present
The Rio Grande at Rio Grande Village gage is located approximately 148 miles downstream from the Rio
Conchos. The gage resides at the downstream end of Hot Springs Canyon near Daniel’s Ranch. The gage does not
have a cableway, and it is funded by the TCEQ and maintained by USGS. The left bank consists of a mixed
bedrock and colluvial hillslope. The right bank consists of alluvium. Downstream of this gage, the river flows
through a wide alluvial valley before entering Rio Grande Village on the Texas side. The Mexican community of
Boquillas is approximately three miles downstream. This gage was not chosen for development of flow
recommendations.
Figure 3.2-7. Photo taken above Rio Grande at Rio Grande Village gage. Gage house is in the bottom center on the hillslope
above the irrigation pump house. Gage cross section is at the bottom edge of the photo.

3-9
IBWC #08-3772.00, TCEQ CAMS # 759, – Rio Grande at Fosters Ranch – 1961 to present
The Rio Grande at Foster’s Ranch gage is located upstream of Amistad Reservoir just east of the Terrell-Val Verde
county line. This gage has a cable way over a weir. The CAMS station is funded by TCEQ and maintained by
USGS. The right bank is alluvium and the left bank has been altered to buttress the weir with heavy rock with a
concrete stairway.
Figure 3.2-8. Foster's Weir.
3.2.1.2 Pecos River Gaging Stations
USGS 08412500 – Pecos River near Orla – 1938 to present.
The Pecos River near Orla gage is located at the Farm Road 652 Bridge. The river here flows through a wide
alluvial floodplain.
Figure 3.2-9. Photo of the Pecos River near Orla gage. Both Pictures were taken from the right bank. Flow is from left to right.
Photo credit: Zhuping Sheng, Texas AgriLife Research.
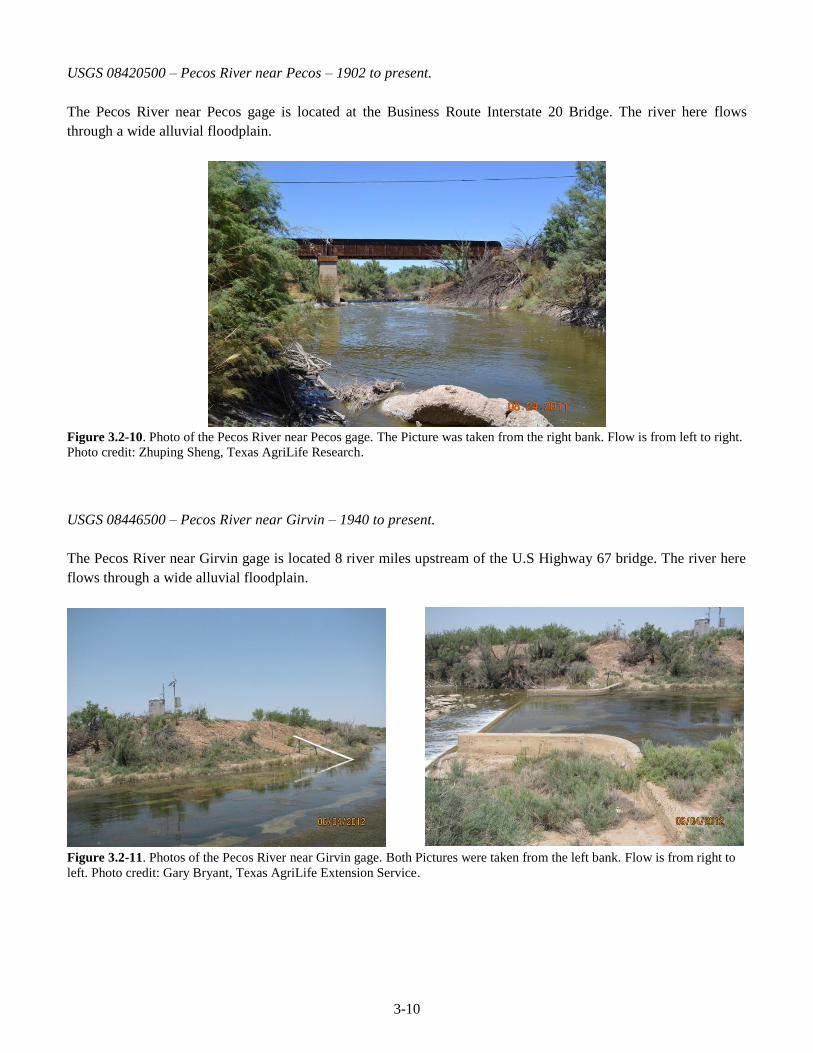
3-10
USGS 08420500 – Pecos River near Pecos – 1902 to present.
The Pecos River near Pecos gage is located at the Business Route Interstate 20 Bridge. The river here flows
through a wide alluvial floodplain.
Figure 3.2-10. Photo of the Pecos River near Pecos gage. The Picture was taken from the right bank. Flow is from left to right.
Photo credit: Zhuping Sheng, Texas AgriLife Research.
USGS 08446500 – Pecos River near Girvin – 1940 to present.
The Pecos River near Girvin gage is located 8 river miles upstream of the U.S Highway 67 bridge. The river here
flows through a wide alluvial floodplain.
Figure 3.2-11. Photos of the Pecos River near Girvin gage. Both Pictures were taken from the left bank. Flow is from right to
left. Photo credit: Gary Bryant, Texas AgriLife Extension Service.

3-11
USGS 08447020 – Independence Creek near Sheffield – 1975 to present.
The Independence Creek near Sheffield gage is located on Independence Creek just above the confluence of
Independence Creek and the Pecos River. The river here flows through a wide gravelly bottomed floodplain.
.
Figure 3.2-12. Photos of the Independence Creek gage. The pictures were taken from the center of the Creek and the left bank.
Flow is away from the photographer. Photo credit: TPWD and TNC.
USGS 08447300 – Pecos River at Brotherton Ranch near Pandale – 2008 to present.
The Pecos River near Girvin gage is located 19 river miles downstream of the confluence of the Pecos River and
Independence Creek. The river here flows through a wide bedrock channel with steep canyon walls.
Figure 3.2-13. Photo of the Pecos River at Brotherton Ranch near Pandale gage. The pictures were taken from the center of the
river. Flow is moving away from the photographer. Photo credit: TPWD.

3-12
IBWC 08-4474.10 – Pecos River near Langtry – 1968 to present.
The Pecos River near Langtry gage is located 13 river miles upstream of the U.S Highway 90 bridge. The river
here flow through a wide bedrock channel with steep canyon walls.
Figure 3.2-14. Photos of the Pecos River near Langtry gage. The picture was taken from the right bank. Flow is from left to
right. Photo credit: Zhuping Sheng, Texas AgriLife Research.

3-13
3.2.1.3 Devils River Gaging Stations
IBWC #08-4490.00, USGS 08449000, TCEQ CAMS 0768 – Devils River at Baker’s Crossing near Juno/Devils
River near Juno – 1926-1949 and 1963-1972 (USGS), 2005 to present (IBWC), 2008-present (TCEQ-water
quality)
The Devils River at Baker’s Crossing near Juno gage is located downstream of the state Highway 163 bridge
roughly 10 miles downstream from the headsprings of the Devils River and 35 miles upstream of the Pafford’s
Crossing gage. The river here has a wide bedrock channel with little floodplain and is constrained by steep canyons.
Figure 3.2-15. Photos of the Devils River near the Juno/Baker’s Crossing gage. Both photos taken from left bank and flow is
from right to left. Photo credit: Christine Kolbe, TCEQ.
IBWC #08-4494.00 – Devils River at Pafford’s Crossing – 1960 to present (IBWC)
The Devils River at Pafford’s Crossing gage is located at the Pafford’s Crossing weir dam roughly 4 miles
upstream from the upper end of the Devils River arm of Lake Amistad. This gage is approximately 45 miles
downstream from the headsprings of the Devils River and 21 miles upstream of the confluence with the Rio
Grande, now under Lake Amistad. The river here has a wide, flat bedrock channel and a well-developed, but
narrow floodplain that is constrained by steep canyons. The gage exists within the Amistad National Recreation
Area managed by the National Park Service.
Figure 3.2-16. Photo of the Devils River at the Pafford’s Crossing gage. Photo is taken from right bank and flow is from left to
right. Photo credit: US Geological Survey.
3-14
3.3 Hydrology-based environmental flow regime methods
Based on data availability and requirements for flow regime assessment, a total of thirteen sites were selected for
HEFR assessment. There are five sites along the Rio Grande, namely Rio Grande below Rio Conchos, Johnson’s
Ranch, Fosters weir, Alamito Creek, and Terlingua Creek. There are six sites along the Pecos River, Pecos River
near Orla, Pecos River at Pecos, Pecos River near Girvin, Independence Creek at Sheffield, Pecos River at
Brotherton near Pandale, and Pecos River at Langtry. There are two sites along the Devils River, namely Devils
River at Pafford Crossing and Devils River at Juno.
The general approach for the hydrologic assessment is to assign each day of the hydrologic record to a specific flow
component. Hydrographic separation uses a time-series record of stream flow to derive a base flow signature. The
method for assessing the variations in hydrology in conjunction with HEFR analyses is the Indicators of Hydrologic
Alteration (IHA).
The IHA method separates the flow data into five fundamental characteristics of hydrologic regimes: the
magnitude, time, frequency, duration, and rate of change in water conditions. Before running an analysis,
environmental flow component parameters were established for each stream gage including high and low flow
separation, high flow pulse and flood definition, and extreme low flow conditions (Figure 3.3-1).
All flows that are below the 25th percentile of daily flows for the period of record are classified as low flows and
only provide the ecological functions associated with base flows. The 25th percentile is the lower limit for high flow
pulses. Similarly, all flows that exceed the 75th percentile of daily flows for the period of record are classified as
high flows and only provide ecological functions associated with high flow pulses. The 75th percentile is the upper
limit for base flows. Specific calibration parameters were established for the identification of high flow pulses
between the 25th and 75
th percentile levels. High flow pulses start when flow increases by more than 50% per day
and end when flow decreases by less than 10% per day.
Overbank flows were defined in IHA as an initial high flow with a peak flow greater than 99.8% of the daily flows
for the period; however, some of the resulting data was revised to best fit each river system. The overbank threshold
for each river changes over time. In particular, flooding on the Rio Grande is difficult to predict based on IHA
parameters because the stream channel has been drastically altered over the past half century (see Section 3.6.1.1
and 3.6.1.3).
Extreme low flows or subsistence flows represent infrequent, naturally occurring low flow events. They were
classified in IHA as an initial low flow (base flow) below 10% of daily flows for the period.
HEFR models require a continuous period of record for calculation. Three of the selected gages have missing data.
The gages at Rio Grande below Rio Conchos, Independence Creek, and Devils River near Juno have gaps of 17, 17,
and 14 years, respectively. In order to use all available records, the dates were rearranged to create a consecutive
time line. For example, a gap in data occurs from 1914 to 1931 for the Rio Grande below Rio Conchos gage.
Measured data on March 1, 1931 was assigned to March 1, 1914 to create a continuous data run without seasonal
shifting. Similar shifts were performed for Independence Creek and the Devils River near Juno. The results of
shifting the dates can lead to a sporadic increase or decrease in flow and possible fluctuations between high flow
pulses and base flow, but this type of event is insignificant during long periods of record.

3-15
Originally, a HEFR analysis was run for the full period of record at each gage; however, specific adjustments were
made to change the seasons and periods of record to better inform the results. The seasons and periods of record
chosen are described below.
Figure 3.3-1. An IHA analysis showing the revised environmental flow components.
3.3.1 Flow Components
Subsistence Flows
Subsistence flows are infrequent low flows that result in deposition, encroachment of vegetation, restricted aquatic
habitat, elevated temperatures and constituent concentrations, and maintain adequate levels of dissolved oxygen.
Subsistence flows were calculated in HEFR by averaging the lowest 5% of base flows for non-zero flows only. A
calculated subsistence flow is created for each seasonal analysis. The results can be redefined based on further
consideration of geomorphology, biology, and water quality data as is the case for the gages at Rio Grande below
Rio Conchos near Presidio and Rio Grande at Johnson’s Ranch.
Base Flows
Base flow is the average flow condition for the river. It maintains the ground water table and provides soil moisture,
flow variability, diversity of habitats, suitable aquatic habitats, connectivity along channel corridors, and suitable
in-channel water quality. Base flow recommendations levels for HEFR analyses use 25th, 50
th, and 75
th percentiles.
These base flow components are separated into dry, average, and wet periods, respectively. HEFR divides these
3-16
components based on reservoir capacity. The percentile values provide variability within and between years in base
flow conditions and vary by season.
High Flow Pulses
High flow pulses provide a short duration, high flow increment. They benefit the geomorphology of streams by
transporting sediment downstream, preventing the encroachment of riparian vegetation, and rejuvenating habitat.
They also provide recruitment events and purges for organisms, connectivity to near-channel water bodies, and
restoration of in-channel water quality after low flow periods.
High flow pulses in HEFR were divided into frequencies. This approach defines the high flow pulse episodic events
by evaluating the duration (days), volume (acre-ft), and peak flow (ft³/s ). The URG BBEST decided on five sets of
frequencies for high flow pulses: 1 per 2 years, 1 per year, 1 per 2 seasons, 1 per season, and 2 per season. Not all
sets of frequencies were used for environmental flow recommendations, and those instances are fully described in
Section 4.
In some cases, it is difficult for IHA hydrographic separation method to distinguish multiple episodic events. If
flow remains above the 75th percentile for all flows or if flow from a storm event decreases sharply and abruptly
increases from a subsequent storm event, IHA is unable to distinguish the two events. However, HEFR is able to
make the distinction using the multipeaks multiplier option. It is designed to split the long high flow pulses into
multiple discrete episodic events for statistical calculations. This setting measures any sharp increase in flow,
greater than 50% of the flow, directly after an episodic event, so it causes the termination of the first episodic event
and the initiation of the new episodic event. The multipeaks multiplier option was set at 2.
Overbank Flows
Overbank flows, a sub-set of high flow pulses, were created for infrequent elevated flows that exceed the channel
capacity. They provide lateral channel movement, floodplain maintenance, recharge of floodplain water tables,
formation of new habitats, distribution of organic material into the channel, deposition of nutrients in the
floodplain, new life phase cues for organisms, diversity of riparian vegetation, conditions for seedling development,
connectivity to floodplain, and restoration of water quality to floodplain waters. Overbank flow frequencies are set
at 1 per 5 years for all HEFR analyses. The multipeaks multiplier was also set at 2.
3.3.2 Seasons
An integral part of base flow separation for HEFR is defining the seasonal variations. West Texas differs from the
rest of the state because of the arid climate; therefore, seasons were defined accordingly. HEFR analyses were
analyzed for three seasons: 1) winter months (November – February) when stream flow is typically on a declining
trajectory following the monsoonal high flows, and when few precipitation inputs occur, 2) Spring (March – June)
when stream flow is often at its lowest levels, but which also overlaps with the historic spring snowmelt flows from
the upper Rio Grande, 3) Monsoon season (July – October) when stream flow is high due to the accumulation of
water from changes in atmospheric circulation and precipitation.

3-17
3.3.3 Period of Record
HEFR results can change significantly if separate time frames are used for the analyses. The URG BBEST chose
the period of record for each gage based on careful consideration of historical impacts such as upstream
impoundments, human interactions, biology, and climate variability. Table 3.3-1 describes the historical data
analyzed by HEFR for each stream flow gage. A more in-depth discussion of the period of record chosen for the
Rio Grande gages is given in sections 3.6.1.2.
Table 3.3-1. Streamflow gage period of record.
Sub-Basin Site Name Period of Record
Rio Grande Alamito Creek 1/1/1932 to 12/31/2009
Rio Grande Rio Grande below Rio Conchos near Presidio 1/1/1901 to 2/28/1914 and
3/1/1931 to 12/31/1967
Rio Grande Terlingua Creek 1/1/1932 to 12/31/2009
Rio Grande Rio Grande at Johnson’s Ranch 1/1/1936 to 12/31/1967
Rio Grande Rio Grande at Foster’s Weir 1/1/1962 to 12/31/2009
Pecos River Pecos River near Orla 1/1/1938 to 12/31/2009
Pecos River Pecos River near Pecos 1/1/1902 to 12/31/1935
Pecos River Pecos River near Girvin 1/1/1939 to 12/31/2011
Pecos River Independence Creek near Sheffield 1/1/1975 to 6/30/1985 and
7/1/2000 to 12/31/2009
Pecos River Pecos River near Langtry 1/1/1967 to 12/31/2010
Devils River Devils River near Juno 1/1/1936 to 2/28/1949 and
3/1/1931 to 12/31/1972
Devils River Devils River at Pafford’s Crossing 1/1/1960 to 12/31/2009

3-18
3.4 Biological Overlay Methods
There are multiple aspects of the relationships of Upper Rio Grande basin flow regimes to the biology and ecology
of its rivers. These include dependencies of instream, riparian and floodplain biological communities to subsistence,
base, high flow pulses and overbank flows. Many of these key functions and their relationships to the various
environmental flow components are outlined in Table 3.1-1. These relationships also vary among the three Upper
Rio Grande sub-basins and the specific approaches to describing them and utilizing available information in a
biological overlay are described in sub-basin specific sections below (Section 3.6.3 Rio Grande sub-basin, Section
3.7.3 Pecos River sub-basin and Section 3.8.3 Devils River sub-basin). We also include recommendations in
Section 5 on adaptive management for additional biological overlay items that we were not able to accomplish with
available time and data.
3.4.1 Fishes of the Upper Rio Grande Basin and Instream Habitat Modeling in the Pecos and Devils River Sub-
basins
One important aspect of the flow biology of Upper Rio Grande Basin rivers is the maintenance of instream habitats for
fishes, primarily by base flows and subsistence flows. This is an important factor for all rivers of the basin, but
particularly with the ground water fed streams of the Pecos and Devils River sub-basins. To ensure that we make flow
recommendations that would be expected to maintain sufficient instream habitat for these locations, we modeled flow-
habitat relationships using available fish habitat utilization data and river cross-section data gathered as part of the
BBEST process. This section outlines the methods used to accomplish this, including compiling a list of Rio Grande
basin fishes, selecting focal species for habitat analysis and our modeling approach and methods.
A fish species list for the upper Rio Grande Basin was compiled using literature (Hoagstrom 2003, Kollaus and
Bonner 2012, Harrell 1978, Cantu and Winemiller 1997, Suttkus and Jones 2006, Valdes Cantu and Winemiller
1997, Bonner et al. 2005, Watson 2006, Moring 2005), the Fishes of Texas Database (vouchered museum collections;
http://www.fishesoftexas.org/about), existing taxonomic works (Texas Freshwater Fishes,
http://www.bio.txstate.edu/~tbonner/txfishes/), and TPWD collections (Garrett 2000-2004, Bean 2012). After
correcting for taxonomic synonyms, a total of 73 fish species (54 for the Rio Grande, 50 for the Pecos and 45 for the
Devils) were recorded for the basin from these sources (Table 3.4-1). Native status and distribution is difficult to
determine for many species; presumed native status is noted for each species in each of the three upper Rio Grande
sub-basins.
Table 3.4-1. Fish species list for the Upper Rio Grande Basin BBEST area. shown are the sub-basins in which each species
occurs; with each species noted as Native or Introduced in the indicated sub-basin. Focal species for flow-habitat modeling (see
text for description) are in bold. Et = extirpated from Texas, E = presumed extinct and R=reintroduced.
Scientific name Common name Rio Grande Pecos River Devils River
Scaphirhynchus platorynchus Shovelnose Sturgeon Native-Et
Atractosteus spatula Alligator Gar Native-Et Native Native
Lepisosteus oculatus Spotted Gar Native Native Native
Lepisosteus osseus Longnose Gar Native Native Native
Anguilla rostrata American eel Native-Et Native-Et Native-Et
Dorosoma cepedianum Gizzard Shad Native Native Native
Dorosoma petenense Threadfin Shad Introduced Introduced
Campostoma anomalum Central Stoneroller Native Native
Campostoma ornatum Mexican Stoneroller Native
Cyprinella lutrensis Red Shiner Native Native

3-19
Scientific name Common name Rio Grande Pecos River Devils River
Cyprinella lutrensis blairi Maravillas Red Shiner Native-E
Cyprinella proserpina Proserpine Shiner Native Native
Cyprinella venusta Blacktail Shiner Introduced Introduced Native
Cyprinus carpio Common Carp Introduced Introduced Introduced
Dionda argentosa Manantial Roundnose Minnow Native Native
Dionda diaboli Devils River Minnow Native
Dionda episcopa Roundnose Minnnow Native
Hybognathus amarus Rio Grande Silvery Minnow Native-R Native-Et
Macrhybopsis aestivalis Speckled Chub Native Native
Notropis amabilis Texas Shiner Native Native
Notropis braytoni Tamaulipas Shiner Native Native
Notropis buchanani Ghost Shiner Native
Notropis chihuahua Chihuahua Shiner Native
Notropis jemezanus Rio Grande Shiner Native Native
Notropis orca Phantom Shiner Native-E Native-E
Notropis simus pecosensis Pecos Bluntnose Shiner Native-Et
Notropis simus simus Bluntnose Shiner Native-E
Notropis stramineus Sand Shiner Native Native
Pimephales promelas Fathead Minnow Introduced Introduced
Pimephales vigilax Bullhead Minnow Introduced Native Native
Rhinichthys cataractae Longnose Dace Native
Carpiodes carpio River Carpsucker Native Native Native
Cycleptus elongatus Blue Sucker Native Native
Ictiobus bubalus Smallmouth Buffalo Native Native Native
Ictiobus niger Black Buffalo Introduced
Moxostoma austrinum West Mexican Redhorse Native
Moxostoma congestum Gray Redhorse Native Native Native
Astyanax mexicanus Mexican Tetra Native Native Native
Ameiurus melas Black Bullhead Native
Ictalurus furcatus Blue Catfish Native Native Native
Ictalurus lupus Headwater Catfish Native-Et Native Native
Ictalurus punctatus Channel Catfish Native Native Native
Ictalurus sp. Chihuahua catfish Native
Pylodictis olivaris Flathead Catfish Native Native Native
Menidia beryllina Inland Silverside Introduced Introduced Introduced
Fundulus grandis Gulf Killifish Introduced
Fundulus zebrinus Plains Killifish Introduced Native
Lucania parva Rainwater Killifish Native
Gambusia affinis Western Mosquitofish Native Native Native
Gambusia amistadensis Amistad Gambusia Native-E
Gambusia gaigei Big Bend Gambusia Native
Gambusia geiseri Largespring Gambusia Introduced Introduced
Gambusia senilis Blotched Gambusia Native-Et
Gambusia speciosa Tex-Mex Gambusia Native
Cyprinodon eximius Conchos Pupfish Native Native

3-20
Scientific name Common name Rio Grande Pecos River Devils River
Cyprinodon pecosensis Pecos Pupfish Native
Cyprinodon variegatus Sheepshead Minnow Introduced
Morone chrysops White Bass Introduced Introduced
Morone saxatilis Striped Bass Introduced Introduced
Lepomis auritus Redbreast Sunfish Introduced Introduced
Lepomis cyanellus Green Sunfish Native Native Native
Lepomis gulosus Warmouth Native Native Native
Lepomis macrochirus Bluegill Native Native Native
Lepomis megalotis Longear Sunfish Native Native Native
Lepomis microlophus Redear Sunfish Introduced Introduced
Lepomis miniatus Redspotted Sunfish Native
Micropterus dolomieu Smallmouth Bass Introduced Introduced
Micropterus salmoides Largemouth Bass Native Native Native
Pomoxis annularis White Crappie Introduced
Etheostoma grahami Rio Grande Darter Native Native Native
Aplodinotus grunniens Freshwater Drum Native Native Native
Cichlasoma cyanoguttatum Rio Grande Cichlid Native Native Native
Oreochromis aureus Blue Tilapia Introduced Introduced Introduced
Total Introduced 13 10 10
Total Native, Extant 32 36 33
Total Native, Extinct 4 1 0
Total Native, Extirpated 4 3 2
Reintroduced 1 0 0
Total 54 50 45
3.4.1.1 Focal Fish Species Selection
One key decision point discussed by the BBEST prior to the habitat modeling process was whether to generate models at
the scale of guilds (i.e. groups of species assigned to the same habitat type) or individual focal species. We chose to
generate models for individual focal species and not generalize to guilds for two primary reasons. First, the guild
approach is often useful when incorporating and interpreting results for a large number of species. Using the guild
approach, the lack of individual species-level results may be outweighed by reduced complexity that facilitates
interpretation on a more general level. However, the fish community is not highly diverse in upper Rio Grande basin
streams so most mesohabitat guilds would only contain one or two species, and interpreting species-specific results is not
overly challenging given the number of models needing to be examined. Second, many of our species of interest use
multiple habitat types, particularly when all life-history stages are considered together, making discrete classification of
species into a single habitat guild problematic. By examining individual species models, our analyses therefore explore
potential habitat suitability across the naturally heterogeneous landscape that each species is exposed to and may
potentially utilize under different flow conditions, without making assumptions about guild classifications.
Based on available data of species distributions, ecological life-history and best professional judgment, the BBEST
and experts from TPWD and Texas State University evaluated and selected candidate focal species such that
several different habitat types were represented, most habitat types were represented by multiple species, and the
diversity of life-history variation in fish species was well represented. We selected 10 focal species for each of our
habitat modeling sites (our approach to site selection is described below in Section 3.4.1.3), though the species were

3-21
not the same across sites (Table 3.4-2). Table 3.4-2 indicates the habitat usage of each selected focal species; we
included at least two species with a primary or secondary preference for each mesohabitat type. Selection of the focal
species also considered their suitability for use in monitoring responses at the fish community level under an
adaptive environmental monitoring and management program.
All of the selected focal species are consistent components of the basin’s fauna and encompass the key ecological and
life-history gradients present at the three sites identified for analyses. Some species of ecological significance such as
Conchos pupfish (Cyprinodon eximius) at the Devils River and various Gambusia species at each site were not
included in this analysis because they are not highly flow-dependent, at least in terms of habitat parameters (depth,
velocity) that our modeling approach analyzes. It is also important to note that other species of ecological importance
were excluded when sufficient data on habitat affinities were not available. The most notable species in this category
is headwater catfish (Ictalurus lupus) which does have habitat flow dependencies, but for which data are limited
primarily because of unknown genetic purity of specimens collected in habitat studies though we were able to include
it for one of the three sites.
Table 3.4-2. Focal species for flow-habitat modeling, which sites they are focal species at and their mesohabitat affinities.
Primary and secondary mesohabitat preferences are indicated by large X’s and dark shading and small x’s and light shading,
respectively.
Focal Species Devils Indy Pecos Riffle Shallow
Run Deep Run
Shallow
Pool
Deep
Pool
Manantial roundnose minnow Yes Yes Yes x X x
Devils river minnow Yes X
Proserpine shiner Yes Yes Yes x X x
Texas shiner Yes Yes Yes x X x
Tamaulipas shiner Yes X x
Sand shiner Yes Yes X X X
Headwater catfish Yes X x x
Gray redhorse Yes Yes Yes X x x
Mexican tetra Yes Yes Yes X X
Largemouth bass Yes Yes Yes x x X
Longear sunfish Yes Yes Yes x x X x
Rio Grande darter Yes Yes Yes X X
Rio Grande cichlid Yes Yes Yes X
3.4.1.2 Fish Habitat Suitability Criteria
Suitability criteria generated from fish observations in a river system are typically used to quantify the range of
suitable depth, velocity, and substrate for target species and life stages. It is generally known that fish habitat use
changes with fish size, season, temperature, activity, habitat availability, presence and abundance of competitors
and predators, discharge, and changes between years (Orth, 1987; Shrivell, 1989; Heggenes, 1990; Shrivell, 1994;
Smith and Li, 1983; Bozek and Rahel, 1992; Everest and Chapman, 1972; Moore and Gregory, 1988; Modde and
Hardy, 1992).
Generation of suitability criteria is fraught with difficulties. Some of the most serious of these are constraints affecting
the size, timing, and quality of the sample data. These include biases in habitat availability, predation/ competition, low
abundance, sampling gear bias, etc. Regardless, practical data collection constraints dictate that suitability criteria are
generated from a limited number of fish observations over a small range of conditions.

3-22
We developed habitat suitability criteria individually for our focal species using existing fish habitat utilization
data. Datasets utilized were Kollaus and Bonner (2012) for the Devils River, Bean (2012) for the Devils River and
lower Pecos River, and Watson (2006) for Independence Creek. We also used data for gray redhorse (Moxostoma
congestum) from the Blanco River (Bean et al. 2007) because sufficient data were not available from our sites and
the Blanco River was judged to be the river most similar to our sites that had additional data available. We
considered using a site-specific approach to developing HSC’s, i.e., develop separate HSC’s for each species at
each site using only habitat utilization data from that site. However, we decided to develop one set of HSC’s for
each species using all data from the three sites due to concerns about site-specific data from the lower Pecos River
not being from the same site as the field cross-section measurements and the desire to have the same approach at
each site (i.e., not doing site-specific at only two of the three sites). As mentioned above, we also needed to add
additional data for gray redhorse to have a sufficient dataset to develop HSC’s. This was the only species for which
we used data outside of the three sites and outside of the upper Rio Grande basin.
To develop suitability criteria for depth and velocity, habitat data were divided into equal increments for depth and
velocity. We then developed criteria using nonparametric tolerance limits (NPTL; Bovee, 1986). Nonparametric
tolerance limits are an approach that sets multiple levels of habitat suitability scores based on break points in the
distribution of quantitative habitat data. We applied NPTL's based on the central 50%, 75 %, 90 %, and 95 % of the
data at the 0.95 confidence level. Tolerance limits for the central 50 % of the data were used as cutoffs for the most
utilized habitat and the range of data between these two points was given a suitability of one. Data between the
50 % tolerance limits and the 75 % tolerance limits was given a suitability of 0.5. Data between the 75 % tolerance
limits and the 90 % tolerance limits was given a suitability of 0.2, and the data between the 90 % tolerance limits
and the 95 % tolerance limits received a suitability of 0.1. data points falling outside the 95 % tolerance limits were
considered outliers and given a suitability of zero.
BBEST members, agency staff, other experts and our contractor then reviewed and refined the initial NPTL results
to adjust for bias and other factors affecting the habitat utilization data. Depth and velocity criteria for several
species were adjusted from initial NPTL results based on best professional judgment. For several deep water
species (e.g., largemouth bass) we extended the range of 0.5 depth suitability to all depths greater than 1 foot. We
did not develop substrate criteria from field data in the database. To develop substrate criteria all substrate sizes
were given an initial suitability of 1.0, which we then lowered for substrate classes that we believe to be less
suitable or unsuitable for the focal species. For example, for riffle-oriented species such as Rio Grande darter
(Etheostoma grahami) silt was given a suitability of 0. Final HSC's for all focal species are in Appendix 3.4.
3.4.1.3 Fish Habitat Availability and Suitability Modeling
We utilized flow-habitat modeling in the biological overlay to answer the following questions:
1. Do the hydrology-based flow regime recommendations maintain sufficient instream habitat quality,
quantity and diversity that provide a sound ecological environment?
2. If they do not, what aspects of the flow regime need to be adjusted or modified to recommend
flows that will maintain instream habitats?
3. Does the flow-habitat analysis provide any justification for simplifying the flow regime (i.e.,
reducing number of base flow tiers) or provide any reason not to simplify when there are other
reasons to consider simplification?
The focus of this assessment was amount and quality of habitat provided during base and subsistence flows. Our
objective was to develop relationships between flow and instream habitat availability for focal species at a subset of
gages as a key component of the biological overlay. We used this analysis to evaluate flow recommendations
(hydrology-based HEFR outputs). Ultimately, we did use the analysis to modify some aspects of the HEFR-derived
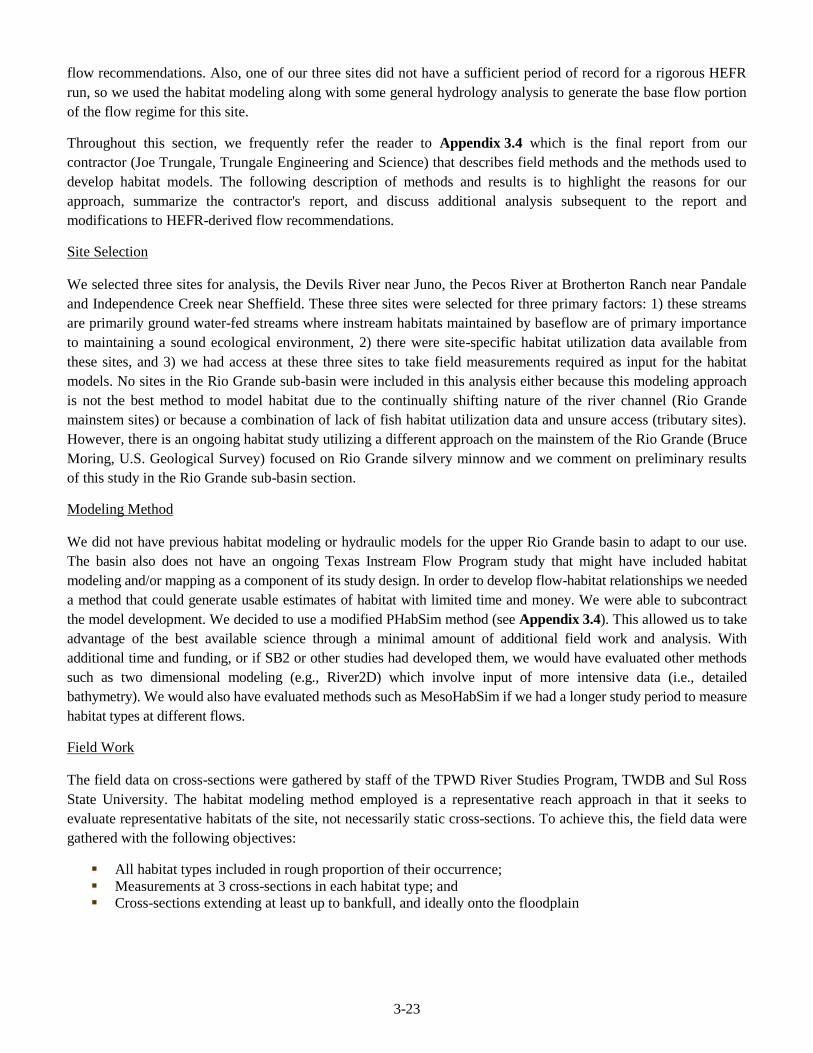
3-23
flow recommendations. Also, one of our three sites did not have a sufficient period of record for a rigorous HEFR
run, so we used the habitat modeling along with some general hydrology analysis to generate the base flow portion
of the flow regime for this site.
Throughout this section, we frequently refer the reader to Appendix 3.4 which is the final report from our
contractor (Joe Trungale, Trungale Engineering and Science) that describes field methods and the methods used to
develop habitat models. The following description of methods and results is to highlight the reasons for our
approach, summarize the contractor's report, and discuss additional analysis subsequent to the report and
modifications to HEFR-derived flow recommendations.
Site Selection
We selected three sites for analysis, the Devils River near Juno, the Pecos River at Brotherton Ranch near Pandale
and Independence Creek near Sheffield. These three sites were selected for three primary factors: 1) these streams
are primarily ground water-fed streams where instream habitats maintained by baseflow are of primary importance
to maintaining a sound ecological environment, 2) there were site-specific habitat utilization data available from
these sites, and 3) we had access at these three sites to take field measurements required as input for the habitat
models. No sites in the Rio Grande sub-basin were included in this analysis either because this modeling approach
is not the best method to model habitat due to the continually shifting nature of the river channel (Rio Grande
mainstem sites) or because a combination of lack of fish habitat utilization data and unsure access (tributary sites).
However, there is an ongoing habitat study utilizing a different approach on the mainstem of the Rio Grande (Bruce
Moring, U.S. Geological Survey) focused on Rio Grande silvery minnow and we comment on preliminary results
of this study in the Rio Grande sub-basin section.
Modeling Method
We did not have previous habitat modeling or hydraulic models for the upper Rio Grande basin to adapt to our use.
The basin also does not have an ongoing Texas Instream Flow Program study that might have included habitat
modeling and/or mapping as a component of its study design. In order to develop flow-habitat relationships we needed
a method that could generate usable estimates of habitat with limited time and money. We were able to subcontract
the model development. We decided to use a modified PHabSim method (see Appendix 3.4). This allowed us to take
advantage of the best available science through a minimal amount of additional field work and analysis. With
additional time and funding, or if SB2 or other studies had developed them, we would have evaluated other methods
such as two dimensional modeling (e.g., River2D) which involve input of more intensive data (i.e., detailed
bathymetry). We would also have evaluated methods such as MesoHabSim if we had a longer study period to measure
habitat types at different flows.
Field Work
The field data on cross-sections were gathered by staff of the TPWD River Studies Program, TWDB and Sul Ross
State University. The habitat modeling method employed is a representative reach approach in that it seeks to
evaluate representative habitats of the site, not necessarily static cross-sections. To achieve this, the field data were
gathered with the following objectives:
All habitat types included in rough proportion of their occurrence;
Measurements at 3 cross-sections in each habitat type; and
Cross-sections extending at least up to bankfull, and ideally onto the floodplain

3-24
It was not possible to get multiple repeated field measurements of hydrology and hydraulics to strengthen the stage-
discharge rating and the hydraulics model due to time limitations. Obtaining additional sets of field measurements
of hydraulics should be a priority for adaptive management (see Section 5) and ongoing refinement of flow
recommendations. This would strengthen model outputs and reduce uncertainty in velocities at the upper range of
modeled flow.
Modeling
Most of the details of the habitat modeling methodology are presented in Appendix 3.4. In addition to the report,
another final product from the contract was an MS Excel tool that contains the model as well as its inputs and outputs.
The tool also has control cells to enable further analysis using the models for each site. The main outputs for this tool
are curves of weighted usable habitat area (WUA) versus modeled flow for each species at each site. Weighted usable
area is an estimate of the area of usable habitat for a species based on its habitat suitability criteria (i.e. preferred
ranges of depth, velocity and substrate) and the habitat characteristics present at the site (see Appendix 3.4 for details
of how WUA is calculated from field data using the HSCs). The tool also has the capability to report the percent of
maximum WUA (% of Max) (i.e. the WUA produced at each modeled flow as a percent of the maximum WUA
produced by any flow in the range of flows analyzed), the percent of total habitat area at the site as suitable (% of
Total) and other measures. The controls in the spreadsheet allow analysis using subsets of habitat quality, different
flow recommendations (including periods of record and base flow levels), upper ends of percent of maximum WUA
analysis, and others. The remainder of this section reports on activities by the BBEST using the tool subsequent to
delivery by the contractors.
Analysis
In determining how to use the three site-specific models and the Excel tool provided by the contractors, we
addressed the following decision points.
Cross-Sections
The tool can report habitat data for all cross-sections combined or any subset of the cross-sections. Analysis by subsets
might be of particular use for species that are most likely to have most of their habitat in a particular habitat type (i.e.
pool, riffle or run) or portion (i.e. upstream or downstream) of the site. The agency staff and contractor classified each
cross-section as riffle, pool or run in the field. Of course, the classification of these cross-sections might change at
higher flows and the cross-sections are certainly not uniform (i.e. there are areas of riffle microhabitats in cross-
sections classified as runs). However, at the range of flows we are modeling it is likely that some species would have
more habitat in some cross-section types. For example, deep pool species such as largemouth bass are not likely to
have much habitat in cross-sections classified as riffles, even at higher base flows. So, the BBEST considered whether
to use WUA curves for all cross-sections or to utilize subsets for some species. We did all analysis for all species at all
cross-sections and 3 subsets: riffle, run, and pool. For evaluation and refinement of the flow regimes we used both the
totals for all cross-sections and subsets, with emphasis on the riffle and run subsets. Table 3.4-3 indicates which
cross-section subsets were utilized for decision-making for each focal species. For species with multiple subsets
indicated, the large X’s indicate which cross-section subsets were emphasized.
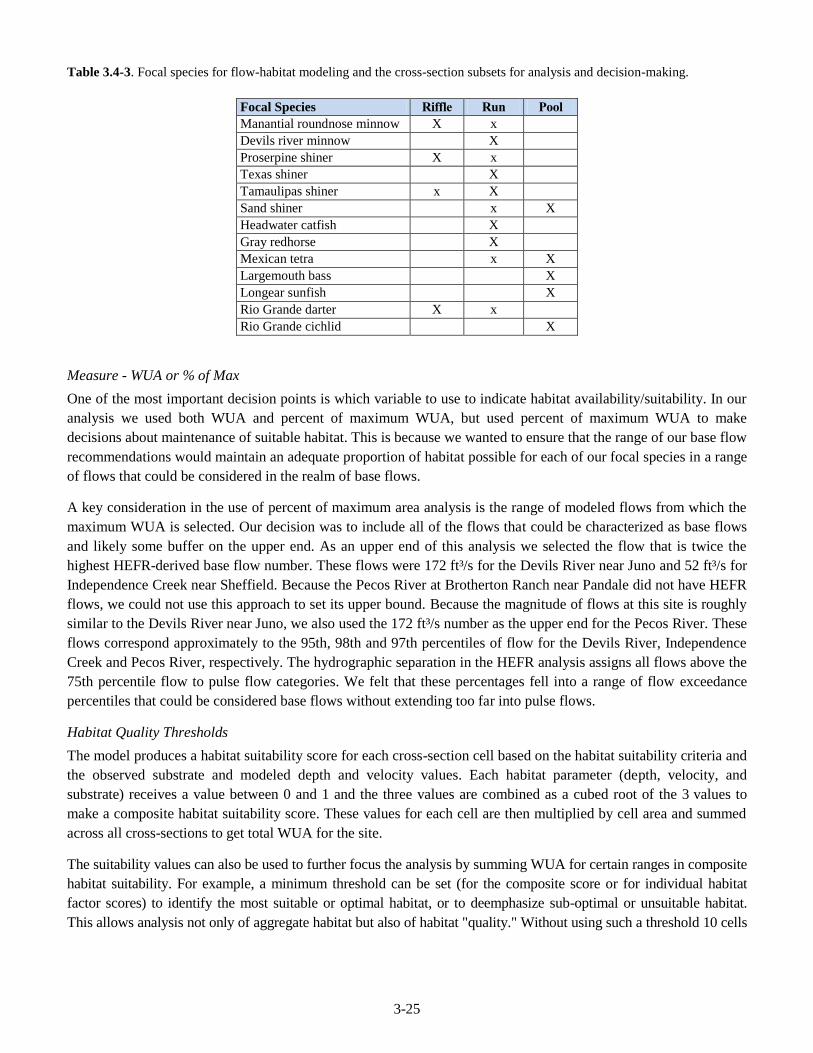
3-25
Table 3.4-3. Focal species for flow-habitat modeling and the cross-section subsets for analysis and decision-making.
Focal Species Riffle Run Pool
Manantial roundnose minnow X x
Devils river minnow X
Proserpine shiner X x
Texas shiner X
Tamaulipas shiner x X
Sand shiner x X
Headwater catfish X
Gray redhorse X
Mexican tetra x X
Largemouth bass X
Longear sunfish X
Rio Grande darter X x
Rio Grande cichlid X
Measure - WUA or % of Max
One of the most important decision points is which variable to use to indicate habitat availability/suitability. In our
analysis we used both WUA and percent of maximum WUA, but used percent of maximum WUA to make
decisions about maintenance of suitable habitat. This is because we wanted to ensure that the range of our base flow
recommendations would maintain an adequate proportion of habitat possible for each of our focal species in a range
of flows that could be considered in the realm of base flows.
A key consideration in the use of percent of maximum area analysis is the range of modeled flows from which the
maximum WUA is selected. Our decision was to include all of the flows that could be characterized as base flows
and likely some buffer on the upper end. As an upper end of this analysis we selected the flow that is twice the
highest HEFR-derived base flow number. These flows were 172 ft³/s for the Devils River near Juno and 52 ft³/s for
Independence Creek near Sheffield. Because the Pecos River at Brotherton Ranch near Pandale did not have HEFR
flows, we could not use this approach to set its upper bound. Because the magnitude of flows at this site is roughly
similar to the Devils River near Juno, we also used the 172 ft³/s number as the upper end for the Pecos River. These
flows correspond approximately to the 95th, 98th and 97th percentiles of flow for the Devils River, Independence
Creek and Pecos River, respectively. The hydrographic separation in the HEFR analysis assigns all flows above the
75th percentile flow to pulse flow categories. We felt that these percentages fell into a range of flow exceedance
percentiles that could be considered base flows without extending too far into pulse flows.
Habitat Quality Thresholds
The model produces a habitat suitability score for each cross-section cell based on the habitat suitability criteria and
the observed substrate and modeled depth and velocity values. Each habitat parameter (depth, velocity, and
substrate) receives a value between 0 and 1 and the three values are combined as a cubed root of the 3 values to
make a composite habitat suitability score. These values for each cell are then multiplied by cell area and summed
across all cross-sections to get total WUA for the site.
The suitability values can also be used to further focus the analysis by summing WUA for certain ranges in composite
habitat suitability. For example, a minimum threshold can be set (for the composite score or for individual habitat
factor scores) to identify the most suitable or optimal habitat, or to deemphasize sub-optimal or unsuitable habitat.
This allows analysis not only of aggregate habitat but also of habitat "quality." Without using such a threshold 10 cells

3-26
of 0.1 (marginal suitability) would score the same as one cell of equal area of 1.0 (maximum suitability). This may or
not be of concern depending on the objectives of the analysis.
We wanted to evaluate the range of habitat qualities for our focal species to determine any patterns in marginal,
suitable, and optimal habitat across the range of flows. We wanted to ensure that optimal or near-optimal habitat is
maintained for focal species by portions of flow recommendations that would meet those requirements. We analyzed
three ranges of habitat suitability: 0-0.5 marginal, 0.5-0.75 suitable, and 0.75-1.0 optimal to evaluate potential
minimum thresholds of 0.5 and 0.75. A variety of minimum quality thresholds have been utilized by other scientists.
The 0.5 and 0.75 (or the very similar 0.8) thresholds have been previously utilized in Texas by the Texas Instream
Flow Program in the Lower San Antonio River study (TIFP and SARA, 2011).
Weighted usable area and percent of maximum curves are presented for each species for a 0.5 threshold in the body of
the report and an example plot of four ranges of habitat quality (<0.5, 0.5-0.75, >0.75 and total) for one selected focal
species is included in each site’s results description. Tables summarizing the analysis using the 0.5 threshold are
presented in Sections 3.7.3 and 3.8.3. We evaluated trends in all 3 quality ranges, but based decisions on a minimum
threshold of 0.5.
"Enoughness" Thresholds
In evaluating the percent of maximum WUA results we needed to determine a minimum percentage that constitutes
sufficient habitat, i.e. an "enoughness" threshold. We evaluated several thresholds including 50 %, 70 %, 75 % and
90 %. We decided to use 75 % to evaluate each focal species' habitat and both 75 and 90 % to evaluate species of
conservation concern. We designated Devils River minnow, manantial roundnose minnow, Proserpine shiner,
Tamaulipas shiner, headwater catfish and Rio Grande darter as the species conservation concern for this analysis.
They were chosen because they are federal or state listed (threatened or endangered) species and/or (if not listed)
they are species of some conservation concern where maintenance of flow-dependent habitat plays a particularly
important role in the species conservation. Specifics of the criteria were as follows:
For species of conservation concern listed above: the Base-Low range needed to maintain at least 75 % in
at least one season in the cross-section subset(s) representing the species’ primary habitat preference(s) and
the Base-Medium needed to maintain at least 90 %, also in the cross-section subset(s) representing the
species’ primary habitat preference(s).
For other species: the Base-Medium numbers needed to maintain at least 75 % in at least one season in the
cross-section subset(s) representing the species’ primary habitat preference(s).
The habitat preferences used to define the focal cross-section subsets for each species are presented in Table 3.4-3.
Because one of the functions of subsistence flows is to provide at least a minimal amount of instream habitat we
also applied a 20 % of maximum threshold for subsistence flows.
Time Series Analysis and Attainment Frequencies
We used the historical record of flows at the three habitat modeling sites and time series of instream habitats using
the flow-habitat models. The goal of this analysis was to examine the habitat frequency curves for our focal species
and derive historical attainment frequencies of the 75 and/or 90 % of maximum WUA thresholds for each species at
each site. While the BBEST did not also use this analysis to examine example flow regime applications, this could
be used by the BBASC, TCEQ or other decision-makers to evaluate the effects of potential flow standards and/or
water management decisions. For example, one might determine that a given reduction (e.g., 10%) in the frequency
of attaining our minimum thresholds due to a management scenario being considered would be the maximum
sustainable to maintain a sound ecological environment. We present this analysis in the form of both graphs and
tables for all three sites, but it is noted that the numbers are based on a very short period of record (5 years) for the
Pecos site.
3-27
In generation of habitat attainment frequencies we only used the range of flows for which habitat modeling was
done (i.e. 1 to 500 ft³/s). This is because the extension of the curves beyond this range of flows cannot be done with
certainty. Therefore, flows in the time series over 500 ft³/s are not included in the attainment frequency analysis. In
other words, the resulting attainment frequencies are frequencies for the range of flows between 1 and 500 ft³/s and
not for the entire period of record.
Uncertainty and limitations of flow-habitat analysis
There are several areas of uncertainty in this flow-habitat analysis which affect its strength and may limit the
conclusions that can be drawn from this assessment. One primary area of uncertainty that should be addressed in
adaptive management is the modeling of hydraulics. Due to low flow conditions and the short timeline to complete
this work, we only have field data on depth and velocity from a single low flow between our subsistence and base
flow recommendations. As a result, our contractor was not able to evaluate the accuracy of the model’s
extrapolations to higher flows. More measurements of discharge and water surface elevation at our sites would also
allow development of site-specific stage-discharge ratings. This analysis relied on USGS ratings from the gage
locations which were proximal to the habitat study sites. However, the assumption that channel geometry and
pattern of response of water surface elevation to changing flows is a potential source of error and uncertainty and
may affect modeling results (see Appendix 3.4 for more discussion of this issue). A priority adaptive management
item would be to obtain more field hydraulics measurements at higher flows, ideally at least in the middle and
upper range of base flow recommendations, and to adjust hydraulics models accordingly.
A second area of uncertainty is the development of habitat suitability criteria. We had sufficient habitat data from our
sites for most of our focal species. However, we did have some species (e.g., headwater catfish, gray redhorse) with
limited data and also did not have data for different life history stages (i.e., juvenile vs. adults). In the adaptive
management phase, obtaining these data is one main area where the flow habitat analysis should be strengthened and
refined. Wherever possible, we should refine the criteria to include multiple life history stages and to include
spawning habitats for species with life histories particularly vulnerable to flow alteration. For example, spawning
habitats may be of particular concern for some species and for others juveniles and adults use distinctly different
habitats.
Another important factor for instream habitats that our analysis does not allow examination of is the spatial
arrangements of habitat across the site. This analysis only examines overall habitat area and does not include the
context of connectivity and patchiness of suitable habitat. In other words, our suitable habitat may be in small,
disconnected patches and higher or lower flows might be needed to connect or increase size of suitable habitat
patches. In order to address this, a habitat mapping approach such as a 2-dimensional model (e.g., River2D) or
MesoHabSim that produces a spatially explicit, continuous map of habitat at the site at multiple flow levels would
be necessary. This should be considered in the work plan.
Another obvious limitation to our analysis is that instream habitats were modeled only for fishes. Additional modeling
for mussels, benthic macroinvertebrates or other flow-sensitive biota would strengthen our certainty that our flow
recommendations would maintain the full suite of biota and a sound ecological environment. Including other taxa in
this analysis would only require gathering habitat utilization data or deriving suitability criteria from published
literature.
The transferability of this analysis to other sites in the upper Rio Grande basin cannot be explicitly reviewed because
we do not have modeling data for other sites. However, the overall conclusions regarding the maintenance of instream
habitats by hydrology-based flow regimes are reasonably consistent across the three study sites (see description of
analysis results in Sections 3.6.3 and 3.7.3). This provides some degree of confidence that the hydrology-based flow

3-28
regimes derived from least altered periods of flow record would also maintain habitats in other sites. An additional
work plan item would be to expand this analysis to other sites where maintenance of instream habitats is a primary
concern in maintaining a sound ecological environment. This should include consideration of this analysis at Alamito
and Terlingua Creeks in the Rio Grande sub-basin and potentially sites in the upper and middle Pecos River.
Results
Site-specific results of flow-habitat analysis are presented and briefly summarized with site-specific conclusions in
Sections 3.6.3 for the Pecos River and Independence Creek and in Section 3.7.3 for the Devils River. Graphs of
WUA and percent of Max WUA have vertical bars to illustrate where the hydrology-based flow recommendations
intersect the habitat curves. We show bars for the range (i.e. across the three seasons) of subsistence flows and the
three levels of base flows.
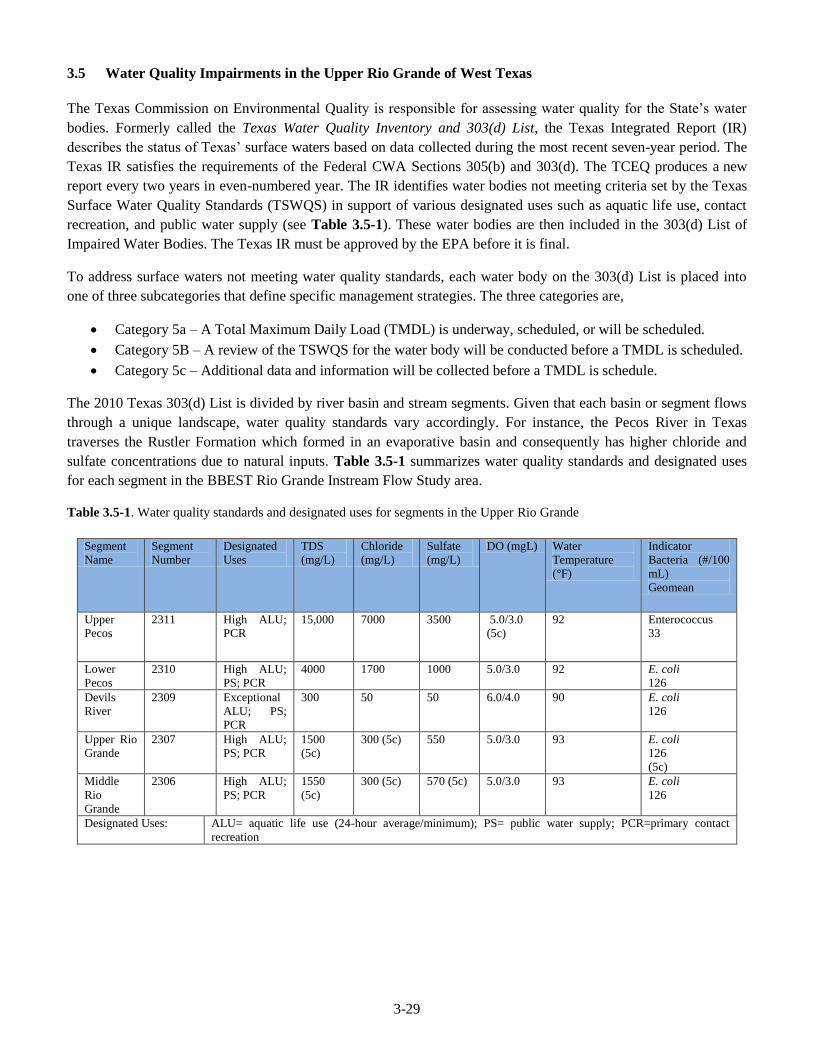
3-29
3.5 Water Quality Impairments in the Upper Rio Grande of West Texas
The Texas Commission on Environmental Quality is responsible for assessing water quality for the State’s water
bodies. Formerly called the Texas Water Quality Inventory and 303(d) List, the Texas Integrated Report (IR)
describes the status of Texas’ surface waters based on data collected during the most recent seven-year period. The
Texas IR satisfies the requirements of the Federal CWA Sections 305(b) and 303(d). The TCEQ produces a new
report every two years in even-numbered year. The IR identifies water bodies not meeting criteria set by the Texas
Surface Water Quality Standards (TSWQS) in support of various designated uses such as aquatic life use, contact
recreation, and public water supply (see Table 3.5-1). These water bodies are then included in the 303(d) List of
Impaired Water Bodies. The Texas IR must be approved by the EPA before it is final.
To address surface waters not meeting water quality standards, each water body on the 303(d) List is placed into
one of three subcategories that define specific management strategies. The three categories are,
Category 5a – A Total Maximum Daily Load (TMDL) is underway, scheduled, or will be scheduled.
Category 5B – A review of the TSWQS for the water body will be conducted before a TMDL is scheduled.
Category 5c – Additional data and information will be collected before a TMDL is schedule.
The 2010 Texas 303(d) List is divided by river basin and stream segments. Given that each basin or segment flows
through a unique landscape, water quality standards vary accordingly. For instance, the Pecos River in Texas
traverses the Rustler Formation which formed in an evaporative basin and consequently has higher chloride and
sulfate concentrations due to natural inputs. Table 3.5-1 summarizes water quality standards and designated uses
for each segment in the BBEST Rio Grande Instream Flow Study area.
Table 3.5-1. Water quality standards and designated uses for segments in the Upper Rio Grande
Segment
Name
Segment
Number
Designated
Uses
TDS
(mg/L)
Chloride
(mg/L)
Sulfate
(mg/L)
DO (mgL) Water
Temperature
(°F)
Indicator
Bacteria (#/100
mL)
Geomean
Upper
Pecos
2311 High ALU;
PCR
15,000 7000 3500 5.0/3.0
(5c)
92 Enterococcus
33
Lower
Pecos
2310 High ALU;
PS; PCR
4000 1700 1000 5.0/3.0 92 E. coli
126
Devils
River
2309 Exceptional
ALU; PS;
PCR
300 50 50 6.0/4.0 90 E. coli
126
Upper Rio
Grande
2307 High ALU;
PS; PCR
1500
(5c)
300 (5c) 550 5.0/3.0 93 E. coli
126
(5c)
Middle
Rio
Grande
2306 High ALU;
PS; PCR
1550
(5c)
300 (5c) 570 (5c) 5.0/3.0 93 E. coli
126
Designated Uses: ALU= aquatic life use (24-hour average/minimum); PS= public water supply; PCR=primary contact
recreation

3-30
3.6 Rio Grande
3.6.1 Hydrology-Based Environmental Flow Regimes
For the Rio Grande below the Rio Conchos, the Rio Grande at Johnson’s Ranch, and the Rio Grande at Foster’s
Weir, we performed HEFR analyses to help guide our understanding of the historic flow regime. However, we
employ a number of other hydrologic analyses to describe hydrologic processes that are overlooked by HEFR
analyses. For the Rio Grande, high flow pulses and overbank flows are specifically important because these are
the flows that guide the direction and rate of geomorphic change. Base flows and subsistence flows are also key
features of the flow regime because these flows directly relate to the available aquatic habitat and water quality.
Thus, the Rio Grande environmental flow recommendations include hydrologic analysis, a geomorphology and
water quality overlay. The geomorphology overlay relates to the high-flow pulse and overbank flow
recommendations, and the water quality overlay informs our base flow and subsistence flow recommendations.
There are also some scientific data pertaining to aquatic habitat for native fish species, however, these studies are
ongoing and thus do little to inform and decisions related to adjustments to HEFR outputs. Biological surveys of
fish and mussels populations can also assist with determinations of ecological soundness.
For Alamito and Terlingua Creeks, HEFR analyses were performed to understand the variability between low
flows (base and subsistence) and high flows (high flow pulses and overbank flows) and the magnitude of the high
flow pulses and overbank flows. Little is known about the physical, biological, or chemical processes that occur in
these creeks, therefore, we rely specifically on HEFR analyses for environmental flow recommendations. It must
be noted here that the HEFR prescribed “overbank flow” term is not directly applicable to Alamito and Terlingua
Creeks. These creeks are braided, and thus, channel bank delineation is a subjective process, and specifying
discharges that inundate these banks is difficult. Thus, in the context of these creeks, “overbank flow” simply
refers to large flows of a 1-5 year recurrence interval.
3.6.1.1 Instream flow regimes and flow regime components
An initial flow table describing instream flow components was presented in Table 3.1-1. However, flow
components of the Rio Grande can be further classified based on the discharge, duration, source area of runoff, and
the geomorphic processes that occur. Thus, modifications to the general flow component table (Table 3.1-1) based
specifically for the Rio Grande are described below and summarized in Table 3.6-1.
1) Subsistence flows – Minimum stream flow to maintain tolerable water quality. Subsistence flows are
generally maintained by ground water in puts in the lower reach. In the upper reach, subsistence
flows are dependent on return flows.
2) Base flows – long duration low flows with discharge maintaining either a flat or gently sloping
trajectory. Base flows are generally driven by a combination of ground water inputs and irrigation
or municipal return flow from the lower Rio Conchos, or the Presidio irrigation district. Base
flows transport little or no sediment.
3) High flow dam releases (HFDR) – HFDR are generally higher than 350 ft³/s, most often in the range
of 1,500 to 5,000 ft³/s and occur when water is released from Luis L. Leon Dam on the Rio
Conchos. HFDR can occur any time of the year and are generally for the sole purpose of
delivering water to Amistad Reservoir. HFDR occasionally occur, however, when reservoir
storage needs to be created behind Luis L. Leon Dam in anticipation of high flow inputs from the
upper Rio Conchos basin. Dam releases occur for long durations, generally 5 days or more, and
rarely overtop the banks of the channel on the Rio Grande. These floods transport fine sediment

3-31
(Dean et al., 2011b, unpublished data), yet little data exists as to whether these flows are capable
of reorganizing gravel deposits on the channel bed.
4) Flash floods – These floods are short duration and variable in discharge. Discharge may be anywhere
between 200 and 20,000 ft³/s or more, and these floods last from less than 12 hours to a few days.
Flash floods generally occur on ephemeral tributaries during monsoon season, and contribute a
large proportion of sediment to the Rio Grande. Because of the short duration and high sediment
loads of flash floods, they are ineffective at eroding banks and reorganizing material on the
channel bed, and instead, cause channel narrowing and vertical floodplain accretion because
sediment is deposited in low-velocity areas along the channel margins, on top of channel bars, or
on the floodplain (Dean and Schmidt, 2011; Dean et al., 2011a).
5) Channel resetting floods – These flows occur during the monsoon season and originate in the Rio
Conchos watershed, are greater than 35,000 ft³/s, and occur for longer than a week in duration.
These floods were common in the early part of the 20th century, however, now they only occur
when tropical storms in the Sierra Madre Occidental deliver large amounts of precipitation to the
Rio Conchos watershed and overwhelm the capacity of Rio Conchos reservoirs. Since the 1950s,
these floods have only occurred 5 times (1958, 1978, 1990, 1991, and 2008) and are referred to as
“channel resetting” floods because they erode accumulating sediment, uproot channel margin
vegetation, and cause channel widening throughout the length of the river corridor
The flows that constitute the present flow regime described above have shown to be ineffective at maintaining a
sound ecological environment above La Linda, MX because this regime has failed to maintain key habitat such as
gravel bars free of fine sediment, backwaters and side-channels, and has failed to sufficiently transport enough
sediment downstream to prevent progressive channel narrowing. The primary cause of this is because there has
been a shift in the ratio of large, long-duration floods that move sediment and erode accumulating sediment, to
short-duration flash floods that contribute sediment and cause channel narrowing and vertical floodplain accretion.
The frequency of short-duration flash floods is governed by the storm frequency over ephemeral watersheds, and
is thus a given boundary condition of both the present and the past stream flow regimes. The frequency of long-
duration high flows (i.e. HFDR and channel-resetting floods) is also determined by climatic conditions throughout
the basin, but it is also governed by the degree of water impoundment and irrigation diversions upstream. Given
that long-duration high flows also constitute the portion of the present flow regime that is known to provide key
geomorphic and ecological services, such as sediment transport and habitat rejuvenation, a large portion of our
environmental flow analyses for the Rio Grande focuses on these types of flows. High flows also promote sound
ecological function downstream from La Linda, MX, however, ground water inputs are also an important
component to the ecological environment, and thus, the downstream reach will be discussed in a different manner.
HEFR analyses segregate flows into four categories: overbank flows, high flow pulses, base flows, and
subsistence flows. For the Rio Grande, subsistence flows and base flows are the same as those described above.
High flow pulses and overbank flows, however, include high flow dam releases, flash floods, and channel
resetting floods. For the purposes of HEFR analyses in this study, we characterize channel-resetting floods as
overbank flows that occur for long durations, and characterize HFDR and flash floods as high flow pulses which
may be short or long in duration, yet do not significantly inundate the floodplain. The above flows are summarized
in Table 3.6-1, which is adapted from the flow component table in Section 3 and specifically tailored to the
hydrology of the Rio Grande. This table specifically outlines different types of flow components. Additional
discussion of physical processes associated with these flows are included in the geomorphological overlay.
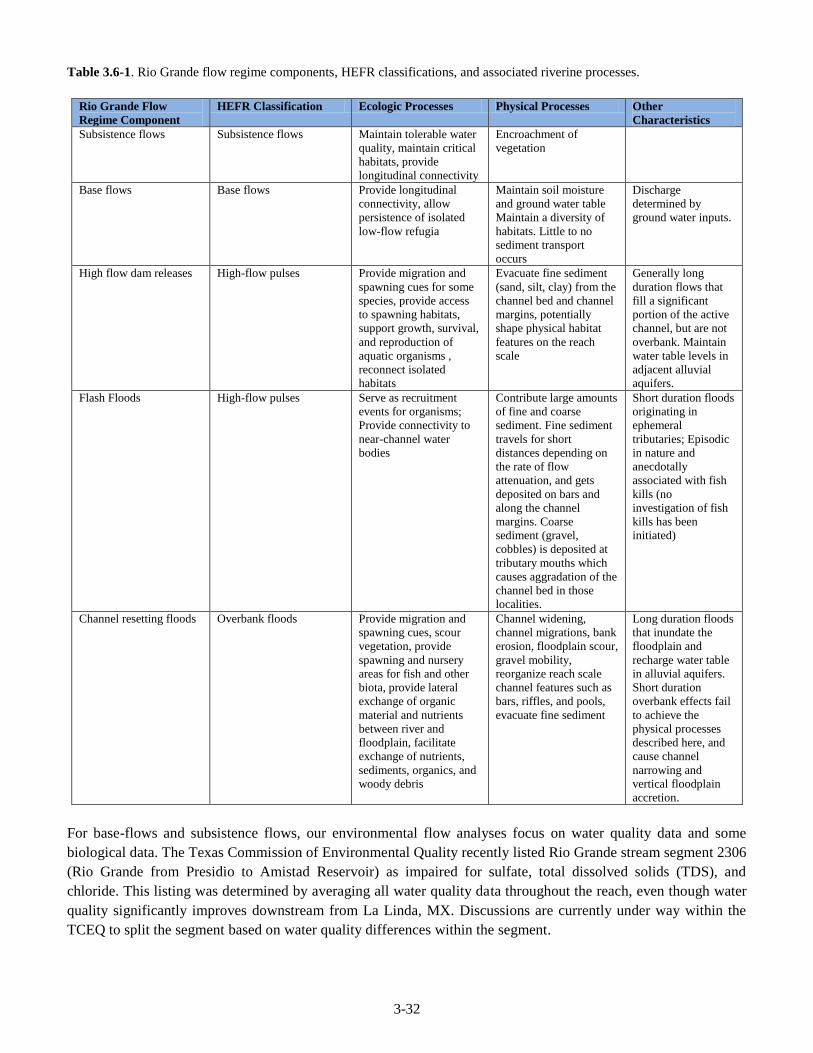
3-32
Table 3.6-1. Rio Grande flow regime components, HEFR classifications, and associated riverine processes.
Rio Grande Flow
Regime Component
HEFR Classification Ecologic Processes Physical Processes Other
Characteristics
Subsistence flows Subsistence flows Maintain tolerable water
quality, maintain critical
habitats, provide
longitudinal connectivity
Encroachment of
vegetation
Base flows Base flows Provide longitudinal
connectivity, allow
persistence of isolated
low-flow refugia
Maintain soil moisture
and ground water table
Maintain a diversity of
habitats. Little to no
sediment transport
occurs
Discharge
determined by
ground water inputs.
High flow dam releases High-flow pulses Provide migration and
spawning cues for some
species, provide access
to spawning habitats,
support growth, survival,
and reproduction of
aquatic organisms ,
reconnect isolated
habitats
Evacuate fine sediment
(sand, silt, clay) from the
channel bed and channel
margins, potentially
shape physical habitat
features on the reach
scale
Generally long
duration flows that
fill a significant
portion of the active
channel, but are not
overbank. Maintain
water table levels in
adjacent alluvial
aquifers.
Flash Floods High-flow pulses Serve as recruitment
events for organisms;
Provide connectivity to
near-channel water
bodies
Contribute large amounts
of fine and coarse
sediment. Fine sediment
travels for short
distances depending on
the rate of flow
attenuation, and gets
deposited on bars and
along the channel
margins. Coarse
sediment (gravel,
cobbles) is deposited at
tributary mouths which
causes aggradation of the
channel bed in those
localities.
Short duration floods
originating in
ephemeral
tributaries; Episodic
in nature and
anecdotally
associated with fish
kills (no
investigation of fish
kills has been
initiated)
Channel resetting floods Overbank floods Provide migration and
spawning cues, scour
vegetation, provide
spawning and nursery
areas for fish and other
biota, provide lateral
exchange of organic
material and nutrients
between river and
floodplain, facilitate
exchange of nutrients,
sediments, organics, and
woody debris
Channel widening,
channel migrations, bank
erosion, floodplain scour,
gravel mobility,
reorganize reach scale
channel features such as
bars, riffles, and pools,
evacuate fine sediment
Long duration floods
that inundate the
floodplain and
recharge water table
in alluvial aquifers.
Short duration
overbank effects fail
to achieve the
physical processes
described here, and
cause channel
narrowing and
vertical floodplain
accretion.
For base-flows and subsistence flows, our environmental flow analyses focus on water quality data and some
biological data. The Texas Commission of Environmental Quality recently listed Rio Grande stream segment 2306
(Rio Grande from Presidio to Amistad Reservoir) as impaired for sulfate, total dissolved solids (TDS), and
chloride. This listing was determined by averaging all water quality data throughout the reach, even though water
quality significantly improves downstream from La Linda, MX. Discussions are currently under way within the
TCEQ to split the segment based on water quality differences within the segment.

3-33
Investigations to determining the role of ground water in maintaining water quality with in the Rio Grande
conducted by the National Park Service and Sul Ross State University show improvements in water quality
downstream from Presidio, TX, at low flows, (Bennett and Cutillo, 2008). Biological investigations into
associations between algal communities and water quality are congruent with these studies (Porter and
Longley,2011) Water quality studies, TCEQ impairment listing show that a sound ecological environment does
not exist upstream from La Linda, MX.
HEFR analyses for Alamito and Terlingua Creeks are used for specifying environmental flows for each flow
component. There are water quality concerns for both of these creeks pertaining to high mercury levels (Smith et
al., 2010), however, much of this mercury is naturally derived from cinnabar deposits at the base of the Del Rio
formation. Mercury mining during the 19th and 20th centuries have undoubtedly caused increases in mercury
levels found in the creeks, however, there is little information as to how concentrations vary with stream flow or
other processes that affect mercury levels in these creeks. Therefore, a water quality overlay is not included, but is
discussed in the adaptive management section.
3.6.1.2 Period of Record
Over the last century, there has been a general trend of declining stream flow on the Rio Grande, although this
trend was interrupted by large runoff in the 1980s and early 1990s (Figure 3.6-1). These general patterns are
caused by cyclical climatic periods of wet years and drought, the ever-increasing irrigation withdrawals upstream
of this study reach, and the control of flood flow by large dams upstream. The largest dams include La Boquilla
Dam (closed 1916), Francisco I. Madera (closed 1947), Luis L. Leon Dam (closed 1967), all on the Rio Conchos,
and Elephant Butte Dam on the Rio Grande (closed 1916).
Figure 3.6-1. Total annual stream flow volume for the Rio Grande below the Rio Conchos, Johnson’s Ranch, and Foster’s
weir. 10-year running averages are shown.
The driest periods on record occurred in the late 1940s and 1950s, and the late 1990s and 2000s. Both periods
were typified by regional drought, and the later period was additionally affected by withdrawals for irrigated
agriculture. The onset of large-scale ecosystem changes began in this initial drought period of the late 1940s and

3-34
1950s (Dean and Schmidt, 2011). Total stream flow increased in the 1970s and 1980s, however, the closure of
Luis L. Leon Dam in 1967 effectively removed all flood flows originating in the Rio Conchos headwaters from
the Rio Grande hydrology. The exceptions were the largest floods occurring during tropical storms when reservoir
capacity was exceeded (1978, 1990, 1991, and 2008) (Figure 3.6-2). Thus, after the closure of Luis L. Dam, there
was a shift in the ratio of large, long-duration floods coming from the Rio Conchos to short-duration flash floods
from ephemeral tributaries.
Figure 3.6-2. Annual peak mean daily discharge for the Rio Grande below the Rio Conchos, Johnson Ranch, and Foster’s
weir. 10-year running averages are shown.
The hydrologic shift in flood source is apparent when flood magnitude and flood duration are analyzed in concert.
To investigate this pattern, we calculated the annual cumulative discharge that exceeded 15,467 ft³/s (i.e.
ft³/s*days >15,467), which is the average annual flood over the period of record for the Rio Grande below the Rio
Conchos gage (Figure 3.6-3). Thus, small spikes on this graph depict flows that exceeded this threshold for short
periods of time, and large spikes depict flows that exceeded this threshold for long periods of time. This graph
shows that since the closure of Luis L. Leon Dam, only the largest floods driven by tropical storms in the Rio
Conchos basin exceed this threshold for any significant duration. The plot shows that downstream of the
confluence of the Rio Conchos, runoff from many ephemeral tributaries can still produce floods that exceed this
threshold, although they are short lived. Average floods from ephemeral tributaries in the upper section of the
study reach rarely, if ever, exceed the discharge of 15,467 ft³/s.
Based on the patterns described above, the period of record for HEFR analyses at the below the Rio Conchos gage
and the Johnson’s Ranch gage consists of all data prior to the closure of Luis L. Leon Dam, in 1967. This period is
believed to correspond to the above vision of a sound ecological environment, because it included an ecologic
assemblage containing the full suite of native species, and a physical template that consisted of a large width to
depth ratio, the presence of numerous in-channel bars, backwaters, and side-channels. All of these geomorphic
features are deemed necessary for the survival of the native aquatic species. For the gage at Foster’s weir, the
entire dataset from 1962 to present was used partly, because there is a lack of data prior to the closure of Luis L.
Leon Dam, and partly because ground water inputs and occasional moderate to large floods from tributaries
alleviate the problems of fine sediment loading, and water quality that occur in the upstream section of the reach.

3-35
Figure 3.6-3. Plot showing ft³/s days greater than the average annual flood at the Rio Grande below the Rio Conchos of 15,467
ft³/s. This metric combines both flood magnitude and duration. Note that downstream from the Rio Conchos, there are
occasional moderate to large floods that occur at the Johnson’s Ranch and Foster’s weir gage caused by tributary inputs.
HEFR analyses for Alamito and Terlingua Creeks use the entire periods of record, from 1932 to present. Analyses
were conducted in this manner because there is little knowledge concerning historical variation or historical
anthropogenic impacts to stream flow during this period.
3.6.1.3 HEFR application
HEFR analyses provide a reasonable approach for identifying past hydrologic trends. On dynamic systems where
geomorphic and ecologic conditions rapidly change, however, results from HEFR analyses may be unreasonably
applied without sound understanding of the physical and ecological processes that occur. For the Rio Grande, we
describe the results of the HEFR analyses for overbank and high-flow pulses, and contrast those results with the
present understanding of the geomorphic processes that are known to occur. Summaries of the results from the
HEFR analyses are shown in Table 3.6-2. This table shows the discharge and duration statistics for the below Rio
Conchos and Johnson Ranch gages prior-1967, and for the Foster’s Weir gage between 1962 and 2010. We also
included HEFR analyses for the Johnson Ranch gage between 1980 and 1989, which was a period characterized
by high stream flow, and 1992-2007, which is the driest period of record. Additionally, in parentheses, are the 5-
year, 2-year, and 1-year discharges and the flow duration calculated from the mean daily discharge data for the
same periods. The 5-year, 2-year, and 1-year were calculated using the Weibull plotting position of the annual
peak mean daily discharge data. These data are included in Table 3.6-2 because they provide a means for
comparing the HEFR analyses to other simple statistics typically used in hydrologic analyses. The below
discussion of HEFR results and additional hydrologic analyses focus on the Rio Grande below the Rio Conchos
and Johnson’s Ranch gages because these gages exist in a reach deemed unsound. Stream flow is much higher at
the Foster’s Weir gage because of ground water inputs and additional flash floods from large ephemeral
tributaries.

3-36
Table 3.6-2. HEFR results for Rio Grande at the below Rio Conchos, Johnson’s Ranch, and Foster’s Weir gages for selected
time periods.
Gage HEFR Overbank flow, 1
per 5 year
(mean daily data
comparison)
HEFR high flow pulse, 1
per 2 year
(mean daily data
comparison)
HEFR high flow pulse 2,
1 per year
(mean daily data
comparison)
Rio Grande
below Rio
Conchos (1900-
1967-pre-dam)
34,010 ft³/s (32,327) 17,090 ft³/s (10,488) 9,500 ft³/s (1,441)
21 to 79 days (0.7) 13 to 48 days (8.1) 9 to 31 days (85.3)
Rio Grande
below Rio
Conchos (1980-
1989)
12610 ft³/s (12,164) 10,310 ft³/s (10,312) 8,970 ft³/s (<2,140)
9 to 69 days (0.2) 7 to 58 days (0.6) 7 to 52 days (62.8)
Rio Grande
below Rio
Conchos (1992-
2007)
9,076 ft³/s (7,881) 7,310 ft³/s (4,738) 5,721 ft³/s (<1,733)
7 to 41 days (0.5) 6 to 37 days (4.6) 6 to 32 days (20.2)
Rio Grande at
Johnson’s Ranch
(1936-1967 – pre-
dam)
30,690 ft³/s (22,521) 15,720 ft³/s (11,737) 9,500 ft³/s (<1,938)
16 to 57 days (1.5) 10 to 37 days (5.9) 7 to 26 days (46.8)
Rio Grande at
Johnson’s Ranch
(1980-1989 –
wet)
18,190 ft³/s (15,327) 12,400 ft³/s (10,128) 9,747 ft³/s (<4,626)
12 to 86 days (0.4) 9 to 67 days (1.1) 8 to 57 days (12)
Rio Grande at
Johnson’s Ranch
(1992-2007 - dry)
14,270 ft³/s (12,996) 11,160 ft³/s (9,323) 8,052 ft³/s (<1,861)
6 to 24 days (0.3) 6 to 21 days (1.3) 5 to 17 days (24)
Rio Grande at
Foster’s Weir
(1962-2010)
24,190 ft³/s (25,249) 12,710 ft³/s (10,912) 9,394 ft³/s (<2,458)
13 to 61 days (0.86) 8 to 38 days (4.3) 6 to 30 days (50.1)
*Note: numbers in parentheses are flood recurrence intervals and flow duration statistics for same
periods. Flood statistics are discharges of 5, 2, and 1-year recurrence intervals calculated using the
Weibull plotting position for peak mean daily discharges for the indicated periods. Flow duration
statistics are in days
The results of the HEFR analyses show similar findings to those presented in Figure 3.6-1-Figure 3.6-3, with
significant reductions in stream flow occurring after the closure of Luis L. Leon Dam in the upstream half of the
study reach. Even during the wet decade of the 1980s, the 1 per 5 year and 1 per 2 year floods are significantly
less than prior to 1967. Comparisons of HEFR results for the periods before 1967 and during 1992-2007 are even
more striking. Prior to 1967 at the below Rio Conchos, HEFR analyses show a 1 in 5 year flood to be 34,010 ft³/s ,
while the 1992 to 2007 1 in 5 year flood was 9,076 ft³/s. At the Johnson Ranch gage, the 1 in 2 year flow was
15,720 ft³/s prior to 1967, with a duration of 10 to 37 days. Between 1992 and 2010, a flow of this magnitude was
exceeded just three times, one of which was the 2008 channel-resetting flood. With the exception of the 2008 flood,
a flow of 15,720 was only exceeded for a total duration of 3 days during this period.
Comparison of the HEFR analyses and the additional statistics regarding flood flow magnitudes and durations
show that HEFR analyses over-predict both the flood magnitude and duration of the overbank and high flow

3-37
pulses. The greatest differences are for the 1 per year high flow pulses. The HEFR 1 per year pulse if often 4 to 8
times greater than the 1-year recurrence interval flood based on the peak mean annual discharge data. For
example, during the driest period of record at the Johnson’s Ranch gage (1992-2007), HEFR results show a 1-per
year high flow magnitude of 8,052 ft³/s, whereas the 1-year flood from the peak mean annual discharge data is less
than 1,861 ft³/s. Based on flow duration analyses using the mean daily discharge data, the HEFR 1 per year high
flow magnitude of 8,052 ft³/s only lasted approximately 1.8 days; much smaller than the 5 to 17 days obtained
from the HEFR regression statistics. For these reasons, the HEFR results are helpful for understanding historic
hydrologic trends, however, we believed that HEFR inaccurately represents some aspects of the high-flow regime.
The difference between the pre-1967 HEFR analyses and flood statistics from the 1992-2007 HEFR results and
flood statistics exemplifies the magnitude of hydrologic alteration that has occurred over the last 50 years. Thus,
even though the pre-1967 hydrologic data correspond to a sound ecological environment, the simple comparison
of the present and past flow regimes highlights that recommending environmental flow targets outlined by the pre-
1967 HEFR results is completely unreasonable, and potentially impossible. Instead, the results of the pre-1967
HEFR analyses should be viewed as the flows required for complete geomorphic restoration of the upper Rio
Grande. Below we discuss the key physical riverine processes that are understood, and rely heavily upon our
geomorphic understanding to guide our environmental flow recommendations for high-flow pulses and overbank
flows.
HEFR analyses for Alamito and Terlingua Creeks show that stream flow of Terlingua creek is generally higher
than Alamito Creek for all flow components. Subsistence flows for Terlingua Creek range from 1.1 to 1.4 ft³/s,
and are 0.71 ft³/s for Alamito Creek. The 1 in 5 year flow for Terlingua creek is 5,933 ft³/s and is 2,469 ft³/s for
Alamito Creek. The 1 in 5 year flow for Terlingua creek is roughly half of the long-term 2 year flood on the Rio
Grande.
3.6.2 Water Quality Overlay
The Rio Grande in west Texas is divided into two segments, the Upper Rio Grande, Segment 2307, is from El
Paso to the confluence with the Rio Conchos. The Middle Rio Grande runs from the confluence with the Rio
Conchos to the upstream end of Amistad Reservoir just below Foster’s Weir.
Irrigation withdrawal in the Upper Rio Grande Basin coupled with long-term drought throughout northern Mexico
and the southern Rockies has put pressure on an already over-appropriated basin. The end result is increasing
dissolved solids concentrations in the Rio Grande above Amistad Reservoir (Segment 2306). Spring-water inflow
has maintained reduced TDS concentrations in the lower portion of Segment 2306 (Lower Canyons Reach).
However, the lack of consistent flow in the upper half of Segment 2306 (Park Reach) and input from Segment
2307 and possibly the Rio Conchos has resulted in increasing and variable dissolved solids concentrations.
Segment 2307 has been listed as impaired for bacteria, chloride, and total dissolved solids since 1996.
Historically, Segment 2306 has fully supported the assigned water quality standards for TDS, chloride, and sulfate
because of spring flow. The TSWQS require the averaging of chloride, sulfate, and TDS data across the entire
segment. Higher salinity levels in the upper portion are masked when data from the lower portion of Segment
2306 are included in the average. However, an increasing trend in dissolved solids concentrations has resulted in
this water body failing to attain the water quality standards for TDS, chloride, and sulfate for the first time.
Segment 2306 was included on the 2010 303(d) Impaired Waters List for chloride, sulfate and total dissolved
solids in 2010.

3-38
For this reason the TCEQ is currently considering creating a new stream segment in the TSWQS to better reflect
water quality and flow in these two stream reaches. The data review is still ongoing. The recommended segment
boundaries are,
“Rio Conchos confluence in Presidio County to Tornillo Creek in Brewster County" — flow is highly
dependent on dam releases and experiences periods of very low flow.
“From Tornillo Creek in Brewster County to Ramsey Canyon in Val Verde County” —stable base flow is
maintained by spring input.
An indication of the potential effects of elevated dissolved solids was observed downstream of Santa Elena
Canyon. Several toxicity tests were run on samples collected downstream of Santa Elena Canyon. In 1995, a
sample collected by TCEQ downstream of Santa Elena Canyon caused sub-lethal effects on the water flea
Ceriodaphnia dubia. In 2001-2002 a toxicity project conducted by TCEQ collected four samples at Santa Elena
Canyon that also caused sub-lethal effects on C. dubia. The suspected cause was elevated dissolved solids but this
was not confirmed. This location was also noted in the biological summary as having a benthic community
dominated by a single tolerant species of black fly.
Other parameters included in the TSWQS for Segment 2306—pH, temperature, and DO—meet water quality
standards and are considered fully supporting in the 2010 Texas IR.
Figure 3.6-4 illustrates a relationship between flow and total dissolved solids for four stations along the Rio
Grande. Regression equations best explain the observed variability for the stations below the Rio Conchos and
above the reach with significant spring flow. Generally speaking high flows are associated with more dilute waters.
Figure 3.6-5 depicts TDS through time for the same four stations showing an increasing trend. The modeled
relationship best explains the variability for the stations below the Rio Conchos and above the spring fed reach. For
the upper three stations, TDS concentrations are about the standard.

3-39
Figure 3.6-4. Total dissolved solids are plotted against flow for four stations along the Rio Grande, from Bennett et al., 2012.

3-40
Figure 3.6-5. TDS plotted through time for four stations: Rio Grande above Rio Conchos, Rio Grande below Rio Conchos ,
Rio Grande at Santa Elena Take Out, and Rio Grande at Foster’s Weir, from Bennett et al., 2012.

3-41
3.6.3 Biology Overlay
Biological data used in the preparation of this report was gathered from various sources including published peer
reviewed articles, agency reports, conference proceedings, and regional, state and federal environmental databases.
These data are used to evaluate the condition and extent of aquatic communities (fish, benthic macroinvertebrates,
and freshwater mollusks) in a hydrologic context whenever possible.
The URG is one of the most remote stream segments in Texas and is therefore one of the least studied segments.
This segment is defined as 2306 in the Texas Surface Water Standards (TSWQS). At 318 miles, with significant
geochemical, hydrological and ecological gradients, this segment can be described as two different stream reaches.
For the purposes of the report, the Lower Canyons Reach (La Linda, MX to the headwaters of Amistad Reservoir)
has stable base flows provided by ground water inputs and increased flood pulses due to larger watershed inputs.
The Parks Reach (Rio Conchos to La Linda, MX) is highly dependent on dam releases which results in a more
regulated hydrograph. The Parks Reach is vulnerable to periods of very low flow and sections that go dry under
certain conditions. The TCEQ is currently considering creating a new stream segment in the TSWQS to better
reflect water quality and flow in these two stream reaches. The boundary between the two new stream segments
may not coincide with the two reaches described here.
The biological information used in the report is focused primarily on the upper 140 miles of river. The URG
BBEST has determined that the upper reach above La Linda, Coahuila, MX is unsound due to water quality issues,
an absence of native mussel populations, and a depauperate benthic macroinvertebrate population. The upstream
portion is partly lined by state and federal park lands and is accessible by roads. The downstream reach is not
serviced by any paved roads between La Linda, MX and Amistad Reservoir, a distance of over 100 river miles.
Few backcountry roads exist within this reach with the exception of roads within the Black Gap Wildlife
Management Area just downstream of La Linda and an access road to Foster’s Weir just upstream of Amistad
Reservoir. Any studies conducted within this lower reach are generally dependent on boat travel.
3.6.3.1 Background
The Rio Grande can be divided into two branches. The northern branch drains the southern Rocky Mountains in
Colorado and New Mexico and much of the western half of New Mexico. The northern branch is affected by
hydrologic modifications intended to divert water for irrigation and municipal uses. The Water Convention of May
21, 1906 provided for the distribution of water to the US and Mexico within the international reach of the Rio
Grande between the El Paso-Juarez Valley and Fort Quitman, TX. Water diversions in El Paso and Juarez typically
block the majority of flow from the northern branch. These diversions and long-term drought throughout northern
Mexico, the desert southwest, and the southern Rockies in the U.S. continues to put extreme pressure on an already
over-appropriated basin.
The southern branch drains the Sierra Madres Occidental in Chihuahua, MX. This branch can provide greater than
80% of the flow entering the URG reach via the Rio Conchos.
Consequently, primary focus of this report is to summarize the available biological data and to develop a biological
context to be used in conjunction with hydrological based methods for developing instream flow recommendations.
3.6.3.2 Hydrology, Geomorphology and Habitats.
Because of upstream diversions and flow controls, the Big Bend reach of the Rio Grande is plagued by a cyclic
accumulation of sediment which fills backwater areas, side channels, pools, and gravel bars with fine sediment all

3-42
resulting in the narrowing of the river channel. In addition, more subtle shifts in grain size from fine sand and small
gravel to large gravel and cobble in riffles and rapids is impacting habitat use and availability for imperiled native
species (Heard et al, 2012, Garrett, unpublished report). Channel narrowing is occasionally interrupted by long-
duration floods induced by tropical storms, often called “reset events” (see Section 2.6.1). In between reset events
the available aquatic habitat constantly changes with the accumulation of sediment and the resulting reduction in
channel width. The development of floodplains inset into the channel cover near shore habitats, steepen banks and
decrease width-to-depth ratios. Large gravel and cobble substrates, especially in riffles and at tributary mouths,
have replaced small gravel and sand. The channel narrowing process is amplified by the exotic giant cane (Arundo
donax) and saltcedar (Tamarix spp.) which line the banks and invade the channel, anchoring sediment and making
it even harder for the river to flush sediment downstream.
Fish abundance and distribution respond to variations in flow and habitat availability (Poff, et al, 1997). The USGS
completed a biological assessment (Moring, 2002) in which five study reaches were established on the Rio Grande
in and near Big Bend National Park. Moring interpreted differences in stream habitat condition and riparian
vegetation as being related to differences in surface geology among the five reaches. In the most upstream reach,
Colorado Canyon in Big Bend Ranch State Park, igneous rock predominates and stream-bed material is larger.
Steeper and rockier banks provide for less diverse and dense riparian vegetation than the other four reaches that
were bounded by limestone or Quaternary gravel terraces. Habitat variables such as slope, sinuosity, velocity,
depth, width and riparian vegetation were measured and reported. Of the five sites, only one, Santa Elena, is
associated with a large tributary and Moring reported the greatest number of fish species and individuals at this site,
illustrating the importance of tributary flows on hydrologic variability and maintenance of habitat heterogeneity.
Replicated sampling and mapping of these areas through the following decade would likely have revealed intra-site
variability related to channel sedimentation and narrowing. A more recent USGS study of habitat associated with
the reintroduction of the Rio Grande Silvery minnow is not yet complete.
Heard et. al, (2012) reported that imperiled species only comprise 4% of the total fish community, a drastic decline
in relative abundance for these species. Heard found strong associations for speckled chub (Macrhybopsis
aestivalis) and Rio Grande shiner (Notropis jemezanus) with riffle and run habitats with gravel substrates and
relatively swift current with little silt. Also associated with these types of habitats were blue sucker (Cycleptus
elongates), Tamaulipas shiner (Notropis braytoni), and longnose dace (Rhinichthys cataractae). The loss of sand
and gravel riffles and backwaters has been shown to negatively affect many species and it is likely the cause for the
potential loss of some species (Saunders, personal communication).

3-43
Figure 3.6-6. Results from a mussel survey conducted in 2005 depicting downstream increase in abundance. Reported river
mile is at the downstream end of each sampling reach.
Table 3.6-3. Mussel data from NPS survey (Renfro, 2005)
Reach
Number of
mussels found
Mussels/ river
mile
Lajitas to Santa Elena Take Out 0 0.00
Santa Elena take Out to Cottonwood
Campground 0 0.00
Cottonwood Campground to Solis 3 0.06
Solis to Rio Grande Village 1 0.15
Rio Grande Village to La Linda 26 0.57
La Linda to Taylor's Farm 45 1.96
3.6.3.3 Benthic Macroinvertebrates
The first published, and broadly focused survey of upper Rio Grande invertebrates were conducted by Davis and
published in 1980. Davis found increasing diversity and number of taxa and decreasing redundancy moving
downstream. He also found improvement in ecological richness between a station above the confluence with the
Rio Conchos and just below. Davis attributes these changes to improving water quality and substrate.
More recent studies indicate a lower diversity of benthic macro invertebrates in the area downstream of Santa Elena
Canyon and the area of Rio Grande Village when compared to upstream and downstream monitoring sites (IBWC,
1994, 1998, Moring 2002). Several studies found the benthic community in these areas dominated by a single

3-44
tolerant species of black fly. Available data scored using the benthic index of biotic integrity and compared to the
TSWQS the aquatic life use (ALU) at Santa Elena Canyon ranges from limited to high. The designated ALU is
high in the TSWQS. The limited and intermediate ALU scores indicate very low abundance or absence of sensitive
species, moderate to low diversity and species richness, and a moderately to severely imbalanced trophic structure.
Unpublished field observations made during sample collection indicates improving conditions moving downstream.
Freshwater mussels are widely recognized as one of the most-rapidly declining groups in North America. They are
important elements of aquatic ecosystems and appear to be most impacted by changes in water quality and habitat
in part due to their sensitivity to environmental degradation. Historically, 16 species of unionids occurred in the Rio
Grande drainage. Howells reports that only six native species had been found alive in the decade previous to his
publication in 2001. Moring (2002) found only exotic bivalves in a biological assessment of the Rio Grande in
BBNP. A more recent (2005) mussel survey by the National Park Service (NPS) found only empty shells
representing three of the four species believed to exist in the area with no individuals found in the upper reach and
increasing in number moving downstream (Table 3.6-3, Figure 3.6-6). The condition and location of these shells
indicate that these species are still living within the Big Bend Reach. In 2008, state directed sampling within the
Big Bend Reach from Terrell County downstream to Val Verde County found native unionids only at John’s
Marina near Dryden.
Table 3.6-4. List of native mussel species with status.
Scientific name Common
name Status
Cyrtonaias
tampicoensis
Tampico
Perlymussel
Native,
Potamilus
salinasensis
Salina
Mucket
Native
Popenaias
popeii
Texas
Hornshell
Native
Truncilla
cognate
Mexican
fawnsfoot
Native-Et
Corbicula
fluminea
Asiatic
Clam
Introduced
Spahaerium Sp Fingernail
Clam
Introduced
3.6.3.4 Ichthyofauna
Eight of fifty-three species of fish have been identified in the Big Bend Reach of the Rio Grande as threatened
(Hubbs et al, 2008). Five species are extirpated, two species are extinct, and 13 are introduced (Hubbs et al., 2008).
Within Big Bend National Park several studies report intact populations relative to other reaches upstream and
downstream (Heard et al., 2012). Yet these same studies note multiple extirpations of native fish, competition with
invasive species and persistent water quality and quantity issues (Moring, 2002, Heard, 2012). Although several
lists of sampled and extirpated fish are available (Garrett, 2002, Moring, 2002, and Heard 2012), the lack of
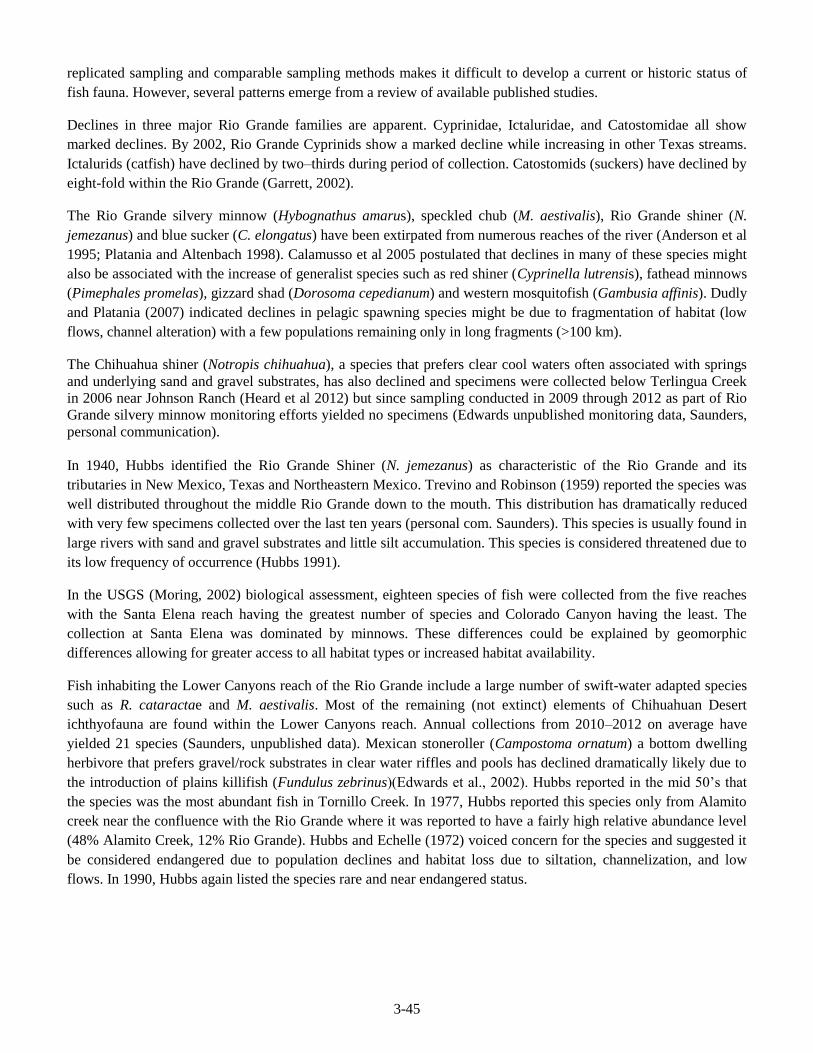
3-45
replicated sampling and comparable sampling methods makes it difficult to develop a current or historic status of
fish fauna. However, several patterns emerge from a review of available published studies.
Declines in three major Rio Grande families are apparent. Cyprinidae, Ictaluridae, and Catostomidae all show
marked declines. By 2002, Rio Grande Cyprinids show a marked decline while increasing in other Texas streams.
Ictalurids (catfish) have declined by two–thirds during period of collection. Catostomids (suckers) have declined by
eight-fold within the Rio Grande (Garrett, 2002).
The Rio Grande silvery minnow (Hybognathus amarus), speckled chub (M. aestivalis), Rio Grande shiner (N.
jemezanus) and blue sucker (C. elongatus) have been extirpated from numerous reaches of the river (Anderson et al
1995; Platania and Altenbach 1998). Calamusso et al 2005 postulated that declines in many of these species might
also be associated with the increase of generalist species such as red shiner (Cyprinella lutrensis), fathead minnows
(Pimephales promelas), gizzard shad (Dorosoma cepedianum) and western mosquitofish (Gambusia affinis). Dudly
and Platania (2007) indicated declines in pelagic spawning species might be due to fragmentation of habitat (low
flows, channel alteration) with a few populations remaining only in long fragments (>100 km).
The Chihuahua shiner (Notropis chihuahua), a species that prefers clear cool waters often associated with springs
and underlying sand and gravel substrates, has also declined and specimens were collected below Terlingua Creek
in 2006 near Johnson Ranch (Heard et al 2012) but since sampling conducted in 2009 through 2012 as part of Rio
Grande silvery minnow monitoring efforts yielded no specimens (Edwards unpublished monitoring data, Saunders,
personal communication).
In 1940, Hubbs identified the Rio Grande Shiner (N. jemezanus) as characteristic of the Rio Grande and its
tributaries in New Mexico, Texas and Northeastern Mexico. Trevino and Robinson (1959) reported the species was
well distributed throughout the middle Rio Grande down to the mouth. This distribution has dramatically reduced
with very few specimens collected over the last ten years (personal com. Saunders). This species is usually found in
large rivers with sand and gravel substrates and little silt accumulation. This species is considered threatened due to
its low frequency of occurrence (Hubbs 1991).
In the USGS (Moring, 2002) biological assessment, eighteen species of fish were collected from the five reaches
with the Santa Elena reach having the greatest number of species and Colorado Canyon having the least. The
collection at Santa Elena was dominated by minnows. These differences could be explained by geomorphic
differences allowing for greater access to all habitat types or increased habitat availability.
Fish inhabiting the Lower Canyons reach of the Rio Grande include a large number of swift-water adapted species
such as R. cataractae and M. aestivalis. Most of the remaining (not extinct) elements of Chihuahuan Desert
ichthyofauna are found within the Lower Canyons reach. Annual collections from 2010–2012 on average have
yielded 21 species (Saunders, unpublished data). Mexican stoneroller (Campostoma ornatum) a bottom dwelling
herbivore that prefers gravel/rock substrates in clear water riffles and pools has declined dramatically likely due to
the introduction of plains killifish (Fundulus zebrinus)(Edwards et al., 2002). Hubbs reported in the mid 50’s that
the species was the most abundant fish in Tornillo Creek. In 1977, Hubbs reported this species only from Alamito
creek near the confluence with the Rio Grande where it was reported to have a fairly high relative abundance level
(48% Alamito Creek, 12% Rio Grande). Hubbs and Echelle (1972) voiced concern for the species and suggested it
be considered endangered due to population declines and habitat loss due to siltation, channelization, and low
flows. In 1990, Hubbs again listed the species rare and near endangered status.

3-46
A 2004 study of fish within the entire reach noted seven species less than found by Hubbs (1977). N. chihuahua, N.
jemezanus, P. promelas, C. elongatus, Menidia beryllina, Morone chrysops, and Micropterus salmoides were not
found during this study.
3.6.3.5 Riparian Biology
To date, no analysis of the historic riparian condition of the Parks or Lower Canyons reach of the Rio Grande has
been published. Qualitative assessments of riparian conditions before anthropogenic flow controls can be made
based on written historic accounts and photography (e.g. 1848 Emory survey, 1859-60 Camel Corps account). It
appears that this reach of the Rio Grande supported fairly narrow, discontinuous riparian vegetation at the edges of
a wide, shallow, and dynamic channel. Overstory (gallery) forest patches are known to have occurred in the region,
but these patches were neither well-developed nor continuous.
Currently, the banks of the Rio Grande are dominated largely by dense infestations of exotic and invasive
vegetation, specifically giant cane (Arundo donax), and salt cedar (Tamarix spp.), with the general distributional
pattern being the dominance of salt cedar at the upper reaches, and increasing density of giant cane downstream
(NPS and CONANP – unpublished data). Throughout the reach, dense patches of native river cane (or common
reed, Phragmites australis) occur and in some places can be as dominant as Arundo. Both community and
landscape-level plant diversity are low in exotic-dominated riparian areas. However, in some areas where well
developed floodplains exist, native dominated mesquite bosques occur, and there are a few remnant patches of
overstory cottonwood and willow forest scattered throughout the Big Bend of the Rio Grande.
Dean and Schmidt (2011) have identified a feedback between the establishment of riparian vegetation and sediment
accumulation along the channel of the Rio Grande. Other researchers have identified the importance of natural and
modified in shaping riparian vegetation communities (Stromberg, 2001). Non-native riparian vegetation, salt cedar
and giant cane, is currently being managed along significant lengths (i.e. 30km) of the Rio Grande. Additionally,
salt cedar leaf beetles (Diorhabda spp.), a biocontrol agent for salt cedar, are successfully established throughout
the region. However, little is understood concerning the mechanisms that drive non-native vs. native vegetation
establishment and proliferation, and the role that the current flow regime has on the patterns of native vs. non-
native vegetation establishment and proliferation. Investigations regarding riparian vegetation dynamics in relation
to flow magnitude and duration would be valuable in providing future instream flow recommendations.
3.6.4 Geomorphology Overlay
As described in Section 2.6, the modern Rio Grande is a disequilibrium river where rapid channel narrowing occurs
during low flow years, and channel widening occurs during rare, large, long duration floods (Dean and Schmidt,
2011; Dean et al., 2011a). Thus, channel and floodplain morphology is rarely in a static or equilibrium state, but
instead, constantly changes. The rate and magnitude of change is determined by the amount of sediment input by
ephemeral tributaries and upstream reaches, and the frequency and magnitude of flows that transport and
redistribute the supplied sediment. Short duration floods lack the ability to cause significant bank erosion, yet are
efficient at suspending fine sediment and depositing that sediment on top of active gravel bars, and in low velocity
areas along the channel margin (Dean et al., 2011a, 2011b)(Figure 3.6-7). This often results in the infilling of
important habitats such as side-channels and backwaters. Additionally, short duration floods that inundate the
floodplain cause vertical accretion of the floodplain surface thereby increasing the height of the floodplain above
the channel bed and causing vertical disconnection of the floodplain from in-channel habitats.
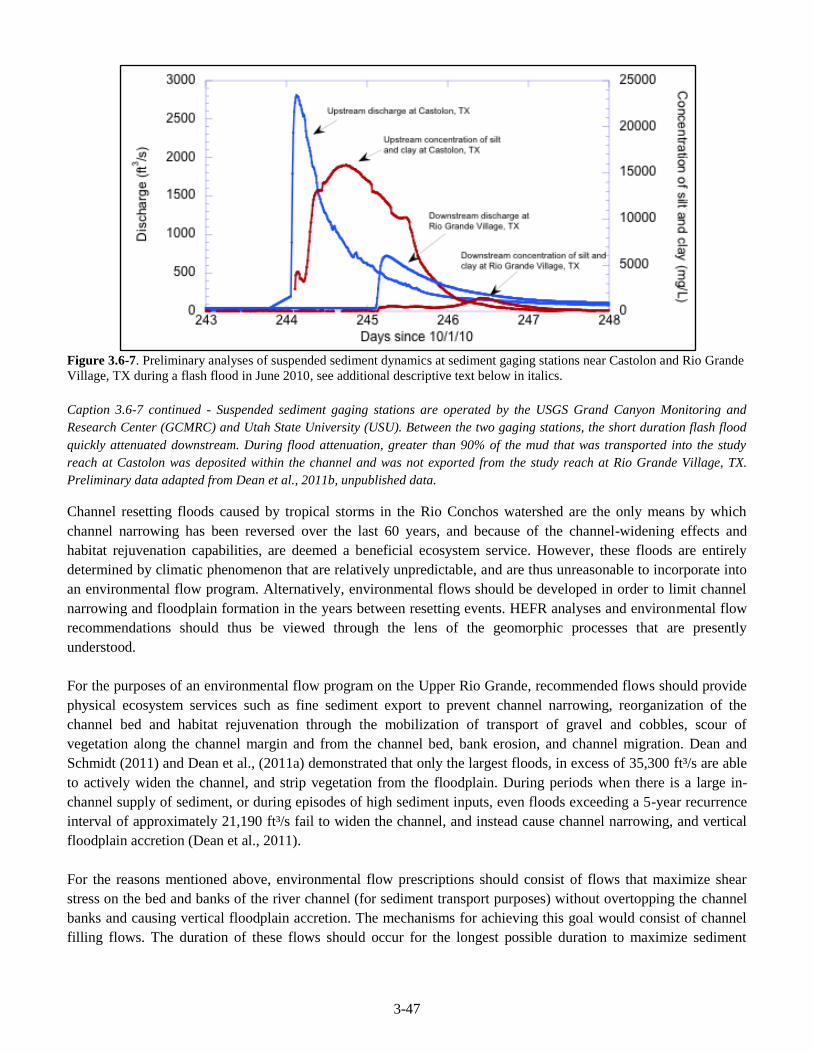
3-47
Figure 3.6-7. Preliminary analyses of suspended sediment dynamics at sediment gaging stations near Castolon and Rio Grande
Village, TX during a flash flood in June 2010, see additional descriptive text below in italics.
Caption 3.6-7 continued - Suspended sediment gaging stations are operated by the USGS Grand Canyon Monitoring and
Research Center (GCMRC) and Utah State University (USU). Between the two gaging stations, the short duration flash flood
quickly attenuated downstream. During flood attenuation, greater than 90% of the mud that was transported into the study
reach at Castolon was deposited within the channel and was not exported from the study reach at Rio Grande Village, TX.
Preliminary data adapted from Dean et al., 2011b, unpublished data.
Channel resetting floods caused by tropical storms in the Rio Conchos watershed are the only means by which
channel narrowing has been reversed over the last 60 years, and because of the channel-widening effects and
habitat rejuvenation capabilities, are deemed a beneficial ecosystem service. However, these floods are entirely
determined by climatic phenomenon that are relatively unpredictable, and are thus unreasonable to incorporate into
an environmental flow program. Alternatively, environmental flows should be developed in order to limit channel
narrowing and floodplain formation in the years between resetting events. HEFR analyses and environmental flow
recommendations should thus be viewed through the lens of the geomorphic processes that are presently
understood.
For the purposes of an environmental flow program on the Upper Rio Grande, recommended flows should provide
physical ecosystem services such as fine sediment export to prevent channel narrowing, reorganization of the
channel bed and habitat rejuvenation through the mobilization of transport of gravel and cobbles, scour of
vegetation along the channel margin and from the channel bed, bank erosion, and channel migration. Dean and
Schmidt (2011) and Dean et al., (2011a) demonstrated that only the largest floods, in excess of 35,300 ft³/s are able
to actively widen the channel, and strip vegetation from the floodplain. During periods when there is a large in-
channel supply of sediment, or during episodes of high sediment inputs, even floods exceeding a 5-year recurrence
interval of approximately 21,190 ft³/s fail to widen the channel, and instead cause channel narrowing, and vertical
floodplain accretion (Dean et al., 2011).
For the reasons mentioned above, environmental flow prescriptions should consist of flows that maximize shear
stress on the bed and banks of the river channel (for sediment transport purposes) without overtopping the channel
banks and causing vertical floodplain accretion. The mechanisms for achieving this goal would consist of channel
filling flows. The duration of these flows should occur for the longest possible duration to maximize sediment

3-48
export and channel-bed reconfiguration. A short duration flood would most likely only result in the deposition of
fine sediment on in-channel bars. Addition benefits would include the scouring of maturing algal communities,
local bank erosion, and the maintenance of channel width.
Recent 1-dimensional hydraulic modeling efforts using the US Army Corps of Engineers Hydrologic Engineering
Centers River Analysis System (HEC-RAS) have been conducted by Utah State University (USU) in order to
quantify the discharge of a “channel-filling flow”. Estimating a channel filling flow is difficult because the effects
of the 2008 channel-resetting flood were not the same everywhere. There was little channel widening in some areas,
and catastrophic widening in others. Thus, channel filling flow estimates vary considerably depending upon reach-
scale geomorphic controls. This is evident based on modeling results for three reaches in BBNP: Castolon, Hot
Springs, and Solis. As shown in Figure 3.6-8, each reach has a range of discharges that fill the channel before
overtopping the channel banks.
Figure 3.6-8. Results from 1-dimensional hydraulic modeling to characterize the magnitude of a channel filling flow.
Caption 3.6-8 continued - The decrease in slope of each of these lines indicates that the narrow portions of the channel have
been filled. We defined the breaks in slope for the Solis and Hot Springs reaches as the channel filling flow. Adapted from
Dean and Schmidt (2011b).
Model results indicate that flows less than 8,800 ft³/s produce overbank flow in all three reaches (Figure 3.6-8). For
each increasing modeled discharge, the number of overbank cross sections increases, however, there is an
approximate threshold discharge at which the rate of increase declines. In the Solis reach, this threshold appears to
be at approximately 10,500 ft³/s, where nearly 70% (11 of 16) of the cross sections are overbank (Figure 3.6-8). In
the Hot Springs reach, this threshold appears to be at approximately 12,350 ft³/s, where over 55% (19 of 33) of the
cross sections are overbank (Figure 3.6-8). In the Castolon reach, the threshold appears to be between 12,350 and
14,125 ft³/s, where approximately 50% (10 of 19) of the cross sections are overbank (Figure 3.6-8).
These thresholds indicate variability in channel width and bank height among the three reaches and within each
reach. In all reaches, there are narrow portions of the channel where floodplain inundation occurs at relatively low
discharges, and wide portions where the floodplains don’t get inundated unless extreme floods occur. For these
reasons, defining a threshold discharge for floodplain inundation was difficult. However, based on the change in
slope of the curves in Figure 3.6-8, we define the threshold discharge as the point at which most of the narrow
reaches begin to overtop their banks; this discharge is approximately 10,500 ft³/s and is roughly equivalent to a 2-
year flood at the Johnson’s Ranch gage.
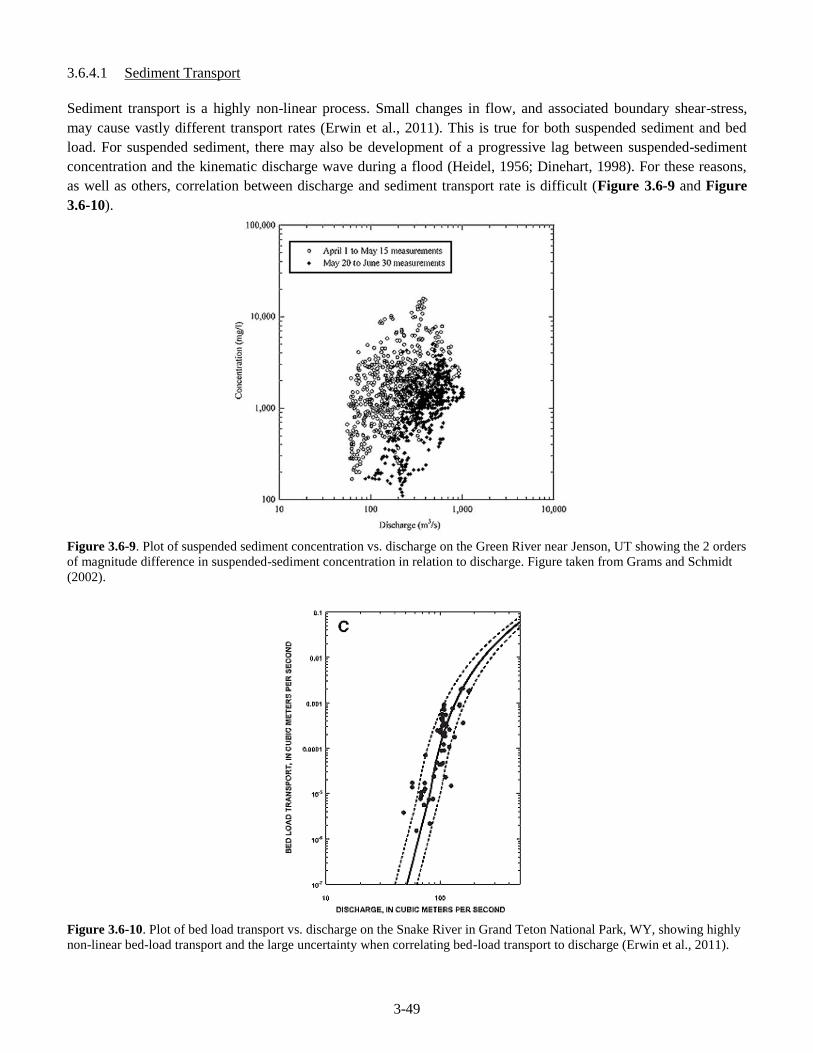
3-49
3.6.4.1 Sediment Transport
Sediment transport is a highly non-linear process. Small changes in flow, and associated boundary shear-stress,
may cause vastly different transport rates (Erwin et al., 2011). This is true for both suspended sediment and bed
load. For suspended sediment, there may also be development of a progressive lag between suspended-sediment
concentration and the kinematic discharge wave during a flood (Heidel, 1956; Dinehart, 1998). For these reasons,
as well as others, correlation between discharge and sediment transport rate is difficult (Figure 3.6-9 and Figure
3.6-10).
Figure 3.6-9. Plot of suspended sediment concentration vs. discharge on the Green River near Jenson, UT showing the 2 orders
of magnitude difference in suspended-sediment concentration in relation to discharge. Figure taken from Grams and Schmidt
(2002).
Figure 3.6-10. Plot of bed load transport vs. discharge on the Snake River in Grand Teton National Park, WY, showing highly
non-linear bed-load transport and the large uncertainty when correlating bed-load transport to discharge (Erwin et al., 2011).

3-50
There are little data concerning sediment transport rates on the Rio Grande. The philosophy of establishing
environmental flows based on estimates of a channel-filling flow (Section 3.3) is based upon first principles of
sediment transport (i.e. greater shear stress = greater transport), as well as the current understanding of geomorphic
changes associated with the different types of flood flows outlined in Section 3.6.1.1. However, the hypothesis that
long-duration channel-filling flows will alleviate problems of sediment loading within the channel is only assumed.
Below, we talk about some preliminary sediment transport analyses to inform this assumption.
A suspended sediment monitoring campaign was recently initiated by the USGS GCMRC and USU in 2010. Two
suspended-sediment monitoring stations were installed near Castolon, TX and Rio Grande Village, TX. These
gages are near-continuously monitoring such that real-time transport data can be obtained, thus negating the
reliance of imprecise sediment rating curves. This monitoring campaign is still in the initial phase of calibration,
and preliminary results of transport in 2011 are limited because of the lack of flood flows that occurred. However,
preliminary analyses indicate that 1) dam releases (in this case, long duration high flow pulses) have the potential to
export silt and clay from the study reach, and 2) dam releases (long-duration high flow pulses) promote the
transport of fine sediment if inputs happen concurrently with high main-stem flows (Figure 3.6-11). Findings were
different concerning sand, however, sand concentrations were quite low (<100 mg/L) and thus are probably
negligible concerning large scale sediment dynamics. We hypothesize that a steady state channel-filling flow will
operate in a similar manner to the dam release in Figure 3.6-11, however, sediment transport analyses have not
been conducted on a flow of that magnitude.
Figure 3.6-11. Preliminary analyses of suspended silt and clay transport during a dam release in July 2010.
Caption 3.6-11 continued - Note that at the downstream gage, silt and clay concentration was always higher during the steady
state release indicating that silt and clay was exported. Also, note that silt and clay inputs from flash floods superimposed on
the top of the dam release were translated through the reach indicating that sediment attenuation did not occur in contrast to
data shown in Figure 3.6-7.
There are even less data concerning bed load transport on the Rio Grande. Dean and Schmidt (2011c) show that
tributary flash floods have caused aggradation of coarse sediment (gravel and cobbles) at tributary junctions
between 2009 and 2012 (Figure 3.6-12). There have been no main-stem flows that have been able to mobilize
and/or reorganize these deposits and there have been no main-stem flows that have approached the magnitude of a
channel-filling flow.

3-51
Figure 3.6-12. Channel cross sections measured at the mouth of Alamo Creek near Castolon, TX between 2009 and 2012.
Note the aggradation of the channel bed between 2009 and 2010.
We conducted some exploratory bed load transport modeling to investigate the sediment transport potential of the
coarse-grained deposits at the mouth of Alamo Creek; one of these reaches where gravel aggradation is occurring.
The purpose of this modeling was to examine the threshold of bed load mobility, quantify the uncertainty in these
estimates, and to model the sediment transport characteristics for a flow that approaches a channel filling flow of
10,500 ft³/s. We conducted this modeling using the same 1-dimensional hydraulic models mentioned in Section
3.6.4, and used the sediment analysis functions with grain size data obtained from data collection in the field. We
designed a simple stepped hydrograph with each step consisting of a 6-hour period. The first step was raised from a
base flow of 35 ft³/s to 3,530 ft³/s, and each additional step was in an increment of 1,765 ft³/s (Figure 3.6-13).
Figure 3.6-13. Stepped hydrograph used in the 1-dimensional sediment analysis completed using HEC-RAS.
Using the surveyed cross-section geometry and grain size data measured in the field, we ran the sediment analysis
using the Meyer-Peter-Mueller sediment transport equation (1),
(1) (kr/k’r) RS = 0.047(s-)dm + 0.25(/g)1/3
((s-)/)2/3
qs2/3
where qs is the sediment transport rate per unit width, kr is a roughness coefficient, k’r is the roughness attributed
to the sediment grains, is the unit weight of water, s is the unit weight of the sediment, g is the acceleration due
to gravity, dm is the median particle diameter, R is the hydraulic radius, and S is the energy gradient (USACE,
2010).

3-52
Model results show that at this location, gravel becomes mobile at flows less than 3,530 ft³/s. At the peak modeled
discharge of approximately 10,500 ft³/s (channel-filling flow), more than 25 tons of sediment is transported per day.
Over the length of the hydrograph, a cumulative amount of 1,611 tons of sediment is transported through a cross
section (Figure 3.6-13 and Figure 3.6-14). These results show that a channel-filling flow is able to mobilize the
gravel deposits in this reach.
Figure 3.6-14. Sediment transport calculations for a cross section near Alamo Creek obtained from 1-dimensional sediment
modeling. (a) Sediment transport rate over the duration of the model run. (b) Cumulative volume of sediment transported over
the duration of the model run.
When these numbers are compared to the preliminary analyses of sediment influx from Alamo Creek as measured
by detailed topographic surveys, a crude mass balance can be developed. Between 2011 and 2012, USU conducted
detailed surveys of the aggrading Alamo Creek gravel deposits. Digital elevation models (DEM) were built of the
surveyed section of the channel for each year, and the 2011 DEM was subtracted from the 2012 DEM to calculate
the elevation difference between the two years. To limit the degree of uncertainty in the surveys, all differences less
than approximately 6 inches were excluded from the analyses. Calculations of the difference between the two
surveys indicate that over 3,140 tons of sediment was deposited within the river channel during that year (Figure
3.6-15); roughly twice as much as sediment flux calculated for the 60-hour sediment modeling run. Based on the
modeling results, a channel filling flow will have to occur for longer than 18 hours in order to move the 2011-2012
accumulated amount of sediment downstream.
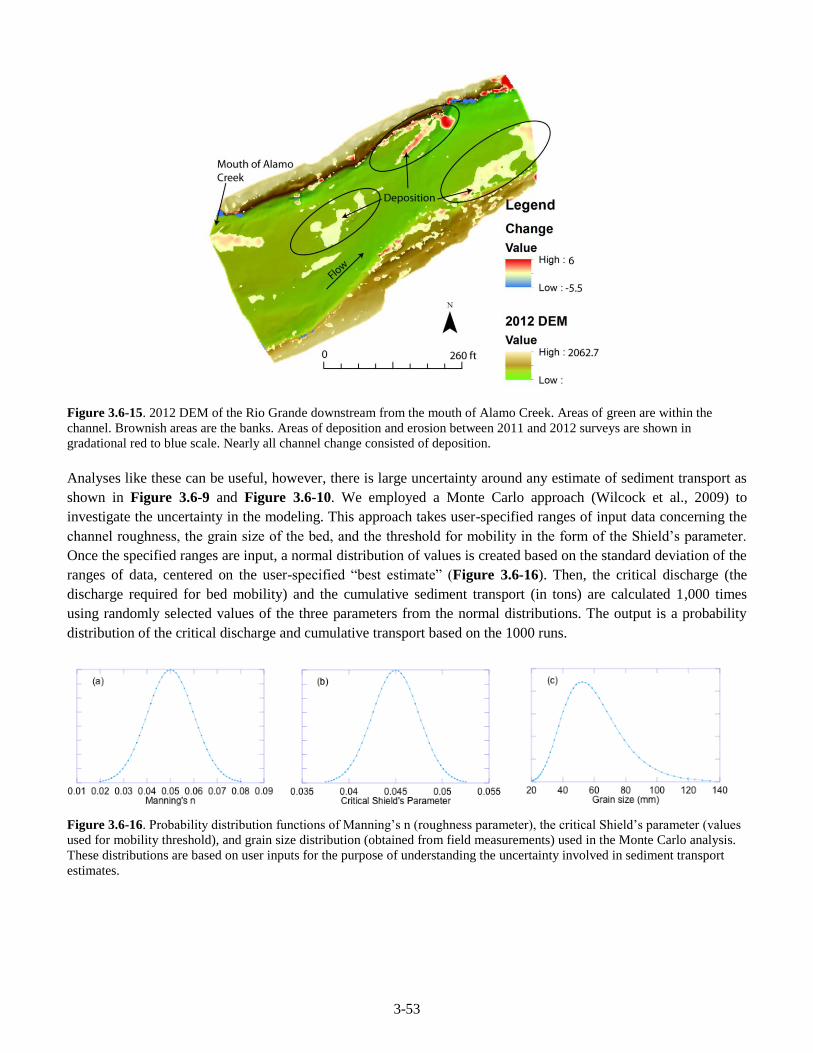
3-53
Figure 3.6-15. 2012 DEM of the Rio Grande downstream from the mouth of Alamo Creek. Areas of green are within the
channel. Brownish areas are the banks. Areas of deposition and erosion between 2011 and 2012 surveys are shown in
gradational red to blue scale. Nearly all channel change consisted of deposition.
Analyses like these can be useful, however, there is large uncertainty around any estimate of sediment transport as
shown in Figure 3.6-9 and Figure 3.6-10. We employed a Monte Carlo approach (Wilcock et al., 2009) to
investigate the uncertainty in the modeling. This approach takes user-specified ranges of input data concerning the
channel roughness, the grain size of the bed, and the threshold for mobility in the form of the Shield’s parameter.
Once the specified ranges are input, a normal distribution of values is created based on the standard deviation of the
ranges of data, centered on the user-specified “best estimate” (Figure 3.6-16). Then, the critical discharge (the
discharge required for bed mobility) and the cumulative sediment transport (in tons) are calculated 1,000 times
using randomly selected values of the three parameters from the normal distributions. The output is a probability
distribution of the critical discharge and cumulative transport based on the 1000 runs.
Figure 3.6-16. Probability distribution functions of Manning’s n (roughness parameter), the critical Shield’s parameter (values
used for mobility threshold), and grain size distribution (obtained from field measurements) used in the Monte Carlo analysis.
These distributions are based on user inputs for the purpose of understanding the uncertainty involved in sediment transport
estimates.

3-54
The Monte Carlo results show the relative uncertainty involved with the prediction of sediment transport without
field data of actual transport rates for which to calibrate the sediment transport equations. Monte Carlo simulations
show that in a simplified channel with the same slope and width as used in the 1-dimensional modeling, and the
given range of input values, the threshold for gravel mobility generally does not occur until discharge exceeds
15,000 ft³/s (Figure 3.6-17). Often the threshold is much larger. Additionally, over 980 of the 1,000 simulations
calculated the total cumulative transport for the input hydrograph to be less than 220 tons per day. It is likely that
the critical discharge is over predicted by the Monte Carlo runs because true channel topography is not used, and
instead the cross section is assumed to be quasi-trapezoidal. However, the Monte Carlo simulations show that there
is a large degree of uncertainty in predicting when bed-load transport will occur. Thus, there is great caution when
applying sediment transport models to problems without a comprehensive understanding of the factors driving
transport in any given reach.
Figure 3.6-17. Results of the Monte Carlo simulation.
Caption 3.6-17 continued - (a) Distribution of 1000 calculations of the threshold discharge for bed-load transport based on the
range of user defined inputs (Figure 3.6-16). The threshold for motion in this analysis is much greater than in the 1-
dimensional modeling, and the relative uncertainty in predicting the discharge required for bed-load mobility is apparent. (b)
Distribution of the cumulative transport calculations over the range of the hydrograph is Figure 3.6-13. Note that the
cumulative transport is much lower than predicted by the 1-dimensional modeling, which also is an indicator of the uncertainty
involved in modeling sediment transport without field data for calibration.
Continued suspended-sediment monitoring on the Rio Grande is needed to constrain suspended sediment transport
dynamics for proposed environmental flow scenarios. Additionally, a comprehensive bed-load transport study
needs to be conducted in order to understand which flows are capable of mobilizing the channel bed, and how much
transport occurs during given flow events. These types of data are integral when designing environmental flow
programs based on physical river processes. Measurements of geomorphic change are alone not enough to inform
managers of the mechanisms responsible for the change.

3-55
3.7 Pecos River
3.7.1 Hydrology-based Environmental Flow Regimes
Development of initial hydrology-based flow regimes for five of the six Pecos River sub-basin gages (Pecos River
at Orla, Pecos, Girvin and Langtry and Independence Creek near Sheffield) followed the methods and parameters
described in Section 3.3. There was not sufficient period of record at the sixth gage (Pecos River at Brotherton
Ranch near Pandale) for HEFR analysis. For this gage, we are recommending only subsistence and base flows. Our
subsistence flow recommendation for all three seasons is the 95th percentile (Q95) of the current period of record
which is 39 ft³/s. Evaluation and refinement of this initial subsistence flow should be a component of the adaptive
management phase. Base flows for this gage were developed from instream habitat modeling as described in
Section 3.7.3. No episodic events (high flow pulses or overbank flows) are being recommended at this time, but
should be developed as a longer period of record becomes available and/or through other methods in the adaptive
management phase.
3.7.2 Water Quality overlay
The Pecos River in west Texas is divided into two segments by the TCEQ. The Upper Pecos, Segment 2311, which
extends from immediately upstream of the confluence with Independence Creek to Red Bluff Dam in Loving
/Reeves County (309 miles). The Lower Rio Grande, Segment 2310, extends from the confluence with
Independence Creek to the weir dam near Langtry, Texas (89 miles).
The Pecos River is an important source of surface water in the arid western portion of Texas and is one of the main
US tributaries flowing into the Rio Grande. Natural geologic deposits in the Pecos River watershed increase the
concentration of chloride, sulfate, and dissolved solids to levels that are as much as ten times higher than typical
surface waters.
In addition to these natural deposits, salt cedar (Tamarisk sp.) contributes to elevated salinity levels in the Pecos
River. Salt cedar is an exotic invasive, salt tolerant species that increases salinity by transpiration of freshwater
sources. Other activities such as oil and gas exploration, irrigation demands, and droughts compound the issues
facing water quality and water quantity in the Pecos River.
The visible results of increasing salinity are the fish kills caused by the brackish water species of golden alga,
Prymnesium parvum. Fish kills related to P. parvum have been documented in the Pecos River since 1985.
The Upper Pecos River is dominated by low flow and high dissolved solids. Segment 2311 is listed as impaired for
DO in the lower portion of the water body. Segment 2311 can be further divided into three sections, one from the
TX-NM state line to the Ward II turnout, one from Ward II turnout to Iraan, and one from Iraan to the confluence
of Independence Creek. The upper 102 river miles, from the TX-NM state line to the Ward II turnout, (Figure 2.6-8
and Figure 2.6-10) is under complete control of the Red Buff Water Power Control District. If the district has
sufficient water for irrigation, ample water is released for this section of the river. Even during normal rainfall
years, if the water supply is too low for irrigation, portions of this section of the river will be dry (Figure 3.7-1).

3-56
Figure 3.7-1. Dry Pecos River Bed.
Water quality is affected by water from the Rustler formation. Salt Creek originates from Rustler springs which
contribute 45,700 tons of salt per year in 2,675 acre feet of water per year. This water is injected into the Pecos
River just below Red Bluff Dam.
The vast majority of water in this section and the overpowering influence is the water from Red Bluff Reservoir
itself. Shortly after construction of the Red Bluff Dam in 1936, water outflow 1937-1940 was reported to be 4,710
ppm TDS (Howard and Love, 1943). Currently the salinity of the Red Bluff outflow, when measured at Orla, is
6,150 ppm TDS (Miyamoto 2007). Due to evaporation, salt concentrations will increase but only a small amount
before the last of the water is removed from the river at the Ward II turnout.
The water quality is checked at the surface water gage near Orla. Data from the Texas Clean Rivers Program of the
IBWC and TCEQ is depicted in the two following figures. The data indicates there is a slight decrease in salinity
over the past 30 years. However, it is clear the water quality is extremely variable. This gaging station is nine river
miles below the Red Bluff Reservoir and is therefore directly related to the water quality in the reservoir. It is also
upstream of all irrigation districts. Rustler Aquifer water does enter the Pecos River via Salt Creek which is located
between Red Bluff Reservoir and the Orla gage. Discharge data also relates the frequency of the low flows in the
river
It must be related that this flow gage is unreliable but we have no knowledge of when the gage became unreliable.
TPWD was conducting habitat surveys just below the Orla gage during the summer of 2011. Measured flow was
approximately 60 ft³/s while the gage was reporting 11 ft³/s. Red Bluff Water Power Control District also knows
not to use the gage and omits any flow data associated with it. This is an obvious example of how incorrect data are
used in research activities.

3-57
Figure 3.7-2. Water quality data for the Pecos River at Orla.
During rainfall events which are large enough to produce runoff, the effect upon the river is minimal. Standard
operating procedure is to allow the first day of river flow through the riverbed and then open the gates to the
diversions to capture any “free” water from the river. This dilutes and freshens water in the irrigation canals but
does little to help maintain river form or water quality. The Loving, Reeves II, Ward III, and Ward II Irrigation
Districts are between the Orla gage and the Pecos gage. The HFER analysis at the Pecos gage show 0.5 ft³/s low
base flow and high base flow is 32 ft³/s in the winter and 104 ft³/s during the summer. This difference is the
difference between no irrigation in the winter and peak irrigation in the summer. The first days flow is allowed to
stay in the river because it is the highest level of TDS and high in debris. The first flush is left in the river as it is
undesirable for irrigation purposes.

3-58
Although the stretch from the TX-NM state line may be dry due to no releases from Red Bluff Reservoir, the river
section from Ward II turnout to Iraan will always have water except during the driest of years. During the drought
of 2011, this section of the river had water flowing. The water source is thought to be the Pecos Valley Aquifer.
Unfortunately, this source is the worst quality water in the Pecos Valley Aquifer (Figure 3.7-3).
Figure 3.7-3. Distribution of ground water total dissolved solids (TDS) in the Pecos Basin of Texas.
This portion of the river is represented by the Girvin gage by the Texas Clean Rivers Program. TCRP data indicate
the average water quality at Girvin is steady at about 15,000 ppm TDS. Generally the water quality decreases as
flow decreases and water quality improves as the flow increases. The consistent quality over time further
accentuates the proposal that Red Bluff Reservoir water flow and quality influence stop at Ward II irrigation district
turnout and the flow through Girvin is the result of springs downstream of the Ward II irrigation district turnout.

3-59
Figure 3.7-4. Water quality data for the Pecos River at Girvin.
During the winter months, the water quality will remain between 12,000 and 15,000 ppm TDS in this section.
However, during the summer months, the water quality will remain between 12,000 to 15,000 ppm TDS near
Coyanosa but will increase to 28,500 ppm TDS at Iraan. This increase in concentration is presumed to be from
evaporation. It is important to realize, the first 80 miles of this 187 mile section of the river is cutoff from overland
flow by irrigation canals (Figure 2.6-10). The poor quality spring flow is only supplemented by other Pecos Valley
springs and irrigation return flow in the area. Area storm water flows never reach the Pecos River in the upper 80
miles of this section.
Girvin – TDS vs. Discharge
Girvin – TDS (mg/L)

3-60
Just downstream of Iraan, the ground water quality greatly increases as its source is the Edwards Aquifer. However,
it takes until the river reaches Independence Creek before the river can be designated a sound ecological
environment. Below Iraan, the overland flows typically reach the river although there are no perennial streams
other than Independence Creek.
At the confluence of the Pecos River and Independence Creek, the river flow volume increases by 42% and the
TDS concentrations decrease by 50%. The TDS concentrations at Langtry are approximately 2,000 ppm (Miyamoto
2008).
The Texas Clean Rivers Program water quality data is extremely consistent for Independence Creek.
Figure 3.7-5. Water quality data for the Pecos River at Independence Creek near Sheffield.
Stream flow salinity at Girvin has increased since 1941. No salinity data are available at Girvin after 1982 except
occasional measurements through the Texas Clean Rivers Program (TCRP). The flow has decreased to a range of
16,000 to 25,000 acre feet / year since the 1950s. Salinity reported at Langtry does not follow the salinity patterns
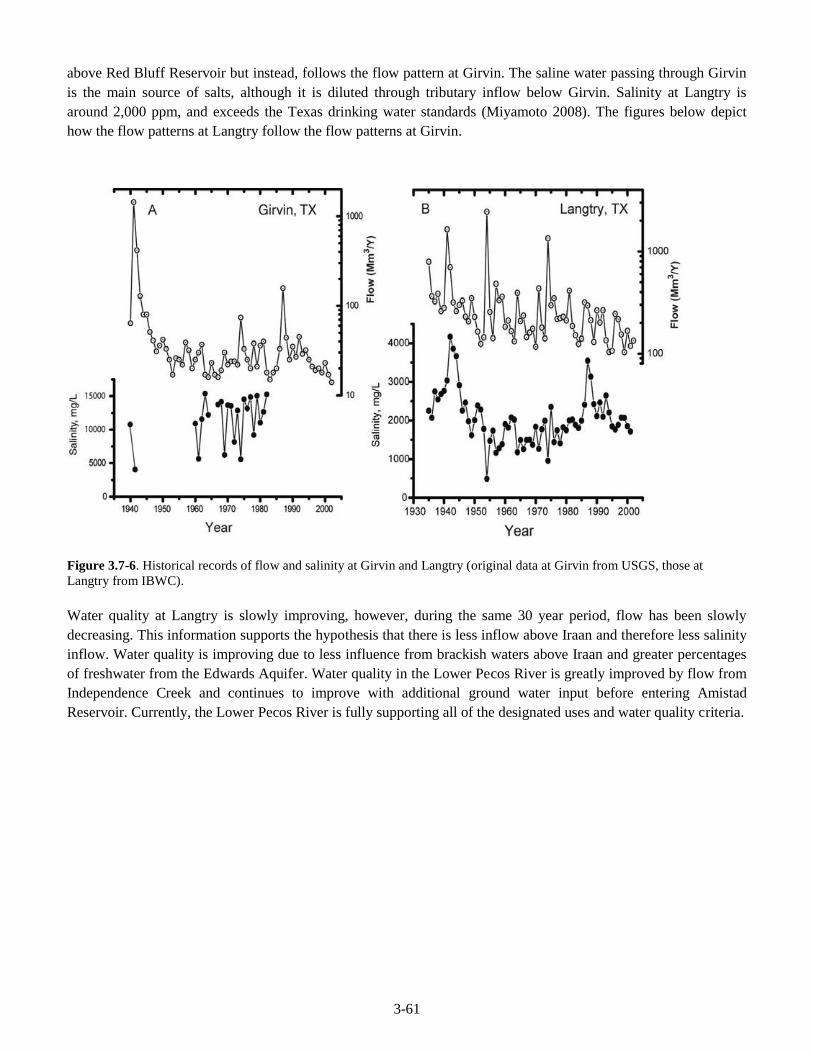
3-61
above Red Bluff Reservoir but instead, follows the flow pattern at Girvin. The saline water passing through Girvin
is the main source of salts, although it is diluted through tributary inflow below Girvin. Salinity at Langtry is
around 2,000 ppm, and exceeds the Texas drinking water standards (Miyamoto 2008). The figures below depict
how the flow patterns at Langtry follow the flow patterns at Girvin.
Figure 3.7-6. Historical records of flow and salinity at Girvin and Langtry (original data at Girvin from USGS, those at
Langtry from IBWC).
Water quality at Langtry is slowly improving, however, during the same 30 year period, flow has been slowly
decreasing. This information supports the hypothesis that there is less inflow above Iraan and therefore less salinity
inflow. Water quality is improving due to less influence from brackish waters above Iraan and greater percentages
of freshwater from the Edwards Aquifer. Water quality in the Lower Pecos River is greatly improved by flow from
Independence Creek and continues to improve with additional ground water input before entering Amistad
Reservoir. Currently, the Lower Pecos River is fully supporting all of the designated uses and water quality criteria.

3-62
Figure 3.7-7. Water quality data from the Pecos River at Langtry.

3-63
3.7.3 Flow-habitat Modeling Results and Overlay (Independence Creek and Pecos River)
Site-specific results of flow-habitat analysis are presented and briefly summarized with conclusions for
Independence Creek near Sheffield and the Pecos River at Brotherton Ranch near Sheffield. Graphs of WUA and
percent of Max WUA have vertical bars to illustrate where the hydrology-based flow recommendations intersect
the habitat curves. We show bars for the range (i.e. across the three seasons) of subsistence flows and the three
levels of base flows. The key to focal species abbreviations used in figures and tables throughout this section is: E.
gra.=Rio Grande darter, C. Pro.=Proserpine shiner, D. arg.=manantial roundnose minnow, N. ama.=Texas shiner,
N. bra.=Tamaulipas shiner, N. str.=sand shiner, M. con.=gray redhorse, I. lup.=headwater catfish, A. mex.=Mexican
tetra, L. meg.=longear sunfish, M. sal.=largemouth bass and C. cya.=Rio Grande cichlid.
The flow-habitat modeling for Independence Creek near Sheffield indicates that the hydrology-based flow
recommendations for base flows do not maintain suitable aquatic habitats for most of the focal species, but do
maintain habitat diversity at this site (Figure 3.7-9 and Figure 3.7-10, Table 3.7-1 through Table 3.7-4,
Appendix 3.4). The range of our Base Flow recommendations does not overlap the peaks of many of the focal
species' flow-WUA curves, but intersect them on the rising portions of the curves. Because of this, the percent of
Max WUA numbers for many species do not provide enough suitable habitat (Table 3.7-1). Regarding Subsistence
flows, the 20% minimum threshold was easily met for all species in all seasons. However, regarding Base flows,
there are six species for which one or more minimum thresholds of percent of maximum WUA were not maintained
by the hydrology-based numbers, so some modifications to the initial flow regime are necessary to maintain
instream habitats.
There is a general trend that habitat areas continue to increase across the entire range of flows modeled and only
one or two curves in pool cross sections peak below 500 ft³/s (Figure 3.7-9a, Table 3.7-1, Table 3.7-2). This is
most likely due to the nature of the Independence Creek channel, which is wide and flat. In contrast to the Devils
River site, this site has riffles, pools and runs in nearly the same proportion without one being dominant. Another
consequence of the base flow range intersecting the flow-WUA curves on the steeply rising portion of the curves is
that even small reductions in base flow recommendations results in significant reductions in habitat.
Because species are not evenly distributed among cross-sections at our sites, we decided to emphasize cross-section
subsets in biological overlay decision-making. All three riffle species (Rio Grande darter, Proserpine shiner and
manantial roundnose minnow) did have the 75% Base-Low threshold met, but the 90% threshold was not met until
above the Base-High range (Figure 3.7-10b, Table 3.7-3). For two of these three species (Rio Grande darter,
Proserpine shiner) 40 ft³/s is needed to meet the 90% threshold in the riffle cross-sections and the other (manantial
roundonse minnow) 30 ft³/s. One of the three primary run species (headwater catfish) also does not have the 90%
threshold met until above the Base-High range; 40 ft³/s is needed to achieve 90% (Figure 3.7-10c, Table 3.7-4).
The other two run species (Texas shiner and gray redhorse) did have their thresholds met in the Base flow ranges.
Pool species all had their 75% thresholds met in or below the Base flow range (Figure 3.7-10d).
Figure 3.7-11 and Table 3.7-5 show the results of the habitat time series analysis for the whole period of record of
historical flows at Independence Creek near Sheffield. These results are for all cross-sections and do not consider
cross-section subsets separately, though this could be done in the future. We recommend that environmental flow
standards adopted by the BBASC not reduce these frequencies more than 10%.
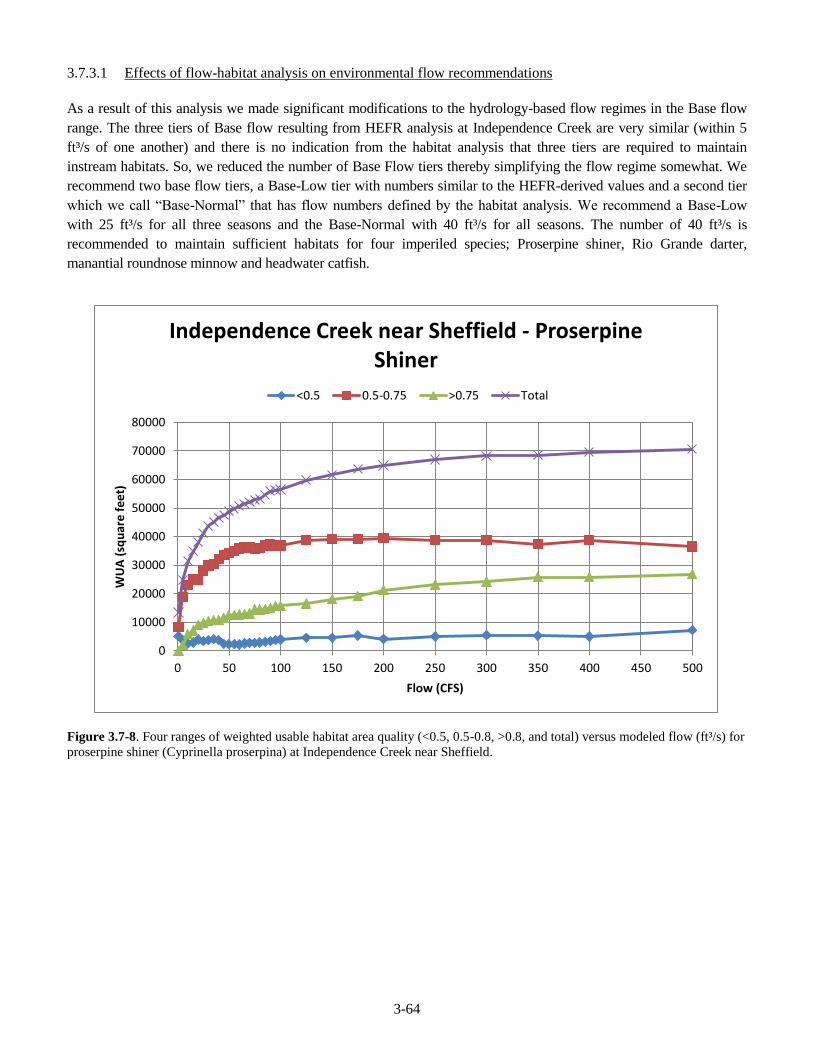
3-64
3.7.3.1 Effects of flow-habitat analysis on environmental flow recommendations
As a result of this analysis we made significant modifications to the hydrology-based flow regimes in the Base flow
range. The three tiers of Base flow resulting from HEFR analysis at Independence Creek are very similar (within 5
ft³/s of one another) and there is no indication from the habitat analysis that three tiers are required to maintain
instream habitats. So, we reduced the number of Base Flow tiers thereby simplifying the flow regime somewhat. We
recommend two base flow tiers, a Base-Low tier with numbers similar to the HEFR-derived values and a second tier
which we call “Base-Normal” that has flow numbers defined by the habitat analysis. We recommend a Base-Low
with 25 ft³/s for all three seasons and the Base-Normal with 40 ft³/s for all seasons. The number of 40 ft³/s is
recommended to maintain sufficient habitats for four imperiled species; Proserpine shiner, Rio Grande darter,
manantial roundnose minnow and headwater catfish.
Figure 3.7-8. Four ranges of weighted usable habitat area quality (<0.5, 0.5-0.8, >0.8, and total) versus modeled flow (ft³/s) for
proserpine shiner (Cyprinella proserpina) at Independence Creek near Sheffield.
0
10000
20000
30000
40000
50000
60000
70000
80000
0 50 100 150 200 250 300 350 400 450 500
WU
A (
squ
are
fe
et)
Flow (CFS)
Independence Creek near Sheffield - Proserpine Shiner
<0.5 0.5-0.75 >0.75 Total

3-65
Figure 3.7-9. Weighted usable habitat area with a 0.5 minimum quality threshold versus modeled flow (ft³/s) for 10 focal
species at Independence Creek near Sheffield. Shown are WUA versus flow relationships for a) all cross-sections, b) riffle
cross-sections, c) run cross-sections and d) pool cross-sections. Vertical bars bracket environmental flow regime components.
0
10000
20000
30000
40000
50000
60000
0 20 40 60 80 100 120
WU
A -
sq. f
t
Discharge (cfs)
Weighted Usable Area versus Simulated Discharge Independence Creek at on TNC preserve near hunting blind #14
(Total)
E. gra. C. pro. D. arg. N. ama. I. lup. A. mex. M. con. L. meg. M. sal. C. cya.
0
2000
4000
6000
8000
10000
12000
14000
0 20 40 60 80 100 120
WU
A -
sq. f
t
Discharge (cfs)
Weighted Usable Area versus Simulated Discharge Independence Creek at on TNC preserve near hunting blind #14
(Riffle Total)
E. gra. C. pro. D. arg. N. ama. I. lup. A. mex. M. con. L. meg. M. sal. C. cya.
a.
b.

3-66
Figure 3.7-9. Continued.
0
5000
10000
15000
20000
25000
0 20 40 60 80 100 120
WU
A -
sq. f
t
Discharge (cfs)
Weighted Usable Area versus Simulated Discharge Independence Creek at on TNC preserve near hunting blind #14
(Run Total)
E. gra. C. pro. D. arg. N. ama. I. lup. A. mex. M. con. L. meg. M. sal. C. cya.
0
2000
4000
6000
8000
10000
12000
14000
16000
18000
20000
0 20 40 60 80 100 120
WU
A -
sq. f
t
Discharge (cfs)
Weighted Usable Area versus Simulated Discharge Independence Creek at on TNC preserve near hunting blind #14
(Pool Total)
E. gra. C. pro. D. arg. N. ama. I. lup. A. mex. M. con. L. meg. M. sal. C. cya.
d.
c.

3-67
0%
10%
20%
30%
40%
50%
60%
70%
80%
90%
100%
0 10 20 30 40 50 60 70 80
Pe
rce
nt
Discharge (cfs)
Percent of Maximum WUA versus Simulated Discharge Independence Creek at on TNC preserve near hunting blind #14
(xsec13_Total)
E. gra. C. pro. D. arg. N. ama. I. lup. A. mex. M. con. L. meg. M. sal. C. cya.
0%
10%
20%
30%
40%
50%
60%
70%
80%
90%
100%
0 10 20 30 40 50 60 70 80
Pe
rce
nt
Discharge (cfs)
Percent of Maximum WUA versus Simulated Discharge Independence Creek at on TNC preserve near hunting blind #14
(xsec10_Riffle Total)
E. gra. C. pro. D. arg. N. ama. I. lup. A. mex. M. con. L. meg. M. sal. C. cya.
a.
b.
Figure 3.7-10. Graphs a) and b);
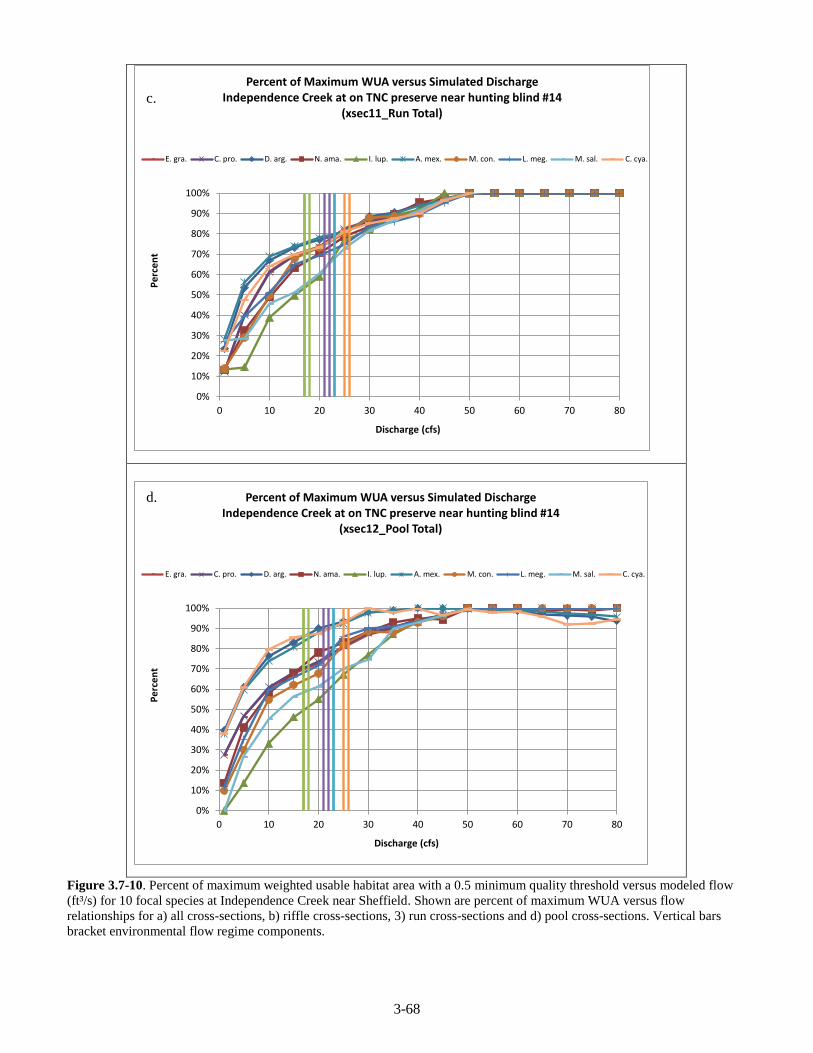
3-68
Figure 3.7-10. Percent of maximum weighted usable habitat area with a 0.5 minimum quality threshold versus modeled flow
(ft³/s) for 10 focal species at Independence Creek near Sheffield. Shown are percent of maximum WUA versus flow
relationships for a) all cross-sections, b) riffle cross-sections, 3) run cross-sections and d) pool cross-sections. Vertical bars
bracket environmental flow regime components.
0%
10%
20%
30%
40%
50%
60%
70%
80%
90%
100%
0 10 20 30 40 50 60 70 80
Pe
rce
nt
Discharge (cfs)
Percent of Maximum WUA versus Simulated Discharge Independence Creek at on TNC preserve near hunting blind #14
(xsec11_Run Total)
E. gra. C. pro. D. arg. N. ama. I. lup. A. mex. M. con. L. meg. M. sal. C. cya.
0%
10%
20%
30%
40%
50%
60%
70%
80%
90%
100%
0 10 20 30 40 50 60 70 80
Pe
rce
nt
Discharge (cfs)
Percent of Maximum WUA versus Simulated Discharge Independence Creek at on TNC preserve near hunting blind #14
(xsec12_Pool Total)
E. gra. C. pro. D. arg. N. ama. I. lup. A. mex. M. con. L. meg. M. sal. C. cya.
d.
c.

3-69
Table 3.7-1. Percent of maximum weighted usable habitat area with a 0.5 minimum quality threshold for 10 focal species
resulting from hydrology-based flow regime (HEFR) results at the Independence Creek near Sheffield. Shown are percentages
for Subsistence and all three ranges of Base Flows. Shaded cells are those flows meeting "enoughness" thresholds of 20 % for
Subsistence flows and 75 or 90 % (per requirements for each species) for all three ranges of Base Flows.
Focal Species Flow Component Percent of Maximum Weighted Usable Area
Winter Spring Monsoon
Cyprinella proserpina Subsistence 71% 71% 71%
Base - Low 76% 75% 75%
Base - Medium 78% 78% 78%
Base - High 81% 82% 81%
Dionda argentosa Subsistence 80% 79% 79%
Base - Low 83% 83% 83%
Base - Medium 84% 84% 84%
Base - High 85% 87% 85%
Notropis amabilis Subsistence 72% 70% 70%
Base - Low 77% 76% 76%
Base - Medium 79% 79% 79%
Base - High 81% 82% 81%
Moxostoma congestum Subsistence 71% 70% 70%
Base - Low 77% 75% 75%
Base - Medium 78% 78% 78%
Base - High 82% 83% 82%
Ictalurus lupus Subsistence 59% 57% 57%
Base - Low 68% 65% 65%
Base - Medium 71% 71% 71%
Base - High 76% 77% 76%
Astyanax mexicanus Subsistence 80% 79% 79%
Base - Low 83% 82% 82%
Base - Medium 84% 84% 84%
Base - High 85% 87% 85%
Micropterus salmoides Subsistence 51% 50% 50%
Base - Low 58% 56% 56%
Base - Medium 60% 60% 60%
Base - High 63% 64% 63%
Lepomis megalotis Subsistence 69% 68% 68%
Base - Low 75% 73% 73%
Base - Medium 76% 76% 76%
Base - High 79% 81% 79%
Etheostoma grahami Subsistence 71% 70% 70%
Base - Low 76% 75% 75%
Base - Medium 78% 78% 78%
Base - High 81% 82% 81%
Cichlasoma Subsistence 64% 63% 63%
cyanoguttatum Base - Low 67% 66% 66%
Base - Medium 69% 69% 69%
Base - High 71% 72% 71%
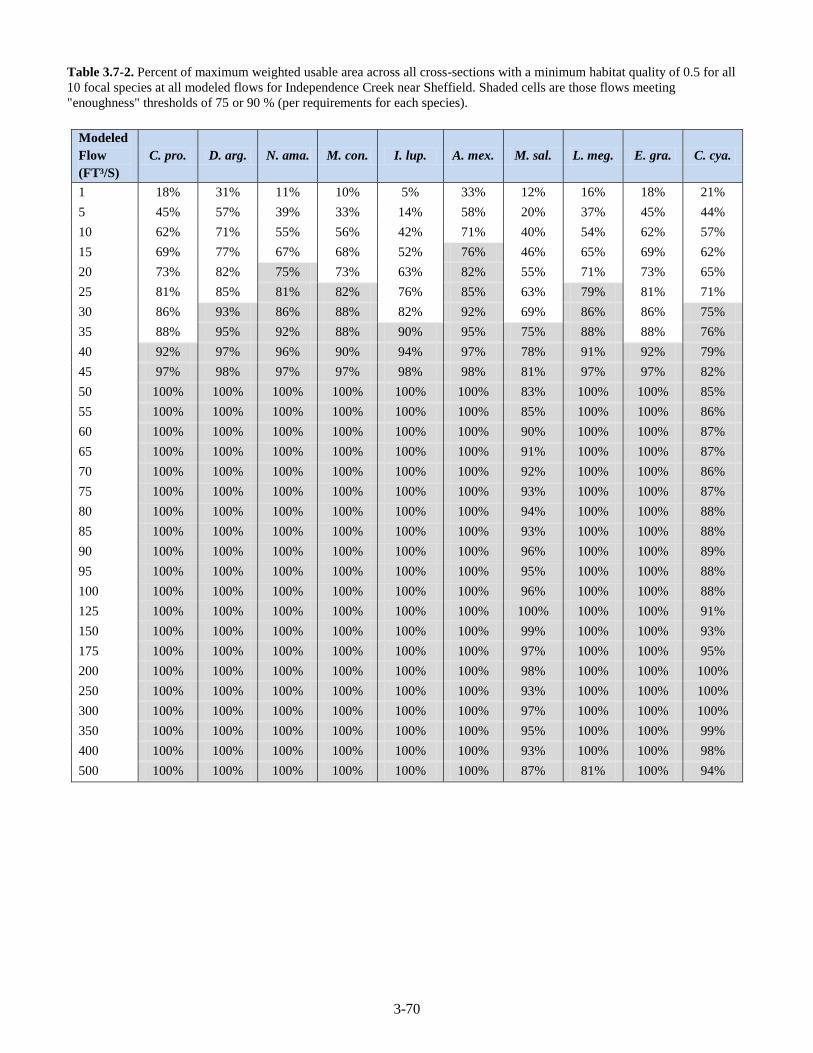
3-70
Table 3.7-2. Percent of maximum weighted usable area across all cross-sections with a minimum habitat quality of 0.5 for all
10 focal species at all modeled flows for Independence Creek near Sheffield. Shaded cells are those flows meeting
"enoughness" thresholds of 75 or 90 % (per requirements for each species).
Modeled
Flow
(FT³/S)
C. pro. D. arg. N. ama. M. con. I. lup. A. mex. M. sal. L. meg. E. gra. C. cya.
1 18% 31% 11% 10% 5% 33% 12% 16% 18% 21%
5 45% 57% 39% 33% 14% 58% 20% 37% 45% 44%
10 62% 71% 55% 56% 42% 71% 40% 54% 62% 57%
15 69% 77% 67% 68% 52% 76% 46% 65% 69% 62%
20 73% 82% 75% 73% 63% 82% 55% 71% 73% 65%
25 81% 85% 81% 82% 76% 85% 63% 79% 81% 71%
30 86% 93% 86% 88% 82% 92% 69% 86% 86% 75%
35 88% 95% 92% 88% 90% 95% 75% 88% 88% 76%
40 92% 97% 96% 90% 94% 97% 78% 91% 92% 79%
45 97% 98% 97% 97% 98% 98% 81% 97% 97% 82%
50 100% 100% 100% 100% 100% 100% 83% 100% 100% 85%
55 100% 100% 100% 100% 100% 100% 85% 100% 100% 86%
60 100% 100% 100% 100% 100% 100% 90% 100% 100% 87%
65 100% 100% 100% 100% 100% 100% 91% 100% 100% 87%
70 100% 100% 100% 100% 100% 100% 92% 100% 100% 86%
75 100% 100% 100% 100% 100% 100% 93% 100% 100% 87%
80 100% 100% 100% 100% 100% 100% 94% 100% 100% 88%
85 100% 100% 100% 100% 100% 100% 93% 100% 100% 88%
90 100% 100% 100% 100% 100% 100% 96% 100% 100% 89%
95 100% 100% 100% 100% 100% 100% 95% 100% 100% 88%
100 100% 100% 100% 100% 100% 100% 96% 100% 100% 88%
125 100% 100% 100% 100% 100% 100% 100% 100% 100% 91%
150 100% 100% 100% 100% 100% 100% 99% 100% 100% 93%
175 100% 100% 100% 100% 100% 100% 97% 100% 100% 95%
200 100% 100% 100% 100% 100% 100% 98% 100% 100% 100%
250 100% 100% 100% 100% 100% 100% 93% 100% 100% 100%
300 100% 100% 100% 100% 100% 100% 97% 100% 100% 100%
350 100% 100% 100% 100% 100% 100% 95% 100% 100% 99%
400 100% 100% 100% 100% 100% 100% 93% 100% 100% 98%
500 100% 100% 100% 100% 100% 100% 87% 81% 100% 94%
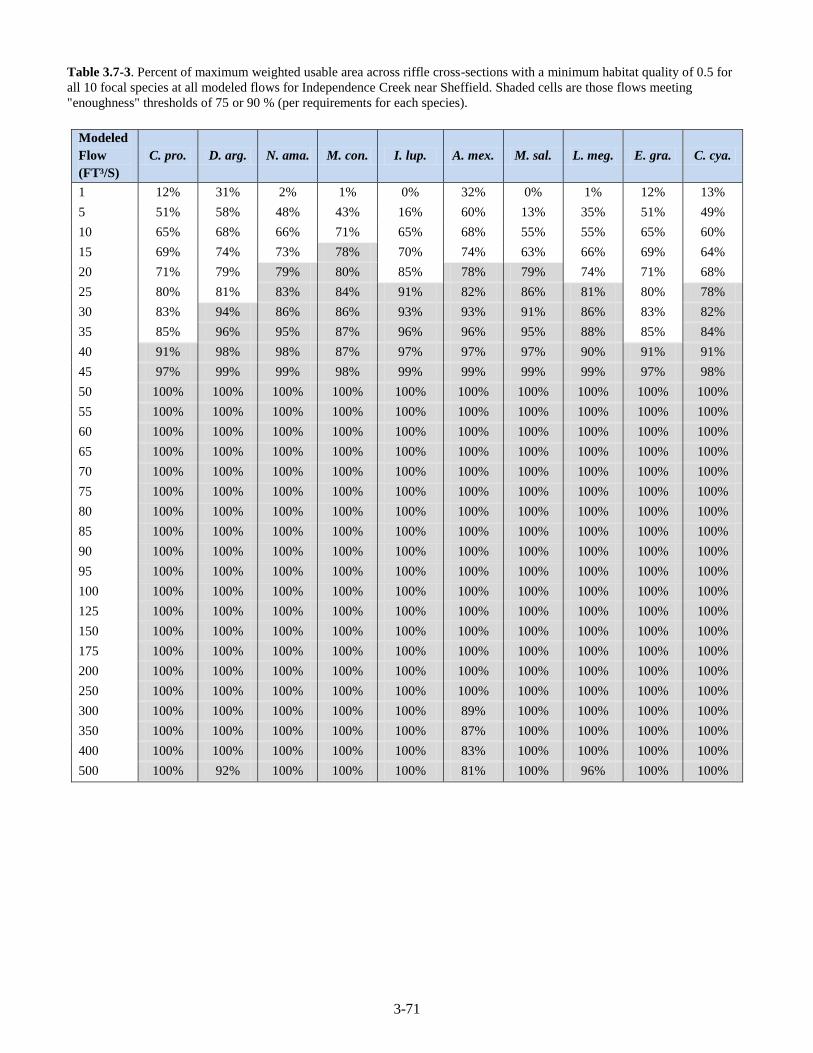
3-71
Table 3.7-3. Percent of maximum weighted usable area across riffle cross-sections with a minimum habitat quality of 0.5 for
all 10 focal species at all modeled flows for Independence Creek near Sheffield. Shaded cells are those flows meeting
"enoughness" thresholds of 75 or 90 % (per requirements for each species).
Modeled
Flow
(FT³/S)
C. pro. D. arg. N. ama. M. con. I. lup. A. mex. M. sal. L. meg. E. gra. C. cya.
1 12% 31% 2% 1% 0% 32% 0% 1% 12% 13%
5 51% 58% 48% 43% 16% 60% 13% 35% 51% 49%
10 65% 68% 66% 71% 65% 68% 55% 55% 65% 60%
15 69% 74% 73% 78% 70% 74% 63% 66% 69% 64%
20 71% 79% 79% 80% 85% 78% 79% 74% 71% 68%
25 80% 81% 83% 84% 91% 82% 86% 81% 80% 78%
30 83% 94% 86% 86% 93% 93% 91% 86% 83% 82%
35 85% 96% 95% 87% 96% 96% 95% 88% 85% 84%
40 91% 98% 98% 87% 97% 97% 97% 90% 91% 91%
45 97% 99% 99% 98% 99% 99% 99% 99% 97% 98%
50 100% 100% 100% 100% 100% 100% 100% 100% 100% 100%
55 100% 100% 100% 100% 100% 100% 100% 100% 100% 100%
60 100% 100% 100% 100% 100% 100% 100% 100% 100% 100%
65 100% 100% 100% 100% 100% 100% 100% 100% 100% 100%
70 100% 100% 100% 100% 100% 100% 100% 100% 100% 100%
75 100% 100% 100% 100% 100% 100% 100% 100% 100% 100%
80 100% 100% 100% 100% 100% 100% 100% 100% 100% 100%
85 100% 100% 100% 100% 100% 100% 100% 100% 100% 100%
90 100% 100% 100% 100% 100% 100% 100% 100% 100% 100%
95 100% 100% 100% 100% 100% 100% 100% 100% 100% 100%
100 100% 100% 100% 100% 100% 100% 100% 100% 100% 100%
125 100% 100% 100% 100% 100% 100% 100% 100% 100% 100%
150 100% 100% 100% 100% 100% 100% 100% 100% 100% 100%
175 100% 100% 100% 100% 100% 100% 100% 100% 100% 100%
200 100% 100% 100% 100% 100% 100% 100% 100% 100% 100%
250 100% 100% 100% 100% 100% 100% 100% 100% 100% 100%
300 100% 100% 100% 100% 100% 89% 100% 100% 100% 100%
350 100% 100% 100% 100% 100% 87% 100% 100% 100% 100%
400 100% 100% 100% 100% 100% 83% 100% 100% 100% 100%
500 100% 92% 100% 100% 100% 81% 100% 96% 100% 100%

3-72
Table 3.7-4. Percent of maximum weighted usable area across run cross-sections with a minimum habitat quality of 0.5 for all
10 focal species at all modeled flows for Independence Creek near Sheffield. Shaded cells are those flows meeting
"enoughness" thresholds of 75 or 90 % (per requirements for each species).
Modeled
Flow
(FT³/S)
C. pro. D. arg. N. ama. M. con. I. lup. A. mex. M. sal. L. meg. E. gra. C. cya.
1 12% 24% 13% 14% 14% 28% 28% 27% 12% 22%
5 40% 53% 32% 29% 14% 56% 28% 40% 40% 48%
10 61% 67% 49% 50% 39% 69% 46% 51% 62% 64%
15 69% 73% 63% 68% 50% 74% 51% 65% 70% 70%
20 73% 77% 71% 73% 59% 78% 61% 69% 74% 73%
25 82% 80% 79% 80% 77% 81% 73% 75% 83% 81%
30 86% 89% 84% 88% 82% 88% 81% 84% 86% 85%
35 88% 91% 90% 89% 89% 90% 87% 86% 89% 88%
40 90% 94% 95% 90% 92% 94% 92% 90% 91% 90%
45 96% 97% 97% 97% 100% 97% 97% 96% 97% 96%
50 100% 100% 100% 100% 100% 100% 100% 100% 100% 100%
55 100% 100% 100% 100% 100% 100% 100% 100% 100% 100%
60 100% 100% 100% 100% 100% 100% 100% 100% 100% 100%
65 100% 100% 100% 100% 100% 100% 100% 100% 100% 100%
70 100% 100% 100% 100% 100% 100% 100% 100% 100% 100%
75 100% 100% 100% 100% 100% 100% 100% 100% 100% 100%
80 100% 100% 100% 100% 100% 100% 100% 100% 100% 100%
85 100% 100% 100% 100% 100% 100% 100% 100% 100% 100%
90 100% 100% 100% 100% 100% 100% 100% 100% 100% 100%
95 100% 100% 100% 100% 100% 100% 100% 100% 100% 100%
100 100% 100% 100% 100% 100% 100% 100% 100% 100% 100%
125 100% 100% 100% 100% 100% 100% 100% 100% 100% 100%
150 100% 100% 100% 100% 100% 100% 100% 100% 100% 100%
175 100% 100% 100% 100% 100% 100% 100% 100% 100% 100%
200 100% 100% 100% 100% 100% 100% 100% 100% 100% 100%
250 100% 100% 100% 100% 100% 100% 100% 100% 100% 100%
300 100% 100% 100% 100% 100% 100% 100% 100% 100% 100%
350 100% 100% 100% 100% 100% 100% 100% 100% 100% 100%
400 100% 100% 100% 100% 100% 100% 100% 100% 100% 100%
500 100% 100% 100% 100% 100% 100% 100% 100% 100% 100%

3-73
Figure 3.7-11. Habitat frequency curves for 10 focal species for the full period of record of historical flows (1975-1985, 2002-
2009) at the USGS gage at Independence Creek near Sheffield.
0%
10%
20%
30%
40%
50%
60%
70%
80%
90%
100%
0.00% 10.00% 20.00% 30.00% 40.00% 50.00% 60.00% 70.00% 80.00% 90.00% 100.00%
Pe
rce
nt
of
Max
imu
m W
UA
Percent of Time Equaled or Exceeded
Independence Creek near Sheffield - USGS 1975-1985, 2002-2009
E. gra. C. pro. D. arg. N. ama. I. lup. A. mex. M. con. L. meg. M. sal. C. cya.
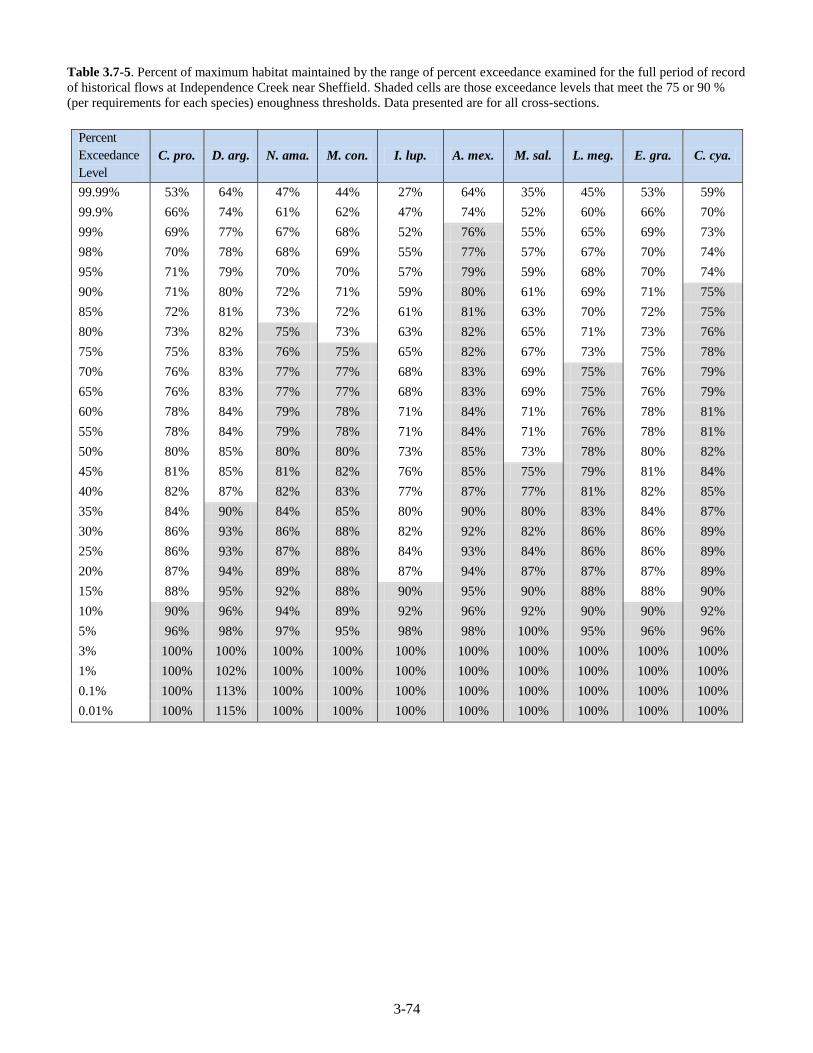
3-74
Table 3.7-5. Percent of maximum habitat maintained by the range of percent exceedance examined for the full period of record
of historical flows at Independence Creek near Sheffield. Shaded cells are those exceedance levels that meet the 75 or 90 %
(per requirements for each species) enoughness thresholds. Data presented are for all cross-sections.
Percent
Exceedance
Level
C. pro. D. arg. N. ama. M. con. I. lup. A. mex. M. sal. L. meg. E. gra. C. cya.
99.99% 53% 64% 47% 44% 27% 64% 35% 45% 53% 59%
99.9% 66% 74% 61% 62% 47% 74% 52% 60% 66% 70%
99% 69% 77% 67% 68% 52% 76% 55% 65% 69% 73%
98% 70% 78% 68% 69% 55% 77% 57% 67% 70% 74%
95% 71% 79% 70% 70% 57% 79% 59% 68% 70% 74%
90% 71% 80% 72% 71% 59% 80% 61% 69% 71% 75%
85% 72% 81% 73% 72% 61% 81% 63% 70% 72% 75%
80% 73% 82% 75% 73% 63% 82% 65% 71% 73% 76%
75% 75% 83% 76% 75% 65% 82% 67% 73% 75% 78%
70% 76% 83% 77% 77% 68% 83% 69% 75% 76% 79%
65% 76% 83% 77% 77% 68% 83% 69% 75% 76% 79%
60% 78% 84% 79% 78% 71% 84% 71% 76% 78% 81%
55% 78% 84% 79% 78% 71% 84% 71% 76% 78% 81%
50% 80% 85% 80% 80% 73% 85% 73% 78% 80% 82%
45% 81% 85% 81% 82% 76% 85% 75% 79% 81% 84%
40% 82% 87% 82% 83% 77% 87% 77% 81% 82% 85%
35% 84% 90% 84% 85% 80% 90% 80% 83% 84% 87%
30% 86% 93% 86% 88% 82% 92% 82% 86% 86% 89%
25% 86% 93% 87% 88% 84% 93% 84% 86% 86% 89%
20% 87% 94% 89% 88% 87% 94% 87% 87% 87% 89%
15% 88% 95% 92% 88% 90% 95% 90% 88% 88% 90%
10% 90% 96% 94% 89% 92% 96% 92% 90% 90% 92%
5% 96% 98% 97% 95% 98% 98% 100% 95% 96% 96%
3% 100% 100% 100% 100% 100% 100% 100% 100% 100% 100%
1% 100% 102% 100% 100% 100% 100% 100% 100% 100% 100%
0.1% 100% 113% 100% 100% 100% 100% 100% 100% 100% 100%
0.01% 100% 115% 100% 100% 100% 100% 100% 100% 100% 100%

3-75
3.7.3.2 Pecos River at Brotherton Ranch near Pandale
There is not a sufficient period of record of daily flows for the Pecos River at Brotherton Ranch near Pandale for a
full HEFR run. But, to determine the general magnitude of base flows at this gage we did an abbreviated
hydrographic separation in IHA using default percentages. From this we derived the 25th, 50
th and 75
th percentiles
for low flows for each month as a Base-Low, Base-Medium and Base-High (respectively) value. We then averaged
these flows across the months for the seasons to calculate a single number for each of the 3 base flow tiers for each
season (Table 3.7-6).
Table 3.7-6. Initial base flow numbers derived from an abbreviated hydrographic separation using IHA for the Pecos River at
Brotherton near Pandale.
Base Flow Tier Winter Spring Monsoon High 111 89 107 Medium 101 76 85 Low 80 60 62
The flow-habitat modeling for the Pecos River at Brotherton Ranch near Pandale indicates that the flow
recommendations for base flows resulting from our abbreviated hydrology analysis do maintain suitable aquatic
habitats for most of the focal species and maintain habitat diversity at this site (Figure 3.7-13 and Figure 3.7-14,
Table 3.7-7 through Table 3.7-10, Appendix 3.4). The range of our Base Flow recommendations does overlap the
peaks of several of the focal species' flow-WUA curves and the percent of Max WUA numbers for most species
provides enough suitable habitat (Table 3.7-7). Regarding Subsistence flows, the 20% minimum threshold was
easily met for all species in all seasons. However, regarding Base flows, there is one species for which one or more
minimum thresholds of percent of maximum WUA were not maintained by the hydrology-based numbers, so some
modifications to the initial flow regime are necessary to maintain instream habitats.
There is a general trend that nearly all species’ habitat area curves do peak in the range of flows modeled and our
range of Base flows does overlap the peaks for most species (Figure 3.7-13a, Table 3.7-7, Table 3.7-8), with the
exception of two species of conservation concern, proserpine shiner and Tamaulipas shiner. In contrast to the
Devils River site, this site has riffles, pools and runs in nearly the same proportion without one being dominant.
Because species are not evenly distributed among cross-sections at our sites, we decided to emphasize cross-section
subsets in biological overlay decision-making. All four riffle species (Rio Grande darter, proserpine shiner,
manantial roundnose minnow and Tamaulipas shiner) did have both the 75% Base-Low threshold and their 90%
thresholds met in the Base flow range (Figure 3.7-14b, Table 3.7-9), though the minimum flow needed to maintain
90% of Tamaulipas shiner WUA in riffle cross-sections (90 ft³/s) was just above the Spring Base-High number. All
three of the primary run species (Texas shiner, Tamaulipas shiner and gray redhorse) have their 75% or 90%
thresholds met in or below the Base flow range (Figure 3.7-14c, Table 3.7-10). Pool species all had their 75%
thresholds met in or below the Base flow range (Figure 3.7-14d).
Figure 3.7-15 and Table 3.7-11 show the results of the habitat time series analysis for the whole period of record
of historical flows at the Pecos River at Brotherton Ranch near Pandale. These results are for all cross-sections and
do not consider cross-section subsets separately, though this could be done in the future. We recommend that
environmental flow standards adopted by the BBASC not reduce these frequencies more than 10%. However, these
numbers are derived from a very short period of record and need to be strengthened by reexamination after a longer
period of daily flow record.

3-76
3.7.3.3 Effects of flow-habitat analysis on environmental flow recommendations
As a result of this analysis we made significant modifications to the hydrology-based flow regimes resulting from the
abbreviated analysis in the Base flow range. Two tiers of base flow are created. A Base-Low tier is created with the
numbers from our abbreviated hydrographic separation and analysis. These flows need to remain at least 60 ft³/s
because the minimum thresholds for Rio Grande darter, Proserpine shiner and Tamaulipas shiner are not met for
any flows below this magnitude. A second tier, called Base-Normal, is created using the Base-Medium numbers
from our abbreviated hydrology analysis but with the Spring and Monsoon numbers increased to 90 ft³/s to meet the
minimum threshold for Tamaulipas shiner in riffle cross-sections. Because the Base-High numbers are not
significantly higher than the Base-Medium numbers and because of uncertainty due to the short period of record,
we are not recommending a third Base-High tier of flows. We also make this recommendation for the sake of
simplicity of the flow regime recommendations. However, it should be recognized that we view these numbers,
including the Base-Normal, as minimum numbers. These should not be diluted further.
Figure 3.7-12. Four ranges of weighted usable habitat area quality (<0.5, 0.5-0.8, >0.8, and total) versus modeled flow (ft³/s)
for Tamaulipas shiner (Notropis braytoni) at the Pecos River at Brotherton Ranch near Pandale.
0
10000
20000
30000
40000
50000
60000
70000
0 50 100 150 200 250 300 350 400 450 500
WU
A (
squ
are
fe
et)
Flows (CFS)
Pecos River near Pandale - Tamaulipas shiner
<0.5 0.5-0.75 >0.75 Total

3-77
Figure 3.7-13. Weighted usable habitat area with a 0.5 minimum quality threshold versus modeled flow (ft³/s) for 10 focal
species at the Pecos River at Brotherton Ranch near Pandale. Shown are WUA versus flow relationships for a) all cross-
sections, b) riffle cross-sections, 3) run cross-sections and d) pool cross-sections. Vertical bars bracket environmental flow
regime components.
0
10000
20000
30000
40000
50000
60000
0 50 100 150 200
WU
A -
sq. f
t
Discharge (cfs)
Weighted Usable Area versus Simulated Discharge Pecos at approximately 5 to 6 miles upstream of the Pandale crossing
(Total)
E. gra. C. pro. D. arg. N. bra. N. ama. A. mex. M. con. L. meg. M. sal. C. cya.
0
5000
10000
15000
20000
25000
0 50 100 150 200
WU
A -
sq. f
t
Discharge (cfs)
Weighted Usable Area versus Simulated Discharge Pecos at approximately 5 to 6 miles upstream of the Pandale crossing (Riffle
Total)
E. gra. C. pro. D. arg. N. bra. N. ama. A. mex. M. con. L. meg. M. sal. C. cya.
a.
b.
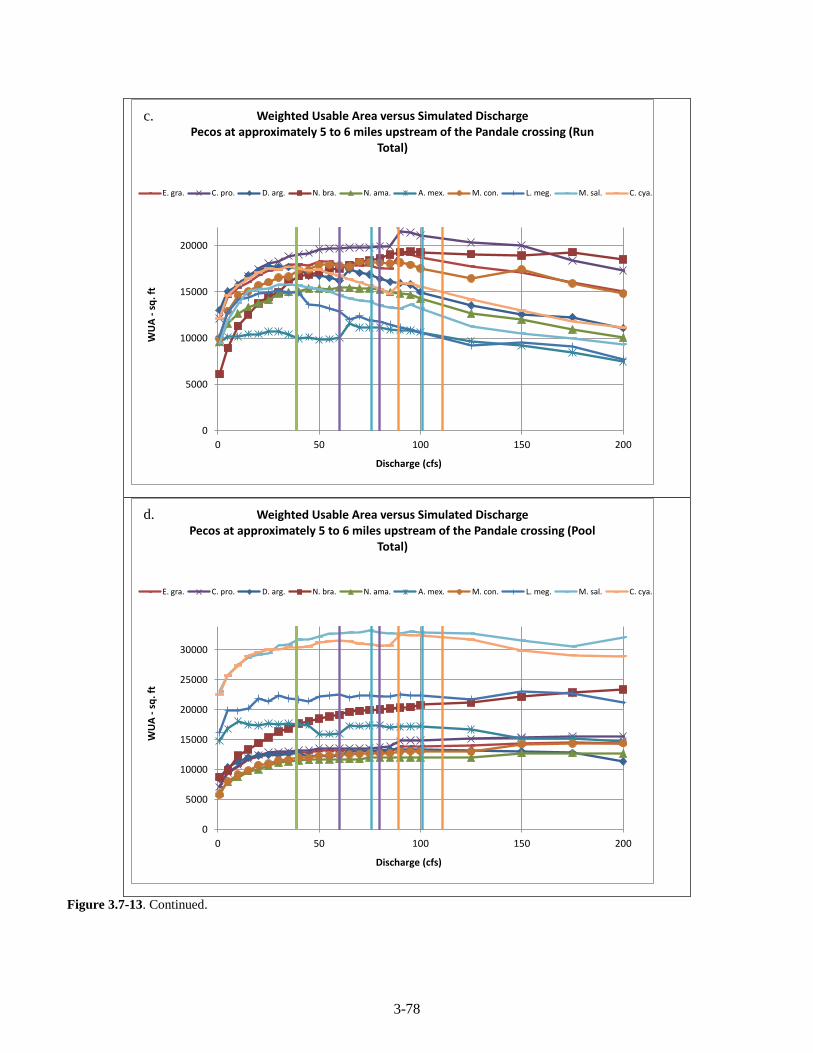
3-78
Figure 3.7-13. Continued.
0
5000
10000
15000
20000
0 50 100 150 200
WU
A -
sq. f
t
Discharge (cfs)
Weighted Usable Area versus Simulated Discharge Pecos at approximately 5 to 6 miles upstream of the Pandale crossing (Run
Total)
E. gra. C. pro. D. arg. N. bra. N. ama. A. mex. M. con. L. meg. M. sal. C. cya.
0
5000
10000
15000
20000
25000
30000
0 50 100 150 200
WU
A -
sq. f
t
Discharge (cfs)
Weighted Usable Area versus Simulated Discharge Pecos at approximately 5 to 6 miles upstream of the Pandale crossing (Pool
Total)
E. gra. C. pro. D. arg. N. bra. N. ama. A. mex. M. con. L. meg. M. sal. C. cya.
c.
d.
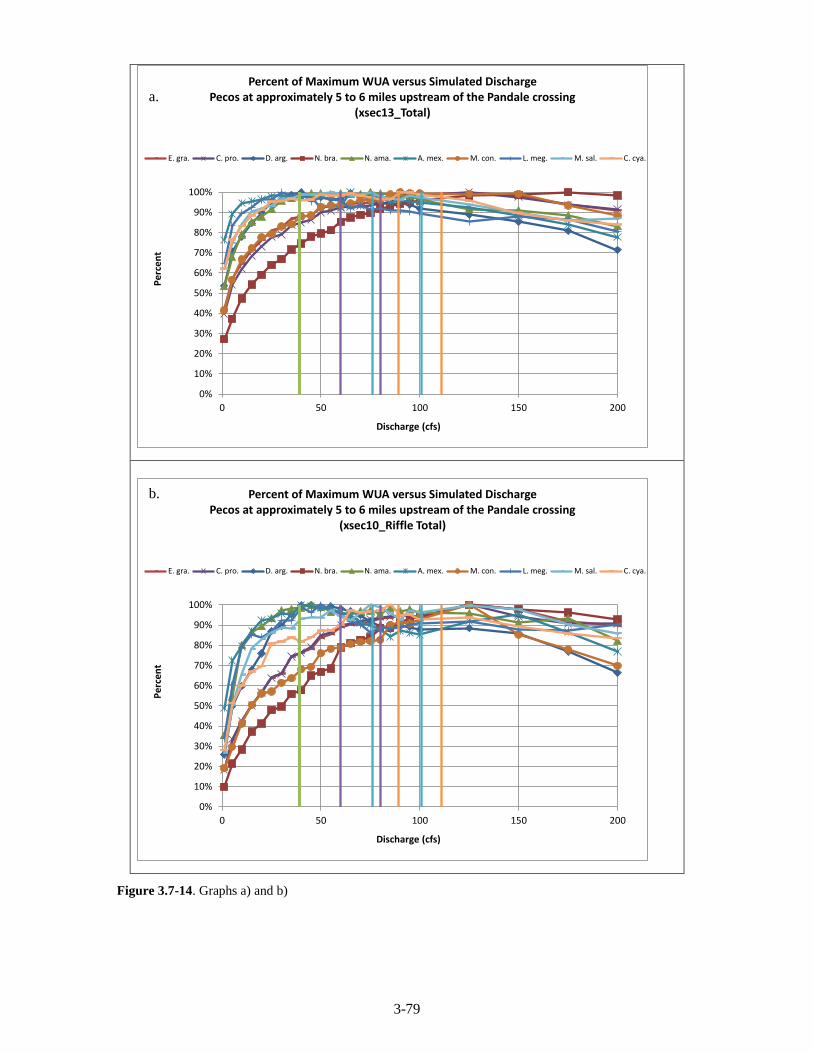
3-79
0%
10%
20%
30%
40%
50%
60%
70%
80%
90%
100%
0 50 100 150 200
Pe
rce
nt
Discharge (cfs)
Percent of Maximum WUA versus Simulated Discharge Pecos at approximately 5 to 6 miles upstream of the Pandale crossing
(xsec13_Total)
E. gra. C. pro. D. arg. N. bra. N. ama. A. mex. M. con. L. meg. M. sal. C. cya.
0%
10%
20%
30%
40%
50%
60%
70%
80%
90%
100%
0 50 100 150 200
Pe
rce
nt
Discharge (cfs)
Percent of Maximum WUA versus Simulated Discharge Pecos at approximately 5 to 6 miles upstream of the Pandale crossing
(xsec10_Riffle Total)
E. gra. C. pro. D. arg. N. bra. N. ama. A. mex. M. con. L. meg. M. sal. C. cya.
a.
b.
Figure 3.7-14. Graphs a) and b)

3-80
Figure 3.7-14. Percent of maximum weighted usable habitat area with a 0.5 minimum quality threshold versus modeled flow
(ft³/s) for 10 focal species at the Pecos River at Brotherton Ranch near Pandale. Shown are percent of maximum WUA versus
flow relationships for a) all cross-sections, b) riffle cross-sections, 3) run cross-sections and d) pool cross-sections. Vertical
bars bracket environmental flow regime components.
0%
10%
20%
30%
40%
50%
60%
70%
80%
90%
100%
0 50 100 150 200
Pe
rce
nt
Discharge (cfs)
Percent of Maximum WUA versus Simulated Discharge Pecos at approximately 5 to 6 miles upstream of the Pandale crossing
(xsec11_Run Total)
E. gra. C. pro. D. arg. N. bra. N. ama. A. mex. M. con. L. meg. M. sal. C. cya.
0%
10%
20%
30%
40%
50%
60%
70%
80%
90%
100%
0 50 100 150 200
Pe
rce
nt
Discharge (cfs)
Percent of Maximum WUA versus Simulated Discharge Pecos at approximately 5 to 6 miles upstream of the Pandale crossing
(xsec12_Pool Total)
E. gra. C. pro. D. arg. N. bra. N. ama. A. mex. M. con. L. meg. M. sal. C. cya.
d.
c.

3-81
Table 3.7-7. Percent of maximum weighted usable habitat area with a 0.5 minimum quality threshold for 10 focal species
resulting from abbreviated hydrology analysis results at the Pecos River at Brotherton Ranch near Pandale. Shown are
percentages for Subsistence and all three ranges of Base Flows. Shaded cells are those flows meeting "enoughness" thresholds
of 20 % for Subsistence flows and 75 or 90 % (per requirements for each species) for all three ranges of Base Flows.
Focal Species Flow Component Percent of Maximum Weighted Usable Area
Winter Spring Monsoon
Cyprinella proserpina Subsistence 88% 88% 88%
Base - Low 93% 92% 92%
Base - Medium 98% 92% 93%
Base - High 97% 99% 97%
Dionda argentosa Subsistence 99% 99% 99%
Base - Low 92% 91% 94%
Base - Medium 84% 94% 91%
Base - High 81% 90% 82%
Notropis amabilis Subsistence 97% 97% 97%
Base - Low 98% 100% 100%
Base - Medium 91% 99% 97%
Base - High 87% 96% 89%
Notropis braytoni Subsistence 86% 86% 86%
Base - Low 96% 91% 91%
Base - Medium 100% 95% 98%
Base - High 99% 100% 100%
Moxostoma congestum Subsistence 94% 94% 94%
Base - Low 99% 98% 98%
Base - Medium 96% 100% 99%
Base - High 94% 99% 95%
Astyanax mexicanus Subsistence 86% 86% 86%
Base - Low 96% 86% 92%
Base - Medium 91% 96% 94%
Base - High 88% 94% 89%
Micropterus salmoides Subsistence 99% 99% 99%
Base - Low 86% 93% 92%
Base - Medium 83% 88% 84%
Base - High 78% 83% 80%
Lepomis megalotis Subsistence 98% 98% 98%
Base - Low 78% 85% 83%
Base - Medium 70% 79% 76%
Base - High 66% 74% 68%
Etheostoma grahami Subsistence 94% 94% 94%
Base - Low 92% 94% 94%
Base - Medium 98% 93% 92%
Base - High 96% 98% 96%
Cichlasoma Subsistence 99% 99% 99%
cyanoguttatum Base - Low 87% 95% 94%
Base - Medium 87% 88% 83%
Base - High 84% 89% 86%

3-82
Table 3.7-8. Percent of maximum weighted usable area across all cross-sections with a minimum habitat quality of 0.5 for all
10 focal species at all modeled flows for the Pecos River at Brotherton Ranch near Pandale. Shaded cells are those flows
meeting "enoughness" thresholds of 75 or 90 % (per requirements for each species).
Modeled
Flow
(FT³/S)
C. pro. D. arg. N. ama. N. bra. M. con. A. mex. L. meg. M. sal. E. gra. C. cya.
1 40% 54% 53% 28% 41% 76% 64% 62% 42% 62%
5 54% 71% 68% 38% 57% 89% 83% 75% 57% 77%
10 62% 78% 79% 48% 67% 95% 90% 84% 65% 83%
15 68% 85% 85% 55% 72% 96% 92% 90% 71% 88%
20 73% 90% 88% 60% 78% 96% 96% 92% 76% 91%
25 78% 95% 92% 65% 79% 98% 96% 93% 81% 95%
30 79% 96% 96% 68% 83% 99% 100% 97% 82% 95%
35 84% 99% 97% 73% 84% 98% 98% 97% 87% 97%
40 85% 100% 98% 75% 88% 98% 99% 99% 88% 96%
45 86% 98% 99% 79% 88% 97% 95% 99% 89% 96%
50 90% 97% 99% 81% 93% 92% 97% 99% 92% 99%
55 91% 97% 99% 82% 94% 93% 97% 100% 93% 98%
60 92% 96% 99% 86% 94% 93% 96% 99% 94% 98%
65 93% 99% 99% 89% 94% 100% 92% 98% 94% 100%
70 93% 98% 99% 90% 96% 98% 93% 99% 95% 98%
75 94% 97% 100% 91% 96% 98% 92% 100% 95% 98%
80 95% 95% 99% 93% 96% 97% 92% 98% 95% 97%
85 95% 94% 99% 94% 99% 95% 91% 97% 95% 97%
90 99% 94% 98% 95% 100% 96% 91% 96% 100% 100%
95 99% 94% 98% 96% 99% 95% 90% 98% 100% 100%
100 99% 92% 96% 97% 99% 95% 90% 97% 99% 99%
125 100% 89% 92% 99% 99% 92% 85% 94% 100% 96%
150 97% 85% 91% 100% 99% 88% 88% 90% 98% 90%
175 94% 81% 88% 100% 93% 84% 86% 86% 94% 86%
200 92% 71% 83% 100% 88% 78% 80% 87% 91% 84%
250 85% 61% 76% 93% 77% 71% 73% 78% 81% 75%
300 76% 51% 71% 87% 69% 65% 63% 75% 70% 66%
350 69% 46% 65% 81% 67% 60% 54% 67% 64% 60%
400 62% 40% 58% 73% 60% 59% 43% 58% 59% 55%
500 47% 32% 41% 58% 42% 50% 35% 41% 46% 37%

3-83
Table 3.7-9. Percent of maximum weighted usable area across riffle cross-sections with a minimum habitat quality of 0.5 for
all 10 focal species at all modeled flows for the Pecos River at Brotherton Ranch near Pandale. Shaded cells are those flows
meeting "enoughness" thresholds of 75 or 90 % (per requirements for each species).
Modeled
Flow
(FT³/S)
C. pro. D. arg. N. ama. N. bra. M. con. A. mex. L. meg. M. sal. E. gra. C. cya.
1 19% 26% 36% 10% 19% 49% 34% 27% 18% 28%
5 34% 50% 55% 21% 30% 73% 60% 50% 33% 51%
10 42% 60% 80% 28% 41% 79% 79% 65% 42% 60%
15 50% 68% 86% 37% 50% 87% 85% 78% 50% 67%
20 57% 76% 89% 41% 56% 92% 84% 83% 57% 70%
25 64% 87% 94% 48% 57% 93% 87% 86% 64% 81%
30 66% 90% 97% 50% 61% 96% 92% 89% 66% 82%
35 74% 95% 98% 56% 64% 95% 92% 88% 75% 84%
40 76% 100% 99% 58% 68% 100% 99% 93% 76% 82%
45 79% 100% 100% 65% 69% 99% 96% 94% 78% 84%
50 85% 99% 99% 67% 76% 98% 100% 94% 84% 87%
55 87% 99% 97% 68% 78% 98% 98% 97% 85% 87%
60 90% 98% 96% 79% 79% 96% 95% 94% 89% 90%
65 91% 97% 95% 81% 81% 95% 92% 93% 90% 97%
70 92% 95% 97% 83% 82% 91% 90% 96% 91% 96%
75 93% 92% 97% 84% 82% 90% 86% 100% 92% 97%
80 94% 89% 96% 89% 83% 88% 89% 99% 93% 97%
85 94% 88% 98% 89% 90% 84% 88% 96% 94% 100%
90 95% 90% 97% 91% 91% 87% 89% 93% 95% 95%
95 94% 89% 98% 93% 91% 86% 90% 97% 95% 95%
100 94% 88% 96% 94% 93% 85% 91% 96% 94% 93%
125 100% 88% 96% 100% 100% 92% 92% 100% 100% 94%
150 94% 86% 91% 98% 85% 95% 88% 98% 98% 90%
175 91% 77% 94% 96% 78% 87% 87% 90% 92% 86%
200 91% 66% 82% 93% 70% 77% 91% 86% 90% 84%
250 82% 52% 82% 85% 53% 71% 81% 77% 71% 68%
300 69% 44% 93% 81% 48% 71% 65% 77% 56% 54%
350 60% 37% 90% 72% 53% 66% 59% 68% 47% 48%
400 49% 32% 83% 65% 49% 64% 30% 43% 42% 40%
500 34% 27% 64% 51% 34% 57% 21% 28% 30% 29%
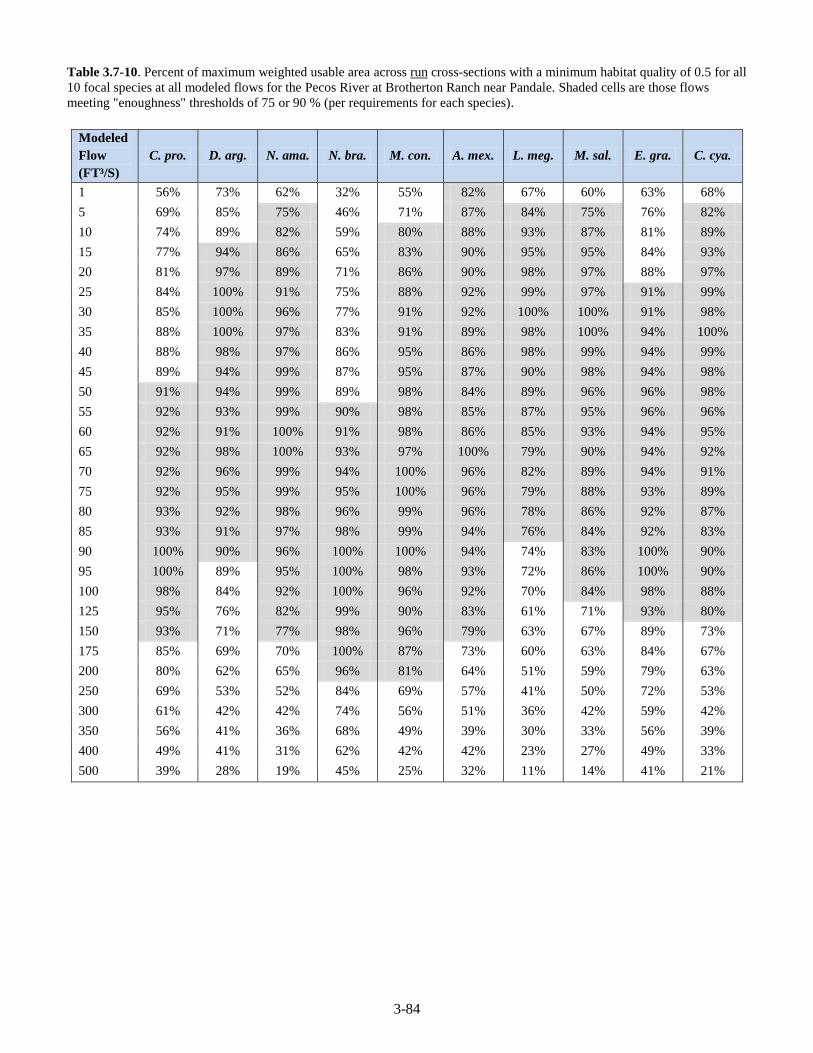
3-84
Table 3.7-10. Percent of maximum weighted usable area across run cross-sections with a minimum habitat quality of 0.5 for all
10 focal species at all modeled flows for the Pecos River at Brotherton Ranch near Pandale. Shaded cells are those flows
meeting "enoughness" thresholds of 75 or 90 % (per requirements for each species).
Modeled
Flow
(FT³/S)
C. pro. D. arg. N. ama. N. bra. M. con. A. mex. L. meg. M. sal. E. gra. C. cya.
1 56% 73% 62% 32% 55% 82% 67% 60% 63% 68%
5 69% 85% 75% 46% 71% 87% 84% 75% 76% 82%
10 74% 89% 82% 59% 80% 88% 93% 87% 81% 89%
15 77% 94% 86% 65% 83% 90% 95% 95% 84% 93%
20 81% 97% 89% 71% 86% 90% 98% 97% 88% 97%
25 84% 100% 91% 75% 88% 92% 99% 97% 91% 99%
30 85% 100% 96% 77% 91% 92% 100% 100% 91% 98%
35 88% 100% 97% 83% 91% 89% 98% 100% 94% 100%
40 88% 98% 97% 86% 95% 86% 98% 99% 94% 99%
45 89% 94% 99% 87% 95% 87% 90% 98% 94% 98%
50 91% 94% 99% 89% 98% 84% 89% 96% 96% 98%
55 92% 93% 99% 90% 98% 85% 87% 95% 96% 96%
60 92% 91% 100% 91% 98% 86% 85% 93% 94% 95%
65 92% 98% 100% 93% 97% 100% 79% 90% 94% 92%
70 92% 96% 99% 94% 100% 96% 82% 89% 94% 91%
75 92% 95% 99% 95% 100% 96% 79% 88% 93% 89%
80 93% 92% 98% 96% 99% 96% 78% 86% 92% 87%
85 93% 91% 97% 98% 99% 94% 76% 84% 92% 83%
90 100% 90% 96% 100% 100% 94% 74% 83% 100% 90%
95 100% 89% 95% 100% 98% 93% 72% 86% 100% 90%
100 98% 84% 92% 100% 96% 92% 70% 84% 98% 88%
125 95% 76% 82% 99% 90% 83% 61% 71% 93% 80%
150 93% 71% 77% 98% 96% 79% 63% 67% 89% 73%
175 85% 69% 70% 100% 87% 73% 60% 63% 84% 67%
200 80% 62% 65% 96% 81% 64% 51% 59% 79% 63%
250 69% 53% 52% 84% 69% 57% 41% 50% 72% 53%
300 61% 42% 42% 74% 56% 51% 36% 42% 59% 42%
350 56% 41% 36% 68% 49% 39% 30% 33% 56% 39%
400 49% 41% 31% 62% 42% 42% 23% 27% 49% 33%
500 39% 28% 19% 45% 25% 32% 11% 14% 41% 21%

3-85
Figure 3.7-15. Habitat frequency curves for 10 focal species for the full period of record of historical flows (2007-2012) at the
USGS gage at the Pecos River at Brotherton Ranch near Pandale.
45%
55%
65%
75%
85%
95%
0.00% 10.00% 20.00% 30.00% 40.00% 50.00% 60.00% 70.00% 80.00% 90.00% 100.00%
Pe
rce
nt
of
Max
imu
m W
UA
Percent of Time Equaled or Exceeded
Pecos River near Pandale - USGS 2007-2012
E. gra. C. pro. D. arg. N. bra. N. ama. A. mex. M. con. L. meg. M. sal. C. cya.
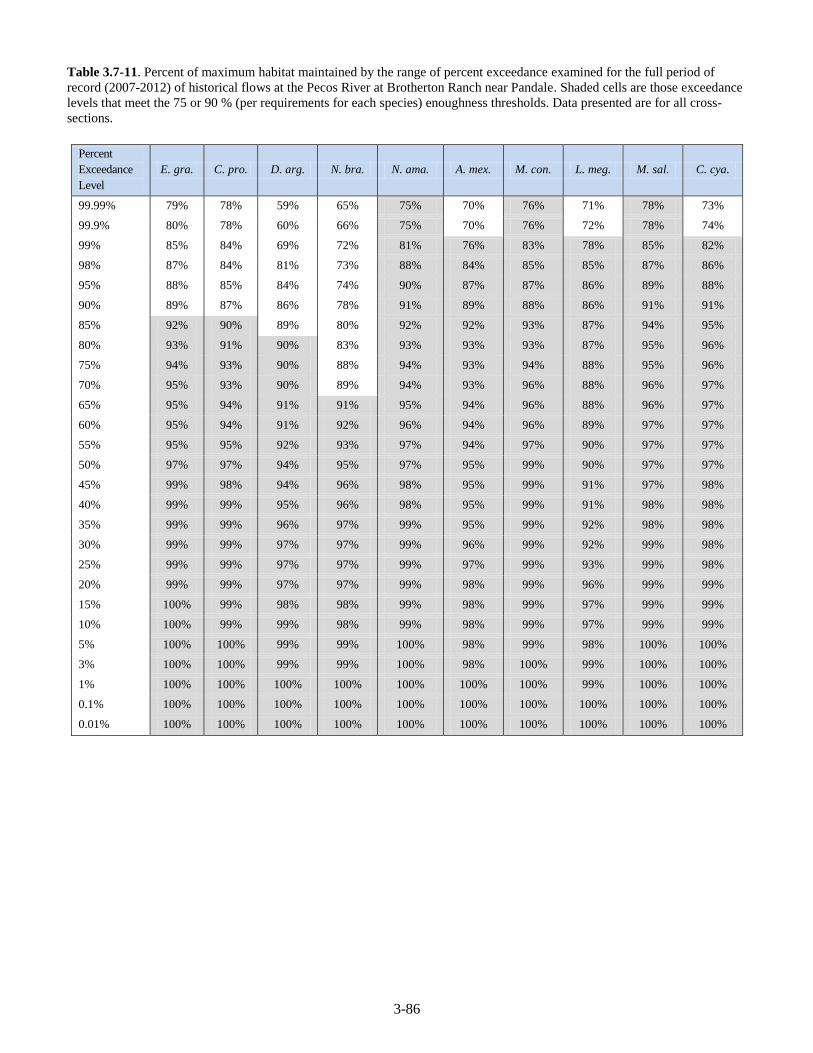
3-86
Table 3.7-11. Percent of maximum habitat maintained by the range of percent exceedance examined for the full period of
record (2007-2012) of historical flows at the Pecos River at Brotherton Ranch near Pandale. Shaded cells are those exceedance
levels that meet the 75 or 90 % (per requirements for each species) enoughness thresholds. Data presented are for all cross-
sections.
Percent
Exceedance
Level
E. gra. C. pro. D. arg. N. bra. N. ama. A. mex. M. con. L. meg. M. sal. C. cya.
99.99% 79% 78% 59% 65% 75% 70% 76% 71% 78% 73%
99.9% 80% 78% 60% 66% 75% 70% 76% 72% 78% 74%
99% 85% 84% 69% 72% 81% 76% 83% 78% 85% 82%
98% 87% 84% 81% 73% 88% 84% 85% 85% 87% 86%
95% 88% 85% 84% 74% 90% 87% 87% 86% 89% 88%
90% 89% 87% 86% 78% 91% 89% 88% 86% 91% 91%
85% 92% 90% 89% 80% 92% 92% 93% 87% 94% 95%
80% 93% 91% 90% 83% 93% 93% 93% 87% 95% 96%
75% 94% 93% 90% 88% 94% 93% 94% 88% 95% 96%
70% 95% 93% 90% 89% 94% 93% 96% 88% 96% 97%
65% 95% 94% 91% 91% 95% 94% 96% 88% 96% 97%
60% 95% 94% 91% 92% 96% 94% 96% 89% 97% 97%
55% 95% 95% 92% 93% 97% 94% 97% 90% 97% 97%
50% 97% 97% 94% 95% 97% 95% 99% 90% 97% 97%
45% 99% 98% 94% 96% 98% 95% 99% 91% 97% 98%
40% 99% 99% 95% 96% 98% 95% 99% 91% 98% 98%
35% 99% 99% 96% 97% 99% 95% 99% 92% 98% 98%
30% 99% 99% 97% 97% 99% 96% 99% 92% 99% 98%
25% 99% 99% 97% 97% 99% 97% 99% 93% 99% 98%
20% 99% 99% 97% 97% 99% 98% 99% 96% 99% 99%
15% 100% 99% 98% 98% 99% 98% 99% 97% 99% 99%
10% 100% 99% 99% 98% 99% 98% 99% 97% 99% 99%
5% 100% 100% 99% 99% 100% 98% 99% 98% 100% 100%
3% 100% 100% 99% 99% 100% 98% 100% 99% 100% 100%
1% 100% 100% 100% 100% 100% 100% 100% 99% 100% 100%
0.1% 100% 100% 100% 100% 100% 100% 100% 100% 100% 100%
0.01% 100% 100% 100% 100% 100% 100% 100% 100% 100% 100%

3-87
3.7.4 Geomorphology overlay
Little work has been done on sediment transport and geomorphic processes on the Pecos River. The Upper Pecos
traverses the sediments of the Pecos Alluvium, and thus, has a large sediment supply in this alluvial reach. The
lower Pecos is generally confined within bedrock, and the remaining alluvial portions of the bottomland are
generally overfit due to reductions in flow over the last 100 years. The invasion of non-native salt cedar is believed
to have stabilized sediments in some of the alluvial reaches in the upper Pecos, however, removal of this vegetation
in other reaches is believed to have resulted in increased erosion. Areas of sediment storage and evacuation have
not been explicitly identified, and the direct role of salt cedar in driving the storage and evacuation of sediment is
not well understood. A comprehensive geomorphic history over the last century should be constructed to better
understand the geomorphic evolution of the Pecos River. Studies of sediment transport processes in association
with other geomorphic factors such as valley and channel width, gradient, grain size of channel sediments, and
relative density of vegetation will help shed light on the geomorphic behavior of the Pecos River. We consider this
an important item for the BBASC to consider in adaptive management.
The fish community within the Pecos River is known to respond to such flow events and the channel changes that
high flow pulses and overbank flows produce (Harrell 1978). However, the role that geomorphic processes have in
determining the available aquatic habitat, and the flows that drive these geomorphic processes are not understood.
A stronger understanding of geomorphic processes and their dependence on flows, particularly high flow pulses
and overbank flows, is needed for the Pecos River. We consider this an important item for the BBASC to consider
in adaptive management.

3-88
3.8 Devils
3.8.1 Hydrology-based Environmental Flow Regimes
Development of initial hydrology-based flow regimes for the two Devils River sub-basin gages followed the
methods and parameters described in Section 3.3. No modifications were made to the hydrology-based flow
regimes based on the water quality overlay (see Section 3.8.2), but some modifications were made at the Devils
River near Juno according to flow-habitat modeling results as a main component of the biological overlay (see
Section 3.8.3).
Table 3.8-1. Environmental flow components and their functions in the Devils River sub-basin.
Flow
Component
Hydrology Geomorphology Biology Water Quality
No-Flow
Periods
Flow ceases
between
perennial pools
Generally stressful for fish communities
-Isolated pool habitats increase predation on
prey species
-Poor water quality, predator stress, and high
biomass in isolated pool habitats increases
chances for disease and parasite outbreaks
-Pool habitats are avoided by D. argentosa
(Cantu and Winemiller 1997)
Temperatures rise
and oxygen levels
decrease.
- Temperatures held
at thermal extremes
stress fish community
(i.e. shallow isolated
pools)
Subsistence
Flows
Infrequent low
flows
Increased
deposition of fine
and organic
particles
Provide restricted aquatic habitat limit
connectivity
- Loss of spring flow and instream habitats,
reductions in water quality are a threat to D.
argentosa (Edwards 1999)
- Reduced water quality and quantity one of
reasons for extirpation of D. diaboli in
Sycamore Creek
- C. proserpina is intolerant of lentic conditions
resulting from reservoir construction (Williams
et al. 1985; Bonner et al. 2008) and is
threatened by decreased spring flows, habitat
loss and fragmentation, and alteration of flow
regimes (Bonner et al. 2008)
Elevate temperature
and constituent
concentrations
Maintain adequate
levels of dissolved
oxygen
Base Flows Average flow
condition,
including
variability
Maintain soil
moisture and
ground water
table
Maintain a
diversity of
habitats
Provide suitable aquatic habitat, Provide
connectivity along channel corridor
- Dionda diaboli, D. argentosa, and C.
proserpina rely on spring fed systems and
habitats (Harrell 1978, Hubbs 1995, Bonner et
al. 2005)
-D. argentosa reproduction from fall – spring
with peak in Fall in Devils River (Cantu and
Winemiller 1997)
-D. diaboli are likely broadcast spawners
(Gibson et al. 2004) with reproduction
occurring in the spring (Edwards 1999, Garrett
2002). Spawning activity and breeding colors
were noted in Pinto Creek in December
(Edwards 2003)
-C. proserpina spawning season from late
spring to early fall in Devils River (Valdes and
Winemiller 1997; Bonner et al. 2008).
- E. grahami spawns late March to early June
(Harrell 1980)
- C. cyanoguttatum in NE Mexico spawn during
late spring (Darnell 1962; Birkhead 1980)
Provide suitable in-
channel water quality

3-89
High Flow
Pulses
In channel
short duration,
high flows
Maintain channel
and substrate
characteristics;
Prevent
encroachment of
riparian
vegetation
Serve as recruitment events for organisms;
Provide connectivity to near-channel water
bodies
-D. argentosa and N. amabilis are adapted to
flood prone environments (Harrell 1978)
- M. congestum spawns during Feb/Mar and
then again in April/May (Bean 2006, Bean and
Bonner 2008) in central Tx stream
-D. diaboli needs maintenance of gravel-cobble
substrates and aquatic vegetation (Edwards
1999, Garrett et al. 2004)
Restore in-channel
water quality after
prolonged low flow
periods.
Overbank
flows
Infrequent high
flows that
exceed the
channel
Provide lateral
channel
movement and
floodplain
maintenance;
Recharge
floodplain water
table; form new
habitats; flush
organic material
into channel;
Deposit nutrients
in floodplain
Provide new life phase cues for organisms;
Maintain diversity of riparian vegetation;
Provide conditions for seedling development;
Provide connectivity to floodplain
-Post-flooding proserpine shiners gain bio-mass
riverwide, shifting toward intermediate-type
habitats between channels and pools (Harrell
1978)
-N. amabilis were collected in intermediate
habitats between channels and pools and post-
flood were collected from riffles and similar
habitats (Harrell 1978). Spawning occurs in
central Tx stream from Feb – Sept. (Littrell
2006, Miller et al. 2005)
Restore water quality
in floodplain water
bodies
Channel
Maintenance
For most
streams,
channel
maintenance
occurs mostly
during pulse
and overbank
flows
Long-term
maintenance of
existing channel
morphology
Maintains foundation for physical habitat
features instream
-Diversity of instream habitat important to
maintain feeding, spawning, and nursery
habitats for fish
-D. argentosa utilize many instream habitats
(not found in isolated pools or pools with no
flowing water; Cantu and Winemiller 1997)
Water quality
condition like those
during pulse
overbank flows
3.8.2 Water Quality overlay
The Devils River is a single segment that extends from the confluence of Little Satan Creek in Val Verde County to
the confluence of Dry Devils River in Sutton County. Water quality is monitored at several locations throughout
this reach from Baker’s Crossing (at the location of the near Juno gage) near the headwaters to Pafford’s Crossing
where the Devils flows into Lake Amistad.
As previously noted, the Devils River is one of the most pristine water bodies in Texas and a great deal has been
done to protect the quality of the river by protecting the watershed. Currently, the Devils River is fully supporting
all of the designated uses and water quality criteria. However, increasing oil and gas production in the watershed
poses a threat to water quality. Of the water quality parameters most likely to be flow-related, there have been no
violations of dissolved oxygen and temperature standards though TDS concentrations are increasing so that the
average is very near the water quality criterion for Segment 2309.
Figure 3.8-1 shows the general dilute characteristics of the Devils River as measured just below Dolan Falls
downstream from the near Juno gage and Pafford’s Crossing. The TDS is slightly higher upstream at the Dolan
Falls site. A general trend of increasing TDS is observed in the Pafford’s crossing data, with a slope of 0.0017
indicating an increase of 0.62 mg/L per year. Figure 3.8-2 shows the TDS for the Devils River at Pafford’s
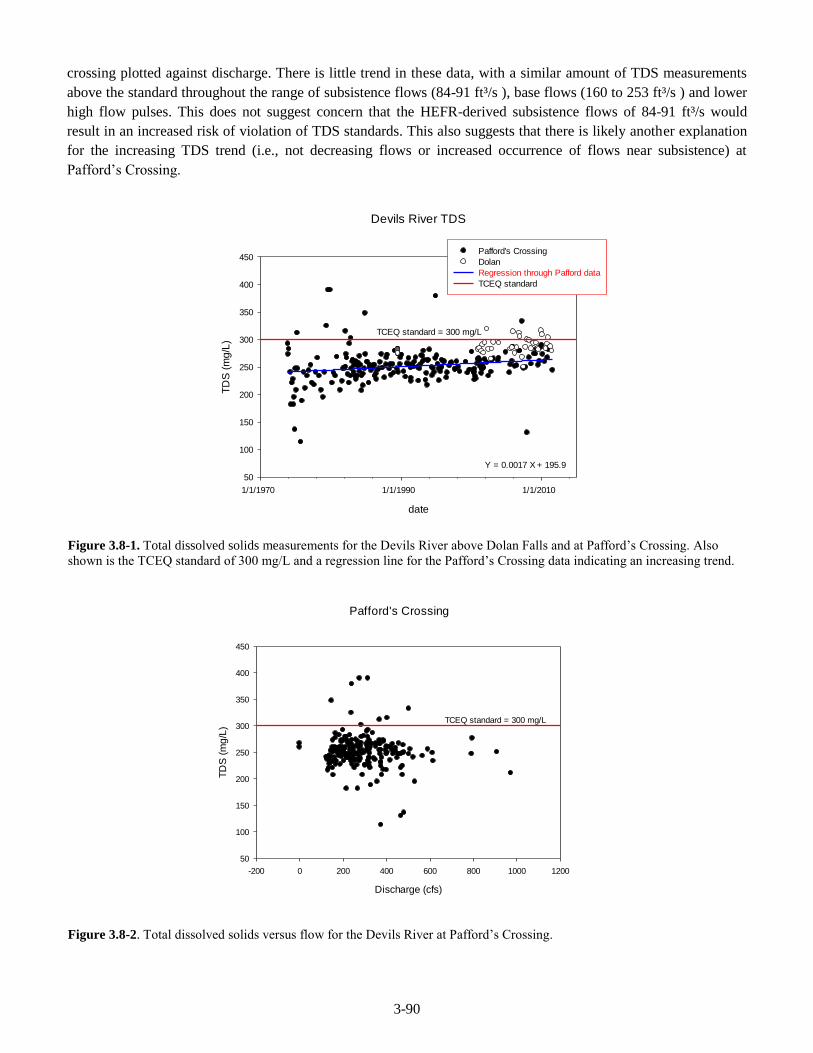
3-90
crossing plotted against discharge. There is little trend in these data, with a similar amount of TDS measurements
above the standard throughout the range of subsistence flows (84-91 ft³/s ), base flows (160 to 253 ft³/s ) and lower
high flow pulses. This does not suggest concern that the HEFR-derived subsistence flows of 84-91 ft³/s would
result in an increased risk of violation of TDS standards. This also suggests that there is likely another explanation
for the increasing TDS trend (i.e., not decreasing flows or increased occurrence of flows near subsistence) at
Pafford’s Crossing.
Devils River TDS
date
1/1/1970 1/1/1990 1/1/2010
TD
S (
mg
/L)
50
100
150
200
250
300
350
400
450Pafford's Crossing
Dolan
Regression through Pafford data
TCEQ standard
TCEQ standard = 300 mg/L
Y = 0.0017 X + 195.9
Figure 3.8-1. Total dissolved solids measurements for the Devils River above Dolan Falls and at Pafford’s Crossing. Also
shown is the TCEQ standard of 300 mg/L and a regression line for the Pafford’s Crossing data indicating an increasing trend.
Pafford's Crossing
Discharge (cfs)
-200 0 200 400 600 800 1000 1200
TD
S (
mg
/L)
50
100
150
200
250
300
350
400
450
TCEQ standard = 300 mg/L
Figure 3.8-2. Total dissolved solids versus flow for the Devils River at Pafford’s Crossing.
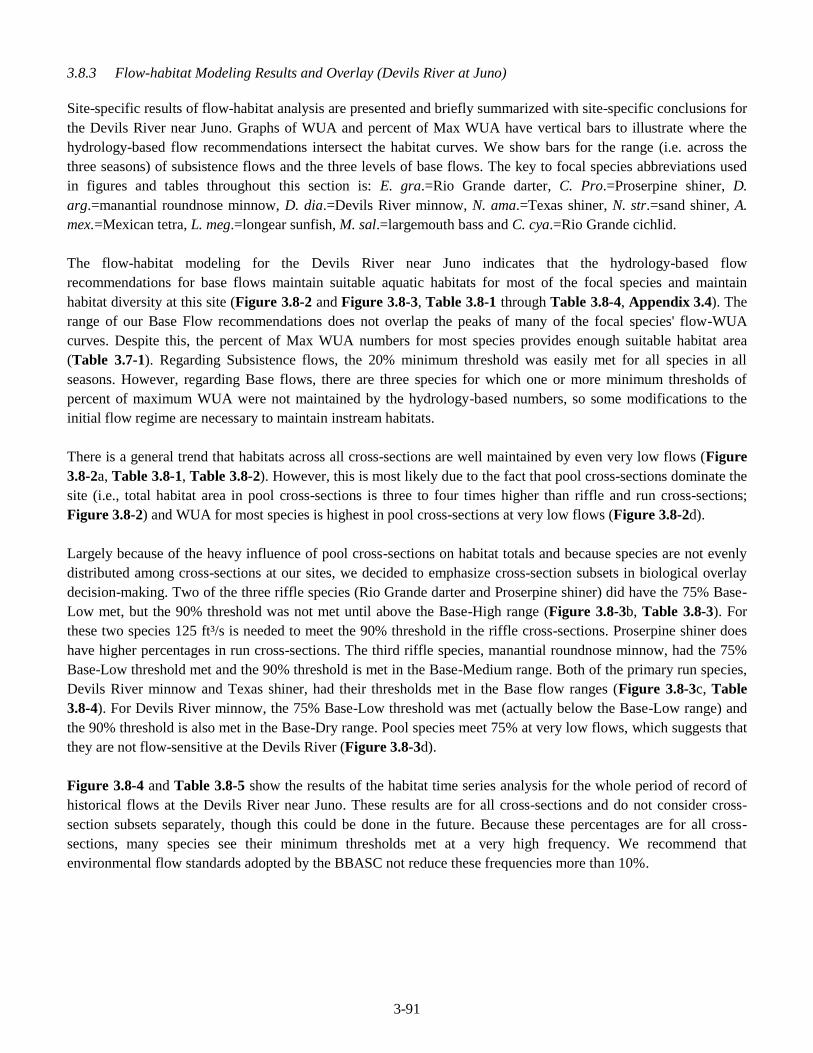
3-91
3.8.3 Flow-habitat Modeling Results and Overlay (Devils River at Juno)
Site-specific results of flow-habitat analysis are presented and briefly summarized with site-specific conclusions for
the Devils River near Juno. Graphs of WUA and percent of Max WUA have vertical bars to illustrate where the
hydrology-based flow recommendations intersect the habitat curves. We show bars for the range (i.e. across the
three seasons) of subsistence flows and the three levels of base flows. The key to focal species abbreviations used
in figures and tables throughout this section is: E. gra.=Rio Grande darter, C. Pro.=Proserpine shiner, D.
arg.=manantial roundnose minnow, D. dia.=Devils River minnow, N. ama.=Texas shiner, N. str.=sand shiner, A.
mex.=Mexican tetra, L. meg.=longear sunfish, M. sal.=largemouth bass and C. cya.=Rio Grande cichlid.
The flow-habitat modeling for the Devils River near Juno indicates that the hydrology-based flow
recommendations for base flows maintain suitable aquatic habitats for most of the focal species and maintain
habitat diversity at this site (Figure 3.8-2 and Figure 3.8-3, Table 3.8-1 through Table 3.8-4, Appendix 3.4). The
range of our Base Flow recommendations does not overlap the peaks of many of the focal species' flow-WUA
curves. Despite this, the percent of Max WUA numbers for most species provides enough suitable habitat area
(Table 3.7-1). Regarding Subsistence flows, the 20% minimum threshold was easily met for all species in all
seasons. However, regarding Base flows, there are three species for which one or more minimum thresholds of
percent of maximum WUA were not maintained by the hydrology-based numbers, so some modifications to the
initial flow regime are necessary to maintain instream habitats.
There is a general trend that habitats across all cross-sections are well maintained by even very low flows (Figure
3.8-2a, Table 3.8-1, Table 3.8-2). However, this is most likely due to the fact that pool cross-sections dominate the
site (i.e., total habitat area in pool cross-sections is three to four times higher than riffle and run cross-sections;
Figure 3.8-2) and WUA for most species is highest in pool cross-sections at very low flows (Figure 3.8-2d).
Largely because of the heavy influence of pool cross-sections on habitat totals and because species are not evenly
distributed among cross-sections at our sites, we decided to emphasize cross-section subsets in biological overlay
decision-making. Two of the three riffle species (Rio Grande darter and Proserpine shiner) did have the 75% Base-
Low met, but the 90% threshold was not met until above the Base-High range (Figure 3.8-3b, Table 3.8-3). For
these two species 125 ft³/s is needed to meet the 90% threshold in the riffle cross-sections. Proserpine shiner does
have higher percentages in run cross-sections. The third riffle species, manantial roundnose minnow, had the 75%
Base-Low threshold met and the 90% threshold is met in the Base-Medium range. Both of the primary run species,
Devils River minnow and Texas shiner, had their thresholds met in the Base flow ranges (Figure 3.8-3c, Table
3.8-4). For Devils River minnow, the 75% Base-Low threshold was met (actually below the Base-Low range) and
the 90% threshold is also met in the Base-Dry range. Pool species meet 75% at very low flows, which suggests that
they are not flow-sensitive at the Devils River (Figure 3.8-3d).
Figure 3.8-4 and Table 3.8-5 show the results of the habitat time series analysis for the whole period of record of
historical flows at the Devils River near Juno. These results are for all cross-sections and do not consider cross-
section subsets separately, though this could be done in the future. Because these percentages are for all cross-
sections, many species see their minimum thresholds met at a very high frequency. We recommend that
environmental flow standards adopted by the BBASC not reduce these frequencies more than 10%.

3-92
3.8.3.1 Effects of flow-habitat analysis on environmental flow recommendations
As a result of this analysis we made two modifications to the hydrology-based flow regimes in the Base flow range.
We felt that we needed to have 125 ft³/s in at least some portion of the flow regime because it is the minimum flow
needed to maintain two of our riffle species. Because the spring spawning season is the most important time for
habitat maintenance, we chose to increase the base flows for only this season. We increased the Spring base flow to
125 ft³/s for both the Base-Medium and Base-High tiers. We considered simplification of the flow regime (i.e.,
reducing the number of tiers of base flow), but did not see a strong reason for this at the Devils River.
Figure 3.8-1. Four ranges of weighted usable habitat area quality (<0.5, 0.5-0.75, >0.75, and total) versus modeled flow (ft³/s)
for Devils River minnow (Dionda diaboli) at the Devils River near Juno.
0
100000
200000
300000
400000
500000
600000
700000
800000
0 50 100 150 200 250 300 350 400 450 500
WU
A (
squ
are
fe
et)
Flows (CFS)
Devils River at Juno - Devils River Minnow
<0.5 0.5-0.75 >0.75 Total

3-93
Figure 3.8-2. Weighted usable habitat area with a 0.5 minimum quality threshold versus modeled flow (ft³/s) for 10 focal
species at the Devils River near Juno. Shown are WUA versus flow relationships for a) all cross-sections, b) riffle cross-
sections, c) run cross-sections and d) pool cross-sections. Vertical bars bracket environmental flow regime components.
0
100000
200000
300000
400000
500000
600000
700000
800000
900000
1000000
0 50 100 150 200
WU
A -
sq. f
t
Discharge (cfs)
Weighted Usable Area versus Simulated Discharge Devils at TPWD SNA and TNC Preserve U/S of Dolan creek confluence (Total
Total)
E. gra. C. pro. D. arg. D. dia. N. ama. A. mex. N. str. L. meg. M. sal. C. cya.
0
20000
40000
60000
80000
100000
120000
140000
160000
180000
0 50 100 150 200
WU
A -
sq. f
t
Discharge (cfs)
Weighted Usable Area versus Simulated Discharge Devils at TPWD SNA and TNC Preserve U/S of Dolan creek confluence (Riffle
Total)
E. gra. C. pro. D. arg. D. dia. N. ama. A. mex. N. str. L. meg. M. sal. C. cya.
a.
b.
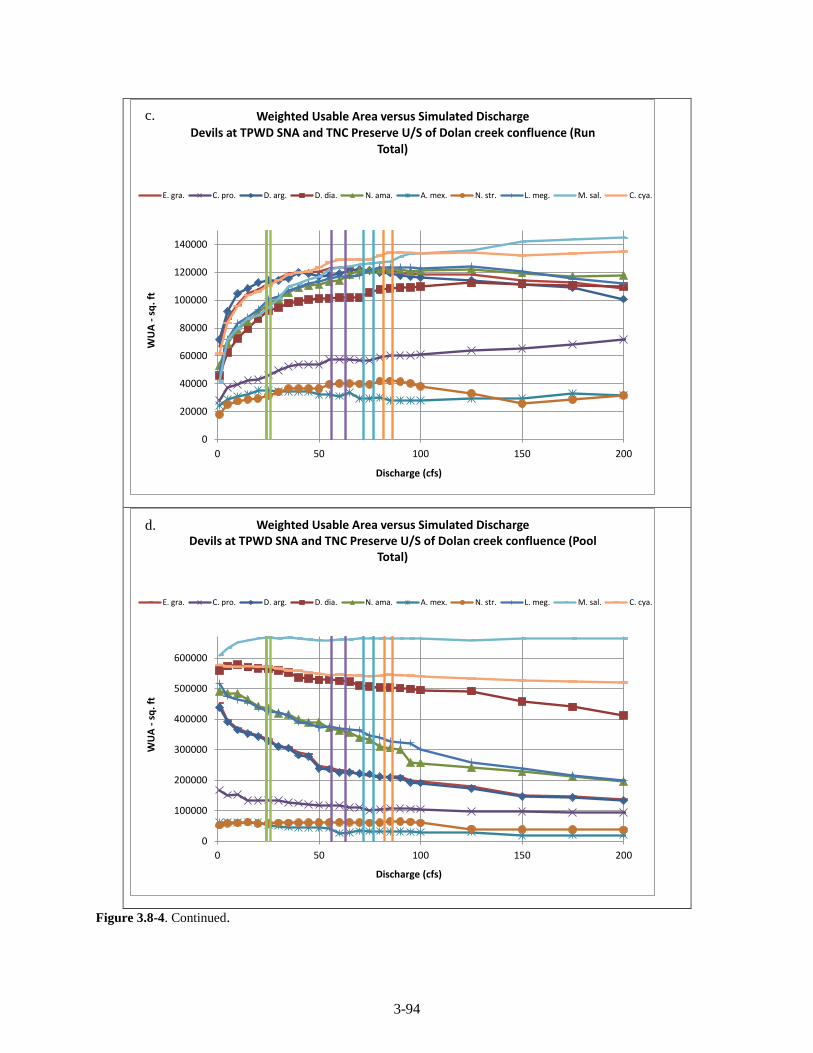
3-94
Figure 3.8-4. Continued.
0
20000
40000
60000
80000
100000
120000
140000
0 50 100 150 200
WU
A -
sq.
ft
Discharge (cfs)
Weighted Usable Area versus Simulated Discharge Devils at TPWD SNA and TNC Preserve U/S of Dolan creek confluence (Run
Total)
E. gra. C. pro. D. arg. D. dia. N. ama. A. mex. N. str. L. meg. M. sal. C. cya.
0
100000
200000
300000
400000
500000
600000
0 50 100 150 200
WU
A -
sq. f
t
Discharge (cfs)
Weighted Usable Area versus Simulated Discharge Devils at TPWD SNA and TNC Preserve U/S of Dolan creek confluence (Pool
Total)
E. gra. C. pro. D. arg. D. dia. N. ama. A. mex. N. str. L. meg. M. sal. C. cya.
d.
c.

3-95
0%
10%
20%
30%
40%
50%
60%
70%
80%
90%
100%
0 50 100 150 200
Pe
rce
nt
Discharge (cfs)
Percent of Maximum WUA versus Simulated Discharge Devils at TPWD SNA and TNC Preserve U/S of Dolan creek confluence
(xsec13_Total Total)
E. gra. C. pro. D. arg. D. dia. N. ama. A. mex. N. str. L. meg. M. sal. C. cya.
0%
10%
20%
30%
40%
50%
60%
70%
80%
90%
100%
0 50 100 150 200
Pe
rce
nt
Discharge (cfs)
Percent of Maximum WUA versus Simulated Discharge Devils at TPWD SNA and TNC Preserve U/S of Dolan creek confluence
(xsec10_Riffle Total)
E. gra. C. pro. D. arg. D. dia. N. ama. A. mex. N. str. L. meg. M. sal. C. cya.
a.
b.
Figure 3.8-5. Graphs a) and b).

3-96
Figure 3.8-3. Percent of maximum weighted usable habitat area with a 0.5 minimum quality threshold versus modeled flow
(ft³/s) for 10 focal species at the Devils River near Juno. Shown are percent of maximum WUA versus flow relationships for a)
all cross-sections, b) riffle cross-sections, 3) run cross-sections and d) pool cross-sections
0%
10%
20%
30%
40%
50%
60%
70%
80%
90%
100%
0 50 100 150 200
Pe
rce
nt
Discharge (cfs)
Percent of Maximum WUA versus Simulated Discharge Devils at TPWD SNA and TNC Preserve U/S of Dolan creek confluence
(xsec11_Run Total)
E. gra. C. pro. D. arg. D. dia. N. ama. A. mex. N. str. L. meg. M. sal. C. cya.
0%
10%
20%
30%
40%
50%
60%
70%
80%
90%
100%
0 50 100 150 200
Pe
rce
nt
Discharge (cfs)
Percent of Maximum WUA versus Simulated Discharge Devils at TPWD SNA and TNC Preserve U/S of Dolan creek confluence
(xsec12_Pool Total)
E. gra. C. pro. D. arg. D. dia. N. ama. A. mex. N. str. L. meg. M. sal. C. cya.
d.
c.
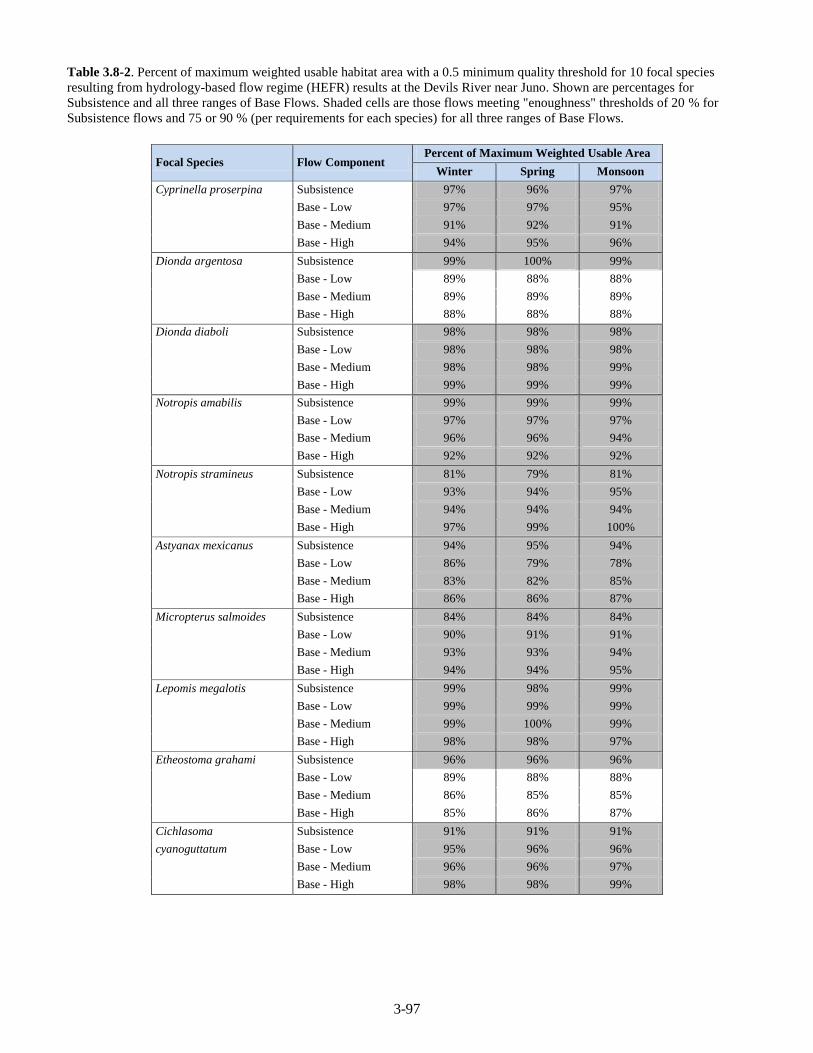
3-97
Table 3.8-2. Percent of maximum weighted usable habitat area with a 0.5 minimum quality threshold for 10 focal species
resulting from hydrology-based flow regime (HEFR) results at the Devils River near Juno. Shown are percentages for
Subsistence and all three ranges of Base Flows. Shaded cells are those flows meeting "enoughness" thresholds of 20 % for
Subsistence flows and 75 or 90 % (per requirements for each species) for all three ranges of Base Flows.
Focal Species Flow Component Percent of Maximum Weighted Usable Area
Winter Spring Monsoon
Cyprinella proserpina Subsistence 97% 96% 97%
Base - Low 97% 97% 95%
Base - Medium 91% 92% 91%
Base - High 94% 95% 96%
Dionda argentosa Subsistence 99% 100% 99%
Base - Low 89% 88% 88%
Base - Medium 89% 89% 89%
Base - High 88% 88% 88%
Dionda diaboli Subsistence 98% 98% 98%
Base - Low 98% 98% 98%
Base - Medium 98% 98% 99%
Base - High 99% 99% 99%
Notropis amabilis Subsistence 99% 99% 99%
Base - Low 97% 97% 97%
Base - Medium 96% 96% 94%
Base - High 92% 92% 92%
Notropis stramineus Subsistence 81% 79% 81%
Base - Low 93% 94% 95%
Base - Medium 94% 94% 94%
Base - High 97% 99% 100%
Astyanax mexicanus Subsistence 94% 95% 94%
Base - Low 86% 79% 78%
Base - Medium 83% 82% 85%
Base - High 86% 86% 87%
Micropterus salmoides Subsistence 84% 84% 84%
Base - Low 90% 91% 91%
Base - Medium 93% 93% 94%
Base - High 94% 94% 95%
Lepomis megalotis Subsistence 99% 98% 99%
Base - Low 99% 99% 99%
Base - Medium 99% 100% 99%
Base - High 98% 98% 97%
Etheostoma grahami Subsistence 96% 96% 96%
Base - Low 89% 88% 88%
Base - Medium 86% 85% 85%
Base - High 85% 86% 87%
Cichlasoma Subsistence 91% 91% 91%
cyanoguttatum Base - Low 95% 96% 96%
Base - Medium 96% 96% 97%
Base - High 98% 98% 99%

3-98
Table 3.8-3. Percent of maximum weighted usable area across all cross-sections with a minimum habitat quality of 0.5 for all
10 focal species at all modeled flows for the Devils River near Juno. Shaded cells are those flows meeting "enoughness"
thresholds of 75 or 90 % (per requirements for each species).
Modeled
Flow
(FT³/S)
C. pro. D. arg. D. dia. N. ama. N. str. A. mex. M. sal. L. meg. E. gra. C. cya.
1 100% 90% 100% 86% 94% 68% 51% 100% 69% 79%
5 95% 92% 98% 91% 97% 84% 67% 97% 76% 83%
10 94% 96% 98% 94% 100% 90% 72% 98% 79% 85%
15 95% 91% 99% 95% 99% 97% 76% 99% 81% 88%
20 96% 94% 100% 96% 98% 100% 76% 98% 83% 89%
25 96% 97% 100% 98% 99% 94% 80% 98% 84% 91%
30 94% 99% 98% 98% 98% 92% 85% 99% 85% 91%
35 95% 97% 99% 99% 100% 92% 88% 100% 87% 92%
40 94% 97% 97% 97% 98% 93% 88% 98% 88% 93%
45 94% 96% 97% 97% 98% 92% 90% 98% 89% 93%
50 88% 96% 89% 97% 99% 89% 91% 97% 89% 95%
55 89% 97% 89% 98% 97% 89% 93% 98% 90% 95%
60 88% 97% 88% 98% 97% 76% 95% 99% 91% 96%
65 88% 94% 89% 98% 98% 79% 95% 99% 91% 96%
70 85% 93% 89% 97% 96% 82% 94% 100% 92% 96%
75 86% 90% 89% 99% 96% 84% 93% 99% 93% 96%
80 85% 92% 88% 99% 92% 85% 95% 99% 94% 97%
85 87% 96% 88% 99% 92% 87% 100% 97% 95% 98%
90 86% 96% 88% 99% 91% 88% 99% 97% 96% 99%
95 84% 96% 85% 99% 84% 89% 98% 97% 96% 99%
100 84% 96% 85% 99% 84% 90% 95% 93% 96% 99%
125 83% 98% 82% 100% 84% 92% 82% 89% 97% 100%
150 77% 100% 76% 96% 83% 83% 77% 87% 100% 100%
175 76% 100% 75% 94% 80% 85% 79% 84% 100% 100%
200 74% 100% 72% 90% 78% 79% 81% 81% 100% 100%
250 68% 100% 65% 85% 74% 79% 78% 78% 100% 100%
300 60% 99% 59% 80% 70% 81% 80% 73% 100% 99%
350 58% 100% 58% 74% 67% 81% 84% 68% 100% 98%
400 57% 100% 55% 66% 61% 86% 94% 66% 100% 99%
500 54% 100% 52% 61% 59% 98% 100% 57% 100% 99%

3-99
Table 3.8-4. Percent of maximum weighted usable area across riffle cross-sections with a minimum habitat quality of 0.5 for
all 10 focal species at all modeled flows for the Devils River near Juno. Shaded cells are those flows meeting "enoughness"
thresholds of 75 or 90 % (per requirements for each species).
Modeled
Flow
(FT³/S)
C. pro. D. arg. D. dia. N. ama. N. str. A. mex. M. sal. L. meg. E. gra. C. cya.
1 11% 6% 4% 4% 12% 12% 2% 3% 5% 4%
5 28% 19% 8% 9% 33% 37% 5% 7% 14% 13%
10 38% 29% 15% 15% 41% 49% 10% 11% 21% 19%
15 46% 39% 23% 21% 46% 59% 13% 17% 28% 25%
20 54% 46% 28% 28% 55% 62% 19% 21% 36% 31%
25 57% 54% 35% 33% 59% 63% 23% 26% 43% 37%
30 61% 61% 39% 39% 65% 65% 28% 31% 49% 41%
35 62% 66% 45% 44% 68% 68% 33% 37% 55% 47%
40 63% 73% 49% 48% 70% 71% 38% 41% 60% 51%
45 66% 76% 51% 54% 73% 71% 43% 44% 64% 56%
50 67% 78% 55% 57% 75% 71% 47% 49% 70% 63%
55 68% 79% 58% 62% 75% 71% 49% 51% 72% 65%
60 68% 81% 63% 65% 78% 71% 52% 56% 75% 67%
65 68% 83% 66% 71% 79% 71% 56% 59% 77% 69%
70 69% 87% 71% 73% 77% 73% 59% 63% 78% 70%
75 71% 89% 78% 76% 80% 78% 64% 69% 81% 73%
80 72% 90% 80% 78% 80% 82% 68% 72% 82% 75%
85 75% 93% 83% 79% 84% 89% 73% 75% 86% 78%
90 77% 95% 85% 81% 84% 92% 79% 76% 87% 80%
95 77% 96% 86% 82% 85% 95% 81% 78% 88% 82%
100 80% 98% 88% 84% 87% 98% 83% 80% 90% 86%
125 91% 100% 94% 92% 97% 100% 91% 91% 96% 95%
150 100% 100% 100% 100% 100% 98% 100% 100% 100% 100%
175 100% 100% 100% 100% 100% 95% 100% 100% 100% 100%
200 100% 100% 100% 100% 100% 86% 100% 100% 100% 100%
250 100% 100% 100% 100% 100% 86% 100% 100% 100% 100%
300 100% 100% 100% 100% 100% 87% 100% 100% 100% 100%
350 100% 98% 100% 100% 100% 86% 100% 100% 100% 100%
400 100% 92% 100% 100% 100% 85% 100% 100% 97% 100%
500 100% 79% 100% 100% 100% 69% 100% 100% 87% 100%
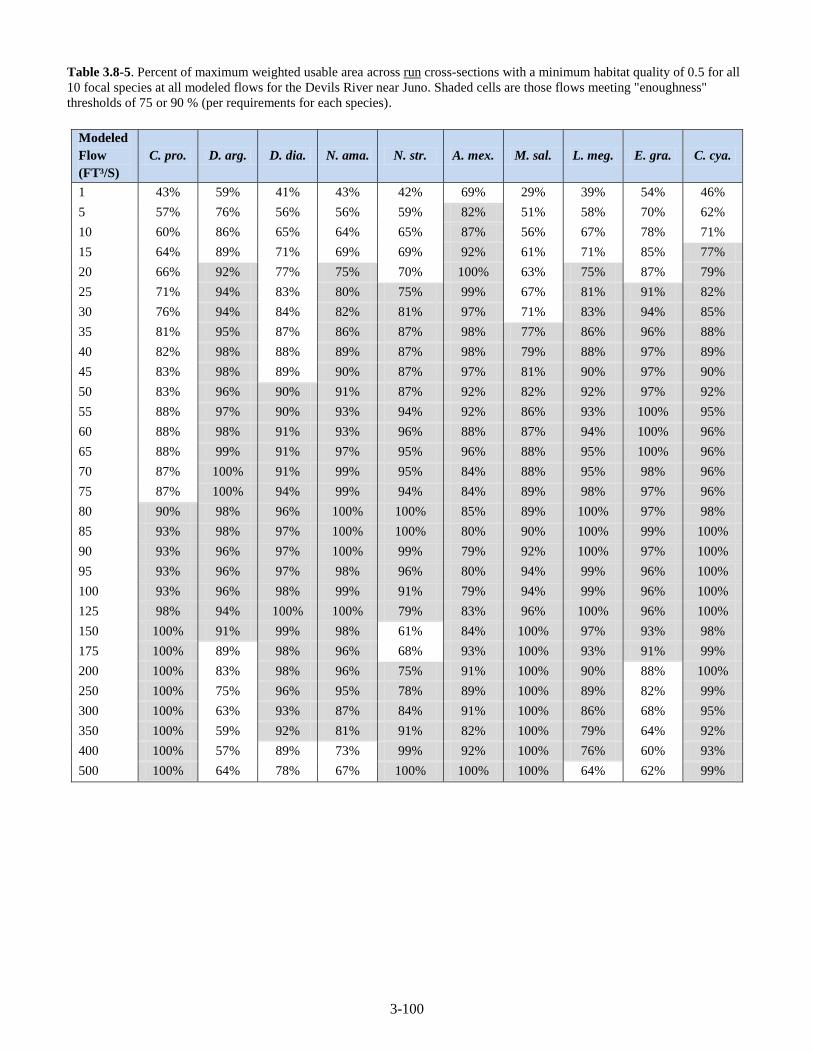
3-100
Table 3.8-5. Percent of maximum weighted usable area across run cross-sections with a minimum habitat quality of 0.5 for all
10 focal species at all modeled flows for the Devils River near Juno. Shaded cells are those flows meeting "enoughness"
thresholds of 75 or 90 % (per requirements for each species).
Modeled
Flow
(FT³/S)
C. pro. D. arg. D. dia. N. ama. N. str. A. mex. M. sal. L. meg. E. gra. C. cya.
1 43% 59% 41% 43% 42% 69% 29% 39% 54% 46%
5 57% 76% 56% 56% 59% 82% 51% 58% 70% 62%
10 60% 86% 65% 64% 65% 87% 56% 67% 78% 71%
15 64% 89% 71% 69% 69% 92% 61% 71% 85% 77%
20 66% 92% 77% 75% 70% 100% 63% 75% 87% 79%
25 71% 94% 83% 80% 75% 99% 67% 81% 91% 82%
30 76% 94% 84% 82% 81% 97% 71% 83% 94% 85%
35 81% 95% 87% 86% 87% 98% 77% 86% 96% 88%
40 82% 98% 88% 89% 87% 98% 79% 88% 97% 89%
45 83% 98% 89% 90% 87% 97% 81% 90% 97% 90%
50 83% 96% 90% 91% 87% 92% 82% 92% 97% 92%
55 88% 97% 90% 93% 94% 92% 86% 93% 100% 95%
60 88% 98% 91% 93% 96% 88% 87% 94% 100% 96%
65 88% 99% 91% 97% 95% 96% 88% 95% 100% 96%
70 87% 100% 91% 99% 95% 84% 88% 95% 98% 96%
75 87% 100% 94% 99% 94% 84% 89% 98% 97% 96%
80 90% 98% 96% 100% 100% 85% 89% 100% 97% 98%
85 93% 98% 97% 100% 100% 80% 90% 100% 99% 100%
90 93% 96% 97% 100% 99% 79% 92% 100% 97% 100%
95 93% 96% 97% 98% 96% 80% 94% 99% 96% 100%
100 93% 96% 98% 99% 91% 79% 94% 99% 96% 100%
125 98% 94% 100% 100% 79% 83% 96% 100% 96% 100%
150 100% 91% 99% 98% 61% 84% 100% 97% 93% 98%
175 100% 89% 98% 96% 68% 93% 100% 93% 91% 99%
200 100% 83% 98% 96% 75% 91% 100% 90% 88% 100%
250 100% 75% 96% 95% 78% 89% 100% 89% 82% 99%
300 100% 63% 93% 87% 84% 91% 100% 86% 68% 95%
350 100% 59% 92% 81% 91% 82% 100% 79% 64% 92%
400 100% 57% 89% 73% 99% 92% 100% 76% 60% 93%
500 100% 64% 78% 67% 100% 100% 100% 64% 62% 99%

3-101
Figure 3.8-4. Habitat frequency curves for 10 focal species for the full period of record of historical flows (1926-1949, 1963-
1972) at the USGS gage at the Devils River near Juno.
50%
55%
60%
65%
70%
75%
80%
85%
90%
95%
100%
0.00% 10.00% 20.00% 30.00% 40.00% 50.00% 60.00% 70.00% 80.00% 90.00% 100.00%
Pe
rce
nt
of
Max
imu
m W
UA
Percent of Time Equaled or Exceeded
Devils River at Juno - USGS 1926-1949, 1963-1972
E. gra. C. pro. D. arg. D. dia. N. ama. A. mex. N. str. L. meg. M. sal. C. cya.

3-102
Table 3.8-6. Percent of maximum habitat maintained by the range of percent exceedance examined for the full period of record
of historical flows at the Devils River near Juno. Shaded cells are those exceedance levels that meet the 75 or 90 % (per
requirements for each species) enoughness thresholds. Data presented are for all cross-sections.
Percent
Exceedance
Level
C. pro. D. arg. D. dia. N. ama. N. str. A. mex. M. sal. L. meg. E. gra. C. cya.
99.99% 90% 53% 62% 60% 76% 76% 81% 59% 54% 88%
99.9% 90% 55% 65% 61% 76% 76% 81% 64% 56% 88%
99% 90% 65% 85% 74% 77% 77% 83% 78% 68% 89%
98% 91% 74% 93% 80% 78% 78% 84% 83% 76% 90%
95% 91% 76% 96% 83% 78% 79% 84% 87% 77% 91%
90% 92% 80% 97% 83% 79% 81% 87% 89% 81% 92%
85% 93% 82% 97% 84% 81% 82% 88% 90% 83% 93%
80% 93% 84% 98% 84% 83% 83% 90% 92% 83% 95%
75% 94% 85% 98% 84% 86% 84% 91% 93% 84% 96%
70% 95% 85% 98% 84% 88% 85% 92% 97% 84% 96%
65% 96% 87% 98% 90% 89% 86% 93% 97% 85% 96%
60% 96% 88% 98% 91% 91% 86% 93% 97% 85% 96%
55% 96% 88% 98% 92% 93% 87% 94% 97% 85% 97%
50% 96% 88% 99% 92% 94% 87% 94% 98% 85% 98%
45% 96% 88% 99% 93% 94% 88% 94% 98% 86% 98%
40% 96% 88% 99% 95% 94% 89% 95% 98% 86% 99%
35% 97% 89% 99% 96% 95% 89% 96% 99% 87% 99%
30% 97% 89% 99% 97% 95% 90% 96% 99% 87% 99%
25% 97% 89% 99% 97% 96% 91% 97% 99% 88% 99%
20% 97% 89% 99% 98% 97% 91% 97% 99% 89% 100%
15% 98% 97% 99% 98% 98% 92% 97% 99% 94% 100%
10% 98% 98% 99% 99% 99% 92% 98% 99% 95% 100%
5% 100% 99% 100% 99% 99% 94% 100% 100% 96% 100%
3% 100% 100% 100% 99% 100% 97% 100% 100% 96% 100%
1% 100% 100% 100% 99% 100% 99% 100% 100% 96% 100%
0.1% 100% 100% 100% 100% 100% 99% 100% 100% 96% 100%
0.01% 100% 100% 100% 100% 100% 99% 100% 100% 96% 100%

3-103
3.8.4 Geomorphology overlay
Little work has been done on sediment transport and geomorphic processes on the Devils River. The relatively
short amount of time which the BBEST had to develop environmental flow recommendations did not permit in-
depth analysis of the relationships between Devils River channel shape, sediment dynamics and flow. The Devils
River has primarily a bedrock channel that is likely rather constant in its configuration. However, there is extensive
transport of coarse sediments in floods that likely plays an important role in maintaining instream habitat features.
The fish community is known to respond to such flow events and the channel changes they produce (Harrell 1978).
It is also possible that historical land uses such as grazing may have impacted these sediment dynamics. A stronger
understanding of these processes and their dependence on flows, particularly high flow pulses and overbank flows,
is needed for the Devils River. We consider this an important item for the BBASC to consider in adaptive
management.

4-1
Section 4. Environmental Flow Recommendations
4.1 Environmental Flow Regime Summaries
Table 4.1-1. Environmental Flow Regime Recommendation, Alamito Creek.
Overbank
Flows
Qp: 2,469 ft³/s with Average Frequency 1 per 5 years
Regressed Volume is 9,996
Regressed Duration is 6
High Flow
Pulses
Qp: 1,459 ft³/s with Average Frequency 1 per 2 years
Regressed Volume is 5,763
Regressed Duration is 6
Qp: 915 ft³/s with Average Frequency 1 per year
Regressed Volume is 3,535
Regressed Duration is 5
Qp: 2 ft³/s with Average
Frequency 1 per 2 seasons
Volume is 1,448
Duration is 4
Qp: 484 ft³/s with Average
Frequency 1 per 2 seasons
Volume is 1,448
Duration is 4
Qp: 1,250 ft³/s with
Average Frequency 1 per 2
seasons
Volume is 5,175
Duration is 6
Qp: 226 ft³/s with Average
Frequency 1 per season
Volume is 648
Duration is 4
Qp: 675 ft³/s with Average
Frequency 1 per season
Volume is 2,700
Duration is 6
Base Flows
(ft³/s )
1.8(49.5%) 1.8(36.9%) 1.8(49.4%)
1.4(67.5%) 1.4(47.4%) 1.4(58.5%)
1.1(85.1%) 1.1(69.5%) 1.1(74.9%)
Subsistence
Flows (ft³/s ) 0.71(97.8%) 0.71(87.0%) 0.71(87.8%)
Nov Dec Jan Feb Mar Apr May Jun Jul Aug Sep Oct
Winter Spring Monsoon
Flow Levels
High (75th %ile) Notes:
Medium (50th %ile) 1. Period of record: 1/1/1932 to 12/31/2009
Low (25th %ile) 2. Subsistence and base flows calculated using non-
zero flows only.
Subsistence

4-2
Table 4.1-2. Environmental Flow Regime Recommendation, Rio Grande below Rio Conchos near Presidio.
Channel
Resetting
Flows
Qp: Greater than 35,000 ft³/s with Average Frequency of 1 per 10 years
Overbank
Flows No flow recommendations
High Flow
Pulses
Qp: 10,500 ft³/s with Average Frequency 1 per year
Volume is 273,397
Duration is 5
Base Flows
(ft³/s )
901(38.2%) 675(32.4%) 816(60.6%)
590(58.8%) 348(50.5%) 537(72.8%)
367(78.0%) 227(65.3%) 310(84.5%)
Subsistence
Flows (ft³/s ) 95(98.6%) 52(89.6%) 80(96.8%)
Nov Dec Jan Feb Mar Apr May Jun Jul Aug Sep Oct
Winter Spring Monsoon
Flow Levels
High (75th %ile) Notes:
Medium (50th %ile)
1. Period of record: 1/1/1901 to 2/28/1914 and
3/1/1931 to 12/31/1967
Low (25th %ile) 2. Subsistence and base flows calculated using non-
zero flows only.
Subsistence

4-3
Table 4.1-3. Environmental Flow Regime Recommendation, Terlingua Creek.
Overbank
Flows
Qp: 5,933 ft³/s with Average Frequency 1 per 5 years
Volume is 18,999
Duration is 7
High Flow
Pulses
Qp: 3,673 ft³/s with Average Frequency 1 per 2 years
Volume is 11,913
Duration is 7
Qp: 2,370 ft³/s with Average Frequency 1 per year
Regressed Volume is 7,760
Regressed Duration is 6
Qp: 49 ft³/s with Average
Frequency 1 per 2 seasons
Volume is 241
Duration is 5
Qp: 1,621 ft³/s with Average
Frequency 1 per 2 seasons
Volume is 5,261
Duration is 5
Qp: 3,002 ft³/s with
Average Frequency 1 per 2
seasons
Volume is 9,961
Duration is 7
Qp: 6 ft³/s with Average
Frequency 1 per season
Volume is 111
Duration is 4
Qp: 950 ft³/s with Average
Frequency 1 per season
Volume is 3,079
Duration is 5
Qp: 2,041 ft³/s with
Average Frequency 1 per
season
Volume is 6,890
Duration is 7
Qp: 389 ft³/s with Average
Frequency 1 per season
Volume is 1,261
Duration is 4
Qp: 1,130 ft³/s with
Average Frequency 1 per
season
Volume is 3,899
Duration is 6
Base Flows
(ft³/s )
2.8(47.0%) 2.8(42.3%) 2.8(66.1%)
2.5(58.6%) 2.5(53.3%) 2.5(73.8%)
2.1(75.4%) 2.1(67.3%) 2.1(82.7%)
Subsistence
Flows (ft³/s ) 1.4(96.2%) 1.1(96.7%) 1.1(97.7%)
Nov Dec Jan Feb Mar Apr May Jun Jul Aug Sep Oct
Winter Spring Monsoon
Flow Levels
High (75th %ile) Notes:
Medium (50th %ile) 1. Period of record: 1/1/1932 to 12/31/2009
Low (25th %ile) 2. Subsistence and base flows calculated using non-
zero flows only.
Subsistence
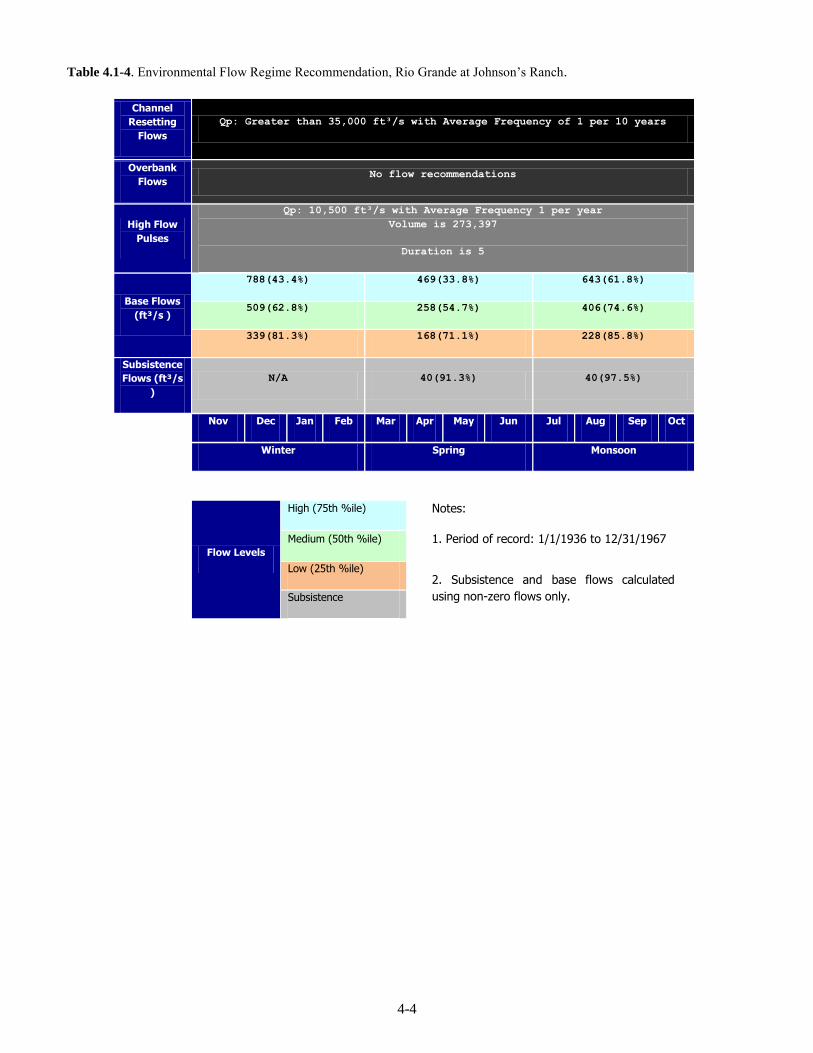
4-4
Table 4.1-4. Environmental Flow Regime Recommendation, Rio Grande at Johnson’s Ranch.
Channel
Resetting
Flows
Qp: Greater than 35,000 ft³/s with Average Frequency of 1 per 10 years
Overbank
Flows No flow recommendations
High Flow
Pulses
Qp: 10,500 ft³/s with Average Frequency 1 per year
Volume is 273,397
Duration is 5
Base Flows
(ft³/s )
788(43.4%) 469(33.8%) 643(61.8%)
509(62.8%) 258(54.7%) 406(74.6%)
339(81.3%) 168(71.1%) 228(85.8%)
Subsistence
Flows (ft³/s
)
N/A 40(91.3%) 40(97.5%)
Nov Dec Jan Feb Mar Apr May Jun Jul Aug Sep Oct
Winter Spring Monsoon
Flow Levels
High (75th %ile) Notes:
Medium (50th %ile) 1. Period of record: 1/1/1936 to 12/31/1967
Low (25th %ile) 2. Subsistence and base flows calculated
using non-zero flows only.
Subsistence
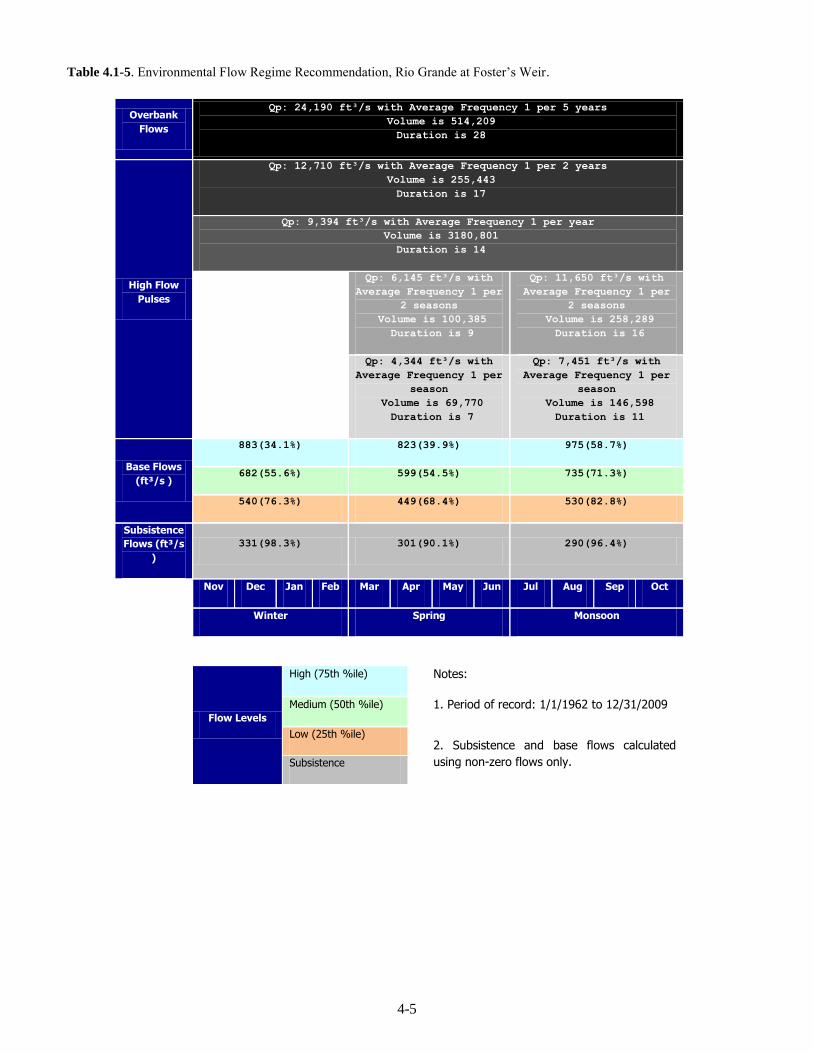
4-5
Table 4.1-5. Environmental Flow Regime Recommendation, Rio Grande at Foster’s Weir.
Overbank
Flows
Qp: 24,190 ft³/s with Average Frequency 1 per 5 years
Volume is 514,209
Duration is 28
High Flow
Pulses
Qp: 12,710 ft³/s with Average Frequency 1 per 2 years
Volume is 255,443
Duration is 17
Qp: 9,394 ft³/s with Average Frequency 1 per year
Volume is 3180,801
Duration is 14
Qp: 6,145 ft³/s with
Average Frequency 1 per
2 seasons
Volume is 100,385
Duration is 9
Qp: 11,650 ft³/s with
Average Frequency 1 per
2 seasons
Volume is 258,289
Duration is 16
Qp: 4,344 ft³/s with
Average Frequency 1 per
season
Volume is 69,770
Duration is 7
Qp: 7,451 ft³/s with
Average Frequency 1 per
season
Volume is 146,598
Duration is 11
Base Flows
(ft³/s )
883(34.1%) 823(39.9%) 975(58.7%)
682(55.6%) 599(54.5%) 735(71.3%)
540(76.3%) 449(68.4%) 530(82.8%)
Subsistence
Flows (ft³/s
)
331(98.3%) 301(90.1%) 290(96.4%)
Nov Dec Jan Feb Mar Apr May Jun Jul Aug Sep Oct
Winter Spring Monsoon
Flow Levels
High (75th %ile) Notes:
Medium (50th %ile) 1. Period of record: 1/1/1962 to 12/31/2009
Low (25th %ile) 2. Subsistence and base flows calculated
using non-zero flows only.
Subsistence

4-6
Table 4.1-6. Environmental Flow Regime Recommendation, Pecos River near Orla.
Overbank
Flows
Qp: 1,770 ft³/s with Average Frequency 1 per 5 years
Volume is 8,979
Duration is 23
High Flow
Pulses
Qp: 1,090 ft³/s with Average Frequency 1 per 2 years
Volume is 5,617
Duration is 18
Qp: 619 ft³/s with Average Frequency 1 per year
Volume is 4,687
Duration is 13
Qp: 109 ft³/s with
Average Frequency 1 per
2 seasons
Volume is 4,460
Duration is 6
Qp: 577 ft³/s with
Average Frequency 1 per
2 seasons
Volume is 19,077
Duration is 15
Qp: 772 ft³/s with
Average Frequency 1 per
2 seasons
Volume is #N/A
Duration is 12
Qp: 53 ft³/s with
Average Frequency 1 per
2 seasons
Volume is #N/A
Duration is 4
Qp: 417 ft³/s with
Average Frequency 1 per
season
Volume is 13,530
Duration is 13
Qp: 429 ft³/s with
Average Frequency 1 per
season
Volume is 1,412
Duration is 9
Base Flows
(ft³/s )
17(31.9%) 44(58.5%) 69(52.4%)
12(50.1%) 15(72.0%) 33(68.3%)
8.8(67.1%) 9.1(82.6%) 12(82.7%)
Subsistence
Flows (ft³/s
)
3.3(92.1%) 3.3(96.5%) 3.3(96.6%)
Nov Dec Jan Feb Mar Apr May Jun Jul Aug Sep Oct
Winter Spring Monsoon
Flow Levels
High (75th %ile) Notes:
Medium (50th %ile) 1. Period of record: 1/1/1938 to 12/31/2009
Low (25th %ile) 2. Subsistence and base flows calculated
using non-zero flows only.
Subsistence

4-7
Table 4.1-7. Environmental Flow Regime Recommendation, Pecos River near Pecos .
Overbank
Flows
Qp: 3,620 ft³/s with Average Frequency 1 per 5 years
Volume is 131,386
Duration is 23
High Flow
Pulses
Qp: 2,180 ft³/s with Average Frequency 1 per 2 years
Volume is 77,538
Duration is 19
Qp: 1,380 ft³/s with Average Frequency 1 per year
Volume is 46,974
Duration is 16
Qp: 231 ft³/s with
Average Frequency 1 per
2 seasons
Volume is 8,297
Duration is 12
Qp: 1,190 ft³/s with
Average Frequency 1 per
2 seasons
Volume is #N/A Duration
is 13
Qp: 1,270 ft³/s with
Average Frequency 1 per
2 seasons
Volume is 40,068
Duration is 14
Qp: 231 ft³/s with
Average Frequency 1 per
season
Volume is 1,581
Duration is 6
Qp: 488 ft³/s with
Average Frequency 1 per
season
Volume is #N/A Duration
is 9
Qp: 470 ft³/s with
Average Frequency 1 per
season
Volume is 8,422
Duration is 10
Qp: 21 ft³/s with
Average Frequency 1 per
season
Volume is #N/A
Duration is 3
Qp: 255 ft³/s with
Average Frequency 1 per
season
Volume is 361
Duration is 7
Qp: 224 ft³/s with
Average Frequency 1 per
season
Volume is #N/A
Duration is 8
Base Flows
(ft³/s )
32(45.1%) 78(50.7%) 104(45.0%)
9.9(65.5%) 16(66.6%) 30(65.5%)
5.7(82.3%) 4.6(82.1%) 5.2(82.3%)
Subsistence
Flows (ft³/s
)
0.5(98.8%) 0.4(98.3%) 0.4(98.1%)
Nov Dec Jan Feb Mar Apr May Jun Jul Aug Sep Oct
Winter Spring Monsoon
Flow Levels
High (75th %ile) Notes:
Medium (50th %ile) 1. Period of record: 1/1/1902 to 12/31/1935
Low (25th %ile) 2. Subsistence and base flows calculated
using non-zero flows only.
Subsistence
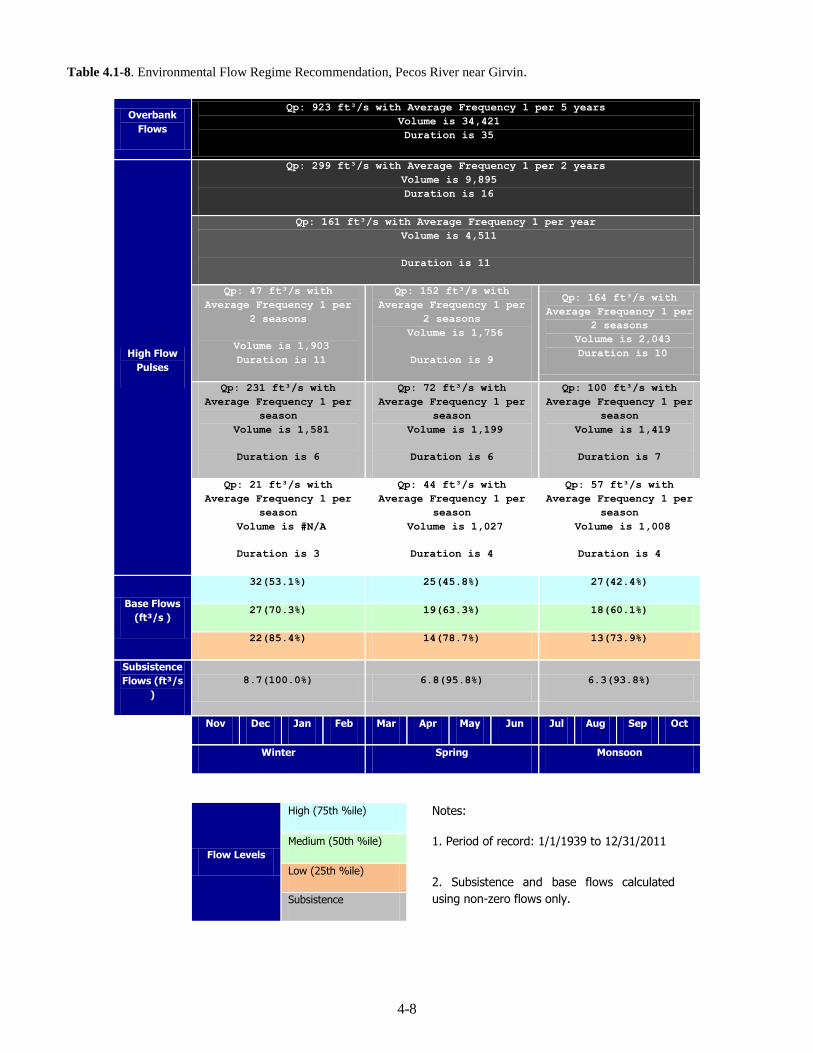
4-8
Table 4.1-8. Environmental Flow Regime Recommendation, Pecos River near Girvin.
Overbank
Flows
Qp: 923 ft³/s with Average Frequency 1 per 5 years
Volume is 34,421
Duration is 35
High Flow
Pulses
Qp: 299 ft³/s with Average Frequency 1 per 2 years
Volume is 9,895
Duration is 16
Qp: 161 ft³/s with Average Frequency 1 per year
Volume is 4,511
Duration is 11
Qp: 47 ft³/s with
Average Frequency 1 per
2 seasons
Volume is 1,903
Duration is 11
Qp: 152 ft³/s with
Average Frequency 1 per
2 seasons
Volume is 1,756
Duration is 9
Qp: 164 ft³/s with
Average Frequency 1 per
2 seasons
Volume is 2,043
Duration is 10
Qp: 231 ft³/s with
Average Frequency 1 per
season
Volume is 1,581
Duration is 6
Qp: 72 ft³/s with
Average Frequency 1 per
season
Volume is 1,199
Duration is 6
Qp: 100 ft³/s with
Average Frequency 1 per
season
Volume is 1,419
Duration is 7
Qp: 21 ft³/s with
Average Frequency 1 per
season
Volume is #N/A
Duration is 3
Qp: 44 ft³/s with
Average Frequency 1 per
season
Volume is 1,027
Duration is 4
Qp: 57 ft³/s with
Average Frequency 1 per
season
Volume is 1,008
Duration is 4
Base Flows
(ft³/s )
32(53.1%) 25(45.8%) 27(42.4%)
27(70.3%) 19(63.3%) 18(60.1%)
22(85.4%) 14(78.7%) 13(73.9%)
Subsistence
Flows (ft³/s
)
8.7(100.0%) 6.8(95.8%) 6.3(93.8%)
Nov Dec Jan Feb Mar Apr May Jun Jul Aug Sep Oct
Winter Spring Monsoon
Flow Levels
High (75th %ile) Notes:
Medium (50th %ile) 1. Period of record: 1/1/1939 to 12/31/2011
Low (25th %ile) 2. Subsistence and base flows calculated
using non-zero flows only.
Subsistence

4-9
Table 4.1-9. Environmental Flow Regime Recommendation, Independence Creek near Sheffield.
Overbank
Flows
Qp: 1,100 ft³/s with Average Frequency 1 per 5 years
Volume is 5,800
Duration is 22
High Flow
Pulses
Qp: 612 ft³/s with Average Frequency 1 per 2 years
Volume is 3,863
Duration is 18
Qp: 182 ft³/s with Average Frequency 1 per year
Volume is 2,114
Duration is 11
Qp: 33 ft³/s with
Average Frequency 1 per
2 seasons
Volume is 2,666
Duration is 15
Qp: 100 ft³/s with
Average Frequency 1 per
2 seasons
Volume is 1,637
Duration is 8
Qp: 231 ft³/s with
Average Frequency 1 per
2 seasons
Volume is 1,777
Duration is 9
Qp: 42 ft³/s with
Average Frequency 1 per
season
Volume is 1,115
Duration is 7
Qp: 44 ft³/s with
Average Frequency 1 per
season
Volume is 1,013
Duration is 5
Base Flows
(ft³/s )
40 40 40
25 25 25
Subsistence
Flows (ft³/s
)
18(99.2%) 17(96.1%) 17(92.5%)
Nov Dec Jan Feb Mar Apr May Jun Jul Aug Sep Oct
Winter Spring Monsoon
Flow Levels
High (75th %ile) Notes:
Medium (50th %ile)
1. Period of record: 1/1/1975 to 2/28/1985
and 3/1/2000 to 12/31/2009
Low (25th %ile) 2. Subsistence and base flows calculated
using non-zero flows only.
Subsistence

4-10
Table 4.1-10. Environmental flow regime recommendation, Pecos River near Brotherton Ranch.
Overbank
Flows No flow recommendations
High Flow
Pulses No flow recommendations
Base Flows
(cfs)
101 90 90
80 60 62
Subsistence
Flows (cfs) 39 39 39
Nov Dec Jan Feb Mar Apr May Jun Jul Aug Sep Oct
Winter Spring Monsoon
Flow Levels
High (75th %ile) Notes:
Medium (50th %ile) 1. Period of record: 1/1/2008 to 12/31/2010
Low (25th %ile) 2. Subsistence and base flows calculated
using non-zero flows only.
Subsistence
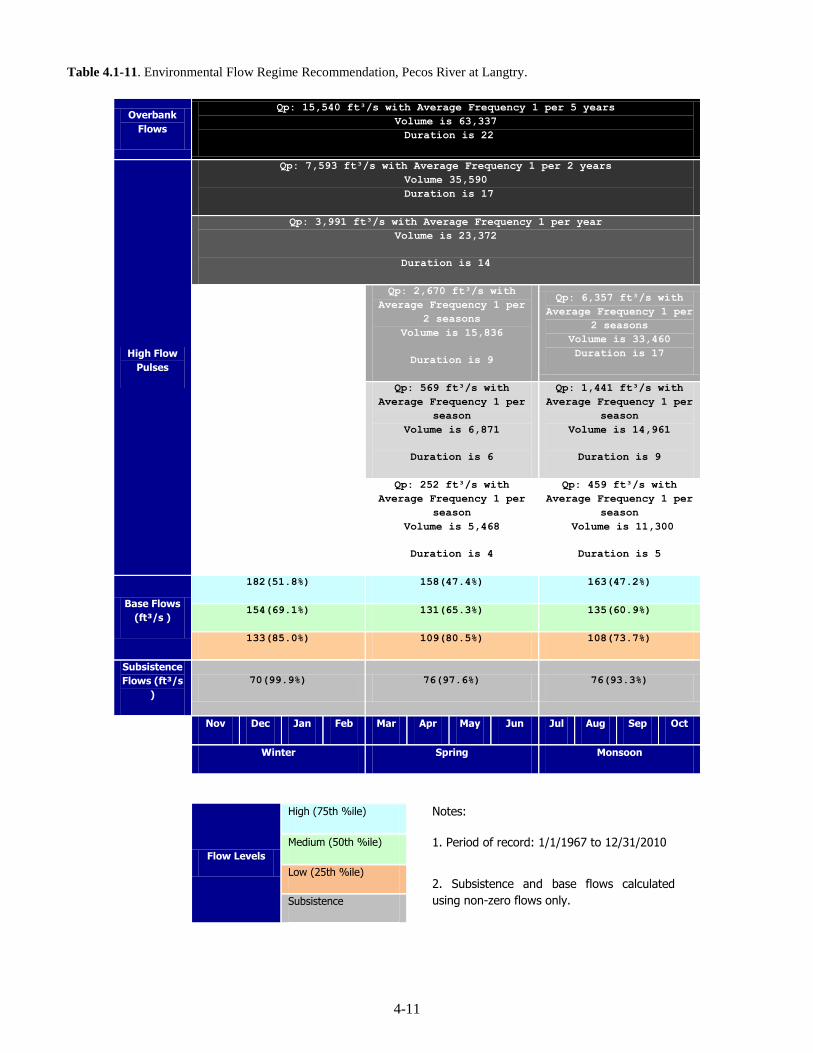
4-11
Table 4.1-11. Environmental Flow Regime Recommendation, Pecos River at Langtry.
Overbank
Flows
Qp: 15,540 ft³/s with Average Frequency 1 per 5 years
Volume is 63,337
Duration is 22
High Flow
Pulses
Qp: 7,593 ft³/s with Average Frequency 1 per 2 years
Volume 35,590
Duration is 17
Qp: 3,991 ft³/s with Average Frequency 1 per year
Volume is 23,372
Duration is 14
Qp: 2,670 ft³/s with
Average Frequency 1 per
2 seasons
Volume is 15,836
Duration is 9
Qp: 6,357 ft³/s with
Average Frequency 1 per
2 seasons
Volume is 33,460
Duration is 17
Qp: 569 ft³/s with
Average Frequency 1 per
season
Volume is 6,871
Duration is 6
Qp: 1,441 ft³/s with
Average Frequency 1 per
season
Volume is 14,961
Duration is 9
Qp: 252 ft³/s with
Average Frequency 1 per
season
Volume is 5,468
Duration is 4
Qp: 459 ft³/s with
Average Frequency 1 per
season
Volume is 11,300
Duration is 5
Base Flows
(ft³/s )
182(51.8%) 158(47.4%) 163(47.2%)
154(69.1%) 131(65.3%) 135(60.9%)
133(85.0%) 109(80.5%) 108(73.7%)
Subsistence
Flows (ft³/s
)
70(99.9%) 76(97.6%) 76(93.3%)
Nov Dec Jan Feb Mar Apr May Jun Jul Aug Sep Oct
Winter Spring Monsoon
Flow Levels
High (75th %ile) Notes:
Medium (50th %ile) 1. Period of record: 1/1/1967 to 12/31/2010
Low (25th %ile) 2. Subsistence and base flows calculated
using non-zero flows only.
Subsistence

4-12
Table 4.1-12. Environmental Flow Regime Recommendation, Devils River near Juno
Overbank
Flows
Qp: 39,200 ft³/s with Average Frequency 1 per 5 years
Volume is 147,711
Duration is 17
High Flow
Pulses
Qp: 15,900 ft³/s with Average Frequency 1 per 2 years
Volume is 72,060
Duration is 15
Qp: 3,570 ft³/s with Average Frequency 1 per year
Volume is 21,870
Duration is 13
Qp: 2 ft³/s with
Average Frequency 1
per 2 seasons
Volume is 2,666
Duration is 15
Qp: 2,340 ft³/s with
Average Frequency 1 per
2 seasons
Volume is 11,472
Duration is 8
Qp: 10,500 ft³/s with
Average Frequency 1 per
2 seasons
Volume is 54,533
Duration is 21
Qp: 387 ft³/s with
Average Frequency 1 per
season
Volume is 6,313
Duration is 8
Qp: 990 ft³/s with
Average Frequency 1 per
season
Volume is 13,068
Duration is 13
Base Flows
(ft³/s )
125 125 125
125 125 125
56(81.6%) 59(76.0%) 63(76.9%)
Subsistence
Flows (ft³/s
)
26(97.1%) 24(95.8%) 26(95.3%)
Nov Dec Jan Feb Mar Apr May Jun Jul Aug Sep Oct
Winter Spring Monsoon
Flow Levels
High (75th %ile) Notes:
Medium (50th %ile)
1. Period of record: 1/1/1926 to 2/28/1949
and 3/1/1963 to 12/31/1972
Low (25th %ile) 2. Subsistence and base flows calculated
using non-zero flows only.
Subsistence

4-13
Table 4.1-13. Environmental Flow Regime Recommendation, Devils River at Pafford’s Crossing.
Overbank
Flows
Qp: 34,110 ft³/s with Average Frequency 1 per 5 years
Volume is 148,364
Duration is 22
High Flow
Pulses
Qp: 10,100 ft³/s with Average Frequency 1 per 2 years
Volume 59,961
Duration is 16
Qp: 3,673 ft³/s with Average Frequency 1 per year
Volume is 34,752
Duration is 13
Qp: 1,462 ft³/s with
Average Frequency 1 per
2 seasons
Volume is 21,327
Duration is 9
Qp: 6,816 ft³/s with
Average Frequency 1 per
2 seasons
Volume is 46,548
Duration is 14
Qp: 558 ft³/s with
Average Frequency 1 per
season
Volume is 17,374
Duration is 7
Qp: 1,872 ft³/s with
Average Frequency 1 per
season
Volume is 27,781
Duration is 9
Qp: 318 ft³/s with
Average Frequency 1 per
season
Volume is 27,781
Duration is 9
Base Flows
(ft³/s )
243(56.5%) 253(41.5%) 238(49.7%)
200(69.0%) 207(59.3%) 206(62.9%)
175(81.3%) 160(74.5%) 166(76.5%)
Subsistence
Flows (ft³/s
)
84(96.3%) 91(94.1%) 87(94.7%)
Nov Dec Jan Feb Mar Apr May Jun Jul Aug Sep Oct
Winter Spring Monsoon
Flow Levels
High (75th %ile) Notes:
Medium (50th %ile) 1. Period of record: 1/1/1960 to 12/31/2009
Low (25th %ile) 2. Subsistence and base flows calculated
using non-zero flows only.
Subsistence

4-14
4.1.1 Hydrologic Conditions
The Upper Rio Grande BBEST recommends that seasonal hydrologic conditions at our environmental flow
recommendation locations be determined on the basis of the 12-month cumulative antecedent flow volume near that
location as compared to trigger volumes selected such that dry, average, and wet conditions will apply 25 %, 50 %,
and 25 % of the time, respectively. The subsistence hydrologic condition is a sub-category of the dry hydrologic
condition with a trigger volume set such that subsistence conditions apply only 10 % of the time. These proportions
would be achieved by selecting percentile triggers (i.e., 10th percentile and below as subsistence conditions, 10
th to
25th as dry, 25
th to 75
th as average and 75
th and higher as wet) from a flow record incorporating current permit
conditions, generally using a TCEQ Water Availability Model. For the Rio Grande basin we recommend that these
triggers be developed using the Rio Grande basin WAM or other applicable tools. Use of 12-month cumulative
flow volumes provides adequate recognition of the persistence of drought and avoids more complex antecedent
seasonal computations associated with shorter durations. It is recommended that the applicable hydrologic
condition for the entire season be determined on the basis of an assessment of hydrologic condition at the beginning
of the first day of the season, thereby recognizing practical operations. Compliance with high flow pulse and
overbank flow recommendations is not intended to be subject to hydrologic conditions.
4.1.2 Subsistence Flows
The primary functions of our subsistence flow recommendations are to maintain water quality (primarily dissolved
oxygen, temperature and total dissolved solids), some amount of instream habitat area and habitat connectivity to
ensure that native aquatic organisms can re-colonize a stream segment once normal flows return and to provide life
cycle cues related to periods of low flow (Table 3.1-1). It is the assumption of the URG BBEST that subsistence
flows will not threaten an SEE or prevent the rehabilitation of an unsound ecological environment.
For eleven of our thirteen flow recommendation locations, we recommend the seasonal subsistence flows derived
from HEFR (see Section 3.3 for description of HEFR methodology). For one location in the Pecos sub-basin we
derived the subsistence flow using another method (see below) and for one location in the Rio Grande sub-basin the
HEFR-derived subsistence flow was modified for one season to maintain minimal habitat connectivity (see below).
The Upper Rio Grande BBEST recommends that translation of seasonal subsistence flows into environmental flow
standards and permit conditions not result in more frequent occurrence of flows less than the recommended
seasonal subsistence values as a result of the issuance of new surface water appropriations or amendments.
Recognizing ecological risks associated with potential increases in the frequency of occurrence of flows near the
seasonal subsistence level, the Upper Rio Grande BBEST further recommends that all inflow be passed when
inflows are between the specified seasonal base and subsistence values under dry hydrologic conditions. Only
under subsistence hydrologic conditions (which, as defined above, apply up to 10 percent of the time), may inflow
passage be reduced to seasonal subsistence values.
4.1.2.1 Rio Grande Sub-basin
No violations of stream standards for dissolved oxygen or temperature have been noted in or near the Rio Grande
sub-basin gages for which flow recommendations are provided. However, increasing salinity has been noted in the
Parks Reach and may become an issue for the Lower Canyons reach (Bennett et al., 2012). No water quality
information is available for the gages on Terlingua or Alamito Creeks. For that reason it is the recommendation of
the URG BBEST that HEFR outputs be accepted as adequate for maintain water quality at two of the three Rio

4-15
Grande gages(RG below RC and Fosters Ranch) and for the two creek gages. We find that there is not supportable
reason to lower HEFR outputs.
Continuous water quality monitoring on the Rio Grande only began in 2005. In the spring of 2003, a 58-day period
of low flow of less than one cubic meter per second occurred at the Gage near Johnson Ranch. This discharge is
equal to HEFR subsistence flow out puts for the Spring season for this gage. This low flow event prompted the
National Park Service and the U.S. Geological Survey to re-evaluate the status of fish communities in Big Bend
National Park, comparing results of a 1999 evaluation with the post low-flow study. Results of the study indicate
that fish communities diminished in both numbers of individuals and species diversity during the intervening period
(Moring, 2005). It is not known if the decline is attributable to water quality issues associated with the low flow
period or some other environmental factor. A more recent study by the USGS to quantify habitat availability at Rio
Grande Silvery Minnow release and professional judgment of fish biologists suggest that flows of 35 ft³/s may not
provide adequate habitat connectivity. Therefore it is the consensus of the URG BBEST that HEFR outputs for the
Winter season subsistence flows (28 ft³/s) for the Rio Grande at Johnson’s Ranch be adjusted upward to equal the
HEFR output for Monsoon of 40 ft³/s. There have not been similar studies conducted in the vicinity of the gage
below the Rio Conchos, thus, subsistence flows were not able to be adjusted based on professional judgment as was
done at Johnson’s Ranch.
4.1.2.2 Pecos River Sub-basin
There have been no violations of water quality standards for dissolved oxygen or temperature in the Lower Pecos
River (i.e., Pecos at Brotherton Ranch near Pandale and Pecos at Langtry). There has been a gradual decrease in
flow in the last 30 years at the Pecos River near Langtry. It is imperative we protect ground water flows into the
river to maintain adequate flow. However, we do feel confident that the subsistence flow recommendations derived
from historical hydrology using HEFR will continue to maintain water quality.
In the Upper Pecos River between Red Bluff Reservoir and Independence Creek, TCEQ has declared the river
impaired due to low dissolved oxygen and there are extremely high total dissolved solids in this stretch of the river.
Therefore, the current hydrology of the Upper Pecos River does not maintain a sound ecological environment and
because our HEFR numbers were derived from the current impacted hydrology we do not have confidence that our
subsistence recommendations will enhance current condition to maintain a sound ecological environment. Instead
we make the current subsistence flow recommendations with the objective of maintaining current conditions and
mitigating against further deterioration of water quality conditions. The subsistence flows needed to restore this
reach to a sound ecological environment would then be developed in the adaptive management phase. The best
method to determine the appropriate subsistence flow for the Upper Pecos is to vary the release from Red Bluff
Reservoir and measure the dissolved oxygen and total dissolved solids at Iraan. Once the dissolved oxygen and
TDS requirements are met and maintained, this would be the flow required at Iraan to meet the subsistence
requirements for a sound ecological environment for the Upper Pecos River. This would need to be repeated during
each of the winter, spring, and monsoon seasons.
4.1.2.3 Devils River Sub-basin
There have been no violations of water quality standards for dissolved oxygen or temperature in the Devils River.
And, while there have been some measurements above standards for total dissolved solids, these have occurred just
as frequently at flows well above subsistence and do not seem to be flow-related. So, we feel confident that the
subsistence flow recommendations derived from historical hydrology will continue to maintain water quality.

4-16
4.1.3 Base Flows
The functions of our base flow recommendations are to maintain instream habitat quantity, quality and diversity,
variable flow conditions, longitudinal connectivity and water quality (Table 3.1-1). Variability is essential in order
to balance the unique habitat requirements of aquatic species and communities. For this reason, our base flow
recommendations began with three tiers of base flows (low, medium and high) across the three seasons derived
from HEFR analysis. The HEFR-derived base flows were reviewed and modified for two locations, one each in the
Pecos and Devils River sub-basins (see below). Also, one location in the Pecos River sub-basin had its base flow
numbers derived primarily from the flow-habitat analysis (see below).
The Upper Rio Grande BBEST recognizes that translation of seasonal base flows into environmental flow standards
and permit conditions may result in reduction of our recommended seasonal base values as a result of the issuance
of new surface water appropriations or amendments. For reaches that have been found to have sound ecological
environments, the Upper Rio Grande BBEST finds some degree of reduction in frequency of high and medium base
flow recommendations below historical levels to be an acceptable ecological risk. However we do not find that a
reduction in frequency of low base flows is acceptable. We state in Section 3.4 that up to a 10% reduction in
historical attainment frequency of our habitat thresholds may be acceptable in some cases. However, tables and
figures showing percentages of maximum habitat versus discharge for selected species (in Section 3.6.3 and Section
3.7.3) show that any substantial reduction in flows below our base flow recommendations may quickly reduce
available instream habitat. Also, we have taken steps to both simplify the base flow portion of our flow regime
recommendations and to determine the minimum flows needed to maintain habitats for our focal species. Thus, any
reduction beyond the current base flow recommendations would likely put at risk key ecological components that
maintain a sound ecological environment. The URG BBEST recommends that the issuance of new surface water
appropriations be accompanied by adequate monitoring programs to support adaptive management principles.
4.1.3.1 Rio Grande Sub-basin
Instream habitat modeling has not occurred or is not available anywhere along the Rio Grande or its tributaries. A
USGS study of habitat flow relationships is near completion and will be available for the next instream flow
analysis (Moring, personal communication). Violations of water quality standards have not occurred and would not
be expected to occur at the base flow level. Given this, the unsound ecology of the Parks Reach, the lack of
knowledge of the bio-physical relationships in the Lower Canyons reach or the two creeks, it is the consensus of the
URG BBEST that HEFR derived base flow recommendations not be adjusted until there is a scientifically
supportable reason to do so.
4.1.3.2 Pecos River Sub-basin
The flow-habitat analysis at Independence Creek near Sheffield and the Pecos River at Brotherton near Pandale
indicates that base flows derived from historical hydrology are likely to maintain sufficient habitat for the species
considered, with a few exceptions. We did modify the HEFR-based flow regime for Independence Creek near
Sheffield reducing to two tiers of base flows and increasing flows in the upper tier to 40 ft³/s to maintain habitats
for some of our focal species. Because the flow-habitat analysis at Independence Creek and the Pecos River at
Brotherton indicated that historical hydrology-derived base flows are likely to be at least sufficient, we do have
confidence that instream habitats would also be maintained by the HEFR-derived flows at the Pecos River at
Langtry because it is a similar channel in the Edwards Plateau influenced reach of the Pecos.

4-17
We did not have flow-habitat analysis available for the Upper Pecos and the hydrology-based flow regimes are
based on altered hydrologic record. Thus, we make the current base flow recommendations resulting from HEFR
analysis with the objective of maintaining current conditions and mitigating against further deterioration of
instream habitats, biological communities and other factors. he base flows needed to restore this reach to a sound
ecological environment would then be developed in the adaptive management phase. To determine the appropriate
base flows for the Upper Pecos River, we would have to determine the subsistence flow as described above in
Section 4.1.2.2 and Section 2.6.2. The low base flow and the high base flow can then be determined mathematically
at the 25%tile and 75%tile levels respectively.
4.1.3.3 Devils River Sub-basin
The flow-habitat analysis at the Devils River near Juno indicated that HEFR-derived base flows are likely to
maintain sufficient habitat for the species considered, with a few exceptions. We did slightly modify the HEFR-
based flow regime for the Devils River near Juno by increasing the HEFR-derived Base-Medium and Base-High
numbers for the Spring season to 125 ft³/s to maintain habitats for some of our focal species. We did not have flow-
habitat analysis available for the Devils River at Pafford’s Crossing so our flow recommendations for that location
are the HEFR-derived base flows. Because the flow-habitat analysis at the Devils River near Juno indicated that
HEFR-derived base flows are likely to be at least sufficient, we do have confidence that instream habitats would
also be maintained by the HEFR-derived flows at Pafford’s.
4.1.4 High pulse flows
The functions of our high flow pulse recommendations are to maintain river channels and floodplain form and
prevent encroachment of riparian vegetation (higher pulses 1 per 2 year pulse, somewhat 1 per year pulse), flush
organic materials and enhance water quality after prolonged low flows (1 per year, 1 per season pulses), provide
connectivity to near-channel water bodies and in channel habitat features and provide life history cues and
recruitment events for organisms (seasonal pulses, maybe 1 per year pulse) (Table 3.1-1). We used HEFR to
develop initial characterizations of high flow pulses from the historical hydrology and utilized geomorphological
and other information to refine pulse recommendations at a subset of our gages. These HEFR-derived flows serve
as our recommended high flow pulses for all locations except for two of the three mainstem Rio Grande sites where
extensive additional hydrologic and geomorphological information was available and from which pulse
recommendations were developed (see below).
Our recommended high flow pulses generally include peak daily average flow rates and cumulative volumes and
durations for high flow pulses with frequencies (and increasing magnitudes) of two per season, one per season, one
per 2 seasons, one per year, one per two years, and one per five years. Our recommendations include central
tendency pulse volumes and durations for all high flow pulse events. The framework for high flow pulses for two of
the Rio Grande mainstem sites is defined by additional parameters from previous research (see below).
The Upper Rio Grande BBEST recognizes that translation of pulse flows of specified frequencies into
environmental flow standards and permit conditions may result in reduced magnitude or less frequent occurrence of
high flow pulses as a result of the issuance of new surface water appropriations or amendments. The BBEST finds
some degree of reduction in pulse magnitude or frequency to be an acceptable ecological risk. However, more
information is needed to determine an acceptable modification to high flow pulses for our sites other than the Rio
Grande mainstem sites and steps to develop this information are included in Section 5 as adaptive management
tasks.

4-18
Because the high pulse flows are episodic events, the Upper Rio Grande BBEST recommends that the following
criteria be used in conjunction with the HEFR generated high pulse flow recommendations. The adopted criteria
describe the qualifications for meeting a high flow pulse requirement and the criteria for allowing higher-level
pulse flow events to satisfy the yet unmet annual or seasonal pulse flow events with lower pulse peak flow trigger
levels. A qualifying flow pulse or overbank event is identified when flow exceeds the prescribed trigger (i.e. peak)
flow magnitude. It continues (which means flows are passed up to that trigger magnitude) until the prescribed
volume or duration has passed. If, during a qualifying event at one magnitude, flows increase to a magnitude that
exceeds a greater magnitude event trigger, the trigger magnitude, volume, and duration of the higher qualifying
pulse controls inflow passage. In this case, the higher magnitude events are considered to satisfy the lower
magnitude events in the same season (e.g., one 2 per year event also counts for one per season event, one two per
season, one three per season event, and one four per season event).
4.1.4.1 Rio Grande Sub-basin
For the Rio Grande mainstem sites high flow pulse recommendations seek to limit the rate and magnitude of
channel narrowing. High flow pulses must be of a sufficient frequency and magnitude to mobilize and reorganize
coarse gravel and cobble deposits on the channel bed, and must be of sufficient duration to export fine sediment
that has accumulated within the river channel.
To achieve these geomorphic goals, we recommend that annual channel filling flows of 10,500 ft³/s with a
minimum of a 5–day duration be excluded from permit consideration. Ideally, high-flow pulses for channel
maintenance purposes would happen during, near the end of, or soon after monsoon season for the purposes of
exporting the sediment inputs that occur during the monsoon. Alternatively, if an annual high flow pulse is not
available during the monsoon season; geomorphic goals could be met with a high pulse flow during the Spring
season and would have the benefit of providing biological cues to species such as the Rio Grande Silvery Minnow.
Therefore, The URG BBEST recommends that the first high flow pulse of the above stated magnitude and duration
following the monsoon season be excluded from permit consideration.
4.1.4.2 Pecos River Sub-basin
For the Lower Pecos River sub-basin we used HEFR to describe high flow pulses from the historical hydrology.
No attempt was made to determine suitable high pulse flows to restore a sound ecological environment in the Upper
Pecos since the only available data is from gages established after the Red Bluff Reservoir was constructed. This is
managed water data and does not represent a natural flow pattern. The first 182 river miles of the Pecos River are
paralleled by irrigation canals which intercept overland flows and prevent them from entering the river (Section
2.6.2). Also, it is standard operating procedures for the irrigation districts to divert any acceptable pulse flow waters
from the river at their respective diversion points. Despite this, we make the current base flow recommendations
resulting from HEFR analysis with the objective of maintaining current conditions and mitigating against further
deterioration of river channel and other factors depending on high the flow pulses that do occur in the current
hydrology. The high flow pulses needed to restore this reach to a sound ecological environment would then be
developed in the adaptive management phase. This may be accomplished by mathematically determining the high
pulse flows from the size of the sub-basins intercepted by the irrigation canals and calculating the flow inputs from
historical storm events. These inputs would also consider the runoff coefficients from soil type, slope and
vegetation coverage. Probabilities would be determined to simulate pulse flows from multiple storm events in
multiple basins. These values would then be cross referenced with habitat requirements for desired fish species and

4-19
the sediment transport models creating the appropriate habitat. Only then could we make a defendable position as to
the required high flow pulses necessary for maintaining a sound ecological environment in the Upper Pecos River.
4.1.4.3 Devils River Sub-basin
For the Devils River sub-basin we used HEFR to describe high flow pulses from the historical hydrology. This
analysis resulted in 3 tiers of pulses for Juno (1 per 2 year, 1 per year and one per season for two of the three
seasons) and 4 tiers of pulses for Pafford’s Crossing (1 per 2 year, 1 per year, one per season for two of the three
seasons and 2 per season for one of the three seasons).
4.1.5 Overbank flows
The functions of our overbank flow recommendations are to provide lateral channel movement and floodplain
maintenance, recharge the floodplain water table, form new instream habitats, flush organic material into channel,
deposit nutrients in the floodplain, provide other life history cues for organisms, maintain diversity of riparian
vegetation, provide connectivity to floodplain and to restore water quality in floodplain water bodies (Table 3.1-1).
We used HEFR to describe overbank flows from the historical hydrology at our sites and defined these
recommended overbank flows for most gages at a frequency of one per 5 years using magnitude, duration and
volume. Overbank flows for two of the three Rio Grande mainstem sites were defined differently (see below).
4.1.5.1 Rio Grande Sub-basin
Recommendations related to overbank flows in a system in sediment surplus such as the Rio Grande seek to avoid
undesirable geomorphic effects. For the purposes of this report we define overbank flows for the Rio Grande below
Rio Conchos and at Johnson’s Ranch as flow events between 10,500 ft³/s and 35,300 ft³/s. We recognize that
naturally derived overbank flows may occur infrequently. However, previous research suggests that overbank flows
result in overbank sedimentation and vertical floodplain accretion, which is one of the primary processes
contributing to channel narrowing.
We recognize that overbank flows may serve many beneficial services, such encouraging native riparian vegetation
recruitment and lateral floodplain connectivity. However, little is currently understood regarding riparian vegetation
dynamics during overbank floods. Also, the riparian corridor of the Rio Grande is heavily vegetated by non-native
vegetation, and thus potential benefits of overbank flows to the riparian vegetation community may be outweighed
by benefits to non-native vegetation. Additionally, as described in Section 3.6.4 and Figure 3.6-11, a high-flow
pulse of 10,500 ft³/s would help prevent vegetation establishment within the active river channel, which is one of
the initial mechanisms by which the channel begins to narrow following a channel-resetting flood.
4.1.5.2 Pecos River Sub-basin
For the Lower Pecos River sub-basin we used HEFR to describe overbank flows from the historical hydrology.
No attempt was made to determine suitable overbank flows to restore a sound ecological environment in the Upper
Pecos since the only available data is from gages established after the Red Bluff Reservoir was constructed. Despite
this, we make the current base flow recommendations resulting from HEFR analysis with the objective of
maintaining current conditions and mitigating against further deterioration of the river channel, floodplain and other
factors depending on any overbank flows that do occur in the current hydrology. Any overbank flows needed to
restore this reach to a sound ecological environment would then be developed in the adaptive management phase.
This may be accomplished by mathematically determining the overbank flows from the size of the sub-basins

4-20
intercepted by the irrigation canals and calculate the flow inputs from historical storm events. These inputs would
also consider the runoff coefficients from soil type, slope and vegetation coverage. Probabilities would be
determined to simulate overbank flows from multiple storm events in multiple basins. These values would then be
cross referenced with habitat requirements for desired fish species and the sediment transport models creating the
appropriate habitat. Only then could we make a defendable position as to the required overbank flow pulses
necessary for the Upper Pecos River.
4.1.5.3 Devils River Sub-basin
For the Devils River sub-basin we used HEFR to describe overbank flows from the historical hydrology. This
analysis resulted in one tiers of overbank flows for both Juno and Pafford’s Crossing.
4.1.6 Reset Flows for the Upper Rio Grande Sub-basin
The URG recognizes that large floods greater than 35,300 ft³/s (channel resetting floods) are instrumental in
reversing negative geomorphic changes by evacuating accumulated sediment, stripping non-native vegetation,
maintaining channel conveyance capacity, and restoring aspects of the historic geomorphic form of the channel and
floodplain. Our current understanding of physical processes indicates that channel resetting floods are the most
important portion of the present flow regime with respect to maintaining channel form. Thus, we recommend that
the occurrence of large floods greater than 35,300 ft³/s continue to occur at the Rio Grande below the Rio Conchos
and Johnson’s Ranch gages every 10 years, which is the approximate recurrence interval of these flows at these
locations. We recommend that floods greater than 35,300 ft³/s be excluded from permit consideration once per
decade.
The URG BBEST recognizes that the last reset flow of 2008 caused great harm to many of the communities along
the Rio Conchos and Rio Grande and it is not our position that the beneficial geomorphic effects outweigh the
harmful outcomes. Rather it is our position that the negative consequences of the 2008 flow were the result of
channel narrowing processes that occurred in the 1990s and 2000s, and the associated loss of channel capacity. The
maximum instantaneous discharge of 50,000 ft³/s was well with in the design parameters of the leveed reach at
Presidio. The problems associated with the 2008 flood were not unavoidable. Maintenance of channel capacity by
limiting the magnitude of sediment accumulation within the channel will help limit flooding impacts during future
channel resetting floods.

5-1
Section 5. Adaptive Management
5.1 Introduction
Adaptive management is a flexible and iterative decision making process that addresses uncertainties and
knowledge gaps through monitoring and focused research. As with all other SB3 stakeholder groups, the Rio
Grande BBASC is charged with identifying research and monitoring priorities to address uncertainty, guide and
improve subsequent instream flows analysis, define instream flow standards, and to develop strategies to meet
instream flow recommendations. Senate Bill 3 specifies the goals of the work plan as follows:
Section 11.02362 (p) In recognition of the importance of adaptive management, after submitting its
recommendations regarding environmental flow standards and strategies to meet the environmental flow
standards to the commission, each basin and bay area stakeholders committee, with the assistance of the
pertinent basin and bay expert science team, shall prepare and submit for approval by the advisory group
a work plan. The work plan must:
1. establish a periodic review of the basin and bay environmental flow analyses and
environmental flow regime recommendations, environmental flow standards, and strategies, to
occur at least once every 10 years;
2. prescribe specific monitoring, studies, and activities; and
3. establish a schedule for continuing the validation or refinement of the basin and bay
environmental flow analyses and environmental flow regime recommendations, the
environmental flow standards adopted by the commission, and the strategies to achieve those
standards.
Section 11.1471 (f) An environmental flow standard or environmental flow set-aside adopted under
Subsection (a) may be altered by the commission in a rulemaking process undertaken in accordance with
a schedule established by the commission. In establishing a schedule, the commission shall consider the
applicable work plan approved by the advisory group under Section 11.02362 (p).
The environmental flow regime recommendations made in this report are based upon the best scientific knowledge
available yet there is considerable opportunity for improved understanding. Several other BBEST’s have developed
detailed suggestions for adaptive management approaches and the URG BBEST recommends that the Rio Grande
BBASC consult those plans as well as work plans developed by previous BBASC’s for details. What follows in
Section 5.2 is our recommendations for future research and monitoring priorities to be addressed in the BBASC’s
work plan. The Rio Grande BBEST may also be asked by the BBASC to provide refinement to these
recommendations and assistance in development of the work plan. In Section 5.3 below we also provide a
suggested approach for the adaptive management based in part on the process used in other basins and laid out by
the Nueces BBEST.
5.2 Future Research and Monitoring Needs
5.2.1 Describe relationships between flow and physical, chemical, and biological structure and function of the
streams and how these relationships support ecological health.
There have been very few studies of the interrelationships between environmental flow regime components and
stream health in the Rio Grande basin. It would be valuable to prioritize and focus future monitoring and research
programs so that these interrelationships can be hypothesized and tested. This is an overarching goal for all three
sub-basins: the Rio Grande, the Pecos River, and the Devils River.
5-2
Biologic and ecologic research should focus on the effects of different portions of the flow regime as it applies to
ecologic health, such as the rejuvenation of benthic macroinvertebrate communities, reorganization of channel
deposits, scouring of benthic algae, and biologic cues for migration or spawning of native fish species. Significant
work needs to be conducted to constrain these processes, and refine the current flow recommendations. Some of the
analysis in this task may be suited to the biennial state-wide water quality assessment based primarily on TCEQ’s
Surface Water Quality Monitoring (SWQM) and Texas Clean Rivers Program data. TCEQ’s SWQM Information
System database would be an excellent starting point for this task. In addition to site-specific studies, another
potential approach to develop relationships between flow and ecology would be to utilize regional ecological
datasets, however these datasets are likely to be lacking in information. Another potential source for information is
the National Park Service Chihuahuan Desert Inventory and Monitoring Network. By analyzing information such
as biological monitoring data from streams with a range of hydrologic alteration, it may be possible to develop
relationships between flow alteration metrics and ecological metrics.
The focus of the report would be on relationships between flows and ecological health in a minimum of two
representative stream segments within the sub–basins and reaches identified in this report. This includes the Parks
and the Lower Canyons reaches for the Rio Grande, the two major tributaries to the Rio Grande, Alamito and
Terlingua creeks, three reaches on the Pecos River, and two reaches on the Devils River. Each of these
representative stream segments should be associated with either a permanent gage or a monumented cross section.
One potential site within the Lower Canyons is the gage at Foster’s Weir. This site will need to be evaluated for
impacts caused by the weir, the appropriateness of using that site for long term monitoring, and a determination
made as to the ongoing effectiveness and usefulness of the weir.
In addition to site-specific studies, another potential approach to develop relationships between flow and ecology would
be to utilize regional ecological datasets. By analyzing information such as biological monitoring data from streams with
a range of hydrologic alteration it is possible to develop relationships between flow alteration metrics and ecological
metrics. For example, relationships have been developed between base flow alteration and temperature, fish biomass and
benthic macroinvertebrate community indices. This can be a useful approach in regions where detailed site-specific
studies are not available but less intensive information is available across a basin, region or state. Availability of
ecological data for such analyses in the Rio Grande Basin should be assessed and flow-ecology relationships developed
using stream gage or other hydrology data.
Given the highly variable geomorphic conditions that exist on the Rio Grande, it is likely that some of these
relationships vary in importance and function from year to year. Implementation will therefore require considerable
planning and a long term perspective.
5.2.2 Describe relationships between flow and geomorphic processes such as sediment transport
Stream segments within the URG exhibit a wide variety of geomorphic settings including segments for the Rio
Grande that are in sediment surplus, bedrock channel segments on the Pecos and Devils, and highly manipulated
and regulated segments on the upper Pecos. Apart from a small section of the Rio Grande, there have been no
investigations of sediment transport processes within stream segments of the Rio Grande Basin. Analyses of
suspended and bed load transport will help in determining the threshold for the reorganization and rejuvenation of
stream segments. These processes are important for maintaining the habitat heterogeneity that is important for
aquatic species survival during base and subsistence flows. Determination of bed load transport thresholds and
associated geomorphic change during high flow pulses will provide the opportunity to re-evaluate the
environmental flow prescriptions for high-flow pulses and overbank flows.

5-3
Rapidly occurring geomorphic change on the Rio Grande associated with sediment surplus creates great inter-
annual uncertainty with respect to habitat availability, channel conveyance capacity and flooding frequency.
Sediment inputs from tributaries within the Parks reach can rapidly constrict channel conveyance capacity and
smother aquatic habitat. Therefore, it is the recommendation of the URG BBEST that flow recommendations on the
Rio Grande be re-evaluated with respect to channel shape every 5 years. As channel narrowing occurs, the capacity
of the channel to convey flood water will be reduced, with lower discharge values rising to higher stage elevations.
Geomorphic conditions of the channel and floodplain must be monitored annually, and channel filling flow
magnitudes should be recalculated in order to predict how the channel filling discharge changes as the channel loses
conveyance capacity. Recently initiated and ongoing sediment monitoring studies should be incorporated into
future instream flow analysis.
The highly manipulated upper Pecos presents a challenge in that several generations of resource utilization have left
a highly disconnected and fragmented channel in need of some serious and thoughtful attention. With the complete
diversion of surface flow and highly saline ground water contributions by the Ward II turnout, the upper Pecos is in
such degraded shape that potential management solutions like increasing instream flows might threaten the sound
ecological environment of the lower Pecos River. It is the consensus of the URG BBEST that a more robust flow
history for the Pecos River be developed with available gage data. Additionally, analysis of slack water deposits in
tributary mouths could provide information on both flow history and sediment transport history.
Little work has been done on sediment transport and the geomorphic processes on the Devils River. The relatively
short amount of time which the BBEST had to develop environmental flow recommendations did not permit in-depth
analysis of the relationships between Devils River channel shape, sediment dynamics and flow. The Devils River has
primarily a bedrock channel that is likely rather constant in its configuration. However, there is extensive transport of
coarse sediments in floods that likely plays an important role in maintaining instream habitat features. The fish
community is known to respond to such flow events and the channel changes they produce (Harrell 1978). It is also
possible that historical land uses such as grazing may have impacted these sediment dynamics. A stronger understanding
of these processes and their dependence on flows, particularly high flow pulses and overbank flows, is needed for the
Devils River.
Significant work needs to be conducted to constrain bio-physical process with respect to flow recommendations.
Processes such as hyporheic exchange and nutrient and oxygen mediation by biological communities respond to
different flow components. Revision of future flow recommendations may improve conditions such as low
dissolved oxygen, and provide ecologic benefit, however, these processes are not understood,
5.2.3 Conduct additional modeling of relationships between in-stream habitat and flow.
The BBEST and its contractors made considerable progress in understanding relationships between instream habitat
suitability, however the work utilized a simple modeling approach, was only conducted at three sites, and was only
conducted under one flow condition at two of the sites. Specific tasks to improve and expand the habitat analysis
may include:
Suitable habitat may be in small, disconnected patches and higher or lower flows might be needed to connect or
increase size of suitable habitat patches. In order to address this, a habitat mapping approach such as a 2-
dimensional model (e.g., River 2D) or MesoHabSim that produces a spatially explicit, continuous map of habitat
at the site at multiple flow levels would be necessary to evaluate how patches of habitat are connected at different
flows.
5-4
Collect additional information about the instream habitats utilized by different species of fish and their
different life stages and pair this with information on fish abundance in habitat patches to better understand
the role of flow-dependent habitat in structuring fish communities.
Collect more habitat utilization data from different streams and at different flows.
Model hydraulic conditions under several different flows.
Sample the cross-sections measured at these three sites to obtain at least one additional set of hydraulics
measurements near the middle or upper end of the base flow recommendations. This would allow evaluation of
another source of uncertainty, the stage-discharge rating curves used at each site.
5.2.4 Identify stream locations not included in the BBEST environmental flow regime report that should be
analyzed for relationships between flow and environmental health.
This would be a desk-top study based in part on review of expected water demands and availability identified by
regional water planning and data gaps for individual stream segments. This review would help identify water bodies
that may have future water rights applications for diversions or vulnerable water bodies that are not gaged and for
which there is not information to base decisions on. Review and identification of additional locations for
environmental flow analysis could be summarized in 2013 and 2018.
5.2.5 Describe the relationship between flow and water quality.
Within the Rio Grande basin, there are well established relationships between flow and water quality, particularly
between flow and salinity or total dissolved solids (Miyamoto et al., 1995, Raines et al., 2012). Miyamoto et al.
(1995) found that salts are accumulating in the URG and that metals, especially Hg and Pb, can be found in
concentrations above EPA chronic criteria for aquatic species protection. It would be valuable to initiate
investigations related to channel, floodplain and instream processes that mediate water quality in the context of
channel narrowing and sediment accumulation. yet there are no studies that have established linkages between
water quality and channel process such as hyporheic exchange and sediment transport. Additionally, there are no
comprehensive studies aimed at understanding the relationships between flow and nutrient dynamics.
Some of the analysis within this task may be suited to the TCEQ Continuous Water Quality Monitoring Network.
For instance, there are currently over 4 years of 15-continuous monitoring data for two stations on the Rio Grande.
Continuous water quality stations also exist on the Pecos and Devils Rivers. These data could provide useful
information regarding real-time relationships among different flow components and water quality trends because
monitoring measurements include water quality parameters as well as a flow measurements. These data may shed
light on many phenomenon that are not well understood such as the Rio Grande fish-kills that have been reported
during high flow pulses. Additionally, by analyzing these water quality data in concert with discharge data from
surrounding gages, potential source areas of contaminants, and the effects of high flow pulses on water quality may
be discerned. The complete analyses of these real-time data should be a priority of scientific research, and should
be heavily considered for any future environmental flow recommendations.
The Devils River is highly pristine and maintains excellent water quality. However, the development of the lower
tract of the Devils River State Natural Area may lead to increased recreational pressure on the river and additional
stresses on the river. There is concern that this could manifest itself in water quality problems and a strong baseline
knowledge of water quality relations to flow is needed to detect any impacts. In particular, there should be
investigation into if there is any anthropogenic influence on the increasing trend in dissolved solids and any
relationship to changes in flow. There should also be more work done to see if there are areas where other water
quality parameters are potentially vulnerable to effects of reduced flow.

5-5
5.2.6 Evaluate reliability and comparability between gages.
Given that the instream flow recommendations are based upon stream flow and water quality gages maintained by
several different agencies, the URG recommends a review of gage performance, Quality Assurance/Quality Control
(QA/QC) programs and comparability between gages. Upon close examination of data from gages operated by
different agencies it is apparent that some discrepancies exist.
5.2.7 Conduct a complete water balance analysis for all stream segments within the upper Rio Grande.
River Segments within the URG are extremely dynamic with flashy hydrographs impacted by extreme runoff
events, complete diversions such as at the Ward II turnout on the Pecos, and in some cases stable base flows
provided by ground water inputs.
For the Pecos River, we know practically all water is removed from the river at the Ward II turnout, yet extreme
runoff events can over top the dam. Poorly quantified or regulated gains and losses are present throughout all
stream segments within the URG, especially on the Pecos River. Good management recommendations are
disadvantaged by inadequate knowledge of hydrologic attributes.
5.2.8 Evaluate status of benthic macroinvertebrates within the URG.
Benthic macroinvertebrates are sensitive to siltation, poor water quality and disturbance. Invasive species such as
European clam Corbicula are known to be indicators of degraded conditions. In many ways benthic
macroinvertebrates can be an early indicator of changing conditions. This study could be based on TCEQ methods
for determining stream health.
Studies need to be completed on the benthic and mussel health of the Devils River and their relationship to flow.
There have been recent collections of the Texas hornshell (Popenaias popeii) in the Devils River indicating that the
current flow regime may be suitable for maintaining healthy mussel populations. However, there has not been a
systematic survey of mussels throughout the perennial reach of the Devils. There is also relatively little known
about benthic macroinvertebrate communities and their relationships to flow regime components and response of
these communities to flow alteration. Expanding this knowledge in the Devils River sub-basin will likely involve a
need to expand benthic macroinvertebrate monitoring.
5.2.9 Investigate the relationship between flow dynamics and riparian vegetation establishment and persistence.
Dean and Schmidt (2011) have identified a feedback between the establishment of riparian vegetation and sediment
accumulation along the channel of the Rio Grande. Other researchers have identified the importance of natural and
modified hydrologic regimes in shaping riparian vegetation communities (Stromberg, 2001). Non-native riparian
vegetation, salt cedar and giant cane, is currently being managed along significant lengths (i.e. 30km) of the Rio
Grande. However, little is understood concerning the mechanisms that drive and the role that the current flow
regime has on patterns of non-native vs. native vegetation establishment and proliferation. Investigations regarding
riparian vegetation dynamics in relation to flow magnitude and duration would be valuable in providing future
instream flow recommendations.

5-6
5.2.10 Describe relationship of the URG stream segments, its tributaries, and major springs to ground water and
how it is likely to be affected by changes in water use.
Many of the stream segments of the URG are highly dependent on ground water input from the Edwards-Trinity Plateau
Aquifer. Many of the major springs feeding the segments are known and there have been some gain-loss studies to
understand the nature of ground water-surface water connections. However, there is not enough information to predict
response of surface waters to potential increases in ground water pumping within the basin.
The Lower Canyons Reach of the Rio Grande, the lower Pecos River, and the entire Devils River are pristine systems
that support diverse populations of native species and deliver a great amount of high quality water to Amistad Reservoir.
Protecting these resources may require creation of long-term ground water monitoring locations combined with special
studies analyzing relationships between ground water levels, stream flows, ground water withdrawals, land cover/use
patterns, and meteorological conditions throughout the basin.
5.2.11 Identify water development activities planned for the future, and how they might influence ground water,
river flows, and physical and hydrologic connections between the two
With the exception of urban centers like Midland, the human population of the URG is not expected to grow much.
However, the urban areas within and adjacent to the URG are looking to develop aquifers within this study area to obtain
new sources of water. In addition, oil and gas exploration will require large amounts of fresh water as well as disposal
facilities. Many of the stream segments of the URG are in good shape due to ground water inputs and these inputs will be
decreased by ground water pumping, these activities (Donnelly, 2007).
Possible water development activities may occur distant from the sites for which environmental flow regimes have been
identified, however much of the study area lies above one aquifer, the Edwards Trinity Plateau Aquifer. The linkages
between ground water pumping and decreases to stream flow are at least partly understood and described in the Ground
water Availability Model (Anaya, 2004).
Water development possibilities identified in the regional water plans and from other sources should be evaluated for
their potential to affect stream segments within the URG basin. These studies would start as desk-top studies involving
the prioritization of possible water development activities to evaluate. Each development should be evaluated with the
appropriate TWDB Ground Water Availability Model. Secondly, these development activities should be evaluated in
concert with oil and gas projections to establish cumulative effects.
5.2.12 Creating an Sound Ecological Environment for the Upper Pecos River
If it is a desire to know the flows necessary to establish a sound ecological environment for the Upper Pecos River
between Red Bluff Reservoir and Independence Creek, it is necessary to conduct an extremely extensive study
outside the scope of this project. An estimated base flow for the river would have to be established. This would be
key to the flows required between Ward II irrigation turnout and Iraan. Currently, the flows of the region do not
meet subsistence flows as determined by the DO impairment and the high TDS in this stretch of the river.
Reservoir releases would have to provide sufficient flow to alleviate the DO and TDS problems in this section of
the river. It would be critical to conduct a study to determine a total water balance form Red bluff Reservoir to
Iraan to determine these flows. Once this is established, and through trial and error test a base flow of this portion
of the river can be established. Pulse flows and overbank flows must be established from calculations of the
drainage basins, soil and vegetation runoff coefficient determinations, and rainfall histories of the various sub-
basins which are separated from the river by irrigation canals. Once these flow volumes and durations are

5-7
calculated for each sub-basin, the flow would be calculated and statistically weighted as to the probabilities of more
than one sub-basin producing pulse flow events at the same time.
Pulse flows are as critical to channel maintenance and fish habit as subsistence flows are to keeping them alive.
This entire study would be necessary to determine the level of effort to create a sound ecological environment for
the Upper Pecos River from Red Bluff to the confluence with Independence Creek.

5-8
5.3 Adaptive Management/Work Plan Process and Products
A process is needed to implement the work plan which will carry out the research and monitoring recommendations
described above. This process is well underway in several previous basins and the Rio Grande BBASC may choose
to determine its own approach based on how the process has progressed in these other basins. We offer the
following suggestion for a process which stakeholders may consider:
Following submittal of its report to the TCEQ and the Environmental Flows Advisory Group, the BBASC would
convene a meeting with the BBEST to initiate the work plan. This meeting would identify steps to be taken,
individuals responsible, funding sources, and deadlines.
1. BBASC and the BBEST, perhaps supported by agencies such as Texas Parks and Wildlife Department,
would continue to identify potential sources for funding, monitoring, special studies, and research.
Individuals and organizations may be invited to describe local, state, and federal grant opportunities.
Opportunities would be sought to adjust existing and upcoming monitoring efforts, particularly Clean
Rivers Program work, to address multiple needs including those of the BBASC.
2. The BBASC would convene a work group that would:
a. Identify baseline sound environment conditions,
b. Compile information collected for the work plan, and
c. Analyze information and prepare the initial work plan for BBASC approval and submittal
according to the specified schedule.
3. The BBASC would finalize a process and schedule for describing work plan results according to the
specified schedule.
4. The BBASC would schedule annual or more frequent adaptive management meetings to be informed of
work plan progress, discuss needs and opportunities for funding and collaboration, and modify the plan as
necessary.
The product of the work plan would be a report to the TCEQ and Environmental Flows Advisory Group on or
before the 10th anniversary of TCEQ's adoption of environmental flow standards for the Rio Grande basin. The
report would:
Summarize relevant monitoring, special studies, and research done;
Validate or suggest refinement of the BBEST's environmental flows analyses and recommendations;
Describe environmental flow regimes for sites not included in the original BBEST and BBASC
recommendations as appropriate;
Validate TCEQ's environmental flows standards and where appropriate, suggest refinements to those
standards; and
Validate strategies implemented to provide environmental flows and where appropriate, propose new
strategies or refinements to existing strategies.
The overall goal of this report would be to:
Summarize results of the studies recommended in this work plan with particular emphasis on the
inclusion/analysis of information collected after 2012 when the BBEST's environmental flow
recommendations were published.
Revise as appropriate, environmental flow regime recommendations published by the BBEST.

5-9
Revise the work plan to ensure future information adequately supports development of environmental flow
regimes and environmental flow standards.
This report will be published in 2022. This should be the first in what will be considered a long term process with
reviews of work plan implementation conducted at least once every five years and reevaluation of environmental
flow regime recommendations at least once every 10 years until 2082.
6-1
Section 6. References
Anaya, R. 2004. Conceptual Model for the Edwards–Trinity (Plateau) Aquifer System, Texas. In Mace, R. E., E.S.
Angle and W. F. Mullican, III, eds. Aquifers of the Edwards Plateau. Report 360. Texas Water
Development Board, Austin, Texas.
Anaya, R. and I. Jones. 2004. Ground water availability model for the Edwards-Trinity (Plateau) and Cenozoic
Pecos Alluvium aquifer systems, Texas: Texas Water Development Board, GAM Report, 208 p.
Anaya, R. and I. Jones. 2009. Ground water Availability Model for the Edwards-Trinity (Plateau) and Pecos Valley
Aquifers of Texas, Texas Water Development Board Report 373. <http://www.twdb.state.tx.us/ground
water/models/gam/eddt_p/ET-Plateau_Full.pdf >
Anderson, A. A., C. Hubbs, K.O. Winemiller and R.J. Edwards. 1995. Texas freshwater fish assemblages following
three decreases of environmental change. Southwestern Naturalist 40:314-21
Ashworth, J.B., 1990. Evaluation of ground-water resources in parts of Loving, Pecos, Reeves, Ward, and Winkler
Counties, Texas, Texas Water Development Board Report 317.
Bailey, L. A., J. R. Dixon, R. Hudson, and M. R. J. Forstner. 2008. Minimal genetic structure in the Rio Grande
Cooter (Pseudemys gorzugi). Southwestern Naturalist 53(3):406-411.
Barker, R.A., P.W. Bush and E.T. Baker, Jr. 1994. Geologic history and hydrogeologic setting of the Edwards-
Trinity Aquifer system, west-central Texas: U.S. Geological Survey water Resources Investigations Report
94-4039, 51 p.
Barker, R.A. and A.F. Ardis. 1996. Hydrogeologic framework of the Edwards-Trinity Aquifer system, west-central
Texas, U.S. Geological Survey Professional Paper 1421-B, 61 p., 8 pl.
Bayer, C.W., J.R. Davis, S.R. Twidwell, R. Kleinsasser, G. Linam, K. Mayes, and E. Hornig. 1992. Texas aquatic
ecoregion project: an assessment of least disturbed streams (draft). Texas Water Commission, Austin,
Texas.
Bean, P.T. 2006. Spatial and temporal patterns in the fish assemblage of the Blanco River, Texas, and Reproductive
ecology and diet of the grey redhorse, Moxostoma congestum. M.S. Thesis. Texas State University – San
Marcos. San Marcos, Texas, 58 pp.
Bean, P.T., T.H. Bonner and B.M. Littrell. 2007. Spatial and temporal patterns in the fish assemblage of the Blanco
River, Texas. Texas Journal of Science 59:179-200.
Bean, P.T. and T.H. Bonner. 2008. Diet and reproduction of the gray redhorse (Moxostoma congestum) in a Texas
Hill Country stream and reservoir. Journal of Freshwater Ecology 23(3):397-404.
Bean, M.G. and T.H. Bonner. 2010. Spatial and temporal distribution of Bothriocephalus acheilognathi (Cestoda:
Bothriocephalidea) in the Rio Grande (Rio Bravo del Norte). Journal of Aquatic Animal Health 22:182-
189.
Bean, M. 2012. Unpublished habitat utilization data for the Rio Grande basin. Texas Parks and Wildlife
Department.
6-2
Belzer W, Hart C. 2007. Identifying and characterizing the volume and quality of tributaries and springs. Texas
Water Resources Institute. TR-302.
Bennett J. and P.A. Cutillo. Geologic and Geochemical Characterization of Thermal Springs Along the Rio Grande
in Big Bend National Park and the Rio Grande Wild and Scenic River. Geological Society of America
Abstracts with Programs, Vol. 39, no. 6, p.510.
Bennett, J., K.M. Urbanczyk, B. Brauch, B. Schwartz and W.C.P Shanks. 2009. THE INFLUENCE OF SPRINGS
ON DISCHARGE AND RIVER WATER CHEMISTRY IN THE LOWER CANYONS, RIO GRANDE
WILD AND SCENIC RIVER, TEXAS. Portland GSA Annual Meeting (18-21 October 2009).
Bennett, J., B. Brauch and K.M. Urbanczyk. 2012. ESTIMATING GROUND WATER CONTRIBUTION FROM
THE EDWARDS-TRINITY PLATEAU AQUIFER TO THE BIG BEND REACH OF THE RIO
GRANDE, TEXAS, South-Central Section - 46th Annual Meeting (8–9 March 2012).
Birkhead, W.S. 1980. Cichlasoma cyanoguttatum (Baird and Girard) Rio Grande Perch. pp. 765 in D.S. Lee et al.
Atlas of North American Freshwater fishes. N.C. State Mus. Nat. Hist., Raleigh, i-r+854.
Bogener S, 2003. Ditches Across the Desert: Irrigation in the Lower Pecos Valley. Book published by the Texas Tech
University Press.
Boghici, R. 1999. Changes in Ground water Conditions in Parts of Trans-Pecos Texas, 1988 -1998, Texas Water
Development Board, Report 348, Austin, Texas.
Bonner, T. H., C. Thomas, C. S. Williams and J. P Karges. 2005. Temporal assessment of a west Texas stream fish
assemblage. Southwestern Naturalist 50(1):74-78.
Bonner, T.H., J.M. Watson, and C.S. Williams. 2008. Threatened fishes of the world: Cyprinella proserpina Girard,
1857 (Cyprinidae). Environmental Biology of Fishes 81:365-366.
Bovee, K. D. 1986. Development and evaluation of habitat suitability criteria for use in the instream flow
incremental methodology. US Fish and Wildlife Service Biol. Report 86(7), US Fish and Wildlife Service,
Washington, DC.
Bozek, M.A. and F.J. Rahel. 1992. Generality of microhabitat suitability models for young Colorado River
cutthroat trout across sites and among years in Wyoming streams. Canadian Journal of Fisheries and
Aquatic Sciences 49:552-564.
Brauch, B, J. Bennett, K.M. Urbanczyk and B. Schwartz. 2009. SPRING STUDIES IN THE LOWER CANYONS
OF THE RIO GRANDE, RIO GRANDE WILD AND SCENIC RIVER, TEXAS, North-Central Section
(44th Annual) and South-Central Section (44th Annual) Joint Meeting (11–13 April 2010).
Brune, G. 2002. Springs of Texas, Volume 1. Second edition. Texas A&M University Press, College Station,
Texas.
Burlakova, L.E. and A.Y. Karatayev. 2010. State-wide assessment of unionid diversity in Texas. Performance
report final. State Wildlife Grants Program.
Callamusso, B., J.N. Rinne and R.J. Edwards. 2005. Historic changes in the Rio Grande fish fauna: Status, threats,
and management of native species. Pages 205-223 in J.N. Rinne, R.M. Huges, and B. Calamusso, editors,
Historical changes in large river fish assemblages of the Americas, Symposium 45. Bethesda, MD:
American Fisheries Society.

6-3
Cantu, N.E.V. and K.O. Winemiller. 1997. Structure and habitat associations of Devils River fish assemblages.
Southwestern Naturalist 42(3):265-278.
Carman, S.M. 2007. Texas Hornshell Popenaias popeii Recovery Plan. New Mexico Department of Game and
Fish, Conservation Services Division, Santa Fe, New Mexico.
Daggett M. 1985. Pecos County History. Book published by the Pecos County Historical Commission.
Darnell, R.M. 1962. Fishes of the Rio Tamesi and related coastal lagoons in east-central Mexico. Publ. Inst. Mar.
Sci. 8:299-365.
Davis, Jack R. 1980. Species composition and diversity of benthic macroinvertebrates in the upper Rio Grande,
Texas. The Southwestern Naturalist(25) 2:137-150. May 15, 1980.
Davis, J.R. 1980a. Rediscovery, distribution, and populational status of Cyprinodon eximius (Cyprinodontidae) in
Devils River. Texas. Southwestern Naturalist 25(1):81-88.
Dean, D.J. and J.C. Schmidt. 2011. The role of feedback mechanisms in historical changes of the lower Rio Grande
in the Big Bend region: Geomorphology, v. 126, p. 333–349, doi:10.1016/j.geomorph.2010.03.009.
Dean, D.J. and J.C. Schmidt. 2011b. Draft Annual Report, Monitoring Geomorphic Response to Exotic Plant
Removal on the Rio Grande in the Big Bend region: submitted to the National Park Service, October 20,
2011, 45 pp.
Dean, D.J., M.L. Scott, P.B. Shafroth and J.C. Schmidt. 2011a. Stratigraphic, sedimentologic, and
dendrogeomorphic analyses of rapid floodplain formation along the Rio Grande in Big Bend National Park,
Texas: GSA Bulletin, V.123, p. 1908-1925, soi:10.1130/B30379.1
Dean, D.J., D.J. Topping, J.C. Schmidt, T.A. Sabol and R.E. Griffitsh. 2011b. Near-continuous suspended sediment
monitoring of the Rio Grande using multi-frequency acoustic instrumentation in Big Bend national Park,
USA. American Geophysical Union, 2011 Annual Meeting, Poster presentation, San Francisco, CA.
Dearen P. 2000. Crossing Rio Pecos. Book published by the Texas A&M University Press.
De la Cruz, Augustine. 2004. An assessment of water quality of Segment 2309 (Devils River). Texas Commission
on Environmental Quality. AS-193, 28 pp.
Dinehart, Randal L. 1998. Sediment transport at gaging stations near Mount St. Helens, Washington, 1980-90. Data
collection and analysis: U.S. Geological Survey Professional Paper 1573, 105 p. <
http://pubs.er.usgs.gov/usgspubs/pp/pp1573 >
Donnelly, Andrew, 2007. GAM Run 06-16. Report for the Texas Water Development Board. February 2, 2007
Dudley, R.K. and S.P. Platania. 2007. Flow regulation and fragmentation imperil pelagic-spawning riverine fishes.
Ecological Applications 17: 2074-2086.
Edwards, R.J. 1999. Ecological profiles for selected stream-dwelling Texas freshwater fishes II. Report to the
Texas Water Development Board. 69 pp.
Edwards, R. J., G. P. Garrett and E. Marsh-Matthews. 2002. Conservation and status of the fish communities
inhabiting the Río Conchos basin and middle Rio Grande, México and U.S.A. Reviews in Fish Biology and
Fisheries 12:119-132.

6-4
Erwin, S.O., J.C. Schmidt and N.C Nelson. 2011. Downstream effects of impounding a natural lake: The Snake
River downstream from Jackson Lake Dam, Wyoming, USA. Earth Surface Processes and Landforms,
36(11), 1421-1434.
Everest, F. H. and D. W. Chapman. 1972. Habitat selection and spatial interaction by juvenile Chinook salmon and
steelhead trout in two Idaho streams. Journal of the Fisheries Research Board of Canada 29:91–100.
Everitt, Benjamin. 1993. Channel responses to declining flow on the Rio Grande between Ft. Quitman and Presidio,
Texas: Geomorphology, v. 6, no. 3, p. 225–242, doi:10.1016/0169-555X(93)90048-7.
Everitt, Benjamin L. 1998. Chronology of the spread of tamarisk in the central Rio Grande: Wetlands 18 (4), 658–
668.
Far West Texas Water Planning Group. 2011. Far West Texas water plan, prepared for Texas Water Development
Board, LBG Guyton Associates and Freese and Nichols.
<https://www.twdb.state.tx.us/wrpi/rwp/3rdRound/2011_RWP/RegionE/>
Garrett, G. P., R. J. Edwards and A. H. Price. 1992. Distribution and status of the Devils River minnow, Dionda
diaboli. Southwestern Naturalist 37(3):259-267.
Garrett, G.P. 2000-2004. Unpublished fish community collection data for the Devils River. Texas Parks and
Wildlife Department.
Garrett, G.P., C. Hubbs, and R.J. Edwards. 2002. Threatened fishes of the world: Dionda diaboli Hubbs and
Brown, 1956 (Cyprinidae). Environmental Biology of Fishes 65:478.
George, P.G., R.E. Mace and N. Petrossian. 2011. Aquifers of Texas, Texas Water Development Board Report 380.
Gibson, J.R., J.N. Fries, and G.P. Garrett. 2004. Habitat and substrate use in reproduction of captive Devils River
minnows. North American Journal of Aquaculture 66:42-47.
Grams, P.E. and J.C. Schmidt. 2002. Streamflow regulation and multi-level flood plain formation: Channel
narrowing on the aggrading Green River in the eastern Uinta mountains, Colorado and Utah.
Geomorphology, 44(3-4), 337-360.
Gregaory, L. and W. Hatler. 2008. A Watershed Protection Plan for the Pecos River in Texas, Prepared for Texas
State Soil and Water Conservation Board and U.S. Environmental Protection Agency, by Texas AgriLife
Extension, Texas AgriLife Research Center, International Boundary and Water Commission, and Texas
Water Research Institute. <http://pecosbasin.tamu.edu/>
Griffith, G.E., S.B. Bryce, J.M. Omernik, and A. Rogers. 2007. Ecoregions of Texas. Texas Commission on
Environmental Quality. Austin, TX. 125p.
Harrell, Herschel L. 1978. Response of the Devil’s River (Texas) fish community to flooding. Copeia 1978(1):60-
68.
Heard, T.C., J.S. Perkin and T.H. Bonner. 2012. Intra-annual variation in fish communities and habitat associations
in a Chihuahuan Desert reach of the Rio Grande/Rio Bravo Del Norte. Western North American Naturalist,
72(1).
Heggenes, J. 1990. Habitat utilization and preferences in juvenile Atlantic salmon in streams. Regulated Rivers
Research and Management, Vol. 5, p. 341-354.
6-5
Heidel, S.G., 1956, The progressive lag of sediment concentration with flood waves: Transactions, American
Geophysical Union, v. 37, n. 1, p. 56-66.
Herring, J.,J. Hunt, J.M. Turner, T.W. Labbatt III, L.C. McMahan and E.B. Vaughn. 2008. Texas Instream Flow
Studies: Technical Overview, TCEQ, TWDB, and TPWD Texas Water Development Board Report 369.
Hoagstrom, C. W. 1994. Relative abundance and niche partitioning in the fish community of the Pecos River, Pecos
County, TX. Unpublished Master’s Thesis, Sul Ross State University, Alpine, TX. 136 pp.
Hoagstrom, C. W. 2003. Historic and recent fish fauna of the lower Pecos River. Pp. 91-110 in Garrett, G. P. and N.
L. Allan (eds.) Aquatic fauna of the Northern Chihuahuan Desert. Special Publication 46. The Museum of
Texas Tech University.
Howard, C. S. and S.K. Love. 1945. Quality of surface water of the United States, 1943, with a summary of
analyses of streams in Colorado River, Pecos River, and Rio Grande basins, 1925 to 1943, U. S. Geological
Survey Water-Supply Paper.
Howells, Robert B. 2001. Declining status of freshwater mussels in the Rio Grande, with comments on other
bivalves. In Aquatic Fauna of the Northern Chihuahuan Desert, eds. Gary P. Garrett and Nathan L. Allan,
Special Publication of Museum of Texas Tech University Number 43, May 12 2003.
Hubbs, C.L. 1940. Fishes of the Big Bend region of Texas. Transactions of Texas Academy of Science 23:3-12.
Hubbs C, R.R. Miller, R.J. Edwards, K.W. Thompson, E. Marsh, G.P. Garrett, G.L. Powell, D.J. Morris, R.W. Zerr.
1977. Fishes inhabiting the Rio Grande, Texas and Mexico, between El Paso and the Pecos confluence. In:
Johnson RR, Jones DA, technical coordinators. Importance, preservation, and management of riparian
habitat: a symposium; 1977 Jul 9; Tucson, AZ. Fort Collins (CO): U.S. Dept. of Agriculture, Forest
Service, Rocky Mountain Forest and Range Experiment Station. (General technical report RM: 43) p 91-7.
Hubbs, C. and G.P. Garrett. 1990. Re-establishment of Cyprinodon eximius (Cyprinodontidae) and status of Dionda
diaboli (Cyprinidae) in the vicinity of Dolan Creek, Val Verde Co., Texas. Southwestern Naturalist
35(4):446-478.
Hubbs, C., R.J. Edwards and G.P. Garrett. 2008. An annotated checklist of the freshwater fishes of Texas, with
keys to identification of species. Texas Journal of Science. <http://www.texasacademyofscience.org/>
Hubbs and Echelle. 1972. Endangered non-game fishes of the upper Rio Grande basin. In: Symposium on rare and
endangered wildlife of the southwestern United States. New Mexico Department of Game and Fish.
IBWC. 1994. Binational Study Regarding the Presence of Toxic Substances in the Rio Grande/Rio Bravo and its
Tributaries Along the Boundary Portion Between the United States and Mexico.
IBWC. 1998. Second Phase of the Binational Study Regarding the Presence of Toxic Substances in the Rio
Grande/Rio Bravo and its Tributaries Along the Boundary Portion Between the United States and Mexico.
Itzkowitz, M. and J. Nyby. 1982. Field Observations of Parental Behavior of the Texas Cichlid Cichlasoma
cyanoguttatum. American Midland Naturalist 108(2):364-368.
Jensen R, Hatler W, Mecke M, Hart C. 2006. The Influence of Human Activities on the Water of the Pecos Basin
of Texas: A Brief Overview. Special Report-2006-03. Texas Water Resources Institute publication.
Karges J. 2006. Personal Communication. July 11, 2006.

6-6
Kelsch, S. W. and F. S. Hendricks. 1990. Distribution of the headwater catfish Ictalurus lupus (Osteichthyes:
Ictaluridae). Southwestern Naturalist 35(3):292-297.
Kollaus, K. A. and T. H. Bonner. 2012. Habitat associations of a semi-arid fish community in a karst spring-fed
stream. Journal of Arid Environments 76:72 – 79.
Larkin, T.J. and G.W. Bomar. 1983. Climatic atlas of Texas. Texas Department of Water Resources, Austin, TX,
Publication LP-192.
Linam, G.W., L.J. Kleinsasser and K. Mayes. 1999. Regionalization of the index of biotic integrity for Texas
streams. Texas Parks and Wildlife Department, River Studies Report No. 16, Austin, Texas.
Lingle R, Linford D. 1961. The Pecos River Commission of New Mexico and Texas: A Report of a Decade of
Progress (1950-1960). Published by the Pecos River Commission, Carlsbad, New Mexico.
Littrell, B.M. 2006. Can Invasiveness of Native Cyprinids Be Predicted From Life History Traits? A Comparison
Between a Native Invader and a Regionally Endemic Cyprinid and Status of an Introgresses Guadalupe
Bass Population in a Central Texas Stream. Master of Science Thesis, Texas State University-San
Marcos.61 pp.
Lopez-Fernandez, H. and K. O. Winemiller. 2005. Status of Dionda diaboli and report of established populations of
exotic fish species in lower San Felipe Creek, Val Verde County, Texas. Southwestern Naturalist
50(2):246-251.
Martin, R.F. 1986. Spawning behavior of the gray redhorse, Moxostoma congestum (Pisces: Catostomidae) in
Central Texas. Southwest. Nat. 31: 399-401.
Miller, R. R., W. L. Minckley and S. M. Norris. 2005. Freshwater Fishes of Mexico. The University of Chicago
Press. Chicago, IL. pp 131-32.
Mills K. 2005. Updated Evaluation for the Trans-Pecos Priority Ground water Management Study Area. Technical report
published by the Texas Commission on Environmental Quality.
Miyamoto S.,L.B. Fenn and D. Swietlik. 1995. Flow, Salts, and Trace Elements in the Rio Grande: A Review.
Texas Agricultural Experiment Station, Texas Water Resources Institute. July 1995.
Miyamoto S. 1996. Salinity of the Rio Grande: Trend and management implications. Terra, 14(3): 265-278.
Miyamoto, S., Yuan, F., McDonald, A., Hatler, W., Anaya, G., Belzer, W., 2006. Reconnaissance survey of salt
sources and loading into the Pecos River. Texas A&M University Agricultural Research Center at El Paso.
Texas Water Resources Institute, Technical Report No 291.
Miyamoto S, F. Yuan and S. Anand. 2007. Water Balance, Salt Loading, and Salinity Control Options of Red Bluff
Reservoir, Texas. Texas Water Resources Institute. TR-298.
Miyamoto, S, S. Anand and W. Hatler. 2008. Hydrology, Salinity, and Salinity Control Possibilities of the Middle
Pecos River: A Reconnaissance Report. Texas Water Resources Institute. TR-2008-315.
Modde, T. and T. B. Hardy. 1992. Influence of Different Microhabitat Criteria on Salmonid Habitat Simulation.
Rivers: 3:1 37-44 pp.
Moore, K. M. S. and S. V. Gregory. 1988. Summer habitat utilization and ecology of cutthroat trout fry (Salmo
clarki) in Cascade Mountain streams. Canadian Journal of Fisheries and Aquatic Sciences 45: 1921-1930.

6-7
Moring, B. 2000. Baseline Assessment of Instream and Riparian-Zone Biological Resources on the Rio Grande in
and Near Big Bend National Park, Texas. USGS WRS 02-4106.
Moring, B.J. 2002. Baseline assessment of instream and riparian-zone biological resources on the Rio Grande in
and Near Big Bend National Park, Texas. Water-Resources Investigations Report 02-4106. U.S.
Department of Interior, Geological Survey, Austin, TX. 33 pp.
Moring, J.B. 2005. Status of fish communities in the Rio Grande, Big Bend National Park, Texas—Comparison
before and after spring 2003 period of low flow: U.S. Geological Survey Scientific Investigations Report
2005–5209, 11 p.
Mueller, J.E., 1975. Restless river. Texas Western Press, The University of Texas at El, Paso.
National Academy of Sciences. 2005. The Science of Instream Flows: A Review of the Texas Instream Flow
Program. Committee on Teview of Methods for Establishing Instream Flows for Texas Rivers, National
Research Council, National Academies Press, Washington D.C.
<http://www.twdb.texas.gov/InstreamFlows/pdfs/NAS_Report.pdf>
National Park Service. 1995. The nationwide rivers inventory. United States Department of the Interior,
Washington, DC. <http://www.ncrc.nps.gov/rtca/nri>
Newman C, Dale B. 1993. "The Pecos-River of Hard-Won Dreams." National Geographic, 183: 38-63.
Nielsen-Gammon, J. 2009. The changing climate of Texas. In: J. Schmandt, Clarkson, J., North, G.R. (Ed.), The
impact of global warming on Texas. University of Texas Press, Austin, TX.
Omernik, J.M. 2004, Perspectives on the nature and definitions of ecological regions: Environmental Management,
v. 34, Supplement 1, p. s27-s38
Orth, D. J. 1987. Ecological considerations in the development and application of instream flow-habitat models.
Regulated Rivers 1:171-181.
Osterkamp, W.R. 2008. Annotated definitions of selected geomorphic terms and related terms of hydrology,
sedimentology, soil science and ecology. In: USGS (Ed.), Reston, VA.
Platania, S.P. and C.S. Altenbach. 1998. Reproductive strategies and egg types of seven Rio Grande Basin
cyprinids. Copia3:559-569.
Plateau Water Planning Group. 2011. Plateau region water plan, prepared for Texas Water Development Board,
LBG Guyton Associates and Freese and Nichols
<https://www.twdb.state.tx.us/wrpi/rwp/3rdRound/2011_RWP/RegionJ/ >
Poff, N. L, K. David Allan, M.B. Bain, J.R. Karr, KI. Prestegaard, B.D. Richter, R.E. Sparks and J.C. Stromberg.
1997. The Natural flow Regime. BioScience, 47(11), 769-784.
Poff, N.L., Ward, J.V., 1989. Implications of streamflow variability and predictability for lotic community
structure: A regional analysis of streamflow patterns. Canadian Journal of Fisheries and Aquatic Sciences,
46(10), 1805-1818.
Pollen-Bankhead, N., A. Simon, K. Jaeger and E. Wohl. 2009. Destabilization of streambanks by removal of
invasive species in Canyon de Chelly National Monument, Arizona. Geomorphology 103 (3), 363–374.

6-8
Poole, J. 1999. Personal communication. Texas Parks and Wildlife Department, Austin, Texas
Porter, S.D. and G. Longley. 2011. Influence of Ground and Surface Water Relations on Algal Communities in the
Rio Grande Wild and Scenic River. Edwards Aquifer Research and Data Center. Texas State, 54 pp.
Raines, T.H., M.J. Turco, P.J. Connor and J.B. Bennett. 2012. Streamflow gains and losses and selected water-
quality observations in five subreaches of the Rio Grande/Rio Bravo del Norte from near Presidio to
Langtry, Texas, Big Bend area, United States and Mexico, 2006: U.S. Geological Survey Scientific
Investigations Report 2012–5125, 30 p.
Reeves, R.D. and T.A. Small. 1973. Ground water resources of Val Verde County, Texas: Texas Water
Development Board Report 172, 144 p.
Region F Water Planning Group, 2010. 2011 Region F Water Plan, prepared for Texas Water Development Board,
Vol. I Report and Vol. II Appendices, Freese and Nichols and LBG Guyton Associates.
<https://www.twdb.state.tx.us/wrpi/rwp/3rdRound/2011_RWP/RegionF/PDF's/ >
Renfrow, J. 2005. Final Report: Distribution and Diversity Survey of Rio Grande Mussels in Bend National Park
and a Portion of the Rio Grande Wild and Scenic River. National Park Service, June 5, 2005.
Rhodes, K. and C. Hubbs. 1992. Recovery of Pecos River fishes from a red tide fish kill. Southwestern Naturalist
37(2):178-187.
Richter, B.D., Baumgartner, J.V., Powell, J., Braun, D.P., 1996. A method for assessing hydrologic alteration
within ecosystems. Conservation Biology, 10(4), 1163-1174.
Richter, B.D., A.T. Warner, J.L. Meyer and K. Lutz. 2006. A Collaborative and Adaptive Process for Developing
Environmental Flow Recommendations. River Research and Applications, 22: 297–318.
Richter, B. D., and G. A. Thomas. 2007. Restoring environmental flows by modifying dam operations. Ecology and
Society 12(1): 12.
Robertson, M. S. and K. O. Winemiller. 2003. Habitat associations of fishes in the Devils River. Journal of
Freshwater Ecology 18:115-127.
SAC (Science Advisory Committee). 2009. Geographic Scope of Instream Flow Recommendations, Report# SAC
2009-02. April, 2009.
<http://www.sratx.org/BBEST/RecommendationsReport/LinkedDocuments/GeoScope-20090403.pdf >
Saunders, Ken. Fish Biologist. Texas Parks and Wildlife.
Schmandt, J., J. Clarkson and J.R. North, eds. 2008. The Impact of Global Warming on Texas (2nd ed.), 33p. <
http://www.texasclimate.org/Portals/6/Books/ImpactTX/Ch2Nielsen-Gammon.pdf >
Schmidt, J.C., B.L. Everitt and G.A. Richard. 2003. Hydrology and geomorphology of the Rio Grande and
implications for river rehabilitation. In: Garret, G.P. and A.L. Allan (Eds.),Special Publications no. 46.
Museum of Texas Tech University, Lubbock, TX, USA, pp. 25–45.
Schmidt, J. C. 2010. A watershed perspective of changes in stream flow, sediment supply, and geomorphology of
the Colorado River. Colorado River Basin Science and Resource Management Symposium. T. S. Melis, J.
F. Hamill, L. G. Coggins, Jr.et al. Scottsdale, Arizona, U.S. Geological Survey Scientific Investigations
Report 2010 5135: 51-76.

6-9
Shirvell. C. S. 1989. Ability of PHABSIM to predict chinook salmon spawning habitat. Regulated Rivers :
Research and Management 3:277 289.
Shirvell, C. S. 1994. Effect of changes in streamflow on the microhabitat use and movements of sympatric juvenile
coho (Oncorhynchus kisutch) and chinook salmon (O. tshawytscha) in a natural stream. Can. J. Fish. Aquat.
Sci. 51:1644-1652.
Smith, A., A.A. Abuzeineh, M.M. Chumchal, T.H. Bonner and W.H. Nowlin. 2010. Mercury contamination of the
fish community of a semi-arid and arid river system: Spatial variation and the influence of environmental
gradients. Environmental Toxicology and Chemistry, 29(8), 1762-1772.
Smith, A., M.M. Chumchal, T.H. Bonner and W.H. Nowlin. 2010. Mercury contamination of the Rio Grande/Rio
Bravo Del Norte fish community: spatial variation and influence of environmental gradients.
Environmental Toxicology and Chemistry 29:1762-1772.
Smith, J. J. and H. W. Li. 1983. Energetic factors influencing foraging tactics of juvenile steelhead trout, Saltno
gairdneri. Pages 173-180 in D. L. G. Noakes, D. G. Lingquist, G. S. Helfman, and Jo A. Ward, editors.
Predators and prey in fishes. Dr. W. Junk, The Hague, The Netherlands.
Smith, Richard. 2001. Hydrogeology of the Marathon Basin, Brewster County, Texas. in Mace, R.E., Mullican,
W.F., and Angle, E.S., eds. Aquifers of West Texas, Texas Water Development Board Report 356, pp. 190
- 206.
Stotz, N.G., 2000. Historic reconstruction of the ecology of the Rio Grande /Rio Bravo channel and floodplain in
the Chihuahuan desert, World Wildlife Fund.
Stromberg, J.C. 2001. Restoration of riparian vegetation in the south-western united states: Importance of flow
regimes and fluvial dynamism. Journal of Arid Environments, 49(1), 17-34.
Suttkus, R. D. and C. Jones. 2006. Fishes of Independence Creek and Pecos River. Occasional Papers, Museum of
Texas Tech University 248:1-7.
Tal, M., and C. Paola. 2007. Dynamic single-thread channels maintained by the interaction of flow and vegetation.
Geology 35 (4), 347–350.
TCEQ. 2003. Assessment of the Presence and Causes of Ambient Water Toxicity in the Rio Grande Above Amistad
Reservoir, Segment 2306. TCEQ TMDL Program. Trevino-Robinson, D. 1959. The ichthyofauna of the
lower Rio Grande, Texas and Mexico, Copeia 1959:253-256.
Texas Commission on Environmental Quality, Texas Parks and Wildlife Department, and Texas Water
Development Board. 2008. Texas Instream Flow Studies: Technical Overview. TWDB Report 369. May
2008. Austin, TX.
<http://www.twdb.state.tx.us/publications/reports/numbered_reports/doc/R369_InstreamFlows.pdf>
Texas Energy Conservation Office, 2008, Texas Renewable Energy Resource Assessment.
<http://www.seco.cpa.state.tx.us/publications/renewenergy/pdf/renewenergyreport.pdf.>
Texas Instream Flow Program (TIFP). 2008. Texas Instream Flow Studies: Technical Overview. Texas Water
Development Board Report 369:1-137, Texas Water Development Board, Austin, TX.
Texas Instream Flow Program and San Antonio River Authority. 2011. Instream Flow Study of the Lower San
Antonio River and Lower Cibolo Creek. Interim Progress Report and Instream Flow Recommendations.
183 pp.

6-10
Texas Natural Resource Conservation Commission. 1996. Texas surface water quality standards. Texas Natural
Resource Conservation Commission, Austin, Texas.
Texas Parks and Wildlife Department. 2004. List of Potential Ecologically Unique Stream Segments for Region F,
September 13, 2004.
<http://www.twdb.state.tx.us/wrpi/rwp/3rdRound/2010_IPP/RegionF/PDF/Chapters/Region%20F%20Cha
pter%208_IPP.pdf>
Texas Water Development Board. 2001. Chapter 357, Regional Water Planning Guidelines, Austin, October 1999,
amended July 11, 2001.
Texas Water Development Board. 2012. Precipitation and Lake Evaporation Data for Texas.
<http://midgewater.twdb.state.tx.us/Evaporation/evap.html >
Trevino-Robinson, D. 1959. The ichthyofauna of the lower Rio Grande, Texas and Mexico, Copeia 1959:253-256.
Urbanczyk, K.M., J.C. White and D.R.Rohr. 2001. Geologic History of West Texas, in Mace, R.E., Mullican, W.F.,
and Angle, E.S., eds. Aquifers of West Texas, Texas Water Development Board Report 356, pp. 17-25.
Valdes Cantu, N. E. and K. O. Winemiller. 1997. Structure and habitat associations of Devils River fish
assemblages. Southwestern Naturalist 42(3):265-278.
Wade, S.C., W.R. Hutchison, A.H. Chowdhury and D. Coker. 2011. A Conceptual Model of Ground water Flow in
the Presidio and Redford Bolsons Aquifers. <http://www.twdb.state.tx.us/ground
water/models/gam/prbl/PRBL_Conceptual_Model_Report.pdf >
Walker, K.F., Sheldon, F., Puckridge, J.T., 1995. A perspective on dryland river ecosystems. Regulated Rivers:
Research & Management, 11(1), 85-104.
Watson, J. M. 2006. Patterns and habitat associations of a desert spring fish assemblage and responses to a large-
scale flood. M. S. Thesis, Texas State University.
Wilcock, P, J. Pitlick and Y. Cui. 2009. Sediment Transport Primer: Estimating Bed-Material Transport in Gravel-
bed Rivers. Gen. Tech. Rep. RMRS-GTR-226. Fort Collins, CO: U.S. Department of Agriculture, U.S.
Forest Service, Rocky Mountain Research Station.
Wilde, G.R. and A.A. Echelle. 1992. Genetic status of Pecos pupfish populations after establishment of a hybrid
swarm involving an introduced congener. Transactions of the American Fisheries Society 121:277-286
Williams CW. 1982. Texas' Last Frontier: Fort Stockton and the Trans-Pecos (1861-1895), book published by the
Texas A&M University Press.
Williams, J. E., Bowman, D. B., Brooks, J. E., Echelle, A. A., Edwards, R. J., Hedrickson, D. A. & Landye, J. J.
1985. Endangered aquatic ecosystems in North American deserts with a list of vanishing fishes of the
region. J. Az-Nev Acad. Sci. 20:1-62.