environmental economy and policy research · environmental economy . and policy research ....
TRANSCRIPT

1
Environmental Economy and Policy Research
Discussion Paper Series
2010
Number: 51.2010
Investigating Farmers’ Choice of Pearl Millet
Varieties in India to Inform Targeted Biofortification Interventions: Modalities of
Multi-Stakeholder Data Collection by
Dorene Asare-Marfo, Ekin Birol and
Devesh Roy
UNIVERSITY OF CAMBRIDGE Department of Land Economy

2
Investigating Farmers’ Choice of Pearl Millet Varieties in India to Inform Targeted Biofortification Interventions: Modalities of Multi-Stakeholder Data Collection
Dorene Asare-Marfo*, Ekin Birol * and Devesh Roy**
* HarvestPlus, International Food Policy Research Institute, Washington DC, USA ** International Food Policy Research Institute, Washington DC, USA Abstract The poor usually suffer from micronutrient malnutrition because foods that contain essential micronutrients (such as animal source foods) are generally unaffordable to them. Since poor consumers usually consume staples such as wheat, maize and rice, a good way to increase the intake of micronutrients is by adding micronutrients such as zinc, vitamin A and iron to the staples that are consumed on a daily basis. This process is known as biofortification. Biofortification could prove to be an essential strategy for combating micronutrient malnutrition in developing countries such as India, which has one of the world’s highest overall rates of malnutrition. HarvestPlus has been working in the area of biofortification of several staple crops consumed by people in developing countries. In this paper we focus on pearl millet, an important staple crop consumed by the poor in India . While biofortification adds desirable nutrients to crops, it may also alter certain pre-existing traits which farmers and consumers may value thus affecting the adoption of these varieties. In addition institutional and structural factors could affect adoption. This study assesses the factors that affect farmers’ choice of pearl millet varieties which is a precursor to the introduction and dissemination of bio-fortified varieties of pearl millet. The multi-stakeholder coverage and geographic spread of data collection, along with the necessity for strict data quality control, mandated the use of various innovative data collection and validation methods. Data was collected in two states of India, namely Maharashtra and Rajasthan. Our preliminary results reveal significant differences across the two states in terms of the varieties grown and the dynamics surrounding their popularity. These findings are expected to inform the design of efficient, effective and targeted interventions to maximize the adoption of biofortified pearl millet varieties.
Keywords: Biofortification, Pearl millet, CAPI, CATI, HarvestPlus, India
Address for correspondence Dr. Ekin Birol Head, Impact and Policy, HarvestPlus c/o International Food Policy Research Institute 2033 K St, NW Washington, DC 20006, USA Tel: +1-202-862-5617 Fax: +1-202-467-4439 Email: [email protected]

3
1. Introduction
Biofortification – the process of breeding staple food crops with higher
micronutrient content – could prove to be an essential strategy for combating
micronutrient malnutrition in India, which has one of the world’s highest overall
rates of malnutrition. An estimated 66% of children in Western India for example
suffer from anemia (HarvestPlus, 2010). At the same time, a majority of the
Indian population is vegetarian for economic, religious or personal preferences;
and as is the case in many developing countries, access to food supplements
and commercially marketed fortified foods is limited. This suggests that in order
to ensure better nutritional outcomes there is an additional need to enrich the
common diets of the poor in India.
HarvestPlus is a Challenge Program of the Consultative Group on International
Agricultural Research (CGIAR) which recognizes the benefits of biofortification in
developing countries on the one hand, and the high consumption rates of staple
crops among the poor on the other. The researchers in the program endeavor
to solve the micronutrient malnutrition problem by breeding varieties with three
critical micronutrients recognized by the World Health Organization (WHO) –
vitamin A, zinc and iron – into food crops that are widely consumed by the poor
(HarvestPlus, 2009a). Projects are currently underway in seven developing
countries to breed and disseminate biofortified varieties of staple crops such as
wheat, beans, pearl millet, rice, sweet potato, maize and cassava (see
http://www.harvestplus.org/). Scientists from the International Crops Research
Institute for the Semi-Arid Tropics (ICRISAT) in collaboration with HarvestPlus
are currently breeding iron-rich varieties of pearl millet which they aim to
disseminate in India in 2010 (HarvestPlus, 2009b; HarvestPlus, 2010).
While biofortification adds desirable nutrients to the staples, it may also alter
certain pre-existing favorable traits which farmers and consumers value highly.
These changes could in turn affect the adoption rate of biofortified varieties by
farmers. Additionally, adoption may depend on several institutional and
structural factors (such as social networks, market structure of seed systems

4
etc), which need to be assessed before a successful bid on the introduction and
dissemination of new varieties can be made.
The aim of this study therefore is to investigate factors (including institutional
and social networks) that affect farmers’ choice of pearl millet varieties. Data on
current pearl millet cultivation; traits that make certain varieties more popular
than others; the public and private, formal and informal sources of seed and
information about new varieties need to be investigated in order to achieve this
goal. Such information can inform the design of targeted interventions to
maximize the adoption of biofortified pearl millet in India. Three key messages,
following our objectives, have bearings on the data collection methods that are
employed:
(1) Varietal adoption is a complex process involving many agents. The observed
multiplicity of agents, the differences in their information sets and their roles
in varietal adoption highlight the merit of triangulation in data collection that
we assumed ex ante, and was vindicated strongly ex post.
(2) In addition to triangulation, and given the complexities in data needs for
analysis of varietal adoption, data collection methodology needs to
internalize comprehensive validation checks for quality control.
(3) The number of issues to cover becomes compounded when data collection
from specific actors is required to study varietal adoption. Appropriate
methodologies of data collection should therefore be prioritized and identified
in order to capture the relevant information from respective actors under
resource constraints.
Given these priors, we collected and triangulated data across key actors in the
pearl millet seed value chain in India using cutting-edge and innovative data
collection techniques. Four distinct surveys were carried out in two Indian states,
Maharashtra and Rajasthan, to gather information from farmers, agri-input/seed
suppliers, seed companies and agricultural/block extension officers.
Approximately data from 4213 farmers was collected with Personal Digital
Assistants (PDAs) through Computer Assisted Personal Interviews (CAPI), 99
agricultural extension officers were interviewed using conventional pen and
paper interviewing (PAPI), while data from approximately 932 seed/agri-input

5
suppliers were collected through a telephonic survey and entered on web-based
software in real time. Lastly, a web-based survey, which is currently ongoing,
was developed for seed companies throughout India.
Our preliminary results reveal that there are differences across the two states in
terms of the type of pearl millet varieties grown both in more aggregate
categories (modern versus traditional varieties) as well in disaggregated ones
(for example types of hybrid seeds chosen). Several other important differences
such as the role of seed suppliers vs. extension officers in the diffusion of seeds,
and also, in terms of farmers’ sources of information regarding new varieties
were observed. Farmers in Maharashtra are more likely to grow improved
varieties, seeds of which they purchase from agri-input suppliers and are more
likely to obtain their information about new seeds from the private sector agents
such as agri-input suppliers and agri-exhibitions. Rajasthan varietal choice is
strongly skewed in favor of local varieties and the information and distribution
networks are largely concentrated in the public sector (agricultural extension
officers and agricultural information centers).
Through our study we found that there are several advantages and
disadvantages to the various data collection techniques used. These should be
taken into consideration when deciding on an appropriate technique to adopt for
the type of actor being interviewed. The pros and cons of each data collection
method as experienced by the researchers in this study are presented in the
next section and summarized in the appendix.
The rest of the paper unfolds as follows: section 2 discusses the various data
collection methods used in this study into greater detail, section 3 gives a brief
background on pearl millet production in the two study states, section 4
discusses the results of the study and section 5 concludes the paper with a
summary of our key findings as well as the importance of triangulation in a study
of this nature.
6
2. Data Collection Methods Employed
Varietal choice of pearl millet is a complex process and is determined by both
demand and supply side factors apart from being a function of institutional and
social networks. From a demand-side perspective, certain varieties may be
chosen for their consumption traits such as taste, color and quality of roti (bread),
while supply-side factors such as agro-ecological conditions, availability of seed,
and marketing and processing traits may well be the key driving factors for
cultivation of a specific variety in a given block, village or even state. As it turns
out, several actors are also involved and decisions, practices and knowledge
regarding pearl millet cultivation may differ from actor to actor. Institutional and
social networks and the market structure of seed systems also affect the pattern of
varietal cultivation which could again vary across regions. The data collection
methods adopted ex-ante need to capture the complexities of the multi-stakeholder
coverage and the multi-dimensional issues surrounding the adoption of varieties for
each actor. At the same time, the data collected should allow for cross-validation
across actors. The response of each actor is based on his or her information set
and sometimes even the incentives are oriented in a way that determines the
responses. The novelty of triangulating data across several agents in a study of
this nature lies in the ability to cross-validate. Consider for example a simple piece
of information i.e. the five most popular varieties in the region. Depending upon
whether the respondent is a government agent or a private sector employee, the
information set as well as the incentives to report the true picture could very well
vary. Furthermore, a survey of multiple agents along the supply chain becomes
important because valuation of traits has a supply chain dimension; the entry
points for new varieties can only be obtained by understanding the whole food
chain.
Four key players were identified in the pearl millet supply chain in Maharashtra and
Rajasthan; namely, farmers, agri-input suppliers, extension/agricultural officers and
seed companies.1
1 Note that in this phase we exclude the category of consumers, yet we realize that most households are subsistence farmers and accordingly detailed information from farm households was collected also regarding the consumption traits.
The data collection techniques used for each of these actors
were heavily determined by the underlying extensive margin – number of
7
respondents and the geographical dispersion of the respondents in the actor
group, and intensive margin – breadth of information sought from each actor.
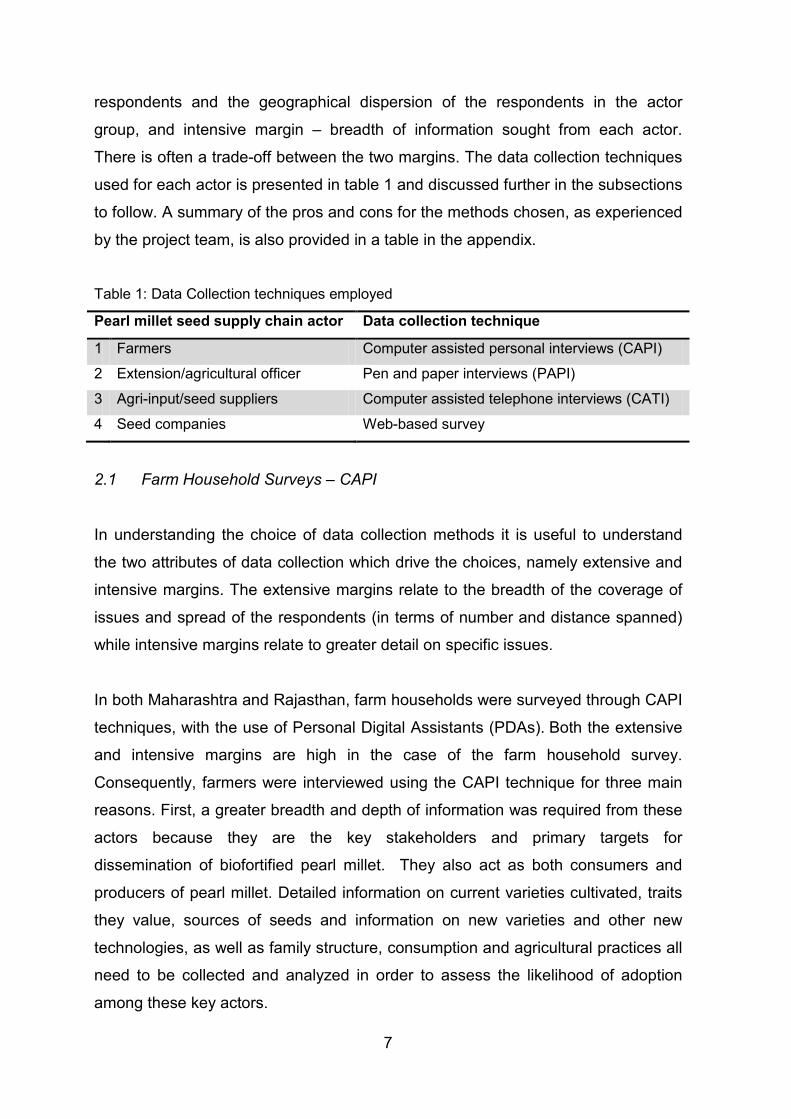
There is often a trade-off between the two margins. The data collection techniques
used for each actor is presented in table 1 and discussed further in the subsections
to follow. A summary of the pros and cons for the methods chosen, as experienced
by the project team, is also provided in a table in the appendix.
Table 1: Data Collection techniques employed
Pearl millet seed supply chain actor Data collection technique
1 Farmers Computer assisted personal interviews (CAPI)
2 Extension/agricultural officer Pen and paper interviews (PAPI)
3 Agri-input/seed suppliers Computer assisted telephone interviews (CATI)
4 Seed companies Web-based survey
2.1 Farm Household Surveys – CAPI
In understanding the choice of data collection methods it is useful to understand
the two attributes of data collection which drive the choices, namely extensive and
intensive margins. The extensive margins relate to the breadth of the coverage of
issues and spread of the respondents (in terms of number and distance spanned)
while intensive margins relate to greater detail on specific issues.
In both Maharashtra and Rajasthan, farm households were surveyed through CAPI
techniques, with the use of Personal Digital Assistants (PDAs). Both the extensive
and intensive margins are high in the case of the farm household survey.
Consequently, farmers were interviewed using the CAPI technique for three main
reasons. First, a greater breadth and depth of information was required from these
actors because they are the key stakeholders and primary targets for
dissemination of biofortified pearl millet. They also act as both consumers and
producers of pearl millet. Detailed information on current varieties cultivated, traits
they value, sources of seeds and information on new varieties and other new
technologies, as well as family structure, consumption and agricultural practices all
need to be collected and analyzed in order to assess the likelihood of adoption
among these key actors.

8
Secondly, a fairly large sample size is required to carry out analyses with better
precision so as to be able to make targeted and relevant policy recommendations
for the population of pearl millet farmers in each state. Third, because of the high
intensive margin (need for detailed data collection) and extensive margins (need to
survey a large sample size), there is greater need to design a survey instrument
that internalizes validation checks for data quality control.
The survey instrument was developed through consultations with the national
collaborators and colleagues from ICRISAT and All India Coordinated Pearl Millet
Improvement Project (ICAR) as well as a background review of relevant literature
on variety adoption, and informal interviews with key pearl millet seed supply chain
actors. The final survey instrument comprised eight modules which included
household identification and composition questions, questions on agricultural
production, varietal choice of pearl millet and pearl millet traits, as well as
questions on other issues such as nutrition and food consumption.
Following the design of the survey instrument, a customized program was
developed using the Satellite Forms software. This program included a number of
control and validation checks. This is one of the main advantages of CAPI surveys.
Unlike traditional PAPI, CAPI allows for consistency checks and resolution of
anomalies either from the respondent or enumerator’s side. Moreover the data
export software developed for the program enables downloading of data from the
PDAs, which also allows for frequent monitoring and minimization of data entry
errors. A recent study (Caeyers et al, 2010) comparing traditional PAPI to CAPI
finds that even though there is no significant difference in respondents’ perceptions
of each form of interviewing, an average of 10 inconsistencies per survey are
detected in PAPI vs. CAPI techniques, as the latter technology, through
consistency and validation checks, reduces outliers. The study also finds that in a
household survey with a total of 640 households, PDA usage tends to reduce
interviewing time by approximately 8%. Although CAPI presents many advantages
over PAPI, there is a critical need to factor in ample time for programming and
extensive pretesting in order to capture the complexities that are inherent in
comprehensive household surveys.

9
In Maharashtra, a four full-day enumerator training workshop was conducted by the
IFPRI researchers and the field project leader in Marathi and Hindi languages. The
same was conducted in Rajasthan but for six full-days in Hindi only. In each state,
twenty enumerators, three field supervisors and one data manager were
thoroughly trained on the purpose of the project, the survey instrument and PDA
use. Data managers were trained on how to download data from the PDAs and
send the same to IFPRI researchers on a regular basis (every week). Pre-tests
were conducted in both states following the training workshops. The aims of the
pre-test were twofold: to concurrently test and finalize the survey instrument, and
also to train the enumerators. The survey instrument as well as the PDA data
collection and data export programs were finalized after the pre-test. Data
collection lasted approximately three months in Maharashtra and four months in
Rajasthan. In general, and in line with Taylor (1998), enumerators and respondents
reacted positively to the new technology.
2.2 Extension/Agricultural Officer Survey – PAPI
The extension or agricultural officer (EAO) serves as the link between the state
agricultural department and the farming community. Each block is assigned one
EAO. Their role spans a variety of areas from informing farmers about new farming
practices, technologies and credit programs to promoting contract farming
opportunities. Because they play a critical role in agricultural development within
each block, they were identified as key actors within the pearl millet supply chain.
The initial aim of the EAO survey was to interview all the EAOs from our sampling
frame of 184 pearl millet cultivating blocks in Maharashtra and 213 pearl millet
cultivating blocks in Rajasthan. Given the extensive margin (that is, wide
geographical coverage), the initial strategy was to send a web-based survey,
similar to the seed company survey, to cover all the EAOs in the sampling frame.
However, hinging on the preexisting knowledge of lower response rates that this
technique typically has compared to face-to-face survey instruments, coupled with
the relatively low levels of computer literacy of EAOs as well as their limited access

10
to reliable internet services, this technique became a less appealing mode of
interviewing for this actor.
Moreover, for EAO survey there was no need for an in-depth questionnaire similar
to what was administered to the farmers; information needed from EAOs was very
basic. Officers were asked questions such as the number of villages they were
responsible for, the composition and farmer dynamics within their designated
villages, popular crops grown in the block and questions pertaining to the top five
most popular pearl millet varieties which farmers in that block typically grow. The
EAO survey was estimated at 10 to 15 minutes to administer and evidently had a
narrower intensive margin. Given all these, a face-to-face PAPI interview with
EAOs was deemed most suitable. Moreover, economies of scale were created in
the sampled blocks as enumerators covered two surveys (and two sets of actors)
in each.
Unfortunately, the response rate for this survey in both states was low: 32% (58
officers) in Maharashtra and 19% (41 officers) in Rajasthan, even though the study
was endorsed by the Agricultural Commissioners of both states, who provided the
research teams and enumerators with letters addressed to the EAOs to encourage
them to participate in the survey. In Maharashtra, of the 58 officers interviewed,
27 of them, i.e. 47% work in the sampled blocks and the remaining are still within
our sampling frame of pearl millet producing blocks, whereas in Rajasthan all of the
officers interviewed work on the sampled blocks. The survey was carried out
concurrently with the farm household surveys in each state.
2.3 Agri-Input Supplier Survey – CATI
The agri-input supplier survey was developed in consultation with the national
collaborators and was primarily implemented by KISAN2
2 KISAN means farmer in Hindi.
, a private agricultural
service provider which organizes India’s largest annual agricultural exhibition. This
survey was conducted over the telephone by six trained enumerators who are
regular staff at KISAN’s call centre. Enumerators spoke to agricultural input
suppliers, who own small shops or kiosks and typically supply a variety of inputs

11
such as seeds and fertilizer. The data were entered in real time on a web-based
computer program designed by KISAN on Sage ACT! software. IFPRI researchers
and national collaborators were given access to this web-based program and were
able to log into it to check and download the data as it was being collected. The
survey instrument was finalized after two pre-tests, each with ten suppliers. The
data for this survey was collected over a combined period of five months for the
two states.
The main motivation for using CATI for this survey was the fact that a database
with contact information for agri-input suppliers preexisted. KISAN has been
developing this database over the last 16 years and uses it to inform the agri-input
suppliers (as well as other actors like farmers and wholesalers of agricultural
equipment) about upcoming agricultural exhibitions. Also, the extensive margin
regarding geographical dispersion was fairly wide as we pursued to reach all
existing suppliers in the sampling frames in each state. Conversely, and similar to
the EAO survey, the intensive margin for this survey was small. These actors have
potentially high opportunity costs of time and a quick but informative data collection
method is suitable for them.
Agri-input respondents were asked questions about the top three pearl millet
varieties they sold in the last season; reasons as to why they think farmers may
prefer these varieties; farmers’ main sources of information on varieties; villages in
which the clientele of the agri-input suppliers are located, and the estimated
percentage of their clientele who are small scale (<2 ha), medium scale (2-5ha)
and large scale (>5ha) farmers.
The sampling frame for the Maharashtra agri-input supplier survey was all of the
2780 agri-input suppliers from Maharashtra listed in the database of KISAN. Of
these 2780 agri-input suppliers, 30% (835 suppliers) could be contacted and stated
that they sold pearl millet seed, of which 95% (789 suppliers) agreed to participate
in the survey. The apparent high response rate of the seed suppliers seems to
justify the mode of data collection used for these actors. These suppliers are
located across 147 of the 184 pearl millet producing blocks in the state, thereby
providing a good coverage (80%) of the pearl millet producing blocks in
12
Maharashtra. In Rajasthan, of the 2590 agri-input suppliers listed in KISAN’s
Rajasthan data base, 6% (159 suppliers) of those contacted stated that they sold
pearl millet seed and 90% (143 pearl millet seed suppliers) of these agreed to
participate in the survey. These suppliers are located across 37 of the 213 pearl
millet producing blocks in the state. In Rajasthan there are significantly fewer
number of pearl millet seed suppliers compared to Maharashtra, revealing that
formal pearl millet seed markets in Rajasthan are thin and that farmers probably
rely on their own seeds and to some extent public sector seeds for pearl millet
production.
2.4 Seed Company Survey – web-based
The geographical coverage for the seed company survey was nationwide and the
depth of information required from these actors was relatively low. Coupled with
the fact that seed company managers, to whom this survey was addressed to, are
expected to possess a given level of computer literacy rendered a self-
administered web-based questionnaire a favorable method for carrying out this
survey. However, as with any web-based survey, the greatest disadvantage is the
probability of receiving a very low response rate. To remedy this, it was decided
that frequent reminders would be sent out encouraging participation from the seed
company managers. In this web-based survey, seed company managers were
asked whether their company had sold pearl millet seeds in the study states;
information on the three most popular pearl millet varieties sold by their company
(e.g., its price, type (i.e., hybrid or not) and reasons as to why they think farmers
prefer these varieties).
A list of seed companies was compiled following internet searches and
consultations with ICRISAT colleagues. The survey instrument was developed
through consultations with our national collaborators, ICRISAT colleagues, and
ICAR. Emails asking the seed companies to take part in the survey were sent by
ICRISAT since seed companies already interact regularly with ICRISAT and also
procure their seed (for sale) from them. In the case of these actors, the web based
survey is thought to be the most efficient technique, since these high level
professionals are likely to have reliable internet access and to be proficient in

13
computer use. Moreover the ability to garner the trust and participation of the
respondent is the key. For that reason, an equivalent of a survey underwriter such
as ICRISAT is advisable.
3. Case Study States
3.1 Maharashtra
The sampling methodology used to select the farm households interviewed was a
combination of stratified random sampling and probability proportionate to size
(PPS) methods. Sampling design consisted of four stages. First, based on
background research, of the nine agro-ecological zones in the Maharashtra, two
were identified as conducive to pearl millet production. These two zones are the
scarcity zone and the assured rainfall zone. Second, the sampling frame for the
farm household survey was drawn by using the most recent (2007-8) block level
data on the area under pearl millet production in the two agro-ecological zones in
which pearl millet is produced. These blocks comprise 184 blocks of the total of
446 blocks which make up the state of Maharashtra.
Third, the 184 pearl millet producing blocks in these two agro-ecological zones
were ranked in an ascending order according to the total area under pearl millet
production and split into four groups based on quartile cut off points for total land
under pearl millet production. In each group (low, low-medium, high-medium and
high group) seven to 13 blocks were randomly selected, oversampling in areas
with high-medium and high pearl millet production areas. Figure 1 below shows
the share of agricultural area dedicated to pearl millet in each one of the 184 pearl
millet producing blocks. Figure 2 shows the blocks selected for the purposes of this
study. Lastly, depending on the total number of villages, four to six villages were
randomly selected in each block. The selection of villages was based on
stratification according to the distance to the centre of the block. Finally, in each
village, depending on the population of the village, 10 to 20 households were
randomly selected to be interviewed. In total, 2069 households were interviewed
across nine districts, 38 blocks and 199 villages.

14
Figure 1. Share of agricultural area dedicated to pearl millet production, Maharashtra
Figure 2. Sampled blocks in Maharashtra
3.2 Rajasthan
In Rajasthan, we followed a similar sampling design. Out of the ten agro-climatic
zones in Rajasthan, six are conducive to pearl millet production We used the
most recent (2007-8) block level data on the area under pearl millet agro-ecological
zones in which pearl millet is produced (Figure 3 below). These zones include 213
blocks of the total 245 blocks which make up the state of Rajasthan.

15
Third, the 213 pearl millet and wheat producing blocks were ranked in an
ascending order according to the total area under pearl millet production and split
into quartiles of total land under pearl millet production. All the blocks in high-
medium and high crop area groups were selected. Selection of these high-medium
crop and high crop blocks ensured that we also had blocks from the low-medium
and low crop area. In total, data were collected from all five high pearl millet area
blocks, almost all (13 out of 14) high-medium pearl millet area blocks, four low-
medium pearl millet area blocks and 23 low pearl millet area blocks. Figure 3
shows the share of agricultural area dedicated to pearl millet in each one of the
213 pearl millet producing blocks and Figure 4 shows the 45 sampled blocks.
Fourth, depending on the total number of villages in each block, four to six villages
were randomly selected in each block. Similar to the Maharashtra sampling, the
selection of villages was based on stratification according to the distance to the
centre of the block. Finally, in each village, depending on the population of the
village 10 to 15 households were randomly selected to be interviewed. To select
the respondents a cross sampling method was used. A total of 2144 households
were interviewed in 15 districts, 45 blocks and 223 villages.
Figure 3. Share of agricultural area dedicated to pearl millet production, Rajasthan

16
Figure 4. Sampled blocks in Rajasthan
4. Results In this section, we present some preliminary results from the farm household
survey, agri-input survey, and EAO survey. Results from the seed company survey
are not presented in this paper because the survey is still ongoing.
4.1 Results from the Farm Household Survey
According to the sample statistics, 66% of all interviewed households in
Maharashtra and 68% of interviewed households in Rajasthan cultivated pearl
millet in the last twelve months (either in Kharif (autumn) 2009 and/or in Rabi
(spring) 2008 seasons). In both states, when non-pearl millet growers were asked
why they did not cultivate pearl millet in the last season, the most frequently cited
reasons were farmers’ preference of other crops which yielded higher profits (20%
in Maharashtra and 12% in Rajasthan) and higher prices in the market (7% in
Maharashtra and 6% in Rajasthan). A majority of the farmers in both states (88%
in Maharashtra and 98% in Rajasthan) produced pearl millet in the Kharif 2009
season.
A great majority of pearl millet farmers preferred to cultivate only one pearl millet
variety per season. In fact, only 5% of farmers who cultivated pearl millet in Kharif
17
2009 sowed multiple varieties. A great majority of farmers (30% in Maharashtra
and 49% in Rajasthan) who cultivated multiple varieties cited “experimenting with a
new variety” as the main reason for sowing multiple varieties. In Maharashtra,
farmers who cultivate more than one pearl millet variety typically have lower off-
farm and farm incomes compared to those who sow only one variety. Therefore it
seems to be the poorer households who opt for diversification across varieties in
that state. In Rajasthan there is no difference in the income levels of farmers who
cultivate multiple varieties compared to those who cultivate only one variety.
Pearl millet producing households in Maharashtra cultivate significantly larger farm
areas (at 5% significance level); in Rajasthan, there is no significant difference in
farmland size between the two groups. Overall, compared to their Maharashtra
counterparts, pearl millet farmers in Rajasthan have lower incomes (off-farm and
farm) and farm smaller areas.
4.1.1 Popular Pearl Millet Varieties – Farm Household Survey
In this section we focus on the popular pearl millet varieties cultivated in Kharif
2009, since in both states, only a small fraction of farmers were found to be Rabi
pearl millet farmers. In Maharashtra 51 varieties of pearl millet seeds were
identified and this figure is as high as 68 for Rajasthan. Seed markets in
Maharashtra are likely to be more concentrated than Rajasthan and therefore
exhibit less diversification in number of varieties cultivated. The top10 pearl millet
varieties were ranked according to the share of land area dedicated to each variety
in the state. These are presented in table 2.
According to the results, the most popular pearl millet variety in Maharashtra is
Mahyco 204, followed by Pioneer 86M32, Mahyco 2210, Nirmal 9 and Mahalaxmi
308. In support of Dar et al (2006) where it was suggested that at least 80% of
pearl millet varieties grown were hybrids from private companies, all of these
popular varieties are hybrids produced by private seed companies. Also in the top
10 is Mahabeej ICTP 8203, which is an open pollinated variety (OPV) developed
by ICRISAT and produced by Maharashtra State Seeds Corporation Ltd., a public
seed company. Since a great majority of pearl millet farmers cultivate hybrid seeds
18
in this state, the frequencies of seed replacement is high and on average farmers
cultivate the seed of the same variety for two to three years. The top five ranking in
Maharashtra does not differ when one looks at the popularity in terms of the
number of farmers who cultivate each variety.
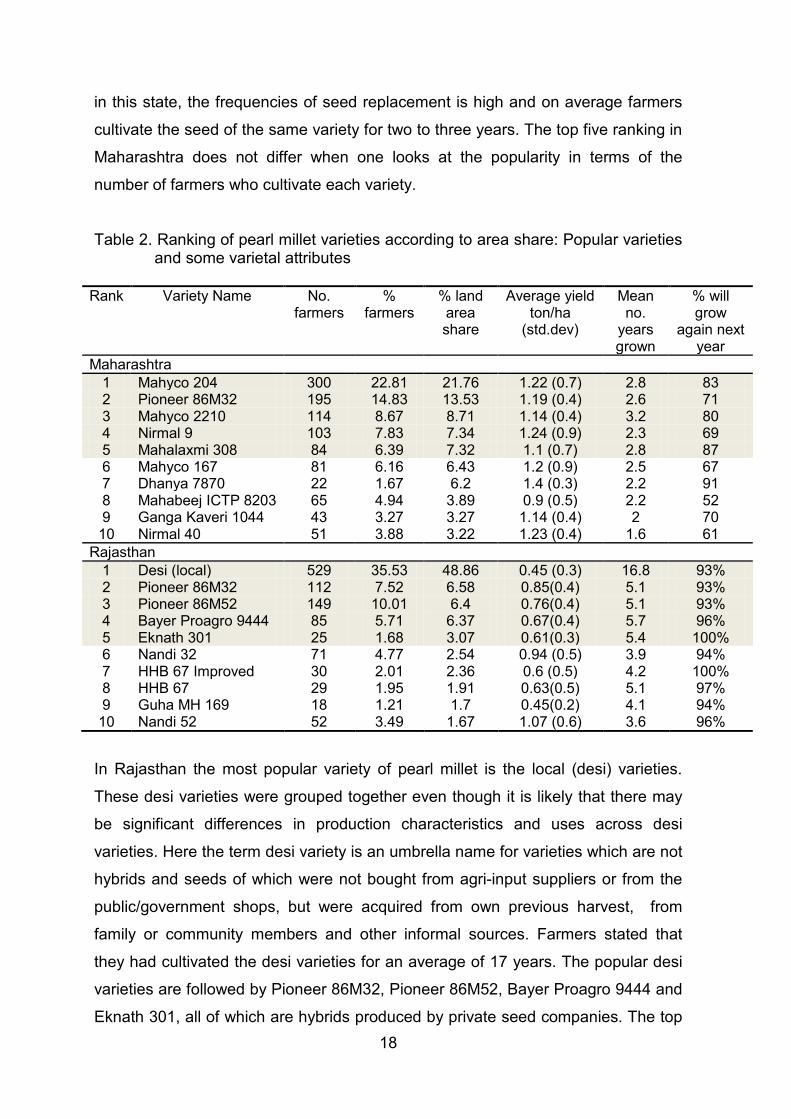
Table 2. Ranking of pearl millet varieties according to area share: Popular varieties and some varietal attributes
Rank Variety Name No.
farmers %
farmers % land area share
Average yield ton/ha
(std.dev)
Mean no.
years grown
% will grow
again next year
Maharashtra 1 Mahyco 204 300 22.81 21.76 1.22 (0.7) 2.8 83 2 Pioneer 86M32 195 14.83 13.53 1.19 (0.4) 2.6 71 3 Mahyco 2210 114 8.67 8.71 1.14 (0.4) 3.2 80 4 Nirmal 9 103 7.83 7.34 1.24 (0.9) 2.3 69 5 Mahalaxmi 308 84 6.39 7.32 1.1 (0.7) 2.8 87 6 Mahyco 167 81 6.16 6.43 1.2 (0.9) 2.5 67 7 Dhanya 7870 22 1.67 6.2 1.4 (0.3) 2.2 91 8 Mahabeej ICTP 8203 65 4.94 3.89 0.9 (0.5) 2.2 52 9 Ganga Kaveri 1044 43 3.27 3.27 1.14 (0.4) 2 70 10 Nirmal 40 51 3.88 3.22 1.23 (0.4) 1.6 61
Rajasthan 1 Desi (local) 529 35.53 48.86 0.45 (0.3) 16.8 93% 2 Pioneer 86M32 112 7.52 6.58 0.85(0.4) 5.1 93% 3 Pioneer 86M52 149 10.01 6.4 0.76(0.4) 5.1 93% 4 Bayer Proagro 9444 85 5.71 6.37 0.67(0.4) 5.7 96% 5 Eknath 301 25 1.68 3.07 0.61(0.3) 5.4 100% 6 Nandi 32 71 4.77 2.54 0.94 (0.5) 3.9 94% 7 HHB 67 Improved 30 2.01 2.36 0.6 (0.5) 4.2 100% 8 HHB 67 29 1.95 1.91 0.63(0.5) 5.1 97% 9 Guha MH 169 18 1.21 1.7 0.45(0.2) 4.1 94% 10 Nandi 52 52 3.49 1.67 1.07 (0.6) 3.6 96%
In Rajasthan the most popular variety of pearl millet is the local (desi) varieties.
These desi varieties were grouped together even though it is likely that there may
be significant differences in production characteristics and uses across desi
varieties. Here the term desi variety is an umbrella name for varieties which are not
hybrids and seeds of which were not bought from agri-input suppliers or from the
public/government shops, but were acquired from own previous harvest, from
family or community members and other informal sources. Farmers stated that
they had cultivated the desi varieties for an average of 17 years. The popular desi
varieties are followed by Pioneer 86M32, Pioneer 86M52, Bayer Proagro 9444 and
Eknath 301, all of which are hybrids produced by private seed companies. The top

19
five hybrid – all produced by private seed company, New Nandi Seeds Corporation
– varieties have been cultivated by farmers for an average of five to six years. In
this state majority of farmers are small-scale, farming less than 2 ha of land.
Compared to other varieties, Eknath 301 seems to be preferred by medium scale
producers who farm 2-6 hectares of total.
Unlike Maharashtra, the ranking of top five varieties in Rajasthan differ when
varieties are ranked according to the number of farmers who chose to cultivate
each variety. Had we used the number (or percentage) of farmers who chose each
variety to rank the popular varieties, Nandi 32 would have ranked higher than
Eknath 301. Even though compared to Nandi 32 fewer farmers chose to cultivate
Eknath 301, the latter cultivated larger areas and hence the area share of Eknath
301 in this state is larger than that of Nandi 32. Also, had we combined the number
of farmers and area share of the HHB 67 and HHB 67 Improved varieties, HHB 67
variety would have made it to top five as the fifth one.
4.1.2 Reasons for popularity of Top Five Pearl Millet Varieties – Farm Household
Survey
For the top five varieties in Maharashtra, 69% or a higher share of farmers said
that they would cultivate the same variety again next year and the main reason
cited for this was “good yield” (94%) followed by “good taste” (57%) and good
market price (37%). However the variety with the lowest “return customer” rate is
Mahabeej ICTP 8203 (Only 52% of respondents said they would cultivate it the
following year). Farmers were also asked to state the importance of 18 traits in
pearl millet production, and rate how well their varieties performed against these
traits. Figure 5 presents Top-five-variety farmers’ perceptions regarding the
performance of the varieties for 10 of these 18 traits, in Maharashtra. Mahalaxmi
308, Nirmal 9 and Mahyco 2210 perform better against most of the production
traits; Nirmal 9 performs the best against marketing and processing, as well as
feed and fodder traits; and for food consumption traits the consensus is mixed
though Mahyco 204 (the most popular variety) doesn’t rank as high in its
performance against consumption traits.

20
Figure 5. Percentage of pearl millet farmers who thought top five varieties performed well against important traits, Maharashtra
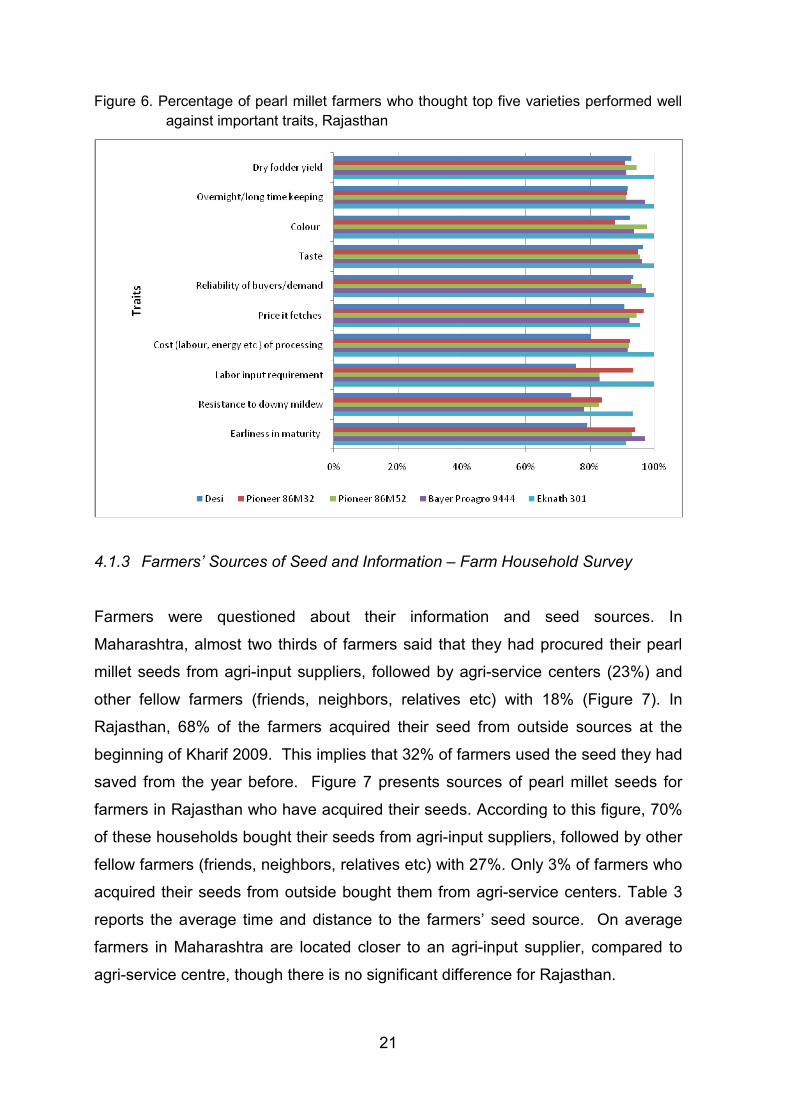
For the top five varieties in Rajasthan, the main reasons cited for continued
cultivation are satisfactory yield, as the key production trait, and good feed and
flour quality, as the main consumption trait. Of the top 10, the variety with the
highest percentage of “return customers” are Eknath 301 and HHB 67 Improved,
with 100% return rate. For production attributes hybrids generally perform better
than the desi varieties. Previous studies had found that desi varieties perform
better in Western and most arid areas of the state where they are better suited to
marginal agro-ecological conditions (Kelley et al. 1996). Had we analyzed the data
according to the geographical location, perhaps the ranking of variety performance
would have been different. Regarding marketing traits, desi varieties are inferior to
hybrids and hence fewer proportions of desi varieties are sold (as also presented in
Figure 6 below). In terms of consumption traits desi varieties do as well as or
better than the Pioneer and Proagro varieties, though Eknath 301 seems to
perform the best against consumption traits.
21
Figure 6. Percentage of pearl millet farmers who thought top five varieties performed well against important traits, Rajasthan
4.1.3 Farmers’ Sources of Seed and Information – Farm Household Survey
Farmers were questioned about their information and seed sources. In
Maharashtra, almost two thirds of farmers said that they had procured their pearl
millet seeds from agri-input suppliers, followed by agri-service centers (23%) and
other fellow farmers (friends, neighbors, relatives etc) with 18% (Figure 7). In
Rajasthan, 68% of the farmers acquired their seed from outside sources at the
beginning of Kharif 2009. This implies that 32% of farmers used the seed they had
saved from the year before. Figure 7 presents sources of pearl millet seeds for
farmers in Rajasthan who have acquired their seeds. According to this figure, 70%
of these households bought their seeds from agri-input suppliers, followed by other
fellow farmers (friends, neighbors, relatives etc) with 27%. Only 3% of farmers who
acquired their seeds from outside bought them from agri-service centers. Table 3
reports the average time and distance to the farmers’ seed source. On average
farmers in Maharashtra are located closer to an agri-input supplier, compared to
agri-service centre, though there is no significant difference for Rajasthan.

22
Figure 7. Farmers’ Sources of pearl millet seeds in Maharashtra (left) and Rajasthan (right)
Table 3. Average time and distance to travel to the source of seed
Seed Source
MAHARASHTRA RAJASTHAN
Average Time in mins
(std.dev)
Average Distance in km (std.dev)
Average Time in
mins (std.dev)
Average Distance in
km (std.dev)
Agri-input Provider 44 (36.49) 7.1(7.06)
68(53.1) 11(10.2)
Agri-service center 58 (37.2) 7.2(6.64)
68(57)
12(13.7)
Neighbor 1 (0.54) 9.3(5.99)
0.4(2.55)
2(6.4)
Family member 2 (3.28) 9.5(7.18)
3(14.5)
0.4(2.3)
Farmer in common cooperative 39 (37.31) 12.9(9.52)
65(60.2)
7(9.1)
Farmer in common organization 60 (0) 13.5(2.12)
60(.)
6(.)
Friend 71 (37.82) 10.6(8.01)
61(71.8)
11(9.9)
Other 63 (12.47) 10.7(3.68)
20(34.6) 5(8.7)
In terms of information sources, a great majority of farmers (71% in Maharashtra
and 97% in Rajasthan) listed other farmers (e.g., their friends, neighbors, extended
family or relatives and colleagues in cooperatives) as their main source of
information regarding varieties. This finding reveals the important role of social
networks in diffusion of information about new technologies, such as improved or

23
hybrid varieties of seeds. Only a very small share of farmers cited public sector
EAOs as their main sources of information about pearl millet varieties and seeds.
4.2 Results from EAO and Agri-Input Supplier Surveys
4.2.1 Popular Pearl Millet Varieties – EAO and Agri-Input Supplier Surveys
Agricultural officers (EAOs) were asked to rank up to five pearl millet varieties in
terms of their popularity, and agri-input suppliers were asked to rank up to three
varieties. Popularity was defined as the share of land area dedicated to the variety
in the block – for EAOs, and as the best/fastest-selling variety – for agri-input
suppliers. In Maharashtra , the EAO survey data on the percentage of total pearl
millet area dedicated to each variety and the yield of each variety were incomplete
and therefore varieties were ranked in terms of the number of times (frequency)
they are cited as being one of the top five popular varieties in the block. Even
though the land area share data was more complete in Rajasthan, we had to use
the same ranking approach in the two states in order to make comparison possible.
In Maharashtra, 37 varieties were identified from the EAO survey and 25 from the
agri-input survey. Rajasthan EAOs identified up to 27 varieties while its agri-input
suppliers identified 52 varieties. In Table 4 below we present the statistics for top
10 most popular varieties, as stated by the EAOs and agri-input suppliers in both
states.
Table 4. Frequency of citation as popular pearl millet varieties among farmers, by EAOs
and Agri-Input Suppliers
MAHARASHTRA RAJASTHAN EAO AGRI-INPUT EAO AGRI-INPUT Rank Variety Name Rank Variety Name Rank Variety Name Rank Variety Name
1 Mahabeej ICTP 8203
1 Mahyco 204 1 HHB 67 1 Bayer Proagro 9444
2 Mahyco 204 2 Pioneer 86M32 2 Bayer Proagro 9444
2 Guha MH 169
3 Mahabeej Shradha 8609
3 Nirmal 9 3 Desi 3 Pioneer 86M52
4 Pioneer 86M32 4 Mahyco 2210 4 Raj 171 4 HHB 67 5 Mahabeej Saburi 5 Nirmal Tulja 1579 5 Nandi 5 5 Pioneer 86M32 6 Mahyco 2210 6 Mahabeej ICTP
8203 6 JK 26 6 JK 26
7 Zuari 2301 7 Ganga Kaveri 7 Guha MH 169 7 Shriram 8494

24
1044 8 Mahalaxmi 308 8 Mahyco 163 8 Nandi 52 8 Eknath 301 9 Nirmal 9 9 Nirmal 40 9 Pioneer 86M32 9 Nirmal 1651
10 Bayer Proagro 9330
10 Mahalaxmi 308 10 HHB 94 10 Guha 118
The popular varieties “picture” provided by the EAOs in Maharashtra is significantly
biased towards seeds produced by public sector. However, two thirds of EAOs
(67%) said that they have seen a shift in farmers’ demand for pearl millet seed
produced by private seed companies relative to public ones in the past three to five
years. In Maharashtra, the top five varieties as reported by agri-input suppliers is
very similar to the one provided by farmers, as expected, since a great majority of
farmers procure their seeds from these suppliers. The popular varieties list
provided by EAOs in Rajasthan is similar to what was stated by farmers in that
state. This finding may be explained by the fact that in Rajasthan the public sector,
i.e., public agricultural extension officers, is comparatively important in farmers’
decision-making vis-a-vis Maharashtra.
4.2.2 Reasons for popularity of Top Pearl Millet Varieties – EAO and Agri-Input
Supplier Surveys
Across both states and between the two actors, there is a general consensus that
good yield is the main determining factor in farmers’ choice of pearl millet seed.
Good quality taste and feed/fodder were also cited as important traits for farmers in
Maharashtra by both actors. EAOs in Rajasthan thought desi varieties performed
the best in terms of low input requirement, taste and marketability, though the yield
for desi varieties were thought to be lower than those of hybrid varieties. One
interesting finding from the agri-input suppliers in Rajasthan was the fact that they
did not rank quality and taste of flour very highly. This reveals that in this state the
agri-input suppliers believe farmers produce pearl millet mainly as an input to
livestock production. This finding is also reflected in the comments of agri-input
suppliers, many of whom stated that farmers grow pearl millet seeds they buy from
the suppliers mainly for fodder.

25
4.2.3 Farmers’ Sources of Seed and Information – EAO and Agri-Input Supplier
Surveys
EAOs in both states reported that farmers’ primary sources of pearl millet seed are
agri-input suppliers and that their secondary sources are local providers, i.e.
neighbors, friends, extended family or relatives, and agri-service centers (see
figure 8 below). EAOs in Maharashtra believe that farmers’ main sources of
information about pearl millet varieties are again agri-input suppliers and EAOs
themselves. In Rajasthan, EAOs believe that agri-service centers and EAOs are
the primary sources of information about varieties for farmers.
According to agri-input suppliers in both states, farmers’ main sources of
information on pearl millet varieties are agri-input suppliers and field
demonstrations. Agri-input suppliers seem to have underestimated the important
role of farmers in providing information to each other. Suppliers in Rajasthan also
stated agricultural extension officers (the public sector) to be an important source
of seed information.
Figure 8. Farmers’ sources of information on varieties as cited by agri-input suppliers in Maharashtra and Rajasthan

26
5. Conclusions and Policy Implications
In this paper we presented the diverse and innovative data collection techniques
that were employed to carry out a multi-stakeholder and multi-dimensional study on
the adoption of popular pearl millet varieties in India to inform targeted breeding
and dissemination of biofortified pearl millet varieties. Data were collected using
four different technologies for four actors in two states in India, namely
Maharashtra and Rajasthan, where pearl millet is an important staple. Actors
included farmers who were interviewed using CAPI; EAOs interviewed with
traditional PAPI; agri-input suppliers interviewed using CATI, and lastly, seed
companies for whom a web-based survey is being administered. Comparison and
consolidation of the results across these different actors (i.e. triangulation) and
across the two states reveal very interesting insights regarding the cultivation of
pearl millet varieties. We summarize our key preliminary findings from our study
states and triangulate these across the key actors in each. We conclude with some
key remarks and recommendations regarding the data collection methods
employed.
5.1 Triangulation of results
5.1.1 Maharashtra
Of the top five most popular varieties identified through the farmer and agri-input
supplier surveys in Maharashtra, the top four are common across the two actors.
This congruence of the results of the two surveys lends credibility to the data
collected. This is particularly important since CAPI household surveys were
implemented in 38 out of the 184 pearl millet producing blocks in Maharashtra, and
the CATI agri-input supplier survey in 147 of the same (i.e., 80% of all pearl millet
producing areas in Maharashtra).We can assert that the farm household survey
sample is somewhat representative of pearl millet producing areas in Maharashtra.
Also, considering a majority of farmers in this state (60%) indicated that they
obtained their pearl millet seeds from agri-input suppliers, the apparent agreement
is again an important validation of the results from both surveys.
27
Top five varieties cited by EAOs were however significantly different, with only two
varieties being in agreement with the farm household and agri-input survey
findings. This divergence between the popular varieties listed by farmers and agri-
input suppliers on the one hand, and those listed by EAOs on the other, may
suggest that EAOs of this state may be detached from realities on the field and that
the interaction they have with farmers could primarily be with a self selected
sample that grows varieties from the public sector in Maharashtra.
Farmers, agri-input suppliers and EAOs all stated agri-input suppliers to be
farmers’ main source of seed. Farmers stated that their main sources of
information regarding varieties are other farmers (neighbors, friends,
relatives/extended family and farmers in cooperatives) whereas agri-input suppliers
and EAOs both considered themselves as farmers’ main informants regarding
pearl millet varieties. This finding, in line with Matuschke (2009), suggests that
farmers rely on other farmers for pearl millet seed information and advice and
emphasizes the importance of social networks and farmer to farmer learning in
diffusion of new technologies such as biofortified seeds. The respondent bias in
such questions is generally expected and triangulation helps bring this to the light.
5.1.2 Rajasthan
In Rajasthan, of the top five most popular varieties identified through the agri-input
supplier survey, three are common with the farmer survey. Since desi varieties are
not sold in agri-input shops, the discrepancy between the popular varieties across
the two actors is as expected. Again, the fact that even three popular varieties are
common across the two surveys, lends more credibility to the popularity of the
identified varieties within the state. Similarly, two varieties were commonly
identified between agri-input supplier and EAO surveys; and three varieties were
common across EAO and farmer surveys. Although less than one fifth of EAOs
from pearl millet cultivating blocks could be interviewed, EAOs from Rajasthan
were found to be more knowledgeable about the pearl millet varieties cultivated in
their blocks, compared to their counterparts in Maharashtra, as they also confirmed
the popularity of desi varieties within their state. This is expected given that public

28
sector varieties are more prominent in Rajasthan and as such more farmers would
be linked to EAOs in order to get information and technical guidance from them.
A majority (97%) of farmers in Rajasthan cited other farmers as their main sources
of information regarding pearl millet varieties. In fact 63% of all farmers cited
neighbors, revealing again the importance of social networks and proximity for
dissemination of information about different varieties. According to the EAOs and
agri-input suppliers, farmers’ main sources of information regarding pearl millet
varieties purchased from outside are public sources (EAOs and agri-service
centres) followed by other local farmers. There is a divergence in this respect
between farmers on the one hand and agri-input and EAOs on the other. The fact
that the two external agents agree, may suggest a need for further validation on
the dominant information source for farmers in Rajasthan. Overall, Rajasthan
provides evidence in support of public sector, as well as informal social networks,
still being the dominant players in the seed market and in agricultural extension.
This contrasts with Maharashtra where the pearl millet seed sector is nearly fully
privatized.
The overwhelming share of local varieties in Rajasthan is striking especially in
relation to the situation in Maharashtra and calls for reorienting the traditional
question of technology adoption in agriculture from a case of choice between
hybrids and non-hybrids (such as in Rajasthan) to choice among different hybrids
(as likely in Maharashtra). On average, farmers in Rajasthan replace their seed
every five years for hybrids and 17 years for desi varieties. Seed replacement is
done more frequently in Maharashtra where on average hybrid seeds are replaced
every two years. Therefore in Rajasthan stronger efforts would be required when
introducing and diffusing biofortified seeds in the market.
5.2 On Employment of Data Collection Techniques
While there is no official rule on the appropriate data collection methods to employ
for any given study, there are best practices in data collection that can and should
be tailored to fit the context specific needs of the study. Because our study
mandated the need to consult several actors, each with varying information sets

29
and skills in responding (for example use of computers), there was merit gained
from using four innovative techniques to achieve our goal. We find ex-post, that in
a study of this nature, the extensive and intensive margins in the administering of
the questionnaire plays a critical role in the ultimate method adopted. More often
than not, there will be a tradeoff between the depth and specificity of information
required – i.e. the intensive margin, vis-à-vis the geographical spread, location and
profile of the actors/respondents in question and the breadth of the questionnaire–
i.e. the extensive margin.
Independent of these margins, the importance of data validation applies to all the
components of data collection and it has implications for the data collection
technique adopted. Questionnaires with higher intensive margins imply the need
for stronger data validation checks, as was the case for our farm household
questionnaire, in order to minimize respondent, enumerator and data entry errors
which could heavily affect the results of the study. Such mainstream data validation
requirements call for techniques such as CAPI which make use of PDAs and often
require a great amount of organization, thoroughness and intensive training
sessions to ensure a smooth data collection process. Although CAPI techniques
have many undisputed advantages over traditional PAPI (see for example Caeyers
et al., 2010; Fafchamps et al., 2010), they are also costly to implement in terms of
time needed to finalize questionnaires, programming and other resources. At the
same time, while CATI techniques – similar to what was employed in our survey for
the agri-input suppliers – receive merit for their data validation abilities, as well as
the relatively low-cost of administration, they require a well established database
with information on the relevant sample’s contact details prior to the administration
of the survey. In our experience, it would be almost futile and inefficient to spend
time gathering contact information for respondents if it is not pre-existing; in such a
case one would be better off adopting an alternative data collection technique
altogether.
The advantages and disadvantages of each data collection method in this study as
experienced by the research team are summarized in a table in the appendix.
These along with other sampling issues and the context specific nature of the study

30
should be strongly considered when deciding on appropriate techniques to use for
data collection.
6. References Caeyers, B., N. Chalmers, J. De Weerdt (2010) A Comparison of CAPI and PAPI through
a Randomized Field Experiment, University of Oxford.
Dar, W. D., Reddy, B. V. S., Gowda, C. L. L., Ramesh, S. (2006) Genetic resources enhancement of ICRISAT mandate crops. Current Science 91 (7): 880–884
Fafchamps, M., McKenzie, D., Quinn, S., Woodruff C. (2010) Using PDA consistency checks to increase the precision of profits and sales measurement in panels. Journal of Development Economics In Press, Corrected Proof
HarvestPlus (2009a), Breeding Crops for Better Nutrition: General Brochure, HarvestPlus, IFPRI, Washington, D.C. (http://www.harvestplus.org/sites/default/files/HarvestPlus_General_Brochure_2009.pdf)
HarvestPlus (2009b), Iron-Pearl Millet Strategy, HarvestPlus, IFPRI, Washington, D.C., (http://www.harvestplus.org/sites/default/files/HarvestPlus_Pearl_Millet_Strategy.pdf)
HarvestPlus (2010), Country Crop Profile: Iron Pearl Millet in India, HarvestPlus, IFPRI, Washington, D.C., (http://www.harvestplus.org/sites/default/files/Country%20Crop%20Profile_India%20Iron%20Pearl%20Millet.pdf)
Kelley, T.G., Parthasarathy, P.R., Weltzien E.R. and Purohit M.L. (1996) Adoption of improved cultivars of millet in an arid environment: Straw yield and quality considerations in Western Rajasthan, Experimental Agriculture 32:161-171.
Matuschke, I. (2009) The impact of social networks on hybrid seed adoption in India. Agricultural Economics 40: 493–505.
Taylor, S. (1998) Setting up Computer-Assisted Personal Interviewing in the Australian Longitudinal Study of Ageing, Statistical Science, Vol. 13, No. 1, pp. 14-18.

31
APPENDIX
Advantages and Disadvantages of Data Collection Techniques Employed
ADVANTAGES DISADVANTAGES RECOMMENDATIONS
A. Computer Assisted Personal Interviewing (CAPI)
1. Consistency and validation checks in programs minimizes potential for error – from respondent, enumerator and data entry
1. Requires a well functioning program 1. Researchers need to spend time with the programmer to understand each other’s language, demands, limitations etc.
2. Ease in asking complex questions that have loops and skip patterns
2. Requires thorough timing and planning in order to finalize the questionnaire as early as possible to give enough time for programming and testing
2. Researchers need to be organized, thorough and forward thinking before designing questionnaire to ensure all possible answers are included
3. Permissible real-time monitoring of data as they can be downloaded and emailed to project team members even as the survey is ongoing
3. Equipment and programming can be costly
3. Programs should allow a degree of flexibility for open-ended answers
4. Reduction in time taken to conduct survey as options to questions are programmed
4. Additional costs required for extensive training of enumerators and pretesting
4. Survey should be programmed in the local language
5. PDAs are portable and are not cumbersome to carry as is the case with questionnaires in traditional PAPI
5. Requires electricity and other equipment such as laptops to allow for downloading and recharging while on the field – can be a drawback when surveying in developing countries where power failure is common.
5. Train enumerators thoroughly (how to look after the equipment, how to add/save data)
6. Enumerators and respondents respond well to new technology
6. Test the program both on the field and off the field – also need to test the data export program thoroughly

32
ADVANTAGES DISADVANTAGES RECOMMENDATIONS
7. Allows for additional technology such as GPS, photos, recording, which can add value to the data collection
7. Insure PDA devices during survey in case of theft or damage
B. Computer Assisted Telephone Interviewing (CATI) 1. Allows for greater geographical
coverage over a shorter period of time
1. Requires a pre-existing database of respondents’ telephone numbers or need to budget to collect this information
1. Ensure that a pre-existing database of respondents is available in advance
2. Data can be collected and updated in real time.
2. Language restrictions from one location to the next may warrant more enumerators/phone operators than necessary.
2. Language of the target region should be studied in advance and relevant words should be known to the representatives who are interacting on phone
3. Respondent can be re-contacted easily if the need arises (unlike PAPI and CAPI)
3. Survey cannot be too lengthy and questions should not have multiple answers as respondents lose concentration
3. Keep survey as short as possible in order to keep the attention of the respondent and get the most relevant information out of them
4. Cost of administration is cheaper than PAPI or CAPI
4. Misspelling and incorrect hearing may introduce some error in the data collection
4. Need to be extremely polite in order to establish rapport and get the information needed – might help to text (SMS) before calling to inform about phone call and text again after the CATI to show appreciation.
5. Ensure that interviewers are well trained and extremely patient and tolerant as phone interviewing may come with significant non-response and rejection.
C. Web-based Survey
1. Saves a great amount of time 1. Access issues – need to identify respondents and their contact information
1. May be helpful to use an authoritative figure to send out emails in order to increase the response rate
33
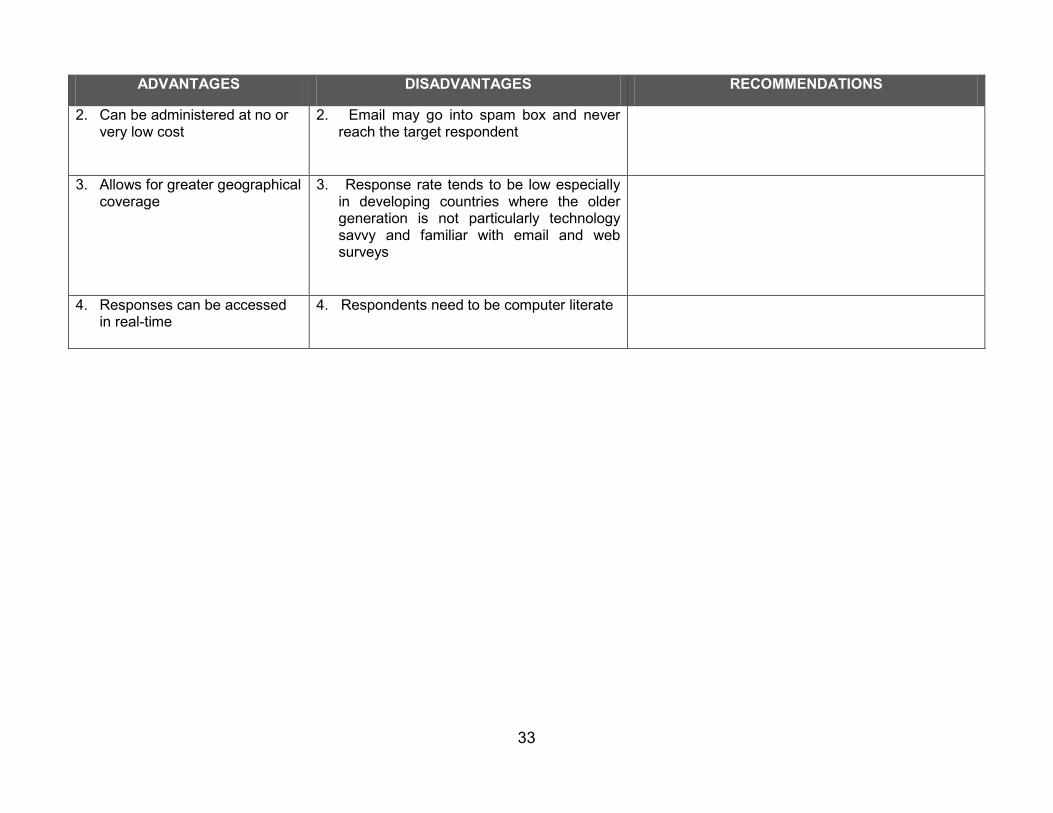
ADVANTAGES DISADVANTAGES RECOMMENDATIONS
2. Can be administered at no or very low cost
2. Email may go into spam box and never reach the target respondent
3. Allows for greater geographical coverage
3. Response rate tends to be low especially in developing countries where the older generation is not particularly technology savvy and familiar with email and web surveys
4. Responses can be accessed in real-time
4. Respondents need to be computer literate