environmental dna (edna) monitoring and …...dolson, dave copplestone, wil wegman, dayna laxton,...
TRANSCRIPT

Aquatic Research and Monitoring Section Ministry of Natural Resources and Forestry
Aquatic Research Series 2014-06
Ontario’s Invading Species Awareness Program: analysis of provincial boater and angler survey results Shannon Fera, Tim Johnson, Shelley Arnott

Aquatic Research and Monitoring Section Ministry of Natural Resources and Forestry
Aquatic Research Series 2014-06
Ontario’s Invading Species Awareness Program:analysis of provincial boater and angler survey results standard operating proceduresShannon Fera1, Tim Johnson2, Shelley Arnott3
1Aquatic Research and Monitoring Section Science and Research Branch Ontario Ministry of Natural Resources and Forestry 2140 East Bank Drive Peterborough ON K9J 7B8
2Aquatic Research and Monitoring Section Glenora Fisheries Station 41 Hatchery Lane Picton ON K0K 2T0
3Department of Biology Queen’s University 116 Barrie Street Kingston ON K7L 3N6

© 2014, Queen’s Printer for OntarioPrinted in Ontario, Canada
This publication was produced by:
Aquatic Research and Monitoring SectionOntario Ministry of Natural Resources and Forestry2140 East Bank DrivePeterborough ON K9J 7B8
Cette publication hautement spécialisée Analyse des résultats des sondages réalisés auprès des plaisanciers et des pêcheurs dans le cadre du Programme de sensibilisation aux espèces envahissantes de l’Ontario n’est disponible qu’en anglais conformément au Règlement 671/92, selon lequel il n’est pas obligatoire de la traduire en vertu de la Loi sur les services en français. Pour obtenir des renseignements en français, veuillez communiquer avec le ministère des Richesses naturelles au [email protected].
This technical report should be cited as follows: Fera, Shannon, Tim Johnson, and Shelley Arnott. 2014. Ontario's Invading Species Awareness Program: analysis of provincial boater and angler survey results. Ontario Ministry of Natural Resources and Forestry, Science and Research Branch, Peterborough, Ontario. Aquatic Research and Monitoring Technical Report 2014-06. 23p.
Cover photo: Pressure washing boat to prevent spread of invasive speciesPhoto credit: Danielle Tassie

Ontario’s Invading Species Awareness Program: analysis of provincial boater and angler survey resultsi
Executive summaryThe Ontario Invading Species Awareness Program provides information to recreational boaters and anglers about aquatic invasive species and how to prevent their spread. To evaluate how information was being received by the public, three surveys were sent randomly to licensed anglers in the province in 1998, 2004, and 2009. Administered by the Ontario Ministry of Natural Resources and Forestry, these surveys assessed the boating and angling public’s knowledge and participation in spread prevention. Though inconsistent survey design prevented direct comparison, several trends across the three surveys are evaluated in this report.
Results indicate that the public receives information about invasive species and prevention strategies from many sources, with more sources in 2009 than in previous surveys. The internet, signage, and trade show kiosks were common sources of information by 2009.
Likely due to this outreach, more people were always or sometimes visually inspecting their boats in 2009 (89%) compared to 1998 (77%). Draining and drying were also practiced by most boaters 94% and 88% of the time, respectively. However, most other preventative boat cleaning strategies (pressure and hot water washing; physical removal of plants and mud; and flushing the motor) had unchanged or decreased in participation since the initial survey in 1998. Fewer individuals claim a ‘lack of knowledge’ as the reason for not participating in prevention practices (18% in 1998 and 3% in 2009). However, many respondents believe their boating practices do not contribute to the spread of invasive species, either because they are not moving their boats, or do not think they have boated in contaminated waters.
Anglers use artificial lures more often than any other bait type. In 2009, 41% always used artificial lures, while 15% always used live baitfish. Little change, however, was observed in bait release habits between 1998 and 2009, though changes to the wording of the questions made it difficult to directly compare the three surveys. In 2009, 46% of western Ontario residents and 40% of central Ontario residents released leftover bait back into lakes and rivers after a day of fishing, which was higher than the all other regions of the province. The reasons indicated for releasing bait were primarily compassionate—a desire to provide the bait as food for fish, or not wanting to unnecessarily kill the bait—but 22% did not properly dispose of bait because it was an inconvenience. Future messages about bait disposal should directly target anglers’ concerns about unnecessary killing of leftover bait.
Key findings are outlined in the report and can help guide future Invading Species Awareness Program outreach efforts to target boaters and anglers. Key messages could include delivering information using the sources preferred by the public, and message consistency from all organizations that provide information. A future survey could also evaluate how trends have changed as a result of public awareness programs in the province since 2009. Future survey questions are provided in this report, and build on the strengths of the past surveys while maintaining consistency to allow trend analysis.
RésuméAnalyse des résultats des sondages réalisés auprès des plaisanciers et des pêcheurs dans le cadre du Programme de sensibilisation aux espèces envahissantes de l’Ontario
Le Programme de sensibilisation aux espèces envahissantes de l’Ontario renseigne les plaisanciers et les pêcheurs récréatifs sur les espèces aquatiques envahissantes ainsi que sur les moyens à prendre pour en prévenir la propagation. Trois questionnaires de sondage ont été envoyés au hasard à des pêcheurs autorisés dans la province en 1998, en 2004 et en 2009 afin d’évaluer les ressources qui donnent de l’information à la population. Administrés par le ministère des Richesses naturelles et des Forêts de l’Ontario, ces sondages évaluent les connaissances des plaisanciers et des pêcheurs ainsi que leur participation à la prévention de la propagation. Même si le manque d’uniformité dans la conception des sondages a empêché de faire une comparaison directe, plusieurs tendances qui sont ressorties des trois sondages sont évaluées dans ce rapport.
Les résultats indiquent que la population reçoit de l’information sur les espèces envahissantes et les stratégies de prévention de plusieurs sources, qui étaient plus nombreuses lors du sondage de 2009 qu’au cours des sondages précédents. L’internet, les affiches et les stands dans les salons professionnels constituaient les sources d’information les plus courantes en 2009.
Cette sensibilisation a probablement incité un plus grand nombre de personnes à procéder toujours ou parfois à une inspection visuelle de leur bateau en 2009 (89 %) par rapport à 1998 (77 %). La plupart des plaisanciers

Ontario’s Invading Species Awareness Program: analysis of provincial boater and angler survey resultsii
vidangeaient et asséchaient leur bateau 94 % et 88 % du temps respectivement. Par contre, la plupart des autres stratégies de nettoyage préventif des bateaux (lavage sous pression et à l’eau chaude, élimination physique des végétaux et de la boue et rinçage du moteur) n’ont pas modifié ou diminué les taux de participation depuis le premier sondage en 1998. Un moins grand nombre de personnes déclarent ne pas avoir adopté les pratiques de prévention (18 % en 1998 et 3 % en 2009) à cause d’un « manque de connaissances ». Cela dit, de nombreux répondants considèrent que leurs pratiques de navigation ne contribuent pas à la propagation des espèces envahissantes, soit parce qu’ils ne déplacent pas leur bateau, soit parce qu’ils ne pensent pas avoir navigué dans des eaux contaminées.
Les pêcheurs ont plus souvent recours à des leurres artificiels qu’à tout autre type d’appât. En 2009, 41 % des pêcheurs employaient toujours des leurres artificiels, tandis que 15 % des pêcheurs utilisaient toujours des poissons-appâts vivants. On a toutefois observé peu de changements dans les habitudes liées à la relâche des appâts entre 1998 et 2009, quoique les modifications apportées au libellé des questions rendent difficile la comparaison directe des trois sondages. En 2009, 46 % des résidents de l’ouest de l’Ontario et 40 % des résidents du centre de l’Ontario relâchaient les appâts inutilisés après une journée de pêche; ces taux sont plus élevés que ceux de toutes les autres régions de la province. On relâchait les appâts dans les lacs et les rivières principalement pour des motifs de compassion, c’est-à-dire dans une volonté de nourrir les poissons et de ne pas tuer inutilement les appâts, mais 22 % des répondants ne se débarrassaient pas adéquatement des appâts parce que ce n’était pas commode. Les prochains messages sur la disposition des appâts devraient cibler directement les préoccupations des pêcheurs qui veulent éviter de tuer inutilement les appâts inutilisés.
Les principaux résultats, qui sont indiqués dans le rapport, peuvent aider à guider les prochains efforts déployés dans le cadre du Programme de sensibilisation aux espèces envahissantes afin de cibler les plaisanciers et les pêcheurs. Les messages clés devraient: donner de l’information à l’aide des sources de prédilection de la population et être cohérents à l’échelle de la province. Un prochain sondage pourrait également évaluer dans quelle mesure les tendances ont changé à la suite des programmes de sensibilisation de la population qui ont été menées dans la province depuis 2009. Les questions qui sont proposées dans ce rapport pour les sondages à venir s’appuient sur les forces des enquêtes antérieures tout en assurant une uniformité afin de faciliter l’analyse des tendances.
AcknowledgementsWe would like to thank Francine MacDonald, Jeff Brinsmead, and Donna Wales for providing the survey data, careful revisions of this manuscript, and for their guidance throughout the project. Len Hunt provided helpful advice on considerations for new survey questions, while Mark Robbins provided information on MNRF’s enforcement programs. Andrew Drake (University of Toronto) and Nigel Lester provided helpful insight in interpreting survey results and in making comparisons to previous studies. Helen Ball, Jason Borwick, Rebecca Dolson, Dave Copplestone, Wil Wegman, Dayna Laxton, Cam Willox, Tim Haxton, Derek Landry, Matt Smith (OFAH), and Sophie Monfette (OFAH) provided suggestions on earlier drafts of this manuscript. Sarah Higginson and Lyn Thompson assisted with final edits and layout for this report. Funding for this project was provided by Biodiversity Policy Section.
Ontario’s Invading Species Awareness Program: analysis of provincial boater and angler survey resultsiii
ContentsExecutive summary ........................................................................................................................................i
Résumé ...........................................................................................................................................................i
Acknowledgements ......................................................................................................................................ii
Contents .......................................................................................................................................................iii
List of Tables ................................................................................................................................................iv
List of Figures ..............................................................................................................................................iv
Introduction ................................................................................................................................................. 1Survey questions ................................................................................................................................... 1Sources of AIS-related public awareness programs ........................................................................... 3Investments ........................................................................................................................................... 5Preventative behaviours ....................................................................................................................... 6Barriers to public participation ............................................................................................................. 7Changing recreational behaviours ....................................................................................................... 8Concerns associated with AIS ............................................................................................................. 9
Baitfish as a pathway for invasive species spread in Ontario ................................................................. 10 Bait types ............................................................................................................................................. 10 Live baitfish acquisition ....................................................................................................................... 12 Self-harvested bait .............................................................................................................................. 12 Purchasing from a bait shop ............................................................................................................... 12 Bait release ......................................................................................................................................... 13 What do the results show? ................................................................................................................ 16
Continued program evaluation ................................................................................................................ 17 Comparing the importance of various pathways of spread. ........................................................... 17
Key findings from the survey trends .................................................................................................. 17Suggested questions for a future survey ........................................................................................... 18
References .................................................................................................................................................. 23

Ontario’s Invading Species Awareness Program: analysis of provincial boater and angler survey resultsiv
List of TablesTable 1. The number of respondents, response rates, and number of questions in each aquatic invasive
species awareness survey sent to Ontario anglers in 1998, 2004, and 2009. ................................... 1Table 2. List of questions present in the three aquatic invasive species awareness surveys. ............... 2
List of FiguresFigure 1. Contributions of organizations that provided information about aquatic invasive species to
the public. ............................................................................................................................................. 3Figure 2. Percentage of yes responses to the question “From which of the following sources have you
heard about aquatic invasive (exotic) species?” in 1998, 2004, and 2009. ...................................... 4Figure 3. Proportion of each response chosen as the best source of aquatic invasive species
information by respondents in the 1998 and 2009 surveys. .............................................................. 5Figure 4. The proportion of responses to the question “How often did you take the following
precautions when transporting your boat and launch into a new waterbody?” ............................. 6Figure 5. Responses to “If you didn’t always take precautions against the spread of invasive species,
please indicate why” from the 1998, 2004, and 2009 surveys. ........................................................ 7Figure 6. Proportion of respondents that indicated that they changed their recreational behaviours in
response to invasive species. .............................................................................................................. 8Figure 7. Results from the 2010 Ontario recreational fisheries survey indicating how respondents
perceived the threat of invasive species. ............................................................................................ 9Figure 8. Proportional use of each bait type according to the 2009 aquatic invasive species awareness
survey. .................................................................................................................................................. 10Figure 9. Proportion of baitfish users by frequency of use in each region of Ontario, according to the
aquatic invasive species awareness survey in 2009. ........................................................................ 11Figure 10. Proportion of respondents who acquired their live bait from each source, according to the
aquatic invasive species awareness survey in 2009. ......................................................................... 12Figure 11. The proportion of respondents indicating whether they always, sometimes or never release
their live bait into the water at the end of a day’s fishing in the aquatic invasive species awareness surveys. ................................................................................................................................................ 13
Figure 12. Live baitfish disposal practices in Ontario based on 2004 and 2009 aquatic invasive species survey results. ...................................................................................................................................... 14
Figure 13. Bait release and disposal habits by angler type, according to the Recreational Fishing Survey in 2010. ................................................................................................................................................ 15
Figure 14. Reasons for releasing leftover live bait into the water at the end of a day’s fishing, separated by the location of residence of each respondent. ........................................................................... 16

Ontario’s Invading Species Awareness Program: analysis of provincial boater and angler survey results1
Introduction Recreational activities such as boating and angling play a large role in the secondary spread of aquatic invasive species (AIS). For this reason, proper boat and equipment cleaning strategies and bait disposal practices are important to minimize the spread of aquatic invasive species. Considerable effort and resources have been put into public awareness programs by the government of Ontario to educate citizens about the consequences of AIS and prevention measures to use when boating and angling. Ontario’s Invading Species Awareness Program (ISAP), a partnership between the Ontario Ministry of Natural Resources and Forestry (MNRF) and the Ontario Federation of Anglers and Hunters (OFAH), has helped educate the public about invasive species since 1992. One of the primary goals of the program has been to educate boaters and anglers who inadvertently aid the spread of AIS in Ontario.
MNR conducted three public surveys of randomly chosen licensed Ontario anglers in 1998, 2004, and 2009 (Table 1). The surveys were conducted to assess the recreational user’s behaviour, level of knowledge about AIS and related prevention strategies, and their participation in recommended mitigation strategies. Each survey was designed to evaluate the ISAP’s goals at the time of the survey, and the questions and response options reflect the shifts in program priorities from year to year. The original survey in 1998 referred to species as ‘exotic’, but was later changed to ‘invasive’ or ‘invading’ for the 2004 and 2009 surveys.
Table 1. The number of respondents, response rates, and number of questions in each aquatic invasive species awareness survey sent to Ontario anglers in 1998, 2004, and 2009.
Survey Year Number of questions Sent to Number of Respondents Response Rate
1998 20 3000 1245 45%
2004 31 4500 1522 34%
2009 33 5000 1496 30%
The purpose of this report was to compare the results of the three surveys; specifically, to identify changing patterns in boater awareness and participation in mitigation strategies following public education programs. Survey results were also used to help identify the most effective outreach strategies in the ISAP, and to classify the barriers that continue to prevent recreational boaters and anglers from taking measures to help prevent the spread of AIS.
Survey questions
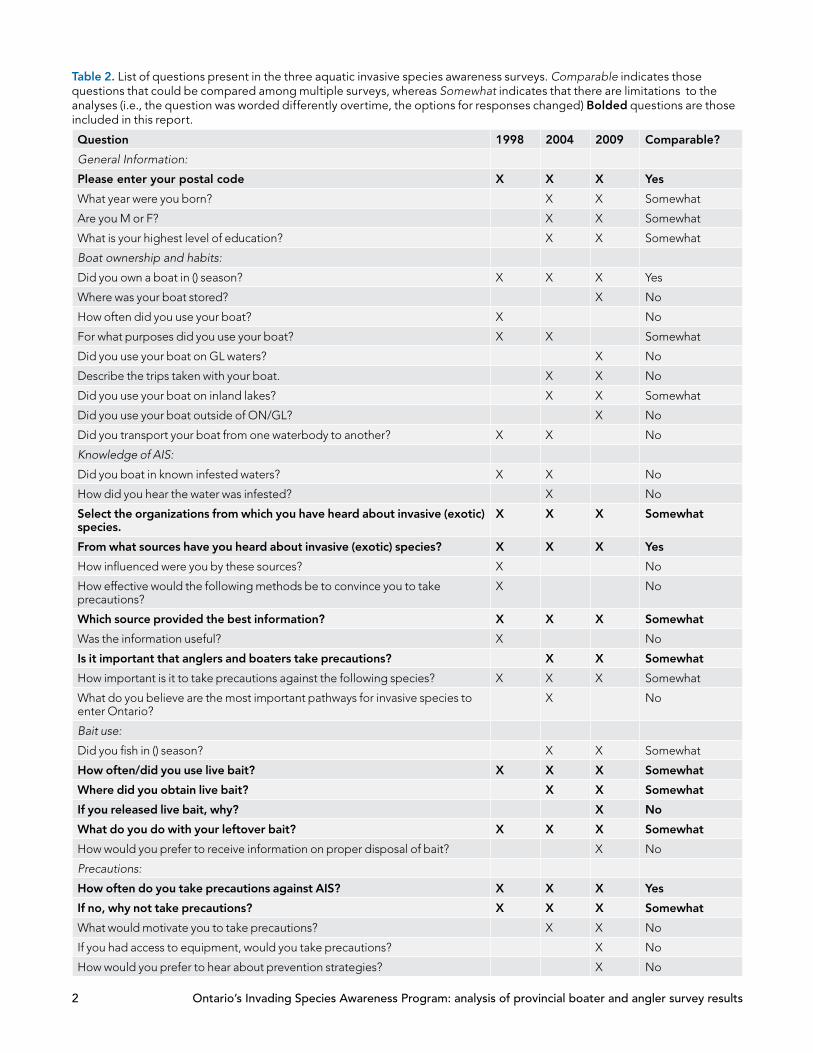
The three AIS awareness surveys were conducted independently and were not designed to be compared directly, however, a number of similar questions were evaluated to provide an indication of trends in public knowledge and compliance rates spanning the 11-year time frame from 1998 to 2009. The number of surveys and the response rates for each survey varied by region. Individuals under 18 or over 65 years of age and out-of-province anglers were not included in the survey. Similarly, the surveys did not target recreational boaters who are not also licensed anglers. The questions varied from year to year, as did the wording and response options (see Table 2 for the list of questions included in the three surveys). The data associated with several of the 2004 questions were lacking, further limiting some analyses. We have identified in the text where differences in surveys existed and how these differences may affect the interpretation of results.
Ontario’s Invading Species Awareness Program: analysis of provincial boater and angler survey results2
Table 2. List of questions present in the three aquatic invasive species awareness surveys. Comparable indicates those questions that could be compared among multiple surveys, whereas Somewhat indicates that there are limitations to the analyses (i.e., the question was worded differently overtime, the options for responses changed) Bolded questions are those included in this report.
Question 1998 2004 2009 Comparable?
General Information:
Please enter your postal code X X X Yes
What year were you born? X X Somewhat
Are you M or F? X X Somewhat
What is your highest level of education? X X Somewhat
Boat ownership and habits:
Did you own a boat in () season? X X X Yes
Where was your boat stored? X No
How often did you use your boat? X No
For what purposes did you use your boat? X X Somewhat
Did you use your boat on GL waters? X No
Describe the trips taken with your boat. X X No
Did you use your boat on inland lakes? X X Somewhat
Did you use your boat outside of ON/GL? X No
Did you transport your boat from one waterbody to another? X X No
Knowledge of AIS:
Did you boat in known infested waters? X X No
How did you hear the water was infested? X No
Select the organizations from which you have heard about invasive (exotic) species.
X X X Somewhat
From what sources have you heard about invasive (exotic) species? X X X Yes
How influenced were you by these sources? X No
How effective would the following methods be to convince you to take precautions?
X No
Which source provided the best information? X X X Somewhat
Was the information useful? X No
Is it important that anglers and boaters take precautions? X X Somewhat
How important is it to take precautions against the following species? X X X Somewhat
What do you believe are the most important pathways for invasive species to enter Ontario?
X No
Bait use:
Did you fish in () season? X X Somewhat
How often/did you use live bait? X X X Somewhat
Where did you obtain live bait? X X Somewhat
If you released live bait, why? X No
What do you do with your leftover bait? X X X Somewhat
How would you prefer to receive information on proper disposal of bait? X No
Precautions:
How often do you take precautions against AIS? X X X Yes
If no, why not take precautions? X X X Somewhat
What would motivate you to take precautions? X X No
If you had access to equipment, would you take precautions? X No
How would you prefer to hear about prevention strategies? X No

Ontario’s Invading Species Awareness Program: analysis of provincial boater and angler survey results3
Other:
Have AIS affected your recreation or business activities? X X No
Have you changed your habits to avoid AIS? X X Somewhat
Are you aware of the Hotline? X X Somewhat
Have you called the Hotline? X X Somewhat
Are you willing to pay a fee towards AIS programs? X X No
Sources of AIS-related public awareness programs
This survey indicates that boaters accessed a broader range of agencies for information in 2009 than in 1998 (Figure 1). In 1998, most information came from the Ministry of Natural Resources (MNR; 35%), the Ontario Federation of Anglers and Hunters (OFAH, 35%), or no information was received at all (18%). A small proportion also came from the Department of Fisheries and Oceans (DFO, which includes the Canadian Coast Guard and represented 5%), as well as cottage and lake associations (6%).
Figure 1. Contributions of organizations that provided information about aquatic invasive species to the public. Respondents were asked to indicate which organizations provided them with information about AIS and AIS spread prevention strategies. Values indicate the number of yes responses to each response option. Environment Canada, fishing/boating club, school and not sure were provided as options in 2009 but not in 1998.
0%
5%
10%
15%
20%
25%
30%
35%
40%
Prop
ortio
n of
ans
wer
s
1998
2009

Ontario’s Invading Species Awareness Program: analysis of provincial boater and angler survey results4
In 2009, MNR (29%) and OFAH (22%) represented the largest proportions of sources; though DFO (12%) and cottage and lake associations (7%) increased in importance in that year. The 2009 survey additionally offered fishing and boating clubs, Environment Canada (EC), schools, and not sure as options that were not included on the 1998 survey; these options accounted for a total of 20% of the responses in 2009. A substantially lower proportion of people indicated they had not received any information regarding AIS or AIS spread prevention strategies in the consecutive surveys; dropping from 18% in 1998 to 3% in 2009. Results from 2004 were not available for this question.
The methods of information delivery were then assessed using a similar question (Figure 2). Survey results indicate that information provided by trade shows, postings at marinas and bait shops, billboards, the Invading Species Hotline, and word of mouth (friends) have all increased in importance from 1998 to 2009. Books became a less important source of information between 1998 and 2004 (this response was not an option in 2009), as the internet quickly became a principal source (the proportion of yes responses for the internet more than doubled between 2004 and 2009.) Television (TV) and radio were selected less frequently in 2009 compared to the 1998 and 2004 surveys. The remaining sources (print) tended to show similar levels of yes responses across the surveys.
Figure 2. Percentage of yes responses to the question From which of the following sources have you heard about aquatic invasive (exotic) species? in 1998, 2004, and 2009. Print media refers to both magazines and newspapers in 2004 and 2009, but only to magazines in 1998. Books was not listed on the 2009 survey and internet was not listed in 1998.
0
10
20
30
40
50
60
70
80
90
100
Perc
enta
ge o
f 'Ye
s' re
spon
ses
1998
2004
2009

Ontario’s Invading Species Awareness Program: analysis of provincial boater and angler survey results5
To evaluate which strategies have been most effective in disseminating information about AIS to the public, survey respondents were asked to indicate which of the information delivery methods (from Figure 2) provided them with the best source of information. The two highest responses from both the 1998 and the 2009 surveys were print media (including newspapers and magazines) and television (Figure 3). Between 1998 and 2009, however, print sources dropped by 8%, while TV increased by 6%. Very little change occurred across the remainder of the responses, and brochures and the Recreational Fishing Regulations Summary were consistently ranked 3rd and 4th, respectively. Some of the changes in responses may reflect the level of investment put into each type of outreach from year to year, though the consistency in the responses in both survey years likely indicates that these are the preferred or most common media through which the public receives their information.
Figure 3. Proportion of each response chosen as the best source of aquatic invasive species information by respondents in the 1998 and 2009 surveys. Books were not listed as a response option in 2009, while Internet was not a response option in 1998.
Investments
To estimate the cost/benefit ratio for each of the delivery methods of the ISAP, program expenditures between 2002 and 2010 were compiled. This analysis was limited in that in-kind contributions and those from partnering organizations such as OFAH were not included in the expenditures. Substantial year-to-year variation existed in terms of the relative funding on different delivery methods, yet some of these methods (e.g., billboards) would continue to convey their message for multiple years. Further confounding the analysis to equate the level of investment with the response (as assessed from Figure 2, the number of respondents who indicated they received information from each source) was the fact that awareness messages were produced by sources other than ISAP which influenced the survey responses. As such, a cost/benefit evaluation (effectiveness) for the different ISAP delivery methods was not feasible. For the period of comparison (2002–2010), expenditures increased for print media, radio, TV, marina and bait shop postings, trade shows/workshops, billboards, and the internet (funds allocated to website development). Of these, the internet, tradeshows, postings and billboards showed an increase in the percentage
0%
10%
20%
30%
40%
50%
Prop
ortio
n of
ans
wer
s 1998
2009

Ontario’s Invading Species Awareness Program: analysis of provincial boater and angler survey results6
of people who identified these as sources, while radio, TV and print media decreased. Interestingly, an overall decline in the number of respondents who received information about AIS via TV declined, but increased in terms of those seeing it as a ‘best source’. Trade shows were identified by fewer people as a 'best source' even though more people identified them as a source of information.
Preventative behaviours
Preventative practices were evaluated by the AIS awareness surveys by asking survey respondents how often they took precautions against the spread of invasive species prior to moving their boat from one waterbody to another (Figure 4). In each consecutive survey, there was an increase in the number of respondents practicing visual boat inspection. The wording of this question changed however; in 1998 it stated visual inspection of boat and equipment for exotic species, while in 2004 and 2009 it was worded visual inspection for attached plants and animals (a much more general inspection), which may have misleadingly indicated a higher number of inspections were being performed.
Though changes in responses-over-time tended to be minor, the number of people replying always and sometimes to washing practices either stayed the same (drying, from 2004 to 2009; hot water washing from 2004 to 2009) or decreased over the 11-year time period. An exception was the use of high pressure water, which increased slightly between 2004 and 2009. Results indicate that though visual inspections are increasing, some prevention strategies were being used less frequently. Overall, the core behaviours of inspect, drain, wash and dry showed consistent levels of participation across the three surveys (over 80% always and sometimes), while the procedures that required more time or specialized equipment (i.e., pressure washers) remain low across the surveys. Inspecting and removing attached plants and mud is an effective first step in boat and equipment cleaning, reducing the number of macrophytes and small-bodied organisms by 88% and 65% respectively (Rothlisberger et al. 2010).
Figure 4. The proportion of responses to the question “How often did you take the following precautions when transporting your boat and launch into a new waterbody?” Visual refers to visual inspection of boats and equipment, Drain refers to draining water from boat, bilge, and live well, Dry refers to allowing boat to dry for 5 days, High P and Hot water, refer to rinsing boat with high pressure or hot water, Clean Veg refers to physically cleaning vegetation or mussels from the boat and equipment, and Flush Motor refers to flushing the motor’s cooling system with clean water.
0%
10%
20%
30%
40%
50%
60%
70%
80%
90%
100%
1998
2004
2009
1998
2004
2009
1998
2004
2009
1998
2004
2009
1998
2004
2009
1998
2004
2009
1998
2004
2009
Drain Visual Dry CleanVeg
High P FlushMotor
Hot Water
Prop
ortio
n of
Res
pons
es
Never
Sometimes
Always

Ontario’s Invading Species Awareness Program: analysis of provincial boater and angler survey results7
Barriers to public participation
To gauge the barriers to public participation, respondents were asked why they did not take precautions against the spread of invasive species. The response options for this question changed in each survey; in 1998 and 2009, only one response could be selected, and the responses represented the proportion of answers adhering to a given precaution (i.e., sum of all responses represents 100% of the answers). In 2004, respondents instead indicated how much they agreed with each statement, allowing multiple responses per individual. To facilitate comparison, the 2004 data were rescaled to represent a proportion of the total responses (Figure 5).
Figure 5. Responses to “If you didn’t always take precautions against the spread of invasive species, please indicate why” from the 1998, 2004, and 2009 surveys. Shown are the response options that were found in all three of the surveys. Precautions were unnecessary is a created category that encompasses responses such as waterbodies were not infested and one waterbody only. In 1998 and 2009, respondents were asked to select one answer of the provided options, whereas in 2004 respondents were asked to state how much they agreed with each of the provided options. Plotted for 2004 are the proportions of respondents that agreed with each option, for comparison purposes.
The proportion of respondents who cited a lack of knowledge of precautions as the reason they did not participate in preventative measures decreased in each survey. This may indicate that outreach programs have been successful in educating boaters about mitigation strategies. In contrast, a slightly higher number of people in each survey suggested that they do not believe AIS are an important concern (from less than 1% in 1998 to 12% in 2009; further discussion at the end of this section). Though the wording of these questions made direct comparison difficult, a greater number of individuals indicated they were unaware of the issue of invasive species in 2004 than in 1998 (this was not an option in the 2009 survey). Across all three surveys, the greatest number of responses within the grouped category referred to as 'precautions were unnecessary', which includes the response options: the waterbody was not infested and one waterbody only, and indicates that respondents did not believe that preventative measures were needed in their specific cases. A further prompt as to how respondents learned if waters were infested, or whether they boat in connecting waterbodies, could help to establish if preventative measures should in fact have been taken in those cases.

Ontario’s Invading Species Awareness Program: analysis of provincial boater and angler survey results8
Changing recreational behaviours
In 2004 and 2009, respondents were asked to indicate if they had changed their recreational habits as a result of invasive species (Figure 6). The number of respondents who indicated yes increased by approximately 10% over the course of five years. This could be explained by increased efficacy in message delivery by outreach programs or that the effects of AIS have been detected by recreational boaters and anglers. For example, anglers and boaters may have changed when, where, and how they fish or boat (e.g., using different lures or fishing methods to minimize catching invasive fish). However, although the question referred to changes in location of activity, timing of activity, duration, types of gear or target species, this may also represent those who have started practicing some of the suggested prevention tactics. Modifications to this question in a future survey specifying the types of changes that recreational boaters and anglers make would be worthwhile.
Figure 6. Proportion of respondents that indicated that they changed their recreational behaviours in response to invasive species.
0%
10%
20%
30%
40%
50%
60%
70%
80%
90%
100%
2004 2009
Prop
ortio
n of
ans
wer
s
No
Yes

Ontario’s Invading Species Awareness Program: analysis of provincial boater and angler survey results9
Concerns associated with AIS
Approximately 12% of the 2009 respondents indicated that they do not take precautions against the spread of invasive species because they do not believe that they are a serious threat (Figure 5). For comparison purposes, we used the results of a similar question asked in the 2010 Ontario Recreational Fishing Survey, which assessed anglers’ concerns for the health of Ontario fisheries to validate the responses of the AIS survey (respondents were asked to indicate whether they thought the listed threats were serious, somewhat serious, not an issue, or no opinion). This survey showed that a large portion of the angling public believes that the threat of invasive species was serious: 30% of respondents indicated it was a serious concern, and an additional 28% thought it was a somewhat serious concern, whereas only 14% indicated that they did not believe AIS are an issue; a response similar to the AIS survey (Figure 7). While the majority (68%) of recreational anglers understand the negative consequences of AIS in the 2009 survey, there was still a significant proportion of the public who required further information about the environmental, social, and economic impacts of AIS.
Figure 7. Results from the 2010 Ontario recreational fisheries survey indicating how respondents perceived the threat of invasive species.
Serious
Somewhat serious
not an issue
no opinion
no response

Ontario’s Invading Species Awareness Program: analysis of provincial boater and angler survey results10
Baitfish as a pathway for invasive species spread in OntarioTo understand the role of baitfish as a pathway of AIS spread, trends in the types of bait used, the acquisition of bait, and the frequency of proper bait disposal practices were analyzed from the AIS awareness surveys. The results of two additional angler surveys were used to validate the accuracy of the responses to the AIS surveys, and further explain some of the trends associated with baitfish use. The Survey of Recreational Fishing in Canada (hereafter referred to as the Recreational Fishing Survey), collects angler information regarding fishing activities across the country. Although questions may change, the survey has been conducted in five year intervals since 1970; questions specifically relevant to Ontarians regarding AIS and baitfish use appeared on the survey in 2005 and 2010. Topics include fishing habits, perceived threats to Ontario’s fisheries, and baitfish usage. Some results of the 2010 survey, which had a response rate of 40%, with 11,846 useable questionnaires returned, are included.
A baitfish-specific survey, conducted through DFO (Summary of a Survey of Baitfish Users in Canada, Ward et al., 2011) further examined Canadian anglers’ trends in baitfish use. Summary of a Survey of Baitfish Users in Canada, also referred to as the Great Canadian Baitfish Survey, spanned the 2006/07 fishing year. The survey was distributed in both paper copy and electronic format, and resulted in 1,815 responses in Ontario. Surveys were distributed at the Spring Fishing Show in Toronto in April 2006, were advertised on the OFAH and various conservation websites in Ontario, and through flyers distributed to bait shops and angling retailers. It was possible that targeting survey respondents at the Toronto Spring Fishing Show (versus randomly selecting registered anglers in the other surveys) may have skewed the results towards more avid fishermen and residents of southern Ontario, thus affecting the proportions of live baitfish users observed.
Bait types
The 2009 AIS awareness survey indicated that artificial lures were the most commonly used bait type, with approximately 95% of participants indicating that they always or sometimes used artificial lures. Live baitfish represented 15% of bait types used always, and 53% of bait used sometimes, and whereas 32% of respondents indicate that they never use live bait (Figure 8).
Figure 8. Proportional use of each bait type according to the 2009 aquatic invasive species awareness survey.
0%
20%
40%
60%
80%
100%
Prop
ortio
n of
resp
onse
s
Never
Sometimes
Always

Ontario’s Invading Species Awareness Program: analysis of provincial boater and angler survey results11
In comparison, data from the Recreational Fishing Survey (2010) showed that live baitfish were used often by 41% of respondents, sometimes by 28% of respondents, and never by 31% of respondents. The never responses from both surveys (AIS and Recreational Fishing Survey) were consistent (32% and 31%), while the differences between the other two categories likely reflect the division between always/sometimes (68% total), and often/sometimes responses (69% total). A different trend was seen in the Great Canadian Baitfish Survey (2007), however, where 90% of the respondents identified themselves as live baitfish users. Baitfish use was also separated by frequency, in which 48% of those who used live baitfish used it 11 or more times per year, while 20% used it between 6–10 times, 26% between 2–5 times per year, and 6% used live bait only once per year.
According to the 2009 AIS awareness survey, the highest number of baitfish users were in northern Ontario (P postal code, 86%), while central, eastern, and metro Toronto residents showed similar proportions of baitfish users (59, 61, and 59%, respectively; Figure 9).
Figure 9. Proportion of baitfish users by frequency of use in each region of Ontario, according to the aquatic invasive species awareness survey in 2009.
0%
10%
20%
30%
40%
50%
60%
70%
80%
90%
100%
Prop
ortio
n of
Res
pond
ents
Never
Sometimes
Always

Ontario’s Invading Species Awareness Program: analysis of provincial boater and angler survey results12
Live baitfish acquisition
AIS awareness survey respondents were asked to identify how they acquired their live bait. The results of the 2004 and 2009 surveys showed that trends did not change much during the five year period (Figure 10), with most bait purchased at a bait shop (69% always in 2004, 67% always in 2009). There was also a slight increase in the number of self-harvesters that acquired their bait from the same waters being fished (13% always in 2004, 18% in 2009), while those who always harvested their bait from different waters being fished differed by 1% between the two surveys.
Figure 10. Proportion of respondents who acquired their live bait from each source, according to the aquatic invasive species awareness survey in 2009.
Self-harvested bait
Results of the 2009 AIS awareness surveys (Figure 10) indicated that the majority of self-harvesters use their bait in the same waters as they were collected, while those who use their bait in different waters than they were collected represented 2% of the always respondents and up to 17% of the sometimes responses. These numbers are comparable to the 2004 survey, where 3% indicated always and 19% indicated sometimes. Results from the Great Canadian Baitfish Survey shows that up to 38% of baitfish self-harvesters use their bait in waters other than where they caught (up to 75% used the bait in the same waters as they captured it; some respondents indicated multiple answers). Of those using live bait in the Great Canadian Baitfish Survey (90%), 56% collected their own bait (8% always, 48% sometimes) while 44% of anglers never do. Though this is a legal practice, it is possible that using bait in different waters than they were caught may inadvertently facilitate the spread of AIS to new waters.
Purchasing from a bait shop
The Great Canadian Baitfish Survey also indicated that baitfish purchasers bought their bait near their fishing spot 37% of the time, on the way to their fishing spot 34% of the time, and close to where they live the remainder of the time (29%). This valuable information could be used in future AIS surveys to assess how bait movement across the province has changed since the 2007 Great Canadian Baitfish Survey. Awareness messages can be made more
0%
20%
40%
60%
80%
100%20
04
2009
2004
2009
2004
2009
2004
2009
2004
2009
Bought it Collected(same water)
Collected(different
water)
Got it fromsomeone else
Other
Prop
ortio
n of
resp
onse
s
never
sometimes
always

Ontario’s Invading Species Awareness Program: analysis of provincial boater and angler survey results13
effective by collecting thorough information about the baitfish pathway. For example, it may be useful to emphasize that anglers using live bait should purchase it closer to their fishing location.
Bait release
Each AIS awareness survey (1998, 2004, and 2009) had a question to identify how frequently respondents released their live bait back into the water (Figure 11). The definition of bait changed across the three surveys. In 1998 it referred to live bait minnows, in 2004 the question more inclusively stated live bait (which could include worms, leeches, crayfish, frogs, etc.), while 2009 specified live bait fish. The responses can provide an estimate of trends through time, which show that fewer people released live bait in 2009 than previously (always: 14%, 15%, 9%, and sometimes: 31%, 38% 27%, respectively).
Figure 11. The proportion of respondents indicating whether they always, sometimes, or never release their live bait into the water at the end of a day’s fishing in the aquatic invasive species awareness surveys. The 2004 and 2009 surveys asked "what do you do with your leftover bait?" where released in the water was one of the possible responses. In 1998, the survey simply asked respondents to indicate whether or not they released their bait. The definition of bait changed from live bait minnows (1998), live bait (2004) to live bait fish (2009).
0%
20%
40%
60%
80%
100%
1998 2004 2009
Prop
ortio
n of
resp
onse
s Never
Sometimes
Always

Ontario’s Invading Species Awareness Program: analysis of provincial boater and angler survey results14
Changes to the Ontario Fishery Regulations in 2007 specified that bait and bait buckets must be disposed of on land, at least 30m away from any water body. Trends between the 2004 and 2009 surveys revealed changes in bait bucket disposal practices (Figure 12). Those who responded always or sometimes to released into water decreased from 55% in 2004 to 36% in 2009 (a 6% drop in those who responded always); which indicated a positive change towards proper bait disposal practices. The number of people who disposed of leftover bait in the garbage has shown little change before and after this regulation. All other options (frozen/preserved for later use, and given to other anglers) have shown similar levels of response, or decreased to some degree. Future surveys could use an open-ended question to determine what was being done with the leftover bait, as it may not have been one of the response options provided.
The 2009 survey offered I never have any leftover bait as an additional response, to which 97% responded always. The remaining 3% was equally divided among the sometimes and never responses. Only 290 people responded to this portion of the question, whereas the other responses (released, given to others, disposed, preserved, and retained for later) had between 549 and 720 responses each. It was likely that this was an elevated estimate as a result of the wording of the question. It would be valuable to continue including this option, re-worded, on future surveys to monitor this trend.
Figure 12. Live baitfish disposal practices in Ontario based on 2004 and 2009 aquatic invasive species survey results.
Responses regarding bait disposal practices of anglers between the AIS survey in 2009 and the Recreational Fishing Survey in 2010 showed a high degree of consistency, and were likely an accurate description of bait disposal habits of Ontarians. The AIS survey in 2009 reported that 36% of people always disposed of their bait on land, while 39% sometimes did, and only 25% never disposed of their bait on land. In comparison, respondents in the Recreational Fishing Survey indicate they disposed of their baitfish on-land were 67% (combining always and sometimes responses). The Great Canadian Baitfish Survey, where respondents were asked to indicate either yes or no, showed compliance levels to proper baitfish disposal at 43%, which is comparable to the always responses of the other two surveys.
0%
20%
40%
60%
80%
100%
2004 2009 2004 2009 2004 2009 2004 2009
Disposed Released Preserved Given to otheranglers
Prop
ortio
n of
resp
onse
s
Never
Sometimes
Always

Ontario’s Invading Species Awareness Program: analysis of provincial boater and angler survey results15
Respondents’ postal codes were used to delineate geographic patterns in bait release habits across Ontario. The highest I don’t release response was observed in northern Ontario (postal code P; 65%). This was followed by eastern Ontario (postal code K; 61%). The highest levels of bait release were seen in the metro Toronto postal code region (M), where only 35% indicated that they do not release their bait. It was possible that the level of targeted outreach by the ISAP program was high in the eastern Ontario (K) region given the proximity to the program base of operations; however the trends did correspond with expected levels of outreach and education across the rest of the province. The results were also separated into angler age categories, however no noteworthy trends were observed (categories included under 29, 30–39, 40–49, 50–59, and 60+). Always responses varied from 8–12% across all age groups, while sometimes and always responses combined represented approximately 40% of all age categories. Comparatively, the 40–49 and 50–59 categories each represented nearly twice as many registered anglers than the remaining age classes, indicating that they are the primary target for AIS education and awareness. Ontario residents under 18 and over 65 do not require a fishing license and therefore were not included in the survey.
Release rates according to the Recreational Fishing Survey in 2010 were comparatively low across all angler categories, and consistently lower than the results of the AIS surveys (Figure 13). When separated by angler type, resident seniors were identified as those least likely to release their bait back into the water (8%), followed by other non-residents (9%), residents (11%), and Canadian non-residents (16%). The higher sample sizes in the Recreational Fishing Survey may provide more meaningful results than this same analysis of the AIS surveys. These trends potentially indicate that non-Ontario Canadian residents were the least knowledgeable about baitfish disposal practices that prevent the spread of AIS. Seniors and non-Canadian anglers (who were all from the United States) demonstrated the highest compliance with bait disposal regulations and recommendations according to the survey.
Figure 13. Bait release and disposal habits by angler type, according to the Recreational Fishing Survey in 2010. Proportions refer to the number of people that indicated either always or sometimes to each option.
0%
20%
40%
60%
80%
100%
Resident Senior Resident Canadian Non-resident
Other Non-resident
Prop
ortio
n of
resp
onse
s
Released
Retained live
Gave to others
Preserved
Disposed

Ontario’s Invading Species Awareness Program: analysis of provincial boater and angler survey results16
The ‘L’, ‘M’ and ‘N’ postal code regions (central, metro Toronto, and western regions respectively) showed the highest levels of baitfish release, and respondents indicated that their reasons for releasing bait include not wanting to kill the bait unnecessarily, not wanting to transport the bait, and (in central Ontario and metro Toronto) that there were no facilities provided to dispose of their bait (Figure 14). Comments given with the other category responses consisted of fed the bait to the fish, or released the fish back into the water it was collected from. Given this information, it seems that a significant portion of the other responses could fit in a general category of believing that they were doing the right thing. The no code given category, which consists of all survey responses that did not provide a postal code, was comparable to the weighted average of all the regions.
Figure 14. Reasons for releasing leftover live bait into the water at the end of a day’s fishing, separated by the location of residence of each respondent.
What do the results show?
According to the surveys, between 61% (AIS survey, 2009) and 90% (Great Canadian Baitfish Survey, 2007) of Ontario anglers use live baitfish. There are varying levels of baitfish use and acquisition across the surveys, which likely reflected the difference in the wording of the questions (primarily the use of yes/no, always/sometimes/never) as well as the geographic distribution of the respondents. Of those who identified themselves as live bait users, between 15–48% (varying results in each survey) indicated that they use live baitfish often although the majority of anglers are using artificial lures most of the time.
Up to 92% of the respondents buy baitfish from a bait shop, while a much smaller percentage are self-harvesters. Bait shop checks indicate that in 2007, 13.6% (Ward et al., 2011) and in 2012, 13.8% (MNRF Enforcement Unit pers. comm.) of fish purchased were non-target (illegal) bait species in Ontario. An inspection conducted by the MNRF enforcement unit over the 2012 and 2013 seasons showed that at 184 sites, 22 had non-target species (12% of bait shops). In contrast, a much larger discrepancy exists amongst the surveys for self-harvesting trends; between 2% (always responses in the 2009 AIS survey) and 34% (Great Canadian Baitfish Survey, 2010).
0%
10%
20%
30%
40%
50%
60%
70%
80%
90%
100%
Pro
porti
on o
f ans
wer
s
Smell attracts animals
No Facilities
Don't want to transport
Other
Convenience
Don't want to kill
NA, I don't release

Ontario’s Invading Species Awareness Program: analysis of provincial boater and angler survey results17
Given that the 2009 AIS survey found that 29% of anglers disposed of unused bait on land and an additional 14% preserved the bait for future use, collectively, 43% of the anglers create little risk for new introductions by practicing acceptable behaviours. Furthermore, if the 34% of anglers who acquired their bait from other anglers similarly dispose of or preserve their baitfish, then a total of 58% of the unused bait potentially may not contribute to further spread. The remaining events (42%) could potentially facilitate species spread.
A summary of the AIS survey results indicated the areas of concern in the baitfish pathway including:
a) leftover bait released into the water for compassionate reasons (41% of releases)
b) leftover bait released into the water for convenience reasons (22% of releases)
c) self-harvesters who move bait to new waters (between 2% and 19% in 2009 AIS survey)
Continued program evaluationThe results of the AIS awareness surveys indicated that there are more sources delivering AIS-related information to the public now than in the past (Figures 1 and 2), and that the use and importance of these sources are changing (Figure 2 and 3). For this reason, it is important that the ISAP program utilize the most effective strategies to deliver information about AIS to the public, while maintaining consistency with other organizations. Continued evaluation of the public awareness program, changing message delivery methods, and assessment of the allocation of resources in different outreach strategies could help to effectively inform the public about AIS. Another survey, designed specifically to assess how public participation and knowledge may have changed as a result of ISAP and other initiatives since 2009 (e.g., programs specific to Lake Simcoe), can help gauge the success of the newly-implemented public education techniques and can guide future decision-making.
Comparing the importance of various pathways of spread
It is difficult to quantify the number of events of concern that would occur in the boat and baitfish pathways; however, it is likely that boats and equipment (including angling equipment) may be a comparatively higher contributor to invasive species spread than baitfish use (see other sections in this report for further information). The number of events that may contribute to the spread of invasive fish via the baitfish pathway (not including diseases, hitchhikers or plant fragments) may be lower than other vectors given that most purchased bait fish are legal species, and that the pathway is regulated. Public participation in boat and equipment cleaning recommendations does not appear to have increased over time, and it is difficult to assess public behaviours given that the pathway is not regulated. Furthermore, anglers are likely to contribute to species spread via hitchhikers on their equipment (an issue for all anglers and not just those using live bait).
Key findings from the survey trends
These survey results reinforced the need to continue to share AIS spread prevention information with the public. The key findings from the survey results include:
1. Information on AIS are delivered to the public by numerous organizations (e.g., MNRF, OFAH, DFO, cottage and lake associations, Environment Canada) through multiple formats. Most people obtain this information through traditional communication streams (print media, TV, and the internet, but not radio) that can provide detailed messaging. A small, but growing number of boaters indicated that they do not believe AIS are a concern.
2. Clean, inspect, drain, and dry behaviours are the most commonly practiced preventative boat cleaning strategies across the three surveys. High pressure washing, hot water washing, and flushing of the motor are practiced much less frequently. Lack of knowledge about the precautions is less of a barrier in 2009 than previously, however, a perception that precautions were unnecessary remains the main reason not to participate in boat cleaning.
3. The proportion of live baitfish users varies across the province; being highest in the north and lowest in the east. The majority of anglers purchase their live bait as opposed to self-harvesting. Baitfish purchasers

Ontario’s Invading Species Awareness Program: analysis of provincial boater and angler survey results18
identified that they buy their bait close to home (29%) or on the way to their fishing spot (34%), instead of near their fishing location. This may enable disease spread and the range expansion of species native in Ontario.
4. The proportion of survey respondents who indicate they release their live bait back into the water has decreased somewhat. The primary barriers to correct baitfish disposal (e.g., on land) include compassionate reasons (e.g., not wanting to unnecessarily kill fish, adding food to the system) as well as convenience reasons (e.g., not wanting to transport fish see self-harvested bait section).
Suggested questions for a future survey
The following are offered as possible questions to include in a follow-up survey. They have been developed to compliment the 2009 survey (and 2004 and 1998 surveys, where possible), so that comparisons can be made to the previous surveys. Some questions have been modified to reflect changes in relevancy of questions over time. For the purpose of removing invasive species was added to many questions to benefit the survey and confirm the motivations of the preventative behaviours listed. It is possible that the higher response rates (45% in 1998 as compared to 30% in 2009) observed in the earliest survey could be related to the ease of answering; there were fewer questions on the survey (20 questions versus 33 in 2009) and would have taken less time to answer. In light of this, simplifying the wording and offering ‘opt-out’ questions for those to whom the questions are not relevant could make the survey easier to complete. Another suggestion may be to offer an incentive to encourage survey recipients to respond to the survey such as a randomly drawn Recreational Fishing License.
Sources of information:
1) Have you ever heard about invasive species? If no, please skip ahead to the boating section (Question 8).
a. Yes
b. No
c. Not sure
2) In your opinion, how important is it that recreational anglers and boaters take precautions to prevent the spread of invasive species from one waterbody to another? (Scale: 1- not important 2 3 4 5 -very important)
3) From which of the following organizations or agencies have you heard about invasive species? (Responses: Yes, No, Don’t Know)
a. Ontario Ministry of Natural Resources and Forestry____________
b. Department of Fisheries and Oceans ______________
c. Canadian Coast Guard_________________________
d. Environment Canada__________________________
e. Ontario Federation of Anglers and Hunters_________
f. Cottage or Lake association_____________________
g. Fishing or boating club_________________________
h. School_____________________________________
i. Not sure __________________________________
j. Other (please specify)_________________________
4) Please select all the sources and media from which you have heard about invasive species. (Yes or No for each.)
a. Print media (newspapers or magazines)_________
b. Television________________________________
c. Radio___________________________________

Ontario’s Invading Species Awareness Program: analysis of provincial boater and angler survey results19
d. Friends, family (word of mouth)______________
e. Trade shows______________________________
f. Internet__________________________________
g. Social media______________________________
h. Training sessions___________________________
i. Brochures________________________________
j. Billboards________________________________
k. Recreational Fishing Regulations Summary______
l. Marina, bait and tackle shop signs_____________
m. Boat launch signs__________________________
n. Hotline__________________________________
o. Other (specify) ____________________________
5) Which of the above sources or media from question 5, provided you with the BEST information on how to avoid spreading invasive species from one waterbody to another?
________________________________________________________________
6) What do you believe are the most likely pathways through which invasive species enter or spread throughout Ontario? Please circle all that apply.
a. International trade
b. International travel
c. Ballast waters from transoceanic ships
d. Fish farming
e. Live bait release
f. Aquarium/watergarden trade
g. Live fish food markets
h. Fishing activities
i. Boating activities
j. Unauthorized stocking of waters
k. Canals, dams, water diversions
l. Float planes
m. Other (please specify)__________
Boating:
7) Did you use a boat in (current year)? If no, skip ahead to the section on bait (Question 17).
a. Yes
b. No
8) If yes in (8), what type of boat do you use most frequently?
a. Small power boat (under 20ft)

Ontario’s Invading Species Awareness Program: analysis of provincial boater and angler survey results20
b. Large power boat (over 20ft)
c. Personal watercraft (i.e., jet ski)
d. Canoe or kayak
e. Small sailboat (under 20ft)
f. Large sailboat (over 20ft)
g. Other __________ (please specify).
9) Did you move your most frequently used boat (by trailer or car) from one waterbody to another during the (year) season? If no, please skip to question 17 after this question.
a. Yes
b. No
10) How often did you move your most frequently used boat from one waterbody to another over the (year) season?
a. once
b. 2–4 times
c. 5–10
d. 10+
11) On average, how long was your most frequently used boat out of the water before bring launched into a new waterbody?
a. Never (stays in same water all season)
b. <1 day between trips
c. 2–4 days
d. 5–7 days
e. 8–14 days
f. 15+ days
12) When you transported/removed your most frequently used boat from the water, how often did you do each of the following to prevent the spread of AIS? (Responses: Always, Sometimes, Never).
a. visually inspect the boat for attached plants and animals
b. clean off plants/animals from boat, motor and trailer
c. drain all water from the boat (including bilge and live well)
d. allow boat to dry for at least 5 days
e. wash with high pressure water
f. wash with hot water
g. flush the motor with hot water
13) If and when you didn’t take any of these precautions, what was your main reason?
a. I always took precautions
b. preventing the spread of AIS and diseases isn’t important
c. I didn’t have the right equipment
d. it takes too long

Ontario’s Invading Species Awareness Program: analysis of provincial boater and angler survey results21
e. I don’t know how to do it properly
f. I don’t believe these precautions will help prevent the spread
g. other (please specify) __________
14) Which of the following would be likely to motivate you to clean your boat for the purpose of preventing the spread of invasive species before launching into a new waterbody? Please check all that apply.
a. more information about how to clean the boat
b. more information on the benefits and importance of cleaning your boat
c. demonstration of boat cleaning and species identification by trained individuals
d. directions to the nearest car wash that will accommodate a boat
e. access to pressure washer equipment, brushes, and tools at the boat launch
f. boat wash parking zones at the boat launch, so that there is a dedicated space for boat washing
g. fines for having plants or mud on the boat when driving
h. a boat sticker reminding you of the steps to cleaning the boat after removal from the water
i. other (please specify) __________
Bait:
15) Did you fish in the (current year) season? If no, please skip to ‘other’ section (Question 24).
a. yes
b. no
16) How often do you fish with each type of bait (responses: always, sometimes, never)?
a. artificial bait
b. live baitfish
c. dead baitfish
d. fish parts
e. crayfish
f. worms
g. leeches
h. frogs
i. other
17) When did you use live baitfish in the current year? If you select ‘never’, please skip to ‘other’ section (Question 24) after this question.
a. mostly summer
b. mostly winter
c. both
d. never

Ontario’s Invading Species Awareness Program: analysis of provincial boater and angler survey results22
18) How often did you use live baitfish (only fish species) in the current year?
a. zero times
b. one time
c. 2–5 times
d. 6–10 times
e. 11+ times
19) If you use live baitfish, where do you obtain your live baitfish (Responses: Always, Sometimes, Never)?
a. buy it from a bait shop
b. collect from the same waterbody as I was fishing
c. collect from a different water body than I fished in
d. I use someone else’s leftover baitfish
e. other (please specify)___________________
20) At the end of the day’s fishing, what do you do with leftover baitfish (Responses: Always, Sometimes, Never)?
a. release it into the water
b. give it to others to use
c. dispose of it on land or in a garbage can
d. save it for later (keep it live)
e. preserve it for later
f. I never have leftover baitfish
g. other (please specify) __________________
21) Please indicate why you have released leftover baitfish into the water:
a. I never release baitfish in the water
b. did not want to unnecessarily kill the baitfish
c. I was providing additional food to the fish
d. water is a convenient place for disposal
e. did not want to have to transport it after fishing is done
f. did not want to attract wildlife by dumping on land
g. no place (garbage can) at launch for disposing
h. other (please specify)___________
General information about the respondent:
22) please list the postal code of your primary residence._________________
23) in what year were you born? __________
24) please indicate your gender. (M/F)

Ontario’s Invading Species Awareness Program: analysis of provincial boater and angler survey results23
ReferencesDepartment of Fisheries and Oceans, 2012. Survey of Recreational Fishing in Canada, 2010. Ottawa, Ontario.
Rothlisberger, J.D., Chadderton, W.L., McNulty, J. and Lodge, D.M., 2010. Aquatic Invasive Species Transport via trailered boats: what is being done, who is doing it, and what can be done. Fisheries 35: 121–132.
Ward, J.M., Cudmore, B., Drake, D.A.R. and N.E. Mandrak, 2011. Summary of a Survey of Baitfish Users in Canada. Canadian Manuscript Report of Fisheries and Aquatic Sciences, 2972.

ISBN: 978-1-4606-4751-6
2014