environmental assessment of proposed geoduck harvest …
TRANSCRIPT
ENVIRONMENTAL ASSESSMENT OF PROPOSED GEODUCK HARVEST
ALONG THE NORTHERLY SHORELINES OF HENDERSON INLET AT THE ITSAMI GEODUCK TRACT (#16300)
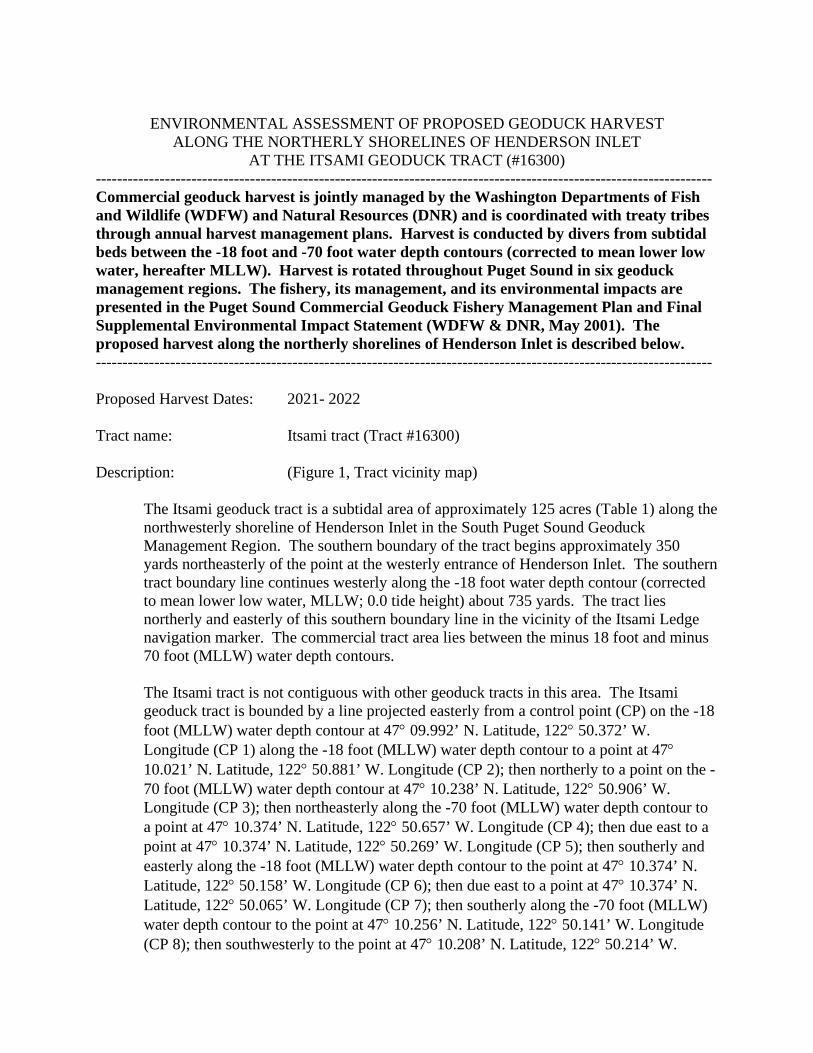
-------------------------------------------------------------------------------------------------------------------- Commercial geoduck harvest is jointly managed by the Washington Departments of Fish and Wildlife (WDFW) and Natural Resources (DNR) and is coordinated with treaty tribes through annual harvest management plans. Harvest is conducted by divers from subtidal beds between the -18 foot and -70 foot water depth contours (corrected to mean lower low water, hereafter MLLW). Harvest is rotated throughout Puget Sound in six geoduck management regions. The fishery, its management, and its environmental impacts are presented in the Puget Sound Commercial Geoduck Fishery Management Plan and Final Supplemental Environmental Impact Statement (WDFW & DNR, May 2001). The proposed harvest along the northerly shorelines of Henderson Inlet is described below. -------------------------------------------------------------------------------------------------------------------- Proposed Harvest Dates: 2021- 2022 Tract name: Itsami tract (Tract #16300) Description: (Figure 1, Tract vicinity map)
The Itsami geoduck tract is a subtidal area of approximately 125 acres (Table 1) along the northwesterly shoreline of Henderson Inlet in the South Puget Sound Geoduck Management Region. The southern boundary of the tract begins approximately 350 yards northeasterly of the point at the westerly entrance of Henderson Inlet. The southern tract boundary line continues westerly along the -18 foot water depth contour (corrected to mean lower low water, MLLW; 0.0 tide height) about 735 yards. The tract lies northerly and easterly of this southern boundary line in the vicinity of the Itsami Ledge navigation marker. The commercial tract area lies between the minus 18 foot and minus 70 foot (MLLW) water depth contours. The Itsami tract is not contiguous with other geoduck tracts in this area. The Itsami geoduck tract is bounded by a line projected easterly from a control point (CP) on the -18 foot (MLLW) water depth contour at 47° 09.992’ N. Latitude, 122° 50.372’ W. Longitude (CP 1) along the -18 foot (MLLW) water depth contour to a point at 47° 10.021’ N. Latitude, 122° 50.881’ W. Longitude (CP 2); then northerly to a point on the -70 foot (MLLW) water depth contour at 47° 10.238’ N. Latitude, 122° 50.906’ W. Longitude (CP 3); then northeasterly along the -70 foot (MLLW) water depth contour to a point at 47° 10.374’ N. Latitude, 122° 50.657’ W. Longitude (CP 4); then due east to a point at 47° 10.374’ N. Latitude, 122° 50.269’ W. Longitude (CP 5); then southerly and easterly along the -18 foot (MLLW) water depth contour to the point at 47° 10.374’ N. Latitude, 122° 50.158’ W. Longitude (CP 6); then due east to a point at 47° 10.374’ N. Latitude, 122° 50.065’ W. Longitude (CP 7); then southerly along the -70 foot (MLLW) water depth contour to the point at 47° 10.256’ N. Latitude, 122° 50.141’ W. Longitude (CP 8); then southwesterly to the point at 47° 10.208’ N. Latitude, 122° 50.214’ W.

ENVIRONMENTAL ASSESSMENT OF PROPOSED GEODUCK HARVEST AT THE ITSAMI GEODUCK TRACT (#16300) Page 2 of 10
Longitude (CP 9); then southwesterly to the point at 47° 10.064’ N. Latitude, 122° 50.280’ W. Longitude (CP 10); then due south to the point at 47° 09.992’ N. Latitude, 122° 50.280’ W. Longitude (CP 11); then due west to the point of origin (Figure 2). All positions are in WGS84 datum.
Commercial harvests on this tract must be within the designated tract boundary polygon described above. Vessels conducting geoduck harvest operations must remain seaward of a line two hundred yards seaward from and parallel to the line of ordinary high tide, to conform with state statute (RCW 77.60.070). Any variance to the stated boundary line will be coordinated between WDFW and DNR and will be implemented by DNR for commercial geoduck harvests.
Substrate:
Geoducks are found in a wide variety of sediments ranging from soft mud to gravel. The most common sediments where geoducks are harvested are sand with varying amounts of mud and/or gravel. The specific sediment type of a bed is primarily determined by water current velocity. Coarse sediments are generally found in areas of fast currents and finer (muddier) sediments in areas of weak currents. The major impact of harvest will be the creation of small holes where the geoducks are removed. The holes fill in within a few days to several weeks and have no long-term effects. The substrate holes refill in areas with strong water currents much faster than in areas with weak water currents. Water currents can be strong in the vicinity of the Itsami tract. Currents reach an estimated average flood velocity of 1.5 knots and an estimated average ebb velocity of 2.2 knots (Tides and Currents software; station #1846; Dana Passage).
Sub-surface substrates observed during collection of geoduck dig samples include gravel and shell, and characteristics include “compact” (Table 2). The surface substrates within this tract are highly variable with sand predominant on 48 of 56 transects (Table 3). Mixtures of sand and cobble were noted on 18 transects, sand and shell on 9 transects, mud on 7 transects and boulders on 14 transects. Eighteen transects have cobble as the predominant substrate, which may present a significant hindrance to digging geoducks.
Water Quality:
Water quality is good at the Itsami tract. Water at this tract is affected by strong water currents and turbulence of Dana Passage, which prevents stratification (water layering) and brings deeper nutrient-rich waters to the surface. As a result, the water quality in this area is high. At a WA Dept. of Ecology water quality station in Henderson Inlet (HND001- Henderson Inlet-Cliff Point), the minimum dissolved oxygen (D.O.) concentration reported between 10/5/92 and 12/18/2006 (most recent data year completed) from a water depth range of 9-11 meters was 4.2 mg/L, with an average D.O. of 7.98 mg/L. D.O. concentrations below 3.0 mg/L for extended periods may cause

ENVIRONMENTAL ASSESSMENT OF PROPOSED GEODUCK HARVEST AT THE ITSAMI GEODUCK TRACT (#16300) Page 3 of 10
stress in marine organisms. Maximum water temperatures at this water depth range and within this time frame varied between 6.85 to15.33º C. The water acidity at this water depth range and within this time frame varied between a pH of 7.6 to 8.8. On March 6, 2013 the DOH provided an upgrade notification for the most westerly portion of this tract. The harvest area within the tract boundary polygon is classified as “Approved” by the Washington Department of Health (DOH) for commercial shellfish harvest. This area has been tested for inorganic arsenic levels (Jerry Borchert, DOH, pers. comm., 7/10/14) and this tract is not currently on the list of approved tracts to export geoducks to China. More detailed information regarding arsenic can be found at the DOH web site, including a fact sheet found at http://www.doh.wa.gov/Portals/1/Documents/4400/332-146-Arsenic-in-Shellfish.pdf. DNR will verify the health status of the Itsami tract prior to any state managed commercial geoduck harvest on this tract.
Biota:
Geoduck:
The Itsami geoduck tract is approximately 125 acres and currently contains an estimated 1,061,725 pounds of geoducks after subtracting harvest of 453,917 pounds of geoduck from the 2018 pre-fishing biomass estimate (Table 1). Geoducks are considered commercial quality on all of the dig stations (Table 2). Three geoduck dig stations were rated “easy” to dig. The other dig stations were rated as having “some difficulty” to being “very difficult” to dig. Shell and substrate compactness, low abundance, depth in the substrate and turbidity were listed as factors that hindered digging. The geoduck density on this tract is moderate to low and currently estimated to be 0.086 geoducks/sq.ft. The pre-fishing density averaged 0.121 geoducks/sq.ft. The density on the pre-fishing surveys range from 0.000 geoducks/sq.ft. on transects 46 and 56 to 0.476 geoducks/sq.ft. on transect 24 (Figure 3, Table 3, Table 4). The weight of geoducks at the Itsami tract are moderate for Puget Sound, averaging 2.28 pounds. The lowest average whole weight is 1.67 pounds per geoduck at station #30 and the highest average whole weight is 2.92 pounds per geoduck at station #10 (Table 5). The Itsami geoduck tract was formerly named Henderson 2. This area was surveyed by WDFW in 1979 and was harvested in 1980-81; 566,000 pounds landed. The tract was re-surveyed by WDFW in 1984 and was harvested in 1985; 1,112,000 pounds landed. Post-harvest surveys were conducted in 1986, 1992, and 2011. The 2011 surveyed density was not significantly different than the original pre-fishing survey estimate, and this tract was considered recovered. Commercial harvest began again on this tract by treaty tribes in 2012 and continued until 2016 with 1,657,296 pounds landed. The tract was considered fished down at that point and again placed into recovery status. The tract was

ENVIRONMENTAL ASSESSMENT OF PROPOSED GEODUCK HARVEST AT THE ITSAMI GEODUCK TRACT (#16300) Page 4 of 10
surveyed in 2018, originally as a post-harvest survey, during which it was found that there were still commercial densities of geoduck on this tract. This could be due to misreporting or an inaccurate pre-fishing survey. This new 2018 pre-fishing biomass estimate was 1,515,642 lbs.
Geoducks are managed for long term sustainable harvest. No more than 2.7% of the fishable stocks are harvested (total fishing mortality) each year in each management region throughout Puget Sound. The fishable portion of the total Puget Sound population for non-Indian harvesters includes geoducks that are found in water deeper than -18 feet and shallower than -70 feet (corrected to mean lower low water - MLLW). Other geoducks which are not harvestable are found inshore and offshore of the harvest areas. Observations in south Puget Sound show that major geoduck populations continue to depths of 360 feet. Additional geoducks exist in polluted areas and are also unavailable for harvest, but continue to spawn and contribute to the total population.
The low rate of harvest is due to geoduck's low rate of natural recruitment. WDFW has studied the regeneration rate of geoducks on certain tracts throughout Puget Sound. The estimated average time to regenerate a tract to its original density, after removal of 65 percent of the geoducks, is 55 years. The recovery time for the Itsami tract is unknown. The research to empirically analyze tract recovery rates is continuing. Fish:
Geoduck beds are generally devoid of rocky outcroppings and other relief features that attract and support many fish species, such as rockfish and lingcod. The bottoms are relatively flat and composed of soft sediments which provide few attachments for macroalgae, which also is associated with rockfish and lingcod. The fish observed during the surveys at the Itsami tract were various species of flatfish, sanddabs, sculpins, and gobies.
WDFW marine fish managers were asked of their concerns of any possible impacts on groundfish and baitfish that geoduck fishing would have. Greg Bargmann of WDFW stated that geoduck fishing would have no long-term detrimental impacts and may have some short term benefits to flatfish populations by increasing the availability of food. Dan Penttila of the WDFW Fish Management Program recommended that eelgrass beds within the harvest tract should be preserved for any spawning herring. No eelgrass has been observed along this tract below a depth of –16 feet (MLLW). The Itsami nearshore tract boundary will be along the -18 foot (MLLW) water depth contour to provide year-round protection to Pacific herring spawning habitat and provide a vertical buffer between eelgrass beds and geoduck harvest.
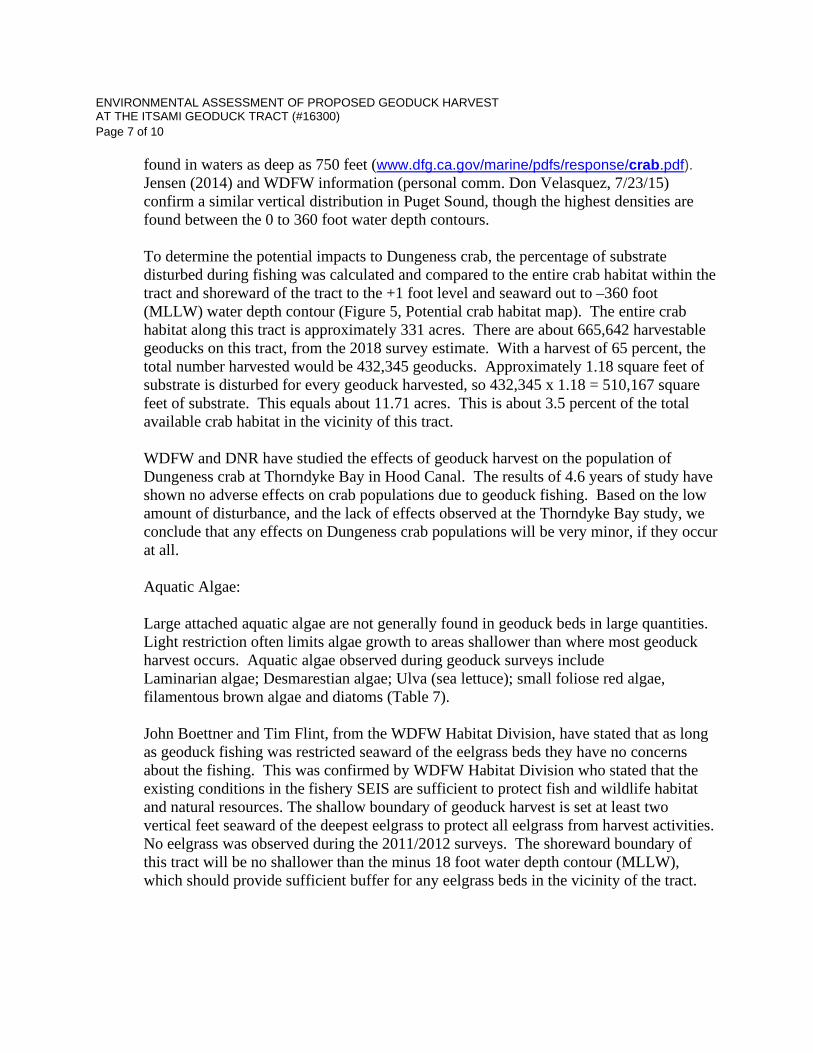
There are no Pacific herring spawning grounds documented along the shorelines of Henderson Inlet or in the vicinity of the Itsami tract. A herring spawning holding area

ENVIRONMENTAL ASSESSMENT OF PROPOSED GEODUCK HARVEST AT THE ITSAMI GEODUCK TRACT (#16300) Page 5 of 10
has been identified easterly of the tract in the vicinity of Johnson Point (Figure 4). Geoduck fishing on the Itsami tract should have no detrimental impacts on herring spawning.
NOAA Fisheries Service announced on April 27, 2010 that it was listing canary and yellow eye rockfish as “threatened” and bocaccio as “endangered” under ESA (federal Endangered Species Act). The listings became effective on July 27, 2010. Historic high levels of fishing and water quality are cited as reasons that these rock fish populations are in peril and have been slow to recover. Geoduck fishery managers are tracking this process and will take actions necessary to reduce the risk of “take” of any listed rockfish species that could potentially result from geoduck harvest activity.
Two salmon populations, Puget Sound chinook salmon and Hood Canal summer run chum salmon, were listed by the National Marine Fisheries Service on March 16, 1999 as threatened species under the federal Endangered Species Act. Critical habitat for summer run chum salmon populations include all marine, estuarine, and river reaches accessible to the listed chum salmon between Dungeness Bay and Hood Canal and within Hood Canal. The timing for summer run chum spawning is early September to mid-October. Out-migration of juveniles has been observed in Hood Canal during February and March, though out-migration may be as late as mid-April. The Itsami tract is outside of the critical habitat range for Hood Canal summer run chum salmon.
Critical habitat for Puget Sound chinook salmon includes all marine, estuarine and river reaches accessible to listed chinook salmon in Puget Sound. WDFW recognizes 27 distinct stocks of chinook salmon; 8 spring-run, 4 summer-run, and 15 summer/fall and fall-run stocks. The existence of an additional five spring-run stocks is in dispute. The majority of Puget Sound chinook salmon emigrate to the ocean as subyearlings.
Streams or tributaries near the Itsami geoduck tract are McAllister Creek and Nisqually River (approximately 8 miles from the tract), and Chambers Creek (approximately 16 miles from the tract). Two runs of Chinook salmon have been identified in the Nisqually River basin. The status of the Spring/Summer run of Chinook salmon in the Nisqually River basin is extinct (NMFS, Appendix E, TM-35, Chinook Status Review). The status of the natural Summer/Fall run of Chinook salmon in the Nisqually River basin is mixed native and non-native origin; a composite of wild, cultured, or unknown/unresolved production; and healthy with a 5-year geometric mean for total estimated escapement at 699 fish (NMFS, Appendix E, TM-35, Chinook Status Review).
The geographic separation (horizontal) of this tract from known spawning tributaries and vertical separation of geoduck harvest (deeper and seaward of the -18 ft. MLLW contour) from juvenile salmon rearing areas and migration corridors (upper few meters of the water column) reduces or eliminates potential impacts to salmon populations. Charles Simenstad of the University of Washington School of Fisheries stated that the

ENVIRONMENTAL ASSESSMENT OF PROPOSED GEODUCK HARVEST AT THE ITSAMI GEODUCK TRACT (#16300) Page 6 of 10
exclusionary principle of not allowing leasing/harvesting in water shallower than -18 ft. MLLW, the 2 foot vertically from elevation of the lower eelgrass margin, and within any regions of documented herring or forage fish spawning should under most conditions remove the influences of harvest induced sediment plumes from migrating salmon. Geoduck harvest should have no impact on salmon populations. On May 7, 2007 NOAA Fisheries Service announced listing of Puget Sound steelhead as “threatened” under ESA. This listing includes more than 50 stocks of summer- and winter-run steelhead. Steelhead share many of the same waters as Puget Sound Chinook salmon, which are already protected by ESA, and will benefit from shared conservation strategies. There are no identified streams or rivers in the vicinity of Henderson Inlet that support steelhead stocks. The horizontal separation between tributaries that support steelhead runs and the Itsami tract will assure that geoduck harvest will likely have no impact on steelhead populations. Green sturgeon has undergone ESA review in recent years, due to depressed populations. NOAA Fisheries Service produced an updated status review on February 22, 2005 and reaffirmed that the northern green sturgeon Distinct Population Segment (DPS) warranted listing as a Species of Concern, however proposed that the Southern DPS should be listed as Threatened under the ESA. NMFS published a final rule on April 7, 2006 listing the Southern DPS as threatened [pdf] (71 FR 17757), which took effect June 6, 2006. The green sturgeon critical habitat proposed for designation includes the outer coast of Washington within 110 meters (m) depth (including Willapa Bay and Grays Harbor) to Cape Flattery and the Strait of Juan de Fuca to its United States boundary. Puget Sound proper has been excluded from this critical habitat designation. The Itsami geoduck tract is outside of the critical habitat range of green sturgeon and geoduck harvest at this location will have no adverse effects on ESA recovery efforts for green sturgeon populations.
Invertebrates: Many different kinds of invertebrates were observed which are frequently found on geoduck beds were observed on this tract, including anemones, bivalves, cnidarians, crab, echinoderms, gastropods, nudibranchs, sea stars, crustaceans, and annelid worms (Table 6). Geoduck harvest has not been shown to have long-term adverse effects on these invertebrates. Geoduck harvest can depress some benthic invertebrates, however most of these animals recover within one year.
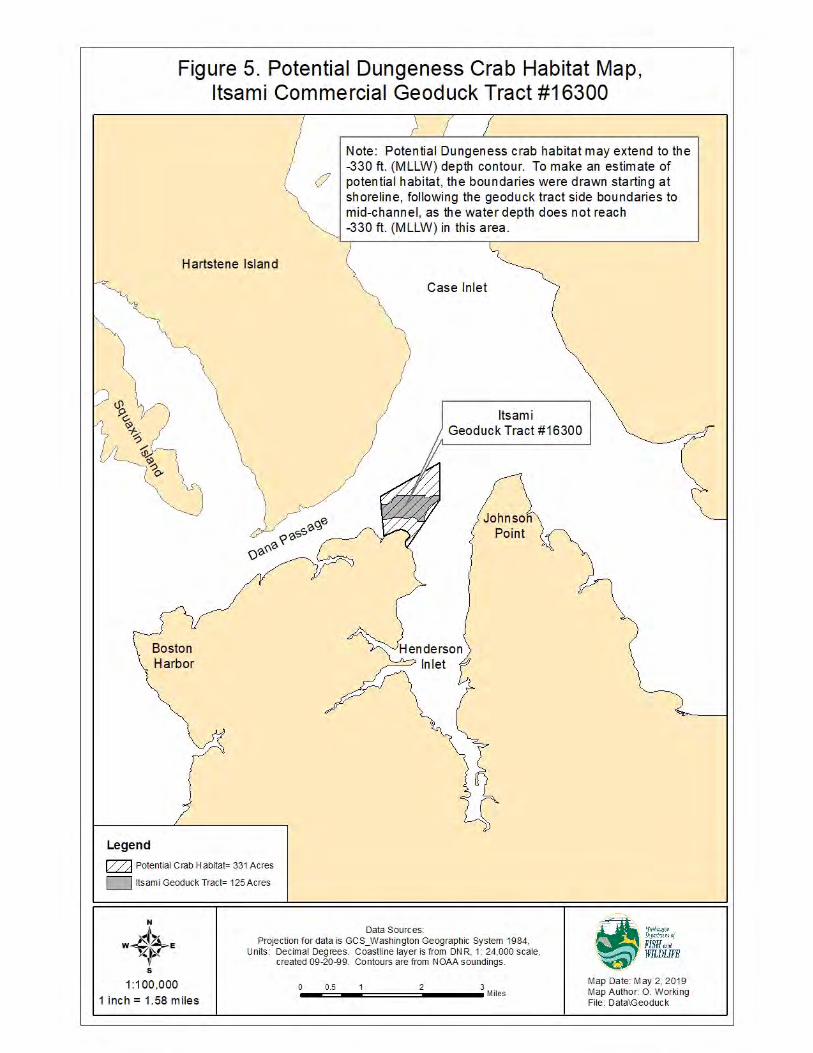
There is on-going interest from recreational and commercial crab fishers about interactions between geoduck harvest activity and Dungeness crab populations. Dr. Dave Armstrong at the University of Washington has determined that Dungeness crab utilize Puget Sound bottoms from the +1 foot level out to the minus 330 foot level. The California Department of Fish and Wildlife suggest that coastal Dungeness crab can be
ENVIRONMENTAL ASSESSMENT OF PROPOSED GEODUCK HARVEST AT THE ITSAMI GEODUCK TRACT (#16300) Page 7 of 10
found in waters as deep as 750 feet (www.dfg.ca.gov/marine/pdfs/response/crab.pdf). Jensen (2014) and WDFW information (personal comm. Don Velasquez, 7/23/15) confirm a similar vertical distribution in Puget Sound, though the highest densities are found between the 0 to 360 foot water depth contours. To determine the potential impacts to Dungeness crab, the percentage of substrate disturbed during fishing was calculated and compared to the entire crab habitat within the tract and shoreward of the tract to the +1 foot level and seaward out to –360 foot (MLLW) water depth contour (Figure 5, Potential crab habitat map). The entire crab habitat along this tract is approximately 331 acres. There are about 665,642 harvestable geoducks on this tract, from the 2018 survey estimate. With a harvest of 65 percent, the total number harvested would be 432,345 geoducks. Approximately 1.18 square feet of substrate is disturbed for every geoduck harvested, so 432,345 x 1.18 = 510,167 square feet of substrate. This equals about 11.71 acres. This is about 3.5 percent of the total available crab habitat in the vicinity of this tract. WDFW and DNR have studied the effects of geoduck harvest on the population of Dungeness crab at Thorndyke Bay in Hood Canal. The results of 4.6 years of study have shown no adverse effects on crab populations due to geoduck fishing. Based on the low amount of disturbance, and the lack of effects observed at the Thorndyke Bay study, we conclude that any effects on Dungeness crab populations will be very minor, if they occur at all. Aquatic Algae:
Large attached aquatic algae are not generally found in geoduck beds in large quantities. Light restriction often limits algae growth to areas shallower than where most geoduck harvest occurs. Aquatic algae observed during geoduck surveys includeLaminarian algae; Desmarestian algae; Ulva (sea lettuce); small foliose red algae, filamentous brown algae and diatoms (Table 7).
John Boettner and Tim Flint, from the WDFW Habitat Division, have stated that as long as geoduck fishing was restricted seaward of the eelgrass beds they have no concerns about the fishing. This was confirmed by WDFW Habitat Division who stated that the existing conditions in the fishery SEIS are sufficient to protect fish and wildlife habitat and natural resources. The shallow boundary of geoduck harvest is set at least two vertical feet seaward of the deepest eelgrass to protect all eelgrass from harvest activities. No eelgrass was observed during the 2011/2012 surveys. The shoreward boundary of this tract will be no shallower than the minus 18 foot water depth contour (MLLW), which should provide sufficient buffer for any eelgrass beds in the vicinity of the tract.

ENVIRONMENTAL ASSESSMENT OF PROPOSED GEODUCK HARVEST AT THE ITSAMI GEODUCK TRACT (#16300) Page 8 of 10
Marine Mammals: Several species of marine mammals, including seals, sea lions, and river otters may be observed in the vicinity of this geoduck tract. Killer whales (Orcinus orca) may also be observed in the vicinity of this tract, particularly between November – March. The Southern Resident stock of killer whales resides mainly in the San Juan Islands throughout spring and summer, but incursions south into Puget Sound occur more frequently during winter months (Brent Norberg, NOAA, pers. comm. 5/15/06). The Southern Resident stock of killer whales was listed as “endangered” under the federal Endangered Species Act (ESA) by the National Marine Fisheries Service on November 15, 2005. This is in addition to the designation of this stock in May 2003 as “depleted” under the Marine Mammal Protection Act. More information and a draft conservation plan for this stock can be found at the NOAA website (http://www.nwr.noaa.gov/Marine-Mammals/Whales-Dolphins-Porpoise/Killer-Whales/ESA-Act-Status/Listing-Final.cfm). Hand pick shellfish fisheries, like geoduck harvesting, are considered Category III under the Marine Mammal Authorization Program for Commercial Fisheries. This means that there is a “rare or remote” likelihood of marine mammal “take,” (Brent Norberg, NOAA, pers. comm. 5/15/06). Precautions should be taken by commercial divers, when marine mammals are in the area, to be aware of marine mammal movements and behavior to eliminate the remote risk of entanglement with diver hoses and lines.
Birds:
A variety of marine birds are common in Puget Sound and the general vicinity of this tract. The most significant of these are guillemots, murres, murrelets, grebes, loons, scoters, dabbing ducks, black brant, mergansers, buffleheads, cormorants, gulls, and terns. Blue heron, bald eagles, and osprey are regularly observed. Geoduck harvest does not appear to have any significant effect on these birds or their use of the waters where harvest occurs. A study by DNR and the WDFW was conducted at northern Hood Canal to learn the effects of geoduck fishing on bald eagles (Watson et al., 1995). A significant conclusion of this study is that geoduck clam harvest is unlikely to have any adverse impacts on bald eagle productivity.
Other uses:
Adjacent Upland Use:
The upland property at Henderson Inlet, along the Itsami tract is designated a Rural along the western shoreline and Conservancy along the eastern shoreline. To minimize possible disturbance to adjacent residents, harvest vessels are not allowed within 200 yards of the ordinary high tide line (OHT) or shallower than -18 feet (MLLW) whichever is farther seaward. Harvest is only allowed during daylight hours, and no harvest is allowed on Saturdays, Sundays, or state holidays.

ENVIRONMENTAL ASSESSMENT OF PROPOSED GEODUCK HARVEST AT THE ITSAMI GEODUCK TRACT (#16300) Page 9 of 10
The only visual effect of harvest is the presence of the harvest vessels on the tract. These 35-40 foot boats are anchored during harvest and all harvest is conducted out of sight by divers. Noise from the boats, compressors and pumps may not exceed 50 dBA measured 200 yards from the noise source, 5 dBA below the state noise standard.
Fishing:
Some recreational salmon fishing could occur seasonally in proximity to the geoduck bed. In recent years, commercial and recreational crab fishing effort has increased in this area. The WDFW Sport Fishing Rules pamphlet describes seasons, size limits, daily limits, specific closed areas, and rules for salmon and other marine fish species. The fishing, which does occur, should not create any problems for the geoduck harvesting effort in the area.
Geoduck fishing on this tract is managed in coordination with the southern Puget Sound treaty tribes through annual state/tribal harvest management plans. The non-Indian geoduck fishery should not be in conflict with any concurrent tribal fisheries.
Navigation:
Dana Passage is a frequently used navigational route for vessels transiting between ports in southern Puget Sound. The Itsami Ledge area is avoided by larger vessels since the water depths become shallow near the navigation marker. Most vessel traffic should be northerly of the geoduck tract area. Geoduck harvesting at this site should not result in any significant navigational conflicts. The Department of Natural Resources will notify the local boating community prior to geoduck harvests.
Summary: Continued commercial geoduck harvest is proposed for the Itsami geoduck tract located along the northern shorelines at the mouth of Henderson Inlet. The tract was most recently surveyed in the year 2018. The anticipated environmental impacts of this harvest are within the range of conditions discussed in the Final Supplemental Environmental Impact Statement (2001) for the commercial geoduck clam fishery. To reduce possible impacts to baitfish and eelgrass, harvest will be deeper and seaward of the -18 foot (MLLW) water depth contour. No significant impacts are expected from this harvest. File: 210816_Itsami_EA_16300.doc


Page 1 of 3
EXPLANATION OF SURVEY DATA TABLES
The geoduck survey data for each tract is reported in seven computer-generated tables. These tables contain specific information gathered from transect and dig samples and diver observations. The following is an explanation of the headings and codes used in these tables. Tract Summary
This table is a general summary of survey information for the geoduck tract including estimates of Tract Size in acres, average geoduck Density in animals per sq.ft., Total Tract Biomass in pounds with statistical confidence, and Total Number of Geoducks. Mass estimators are reported in average values for Whole Weight and Siphon Weight in pounds. Geoduck siphon weights are also reported in Siphon Weight as a percentage of Whole Weight. Biomass estimates are adjusted for any harvest that may occur subsequent to the pre-fishing survey.
Digging Difficulty
This table presents a station-by-station evaluation of the factors contributing to the difficulty of digging geoduck samples with a 5/8” inside nozzle diameter water jet. Codes for the overall subjective summary of the digging difficulty are given in the Difficulty column. An explanation of the codes for the dig difficulty follows:
Code Degree of Difficulty Description
0 Very Easy Sediment conducive to quick harvest. 1 Easy Significant barrier in substrate to inhibit digging. 2 Some difficulty Substrate may be compact or contain gravel, shell or
clay; most geoducks still easy to dig. 3 Difficult Most geoducks were difficult to dig, but most
attempts were successful. 4 Very Difficult It was laborious to dig each geoduck. Unable to dig some geoducks. 5 Impossible Divers could not remove geoducks from the substrate.
Abundance refers to the relative geoduck abundance; a zero (0) indicates that geoducks were very sparse, a one (1) indicates that they were moderately abundant and a two (2) indicates that they were very abundant. Depth refers to the depth that the geoducks were found in the substrate. A zero (0) indicates that they were shallow, a one (1) indicates that they were moderately deep and a two (2) indicates that they were very deep. The columns labeled Compact, Gravel, Shell, Turbidity and Algae refer to factors that contribute to digging difficulty by interfering with the digging process. A zero (0) in one of these columns indicates that the factor was not a problem, a one (1) indicates that the

Page 2 of 3
factor caused moderate difficulty and a two (2) indicates that the factor caused a significant amount of difficulty when digging. Compact refers to the compact or sticky nature of a muddy substrate. Gravel and Shell refer to the difficulty caused by these substrate types. Turbidity refers to the turbidity within the water near the dig hole caused by the digging activity. High turbidity makes it difficult to find the geoduck siphon shows. The difficulty of digging associated with turbidity varies with the amount of tidal current present. Therefore, the turbidity rating refers only to the conditions occurring when the sample was collected. Algae refers to algal cover, which also makes it difficult for the diver to find geoduck siphon shows. Because algal cover varies seasonally, this value only applies to the conditions when the sample was collected. The Commercial column gives a subjective assessment of whether or not it would be feasible to harvest geoducks on a commercial basis at the given station.
Transect Water Depths, Geoduck Densities and Substrate Observations
This table reports findings for each transect. Start Depth and End Depth (corrected to MLLW) are given for each transect. Geoduck Density is reported as the average number of geoducks per square foot for each 900 square foot transect. Substrate Type and Substrate Rating refer to evaluations of the substrate surface. A two (2) rating indicates that the substrate type is predominant. A one (1) rating indicates the substrate type was present.
Geoduck Weights and Proportion Over 2 Pounds
This table summarizes the size and quality of the geoducks at each of the stations where dig samples were collected. Weight values for any geoduck dig samples that were damaged during sampling to the extent that water loss occurred, are excluded from calculations. The Number Dug column lists the number of geoducks collected. The Avg. Whole Weight (lbs.) column gives the average sample weight of whole geoduck clams for each dig station. The Avg. Siphon Weight (lbs.) column gives the average weight of the siphons of the geoducks for each dig station. The percentage of geoducks greater than two pounds is given in the % Greater than 2 lbs. column.
Transect - Corrected Geoduck Count and Position Table
This table reports the diver Corrected Count, the geoduck siphon Show Factor used to correct the count, and the Latitude/Longitude position of the start point of each survey transect. Raw (observed) siphon counts are “corrected” by dividing diver observed counts for each transect with a siphon “show” factor (See WDFW Tech. Report FPT00-01 for explanation of show factor) to estimate the sample population density. Transect positions are reported in degrees and decimal minutes to the thousandth of a minute, datum WGS84.

Page 3 of 3
Most Common and Obvious Animals Observed This table summarizes the animals, other than geoducks, that were observed during the geoduck survey, and reports the total number of transects on which they were present (# of Transects Where Observed). This is qualitative presence/absence data only, and only animals that can be readily seen by divers at or near the surface of the substrate are noted. The Group designation allows for the organization of similar species together in the table. Whenever possible, the scientific name of the animal is listed in Taxonomer, and a generally accepted Common Name is also listed. Many variables may make it difficult for divers to notice other animals on the tract, including but not limited to poor visibility, diver skill, animals fleeing the divers, animal size, or cryptic appearance or behavior (in crevasses or under rocks).
Most Common and Obvious Algae Observed
This table summarizes marine algae observed during the geoduck survey, and reports the total number of transects on which they were seen (# of Transects Where Observed). This is qualitative presence/absence data only, and only for macro algae, with the exception of diatoms. At high densities diatoms form a “layer” on or above the substrate surface that is readily visible and obvious to divers. Other types of phytoplankton are not sampled and are rarely noted. Whenever possible, the scientific name or a general taxonomic grouping of each plant is listed in Taxonomer.
Last Updated: April 14, 2020 S:\FP\FishMgmt\Geoduck\EnvironmentalAssessmentReports\Forms\EAcodesexplanation_7tables.doc

Table 1. GEODUCK TRACT SUMMARYItsami geoduck tract # 16300.
Tract Name ItsamiTract Number 16300Tract Size (acres)a 125Density of geoducks/sq.ftb 0.086Total Tract Biomass (lbs.)b 1,061,725Total Number of Geoducks on Tractb 465,943Confidence Interval (%) 23.84%
Mean Geoduck Whole Weight (lbs.) 2.28Mean Geoduck Siphon Weight (lbs.) 0.41Siphon Weight as a % of Whole Weight 18%
Number of 900 sq.ft. Transect Stations 56Number of Geoducks Weighed 92
a. Tract area is between the -18 ft. and -70 ft. (MLLW) water depth contours
Generation Date: August 16, 2021Generated By: O. Working, WDFWFile: S\FP\FishMgmt\Geoduck\EAs
b. Biomass is based on the 2018 WDFW Pre-fishing geoduck survey biomass of 1,515,642 lbs. minus harvest of 453,917 lbs. through August 16, 2021

Table 2: DIGGING DIFFICULTY TABLEItsami geoduck tract #16300, 2011 and 2012 WDFW and Squaxin Tribe pre-fishing surveys.
Dig Dig Difficulty Abundance Depth Compact Gravel Shell Turbidity Algae CommercialDate Station (0-5) (0-2) (0-2) (0-2) (0-2) (0-2) (0-2) (0-2) (Y/N)
6/4/2018 8 3 1 1 1 1 1 0 0 Y6/4/2018 10 2 1 1 0 0 1 1 0 Y6/4/2018 17 3 2 1 1 1 2 0 0 Y6/4/2018 20 1 2 1 1 0 0 0 0 Y6/4/2018 42 4 2 1 0 1 2 1 0 Y6/4/2018 53 2 2 1 2 0 0 0 0 Y6/5/2018 30 1 1 1 1 0 0 0 0 Y6/5/2018 35 2 2 0 1 0 1 1 0 Y6/5/2018 47 1 2 0 1 0 1 0 0 Y
Generated On: August 16, 2021Generated By: O. Working, WDFWFile: S\FP\FishMgmt\Geoduck\EAs

Table 3: TRANSECT WATER DEPTHS, GEODUCK DENSITIES, AND SUBSTRATE OBSERVATIONSItsami geoduck tract #16300, 2018 WDFW pre-fishing survey.
Survey Start Depth End Depth Geoduck Density Date Transect (ft.) a (ft.) a (no. / sq.ft.) b sand mud shell cobble gravel hardpan boulder
4/30/2018 1 19 21 0.1018 24/30/2018 2 21 23 0.0189 24/30/2018 3 23 26 0.0138 24/30/2018 4 26 30 0.0113 24/30/2018 5 31 37 0.0239 24/30/2018 6 37 40 0.0352 24/30/2018 7 40 44 0.1659 24/30/2018 8 45 48 0.1923 24/30/2018 9 49 50 0.2187 2 14/30/2018 10 18 18 0.2426 24/30/2018 11 18 23 0.0251 2 1 14/30/2018 12 23 24 0.1056 2 1 14/30/2018 13 24 27 0.1194 2 14/30/2018 14 26 27 0.2011 2 14/30/2018 15 27 26 0.0616 2 1 15/1/2018 16 25 27 0.0630 2 1 1 15/1/2018 17 28 30 0.1488 2 1 1 1 15/1/2018 18 31 33 0.1019 25/1/2018 19 33 38 0.3619 25/1/2018 20 38 39 0.2211 2 15/1/2018 21 39 37 0.0054 2 1 15/1/2018 22 37 40 0.0255 2 1 1 15/1/2018 23 40 49 0.4115 2 1 15/1/2018 24 49 54 0.4758 2 1 15/1/2018 25 42 34 0.0241 2 1 15/1/2018 26 34 32 0.1233 2 1 1 15/1/2018 27 32 37 0.2386 2 1 15/1/2018 28 36 38 0.1300 2 15/1/2018 29 38 39 0.1139 25/1/2018 30 39 40 0.1742 25/1/2018 31 39 43 0.1608 25/1/2018 32 43 48 0.0791 2 15/1/2018 33 48 47 0.1193 25/2/2018 34 18 22 0.0330 25/2/2018 35 22 32 0.0473 2 1 15/2/2018 36 32 40 0.0502 1 25/2/2018 37 40 45 0.0559 25/2/2018 38 46 47 0.0717 25/2/2018 39 47 50 0.0516 25/2/2018 40 51 47 0.0502 25/2/2018 41 47 43 0.1792 1 25/2/2018 42 59 61 0.3226 2 15/2/2018 43 61 63 0.1520 2 1 1
Substrate c

Table 3. Continued
Survey Start Depth End Depth Geoduck Density Date Transect (ft.) a (ft.) a (no. / sq.ft.) b sand mud shell cobble gravel hardpan boulder
5/2/2018 44 63 65 0.0616 2 1 15/2/2018 46 64 66 0.0000 2 15/3/2018 47 18 29 0.2669 25/3/2018 48 29 30 0.1701 2 15/3/2018 49 31 36 0.0499 2 1 15/3/2018 50 36 40 0.0390 2 15/3/2018 51 40 43 0.0780 2 15/3/2018 52 44 50 0.0640 2 1 15/3/2018 53 70 41 0.1623 25/3/2018 54 41 37 0.1873 25/3/2018 55 37 28 0.2122 2 1 15/3/2018 56 28 20 0.0000 1 1 1 2 1
a. All depths are corrected to mean lower low water (MLLW)b. Densities were calculated using a daily siphon show factorc. Substrate ratings: 1 = present; 2 = predominant; blank = not observed
Generated On: August 16, 2021Generated By: O. Working, WDFWFile: S\FP\FishMgmt\Geoduck\EAs
Substrate c

Table 4: TRANSECT CORRECTED GEODUCK COUNT AND POSITION TABLEItsami geoduck tract #16300, 2018 WDFW pre-fishing survey.
Survey Date Transect Corrected Count Show Factor a
4/30/2018 1 92 0.884 47 10.006 122 50.8044/30/2018 2 17 0.884 47 10.032 122 50.7854/30/2018 3 12 0.884 47 10.059 122 50.7724/30/2018 4 10 0.884 47 10.082 122 50.7594/30/2018 5 21 0.884 47 10.105 122 50.7434/30/2018 6 32 0.884 47 10.130 122 50.7254/30/2018 7 149 0.884 47 10.151 122 50.7054/30/2018 8 173 0.884 47 10.173 122 50.6944/30/2018 9 197 0.884 47 10.196 122 50.6764/30/2018 10 218 0.884 47 10.031 122 50.6164/30/2018 11 23 0.884 47 10.045 122 50.5794/30/2018 12 95 0.884 47 10.058 122 50.5524/30/2018 13 107 0.884 47 10.062 122 50.5864/30/2018 14 181 0.884 47 10.076 122 50.5614/30/2018 15 55 0.884 47 10.093 122 50.5335/1/2018 16 57 0.829 47 10.117 122 50.5105/1/2018 17 134 0.829 47 10.148 122 50.5075/1/2018 18 92 0.829 47 10.177 122 50.5005/1/2018 19 326 0.829 47 10.207 122 50.4895/1/2018 20 199 0.829 47 10.238 122 50.4735/1/2018 21 5 0.829 47 10.267 122 50.4645/1/2018 22 23 0.829 47 10.293 122 50.4625/1/2018 23 370 0.829 47 10.320 122 50.4575/1/2018 24 428 0.829 47 10.355 122 50.4515/1/2018 25 22 0.829 47 10.368 122 50.3475/1/2018 26 111 0.829 47 10.343 122 50.3515/1/2018 27 215 0.829 47 10.319 122 50.3575/1/2018 28 117 0.829 47 10.288 122 50.3635/1/2018 29 103 0.829 47 10.258 122 50.3655/1/2018 30 157 0.829 47 10.224 122 50.3685/1/2018 31 145 0.829 47 10.194 122 50.3755/1/2018 32 71 0.829 47 10.164 122 50.3795/1/2018 33 107 0.829 47 10.139 122 50.3825/2/2018 34 30 0.775 47 10.000 122 50.3915/2/2018 35 43 0.775 47 10.028 122 50.3755/2/2018 36 45 0.775 47 10.050 122 50.3605/2/2018 37 50 0.775 47 10.076 122 50.3475/2/2018 38 65 0.775 47 10.096 122 50.3375/2/2018 39 46 0.775 47 10.118 122 50.3225/2/2018 40 45 0.775 47 10.139 122 50.3165/2/2018 41 161 0.775 47 10.165 122 50.3055/2/2018 42 290 0.775 47 10.228 122 50.714
Latitude b Longitude b

Table 4. Continued
Survey Date Transect Corrected Count Show Factor a
5/2/2018 43 137 0.775 47 10.250 122 50.6995/2/2018 44 55 0.775 47 10.277 122 50.6915/2/2018 45 13 0.775 47 10.300 122 50.6805/2/2018 46 0 0.775 47 10.324 122 50.6655/3/2018 47 240 0.712 47 10.016 122 50.8645/3/2018 48 153 0.712 47 10.042 122 50.8695/3/2018 49 45 0.712 47 10.074 122 50.8685/3/2018 50 35 0.712 47 10.103 122 50.8625/3/2018 51 153 0.712 47 10.125 122 50.8555/3/2018 52 45 0.712 47 10.147 122 50.8465/3/2018 53 35 0.712 47 10.269 122 50.1475/3/2018 54 70 0.712 47 10.284 122 50.1625/3/2018 55 58 0.712 47 10.296 122 50.2055/3/2018 56 146 0.712 47 10.308 122 50.241
a. Daily siphon show factor was used to correct combined geoduck countsb. Latitude and longitude are in degrees and decimal minutes and are in WGS84 datum
Generated On: August 16, 2021Generated By: O. Working, WDFWFile: S\FP\FishMgmt\Geoduck\EAs
Latitude b Longitude b
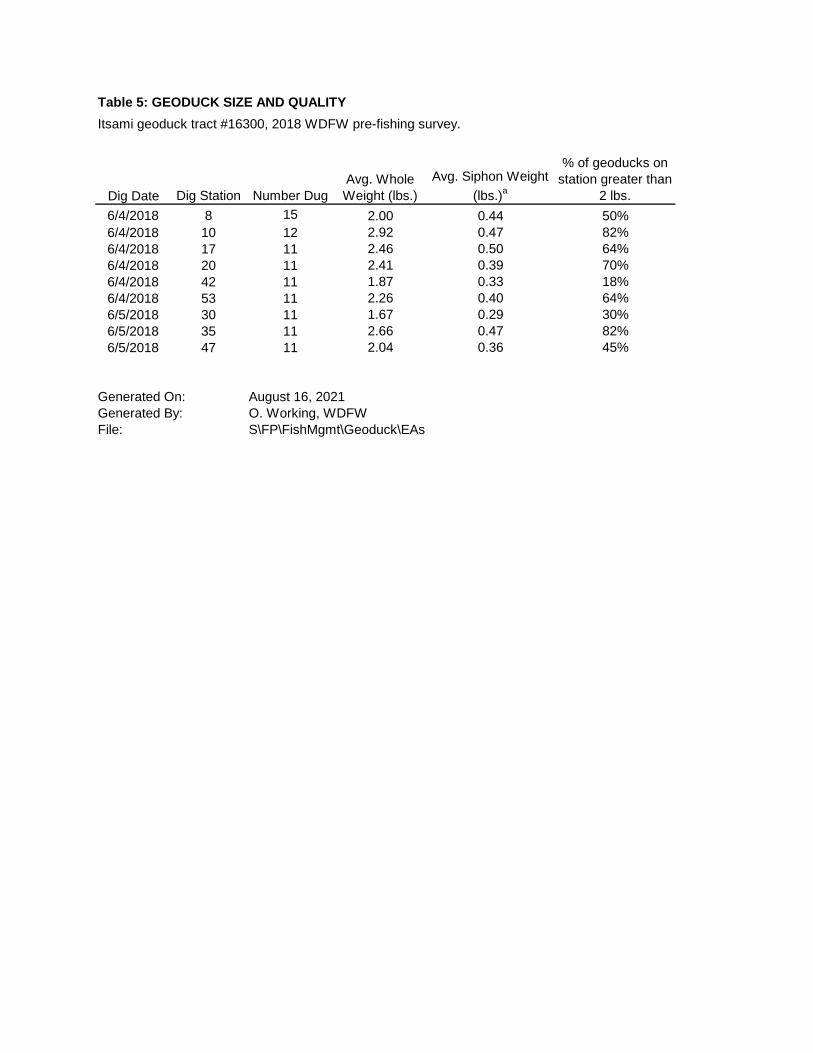
Table 5: GEODUCK SIZE AND QUALITYItsami geoduck tract #16300, 2018 WDFW pre-fishing survey.
Dig Date Dig Station Number DugAvg. Whole Weight (lbs.)
Avg. Siphon Weight (lbs.)a
% of geoducks on station greater than
2 lbs.6/4/2018 8 15 2.00 0.44 50%6/4/2018 10 12 2.92 0.47 82%6/4/2018 17 11 2.46 0.50 64%6/4/2018 20 11 2.41 0.39 70%6/4/2018 42 11 1.87 0.33 18%6/4/2018 53 11 2.26 0.40 64%6/5/2018 30 11 1.67 0.29 30%6/5/2018 35 11 2.66 0.47 82%6/5/2018 47 11 2.04 0.36 45%
Generated On: August 16, 2021Generated By: O. Working, WDFWFile: S\FP\FishMgmt\Geoduck\EAs

Table 6: MOST COMMON AND OBVIOUS ANIMALS OBSERVEDItsami geoduck tract #16300, 2018 WDFW pre-fishing survey.
# of Transects where Observed Group Common Name Taxonomer
32 ANEMONE BURROWING ANEMONE Pachycerianthus fimbriatus19 ANEMONE PLUMED ANEMONE Metridium spp.34 ANEMONE STRIPED ANEMONE Urticina spp.6 BIVALVE HARDSHELL CLAMS Veneridae spp.3 BIVALVE HEART COCKLE Clinocardium nuttalli40 BIVALVE HORSE CLAM Tresus spp.2 BIVALVE JINGLESHELL OYSTER Pododesmus macrochisma17 BIVALVE PIDDOCK Unspecified Pholadidae44 CNIDARIA SEA PEN Ptilosarcus gurneyi11 CNIDARIA SEA WHIP Stylatula elongata10 CRAB DECORATOR CRAB Oregonia gracilis4 CRAB GRACEFUL CRAB Cancer gracilis40 CRAB HERMIT CRAB Unspecified hermit crab28 CRAB RED ROCK CRAB Cancer productus1 CUCUMBER ORANGE CUCUMBER Cucumaria miniata3 CUCUMBER SEA CUCUMBER Parastichopus californicus1 FISH BAY PIPEFISH Syngnathus leptorhynchus2 FISH COD Gadid spp.1 FISH FLATFISH Unspecified flatfish1 FISH SAND LANCE Ammodytes hexapterus1 FISH SAND SOLE Psettichthys melanostictus10 FISH SANDDAB Citharichthys spp.16 FISH SCULPIN Unspecified Cottidae6 FISH STARRY FLOUNDER Platichthys stellatus7 GASTROPOD MOON SNAIL Polinices lewisii26 GASTROPOD MOON SNAIL EGGS Polinices lewisii egg case27 GASTROPOD NASSA SNAILS Nassarius spp.3 GASTROPOD NUDIBRANCH Unspecified nudibranch5 MISC SPONGE Unspecified Porifera16 NUDIBRANCH ARMINA Armina californica5 NUDIBRANCH DENDRONOTUS Dendronotus spp.2 NUDIBRANCH DIRONA Dirona albolineata2 NUDIBRANCH ROSY TRITONIA Tritonia diomedea2 SEA STAR BLOOD STAR Henricia leviuscula3 SEA STAR BRITTLE STAR Unspecified brittle star2 SEA STAR FALSE OCHRE STAR Evasterias troschelli12 SEA STAR LEATHER STAR Dermasterias imbricata1 SEA STAR RAINBOW STAR Orthasterias koehleri4 SEA STAR SHORT-SPINED STAR Pisaster brevispinus1 SHRIMP SHRIMP Unspecified shrimp29 WORM ROOTS Chaetopterid polychaete tubes35 WORM SABELLID TUBE WORM Sabellid spp.2 WORM TEREBELLID TUBE WORM Terebellid spp.
Generated On: August 16, 2021Generated By: O. Working, WDFWFile: S\FP\FishMgmt\Geoduck\EAs

Table 7: MOST COMMON AND OBVIOUS ALGAE OBSERVEDItsami geoduck tract #16300, 2018 WDFW pre-fishing survey.
# of Transects where observed Taxonomer
22 Desmarestia spp.11 Diatoms1 Filamentous brown algae28 Laminaria spp.51 Small red algae33 Ulva spp.
Generated On: August 16, 2021Generated By: O. Working, WDFWFile: S\FP\FishMgmt\Geoduck\EAs