environmental assessment of digestate treatment ... · pdf filefrom a wide range of...
TRANSCRIPT

Waste Management xxx (2015) xxx–xxx
Contents lists available at ScienceDirect
Waste Management
journal homepage: www.elsevier .com/locate /wasman
Environmental assessment of digestate treatment technologies usingLCA methodology
http://dx.doi.org/10.1016/j.wasman.2015.05.0070956-053X/� 2015 Elsevier Ltd. All rights reserved.
⇑ Corresponding author at: Peruvian LCA Network, Department of Engineering,Pontificia Universidad Católica del Perú (PUCP), Avenida Universitaria 1801, SanMiguel 32, Lima, Peru. Tel.: +51 6262000 4765.
E-mail address: [email protected] (I. Vázquez-Rowe).
Please cite this article in press as: Vázquez-Rowe, I., et al. Environmental assessment of digestate treatment technologies using LCA methodologyManagement (2015), http://dx.doi.org/10.1016/j.wasman.2015.05.007
Ian Vázquez-Rowe a,b,c,⇑, Katarzyna Golkowska a, Viooltje Lebuf d, Céline Vaneeckhaute e, Evi Michels e,Erik Meers e, Enrico Benetto a, Daniel Koster a
a Environmental Research and Innovation (ERIN), Luxembourg Institute of Science and Technology (LIST), 5, avenue des Hauts-Fourneaux, 4362 Esch/Alzette, Luxembourgb Peruvian LCA Network, Department of Engineering, Pontificia Universidad Católica del Perú (PUCP), Avenida Universitaria 1801, San Miguel 32, Lima, Peruc Department of Chemical Engineering, University of Santiago de Compostela, Rúa Lope Gómez de Marzoa s/n, 15782 Santiago de Compostela, Spaind Flemish Coordination Centre for Manure Processing, Abdijbekestraat 9, 8200 Brugge, Belgiume Laboratory of Analytical and Applied Ecochemistry, Faculty of Bioscience Engineering, University of Ghent, Coupure Links 653, 9000 Ghent, Belgium
a r t i c l e i n f o
Article history:Received 15 December 2014Accepted 6 May 2015Available online xxxx
Keywords:AmmoniaDigestate spreadingDigestate treatmentDried digestateFlandersLife Cycle Assessment
a b s t r a c t
The production of biogas from energy crops, organic waste and manure has augmented considerably theamounts of digestate available in Flanders. This has pushed authorities to steadily introduce legislativechanges to promote its use as a fertilising agent. There is limited arable land in Flanders, which entailsthat digestate has to compete with animal manure to be spread. This forces many anaerobic digestionplants to further treat digestate in such a way that it can either be exported or the nitrogen be removed.Nevertheless, the environmental impact of these treatment options is still widely unknown, as well as theinfluence of these impacts on the sustainability of Flemish anaerobic digestion plants in comparison toother regions where spreading of raw digestate is allowed. Despite important economic aspects that mustbe considered, the use of Life Cycle Assessment (LCA) is suggested in this study to identify the environ-mental impacts of spreading digestate directly as compared to four different treatment technologies.Results suggest relevant environmental gains when the digestate mix is treated using the examined con-version technologies prior to spreading, although important trade-offs between impact categories wereobserved and discussed. The promising results of digestate conversion technologies suggest that furtherLCA analyses should be performed to delve into, for instance, the appropriateness to shift to nutrientrecovery technologies rather than digestate conversion treatments.
� 2015 Elsevier Ltd. All rights reserved.
1. Introduction
Biogas production across Europe has experienced a rapidgrowth throughout many nations (Hamelin et al., 2011). Theannual primary biogas production in the European Union (EU)has increased by 106% from 4899 ktoe in 2006 to 10,085 ktoe in2011 (EUROBSERV’ER, 2012). This proliferation has become anextended practice in many farms in countries like Germany, Italyor Belgium (BMU, 2009; Fabbri et al., 2010), who have benefitedfrom a wide range of agricultural and livestock substrates (e.g.manure, agricultural waste, energy crops, etc.) to produce energy.The main reasons for this growth are linked to a wide range ofenvironmental benefits (Rehl and Müller, 2011). For instance, the
high moisture content of fresh wastes inhibits the use of alterna-tive conversion processes, such as thermochemical processes. Inaddition, from a waste treatment perspective, microbial actionallows a substantial reduction of pathogens in the waste stream,as well as an important decrease in the chemical oxygen demand(COD), nitrates or organic nitrogen among other relevant parame-ters (Lauwers et al., 2013).
In addition, the production of biogas from livestock slurry hasshown to be a technique that has a great potential for the reductionof greenhouse gas (GHG) emissions (Hamelin et al., 2011). Thischaracteristic, added to its versatile application possibilitiesincluding direct substitution of natural gas, its use as CHP or as aliquid fuel in the transportation sector, makes biogas a key energycarrier source in the renewable energy strategy in many Europeancountries, such as Belgium (Astrup et al., 2011). However, in asimilar way to most novel energy production technologies, biogasproduction is not exempt of certain drawbacks, which range fromoperational issues to waste management (Berglund and Borjesson,
. Waste

1 Situation C2, following the ILCD Handbook for LCA, includes studies thataccording to their goal definition do not include any interaction with other systems.In other words, substitution processes that may occur, or the consequences of a shockon a specific process, which is a function that is foreseen in consequential LCA, are notincluded in this study.
2 I. Vázquez-Rowe et al. / Waste Management xxx (2015) xxx–xxx
2006; Mezzullo et al., 2013). The concentration of biogasplants digesting organic waste, energy crops and/or livestockmanure in regions with intensive livestock farming has led to alocal surplus of one of its by-products: digestate. Consequently,these areas are prone to experience an excess of nutrients on thefields if the surplus is not managed correctly (Prapasponga et al.,2010; Rehl and Müller, 2011). This scenario has been reported insome agricultural regions in Europe, such as Belgium, theNetherlands or certain regions of Italy or Germany (Brouwer et al.,1999).
In Flanders (Belgium) high levels of nitrate in water bodies werealready identified two decades ago. At the time this problem wasmainly attributed to local manure overproduction associated withthe intensive livestock activities on limited arable land (Lebuf et al.,2012). The introduction of Nitrogen Vulnerable Zones in the frame-work of the European Nitrate Directive (European Council, 1991),limiting the allowed N spreading concentrations, only partiallysolved the problem. The parallel development of biogas plants,not only digesting manure but also organic waste and energyplants, additionally increased the available digestate amounts(and organic N amounts). In 2007, Flemish authorities enforcedcompulsory treatment of manure and digestate (Flemish ManureDecree, 2007) and subsequent export of the treated products (orN mineralisation) to prevent further nitrogen concentration inthe soils and aquifers. Consequently, anaerobic digestion plantsin Flanders are currently focusing their efforts on providing ade-quate technologies to process digestate, thereby avoiding thedirect spreading of raw digestate.
To reach this goal, research and implementation of digestatetreatment technologies, which reduce the water content and nutri-ent leakage, has gained importance in Flanders in order to produceeasily transportable mineral concentrates (Forbes et al., 2005; Rehland Müller, 2011). This transition allows in some cases to forwardsurplus minerals to regions with nutrient shortages (Forbes et al.,2005; Holm-Nielsen et al., 2009) or, in others, the use of productswith low ammonia content in Flemish fields (Decree BS13.05.2011,2011). Given the strategic importance of these conversion tech-nologies to reduce the environmental risks linked to the excessof nutrients in this region, the use of environmental managementtools appears as an appropriate mechanism to evaluate the suit-ability of these technologies.
In fact, the environmental profile of these digestate treatmenttechnologies have been previously analysed using Life CycleAssessment – LCA (Rehl and Müller, 2011; Laurent et al., 2014),an environmental management tool that consists of the evaluationof the potential environmental impacts that are generated by aproduct or process during its life-cycle (ISO, 2006). Hence, theuse of LCA in this specific context arises as a useful decisiontool for policy makers and agricultural and farming industrystakeholders when assessing these technologies. The main aim ofthe study is to assist in selecting environmentally sustainabletreatment technologies to deal with digestate. More specifically,this manuscript focuses on a comparative environmentalassessment of a series of digestate treatment systems. Thesecomparisons are intended to be of support in public policies inorder to steer digestate management towards desirableenvironmental targets, as well as aid the sector with identifyingkey environmental indicators. For the purpose of the study, severaloperational full-scale treatment plants in Flanders (Belgium) havebeen analysed, as well as one future plant scenario, using theammonia stripping technology. The environmental analysis wasbased on the technology systems but also involves a certain levelof assumptions and theoretical scenarios (e.g. for transport,spreading, input characteristics, energy supply) to reach a higherlevel of transparency and transferability of the results to otherregions in North-West Europe (NWE).
Please cite this article in press as: Vázquez-Rowe, I., et al. Environmental assesManagement (2015), http://dx.doi.org/10.1016/j.wasman.2015.05.007
2. Materials and methods
2.1. Goal and scope definition
The main goal of this study is to analyse the environmentalimpacts linked to a set of digestate treatment technologies andthe subsequent use of the output products as compared to thedirect spreading of digestate on Flemish agricultural fields.Consequently, the results expected will allow a thorough evalua-tion of the environmental benefits and drawbacks linked to treat-ing digestate, as well as a discussion on how different treatmentoptions and digestate characteristics may influence the final out-comes of the study. Given the steady-state conditions in whichthe different treatment plants were examined, without delvinginto the consequences that these systems may have on other pro-duction systems, a retrospective (i.e. attributional) LCA approachwas selected for the evaluation, in accordance with situation C21
in the decision support framework suggested by the ILCD guidelines(ILCD, 2010).
The main function of the system is to analyse the environmentalimpacts occurring during the digestate treatment process and sub-sequent spreading on fields of the final products in Flanders, orabroad when appropriate. The retrospective nature of the studyallowed the modelling of comparable functions between the differ-ent digestate treatment scenarios. Therefore, the selected func-tional unit (FU) was 1 tonne of digestate product entering theplant ready to be processed. This FU selection is in accordance withprevious studies analysing the environmental profile of productsresulting from digestate treatment (Rehl and Müller, 2011;Golkowska et al., 2012). In addition, this choice was consideredbased on an environmental improvement perspective to identifythe potential benefits of substituting direct spreading of digestateby the conversion processes described in Section 2.2.Nevertheless, it should be noted, as discussed in Section 4.2, thatthe direct comparability of the different treatment plants was con-strained by the variable characteristics of the incoming digestateused in each plant.
2.2. Definition of treatment systems
A total of five different digestate treatment systems wereassessed. A brief description of each of the different treatmenttechnologies is provided below. Additionally, a baseline scenario(BAS), which depicts the direct spreading of the digestate onFlemish agricultural fields if legislation would allow this practice(see Fig. 1), was created. Given the different dry matter (DM) con-tents of the digestate used in the different treatment plants, theBAS were modelled as follows: (i) BAS-1, in which a mix of rawdigestate and dried digestate with a DM content of 55.6% isassumed as an input, for direct comparability with the scenariodescribed in Section 2.2.1; (ii) BAS-2, with the input indicating aDM content of 25.5% (i.e. solid fraction – SF), to allow comparabil-ity with the composting scenario (Section 2.2.2); and (iii) BAS-3(DM = 8.9%; raw digestate), to compare with the final two scenar-ios (Sections 2.2.3 and 2.2.4).
2.2.1. Digestate drying and pelletizing (D&P)The digestate drying and pelletizing (D&P) plant treats an
annual amount of 99,000 t year�1 of digestate. This incoming pro-duct is composed of a mixture of 50% digestate SF and 50% of dried
sment of digestate treatment technologies using LCA methodology. Waste

A
RAW DIGESTATE TRANSPORT
SPREADING ON THE LOCAL
FIELDS
Baseline Scenario II: Spreading of solid frac�on digestate
STORAGE
Compos�ng (Co)
SOLID FRACTIONDIGESTATE
TUNNELCOMPOSTING
COMPOST
SPREADING ON THE FIELDS
STORAGE
B
ACID WASHERMINERAL FERTILIZER(NH4)2SO4 SOLUTION
PROCESS AIR
TRANSPORT TO FRANCE
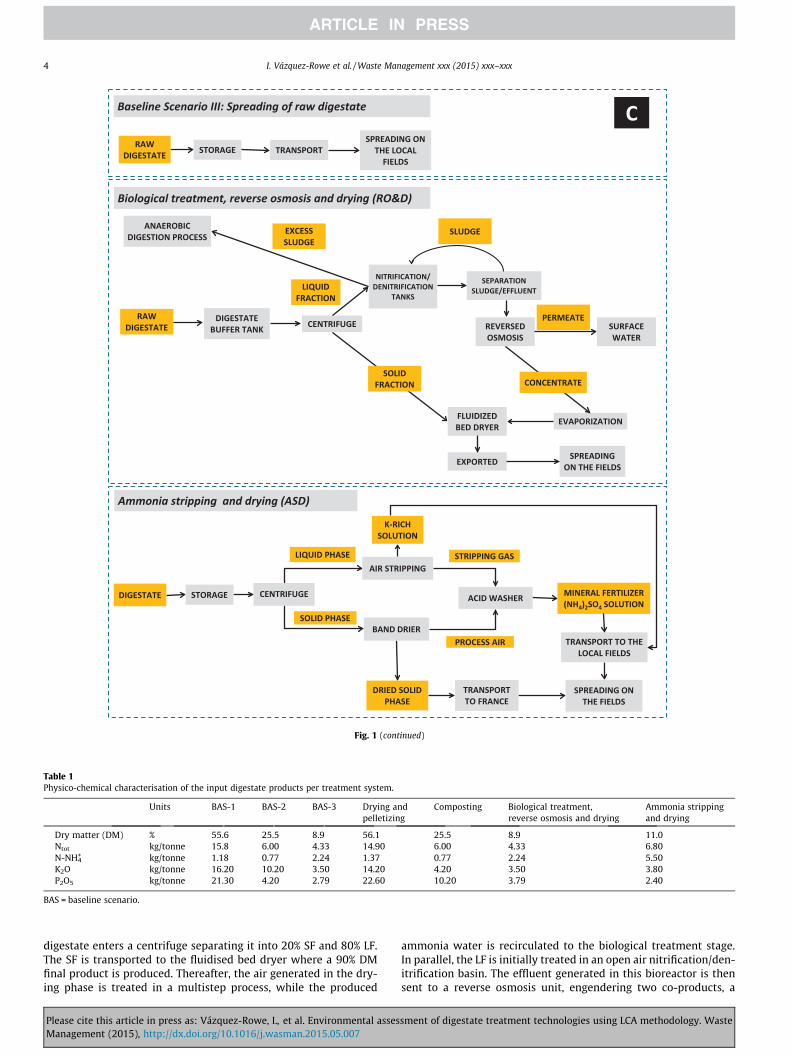
Fig. 1. Schematic representation of the conversion systems modelled. Baseline scenario I – BAS-1, and drying and pelletizing – D&P (a); baseline scenario II – BAS-2 comparedwith composting – Co (b); and baseline scenario III – BAS-3 compared with biological treatment, reverse osmosis and drying – RO&D, and ammonia stripping and drying –ASD (c).
I. Vázquez-Rowe et al. / Waste Management xxx (2015) xxx–xxx 3
digestate. The average DM content of the product entering theplant is 56% (see Table 1). After a short storage period (3–4 days),the input stream goes through a fluidized bed dryer. The evapo-rated water is passed through the acid washer, generating annually35,700 t of vapour and 2000 t of a (NH4)2SO4 solution. Thereafter,the solid output from the drying stage and the (NH4)2SO4 solutionare mixed and pelletized. Finally, the ca. 60,000 t year�1 of pelletsare cooled in a ventilation system, stored and transported for useas an organic fertilizer abroad.
2.2.2. Digestate composting (Co)The digestate composting (Co) scenario is fed with an incoming
product that is composed of SF exclusively. A total of approxi-mately 112,000 t year�1 of SF enters the plant and automaticallyundergoes a composting process in six parallel composting tun-nels. The composting time is strongly dependent on the season.In the summertime, when demand for this product is high, thecomposting process lasts for three days, whereas in the winter this
Please cite this article in press as: Vázquez-Rowe, I., et al. Environmental assesManagement (2015), http://dx.doi.org/10.1016/j.wasman.2015.05.007
process can be extended to six weeks. The variable processing timeof the compost also has an influence on the aeration time, which isone hour during the summer months and one week in winter. Theaeration process is in compliance with the international standardsfor hygienisation (Petterson and Ashbolt, 2003). Hence, theend-product is free of pathogens. From the composting process atotal of nearly 50,000 t year�1 of output is produced, as well asan air flow that is treated in a combined acid air washer and biofil-ter. The air treatment produces an (NH4)2SO4 solution that is finallymixed with the compost and exported to France for spreading onagricultural fields. The final annual output adds up to a total of50,000 t year�1.
2.2.3. Biological treatment, reverse osmosis and drying (RO&D)The fourth plant analysed in this study constitutes a complex
system in which 55,000 t of raw digestate are treated on an annualbasis in a three-step biological treatment, reverse osmosis and dry-ing process (RO&D). After a very short storage period the raw
sment of digestate treatment technologies using LCA methodology. Waste
RAWDIGESTATE
DIGESTATEBUFFER TANK CENTRIFUGE
PERMEATE
SLUDGEEXCESS SLUDGE
LIQUIDFRACTION
NITRIFICATION/ DENITRIFICATION
TANKS
ANAEROBIC DIGESTION PROCESS
SEPARATION SLUDGE/EFFLUENT
REVERSED OSMOSIS
FLUIDIZED BED DRYER
EXPORTED
Biological treatment, reverse osmosis and drying (RO&D)
SURFACE WATER
EVAPORIZATION
CONCENTRATESOLID
FRACTION
SPREADING ON THE FIELDS
RAW DIGESTATE TRANSPORT
SPREADING ON THE LOCAL
FIELDS
Baseline Scenario III: Spreading of raw digestate
STORAGE
ACID WASHER
STRIPPING GAS
MINERAL FERTILIZER(NH4)2SO4 SOLUTION
CENTRIFUGE
LIQUID PHASE
SOLID PHASE
SPREADING ON THE FIELDS
BAND DRIER
DRIED SOLID PHASE
PROCESS AIR
Ammonia stripping and drying (ASD)
TRANSPORT TO FRANCE
TRANSPORT TO THE LOCAL FIELDS
AIR STRIPPING
K-RICH SOLUTION
DIGESTATE STORAGE
C
Fig. 1 (continued)
Table 1Physico-chemical characterisation of the input digestate products per treatment system.
Units BAS-1 BAS-2 BAS-3 Drying andpelletizing
Composting Biological treatment,reverse osmosis and drying
Ammonia strippingand drying
Dry matter (DM) % 55.6 25.5 8.9 56.1 25.5 8.9 11.0Ntot kg/tonne 15.8 6.00 4.33 14.90 6.00 4.33 6.80N-NH4
+ kg/tonne 1.18 0.77 2.24 1.37 0.77 2.24 5.50K2O kg/tonne 16.20 10.20 3.50 14.20 4.20 3.50 3.80P2O5 kg/tonne 21.30 4.20 2.79 22.60 10.20 3.79 2.40
BAS = baseline scenario.
4 I. Vázquez-Rowe et al. / Waste Management xxx (2015) xxx–xxx
digestate enters a centrifuge separating it into 20% SF and 80% LF.The SF is transported to the fluidised bed dryer where a 90% DMfinal product is produced. Thereafter, the air generated in the dry-ing phase is treated in a multistep process, while the produced
Please cite this article in press as: Vázquez-Rowe, I., et al. Environmental assesManagement (2015), http://dx.doi.org/10.1016/j.wasman.2015.05.007
ammonia water is recirculated to the biological treatment stage.In parallel, the LF is initially treated in an open air nitrification/den-itrification basin. The effluent generated in this bioreactor is thensent to a reverse osmosis unit, engendering two co-products, a
sment of digestate treatment technologies using LCA methodology. Waste

I. Vázquez-Rowe et al. / Waste Management xxx (2015) xxx–xxx 5
permeate and a concentrate. The permeate is directly discharged tosurface water, whereas, the concentrate is evaporated and mixedwith the dry product.
2.2.4. Ammonia stripping and drying (ASD)Ammonia stripping and drying (ASD) is the only scenario
included in this study that is currently not being commerciallyapplied for treatment of digestate in Flanders. This new conversionmethod may potentially offer certain advantages, such as reducedammonia emissions or the production of easily transportableammonium sulphate (Bakx et al., 2009; VLM, 2012). The inclusionof ASD in this study is intended to determine whether this technol-ogy may imply environmental gains as compared to the previouslydescribed treatment technologies.
Therefore, a medium-scale treatment plant, with a similarcapacity to those described above (i.e. roughly 60,000 t of rawdigestate per year), was modelled. All the data to model the inputsand outputs of the plant were retrieved mainly from bibliographi-cal data and, to a lesser extent, from expert opinions (Bakx et al.,2009). Once the stored digestate enters the treatment plant, theseparation into a liquid and solid fraction is performed throughcentrifugation (Lootsma and Raussen, 2008). Subsequently, withthe aim of increasing the pH for treatment, the LF is processed withNaOH (Bakx et al., 2009). The main product of the ammonia strip-ping in the LF is the stripped air, which undergoes a final acidwasher step in which an (NH4)2SO4 mineral concentrate is pro-duced. The additional effluent produced during ammonia strippinghas a high content of K, but a low N concentration. Both products(i.e. the effluent rich in K and the mineral concentrate) are subse-quently applied on the fields in West Flanders (see Fig. 1) as fertil-izer. The SF coming from centrifuge is dried on site, allowing theevaporation of approximately 70% of its total volume. The evapo-rated process air is exposed to an acid washing procedure whichgenerates a (NH4)2SO4 mineral concentrate that is thereafterapplied locally. The remaining dried SF is transported for spreadingon fields in neighbouring regions of France.
2.2.5. StorageShort-term storage of raw digestate (5–7 days) was considered
for all five treatment processes, based on the descriptions providedby the plants. However, some differences in how the digestate isstored were observed between plants. In contrast, long-term storagetime of three months was assumed for raw digestate spreading,i.e. the baseline scenarios, based on common practices in TheNetherlands (De Vries, personal communication, May 2012).2 Theemission factors associated with the storage of intermediateproducts (LF and SF) were modelled based on data retrieved fromOenema et al. (2000) and IPCC (2006), as depicted in Table 2.
2.2.6. Spreading of final outputsMost of the final products are eventually spread in Northern
regions of France (ca. 250 km), although some final co-productswere spread on local fields in Flanders (ca. 100 km). One of thedigestate treatment plants also had an export line to someAfrican and Asian countries. However, for the sake of comparabil-ity, exports for this plant were also assumed to be done toNorthern regions of France. All co-products in the different casestudies were assumed to be used for winter wheat cultivationswith secondary crops and sandy loam texture, for which a
2 Individual digestate treatment plants, as well as individual farmers consulted inthe frame of the project reported variable storage times. However, it was decided touse an average storage time for all the different plants, based on the high variabilityduring the year of operation also. Therefore, based on common practices reported byspecialists in The Netherlands, a fixed value was assumed for both treatmenttechnologies and the baseline scenarios.
Please cite this article in press as: Vázquez-Rowe, I., et al. Environmental assesManagement (2015), http://dx.doi.org/10.1016/j.wasman.2015.05.007
maximum spread of 170 kg/ha and 75 kg P/ha are allowed (VLM,2012). In accordance with Flemish legislation different nitrogenuptake efficiency (NUE) rates were assumed (BS13.05.2011,2011). Therefore, the NUE for raw digestate and the LF was 60%,whereas the NUE for the SF, dried digestate or compost was 30%.Finally, in the ASD case study a total spread of 40 kg/ha was consid-ered for the K fertiliser produced when treating the LF, which is theaverage K fertiliser use for Belgium according to FERTISTAT (FAO,2012).
The emissions to the atmosphere, to water bodies and to the soilcaused by the spreading of the different products, as shown inTable 2, were calculated based on the ecoinvent� guidelines(Nemecek et al., 2007).
2.3. Data acquisition and quality
Primary data for the different treatment options were obtainedfrom a wide range of sources. In the first place, designated plantoperators completed a detailed questionnaire linked to the maininput and output flows in the plants. In addition, they provided aseries of data related to operational inputs, including the sourceand amount of energy inputs, the input of raw digestate, the useof chemicals or the final fate of output products. These question-naires, once returned to the Flemish Coordination Centre forManure Processing (VCM) were improved through a series of tele-phone interviews.
Secondly, data regarding feedstock composition for anaerobicdigestion, as well as digestate characteristics were provided byGhent University and completed with internal data from VCM. Inthe case of the BAS, a substrate with similar characteristics to thoseavailable for the treatment plants was modelled to allow directcomparability. Therefore, three different digestate compositionswere assumed for BAS (enclosed as the BAS-I, BAS-II and BAS-IIIscenarios), as described in Section 2.2.
Finally, data quality requirements were met through the defini-tion of a series of parameters that were considered common to thetechnologies analysed, as defined in the technical specificationISO/TS 14048/2002 (ISO, 2002). First, time-related, geographicaland technology coverage were handled by fixing a single year ofassessment (year 2012), a specific geographical area in WestFlanders and the technology production processes described inSection 2.2. Secondly, the precision of the inventory data, under-stood as the degree of variability of data values, was not possibleto quantify since only one set of data per technology was provided.Nevertheless, the lack of precision was counterbalanced with sensi-tivity analysis modelling as described in Section 2.6. The invento-ries of the conversion technologies analysed in this study containaccurate primary data guaranteeing completeness. In contrast, con-sistency was ensured by applying the same assumptions for all theconversion technologies. Finally, reproducibility was attained byproviding a detailed description of the Life Cycle Inventory – LCI(see Section 2.4) and the methods used (see Section 2.5).
2.4. Life Cycle Inventory
A summarized LCI, including the main energy inputs and pro-duct outputs, is shown in Table 3, with all values allocated to theselected FU. Background processes for the different inputs and out-puts considered in the systems were obtained from the ecoinvent�
database (Frischknecht et al., 2007). An exemplary detailed LCI canalso be consulted for the D&P scenario in Table S1 of theSupplementary Material (SM).
2.4.1. EmissionsDespite the relatively good quality of the inventory data regard-
ing operational inputs and flow streams throughout the different
sment of digestate treatment technologies using LCA methodology. Waste

Table 2Estimated emissions for different stages of the analysed production systems reported in kg/functional unit (FU = tonne of incoming digestate).
Storage Treatment Spreading of final products
CH4 N2O NH3 NO CH4 N2O NH3 NO NH3 N2O NOx NO3�
BAS-1 1.33 – 4.95E�1 – N/Ap N/Ap N/Ap N/Ap 2.88 2.48E�1 4.90E�2 5.68BAS-2 0.56 – 1.12E�1 – N/Ap N/Ap N/Ap N/Ap 4.67E�1 1.14E�1 2.40E�2 2.44BAS-3 1.34 – 4.56E�1 – N/Ap N/Ap N/Ap N/Ap 2.59 1.97E�1 4.13E�2 2.90D&P 1.47E�2 9.00E�2 – – – – N/Av – 1.39E�1 9.48E�2 1.98E�2 2.28Co 2.78E�1 – 1.45E�1 – 6.57E�1 6.29E�2 5.31E�1 – 2.91E�2 3.38E�2 7.18E�3 7.07E�1RO&D – – – – – 1.11E�2 1.11E�3 2.22E�3 1.23E�2 2.42E�2 5.09E�1 5.81E�1ASD 2.90E�1 – 4.95E�1 – N/Av N/Av N/Av N/Av 2.81E�1 1.01E�2 2.30E�2 4.77E�1
BAS = baseline scenario; D&P = drying and pelletizing; Co = composting; RO&D = biological treatment, reverse osmosis and drying; ASD = ammonia stripping and drying.
Table 3Summarized inventory data for the digestate treatment scenarios. Data reported perFU tonne of incoming digestate.
D&P Co RO&D ASD
InputsEnergy
Electricity kWh 26.13 53.23 42.04 17.40Heat kWh 141.9 49.85 299.52 222.22Diesel kg 6.38 – – –Natural gas kWh 3.79 – – –
Materials and chemicalsSulphuric acid kg – 3.20 0.28 2.40NaOH L – – 0.28 21.80Powder polymer kg – – 0.14 –
OutputsCo-products
Dried digestate pelletsa kg 606.1 – – –Dried digestate kg – – 64.54 33.60Compost kg – 800.0 –Mineral concentrate kg – – – 18.20K-fertilizer kg – – – 855.0
D&P = drying and pelletizing; Co = composting; RO&D = biological treatment,reverse osmosis and drying; ASD = ammonia stripping and drying.
a The pellets are a mix of dried digestate and mineral concentrate – (NH4)2SO4.The content of mineral concentrate in the final product per FU is 20.20 kg.
6 I. Vázquez-Rowe et al. / Waste Management xxx (2015) xxx–xxx
treatment plants, no primary data were available for the emissionsto air, soil and water of the different processes, as well as thespreading of the final products on agricultural land. Therefore,storage emissions data were retrieved from available literature(De Mol and Hilhorst, 2003; IPCC, 2006; De Vries et al., 2012).Emissions to the air and water occurring in the treatment pro-cesses were obtained from a wide range of bibliographical data(Smet et al., 2003; De Vries et al., 2012). Finally, emissions to air,water and soil related to the spreading on fields of the final prod-ucts were calculated based on the ecoinvent� guidelines (Nemeceket al., 2007).
2.4.2. Conversion technologiesThe main inputs linked to the conversion technologies were
linked to the energy sources used to power the plants. For instance,the Belgian electricity production inventory available in ecoin-vent� was modified based on the current electricity mix in 2012(Groupe Gemix, 2009). In addition, other energy sources, such asthe use of heat from the CHP in all scenarios or diesel and naturalgas for the D&P scenario were modelled based on current practicesin Belgium regarding these carriers (Dones et al., 2007). Moreover,the use of chemicals, such as NaOH for the RO&D and ASD scenar-ios or sulphuric acid in the Co, RO&D and ASD scenarios wereincluded in the inventories to account for their productionprocesses. For these materials the average European productionprocesses were assumed based on the ecoinvent� processes and,
Please cite this article in press as: Vázquez-Rowe, I., et al. Environmental assesManagement (2015), http://dx.doi.org/10.1016/j.wasman.2015.05.007
therefore, the average European energy and material flows weretaken into account (Althaus et al., 2007).
2.4.3. Transportation and spreadingTransportation of final products to agricultural sites for spread-
ing was modelled based on current practices. All outputs wereassumed to be transported by trucks with a 32 t capacity followingthe EURO 5 emissions directive. Similarly, the emissions linked tofuel combustion in the transport phase was modelled based ondata available in the ecoinvent� datasets (Spielmann et al., 2007).Regarding the spreading techniques described in Table 4, theecoinvent� database was also utilized to model these processesfor digestate spreading (Nemecek et al., 2007).
2.5. Life cycle impact assessment
The selected treatment options, as well as the BAS were com-puted following the ReCiPe assessment method (Goedkoop et al.,2009). In particular, the midpoint approach was chosen to evaluateeach impact category individually and identify the key inputs andemissions responsible for environmental burdens. Furthermore,the endpoint hierarchist method was used in order to provide aweighted single score environmental value for each case study,thereby identifying their overall environmental profile. This hierar-chist perspective was selected due to the fact that it takes into con-sideration the main policy approaches linked to time horizons (e.g.100-year horizon for climate change – CC). Consequently, it isbased on consensus, and is foreseen in many environmental stan-dards (e.g. ISO 14040). Nevertheless, comparability with the othertwo perspectives (i.e. egalitarian and individualist) is provided inSection 4.1. On the one hand, egalitarian perspective was discardedfrom the main objectives of the study due to the extended timehorizons, which make it a more conservative calculation, and thecomputation of impacts that are yet to be fully standardised in lifecycle thinking (Goedkoop et al., 2009). On the other hand, the indi-vidualist perspective only reflects a 20 year time frame, consider-ing that human kind fully adapts to changing environmentalconditions, such as rising global temperatures. In fact, in this speci-fic case study this choice would pose important methodologicalissues in terms of the inclusion of methane (CH4) in the finalresults (Goedkoop et al., 2009).
Currently, the selection of ReCiPe as the preferred assessmentmethod to compute the Life Cycle Impact Assessment (LCIA)results represents the highest level of convergence with the ILCDrecommendations (ILCD, 2010, 2011). Finally, regarding land useimpacts, which are monitored in ReCiPe through three differentimpact categories (i.e. natural land transformation, agriculturalland occupation and urban land occupation), we decided to obviatethe recommendation of ILCD to use the soil organic matter (SOM)impact category (ILCD, 2011). The rationale behind this decision islinked to the lack of data relating to specific spreading areas for thedigestate outputs examined in this study. In fact, the use of the
sment of digestate treatment technologies using LCA methodology. Waste

Table 4Additional scenarios to monitor the environmental impacts of fluctuating parameters.
Baselinescenario I
Drying andpelletizing
Baselinescenario II
Composting Baselinescenario III
Biological treatment,reverse osmosis anddrying
Ammonia strippingand drying
Digestate spreading techniqueSurface incorporation (harrowing) BAS-1-SI(H) D&P-SI(H) BAS-2-SI(H) Co-SI(H) BAS-3-SI(H) RO&D-SI(H) ASD-SI(H)Surface incorporation (ploughing) BAS-1-SI(P) D&P-SI(P) BAS-2-SI(P) Co-SI(P) BAS-3-SI(P) RO&D-SI(P) ASD-SI(P)
Energy carrierBiogas heat BAS-1-E D&P-E BAS-2-E Co-E BAS-3-E RO&D-E ASD-E
TransportTransport (+25% distance) BAS-1-T1 D&P-T1 BAS-2-T1 Co-T1 BAS-3-T2 RO&D-T1 ASD-T1Transport (+50% distance) BAS-1-T2 D&P-T2 BAS-2-T2 Co-T2 BAS-3-T2 RO&D-T2 ASD-T2
I. Vázquez-Rowe et al. / Waste Management xxx (2015) xxx–xxx 7
digestate outputs analysed in this case study may imply changes inthe organic carbon content of the soil as compared to other fertil-ising agents. However, this particular aspect was consideredbeyond the scope of the present study.
2.6. Definition of alternative scenarios. Sensitivity analysis
In order to monitor the changes in environmental impactsexpected due to variations in the production system a series ofalternative scenarios were modelled. To this end, the alternativescenarios were divided into three main groups. Firstly, as seen inTable 4, two additional scenarios were modelled to evaluate theeffect of different spreading techniques for digestate. While themain results that are presented in Section 3 consider the surfacespreading of the digestate products evaluated in this study, twospecific spreading techniques that have been shown to mitigateammonia emissions on fields were modelled (Carozzi et al.,2013). Secondly, a set of scenarios were modelled to identify thevariation in environmental impacts based on feasible changes inthe energy source of the different plants. Finally, a set of changesin transport distances from the gate of the plants to the agriculturalfields was considered. It should be noted that the range of scenar-ios that can be modelled could be extended to other dimensions,such as the characteristics of the digestate or specific changesthroughout the treatment of the digestate. However, the alterna-tive scenarios in the present study were selected based on specificissues that were considered of interest for stakeholders in thefarming sector in Flanders, when the preliminary results were pre-sented to them at a meeting coordinated by VCM.
3. Results
3.1. Environmental impacts for the baseline scenario (BAS)
The overall environmental profile of the three different BASscenarios using ReCiPe endpoint (hierarchist perspective) showeddiffering results depending on the nature of the raw product. Forinstance, BAS-1 and BAS-3 show a much higher environmentalimpact (see Fig. 2) than BAS-2 (61% and 51% higher, respectively).This increased environmental impact in BAS-1 and BAS-3 is linkedto the higher emissions in terms of particulate matter formation(PMF) and, to a lesser extent, of climate change (CC). This pictureis related ultimately to the fact that the digestate in BAS-2 corre-sponds exclusively to the solid fraction of digestate and, therefore,has partially undergone previous pre-treatment procedures beforearriving to the plant premises, and indicates a lower concentrationof N-NH4. Consequently, the relative contribution of the PMF cate-gory to the endpoint single score results in BAS-2 was 20%, while39% was reported for BAS-1 and 38% for BAS-3. In contrast, despitethe lower absolute values for CC as compared to BAS-1 and BAS-3,
Please cite this article in press as: Vázquez-Rowe, I., et al. Environmental assesManagement (2015), http://dx.doi.org/10.1016/j.wasman.2015.05.007
BAS-2 shows higher relative contributions to the endpoint dam-ages of CC on human health (40%) than BAS-1 (27%) and BAS-3(26%).
The difference in endpoint environmental impacts betweenBAS-1 and BAS-3 was fairly low, with impacts slightly higher tothe former (11.52 Pt and 10.81 Pt, respectively, 7% higher). In addi-tion, when the absolute and relative contributions of each impactcategory to the total impact are analysed, there are minimal differ-ences between the two scenarios. Finally, it should be noted that inall three scenarios four impact categories (i.e. CC damage onhuman health, CC damage on ecosystems, PMF and fossil depletion– FD), accounted for at least 95% of the total environmental impact.The reason for the predominance of these categories is mainly dueto the fact that the modelled production processes have a limitednumber of operational inputs, as quantified below, which linkedmost burdens to air emissions and transportation.
When the midpoint results are analysed individually for eachimpact category (see Tables 5–7), the relative contributions ofthe different operational inputs included in the LCI are fairly anal-ogous for BAS-1 and BAS-3. Nevertheless, for the sake of simplicity,only the three categories that contributed to 95% of the endpointsingle score values are discussed, while the complete set of cate-gories is shown in Fig. 3. Firstly, field emissions linked to digestatespreading accounted for most of the environmental impacts interms of PMF (81% for BAS-1 and 79% for BAS-3). These impactsare attributable mainly to the high content of N-NH4 in the diges-tates. In fact, in BAS-2, in which the content of N-NH4 is muchlower, the relative contribution of field emissions was 41%, slightlybelow the emissions estimated for the storage phase (42%). Finally,it should be noted that ammonia emissions also account for impor-tant contributions to the terrestrial acidification (TA) and marineeutrophication (ME) categories, even though the weight of theseimpacts in the overall endpoint single score results is minimal.
CC impacts were dominated by field emissions in all threescenarios, ranging from 50% (BAS-1) to 31% (BAS-2). The mainpollutant contributing to these emissions was N2O. Nevertheless,it should be highlighted that once again the emissions on fieldswere lower for BAS-2, in which the digestate product used hasbeen subject to prior pre-treatment. In fact, for BAS-2 theemissions of mainly CH4, and to a lesser extent N2O, occurring inthe storage stage account for 30% of the total impact, while inthe remaining scenarios it only accounts for 20–25% of the impact.Interestingly, fossil fuel emissions from the several transportationstages only account for roughly 15–17% of the final impacts.
The transport of the digestate products to the fields showed tohave an important contribution throughout most of the remainingcategories, especially for the resource and toxicity related indica-tors (see Fig. 3). While the relative weight of most of these cate-gories in terms of endpoints is below 1%, this is not the case forFD. In fact, transport of digestate to the fields represented between67% (BAS-2 and BAS-3) and 73% of the midpoint impacts for BAS-1.
sment of digestate treatment technologies using LCA methodology. Waste

0
2
4
6
8
10
12
14
BAS-1 D&P BAS-2 Co BAS-3 RO&D ASD
Pt
CC [HH] CC [Ec] PMF MD FD Other categories
Fig. 2. Endpoint single score environmental impact results for the selected scenarios (Results reported per FU = 1 tonne of digestate entering the treatment plant). NOTE: CC[HH] = climate change–human health; CC [Ec] = climate change – ecosystems; TA = terrestrial acidification; HT = human toxicity; PMF = particulate matter formation;ALO = agricultural land occupation; ULO = urban land occupation; NLT = natural land transformation; MD = metal depletion; FD = fossil depletion; Other categories = ozonedepletion, freshwater eutrophication, photochemical oxidant formation, terrestrial ecotoxicity, freshwater ecotoxicity, marine ecotoxicity and ionizing radiation; BAS-1 = baseline scenario (1); BAS-2 = baseline scenario (2); BAS-3 = baseline scenario (3); D&P = drying and pelletizing scenario; Co = composting scenario; RO&D = biologicaltreatment, reverse osmosis and drying scenario; ASD = ammonia stripping and drying scenario.
Table 5Environmental impacts for the mixed digestate treatment scenarios selected usingthe ReCiPe midpoint assessment method (data reported per FU, 1 tonne of incomingmixed digestate).
Impact category Unit BAS-1 Drying with pelletizing (D&P)
CC kg CO2 eq 147.77 99.98OD kg CFC-11 2.97E�6 6.40E�6TA kg SO2 eq 8.42 6.21E�1FE kg P eq 2.64E�3 6.39E�3ME kg N eq 0.32 3.48E�2HT kg 1,4-DB eq 3.46 6.99POF kg NMVOC 0.25 4.32–1PMF kg PM10 eq 1.15 1.63E�1TET kg 1,4-DB eq 2.46E�3 4.21E�3FET kg 1,4-DB eq 7.01E�2 1.32E-1MET kg 1,4-DB eq 7.43E�2 1.42E�1IR kg U235 eq 2.24 20.57ALO m2a 0.89 6.29E�1ULO m2a 0.34 3.83E�1NLT m2 6.73E�3 1.55E�2WD m3 8.29E�2 2.47E�1MD kg Fe eq 1.78 2.17FD kg oil eq 6.84 17.00
CC = climate change; OD = ozone depletion; HT = human toxicity;POF = photochemical oxidant formation; PMF = particulate matter formation;IR = ionizing radiation; TA = terrestrial acidification; FE = freshwater eutrophica-tion; ME = marine eutrophication; TET = terrestrial eco-toxicity; FET = freshwatereco-toxicity; MET = marine eco-toxicity; ALO = agricultural land occupation;ULO = urban land occupation; NLT = natural land transformation; WD = waterdepletion; MD = metal depletion; FD = fossil depletion.
Table 6Environmental impacts for the solid fraction treatment scenarios selected using theReCiPe midpoint assessment method (data reported per FU, 1 tonne of incoming solidfraction digestate).
Impact category Unit BAS-2 Composting (Co)
CC kg CO2 eq 109.83 93.44OD kg CFC-11 3.22E�6 3.19E�6TA kg SO2 eq 2.50 2.93FE kg P eq 3.06E�3 6.55E�3ME kg N eq 9.72E�2 1.11E�1HT kg 1,4-DB eq 3.94 7.61POF kg NMVOC 2.44E�1 2.34E�1
8 I. Vázquez-Rowe et al. / Waste Management xxx (2015) xxx–xxx
In addition, site-specific transport on fields (i.e. by truck or tractor)accounted for an important portion of the remaining impacts in allthree scenarios (approximately 20%).
PMF kg PM10 eq 3.76E�1 4.32E�1TET kg 1,4-DB eq 2.64E�3 2.88E�3FET kg 1,4-DB eq 8.19E�2 1.46E�1MET kg 1,4-DB eq 8.68E�2 1.50E�1IR kg U235 eq 2.59 18.53ALO m2a 1.05 6.62E�1ULO m2a 3.81E�1 4.89E�1NLT m2 7.33E�3 7.99E�3WD m3 9.08E�2 4.20E�1MD kg Fe eq 2.28 2.80FD kg oil eq 7.49 8.76
CC = climate change; OD = ozone depletion; HT = human toxicity;POF = photochemical oxidant formation; PMF = particulate matter formation;IR = ionizing radiation; TA = terrestrial acidification; FE = freshwater eutrophica-tion; ME = marine eutrophication; TET = terrestrial eco-toxicity; FET = freshwatereco-toxicity; MET = marine eco-toxicity; ALO = agricultural land occupation;ULO = urban land occupation; NLT = natural land transformation; WD = waterdepletion; MD = metal depletion; FD = fossil depletion.
3.2. Environmental impacts for the drying and pelletizing (D&P)scenario
The total final endpoint value for this scenario was 7.52 Pt, 35%lower than for the BAS-1 scenario. In this treatment plant the mainimpact category contributing to this weighted single score (seeFig. 2) was found to be FD (37%), followed by CC – human health(28%), CC – ecosystems (5%) and PMF (8%). The higher importanceof FD as compared to CC is linked to the higher reliance on fossilfuels-based energy for drying. In addition, the low relative impactsof PMF demonstrate the adequacy of this conversion technology toreduce ammonia emissions. Nevertheless, the increased distancesrelated to the transport of final products for their use on fields in
Please cite this article in press as: Vázquez-Rowe, I., et al. Environmental assesManagement (2015), http://dx.doi.org/10.1016/j.wasman.2015.05.007
France implied considerable impacts throughout all the differentcategories.
From a midpoint perspective (see Fig. 4) the CC emissions fromthe spreading of the final products represented 32% of the totalimpacts, followed by the operational activities in the treatmentplant (i.e. drying, screw conveyor, acid air washing and pelletizing),which represented 27% of the global warming impacts, and theemissions from the incoming product in the storage silo (26%).For FD the main contributors were the operational activities inthe plant (60%), of which the most representative activity wasthe processing in the fluidised bed dryer (47%), followed by thetransport subsystem (28%). Finally, regarding the remainingimpact categories, these were mainly dominated by impacts linkedto the transport subsystem, except for PMF, TA and ME, wherespreading emissions linked to ammonia and nitrate were still themain source of environmental impact. Nevertheless, as can be seenin Fig. 2 and Table 5, the reduction in environmental impacts as
sment of digestate treatment technologies using LCA methodology. Waste

Table 7Comparative environmental impacts for the raw digestate treatment scenariosselected using the ReCiPe midpoint assessment method (data reported per FU, 1tonne of incoming raw digestate).
Impactcategory
Unit BAS-3 Biological treatment,reverse osmosis anddrying (RO&D)
Ammoniastripping anddrying (ASD)
CC kg CO2 eq 134.39 56.58 68.41OD kg CFC-11 3.22E�6 6.30E�6 2.27E�6TA kg SO2 eq 7.08 1.25E�1 2.51FE kg P eq 3.06E�3 6.84E�3 2.61E�2ME kg N eq 2.93E�1 4.01E�1 9.83E�2HT kg 1,4-DB eq 3.94 6.20 26.51POF kg NMVOC 2.61E�1 9.04E�2 5.11E�2PMF kg PM10 eq 1.06 3.58E�2 3.52E�1TET kg 1,4-DB eq 2.64E�3 2.12E�3 4.32E�3FET kg 1,4-DB eq 8.19E�2 1.12E�1 4.00E�1MET kg 1,4-DB eq 8.68E�2 1.26E�1 4.12E�1IR kg U235 eq 2.59 27.48 28.25ALO m2a 1.05 3.29E�1 7.66E�1ULO m2a 3.81E�1 1.06E�1 1.77E�1NLT m2 7.33E�3 1.05E�2 4.91E�3WD m3 9.08E�2 2.49E�1 0.52MD kg Fe eq 2.28 8.57E�1 2.18FD kg oil eq 7.49 16.49 8.98
CC = climate change; OD = ozone depletion; HT = human toxicity;POF = photochemical oxidant formation; PMF = particulate matter formation;IR = ionizing radiation; TA = terrestrial acidification; FE = freshwater eutrophica-tion; ME = marine eutrophication; TET = terrestrial eco-toxicity; FET = freshwatereco-toxicity; MET = marine eco-toxicity; ALO = agricultural land occupation;ULO = urban land occupation; NLT = natural land transformation; WD = waterdepletion; MD = metal depletion; FD = fossil depletion.
I. Vázquez-Rowe et al. / Waste Management xxx (2015) xxx–xxx 9
compared to the BAS-1 in those categories to which ammonia iscontributing is considerable.
3.3. Environmental impacts for the composting (Co) scenario
The Co scenario presented an overall weighted value of 7.04 Pt(see Fig. 2), which was very similar to the overall impact receivedin BAS-2 (7.17 Pt). The Single score impacts were dominatedmainly by four impact categories in a similar range of relativeweights. The two CC categories represented 28% (human health)and 23% (ecosystems) of the environmental impacts, PMFaccounted for 24% of these impacts and FD for 20.0%.
When analysing the midpoint impacts (see Table 6 and Fig. 5),44% of the environmental impacts linked to CC were attributableto the operation of the composting plant, namely the compostingitself (37%) and to a lesser extent the acid washer and biofilterstage (7%). In terms of PMF, 41% of the total impact was linked tothe storage of the input digestate and another 39% was related tothe composting treatment itself. Finally, for the FD category mostimpacts were concentrated in the transportation of the compost(55%) and, to a lesser extent, to the acid washer stage of the treat-ment process (20%).
3.4. Environmental impacts for the biological treatment, reverseosmosis and drying (RO&D) scenario
The final weighted endpoint values for the RO&D scenario was5.13 Pt, 53% lower than BAS-3 (see Fig. 2), and 14% lower thanthe ammonia stripping scenario (i.e. ASD). The FD impact categorywas predominant in terms of overall contribution (52%). Theremaining impacts were linked to the two climate change cate-gories (23% for CC – human health and 19% for CC – ecosystems).PMF only represented 2.7% of the total impacts, while the remain-ing 3.3% was divided up between the other categories computed.
Please cite this article in press as: Vázquez-Rowe, I., et al. Environmental assesManagement (2015), http://dx.doi.org/10.1016/j.wasman.2015.05.007
Midpoint impacts shown in Table 7 and Fig. 6 highlight theimportance of the evaporation step in the overall environmentalprofile of this scenario, since it represents 70% of the impactsrelated to FD and 58% for CC. For the latter category, the nitrification–denitrification basin (14%) and the spreading of the finalproduct on fields (13%) also had important contributions. Animportant observation in the PMF category is the fact that besidesits low relative contribution to the endpoint impacts, thecontribution of on-field emissions only represented 16%, whereasdifferent treatment steps in the digestate plant had moreimportant contributions, such as the evaporation stage (28%) orthe nitrification–denitrification basin (20%). Finally, it should bementioned that for ME the main contributor to environmentalimpacts was the effluent (65%) and on-field spreading was themain impact in terms of agricultural land occupation.
3.5. Environmental impacts for the ammonia stripping and drying(ASD) scenario
The overall endpoint environmental impact for this scenariowas 5.94 Pt, 45% lower than for BAS-3. A vast proportion of thisfinal value was evenly distributed between the following endpointimpact categories: CC – human health (24%), FD (24%), PMF (23%)and CC – ecosystems (20%). This distribution, however, differs sub-stantially from the one observed for RO&D, since the biologicaltreatment in the latter is capable of reducing PMF impacts to extre-mely low levels. In contrast, despite the lower efficacy of ASD (ascompared to RO&D) in terms of reducing the final environmentalimpacts due to ammonia, its dependence on fossil fuels is muchlower, which allows obtaining competitive reductions of ammoniaemissions, while controlling the expenditure of resources andderived GHG emissions.
The midpoint values for the highest contributing categories inthis scenario suggest that the stripping of the liquid fraction isthe main process responsible for environmental impact, since itrepresents 37% of the impacts for CC and 76% for FD. This is mainlydue to the energy requirements needed to power a plant of thesecharacteristics. In addition, emissions in the storage phase of rawdigestate would also account for an outstanding environmentalcontribution: 45% for PMF and 11% for CC. Finally, field activitiesof spreading one of the final products (i.e. mineral fertilizer inthe form of ammonium sulphate) would add up to 17% of the envi-ronmental impacts for the CC category and 13% for PMF. Theseimpacts were mainly linked to the air emissions engendered dur-ing the surface spreading of the mineral fertilizer (i.e. dinitrogenmonoxide in the case of CC and ammonia in PMF).
Finally, as pointed out for the remaining scenarios and treat-ment processes, the application of this technology implies impor-tant reductions in terms of ammonia emissions as compared tothe baseline scenario (BAS-3) and, therefore, substantial benefitsin the categories influenced by these emissions at the sacrifice ofhigher impacts in terms of energy use and climate changeemissions.
3.6. Environmental impacts for the sensitivity analysis scenarios
The selection of the techniques for spreading digestate on thefields has shown to have important impacts on the mitigation ofammonia emissions (Carozzi et al., 2013). Fig. 7 shows the influ-ence of different spreading techniques on the final results.Environmental reductions for BAS when spreading digestate usingthe surface incorporation technique were strongly dependent onthe application of this technique during ploughing or harrowing.In fact, environmental gains during harrowing ranged from 12%(BAS-1) to 3% (BAS-2) for the untreated products, whereas thesegains augmented to 27% (BAS-1) and 7% (BAS-2) if the digestate
sment of digestate treatment technologies using LCA methodology. Waste

0%
20%
40%
60%
80%
100%
BAS-1
0%
20%
40%
60%
80%
100%
BAS-2
0%
20%
40%
60%
80%
100%
CC OD TA FE ME HT POF PMF TET FET MET IR ALO ULO NLT WD MD FD
CC OD TA FE ME HT POF PMF TET FET MET IR ALO ULO NLT WD MD FD
CC OD TA FE ME HT POF PMF TET FET MET IR ALO ULO NLT WD MD FD
BAS-3
Field emissions Transport to fields Field transport Spreading of digestate Digestate storage Soil reac�on
Fig. 3. Detailed midpoint characterisation relative values per operational activity for the baseline scenarios. NOTE: CC = climate change; OD = ozone depletion;TA = terrestrial acidification; FE = freshwater eutrophication; ME = marine eutrophication; HT = human toxicity; POF = photochemical oxidant formation; PMF = particulatematter formation; TET = terrestrial eco-toxicity; FET = freshwater eco-toxicity; MET = marine eco-toxicity; IR = ionizing radiation; ALO = agricultural land occupation;ULO = urban land occupation; NLT = natural land transformation; WD = water depletion; MD = mineral depletion; FD = fossil depletion; BAS-1 = baseline scenario 1 (mix ofraw digestate and dried digestate); BAS-2 = baseline scenario 2 (solid fraction digestate); BAS-3 = baseline scenario 3 (raw digestate).
0%
20%
40%
60%
80%
100%
CC OD TA FE ME HT POF PMF TET FET MET IR ALO ULO NLT WD MD FD
D&P
Acid air washer Dryer Scew conveyor Storage silo
Ven�la�on Transport out of plant Pelle�zing Field opera�ons and emissions
Fig. 4. Detailed midpoint characterisation relative values per operational activity for the treatment of mixed digestate plants. NOTE: CC = climate change; OD = ozonedepletion; TA = terrestrial acidification; FE = freshwater eutrophication; ME = marine eutrophication; HT = human toxicity; POF = photochemical oxidant formation;PMF = particulate matter formation; TET = terrestrial eco-toxicity; FET = freshwater eco-toxicity; MET = marine eco-toxicity; IR = ionizing radiation; ALO = agricultural landoccupation; ULO = urban land occupation; NLT = natural land transformation; WD = water depletion; MD = mineral depletion; FD = fossil depletion; D&W = drying with acidwasher; D&P = drying and pelletizing.
10 I. Vázquez-Rowe et al. / Waste Management xxx (2015) xxx–xxx
Please cite this article in press as: Vázquez-Rowe, I., et al. Environmental assessment of digestate treatment technologies using LCA methodology. WasteManagement (2015), http://dx.doi.org/10.1016/j.wasman.2015.05.007

0%
20%
40%
60%
80%
100%
CC OD TA FE ME HT POF PMF TET FET MET IR ALO ULO NLT WD MD FD
Co
Conveyor Storage Compos�ng Acid washer + bio filter Transport out of plant Field opera�ons and emissions
Fig. 5. Detailed midpoint characterisation relative values per operational activity for the composting plant (treatment of solid fraction digestate). NOTE: CC = climate change;OD = ozone depletion; TA = terrestrial acidification; FE = freshwater eutrophication; ME = marine eutrophication; HT = human toxicity; POF = photochemical oxidantformation; PMF = particulate matter formation; TET = terrestrial eco-toxicity; FET = freshwater eco-toxicity; MET = marine eco-toxicity; IR = ionizing radiation;ALO = agricultural land occupation; ULO = urban land occupation; NLT = natural land transformation; WD = water depletion; MD = mineral depletion; FD = fossil depletion;Co = composting.
-40%
-20%
0%
20%
40%
60%
80%
100%ASD
Dried digestate spreading Mineral fertlizer spreading Spreading of K-effluent
Liquid frac�on treatment Field opera�ons Storage
Intermediate storage (liquid frac�on) Intermediate storage (solid frac�on) Electricity at plant
0%10%20%30%40%50%60%70%80%90%
100%
CC OD TA FE ME HT POF PMF TET FET MET IR ALO ULO NLT WD MD FD
CC OD TA FE ME HT POF PMF TET FET MET IR ALO ULO NLT WD MD FD
RO&D
Dryer Separa�on Treatment of gases from dryer
Reverse Osmosis Evapora�on Reverse Osmosis-concentrate Transport out of plant
Nitrifica�on-denitrifica�on basin Field opera�ons and emissions Effluent
Fig. 6. Detailed midpoint characterisation relative values per operational activity for the treatment of raw digestate. NOTE: CC = climate change; OD = ozone depletion;TA = terrestrial acidification; FE = freshwater eutrophication; ME = marine eutrophication; HT = human toxicity; POF = photochemical oxidant formation; PMF = particulatematter formation; TET = terrestrial eco-toxicity; FET = freshwater eco-toxicity; MET = marine eco-toxicity; IR = ionizing radiation; ALO = agricultural land occupation;ULO = urban land occupation; NLT = natural land transformation; WD = water depletion; MD = mineral depletion; FD = fossil depletion; RO&D = biological treatment, reverseosmosis and drying; ASD = ammonia stripping and drying.
I. Vázquez-Rowe et al. / Waste Management xxx (2015) xxx–xxx 11
is spread while ploughing. However, for the spreading of alltreated products the diversification of spreading techniques wasfound to have marginal influence on the total environmentalimpact.
The alternative scenarios for transport of the final co-productsshowed to have a minimal impact on the final environmental pro-file in the different treatment processes evaluated. More specifi-cally, increases of up to 4% in the final impact were observed for
Please cite this article in press as: Vázquez-Rowe, I., et al. Environmental assesManagement (2015), http://dx.doi.org/10.1016/j.wasman.2015.05.007
the RO&D case study, while in the remaining treatment technolo-gies these were below 2%.
Finally, the change in the energy source to the use of biogas heatfrom the anaerobic digester implied environmental improvementsthat ranged from 52% for the RO&D case study to less than 10% forD&P. In fact, except for RO&D all case studies showed low improve-ments by shifting their energy profile to biogas heat from thedigester.
sment of digestate treatment technologies using LCA methodology. Waste

0
2
4
6
8
10
12
14
BAS-1 D&P BAS-1 D&P BAS-1 D&P
Surface spreading Surface incorpora�on (harrowing) Surface incorpora�on (ploughing)
Pt
CC [HH] CC [Ec] OD TA FE HT POF PMF TET FET MET IR ALO ULO NLT MD FD
0
1
2
3
4
5
6
7
8
BAS-2 Co BAS-2 Co BAS-2 Co
Surface spreading Surface incorpora�on (harrowing) Surface incorpora�on (ploughing)
Pt
CC [HH] CC [Ec] OD TA FE HT POF PMF TET FET MET IR ALO ULO NLT MD FD
0
2
4
6
8
10
12
BAS-3 RO&D BAS-3 RO&D BAS-3 RO&D
Surface spreading Surface incorpora�on (harrowing) Surface incorpora�on (ploughing)
Pt
CC [HH] CC [Ec] OD TA FE HT POF PMF TET FET MET IR ALO ULO NLT MD FD
Fig. 7. Endpoint single score environmental impact results for the selected scenarios considering different spreading techniques (Results reported per FU = 1 tonne ofdigestate entering the treatment plant). NOTE: CC [HH] = climate change – human health; CC [Ec] = climate change – ecosystems; TA = terrestrial acidification; HT = humantoxicity; PMF = particulate matter formation; ALO = agricultural land occupation; ULO = urban land occupation; NLT = natural land transformation; MD = metal depletion;FD = fossil depletion; Other categories = ozone depletion, freshwater eutrophication, photochemical oxidant formation, terrestrial ecotoxicity, freshwater ecotoxicity, marineecotoxicity and ionizing radiation; BAS-1 = baseline scenario (1); BAS-2 = baseline scenario (2); BAS-3 = baseline scenario (3); D&P = drying and pelletizing scenario;Co = composting scenario; RO&D = biological treatment, reverse osmosis and drying scenario.
12 I. Vázquez-Rowe et al. / Waste Management xxx (2015) xxx–xxx
4. Discussion
4.1. The importance of holistic environmental perspectives in digestateanalysis
Digestate treatment across different systems shows an interest-ing performance in terms of environmental impacts as comparedto the vast majority of production systems that have been exam-ined in LCA studies to date. Despite the higher impact in terms ofresource depletion and emissions linked to climate change, theoverall environmental burdens related to digestate treatment in
Please cite this article in press as: Vázquez-Rowe, I., et al. Environmental assesManagement (2015), http://dx.doi.org/10.1016/j.wasman.2015.05.007
all the systems except for composting were substantially lowerthan for direct spreading of the input digestate, independently ofwhether the raw digestate or the mixed input (see. input descrip-tion in Chapter 2.2) were considered. While it may be argued thatthe endpoint perspective adopted (i.e. hierarchist) may skew theresults in a certain direction, when all three approaches are con-fronted overall impacts are still considerably lower when digestateis treated. For instance, Fig. 8 shows the effect of using differentendpoint normalisation weighting perspectives on the final resultsfor the three baseline scenarios. Further discussion on weightingscenarios is included in Section 4.2.
sment of digestate treatment technologies using LCA methodology. Waste
02468
101214161820
Egalitarian Hierarchist Individualist Egalitarian Hierarchist Individualist Egalitarian Hierarchist Individualist
BAS-1 BAS-2 BAS-3
CC [HH] CC [Ec] OD TA FE HT POF PMF TET FET MET IR ALO ULO NLT MD FD
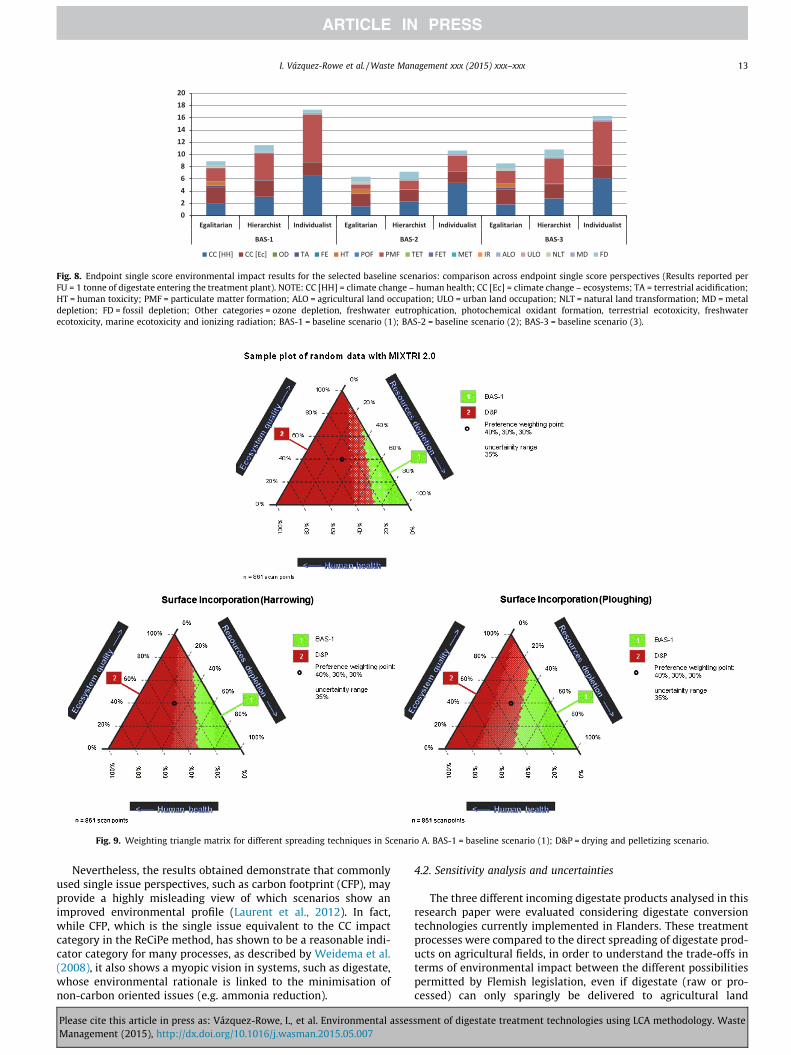
Fig. 8. Endpoint single score environmental impact results for the selected baseline scenarios: comparison across endpoint single score perspectives (Results reported perFU = 1 tonne of digestate entering the treatment plant). NOTE: CC [HH] = climate change – human health; CC [Ec] = climate change – ecosystems; TA = terrestrial acidification;HT = human toxicity; PMF = particulate matter formation; ALO = agricultural land occupation; ULO = urban land occupation; NLT = natural land transformation; MD = metaldepletion; FD = fossil depletion; Other categories = ozone depletion, freshwater eutrophication, photochemical oxidant formation, terrestrial ecotoxicity, freshwaterecotoxicity, marine ecotoxicity and ionizing radiation; BAS-1 = baseline scenario (1); BAS-2 = baseline scenario (2); BAS-3 = baseline scenario (3).
Fig. 9. Weighting triangle matrix for different spreading techniques in Scenario A. BAS-1 = baseline scenario (1); D&P = drying and pelletizing scenario.
I. Vázquez-Rowe et al. / Waste Management xxx (2015) xxx–xxx 13
Nevertheless, the results obtained demonstrate that commonlyused single issue perspectives, such as carbon footprint (CFP), mayprovide a highly misleading view of which scenarios show animproved environmental profile (Laurent et al., 2012). In fact,while CFP, which is the single issue equivalent to the CC impactcategory in the ReCiPe method, has shown to be a reasonable indi-cator category for many processes, as described by Weidema et al.(2008), it also shows a myopic vision in systems, such as digestate,whose environmental rationale is linked to the minimisation ofnon-carbon oriented issues (e.g. ammonia reduction).
Please cite this article in press as: Vázquez-Rowe, I., et al. Environmental assesManagement (2015), http://dx.doi.org/10.1016/j.wasman.2015.05.007
4.2. Sensitivity analysis and uncertainties
The three different incoming digestate products analysed in thisresearch paper were evaluated considering digestate conversiontechnologies currently implemented in Flanders. These treatmentprocesses were compared to the direct spreading of digestate prod-ucts on agricultural fields, in order to understand the trade-offs interms of environmental impact between the different possibilitiespermitted by Flemish legislation, even if digestate (raw or pro-cessed) can only sparingly be delivered to agricultural land
sment of digestate treatment technologies using LCA methodology. Waste
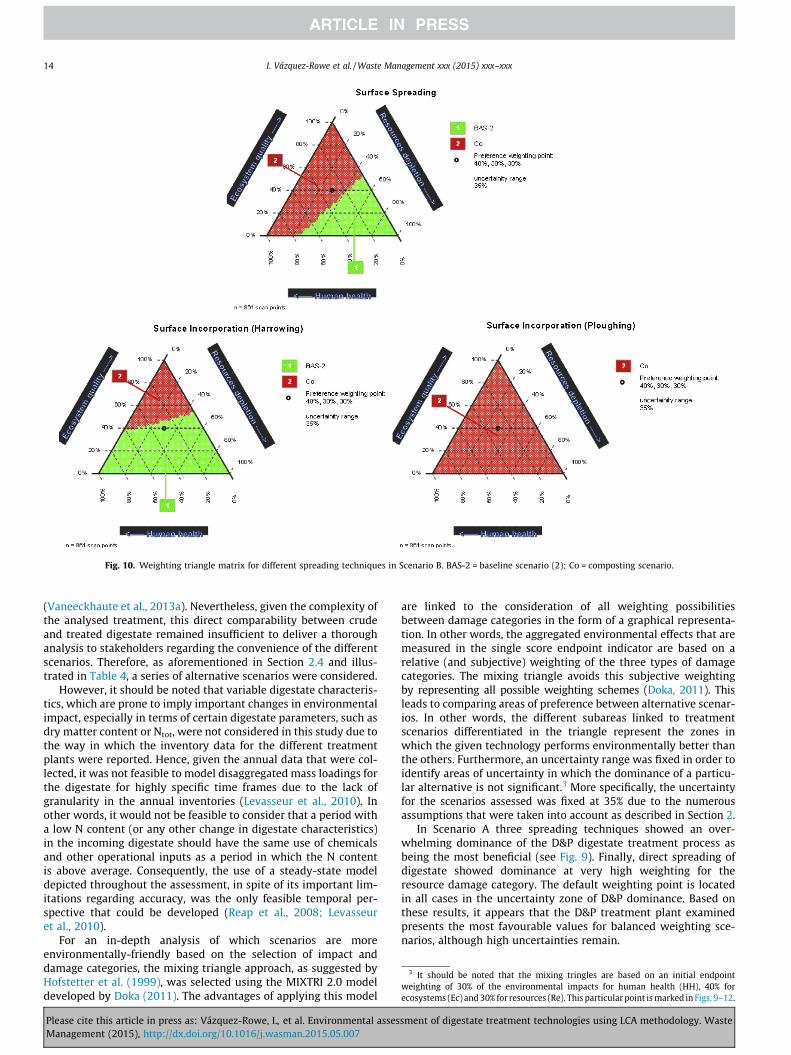
Fig. 10. Weighting triangle matrix for different spreading techniques in Scenario B. BAS-2 = baseline scenario (2); Co = composting scenario.
3 It should be noted that the mixing tringles are based on an initial endpointweighting of 30% of the environmental impacts for human health (HH), 40% forecosystems (Ec) and 30% for resources (Re). This particular point is marked in Figs. 9–12.
14 I. Vázquez-Rowe et al. / Waste Management xxx (2015) xxx–xxx
(Vaneeckhaute et al., 2013a). Nevertheless, given the complexity ofthe analysed treatment, this direct comparability between crudeand treated digestate remained insufficient to deliver a thoroughanalysis to stakeholders regarding the convenience of the differentscenarios. Therefore, as aforementioned in Section 2.4 and illus-trated in Table 4, a series of alternative scenarios were considered.
However, it should be noted that variable digestate characteris-tics, which are prone to imply important changes in environmentalimpact, especially in terms of certain digestate parameters, such asdry matter content or Ntot, were not considered in this study due tothe way in which the inventory data for the different treatmentplants were reported. Hence, given the annual data that were col-lected, it was not feasible to model disaggregated mass loadings forthe digestate for highly specific time frames due to the lack ofgranularity in the annual inventories (Levasseur et al., 2010). Inother words, it would not be feasible to consider that a period witha low N content (or any other change in digestate characteristics)in the incoming digestate should have the same use of chemicalsand other operational inputs as a period in which the N contentis above average. Consequently, the use of a steady-state modeldepicted throughout the assessment, in spite of its important lim-itations regarding accuracy, was the only feasible temporal per-spective that could be developed (Reap et al., 2008; Levasseuret al., 2010).
For an in-depth analysis of which scenarios are moreenvironmentally-friendly based on the selection of impact anddamage categories, the mixing triangle approach, as suggested byHofstetter et al. (1999), was selected using the MIXTRI 2.0 modeldeveloped by Doka (2011). The advantages of applying this model
Please cite this article in press as: Vázquez-Rowe, I., et al. Environmental assesManagement (2015), http://dx.doi.org/10.1016/j.wasman.2015.05.007
are linked to the consideration of all weighting possibilitiesbetween damage categories in the form of a graphical representa-tion. In other words, the aggregated environmental effects that aremeasured in the single score endpoint indicator are based on arelative (and subjective) weighting of the three types of damagecategories. The mixing triangle avoids this subjective weightingby representing all possible weighting schemes (Doka, 2011). Thisleads to comparing areas of preference between alternative scenar-ios. In other words, the different subareas linked to treatmentscenarios differentiated in the triangle represent the zones inwhich the given technology performs environmentally better thanthe others. Furthermore, an uncertainty range was fixed in order toidentify areas of uncertainty in which the dominance of a particu-lar alternative is not significant.3 More specifically, the uncertaintyfor the scenarios assessed was fixed at 35% due to the numerousassumptions that were taken into account as described in Section 2.
In Scenario A three spreading techniques showed an over-whelming dominance of the D&P digestate treatment process asbeing the most beneficial (see Fig. 9). Finally, direct spreading ofdigestate showed dominance at very high weighting for theresource damage category. The default weighting point is locatedin all cases in the uncertainty zone of D&P dominance. Based onthese results, it appears that the D&P treatment plant examinedpresents the most favourable values for balanced weighting sce-narios, although high uncertainties remain.
sment of digestate treatment technologies using LCA methodology. Waste

Fig. 11. Weighting triangle matrix for different spreading techniques in Scenario C. BAS-3 = baseline scenario (3); RO&D = biological treatment, reverse osmosis and dryingscenario.
I. Vázquez-Rowe et al. / Waste Management xxx (2015) xxx–xxx 15
For Scenario B the results that are presented were found to bemore straightforward (see Fig. 10). Consequently, as long as sometype of ammonia emission reduction technique is applied on fields,the spreading of dried digestate appears to be more favourablethan the composting of this product. For instance, very highweightings for ecosystem quality, in most cases above 60–65%would be needed to defend the use of composting treatment onthis already pre-treated product.
Scenario C presents the clearest results for analysis, since thedefault weighting point is situated within the RO&D treatmenttechnology in all three spreading techniques.4 In fact, the domi-nance goes beyond the dotted area of uncertainty, as shown inFig. 11, indicating that this dominance is statistically significant.Direct spreading of raw digestate would only show improved envi-ronmental sustainability as compared to its treatment if very highresources and very low human health damage impacts are com-puted, demonstrating that the direct spreading of raw digestate isnot recommended in Flanders for average digestate characterisationvalues.
Based on the joint interpretation of the weighting triangles forall three scenarios, the results suggest that the treatment of rawdigestate shows an overall environmental benefit when comparedto the direct spreading of the digestate provided that a balancedweighting of the damage categories is considered. This statement
4 The ASD scenario was not included in the mixing triangle due to the fact that it isnot based on primary data, but only on bibliographical data.
Please cite this article in press as: Vázquez-Rowe, I., et al. Environmental assesManagement (2015), http://dx.doi.org/10.1016/j.wasman.2015.05.007
is valid across all digestate spreading techniques. However, inScenarios A and B the interpretation is not as clear, since highlevels of pre-treatment (not considered in this study) imply thatfurther digestate treatment is not useful in most spreading tech-nique scenarios. Therefore, composting of the solid fraction doesnot provide environmental gains with respect to direct spreadingof this product, unless undesired spreading techniques (i.e. surfacespreading are applied). Mixed raw and dried digestate examined inScenario A leads to the most complex interpretation, given thepresence of several best-performing techniques in the trianglematrix. In any case, it appears as if digestate treatment of this pro-duct is desirable regardless of the spreading technique for the finalproducts.
When energy scenarios are compared (see Fig. 12), the shift tousing biogas heat as the exclusive energy source for the treatmentprocesses shows important improvements in the benefits of treat-ing digestate rather than direct spreading. In fact, the use of theD&P technology (i.e. D&P-E) in Scenario A and RO&D in ScenarioC present overwhelming dominance over alternative practices.Moreover, despite high uncertainties, the composting of the solidfraction in Scenario B would also entail an environmental improve-ment as compared to direct spreading.
In the same way as most LCA studies, there are importantsources of uncertainties linked to different stages of the LCA thatshould be analysed with care. Some of these have been analysedalready through the modelling of alternative scenarios, as dis-cussed in the previous section, as well as through providing
sment of digestate treatment technologies using LCA methodology. Waste

Fig. 12. Weighting triangle matrix for the different scenarios considering biogas heat as the sole energy carrier in the treatment of digestate. BAS-1 = baseline scenario (1);BAS-2 = baseline scenario (2); BAS-3 = baseline scenario (3); D&P = drying and pelletizing scenario; Co = composting scenario; RO&D = biological treatment, reverse osmosisand drying scenario.
16 I. Vázquez-Rowe et al. / Waste Management xxx (2015) xxx–xxx
discussion on the different endpoint single score perspective thatcan be modelled (see Section 4.1). Nevertheless, uncertainty shouldnot only be viewed in terms of adding variable scenarios to the sys-tem analysed, but also through understanding underlying sourcesof uncertainty linked to the quality of the LCI data, as well as theinherent uncertainties associated with the mathematical computa-tion behind the impact categories selected. For instance, CC com-putation has shown to have substantial limitations related to thetreatment of indirect effects and feedbacks which can lead touncertainties as high as ±40% (IPCC, 2013). In fact, ReCiPe doesnot provide any uncertainty factors for this specific impact cate-gory (ILCD, 2011).
The ILCD recommendations for the selection of impact cate-gories provide a series of guidance that allow getting a general ideaof the main weaknesses and strengths of these categories in termsof uncertainty (ILCD, 2011). Hence, certain impact categorieswithin the ReCiPe LCIA method have been rated positively, giventhe consideration of several uncertainty factors, such as toxicitycategories, PMF, OD or eutrophication and resource categories,whereas others showed certain limitations that should be consid-ered in the interpretation of the results, such as acidification(due to lack of uncertainties provided) or land use (due to the lackof an environmental characterisation model).
5. Conclusions and future outlook
The main aim of this study was to analyse the environmentalfeasibility and risks of using different conversion technologies to
Please cite this article in press as: Vázquez-Rowe, I., et al. Environmental assesManagement (2015), http://dx.doi.org/10.1016/j.wasman.2015.05.007
treat digestate products in Flanders. The results presented in thisstudy prove the convenience of applying conversion technologiesprior to digestate spreading on fields for fertilisation rather thandirectly spreading the raw product, provided that the incomingdigestate product has suffered limited pre-treatment processes.Despite a substantial increase in impacts associated with globalwarming and energy and mineral use, most analysed scenariosimply considerable environmental gains as compared to directspreading, due to the important reductions in air emissions,namely ammonia. Consequently, this study proves the suitabilityof assessing a wide range of impact categories, as a way to under-stand the trade-offs that may occur between different substi-tutable technologies. Moreover, the increase in energy intensitywhen introducing conversion technologies appears to be, despitethe discussed uncertainties, marginal as compared to the environ-mental benefits in other environmental dimensions. Nevertheless,energy environmental impacts may be reduced substantiallythrough changes in the energy source. In a similar way, the useof spreading techniques aimed at minimising the impact of ammo-nia emissions prove to have an important impact on the final inter-pretation of the results.
The use of the Mixing Triangle approach was implemented as away to deliver a clear message to the stakeholders when it comesto decision making on which are the most appropriate technologiesto select based on the average characteristics of digestate inFlanders. In addition, this system allows constructing cooperatedecisions through the prioritisation of the different impact anddamage categories that are considered in the assessment.
sment of digestate treatment technologies using LCA methodology. Waste

I. Vázquez-Rowe et al. / Waste Management xxx (2015) xxx–xxx 17
Nonetheless, it should be noted that further research should beundergone to attain new insights regarding the appropriateness offurther developing these techniques. At first, the development ofdynamic models in order to understand the time dependent beha-viour of the processes included in the life cycle structure(Levasseur et al., 2010, 2012) should be addressed. For instance,the amounts of raw materials used within the treatment processesare linked to a crucial temporal aspect of the functioning of the sys-tem: the characteristics of the incoming digestate. Moreover, asso-ciated emissions during the storage, processing and spreading ofthe products will also suffer important variations that are worthassessing through time.
Secondly, a further study in which the shift from the currentstate-of-the-art regarding digestate treatment technology inFlanders to nutrient recovery is recommended, in order to identifythe benefits of exploiting intermediate products of digestate treat-ment rather than the final mixed products assessed in the currentpublication. It is expected that such an analysis, which is justifiedby the increasing awareness concerning the depletion of phospho-rus and potassium in the mining sector, should allow assessingfrom an environmental perspective the advantages and drawbacksof closing the cycle for the most relevant agricultural nutrients(Vaneeckhaute et al., 2013b).
Finally, a third issue that should be considered in future studiesis an analysis linked to the environmental consequences (conse-quential LCA) of an increase in available fertilising agents obtainedthrough digestate treatment, which can potentially provide a sub-stitute for chemical mineral fertilisers, with the aim of understand-ing how physical flows and their associated environmental impactscan vary in response to changes in market-driven implicationsbeyond the foreground system under analysis (Golkowska et al.,2014; Vázquez-Rowe et al., 2014).
Acknowledgements
This research project was financially supported by the EuropeanCommission within the frame of the INTERREG IVb NWE Project‘‘Accelarating Renewable Energies through valorization ofBiogenic Organic Raw Material (ARBOR)’’. The authors wish toexpress their gratitude to J. de Vries and P. Hoekma (WageningenUniversity), B. Ryckaert (Inagro) and T. Rehl and J. Müller(University of Hohenheim) for valuable scientific exchange.Dr. Ian Vázquez-Rowe would like to thank the GalicianGovernment for financial support (I2C postdoctoral student grantsprogram). Authors with affiliation to the University of Santiago deCompostela (Spain) belong to the Galician Competitive ResearchGroup GRC 2013-032.
Appendix A. Supplementary material
Supplementary data associated with this article can be found, inthe online version, at http://dx.doi.org/10.1016/j.wasman.2015.05.007.
References
Althaus, H.-J., Chudacoff, M., Hischier, R., Jungbluth, N., Osses, M., Primas, A., 2007.Life Cycle Inventories of Chemicals. ecoinvent report No. 8, v2.0. EMPADübendorf, Swiss Centre for Life Cycle Inventories, Dübendorf, CH.
Astrup, T., Tonini, D., Hamelin, L., Wenzel, H., 2011. Environmental assessment ofrenewable energy scenarios towards 2050. Coherent Energy and EnvironmentalSystem Analysis Background Report Part 5. The Danish Council for StrategicResearch Programme Commission on Sustainable Energy and Environment,November 2011.
Bakx, T., Membrez, Y, Mottet, A., Joss, A., Boehler, M., 2009. État de l’art desméthodes (rentables) pour l’élimination, la concentration ou la transformationde l’azote pour les installations de biogaz agricoles de taille petite/moyenne.
Please cite this article in press as: Vázquez-Rowe, I., et al. Environmental assesManagement (2015), http://dx.doi.org/10.1016/j.wasman.2015.05.007
Federal Department for the Environment, Transports, Energy andCommunication (DETEC), Switzerland (in French).
Berglund, M., Borjesson, P., 2006. Assessment of energy performance in the life-cycle of biogas production. Biomass Bioenergy 30, 254–266.
BMU, 2009. Characteristica of renewable energies, numbers and values. Berlin,Germany. <http://www.umweltnundesamt-daten-zur-umwelt.de>.
Brouwer, F., Hellegers, P., Hoogeveen, M., Luesink, H., 1999. Managing NitrogenPollution from Intensive Livestock Production in the EU. Agricultural EconomicsResearch Institute (LEI), The Hague, pp. 23–42.
BS13.05, 2011. Decree Concerning the Protection of Water Against Nitrate Pollutionfrom Agricultural Sources; May 13, 2011. Decree No.: BS13.05.2011-MAP4.
Carozzi, M., Ferrara, R.M., Rana, G., Acutis, M., 2013. Evaluation of mitigationstrategies to reduce ammonia losses from slurry fertilisation on arable lands.Sci. Total Environ. 449, 126–133.
De Mol, R.M., Hilhorst, M.A., 2003. Methaan-, lachgas- en ammoniakemissie bijproductie, opslag en transport van mest. IMAG, Institut voor Milieu- enAgritechniek, Wageningen, The Netherlands (in Dutch).
de Vries, J.W., Groenestein, C.M., de Boer, I.J.M., 2012. Environmental consequencesof processing manure to produce mineral fertilizer and bio-energy. J. Environ.Manage. 102, 173–183.
Decree BS13.05.2011, 2011. Decree Concerning the Protection of Water AgainstNitrate Pollution from Agricultural Sources. May 13, 2011. Decree No.:BS13.05.2011-MAP4.
Doka, G., 2011. MIXTRI 2.0 – an MS Excel 97 VBA Macro to Draw LCA Results in aMixing Triangle (aka ternary plot). 2.0 ed. Zurich. <http://www.doka.ch/EI99/mixtri.htm> (accessed 15.01.11).
Dones, R., Bauer, C., Bolliger, R., Burger, B., Faist Emmenegger, M., Frischknecht, R.,Heck, T., Jungbluth, N., Röder, A., Tuchschmid, M., 2007. Life Cycle Inventories ofEnergy Systems: Results for Current Systems in Switzerland and other UCTECountries. ecoinvent report No. 5. Paul Scherrer Institut Villigen, Swiss Centrefor Life Cycle Inventories, Dübendorf, CH.
EUROBSERV’ER, 2012. Baromètre Biogaz. Systèmes Solaires, le journal des énergiesrenouvelables. <http://www.eurobserv-er.org/pdf/baro200b.pdf> (in French).
European Council, 1991. Council Directive of 12 December 1991 Concerning theProtection of Waters Against Pollution Caused by Nitrates from AgriculturalSources (91/676/EEC). <http://eur-lex.europa.eu/LexUriServ/LexUriServ.do?uri=CELEX:31991L0676:EN:HTML> (accessed 11.09.13).
Fabbri, C., Soldano, M., Piccinini, S., 2010. The farmer believes in biogas and thenumber bears this out. Informatore Agrario 66, 63–67.
FERTISTAT, 2012. FERTISTAT database. Fertiliser use statistics. Food and AgricultureOrganization of the United Nations – FAO. <http://www.fao.org/ag/agp/fertistat/index_en.htm> (accessed 16.09.13).
Forbes, E.G.A., Easson, D.L., Woods, V.B., McKervey, Z., 2005. An evaluation ofmanure treatment systems designed to improve nutrient management. A reportto the expert group on alternative use of manures. Agri-food and BioscienceInstitute, Hillsborough, p. 114.
Frischknecht, R., Jungbluth, N., Althaus, H.J., et al., 2007. Implementation of LifeCycle Impact Assessment Methods. ecoinvent report No. 3, v2.0. Swiss Centrefor Life Cycle Inventories, Dübendorf.
Goedkoop, M., Heijungs, R., Huijbregts, M., Schryver, A.D., Struijs, J., Zelm, R.V., 2009.ReCiPe 2008. A life cycle impact assessment method which comprisesharmonised category indicators at the midpoint and the endpoint level.Report I: Characterisation, Ministry of Housing, Spatial Planning andEnvironment (VROM). <http://www.lcia-recipe.info>.
Golkowska, K., Vázquez-Rowe, I., Benetto, E., Koster, D., 2012. Life cycle assessmentof ammonia stripping treatment of biogas digestate. In: 4th InternationalSymposium on Energy from Biomass and Waste, Venice, 2012.
Golkowska, K., Vázquez-Rowe, I., Lebuf, V., Accoe, F., Koster, D., 2014. Assessing thetreatment costs and the fertilizing value of the output products in digestatetreatment systems. Water Sci. Technol. 69, 656–662.
Groupe Gemix, 2009. Quel mix énergétique idéal pour la Belgique aux horizons2020 et 2030? Rapport finale. <http://economie.fgov.be/fr/binaries/rapport_gemix_2009_fr_tcm326-76356.pdf> (accessed 10.02.15) (in French).
Hamelin, L., Wesnæs, M., Wenzel, H., Petersen, B.M., 2011. Environmentalconsequences of future biogas technologies based on separated slurry.Environ. Sci. Technol. 45, 5869–5877.
Hofstetter, P., Braunschweig, A., Mettier, T., Müller-Wenk, R., Tietje, O., 1999. Themixing triangle: correlation and graphical decision support for LCA-basedcomparisons. J. Ind. Ecol. 3, 97–115.
Holm-Nielsen, J.B., Al Seadi, T., Oleskowicz-Popiel, P., 2009. The future of anaerobicdigestion and biogas utilization. Bioresour. Technol. 100, 5478–5484.
ILCD, 2010. General guide for Life Cycle Assessment – Detailed guidance. EuropeanCommission, Joint Research Centre, Institute for Environment andSustainability.
ILCD, 2011. Recommendations for Life Cycle Impact Assessment in theEuropean Context – Based on Existing Environmental Impact AssessmentModels and Factors. International Reference Life Cycle Data System, ISBN978-92-79-17451-3.
IPCC, 2006. IPCC Guidelines for National Greenhouse Gas Inventories, vol. 4.Agriculture, Forestry and other Land Use. Intergovernmental Panel on ClimateChange.
IPCC, 2013. Climate Change 2013. The Physical Science Basis. Working Group I.Contribution to the Fifth Assessment Report of the Intergovernmental Panel onClimate Change. Intergovernmental Panel on Climate Change.
ISO, 2002. ISO/TS 14048:2002. Environmental management – Life cycle assessment– Data documentation format. International Standards Organization.
sment of digestate treatment technologies using LCA methodology. Waste

18 I. Vázquez-Rowe et al. / Waste Management xxx (2015) xxx–xxx
ISO 14040-44, 2006. Environmental management – Life cycle assessment –Principles and framework. International Organization for Standardization.
Laurent, A., Olsen, S.I., Hauschild, M.Z., 2012. Limitations of carbon footprint asindicator of environmental sustainability. Environ. Sci. Technol. 46, 4100–4108.
Laurent, A., Bakas, I., Clavreul, J., Bernstad, A., Niero, M., Gentil, E., Hauschild, M.Z.,Christensen, T.H., 2014. Review of LCA studies of solid waste managementsystems – Part I: Lessons learned and perspectives. Waste Manage. 34, 573–588.
Lauwers, J., Appels, L., Thompson, I.P., Degrève, J., Van Impe, J.F., Dewil, R., 2013.Mathematical modelling of anaerobic digestion of biomass and waste: powerand limitations. Prog. Energy Combust. 39, 383–402.
Lebuf, V., Accoe, F., Vaneeckhaute, C., et al., 2012. Nutrient recovery from digestates:techniques and end-products. In: 4th International Symposium on Energy fromBiomass and Waste, Venice, 2012.
Levasseur, A., Lesage, P., Margni, M., Deschenes, L., Samson, R., 2010. Consideringtime in LCA: Dynamic LCA and its application to global warming impactassessments. Environ. Sci. Technol. 44, 3169–3174.
Levasseur, A., Lesage, P., Margni, M., Samson, R., 2012. Biogenic carbon andtemporary storage addressed with dynamic life cycle assessment. J. Ind. Ecol.17, 117–128.
Lootsma, A., Raussen, T., 2008. Aktuelle verfahren zur aufbereitung undverwertung von gärresten. In: Wiemer, K., Kern, M. (Eds.). Bio- undSekundärrohstoffverwertung. Stofflich – energetisch III. Witzenhausen-Institut– Neues aus Forschung und Praxis, pp. 559–576 (in German).
Mezzullo, W.G., McManus, C., Hammond, G.P., 2013. Life cycle assessment of asmall-scale anaerobic digestion plant from cattle waste. Appl. Energy 102, 657–664.
Nemecek, T., Kägi, T., Blaser, S., 2007. Life cycle inventories of agriculturalproduction systems. Final report ecoinvent v2.0 No. 15. Swiss Centre for LifeCycle Inventories, Dübendorf, Switzerland.
Oenema, O., Velthof, G.L., Verdoes, N., Groot Koerkamp, P.W.G., Monteny, G.J.,Bannink, A., van der Meer, H.G., van der Hoek, K.W., 2000. Forfaitaire warden
Please cite this article in press as: Vázquez-Rowe, I., et al. Environmental assesManagement (2015), http://dx.doi.org/10.1016/j.wasman.2015.05.007
voor gasvormige stikstofverliezen uit stallen en mestopslagen. Alterra,Wageningen, The Netherlands (in Dutch).
Petterson, S.A., Ashbolt, N.J., 2003. Guidelines for the Safe Use of Wastewater andExcreta in Agriculture Microbial Risk Assessment. World Health Organization(WHO).
Prapasponga, T., Christensen, P., Schmidt, J.H., Thrane, M., 2010. LCA ofcomprehensive pig manure management incorporating integrated technologysystems. J. Clean. Prod. 18, 1413–1422.
Reap, J., Roman, F., Duncan, S., Bras, B., 2008. A survey of unresolved problems in lifecycle assessment. Part 2: impact assessment and interpretation. Int. J. Life CycleAssess. 13, 374–388.
Rehl, T., Müller, J., 2011. Life cycle assessment of biogas processing treatmenttechnologies. Resour. Conserv. Recy. 56, 92–104.
Smet, J., Debruyne, J., Deckx, J., Deboosere, S., 2003. Manure treatment according tothe Trevi-concept. Commun. Agric. Appl. Biol. Sci. 68, 125–131.
Spielmann, M., Bauer, C., Dones, R., Tuchschmid, M., 2007. Transport Services.ecoinvent report No. 14. Swiss Centre for Life Cycle Inventories, Dübendorf,2007.
Vaneeckhaute, C., Meers, E., Michels, E., Buysse, J., Tack, F.M.G., 2013a. Ecologicaland economic benefits of the application of bio-based mineral fertilizers inmodern agriculture. Biomass Bioenergy 49, 239–248.
Vaneeckhaute, C., Meers, E., Michels, E., Ghekiere, G., Accoe, F., 2013b. Closing thenutrient cycle by using bio-digestion waste derivatives as synthetic fertilizersubstitutes: a field experiment. Biomass Bioenergy 55, 175–189.
Vázquez-Rowe, I., Marvuglia, A., Rege, S., Benetto, E., 2014. Applying consequentialLCA to support energy policy: land use change effects of bioenergy production.Sci. Total Environ. 472, 78–89.
VLM, 2012. Flemish Manure Agency. Fertilisation restrictions on grasslandand arable land. <http://www.vlm.be/SiteCollectionDocuments/Publicaties/mestbank/bemestingsnormen_2012.pdf> (accessed 01.06.13) (in Flemish).
Weidema, B.P., Thrane, M., Christensen, P., Schmidt, J., Løkke, S., 2008. Carbonfootprint. J. Ind. Ecol. 12 (1), 3–6.
sment of digestate treatment technologies using LCA methodology. Waste