environmental and safety risk assessment in...
TRANSCRIPT

ENVIRONMENTAL AND SAFETY RISK ASSESSMENT
IN MINES
A THESIS SUBMITTED IN FULFILLMENT OF THE REQUIRMENTS FOR
THE DEGREE OF
BACHELOR OF TECHNOLOGY
IN
MINING ENGINEERING
BY
SAURABH JAIN
DEPARTMENT OF MINING ENGINEERING NATIONAL INSTITUTE OF TECHNOLOGY
ROURKELA, ORISSA - 769008 2007

ENVIRONMENTAL AND SAFETY RISK ASSESSMENT
IN MINES
A THESIS SUBMITTED IN FULFILLMENT OF THE REQUIRMENTS FOR THE DEGREE OF
BACHELOR OF TECHNOLOGY
IN MINING ENGINEERING
BY
SAURABH JAIN
UNDER THE GUIDANCE OF
Dr. D.P.TRIPATHY &
Prof. B.K.PAL
DEPARTMENT OF MINING ENGINEERING NATIONAL INSTITUTE OF TECHNOLOGY
ROURKELA, ORISSA - 769008 2007

NATIONAL INSTITUTE OF TECHNOLOGY
ROURKELA
CERTIFICATE
This is to certify that the thesis entitled, “Environmental and safety risk assessment in mines”
submitted by Sri Saurabh Jain is fulfillment of the requirements for the award of Bachelor of
Technology Degree in Mining Engineering at the National Institute of Technology, Rourkela
(Deemed University) is an authentic work carried out by him under my supervision and
guidance.
To the best of my knowledge, the matter embodied in the thesis has not been submitted to any
other University/ Institute for the award of any Degree or Diploma.
Date:
Prof. B.K.Pal
Dept. of Mining Engineering
National Institute of Technology
Rourkela, 769008

ACKNOWLEDGEMENT
I wish to express my deep sense of gratitude and indebtedness to Dr. D.P.Tripathy,
Department of Mining Engineering, N.I.T Rourkela for introducing the present topic and for his
inspiring guidance, constructive criticism and valuable suggestions throughout the project work.
I would like to express my gratitude to Prof. B.K.Pal (Head of the Department), for his
valuable suggestions and encouragements at various stages of the work.
I am also thankful to all staff members of Department of Mining Engineering, NIT
Rourkela. I am also thankful to Mr. R.B.Thakre, Assistant Manager, Saoner Mine No.1, WCL
for providing me with valuable data and guidelines. I am also thankful to Mr. H.K.Kar, Safety
Officer, Deulbera Colliery, MCL for providing assistance and support.
My understanding of this project work and its concepts would have remained incomplete if
not for the timely assistance, training and guidance of Mr. Rakesh Dubey, Director, and Mr.
Shard, Project Manager, Disaster Management Institute, Bhopal
Last but not least, my sincere thanks to all my friends who have patiently extended all sorts
of help for accomplishing this undertaking.
Date: Saurabh Jain

Chapter 1
Introduction

Chapter 2
Literature Review

Chapter 3
MPQRA

Chapter 4
Case Study

Chapter 5
Computer Modeling

Chapter 6
Recommendations &
Conclusion

Table of Contents
Abstract .............................................................................................................................. (i)
List of Tables.................................................................................................................. (iii)
List of Figures................................................................................................................ (iv)
1.0 Introduction ................................................................................................................ 1
1.1 Sources of Risk .................................................................................................................. 2
1.2 Need for Risk Assessment.................................................................................................. 3
1.3 Objectives .......................................................................................................................... 4
2.0 Literature Review .................................................................................................... 6
2.1 Introduction ....................................................................................................................... 6
2.2 Risk Nomenclature ............................................................................................................ 7
2.3 Quantitative Risk Analysis ............................................................................................... 11
2.4 Qualitative Risk Assessment ............................................................................................. 13
2.5 Hazards and Risk Analysis ............................................................................................... 16
2.5.1 PHA .......................................................................................................................... 16
2.5.2 FMEA ....................................................................................................................... 17
2.5.3 HAZOP ..................................................................................................................... 20
2.5.4 FTA .......................................................................................................................... 24
2.5.5 ETA .......................................................................................................................... 27
2.5.6 Predictive Human Error Analysis .............................................................................. 28
2.5.7 O & S A .................................................................................................................... 29
2.5.8 AEA .......................................................................................................................... 30
2.5.9 Interface Analysis...................................................................................................... 30
2.5.10 STEP Investigation System ..................................................................................... 31
2.6 Environmental Risk Assessment ...................................................................................... 32
2.6.1 Acid Mine Drainage .................................................................................................. 33
2.6.2 Fire Risk Assessment ................................................................................................ 36
2.7 Risk Management ............................................................................................................ 40
2.7.1 Safety Management Systems ..................................................................................... 40
2.7.2 Characteristics of SMS .............................................................................................. 43

3.0 MPQRA ...................................................................................................................... 44
3.1 Scope ............................................................................................................................... 44
3.1.1 Definitions ................................................................................................................ 45
3.2 Component Methods of MPQRA ..................................................................................... 46
3.2.1 Incident Frequencies From Historical Record ............................................................ 46
3.2.2 Description of Technique .......................................................................................... 47
3.2.3 Discussion ................................................................................................................. 49
3.2.4 Risk Measaures ......................................................................................................... 50
4.0 Case Study ................................................................................................................. 53
4.1 Ray Bachra U/G Mine...................................................................................................... 53
4.1.1 Risk Control Hierarchy.............................................................................................. 53
4.1.2 Steps to RMP ............................................................................................................ 54
4.2 Crinum Mine Fire Management Plan ............................................................................... 62
4.2.1 Identified Key Hazards .............................................................................................. 65
5.0 Computer Modelling ............................................................................................ 72
5.1 FaultTree+ 11.0 ............................................................................................................... 73
5.2 Logan Fault & Event Tree Analysis ................................................................................. 74
5.1 Programming Model For Mine Fire.................................................................................. 74
6.0 Recommendations & Conclusion .................................................................. 78
6.1 Recommendations ............................................................................................................ 78
6.2 Conclusion ....................................................................................................................... 78
References .................................................................................................................. 79

ABSTRACT
Mining is a hazardous operation and consists of considerable environmental, health and safety
risk to miners. Unsafe conditions in mines lead to a number of accidents and cause loss and
injury to human lives, damage to property, interruption in production etc. But the hazards cannot
be completely obliterated and thus there is a need to define and reckon with an accident risk level
possible to be presented in either quantitative or qualitative way.
Safety is paramount in the mining environment. The mining industry has for many years focused
on injury prevention at the workplace through procedures and training, and has achieved
considerable success. However, the statistics on major accident events such as fatalities and
reportable incidents has not shown the corresponding levels of improvement. In the area of major
hazards control, the mining industry approach has emphasized mainly on past experiences and
lessons learnt, while other high hazard industries such as the chemical process industry and oil
and gas industry have taken system safety techniques to new highs.
There are various methodologies and techniques related to the study of Risk Assessment, as
profiled in the literature review in the last section. The next step lies in the application of these
tools to create a Risk assessment or Disaster Management plan for the utilization in the mining
scenario. It has been seen that Indian mines have not been applying Risk Assessment to the
desired degree. For the appropriate method to be designed, it is important to address a few basic
questions and design a step wise formulation of questions to be answered.
The objective of hazards and risk analysis is to identify and analyze hazards, the event sequences
leading to hazards, and the risk of hazardous events. Many techniques, ranging from simple
qualitative methods to advanced quantitative methods, are available to help identify and analyze
hazards. The use of multiple hazard analysis techniques is recommended because each has its
own purpose, strengths, and weaknesses. Some of the more commonly used techniques include
preliminary hazard analysis (PHA), failure modes and effects analysis (FMEA), hazard and
operability studies (HAZOP), fault-tree analysis (FTA), and event-tree analysis (ETA).
Environmental risk assessment (ERA) involves the examination of risks resulting from natural
events (flooding, extreme weather events, etc.), technology, practices, processes, products,
agents (chemical, biological, radiological, etc.) and industrial activities that may pose threats to
ecosystems, animals and people. Environmental health risk assessment addresses human health
concerns and ecological risk assessment addresses environmental media and organisms. ERA is
predominantly a scientific activity and involves a critical review of available data for the purpose
of identifying and possibly quantifying the risks associated with a potential threat.
(i)

Identification of an emerging issue or priority for further action can result in a demand for ERA
to determine whether an initial indication of a problem is valid or not. ERA provides the basis for
most legislative and regulatory programs as well as for international agreements to address
identified threats. If a threat to human health or the environment is identified through ERA, risk
management is performed to consider the need to impose measures to control or manage the risk.
A Safety Management System (SMS) consists of comprehensive sets of policies, procedures and
practices designed to ensure that barriers to unwanted incidents are in place, in use and are
effective. An integrated SMS focuses on both the traditional OHS area and on management of
engineering safety. The SMS tends to integrate all aspects of safety into the ongoing activities of
everyone involved in the operations—from the operator to the chief executive officer. The
responsibility for safety is both individual and collective.
FaultTree+ analysis program for Microsoft Windows enables us to analyse the availability and
reliability of both complex and simple systems and is easy and intuitive to use. FaultTree+
provides an integrated environment for performing fault tree analysis, event tree analysis and
Markov analysis. The program is rich in features and can model a wide range of scenarios.
LOGAN for Windows™ allows the construction and analysis of Fault and Event Trees in the
Windows™ Graphical User Interface environment. The option to edit Fault and Event Tree data
files directly is not available in LOGAN for Windows™
but as an alternative the files can be
created or edited using a text editor such as Notepad. The Fault Tree module of LOGAN can also
be used to solve problems expressed in success logic such as Reliability Block Diagrams and
Success Logic Diagrams.
We created two working programs for calculating the event possibility of a mine fire using Fault
Tree and Event Tree analysis. The first program was created using C++ and FaultTree+ 11.0,
latter being used to create the fault tree for the respective problem, and C++ to create the
programming code. The program works on the simple input to a set of questions which are
treated as basic events, and logic gates to compute the eventuality of a Mine Fire.
(ii)
LIST OF FIGURES
Fig. 1.1: Pie chart showing division of hazard distribution
Fig. 2.1: ALARP
Fig. 2.2: Severity Category
Fig. 2.3: Quantification of FTA
Fig. 2.4: FTA for gas explosion
Fig. 2.5: Fire Pump FTA
Fig. 2.6: The basic event tree
Fig. 2.7: ETA for Gas Explosion
Fig. 2.8: Flowchart for ERA
Fig. 2.9: Environmental Index
Fig. 2.10: Fire hazard Matrix
Fig. 2.11: Quantitative Risk Analysis Module
Fig. 2.12: Risk Management Framework
Fig. 2.13: Safety Management System
Fig. 3.1: Stages of Mining Process and Risk Analysis
Fig. 3.2: Historical Approach
Fig. 4.1: Underground Fire Analysis
Fig. 4.2: Surface Fire Analysis
Fig. 5.1 : Fault Tree Using FaultTree+ 11.0 by Isograph Ltd. for Mine Fire Modeling
Fig. 5.2: Event Tree for Mine Fire using FaultTree+ 11.0
(iii)
LIST OF TABLES
Table 1.1: Fatality Rate Per Million Tons Of Coal Production In Select Countries
Table 2.1: Broadly Defined Severity Category Examples
Table 2.2:Severity Category Examples Specific To Mine Safety
Table 2.3: Frequency Category Examples
Table 2.4: Risk Assessment Matrix
Table 2.5: Severity Category
Table 2.6: Probability – Failure Mode
Table 2.7: Guide Words
Table 2.8: Example HAZOP In Electrical Wiring
Table 2.9: Symbols For Fault Tree
Table 4.1: Risk Rating Criteria
Table 4.2: Initial Hazard Identification For Ray- Bachra U/G Mine, CCL
Table 4.3: Identifying Mechanisms Contributing Principal Hazards And Ranking
Table 4.4: Control Measures & Procedures For Respective Mechanisms Contributing
Hazards
Table 4.5: Principle Identified Hazards And Control Procedures
Table 4.6: Fire Action Response Plan
(iv)
1
CHAPTER 1
1. INTRODUCTION
Mining is a hazardous operation and consists of considerable environmental, health and safety
risk to miners. Unsafe conditions in mines lead to a number of accidents and cause loss and
injury to human lives, damage to property, interruption in production etc. But the hazards cannot
be completely obliterated and thus there is a need to define and reckon with an accident risk level
possible to be presented in either quantitative or qualitative way.
Statistic of accident in our mines indicate that though there has been a gradual fall in death rate
per thousand persons employed in mines, it is a matter of great concern that the trend had
remained almost steady for the last two decades or so. Cause-wise analysis of these accidents
also reveals that a few known cause groups have been the major contributors. There is a need to
do something more than traditional measures to make a break through this trend.
There are good reasons for the mining industry to be concerned about risk in mines, in both
qualitative and quantitative terms. Inappropriate shift schedules, excessive working hours,
increased pollution problems, adverse environment & work conditions and lack of training can
increase exposure risk to miners and result in employee fatigue and danger to life of the miners.
The resulting severe economic and social consequences include reduced productivity, higher
accident and occupational disease rates, absenteeism, resignations and increased workers‘
compensation. On the other hand, there are considerable commercial, financial and industrial
relations benefits to be realized from the development and successful implementation of effective
risk assessment. The extent to which employees feel overworked has implications in four areas
of immediate concern to employers: safety in the workplace; job performance; employee
retention; and health-care costs. These can have a significant impact on a mine‘s performance
and on the health and safety of the workforce in a benign work environment.
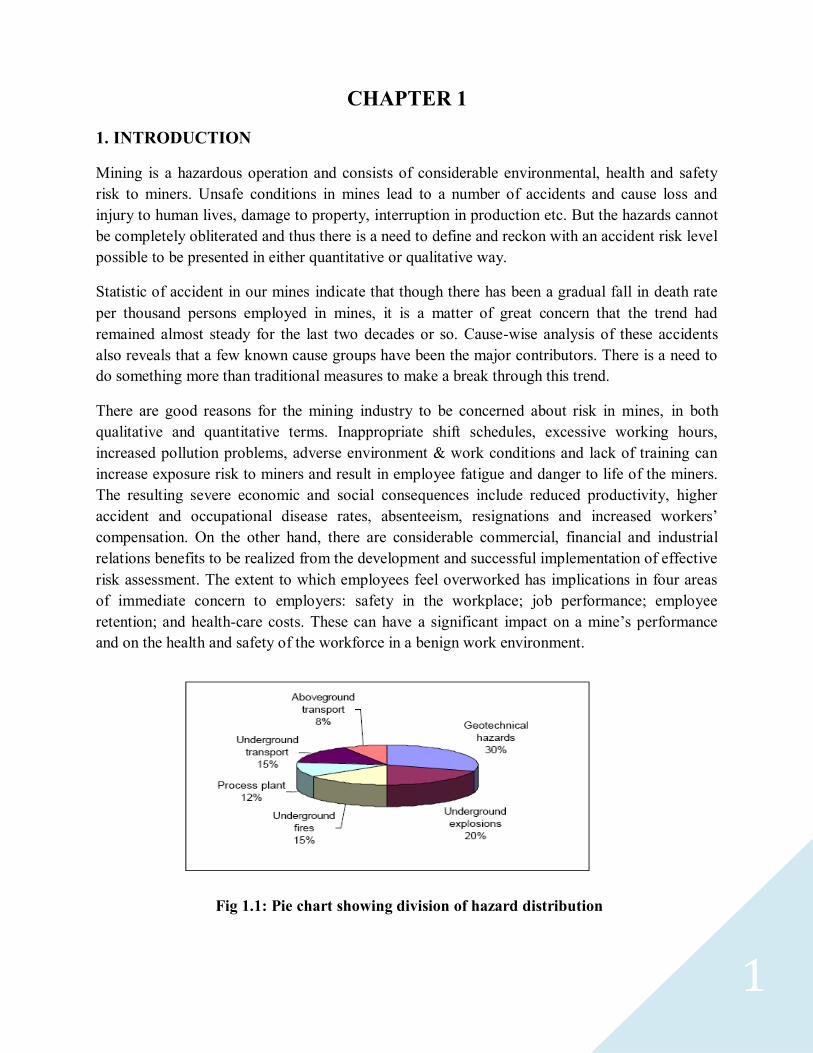
Fig 1.1: Pie chart showing division of hazard distribution

2
1.1 Sources of risk
Open cast mines
Blasting
Inundation
Slope failure
HEMM / dumper movements
Power/ electricity
Parting collapse
Deployment of contractual persons
Fire
Ore handling plant
Underground mines
Inundation
Explosion
Strata / support failure
Presence of gases
Blasting
Machineries
Power / electricity
Parting collapse
Fire
Environment
Acid mine drainage
Fire risk
Toxicity of gases
Water contamination

3
1.2 Need for Risk Assessment
Safety is paramount in the mining environment. The mining industry has for many years focused
on injury prevention at the workplace through procedures and training, and has achieved
considerable success. However, the statistics on major accident events such as fatalities and
reportable incidents has not shown the corresponding levels of improvement. In the area of major
hazards control, the mining industry approach has emphasized mainly on past experiences and
lessons learnt, while other high hazard industries such as the chemical process industry and oil
and gas industry have taken system safety techniques to new highs.
It is pertinent to find answers to the four basic questions as follows:
(i) Are we doing enough in the area of mine safety?
(ii) If the answer is yes, why is this not reflected in the statistics?
(iii) What performance indicators do we have to assure ourselves that what we do is not
only adequate, but effective at the same time? and
(iv) Finally, what else can we do to implement the philosophy of continual improvement,
and learn from the experience of other high hazard industries?
If the answers to the above questions are still not satisfactory then in the view of the necessity of
finding the answers to such questions and to go for different types of safety in mines, various
tools and appropriate steps have to be taken to make mining safe and environment friendly.
Keeping this in view, making workplace safer and better, the project work was undertaken. The
objectives are as follows:
4
1.3 Objectives:
Before the formulation of the risk handling techniques it is important to understand the
conceptual definitions behind risk and its various forms. Various literatures are available for in
depth study on risk assessment in general and mining industries. After understanding the basic
definitions, individual components in the methodology of risk assessment are to be collected and
detailed. These give an insight into formulation of risk assessment modules and methodologies
for a mine working. Safety records for the mining industry in India have been improving over the
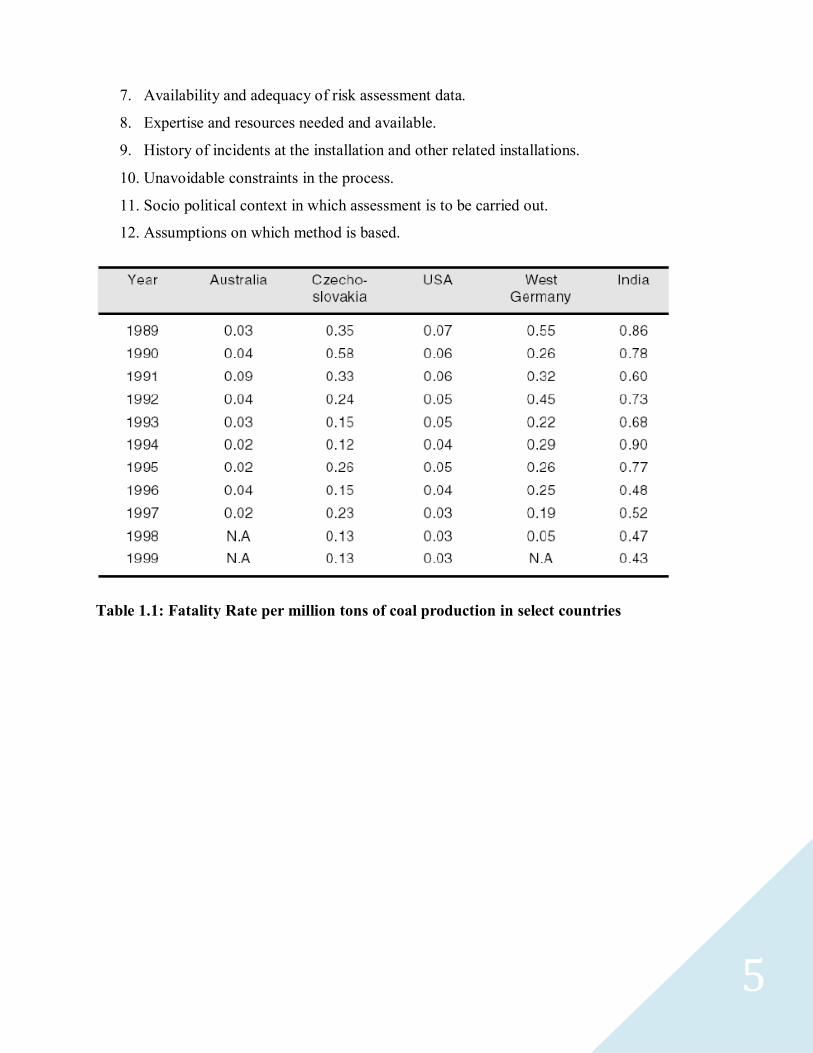
years. However, over 1000 serious accidents still take place every year with over 200 fatalities.
The fatality rate in the coal industry has been brought down by about 30% in the last decade.
Currently, it stands at 0.27 per Mt. of output for CIL mines. Considerable attention is being given
to improve performance in this regard. Compared to some of the advanced coal producing
countries the accident rate in India needs to be further brought down as can be seen in the
following Table 1. In the case of underground coal mines, roof falls continue to be the single
largest cause of accidents, accounting for around 50% of the fatalities underground. Besides
greater emphasis on training and involvement of workmen in all safety related issues, the
industry needs to promote a safety culture leading to inherently safe practices. Risk assessment
and analysis, leading to ―risk management plans‖ should form an integral part of mining at all
stages from planning to execution. Risk management is a continuous process involving
identification of hazards, developing and identifying controls and monitoring the effectiveness of
mining and safety related procedures. With such systems in place it should be possible to further
bring down the accident rate, which is still high compared to some of the advanced mining
countries. Further, to put learning into practice by conducting field work in a nearby mine, by
way of studying all the possible causes of risk, accident rates, and types of accidents. If the mine
is already following a risk assessment method then to see if it is effective in application and
suggest improvements.
There are various methodologies and techniques related to the study of Risk Assessment, as
profiled in the literature review in the last section. The next step lies in the application of these
tools to create a Risk assessment or Disaster Management plan for the utilization in the mining
scenario. It has been seen that Indian mines have not been applying Risk Assessment to the
desired degree. For the appropriate method to be designed, it is important to address a few basic
questions and design a step wise formulation of questions to be answered.
1. What is the scope of Risk Assessment being undertaken?
2. Which type of disaster/ fatality being covered?
3. To what depth do we want to enter the Assessment?
4. Definition of geographical locations.
5. Objective purpose of risk assessment.
6. Estimated nature of risk assessment.
5
7. Availability and adequacy of risk assessment data.
8. Expertise and resources needed and available.
9. History of incidents at the installation and other related installations.
10. Unavoidable constraints in the process.
11. Socio political context in which assessment is to be carried out.
12. Assumptions on which method is based.
Table 1.1: Fatality Rate per million tons of coal production in select countries
6
CHAPTER 2
2. LITERATURE REVIEW
2.1 INTRODUCTION
In this section the literature relegating to the understanding and definition of various types of
risk, risk assessment methodologies and measures undertaken to assess them and certain
examples has been collected and studied.
It involves: Risk Nomenclature, Basic Definition of risk, exposure level, quantitative and
qualitative risk assessment, hazard etc.
PHA: Potential Hazard Analysis
FMEA: Failure Modes and Effects Analysis
HAZOP: Hazard and Operability study
FTA: Fault Tree Analysis
ETA: Event Tree Analysis
PHEA: Potential or Predictive Human Error Analysis
O & SA: Operating and Support Analysis
AEA: Action-Error Analysis
IA: Interface Analysis
STEP: Sequentially Timed Events Plot
Environmental Risk Assessment: Involves study of environmental factors and hazards due to
mining, such as Acid mine drainage, Mine fires, Slope Instability etc. Risk Management:
Incorporates study of risk evaluation, emission and exposure control, and risk monitoring.
The literature has been collected from various mining publications and journals and has been
referenced at the end of the report.
7
2.2 RISK NOMENCLATURE
Risk
(i)As per Oxford dictionary: Risk is ―the chance of or probable danger, and loss, injury or other
adverse consequences to human life‖.
(ii) Risk is defined as ―the probability of injury, disease, or death under specific circumstances.‖
(iii) The chances of something happening that will have an impact on objectives. It is measured
in consequence and likelihood.
Therefore
Risk = Consequence * Probability * Exposure
Where,
Consequence = degree of harm that could be caused to people exposed to the hazard
Exposure = How often and how long people are exposed to the hazard
Probability = Chance that a person will be harmed when they are exposed to the risk
Environmental Risk
Environmental risk is the risk associated with the likelihood or probability that a given chemical
exposure or series of exposures may damage human health. Environmental risk takes two factors
into account: the amount of a chemical present and its relation to the amount the exposed person
can tolerate.
Environmental Risk Assessment
Environmental risk assessment (ERA) involves the examination of risks resulting from natural
events (flooding, extreme weather events, etc.), technology, practices, processes, products,
agents (chemical, biological, radiological, etc.) and industrial activities that may pose threats to
ecosystems, animals and people. Environmental health risk assessment addresses human health
concerns and ecological risk assessment addresses environmental media and organisms. ERA is
predominantly a scientific activity and involves a critical review of available data for the purpose
of identifying and possibly quantifying the risks associated with a potential threat.
Acceptable risk
This is a risk management term. The acceptability of the risk depends on scientific data, social,
economic, and political factors, and the perceived benefits arising from exposure to an agent.

8
Adverse effect
Change in the morphology, physiology, growth, development, reproduction, or life span of an
organism, system, or (sub) population that results in an impairment of functional capacity, an
impairment of the capacity to compensate for additional stress, or an increase in susceptibility to
other influences.
Analysis
Detailed examination of anything complex, made in order to understand its nature or to
determine its essential features.
Assessment
Evaluation or appraisal of an analysis of facts and the inference of possible consequences
concerning a particular object or process.
Assessment end-point
Quantitative/qualitative expression of a specific factor with which a risk may be associated as
determined through an appropriate risk assessment.
Assessment factor
Numerical adjustment used to extrapolate from experimentally determined (dose–response)
relationships to estimate the agent exposure below which an adverse effect is not likely to occur.
Effect assessment
Combination of analysis and inference of possible consequences of the exposure to a particular
agent based on knowledge of the dose–effect relationship associated with that agent in a specific
target organism, system, or (sub)population.
Exposure Concentration or amount of a particular agent that reaches a target organism, system,
or (sub) population in a specific frequency for a defined duration.
Exposure assessment
Evaluation of the exposure of an organism, system, or (sub) population to an agent (and its
derivatives). Exposure assessment is the third step in the process of risk assessment.
Exposure scenario
A set of conditions or assumptions about sources, exposure pathways, amounts or concentrations
of agent(s)involved, and exposed organism, system, or (sub)population (i.e., numbers,
characteristics, habits) used to aid in the evaluation and quantification of exposure(s) in a given
situation.
9
Hazard
Inherent property of an agent or situation having the potential to cause adverse effects when an
organism, system, or (sub)population is exposed to that agent.
Hazard assessment
A process designed to determine the possible adverse effects of an agent or situation to which an
organism, system, or (sub)population could be exposed. The process includes hazard
identification and hazard characterization. The process focuses on the hazard, in contrast to risk
assessment, where exposure assessment is a distinct additional step.
Hazard characterization
The qualitative and, wherever possible, quantitative description of the inherent property of an
agent or situation having the potential to cause adverse effects.
This should, where possible, include a dose–response assessment and its attendant uncertainties.
Hazard characterization is the second stage in the process of hazard assessment and the second of
four steps in risk assessment.
Hazard identification
The identification of the type and nature of adverse effects that an agent has an inherent capacity
to cause in an organism, system, or (sub) population. Hazard identification is the first stage in
hazard assessment and the first of four steps in risk assessment.
Margin of exposure
Ratio of the no-observed-adverse-effect level (NOAEL) for the critical effect to the theoretical,
predicted, or estimated exposure dose or concentration.
Margin of safety
For some experts, margin of safety has the same meaning as margin of exposure, while for
others; margin of safety means the margin between the reference dose and the actual exposure.
Measurement end-point
Measurable (ecological) characteristic that is related to the valued characteristic chosen as an
assessment point.
Risk analysis
A process for controlling situations where an organism, system or population could be exposed
to a hazard. The risk analysis process consists of three components: risk assessment, risk
management, and risk communication.
10
Risk assessment
A process intended to calculate or estimate the risk to a given target organism, system, or
(sub)population, including the identification of attendant uncertainties, following exposure to a
particular agent, taking into account the inherent characteristics of the agent of concern as well as
the characteristics of the specific target system. The risk assessment process includes four steps:
hazard identification, hazard Characterization, exposure assessment, and risk characterization. It
is the first component in a risk analysis process.
Risk characterization
The qualitative and, wherever possible, quantitative determination, including attendant
uncertainties, of the probability of occurrence of known and potential adverse effects of an agent
in a given organism, system, or (sub) population, under defined exposure conditions. Risk
characterization is the fourth step in the risk assessment process.
Risk communication
Interactive exchange of information about (health or environmental) risks among risk assessors,
managers, news media, interested groups, and the general public.
Risk estimation
Quantification of the probability, including attendant uncertainties, that specific adverse effect
will occur in an organism, system, or (sub) population due to actual or predicted exposure.
Risk evaluation
Establishment of a qualitative or quantitative relationship between risks and benefits of exposure
to an agent, involving the complex process of determining the significance of the identified
hazards and estimated risks to the system concerned or affected by the exposure, as well as the
significance of the benefits brought about by the agent. Risk evaluation is an element of risk
management. Risk evaluation is synonymous with risk–benefit evaluation.
Risk management
Decision-making process involving considerations of political, social, economic, and technical
factors with relevant risk assessment information relating to a hazard so as to develop, analyse,
and compare regulatory and non-regulatory options and to select and implement appropriate
regulatory response to that hazard. Risk management comprises three elements: risk evaluation;
emission and exposure control; and risk monitoring.
Risk monitoring
Process of following up the decisions and actions within risk management in order to ascertain
that risk containment or reduction with respect to a particular hazard is assured. Risk monitoring
is an element of risk management.

11
Safety
Practical certainty that adverse effects will not result from exposure to an agent under defined
circumstances. It is the reciprocal of risk.
Safety factor
Composite (reductive) factor by which an observed or estimated no-observed adverse-effect
level (NOAEL) is divided to arrive at a criterion or standard that is considered safe or without
appreciable risk.
Uncertainty
Imperfect knowledge concerning the present or future state of an organism, system, or (sub)
population under consideration.
Uncertainty factor
Reductive factor by which an observed or estimated no-observed-adverse effect level (NOAEL)
is divided to arrive at a criterion or standard that is considered safe or without appreciable risk.
2.3 QUANTITATIVE RISK ANALYSIS
The assessment of risk can be qualitative or quantitative. The latter requires significant specialist
effort, and therefore, the qualitative assessment is often used as being the simpler of the two.
However, the Quantitative Risk Analysis (QRA) provides significant benefits as it not only helps to
identify and rank the risk contributors, but also assists in setting priorities for directing the risk
reduction efforts to achieve optimal outcome.
The QRA integrates all the individual technical studies of the Safety Assessment and evaluates the
risk from operations to personnel. The risk levels calculated are then evaluated against performance
standards to ensure ALARP levels are reached.
The main limitation of QRA is the lack of adequate frequency data for initiating event for the MAE
(e.g. fire or drilling into misfired hole), and dependency on human error failure probability, which
is not available for the mining industry.
Risk Evaluation
There are no formally established regulatory criteria for risk to personnel in the mining industry.
Individual organisations have developed criteria for employee risk, the concepts originally
arising from the chemical process industries and oil and gas industries.
Because of the uncertainties associated with probabilistic risk analysis, used for quantification of
risk levels, the general guiding principle is that the risk be reduced to a level considered As Low
12
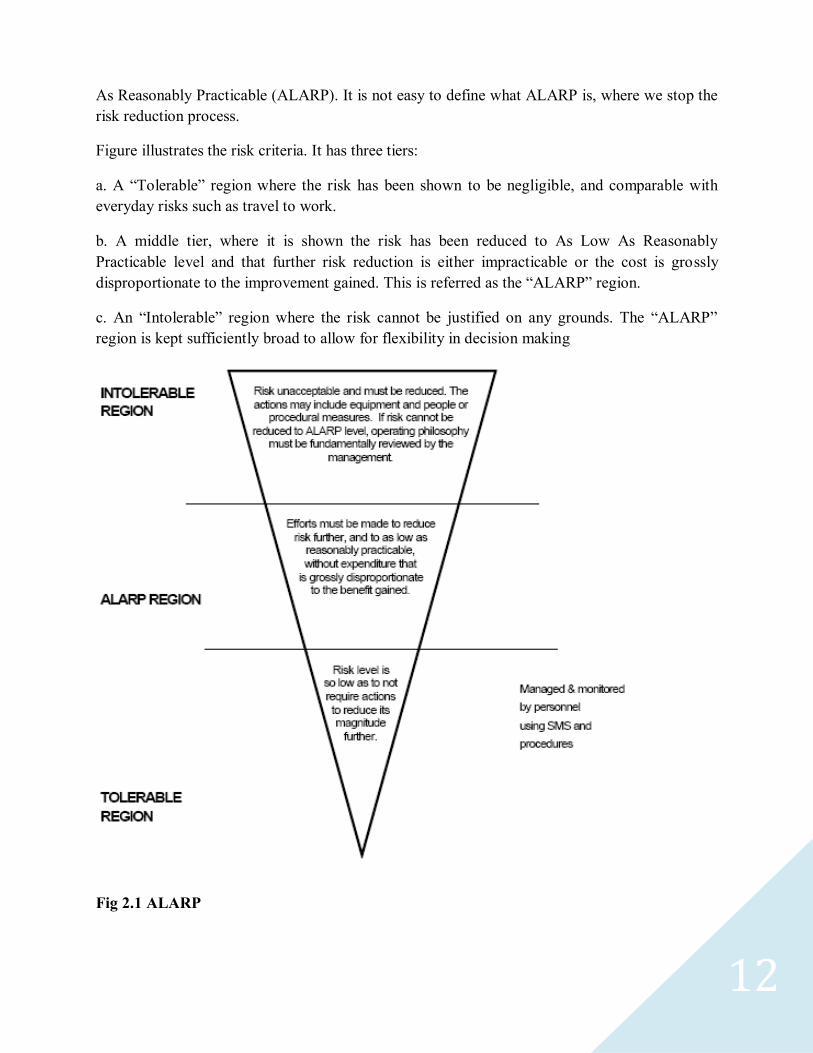
As Reasonably Practicable (ALARP). It is not easy to define what ALARP is, where we stop the
risk reduction process.
Figure illustrates the risk criteria. It has three tiers:
a. A ―Tolerable‖ region where the risk has been shown to be negligible, and comparable with
everyday risks such as travel to work.
b. A middle tier, where it is shown the risk has been reduced to As Low As Reasonably
Practicable level and that further risk reduction is either impracticable or the cost is grossly
disproportionate to the improvement gained. This is referred as the ―ALARP‖ region.
c. An ―Intolerable‖ region where the risk cannot be justified on any grounds. The ―ALARP‖
region is kept sufficiently broad to allow for flexibility in decision making
Fig 2.1 ALARP
13
and allow for positive management initiatives, which may not be quantifiable in terms of risk
reduction.
Some organisations in the process industries and oil and gas industries have set numerical criteria
for risk as demarcation between the tiers. It is not appropriate to apply the criteria from one
industry to another, as the nature of the operations and types of risks are entirely different.
For a well managed mine site, the risk values for underground mining are expected to fall within
the ALARP range. Therefore a demonstration of adequacy of control measures as part of overall
ALARP demonstration is crucial.
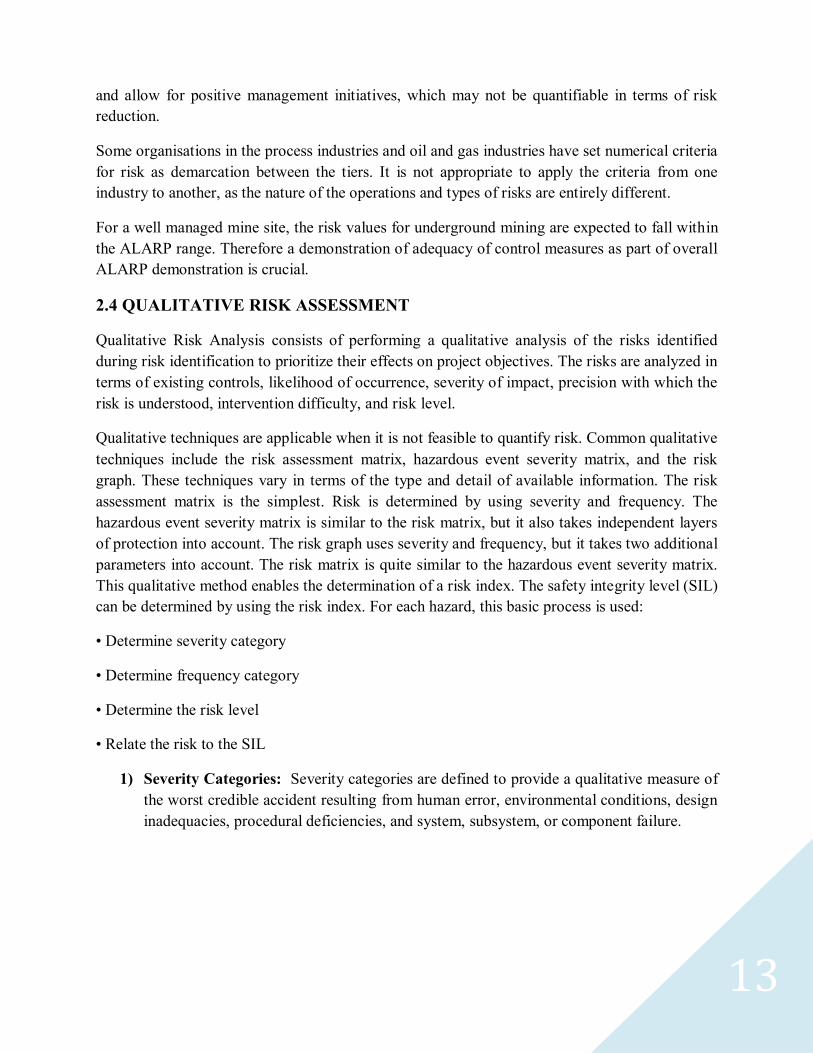
2.4 QUALITATIVE RISK ASSESSMENT
Qualitative Risk Analysis consists of performing a qualitative analysis of the risks identified
during risk identification to prioritize their effects on project objectives. The risks are analyzed in
terms of existing controls, likelihood of occurrence, severity of impact, precision with which the
risk is understood, intervention difficulty, and risk level.
Qualitative techniques are applicable when it is not feasible to quantify risk. Common qualitative
techniques include the risk assessment matrix, hazardous event severity matrix, and the risk
graph. These techniques vary in terms of the type and detail of available information. The risk
assessment matrix is the simplest. Risk is determined by using severity and frequency. The
hazardous event severity matrix is similar to the risk matrix, but it also takes independent layers
of protection into account. The risk graph uses severity and frequency, but it takes two additional
parameters into account. The risk matrix is quite similar to the hazardous event severity matrix.
This qualitative method enables the determination of a risk index. The safety integrity level (SIL)
can be determined by using the risk index. For each hazard, this basic process is used:
• Determine severity category
• Determine frequency category
• Determine the risk level
• Relate the risk to the SIL
1) Severity Categories: Severity categories are defined to provide a qualitative measure of
the worst credible accident resulting from human error, environmental conditions, design
inadequacies, procedural deficiencies, and system, subsystem, or component failure.

14
Table 2.1: Broadly defined severity category examples
catastrophic Death, system loss, severe damage to mine or environment
critical Severe injury, severe occupational illness, major system damage, major mine or
environmental damage
marginal Moderate injury, moderate occupational illness, minor system damage, minor
mine or environmental damage
negligible Minor injury, minor occupational illness, less than minor system damage, less than
minor mine or environmental damage
The severity categories are broad, encompassing severity with respect to personnel safety and
health as well as equipment, mine, and environmental damage. The main focus of this document
is on personnel safety; therefore, the severity category examples in the next table are more
definitive for mining.
Table 2.2:Severity category examples specific to mine safety
catastrophic Death or multiple deaths
Critical Severe injury, permanent disability(partial or total)
Marginal Moderate injury, medical treatment, loss of work days
Negligible Minor injury, first-aid treatment, no lost work days
2) Frequency Categories: A quantitative frequency is generally not possible early in the design
process or might not be known at all. A qualitative frequency may be derived from experience
and evaluation of historical safety data from similar systems. Supporting rationale for assigning a
mishap probability should be documented in hazard analysis reports.
Table 2.3: Frequency category examples
Category Specific individual item frequency
Frequent Likely to occur frequently Once per year
Probable Occurs several times in the life of an item Once in 5 years
Occasional Likely to occur sometimes in the life of an item Once in 10
years
Remote Unlikely, but possible to occur in the life of an item Once in 20

15
years
improbable So unlikely, it can be assumed occurrence may not be
experienced
Once in 50
years
3) Risk Assessment Matrix: This matrix maps the risk index to an SIL. Each cell of the matrix
has a risk index and associated SIL.
Table 2.4: Risk assessment matrix
Catastrophic critical Marginal negligible
frequent A(SIL 3) A(SIL 3) A(SIL 3) B(SIL2)
probable A(SIL 3) A(SIL 3) B(SIL2) C(SIL1)
occasional A(SIL 3) B(SIL2) B(SIL2) C(SIL1)
remote B(SIL2) C(SIL1) C(SIL1) D(NO SIL)
improbable B(SIL2) C(SIL1) C(SIL1) D(NO SIL)
Risk index suggested criteria
A Unacceptable risk
B Undesirable risk
C Acceptable risk with management review and
Approval
D Acceptable risk without management review and
Approval
Risk Assessment and Safety Integrity Level Determination:
Once a hazard or hazardous event is identified and analyzed, the next step is to determine the
associated risk. The level of risk is used to determine which hazards have an unacceptable risk
and which have acceptable risks. Once the risks are identified, the safety performance or degree
of safety to mitigate risk is determined. The safety performance is quantified by assignment of a
level 1, 2, or 3, where 3 is the highest degree of safety performance. These levels are called
safety integrity levels (SILs). It is important to understand that the SIL specifies the safety
performance of a safety-related system function to reduce a given risk to an acceptable level.
16
Risk assessment systematically enables the ―ranking‖ of risks such that efforts can be focused to
eliminate risks or reduce the risks to an acceptable level. Some risks might be classified as
acceptable because they are insignificant or deemed to be at a level that is reasonably practical to
assume. For example, not every single risk associated with driving a car is eliminated, yet most
of us are willing to accept these risks or we wouldn‘t be driving cars. Typically, risk is defined as
the product of severity and frequency. These methods have advantages and disadvantages.
Qualitative risk assessment techniques are relatively simple to understand. They are subjective
and the results may vary depending on the person or team of people conducting the risk
assessment.
These variations result because of variations in experience, knowledge, expertise, and individual
perceptions of risk. Quantitative risk assessment is a rigorous technique based on statistical data.
It requires highly trained and experienced people as well as large quantities of statistical data.
One negative is that the data may not be available. Secondly, the data that are available might not
be an accurate representation for a mining application because it might not have been obtained
for similar conditions of dust, moisture, or vibration. Some of the common qualitative and
quantitative techniques are described next. It is the user‘s responsibility to select the risk
assessment technique that is suitable for the application and user‘s expertise.
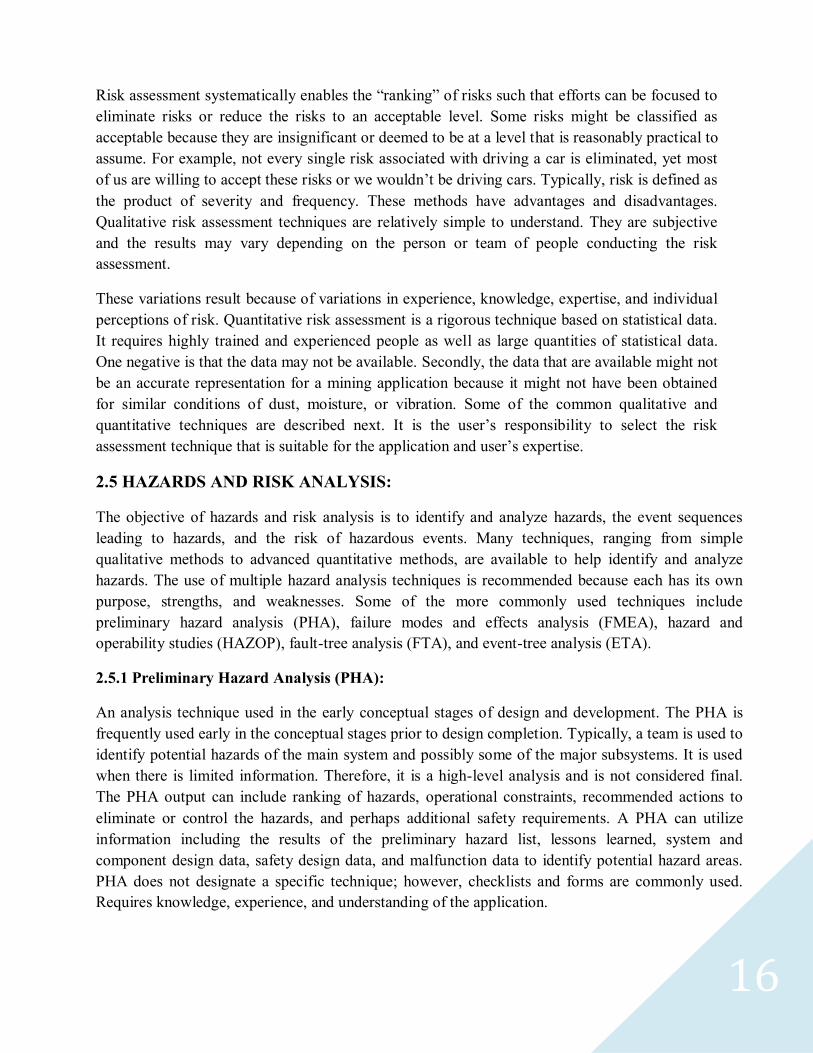
2.5 HAZARDS AND RISK ANALYSIS:
The objective of hazards and risk analysis is to identify and analyze hazards, the event sequences
leading to hazards, and the risk of hazardous events. Many techniques, ranging from simple
qualitative methods to advanced quantitative methods, are available to help identify and analyze
hazards. The use of multiple hazard analysis techniques is recommended because each has its own
purpose, strengths, and weaknesses. Some of the more commonly used techniques include
preliminary hazard analysis (PHA), failure modes and effects analysis (FMEA), hazard and
operability studies (HAZOP), fault-tree analysis (FTA), and event-tree analysis (ETA).
2.5.1 Preliminary Hazard Analysis (PHA):
An analysis technique used in the early conceptual stages of design and development. The PHA is
frequently used early in the conceptual stages prior to design completion. Typically, a team is used to
identify potential hazards of the main system and possibly some of the major subsystems. It is used
when there is limited information. Therefore, it is a high-level analysis and is not considered final.
The PHA output can include ranking of hazards, operational constraints, recommended actions to
eliminate or control the hazards, and perhaps additional safety requirements. A PHA can utilize
information including the results of the preliminary hazard list, lessons learned, system and
component design data, safety design data, and malfunction data to identify potential hazard areas.
PHA does not designate a specific technique; however, checklists and forms are commonly used.
Requires knowledge, experience, and understanding of the application.

17
Advantages:
• Useful at conceptual stages
• Relatively quick to implement
Disadvantage:
• Cannot be used to extensively identify and analyze hazards
2.5.2 Failure Modes and Effects Analysis (FMEA):
This analysis identifies failures of components, subsystems, and their effects on the system. In
essence, it is a ―bottom-up‖ approach starting with the system‘s components. This is a systematic
technique to identify and analyze safety-critical components and subsystems of a system. FMEA
is most effectively conducted during the design phase, thus enabling system design modifications
to eliminate critical components or subsystems.
This is an analytical technique, which explores the effects of failures or malfunctions of
individual components in a system - i.e. "If this part fails, in this manner, what will be the
result?" First the system under consideration must be defined, so that system boundaries are
established. Thereafter the essential questions are:
1. How can each component/part fail?
2. What might cause these modes of failure?
3. What could the effects be if the failures did occur?
4. How serious are these failure modes?
5. How is each failure mode detected?
The level of risk is determined by:
Risk = probability of failure x severity category
Where severity may be categorised thus:
Table 2.5: Severity Category
Category Degree Description
I Minor Functional failure of part of machine or process - no potential
for injury
II Critical Failure will probably occur without major damage to system
or serious injury

18
III Major Major damage to system and/or potential serious injury to
personnel
IV Catastrophic Failure causes complete system loss and/or potential for fatal
injury
And probability may be categorised thus:
A risk assessment matrix may then be prepared
Fig 2.2: Severity Category
Level Probability Description Individual failure mode
A 10-1 Frequent Likely to occur frequently
B 10-2 Probable Likely to occur several times in the life of an item
C 10-3 Occasional Likely to occur sometime in the life of an item
D 10-4 Remote Unlikely to occur but possible
E 10-5 Improbable So unlikely that occurrence may not be experienced
Table 2.6: Probability – Failure mode
19
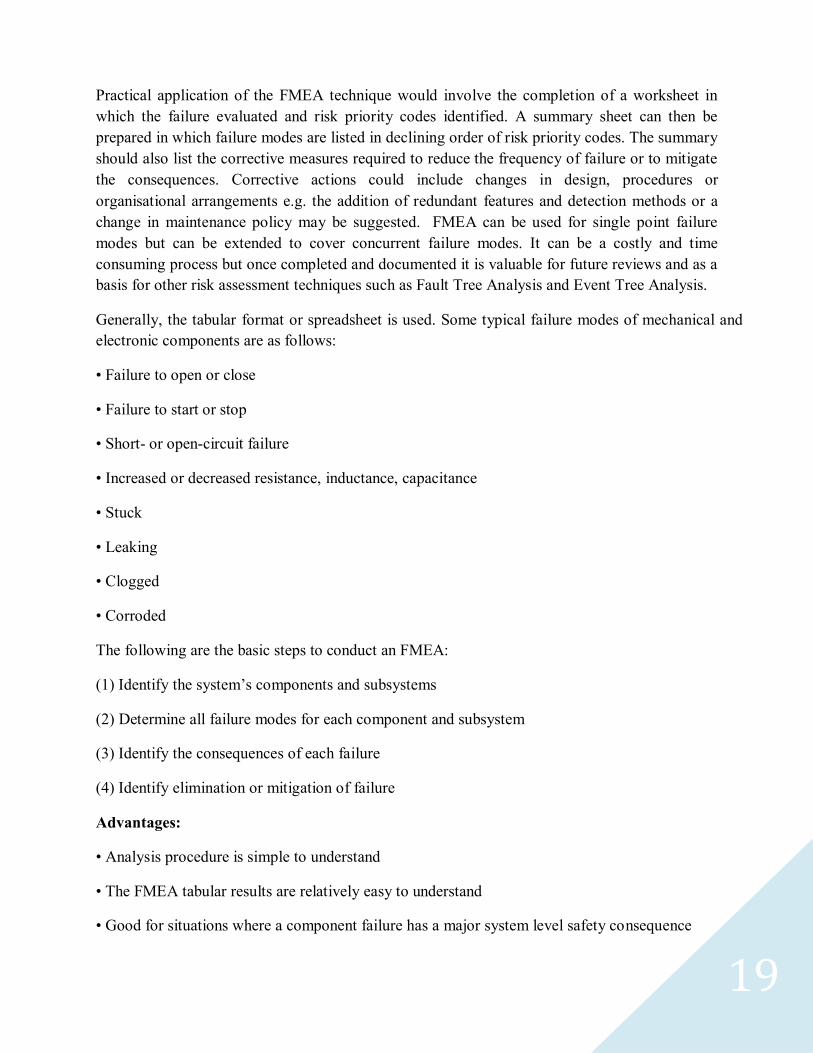
Practical application of the FMEA technique would involve the completion of a worksheet in
which the failure evaluated and risk priority codes identified. A summary sheet can then be
prepared in which failure modes are listed in declining order of risk priority codes. The summary
should also list the corrective measures required to reduce the frequency of failure or to mitigate
the consequences. Corrective actions could include changes in design, procedures or
organisational arrangements e.g. the addition of redundant features and detection methods or a
change in maintenance policy may be suggested. FMEA can be used for single point failure
modes but can be extended to cover concurrent failure modes. It can be a costly and time
consuming process but once completed and documented it is valuable for future reviews and as a
basis for other risk assessment techniques such as Fault Tree Analysis and Event Tree Analysis.
Generally, the tabular format or spreadsheet is used. Some typical failure modes of mechanical and
electronic components are as follows:
• Failure to open or close
• Failure to start or stop
• Short- or open-circuit failure
• Increased or decreased resistance, inductance, capacitance
• Stuck
• Leaking
• Clogged
• Corroded
The following are the basic steps to conduct an FMEA:
(1) Identify the system‘s components and subsystems
(2) Determine all failure modes for each component and subsystem
(3) Identify the consequences of each failure
(4) Identify elimination or mitigation of failure
Advantages:
• Analysis procedure is simple to understand
• The FMEA tabular results are relatively easy to understand
• Good for situations where a component failure has a major system level safety consequence

20
Disadvantages:
• Does not identify common-cause failures
• Does not identify multiple failure combinations
• Human errors during operation and maintenance might be missed
• Can be time-consuming for large, complex system
2.5.3 Hazard and Operability Studies (HAZOP):
A systematic and structured qualitative method of study conducted by a multidisciplinary team.
Guide words are applied to various parameters to stimulate thinking concerning possible deviations.
As a result of these deviations, potential hazards and causes are identified. HAZOP had its
beginnings in the chemical process industry where guide words were designated for process industry
parameters such as flow and pressure. HAZOP can be applied to a system, subsystem, process, or
procedure and also to hardware and software. HAZOP can be easier to implement at the later stages
when designs are firm rather than at conceptual phases. Thus, it is also well suited for hazard
identification and analysis of modifications during the management of change process.HAZOP has
been extended for the hardware and software of programmable systems. Hardware and software
include:
Hardware:
• Analog hardware
• Digital hardware
• Communications
• Electro hydraulic subsystems
• Electromechanical subsystems
• Miscellaneous hardware (e.g., wires, connectors)
Software:
• Software data flow diagrams
• Software state transition diagrams
• Entity relationship diagrams
Guide words are extended with: early, late, before, after. Guide words can be customized for the
user‘s application and system. The guide words are applied to system and subsystem attributes to
identify deviations from the design intent that might create a hazard.
21
The HAZOP should be applied throughout the safety life cycle. Early in the life cycle, HAZOP
should be applied to block diagrams; as the design progresses, HAZOP should be applied to other
system representations, such as electrical schematic diagrams. Many different types of design
representations exist. HAZOP can be applied to the following design representations:
• Block diagrams (electrical, mechanical, hydraulic, etc.)
• Schematic diagrams (electrical, mechanical, hydraulic, etc.)
• State transition diagrams
• Data flow diagrams
• Object-oriented diagrams
• Timing diagrams
• Operating instructions
• Operating tasks
• Maintenance tasks
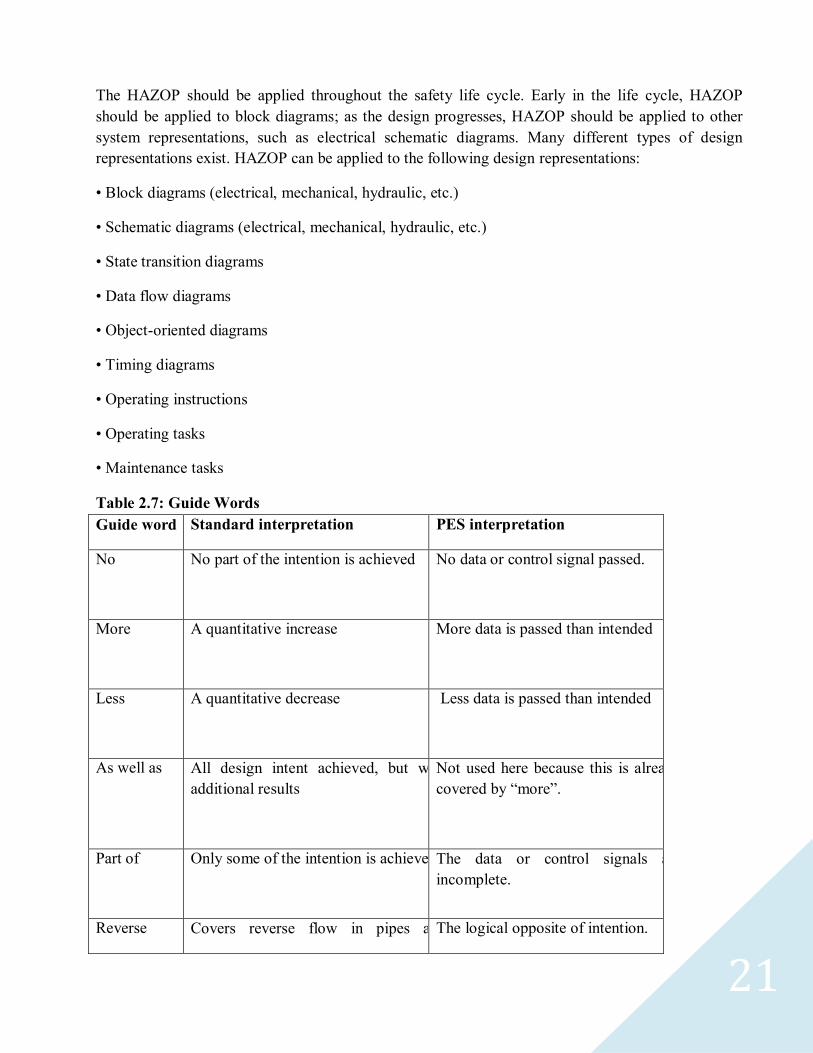
Table 2.7: Guide Words
Guide word Standard interpretation PES interpretation
No No part of the intention is achieved
No data or control signal passed.
More A quantitative increase
More data is passed than intended
Less A quantitative decrease
Less data is passed than intended
As well as All design intent achieved, but with
additional results
Not used here because this is already
covered by ―more‖.
Part of Only some of the intention is achieved
The data or control signals are
incomplete.
Reverse Covers reverse flow in pipes and The logical opposite of intention.

22
reverse chemical reaction.
Other than A result other than the original
intention is achieved
The data or control signals are
complete, but incorrect.
Early Not used The signal arrives too early with
reference to clock time.
Late Not used
The signal arrives too late with
reference to clock time.
Before Not used The signal arrives earlier than
intended within a sequence.
After Not used The signal arrives later than intended
within a sequence.
HAZOP guide word interpretation:
HAZOP is a team-based, qualitative technique that uses guide words applied to parameters in order
to discover deviations from the intended design. The team should be a multidisciplinary collection of
people from technical, organizational, and operational groups. The people are typically highly
qualified by extensive knowledge and experience. Typically, five or six persons are on the team. A
team might be composed of the following:
• Team leader • Senior designer • Safety person • Operation and maintenance person • End user •
Project manager
The length of time to conduct a HAZOP study depends on the size and complexity of the system. For
a small system, it may take a day of preparation and a few days to conduct the team sessions. A large
and complex system may take several days of preparation and a few weeks to conduct the sessions. It
is important for the team leader to keep the team focused on the important safety topics and sections
and to help ensure that common sense and logic prevails. It is very important that a common pitfall
to HAZOP be recognized and dealt with. Often, the study can become quite lengthy, causing the
members to lose interest and commitment. This can result if the team tries to go into too much detail
or tries to be too comprehensive. HAZOP should also be applied at the subsystem levels. This
includes the electromechanical subsystem, electrical communication subsystem, electronic hardware,
and the software.

23
Advantages:
• Very good track record of prior use and success
• Can produce detailed and comprehensive results
• Does not require extensive training or specialized tools
Disadvantages:
• Can be time-consuming for large and complex systems
• Best for short time periods of use because team members can lose effectiveness
Table 2.8: Example HAZOP in electrical wiring
Guide word Example interpretation in electrical wiring
No
Broken or missing wire or connection.
More Excessive voltage or current.
Less Under voltage or current condition.
As well as Noise, interference, or EMI in addition to desired signals
Part of NA
Reverse Circuit polarity is connected backwards or the opposite of the
intention.
Other than Wrong wire or signal.
Early NA

24
2.5.4 Fault-tree Analysis (FTA):
FTA is a logical method of deduction utilizing a graphical depiction of events, faults, or logical
combinations (Boolean expressions such as AND, OR, etc.) thereof. It begins at the top of the fault tree
with an undesirable event. Next, the possible events and logical combinations are developed for the
fault tree until the root causes are determined. The root causes can be triggering events or basic faults.
It is best to use fault trees on the major events because the trees can grow quite large. FTA can be
applied to hardware and to operational modes of the system (i.e., startup, operation, maintenance, and
shutdown).
Fault trees are suited to analysis of static situations; thus, dynamic situations involving timing are
difficult to implement. Also, fault
trees can be qualitative or
quantitative. A quantitative fault
tree uses probabilities for the events
and faults. Finally, the traditional
fault tree for the system hardware
has been extended to software fault-
tree analysis. This is best suited for
analysis of the most critical
software at the module level of
detail. There is a standard set of
graphical symbols to construct the
tree. Additional symbols are used
for special situations. For example,
―transfer in‖ and ―transfer out‖
symbols are used to enable
transition between multiple pages of
fault trees. The basic symbols used
to construct fault trees are shown in
the following table. Table 2.9: Symbols for fault tree
Late NA
Before NA
After NA

25
Advantages:
• Identifies multiple failures
• Identifies multiple events and sequences leading to a hazard
• Identifies common causes
• Provides valuable documentation to aid investigations of mishaps
• Suitable for hardware or software
Disadvantages:
• Can become time-consuming if trees grow very large
• Not suited for timing (dynamic) situations
This is a graphical technique that provides a systematic description of the combinations of possible
occurrences in a system, which can result in an undesirable outcome. This method can combine
hardware failures and human failures. The most serious outcome such as explosion, toxic release, etc.
is selected as the Top Event. A fault tree is then constructed by relating the sequences of events, which
individually or in combination, could lead to the Top Event. This may be illustrated by considering the
probability of a crash at a road junction and constructing a tree with AND and OR logic gates. The tree
is constructed by deducing in turn the preconditions for the top event and then successively for the next
levels of events, until the basic causes are identified.
By ascribing probabilities to
each event, the probability
of a Top Event can be
calculated. This requires
knowledge of probable
failure rates. At an OR gate
the probabilities must be
added to give the probability
of the next event, whereas at
an AND gate, the
probabilities are multiplied.
This is a powerful technique
for identifying the failures
that have the greatest
influence on bringing about
the End Event.
Fig 2.3: Quantification of FTA
26
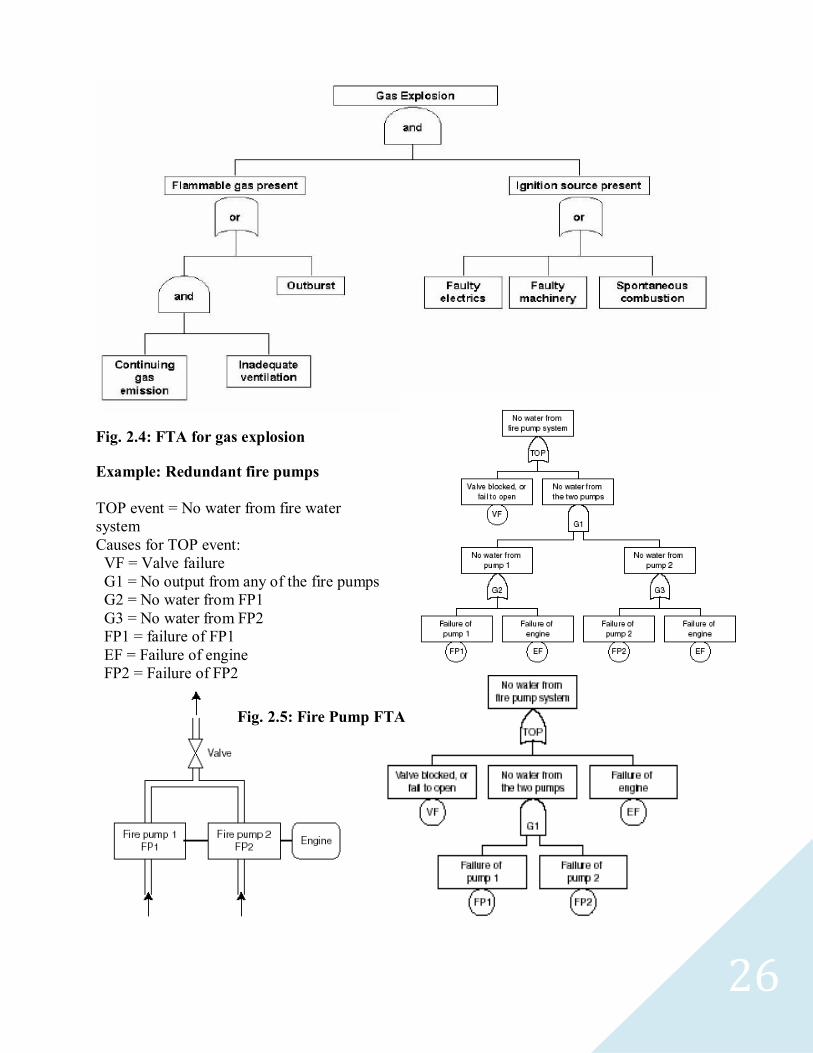
Fig. 2.4: FTA for gas explosion
Example: Redundant fire pumps
TOP event = No water from fire water
system
Causes for TOP event:
VF = Valve failure
G1 = No output from any of the fire pumps
G2 = No water from FP1
G3 = No water from FP2
FP1 = failure of FP1
EF = Failure of engine
FP2 = Failure of FP2
Fig. 2.5: Fire Pump FTA
27
2.5.5 Event-tree Analysis (ETA):
It is a logical, bottom-up graphical technique to determine outcomes from a single initiating
hazardous event. The event tree is useful for determining the probability of each unwanted
outcome resulting from a single initiating event. From this, one can determine which outcomes
are the most severe or occur with the greatest frequency. The safety control measures associated
with the system are used as headings across the top of the tree. The initiating event is then
sequenced through the event tree with the associated control measures. Each control measure has
two paths—operates or fail. Probabilities are determined for each of these paths. Event tree
analysis is based on binary logic, in which an event either has or has not happened or a
component has or has not failed. It is valuable in analyzing the consequences arising from a
failure or undesired event. The consequences of the event are followed through a series of
possible paths. Each path is assigned a probability of occurrence and the probability of the
various possible outcomes can be calculated.
Advantages:
• Well suited for single events with multiple outcomes
• Suited for high risks not amenable to simpler analysis methods
Disadvantages:
• Trees can grow large very quickly
• Probabilities may be difficult to estimate
• Can be extremely time-consuming
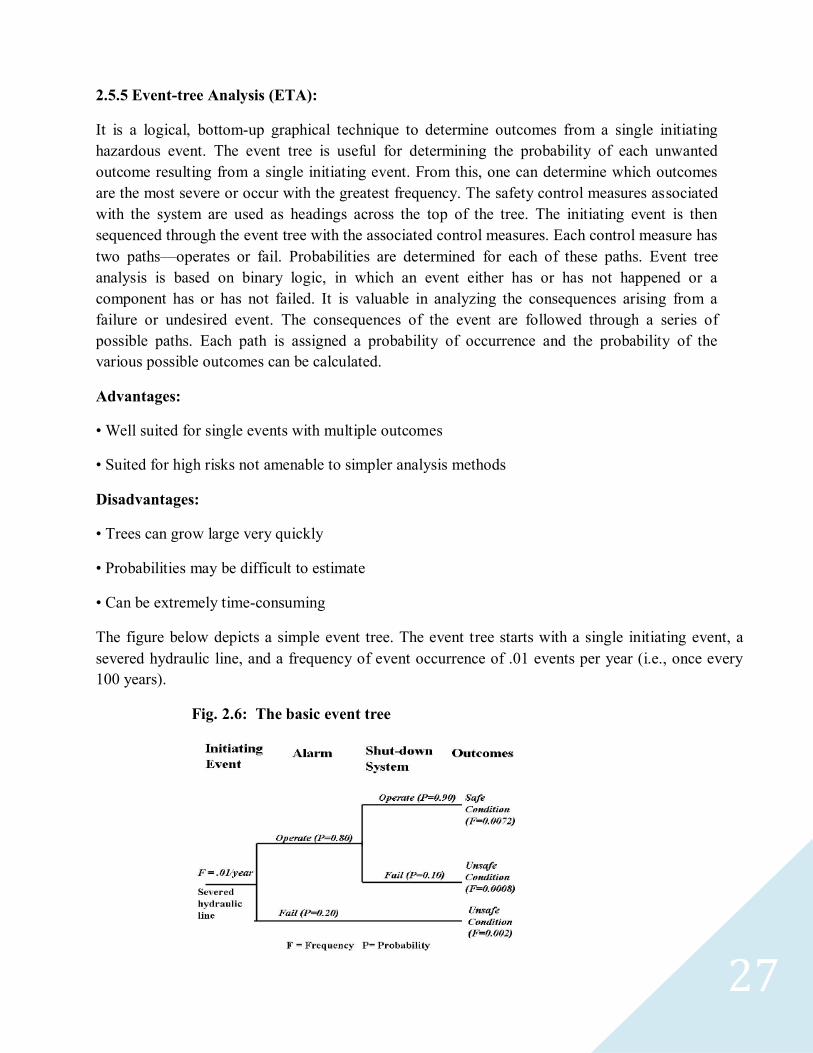
The figure below depicts a simple event tree. The event tree starts with a single initiating event, a
severed hydraulic line, and a frequency of event occurrence of .01 events per year (i.e., once every
100 years).
Fig. 2.6: The basic event tree

28
Fig. 2.7: ETA for Gas Explosion
2.5.6 Potential or Predictive Human Error Analysis:
A team-based method similar in concept to HAZOP; however, this analysis focuses on human tasks
and the associated error potential. Human error causes fall into the following basic categories:
• Complexity – increases the likelihood of error
• Stress – increases the likelihood of error
• Fatigue – increases the likelihood of error
• Environment – adverse environments increase the likelihood of error
• Training – better training reduces the likelihood of error
The members of the team conducting the analysis should consider these error causes as they conduct
the analysis. The basic procedure is as follows:
• Identify key human tasks
• Apply the following guide words for each task:
< Action omitted
< Incomplete action
< Incorrect action timing
< Wrong action

29
< Wrong action sequence
< Wrong selection
< Action applied to the wrong interface object
A worksheet can be used to document the results. It should include the following information:
• Task
• Error guide word(s)
• Description
• Error consequence
• Strategy to prevent or reduce the error consequence
Advantages:
• The method can identify many potential errors
• Validation studies show that a high portion of errors can be identified by thorough application of
the method.
Disadvantages:
• Can be time-consuming if many tasks and actions exist
• Effectiveness depends on the team‘s expertise and effort
2.5.7 Operating and Support Analysis (O&SA):
Operating and Support Analysis seeks to identify hazards during operation and maintenance, find the
root causes, determine the acceptable level of risk, and recommend risk reductions. An
understanding of the operations, environment, and support (maintenance) philosophy (i.e., training,
implementation, etc.) that will be part of the mining process needs to be analyzed. The Operating and
Support Analysis (O&SA) is used to identify hazards that may occur. The O&SA is conducted by a
team familiar with the system‘s operation and interaction with humans. Some of the items to be
considered include:
• Operating during normal and abnormal conditions
• Making changes to the system
• Maintaining the equipment and software
• Testing of the systems

30
• Training personnel on the use and maintenance of the systems
• Providing adequate documentation for the systems
Advantages:
• Provides hazard identification in the context of the entire system operation
Disadvantages:
• Requires a high level of expertise concerning the system
2.5.8 Action-Error Analysis (AEA):
Action-error analysis (AEA) is used to identify operator errors and the subsequent consequences.
AEA specifically focuses on the interactions between humans and the system during operation,
maintenance, and testing. The basic procedure is outlined as follows for operation and maintenance
tasks:
• Identify operator tasks
• Detail the subtasks and actions for each task
• For each action, identify potential operator errors and consequences. As a guide, the following error
types are considered for each action:
< Error of omission (action not taken)
< Wrong sequence of actions
< Temporal errors (actions taken late or early)
< Incorrect actions taken
< Actions applied to the wrong interface object
Advantages:
• Well suited for automated or semi automated processes with operator interfaces
Disadvantages:
• Requires a high level of expertise concerning the system
2.5.9 Interface Analysis:
Interface analysis is used to identify hazards resulting from physical, functional, logical, and
temporal interface incompatibilities. Interface analysis is applicable to all systems and interfaces.

31
Numerous interfaces exist such as human-machine, hardware-software, hardware-hardware, and
system-environment. The types of interface incompatibilities include:
• Environmental (temperature, moisture, dust, and vibration)
• Electrical (EMI, power sources, supply voltages, and data signals)
• Physical (rate and range of movement)
• Logical (conditional responses based on Boolean expressions)
• Temporal (clock times, response times, and delay times) Incompat ibilities can exist between
adjacent, interconnected, interdependent, or interacting system elements.
Advantages:
• Applicable to all systems
• Applicable to all types of interfaces
• Applicable at the subsystem to the component level
Disadvantages:
• Difficult to apply to large or complex systems
• Difficult to find all types of interface incompatibilities for every operation
2.5.10 Sequentially Timed Events Plot (STEP) Investigation System:
STEP is an event-driven approach to define systems, analyze operation, and investigate mishaps.
STEP is an analytical approach that graphically depicts sequentially timed events. Events are defined
with formatted ―building blocks‖ composed of an ―actor and action.‖ The event blocks are
sequentially linked to graphically depict the flow of events that produce an outcome. The graphical
depiction is useful for analyzing and defining events for a given system. STEP analysis can help
discover and analyze problems; the analysis is also useful for assessing mitigation options. STEP is
also used to analyze the types and sequences of events that lead to an incident.
Advantages:
• Can be applied to define and systematically analyze complex systems or processes
• Facilitates focus group analysis
Disadvantages:
• Perceived as complicated and expensive to implement
32
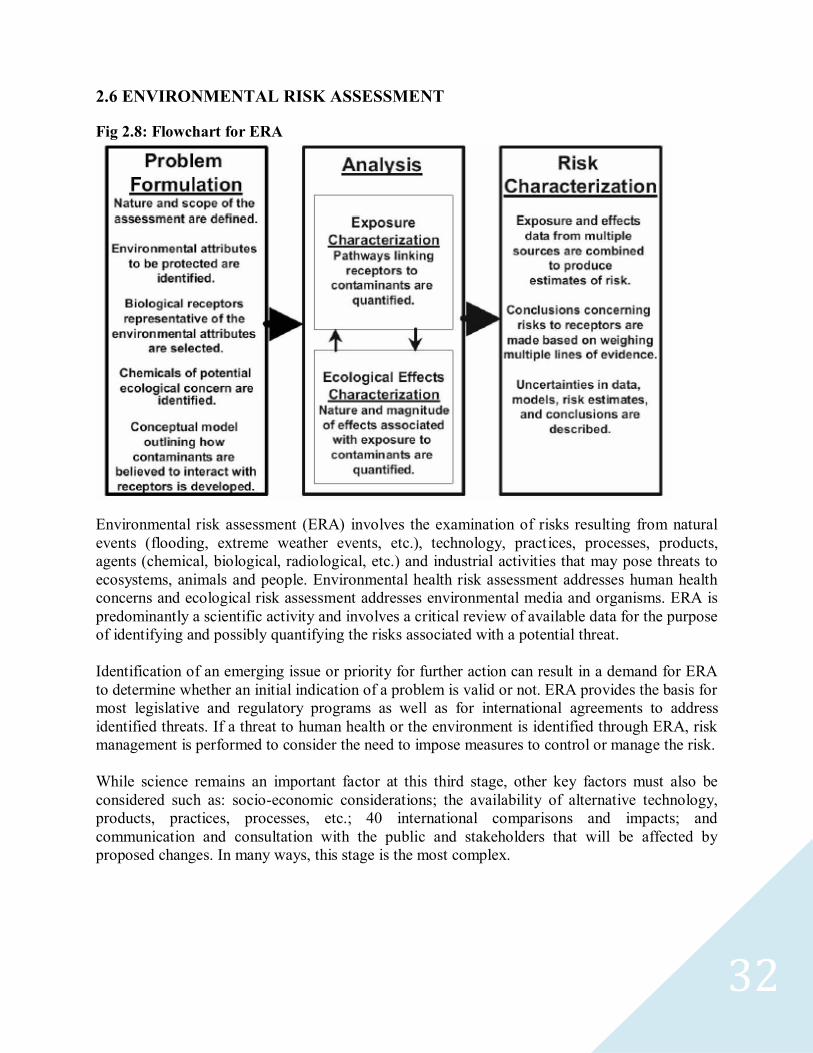
2.6 ENVIRONMENTAL RISK ASSESSMENT
Fig 2.8: Flowchart for ERA
Environmental risk assessment (ERA) involves the examination of risks resulting from natural
events (flooding, extreme weather events, etc.), technology, practices, processes, products,
agents (chemical, biological, radiological, etc.) and industrial activities that may pose threats to
ecosystems, animals and people. Environmental health risk assessment addresses human health
concerns and ecological risk assessment addresses environmental media and organisms. ERA is
predominantly a scientific activity and involves a critical review of available data for the purpose
of identifying and possibly quantifying the risks associated with a potential threat.
Identification of an emerging issue or priority for further action can result in a demand for ERA
to determine whether an initial indication of a problem is valid or not. ERA provides the basis for
most legislative and regulatory programs as well as for international agreements to address
identified threats. If a threat to human health or the environment is identified through ERA, risk
management is performed to consider the need to impose measures to control or manage the risk.
While science remains an important factor at this third stage, other key factors must also be
considered such as: socio-economic considerations; the availability of alternative technology,
products, practices, processes, etc.; 40 international comparisons and impacts; and
communication and consultation with the public and stakeholders that will be affected by
proposed changes. In many ways, this stage is the most complex.

2.6.1 Acid Mine Drainage:
Acid mine drainage (AMD), or acid rock drainage (ARD), refers to the outflow of acidic
water from (usually) abandoned metal mines or coal mines. However, other areas where the
earth has been disturbed (e.g. construction sites, subdivisions, transportation corridors, etc.)
may also contribute acid rock drainage to the environment. In many localities the liquid that
drains from coal stocks, coal handling facilities, coal washeries, and even coal waste tips can
be highly acidic, and in such cases it is treated as acid rock drainage. Acid rock drainage
occurs naturally within most environments as part of the rock weathering process but is
exacerbated by large-scale earth disturbances characteristic of mining and other large
construction activities, usually within rocks containing an abundance of sulfide minerals.
OCCURRENCE
Sub-surface mining often progresses below the water table, so water must be constantly
pumped out of the mine in order to prevent flooding. When a mine is abandoned, the
pumping ceases, and water floods the mine. This introduction of water is the initial step in
most acid rock drainage situations. Tailings piles or ponds may also be a source of acid rock
drainage.
After being exposed to air and water, oxidation of metal sulfides (often pyrite, which is iron-
sulfide) within the surrounding rock and overburden generates acidity. Colonies of bacteria
and archaea greatly accelerate the decomposition of metal ions, although the reactions also
occur in an abiotic environment. These microbes, called extremophiles for their ability to
survive in harsh conditions, occur naturally in the rock, but limited water and oxygen supplies
usually keep their numbers low. Special extremophiles known as acidophiles especially favor
the low pH levels of abandoned mines. In particular, Acidithiobacillus ferrooxidans is a key
contributor to pyrite oxidation.
Metal mines may generate highly acidic discharges where the ore is a sulfide or is associated
with pyrites. In these cases the predominant metal ion may not be iron but rather zinc, copper,
or nickel. The most commonly-mined ore of copper, chalcopyrite, is itself a copper-iron-
sulfide and occurs with a range of other sulfides. Thus, copper mines are often major culprits
of ARD.
CHEMISTRY
The chemistry of oxidation of pyrites, the production of ferrous ions and subsequently ferric
ions, is very complex, and this complexity has considerably inhibited the design of effective
treatment options.
Although a host of chemical processes contribute to ARD, pyrite oxidation is by far the
greatest contributor. A general equation for this process is:
4FeS2(s) + 14O2(g) + 4H2O(l) → 4Fe2+
(aq) + 8SO42-
(aq) + 8H+(aq)
The solid pyrite, when introduced to oxygen and water, is catalyzed to form Iron(II) ions,
sulfate ions, and hydrogen ions. The hydrogen ions bind to the sulfate ions to produce
sulfuric acid.
34
EFFECTS
EFFECTS ON PH
In some ARD systems temperatures reach 120 degrees Fahrenheit (50 °C), and the pH can be
as low as -3.6. ARD-causing organisms can thrive in waters with pH very close to zero.
Negative pH occurs when water evaporates from already acidic pools thereby increasing the
concentration of hydrogen ions.
About half of the coal mine discharges in Pennsylvania have pH under 5 standard units.
However, a significant portion of mine drainage in both the bituminous and anthracite regions
of Pennsylvania is alkaline, because limestone in the overburden neutralizes acid before the
drainage emanates.
HEAVY METAL CONTAMINATION
Many acid rock discharges also contain elevated levels of toxic metals, especially nickel and
copper with lower levels of a range of other heavy metal ions such as lead, arsenic,
aluminium, and manganese. In the coal belt around the south Wales valleys in the UK highly
acidic nickel-rich discharges from coal stocking sites have proved to be particularly
troublesome.
TREATMENT
OVERSIGHT
In the United Kingdom, many discharges from abandoned mines are exempt from regulatory
control. In such cases the Environment Agency working with partners has provided some
innovative solutions, including constructed wetland solutions such as on the River Pelena in
the valley of the River Afan near Port Talbot.
Although abandoned underground mines produce most of the ARD, some recently mined and
reclaimed surface mines have produced ARD and have degraded local ground-water and
surface-water resources. Acidic water produced at active mines must be neutralized to
achieve pH 6-9 before discharge from a mine site to a stream is permitted.
In Canada, work to reduce the effects of ARD is concentrated under the Mine Environment
Neutral Drainage (MEND) program. Total liability from acid rock drainage is estimated to be
between $2 billion and $5 billion CAD. Over a period of eight years, MEND claims to have
reduced ARD liability by up to $400 million CAD, from an investment of $17.5 million
CAD.
METHODS
Carbonate neutralization: Generally, limestone or other calcareous strata that could
neutralize acid are lacking or deficient at sites that produce acidic rock drainage.
Limestone chips may be introduced into sites to create a neutralizing effect. Where
limestone has been used, such as at Cwm Rheidol in mid Wales, the positive impact has
been much less than anticipated because of the creation of an insoluble calcium sulfate
layer on the limestone chips, blinding the material and preventing further neutralization.

35
Ion exchange: Cation exchange processes were investigated as a potential treatment for
ARD. Not only would ion exchangers remove potentially toxic heavy metals from mine
runoff, there was also the possibility of turning a profit off of the recovered metals.
However, the cost of ion exchange materials compared to the relatively small returns, as
well as the inability of current technology to efficiently deal with the vast amounts of
mine discharge, renders this solution unrealistic at present.
Constructed wetlands: Constructed wetlands systems have shown promise as a more
cost-effective treatment alternative to artificial treatment plants. A spectrum of bacteria
and archaea, in consortium with wetland plants, may be used to filter out heavy metals
and raise pH. Anaerobic bacteria in particular are known to be capable of reverting
sulfate ions into sulfide ions. These sulfide ions can then bind with heavy metal ions,
precipitating heavy metals out of solution and effectively reversing the entire process.
Interestingly enough, T. ferrooxidans - the very bacteria which appears to be the problem -
has also been shown to be effective in treating heavy metals in constructed wetland treatment
systems.
The attractiveness of a constructed wetlands solution lies in its passivity - building an
artificial wetlands is a relatively cheap one-time investment which continuously works to
reduce acidity and heavy metal concentration. Although promising, constructed wetlands take
much time to completely cleanse an area, and are simply not enough to deal with extensively
polluted discharge. Constructed wetland effluent often requires additional treatment to
completely stabilize pH. Also, the products of bacterial processes are unstable when exposed
to oxygen, and require special disposal to ensure no further contamination. Other issues
include seasonal variation in the activity of cleansing organisms, as well as the lack of a
practical passive means of moving mine discharge through the most efficient regions of
purification.
Active Treatment with Aeration
In some discharges, HCO3-, a base, enters into the runoff from the breakdown of organic
matter in the mine, such as mine timbers, or from the groundwater interaction with limestone.
The base then neutralizes the acid in the runoff, forming carbonic acid.
H+ + HCO3
- = H2CO3. (1)
When this solution reaches the ground surface, the water is exposed to the air and the
dissolved CO2 will degas into the atmosphere. This lowers the concentration of CO2,
allowing more H2CO3 to decompose, which in turn allows the neutralization of more acid.
H2CO3 = H2O + CO2. (2)
The rise in pH promotes the oxidation of the iron and the formation of iron hydroxide, which
will precipitate out of the solution, leaving little iron left in the water. Large air pumps and
diffuser tubes can be used to allow more CO2 to outgas, and thus precipitate more iron out of
the solution. This explained method can only work, however, for runoff which is naturally
basic.

36
2.6.2 Fire Risk Assessment:
During a risk assessment, hazards are evaluated in terms of the likelihood that a problem may occur
and the damage it might cause. Mine fire preparedness requires consideration of all possible fires that
could occur. However, at a given mine some fires are more likely than others and some would result
in greater damage than would others. Conducting a risk analysis identifies these differences. The
results can be used to target resources at the types of fires that are most likely and/or are most
destructive. Hazards that are very likely to result in fires that would do considerable damage to
people and property should be targeted first for remediation and/or effective response if remediation
isn't possible. Potential fires that are less likely or that would have less severe consequences are
identified for attention later, after the more serious situations have been addressed.
Steps for fire risk assessment:
Step 1: Choose the group that will conduct the analysis: The people involved in this
activity should be knowledgeable about the area of the mine that is being assessed. For
example, at one mine, fire brigade members conducted a fire risk assessment of the entire
property. Alternatively, each crew could analyze their work areas for hazards. Other groups,
like mine rescue teams, fire bosses, safety committee representatives, safety professionals,
and/or supervisors, may be included. If many are people conducting analyses, each should be
assigned to areas he or she knows well. The findings from various sources can be combined
for a detailed mine site analysis.
Step 2: Define the geographic area to be included: Some examples of areas that could be
selected for analysis include a mining section, specific underground areas, the pit, a
maintenance shop, or all of the mine property.
If a large area is selected, it is best to subdivide it into smaller parts and, then, combine the
results later. One way to choose the areas to be included is to ask the group where they think
a fire would cause the most problems. Conduct an analysis of each problem at the area
identified and combines these results to assess the hazards in the larger area.
Step 3: Identify all of the possible fire hazards that exist in the area selected for study:
Start by determining all of the sources of ignition in the study area and organize them with
the help of the attached form called Potential Fires. Notice across the top of this form is labels
for general types of fire like electrical and frictional. Under each general label, trainees
should list all of the specific sources of ignition of this type that can be found in the
geographic area being analyzed. For example, under the label electrical list power centers, fan
motors, etc. and under the frictional label belt rollers or the belt on a motor may be identified.
Be as specific as possible when listing fire hazards.
Step 4: Evaluate the Risks: While there might be many ways of assessing risk, recent
literature suggests using two concepts, that is, probability of occurrence, and severity of
effects. For each fire hazard identified in Step 3, a judgement about the probability of a fire
being caused by that ignition source and the severity of the consequences should be made.
37
The Fire Hazard Risk Matrix can be used to record a risk rating for each fire hazard identified
in the terms high, medium, or low. To use this assessment, several concepts must be
understood:
Hazard - any situation that has fire potential.
Probability - likelihood that the particular hazard will result in a fire.
Severity - an estimation of how serious the potential problem might be in terms of harm to
people and/or damage to property.
It must be remembered when rating to consider secondary incidents that can occur as a result
of the initial incident. For example, a small fire on the surface at an underground coal mine
may cause electric power interruption to one mine fan in a multiple fan ventilation system.
This may, in turn, cause major changes in ventilation underground and result in
accumulations of methane in areas of the mine where it is commonly not found. An explosion
hazard now exists.
In summary, to assess risk:
(a) Identify a source of ignition;
(b) Determine whether the probability is high, medium, or low that this source will actually
cause a fire; and
(c) Determine if the risk of the severity to life, property, and the environment is high,
medium, or low.
Step 5: Use Hazard Ratings During Resource Allocation: According to this risk matrix,
those hazards deemed to have the greatest probability for occurring and the greatest severity
to the operation should be considered as high/high risk hazards. They should be the top
priority for future training, mitigation, and/or response preparation efforts. One way to
organize the findings is to take the completed Fire Hazard Risk Matrix forms, organize them
from high/high risk to low/low risk, and put them in a notebook. Once a hazard is addressed,
the corresponding form can be moved to the back of the notebook, and then the focus should
turn to the next hazard. This process should continue until all identified hazards have been
addressed.
Step 6: The task of risk assessment is an on-going activity: Any time the work
environment changes, update the risk assessment and re-evaluate the priorities. A risk
assessment is most useful if it is never considered finished. Instead, think of it as a draft
document that needs to be up-dated as things change.
Risk Index of Mining Parameters:
Attempts are in progress in certain countries to make the rating of spontaneous fire risk
involved in mining parameters, along with the inherent spontaneous heating tendency of the
coal concerned. Amongst them, the Polish method formulated from statistical analyses of

38
incidences of fires by Olpinski. and that suggested by Feng, Chakravorty and Cochrainc in
Canada and attempts by Banerjee, and Tiwari in India are worth mentioning.
Polish Method:
Olpinski in Poland defined the mining parameters into Seven different types of basic factors,
designated as S1 to S7. They then formulated risk index as:
P =Sz(b)+ (S1+S2 + S3 + S4 + S5 + S6 + S7)
where,
P= Probability of lire risk involved in a particular situation of mining.
S1 = Coal left in mines, goaf.
S2 System method of mining,
S3 = Ventilation method,
S4= Scope for leakage of air within (the goaf etc.),
S5= Degree of wetness of coal seam.
S6= Depth of the concerned mine/ presence of rocks etc.,
S7= intensity/degree of ventilation, and
Sz(b)= Spontaneous heating susceptibility of the coal concerned and rated in the form of
numbers
The degree of spontaneous fire risk involved for different situations from S1 to S7 were
assigned definite numerical values, varying from — 15 to + 15, depending on risk rating. P
values greater than 120 is considered rather unsafe in Polish mining practices and necessary
preventive measures and reorganisation of mining conditions are recommended in such cases.
Canada:
Feng, Chakravorty and Cochraine said:
Fire Risk index =Liability index of the coal x Environmental index.
The spontaneous heating susceptibility of the coal, measures the liability index. They
assessed environmental index by considering only the three mining factors e.g. coal loss,
fissure formation and ventilation pressure difference of the particular situation In case of any
deviation from the normal values of the above factors favouring spontaneous heating they
indicated increment in the values of environmental index and thereby estimated the lire risk
index shown in the following table.
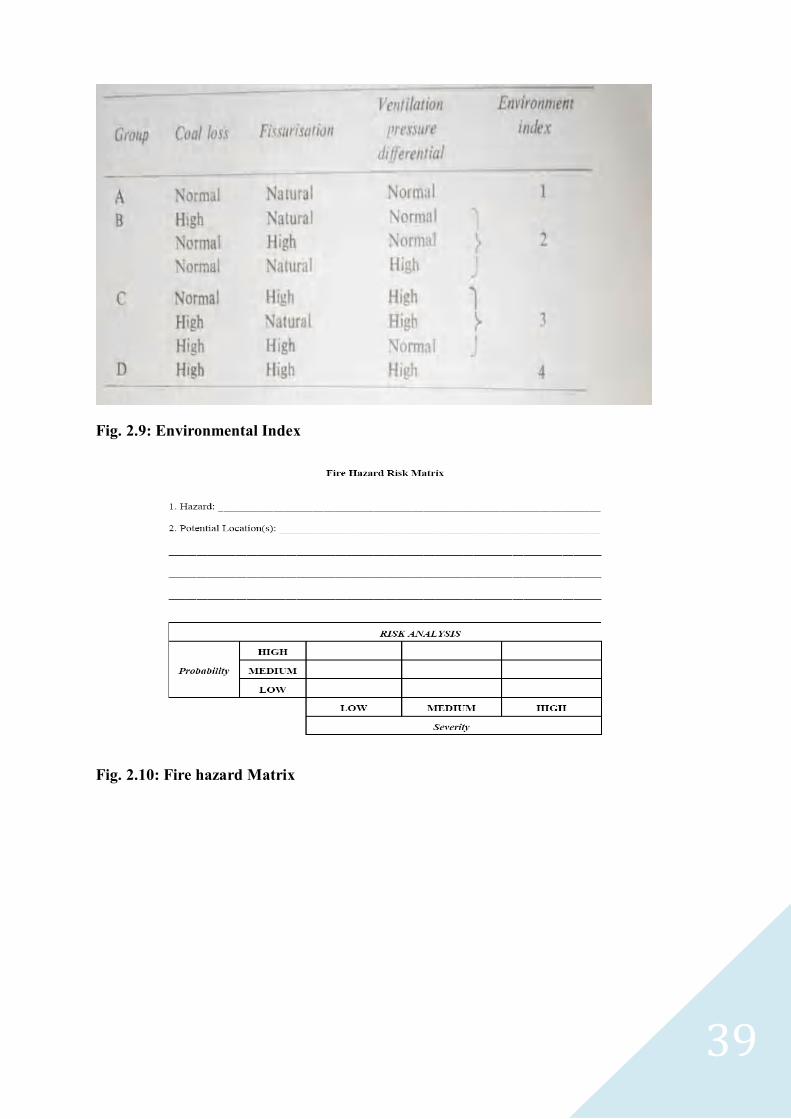
39
Fig. 2.9: Environmental Index
Fig. 2.10: Fire hazard Matrix
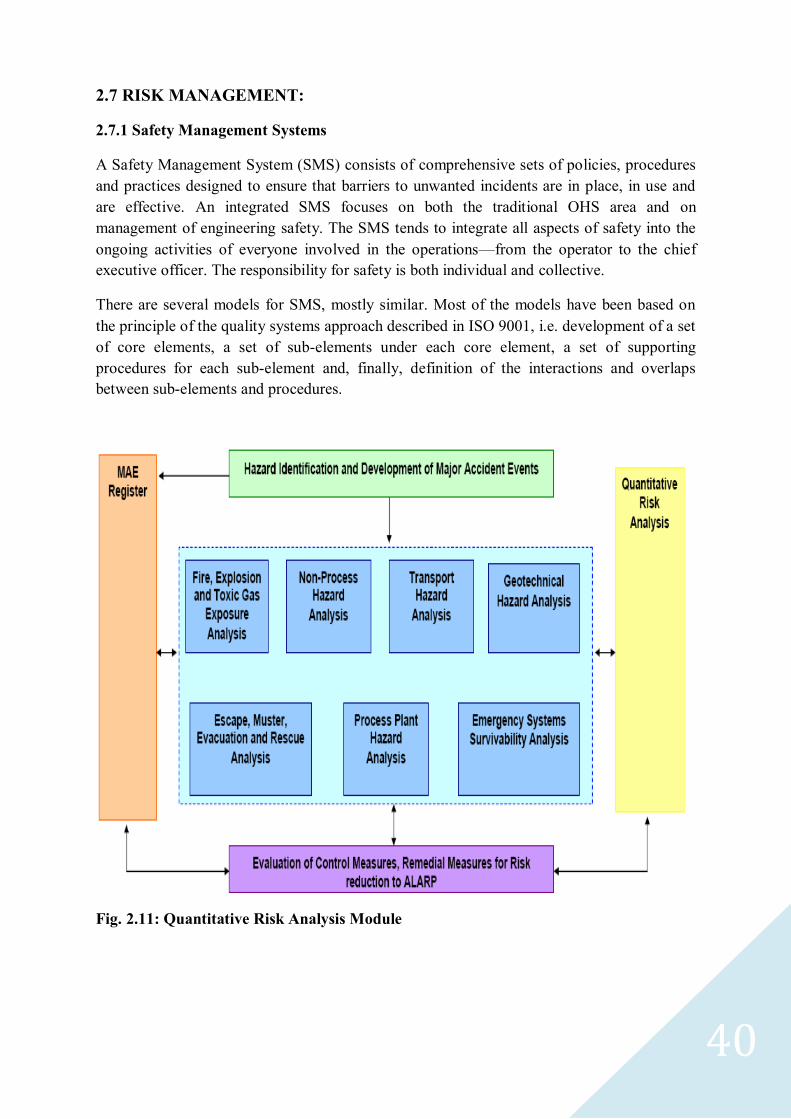
40
2.7 RISK MANAGEMENT:
2.7.1 Safety Management Systems
A Safety Management System (SMS) consists of comprehensive sets of policies, procedures
and practices designed to ensure that barriers to unwanted incidents are in place, in use and
are effective. An integrated SMS focuses on both the traditional OHS area and on
management of engineering safety. The SMS tends to integrate all aspects of safety into the
ongoing activities of everyone involved in the operations—from the operator to the chief
executive officer. The responsibility for safety is both individual and collective.
There are several models for SMS, mostly similar. Most of the models have been based on
the principle of the quality systems approach described in ISO 9001, i.e. development of a set
of core elements, a set of sub-elements under each core element, a set of supporting
procedures for each sub-element and, finally, definition of the interactions and overlaps
between sub-elements and procedures.
Fig. 2.11: Quantitative Risk Analysis Module

41
Fig. 2.12: Risk Management Framework

42
Fig. 2.13: Safety Management System

43
2.7.2 Characteristics of Safety Management Systems
The major characteristics of SMS are:
• It is the principal vehicle for day to day management of all aspects of safety in the
operations.
• Its focus is not only on personnel safety, but also ensuring operational integrity and
minimizing business interruptions, even if no one was injured.
• It outlines a set of procedures for everyone to follow (depending on their roles and
responsibilities, a select set of procedures may apply to each operating group), is system-
dependent and NOT individual-dependent.
• It contains a list of safety critical equipment, and how these are maintained to required
operational integrity through safety critical activities. The activities, procedures, schedules
and responsibilities are defined.
• It lists a set of performance indicators to monitor the integrity of the safety critical activities
being undertaken correctly and according to schedule.
• It outlines an auditing and feedback regime for management control of hazards. It should be
recognised that without a formal well-defined SMS, followed by adequate training,
implementation and monitoring, major hazards are impossible to manage of a PE system.

44
CHAPTER 3 3.0 MPQRA: Mine Process Quantitative Risk Analysis
3.1 Scope
Prevention of human and property losses is integral to the operation and management of
Mining processes. This may be achieved through the selection of a technology that is
inherently safe. Alternatively safety of design and/or operation can be audited by the
application of hazard identification and risk analysis techniques, and adopting measures
suggested by the analysis. The latter approach constitutes Quantitative Risk Analysis (QRA).
This section describes specific techniques that can help in attaining such objectives. The
overall methodology presented in this code allows systematic identification of hazards as well
as quantification of the risks associated with the operation of processes. Applied with the due
expertise and rigor the prescribed methodology can help the user understand the relative
levels of hazards and risk potential in an installation. This aids the selection and prioritization
of necessary strategies for accident prevention and limiting their consequences. Therefore,
the code can be used for improving plant safety performance as well as to reduce human and
property losses.
Risk Analysis is a process that consists of a number of sequential steps as follows:
1. Hazard Identification: Identifying sources of process accidents involving release of
hazardous material in the atmosphere, and the various ways (i.e., scenarios) they
could occur.
2. Consequence Assessment: Estimating the probably zone of impact of accidents as
well as the scale and/or probability of damages with respect to human beings and
plant equipment and other structures.
3. Accident Frequency Assessment: Computation of the average likelihood of accidents.
4. Risk Estimation: Combining accident consequence and frequency to obtain risk
distribution within and beyond a process plant.
The code describes the essential nature of each of above sequence of steps, and describes a
variety of techniques for identifying hazards and the quantification of accident consequence
and frequency towards the final risk estimation.
The QRA is most applicable and provides meaningful results when a mine is built, operated
and maintained as per design intent and good engineering practices.

45
3.1.1 Definitions: With reference to this document the following technical terms used are
interpreted and understood as given below:
Accident A specific unplanned event or sequence of
events that has undesirable consequences.
Basic Event A fault tree event that is sufficiently basic
that no further development is necessary.
Consequence A measure of the expected effects of an
incident.
External Event Event caused by a natural hazard (earth
quake, flood, etc.) or man-induced events
(aircraft crash, sabotage etc.).
Frequency Number of occurrences of an event per unit
of time.
Hazard A characteristic of the system/plant process
that represents a potential for an accident
causing damage to people, property or
environment.
Initiating Event The first event in an event sequence.
Mitigation System Equipment and/or procedures designed to
respond to an accident event sequence by
interfering with accident propagation and/or
reducing the accident consequence.
Probability An expression for the likelihood of
occurrence of an event or an event sequence
during an interval of time or the likelihood
of the success or failure of an event on test
or on demand.
Risk A measure of potential economic loss or
human injury in terms of the probability of
the loss or injury occurring and magnitude
of the loss or injury if it occurs.
Top Event The unwanted event or incident at the top of
a fault tree that is traced downward to more
basic failures using logic gates to determine
causes and likelihood
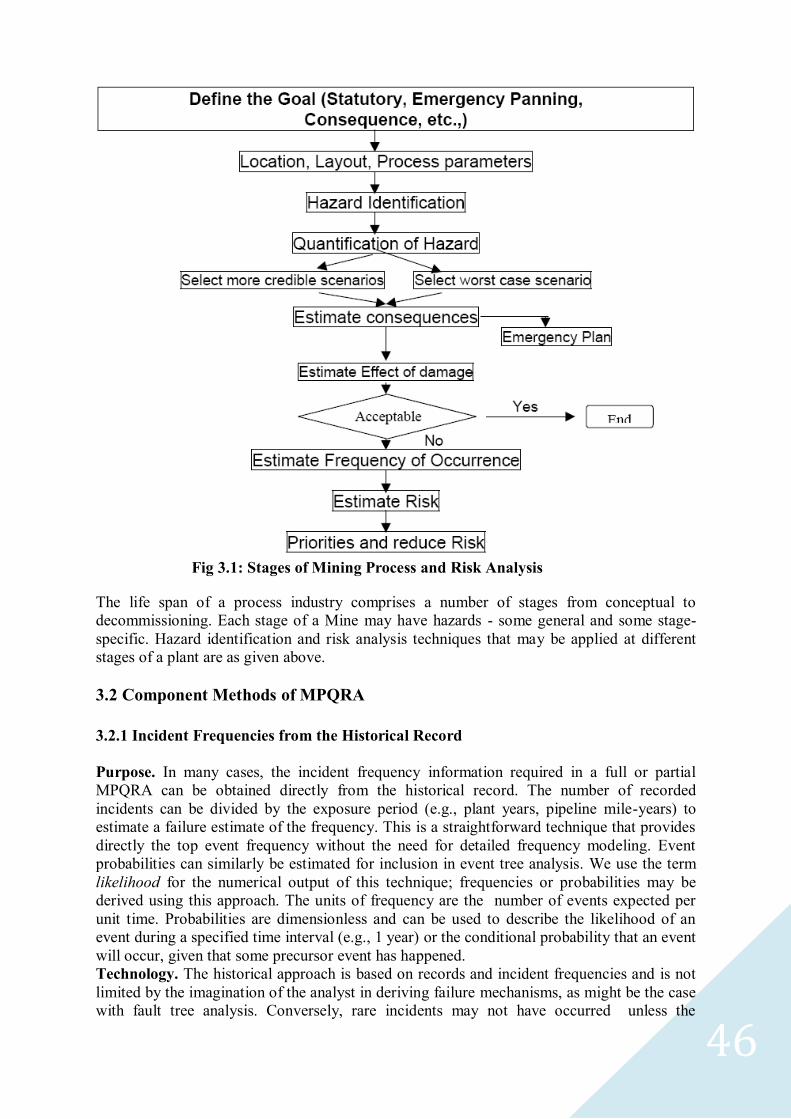
46
Fig 3.1: Stages of Mining Process and Risk Analysis
The life span of a process industry comprises a number of stages from conceptual to
decommissioning. Each stage of a Mine may have hazards - some general and some stage-
specific. Hazard identification and risk analysis techniques that may be applied at different
stages of a plant are as given above.
3.2 Component Methods of MPQRA
3.2.1 Incident Frequencies from the Historical Record
Purpose. In many cases, the incident frequency information required in a full or partial
MPQRA can be obtained directly from the historical record. The number of recorded
incidents can be divided by the exposure period (e.g., plant years, pipeline mile-years) to
estimate a failure estimate of the frequency. This is a straightforward technique that provides
directly the top event frequency without the need for detailed frequency modeling. Event
probabilities can similarly be estimated for inclusion in event tree analysis. We use the term
likelihood for the numerical output of this technique; frequencies or probabilities may be
derived using this approach. The units of frequency are the number of events expected per
unit time. Probabilities are dimensionless and can be used to describe the likelihood of an
event during a specified time interval (e.g., 1 year) or the conditional probability that an event
will occur, given that some precursor event has happened.
Technology. The historical approach is based on records and incident frequencies and is not
limited by the imagination of the analyst in deriving failure mechanisms, as might be the case
with fault tree analysis. Conversely, rare incidents may not have occurred unless the
47
population of items is very large. However, a number of criteria have to be satisfied for the
historical likelihood to be meaningful. These include sufficient and accurate records and
applicability of the historical data to the particular process under review. Provided these
criteria are met, which is often difficult, the frequency information is relatively
straightforward to calculate. Its simplicity should give added confidence to senior
management and others who must review the MPQRA.
Applications. The historical frequency technique is applicable for a number of important
cases in MPQRA. It is often used early in the design stage, before details of systems and
safeguards and defined. Similarly, the technique is ideal where failure causes are very diverse
and difficult to predict, such as with transportation incidents. The simplicity of approach
(given suitability of the data) allows quick, economical frequency estimates to be generated.
Limited safety resources can then be directed to other important parts of consequence
analysis, risk evaluation.
3.2.2. Description of the Technique
The historical approach is summarized by a five-step methodology.
1. Define context.
2. Review source data.
3. Check data applicability.
4. Calculate incident frequency.
5. Validate frequency.
Step 1 Define Context. The historical approach may be applied at any stage of a design—
conceptual, preliminary, or detailed design—or to an existing facility. After the MPQRA has
been defined, the next two steps, system description and hazard identification, should be
completed to provided the details necessary to define the incident list. These steps are
potentially iterative as the historical record is an important input to hazard identification. The
output of this step is a clear specification of the incidents for which frequency estimates are
sought.
Step 2. Review Source Data. All relevant historical data sources should be consulted. The
data may be found in company records, government, or industry group statistics. It is unlikely
that component reliability databases will be of much use for major incident frequencies. The
source data should be reviewed for completeness and independence. Lists of incidents will
almost certainly be incomplete and some judgment will have to be used in this regard. The
historical period must be of sufficient length to provide a statistically significant sample size.
Differences in data gathering techniques and variation in data quality must also be evaluated.
Incident frequencies derived from lists containing only one or two incidents of a particular
type will have large uncertainties. When multiple data sources are used, duplicate incidents
must be eliminated. Sometimes, the data source will provide details of the total plant or item
exposure. Where the exposure is not available, it will have to be estimated from the total
number and age of processes in operation.
Step 3. Check Data Applicability. The historical record may include data over long periods of
time (5 or more years). As the technology and scale may have changed in the period, careful
review of the source data to confirm applicability is important. It is a common mistake for
designers to be overconfident that relatively small design changes will greatly reduce failure
frequencies. In addition, larger scale plants (those that employ new technology such as heat
recovery) or special local environmental factors may introduce new hazards not apparent in
the historical record, It is commonly necessary to review incident descriptions and discard
those failures not relevant to the plant and scenario under review.
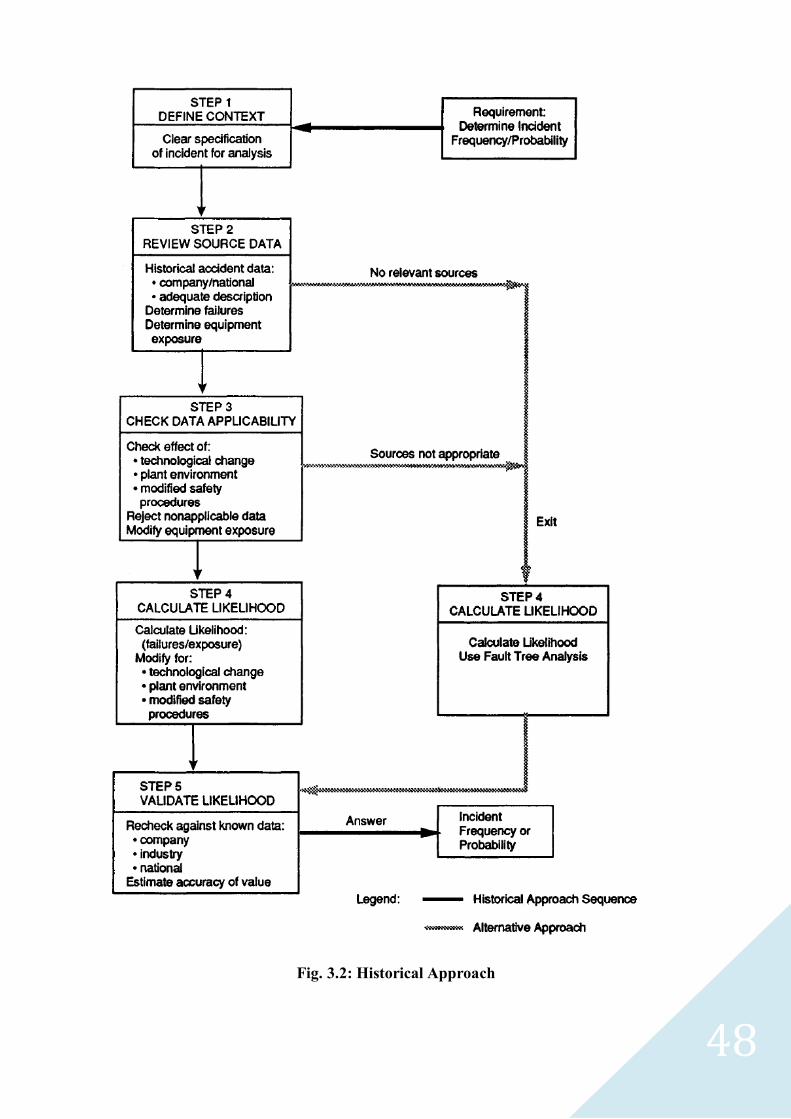
48
Fig. 3.2: Historical Approach

49
Step 4. Calculate Event Likelihood. When the data are confirmed as applicable and the
incidents and exposure are consistent, the historical frequency can be obtained by dividing
the number of incidents by the exposed population. Where the historical data and the mine
under review are not totally consistent, it is necessary to exercise judgment to increase or
decrease the incident frequency.
Step 5. Validate Frequency. It is often possible to compare the calculated incident frequency
with a known population of plant or equipment not used for data generation. This is a useful
check as it can highlight an obvious mistake or indicate that some special feature has not
received adequate treatment.
Theoretical Foundation. The main assumption of the technique is that the historical record
is complete and the population from which the incidents are drawn is appropriate and
sufficiently large for the event likelihoods to be statistically significant. The record of
reported occurrences should include the significant failure modes that are difficult to analyze,
such as human factors, common-cause failures, management systems, and industrial
sabotage.
Input Requirements and Availability. Historical data have diverse sources and may be
difficult to acquire. Data are of two types: incident data and plant or item exposure periods.
Output. The output from this analysis is a numerical value for the event likelihood,
sometimes with an indication of error bounds. In the case of a frequency value, this is
equivalent to the top event value in a fault tree analysis. If the output is a probability (e.g., the
likelihood of a flash fire vs. an unconfined explosion from a flammable vapor cloud), it may
be used directly for risk calculations.
Simplified Approaches. Many analysts use a default set of historical event likelihoods that
they have collected over the years from previous projects and studies. This obviates the need
to go back to original sources when a detailed analysis is not required, and it may be suitable
for MPQRA at an early stage.
3.2.3 Discussion:
Strengths and Weaknesses. The main strength of the technique is that the use of historical
event data, where the accumulated experience is relevant and statistically meaningful, has
great "depth‖ as it will include most significant routes leading to the event. Also, it has a high
degree of credibility with non specialist users, who have to base important decisions on the
MPQRA. The main weakness relates to accuracy and applicability. Technological change,
either in the scale of plant or the design (materials, process chemistry, energy recovery) may
make some historical data inapplicable.
Identification and Treatment of Possible Errors. The main source of error in the
estimation of likelihoods for the historical record is the use of data that are inappropriate or
too sparse to give statistically meaningful results. Often there are good data on the number of
incidents or failures, but poor data on the population in which these failures have occurred.
For these cases, it is necessary to adopt modeling techniques such as fault tree analysis.
Utility. The technique is not difficult to apply, although data gathering can be time
consuming and extremely difficult in cases of mine accidents. The time required to estimate
an incident frequency from historical data can be reduced if the company/user assembles and
keeps updated a database of the historical incident data.
Resources. The analyst should be an engineer because technical judgment is involved. This
is especially important when checking for appropriateness of the data before acting on it. An
in-house information scientist may be able to assist in data gathering. However, it may be
more time and cost effective to use consultants for unusual problems (specialist firms exist
for railway, maritime, and other industry-related incident studies). Industry associations may
be able to assist in identification of such expertise.
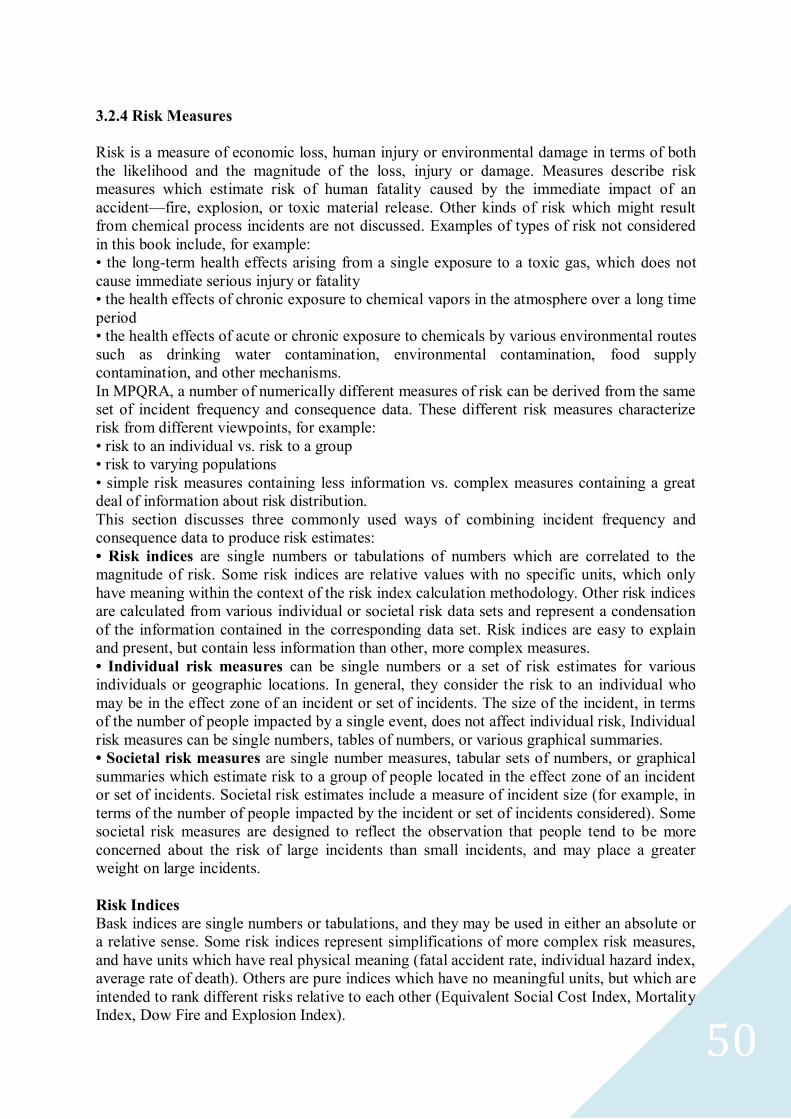
50
3.2.4 Risk Measures
Risk is a measure of economic loss, human injury or environmental damage in terms of both
the likelihood and the magnitude of the loss, injury or damage. Measures describe risk
measures which estimate risk of human fatality caused by the immediate impact of an
accident—fire, explosion, or toxic material release. Other kinds of risk which might result
from chemical process incidents are not discussed. Examples of types of risk not considered
in this book include, for example:
• the long-term health effects arising from a single exposure to a toxic gas, which does not
cause immediate serious injury or fatality
• the health effects of chronic exposure to chemical vapors in the atmosphere over a long time
period
• the health effects of acute or chronic exposure to chemicals by various environmental routes
such as drinking water contamination, environmental contamination, food supply
contamination, and other mechanisms.
In MPQRA, a number of numerically different measures of risk can be derived from the same
set of incident frequency and consequence data. These different risk measures characterize
risk from different viewpoints, for example:
• risk to an individual vs. risk to a group
• risk to varying populations
• simple risk measures containing less information vs. complex measures containing a great
deal of information about risk distribution.
This section discusses three commonly used ways of combining incident frequency and
consequence data to produce risk estimates:
• Risk indices are single numbers or tabulations of numbers which are correlated to the
magnitude of risk. Some risk indices are relative values with no specific units, which only
have meaning within the context of the risk index calculation methodology. Other risk indices
are calculated from various individual or societal risk data sets and represent a condensation
of the information contained in the corresponding data set. Risk indices are easy to explain
and present, but contain less information than other, more complex measures.
• Individual risk measures can be single numbers or a set of risk estimates for various
individuals or geographic locations. In general, they consider the risk to an individual who
may be in the effect zone of an incident or set of incidents. The size of the incident, in terms
of the number of people impacted by a single event, does not affect individual risk, Individual
risk measures can be single numbers, tables of numbers, or various graphical summaries.
• Societal risk measures are single number measures, tabular sets of numbers, or graphical
summaries which estimate risk to a group of people located in the effect zone of an incident
or set of incidents. Societal risk estimates include a measure of incident size (for example, in
terms of the number of people impacted by the incident or set of incidents considered). Some
societal risk measures are designed to reflect the observation that people tend to be more
concerned about the risk of large incidents than small incidents, and may place a greater
weight on large incidents.
Risk Indices
Bask indices are single numbers or tabulations, and they may be used in either an absolute or
a relative sense. Some risk indices represent simplifications of more complex risk measures,
and have units which have real physical meaning (fatal accident rate, individual hazard index,
average rate of death). Others are pure indices which have no meaningful units, but which are
intended to rank different risks relative to each other (Equivalent Social Cost Index, Mortality
Index, Dow Fire and Explosion Index).

51
Limitations on the use of indices are that
(1) there may not be absolute criteria for accepting or rejecting the risk, and
(2) indices lack resolution and do not communicate the same information as individual or
societal risk measures. Consequence indices [e.g., Dow Fire and Explosion and Chemical
Exposure Indices (Dow, 1994a, b)], consider risk only in a relative sense. As an example of a
use of risk indices for relative assessment, a table may be developed that compares the
equivalent social cost for a range of possible risk reduction measures; this permits a ranking
of these measures on the basis of social benefit. Examples of the use of risk indices in
absolute ways are the fatal accident rate (FAR) targets that some companies have established.
• The Fatal Accident Rate (FAR) (Lees, 1980) is the estimated number of fatalities per 108
exposure hours (roughly 1000 employee working lifetimes). The FAR is a single number
index that is directly proportional to the average individual risk. The only difference
numerically is the time period, which is 1 year for the average individual risk, so the FAR
must be multiplied by a factor of 108/(24 x 365) = 1.14 x 10⁴.
• The Individual Hazard Index (IHI) (Helmers and Schaller, 1982) is the FAR for a particular
hazard, with the exposure time defined as the actual time that a person is exposed to the
hazard of concern. The IHI estimates peak risk.
• The Average Rate of Death (Lees, 1980) is defined as the average number of fatalities that
might be expected per unit time from all possible incidents. It is also known as the accident
fatality number. Average Rate of Death is a single number average measure of societal risk.
• The Equivalent Social Cost Index (Okrent, 1981) is a modification of the Average Rate of
Death and takes into account society's aversion to large-consequence incidents.
• The Mortality Index or Number (Marshall, 1987) is used to characterize the potential
hazards of toxic material storage. It is based on the observed average ratio of casualties to the
mass of material or energy released, as derived from the historical record. It is actually a
hazard index rather than a risk index as frequency of occurrence is not incorporated.
• The Dow Fire and Explosion Index (Dow, 1994a) and the Mond Index (ICI, 1985) estimate
relative risk from fires and explosions. These indices can also be used to estimate the
magnitude of potential plant damage from a fire or explosion.
• The Dow Chemical Exposure Index (Dow, 1994b) estimates risk associated with a single
toxic chemical release. Tyler et al. (1996) have proposed an alternative toxicity hazard index.
• The Economic Index measures financial loss and its development is outside the scope of
this volume. The Economic Index may be treated and presented in essentially the same way
as FAR. Companies may have developed specific economic risk targets, and the Economic
Index can be compared with them. If there is no specific target, the relative merits of various
risk reduction measures may be easily ranked. O'Mara, Greenburg, and Hessian (1991) give
an example of economic risk calculation.
Individual Risk
Considine (1984) defines individual risk as the risk to a person in the vicinity of a hazard.
This includes the nature of the injury to the individual, the likelihood of the injury occurring,
and the time period over which the injury might occur.
While injuries are of great concern, there are limited data available on the degrees of injuries.
Thus, risk analysts often estimate risk of irreversible injury or fatality, for which more
statistics are recorded. Individual risk can be estimated for the most exposed individual, for
groups of individuals at particular places or for an average individual in an effect zone. For a
given incident or set of incidents, these individual risk measures have different values.
Definitions of some individual risk measures are given below.
1. Individual risk contours show the geographical distribution of individual risk. The risk
contours show the expected frequency of an event capable of causing the specified level of
harm at a specified location, regardless of whether or not anyone is present at that location to
52
suffer that harm. Thus, individual risk contour maps are generated by calculating individual
risk at every geographic location, assuming that somebody will be present and subject to the
risk 100% of the time (i.e., annual exposure of 8760 hours per year).
2. Maximum individual risk is the individual risk to the person(s) exposed to the highest risk
in an exposed population. This is often the operator working at the unit being analyzed, but
might also be the person in the general population living at the location of highest risk.
Maximum individual risk can be determined from risk contours by locating the person most
at risk and determining what the individual risk is at that point. Alternatively it can be
determined by calculating individual risk at every geographical location where people are
present and searching the results for the maximum value.
3. Average individual risk (exposed population) is the individual risk averaged over the
population that is exposed to risk from the facility (e.g., all of the operators in a building, or
those people within the largest incident effect zone). This risk measure is only useful if the
risk is relatively uniformly distributed over the population, and can be extremely misleading
if risk is not evenly distributed. If a few individuals are exposed to a very high risk, this may
not be apparent when averaged with a large number of people at low risk.
4. Average individual risk (total population) is the individual risk averaged over a
predetermined population, without regard to whether or not all people in that population are
actually exposed to the risk. This average risk measure is potentially extremely misleading. If
the population selected is too large, an artificially low estimate of average individual risk will
result because much of the population might be at no risk from the facility under study.
5. Average individual risk (exposed hours/worked hours). The individual risk for an activity
may be calculated for the duration of the activity or may be averaged over the working day.
For example, if an operator spends 1 hr per shift sampling a reactor and 7 hr per shift in the
control room, the individual risk while sampling would be 8 times the average individual risk
for the entire work day, assuming no risk for the time in the control room.
Societal Risk
Some major incidents have the potential to affect many people. Societal risk is a measure of
risk to a group of people. It is most often expressed in terms of the frequency distribution of
multiple casualty events. However, societal risk can also be expressed in terms similar to
individual risk. For example, the likelihood of 10 fatalities at a specific location x, y is a type
of societal risk measure. The calculation of societal risk requires the same frequency and
consequence information as individual risk. Additionally, societal risk estimation requires a
definition of the population at risk around the facility. This definition can include the
population type (e.g., residential, industrial, school), the likelihood of people being present,
or mitigation factors. Individual and societal risks are different presentations of the same
underlying combinations of incident frequency and consequences. Both of these measures
may be of importance in assessing the benefits of risk reduction measures or in judging the
acceptability of a facility in absolute terms. In general, it is impossible to derive one from the
other. The underlying frequency and consequence information are the same, but individual
and societal risk estimates can only be calculated directly from that basic data.
The difference between individual and societal risk may be illustrated by the following
example. An office building located near a chemical plant contains 40 people during office
hours and 1 guard at other times. If the likelihood of an incident causing a fatality at the
office building is constant throughout the day, each individual in that building is subject to a
certain individual risk. This individual risk is independent of the number of people present—
it is the same for each of the 400 people in the building during office hours and for the single
guard at other times. However, the societal risk is significantly higher during office hours,
when 400 people are affected, than at other times when a single person is affected.
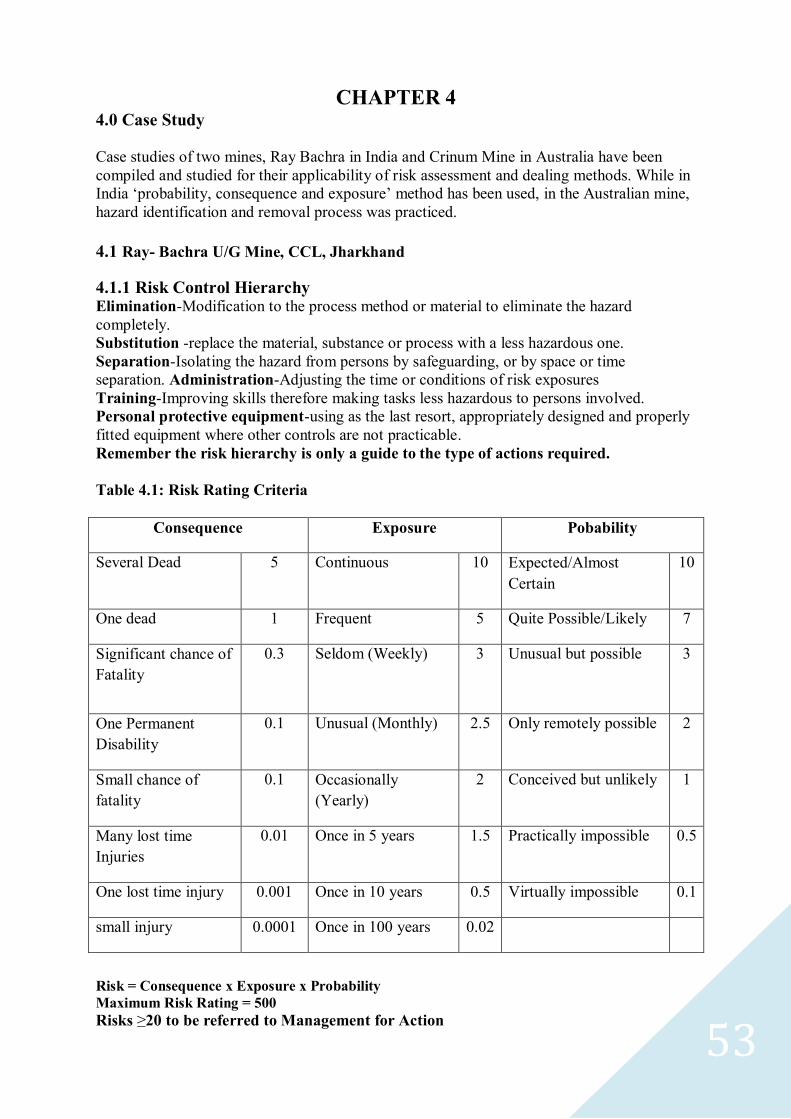
53
CHAPTER 4
4.0 Case Study
Case studies of two mines, Ray Bachra in India and Crinum Mine in Australia have been
compiled and studied for their applicability of risk assessment and dealing methods. While in
India ‗probability, consequence and exposure‘ method has been used, in the Australian mine,
hazard identification and removal process was practiced.
4.1 Ray- Bachra U/G Mine, CCL, Jharkhand
4.1.1 Risk Control Hierarchy Elimination-Modification to the process method or material to eliminate the hazard
completely.
Substitution -replace the material, substance or process with a less hazardous one.
Separation-Isolating the hazard from persons by safeguarding, or by space or time
separation. Administration-Adjusting the time or conditions of risk exposures
Training-Improving skills therefore making tasks less hazardous to persons involved.
Personal protective equipment-using as the last resort, appropriately designed and properly
fitted equipment where other controls are not practicable.
Remember the risk hierarchy is only a guide to the type of actions required.
Table 4.1: Risk Rating Criteria
Risk = Consequence x Exposure x Probability
Maximum Risk Rating = 500
Risks ≥20 to be referred to Management for Action
Consequence Exposure Pobability
Several Dead 5 Continuous 10 Expected/Almost
Certain
10
One dead 1 Frequent 5 Quite Possible/Likely 7
Significant chance of
Fatality
0.3 Seldom (Weekly)
3 Unusual but possible
3
One Permanent
Disability
0.1 Unusual (Monthly) 2.5 Only remotely possible 2
Small chance of
fatality
0.1 Occasionally
(Yearly)
2 Conceived but unlikely 1
Many lost time
Injuries
0.01 Once in 5 years 1.5 Practically impossible 0.5
One lost time injury 0.001 Once in 10 years 0.5 Virtually impossible 0.1
small injury 0.0001 Once in 100 years 0.02

54
4.1.2 STEPS TO RISK MANAGEMENT PLAN
STEP :1 Identification of all hazards associated with the mine
STEP :2 Assessment of risk for prioritizing
STEP :3: Rank and identify the principal hazards which need immediate attention. Rank
those hazards which need continuous management.
STEP : 4 Break all the hazards into different contributing mechanisms (Underlying
causes)
STEP : 5 Fine control each mechanism
STEP : 6 Document procedure for each control
STEP : 7 Fix responsibilities
STEP : 8 Design auditing procedure
Table 4.2: INITIAL HAZARD IDENTIFICATION FOR RAY- BACHRA U/G MINE,
CCL
No. Description of Hazard Consequence Probability Exposure Total
Risk 1 INUNDATION 5 10 10 500
2 POOR QUALITY OF SUPPLIED
MATERIAL
5 10 10 500
3 GEOLOGICAL DISTURBANCE 5 10 10 500
4 IMPROPER STRATA CONTROL 5 7 10 350
5 TRAINING FACILITIES INADEQUATE 5 7 10 350
6 SHORTAGE OF SKILLED PERSON 5 7 10 350
7 INADEQUATE COMMUNICATION SYSTEM 5 7 10 350
8 POOR SUPERVISION 5 7 5 175
9 SPONTANEOUS COMBUSTION 5 3 10 150
10 IMPROPER SURVEYING 5 3 10 150
11 EXPLOSIVES / BLASTING 5 3 5 75
11 HAULAGE 1 7 10 70
12 MACHINERY 1 7 10 70
13 LACK OF AWARENESS 1 7 10 70
14 SEALED OFF PANELS 5 3 2.5 37.5
15 INADEQUATE SUPPLY OF SPARE PARTS 0.3 7 10 21
16 USE OF UNCALIBRATED INSTRUMENT 1 7 3 21
17 VENTILATION NOT TO PLAN 0.1 10 10 10
18 OTHER FIRES 0.1 7 10 7
20 EXTERNAL THREAT
0.01 7 2.50 0.175
21 POOR ILLUMINATION 0.001 3 3 0.009

55
TABLE 4.3: IDENTIFYING MECHANISMS CONTRIBUTING PRINCIPAL HAZARDS AND
RANKING
No. Major Hazard Mechanism Cons. Prob. Expo. Risk
1 INUNDATION - River Overflow above HFL
- Waterlogged Working U/G
- Inrush through subsidence cracks/BH
5
5
5
7
2
7
10
10
2
350
100
70
2 POOR QUALITY OF
SUPPLIED MATERIAL
- Improper procurement procedure
- Inspection procedure not followed
- Improper Storage
5
5
5
7
7
3
10
10
10
350
350
150
3 GEOLOGICAL
DISTURBANCE
- Presence of Fault & Slip planes
- Fractured Roof
5
5
10
10
10
10
500
500
4 IMPROPER STRATA
CONTROL
- Failure to identify bad roof
- Improper Dressing -
- Improper Supervision -
- Poor workmanship -
- Non-superimposition of some pillars in contiguous working
-
- Inadequate Support Design
- Poor quality of support material
5
5
5
5
5
5
5
5
10
7
7
7
7
7
3
3
10
10
10
10
10
10
10
10
500
350
350
350
350
350
150
150
5 TRAINING FACILITIES
INADEQUATE
- Non-existence of skilled trg. Schedule
- Untrained trainers - Infrastructure not to the
requirement - Non-existence of
Feedback / Test
5
5
5
1
7
3
10
10
10
10
10
10
350
150
500
100
6 SHORTAGE OF SKILLED
OR AUTHORISED
PERSON/DEPLOYMENT
OF UNSKILLED PERSON
- Absenteeism - Trg. not done as per
requirement - Manpower Sanction not
as per requirement - Examination for
workmanship certificate not done regularly
1
1
5
7
7
7
5
10
10
35
70
350
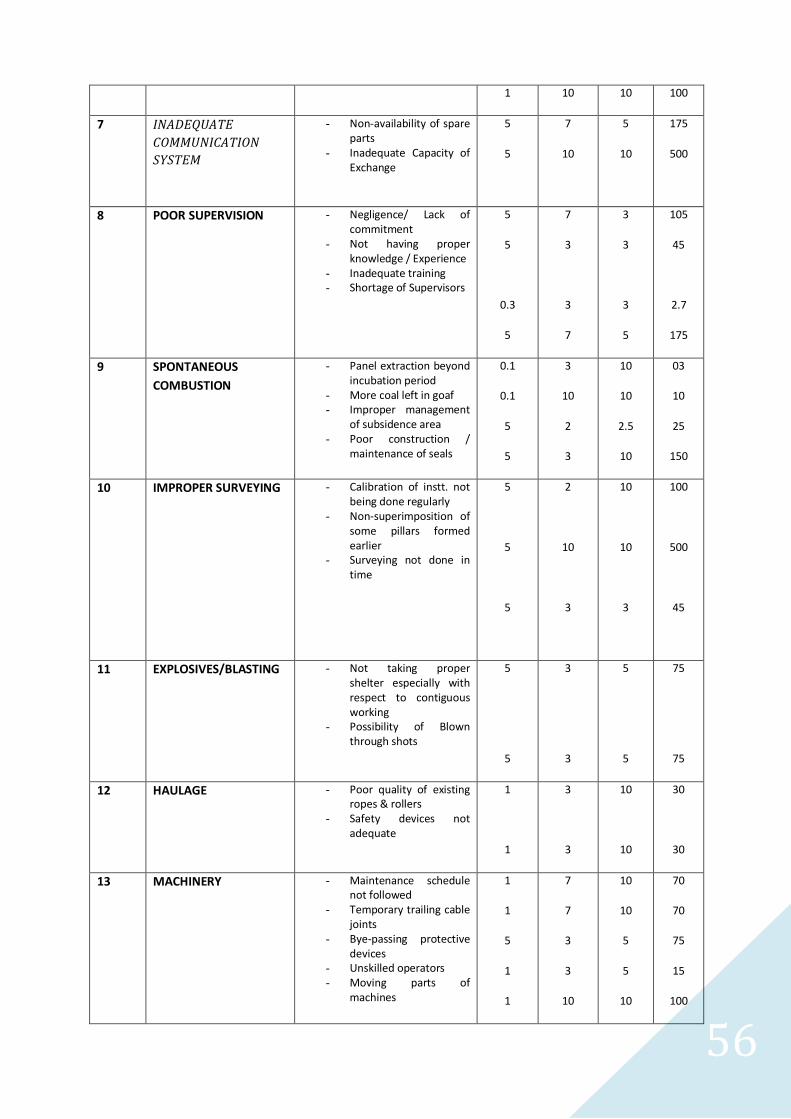
56
1 10 10 100
7 INADEQUATE
COMMUNICATION
SYSTEM
- Non-availability of spare parts
- Inadequate Capacity of Exchange
5
5
7
10
5
10
175
500
8 POOR SUPERVISION - Negligence/ Lack of commitment
- Not having proper knowledge / Experience
- Inadequate training - Shortage of Supervisors
5
5
0.3
5
7
3
3
7
3
3
3
5
105
45
2.7
175
9 SPONTANEOUS
COMBUSTION
- Panel extraction beyond incubation period
- More coal left in goaf - Improper management
of subsidence area - Poor construction /
maintenance of seals
0.1
0.1
5
5
3
10
2
3
10
10
2.5
10
03
10
25
150
10 IMPROPER SURVEYING - Calibration of instt. not being done regularly
- Non-superimposition of some pillars formed earlier
- Surveying not done in time
5
5
5
2
10
3
10
10
3
100
500
45
11 EXPLOSIVES/BLASTING - Not taking proper shelter especially with respect to contiguous working
- Possibility of Blown through shots
5
5
3
3
5
5
75
75
12 HAULAGE - Poor quality of existing ropes & rollers
- Safety devices not adequate
1
1
3
3
10
10
30
30
13 MACHINERY - Maintenance schedule not followed
- Temporary trailing cable joints
- Bye-passing protective devices
- Unskilled operators - Moving parts of
machines
1
1
5
1
1
7
7
3
3
10
10
10
5
5
10
70
70
75
15
100

57
14 LACK OF AWARENESS - Non-existence of documented procedures
- Improper / inadequate training
- Improper communication
- Inadequate Publicity / Objective not explained
1
1
5
1
10
3
3
3
10
5
3
3
100
15
45
09
15 SEALED OFF PANELS
- Improper management of subsidence area
- Poor construction / maintenance of seals
- Improper supervision - Improper sampling &
analysis procedure.
5
5
5
5
2
3
3
2
2.5
10
5
10
25
150
75
100
16 INADEQUATE SUPPLY
OF SPARE PARTS
- Improper procurement planning
- Delay in procurement action
- Importance not given to the indents
1
1
1
7
7
10
5
3
10
35
21
100
17 USE OF UNCALIBRATED
INSTRUMENT
- Non-existence of calibration procedures
- Non-existence of calibration infrastructure
- Non availability of spare Instruments
5
5
5
7
10
7
5
5
3
175
250
105
18 VENTILATION NOT TO
PLAN
- Delay in construction of stoppings
- Tampering of ventilation devices
- Poor construction of stoppings
0.1
0.1
0.1
7
7
3
10
10
10
7
7
3
19 OTHER FIRES - Conveyor Fire - Electrical Fires - Fire during gas cutting - Spilled Off Lubricants
0.3
5
1
0.3
2
7
3
1
3
5
2.5
2
1.8
175
7.5
0.6
20 EXTERNAL THREAT - Theft - Political issues
0.01
0.001
7
3
3
2
0.21
0.006
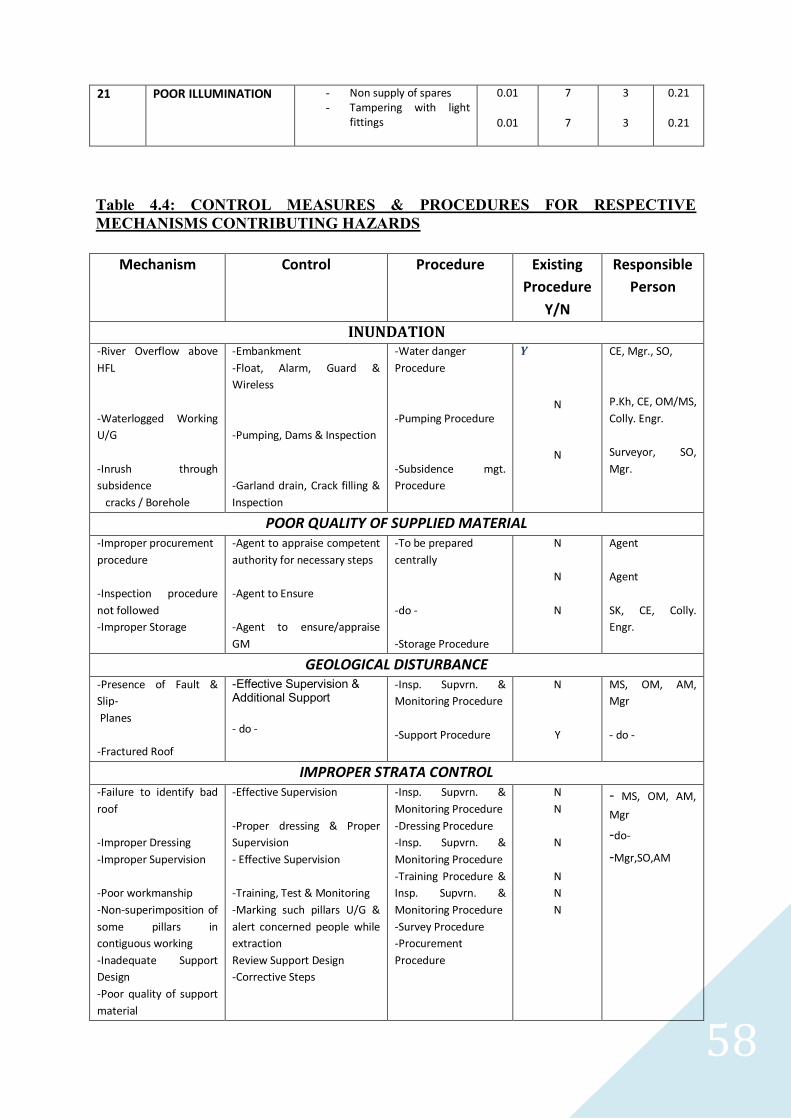
58
21 POOR ILLUMINATION - Non supply of spares - Tampering with light
fittings
0.01
0.01
7
7
3
3
0.21
0.21
Table 4.4: CONTROL MEASURES & PROCEDURES FOR RESPECTIVE
MECHANISMS CONTRIBUTING HAZARDS
Mechanism Control Procedure Existing
Procedure
Y/N
Responsible
Person
INUNDATION -River Overflow above
HFL
-Waterlogged Working
U/G
-Inrush through
subsidence
cracks / Borehole
-Embankment
-Float, Alarm, Guard &
Wireless
-Pumping, Dams & Inspection
-Garland drain, Crack filling &
Inspection
-Water danger
Procedure
-Pumping Procedure
-Subsidence mgt.
Procedure
Y
N
N
CE, Mgr., SO,
P.Kh, CE, OM/MS,
Colly. Engr.
Surveyor, SO,
Mgr.
POOR QUALITY OF SUPPLIED MATERIAL -Improper procurement
procedure
-Inspection procedure
not followed
-Improper Storage
-Agent to appraise competent
authority for necessary steps
-Agent to Ensure
-Agent to ensure/appraise
GM
-To be prepared
centrally
-do -
-Storage Procedure
N
N
N
Agent
Agent
SK, CE, Colly.
Engr.
GEOLOGICAL DISTURBANCE -Presence of Fault &
Slip-
Planes
-Fractured Roof
-Effective Supervision & Additional Support
- do -
-Insp. Supvrn. &
Monitoring Procedure
-Support Procedure
N
Y
MS, OM, AM,
Mgr
- do -
IMPROPER STRATA CONTROL -Failure to identify bad
roof
-Improper Dressing
-Improper Supervision
-Poor workmanship
-Non-superimposition of
some pillars in
contiguous working
-Inadequate Support
Design
-Poor quality of support
material
-Effective Supervision
-Proper dressing & Proper
Supervision
- Effective Supervision
-Training, Test & Monitoring
-Marking such pillars U/G &
alert concerned people while
extraction
Review Support Design
-Corrective Steps
-Insp. Supvrn. &
Monitoring Procedure
-Dressing Procedure
-Insp. Supvrn. &
Monitoring Procedure
-Training Procedure &
Insp. Supvrn. &
Monitoring Procedure
-Survey Procedure
-Procurement
Procedure
N
N
N
N
N
N
- MS, OM, AM,
Mgr
-do-
-Mgr,SO,AM
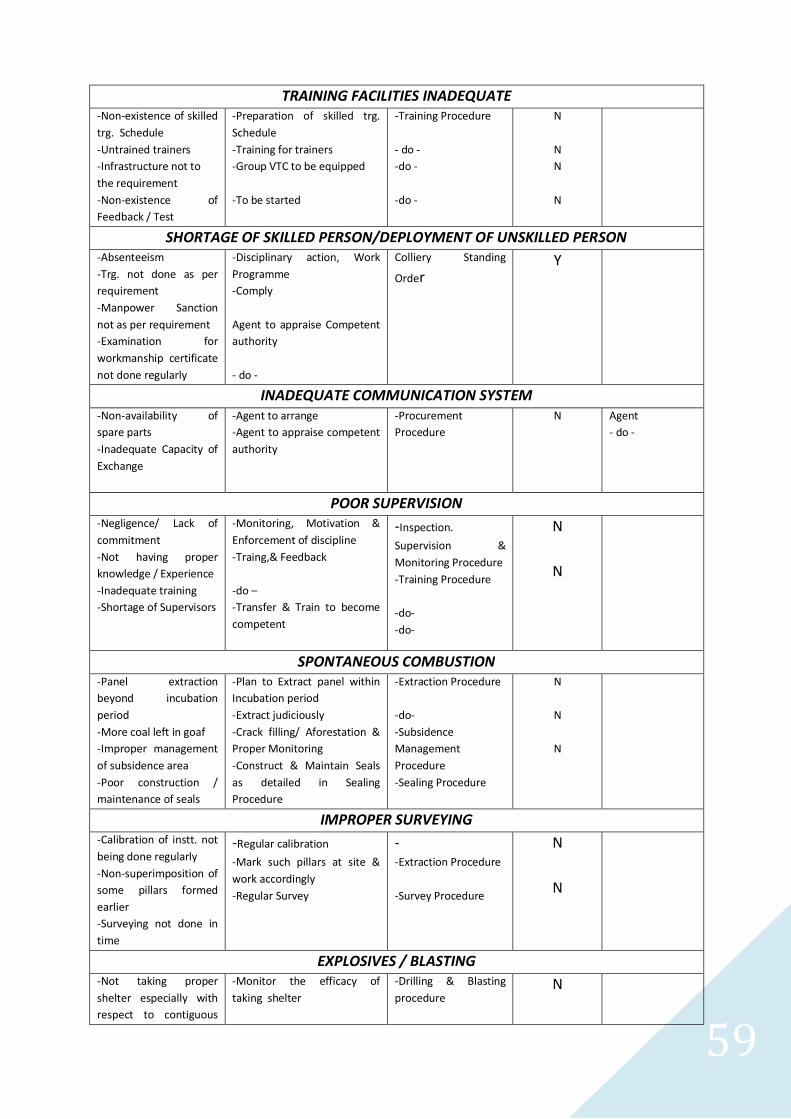
59
TRAINING FACILITIES INADEQUATE -Non-existence of skilled
trg. Schedule
-Untrained trainers
-Infrastructure not to
the requirement
-Non-existence of
Feedback / Test
-Preparation of skilled trg.
Schedule
-Training for trainers
-Group VTC to be equipped
-To be started
-Training Procedure
- do -
-do -
-do -
N
N
N
N
SHORTAGE OF SKILLED PERSON/DEPLOYMENT OF UNSKILLED PERSON
-Absenteeism
-Trg. not done as per
requirement
-Manpower Sanction
not as per requirement
-Examination for
workmanship certificate
not done regularly
-Disciplinary action, Work
Programme
-Comply
Agent to appraise Competent
authority
- do -
Colliery Standing
Order Y
INADEQUATE COMMUNICATION SYSTEM -Non-availability of
spare parts
-Inadequate Capacity of
Exchange
-Agent to arrange
-Agent to appraise competent
authority
-Procurement
Procedure
N Agent
- do -
POOR SUPERVISION -Negligence/ Lack of
commitment
-Not having proper
knowledge / Experience
-Inadequate training
-Shortage of Supervisors
-Monitoring, Motivation &
Enforcement of discipline
-Traing,& Feedback
-do –
-Transfer & Train to become
competent
-Inspection.
Supervision &
Monitoring Procedure
-Training Procedure
-do-
-do-
N
N
SPONTANEOUS COMBUSTION -Panel extraction
beyond incubation
period
-More coal left in goaf
-Improper management
of subsidence area
-Poor construction /
maintenance of seals
-Plan to Extract panel within
Incubation period
-Extract judiciously
-Crack filling/ Aforestation &
Proper Monitoring
-Construct & Maintain Seals
as detailed in Sealing
Procedure
-Extraction Procedure
-do-
-Subsidence
Management
Procedure
-Sealing Procedure
N
N
N
IMPROPER SURVEYING -Calibration of instt. not
being done regularly
-Non-superimposition of
some pillars formed
earlier
-Surveying not done in
time
-Regular calibration
-Mark such pillars at site &
work accordingly
-Regular Survey
- -Extraction Procedure
-Survey Procedure
N
N
EXPLOSIVES / BLASTING -Not taking proper
shelter especially with
respect to contiguous
-Monitor the efficacy of
taking shelter
-Drilling & Blasting
procedure
N

60
working
-Possibility of Blown
through shots
-Stop one of the approaching
faces when within 9m.
-Survey Procedure N
HAULAGE -Poor quality of existing
ropes & rollers
-Safety devices not
adequate
-Procure ropes & rollers in
advance & change old one
timely.
-Install monkey catches in
Endless track & maintain all
safety devices.
-Machinery
Installation &
Maintenance
Procedure
-Conveying & Hauling
Procedure
N
N
MACHINERY -Maintenance schedule
not followed
-Temporary trailing
cable joints
-Bye-passing protective
devices
-Unskilled operators
-Moving parts of
machines
-Implement, Monitor & / or
take corrective action for non-
compliance
-Stop doing temporary joints
-Stop machine if protective
device is not functioning
-Stop machine if skilled
operator is not present-train
more operators
-Fence moving parts of
machines & Don’t allow
people wearing loose dresses
-Maintenance
Schedule
-Inspection.
Supervision &
Monitoring Procedure
-Unsafe
Practices/Unsafe Act
& Colliery Standing
Order
Y
N
Y
N
LACK OF AWARENESS -Non-existence of
documented procedures
-Improper / inadequate
training
-Improper
communication
-Inadequate Publicity /
Objective not explained
-Document all Procedures &
issue to concerned persons
-Traing,& Feedback
-Detailed written
communication either by
letter or on Notice Board
-Explain the objective
-
-Training Procedure
N
SEALED OFF PANELS -Improper management
of subsidence area
-Poor construction /
maintenance of seals
-Improper supervision
-Improper sampling &
analysis procedure
--Blanketing / Crack filling &
Proper Monitoring
-Construct & maintain seals as
detailed in Sealing Procedure
-Regular supervision
-Sampling & analysis as per
Sampling Protocol
-Subsidence
Management
Procedure
-Sealing Procedure
-Inspection.
Supervision &
Monitoring Procedure
- Sampling Protocol
INADEQUATE SUPPLY OF SPARE PARTS -Improper procurement
planning
-Delay in procurement
action
-Importance not given
to the indents
-Advance planning
considering past requirement
& growth
-Avoid delay
-Agent to send reminders.
-Material
Procurement &
Storage Procedure
N
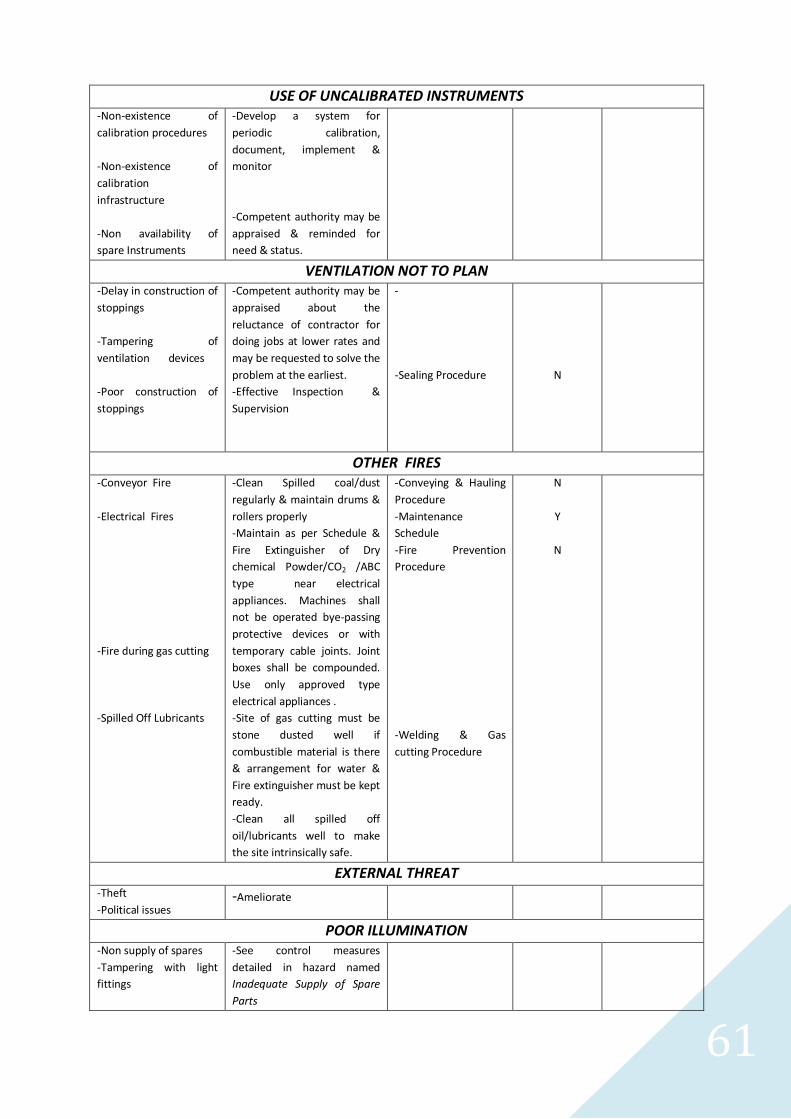
61
USE OF UNCALIBRATED INSTRUMENTS -Non-existence of
calibration procedures
-Non-existence of
calibration
infrastructure
-Non availability of
spare Instruments
-Develop a system for
periodic calibration,
document, implement &
monitor
-Competent authority may be
appraised & reminded for
need & status.
VENTILATION NOT TO PLAN -Delay in construction of
stoppings
-Tampering of
ventilation devices
-Poor construction of
stoppings
-Competent authority may be
appraised about the
reluctance of contractor for
doing jobs at lower rates and
may be requested to solve the
problem at the earliest.
-Effective Inspection &
Supervision
-
-Sealing Procedure
N
OTHER FIRES -Conveyor Fire
-Electrical Fires
-Fire during gas cutting
-Spilled Off Lubricants
-Clean Spilled coal/dust
regularly & maintain drums &
rollers properly
-Maintain as per Schedule &
Fire Extinguisher of Dry
chemical Powder/CO2 /ABC
type near electrical
appliances. Machines shall
not be operated bye-passing
protective devices or with
temporary cable joints. Joint
boxes shall be compounded.
Use only approved type
electrical appliances .
-Site of gas cutting must be
stone dusted well if
combustible material is there
& arrangement for water &
Fire extinguisher must be kept
ready.
-Clean all spilled off
oil/lubricants well to make
the site intrinsically safe.
-Conveying & Hauling
Procedure
-Maintenance
Schedule
-Fire Prevention
Procedure
-Welding & Gas
cutting Procedure
N
Y
N
EXTERNAL THREAT -Theft
-Political issues -Ameliorate
POOR ILLUMINATION -Non supply of spares
-Tampering with light
fittings
-See control measures
detailed in hazard named
Inadequate Supply of Spare
Parts
62
4.2 CRINUM MINE FIRE MANAGEMENT, QUEENSLAND, AUSTRALIA
The Fire Management Plan uses a strategy for eliminating uncontrolled fires by directing
control over the elements which could lead to a fire. Fundamentally, this will be managed by
minimization of introduced combustibles and ignition sources. Where fire occurs control will
be exerted by means of breaking the fire triangle, requiring control or removal of the
combustibles, heat or oxygen.
The Fire Management Plan imposes strategies which are planned to eliminate all possible
causes of fire in the mine. In addition, the Fire Management Plan identifies the necessary
contingencies should a fire occur.
These strategies are:
Control of fuel
Control of ignition sources
Fire detection
Response to a small fire
Response to an escalating fire
Response to an out of control fire
Introduction of a system to control all sources of fuel before use.
CONTROL OF FUEL
A major source of combustible material is the coal seam itself. In particular, coal dust is
present in quantities sufficient to impose a fire hazard. This hazard is controlled by
prevention of spillage, removal of accumulations and rendering coal dust to an incombustible
state by means of Stonedust.
Procedures are in place to control standards of cleanliness in roadways including ‗Clean up of
spillage‘. All activities which use or encounter combustible materials shall be managed so
that those materials cannot catch fire.
Where combustible materials are encountered underground, removal to the surface and
appropriate disposal will be conducted.
All materials used underground or on the surface will be fire resistant where possible. Where
fire resistant materials cannot be used, steps shall be taken to render such materials safe. For
example, where polyurethane resin is used for the purposes of seal construction, a fire
resistant coating will be applied to both sides of the seal in order to achieve this objective.
Where new materials are introduced, the Fire Officer shall take steps to ensure that these
standards are met.
Inspection procedures are in place to ensure that the presence of combustible materials is
minimised. These include statutory inspections underground and specific fire inspections
instigated by the Fire Officer. The Fire Officer will delegate inspections with respect to
compliance with the Fire Management Plan and will ensure that these inspections are
conducted and action taken where non compliance is identified.
CONTROL OF IGNITION SOURCES
Equipment used at the mine is normally certified by an accredited testing authority and
capacity to ignite fires is inherently controlled by this process. For example, electrical

63
equipment used underground may be intrinsically safe (IS) or flameproof (FLP). In
particular, the following controls are in place which minimise the presence of a source of
ignition in the mine environment in the form of Procedures or Work Instructions:
Construction and installation standards for all equipment
Routine inspection, test and maintenance of all equipment
System of tagging out defective equipment
Specialised repair for all explosion protected equipment
Procedure for cutting and welding
Spontaneous Combustion and Ventilation Management Plan
Control of contraband and search procedures
Procedures for vulcanising
Control of static electricity
SKILLS
A key control for fire prevention is the knowledge and commitment of all persons employed
during their day to day activities.
In order to maximise awareness and minimise the risk of fire at Crinum Mine, all persons
employed in the mine shall have competency in the following:
Understanding and knowledge of the minimum standards of housekeeping required to
minimise the presence of combustible materials in the mine
Knowledge of fire fighting equipment and procedures
Knowledge of evacuation procedures
There shall be a competent Fire Officer employed at the mine
A relief Fire Officer will be appointed to cover all duties of the Fire Officer in his
absence from site for any extended periods.
FIRE DETECTION
The fire detection strategy will encompass the following aspects:
Continuous real time and tube bundle monitoring for carbon monoxide in the underground
environment
Routine statutory and fire specific inspections
Surface fire alarms and testing
Temperature monitoring on key equipment if deemed necessary
Thermographic surveys.
RESPONSE TO SMALL FIRES
In the event of a small fire the following controls may be initiated to control and suppress the
fire:
Fire extinguishers

64
Fire fighting water reticulation system
Smothering/air exclusion
Removal of combustibles to a safe place
Removal of source of ignition
Evacuation of people affected by the fire and not involved in fire fighting
Immediate communication of incident to persons affected, supervisor and control
room
Subsequent communication of incident to remainder of mine personnel.
Activation of vehicle fire suppression systems
ESCALATING FIRES
Where a fire cannot be controlled by the means described in the section above, some or all of
the following additional controls may be implemented:
Increased use of the resources described in section 2.5
Communication of the state of the incident to the control room
Communication of the state of the incident to external emergency services
Implementation of emergency evacuation procedures
Implementation of ventilation fire controls
Implementation of ventilation smoke control
Activation of LTU water deluge system
Removal of electrical power
LOSS OF CONTROL OF FIRE
In the event that a fire is out of immediate control, mines rescue teams will be activated.
INVESTIGATION INTO ADDITIONAL CONTROLS
Ongoing investigation may be instigated by the Fire Officer to identify methods of fire risk
reduction. These will include scheduled thermographic surveys and conveyor roller
temperature monitoring and continual improvement to existing controls in place.
Ventilation system
The ventilation system has inherent controls relating to the control of fire hazards. These
include provision of multiple escape routes and segregation of conveyor roads from parallel
intake airways in the interests of prevention of spreading products of combustion from a
conveyor fire.
The ventilation system can be used to control a fire or the results of a fire. For example,
products of combustion can be prevented from being spread by means of ventilation changes.
The impact of fire on the ventilation system must be considered. Where fire exists, damage
to ventilation devices could exacerbate the effects of a fire by means of providing access by
products of combustion to populated areas. No ventilation system change would be permitted
except with the express authority of the Incident Management Team. The impact of the
ventilation system on fire and the means by which the risk of fire damaging ventilation

65
system components is controlled are covered by the Spontaneous Combustion and
Ventilation Management Plan.
4.2.1 Identified Key Hazards
SCOPE STATEMENT
The key hazards of fire at Crinum Mine were established by means of a risk assessment
undertaken within the following scope:
―Identify the key hazards that will result in fire at Crinum Mine and identify controls required
to prevent and control such events.‖
RISK ASSESSMENT
Stage 1 was a risk assessment based on a site audit of heat and smoke effects together with
safety consequences within critical areas of the mine.
The results of the audit were tabled to the Fire Management Plan design team who reviewed
and updated the information in the light of recent knowledge.
Results of the key risks analysis are shown on the following pages.
Fig. 4.1: Underground Fire Analysis

66
Crinum Mine - Surface Fire Analysis
current recommended
controls controls
Initial Fire Description
Heat Effect:Possible production ceased
Minor damage to equipment
Smoke Effect:Smoke could contaminate
underground airways
Safety Consequence:Minor
Possible burns to personnel
Heat SourceElectricity
Vehicles
Bush fires
Cutting and
welding
Smoking
Lightning
Coal braziers
Diesel heaters
Compressors
Escalating Fire Effect
Heat Effect:Substantial damage to
equipment.
Smoke Effect:Further risk of contamination if
underground airways
Safety Consequence:Evacuation
Total Fire Effect
Heat Effect:Loss of equipment
Loss of asset
Smoke Effect:Contamination of underground
mine
Safety Consequence:
Possible fatalities
FuelLoose coal/dust
Pallets
Chemicals
Gas bottles
Empty bags
Grease
Plastic
Oil
Diesel
Furniture
Bulding fabric
Vegetation
Coal stockpile
Fig 4.2: Surface Fire Analysis
In stage 2 The risk assessment was used to identify hazards associated with fire in the
underground and surface operations of the mine. The findings of the risk assessment were
not ranked as all issues were deemed equally damaging and of indeterminate probability.
The risk assessment results were used by the assessment team to identify the necessary
control measures that should be used in the Fire Management Plan. The assessment team
included the following personnel:
Safety Manager
Ventilation Officer
Fire Officer
Miner‘s Officer
Mineworker
External Expert (external review of plan details)
Level 5 Engineering Co-Ordinator
Any future risk assessment and review will include a cross section of the workforce.
The identified hazards are ranked in the prescribed manner, that is:
In the event of any major changes in mine design as identified during the planning process, or
as a consequence of a change in operations underground, the Fire Officer will initiate and
complete a risk assessment to those changes. The risk assessment will consider the hazards

67
involved in making that change with respect to spontaneous combustion, ventilation and gas
management.
Table 4.5: PRINCIPLE IDENTIFIED HAZARDS AND CONTROL PROCEDURES
The following tables indicate the hazards (having high probability and high consequence)
identified during the development of the fire management controls. For each hazard
identified the control measures to reduce or eliminate that hazard are listed. Control
measures are listed in groups based on equipment, methods and skills to ensure that
multifaceted implementation was considered
CONTROL OF FUELS
RISK
FUEL DETAIL EXISTING CONTROLS RECOMMENDED CONTROLS
1 Chemical
Chemicals spill CSIS procedures to be assessed for the fire implications
1 Chemical
Fire risk increased by incorrect chemical storage
Segregated storage
1 Chemical
Heated chemicals increase quantity or toxicity of smoke and hinder evacuation process
Review emergency plan to ensure that risk is covered
1 Coal Accumulations of loose coal Good house keeping
Inspections
1 Coal Coal build up at conveyor drive, LTU and boot end
Inspections
Conveyor system design
Routine weekly clean down
1 Coal Coal dust accumulations around conveyor transfer points
Water sprays on transfer points
Inspections
Good housekeeping
1 Coal Coal spillage at transfer points Transfer chutes designed to eliminate spillage and chute blockages
Inspections
Good housekeeping
1 Coal Coal spillage from conveyors Good house keeping
Conveyor design
Inspections
1 Coal Coal stock pile Water supply for surface fire mains to be made reliable
1 Coal Combustible dust accumulations on roadway floor
Road maintenance procedure
Inspections

68
CONTROL OF FUELS
RISK
FUEL DETAIL EXISTING CONTROLS RECOMMENDED CONTROLS
1 Coal Fine coal carried back over drive rollers
Belt scrapers
Mine to specify rubber surfaced belts to be replaced to reduce fines carry over
1 Coal Presence of coal dust in roadways
Statutory inspections
Stone dusting procedure to be carried out
Procedure for roadway dust sampling
1 Coal Presence of combustible dust Procedure for stonedusting
Inspections
1 Coal Rib spall Procedures contained within the GMP
1 Conveyor belt
Conveyor belt fire Conveyor maintenance
Deputies conveyor conditions inspections and reports carried out 6 times per 24 hr
1 Conveyor belt
Conveyor tracking badly leading to spillage
Belt wander switches with alarm on drive units
Deputies’ inspections
1 Diesel Diesel bulk fuel leakage Installed to Australian Standard
Bund wall
Inspections
1 Diesel Diesel bulk fuel spillage due to vehicle collision
Investigate collision protection
1 Diesel Diesel vehicles spill fuel Vehicles comply with Australian Standard
Vehicle design
Maintenance and inspection
1 Diesel Fuel bay leakage Good housekeeping
Inspections
Develop a standard for underground fuel bay construction and operation
1 Fibreglass
Fibreglass vent ducts fire FRAS materials
Inspections
1 Gas Methane or other gas present in underground workings
Ventilation system
SCVP
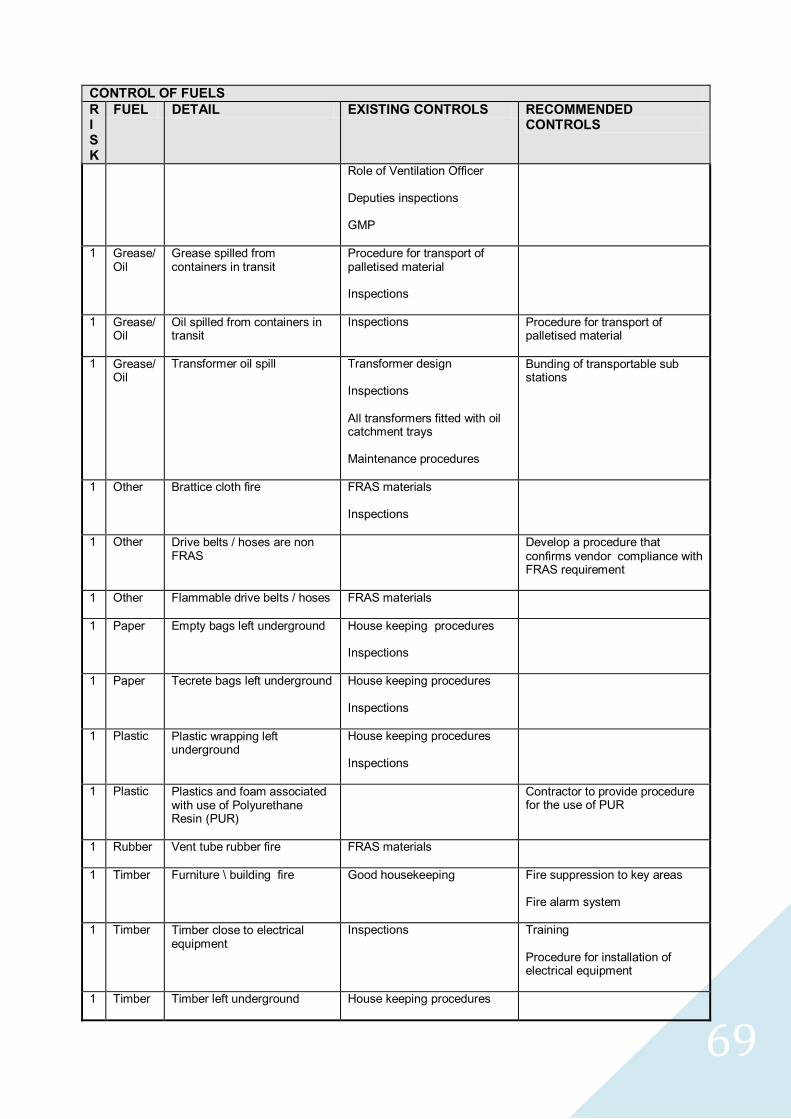
69
CONTROL OF FUELS
RISK
FUEL DETAIL EXISTING CONTROLS RECOMMENDED CONTROLS
Role of Ventilation Officer
Deputies inspections
GMP
1 Grease/Oil
Grease spilled from containers in transit
Procedure for transport of palletised material
Inspections
1 Grease/Oil
Oil spilled from containers in transit
Inspections Procedure for transport of palletised material
1 Grease/Oil
Transformer oil spill Transformer design
Inspections
All transformers fitted with oil catchment trays
Maintenance procedures
Bunding of transportable sub stations
1 Other Brattice cloth fire FRAS materials
Inspections
1 Other Drive belts / hoses are non FRAS
Develop a procedure that confirms vendor compliance with FRAS requirement
1 Other Flammable drive belts / hoses FRAS materials
1 Paper Empty bags left underground House keeping procedures
Inspections
1 Paper Tecrete bags left underground
House keeping procedures
Inspections
1 Plastic Plastic wrapping left underground
House keeping procedures
Inspections
1 Plastic Plastics and foam associated with use of Polyurethane Resin (PUR)
Contractor to provide procedure for the use of PUR
1 Rubber Vent tube rubber fire FRAS materials
1 Timber Furniture \ building fire Good housekeeping Fire suppression to key areas
Fire alarm system
1 Timber Timber close to electrical equipment
Inspections Training
Procedure for installation of electrical equipment
1 Timber Timber left underground House keeping procedures
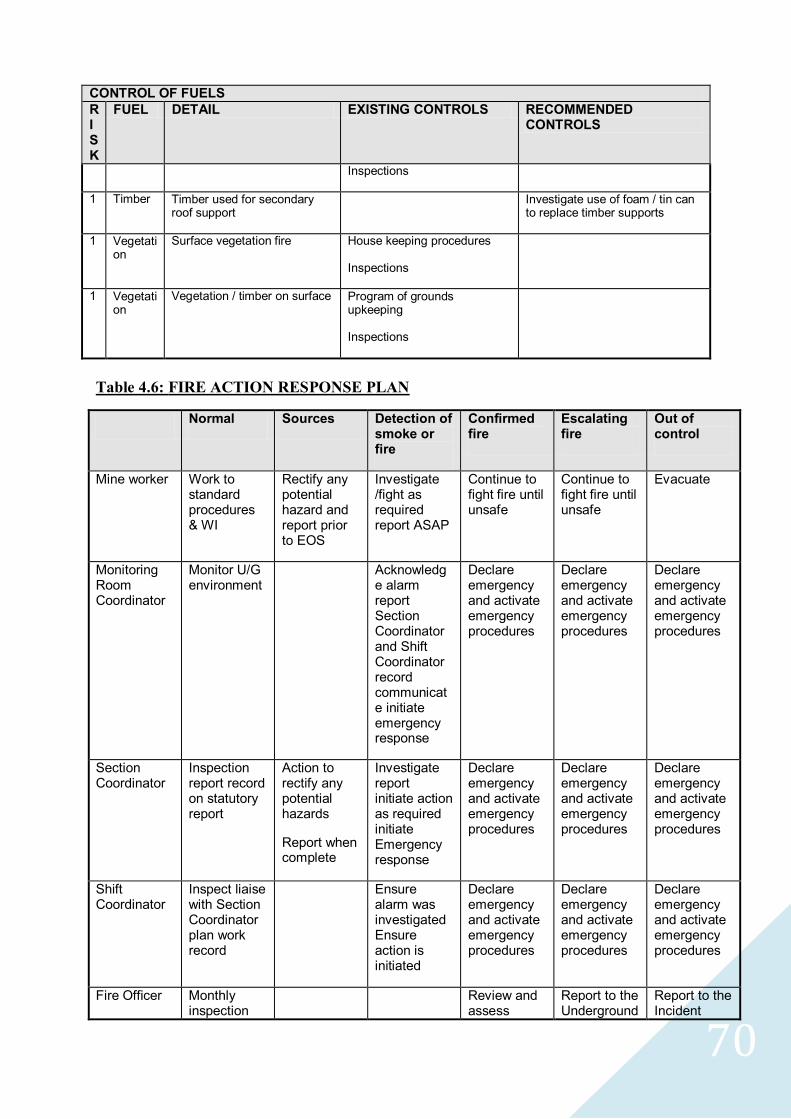
70
CONTROL OF FUELS
RISK
FUEL DETAIL EXISTING CONTROLS RECOMMENDED CONTROLS
Inspections
1 Timber Timber used for secondary roof support
Investigate use of foam / tin can to replace timber supports
1 Vegetation
Surface vegetation fire
House keeping procedures
Inspections
1 Vegetation
Vegetation / timber on surface Program of grounds upkeeping
Inspections
Table 4.6: FIRE ACTION RESPONSE PLAN
Normal Sources Detection of smoke or fire
Confirmed fire
Escalating fire
Out of control
Mine worker Work to standard procedures & WI
Rectify any potential hazard and report prior to EOS
Investigate /fight as required report ASAP
Continue to fight fire until unsafe
Continue to fight fire until unsafe
Evacuate
Monitoring Room Coordinator
Monitor U/G environment
Acknowledge alarm report Section Coordinator and Shift Coordinator record communicate initiate emergency response
Declare emergency and activate emergency procedures
Declare emergency and activate emergency procedures
Declare emergency and activate emergency procedures
Section Coordinator
Inspection report record on statutory report
Action to rectify any potential hazards
Report when complete
Investigate report initiate action as required initiate Emergency response
Declare emergency and activate emergency procedures
Declare emergency and activate emergency procedures
Declare emergency and activate emergency procedures
Shift Coordinator
Inspect liaise with Section Coordinator plan work record
Ensure alarm was investigated Ensure action is initiated
Declare emergency and activate emergency procedures
Declare emergency and activate emergency procedures
Declare emergency and activate emergency procedures
Fire Officer Monthly inspection
Review and assess
Report to the Underground
Report to the Incident

71
audits actions Mine Manager
Management Team
Underground Mine Manager
Ensure plan is complied with / reviewed and modified as appropriate
Form IMT and follow emergency procedures
Form IMT and follow emergency procedures
Form IMT and follow emergency procedures
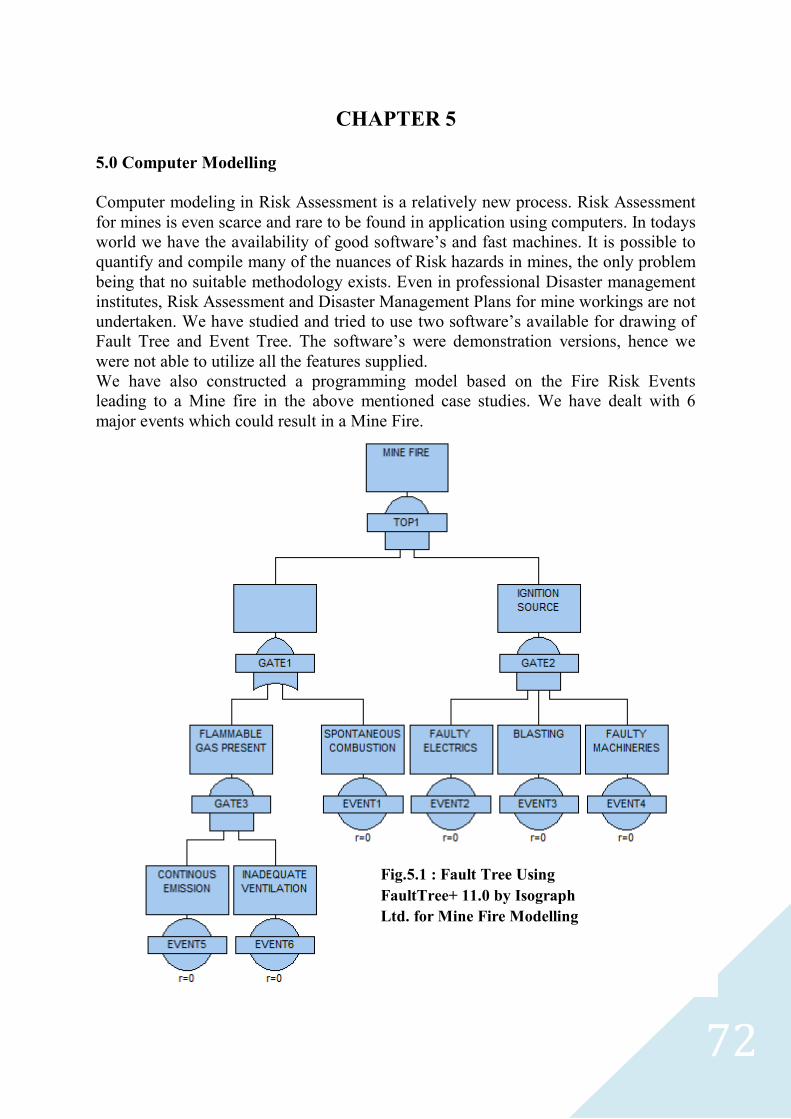
72
CHAPTER 5 5.0 Computer Modelling
Computer modeling in Risk Assessment is a relatively new process. Risk Assessment
for mines is even scarce and rare to be found in application using computers. In todays
world we have the availability of good software‘s and fast machines. It is possible to
quantify and compile many of the nuances of Risk hazards in mines, the only problem
being that no suitable methodology exists. Even in professional Disaster management
institutes, Risk Assessment and Disaster Management Plans for mine workings are not
undertaken. We have studied and tried to use two software‘s available for drawing of
Fault Tree and Event Tree. The software‘s were demonstration versions, hence we
were not able to utilize all the features supplied.
We have also constructed a programming model based on the Fire Risk Events
leading to a Mine fire in the above mentioned case studies. We have dealt with 6
major events which could result in a Mine Fire.
Fig.5.1 : Fault Tree Using
FaultTree+ 11.0 by Isograph
Ltd. for Mine Fire Modelling
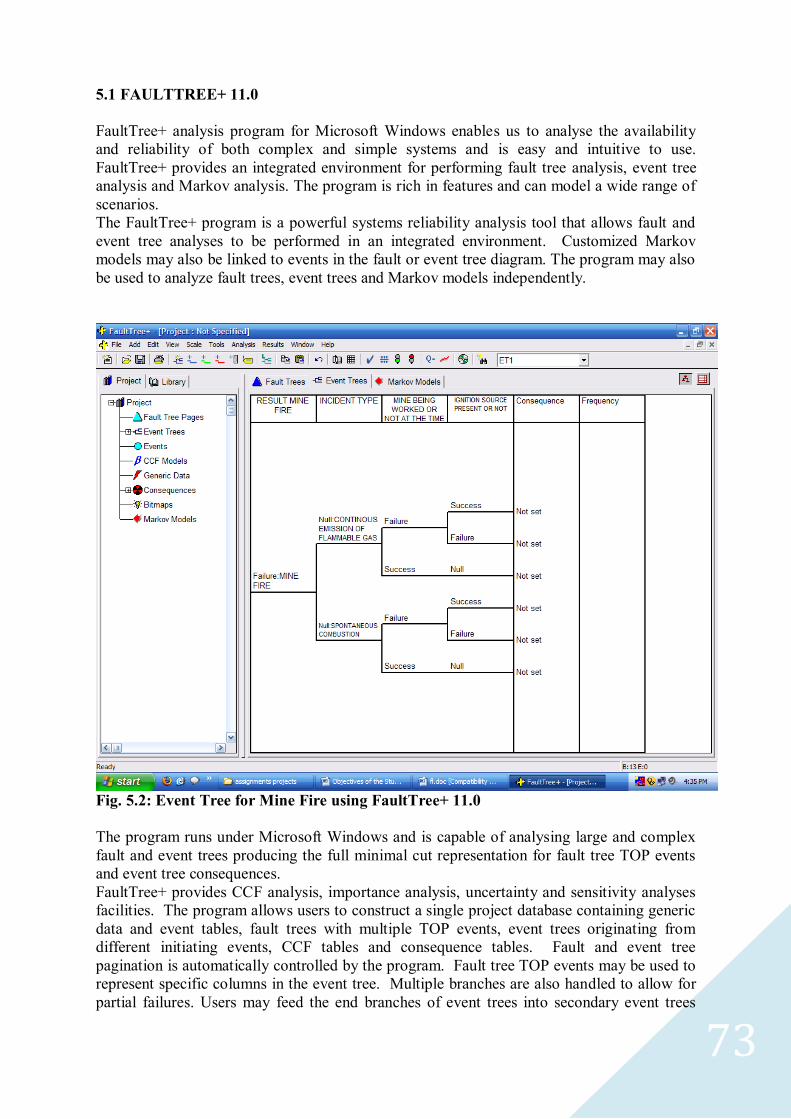
73
5.1 FAULTTREE+ 11.0
FaultTree+ analysis program for Microsoft Windows enables us to analyse the availability
and reliability of both complex and simple systems and is easy and intuitive to use.
FaultTree+ provides an integrated environment for performing fault tree analysis, event tree
analysis and Markov analysis. The program is rich in features and can model a wide range of
scenarios.
The FaultTree+ program is a powerful systems reliability analysis tool that allows fault and
event tree analyses to be performed in an integrated environment. Customized Markov
models may also be linked to events in the fault or event tree diagram. The program may also
be used to analyze fault trees, event trees and Markov models independently.
Fig. 5.2: Event Tree for Mine Fire using FaultTree+ 11.0
The program runs under Microsoft Windows and is capable of analysing large and complex
fault and event trees producing the full minimal cut representation for fault tree TOP events
and event tree consequences.
FaultTree+ provides CCF analysis, importance analysis, uncertainty and sensitivity analyses
facilities. The program allows users to construct a single project database containing generic
data and event tables, fault trees with multiple TOP events, event trees originating from
different initiating events, CCF tables and consequence tables. Fault and event tree
pagination is automatically controlled by the program. Fault tree TOP events may be used to
represent specific columns in the event tree. Multiple branches are also handled to allow for
partial failures. Users may feed the end branches of event trees into secondary event trees
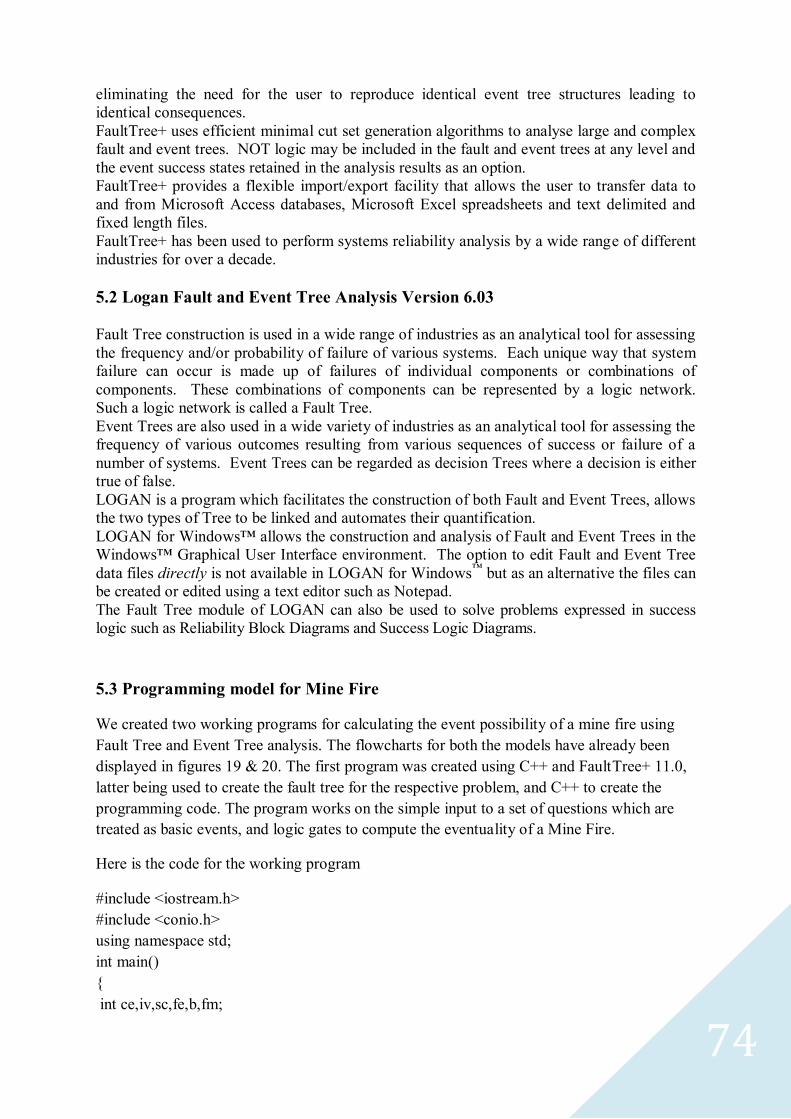
74
eliminating the need for the user to reproduce identical event tree structures leading to
identical consequences.
FaultTree+ uses efficient minimal cut set generation algorithms to analyse large and complex
fault and event trees. NOT logic may be included in the fault and event trees at any level and
the event success states retained in the analysis results as an option.
FaultTree+ provides a flexible import/export facility that allows the user to transfer data to
and from Microsoft Access databases, Microsoft Excel spreadsheets and text delimited and
fixed length files.
FaultTree+ has been used to perform systems reliability analysis by a wide range of different
industries for over a decade.
5.2 Logan Fault and Event Tree Analysis Version 6.03
Fault Tree construction is used in a wide range of industries as an analytical tool for assessing
the frequency and/or probability of failure of various systems. Each unique way that system
failure can occur is made up of failures of individual components or combinations of
components. These combinations of components can be represented by a logic network.
Such a logic network is called a Fault Tree.
Event Trees are also used in a wide variety of industries as an analytical tool for assessing the
frequency of various outcomes resulting from various sequences of success or failure of a
number of systems. Event Trees can be regarded as decision Trees where a decision is either
true of false.
LOGAN is a program which facilitates the construction of both Fault and Event Trees, allows
the two types of Tree to be linked and automates their quantification.
LOGAN for Windows™ allows the construction and analysis of Fault and Event Trees in the
Windows™ Graphical User Interface environment. The option to edit Fault and Event Tree
data files directly is not available in LOGAN for Windows™
but as an alternative the files can
be created or edited using a text editor such as Notepad.
The Fault Tree module of LOGAN can also be used to solve problems expressed in success
logic such as Reliability Block Diagrams and Success Logic Diagrams.
5.3 Programming model for Mine Fire
We created two working programs for calculating the event possibility of a mine fire using
Fault Tree and Event Tree analysis. The flowcharts for both the models have already been
displayed in figures 19 & 20. The first program was created using C++ and FaultTree+ 11.0,
latter being used to create the fault tree for the respective problem, and C++ to create the
programming code. The program works on the simple input to a set of questions which are
treated as basic events, and logic gates to compute the eventuality of a Mine Fire.
Here is the code for the working program
#include <iostream.h>
#include <conio.h>
using namespace std;
int main()
{
int ce,iv,sc,fe,b,fm;

75
int fgp, temp, is, mf;
cout<<"MAIN MENU:-\n";
cout<<"1 for YES, 0 for NO\n";
cout<<"Enter Continuous Emission Status:";
cin>>ce;
cout<<"Enter Inadequate Ventilation Status:";
cin>>iv;
cout<<"Enter Spontaneous Combustion Status:";
cin>>sc;
cout<<"Enter Faulty Electrics Status:";
cin>>fe;
cout<<"Enter Blasting Status:";
cin>>b;
cout<<"Enter Faulty Machineries:";
cin>>fm;
fgp=ce&&iv;
is=fe&&b&&fm;
if (fgp)
cout<<"Flammable Gas Present\n";
else
cout<<"Flammable Gas Not Present\n";
if (is)
cout<<"Ignition Source Present\n";
else
cout<<"Ignition Source Not Present\n";
temp=fgp||sc;
mf=temp&&is;
if (mf)
cout<<"Mine Fire Occurs\n";
else
cout<<"Mine Fire Does Not Occur\n";
cout<<"Thank You for Using The Analysis Software\n";
getch();
}
Output for this program:
MAIN MENU:-
1 for YES, 0 for NO
Enter Continous Emission Status:1
Enter Inadequate Ventilation Status:1
Enter Spontaneous Combustion Status:1
Enter Faulty Electrics Status:0
Enter Blasting Status:1
Enter Faulty Machineries:1

76
Flammable Gas Present
Ignition Source Not Present
Mine Fire Does Not Occur
Thank You for Using The Analysis Software
The second program was created for an Event Tree of the same Mine Fire model created by
us. In this program, we can calculate the eventual possibility of any particular route, by a
simple selection process of yes/no questions and probability value input for each branch of
the Event Tree. Therefore, we were able to accurately ascertain the cumulative probability of
the event of Mine Fire taking place by any sequence of events.
Here is the code for the working program:
#include <stdio.h>
#include <conio.h>
main()
{
int ch;
float x,y,z;
doan:
system("cls");
printf("Input incident type,\n 1. Continious emmision of flammable gas.\n 2. Spontaneous
Combustion\n");
scanf("%d",&ch);
printf("Input probabilty of incident :");
scanf("%f",&x);
printf("\nMine being worked at this time or not ? (1-yes/2-no) :");
scanf("%d",&ch);
if (ch==2) {
printf("Input probabilty of mine not being worked :");
scanf("%f",&y);
printf("\n\nNo injuries will occur,\nProbabilty of mine
fire : %f",x*y);
printf("\n\nCalculate another (1-yes/2-no) :");
scanf("%d",&ch);
if (ch==1) goto doan; else return 0;
}
printf("Input probabilty of mine being worked :");
scanf("%f",&y);
printf("\nIgnition source is present or not ? (1-yes/2-no) :");
scanf("%d",&ch);
printf("Input probabilty :");
scanf("%f",&z);
if (ch==1) printf("\n\nAccident will occur, with severe injuries.");

77
else printf("\n\nAccident will NOT occur");
printf("\nProbabilty of mine fire : %f",x*y*z);
printf("\n\nCalculate another (1-yes/2-no) :");
scanf("%d",&ch);
if (ch==1) goto doan; else return 0;
}
Here is the output for the program:
Input incident type,
1. Continious emmision of flammable gas.
2. Spontaneous Combustion
1
Input probabilty of incident :0.6
Mine being worked at this time or not ? (1-yes/2-no) :2
Input probabilty of mine not being worked :0.4
No injuries will occur,
Probabilty of mine fire : 0.240000
Calculate another (1-yes/2-no) :

78
CHAPTER 6
6.0 Recommendations & Conclusion
6.1 Recommendations:
Risk management must be seen as a tool for development of appropriate health and
safety management systems.
Every mining company should identify one or more mines and should undertake a
formal risk assessment process aimed at reducing the likelihood and impact of
mishaps of all kinds in mines subsequently risk assessment process should be
extended to other mines.
Risk assessment process should aim at effective management of risks, by identifying.
o Which risks are most in need of reduction, and the options for achieving that
risk reduction.
o Which risks need careful on-going management, and the nature of the no-
going attention.
The risk assessment exercise should follow an appropriate process.
Risk management plans should be prepared on the basis of risk assessment and
implemented in the identified mines.
Indian mines are not employing risk assessment techniques as the process of mining is
under the control of a select organizations where money making is more important
than safety measures. For such mines, risk assessment must be made mandatory.
6.2 Conclusion:
It was perceived during the study of the project that the present condition of ‗mine
environment and safety risk‘ is at a low. It was found that mine risk assessment techniques
and implementations are more popular in the developed nations like Australia, USA, Canada,
European countries etc. and are yet to gain a definite and precise foothold in the Indian
mining scenario. Some Indian mines are employing risk assessment techniques although
much work has to be done in terms of successful application and identifiable results.
In the visit to the Disaster Management Institute, we learnt that these institutes haven‘t
undertaken mine risk assessment because of the difficulties faced in quantifying various risks
associated with mining industry. These risks can be quantified, but require meticulous
planning and implementations by the hands of skilled engineers. Computer modeling
techniques are available and programs can be made to adequately suffice the absent advent of
Risk Assessment Modeling in the Indian mining industry. Since we were low on resources
and ability, we weren‘t able to quantify and plan for the various problems like Mine Fires,
Inundation, Roof Fall etc., but we used the most basic factors for Mine Fire and made the
programs. The programs can be easily increased in scope and measure with the addition of
other important features.
It is also important to keep statistics and historical incidents in mind while designing these
programs so as to ensure that ‗History Shouldn‘t Repeat Itself‘.
79
References
Maiti, J. (2005), The Basics of Risk Assessment, Conference on Technological
advancements and Environmental challenges in mining and allied industries in the
21st century, NIT Rourkela, pp. 295-300
Paliwal, Rakesh (2006), Assessment and Management of Trucking Risk – A Case
Study, ENTMS, The Indian Mineral Industry Journal, Bhubaneswar, pp. 64-67
Raman, Raghu (2003), Underground Mine Safety- Are We Doing Enough?, Kellogg
Brown & Root Pty Ltd, Sydney, pp.12-16
Ghose, A.K, & Bose, L.K (2003), Mining in the 21st century quo vadis? , 19th World
Mining Congress, New Delhi, pp. 565
U.S. EPA Region 5 (1991), Environmental Risk: Your Guide to Analyzing And
Reducing Risk, Publication Number 905/9-91/017, pp. 1-5
www.epa.gov/region5/publications/risk.pdf
Sammarco, John J., (2005), Programmable Electronic Mining Systems:Best Practice
Recommendations, Information Circular 9480, Department of Health and Human
Services, Pittsburgh, pp. 22-28
World Health Organisation, (2004), IPCS harmonization projects: IPCS risk
assessment terminology, ISBN 92 4 1562676, Geneva, pp. 3-6
www.who.int/ipcs/methods/harmonization/areas/ipcsterminologyparts1and2.pdf
Launa Mallet and Michael J Brnich Jr,(1999) Conducting a fire risk assessment. U.S.
Department of health and human services, Pittsburgh, pp. 2-8
Environmental Risk Assessment, Five Winds International
www.fivewinds.com/uploadedfiles_shared/EnvironmentalRiskAssessment040127.pdf
Rashe Tilman,(2001),Risk assessment methods-a brief review,MISHC,pp. 4-15
Bahr, N.J.,( 1997), System Safety Engineering and Risk Assessment: A Practical
Approach,pp-12-16
Rouvroye, J.L. and A.C. Brombacher, New quantitative safety standards:
Different techniques, different results? Reliability Engineering and System Safety,
1999. pp. 121-125.
Disaster Management Institute-Bhopal, Spatial Environmental Planning In
Emergency Management, Draft Indian Standard Code of Practice on Hazard
Identification and Risk Analysis, 2006. pp. 1-40

80
Guidelines for Chemical Process Quantitative Risk Analysis (2nd Edition), Center for Chemical Process Safety/AIChE, 2000. pp. 62-102
Indian Standard Environmental Management Systems -Specification With Guidance
For Use, 1997. pp. 2-8
U.S. Department of Energy, Doe Handbook, Chemical Process Hazards Analysis,
1996. pp. 29-35
Wikipedia, the free encyclopedia, www.wikipedia.org