environmental and health risk analysis of medical waste
TRANSCRIPT
DOUCET & MAINKA, P.C. 1200 BROWN STREET PEEKSKILL, NY 10566 :& $::; ;:::$$:
4
ENVIRONMENTAL AND HEALTH RISK ANALYSIS
OF MEDICAL WASTE INCINERATORS
EMPLOYING STATE OF THE ART EMISSION CONTROLS
Floyd Hasselriis David Corbus
Rengasamy Kasinathan
Doucet & Mainka, P.C. Peekskill, NY 10566
For Presentation at the 84th Annual Meeting of the
Air & Waste Management Association
Vancouver, Canada
June, 1991
ABSTRACT
This paper relates emissions from medical waste and other solid waste incinerators, their emission controls and modeled dispersion to environmental and health risk. State regulations for specific pollutants, which range from numerical stack emission rates (unrelated to environmental impact) to those based essentially on environmental impact and health risk, are summarized. The nature and quantity of uncontrolled emissions, and the ability of available technologies to control them are summarized. Results of modeling analyses are presented for medical, industrial, sludge and municipal waste incinerators of various sizes and types, for various stack heights and site-specific configurations. Estimated ground level concentrations of HCl and Toxic Equivalent Dioxins resulting from modem medical waste incinerators using or not using various emission controls are compared with acceptable ambient concentrations based on health standards. The impact of low stack temperatures resulting from emission controls on dilution and dispersion factors is compared. Small as well as large incinerator systems are found to produce ground level concentrations which are below health standards by large safety factors. Detailed modeling, considering emission control and stack options can be used to find optimal configurations. The reduction of chlorine and metals-bearing materials in the waste may obviate the need for emission control devices.
- 1 -
DOUCET & MAINKA, P.C. Consulting Engineers

INTRODUCTION
Medical waste incinerators (MWI) have been installed in over 3,000 hospitals in the US, as a means of destroying infectious wastes expeditiously. They range in size from 100 to lo00 lb/hr for on-site use, and are charged for less than 8 hours per day. Regional MWI may have two 2000 lb/hr units, with a total capacity of 48 tons per day (TPD).
Incinerators burning municipal solid waste (MSW), which range from 100 to 1000 TPD in capacity, are 40 to 80 times as large as MWI. MSW incinerators burning under about 250 TPD are generally refractory-lined, operating with either starved air or excess air, whereas those over 250 TPD almost universally have water-wall furnaces. These size and type differences have justified different regulatory treatment.
Legislation and regulations aimed at controlling large municipal incinerators require the use of efficient emission controls and elaborate continuous monitoring devices. This additional equipment may add 10% to the cost of a large facility, and add a few dollars to the cost of disposal.
An entirely different situation applies to small MWIs. The cost of a scrubber can be close to the cost of a new MWI, and continuous monitors may cost that much again. The capital and operating costs, divided by the quantity of waste burned, result in a cost of disposal which may be too high to justify retrofit or installation of new on-site MWIs. Because of this, the cost of on-site incineration or off-site disposal imposes a great financial burden on health care institutions.
A closer investigation of the specific nature of MWIs is warranted in order to understand the factors which influence the environmental impact of these small-scale combustion devices, and perhaps to arrive at more cost-effective ways to achieve compliance with environmental regulations.
MWI are refractory-lined, two-chamber combustion devices, generally employing the 'starved' air, or 'controlled-air' method of control. Solid refractory hearths (stationary or moving) are favored over stokers to avoid unwanted sifting of unburned waste through the grate openings.
Starved-air incinerators control the air supplied to the primary chamber to control the rate of heat release from the waste. The air supplied to the secondary chamber is used to complete the combustion, and also to cool the gas temperature down. Auxiliary burners are mandatory, providing ignition of the waste during start-up, and serving to maintain the secondary chamber temperature above 1600°F prior to charging and during operation.
- 2 -
DOUCET & MAINKA, P.C. Consulting Engineers
Lockouts are required to prevent charging whenever temperatures are below the minimum, or other limits are out of the correct operating range. Most States require that the incinerator be designed for operation at 1800°F without waste feed.
Water-wall MSW incinerators operate with 150 to 180% of the air needed for complete combustion (50 to 80% excess air) due to the water cooling, and the desire to maximize boiler efficiency. Refractory incinerators, by comparison, require 200 to 220% of theoretical (stoichiometric) air at the secondary chamber in order to maintain 1800°F. Additional air may enter downstream of the secondary chamber: the gases leaving the stack may have 250 to 300% of theoretical air. Refractory incinerators thus provide more dilution of pollutants as they leave the stack. The practice of correcting stack emissions to a reference oxygen or carbon dioxide corresponding with about 150% of theoretical air (50% excess air) does not give them credit for this additional dilution of pollutants. In addition, starved-air incinerators discharge many times less particulate matter due to lazy burning.
Excess air and moisture added to cool and scrub the gases increase the gas volume, and dilute the pollutant concentration before they leave the stack. The amount of dilution depends upon the type of incinerator and the emission control. The actual volume of gases leaving the stack determines the dispersion of the stack gases in the environment.
Regulatory Reauirements
National Standards limit ground-level concentrations of Criteria Pollutants, as shown in Table I. Hydrochloric acid (HC1) is not included, nor are dioxins.
The States are developing and revising regulations applying to medical or biological waste incinerators. Different standards apply to existing MWI than to new installations. Upgrading of existing MWI may be required within various time periods.
A recent survey of current and/or anticipated regulations shows that most States have had, and retain, staging of requirements, in accordance with specific ranges in charging rate for emissions of total suspended particulate matter (TSP), and hydrochloric acid (HCl). Table II shows a simplified representation of the typical ranges.
About 15 percent of the States have no regulations for HCl. About one percent regulate on a case-by-case basis, several using health risk basis; 40 percent limit emissions to 4 lb/hr, or 90 percent control, or 50 ppmv; and about one percent require 95 to 99 percent control or 30 ppmv. Generally states with higher population densities have more stringent requirements. The limit of 4 lb/hr is the emission of a 1000 lb/hr hazardous waste incinerator burning a high-chlorine waste such as PVC.
- 3 -
DOUCET & MAINP(A, EX. Consulting Engineers

The USEPA originally set numerical emission limits for hazardous waste incinerators of 0.08 grains per dry standard cubic foot (gr/dscf), and 4 lb/hr or 99 percent control of HC1. Recently risk-based regulations have been added: emissions of toxic metals are now limited on the basis of ground-level health-risk concentrations. Acceptable ground-level concentrations (GLC) are related back to stack concentrations by dispersion modeling in order to define acceptable stack emissions. A table of allowable stack concentrations is used for the first screen, based on waste composition and a conservative dispersion model. If the applicant expects to exceed these numbers, modeling based on the specific site and technology is required in order to obtain a permit to construct, and trial bum tests have to be performed.
Health-risk-based regulations for MWIs have been developed by several states following the USEPA approach for hazardous waste incinerators, focussing on specific pollutants, including toxic heavy metals.
e Table I - National Air Quality Standards (pg/m3)
Contaminant
Carbon Monoxide (CO)
Sulfur Dioxide (SO2)
Nitrogen Dioxide (Ne) Total Suspended Particulates (TSP) Fine Particulates (PM,,)
Averaging Period
8-hour
1-hour
Annual
24-hour
Annual
Annual 24-hour Annual
24-hour 3-month
National (Primary)
10,Ooo (9 PPm)
(35 PPm)
(0.03 PPm)
(0.14 PPm)
(0.05 PPm)
40,000
80
365
100
75 260 50 150 1.5
Source: USEPA, "National Primary and Secondary Ambient Air Quality Standards," [40 CFR 501
- 4 -
DOUCET & MAINKA, P.C. Consulting Engineers

Table I1 - Ranges of Regulations for TSP and HC1 in the USA
Charging Rate. Pounds per Hour
Pollutant (loo - 500) 1200- lo00)
Particulate. gr/dscf
Hvdrochloric Acid
0.20 c c 0.08
4 lb/hr
0.04 c c
0.02
90 % c c 99 %
{loo0 - 40001
0.020 c c
0.010
50 ppmv c c
30 ppmv
Source: Doucet & Mainka, P.C.
Emission Factors
Conservative estimates of uncontrolled emission factors for MWI are listed in Table III. These depend upon the type of waste, the technology used, and the operating conditions. Wide variations are found when data from old, poorly operated MWI are included. Data from typical present-day systems equipped with good operating controls are quite consistent. An indication of data consistency is the finding that the standard deviation of a set of data is not larger than the mean value.
Emission Controls
The pollutants produced by combustion are of three basic types: those controlled by combustion (carbon monoxide, hydrocarbons and trace organics); particulate matter (including metals); and acid gases (sulfur dioxide, hydrogen chloride and fluoride, and nitrogen dioxide).
The emissions of concern are Total Suspended Particulate (TSP), SO,, HC1, CO, lead, cadmium, chromium (VI), mercury, and dioxins.
- 5 -
DOUCET & MAINKA, P.C. Consulting Engineers

Venturi wet scrubbers and dry lime injection/baghouse systems are emission control systems which are suited to MWIs. These devices can control organic pollutants by condensation and absorption; particulate and metals by dust collection; and acids by reaction with alkaline materials (lime, soda ash and others).
When estimating emissions to the environment, it is conventional to use conservative estimates of control efficiencies for screening purposes. Table 111 lists 90% efficiencies in spite of the fact that test data shows that much higher control efficiencies are generally achieved. These conservative values provide a 10-time safety margin at the outset.
Acid gases can be reduced by 90 to 99%, depending on the temperatures of operation and the amount and type of reagent used. Particulate matter can be controlled to 0.015 to 0.005 gr/dscf, resulting in 99.9% control of the critical heavy metals except for mercury. Mercury can be controlled by chemical additives to the scrubber water or by carbon adsorption.'
- 6 -
BBUCET & MAPNKA, P.C. Consulting Engineers

Table III - Emission Factors and Control Efficiencies for MWI
Uncontrolled Conservative Controlled POllUtantS Emission Control Emissions
Estimates Efficiency Estimate (lb/ton) (W (lb/ton)
Solid Matter Particulate Matter Arsenic Cadmium Chromium Chromium (VI) Lead Manganese Mercury Nickel Zinc
Sulfur Dioxide Nitrogen Oxides Carbon Monoxide Hydrogen Chloride
Trace Organics Benzene TCDD Toxic Equivalent Formaldehyde PAHC
7.35 O.Ooo18 O.ooOo35 0.00072 O.ooOo7 0.0371 0.00054 0.0003 0.00025 0.0019
1.85 6.02 1.2 38.3
0.41 1.37~10” 0.02 0.0010
97 90 90 90 90 90 90 50 90 90
90 0 0 99
90 90 90 90
0.107 0.00009 0.000004 0.00007 0.000007 0.0037 0.000054 0.00015 0.000025 0.00019
0.185 6.02 1.2 0.187
0.041 1.37~10’ 0.002 0.0001
Note: Control efficiencies for metals (except mercury) are expected to exceed 99%.
- 7 -
DOUCET &, MAPNKA, P.C. Consulting Engineers
Dispersion Modeling to Obtain Ground Level Concentrations
The environmental and health risk arising from the emission of pollutants from MWIs depends on many factors which cause dispersion and consequent dilution of the stack gases. Concentrations are greatly reduced before the gases reach the ground, or could enter ventilation systems or windows of elevated buildings.
The relationship between stack emissions and ground level concentrations (GLC) is determined by computer modeling. The burning capacity of the incinerator, stack diameter, velocity, temperature and height, meteorological data and the configuration of buildings and the general terrain are taken into account.
The dispersion model provides estimated concentrations at critical points, including those at ground and elevated levels. The affect on the total population can be estimated, as well as the concentration to which the most-affected individual is subjected.
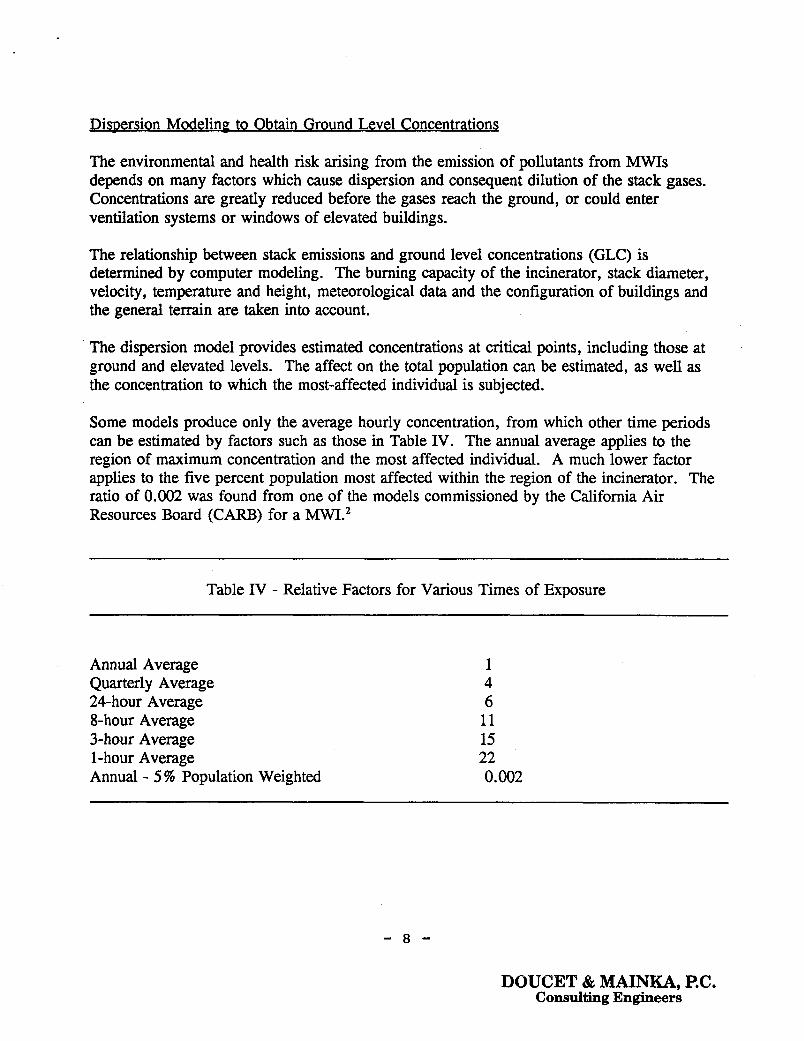
Some models produce only the average hourly concentration, from which other time periods can be estimated by factors such as those in Table IV. The annual average applies to the region of maximum concentration and the most affected individual. A much lower factor applies to the five percent population most affected within the region of the incinerator. The ratio of 0.002 was found from one of the models commissioned by the California Air Resources Board (CARB) for a MWL2
Table IV - Relative Factors for Various Times of Exposure
Annual Average Quarterly Average 24-hour Average 8- hour Average 3-hour Average 1 -hour Average Annual - 5% Population Weighted
1 4 6 11 15 22 0.002
- 8 -
DBUCET & MAINKA, P.C. Consulting Engineers

Results of Modeling of Specific Facilities
Dispersion factors and ground level concentrations are calculated from the grams/second (g/sec) emission rate, the stack height, diameter and velocity, the temperature of the stack gases, and meteorological data such as temperature, wind speed, direction and stability conditions . The calculations produce the grams per cubic meter (g/m3) of pollutant resulting from an emission rate of one g/sec of pollutant. These can be multiplied by the emissions of specific pollutants to obtain the ground level concentrations.
Figure 1 shows the unit ground level concentrations in micrograms per cubic meter (pg/d), based on a fixed discharge rate of one gram per second, obtained from modeling of a wide range of combustion devices. Plotted against stack height they show that concentrations Der
decline from 50 to 0.01 pg/m3. The range of data reveals the variations in the degree of dilution achieved at individual sites.
Medical and industrial waste incinerators, asphalt heaters burning waste oil, and sludge and municipal waste incinerators are included. Most of these studies were performed for the California Air Resources Board (CARB) as part of their cadmium and dioxin studies.'
Incinerators with greater burning capacities usually have higher stack heights. Building heights may vary from as little as 5-meters for small incinerators to 30-m for large waste-to- energy power plants. Good Engineering Practice (GEP) usually results in a stack height of 2.5 times the height of the building. Some municipal waste-to-energy facilities have stack heights of 90-m or greater. Considering that the larger MSW incinerators have capacities 50 to 100 times greater than MWIs, it would be expected that MWI would have emissions Der g/sec 50 to 100 times greater.
.
Since the gramdsecond rates depend upon the burning capacity of the facility, the unit concentrations do not facilitate comparisons of various types of facilities. Dilution Factors (DF) provide a way to evaluate the phenomenon of dilution per se.
- 9 -
DBUCET & IMAINKA, P.C. Consulting Engineers

The DF may be calculated for a given facility from this data, in accordance with the following equations:
m3/sec = actual stack flow volume = (meters/second)x(square meters stack area)
g/m3 ----- - - grams per cubic meter per g/sec, by modeling. g/=
The actual cubic meters per second (ACMS) discharged by the stack depends upon the burning capacity of the incinerator, the composition of the fuel, and the type of emission control (if any) used.
- 10 - DOUCET & MAINKA, P.C.
Consulting Engineers

UNIT GROUND LEVEL CONC. PER GRAM PER SECOND EMISSION
.
1005 , ,
10 20 30 40 50 60 70 80 90 1 STACK HEIGHT, METERS
DILUTION FACTOR
4- I
1000 I b I I I I I I I I
0 10 20 30 40 50 60 70 80 90 1 STACK HEIGHT, METERS
1 - Ground Le vel Concentrations and Dilution Factors versus Stac k H e i u
- 11 - DOUCET & MAINKA, P.C.
Consulting Engineers

The gas volumes which leave the stack depend whether or not a heat recovery boiler, heat exchanger, dilution air or water evaporation are used to cool the gases.
Table V shows the range of Actual Cubic Feet per Minute (ACFM) discharged per million I&J of heat released by the waste, and the corresponding ACMS. For typical medical waste a heating value of 7,500 Btu/lb has been assumed. For MSW, 5,000 Btu/lb is appropriate.
An incinerator with no emission control device would discharge 1,510 ACFM of 1800°F gases directly to the atmosphere. If the gases are diluted by the draft control device, reducing their temperature to 1300"F, the quantity increases to 1,730 ACFM.
If a wet scrubber is applied to the 1800°F gases, evaporation of the water will reduce the temperature of the gases to about 180"F, and the quantity will be reduced to 660 ACFM.
If a boiler is used to cool the gases, and the gases are then cooled by water to 350°F and passed through a baghouse, the gas flow will be reduced to 520 ACFM. If a wet scrubber is used, the gases will be cooled to about 145"F, and the quantity to 450 ACFM.
Note that MWI having no boiler or emission controls discharge direct to the stack over three times as much gas as those with scrubbers, resulting in a reduction in stack pollutant concentration by a factor of three.
This inherent dilution provides justification for permitting these simple systems to discharge particulate matter at three times the concentration which is calculated when making an oxygen or carbon dioxide correction.
Emission standards are conventionally corrected to 12% C02 or 7% 02, in order to use the same regulatory basis for all facilitates, eliminating variations in temperature and excess air. This practice was used in order to avoid the use of dilution air to reduce emission concentrations, and thus meet a limit based on stack concentrations: "dilution is not the solution." This correction provides a fictitious number which does not relate to reality, however. In reality, dilution & the solution.
The volume of gas generated by burning waste at a rate of one million Btu/hr is 236 ACFM, when corrected to standard atmospheric pressure, 68"F, and 12% CO,. This represents about 50% excess air which is typical for operation of fossil fuel-fired boilers. The actual volume of typical oil, gas and coal-fired boilers with a stack temperature of 450°F would be about 400 ACFM per million Btu/hr.
The actual stack concentration, per million Btu/hr of waste fired, of a direct-discharge incinerator is about one quarter that of fossil fuel-fired boilers operating at the same firing rate.
- 12 -
DOUCET & MAINKA, P.C. Consulting Engineers

c
The actual stack concentration, per million Btu/hr of waste fired, of a direct-discharge incinerator is about one third that of an incinerator with heat recovery and gas scrubber operating at the same firing rate.
If incinerators with emission controls are allowed to emit 0.02 gr/dscf of particulate matter, a direct-discharge incinerator should be allowed 1,7291450 x 0.02 or 0.08 gr/dscf, corrected to 12% C02 or 7% 02. This is the original USEPA Federal Standard.
Table V - Stack Gas Flow at Various Stack Temperatures (per million Btu of heat released in the furnace)
Emission Control
Direct to Stack" Diluted with Ai? Wet Scrubbe? Boiler and Filter" Boiler, Spray-dry +Filtert' Boiler and Wet Scrubbe? Fossil-fuel Boiler Reference gas flow, 12% C02
Stack Temp. (OF)
1800 1300 180 350 300 145 450 68
ACFM (ff/min)
15 10 1730 660 520 490 450 400 236
ACMS (m3/ sec)
0.71 0.82 0.31 0.24 0.23 0.21 0.19 0.11
a. Based on medical waste at 7,500 Btu/lb. b. Based on municipal waste at 5,000 Btu/lb.
In addition to the effect of dilution of the stack gases, dispersion of the plume is influenced by the stack height, the thermal buoyancy, and the temperature of the gases, all other factors being equal.
Screening modeling may be used to compare alternatives in early stages of a project. The ground level concentrations can be estimated by multiplying the appropriate dilution factor by the stack concentrations.
- 13 - DOUCET & MAINKA, P.C.
Consulting Engineers

.
Table VI shows the range of unit dispersion factors and dilution factors resulting from three specific combustion sources, obtained by detailed modeling of the sites. The facilities selected illustrate the fact that two similar MWIs exhibited radically different dispersion and dilution factors. On the other hand, one MWI showed a dilution factor higher than a large municipal solid waste (MSW) incinerator.
Table VI - Dispersion and Dilution Factors for Specific Sources
FaciIity Burn Rate Unit Dispersion Dilution
Ib/hr pg/m3 per g/sec Factor
Cedars Sinai2 980 m, 2-m stack]
Kaiser Permanente2 980 m, 7.3-m stack]
St. Stanislaus3 57,000 wunicipal Waste]
27 16,000
5 145,000
0.117 133,500
The ground level concentrations resulting from 10 g/s emissions from a 2000 lb/hr Mw incinerator are compared with 1 g/s emissions from a 200 lb/hr MWI are shown in Table VI. Both have the same quantity of pollutant per unit of waste, and both have a 25m (75-ft) stack. These results have been calculated by using a USEPA screening model called SCREEN, which is considered to be quite c~nservative.~ Two cases are shown, one with a 10-m high building (GEP stack), and one with an 15-m high building which invites downwash.
Table VI shows that (a) a MWI with direct discharge (no boiler or emission control) produced lower ground level concentrations than MWIs equipped with scrubbers or baghouses, due to the effect of plume rise, (b) the 200 lb/hr MWI produced lower concentrations than the 2000 lb/hr MWI, and (c) the wet scrubber applied to the 200 lb/hr MWI did not trigger downwash, but high concentrations due to serious downwash were indicated for the large one.
- 14 - DOUCET & MAINKA, P.C.
Consulting Engineers

This example illustrates some of the options which may be evaluated when considering site and technical options. Detailed modeling may be justified after the critical factors have been identified.
Table VI1 - Ground Level Concentrations versus Stack Temperature and Building Height, pg/m3
2.000 lb/hr. 25-m Stack [lo g/=l
1300°F Stack Temp.
400°F Stack Temp.
300°F Stack Temp.
145°F Stack Temp.
[direct discharge]
[Boiler]
[Boiler & Baghouse]
[Boiler & Scrubber]
200 lb/hr. 25-m Stack [ 1 g/s=l
1300°F Stack Temp.
145°F Stack Temp. [direct discharge]
[Boiler & Scrubber]
10-m Building 15-m Buildinq [GEP Stack]
89
328
400
860
64
189
177
328
400
2430
50
189
Effect of Burning Capacity and Stack Temperature on Plume Rise
The height to which the plume rises depends upon the temperature of the gases, their stack velocity, and their flow quantity. Figure 2 shows the height of the centerline of the plume which is achieved, as a function of the size of the incinerator, and the temperature of the gases (resulting from the emission control used). The land use (Urban or Rural) determines the dispersion coefficients.
- 15 -
DOUCET & MAINKA, P.C. Consulting Engineers

The 1800°F gases from the 2000 lb/hr incinerator show the strongest rise, to 120-m, whereas for the 200 Ib/hr unit the plume leveled off at 60-m. The plumes at lower stack temperatures were similar for the two burning capacities, leveling off at 40-m.
Plume rise is a major factor in determining ground level concentrations, but it is especially important when high buildings or terrain are nearby.
Effect of Emission Controls on Ground Level Concentration
The type of emission control system and the burning capacity of the incinerator affects the ground level concentration. Figure 3 shows the predicted GLC assuming a 25-m stack associated with a 15-m high building, versus horizontal distance from the stack, based on Urban dispersion coefficients. Since this stack is shorter than GEP, downwash will occur. The peak concentration occurs within 100 and 200-m under these circumstances.
The 2000 Ib/hr incinerator with 10 g/sec of pollutant produces higher concentrations than a 200 lb/hr incinerator with 1 g/sec of pollutant (at the same stack concentration). With 1800°F direct discharge, the lowest concentrations are achieved. The larger incinerator shows peaks which are only slightly higher than the small one. However, the effect of the stack temperature is major: the incinerator with a boiler followed by a wet scrubber at 145°F (250 pg/m3) produces a concentration five times as high as the one with a straight 1800°F discharge (50 pg/m3).
If the scrubber reduced particulate emissions from 0.1 gr/dscf by five times to 0.02 gr/dscf, the benefit would be totally negated because the concentration would increase by five times! In other words, the direct discharge incinerator produced the same ground level concentrations as the incinerator with a scrubber. If this is the case, the installation of a scrubber would not be justified. The same applies to both the 200 and the 2000 Ib/hr incinerators.
If HC1 emissions had to be reduced from 500 ppmv to 100 ppmv, the hot stack would serve the purpose as well as the scrubber. However, if lo00 ppmv (commonly encountered by MWIs) had to be reduced in accordance with numerical regulations to 50 ppmv (90% control), a scrubber would certainly be required.
AcceDtable Ground Level Concentrations
Acceptable ground level concentrations of many pollutants have been determined by various health agencies, such as OSHA. Exposure is expected to take place during 8-hour working days. Some of these standards are listed in Table VII. Standards based on health effects use annual averages. Corrections for other exposure times are made in accordance with Table IV, above.
- 16 -
DOUCET & MAINKA, P.C. Consulting Engineers

PLUME HEIGHT 200 LB/HR INCINERATOR
I
0 50 1002003004005006007008009001000 DISTANCE FROM STACK METERS
0’
PLUME HEIGHT 2000 LB/HR INCINERATOR
’ 0 Sb 1W2W3004005006007008009001000 I
DISTANCE FROM STACK M € E € ? S
Fig. 2 - Predicted Plume Rise versus Distance
- 17 -
DOUCET & MAINKA, P.C. Consulting Engineers

Ground Level Concentration - 1 g/sec Various Stack Temperatures - 200 Ib/hr
DISTANCE. METERS
Ground Level Concentration - glsec Various Stack Temperatures - 2000 Ib/nr
250-
200-
ii 0
DISTANCE, METERS
Fig. - 3 - Predicted Ground Level Concentrations versus Distance
- 18 - DOUCET & MAINKA, P.C.
Consulting Engineers

Table VIII - Acceptable Workplace Concentrations and Unit Risk Values for Pollutants
Ground Level Unit Risk Value Concentration' for Inhalation
W m 3 ) Cases per Millionb" at I! e/m3
Pollutant
Total Suspended Particulate: 24-hour Annual
3-minute Annual
Hydrochloric Acid:
Arsenic Beryllium Cadmium Chromium VI Lead Mercury Nickel Benzene Dioxin Equivalent
150,000 7,000
140,000 50,000
0.23 0.42 0.56 8.3
150 - 1,500 12 - 80
3.3 0.42 - 120 3.0 x lo-*
0.004 0.003 0.002 0.012
0.0005
33 @ 1pg/m3'
a.
b. c.
Sources: New York State DEC "Air Guide 1," also regulations of Pennsylvania and North Carolina. Health Risk Assessment, St. Lawrence Cty, NY, Ram Trac Corp. Unit risk is risk posed by 70-year exposure to an airborne concentration of 1 pg/W of each substance except Dioxin Equivalent 2,3,7,&TCDD, for which the applicable unit is picograms per cubic meter of air @g/M3) where 1 pg = 10dpg.
Health risk due to exposure to dioxins and furans, as well as toxic metals such as cadmium, are based on the annual average, since cancer-based risk involves exposure of the most effected individual (MED) for 70 years at that location.
- 19 -
DOUCET & MAINKA, P.C. Consulting Engineers
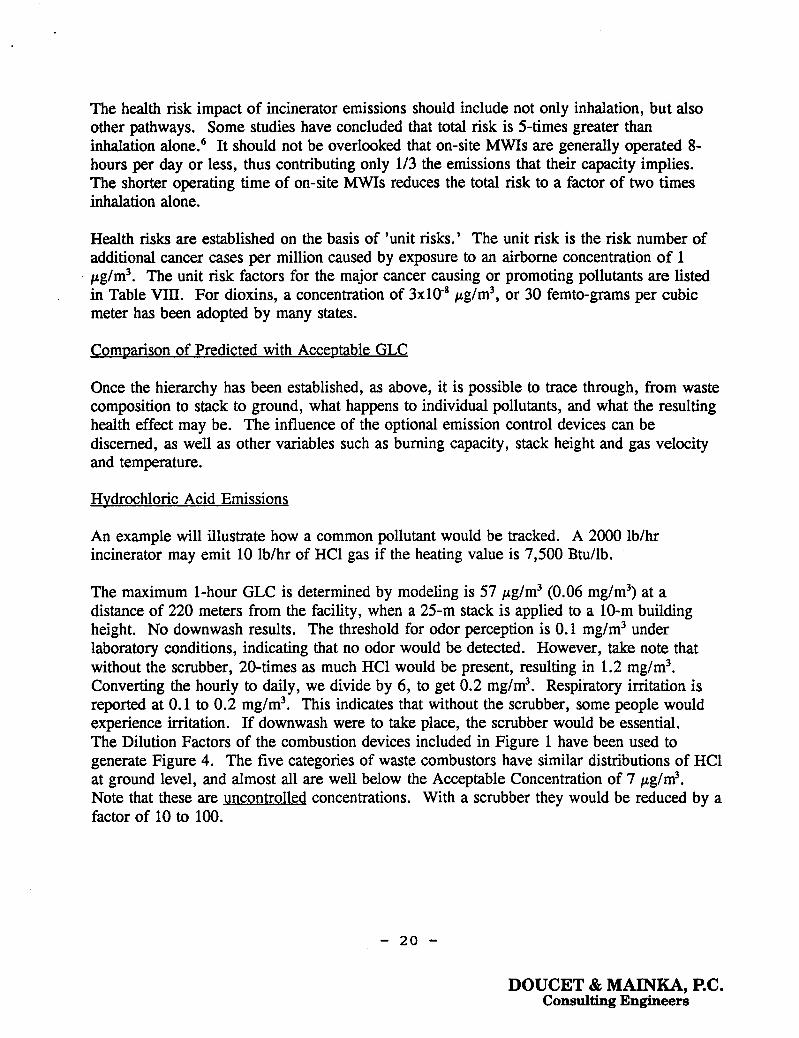
The health risk impact of incinerator emissions should include not only inhalation, but also other pathways. Some studies have concluded that total risk is 5-times greater than inhalation alone.6 It should not be overlooked that on-site MWIs are generally operated 8- hours per day or less, thus contributing only 113 the emissions that their capacity implies. The shorter operating time of on-site MWIs reduces the total risk to a factor of two times inhalation alone.
Health risks are established on the basis of 'unit risks.' The unit risk is the risk number of additional cancer cases per million caused by exposure to an airborne concentration of 1 pglm3. The unit risk factors for the major cancer causing or promoting pollutants are listed in Table VIII. For dioxins, a concentration of 3 ~ 1 8 ~ pg/m3, or 30 femto-grams per cubic meter has been adopted by many states.
Comparison of Predicted with Acceptable GLC
Once the hierarchy has been established, as above, it is possible to trace through, from waste composition to stack to ground, what happens to individual pollutants, and what the resulting health effect may be. The influence of the optional emission control devices can be discerned, as well as other variables such as burning capacity, stack height and gas velocity and temperature.
Hvdrochloric Acid Emissions
An example will illustrate how a common pollutant would be tracked. A 2000 lb/hr incinerator may emit 10 lb/hr of HCl gas if the heating value is 7,500 Btu/lb.
The maximum l-hour GLC is determined by modeling is 57 pg/m3 (0.06 mg/m3) at a distance of 220 meters from the facility, when a 25-m stack is applied to a 10-m building height. No downwash results. The threshold for odor perception is 0.1 mg/m3 under laboratory conditions, indicating that no odor would be detected. However, take note that without the scrubber, 20-times as much HC1 would be present, resulting in 1.2 mg/m3. Converting the hourly to daily, we divide by 6, to get 0.2 mg/m3. Respiratory irritation is reported at 0.1 to 0.2 mg/m3. This indicates that without the scrubber, some people would experience irritation. If downwash were to take place, the scrubber would be essential. The Dilution Factors of the combustion devices included in Figure 1 have been used to generate Figure 4. The five categories of waste combustors have similar distributions of HC1 at ground level, and almost all are well below the Acceptable Concentration of 7 pg/m3. Note that these are uncontrolled concentrations. With a scrubber they would be reduced by a factor of 10 to 100.
- 20 -
DOUCET & MAINKA, P.C. Consulting Engineers

c$ Dio in Emissi
Dioxins are found in the emissions of wood stoves, automobiles, coal-fired boilers, and medical and municipal waste combustors. Finding that background levels of dioxins in the Los Angeles area occasionally exceeded standards, CARB has developed guidelines for combustion of Medical Waste which mandate the use of scrubbers for MWI.
- 21 - DOUCET & MAINKA, P.C.
Consulting Engineers

HCL AT GROUND LEVEL UNCONTROLLED
STACK HEIGHT, METERS
I .I Medical + Industrial Sludge 0 Municipal I I
Fie. 4 - Predicted Ground Level Concentrations of HCl
- 22 - DOUCET & MAINKA, P.C.
Consulting Engineers

The CARB obtained dioxin data from old incinerators which were equipped with no emission controls, or only with simple devices employed at that time.2 Due to the requirement for scrubbers, data is now becoming available regarding the effectiveness of modem scrubbers in removing not only heavy metals, but also dioxins, from incinerator emissions.
Table IX lists the Toxic Equivalent TCDD (dioxin) emissions of uncontrolled MWI, based on CARB tests. These are expressed as grams of pollutant per gram of waste, in accordance with actual measurements of waste burned and pollutant. The average plus one standard deviation does not include the highest value of 635, indicating that this value is somewhat outlying. Extreme outlying data are not included, since outliers are not expected to represent normal average operation of contemporary incinerators. The dry-lime baghouse at Skovde had an average control efficiency of 96.5% during two valid tests.' This would reduce the average TCDD emission from 3 14 down to 11 pg/g.
Table X shows controlled TCDD, based on tests of state-of-the-art scrubbers for a number of MWI systems. The average expected emission from scrubber-equipped MWIs is 10 x gram/gram of waste, or 10 &rams TCDD per gram of waste (10 pg/g). The standard deviation is also 10 pg/g. The mean plus standard deviation is the number which would probably only occur in five regularly-spaced occasions out of 100. The average would persist at 10 picogramdgram, close to that found above.
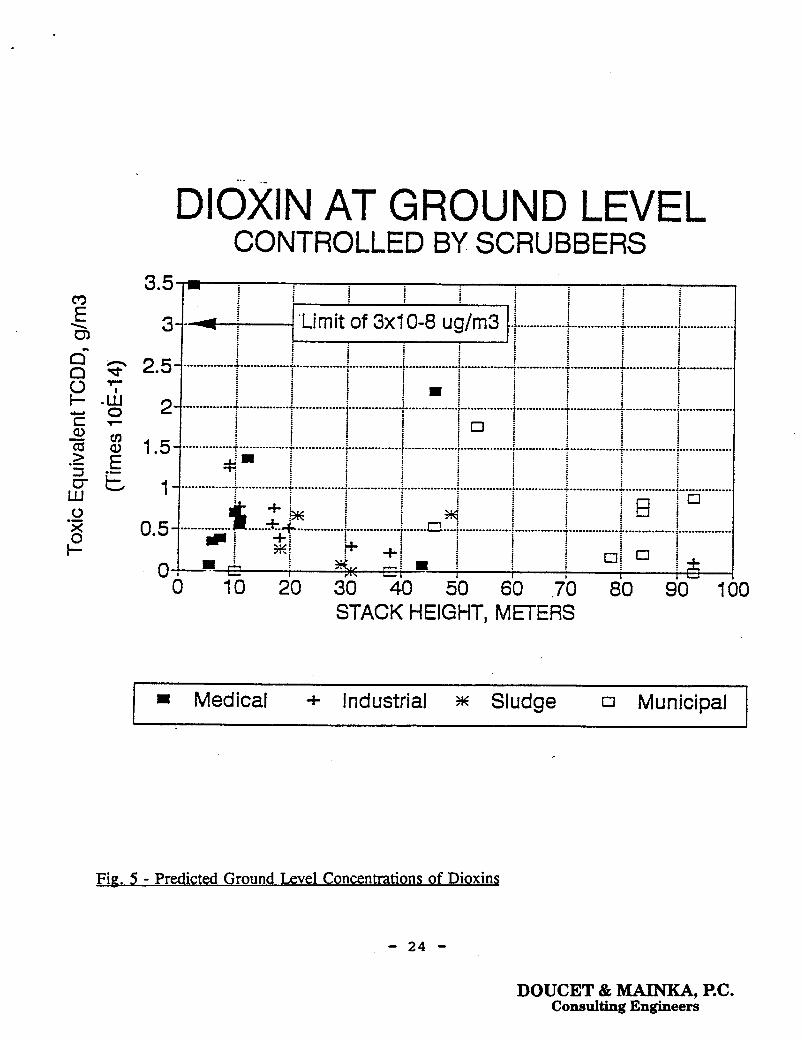
The limit of 3x10⁴ pg/m3 (30 femtogramdgram or 30~10-l~ gramdgram) is internationally accepted, and recognized by the USEPA, as a very conservative estimate of a risk of one additional cancer case per million affected persons. Risks at this level not are considered to be significant. Many health risk authorities believe that this risk factor is 100 times or more too high as it applies to humans.
Figure 5 shows the dioxin concentration which would be expected at ground level for the various combustion systems, if the emissions were 10 pg TCDD per gram of waste. The only MWI exceeding the limit of 3x10⁴ pg/m3 is one with a 3-meter stack. All of the other facilities would produce much lower levels.
Comparisons between predicted ground level concentrations of various pollutants and health- based concentrations which have been made for large municipal waste incinerators show safety factors based on TLVs and AALs ranging from about 100 to tens or hundreds of thousands.
- 23 -
DOUCET & MAINKA, P.C. Consulting Engineers
DIOXIN AT GROUND LEVEL CONTROLLED BY SCRUBBERS
0 .-
STACK HEIGHT, METERS
- Medical + Industrial m Sludge 0 Municipal I I I
Fip. 5 - Predicted G round Level Concentrations of Dioxin8
- 2 4 -
DOUCET & MAINKA, P.C. Consulting Engineers

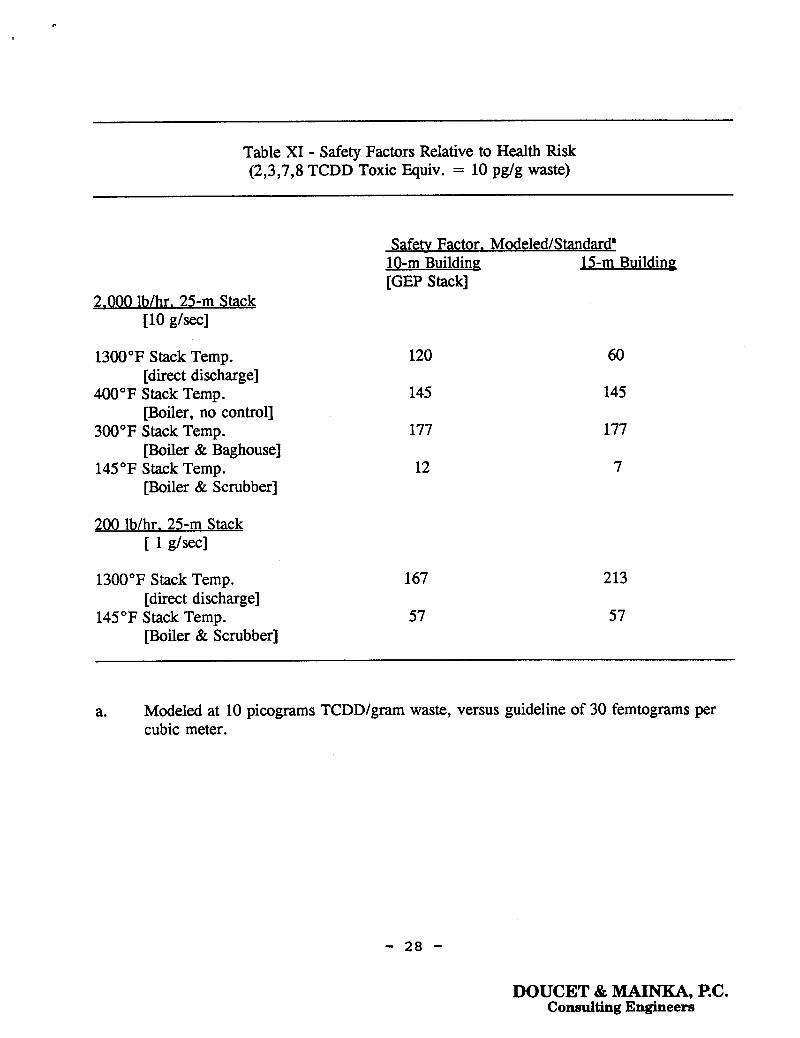
Table XI shows the safety factors which would result based on the New York State limit of 30 femtograms/m3, the modeling factors of Table VI, and a TCDD Toxic Equivalent of 10 pg/g of waste. This shows the range of safety factors as they are influenced by stack temperature and building height. The safety factors, ranging from 7 to 213 are high in all Cases.
The TCDD Toxic Equivalent of 10 pg/g of waste corresponds to a 97.5% removal efficiency, a ratio of about 30. On this basis, if no control were installed, all of the cases in Table X would wet scrubber would fail: but this system would control the TCDD.
meet the stringent ambient TCDD guideline. Only the system with the
Source Subst itution Versus Emission Controls
The primary emissions from a medical waste incinerator without emission controls which would probably fail to meet acceptable ground level pollutant standards are the HCl, heavy metal and dioxin emissions.
Hospital purchasing agents can potentially reduce the presence of chlorinated plastics and plastics containing critical metals such as cadmium in the purchased materials.
It has been demonstrated at several hospitals that avoidance of chlorine-bearing plastics makes it possible to limit HC1 emissions to less than 4 lb/hr or to 30 ppmv, thus obviating the need for an HC1 scrubber. The reduction in chlorinated plastics has been shown to reduce dioxin emission^.^
It is also possible to reduce or eliminate the use of cadmium and other critical metals as fillers and coloring agents in plastics, paper and textiles used in hospitals, thus assuring that uncontrolled emissions of these metals will meet standards.6
CONCLUSIONS
0 The out-of-proportion cost of fitting small on-site medical waste incinerators with elaborate scrubbers is likely to eliminate this option for responsible destruction of medical wastes on-site, thus requiring transportation and landfilling infectious wastes.
The option of upgrading existing incinerators, and providing adequate stack height, thus eliminating the need for scrubbers, merits investigation.
0 Small refractory-lined incinerators, burning commercial or industrial wastes and medical wastes, have pollutant impacts at ground level which have similar ranges to those of other waste burning incinerators, including municipal waste incinerators. The disbenefit of relatively shorter stacks is compensated for by their relatively low mass emissions and more diluted stack discharges.
- 25 -
DOUCET & MAINKA, P.C. Consulting Engineers

0 The high stack temperatures of small uncontrolled incinerators cause the plume to rise much higher than plumes of incinerators equipped with heat recovery boilers and scrubbers, resulting in equivalent ground level concentrations.
0 Dilution Factors are a useful parameter for relating stack emission concentrations to ground level concentrations. Dilution Factors may range from 4,000 for MWI with short incinerator-mounted stacks to over 100,000 when stacks are GEP and/or higher than adjoining buildings. Municipal incinerators showed DF ranging from 60,000 to 300,000.
0 The annual average ground level concentrations of HC1 resulting from operation of the various types of incinerators without controls were generally noted to be below the limit of 7 pg/m3, based on occupational health. Short-term concentrations affecting local buildings may justify the application of efficient acid-gas controls. MWI contribute little to the local ambient concentrations provided that adequate dispersion is assured.
0 The GLC of dioxins resulting from operation of MWIs with emission controls was found to be similar to that of large-scale MSW incinerators, except when stack heights were too low, below GEP requirements.
0 The annual average GLC of dioxins from facilities with emission controls was found to be substantially lower than the ambient standard of 3x10⁸ pglm3 (30 femtograms per cubic meter). With favorable dispersion factors, emissions of dioxins, without the use of outlet emission controls may not cause exceeding of ground level health risk standards.
0 Detailed modeling helps to obtaining the most effective and economic technology for environmental controls. The type of emission control and stack height are essential variables.
0 Reducing potentially toxic substances in hospital wastes by purchase control may be a cost-effective alternative to the installation of costly scrubbers, making it feasible to upgrade existing MWIs. Purchase of plastics containing chlorine and critical heavy metals such as cadmium can be avoided or minimized as a matter of policy.
- 26 -
DOUCET & MAINKA, P.C. Consulting Engineers

Table IX - Uncontrolled TCDD Emissions from MWI'
Facility Toxic Euuivalent TCDD Emissions (picograms per gram waste)
Skovdeb Cedars Sinai San Bemardino St. Agnes Stanford
Mean: Standard Deviation: Mean + Std. Dev.:
Controlled at 96.5%:
80 217 236 400 635
3 14 2 12 526
---
11
a. Source: California Air Resources Board (CAB), except Skovde. b. Ref. [l]. Control efficiency 96.5% for two applicable tests.
Table X - Controlled TCDD Emissions from MWI Scrubbers
Facility
Amer. Environmental2 High Effy. Wet Scrubber Hamot' Baghouse + scrubber
Skovde' Dry lime + Baghouse
MtXUl: Standard Deviation: Mean + S.D.:
Toxic Euuivalent TCDD Emissions (picograms per gram waste)
65.0 1.10 1.68 1.45 1.4
26 6 2.4 11.5 10.0 26.0 10.0 34.2 20.0 60.1
Note: Amer. Envir. can be considered to be the worst case. DOUCET & MAINKA, P.C.
Consulting Engineers - 27 -
c
Table XI - Safety Factors Relative to Health Risk (2,3,7,8 TCDD Toxic Equiv. = 10 pg/g waste)
Safety Factor. Modeled/Standard* 10-m Building E m Building [GEP Stack]
2.000 lb/hr. 25-m Stack 110 g/=l
1300°F Stack Temp.
400°F Stack Temp.
300°F Stack Temp.
145°F Stack Temp.
[direct discharge]
[Boiler, no control]
[Boiler & Baghouse]
[Boiler & Scrubber]
200 lb/hr. 25-m Stack [ 1 g/secl
1300°F Stack Temp.
145°F Stack Temp. [direct discharge]
[Boiler & Scrubber]
120 60
145
177
145
177
12 7
167
57
213
57
a. Modeled at 10 picograms TCDD/gram waste, versus guideline of 30 femtograms per cubic meter.
- 28 -
DOUCET & MAINKA, P.C. Consulting Engineers
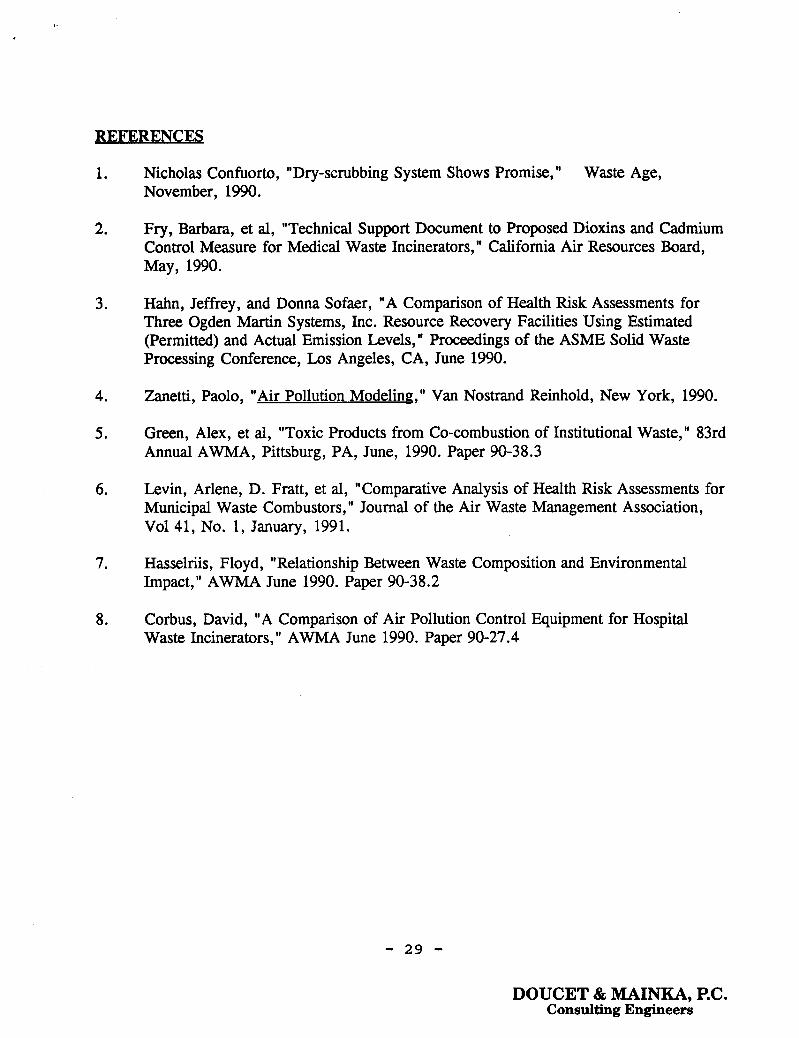
REFERENCES
1.
2.
3.
4.
5 .
6.
7.
8.
Nicholas Confuorto, "Dry-scrubbing System Shows Promise, I' November, 1990.
Waste Age,
Fry, Barbara, et al, "Technical Support Document to Proposed Dioxins and Cadmium Control Measure for Medical Waste Incinerators, 'I California Air Resources Board, May, 1990.
Hahn, Jeffrey, and Donna Sofaer, "A Comparison of Health Risk Assessments for Three Ogden Martin Systems, Inc. Resource Recovery Facilities Using Estimated (Permitted) and Actual Emission Levels," Proceedings of the ASME Solid Waste Processing Conference, Los Angeles, CA, June 1990.
Zanetti, Paolo, "Air Pollution Modeling;," Van Nostrand Reinhold, New York, 1990.
Green, Alex, et al, "Toxic Products from Co-combustion of Institutional Waste, I' 83rd Annual AWMA, Pittsburg, PA, June, 1990. Paper 90-38.3
Levin, Arlene, D. Fratt, et al, "Comparative Analysis of Health Risk Assessments for Municipal Waste Combustors, Journal of the Air Waste Management Association, Vol41, No. 1, January, 1991.
Hasselriis, Floyd, "Relationship Between Waste Composition and Environmental Impact," AWMA June 1990. Paper 90-38.2
Corbus, David, "A Comparison of Air Pollution Control Equipment for Hospital Waste Incinerators," AWMA June 1990. Paper 90-27.4
- 29 -
DOUCET & MAINKA, P.C. Consulting Engineers

ABSTRACT
Emissions from medical waste and other solid waste incinerators are related to the emission controls and modeled dispersion to environmental and health risk. State regulations for specific pollutants, which range from numerical stack emission rates (unrelated to environmental impact) to those based essentially on environmental impact and health risk, are summarized. The nature and quantity of uncontrolled emissions, and the ability of available technologies to control them are summarized. Results of modeling analyses are presented for medical, industrial, sludge and municipal waste incinerators of various sizes and types, for various stack heights and site-specific configurations. Estimated ground level concentrations of HC1 and Toxic Equivalent Dioxins resulting from modem medical waste incinerators using or not using various emission controls are compared with acceptable ambient concentrations based on health standards. The impact of low stack temperatures resulting from emission controls on dilution and dispersion factors is compared. Small as well as large incinerator systems are found to produce ground level concentrations which are below health standards by large safety factors. Detailed modeling, considering emission control and stack options can be used to find optimal configurations. The reduction of chlorine and metals-bearing materials in the waste may obviate the need for emission control devices.
Floyd Hasselriis, P.E., is a Senior Engineer at Doucet & Mainka, P.C. After ten years involvement in waste-to-energy plants burning municipal waste, he has spent the last several years in medical waste combustion. He is a member of the ASME Research Committee on Industrial and Municipal Waste, and a diplomate in the American Association of Environmental Engineers. He has a Masters degree in Mechanical Engineering from the University of Delaware, and over 40 years experience in the combustion of solid fuels.
David Corbus was a Project Manager at Doucet & Mainka, P.C., especially concentrating on on-site and regional medical waste incineration facilities.
Rengasamy Kasinathan is a Project Engineer at Doucet & Mainka, concentrating on permitting and environmental modeling of medical waste incineration facilities.
- 30 -
DOUCET & MAINKA, P.C. Consulting Engineers