environmental accounts overview
DESCRIPTION
Environmental accounts overview . Viveka Palm Head of Unit, Environmental Accounts and Natural Resources, Statistics Sweden [email protected] www.scb.se/mi1301-en. System of Environmental and Economic Accounts , SEEA. The environmental accounts. Environm. statistics. - PowerPoint PPT PresentationTRANSCRIPT

Environmental accounts overview
Viveka PalmHead of Unit, Environmental Accounts and Natural Resources, Statistics Sweden [email protected]/mi1301-en

System of Environmental and Economic Accounts, SEEA
Emission Deposition Load
Export Import
Consumption
ENVIRONMENT
Rest of the world
Natural resources
Production
Damage to environment, health, infrastructure etc.
ECONOMY

The environmental accounts
Varor och tjänster Produktionsaktiviteter (branscher)Privat konsumtionAnvändning o fördeln av inkomsterKapitalbildning Utlandet Total
NATIONAL-RÄKENSKAPER 1 2 3 4 18 1 2 3 4 5
Icke-finan-siella företag Hus-håll
Investe-ringar
Lager-föränd-ringar
Transak-tioner
Varor och 1. Jordbruk 1171 #### 21905 52 541 800 871 709 51978tjänster 2. Skogsbruk 26 731 2 #### 330 395 1026 -991 374 24203
3. Fiske 87 707 699 147 575 -4 448 23374. Gruvor, mineralbrott 203 17 698 1467 27 543 328 -302 5152 329625. Livsmedel, textil m m 5366 234 68 298 #### 203575 510 319 3291 -4620 41598 3525656. Massa, papper, grafisk 119 92 5 69 3713 17515 278 -289 50162 13659917. Hushållens idéella org. 20986 258 2098618. Offentliga myndigheter 147 406071
Produktions- 1. Jordbruk #### 271 29204aktiviteter 2. Skogsbruk #### 1260 19178(branscher) 3. Fiske 960 2521 5 98 41 960
4. Gruvor, mineralbrott 8663 2645 318 91515. Livsmedel, textil m m 61 554 21 82 1,23 18 417 1767796. Massa, papper, grafisk 4 3453 2318 546 11604719. Ofördelade 995 53 251 -327 353 5646 5925
Produktions- Icke varuankn skatter/subv 15 15 15 #### 70 2 5 349 -35255faktorer Egentliga löner 523 152 523 152 25 3132 2947 89 1748 #### 630158
Kollektiva avgifter 147 152 147 152 68 1199 1142 34 666 9687 237362Driftöverskott netto 25 874 25 874 241 3776 9375 300 -119 #### 233403
Privat kons. 54 40 3 6541 541 796370 574 796370delning av Offentlig sektor 3010 49 127 815 177001inkomster HushållKapitalbildning 6403 1371 163 1167 8742 5884 547Utlandet Löpande transakt. (import) 8670 1453 395 #### 278 6875 421494
Kapitaltransaktioner 1536 35Total #### #### 2337 #### #### #### #### 960 9151 #### 796370 796370 205715 -13742 473292
National Accounts
MILJÖSTATISTIK Luftutsläpp 1. Jordbruk 1171 #### 676 Miljötillstånd 1. Jordbruk 1171 #### 103 676
2. Skogsbruk 26 731 2 #### #### 5 2. Skogsbruk 26 731 #### 49 8 53. Fiske 87 707 17 3. Fiske 87 707 174. Gruvor, mineralbrott 203 17 698 752 602 4. Gruvorott 203 1467 962 #### 2467 6025. Livsmedel, textil m m 5366 234 #### 4726 #### 5. Livsmedel, textil m m 5366 234 30 8 ####6. Massa, papper, grafisk 119 92 6. Massa, p 119 92 9 783 83567. Kemisk industri 1877 177 7. Kemisk 1877 231 108 71548. Petroleumraffinaderier 456 1085 756 2868 7. Kemisk 1352 456 342 365 28689. Järn-, stål- o metallverk 579 9. Järn-, stål- o metallverk 579 170 24210. Verkstadsindustri 1933 6365 10. Verkstads 1933 1182 261 5002 211 ####11. El-, gas- o värmeverk 1197 120 505 2588 4098 11. El-, gas- o värmeverk 1197 120 142 1627 54812. Vatten- o avloppsverk 63 590 207 12. Vatten- o a 590 207 170 274 100 9613. Byggnadsindustri 1664 328 183 936 61414. Samfärdsel 271 63 10 1115 14. Samfärdsel 271 63 6015. Handel o övr. tjänster 1933 890 27 950 #### 15. Handel o övr 1933 890 37716. Bostäder o fastigheter 25 599 222 #### 16. Bostäder o 222 297 27 9917. Hushållens idéella org. 17. Hushållens18. Offentliga myndigheter 18. Offentliga
Vattenutsläpp 1. Jordbruk 1171 #### 676 Vattenutsläpp 1. Jordbruk 1171 103 6762. Skogsbruk 26 731 2 #### #### 5 2. Skogsbruk 26 731 49 8 53. Fiske 87 707 17 3. Fiske 87 707 174. Gruvorott 203 17 698 752 602 4. Gruvor, mineralbrott 203 962 6025. Livsmedel, textil m m 5366 234 68 298 4726 #### 5. Livsmedel, textil m m 5366 234 1382 30 86. Massa, p 119 92 5 69 #### 6. Massa, papper, grafisk 119 92 9 487 7837. Kemisk 1877 177 10 397 4669 7. Kemisk industri 177 231 1190 1087. Kemisk 1352 456 180 168 756 8. Petroleumraffinaderier 456 1085 756 342 575 3659. Järn-, stål- o metallverk 10 579 170 9. Järn-, stål- o metallverk 579 170 314 242
10. Verkstadsindustri 261 5002 21111. El-, gas- o värmeverk 1197 120 505 11. El-, gas- o värmeverk 120 4098 142 548 672512. Vatten- o a 63 12. Vatten- o avloppsverk 590 207 170 274 100 9613. Byggnadsindustri 1664 614 #### 13. Byggnadsindustri 328 936 614 473 113 441 ####14. Samfärdsel 271 5250 #### 14. Samfärdsel 271 63 60 1186 65715. Handel o övr 1933 890 27 950 #### 9756 #### 15. Handel o övr. tjänster 1933 890 #### 377 3415 ####16. Bostäder o 25 599 222 #### 16. Bostäder o fastigheter 599 222 297 27 99 75817. Hushållens 17. Hushållens idéella org.18. Offentliga 18. Offentliga myndigheter19. Ofördelade 19. Ofördelade
Avfall 13. Byggnadsindustri #### 70 2 5 349 Avfall 13. Byggnadsin #### 70 349 379 814. Samfärdsel 3132 2947 89 1748 14. Samfärdsel 36115. Handel o övr. tjänster 1199 15. Handel o övr. tj 4705 12616. Bostäder o fastigheter 3776 9375 300 -119 #### 16. Bost 326
Kemikalier Icke va #### 70 2 5 349 -349 2322 370 Kemikalier Icke varuan 70 349 379 8 45 22 370Egentliga löner #### 6035 Egentliga löner 361Kolle 666 7857 #### 9882 Kollektiva Driftöverskott netto 3776 9375 300 -119 #### 9108 #### Driftöversk 326
Utsläpp CO2 #### 424 157 441 #### #### #### Utsläpp CO2 424SO2 1 0 18 1 SO2 1 0 12 18 4 6 9 1NOx 19 14 16 3 NOx 19 14 16 16 4 4 7 3NMVOC 7 5 30 2 NMVOC 7 5 36 30 12 9 1 2NH3 55 0 0 1 NH3 55 0 0 0 0 1
Environm. statistics
Varor och tjänster Produktionsaktiviteter (branscher) ProduktionsfaktorerPrivat konsumtionKapitalbildningUtlandet Total CO2 SO2 Nox VOC
MILJÖ-RÄKENSKAPER 1 2 3 4 5 5.1 18 1 2 3 4 5 5.1 18
Icke varu-ankn skatter/subv
Investe-ringar
Lager-föränd-ring
Transak-tioner
Varor och 1. Jordbruk 1171 #### 676 21905 800 871 709 51978tjänster 2. Skogsbruk 26 731 2 #### 5 330 1026 ### 374 24203
3. Fiske 87 707 17 699 255 -4 448 23374. Gruvor, mineralbrott 203 17 698 1467 602 27 205 ### 5152 329625. Livsmedel, textil m m 5366 234 68 298 #### #### 203575 3291 ### 41598 3525655.1 Miljövänlig livsmprod 45 51 61 201 41 15 52 12425 255 ### 15215 2584138. Petroleumraffinaderier 1352 456 180 168 1085 2868 39023 ### 11866 8243318. Offentliga myndigheter 406071
Produktions- 1. Jordbruk #### 29204aktiviteter 2. Skogsbruk #### 19178(branscher) 3. Fiske 960 960
4. Gruvor, mineralbrott 8663 65 91515. Livsmedel, textil m m 61 554 21 82 #### 1767795.1 Miljövänlig livsmprod 257 1058558. Petroleumraffinaderier 14 2434419. Ofördelade 995 53 251 -327 5752 5925
Produktions- Icke varuankn skatter/subv #### 70 2 5 349 2322 -35255faktorer Egentliga löner 3132 2947 89 1748 #### #### 630158
Driftöverskott netto 3776 9375 300 -119 #### 233403Privat kons. 796370Kapitalbildning 6403 1371 163 1167 8742 #### 340 342
Kapitalförslitn miljöv. 70 325Utlandet Löpande transakt. (import) 8670 1453 395 #### #### 421494
KapitaltransaktionerTotal #### #### 2337 #### #### #### #### #### 960 9151 #### #### 796370 #### ### 473292 251CO2 #### 70 2 5 349 1 2322 14 749 311 410SO2 3132 2947 89 1748 45 9 #### 6 271 667Nox 1199 15 34 666 42 4 #### 102 502VOC 3776 9375 300 -119 #### 5 308 59NH3 14 28 27 756 585 2 45 1
Environmental Accounts

Three components of SEEA
• Flows of materials per industry (energy, material, emissions, waste)
• Economic variables (labour, taxes, subsidies, costs, products and services)
• Natural resources (stocks, quality, value)

Sectors - Industries - Products
DC
BA
1
2
3
4
6
5
V1
V2
V3
V4
V5
Sectors IndustriesProduct/service
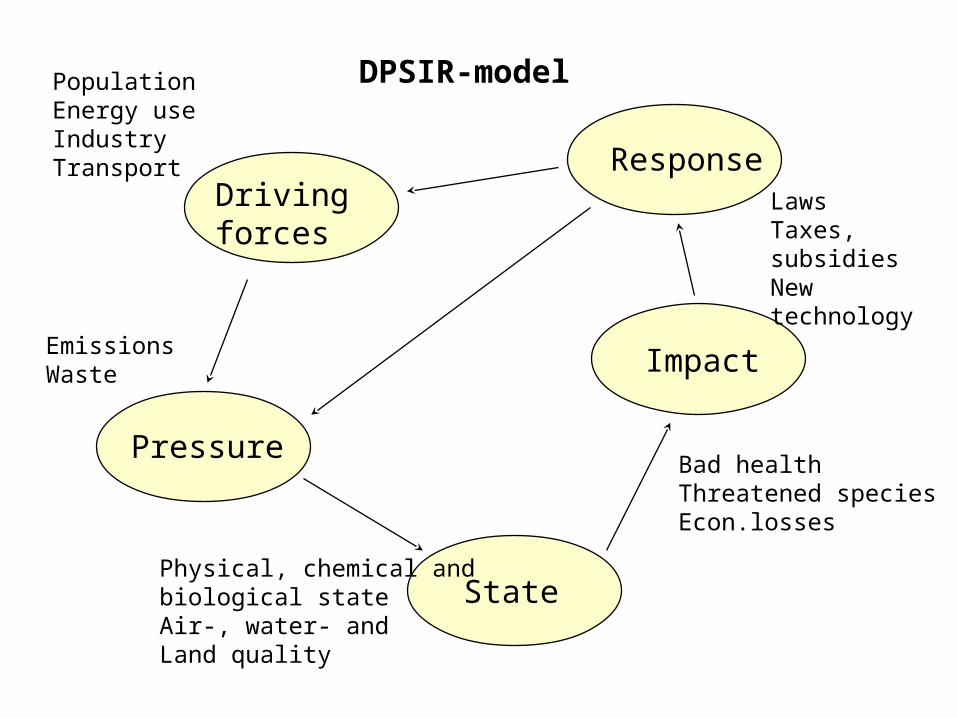
Driving forces
Pressure
State
Impact
Response
PopulationEnergy useIndustryTransport
EmissionsWaste
Physical, chemical and biological stateAir-, water- andLand quality
Bad healthThreatened speciesEcon.losses
LawsTaxes, subsidiesNew technology
DPSIR-model

Industries,government, households
capital
work force
material
energy
goods
services
waste
emissions

Regular publishing
• Energy use per industry and final demand• Emissions to air• Environmental taxes and subsidies• Environmental protection expenditure• Chemical product use• Material flow analysis• Environmental goods and services

Non-regular publishing• Indicators for sustainable development• Water-, Land- , Forest accounts• Household accounts• Decomposition analysis• Regional environmental accounts


Taxes and subsidies in the environmental accounts
Subsidies:1) Product- and other production subsidies 2) Investment grants
Taxes:1) Product- and other production taxes
2) Other levies (e.g. charges)
3) Tax subsidies

Environmental tax revenue by type, EU-27, 1995-2009 (EUR and % GDP)
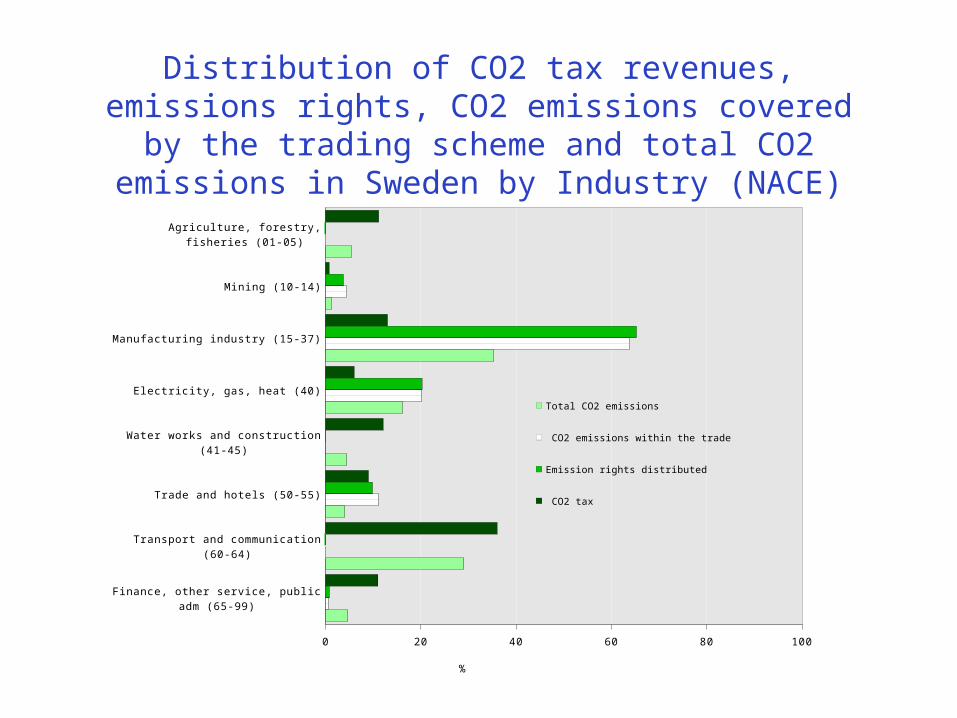
Distribution of CO2 tax revenues, emissions rights, CO2 emissions covered by the trading scheme and total CO2
emissions in Sweden by Industry (NACE)
Agriculture, forestry, fisheries (01-05)
Mining (10-14)
Manufacturing industry (15-37)
Electricity, gas, heat (40)
Water works and construction (41-45)
Trade and hotels (50-55)
Transport and communication (60-64)
Finance, other service, public adm (65-99)
0 20 40 60 80 100
Total CO2 emissions
CO2 emissions within the trade
Emission rights distributed
CO2 tax
%

Environmental taxes
● The OECD and EUROSTAT definition
“…it has been chosen to single out the tax bases that seem to have a particular environmental relevance, and to consider all taxes levied on these tax bases as environmentally related regardless of the motives behind their introduction, their names etc.”

Energy tax and fuel use by industry
0% 10% 20% 30% 40% 50% 60% 70%
01-05 Agriculture, f ishing & forestry
10-14 Mining & quarrying
15-37 Manufacturing
40-41 Elect., gas & w ater
45 Construction
50-52, 55 Wholesale, retail trade
60-64 Transp. & communication
65-67Financial intermediation
70-99 Other
Private consumption
Public consumption
Indu
strie
s
Percent
% of total energy tax on fuel
% of total consumption of fuel (GWh)

SEEA and basic energy statistics
•Time series in focus •Transport energy use by industry, not sector• Data on renewable energy needed (car fuel e.g.)• Small business: enumerating the surveys by industry
(NACE), avoiding reporting labels like ‘other’ sector.• Different system boundary SNA/air emission
statistics: Fuels that are not bought and sold (by-products) are outside of SNA, but inside env. stat.
● Energy taxes and subsidies ● A ‘new’ user group: the modelers of environmental -
economic instruments
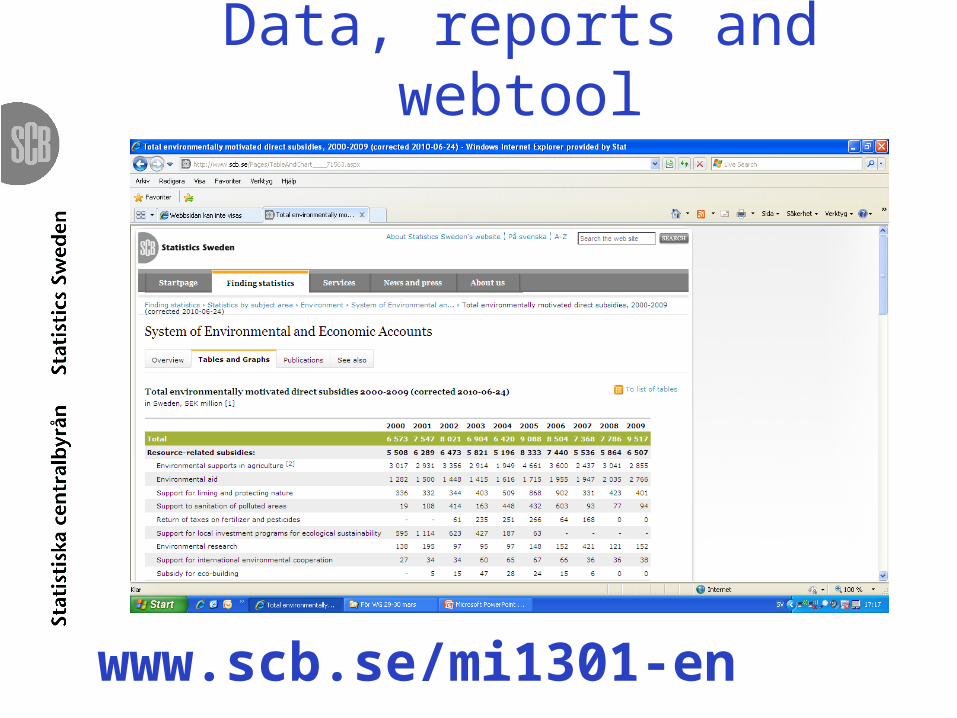
Data, reports and webtool
www.scb.se/mi1301-en